
Global International
Waters Assessment
Regional assessments
Other reports in this series:
Caribbean Sea/Small Islands GIWA Regional assessment 3a
Caribbean Islands GIWA Regional assessment 4
Barents Sea GIWA Regional assessment 11
Baltic Sea GIWA Regional assessment 17
Caspian Sea GIWA Regional assessment 23
Gulf of California/Colorado River Basin GIWA Regional assessment 27
Yellow Sea GIWA Regional assessment 34
East China Sea GIWA Regional assessment 36
Patagonian Shelf GIWA Regional assessment 38
Brazil Current GIWA Regional assessment 39
Amazon Basin GIWA Regional assessment 40b
Canary Current GIWA Regional assessment 41
Guinea Current GIWA Regional assessment 42
Lake Chad Basin GIWA Regional assessment 43
Benguela Current GIWA Regional assessment 44
Indian Ocean Islands GIWA Regional assessment 45b
East African Rift Valley Lakes GIWA Regional assessment 47
South China Sea GIWA Regional assessment 54
Sulu-Celebes (Sulawesi) Sea GIWA Regional assessment 56
Indonesian Seas GIWA Regional assessment 57
Pacifi c Islands GIWA Regional assessment 62

Global International
Waters Assessment
Regional assessment 1a
Russian Arctic
GIWA report production
Series editor: Ulla Li Zweifel
Editorial assistance: Johanna Egerup, Monique Stolte
Maps & GIS: Rasmus Göransson
Design & graphics: Joakim Palmqvist
Global International Waters Assessment
Russian Arctic, GIWA Regional assessment 1a
Published by the University of Kalmar on behalf of
United Nations Environment Programme
© 2005 United Nations Environment Programme
ISSN 1651-940X
University of Kalmar
SE-391 82 Kalmar
Sweden
United Nations Environment Programme
PO Box 30552,
Nairobi, Kenya
This publication may be reproduced in whole or in part and
in any form for educational or non-profi t purposes without
special permission from the copyright holder, provided
acknowledgement of the source is made. No use of this
publication may be made for resale or for any other commercial
purpose whatsoever without prior permission in writing from the
United Nations Environment Programme.
CITATIONS
When citing this report, please use:
UNEP 2005. Tsyban, A.V., Titova, G.D., Shchuka, S.A., Ranenko,
V.V. and Y.A. Izrael. Russian Arctic, GIWA Regional assessment 1a.
University of Kalmar, Kalmar, Sweden.
DISCLAIMER
The views expressed in this publication are those of the authors
and do not necessarily refl ect those of UNEP. The designations
employed and the presentations do not imply the expressions
of any opinion whatsoever on the part of UNEP or cooperating
agencies concerning the legal status of any country, territory,
city or areas or its authority, or concerning the delimitation of its
frontiers or boundaries.
This publication has been peer-reviewed and the information
herein is believed to be reliable, but the publisher does not
warrant its completeness or accuracy.
Printed and bound in Kalmar, Sweden, by Sunds Tryck Öland AB.
Contents
Preface 9
Executive summary
11
Abbreviations and acronyms
14
Regional defi nition
16
Boundaries of the region
16
Physical characteristics
17
Socio-economic characteristics
19
Assessment 28
Freshwater shortage
29
Pollution
30
Habitat and community modifi cation
39
Unsustainable exploitation of fi sh and other living resources
45
Global change
47
Priority concerns for further analysis
51
Causal chain analysis
52
Modifi cation of neritic ecosystems in Kara Sea
52
Chemical pollution in Kara Sea
54
Oil spills in Kara Sea
57
Conclusion
60
Policy options
61
Defi nition of the problem
61
Political and organisational framework
62
Construction of policy options
63
Performance of policy options
65
Conclusions and recommendations
67
References 68
Annexes 72
Annex I List of contributing authors and organisations
72
Annex II Detailed scoring tables
73
CONTENTS
Annex III List of important water-related programmes
79
Annex IV List of conventions and specifi c laws that aff ect water use
81
Annex V The health and social welfare of the Arctic indigenous population in Russia
83
Annex VI General requirements for development of plans on prevention and elimination of oil spill accidents
88
Annex VII Urgent measures for environmental protection
89
The Global International Waters Assessment
i
The GIWA methodology
vii
Preface
This report presents the results of the Global International Waters
The basic goal of this report is to analyse and present in a single
Assessment for the Russian Arctic (GIWA region 1a), as determined
document all available information on the environmental impacts and
during three workshops. The fi rst Scoping and Scaling Workshop was
the transboundary consequences in the seas of the Russian Arctic. The
held in Zvenigorod (Moscow) from 15-18 April 2002. To achieve the
report includes the results of investigations performed by the authors
workshop's objectives, 17 scientists whose expertise included issues
as well as data from the environmental pollution monitoring network
related to environmental and socio-economic impact assessment in
and the scientifi c literature. The specifi c environmental characterstics
the Arctic region were invited to participate. Among participants of the
of the region were considered in order to conduct a comprehensive
workshop were: GIWA/UNEP Scientifi c Director Mr. Dag Daler, GIWA/
assessment of the ecosystem stability and for the prediction of the
UNEP Coordinator Northern Hemisphere Mrs. Elina Rautalahti-Miettinen,
eff ects of anthropogenic processes.
Dr. Thor S. Larsen (UNEP/GRID-Arendal, Norway), Deputy Executive
Secretary of AMAP Vitaly A. Kimstach (Norway), and Prof. Sergei M.
This report especially emphasize the life situation of the Arctic indigenous
Chernyak (USGS/Great Lakes Science Center, USA). The second and
population. Taking into consideration the social and economic situations,
third workshops (Detailed impacts assessment, Causal chain analysis
the socio-economic part of the assessment focused mainly in the
and Policy option analysis) were held in Moscow, Russia, on June 16-18,
indigenous population. A review of the Health and social welfare of the
2003, and September 15-19, 2003. Seven experts participated in these
Arctic indigenous population in Russia is presented in Annex V.
workshops.
PREFACE
9
Executive summary
Occupying just 5% of the area covered by the world's oceans, and just
The Russian Arctic region includes the following seas:
1.5% of their volume, the Arctic Ocean and its adjacent seas have a
Kara
Sea;
pronounced eff ect on the state of the Earth's climate and play a decisive
Laptev
Sea:
role in many global processes. Arctic seas regulate the global carbon
East
Siberian
Sea;
cycle, because they are an important CO source in the winter and a sink
Chukchi
Sea
(the
Russian
section).
2
for the fl ux of CO in the summer. Recent assessments have shown that the
2
Arctic is critically important in atmospheric CO removal, both now and
The total coastal area in the region is 3 460 km2, or one-fi fth of the
2
in the future.
total Russian territory. The region's population of 770 200 is just
0.54% of the country's total population. At the same time, the area's
Arctic seas have a profound impact on many large-scale oceanographic
natural and resource potential are so rich and diverse that the region's
processes; they are a zone of deep ocean water formation, and
stocks of some resources (for example gas and oil) can be considered
determine to a great extent the global hydrological cycle on our planet
a signifi cant part not only of the Russian but also of the world's
as well as atmospheric heat absorption.
resources. Industrial production in the Arctic region today is mainly
(about 90%) composed of "dirty" activity: hydrocarbon extraction,
The Russian sector of the Arctic occupies a large part of the Russian
the mineral resource industry, metal manufacturing, and the building
Federation, extending as far as about 11 000 km from the Norwegian
materials industry.
border on its western boundary to the Mys Dezhneva (East Cape) on
the eastern one. It includes Murmansk Oblast, Nenets AD, Yamalo-
The depletion of mineral deposits in Russia's middle latitudes and
Nenets and Taimyr (Dolgano-Nenets) AD, coastal Arctic uluses (small
the increase in mineral prices makes it more and more attractive to
administrative units at the Arctic coast including several villages) of the
exploit polar lands and seas. Some assessments have suggested that
Sakha Republic (Yakutia), Chukotka (Dolgano-Nenets) AD. The Russian
the polar economy will develop mostly as a result of the exploitation
sector of the Arctic covers about 9.46 million km2, of which the Arctic
of hydrocarbon stocks. Sea and river navigation will expand, increasing
seas cover 6.8 million km2, or 45% of the Arctic Ocean overall. As much
the threat of contamination of Arctic waters.
as 70% of the area is permantly covered by ice.
At present the transboundary waters in the Arctic region are relatively
This report is about the GIWA region 1a, further referred to as the
clean, and the state of the pelagic ecosystems as a whole is favourable.
Russian Arctic, and considers only the central and eastern parts of the
However, the local shelf regions of the Arctic seas and most coastal
Russian section of the Arctic. The western/European part (the Barents
zones are considerably polluted and the state of a number of bays,
Sea and White Sea) is evaluated in the GIWA Regional Assessment 11.
gulfs and estuarine areas has been assessed as critical and even in a
However, because water and atmospheric transports from the western/
catastrophic state. The main contribution to pollution in the Arctic seas
European of the ocean exert a signifi cant infl uence on the condition of
is from diff use, distant sources (river run-off and long-range atmospheric
the transboundary waters in region 1a, information from the Barents
transport) and local sources located in high latitudes or directly on the
Sea region is provided as needed.
Arctic coast. The major hazard facing the Arctic seas is the possibility
EXECUTIVE SUMMARY
11
that oil and its components will enter marine ecosystems as a result
Governance
of sewage discharges, accidental spills, navigation, and gas and oil
All
issues:
insuffi
cient control over environmental conditions, weak
production, especially directly on the shelf. Practically all petroleum
enforcement of ecological regulations;
hydrocarbons and HCHs in the Arctic seas (particularly the Kara Sea) are
the results from run-off carried by the Ob and Yenisei Rivers.
Public control
Chemical pollution: weak local control, especially indigenous
The GIWA concerns are prioritised as follows:
peoples, over chemical pollution levels;
1. Pollution
Oil spills: weak local control over water pollution from oil extraction
2. Habitat and community modifi cation
and transport companies;
3. Global
change
Modifi cation of ecosystems: weak local control over chemical
4. Unsustainable exploitation of fi sh and other living resources
pollution levels, especially indigenous peoples.
5. Freshwater
shortage.
Education and knowledge
Due to substantial diff erences between the seas, the region is divided
Chemical
pollution:
insuffi
cient awareness of the local population
in two sub-systems: the Kara Sea sub-system and the Laptev Sea, East
about the principles of sustainable development as stated
Siberian Sea and Chukchi Sea sub-system. The latter sub-system is
in Agenda 21; poor or inadequate access to environmental
relatively clean, and all issues have not known or slight environmental
information;
impacts. However in the Kara Sea sub-system, the following issues have
Oil
spills:
insuffi
cient knowledge on the part of the local population
moderate or severe impact: Pollution; Chemical pollution and Spills,
about the principles of sustainable development as stated in Agenda
and Habitat and Community Modifi cation; Modifi cation of ecosystem-
21, poor or inadequate access to environmental information, lack
Neritic, Lagoon and Estuarine systems.
of experience with large-tonnage tanker navigation under Arctic
conditions;
The increase of negative impacts from chemical pollution, oil spills and
Modifi cation of ecosystems: insuffi
cient knowledge on the part
modifi cation of ecosystems in the Kara Sea basin can be linked to the
of oil/gas administrators and the local population about the
following root causes:
principles of sustainable development as stated in Agenda 21,
poor or inadequate access to environmental information; poor
Economic
or inadequate investigation into problems caused by chemical
Chemical pollution: market reform failures and failures in strategic
pollution in the Arctic seas ecosystems.
forecasting;
Oil spills: market reform failures, growth of corruption in the oil
Legal
extraction sector and the domination of corporate interests over
Absence of sound regulatory and legislative systems for all activity
strategic ones;
in the region with regard to sustainable development.
Modifi cation of ecosystems: inadequate funding of environmental
needs, poor integration of environmental protection problems
Political
with socio-economic planning, domination of corporate interests
Chemical pollution: absence of an eff ective system for combating
over strategic problems.
transboundary air and water pollution;
Modifi cation of ecosystems: absence of international cooperative
Technological
programs and projects that follow sustainable development
Chemical pollution: use of obsolete industrial technologies,
principles in the Arctic region.
absence of modern air and water decontamination systems;
Oil spills: use of outdated equipment in oil extraction and
The Causal chain analysis showed that the root causes of the three issues
transportation, aging transport fl eet, insuffi
cient emergency
identifi ed above are very similar. Therefore the Policy option analysis
services;
was conducted for all three issues together. The policy options detailed
Modifi cation of ecosystems: use of outdated equipment in minerals
for the problems with chemical pollution, oil spills and modifi cation
extraction, aging transporting fl eet, outdated technologies for
of ecosystems in the Russian Arctic region are based on the policies
industrial waste neutralisation).
adopted at the World Summits on sustainable development held in
12
GIWA REGIONAL ASSESSMENT 1A RUSSIAN ARCTIC
Rio de Janeiro (1992) and Johannesburg (2002). Russian legislation
concerning environmental protection and sustainable development
was also employed.
The main measures identifi ed in the Policy option analysis are designed
not only to preserve and restore the water ecosystems in the region, but
also to reduce polluting substances in the air and water. Another goal
is to aid the local population with its struggle with poverty, as well as
to increase the level of education, while lowering the growth in costs
of public health services.
EXECUTIVE SUMMARY
13
Abbreviations and acronyms
AD
Autonomous Districts (or: autonomous okrugs)
AMAP
Arctic Monitoring and Assessment Program
BERPAC
A Program for Long-term Ecological Research of Ecosystems
of the Bering and Chukchi Seas and the Pacifi c Ocean
BD
Bacterial Destruction
BP Benzo(a)pyrene
CIS
Commonwealth of Independent States
DDT Dichlorodiphenyltrichloroethane
DDE Dichlorodiphenylethane
DDD Dichlorodiphenyldichloroethane
GDP Gross
Domestic
Product
GESAMP Group of Experts on the Scientifi c Aspects of Marine Pollution
GIWA
Global International Waters Assessment
GOIN State
Oceanographic
Institute
-HCCH alpha-hexachlorocyclohexane
-HCCH gamma-hexachlorocyclohexane
IGCE
Institute of Global Climate and Ecology
MPC Maximum
Permissible
Concentration
NSR Northern
Sea
Route
Ocs Organochlorine
Pesticides
PAH
Polycyclic Aromatic Hydrocarbons
PCBs Polychlorinated
Biphenyls
PHs Petroleum
Hydrocarbons
RAS
the Russian Academy of Sciences
RAZ
Russian Arctic Zone
RF Russian
Federation
RSFSR
Russian Soviet Federative Socialist Republic
SSAS Synthetic
Surface
Active
Substances
TIR Total
Initial
Resources
USSR
Union of Soviet Socialist Republics
VOC Volatile
Organic
Compounds
14
GIWA REGIONAL ASSESSMENT 1A RUSSIAN ARCTIC
List of figures
Figure 1
Boundaries of the Russian Arctic region. . . . . . . . . . . . . . . . . . . . . . . . . . . . . . . . . . . . . . . . . . . . . . . . . . . . . . . . . . . . . . . . . . . . . . . . . . . . . . . . . . . . . . . . . . . . . . . . . . . . . . . . . . . . . . . . . . . . . . . . 16
Figure 2
Global and Arctic marine climate systems.. . . . . . . . . . . . . . . . . . . . . . . . . . . . . . . . . . . . . . . . . . . . . . . . . . . . . . . . . . . . . . . . . . . . . . . . . . . . . . . . . . . . . . . . . . . . . . . . . . . . . . . . . . . . . . . . . . . . . 18
Figure 3
Surface ocean currents in the Arctic Ocean. . . . . . . . . . . . . . . . . . . . . . . . . . . . . . . . . . . . . . . . . . . . . . . . . . . . . . . . . . . . . . . . . . . . . . . . . . . . . . . . . . . . . . . . . . . . . . . . . . . . . . . . . . . . . . . . . . . . 18
Figure 4
Summer and winter air temeratures in the Russian Arctic region. . . . . . . . . . . . . . . . . . . . . . . . . . . . . . . . . . . . . . . . . . . . . . . . . . . . . . . . . . . . . . . . . . . . . . . . . . . . . . . . . . . . . . . . . . . . . . . 18
Figure 5
Indigenous people of the Arctic. . . . . . . . . . . . . . . . . . . . . . . . . . . . . . . . . . . . . . . . . . . . . . . . . . . . . . . . . . . . . . . . . . . . . . . . . . . . . . . . . . . . . . . . . . . . . . . . . . . . . . . . . . . . . . . . . . . . . . . . . . . . . . . . . 21
Figure 6
Population density in the Russian Arctic region. . . . . . . . . . . . . . . . . . . . . . . . . . . . . . . . . . . . . . . . . . . . . . . . . . . . . . . . . . . . . . . . . . . . . . . . . . . . . . . . . . . . . . . . . . . . . . . . . . . . . . . . . . . . . . . . 22
Figure 7
Income per capita in the Russian Arctic region as compared to the whole of Russia.. . . . . . . . . . . . . . . . . . . . . . . . . . . . . . . . . . . . . . . . . . . . . . . . . . . . . . . . . . . . . . . . . . . . . . . . . . . . 23
Figure 8
Lena River Delta and East Siberian Sea. . . . . . . . . . . . . . . . . . . . . . . . . . . . . . . . . . . . . . . . . . . . . . . . . . . . . . . . . . . . . . . . . . . . . . . . . . . . . . . . . . . . . . . . . . . . . . . . . . . . . . . . . . . . . . . . . . . . . . . . . 30
Figure 9
Metal concentrations in the Kara Sea waters and bottom sediments. . . . . . . . . . . . . . . . . . . . . . . . . . . . . . . . . . . . . . . . . . . . . . . . . . . . . . . . . . . . . . . . . . . . . . . . . . . . . . . . . . . . . . . . . . . 33
Figure 10
Metal concentrations in Laptev Sea waters.. . . . . . . . . . . . . . . . . . . . . . . . . . . . . . . . . . . . . . . . . . . . . . . . . . . . . . . . . . . . . . . . . . . . . . . . . . . . . . . . . . . . . . . . . . . . . . . . . . . . . . . . . . . . . . . . . . . . 34
Figure 11
Metal concentrations in East Siberian Sea waters and bottom sedimets. . . . . . . . . . . . . . . . . . . . . . . . . . . . . . . . . . . . . . . . . . . . . . . . . . . . . . . . . . . . . . . . . . . . . . . . . . . . . . . . . . . . . . . . 35
Figure 12
Metal concentrations in Chukchi Sea waters. . . . . . . . . . . . . . . . . . . . . . . . . . . . . . . . . . . . . . . . . . . . . . . . . . . . . . . . . . . . . . . . . . . . . . . . . . . . . . . . . . . . . . . . . . . . . . . . . . . . . . . . . . . . . . . . . . . 35
Figure 13
Nickel foundry at Norilsk, Russia. . . . . . . . . . . . . . . . . . . . . . . . . . . . . . . . . . . . . . . . . . . . . . . . . . . . . . . . . . . . . . . . . . . . . . . . . . . . . . . . . . . . . . . . . . . . . . . . . . . . . . . . . . . . . . . . . . . . . . . . . . . . . . . 37
Figure 14
The Fedor Matisen in the pack ice of the Chukchi Sea near Mechigmen Bay, Russia. . . . . . . . . . . . . . . . . . . . . . . . . . . . . . . . . . . . . . . . . . . . . . . . . . . . . . . . . . . . . . . . . . . . . . . . . . . . . 44
Figure 15
Annual winter temperature over Arctic 1900-1996. . . . . . . . . . . . . . . . . . . . . . . . . . . . . . . . . . . . . . . . . . . . . . . . . . . . . . . . . . . . . . . . . . . . . . . . . . . . . . . . . . . . . . . . . . . . . . . . . . . . . . . . . . . . . 47
Figure 16
Road flooded by the Lena River outside Yakutsk, May 23, 2001. . . . . . . . . . . . . . . . . . . . . . . . . . . . . . . . . . . . . . . . . . . . . . . . . . . . . . . . . . . . . . . . . . . . . . . . . . . . . . . . . . . . . . . . . . . . . . . . . 49
Figure 17
Causal chain diagram illustrating the causal links for modification of neritic ecosystems in Kara Sea. . . . . . . . . . . . . . . . . . . . . . . . . . . . . . . . . . . . . . . . . . . . . . . . . . . . . . . . . . 53
Figure 18
Causal chain diagram illustrating the causal links for chemical pollution in Kara Sea. . . . . . . . . . . . . . . . . . . . . . . . . . . . . . . . . . . . . . . . . . . . . . . . . . . . . . . . . . . . . . . . . . . . . . . . . . 55
Figure 19
Kara Sea. . . . . . . . . . . . . . . . . . . . . . . . . . . . . . . . . . . . . . . . . . . . . . . . . . . . . . . . . . . . . . . . . . . . . . . . . . . . . . . . . . . . . . . . . . . . . . . . . . . . . . . . . . . . . . . . . . . . . . . . . . . . . . . . . . . . . . . . . . . . . . . . . . . . . . . 57
Figure 20
Causal chain diagram illustrating the causal links for oil spills in Kara Sea. . . . . . . . . . . . . . . . . . . . . . . . . . . . . . . . . . . . . . . . . . . . . . . . . . . . . . . . . . . . . . . . . . . . . . . . . . . . . . . . . . . . . 58
Figure 21
Gas drilling on the Yamal Peninsula.. . . . . . . . . . . . . . . . . . . . . . . . . . . . . . . . . . . . . . . . . . . . . . . . . . . . . . . . . . . . . . . . . . . . . . . . . . . . . . . . . . . . . . . . . . . . . . . . . . . . . . . . . . . . . . . . . . . . . . . . . . . 63
List of tables
Table 1
Physical, geographical and climate characteristics of the seas of the Russian Arctic region. . . . . . . . . . . . . . . . . . . . . . . . . . . . . . . . . . . . . . . . . . . . . . . . . . . . . . . . . . . . . . . . . . . . . . 17
Table 2
Main river basins in the Russian Arctic region. . . . . . . . . . . . . . . . . . . . . . . . . . . . . . . . . . . . . . . . . . . . . . . . . . . . . . . . . . . . . . . . . . . . . . . . . . . . . . . . . . . . . . . . . . . . . . . . . . . . . . . . . . . . . . . . . . . 19
Table 3
Characteristics of the coastal regions as compared to Russia. . . . . . . . . . . . . . . . . . . . . . . . . . . . . . . . . . . . . . . . . . . . . . . . . . . . . . . . . . . . . . . . . . . . . . . . . . . . . . . . . . . . . . . . . . . . . . . . . . . 19
Table 4
Oil and gas resources in some areas in the Russian Arctic region. . . . . . . . . . . . . . . . . . . . . . . . . . . . . . . . . . . . . . . . . . . . . . . . . . . . . . . . . . . . . . . . . . . . . . . . . . . . . . . . . . . . . . . . . . . . . . . 20
Table 5
Changes in population in the Russian Arctic region. . . . . . . . . . . . . . . . . . . . . . . . . . . . . . . . . . . . . . . . . . . . . . . . . . . . . . . . . . . . . . . . . . . . . . . . . . . . . . . . . . . . . . . . . . . . . . . . . . . . . . . . . . . . . 21
Table 6
Fertility and mortality rates in the Russian Arctic region.. . . . . . . . . . . . . . . . . . . . . . . . . . . . . . . . . . . . . . . . . . . . . . . . . . . . . . . . . . . . . . . . . . . . . . . . . . . . . . . . . . . . . . . . . . . . . . . . . . . . . . . 22
Table 7
Gender and age structure of the population. . . . . . . . . . . . . . . . . . . . . . . . . . . . . . . . . . . . . . . . . . . . . . . . . . . . . . . . . . . . . . . . . . . . . . . . . . . . . . . . . . . . . . . . . . . . . . . . . . . . . . . . . . . . . . . . . . . 23
Table 8
Level of education of employed population 2001. . . . . . . . . . . . . . . . . . . . . . . . . . . . . . . . . . . . . . . . . . . . . . . . . . . . . . . . . . . . . . . . . . . . . . . . . . . . . . . . . . . . . . . . . . . . . . . . . . . . . . . . . . . . . . 23
Table 9
Number and form of property of enterprises and organisations in the region. . . . . . . . . . . . . . . . . . . . . . . . . . . . . . . . . . . . . . . . . . . . . . . . . . . . . . . . . . . . . . . . . . . . . . . . . . . . . . . . . . 24
Table 10
Industrial production in 2001. . . . . . . . . . . . . . . . . . . . . . . . . . . . . . . . . . . . . . . . . . . . . . . . . . . . . . . . . . . . . . . . . . . . . . . . . . . . . . . . . . . . . . . . . . . . . . . . . . . . . . . . . . . . . . . . . . . . . . . . . . . . . . . . . . 24
Table 11
Navigation in the Russian Arctic 1985-2000. . . . . . . . . . . . . . . . . . . . . . . . . . . . . . . . . . . . . . . . . . . . . . . . . . . . . . . . . . . . . . . . . . . . . . . . . . . . . . . . . . . . . . . . . . . . . . . . . . . . . . . . . . . . . . . . . . . . 25
Table 12
Scoring tables for the Russian Arctic region. . . . . . . . . . . . . . . . . . . . . . . . . . . . . . . . . . . . . . . . . . . . . . . . . . . . . . . . . . . . . . . . . . . . . . . . . . . . . . . . . . . . . . . . . . . . . . . . . . . . . . . . . . . . . . . . . . . . 28
Table 13
Water pollution in some of the rivers in the Russian Arctic region. . . . . . . . . . . . . . . . . . . . . . . . . . . . . . . . . . . . . . . . . . . . . . . . . . . . . . . . . . . . . . . . . . . . . . . . . . . . . . . . . . . . . . . . . . . . . . . 29
Table 14
Pollution impact areas in the Russian Arctic region. . . . . . . . . . . . . . . . . . . . . . . . . . . . . . . . . . . . . . . . . . . . . . . . . . . . . . . . . . . . . . . . . . . . . . . . . . . . . . . . . . . . . . . . . . . . . . . . . . . . . . . . . . . . . 31
Table 15
Pollutants above maximum allowed concentrations in the Kara Sea sub-system. . . . . . . . . . . . . . . . . . . . . . . . . . . . . . . . . . . . . . . . . . . . . . . . . . . . . . . . . . . . . . . . . . . . . . . . . . . . . . 33
Table 16
Chlorinated hydrocarbons in the Chukchi Sea.. . . . . . . . . . . . . . . . . . . . . . . . . . . . . . . . . . . . . . . . . . . . . . . . . . . . . . . . . . . . . . . . . . . . . . . . . . . . . . . . . . . . . . . . . . . . . . . . . . . . . . . . . . . . . . . . . 35
Table 17
Phytoplankton in the Laptev Sea.. . . . . . . . . . . . . . . . . . . . . . . . . . . . . . . . . . . . . . . . . . . . . . . . . . . . . . . . . . . . . . . . . . . . . . . . . . . . . . . . . . . . . . . . . . . . . . . . . . . . . . . . . . . . . . . . . . . . . . . . . . . . . . 42
Table 18
Air pollution in the Russian Arctic region. . . . . . . . . . . . . . . . . . . . . . . . . . . . . . . . . . . . . . . . . . . . . . . . . . . . . . . . . . . . . . . . . . . . . . . . . . . . . . . . . . . . . . . . . . . . . . . . . . . . . . . . . . . . . . . . . . . . . . . 55
List of boxes
Box 1
Main functions of ecological indicators. . . . . . . . . . . . . . . . . . . . . . . . . . . . . . . . . . . . . . . . . . . . . . . . . . . . . . . . . . . . . . . . . . . . . . . . . . . . . . . . . . . . . . . . . . . . . . . . . . . . . . . . . . . . . . . . . . . . . . . . 40
ABBREVIATIONS AND ACRONYMS
15
Regional defi nition
This section describes the boundaries and the main physical and
Boundaries of the region
socio-economic characteristics of the region in order to defi ne the
area considered in the regional GIWA Assessment and to provide
The GIWA region Russian Arctic occupies a large part of the Russian
suffi
cient background information to establish the context within
Federation, extending about from Novaya Zemblya on the western
which the assessment was conducted.
edge to the Mys Dezhneva (East Cape) on the eastern one (Figure 1).
The coastal parts of the Russian Arctic region include the entire territories
C h u k c h i S e a
E a s t S i b e r i a n S e a
Z e m b l y a
y a
a
Chukotski AD
v
o
N
K a r a S e a
L a p t e v S e a
ka
ir
Nenents AD
g
Indi
yma
Kol
r
ek
en
Taimyr (Dolgano-Nenets) AD
Ol
naba
Yamalo-Nenets AD
A
Republic of Sakha
Norilsk
Ob
r
Pu
azT
isei
en
Sverdlovsk
Y
Chelyabinsk
Russia
Elevation/
Omsk
Depth (m)
na
Tomsk
Le
4 000
Novosibirsk
Kazakhstan
Kemerovo
2 000
Krasnoyarsk
Karaganda
1 000
Barnaul
Novokuznetsk
500
100
0
Irkutsk
-50
-200
-1 000
-2 000
0
1 000 Kilometres
Ulaanbaatar
Mongolia
© GIWA 2005
Figure 1
Boundaries of the Russian Arctic region.
16
GIWA REGIONAL ASSESSMENT 1A RUSSIAN ARCTIC
Table 1
Physical, geographical and climate characteristics of the seas of the Russian Arctic region.
Depth
Water temperature
Salinity
Average wind
Average air temperature
Annual flow
Sea
Area (km2)
Volume (km3)
Position
Average/Max (m)
Min/Max(°C)
Min/Max (PSU)
velocity (m/s)
Min/Max (°C)
(km3/year)
Kara
883 000
98 000
111/600
68-81° N/50-105° E
-1.7/6
5/35
5-7
-28 (March)/6 (July)
1 290
Laptev
662 000
353 000
533/3 385
71-81° N/105-140° E
-1.7/5
5/35
4-8
-29 (March)/5 (August)
720
East Siberian
913 000
49 000
54/915
69-79° N/140-180° E
-1.8/8
4/32
6-15
-30 (January)/3 (July)
255
Chukchi
595 000*
42 000*
71/1 256*
67-76° N/178° E-156° W
-1.8/8
24/34
4-8
-28 (February)/4 (July)
18 (72*)
Note: *Russian and American part. (Source: Zalogin and Kosarev 1999)
of the following parts of the Russian Federation: Nenets AD, Yamal-Nenets
Physical characteristics
AD, Taimyr (Dolgan-Nenets) AD, Chukotski AD, and the Norilsk industrial
complex of Krasnoyarskiy kray. In addition, the area also includes parts of
Table 1 shows the physical, geographical and climate characteristics of
some administrative districts of the Sakha Republic (Yakutia). The areas
the Russian Arctic region.
in the Sakha Republic that are included in this report are Allaihovsky,
Anabarsky, Bulunsky, Nezhnekolymsky, and Ust-Yanskiy uluses.
Environmental protection problems that are specifi c to Arctic and
subarctic marine ecosystems are becoming more and more important in
This report considers only the central and eastern parts of the entire
connection with the intensifi cation of economic activities in the Russian
Russian sector of the Arctic. The western/European part of the Russian
Arctic region, especially in consideration of the high sensitivity of those
Arctic (the Barents Sea and White Sea) has been evaluated in the GIWA
ecosystems to anthropogenic impacts. The Arctic seas are characterised
Regional Assessment 11 Barents Sea. However, because water and
by long light period in summer and diminished solar radiation in winter,
atmospheric transports from the western/European sector exert a
substantial freeze-up periods and thick, long-lasting ice cover, low water
signifi cant infl uence on the condition of transboundary waters in the
temperatures, foreshortened food webs, limited species diversity, and
Russian Arctic region, information from GIWA region Barents Sea is in
widespread long-living organisms with a high lipid content, which
some cases provided.
allows for the bioaccumulation of many toxic substances. Owing to the
low water temperature, the rate of microbial degradation in the Arctic
The GIWA region Russian Arctic includes the following seas:
seas is not nearly as rapid as in the mid-latitudes, which is particularly
Kara
Sea;
problematic with respect to the accumulation of toxic pollutants in
Laptev
Sea:
diff erent components of marine ecosystems.
East
Siberian
Sea;
Chukchi
Sea
(the
Russian
section).
Another important problem is the fact that people in the Arctic regions
consume fat-rich foods, which tend to accumulate organochlorine
The GIWA Task team agreed that the borders of the region should be
compounds with toxic, mutagenic and carcinogenic properties. In sum,
the following: the southern border of the region lies along the borders
the unique features of the Arctic environment aggravate the impact of
of the drainage basins; the northern border is open as far as the limits of
anthropogenic factors and require that the pollutant discharges to the
available information; the western border is the GIWA region 11 Barents
Arctic seas be immediately controlled, along with constant monitoring
Sea region, and the eastern border is the GIWA region 1b Arctic Greenland
of the situation with an eye to controlling discharges, and an assessment
region (Figure 1). Parts of region´s drainage area are located in Kazakhstan
of the region's ecological capacity.
and Mongolia. However, their infl uence is considerd to be of minor
importance and therefore, they will not be discussed in this report.
Climate
Occupying just 5% of the world's oceans, and just 1.5% of their volume,
The marine waters in the Russian Arctic region that are considered
the Arctic Ocean and its adjacent seas have a pronounced eff ect on
international waters according to the international laws and norms will
the state of the Earth's climate and play a decisive role in many global
be regarded as transboundary waters. The region is divided into two
processes. The Russian Arctic seas regulate the global carbon cycle
sub-systems: (i) Kara Sea, with two main drainage basins, the Ob and
since they are an important CO source in the winter and a CO sink in
2
2
Yenisei; and (ii) Laptev Sea, East Siberian Sea and the Russian sector of
the summer. Recent assessments have shown that the Arctic is critically
the Chukchi Sea including their drainage basins. All of these river basins
important in atmospheric CO removal, both now and in the future
2
are situated in Russia and are therefore not considered transboundary.
(Moritz 1990, IPCC 1996, 2001). Figure 2 depicts the elements of global
REGIONAL DEFINITION
17


Hydrologic cycle
Energy budget
Nor
Sea ice budget
th Atla
Surface albedo
ntic
Temperature
Current
Tr
Marine productivity
Deep water
a
Beaufort Gyre
Arctic climate
nsp
Chemical cycling
formation
olar Drif
t
CHUKCHI SEA
EAST SIBERIAN
Sediments
BARENTS SEA
SEA
World ocean
KARA SEA
CO2
Global climate
Nutrients
LAPTEV SEA
Ecosystem
Temperature
Yen
response
a
THE GLOBAL SYSTEM
Ob
isey
Len
Figure 2
Global and Arctic marine climate systems.
(Note: Dashed lines: Global climate system. Solid lines: Arctic marine system.
Causal linkages are indicated by black and feedback loops by yellow arrows.)
(Source: Arctic system science 1990)
© GIWA 2005
Figure 3
Surface ocean currents in the Arctic Ocean.
(Source: AMAP 1998)
climate systems and Arctic marine systems. The Russian Arctic seas also
have a profound impact on many large-scale oceanographic processes,
is moderated by the Atlantic Ocean to a greater extent than the central
as they are a zone of deep ocean water formation and determine to
and eastern parts because of the prevailing western atmospheric fl ows.
a great extent the global hydrological cycle and atmospheric heat
The western Russian Arctic is the warmest part of the region and the
absorption (Figure 3).
temperature range between winter and summer is much lower than
in the northeastern part of Russia, which is characterised by the most
The climate of the Russian Arctic region is characterised by a lack of
severe climatic conditions (Figure 4).
solar radiation in the winter, which leads to very low temperatures.
In contrast to winter, the summer is characterised by a signifi cant
Rivers systems
solar radiation fl ux, but temperatures are not high because most of
Table 2 shows the main morphological characteristics of the largest
the incoming solar energy is expended in the melting of snow or
rivers in the region. The greatest run-off volume is in the Kara Sea
ice. Atmospheric circulation is characterised by cyclonic activity in all
Basin (1 290 km3). The Arctic seas in this region may be arranged in
seasons, which mediates the exchange of air masses between middle
descending order of river run-off as follows: Kara Sea, Laptev Sea, East
and high latitudes. The climate in the western part of the Russian Arctic
Siberian Sea, and Chukchi Sea. The largest rivers that empty into the
Temperature (°C)
January
July
-40
-30
-20
-10
0
10
20
30
more
© GIWA 2005
Figure 4
Summer and winter air temeratures in the Russian Arctic region.
(Source: ESRI 1996)
18
GIWA REGIONAL ASSESSMENT 1A RUSSIAN ARCTIC
Table 2
Main river basins in the Russian Arctic region.
Socio-economic characteristics
Provision of water
Basin area
Length
Annual flow
(m3/year)
River
(km2)
(km)
(km3)
In this report only the are coastal administrative units of the region are
per km2
per capita
considered: Nenets AD, Yamal-Nenets AD, Taimyr (Dolgan-Nenets) AD,
Kara Sea
Chukotski AD, as well as the Norilsk industrial complex of Krasnoyarskiy
Yenisei (with Angara)
2 580 000
3 844
585
244 200
221 500
Kray. In addition, the region also includes parts of some administrative
Ob (with Irtysh)
2 470 000
3 676
403
178 600
54 400
districts of the Sakha Republic: the Allaihovsky, Anabarsky, Bulunsky,
Taz
150 000
1 401
33
ND
ND
Nezhnekolymsky, and Ust-Yanskiy uluses. Most of Russia's indigenous
Pur
112 000
1 024
29
ND
ND
population (northern minorities) lives in this zone. (Statistical data for
Laptev Sea
the entire Republic of Sakha were used for characterising the uluses
listed. Corrections to the data are based on unoffi
cial information.)
Lena
2 472 000
4 337
489
209 200
446 700
Anabar
100 000
939
17
ND
ND
The total land area included in the region equals 11.7 million km2. The
Olenek
219 000
2 292
46
ND
ND
coastal administrative units have an area of 5.23 million km2, which
East Siberian Sea
is nearly one-third of Russia's total area. If just the coastal uluses of
The rivers of the coastal
1 098 000
-
255
232 300
952 500
the Sakha Republic (Yakutia) are taken into account, the area will be
area including:
Kolyma
644 000
2 150
83
ND
ND
smaller and will amount to about 3.46 million km2, or one-fi fth of the
total territory of the country (Table 3).
Indigirka
360 000
1 790
38
ND
ND
Note: ND = No Data.
(Source: Roshydromet 1996a, b, 1997, 1998, 1999, 2000, 2001, 2002)
Natural resources
The borders of the Russian Federation Arctic Zone (RAZ) inlcude the
GIWA regions Barents Sea and Russian Arctic. The borders were defi ned
Laptev Sea are the Anabar, Olenek and Lena. Lena River is the second
by the State Commission of the Council of Ministers of the USSR in
largest river in the region after Yenisei River, which drains into Kara Sea.
1989 and include the Exclusive Economic Zone and Continental Shelf
Other large river basins in the Kara Sea drainage area are Ob, Taz and
of the Russian Arctic. The State Commission have recently prepared an
Pur rivers. The main rivers of the East Siberian Sea Basin are the Indigirka
evaluation of the law regarding RAZ which determined that the RAZ
and Kolyma rivers. The water volume of the Kolyma River is more than
should also include the coastline, inland waters and territorial seas of
two times that of Indigirka.
the Russian Arctic coast.
The rich natural resources in the Russian Arctic region make the area
an important part of not only of Russia's resource base but also the
Table 3
Characteristics of the coastal regions as compared to Russia.
Territory
Population
GDP in 2000
Industrial production
Agricultural production
Administrative unit
Part of Russia
Part of Russia
Total Russia
(million
Total Russia
Total Russia
Area (km2)
Total
(million RUB)
(million RUB)
(%)
(%)
(%)
rubles)
(%)
(%)
Nenets AD
176 700
1.03
44 900
9 088.9
5 711
206
Yamalo-Nenets AD
750 300
4.39
508 900
127 907.6
10 4915
316
Taimyr (Dolgano-Nenets) D
44 300
2 152
200
826 100
5.05
44
Norilsk industrial complex1
200 000
133 000
99 800
Republic of Sakha (Yakutia)
3 103 200
19.3
982 900
81 918.9
80 594
7 044
Republic of Sakha (coastal Arctic uluses)
930 900
5.79
98 300
8 191.9
5 600
350
Chukotski AD
373 700
4.32
73 800
4 128.6
2 929
108
Total
5 230 000
33.0
1 854 800
1.3
358 196
5.71
294 149
5.0
7 718
0.8
Notes: 1Norilsk industrial complex is located on territory Taimyr (Dolgano-Nenets) D but is in administrative sub-ordination of Krasnoyarskiy kray.
(Source: Regions of Russia 2002)
REGIONAL DEFINITION
19
world's. The Russian Arctic Zone (RAZ) includes substantial parts of well-
Coal fi elds are also found in the region, for example in Taimyrskiy,
known oil and gas provinces, for example Timano-Pecherskaya, Western
Norilskiy coal areas of the Dolgano-Nenets AD, Lenskiy, Anabarskiy,
Siberian, Lena-Tungusskaya, Hatango-Viluiskaya, Kolymo-Indigirskaya,
Olenekskiy coal basins in the northern part of the Republic of Sakha,
Enisey-Lenskaya, Chukotsko-Alaskinskaya and Novosibirsko-
and the Anadirskoye and other coal fi elds of the Chukotski AD. Coal
Chukotskaya. The Nenets AD has 53.4% of the total initial resources
fi elds in the eastern part of the Russian Arctic are less explored and the
(TIR) of oil, 38.9% of the TIR of gas, 12.3% of the TIR of gas condensate
demand for them is smaller than for the western ones. As a whole, the
for all of the Timano-Pechora resources (Table 4). Giant gas fi elds in the
probable coal reserves of the RAZ are estimated at 780 x 1012 tonnes,
Western Siberian province are an exceptional resource in the Arctic as
including 81 x 1012 tonnes of coking coals.
a whole. These fi elds are situated mostly in the Yamal-Nenets AD. Most
of these stocks are shallow, which makes it highly effi
cient to extract
The number of species and the total stocks of biological resources in
them (Granberg et al. 2000). The predicted resources of the northern
the Kara Sea, the East Siberian Sea, the Chukchi Sea and the Laptev Sea
regions of Krasnoyarsk territory (Taymyr AD) and the continental areas
are limited. Most of the marine catches in the RAZ is from the Barents
of Anadyrskiy and Hatyrskiy to as far south as the Chukot Peninsula are
and White seas, i.e. outside the GIWA Russian Arctic region. In these
also shown in Table 4.
seas fi sh populations are to small to allow the establishment of a large
industrial fi shery. At the same time, these coastal areas, along with fi sh
stocks in the region's rivers, are of great importance in supporting the
Table 4
Oil and gas resources in some areas in the Russian
small settlements of the Arctic coastal zone.
Arctic region.
Total initial resources
Administrative unit
Big rivers tend to fl ow north-south through the territories of the
Oil Gas
Gas
condensate
central and eastern parts of the RAZ. On the one hand the rivers are
Nenets AD
13.76 x 10¹² tonnes
2.4 x 10¹⁸ m3
352.9 x 10¹⁸ tonnes
Western Siberian province
a benefi t: they provide transportation for the region as it lacks railway
2.5 x 10¹² tonnes
30 x 1018 m3
0.9 x 10⁹ tonnes
(Yamal-Nenets AD)
connections with the central regions of the country and with large sea
Northern areas of Krasnoyarsk territory
3.2 x 10¹² tonnes
14.6 x 10¹² m3
(Taymyr AD)
ports. On the other hand, the rivers bring problems to the Arctic seas as
Continental areas of Anadyrskiy and
they carry pollutants from the Ural regions, eastern and western Siberia,
0.5 x 10⁹ tonnes
250 x 1012 m3
Hatyrskiy
(Source: Granberg et al. 2000, Oil and Capital 2001)
the Republic of Sakha and the Magadan region.
The national or Northern Sea Route (NSR) bears special importance
The region contains unique stocks and probable reserves of copper-
for the region. This route passes through the Russian Arctic seas and
nickel ores, tin, platinum less-common metals, and rare earth elements,
connects Arctic areas of the Russian Federation with the coast. This
as well as large stocks and probable reserves of gold, diamonds,
route may someday become the shortest way to inter-connect centres
tungsten, mercury, ferrous metals, optical raw materials and ornamental
of global economy such as the Asian-Pacifi c region, North America,
stones. The main mineral resources of the central and eastern parts of
and western Europe.
the RAZ are located in the following provinces:
Taimyr-Norilskaya (copper-nickel ores, platinoids);
Population
Maymecha-Kotuyskaya and Udzhinskaya (phosphorus, iron,
The coastal administrative units of the region have a population of
niobium, platinoids, diamonds);
approximately 1.8 million people (0.9 million if only coastal Yakutia's
Taimyr-Severozemelskaya (gold, mica, molybdenum, tungsten,
uluses are included), which amounts to only 1.3% (0.68%) of Russia's
chrome, vanadium, polymetals);
total population (Table 3). The average population density in the region
Anabarskaya and Yakutskata (diamonds, iron, rare metals);
is very low (0.32 persons per km2), with the highest value in the Yamalo-
Verkhoyanskaya and Yano-Chukotskaya (tin, gold, mercury,
Nenets AD (0.68 persons per km2). Because of the low ecological capacity
tungsten, copper, molybdenum, silver, platinoids, polymetals).
of the tundra territories, settlement densities have only reached to the
maximum density of 2 persons per 100 km2 as compared to 17-18 persons
The continental shelf and archipelagos in the RAZ contain stocks and
per 100 km2 in the forest-steppe zone (Myagkov 1995).
probable reserves of almost all the categories of stream tin, gold and
diamonds, silver, manganese, polymetals, fl uorite and ornamental
The current population of the Russian Arctic region includes an
stones, titanium and zirconium (Barsegov et al. 2000).
indigenous population (northern minorities), old settlers (the Russian
20
GIWA REGIONAL ASSESSMENT 1A RUSSIAN ARCTIC
the development of the regional economy and social infrastructure.
While the total population of the Russian Federation between the
Saami
Chukchi
1970 and 1989 census increased by 13.4%, the population in the north
Eskimos
Chuvans
increased more than 30% and in several of the mostly northerly regions
Nganasans
Nenets
Chukchi
(above the 61st parallel, in particular in the Yamalo-Nenets and Khanty-
Enets
Koryaks
Dolgans
a
Yukagirs
Mansiyskiy AD) it increased by four to six-fold. This growth was also
Ob
L
en
Nenets
Kets
Khants
Evens
Evens
connected with the exploration of the oil fi elds and the associated
Y
Mansi
e
nis
infl ow of people (Barsegov et al. 2002). However, after the USSR's
e
y
Evenks
Selkups
collapse, the region's population started to decrease. The population
Evenks
density is shown in Figure 6.
The dissolution of the Soviet Union was also marked by economic
©
GIWA©
2005
reforms that resulted in pay losses, uncontrolled privatisation, liquidation
Figure 5
Indigenous people of the Arctic.
of people's savings, reduction in wages and back pay that took months
(Source: AMAP 2002)
to pay out, mass unemployment, and both reductions and instability
in food and fuel delivery to the northern regions. This upheaval caused
population that has lived in the territory for several centuries in the
an intensive out migration of people both from the regions of the
Mezen region, the Ust-Russkoe region, and the Yakut population in
Russian Arctic region and from all the other areas and territories of the
the northern part of eastern Siberia) and newcomers, who settled
northern Russia. The region's extreme climate and remote nature meant
the region mainly during the 20th century. The majority of newcomers
that northern residents felt the economic and social impacts of market
are Russian, Ukrainian, and Belorussian. The indigenous population
reform failures more acutely than in other parts of Russia. During the
of the Russian north is composed of 30 northern minorities (about
reforms, state support for northern regions was reduced. More than a
200 million people). These minorities live in 27 territories of the Russian
million people left the sparsely populated northern Russia during the
Federation. Eleven minorities live in the Arctic region: Saami, Enets,
years of reforms. The average decrease in the population of the region
Nenets, Khants, Nganasans, Dolgans, Evens, Evenks, Chukchi, Eskimos,
was about 15-20% from 1991-2001. As a result, during the period from
and Yukagirs. The Selkups, Chuvans, Mansi, Kets, and Koryaks live in the
1990-1991 until 2002 the population of Chukotski AD was reduced by
adjacent GIWA regions (Figure 5). For more information in the Arctic
2.2-fold, while that of the Taimyrski (Dolgano-Nenets) decreased by
indigenous people in Russia see Annex V.
1.3-fold. During the same period the population of the Yamal-Nenets
autonomous region increased by 1.6% (Table 5).
The regions of the northern Russian have always been characterised by
intense migrational movement. Between 1970 and 1989 the direction of
This seemingly anomalous increase can be explained by the
the fl ow was towards far northern Russia. The direction of these fl ows
immigration of people to regions with intensive oil and gas extraction.
was mostly defi ned by the state policy of exploration of regions with
But a natural increase had also occurred as a result of relatively higher
extreme living conditions. The state encouraged the infl ux of people
standards of living. Statistical information that summarises the region
from diff erent areas of Russia to the region for permanent or temporary
provides a clear view of the changes in the socio-economic conditions
residency.
in the Russian Arctic region. However, frequent "spot" observations
run the risk of emphasising the direction and acuteness of general
Under the conditions of the USSR's planned economy there were
regional and sectoral factors that resulted in an increase in wages as
Table 5
Changes in population in the Russian Arctic region.
Change
an incentive. The state also provided stable prices for consumer goods
Administrative unit
1991
1996
2000
2002
(%)
and services, periodic free round-trip travel for workers and members
Nenets AD
54 000
47 000
45 000
45 000
83.3
of their family to other areas of the USSR, and gave the children of these
Yamal-Nenets D
501 000
497 000
504 000
509 000
101.6
settlers privileges in terms of admission to institutes, as well as other
Taimyr (Dolgano-Nenets) AD
54 000
47 000
44 000
44 000
81.5
incentives. These incentives encouraged long-term settlement, which
Republic of Sakha (Yakutia)
1 122 000
1 036 000
989 000
983 000
87.6
is why those who came for temporary or short-term employment
Chukotski AD
160 000
97 000
83 000
74 000
46.3
eventually became old residents and formed a constant staff base for
(Source: Regions of Russia 2002)
REGIONAL DEFINITION
21
Population density
(persons/km2)
<1
C h u k c h i S e a
1-2
3-5
6-10
Chaun
11-100
E a s t S i b e r i a n S e a
Chukotski AD
>100
K a r a S e a
alyy Anyuy
M
O
L a p t e v S e a
molon
Indigi
Taymyr (Dolgano-Nenets)AD
rk
O
a
l
a
enek
Pyasin
Y
Khatanga
M
a
a
n
a
Kheta
abar l
a
a
m
n
y
In
l
y
a
d
b'
A
K
ig
Ko
u
ir
ya O
k
r
o
a
Magadanskaya oblast'
ala
n
Pu
a
Sverdlovskaya oblast'
M
y
m
z
tu
k
T
a
o
a
K
Yamalo-Nenets AD
K
ulu
ru
Republic of Sakha
Khanty-Mansiyskiy AD
T
T
u
a
Yetyp
r
v
isey
a
V
d
n
ily
a
Ye
uy
Vilyuy
Evenkiyskiy AD
Vak
bol
h
To
Tyumenskaya oblast'
a
Irt
g
ys
m
h
A
Tobol
ya
Lena
aM
Kustanay
Tomskaya oblast'
Ishim
Ket'
Tara
Omskaya oblast'
R
u
s
s
i
a
Kokchetav
Om'
'
Angara
Chulym
n
m
a
Novosibirskaya oblast'
d
To
l
A
Tselinograd
Krasnoyarskiy kray
Irkutskaya oblast'
Ob'
Pavlodar
ra
Kemerovskaya oblast'
u
N
Karaganda
Altayskiy kray
a
Amurskaya oblast'
a
Biya
lekm
ur
O
isey Republic of Khakasiya
N
Kat C
Yen
h
Khamsar
Republic of Buryatiya
Vitim
u
Kazakhstan
Republic of Altay
n
u
a
'
ly
M
A
s
a
n
Chitinskaya oblast'
h
lyy
g
m
Y
a
Semipalatinsk
en
r
a
a
ise
n
y
East Kazakhstan
Kara-Ir
E
Selenge
Republic of Tyva
gi
t
Hovsgol
y
ysh
n Go
n
l
Ideriy
Bulgan Selenge
n
o
Arhangay
r
h
Ulaanbaatar
O
Mongolia
0
500 Kilometres
© GIWA 2005
Figure 6
Population density in the Russian Arctic region.
(Source: ORNL 2003)
tendencies. For example the northern settlements of the republic of
Table 6
Fertility and mortality rates in the Russian Arctic region.
Sakha and the settelements of Chukotski are still experiencing a net
Infant
Fertility
Mortality
mortality
outfl ow of people.
Administrative unit
(births/1 000)
(deaths/1 000)
(deaths/1 000)
1990
1995
2001
1990
1995
2001
1998
2001
The decrease in birth rate, increase in mortality and in emigration
Nenets AD
16.7
12.4
13.0
7.0
11.7
12.2
19.5
20.1
are causes of the decrease in the population in the eastern part of
Yamal-Nenets AD
16.3
13.1
12.8
3.3
6.4
6.1
14.6
15.6
the region during the last 10-13 years. The birth rate in these regions
Taimyr (Dolgano-Nenets) AD
15.6
11.4
13.0
6.7
10.7
10.1
16.2
24.3
(number of births per 1000 population), which signifi cantly exceeded
Republic of Sakha (Yakutia)
19.6
15.3
13.6
6.8
9.8
10.0
19.7
17.5
the average level for the Russian Federation as a part of the USSR in the
Chukotski AD
14.3
9.8
10.6
3.9
8.6
7.1
33.1
42.1
1980s to the 1990s, is decreasing annually by 3-5% (Table 6).
Average for Russia
13.4
9.3
9.1
1.2
15.0
15.6
16.5
14.6
(Source: Regions of Russia 2002)
Additionally, the mortality rate has increased in the region. For example,
the number of people who died increased during the period of 1990-
in the mortality rate has increased by 1.4-fold. The growth of mortality
2001: in the Nenets AD the mortality rate increased 1.7-fold, in Chukotski
in children, including infants, is notable. During the last fi ve years this
AD, the increase was 1.8-fold , while in Russia overall, the average growth
mortality level has signifi cantly exceeded the average level for Russia:
22
GIWA REGIONAL ASSESSMENT 1A RUSSIAN ARCTIC
20.1 infants of every 1 000 born in 2001 in the Nenets AD died, while
Table 7
Gender and age structure of the population.
that number was 24.3 in the Taimyr (Dolgano-Nenets) AD (a number
Share of people older than
Administrative
Women per 1 000 men
employable age(%)
that has increased by 150% from 1998), and 42.1 deaths per 1 000 in the
unit
1991
2002
1991
2002
Chukotski AD (Regions of Russia 2002).
Nenets AD
932
1 052
8.5
13.2
Yamalo-Nenets AD
922
951
2.7
6.6
The migratory outfl ow over the last years has changed the ratio of
Taimyr AD
947
961
5.4
9.6
the urban and rural populations in the region. Residents of cities and
Republic of Sakha
986
1 018
7.1
10.7
urban areas have left their homes, mostly because of unemployment.
Chukotski AD
917
920
2.8
10.1
Indigenous peoples and old residents who raise deer, fi sh, trap, hunt and
(Source: Regions of Russia 2002)
cultivate land stay in rural areas. The population loss is at the expense
Table 8
Level of education of employed population 2001.
of urban residents. The share of the urban population out of the total
High and
population of the Nenets AD during 1991-2002 decreased from 63.1% to
Secondary
Elementary
Secondary
Elementary
Administrative
unfinished
professional professional
general
general
60.8%; in the Taimyr AD from 66.5% to 63.9%; in the Republic of Sakha
unit
high
(% of total)
(% of total)
(% of total)
(% of total)
(% of total)
from 66.8% to 64.5%; and in the Chukotski AD from 72.5% to 68.4%. At
Nenets AD
20.1
43.0
14.4
11.1
1.0
the same time, the share of the urban population in the Yamal-Nenets
Yamalo-Nenets AD
20.3
35.3
30.5
14.0
0.1
AD increased by 0.1% because of the growth in the oil and gas industry.
Taimyr (Dolgano-
20.0
25.9
8.4
34.6
1.8
This autonomous district contains several large cities such as Salekhard
Nenets) AD
Republic of Sakha
(343 000), Noyabrsk (99 300), Novyi Urengoy (92 100), and Nadym
23.5
33.8
11.1
20.8
0.6
(Yakutia)
(45 300). As is typical in the north, cities and villages are often located
Chukotski AD
17.5
39.0
16.6
21.2
1.7
very far from each other, separated by great empty areas.
Total for Russia
25.1
31.3
11.6
23.4
1.1
(Source: Regions of Russia 2002)
The negative impacts of the Russian reforms of the last decade have
resulted in the growth of the social burdens borne by the political units
Economy
of the region. The increase in mortality and migrational outfl ow in the
After a long decline during the fi rst part of the 1990s, some growth has
last decade has led to a decrease in those who are employed and a
now been observed in the region's economy (Regions of Russia 2002).
decrease in real employment in the region. Young skilled workers
Incomes in the Russian Arctic region have been growing in recent years.
tend to leave the region, while pensioners and women have stayed.
In several districts, e.g. the Nenets AD and Taimyr AD, this growth is
Traditionally, there are fewer jobs for women than for men. For example,
faster than the average for Russia during 1997-2001 (Figure 7). At the
in the northern Tyumen region the ratio of jobs available for women
same time, the eastern areas have seen a slower growth in wages and a
versus men is one to 50 (Barsegov et al. 2002). However, the share of
rate of growth that lags behind the average growth of wages in Russia,
individuals employed in private enterprises and organisations has
increased (Regions of Russia 2002).
12 000
1997
Table 7 refl ects the growth in the share of female and aged population
10 000
1999
in recent years. The table shows the growth in the population of the
2001
8 000
region that are older than employable age and who need municipal
(rubles/month)
and regional subsidies that unfortunately cannot be paid for by
6 000
government budgets.
4 000
The level of education of workers in the region is shown in Table 8. The
c
ome per capita
I
n
2 000
population of the Nenets AD and Yamalo-Nenets AD is the most well-
educated. The Chukotski AD has the lowest level of education, which
0
Nenets AD
Yamolo-
Taimyr
Republic of
Chukotski
Average for
corresponds to the dynamics of the demographic situation described
Nenets AD
(Dolano-
Sakha
AD
Russia
Nenets AD)
(Yakutia)
earlier (Regions of Russia 2002).
Figure 7
Income per capita in the Russian Arctic region as
compared to the whole of Russia.
(Source: Regions of Russia)
REGIONAL DEFINITION
23
even without adjustments for infl ation and the increased prices for
The growth in incomes results in an increase in demand for personal
consumer goods. However, the region does benefi t from high share of
services, which in turn results in a net improvement in the quality of
hidden wages (in the form of cash, insurance, natural and other kinds) in
life. For example, the creation of paid service jobs in the Yamalo-Nenets
the average incomes per capita. This estimated share is about 21-29%.
AD (8 163 RUB per capita in 2001) and the Republic of Sakha (7 317 RUB
per capita in 2001) signifi cantly exceeds the average level for Russia
Currently the GDP of the region is not high, only 3.59% of Russia's
(5 694 RUB per capita in 2001) (Regions of Russia 2002).
total GDP (if the GDP of the whole Republic of Sakha is included). If
the GDP of just the Arctic uluses of the Republic of Sakha is used in
The current structure of the economy in the region is based on industry
the calculation, the GDP of the region totals to just 2.4% of the GDP of
(10-12% of the total number of enterprises), construction (11-13%, with
Russia. The region's share of industrial production is about 3.2% (2%),
27% for the Yamalo-Nenets AD), trade and food industry (12-15%, 24%
while its share of agricultural production is only 0.8%.
for the Yamalo-Nenets AD), transportation (3.5-6%), as well as other
sectors (Regions of Russia 2002). Table 9 shows the classifi cation of
Great diff erences in income are typical in the region. The income level is
enterprises and organisations by type. Private enterprises clearly
much lower than in countries with a more developed market economy.
dominate after the fi rst phase of privatisation.
This diff erence in incomes is higher between those who come to the
region to work and have a stable income and indigenous peoples
The share of unprofi table enterprises and organisations has decreased
who live in less developed areas. According to the Russian Ministry
from 68% to 52% on average in the Arctic regions of the Russian
of National Policy, the nominal incomes of northern indigenous
Federation (Regions of Russia 2002). Investments in fi xed capital have
peoples are two to three times lower than average for Russia. Because
increased by 6-fold on an absolute and by 9-fold on a per capita level.
many native peoples lack the means to make a living, these peoples
The unemployment level is lower than is average for Russia, and shows
(Chukchi, Nenets, Komi and Khanty) are close to extinction. As a result,
an increase in demand for workers.
the aboriginal populations perceive markets as a negative force; which
in turn results in a negative attitude towards newly arrived individuals,
Industry
in particular entrepreneurs (Barsegov et al. 2000).
The industrial production sector is relatively well-developed in the
Nenets and Yamalo-Nenets AD and falls mostly (95%) in the fuel
sector (hydrocarbons extraction). In other districts construction
Table 9
Number and form of property of enterprises and
organisations in the region.
materials production (Chukotski AD) and the food industry (Dolgano-
Number Form
(%)
Nenets AD) are dominant (Table 10). The highest level of oil extraction
Administrative unit
including condensate in the Timano-Pechorskaya oil and gas province
1996
2001
State
Municipal
Private
(19.2 million tonnes, Nenets AD included) was reached in 1997. Current
Nenets AD
461
703
17.9
11.5
46.7
extraction rates have dropped to 11 million tonnes, or by a factor of 1.7.
Yamalo-Nenets AD
9 086
9 694
5.5
10.0
72.8
At present the Norilsk industrial metallurgical complex located in the
Taimyr (Dolgano-Nenets) AD
515
688
23.1
15.7
38.3
territory of Taimyr (Dolgano-Nenets) AD provides up to 20% of nickel
Republic of Sakha (Yakutia)
17 455
20 260
20.1
0.1
64.6
and cobalt, 65-70% of copper and about 100% of platinum metals
Chukotski AD
1 216
1 607
18.8
20.1
47.2
extracted in the world (Anon. 1998).
Average for Russia
4.3
6.4
76.1
(Source: Regions of Russia 2002)
Table 10
Industrial production in 2001.
Industrial production (%)
Administrative unit
(Petro) chemical
Heavy machine construction,
Forestry, wood processing
Non-ferrous
Fuel
Construction material
Food industry
industry
metal-work
and pulp & paper
metallurgy
Nenets AD
95
0
0.1
0.4
0
2.4
0
Yamalo-Nenets AD
96.5
0
0.7
0.1
0.5
0.6
0
Taimyr (Dolgano-Nenets) AD
0.04
0
0
0
0
0
99.8
Republic of Sakha (Yakutia)
11.8
0.7
14.7
4.7
0.8
2
0
Chukotski AD
6.2
0
21.5
8.7
31.7
11.5
0
(Source: Regions of Russia 2002)
24
GIWA REGIONAL ASSESSMENT 1A RUSSIAN ARCTIC
Table 11
Navigation in the Russian Arctic 1985-2000.
1985
1987
1989
1991
1993
1995
1997
1999
2000
Transport in the region (tonnes/year)
Coastal transport
3 172 400
3302 400
2 953 300
2 431 600
1 519 300
839 600
739 300
706 700
780 000
Transit
38, 100
1 000
55 200
176 200
208 600
100 200
0
0
0
Export
2 569 300
2 765 600
2 800 400
2 194 300
1 284 800
1 372 000
1 180 400
860 500
804 600
Import
401 500
509 800
14 100
1 900
3 000
49 500
35 600
10 400
2 400
Total
6 181 300
6 578 800
5 823 000
4 804 000
3 015 700
2 361 300
1 945 300
1 580 200
1 587 000
Transport in the region (number/year)
Freight vessels (number/year)
296
331
273
243
177
134
70
49
52
Transport runs (number/year)
1 115
1 306
928
811
463
309
220
155
169
(Source: Regions of Russia 2002)
Agriculture
At the same time, the Siberian rivers (particularly those of the Kara
Agricultural production in the region is very weakly developed, which
Sea Basin) are of great historical importance in providing fi sh for the
is to be expected given the extreme climate conditions of the region.
population. The rivers of western Siberia supply valuable roundfi sh
About 60-70% of the meat, potatoes and vegetables are produced on
(whitefi shes, sturgeons and nelma), which amount to 40% of the total
personal plots. The region's food requirements are met mostly by the
catch. Data shows that catches decreased in the 1990s in western
costly "northern delivery" (the delivery of essential goods and fuel
Siberian rivers by more than three-fold as compared to the previous 40
to the regions of the northern Russia) of food from central regions
year period (Luzanskaya 1970, Anon. 2000).
of the country. After the transition to a market economy (after 1991),
the system for northern delivery that was supported by the planned
The western Siberian rivers that fl ow to the Arctic seas saw their annual
economy was destroyed. Commercial organisations that were attracted
average catch decrease from 10 000 tonnes in 1959-1966 (Luzanskaya
by local authorities always fell behind in deliveries and exceeded
1970) to 2 000 tonnes in the 1990s (Anon. 2000). Scientists do not
contract amounts. This led to some emergencies.
believe this decrease is due solely to the overexploitation of fi sh stocks.
Part of the decrease is due to a decrease in fi shing eff ort, mainly due to
In 1995 the Russian government issued a resolution concerning the
a declining regional economy. Fishing in rivers has never been highly
organisation of delivery and transportation of products to support
profi table and it was sometimes supported with subsidies; the market
the economies and populations of the northern regions (No 450
reforms associated with the dissolution of the Soviet Union caused
from May 1995). It defi ned the obligations of executive bodies and
many of these small fi sheries to go bankrupt.
organisations to deliver goods to sea and river ports on time, with
an acknowledgement of the time required to ship goods, and the
Transport
sometimes diffi
cult nature of navigating and transporting goods in
As much as 1.5 million tonnes of cargo was shipped in 2000 along the
northern conditions. Nonetheless, deliveries continued to fail in 2001;
Russia's Northern Sea Route (NSR). However this is four times less than
but by 2002, the diff erent companies providing river and sea transport
was shipped 15 years ago, and the trend seems to be for the shipping
had nearly met their goal. In 2003 deliveries to the Taimyr and Nenets
rates to continue to decline (Table 11). The eastern part of the region
AD was completed by the end of September.
is served by a smaller fl eet than the western part. During the years of
reforms, in the 1990s the number of vessels in the Arctic was reduced
Forestry, fi sheries, and aquaculture
by a factor of 6, while the number of transport runs decreased by 10.
Because most of the territory in the region is located to the north of
Recently there has been a notable constant increase in transportation
the Arctic Circle, there is no forestry. An industrial fi shery in the seas of
along the NSR, which refl ects improvements in the country's overall
the central and eastern Arctic is essentially nonexistent. The seas are
economy (Andreev 2001).
not suffi
ciently productive to support a commercial fi shery, with the
exception of the narrow coastal and embouchement areas. Nor has
The main supplier of cargo in the eastern part of the NSR is the Norilsk
aquaculture been developed.
metallurgical plant, which sends and receives 0.9-1.2 million tonnes of
REGIONAL DEFINITION
25
cargo by river and sea via the port of Dudinka. At the end of the 1980s
turnover of condensed gas at about 20.9 million tonnes per year. The
about 1.2 million tonnes of forestry-related cargo was transported along
river ports of the region, such as Labytnangi, Salekhard and others are
the NSR from Igarka, Lesosibirsk and Krasnoyarsk. But during the years
available to allow for the sea export of oil and gas. The development in
of reforms, this traffi
c sharply decreased.
the Yamal-Nenets AD of chromite ores, which are scarce in Russia, is also
promising, with the estimated resources at about 700 million tonnes.
Tourism
The same is true for titanium-magnetite ores (32.8 million tonnes), and
Due to the extreme conditions and the distance from populated areas,
precious and semi-precious stones.
tourism has not been developed in the region.
The outlook for economic development in Taimyr (the Dolgano-Nenets
Economic development outlook
AD) is related to the development of the Norilsk industrial complex,
The outlook for economic development in the region is determined by
which provides up to 20% of the world's nickel and cobalt, 65-70%
its natural resource potential and the growing demand for raw materials
of the world's copper and essentially 100% of the world's platinum
in both domestic and world markets. The depletion of mineral fi elds
metals. The northern Krasnoyarsk region, which includes Taimyr, in the
in the mid-latitudes of the country and the associated price increase
Dolgano-Nenets AD, contains oil and gas regions (Yenisei-Khatanga,
makes it more and more economic to exploit resources in polar lands
Anabaro-Khantanga and others) with estimated oil resources of about
and seas. This explains the growing interest on the part of Russian and
3.2 000 billion tonnes and about 14.6 billion km3 of gas and condensate.
foreign corporations in the fi elds found in the central and eastern
Gas extracted in this region now mainly supplies the Norilsk metallurgic
territories of the region.
plant (Gramberg et al. 2000).
Some estimates for the Nenets AD predict that economic growth
The oil and gas potential of the arctic regions of the Republic of Sakha
will mainly rely on the development of hydrocarbon stocks. Total
and Chukotka is not well known. The estimated supply in the Bering Sea
resources in 75 fi elds that have already been discovered fi elds about
basin (which adjoins Chukotka) is more than 16 000 billion tonnes of oil
2 400 billion tonnes of oil and 1.2 billion km3 of gas. Twenty-six fi elds
equivalent. Among the most promising issues for the development of
are ready for industrial extraction with their proven stocks totalling
the Chukotski AD is the extraction of non-ferrous metals: gold (up to
about 525 million tonnes of oil and 511 000 km3 of gas. The report
30 tonnes per year), silver, tin, tungsten, and coal (up to 800 000 tonnes
"Energy strategy for Russia until 2020" from the Russian Federal
per year). In the long-term, development of the oil and gas fi elds on the
Council (2002) assumes a growth in oil extraction in the Timano-
continental shelf will also be an option.
Pechorsk oil -and gas province (which includes the Nenets AD) from
a recent 11 million tonnes to 37 million tonnes by 2010. An estimated
With the development of extracting industry in nearly the entire
10 milion tonnes is planned for extraction from the continental shelf.
Russian Arctic region it is expected a growth of production volume
The Nenets AD contains 53.8% of the oil, 38.9% of the gas and 12.3% of
in transporting, services sectors in traditional spheres of living of
the condensate in the province.
aborigines.
The Yamalo-Nenets AD has the largest gas fi elds in the developing
A signifi cant growth in both sea and river navigation in this region is
world (every fourth cubic metre of all the world's gas is extracted from
expected, given the following factors:
this area). There are 205 hydrocarbon fi elds located in the autonomous
The coastal eastern arctic zone of Russia includes existing and
district, including world's largest, Urengoyskoye, Yamburgskoye, and
projected oil and gas, mining and metallurgic enterprises and
Zapoliarnoye. Pipeline transportation is well developed and is continuing
attracts cargo traffi
c from other export-oriented companies from
to be developed, with pipelines such as the "Northern Light" and the
the Krasnoyarsk region, Yakutia, the Novosibirsk region and other
"Urengoy-Pomary-Uzhgorod-Western Europe". With the completion of
regions in the Russian Federation that are located in the basins of
the "Yamal-Europe" pipeline in 2020, the estimated annual supply of
the main north-south rivers.
Yamal gas to Western Europe could reach 150x1012 m3.
More than 30% of Russian timber, carving wood, cellulose and
paper are made in the territories that can be served by the NSR.
Along the Yamal Peninsula seaside some off shore moorings for loading
Sea and river transportation of forest cargo from Igarka, Lesosibirsk
tankers have already been built. The main one is in Harasavey township.
and Krasnoyarsk are planned to be restored to former levels
This township is home to a tank port project, with the estimated
(1.2 million tonnes).
26
GIWA REGIONAL ASSESSMENT 1A RUSSIAN ARCTIC
The growth of traffi
c via the port of Dudinka is expected: magnesite
September 1998 defi ned the programme of sustainable development
(200 000-350 000 tonnes), aluminium (up to 900 000 tonnes) from
in terms of seven independent projects. Integration of these projects
Angaro-Yenisei region, and coal from Yakutia and Kemerovo areas
will be realised by the Arctic Council Board. A working group was
(up to 1 million tonnes).
organised for the implementation of the separate projects.
The NSR is in many ways a possible international sea route. It connects
The projects generally concern the control of various activities:
the centres of the world's economy (the USA, western European
A strategic approach to the control of sustainable development;
and Asian countries). If the problems of year-round and seasonal ice
The Arctic and the problems of sustainable development;
pilotage, rescue, navigation and other problems are solved, the NSR will
The control of Arctic resources.
be able to serve as an international transport corridor. This will, on the
other hand, increase the number of operating vessels that contribute to
The strategy of the board has been to take a gradual approach in
pollution. The potential transit through the NSR is estimated to be from
implementing this programme. An important role in this process will
12 million tonnes in 2010 up to 50 million tonnes in 2020.
belong to the Working Group of the Arctic Council Board, as well as
to regional scientifi c cooperators, non-governmental organisations of
However, the use of the NSR for international trade at a broad scale is
the Arctic indigenous population, and the international documents
linked not only to solutions for the region's technical and economic
and agreements concerning the protection of indigenous civil laws
problems but also with the solution of a complex of political, legal
and interests.
and environmental problems. A comprehensive international study
is currently being carried out by the Norwegian Fridtjof Nansen
Aside from the Arctic Council Board, there are other international
Institute, which off ers the hope that in the long run the NSR could
organisations, committees and programmes in the Arctic, such as
become the most important route for of oil and condensed gas
International Arctic Science Committee (IASC), Arctic Environmental
transportation from sea fi elds to markets in western Europe, North
Impact Assessment (ARIA), Arctic Monitoring and Assessment
America (particularly Alaska), and Asian and Pacifi c countries. This
Programme (AMAP), Conservation of Arctic Flora and Fauna (CAFF),
magnitude of development will require supertankers and ice-class gas
Protection of the Arctic Marine Environment (PAME) and others. Their
carriers. But the high costs of transportation along the NSR may also
tasks are described in Annex III.
be a deterrent in the development of navigation in the Arctic regions
of Russia (Andreev 2001).
The protection of the environment in the Arctic is also regulated
in association with many international agreements and laws (see
International cooperation
Annex IV).
In September 1996 eight Arctic countries signed the Ottawa declaration,
The main trends in international cooperation for the protection of
which created the Arctic Council Board, an international forum for Arctic
the Arctic environment are:
countries. This board is the most appropriate instrument for addressing
Fulfi lment of obligations connected with Russia's membership in
Arctic pollution problems, in particular, the problems of sustainable
diff erent international organisations and conventions concerning
development and Arctic environmental protection (Andreev 2001).
the protection of the Arctic environment;
The Arctic Council Board has been crafted to address the issue
Protecting the interests of the Russian Arctic region with respect to
of sustainable development in the Arctic. This concept includes
the activities of international organisations;
economic development, preservation and sustainable use of natural
Unifi
cation
of
eff orts to solve global and regional ecological
resources, social development and protection of Arctic ecosystems
problems;
and biodiversity in this region. The Arctic Council Board does not have
The application of international experience in solving regional
the status of an international organisation. The Arctic Board is a forum
ecological problems;
for Arctic countries. Joint activity is realised in accordance with the
The attraction of foreign and international investments for the
mandates of the eight countries.
implementation of ecological investment projects, as well as
projects that allow for the protection of nature (Andreev 2001).
The Arctic Council Board has tried to create a programme for sustainable
arctic development. However the Arctic countries did not agree on the
programme priorities. Subsequently, the Ikalyuitskaya declaration from
REGIONAL DEFINITION
27
Assessment
This section presents the results of the assessment of the impacts of each of the fi ve predefi ned GIWA concerns i.e. Freshwater shortage,
Pollution, Habitat and community modifi cation, Unsustainable exploitation of fi sh and other living resources, Global change, and
their constituent issues and the priorities identifi ed during this process. The evaluation of severity of each issue adheres to a set of
predefi ned criteria as provided in the chapter describing the GIWA methodology. In this section, the scoring of GIWA concerns and
issues is presented in Table 12.
Table 12
Scoring tables for the Russian Arctic region.
T
T
C
C
Increased impact
A 0 No
known
impact
A
2 Moderate
impact
Assessment of GIWA concerns and issues according
The arrow indicates the likely
IMP
IMP
T
T
No changes
C
C
to scoring criteria (see Methodology chapter).
direction of future changes.
A 1 Slight
impact
A
3 Severe
impact
IMP
IMP
Decreased impact
a
c
t
s
i
t
y
i
t
y
n
a
c
t
s
n
t
a
l
p
u
*
*
t
a
l
p
u
*
*
n
a
c
t
s
Laptev, East Siberian n
a
c
t
s
Kara Sea
p
m
p
m
i
c
i
m
m
i
c
i
m
m
nme
i
m
o
Score
nme
i
m
o
Score
c
t
s
m
m
o
c
t
s
r
i
t
y
***
and Chukchi seas
c
t
s
o
c
t
s
r
i
t
y
***
v
i
r
o
n
e
r c
n
e
r c
o
a
l
t
h
a
l
t
h
t
h
erall
r
i
o
v
i
r
o
o
t
h
erall
r
i
o
En
impa
Ec
He
O
impa
Ov
P
En
impa
Ec
He
O
impa
Ov
P
Freshwater shortage
0*
1
1
0
0.5
5
Freshwater shortage
0*
1
0
0
0.3
5
Modification of stream flow
0
Modification of stream flow
0
Pollution of existing supplies
1
Pollution of existing supplies
0
Changes in the water table
0
Changes in the water table
0
Pollution
2*
1
2
2
1.8
2
Pollution
1*
0
1
2
1.0
2
Microbiological pollution
0
Microbiological pollution
0
Eutrophication
0
Eutrophication
0
Chemical
2
Chemical
1
Suspended solids
0
Suspended solids
0
Solid waste
1
Solid waste
0
Thermal 0
Thermal 0
Radionuclides
1
Radionuclides
0
Spills
2
Spills
1
Habitat and community modification
1*
2
3
3
2.3
1
Habitat and community modification
1*
1
3
3
2.0
1
Loss of ecosystems
1
Loss of ecosystems
1
Modification of ecosystems
1
Modification of ecosystems
1
Unsustainable exploitation of fish
1*
2
1
1
1.3
3
Unsustainable exploitation of fish
0*
1
1
1
0.8
4
Overexploitation
2
Overexploitation
1
Excessive by-catch and discards
0
Excessive by-catch and discards
0
Destructive fishing practices
0
Destructive fishing practices
0
Decreased viability of stock
1
Decreased viability of stock
1
Impact on biological and genetic diversity
0
Impact on biological and genetic diversity
0
Global change
1*
1
0
1
0.8
5
Global change
1*
1
0
1
0.8
3
Changes in hydrological cycle
1
Changes in hydrological cycle
1
Sea level change
0
Sea level change
0
Increased UV-B radiation
1
Increased UV-B radiation
1
Changes in ocean CO source/sink function
1
Changes in ocean CO source/sink function
1
2
2
*
This value represents an average weighted score of the environmental issues associated to the concern.
** This value represents the overall score including environmental, socio-economic and likely future impacts.
*** Priority refers to the ranking of GIWA concerns.
28
GIWA REGIONAL ASSESSMENT 1A RUSSIAN ARCTIC
Freshwater shortage
Table 13
Water pollution in some of the rivers in the Russian
Arctic region.
T
T
Phenols
Petroleum
Iron
Copper
Zinc
Mercury
C
C
A
A
River
(mg/l)
(mg/l)
(mg/l)
(mg/l)
(mg/l)
(mg/l)
IMP
Kara Sea
IMP
Laptev, East Siberian and Chukchi seas
Ob
0.026
0.7
1.3
ND
ND
ND
The three largest river basins in the region are Yenisei, Ob and Lena,
Yenisei
ND
0.25-0.6
0.1-0.5
0.005-0.015
0.01-0.05
ND
the fi rst two draining into Kara Sea and the latter into Laptev Sea. Other
Lena
0.002-0.007
ND
ND
0.001-0.012
0.01-0.03
ND
large river basins in the Kara Sea drainage area are Taz and Pur rivers. The
Yana
0.001-0.005
ND
0.1-1.1
0.002-0.009
0.01-0.04
ND
main rivers of the East Siberian Sea Basin are the Indigirka and Kolyma
Kolyma
0.001-0.004
0.1-0.4
0.1-0.3
0.002-0.006
ND
ND
rivers. The quiality of these water bodies is aff ected by industrial and
Indigirka
0.006-0.008
ND
0.1-1.8
0.002-0.007
ND
0.015
domestic pollution such as wastewater and atmospheric emissions.
Note: ND = No Data.
(Source: Roshydromet 1996a,b, 1997, 1998, 1999, 2000, 2001, 2002)
The two issues modifi cation of stream fl ow and changes in water table
were both assessed as having no known impacts in the region and are
therefore not further discussed.
have a pronounced eff ect on water quality of the Lena River. The
downstream waters are polluted by phenols, copper compounds,
Environmental impacts
and zinc (Table 13) (Roshydromet 1996a, 1996b, 1997-2002). Waters in
Pollution of existing supplies
the Anabar River contain concentrations of copper compounds as high
Kara Sea
as 0.013 mg/l, as well as high concentrations of petroleum. The waters
Pollution of existing supplies was assessed to have a slight impact in
of the Yana are heavily polluted by phenols, and by copper, zinc, and
the Kara Sea sub-system. The main rivers of the Kara Sea Basin are the
iron (Table 13) (Roshydromet 1996a, 1996b, 1997-2002).
Ob, the Pur, the Taz and the Yenisei. The Ob and the Yenisei are among
the largest rivers in the Arctic. The quality of the water bodies in the Ob
The main rivers of the East Siberian Sea Basin are the Indigirka and
Basin is greatly aff ected by industrial atmospheric emissions, and the
the Kolyma. The water volume of the Kolyma is more than two times
eff ects of forest tracts (often swamped), which enrich the water with a
that of the Indigirka. The main pollution sources in the Kolyma River
great amount of organic substances that do not dissolve easily, including
Basin are the wastewater from the gold mining industry, housing and
phenols, and low- and high-molecular petroleum hydrocarbons. The
communal services. The water is polluted by petroleum, phenols,
downstream portion of the Ob is polluted by phenols, petroleum, and
copper compounds and iron (Table 13). Maximum concentrations of
iron compounds (Table 13). The maximum concentrations found were
petroleum, phenols, and copper compounds amounted to 0.45, 0.016
0.009 mg/l for copper, 0.15 mg/l for zinc, 1.75 mg/l for petroleum, and
and 0.011 mg/l, respectively (Roshydromet 1996a, 1996b, 1997-2002).
0.085 mg/l for phenols (Roshydromet 1997-2002). It should be noted
The Indigirka River is polluted by phenols, copper compounds and
that the petroleum pollution levels in the vicinity of large industrial
iron (Table 13). Mercury was also found in the water with concentraions
enterprises are lower than in the vicinity of intensive oil production.
up to 0.015 mg/l. The maximum phenol concentration was 0.037 mg/l
The main contributor to water pollution in the lower Yenisei River is the
(Roshydromet 1996a, 1996b, 1997-2002).
wastewater of the Podtesosk ship-repair yard, the Yenisei timber-rafting
agency, the Lesosibirsk and Novoyeniseisk sawmills and wood-working
Socio-economic impacts
integrated works, the Igarka timber transhipment integrated works, and
The socio-economic impacts of freshwater shortage are not signifi cant
the Igarka river port. The water is most polluted by petroleum, copper,
in the region. However, the GIWA Task team assessed economic and
zinc and iron (Table 13) (Roshydromet 1997-2002).
health impacts to be slight. There is no precise statistical evidence of
diseases caused by pollution of freshwaters, but there are single records
Laptev, East Siberian and Chukchi seas
of diseases resulting from poor water quality (dysentery, hepatitis) in
Generally, no known impact of pollution of existing supplies was
the Kara Sea sub-system There are no records of other social and
assigned to the Laptev, East Siberian and Chukchi seas sub-system.
community impacts in the region.
However, local impacts occur. The large rivers that empty into the
Laptev Sea are the Anabar, Olenek, Lena and the Yana. The Lena is
Conclusions and future outlook
the second largest river in the Arctic after the Yenisei River (Figure 8).
Freshwater shortage is not a problem for the region under present
Wastewater from the Lenarechenergo, Lenzoloto, and Siberian Gold
conditions, and it is unlikely that it will become a problem in the near
companies, and river crafts, ports, petroleum bases, and shipyards
future.
ASSESSMENT
29
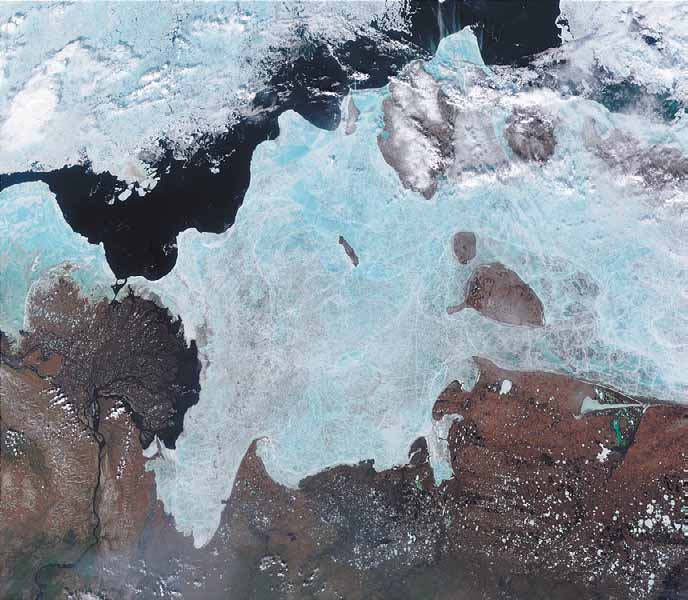
Figure 8
Lena River Delta and East Siberian Sea.
(Photo: NASA)
Pollution
Maritime
accidents;
Run-off via rivers from various land uses;
T
T
C
C
A
A
Operation of transport facilities such as marine and river craft,
IMP
Kara Sea
IMP
Laptev, East Siberian and Chukchi seas
aviation, timber rafting, road and pipeline transport;
The current anthropogenic impact on the Arctic marine environment
Mineral
extraction;
consists mainly of the increasing rate of pollutant transport from both
Atmospheric pollution from e.g. industries.
local and regional sources. Anthropogenic activities in the Russian
Arctic region causing pollution include:
The large river run-off has substantial eff ects on the Arctic seas.
Direct dumping of waste from industrial, municipal, and agricultural
This fl ow is the equivalent of about 10% of the total global run-off .
enterprises situated on the coast;
Signifi cant quantities of chemically reactive and biogenic material may
Burial of toxic material;
be transported by the rivers. Human activities have signifi cant direct
30
GIWA REGIONAL ASSESSMENT 1A RUSSIAN ARCTIC
and indirect consequences for the amount and timing of the run-off
hundreds of thousand tonnes of lead compounds, and tens of
into the Arctic Ocean.
thousand tonnes of chlorinated hydrocarbons, including PCBs, HCHs,
dibenzodioxines and other toxic compounds precipitate from the
At present, large mining and smelting integrated plants (Pechenga-
atmosphere onto the ocean surface every year (Izrael & Tsyban 1989).
Nickel, Monchegorsk, Norilsk), many open pits and polygons, and an
Essentially all known contaminants have been found in the atmosphere
extensive network of pipelines are operated in the Russian Arctic region.
above the Arctic. At the same time, there is relatively little specifi c data
In addition, 25 coal mines, fi ve strip mines, more than 20 large mines
about these contaminants and their concentrations in the Arctic.
and associated concentrating mills, 200 gold excavation and precious
Air samples have been collected by the Roshydromet background
metal mining and hundreds of oil and gas wells are operated in the
monitoring network (Rovinsky & Gromov 1996, Roshydromet 1997-2002)
region. Carbon dioxide emissions in the Russian Arctic account for
and in during diff erent expeditions (Izrael & Tsyban 1992, Izrael & Tsyban
33% of the total emissions from Russia's entire territory; emissions of
2000, Tsyban 1999, Bidleman et al. 1996, Chernyak et al. 1996).
copper, nickel, sulphuric acid, soot and chlorine account for 61, 88, 82,
23 and 40% of the country's total emissions, respectively. Oil pollution
The sources of air pollution above the Russian Arctic seas are primarily
is becoming highly problematic in some bays and off shore regions of
industrial centres, towns and settlements in the immediate vicinity of
the Arctic seas (SB RF 1995).
the seas. These sources, as a rule, are located in the western Arctic
(Table 14). For example, every year, the following substances are
Pollution sources
discharged to the air (SB RF 1995, Igamberdiev & Tereshnikov 1994,
Mining and process industries make a signifi cant contribution to
Roshydromet 1997-2002):
environmental pollution in the Russian Arctic. They are sources of
Murmansk region: 61 180 tonnes of solid substances, 12 070 tonnes
emissions containing sulphur dioxide, carbon and nitrogen oxides,
of hydrocarbons, 1 140 tonnes of hydrocarbons and 10 tonnes of
ammonia, hydrogen sulphide, formaldehyde, phenol, benzo(a)pyrene,
phenol.
trace metals, dioxins, and polychlorinated biphenyls. The coal mining
Arkhangelsk region: 55.3 tonnes of solid substances.
industry is a source of polycyclic aromatic hydrocarbons and a great
Komi Republic: 138 800 tonnes of solid substances and dust.
amount of sulphur, nitrogen and carbon oxides, and trace metals. Wood
Taimyr Autonomous Area 29 700 tonnes of solid substances, 1 300
processing industry complexes, especially integrated pulp-and-paper
tonnes of nickel, 3 000 tonnes of copper and 44 tonnes of lead.
mills, discharge phenols, benzo(a)pyrene and formaldehyde.
Chukot Autonomous Area 13 700 tonnes of lead.
Accidental oil spills associated with navigation, oil and gas production
Atmospheric transport of dust and solid substances results in the
and exploitation on both the land and the Arctic shelf are a major issue
deposition of materials of continental origin in the open areas of the
for Arctic seas. As a result, there are practically no rivers in western
Siberia that are free of oil pollution (MEPNR 1994, Roshydromet
Table 14
Pollution impact areas in the Russian Arctic region.
1996a, 1996b, 1997-2002). Discharges of raw or inadequately purifi ed
Area (Industrial centres)
Pollution sources
Polluting substances
wastewater also contaminate estuarine areas.
The Kola Peninsula
Metallurgy, mining industry,
Trace metals, petroleum, PAHs,
(Murmansk, Nickel, Zapolarny,
municipal sewage, nuclear power radionuclides, dust
Monchegorsk, Olenegorsk) *
plants, transport and other
Table 14 shows areas most impacted by pollution in the Russian Arctic
Pulp-and-paper industry,
Phenols, petroleum, PAHs,
Northern Dvina
region as well as the adjacent GIWA region Barents Sea. Industries in the
municipal sewage, thermal
chlorinated hydrocarbons, dust,
(Arkhangelsk, Novodvinsk) *
power plant and others
trace metals, radionuclides
Murmansk and Arkhangelsk oblasts are a source of atmospheric and
Oil and gas production, wood-
Petroleum, phenols, trace
Timano-Pechersk
water contamination that is subsequently transported to the central and
working industry and others
metals, chlorinated hydrocarbons
eastern Arctic regions. Due to the atmospheric and riverine transport
Petroleum, phenols, chlorinated
Ob
Oil and gas production and others hydrocarbons, trace metals
of pollutants, the infl uence of the industrial centres can be seen over a
Wood-working industry, river
Petroleum, phenols, chlorinated
Yenisei
substantial distance. This long-range transport has a pronounced eff ect
ports and others
hydrocarbons, trace metals
on the state of marine ecosystems.
Norilsk
Metallurgy, mining industry
Trace metals, PAHs, dust
Trace metals, radionuclides,
Yana-Indigirka
Mining industry
petroleum, dust
Atmospheric transport
Mining industry, thermal power
Trace metals, PAHs,
Valkumeisk
The importance of atmospheric transport in polluting the world's
plants
radionuclides, dust
Note: * Part of GIWA region 11 Barents Sea.
oceans has only been recognised in the last few decades. For example,
(Source: SB RF 1995, MEPNR 1994, Roshydromet 1996a,b, 1997, 1998, 1999, 2000, 2001, 2002)
ASSESSMENT
31
seas. They can also inhibit photosynthetic processes, resulting in the
River (Laptev Sea); Kolyma River (East Siberian Sea); and Indigirka River
decreased transparency of the ocean's surface layers.
(the East Siberian Sea).
It is noteworthy that rather high concentrations of some pollutants
They can also be arranged with respect to organochlorine hydrocarbon
have been found in the air above industrial centres in the Arctic. For
(HCH, DDT, DDE) transport (Roshydromet 1996-2002):
example, above the Murmansk region industrial centres in the GIWA
Yenisei River (the Kara Sea); Ob River (the Kara Sea); Taz River (the Kara
region Barents Sea, the benzo(a)pyrene (BP) concentration varied
Sea); Anabar River (the Laptev Sea); Olenek River (the Laptev Sea); Lena
between 1.1 and 9.5 g/m3 while the concentration ranged from 1.2-
River (the Laptev Sea); and Kolyma River (the East Siberian Sea).
2.0 g/m3 in the Chukchi Autonomous Area. It should be noted that
BP possesses toxic, mutagenic and carcinogenic properties. BP also
Environmental impacts
circulates actively in arctic ecosystems and accumulates in marine biota,
Generally, the environmental impacts of pollution was assessed to
including commercially valuable fi sh. Annually, about 1.4 tonnes of BP is
be moderate in the Kara Sea sub-system and slight in the Laptev Sea,
transported to the Russian Arctic region, which represents 0.9% of the
East Siberian Sea, Chukchi Sea sub-system. Specifi c impacts of the
total emissions from CIS and Baltic countries (Izrael et al. 1992).
diff erent pollution issues is discussed below. There are no records of
microbiological, eutrophication or thermal pollution in the Russian
As a result of the long-range atmospheric transport of pollutants from
Arctic region. There are either no obvious problems from water turbidity,
industrial regions, the Arctic seas are contaminated when aerosolised
suspended solids and associated limitation of water transparency. Solid
pollutants are washed out of the atmosphere (Burova 1992). This is
waste was considered to have no known impact in the Laptev, East
demonstrated in part by the contrast between HCH concentrations
Siberian and Chukchi sub-system. These issues are therefore not further
in the open regions of the Kara Sea, which were higher than those in
discussed. However, domestic solid waste and metal barrels pollute
off shore areas; a fi nding that can only be explained by atmospheric
the shores of the Kara Sea Basin and these wastes can harm biological
transport (GOIN 1996d).
processes and ecosystems (GESAMP 2001). The issue was therefore
considered to have slight impacts in this sub-system.
The transport of air masses to the Arctic is complicated and highly
variable. It is presumed that winter air masses come to the Arctic
Chemical pollution
mainly from Eurasia, while in summer this fl ux moves in the opposite
Water bodies in the region show minimal or insignifi cant chemical
direction. Air masses also typically come from the northern regions of
contamination. However, some chemical contaminants in the Kara Sea
the Pacifi c (above Alaska) and Atlantic (from Greenland) Oceans. Thus,
region are above Russian threshold limits. However, the existing level of
an important source of Arctic pollution is the long-range atmospheric
pollution in the Laptev Sea, East Siberian Sea, Chukchi Sea sub-system
transport of pollutants from the industrial zones of the northern
is lower than the Permitted Marginal Concentration (state standards).
hemisphere.
Contaminant concentrations are described below.
River run-off
Kara Sea
River run-off plays one of the leading roles in the pollution of the Arctic
The Kara and Laptev seas play the leading role in the transport of ice
seas. The huge catchment area and large water volume (70% of the
and water masses in the Arctic. The largest Asian rivers, with catchment
total river run-off in the Russian Federation) means that river run-off
areas equal to almost half of the Russian territory, fl ow into the Kara Sea.
transports a huge percentage of the Russian territory's total pollutant
The Ob and Yenisei river mouths create large estuaries where freshwaters
burden to the Arctic. This includes 65-75% of the organic matter,
mix with seawater. This freshwater infl uence can be traced hundreds of
nitrogen, phosphorus, iron, and silicon compounds, 91% of petroleum,
kilometres from the river mouths. The pollution sources for the Kara Shelf
95% of HCH isomers, 51% of DDT and 18% of DDE (Roshydromet
are the same as pollution sources for other Arctic seas. The largest Siberian
1996a).
rivers, the Ob and the Yenisei, carry a substantial amount of pollution
to the Kara Sea. Almost 40% of the sea area is aff ected by continental
The rivers of the region can be arranged in descending order based on
freshwaters. Chemical monitoring data from the Roshydromet network
their petroleum input to the Arctic seas (Roshydromet 1996-2002):
(GOIN 1996d, Roshydromet 1997-2002) and the Arctic Monitoring Centre,
Ob River (Kara Sea); Yenisei River (Kara Sea); Anabar River (Laptev Sea);
show that trace metals and petroleum hydrocarbons are the most
Lena River (Laptev Sea); Taz River (Kara Sea); Pur River (Kara Sea); Olenek
widespread pollutants in the Kara Sea.
32
GIWA REGIONAL ASSESSMENT 1A RUSSIAN ARCTIC
According to GOIN (1996d) and Roshydromet (1997-2002) the mean
DDT concentration was 0.27 ng/l in the range between 0.04 and
42
33
20
80
1.40 ng/l; the mean HCH was 0.16 ng/l, with a maximum concentration
70
y wt)
60
of 0.37 ng/l found in the Baidarats Bay; and the mean PCB content
50
(µg/g dr
n
40
amounted to 1.15 ng/l, with a maximum of 11 ng/l recorded in the Ob
i
o
30
t
r
at
Bay. In 1995 the DDT concentrations in Kara Sea surface water varied
15
cen
20
n
o
C
10
from 0.03 to 2.5 ng/l. The maximum DDT concentrations (up to 249
0
Pb
Cu
Zn
Cd
Ni
Co
ng/l) were found near Belyi Islands; maximum concentrations of HCHs
(µg/l)
n
Sediment
t
i
o
(up to 2.25 ng/l) and of PCBs (up to 8.3 ng/l) were observed near the
t
r
a
n 10
Min
Ob Bay and near Cape Kharasavei (the southwestern sea), respectively
c
e
Max
n
(GOIN 1996d).
Co
A one-time measurement of trace metal concentrations in Kara Sea
5
surface waters in 1991 found lead, cadmium, and tin, and copper
concentrations at tenths to hundredths of g/l. Mn, Ni and Zn
concentrations were found at several mg/l (GOIN 1992). Measurements
in the coastal zone during the summer of 1992 found the following high
0
Pb
Cu
Zn
Cd
Ni
Co
Mn
Fe
concentrations (which refl ect increased river discharges due to snowmelt
Figure 9
Metal concentrations in the Kara Sea waters and
and thawing ice): 58.8 g/l of iron, 15.3 g/l of zinc, 0.4 g/l of lead, and
bottom sediments.
0.15 g/l of cobalt (GOIN 1996a). In 1993 the highest concentrations were
(Source: GOIN 1996, Roshydromet 1997,1998, 1999, 2000, 2001, 2002)
observed to the east of Belyi Island in the zone infl uenced by the Ob and
Yenisei: 3.1 g/l of manganese, 96 g/l of iron, 0.5 g/l of nickel, 1.9 g/l
of copper, 10 g/l of zinc, and 0.07 g/l tin; the Pyasina Bay showed the
0.33-0.53 ng/l of -HCH; 0.25-0.26 ng/l of -HCH; 0.35-0.95 ng/l of DDE;
copper concentrations of 1.6 g/l (GOIN 1996b). In 1994 the picture did
0.07-0.33 ng/l of DDD; 0.10-0.44 ng/l of DDT; and 3.1-11.0 ng/l of PCBs
not change: in the open sea the concentrations varied in the hundredths
(GOIN 1996c). The data presented confi rm that pollution in the waters
of mg/l for lead, cadmium, tin, and cobalt, in the tenths of g/l for nickel,
of the Arctic basin has resulted from long-range atmospheric transport,
and in the tenths to whole units of g/l for iron, manganese, copper, and
particularly in view of the fact that DDT has not been used in the Kara
zinc. Higher levels of trace metals were found in summer months in the
Sea Basin since 1977 (Roshydromet 1996a).
areas of the Ob and Yenisei mouths (GOIN 1996c).
Table 15
Pollutants above maximum allowed concentrations in
The levels of trace metal content of the seawater and bottom sediments
the Kara Sea sub-system.
of the Kara Sea are shown in Figure 9. It is noteworthy that higher
Above maximum allowable concentration
Region
concentrations of the pollutants in the water and bottom sediments
DDT
HCH
PCBs
PHs
Cu
Zn
Mn
Fe
PAHs
were found in the estuaries of the Ob and Yenisei rivers as well as in the
Y
enisei Bay
off shore area exposed to the river and terrigenous run-off s (Table 15)
Ushakov Island region
(GOIN 1996, Roshydromet 1997-2002).
Ob Bay
Pyasina Bay
The state of chemical water pollution in the off shore region of the Kara
Sea has not changed appreciably in the last years. Toxic pollutants
Taz Bay
such as HCHs, DDTs and PCBs are found practically in all bays and
Baidarats Bay
estuarine zones. This fact causes serious concern in connection with
Yamal Coast
the negative consequences of chronic impacts of contaminants on
Belyi Island region
marine organisms.
Kharasavei Cape
Dikson
The following concentrations of pollutants have been measured
Amderma
in precipitation above the central Kara Sea (expedition KAREX-94):
(Source: GOIN 1996, Roshydromet 1997, 1998, 1999, 2000, 2001, 2002)
ASSESSMENT
33
In air samples above the Chukchi Sea in the area of Vrangel Island, the
12
-HCH and -HCH content amounted to 73 and 20 pg/m3, respectively
22
200
11.5
Min
(Jantunen & Bidleman 1995, Bidleman et al. 1995). In the western Arctic
11
Max
10.5
the PCB concentration reached 904 pg/m3 in 1988 and 382 pg/m3
10
9.5
in 1993; the DDT content was 38.00 and 34.82 ng/m3, respectively
9
8.5
(Hinckley et al. 1992, Izrael & Tsyban 2000). It should be noted that
8
g/l)
according to data from Bidleman et al. (1995), in the period from 1988 to
7.5
(©
7
n
1993 the HCH content of the atmosphere above the Bering and Chukchi
6.5
t
i
o
6
t
r
a
seas declined considerably while the HCH concentration in these seas
n
5.5
c
e
n
5
has remained relatively unchanged since the early 1980s. The Arctic seas
Co
4.5
are currently losing their function as an HCH sink and are becoming a
4
3.5
new HCH source for the Arctic (Bidleman et al. 1995).
3
2.5
2
Discharges of trace metals from the non-ferrous metallurgy industry
1.5
1
make a substantial contribution to both air and ocean pollution in the
0.5
0
region. In Norilsk (see Figure 13), for example, respectively 2 800, 1 250
Pb
Cu
Zn
Cd
Ni
Co
Mn
Fe
and 68 tonnes per year of copper, nickel and cobalt have been emitted
Figure 10 Metal concentrations in Laptev Sea waters.
(Rovinskiy & Gromov 1996).
(Source: GOIN 1996, Roshydromet 1997,1998, 1999, 2000, 2001, 2002)
Laptev, East Siberian and Chukchi seas
Because of its geographical position and hydrologic conditions, the
highest pollution levels were found in the estuarine areas, in the Zarya
Laptev Sea qualifi es as a continental margin sea. Most of the sea is
Strait and near the Novosibirsk Islands (GOIN 1996, Roshydromet 1997-
shallow; half its total area is no deeper than 50 m. The shelf regions of
2002). The water concentrations of trace metals in the Laptev Sea are
the sea are polluted by a number of inland activities, including oil and
presented in Figure 10.
gas exploration and production, inland water and sea transport, ore
mining and processing enterprises, accidental oil spills, fl oating and
The East Siberian Sea is a marginal sea fully situated on the continental
sunken wood, and discharges and effl
uent from towns and settlements
shelf. Water depths of 20 to 25 m predominate. The sources of water
situated on the coast and along rivers. River run-off and atmospheric
pollution in the East Siberian Sea, as in other Arctic seas, are marine and
transport play an important role in marine pollution.
inland water transport, depots of combustible materials and lubricants,
refuelling points, mining enterprises, towns and settlements situated on
Phenol concentrations in the Laptev Sea are the highest of all Arctic
the sea coast and along rivers, transport of contaminants by air fl uxes
seas (GOIN 1996d, Roshydromet 1997-2002). The highest phenol
and Arctic ice, accidental spills, sunken wood, etc. According to routine
concentrations (up to 65 mg/l) are typical for coastal areas, that
statistical data collected over the last decade (GOIN 1996, Roshydromet
are under the infl uence of fl oating and sunken wood. In 1991 the
1997-2002), about 300 kg of oil, about 18 000 tonnes of particulate
concentrations of HCH amounted to 17 ng/l (GOIN 1992). In 1992
matter, 215 tonnes of sulphates, 83 tonnes of chlorides, about 980 kg of
the highest concentrations of DDT (up to 0.9 ng/l) were found in
nitrates, and 167 kg of fats were discharged in the Chaun region of the
the region of the northern lands, while the highest concentrations of
East Siberian Sea. A broad spectrum of trace metals was discovered in
HCH and PCB were observed near the Novosibirsk Islands and in the
the water and bottom sediments of the East Siberian Sea, with iron and
Vilkitsky Strait, respectively (GOIN 1996a). In 1993 the DDT content was
zink being the main pollutants (Figure 11).
2.7 ng/l in Khatanga Bay and 1.3 ng/l near the Novosibirsk Islands; the
HCH concentration amounted to 1.2 ng/l near Little Taimyr Island and
The Chukchi Sea is also a marginal sea, where depths of 40 to 60 m
2.9 ng/l in the Shokalsky Strait; and the PCB content was 5.5 ng/l near
predominantly. The maximum depth is 1 256 m. The Chukchi Sea, with
Stolbovoi Island, 4.5 ng/l in Anabar Bay and 4.5 ng/l in Olenek Bay (GOIN
a high biological productivity and high species diversity, is one of the
1996b). The average content of the DDT group amounted to 0.2 ng/l
unique regions of the world's oceans. Additionally, because the area
(varying from 0.01 to 1.20 ng/l), and the HCH and PCB concentrations
receives a substantial fl ux of carbon dioxide from the atmosphere, the
varied from 0.3 to 1.0 ng/l and from 2.4 to 7.0 ng/l, respectively. The
Chukchi Sea plays an important role in shaping the Earth's climate. The
34
GIWA REGIONAL ASSESSMENT 1A RUSSIAN ARCTIC
200
190
150
15
10
150
14
350
Min
Min
9
13
300
Max
Max
12
250
8
g/g dry wt)
11
(© 200
g/l)
7
10
150
(©
( g/l)
9
100
n
6
tion
i
o
a
8
50
Concentration
5
7
0
t
r
at
entr
Pb
Cu
Zn
Cd
Ni
nc
6
cen
4
o
n
C
o
5
C
3
4
3
2
2
1
1
0
0
Pb
Cu
Zn
Cd
Ni
Co
Mn
Fe
Pb
Cu
Zn
Cd
Ni
Co
Mn
Fe
Figure 11 Metal concentrations in East Siberian Sea waters and
Figure 12 Metal concentrations in Chukchi Sea waters.
bottom sedimets.
(Source: GOIN 1996, Roshydromet 1997,1998, 1999, 2000, 2001, 2002)
(Source: GOIN 1996, Roshydromet 1997,1998, 1999, 2000, 2001, 2002)
coastal waters of the Chukchi Sea are polluted by local sources, such
last 5 years and that of -HCH has decreased 4- fold. Table 16 shows
as sewage from settlements, ships, accidental spills of combustible
that the -HCH accumulation in the bottom sediments is growing
materials and lubricants, and decaying sunken and fl oating wood.
while that of -HCH has decreased pronouncedly, probably owing to
According to routine statistical data collected over the last decade
biodegradation (Hinckley et al. 1992, Izrael & Tsyban 2000).
(GOIN 1996, Roshydromet 1997-2002), 200 kg of oil, 105 tonnes of
particulate matter, 48.5 tonnes of sulphates, 65 tonnes of chlorides and
Data from a long-term investigation of the HCH distribution in the waters
2 462 kg of nitrates have been discharged from the Russian territory
of the Chukchi Sea and Bering Sea show that the HCH concentration
(from the Schmidt Region alone) into the coastal zone of the Chukchi
in Arctic seas has remained relatively constant since the early 1980s,
Sea. The open sea is mainly polluted by the transport of contaminants
while its atmospheric concentration has decreased considerably
in the air and Arctic ice.
(Jantunen et al. 1995, Bidleman et al. 1995). These authors indicate that
the Chukchi and Bering seas are losing their function as a HCH sink and
In spite of the considerable remoteness of the Chukchi Sea, heavy
are becoming a new HCH source to the Arctic atmosphere.
metals, aromatic and chlorinated hydrocarbons, and new contaminants
(endosulfan, bromoform, dibromomethane, etc.) have been discovered
Table 16
Chlorinated hydrocarbons in the Chukchi Sea.
over the last few years in all the main components of its ecosystems.
Water (ng/l)
Air (pg/m3)
Se
diments (ng/g)
Region
Figure 12 shows a broad spectrum of trace metals in the surface waters
1988
1993
1988
1993
1988
1993
of the Chukchi Sea.
Western part
2.33
2.22
212
70
0.92
ND
-HCH
Eastern part
2.41
2.43
214
74
0.27
0.43
A study of the chemical regime in the Chukchi Sea over the past decade
Vrangel Island
ND
2.07
ND
73
ND
ND
(Izrael & Tsyban 1992, Tsyban 1999, Izrael & Tsyban 2000, Roshydromet
Western part
0.59
0.16
57
20
0.21
ND
2001) has shown that the distribution of organic pollutants is becoming
-HCH
Eastern part
0.61
0.15
57
19
0.11
0.02
more and more pronounced from year to year. At the present time,
Vrangel Island
ND
0.14
ND
20
ND
ND
it is believed that hexachlorocyclo-hexanes (HCHs) rank among the
Western part
0.003
0.08
38.0
34.8
3.49
ND
most widespread chlorinated pesticides in the Arctic seas (Bidleman
DDT
Eastern part
0.004
0.095
ND
32.4
0.14
0.60
et al. 1995). For example, the HCH content of water samples in Chukchi
Vrangel Island
ND
0.17
38.0
46.9
ND
ND
Sea waters exceeds that of other chlorinated hydrocarbons, such
Western part
0.43
0.63
904
382
13
ND
as polychlorinated biphenyls (PCBs) and DDTs (Table 16). While the
PCB
Eastern part
0.55
0.56
904
550
8.7
16.3
atmospheric concentration of HCH isomers has decreased considerably,
Vrangel Island
ND
0.50
ND
ND
ND
ND
Note: ND = No Data.
the -HCH content of the sea water has remained unchanged for the
(Source: Hinckley et al. 1992, Izrael and Tsyban 2000)
ASSESSMENT
35
Pollution of the Chukchi Shelf by polychlorinated biphenyls (PCBs) is
Radionuclides
of major concern. Although their atmospheric content decreased in
Radioactive contamination has resulted from three primary sources:
1993 as compared to that of 1988, the water concentrations of these
atmospheric nuclear weapons testing during 1950-1980; releases from
toxics remained unchanged. The PCB content of the bottom sediments
European nuclear reprocessing plants e.g. Sellafi eld, which peaked in
has increased two-fold from 1988 to 1993, from 8.7 to 16.3 ng/g
the mid-1970s; and fallout from the Chernobyl accident in 1986 (AMAP
(Hinckley et al. 1992, Izrael & Tysban 2000). This fact demonstrates the
1997). There are no evident data on high concentration of radionuclides
accumulation of organochlorines in Chukchi Sea ecosystems. It is
in the region (AMAP 1997, 2002). From 1992 to 1994, a joint Norwegian-
noteworthy that the long residence time of these compounds (several
Russian expert group sampled water, sediments and biota in the Barents
decades) in the marine environment determines their active circulation
and Kara seas (including the region of Novaya Zemlya). The results show
along food webs and accumulation in marine organisms, including
that there is no signifi cant contamination of the Kara Sea. In fact, the
commercial species. For example, the coeffi
cients of PCB accumulation
levels of radionuclides in the water are lower than in many other marine
in particulate matter, plankton and neuston samples amounted from 100
areas, such as the Irish, Baltic and North seas (AMAP 1997).
to 10 000. Substantial accumulation of all chlordane components (50-
100 ng/g of fat) has been found in the zooplankton samples (Hinckley
Spills
et al. 1992, Izrael & Tysban 2000).The following chlorinated hydrocarbons
It is mainly the coastal areas of western Siberia that are exposed to
have been found in Chukchi Sea ice: 34 ng/l of HCHs, 0.016 ng/l of DDTs,
oil spills. One of the main reasons for these spills is that about half
and 0.9 ng/l of PCBs (Hinckley et al. 1992, Chernyak et al. 1996).
of the petroleum pipelines in the region have not been maintained
properly. Pipelines in western Siberia burst as often as 35 000 times per
New non-natural contaminants like endosulfan, bromoform,
year. Only about 300 of these pipeline bursts are offi
cially registered.
dibromomethane, and chloroiodomethane; as well as the pesticides
Each burst pipeline discharges about 10 000 tonnes of oil. Diff erent
chloropyriphos, chlorothalonil, phenvalerate, trifl uarin have been
estimates put the total volume of the oil lost to the water at about
found in the near-to-surface air layer, in fog and in Chukchi Sea waters
3-10 million tonnes from the time when oil was fi rst exploited in the
(Chernyak et al. 1996). Their arrival is associated with long-range
region. For example, 100 000 tonnes of oil was lost as a result of the
atmospheric transport.
Usinsk oil disaster, polluting about 60 km2 (Barsegov et al. 2000). The
planned growth of mining on the continental shelf of the Arctic seas
In spite of the fact that many countries have limited or banned DDTs
will aggravate pollution problems situation in the western parts of the
since the 1970s, these compounds are widespread and are found in many
Kara and Chukchi seas.
marine ecosystems owing to the combination of their long-term use
and the long-range atmospheric transport of pollutants. For example,
Kara Sea
in 1988-1993 the pp'-DDT content of the Chukchi water ranged from
Navigation, oil and gas production and exploitation frequently result in
0.003 to 0.095 ng/l (Table 16). However, in 1993 concentrations were
oil spills in the sub-system. As a result, there are practically no rivers in
20 times higher than in 1988 (Hinckley et al. 1992, Izrael & Tysban
western Siberia that are free of oil pollution (MEPNR 1994, Roshydromet
2000). The maximum concentrations of DDT (like those of - and -
1996a, 1996b, 1997-2002). The Kara Sea Basin is a region that is constantly
HCH) in the Chukchi Sea were found in the coastal waters of Alaska. Of
subjected to oil pollution, from both ongoing oil spills and oil that
special concern is the fact that DDT continues to accumulate in the sea
washes from the shores. Equipment is aging, obsolete technologies are
bottom sediments. The coeffi
cients of DDT accumulation in particulate
in use and safety requirements for oil production are not abided by.
matter and in zooplankton amount to 100-1 000 and 10 000-100 000,
respectively. It should be noted that such hydrophobic substances as
Trace metals and petroleum hydrocarbons are the most widespread
DDTs and highly chlorinated PCBs are absorbed by particulate matter and
pollutants in the Kara Sea, according to the chemical monitoring data
are easily transferred from the surface layers of the ocean to the depths.
of the Roshydromet network (GOIN 1996, Roshydromet 1997-2002) and
the Arctic Monitoring centre. In 1991-1992 in the open Kara Sea, the
A study of Chukchi Sea chemical pollution conducted by Institute of
content of petroleum hydrocarbons (PHs) ranged from 0 to 20 g/l,
Global Climate and Ecology (IGCE) specialists used indicator organisms
while in the Baidarats, Ob and Taz bays, it did not exceed 50-70 g/l.
to evaluate the ecosystem. In the Chukchi Sea, the presence of these
The Maximum Allowable Concentration (MAC) was exceeded at Cape
organisms remains low, but their distribution has expanded every year,
Kharasavei (up to 92 g/l) and near the Arctic settlements of Amderma
and currently they can be found nearly everywhere (IGCE 1996).
and Dickson (above 200 g/l) (GOIN 1996a). A lower concentration of
36
GIWA REGIONAL ASSESSMENT 1A RUSSIAN ARCTIC

Figure 13 Nickel foundry at Norilsk, Russia.
(Photo: Arcticphoto)
petroleum hydrocarbons (PHs) was observed in 1993-1994, but in the
The average concentration of petroleum hydrocarbons in the East
Ob Bay in 1994 a concentration of 100 mg/l was observed (GOIN 1996c).
Siberian Sea in 1991 amounted to 16 g/l (a maximum of up to
Currently, the mean concentration of PHs amounts to 24 g/l, with a
50 g/l was found in Chaun Bay) (GOIN 1992). In 1992 the PHs content
maximum concentration found in Yenisei Bay (105 mg/l) (GOIN 1996,
somewhat increased (up to 27 g/l), with maximum concentrations
Roshydromet 1997-2002).
(up to 80 g/l) observed near the Novosibirsk Islands and Wrangel
Island (GOIN 1996b). Currently, oil pollution in the East Siberian Sea has
Laptev, East Siberian and Chukchi seas
stayed at approximately at the same level (GOIN 1996, Roshydromet
In 1991 in the Laptev Sea, oil pollution was estimated to be at about
1997-2002).
15-20 g/l; the concentrations of petroleum hydrocarbons exceeded
the MACs in Tiksi Bay (70 g/l), Bugor-Khaya fi rth (a lane route) (130 g/l),
In all the components of the Chukchi Sea ecosystems, benzo(a)pyrene
and in Olenek Bay (80 g/l) (GOIN 1992). In 1992 the concentrations of
(BP) - an indicator of carcinogenic polycyclic aromatic hydrocarbons
petroleum hydrocarbons varied within narrow limits (12-39 g/l) and
(PAHs) - has been found. Some PAHs, for example BP, easily convert to
only in Bugor-Khaya fi rth the maximum level (up to 200 g/l) (GOIN
mutagenic and carcinogenic epoxydiols, which interact with DNA. In the
1996a). In 1993 the level of petroleum hydrocarbons in the Laptev Sea
last few years the BP concentrations in Chukchi seawater have been 0.01-
did not exceed the MACs (GOIN 1996b). The measurements carried
0.5 ng/l and 0.01-0.6 ng/l in the surface and bottom layers respectively.
out in recent years have found an average concentration of petroleum
The average BP content of the bottom sediments has reached
hydrocarbons of 17.1 g/l in the open waters and up to 114 g/l in
2.28 mg/kg. However, the coeffi
cients of BP accumulation in particulate
Bugor-Khaya fi rth (GOIN 1996, Roshydromet 1997-2002).
matter and in biota have proved to be rather high (Izrael & Tsyban 1992,
Tsyban 1999, Izrael & Tsyban 2000, Roshydromet 1997-2002).
ASSESSMENT
37
The lowest mean oil pollution level for the Arctic seas, 7.2 g/l, was
Siberia to Scandinavian countries have been rejected as unacceptable
observed in 1991, according to the data of the Roshydromet chemical
because of higher-than-acceptable levels of heavy metals (Vilchek
monitoring network. In 1992 it amounted to 10.5 g/l, the maximum of
1996).
20 mg/l was observed in the southern sea near the Chukchi Peninsula
coast (GOIN 1996a). In 1993 near the settlement of Vankarem, the
The pollution problem is most acute in the region's large industrial cities
concentration of petroleum hydrocarbons amounted to 40 g/l,
such as Norilsk and Vorkuta. Residents of these cities, mostly children,
although the general oil pollution level in the sea was low (GOIN
are subject to chronic diseases such as bronchitis, pneumonia, lung
1996b). At the present time, the oil pollution in the diff erent areas of
cancer, bronchial asthma, and allergies. Women have had pregnancy
the Chukchi Sea has remained at approximately the same level (GOIN
complications. Heavy metals and PAHs are strongly mutagenic. In
1996, Roshydromet 1997-2002).
Norilsk the frequency of congenital defects in infants is 11.2 per 1 000
(the Russian average is 6 to 8). In addition to the unstable ecological
A serious concern is also raised by the existing projects that involve
situation, a decrease in living standards, a change for the worse in
the prospecting for and production of oil and gas on the Chukchi
medical care, changes in the traditional way of life and nutrition
continental shelf. Exploration and industrial drilling for oil and gas
patterns, all result in a growth in morbidity and mortality, including
production on the shelf result in a number of anthropogenic factors
in children (Revich 1994). The mortality rate from diff erent diseases in
that aff ect the state of pelagic and bottom ecosystems, beginning with
the region is 2.5 times higher than the Russian average. More detailed
the hazardous consequences of seismic prospecting and the pollution
information is available in Annex V.
of water and bottom sediments by drilling fl uids and slurries, and
ending with oil, copper and other metal pollution.
Other social and community impacts were assessed to be moderate
in both sub-systems. Massive changes in the distribution of traditional
Socio-economic impacts
indigenous populations are connected with the widening scope of oil,
Economic impacts were considered slight in the Kara Sea sub-system.
gas, and other resource production, transport routes and construction.
Economic impacts relate to the lack of funding needed to reconstruct
Because lands are expropriated for industry and are tainted by industrial
and modernise water treatment plants to decrease the pollution
pollution, the rural population loses not only its pastures but hunting
of rivers of western and eastern Siberia. These problems are mainly
lands and fi shing sites, as well as territories to collect wild berries and
linked to the general economic conditions in Russia, which are more
mushrooms. The indigenous population must therefore abandon
problematic in the northern parts. After 1990, an abrupt decrease in
historical residences and life styles.
production, reduction of investments, and an increase in consumer
costs occured. A score of no known economic impact was assigned to
It is important to note that most of the region's indigenous population
the Laptev , East Siberian and Chukchi seas sub-system.
(75%) is rural. Residence in multinational settlements and cities entirely
changes indigenous peoples' lifestyles, resulting in many negative
Health impacts were moderate and slight in the Kara and Laptev,
consequences. For example the death rate for the indigenous
East Siberian and Chukchi seas sub-systems respectively. The human
population is higher than for the immigrants. Additionally, traditional
health situation in the Arctic region in general is poor. Morbidity
trades are largely unprofi table, which causes a serious unemployment
directly connected with chemical pollution of the catchments that
problem. About 25-35% of the indigenous people in the region have no
drain to the Arctic seas (especially in the Kara Sea sub-system) is
permanent job and survive only on the income from gathering berries
particularly troubling. Nowadays some Arctic regions (Pechenga-Nickel,
and mushrooms. The unemployment level is especially high for women
Monchegorsk, Norilsk etc.) are referred to as ecologically unstable.
and young people. More detailed information is provided in Annex V.
Agricultural products and wild berries that come from these regions
may contain higher-than-acceptable concentrations of heavy metals
Conclusions and future outlook
and other pollutants. Petroleum contamination and heavy metals spoil
The open waters of the Arctic seas are clean, with the concentration of
the quality of river and lake fi sh (Yevseev 1996).
pollutants low or absent, and the state of the pelagic ecosystems as a
whole is good. However, some of the shelf regions and essentially most
The migration of pollutants in food chains (both terrestrial and aquatic)
of the coastal zones are considerably polluted and the state of a number
often results in the accumulation of these pollutants at a higher trophic
of bays, gulfs and estuarine areas is as critical or even catastrophic. The
level. For example, large numbers of deer meat deliveries from western
ecological situation in these regions is aggravated by the presence in the
38
GIWA REGIONAL ASSESSMENT 1A RUSSIAN ARCTIC
bottom sediments of high concentrations of numerous contaminants of
Habitat and community
anthropogenic origin, which has accumulated for many years.
modification
The character of marine pollution is specifi c to each of the regions of
T
T
C
C
A
A
IMP
Kara Sea
IMP
Laptev, East Siberian and Chukchi seas
the Arctic seas and depends on the degree of anthropogenic loading
and the specifi c features of pollution sources. The main contribution
This concern encompasses two environmental issues: losses of
to pollution in the Russian Arctic region results from diff use, non-point
ecosystems or ecotones, and modifi cation of ecosystems or ecotones.
sources such as river run-off and long-range atmospheric transport as
Because of the diffi
culties in the individual assessment of the two issues,
well as localised sources in the high latitudes or directly on the Arctic
and because the expertise did not fully cover all habitats, the decision
coast. Given their large catchment areas and run-off volumes, northern
was made in favour of a clumped assessment. The scores for each of the
rivers exert a powerful infl uence on the character and level of pollution
selected habitats were derived from educated guesses and estimations.
in the Arctic seas, particularly in the estuarine and shelf regions. More
Assessments were conducted only for habitats related to the Russian
than half of the organic toxics (including phenols and chlorinated
Arctic region.
hydrocarbons), as well as nitrogen and phosphorus compounds, and
the bulk of oil pollution that are exported from the Russian territory
Ecological indicators
are carried by river fl ow to the Arctic Ocean. Practically all petroleum
Estimates of the state and the level of degradation in marine ecosystems
hydrocarbons and chlorinated hydrocarbons are transported to the
are based on the results of the study and joint analysis of the following
Arctic seas by the run-off from the Ob and Yenisei rivers.
inter-connected problems (Tsyban 1999, Izrael et al. 2002). Box 1 shows
the main functions of ecological indicators.
Air transport also contributes to the broad-scale pollution of the Arctic,
1. Study of chemical pollution in the marine environment.
especially in winter. As a result of long-range atmospheric transport,
2. Investigation of the rate of contaminant production-destruction
a substantial amount of contaminants from the industrial regions of
processes, defi ning a balanced state for the formation and
Eurasia reaches the high latitudes and precipitates directly onto the
destruction of organic matter in the ecosystem, and with defi nition
surface of the Arctic seas.
of the meaning of biomass of separate groups of organisms as
well.
Local coastal sources determine the specifi c distribution of pollution
3. Study of the ecological consequences of anthropogenic impacts
and its severity. Local fl uxes of anthropogenic pollutants are mainly
on the marine environment and determination of the extent of
formed from the atmospheric emissions and wastewater produced
ecosystem degradation.
by large cities, public services, industrial zones and transportation.
4. Study of natural processes, including those that result in the
The greatest number of point sources of contaminants is centred
modifi
cation or elimination of polluting substances, and
in the western Russian Arctic in the territories of the Murmansk and
determining the stability of the marine ecosystem in view of
Arkhangelsk regions.
anthropogenic impacts.
The major hazard for the Arctic seas results from oil and its components
Environmental impacts
that enter marine ecosystems from sewage discharges, accidental
Loss and modifi cation of ecosystems or ecotones
spills, navigation, and gas and oil production, especially directly on
There are no records of serious habitat loss in the region. However,
the shelf. Trace metals and chlorinated hydrocarbons in combination
evidence of degradation of some habitats have been documented
with other contaminants undoubtedly constitute a threat to life in the
in the region. There is evidence of changes in species composition
Arctic seas. Pollution is one of the main problems in the Russian Arctic
due to species extinctions or introductions. The changes are local in
region. Chemical pollution and spills are the most alarming issues.
character. Changes in the region's marine and freshwater ecosystems
Eutrophication, microbiological pollution, suspended solids, solid
and their degradation as a result of anthropogenic impacts can be
waste, thermal pollution and radionuclide have an unknown or slight
manifested by: (i) decreased species diversity, changes in species and
eff ect in the region. Over the next 20 years, environmental impacts from
the dimensional structure of communities; (ii) decreases in the total
oil pollution are expected to remain signifi cant. Chemical pollutants
number and biomass of organisms, especially of benthofauna; (iii) a
such as chlorinated hydrocarbons, heavy metals are considered to pose
pronounced predominance of species most resistant to pollution; and
a moderate threat.
(iv) a decreased intensity and seasonal instability in biological processes,
ASSESSMENT
39
Box 1
Main functions of ecological indicators.
Harmful changes in the natural
help but infer that the most important
radioactive pollution, eutrophication,
An ecosystem's ability to provide
environment are to some extent
advantage in the use of indicators
removal of renewable biological
protection against alien intervention
compensated for by the assimilative
consists of the possibility of facilitating
resources);
with the use of a spectrum of biological,
capacity of ecosystems, a capacity that
and expediting the taking of decisions
- The rate of changes in production
physical and chemical processes is its
in part determines ecosystem stability.
at the national or regional level.
/destruction processes;
natural immunity, which is measured
The determination of standards for
The main functions of ecological
by assimilative capacity. In this case
assimilative capacity is one of the
- Changes in biodiversity;
indicators are as follows (Gallopin 1997):
any important perturbations of the
most important problems posed by
- The rate of microbial degradation of
structural and functional characteristics
sustainable development. Included
- To assess environmental conditions
organic contaminants;
of marine biocenoses are accompanied
in this determination are economic,
and process trends;
by changes in their biogeochemical
- The rate of the flux of contaminants
social, and ecological issues, as well
- To compare different natural
functions and reflect a change in the
in the process of biogenic
as the demands of nature protection
situations;
circulation of matter and energy in the
sedimentation;
and other characteristics of the natural
marine ecosystem as a whole.
- To assess environmental conditions
environment and society, all of which
- Adaptation at the organism level;
with respect to a particular target;
According to this approach, the GIWA
can be represented by indicators.
- Intensity of natural processes
Task team used the rating scale to
- To provide an early warning system;
Indicators should be comprehensible
determining the stability of marine
reflect the extent of anthropogenic
and sufficient for the assessment of
- To provide a system that can
ecosystems that include deposition
degradation of the marine ecosystem, as
critical situations in natural ecosystems
forecast the environmental state and
(biosedimentation) and destruction
presented earlier. The main ecological
as well as economics, and should also be
variability of processes.
(microbial transformation) of organic
indicators were taken into account in
able to determine responses to negative
Taking into consideration modern
matter (including toxics).
characterising the state of the marine
impacts (Moldan & Billharz 1997). There
approaches in the selection of stable
The activity of microorganisms is
environment. The scale includes the
are several definitions of indicators. All
development indicators and also
determined by environmental conditions
following stages:
definitions agree that an indicator is a
considering the results of long-term
(temperature, availability of easily
- Stable
ecosystem;
measure that sums up the information
interdisciplinary investigations and
assimilated organic compounds, oxygen
related to some phenomenon, parameter
- Transient
ecosystem;
monitoring in the Russian seas and other
regime, biotic factors, and particulate
or a derivative of closely related
region (e.g. Izrael, Tsyban, 1989, 1990,
matter distribution). The functioning of
- Crisis
ecosystem;
parameters that describe the state of the
1992, Gidrometeoizdat 1990, Izrael et al.
the microbial population in the surface
- Disaster
ecosystem.
phenomenon/process (Gallopin 1997).
2000, Tsyban 1997, 1999), the GIWA Task
microlayers of the water column is
In recent years many aspects of the
The use of indicators is the most
team suggests the following ecosystem
particularly important. The complex
anthropogenic impact on high-
important goal in the assessment of
indicators to be used for the assessment
of microorganisms that develops
latitude marine ecosystems have been
stability of individual systems. This
of the stability and variability of marine
in these layers constitutes the first
determined, these aspects include
problem has not been adequately
ecosystems.
biological structure that performs the
increasing levels of chemical pollution in
developed yet, but at present it is
- Changes in the most important
transformation and degradation of
near-shore waters (intensive pollution)
attracting more and more attention
physical processes (temperature,
many chemical toxicants in the surface
and areas of chronic pollution by
from the scientific community.
wind, circulation and other regimes);
film of the ocean. Biosedimentation of
stable chemical compounds in low
According to current concepts (Moldan
particulate organic matter is the most
- Changes in the hydrochemical
concentrations in open water (factors of
& Billharz, 1997), many factors and
important component of the process of
regime;
low intensity). Both intensive pollution
processes - from key natural phenomena
photic layer purification of contaminants,
and factors of low intensity are hazards
to leading social problems - can be used
- The level of anthropogenic impact
especially from chemicals that possess a
for the ecological safety of the Arctic seas.
as potential indicators. One cannot
(chemical, biological, temperature,
high bioaccumulative ability.
especially of production/destruction. The overall score of slight impact
microorganisms was typical for the seas of the Arctic region. The
was given to both sub-systems. For lagoons, estuaries and neritic
maximum was observed in summer and early autumn, while the
systems in the Kara Sea sub-system, the environmental impacts were
minimum occurred in winter. The dynamics of microbiological indices
moderate. To characterise the activity of biological processes and assess
has remained constant during the last few years.
the state of the Russian Arctic ecosystems data from the Roshydromet
marine network (1997-2002) and Gidrometeoizdat (1990, 1992a, 1992b,
The number of heterotrophic and saprophytic bacteria ranged from
1993, 1996) have been used.
10 to 50 cells/ml, that of oil-oxidising bacteria ranged between 10 and
30 cells/ml. The quantitative indices of the development of indicator
Kara Sea
bacteria have not changed over the last years. The relationship
Bacteriological observations included the determination of the
between the total bacterial number and the number of saprophytic
total bacterial number, raw biomass, the number of heterotrophic,
microorganisms (the coeffi
cient of relationships) has changed in the
saprophytic, oil- and pheno-oxidising bacteria, and indices showing
range from 0.0001 to 1%.
the relationships between the total number and the number of each
of the above groups of bacteria in the off shore area. Note that the
The waters of the Vega Strait can be characterised by bacteriological
determination of indicator bacteria was carried out for the purpose of
indices as slightly polluted. In the Yenisei Bay, where observations were
biological indication of chronic pollution of marine ecosystems.
carried out from April to May, the mean values of the total bacterial
number and biomass amounted to 195 000 cells/ml and 0.34 mgC/m3. The
Over the last few years in the Vega Strait near the settlement of Dickson
maximum number of heterotrophic saprophytic bacteria was observed
the total number of microorganisms had an average of 200 000 cells/ml.
in April and amounted to tens of cells/ml. The minimum number fell in
Bacterioplankton biomass had an average of 0.34 mgC/m3 in February.
May. During investigations of all the areas studied, indicator microfl ora
The seasonal dynamics of the total number and biomass of
(oil-oxidising and phenol-oxidising microorganisms) were found.
40
GIWA REGIONAL ASSESSMENT 1A RUSSIAN ARCTIC
The relationships calculated between the total bacterial number and
ecosystem (Tsyban et al. 1992b). According to bacteria indicators, the
that of indicator microorganisms makes it possible to characterise
waters of Tiksi Bay and Bulunkan Bight, where the Tiksi port is situated,
the waters of the Bay as slightly polluted. In the Pyasina Bay the total
can be placed into the category of eutrophic and chronically polluted
number of bacteria in April-May of 1993 to 230 000 cells/ml on average,
waters. Indicator bacteria are widespread in the Bulunkan Bight. The
and the mean bacterial biomass was 0.36 mgC/m3. The mean number of
maximum concentration of oil- and phenol- oxidising bacteria reached
saprophytic microfl ora turned out to be insignifi cant. Oil- and phenol-
1 000 cells/ml, which is indicative of the chronic pollution in that area of
oxidising microorganisms were found over the entire water area
the sea. Over the rest of Tiksi Bay the total amount of microorganisms
studied, where their mean number ran into units of cells/ml. Pyasina
has also proved to be high (0.1-1.2 million cells/ml). The number of
Bay can be characterised as slightly polluted.
saprophytic bacteria has varied over a wide range (from 100 cells/ml
to 600 000 cells/ml), amounting to an average of 10 000 cells/ml. The
In Gydan Bay, the mean values of microbiological indices are as follows:
number of oil- and phenol-oxidising bacteria reached 1 000 cells/ml.
the total bacterial number, biomass and the number of saprophytic
bacteria were 210 000 cells/ml, 0.33 mgC/m3 and units of cells/ml,
In Neelov Bay, the total number of microorganisms has ranged from
respectively. Oil- and phenol-oxidising microorganisms were found
0.1 to 1.4 million cells/ml, amounting to an average of 0.7 million cells/ml.
in some cases. The waters of Gydan Bay can be placed, with respect
The number of saprophytic bacteria has varied between 10 and
of microbiological indices, in the category of slightly polluted. In 1993
100 000 cells/ml, the average value being 10 000 cells/ml. The concen-
the chlorophyll a content of the water in the off shore areas of the Kara
tration of oil-oxidising bacteria in Neelov Bay has reached 100 cells/ml
Sea amounted to 0.8-22 mg/m3. This value is fi ve times greater than
and remained at this level over the last few years. Neelov Bay waters can
in the open sea. It should be noted that in the Ob Bay, in conditions
be placed, according to bacteriological indices, into the category of
of low water transparency and with a high concentration of biogenic
eutrophic and moderately polluted.
elements, the physiological activity of phytoplankton was not high
(Vedernikov et al. 1994).
In Bulunkan Bight 36 species of phytoplankton were found (Table 17).
The predominance of diatoms is indicative of a change in the
The distribution and quantitative aspects of indicator microorganism
phytoplankton community. In summer the species of green algae
development are indicative of the chronic pollution of water areas
are also widespread in the Bight. The trend was a decrease in the total
by low doses of persistent pollutants. The ecosystem state in the
number and biomass of phytoplankton as compared with preceding
investigated regions of the Kara Sea as a whole is considered stable
years. The interseasonal long-term analysis of the phytoplankton
to transitional. The overall environmental impact for Habitat and
community functioning in Bulunkan as a whole is indicative of its
community modifi cation in the Kara sub-system was slight. However,
depressed state.
for lagoons, estuaries and neritic systems, the environmental impact
was moderate in the Kara Sea sub-system.
In the remainder of Tiksi Bay, 81 species of phytoplankton were
found. In summer the phytoplankton number varied from 30 000 to
Laptev Sea
185 000 cells/l. The trend was for a decrease in the number and biomass
In the last few years in Balunkan Bight of Tiksi Bay the total number
as compared with the preceding years. In Neelov Bay a total of 137
of bacteria has become as high as 1 million cells/ml, amounting
species of phytoplankton were discovered. In summer the number
to an average of 400 000-600 000 cells/ml. The dispersion of the
of phytoplankton reached the maximum of 1 325 000 cells/l and the
concentration values of saprophytic bacteria has proved signifi cant -
biomass 2.22 mg/l, at the expense of the active vegetation of the
from ten to hundreds of thousands of cells/ml, which also corresponds
diatoms, green and blue-green algae (Table 17).
to the level of eutrophic waters.
In Buor-Khaya Bay the phytoplankton diversity was very poor; 17 species
Systematic studies of the distribution of indicator bacteria, i.e. of
were found, including 15 diatoms and 2 species of green algae. Over the
heterotrophic bacteria that have adapted to higher concentrations
last few years the quantitative indices of phytoplankton development
of toxic contaminants and acquired an ability to destroy persistent
have been extremely low: the maximum number and biomass were
organic compounds, including non-natural substances, as a result
110 000 cells/l and 0.12 mg/l, respectively. The mean values of the
of a change in the genotype, demonstrates mutations in microbial
phytoplankton number and biomass amounted to 28 750 cells/ml
populations and refl ects their dynamics and hence the variability of the
and 0.07 mg/l, respectively, which is 5 times less than the mean
ASSESSMENT
41
Table 17
Phytoplankton in the Laptev Sea.
Phytoplankton (number of species)
Phytoplankton
Zooplankton
Location
Number
Blue-green
Number (cells/l)
Biomass (mg/l)
Number of
Biomass
Diatoms
Green algae
Flagellates
Total
(specimens/
algae
species
(mg/m3)
Variation
Average
Variation
Average
m3)
Bulunkan Bight
31
3
1
1
36
65 000-285 000
ND
ND
0.23
18
7 440
467.3
Tiksi Bay
66
10
3
2
81
30 000-185 000
94 100
0.01-0.31
0.15
16
1 715
53.3
Neelov Bay
112
14
7
4
137
ND
576 600
ND
0.97
27
5 931
182.0
Buor-Khaya Bay
15
2
-
-
17
ND
28 750
ND
0.07
ND
ND
ND
Note: ND = No Data.
(Source: Roshydromet 1997, 1998, 1999, 2000, 2001, 2002, Gidrometeoizdat 1990, 1992a, 1992b, 1993, 1996)
values reported in 1992 (Table 17). The state of the phytoplankton
In Neelov Bay the highest values of the abundance and biomass of
in Buor-Khaya water is depressed and that there is a trend toward
benthos were observed in March (840 specimens/m2 and 10 g/m2,
the degradation of important biotic components. In Olenek Bay the
respectively). The mean values were 191 specimens/m2 and 5.4 g/m2,
phytoplankton biomass also proved to be very low (0.02 mg/l). In Yana
which was at the level of 1992. In Olenek Bay, the maximum quantitative
Bay the phytoplankton number and biomass amounted to 82 500 cells/l
indices of zoobenthos development were also observed in spring. They
and 0.22 mg/l, respectively.
reached 1 160 specimens/m2 (the total number) and 18.9 g/m2 (the total
biomass), when the mean values were 780 specimens/m2 and 18.4 g/m2,
In the summer in Bulunkan Bight, 18 species of zooplankton were
respectively.
observed. Over the rest of the Tiksi Bay water area, 16 species of
zooplankton were found, to be compared to 1992 when 19 species
In Yana Bay and the Dmitry Laptev Strait, the species diversity of
were found. Copepods formed a predominant group with 95% of
benthofauna remained unchanged, as in preceding years. The
the total number and 99% of the total biomass. The seasonal course
maximum values of the total number, 4 290 specimens/m2, were
of variation of the number and biomass of zooplankton in Buor-
observed in March in Yana Bay and 2 940 specimens/m2 in the Dmitry
Khaya Bay was similar to that of 1992, however the absolute values
Laptev Strait. The mean values were 1 657 and 1 900 specimens/m2,
varied substantially. In Neelov Bay, 27 species were revealed to be
respectively. The total zoobenthos biomass amounted on average to
compared to 31 species in 1992. In summer the number and biomass of
17.7 g/m2 in Yana Bay and to 30.5 g/m2 in the Dmitry Laptev Strait.
zooplankton were 5 931 specimens/m3 and 182.0 mg/m3, respectively,
which is somewhat lower than the level of 1992 (Table 17). The species
Thus, changes in the biotic component of the coastal ecosystems of the
composition of benthos in Bulunkan Bight and Tiksi Bay has stayed at
Laptev Sea manifested themselves in the wide distribution of indicator
the same level in recent years, but is represented only by oligochaetes
microfl ora, low values of the total number and biomass of phyto-,
and amphipods. However the quantitative characteristics varied over
zooplankton and zoobenthos, a decrease in the species diversity of
wide limits. For example, in Bulunkan Bight the number ranged from
benthofauna, and predominance in its composition of oligochaetes
40 specimens/m2 in September-November to 420 specimens/m2 in
and polychaetes; hydrobionts-indicators of chronic chemical pollution
January, and amounted to an average of 182.5 specimens/m2. The total
of the marine environment. The state of the ecosystem in the open sea
biomass varied from 1.2 g/m2 in September-November to 8.0 g/m2 in
as a whole can be characterised as stable. In the coastal areas and in
August, with mean values being equal to 3.7 g/m2.
estuarine zones of large rivers, the ecosystems can be characterised as
transient (Box 1).
The maximum values for the total zoobenthos number in Tiksi Bay
were observed in January and amounted to 3 000 specimens/m2.
East Siberian Sea
The maximum zoobenthos biomass was observed in May (70 g/m2)
In the region of the Pevek tongue as a whole, the total number of bacteria
when its mean value was 18 g/m2. In Buor-Khaya Bay, the highest
varied from 60 000 to 7.6 million cells/ml. The seasonal variability of the
quantitative indices were observed in July: the total number reached
total bacterioplankton number is only slightly expressed. The lowest values
4 850 specimens/m2 and the total biomass was 38.5 g/m2, while the
were observed in March and April, while the highest values occurred in
mean values were 1 950 specimens and 28.3 g/m2, respectively.
September. The mean annual total number of bacterioplankton near the
Pevek tongue amounted to 1.2 million cells/ml.
42
GIWA REGIONAL ASSESSMENT 1A RUSSIAN ARCTIC
Saprophytic bacteria were found in all the East Siberian water studied.
areas of Chaun Bay. The number and biomass of benthos amounted to
Their most probable number (MPN) varied within the limits of natural
4 400 specimens/m2 and 195 g/m2 respectively.
variability from 4 cells/ml in March to 500 cells/ml in January, amounting
to 90 cells/ml per year on the average. Oil-oxidising bacteria were
Judging from the species diversity and quantitative characteristics of
discovered during all seasons of the year. The maximum of their most
the investigated biocenoses, the bottom ecosystems of Chaun Bay are
probable number reached 250 cells/ml in April. Variations of the MPN
in good condition. Based on these observations, it was determined that
of oil-oxidising microorganisms occurred within the range from 0 to
the benthos state in the coastal regions that were investigated of the
15 cells/ml. According to bacteriological data, the waters seaward of the
East Siberian Sea is characterised as stable (Box 1).
Pevek tongue remain slightly polluted. In Chaun Bay, the total bacterial
number varied from 270 000 cells/ml in May to 1.8 million cells/ml in
The level of oil pollution in the investigated areas has been substantially
September. The mean annual total bacterial number in Chaun Bay was
reduced over the last decade, from mean values of 11-13 MAC to 1 MAC,
816 000 cells/ml.
and the waters are not polluted by synthetic surface active substances
(SSAS), while contamination by metals and PCBs is insignifi cant.
The saprophytic microfl ora content also changed within the limits of
Hydrochemical characteristics of Chaun Bay waters make it possible to
natural variations from 0 to hundreds of cells/ml, amounting to 100
consider them clean as a whole, with appearance of zones with local
cells/ml per year on the average. The MPNs of oil-oxidising bacteria were
pollution by some contaminants, like trace metals, petroleum, etc.
within the range from 0 to some tens of cells/ml. The data obtained over
the last three years confi rm a trend toward stabilisation and even to
The state of microbial populations and bottom fauna in Chaun Bay has
some decrease in the values of saprophytic and oil-oxidising microfl ora
remained unchanged since the observations started in 1984. Variations
in the Chaun Bay, pointing to some improvement of the ecological
discovered for the microbiological characteristics studied correspond to
situation in the investigated areas.
seasonal and inter-annual fl uctuations. At the same time there has been
a trend toward an improvement in the ecological situation. Based on
According to microbiological data, the waters in the investigated
microbiological indices, the waters in the studied areas of the sea may
areas remain slightly to moderately polluted. In the region of the
be defi ned as varying from relatively clean to lightly and moderately
Pevek tongue of Chaun Bay, 43 species - representing 14 large taxa
polluted (in local zones in summer). The zoobenthos state in Chaun Bay
of invertebrate animals and plants - were found in the benthos
is stable (Box 1). In the light of the above facts, the state of the coastal
composition. The widest species diversity (16 species) was found in
ecosystems of the East Siberian Sea may be defi ned as not impacted.
polychaetes. The average number of benthic organisms amounted to
7 783 specimens/m2. The highest density of settlements was typical
Chukchi Sea
for oligochaetes. The predominant species were Oligochaeta g. sp.,
In further defi ning the negative consequences of Chukchi Sea chemical
Nereimyra aphroditoides, Cistenides granulata and others. The average
pollution, the partial biodegradation of chlorinated hydrocarbons by
biomass reached 130 g/m2. The benthos biomass was mainly formed
marine microorganisms must be taken into account. For example, from
by bivalves, e.g. C. granulata, Leionucula infl ata, Macoma incospicua,
8 to 45% of benzo(a)pyrene can be removed by microbial degradation.
and Terebelioides stroemi. The species composition and quantitative
The greatest amount of microbial activity has been found in the
characteristics of the bottom biocenoses were within the limits
southern Chukchi Sea (at the level of 80%). In the low-temperature
of long-term variations, and the state of the benthos community
waters of the Chukchi Sea, only low chlorinated PCB congeners (from
remained stable (Box 1). It should be noted that the bottom sediments
mono- to pentachlorbiphenyls) are subject to microbial transformation.
in this region are chronically polluted by inclusions of small pieces of
These congeners account for only 18% of the total amount, and the
coal, slag, and solid waste.
maximum level of their degradation, in 10 days, does not exceed 50%
for dichlorbiphenyls and only 10% for tetrachlorbiphenyls. Highly
In the water of Chaun Bay, 17 to 56 species of macrophytes and
chlorinated PCB components containing more than six chlorine
invertebrate animals belonging to 25 taxonomic groups were
atoms have proved to be resistant to microbial degradation at low
discovered. Like in the preceding years, polychaetes (up to 21 species
temperature.
at a station) and bivalves (up to 9 species) remained the characteristic
predominant groups. Polychaetes and bivalves predominated in
Microbial degradation of - and -HCH in the Chukchi Sea was fi rst
number and in biomass, respectively, in most of the investigated
studied in 1993. Unlike polychlorinated biphenyls, these compounds
ASSESSMENT
43
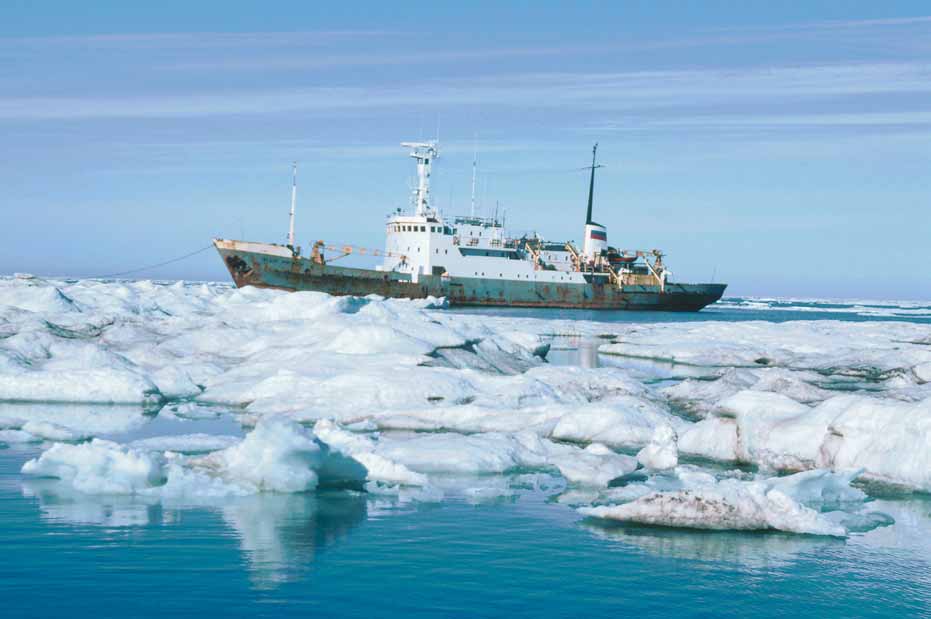
Figure 14 The Fedor Matisen in the pack ice of the Chukchi Sea near Mechigmen Bay, Russia.
(Photo: Corbis)
are subject to more active microbial degradation. For example, in the
Socio-economic impacts
southern Chukchi Sea, the microfl ora of the surface layers proved able
The overall socio-economic impacts of Habitat and community
to transform up to 40% of an HCH mass with an initial concentration
modifi cation was moderate in both sub-systems. At the same time,
of 40 ng/l in a period of fi ve days. Thus, substantial proportions (from
the GIWA experts assigned a severe impact for the indigenous
40 to 100%) of persistent organic pollutants are capable of microbial
populations in the region. It is recommended that GEF considers
transformation in Arctic sea conditions and actively accumulate in
combining the issues that concern the northern Russia's indigenous
marine organisms and bottom sediments.
populations into a separate problem. The people who inhabit the
Russian Arctic coast (including the old-settler Russians and the Yakut
The negative ecological consequences of Chukchi Sea pollution also
population) traditionally made their living by hunting, fi shing, and
include the processes of bioaccumulation of pollutants possessing
reindeer husbandry. This lifestyle, which was common until the
toxic, carcinogenic and mutagenic properties. The ecological situation
1960s, promoted the development of a special type of cultural
in the Chukchi Sea as a whole can be considered as not impacted.
landscape, which, in the best case, appeared to outsiders as virgin
However, continued chemical pollution will perturb the functioning of
lands, or more often, as waste lands, which did not need any land use
plankton communities, resulting in decreased biological diversity and
regulation. Generations of experience allowed indigenous people
continuing accumulation of hazardous pollutants in marine organisms
to balance economic demands against the ecological capacity of
of commercial value.
the fragile environment. The specialisation and the structure of this
type of nature management corresponded to the natural landscape
44
GIWA REGIONAL ASSESSMENT 1A RUSSIAN ARCTIC
structure, which provided stable functioning of its components and
associated changes in social structures also contribute to the problem.
supported the ethnic groups who made their living from the land
These broad cultural changes have resulted in a loss of educational and
(Yevseev 1996).
scientifi c values, as well as a modifi cation or loss of cultural heritages.
More than 30% of deaths in the region are the result of violence. The
Industrial development in the Arctic has been accompanied by
suicides level is 3-4 times higher than the Russian average. Annex V
severe natural resource losses. Nowadays, rivers, lakes and wetland
contains more detailed information about health and social welfare in
ecosystems in the vast territories of the region have lost their value as a
the region.
result of this development, which has aff ected the ability of indigenous
populations to survive. Recent decreases in area and quality of reindeer
Conclusions and future outlook
pastures have resulted in decreases in herd size. For example, in the
Changes in the region's marine ecosystems, and their degradation as
Yamalo-Nenets AD, the total area of reindeer pasture has decreased by
a result of anthropogenic impacts are manifested by the following
7.1 million ha in the last few years.
negative eff ects: decreased species diversity, changes in species and the
dimensional structure of communities, decreases in the total number
At the beginning of 1990s, the local population was no longer
and biomass of organisms, especially of benthofauna, a pronounced
supported by the state as had been done under the old system of the
predominance of species most resistant to pollution, and a decreased
planned economy. The combined eff ects of the destruction of natural
intensity and seasonal instability in biological processes, especially of
ecosystems, along with the displacement of indigenous peoples
production/destruction.
from their traditional lands as a result of industrial development and
the errors of economic reforms, caused huge damage to the local
Currently, the anthropogenic impact on the Russian Arctic marine
economy. After 1990, there was a one-third decrease in the harvest of
ecosystems mainly consists of a more rapid arrival of contaminants
fi sh, furs, and marine animals, and the gathering of berries, mushrooms,
at both local and regional scales. Thus, Habitat and community
nuts, medical plants and algae nearly ceased. High transportation costs
modifi cation is an important issue for the Russian Arctic region. It is
meant that around 60% of what is produced is lost since it cannot be
expected that over the next 20 years, the ecological situation in the
shipped to markets.
Neritic ecosystems will experience changes. The major concern with
regard to neritic ecosystems is linked to changes in the structure of the
Local products such as deer meet, fi sh and wild berries have
community, such as an increase in indicator bacteria, an increase in the
traditionally occupied an important place in the nutrition of the
quantity of tumour-like anomalies (TLA) in zooplankton, and a decrease
indigenous and old settlers population alike. Thus, compared to the
of species diversity.
new arrivals, the indigenous population consumed 3-5 times more
deer and wild animal meat, 8 times more marine mammal meat and
fat, and 2-8 times more river fi sh. Both the indigenous peoples and
new arrivals often eat local wild plants and marine fi sh. The raising
Unsustainable exploitation of
of deer for slaughter accounts for almost half of the animal stock
fish and other living resources
production in the region.
T
T
C
C
A
A
IMP
Kara Sea
IMP
Laptev, East Siberian and Chukchi seas
Nutritional imbalances, as a result of a decrease in local food
consumption and the adoption of a European diet, mean that the
Fish catches and use of other aquatic resources harvested from the
population does not consume enough calories or foods rich in
Arctic Ocean add up to about 950 000 tonnes annually or more than
microelements. In view of the contamination of local products, the
20% of the total Russian catch (Anon. 2000). The businesses and
current situation contributes to a growth in morbidity and an increased
organisations located in the Murmansk and Archangelsk regions are
death rate of the indigenous population.
responsible for these catches as most of the harvest is from the Barents
and White seas in the adjacent GIWA region Barents Sea. The number
The growth of poverty and the increasing unemployment levels on
of species and the total stocks of biological resources in the the Kara,
the Russian Arctic coast is closely connected with the destruction of
East Siberian, Chukchi and Laptev seas are limited. In these seas the
natural ecosystems and the loss of traditional relationships with nature.
fi sh stocks are not large enough to allow the establishment of a large
Changes in employment opportunities for local populations and
industrial fi shery. However, these coastal areas, along with fi sh stocks
ASSESSMENT
45
in the region's rivers, are of great importance in supporting the small
Scientists have also noted the sharp increase in poaching during
settlements of the Arctic coastal zone.
the period of economic reforms. Poachers traditionally take the
most valuable fi sh species, known as "Siberian delicacies". Stocks of
As described above, the marine part of the region has a not known
major anadromous and catadromous fi shes and populations of other
impact of unsustainable exploitation. The central and eastern Arctic
valuable species are also stressed (Mikhailova 1995). The combination
seas do not have a signifi cant fi shing industry, except in a narrow band
of these factors indicates that the most valuable fi sh species are
near coastal areas, and they are basically called "non-fi shery seas"
overexploited.
(Zenkevich 1977). Commercial fi sh are essentially unavailable in these
seas, hence fi shery production research is negligible.
Decreased viability of stock through pollution and disease
A slight impact was assigned to this issue in both sub-systems. The
However, the rivers of the region do have some valuable fi sh and
GIWA experts noted increased reports of parasitic infections in some
are of great importance in providing fi sh for the local population.
fi sh but without evidence of widespread impacts on the main stock.
Therefore, the assessment of this concern is focused on the region's
The accumulation of high levels of pollutants has been noted in the
river systems. Generally, the Kara Sea sub-system was assessed to have
tissues of marine organisms. It was concluded that the contamination
slight environmental impacts of Unsustainable exploitation of other
in the Russian Arctic seas is not a problem for open water marine
living resources, while the Laptev Sea, East Siberian Sea, Chukchi Sea
organisms. These marine organisms accumulate negligible quantities
sub-system had no known impact. Current harvesting practices show
of chemicals (lower than anticipated as predicted by medical and
no evidence of excessive by-catch and/or discards. There is also no
biological estimates). Chemical pollution is more typically a problem
evidence of habitat destruction due to fi sheries practices or impact on
for the European sector of the Arctic seas. However, oil and chemical
biological and genetic diversity. These issues are therefore not further
pollution in Arctic coastal river systems, particularly in the Ob and the
discussed.
Yenisei, have resulted in morbidity and mortality in fi sh, along with a
decreased viability of stock from pollution and (Mikhailova 1995).
Environmental impacts
Overexploitation
Socio-economic impacts
Siberian rivers, particularly those of the Kara Sea sub-system, are
The socio-economic impacts were assessed to be slight in the rivers of
historically of great importance in providing fi sh for the local population.
both sub-systems. A three-fold decrease in catches from the Siberian
Valuable roundfi sh such as whitefi shes, sturgeons and nelma amount
rivers during 1990s led to a loss of food sources for human or animal
up to 40% of the total catch in the rivers of western Siberia. The average
consumption. The overexploitation of valuable fi sh species and their
annual catch in Ob-Irtysh Basin was about 40 000 tonnes in the period
death due to pollution has reduced the profi tability of the catch and
from 1946 to 1989. In the 1990s, the average annual catch decreased
will require signifi cant additional costs for the artifi cial restoration of
to 12 000 tonnes. In the Yenisei Basin, the average annual catch during
valuable fi sh stocks. Because of the pollution of the Ob and other rivers
that period decreased from 4 000 to 1 500 tonnes. This data shows
by municipal wastes, as much as 60% of the Carp population and part
that catches in western Siberia rivers decreased by a factor of three in
of the Sig population is infected by opistharhosis and other helminth
the 1990s as compared to the previous 40-year period. In the rivers of
diseases, which make the fi sh dangerous for consumption (Anon. 2000).
western Siberia that fl ow in the Arctic seas, the average annual catch
Other socio-economic impacts are for example bankruptcy of small
decreased from 10 000 tonnes in 1946-1989 to 2 000 tonnes in the 1990s
fi sheries, a growth in poaching and a confl ict between user groups over
(Luzanskaya 1970, Anon. 2000).
shared resources, including space.
However, scientists do not link this decrease solely to the overexploitation
Conclusions and future outlook
of fi sh stocks. Among the major causes is a total decrease in the catch
Unsustainable exploitation of fi sh and other living resources is not a
intensity due to economic reasons. The river fi shery has never been
problem for the international waters of the region. Oil and gas extraction
highly profi table and it was sometimes supported with subsidies. As a
planned for the region will however increase the risk of anthropogenic
result of economic crisis many small fi sheries went bankrupt. The other
impact on the region's river systems, which consequently will infl uence
cause of the reduction in catches is due to the uncertainty in catch
fi sheries.
statistics. Some experts believe the volume of fi sh that are unaccounted
for equals or exceeds the amount tallied in statistics.
46
GIWA REGIONAL ASSESSMENT 1A RUSSIAN ARCTIC
Global change
and density of riparian, terrestrial or aquatic plants but without
infl uencing overall levels of productivity. There is some evidence of
T
T
C
C
A
A
change in ocean and coastal currents due to global climate change,
IMP
Kara Sea
IMP
Laptev, East Siberian and Chukchi seas
but without a strong eff ect on ecosystem diversity and productivity.
Major physical and ecological changes are expected in the Arctic
as a result of global climate change. Frozen areas will thaw and
Sea level change
undergo substantial changes with warming. A substantial loss of sea
According to the IPCC (2001) there is no evidence of sea level change
ice is expected in the Arctic Ocean. As warming occurs, there will be
in the region. The issue was therefore assessed as having no known
considerable thawing of permafrost, leading to changes in drainage,
impact in the region.
increased slumping, and altered landscapes over large areas. Drainage
systems in the Arctic are likely to change at the local scale. River and
Increased UV-B radiation as a result of ozone depletion
lake ice will break up earlier and freeze later. Polar warming probably
Ozone depletion and an associated increase in UV-B radiation have
will increase biological production but may lead to diff erent species
been observed in the Arctic over the past decade, and was assessed
composition on land and in the sea. On land, there will be a tendency for
as having a slight impact in both sub-systems. This change may have
northward shifts in major biomes such as tundra and boreal forest along
a considerable eff ect on biological activity. Ozone depletion has
with associated animals, resulting in signifi cant impacts on species such
occurred both as a steady decline and also in short, isolated areas
as bear and caribou. However, the Arctic Ocean places a geographical
with very low ozone (Watson et al. 1998). Climate change may increase
limit on northward movement. Marine ecosystems will also move
ozone depletion. The cooling of the stratosphere is likely to increase this
poleward. Animals dependent on ice may be at a disadvantage in polar
depletion with the current chlorine loading. However, chlorine loading
areas. Figure 15 shows the annual winter temerature over Arctic during
can also be expected to decline considerably in the future. Some of the
the period 1900 to 1996.
episodes of low ozone observed in the Arctic are not associated with
chemical depletion but are due to the infl ux of low-ozone air from lower
Environmental impacts
latitudes (Taalas 1993, Taalas et al. 1995). Whether these episodes will
Changes in hydrological cycle and ocean circulation
increase or decrease will depend on stratospheric circulation patterns
The impact of this issue was slight in both sub-systems. A change in the
near the Arctic; thus these episodes also may be infl uenced by climate
hydrologic cycle due to global change will change in the distribution
change. The chemically induced and the dynamically induced episodes
of low ozone that have occurred in the Arctic appear to be increasing in
both frequency and severity (Taalas et al. 1997). These depletion events
3.0
are most prevalent in the spring, when biological activity is highly
sensitive to UV-B radiation. Increased levels are likely to aff ect human
2.0
populations as well as aquatic and terrestrial species and ecosystems
(Taalas 1993).
) 1.0
(°C
e
Arctic plants are also aff ected by increased UV-B radiation. In Arctic
t
ur
a
regions, UV-B radiation is low, but the relative increase from ozone
0
mper
depletion is large, although the ancestors of present-day Arctic plants
e
r T
were growing at lower latitudes with higher UV-B exposure. Over
t
e
i
n
W -1.0
the past 20 years, stratospheric ozone has decreased approximately
10-15% in northern polar regions (Thompson & Wallace 2000). As a fi rst
approximation, a 1% decrease in ozone results in a 1.5-2% increase in
-2.0
UV-B radiation. The processes that damage organisms are temperature-
independent, whereas repair processes are slowed by low temperatures.
-3.0
Hence, it is predicted that Arctic plants may be sensitive to increased
1900
1910
1920
1930
1940
1950
1960
1970
1980
1990
UV-B radiation, especially because many individuals are long-lived
Year
and the eff ects are cumulative. In a study of responses by Ericaceous
Figure 15 Annual winter temperature over Arctic 1900-1996.
(Source: IPCC 2001)
plants to UV-B radiation, responses varied from species to species and
ASSESSMENT
47
were more evident in the second year of exposure (Björn et al. 1997,
"for indigenous people, climate change is often not a top priority, but a
Callaghan et al. 1998). For unknown reasons, however, the growth of
luxury, and Western scientists may well be indoctrinating Natives with
the moss Hylocomium splendens is strongly stimulated by increased
their own terminology and agenda on climate change" (BESIS 1999).
UV-B, provided adequate moisture is available (Gehrke et al. 1996).
Increased UV-B radiation may also alter plant chemistry, which could
Exploration, production, transportation of oil and gas, and associated
reduce decomposition rates and nutrient availability (Björn et al. 1997,
construction of processing facilities are likely to be aff ected by climatic
1999). Soil fungi diff er with regard to their sensitivity to UV-B radiation,
change (Maxwell 1997). Changes in a large number of climate and
and their response also will aff ect the processes of decomposition
related variables will aff ect on- and off shore oil and gas operations. Use
(Gehrke et al. 1995). Therefore, measurable eff ects of UV-B radiation
of oil drilling structures or ice-strengthened drill ships designed to resist
can be detected with respect to the behaviour or appearance of some
ice, use of the ice itself as a drilling platform, and construction of artifi cial
aquatic species, without aff ecting the viability of the population.
islands are likely to give way to more conventional drilling techniques
employed in ice-free waters (Maxwell 1997). These likely changes are
Changes in ocean CO source/sink function
not without concerns. Although the use of regular drill ships may
2
The impact of greenhouse gases including CO was considered and
reduce operating costs by as much as 50% (Croasdale 1993), increased
2
based on the IPCC assessment (IPCC 2001) the impact is slight.
wave action, storm surges, and coastal erosion may necessitate design
changes in conventional off shore and coastal facilities (McGillivray et al.
Socio-economic impacts
1993). This may increase the costs of pipeline construction because
In the past, when population densities of indigenous people were
extensive trenching may be needed to combat the eff ects of coastal
lower and economic and social structures were linked only weakly
instability and erosion, especially that caused by permafrost melting
to those in the south, northern peoples showed signifi cant fl exibility
(Croasdale 1993, Maxwell 1997). Design needs for onshore oil and gas
in coping with climate variability (Sabo 1991). Now, commercial, local,
facilities and winter roads are strongly linked to accelerated permafrost
and conservation interests have reduced their options, and they may
instability and fl ooding. The impact of climate change is likely to lead to
be less well equipped to cope with the combined impacts of climate
increased costs in the industry associated with design and operational
change and globalisation (Peterson & Johnson 1995). Increasingly, the
changes (Maxwell 1997).
overall economy is tied to distant markets. For example, in Russia 92%
of exported oil is extracted from wells north of the Arctic Circle (Nuttall
The impact of climate warming on transportation and communications
1998). The value of native, local harvests of renewable resources has
in Arctic regions is likely to be considerable. Within and between most
been estimated to be only 33-57% of the total economy of some
polar countries, air transport by major commercial carriers is widely
northern communities (IPCC 2001). However, harvesting of renewable
used to move people and freight. Irrespective of climate warming,
resources also must be considered in terms of maintaining cultural
the number of scheduled fl ights in polar regions is likely to increase.
activities. Harvesting contributes to community cohesion and self-
This will require an adequate infrastructure over designated routes,
esteem, and knowledge of wildlife and the environment strengthens
including establishment of suitable runways, roads, buildings, and
social relationships (Warren et al. 1995).
weather stations. These installations will require improved engineering
designs to cope with permafrost instability. Because paved and snow-
Predicted climate change is likely to have impacts on marine and
ploughed roads and airfi eld runways tend to absorb heat, the mean
terrestrial animal populations; changes in population size, structure,
annual surface temperature may rise by 1-6°C, and this warming may
and migration routes also are probable (Beamish 1995, Gunn 1995,
exacerbate climate-driven permafrost instability (Maxwell 1997). Cloud
Ono 1995). Careful management of these resources will be required
cover, wind speeds and direction, and patterns of precipitation may
within a properly consultative framework, similar to recent agreements
be expected to change at the regional level in response to global
that are wide-ranging and endeavour to underpin the culture and
warming. At present, the density of weather stations is relatively low in
economy of indigenous peoples (Nuttall 1998). Langdon (1995) claims
Arctic regions. Increased air and shipping transports under a changing
that "the combination of alternative cultural lifestyles and altered
climate will require a more extensive weather recording network and
subsistence opportunities resulting from a warmer climate may pose
navigational aids than now exists.
the greatest threat of all to the continuity of indigenous cultures in
northern North America." An alternative view is that northern people
The impact of climate warming on marine systems is predicted to lead
live with uncertainty and learn to cope with it; this view suggests that
to loss of sea ice and opening of sea routes such as the Northeast and
48
GIWA REGIONAL ASSESSMENT 1A RUSSIAN ARCTIC
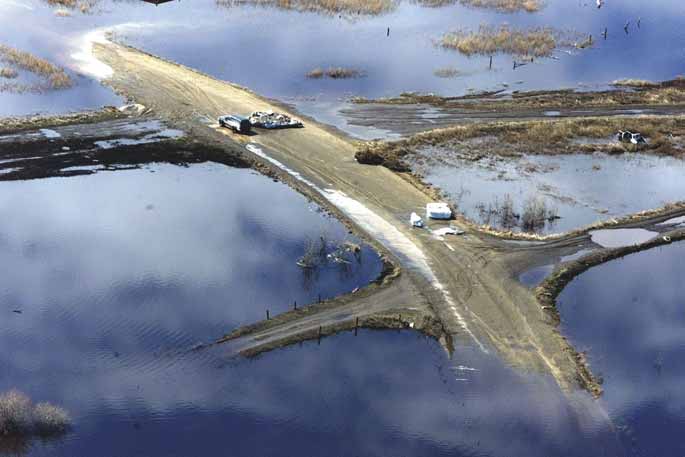
Figure 16 Road
fl ooded by the Lena River outside Yakutsk, May 23, 2001.
(Photo: Corbis)
Northwest passages. Ships will be able to use these routes without
eff ects of global warming are likely to have little eff ect on human health.
strengthened hulls. There will be new opportunities for shipping
Potential indirect eff ects, such as changes in infectious diseases and
associated with movement of resources (oil, gas, minerals, and timber),
vector organisms, are largely unknown. UV-B radiation is increasing,
freight, and people (tourists). However, improved navigational aids will
which can damage the genetic (DNA) material of living cells (in an
be needed, and harbour facilities probably will have to be developed.
inverse relationship to organism complexity) and induce skin cancers,
The increase in shipping raises questions of maritime law that will need
as shown in experimental animals. It also may aff ect human health: UV-B
to be resolved quickly. These issues include accident and collision
radiation is implicated in causing human skin cancer and lesions of the
insurance, which authority is responsible for removal of oil or toxic
conjunctiva, cornea, and lens; it also may impair the body's immune
material in the event of a spill, and which authority or agency pays
system (IPCC 2001).
expenses incurred in an environmental cleanup. These questions are
important because sovereignty over Arctic waters is disputed among
Climate change and economic development associated with oil
polar nations, and increased ship access could raise many destabilising
extraction, mining, and fi sh farming will result in changes in diet
international issues. Increased storm surges are predicted that will aff ect
and nutritional health and exposure to air-, water-, and food-borne
transport schedules.
contaminants (Bernes 1996, Rees & Williams, 1997, Vilchek & Tishkov
1997, AMAP 1998, Weller and Lange 1999, Freese 2000). People who
Increased levels of UV-B radiation are likely to aff ect the human
rely on marine systems for food resources are particularly at risk
populations (Taalas 1993). Episodes of extreme cold and blizzards are
because Arctic marine food chains are long (AMAP 1997). Low-lying
major climate concerns for circumpolar countries like Russia and Canada
Arctic coasts of western Canada, Alaska, and the eastern Russian Arctic
(IPCC 2001). However, the polar regions will remain cold, so the direct
are particularly sensitive to sea-level rise. Coastal erosion and retreat
ASSESSMENT
49
as a result of thawing of ice-rich permafrost already are threatening
most buildings in cities such as Tiksi and Yakutsk will be lost, unless
communities, heritage sites, and oil and gas facilities (Forbes & Taylor
protective measures are taken (Weller & Lange 1999). The impact of
1994, Are 1999).
warming is likely to lead to increased building costs, at least in the short-
term, as new designs are produced that cope with permafrost instability.
Along the coasts of the Bering and Chukchi seas, indigenous peoples
Snow loads and wind strengths may increase, which also would require
report thinning and retreating sea ice, drying tundra, increased
modifi cations to existing building codes (Maxwell 1997). There will be
storms, reduced summer rainfall, warmer winters, and changes in the
reduced demand for heating energy with warmer climate (Anisimov &
distribution, migration patterns, and numbers of some wildlife species.
Poljakov 1999).
These populations say that they already are feeling some of the impacts
of a changing, warming climate (Mulvaney 1998). For example, when
Conclusions and future outlook
sea ice is late in forming, certain forms of hunting are delayed or may
Changes in ecological situations and socio-economic activity caused
not take place at all. When sea ice in the spring melts or deteriorates
by global climate change are expected. The hydrology of the Arctic is
too rapidly, it greatly decreases the length of the hunting season. Many
particularly susceptible to warming because small rises in temperature
traditional foods are dried (e.g. walrus, whale, seal, fi sh, and birds) in the
will result in increased melting of snow and ice, with subsequent
spring and summer to preserve them for consumption over the long
impacts on the water cycle. There will be a shift to a run-off regime
winter months. When the air is too damp and wet during the "drying"
that is driven increasingly by rainfall, with less seasonal variation in run-
seasons, food becomes mouldy and sour. The length of the wet season
off . There will be more ponding of water in some areas, but peatlands
also aff ects the ability to gather greens such as willow leaves, beach
may dry out because of increased evaporation and transpiration from
greens, dock and wild celery. These accounts refl ect the kinds of changes
plants. In some areas, thawing of permafrost will improve infi ltration.
that could be expected as global warming aff ects the Arctic (Mulvaney
An expected reduction in ice-jam fl ooding will have serious impacts
1998). As climate continues to change, there will be signifi cant impacts
on riverbank ecosystems and aquatic ecology, particularly in the highly
on the availability of key subsistence marine and terrestrial species. At
productive Arctic river deltas. Changes in Arctic run-off will aff ect sea-
a minimum, salmon, herring, walrus, seals, whales, caribou, moose, and
ice production, deepwater formation in the North Atlantic, and regional
various species of waterfowl are likely to undergo shifts in range and
climate. A major impact would result from a weakening of the global
abundance. This will entail local adjustments in harvest strategies as
thermohaline circulation as a result of a net increase in river fl ow and the
well as in allocations of labour and resources (e.g. boats, snowmobiles,
resulting increased fl ux of freshwater from the Arctic Ocean.
weapons). As the climate changes, community involvement in
decision-making has the potential to promote sustainable harvesting
Warming should increase biological production; however, the eff ects
of renewable resources, thereby avoiding deterioration of common
of increased precipitation on biological production are unclear. As
property. However, factors that are beyond the control of the local
warming occurs, there will be changes in species composition on
community may frustrate this ideal. For example, many migratory
land and in the sea, with a tendency for poleward shifts in species
animals are beyond hunters' geographical range for much of the year,
assemblages and loss of some polar species. Changes in sea ice will alter
and thus beyond the management of small, isolated communities.
the seasonal distributions, geographic ranges, patterns of migration,
Traditional subsistence activities are being progressively marginalised
nutritional status, reproductive success, and ultimately the abundance
by increasing populations and by transnational commercial activities
and balance of species. Animals that are dependent on sea ice, such as
(Sklair 1991, Nuttall 1998).
seals, walrus, and polar bears, will be disadvantaged. High-arctic plants
will show a strong growth response to summer warming. It is unlikely
The capacity of permafrost to support buildings, pipelines, and roads
that elevated CO levels will increase carbon accumulation in plants, but
2
has decreased with atmospheric warming, so pilings fail to support
plants may be damaged by higher UV-B radiation. Biological production
even insulated structures (Weller & Lange 1999). The problem is
in lakes and ponds will increase.
particularly severe in the Russian Federation, where a large number
of fi ve-story buildings constructed in the permanent permafrost zone
Climate change, in combination with other stresses, will aff ect human
between 1950 and 1990 already are weakened or damaged, probably as
communities in the Arctic. The impacts may be particularly disruptive
a result of climate change. For example, a 2°C rise in soil temperature in
for communities of indigenous peoples following traditional lifestyles.
the Yakutsk region has led to a decrease of 50% in the bearing capacity
Changes in sea ice, seasonality of snow, and habitat and diversity of
of frozen ground under buildings. It has been predicted that by 2030,
food species will aff ect hunting and gathering practices and could
50
GIWA REGIONAL ASSESSMENT 1A RUSSIAN ARCTIC
threaten longstanding traditions and ways of life. On the other hand,
system is expected. Some estimates predict that the economy will
communities that practice these lifestyles may be suffi
ciently resilient
develop mostly as a result of the development of hydrocarbon stocks.
to cope with these changes. Increased economic costs are expected to
Economic development will also hinge on the planned growth in the
aff ect infrastructure, in response to thawing of permafrost and reduced
production of chromite and titanium-magnetite ores from Yamal-
transportation capabilities across frozen ground and water.
Nenets AD, as well as growth in the production of nickel, cobalt, copper
and other metals from the Norilsk industrial complex (Dolgano-Nenets
AD, Taimyr). Therefore it is expected that the negative impacts from
chemical pollution and spills will remain at their current levels or will
Priority concerns for further
increase in the future.
analysis
The second prioritised concern that may increase in severity in the
Pollution and Habitat and community modifi cation in the Kara Sea
future is Habitat and community modifi cation. The most threatening
sub-system were ranked as the priority concerns for the Russian Arctic
issue here is the modifi cation of ecosystems, primarily the neritic
region. The analysis of the main issues and levels of pollution suggests
systems of the Kara Sea sub-system. Spills and chemical pollutants such
that the waters of the Russian Arctic region are much cleaner than other
as chlorinated hydrocarbons, heavy metals are actively bioaccumulating
European seas and the Barents Sea. However, two of the issues from the
at signifi cant levels in the bottom sediments and in marine organisms,
concern Pollution have been chosen for further analysis in the Kara Sea
thereby disturbing the natural balance in existing ecosystem.
sub-system: chemical pollution and spills.
After the decline in production during the 1990s as a result of
economic reforms, rapid growth in production in the Kara Sea sub-
ASSESSMENT
51
Causal chain analysis
This section aims to identify the root causes of the environmental
Modification of neritic
and socio-economic impacts resulting from those issues and
ecosystems in Kara Sea
concerns that were prioritised during the assessment, so that
appropriate policy interventions can be developed and focused
Figure 17 shows the causal chain diagram for modifi cation of neritic
where they will yield the greatest benefi ts for the region. In order
ecosystems in the Kara Sea sub-system.
to achieve this aim, the analysis involves a step-by-step process
that identifi es the most important causal links between the
Environmental and socio-economic impacts
environmental and socio-economic impacts, their immediate
Changes in the region's marine and freshwater ecosystems, and their
causes, the human activities and economic sectors responsible
degradation as a result of anthropogenic impacts, are manifested by
and, fi nally, the root causes that determine the behaviour of
the following negative eff ects; decreased species diversity, changes in
those sectors. The GIWA Causal chain analysis also recognises
species and the dimensional structure of communities, decreases in the
that, within each region, there is often enormous variation in
total number and biomass of organisms (especially of benthofauna), a
capacity and great social, cultural, political and environmental
pronounced predominance of species most resistant to pollution, and
diversity. In order to ensure that the fi nal outcomes of the GIWA
a decreased intensity and seasonal instability in biological processes
are viable options for future remediation, the Causal chain
(especially of production/destruction).
analyses of the GIWA adopt relatively simple and practical
analytical models and focus on specifi c sites within the region.
Because lands have been expropriated for industrial uses and are tainted
For further details on the methodology, please refer to the GIWA
by pollution, the rural population has lost not only its pastures but also
methodology chapter.
hunting lands and fi shing sites, as well as territories where wild berries
and mushrooms can be gathered. The indigenous population must
The issues identifi ed in the assessment as having the highest priority for
therefore abandon their traditional lifestyles and places of residence.
the region are chemical pollution, oil spills, and modifi cation of neritic
Serious confl icts with indigenous population and oil companies
ecosystems, lagoons and estuaries in the Kara Sea sub-system. The aim
because of hunting and fi shing sites have occurred (see Annex V).
of the Causal chain analysis is to determine the root causes of chemical
pollution, oil spills and habitat modifi cation, in order to enable policy
The conditions in the Arctic region are unfavourable for human health.
makers to prioritise actions in the region. The identifi ed root causes will
Morbidity can be directly connected with chemical and oil spills and the
form the basis for the Policy option analysis in the next section.
overall pollution in the catchments of the Kara Sea. The mortality rate
in the region from diff erent diseases is higher than the Russian average.
The increased water-borne inputs of chemical pollution and oil spills,
Poverty and growth of unemployment is closely connected with
atmospheric inputs of chemical pollutants are closely connected with
indigenous peoples' loss of their traditional and sustainable relationship
oil and gas production, the mining and metallurgy industry, and sea
with the land. About 25-35% of the area's indigenous population are
and inland water transport. The modifi cation of the Russian Arctic's
without a permanent job and survive only by gathering wild berries
ecosystems is a result of chemical pollution and oil spills.
and mushrooms. The unemployment level is especially high for women
52
GIWA REGIONAL ASSESSMENT 1A RUSSIAN ARCTIC
Issues
Immediate causes
Sectors/Activities
Root causes
Modification of
Mining and
Governance
Aquatic input
neritic ecosystems
metallurgical industry
Technology
Atmospheric deposition
Oil and gas production
Economic
Sea and inland
water transport
Legal
Lack of education and
knowledge
Public control
Political
Figure 17 Causal chain diagram illustrating the causal links for modifi cation of neritic ecosystems in Kara Sea.
and young people. As much as 15% of the unemployed indigenous
impact on environment; and (vii) alterations in habitats for fi sh and
population has stopped looking for a job.
migrant birds. All these factors cause serious damage to many natural
resources. Many once-natural ecosystems have been aff ected by these
Immediate causes
impacts, which can be seen over a large part of the region (including
The immediate causes of the modifi cation of the neritic, lagoons
sea, lake and swamp ecosystems).
and estuarine ecosystems of the Kara Sea are: (i) Increased water-
borne inputs of chemical pollution and oil spills; and (ii) Increased
Other sectors involved in the modifi cation of neritic ecosystems are
atmospheric inputs of chemical pollution. The following processes are
the mining and metallurgical industry as well as sea and inland water
mainly responsible:
transports.
Pollution by petroleum hydrocarbons including polyaromatic ones
(benzo(a)pyrene);
Root causes
Pollution by persistent organic pollutants (chlorinated Economy
hydrocarbons) of agricultural, industrial and community origin;
Economic causes are linked with inadequate funding of environmental
Pollution by heavy metals, discharged into the environment by
needs such as the reconstruction and modernisation of water treatment
mining and metallurgy enterprises;
plants to control pollution discharged to Siberian rivers, treatment of
Pollution by other chemical agents including oxides of sulphur,
industrial air discharges, restoration of natural ecosystems, and the
nitrogen and carbon, ammonium, hydrogen sulphide, phenols,
provision of nature protection services (Andreev 2001). Poor integration
nitrogen and phosphorus.
of environmental protection problems with socio-economic planning
also leads to water ecosystems degradation. A comprehensive monetary
Sectors
estimation of the natural resources potential (natural capital) in a single
The modifi cation of highly vulnerable water ecosystems in the Kara
state accounting system has never been conducted. The result is a
Sea sub-system is a result of the rapid industrial development of the
growth in corruption and illegal deals; income is hidden from taxation,
Russian Arctic region after the 1970s. The growth in oil and gas sector
which means there is less public money for social and economic needs;
was facilitated by the construction of pipelines, roads and ports. Oil
and corporate interests tend to dominate strategic problems (Barsegov et
and gas development and extraction result in the following kinds of
al. 2000). Other economic root causes of the modifi cation of ecosystems
pollution: (i) release of drilling slurry; (ii) occasional and permanent
are similar to the root causes of chemical pollution and oil spills.
leaks of fuel, lubricants, gas condensate, drilling and other washing
liquids; (iii) chemical pollution of water and bottom sediments; (iv)
Technology
construction of artifi cial structures (i.e. underwater pipelines); (v) noise
Many of the oil, gas and mineral extracting and metallurgic companies
and vibration caused by drilling rigs that scare animals; (vi) thermal
use physically outdated equipment and technologies. Transport vessels
CAUSAL CHAIN ANALYSIS
53
are also outdated, which increases the risk of oil spills. Companies use
Political causes
outdated technologies to neutralise or control industrial wastes.
The precepts of sustainable development have not yet been
(Andreev 2001).
implemented in concrete international programmes and projects in
the Arctic. Indicators of sustainable development that are common
Governance
for all the Arctic countries have not been agreed to. These indicators
In the Kara Sea sub-system control over environmental conditions is
should be aimed at reducing the total anthropogenic impact to an
weakened due to low level of funding for control services, including
acceptable level.
funding for modern equipment. New owners of oil, mining, metallurgic
and transporting companies that pollute reservoirs are not being forced
by the government to completely follow environmental protection
legislation and regulations, including paying compensation for damage
Chemical pollution in Kara Sea
done to the environment. The need to balance economic demands and
the ecological capacity of fragile northern ecosystems is ignored by
Figure 18 shows the causal chain diagram for chemical pollution in the
company managers (Andreev 2001).
Kara Sea sub-system.
Public control
Environmental and socio-economic impacts
Control over the activity of oil, mining, transporting and other industrial
Assessment analysis of the concern Pollution showed that the long-
companies by the local population (especially indigenous peoples) is
range atmospheric transfer of persistent toxic organic chemicals and
insuffi
cient. The ability of non-governmental ecological organisations
pollution via river run-off are very harmful for the marine ecosystem. A
to infl uence decisions about new oil, gas and mineral fi eld development
decrease of the number and variety of macrophytes and zoobenthos,
and the construction of industrial infrastructures is extremely limited.
changes in ecological processes, changes in ethological reactions,
bioaccumulation of toxic chemicals, pathological manifestations
Lack of knowledge and education
of contamination and increased mortality are the consequences of
Oil and gas administrators and the local population, particularly the
anthropogenic impact.
rural and indigenous population have insuffi
cient knowledge about
current environmental legislation and the principles of sustainable
Increasing chemical pollution causes contamination of drinking water
development as described by Agenda 21. The problems caused by
and local foodstuff s, such as deer meet, fi sh, and wild berries that have
chemical and other pollution in Arctic seas ecosystems have been poorly
traditionally occupied an important place in the diets of indigenous and
studied. For example there has been little scientifi c examination of the
old settlers populations in the Russian Arctic. Diff erent pollution-related
ecological capacity of the fragile sea and freshwater ecosystems. There
illnesses result in a regional mortality rate that is 2.5 times higher than
is a lack of information to allow the simulation of basic hydrological
the Russian average. Costs for mitigating this problems are increasing.
and ecological processes in Arctic seas, particularly with respect to the
Because lands are expropriated for industrial uses and are tainted by
estimation of the possible consequences of petroleum product spills
pollution, the rural population loses its pastures, hunting lands and
and other problems (Annex V) (Denisov 2002).
fi shing sites, as well as territories where wild berries and mushrooms
can be gathered. The indigenous population must therefore abandon
Legal and regulatory causes
their traditional lifestyles and places of residence, leading to increased
Recently, a series of legislative acts, presidential decrees and long-term
unemployment.
governmental programmes has been enacted to regulate the socio-
economic and environmental situation in the Arctic and the Russian
Immediate causes
North (see Annex VII). However the existing legislation is not adequate
Pollutants are transported into the Kara Sea by currents from the
for solving the region's problems. One of the main root causes of the
Barents Sea, river run-off from industrial regions in its catchment area,
negative trends in the socio-economic and environmental situation is
and via long-range atmospheric transport from western Europe and
that there are no regulations or legislation that refl ect an agreed-upon
the East. It is important to emphasise the sources of the diff erent kinds
defi nition of sustainable development in the region (Andreev 2001).
of pollutants and to identify the ones that have the most infl uence.
It is also important to defi ne the kinds of activities in the territories
of western Siberia that contaminate the Kara Sea sub-system. The
54
GIWA REGIONAL ASSESSMENT 1A RUSSIAN ARCTIC
Issues
Immediate causes
Sectors/Activities
Root causes
Chemical
Mining and
Aquatic input
Governance
pollution
metallurgical industry
Atmospheric deposition
Oil and gas production
Technology
Economic
Legal
Lack of education and
knowledge
Political
Public control
Figure 18 Causal chain diagram illustrating the causal links for chemical pollution in Kara Sea.
immediate causes of chemical pollution are increased aquatic inputs
Table 18
Air pollution in the Russian Arctic region.
and atmospheric deposition.
Administrative unit
1992
1995
2000
2001
Nenets AD
ND
24 000
8 000
8 000
Analyses have shown that the major source of contamination in Kara
Yamalo-Nenets AD
ND
757 000
576 000
587 000
Sea is the mineral resource industry and oil and gas production. In the
Taimyr (Dolgano-Nenets) AD
ND
22 000
16 000
12 000
autonomous districts situated on the shores of the Kara Sea (Nenets,
Republic of Sakha (Yakutia)
ND
120 000
134 000
130 000
Yamal-Nenets and Taimyr (Dolgano-Nenets)), more than 95% of the
Norilsk metallurgical complex, Taimyr
2 208 300
2 041 400
2 149 100
2 114 800
industrial production is accounted for by the fuel industry, and the
Territory (Dolgano-Nenets) AD
ND = No Data.
mining, and smelting and processing industry. Nowadays every fourth
(Source: Regions of Russia 2002, Goskomstat 2002)
cubic metre of the world's gas is extracted in Yamalo-Nenets AD. Oil
and gas development poses a signifi cant threat to environment due
of emitting the most amount of pollution of any industry or activity in
to pollution from oil and gas extraction, and oil and gas spills from
all of Russia. The Norilsk region is currently considered to be ecologically
pipeline breaks.
unstable.
However a much more dangerous threat to water bodies is posed
Sectors
by the chemical pollution from the mining and metallurgy industry.
The main threat of chemical air and water pollution in the Kara Sea
At present, the Norilsk industrial metallurgical complex, in the Taimyr
sub-system is posed by the mining and metallurgical industry (Norilsk
Territory (Dolgano-Nenets) AD provides up to 20% of the world's nickel
industrial complex), particularly as a result of air emissions from the
and cobalt, 65-70% of the copper and 100% the world's platinum
complex. All other industries in the region are undeveloped and tend
metals (Anon. 1998). Point sources of pollution in Norilsk vent 31
to be of the service type. Transboundary atmospheric transport of
diff erent substances including sulphur dioxide; 40 000 tonnes of dust
chemicals poses a signifi cant additional threat to Arctic seas. Oil and
are vented every year, of which 18% is pure nickel. An estimated 5 kg
gas production industries in the region also contribute to pollution.
of chemicals and contaminants falls on every square metre of Norilsk.
These substances eventually fi nd their way to the water.
Root causes
Economy
The air emissions from the Norilsk industrial complex are nearly three
Failures in market reform
times greater than those from all the shoreline industries in the region
The shock of the transition from a centralised state system to liberal
(Table 18). In fact, this industrial complex holds the dubious distinction
market relations in Russia in 1992 hampered the creation of sustainable
CAUSAL CHAIN ANALYSIS
55
market structures and an adequate system for supporting communities
The Russian government still does not accept a long-term federal
in the north. When the reforms began many of the state supports for
strategy that would enable the Arctic zone to make the transition to an
the population were eliminated. The failure of these reforms sharply
economy that is based on the principles of sustainable development.
decreased both production and tax incomes in Russia. But the most
The main parts of the Arctic development strategy have already been
serious consequences of the crisis were in the north, where the very
created by the Council of Industrial Forces Relocation (Andreev 2001),
survival of the population was threatened. The abrupt decrease in
but the strategy does not achieve the goals set by Agenda 21 and other
production and the associated drops in tax incomes and business
international targets agreed to at the United Nations Conference on
investments were combined with a dramatic increase in consumer
Environment and Development (UNCED) in Rio de Janeiro 1992 and
costs after 1990. As a result, the fi nancing of social and environmental
World Summit on Sustainable Development (WSSD) in Johannesburg
needs has been greatly reduced.
2002.
The majority of newer state programmes dating from the mid-1990s
Technology
and designed for the social and economic development of the
Many of the mining and metallurgical plants operated by Norilsk and
northern Russia up to the year 2000 were never completed due to
other industrial complexes in the Kara Sea sub-system use aging and
lack of money. Improvements in the socio-economic situation in the
worn-out equipment and technologies that date from the 1940s and
north were evident only after 2000. The reforms have meant that the
1950s. This explains why more than 2 500 000 tonnes of pollution is
fi nancing of nature conservation measures has been drastic decreased
discharged into the air and water every year. There is an urgent need
(Regions of Russia 2002).
for industrial renovation, pollution treatment facilities and wastewater
treatment and recycling systems. However, these investments are very
During the economic crisis, it was impossible for the state to regulate
diffi
cult to achieve due to lack of fi nances (Regions of Russia 2002,
polluting industries and force them to clean up because to do so would
Barsegov et al. 2000).
have resulted in mass bankruptcies and a growth in social tensions.
Additionally, a powerful industrial lobbying group hindered the Russian
Governance
government in its eff orts to toughening environmental protection and
The regulation of polluting industries in order to protect the
monitoring of mining operations. Industry has preferred to pay to
environment is weak in the Kara Sea sub-system due to lack of fi nancing
pollute rather than to invest in clean-up and treatment technologies.
for control systems, including the replacement of outdated equipment
Local authorities, under pressure from new business owners, have
with modern equipment with pollution control systems. The payments
sometimes even decreased or eliminated pollution payments, even
that industries make to pollute the environment are unreasonably low
though this is prohibited by federal legislation. There are even cases
and are not eff ective economic regulators (Barsegov et al. 2000).
in which these pollution payments have been used inappropriately on
expenditures other than for the mitigation of industrial environmental
Public control
impacts (Barsegov et al. 2000).
The local population, particularly the indigenous population, has
insuffi
cient say or control over environmental protection issues. Non-
Strategic forecast failures
governmental ecological organisations have virtually no eff ect on
When market reforms were fi rst introduced, the state had not
economic decisions (Barsegov et al. 2000).
performed complex long-term strategic forecasts for some time for
socio-economic development in the north. Consequently, when
Lack of education and knowledge
northern industries were fi rst purchased by new owners, the owners
The local population, particularly the rural and indigenous population,
thought only about momentary gains, without concomitant spending
know little about existing ecological laws and principles of sustainable
on social and ecological needs.
development, such as are described in Agenda 21. It can be diffi
cult for
them to gain access to current, accurate environmental information in
Federal programmes from the mid-1990s onward were designed to
order to aid decision-making. Most parts of northern Siberia have no
encourage socio-economic development in northern Russia up until
computer network with Internet access; indeed, a considerable part
the year 2000, but these programmes did not establish a dependable
of the population has had diffi
culty getting access to newspapers
system of environment protection.
and journals during the period of reforms. The overall levels of public
education declined radically. Atmosphere and climate monitoring
56
GIWA REGIONAL ASSESSMENT 1A RUSSIAN ARCTIC
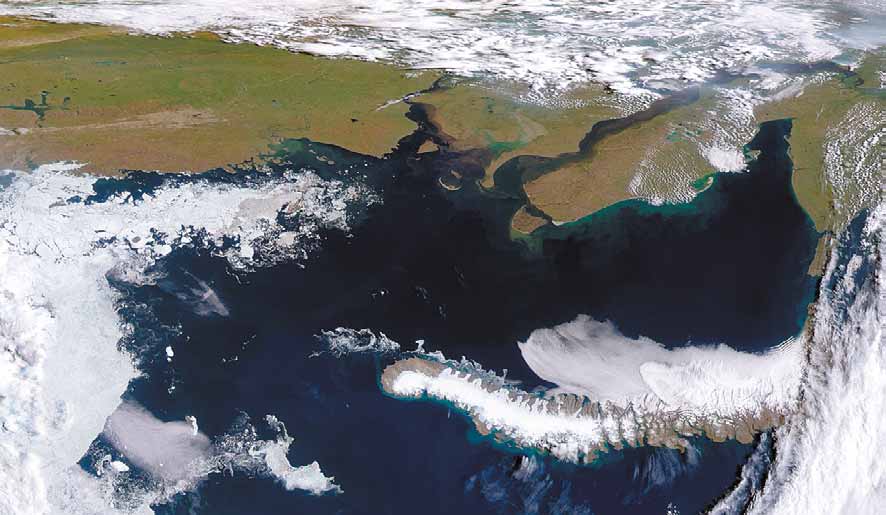
Figure 19 Kara
Sea.
(Photo: NASA)
services were cut back. Financing of ocean research expeditions was
et al. 2000). International eff orts and multinational cooperation will be
reduced, so that the long-term ecological monitoring data set was
required to limit this fl ow of pollution to the Arctic.
interrupted (Barsegov et al. 2000).
Conclusion
Legal
This causal chain analysis demonstrates the clear links between
Recently a series of legislative acts, presidential decrees and long-
environmental and socio-economic impacts, immediate causes and
term governmental programmes have been enacted to regulate the
root causes underlying the increase of chemical pollution in the Kara
socio-economic and environmental situation in the Russian Arctic (see
Sea sub-system and other Arctic sea basins. These links are shown
Annexes III and IV). However these eff orts are insuffi
cient in terms of
in Figure 18. The root causes of chemical pollution that have been
sustainable development in the Arctic because there is no agreed-
identifi ed as a result of this assessment cannot be overcome over the
upon approach to sustainable development for the Russian Arctic
short-term. Time and signifi cant resources will be required.
region. It testifi es to absence of system approach of the legislative
base of the Russian legislation conformably to Arctic from the point of
the sustainable development (Andreev 2001).
Oil spills in Kara Sea
Political
A large part of chemical pollution of the Arctic seas comes from European
Figure 20 shows the causal chain diagram for oil spills in the Kara Sea
and Asian countries as well as the US as a result of transboundary air and
sub-system.
water fl ows. The annual amount of sulphur and nitric oxides transported
to the Arctic from Europe amounts more than 400 000 tonnes, and from
Environmental and socio-economic impacts
Siberia, the Far East, Kazakhstan, China and Middle Asian countries, the
The exploitation of oil fi elds in the Kara Sea sub-system and the
amount is estimated to be as much as to 230 000 tonnes (Barsegov
transport of this oil, whether by boat or pipeline, have increased
CAUSAL CHAIN ANALYSIS
57
Issues
Immediate causes
Sectors/Activities
Root causes
Growing risk of spills
Oil spills
Oil production
Governance
around drilling sites
Growing risk of spills
Sea and inland water
Technology
during transport
transport
Economic
Legal
Lack of education and
knowledge
Public control
Figure 20 Causal chain diagram illustrating the causal links for oil spills in Kara Sea.
the risk of oil spills, which are harmful for marine communities
The increasing risk of oil spills near and around drilling sites as well
and organisms. The larger spills result in injury and death of birds
as occasional and permanent leaks from ground-based (near-shore)
and mammals in the vicinity of the spill (Borisov et al. 2001). The
and undersea oil fi elds ;
microbiological population changes both in number and genetic
The increasing risk of spills during transportation such as pipeline
characteristics as a result of oil spill pollution. Furthermore,
accidents, occasional or deliberate release of dirty water, lubricating
bioaccumulation of hydrocarbons, and changes in behaviour of fi sh
fl uids and fuel from all kinds of transport into the sea and river ports
and benthic organisms occurs. Finally, the ecosystem's functioning
and when transporting cargo along the Northern Sea Route NSR,
is disturbed.
accidents with cargo vessels (tankers) and equipment.
The high concentration of petroleum products in the region's waters
The intense development of oil fi elds in the Kara Sea sub-system began
destroys the quality of river and lake fi sh, and can aff ect berries and
in the early 1970s. Until recently, oil wells have been land-based, and
mushrooms (Yevseev 1996). Because lands have been expropriated
the oil is mainly transported via pipelines. Oil spills often occur during
for industrial uses and are tainted by pollution, the rural population
drilling, which results in soil pollution of soil and ultimately rivers and
has lost not only its pastures but also hunting lands and fi shing
lakes. The peak extraction levels were reached by the end of 1980s. From
sites, as well as territories where wild berries and mushrooms can be
1992-2000 extraction decreased by about 1.5 times. During the same
gathered. The indigenous population must therefore abandon their
period transport along the NSR dropped nearly to zero; the number of
traditional lifestyles and places of residence. About 25-35% of the
sea transporting vessels in the Arctic decreased by fi ve times, while the
area's indigenous population traditionally survived due to gathering
number of trips decreased two-fold. Researchers have noted that the
wild berries and mushrooms. The generally unprofi table nature of
drop in oil production has led to an improvement in water quality in
traditional trades worsens the unemployment problem. Oil pollution
Siberian rivers and restoration of fi sh stocks (Anon. 2000).
is also attributed with the higher-than-average levels of morbidity and
mortality in the population. The mortality rate from diff erent diseases
But the goal of the "Energy strategy for Russia until 2020" from the
in the Russian Arctic region is signifi cantly higher than the Russian
Russian Federal Council (2002) is for an increase oil extraction, including
average. Additionally, the mortality of indigenous population exceeds
drilling on Arctic continental shelf. The plan also calls for a growth in
the mortality of newer arrivals to the region.
sea and river transportation, particularly for oil transport, which makes
the threat of oil spills more real. Diff erent statistical sources report
Immediate causes
that an average of 130-160 tonnes is lost for every million tonnes of
Several kinds of oil pollution disturb the Kara Sea sub-system, divided
oil transported (Borisov et al. 2001). The energy strategy also calls for
into two main immediate causes:
increases in the level of oil extraction in the Kara Sea sub-system to 40-
58
GIWA REGIONAL ASSESSMENT 1A RUSSIAN ARCTIC
50 million tonnes in 20 years. This means as much as 8 000 tonnes of
A similar situation exists with respect to transport services, which have
oil could be lost in transport, or an amount that is equivalent to what
been transferred to private ship-owners, who are not interested in
could be lost in a large tanker accident. But unlike a tanker accident,
modernising their aging fl eets. This increases the threat of oil spills.
these spills will occur over a long period and will be spread along the
There is no single Arctic policy designed to solve the problems
vast area of the Arctic seas. In sum, the main pollution threat to the
posed by the use of the Northern Sea Route (NSR). Such a policy was
Kara Sea sub-systems from the oil industry and associated sea and river
implemented under the planned economy but currently the state does
transportation.
nothing to support the NSR, even though it is a very signifi cant route
for the Russian Arctic.
Root causes
Economy
Technology
Failures in market reforms
Many oil companies use outdated equipment and technologies
The shock of the transition from a centralised state system to liberal
(pipelines in particular). The diff erent Russian Arctic emergency services
market relations in Russia in 1992 hampered the creation of sustainable
are equipped with the equipment to clean up relatively small oil spills
market structures in the oil industry. The economic crisis caused by
(up to 500 tonnes) not far from the Arctic coastline. However, these
failures during this transition period sharply decreased the levels of
organisations are unable to cope with large-scale oil spills in remote ice
both oil extraction and tax incomes at. As a result, fi nancing for social
covered Arctic seas (Patin 2001).
and environmental needs was greatly decreased. The export-oriented
Russian economy is sometimes perceived as the main reason for the
Governance
press to increase in oil and gas exploitation and transportation in the
The sustainable development of the Arctic is impossible without reliable
Arctic seas without an adequate attention to ecological safety. As a
data, including the monitoring of natural systems, hydrometeorological
result, the risk of accidents and oil spills may increase (Barsegov et al.
conditions and ecological situations. An arctic monitoring network
2000, Lvov 2002).
must include stationary research stations and other structures, research
vessels and satellites for remote monitoring. However in the 1990s,
Corruption
fi nancing for the environmental monitoring network in the Kara Sea
Even though it has been over 10 years since the introduction of market
sub-system was severely cut back. Air quality observations were cut
reforms, there still is no eff ective state regulation of the monopolies
by nearly fi ve-fold, and the sea hydrometeorological network was cut
that exploit publicly owned oil, coal and mineral fi elds. The profi ts from
by more than 30%. This reduced the quality of the forecasts for storm
these privately owned companies, which are estimated to be in the
and ice conditions, ship-icing and consequently increased the risk of
trillions of US dollars, are hidden from taxation, and company owners
dangerous situations, including oil spills (Andreev 2001). New owners
profi ted greatly. The magnitude of these profi ts was evident even in the
of oil and transport companies that cause oil spills are not forced by the
earliest years of market reforms when a huge disparity in incomes was
government to follow the ecological legislation and regulations or to
common. This situation jeopardises for sustainable development. More
pay compensation for the damage done to the environment (Barsegov
than half of Russia's population had to struggle to survive. The natural
et al. 2000).
resources extraction sector became highly corrupt (Lvov 2002).
Public control
Domination of corporate control over strategic problems
The public has insuffi
cient control over the environmental impacts from
Most of the Russian oil companies allow short-term profi ts to
the level of activity of oil extraction and transport companies. The local
dominate over the long-term ones. These companies do not put
population has little or no control or infl uence over the conditions and
suffi
cient investments into the kinds of infrastructure that allow for
restrictions on new oil fi eld development.
clean oil extraction and transportation, nor do they fund environment
protection measures, such as information centres, emergency
Lack of knowledge and education
services, and monitoring systems. The absence of a long-range well-
The local population, particularly the rural and indigenous populations,
coordinated plan for the development of petroleum production in the
does not have enough information about existing environmental
Russian Arctic prevents oil companies from investing in programmes
protection legislation and the principles of sustainable development
for environmental protection. Instead, when the oil wells run dry, oil
as described in Agenda 21. Gaining access to this information is also
companies leave nothing but destroyed ecosystems and social crises.
diffi
cult. Tanker transportation in Arctic conditions entails a complex
CAUSAL CHAIN ANALYSIS
59
of natural factors (polar night, seasonal ice, frequent storms). All this
threats to the environment also threaten the well-being of indigenous
presupposes special knowledge and skills on the part of the crew. With
minorities. Because the Arctic environment is extremely vulnerable, the
the decrease of cargo traffi
c along the NSR, the lack of experience in
capacity of the environment to absorb or withstand the negative eff ects
large-tonnage tanker navigation in Arctic conditions is more and more
of pollution must be taken into account during oil and gas production.
evident (Andreev 2001).
However, until now, the Russian government has not adopted a long-
range state strategy to allow the transition of the Russian Arctic region
Legal
to sustainable development, even though the main components of
Recently, a series of legislative acts, presidential decrees and long-term
such a strategy have already been created by the Council of Productive
governmental programmes has been enacted to regulate the socio-
Forces Relocation (Andreev 2001).
economic and environmental situation in the Arctic and the Russian
North (see Annexes III and IV). But these eff orts are insuffi
cient in terms
As rapid industrial development is predicted for the region, the
of sustainable development in the Arctic because there is no agreed-
adoption of this strategy should be given priority. The existence of the
upon approach to sustainable development for the region. It testifi es
strategy demonstrates that the Russian government has the ability to
to absence ot system approach of the legislative base of the Russian
meet the sustainable development goals set by Agenda 21 and other
legislation conformably to Arctic from the point of the sustainable
international targets agreed to at the United Nations Conference on
development (Andreev 2001). Environmental Impact Assessments (EIA)
Environment and Development (UNCED) in Rio de Janeiro 1992 and
procedures for providing emergency clean-up equipment for complex
World Summit on Sustainable Development (WSSD) in Johannesburg
oil and gas installations are not common practice in Russia.
2002. Nonetheless, Arctic countries must also participate in defi ning
a strategy for Arctic sustainable development given the fragile
ecosystems and unique cultural heritage. Russia has in principle
declared support for the concept idea of sustainable development in
Conclusion
decrees from the president and the government (see Annex IV). At the
same time the living conditions in Arctic are so extraordinary, that the
Sustainable development in the Arctic will require the balanced
practical realisation of sustainable development will require not only
coordination of economic, social and ecological aspects of
special national programs, but international eff orts.
development, with an emphasis on human welfare, particularly because
60
GIWA REGIONAL ASSESSMENT 1A RUSSIAN ARCTIC
Policy options
This section aims to identify feasible policy options that target
of exploitive consumption of natural capital; (iii) changes in the way of
key components identifi ed in the Causal chain analysis in order to
life and culture of indigenous peoples; and (iv) decrease in social safety
minimise future impacts on the transboundary aquatic environment.
nets, standards of education and life spans. At the same time, corruption,
Recommended policy options were identifi ed through a pragmatic
crime rates and other social problems have increased. During the 1990s,
process that evaluated a wide range of potential policy options
the total pollution load to the water bodies decreased in Russia as a
proposed by regional experts and key political actors according
result of economic slowdowns and production setbacks. In spite of
to a number of criteria that were appropriate for the institutional
this, ecological systems have tended to continue to degrade, partly as
context, such as political and social acceptability, costs and benefi ts
a result of the accumulation of pollutants from earlier activities. All of
and capacity for implementation. The policy options presented in
these facts are evidence of unsustainable development inthe Russian
the report require additional detailed analysis that is beyond the
Arctic region and demonstrate that socio-economic and ecological
scope of the GIWA and, as a consequence, they are not formal
problems in the northern Russia are interrelated. These problems
recommendations to governments but rather contributions to
cannot be solved using the principle of "patching holes". Solving these
broader policy processes in the region.
problems will require a comprehensive approach at the national level,
as well international cooperation for the control of transboundary
atmospheric and water pollution.
In Russia, a long-term federal programme for sustainable development
Definition of the problem
of the Arctic region is still not accepted, although the concepts for
this approach has been worked out and used for the substantiation
The previous causal chain analysis identifi ed the most signifi cant
of Russian Arctic policy (Andreev 2001). There is a huge threat to
immediate causes, sectors and root causes of problems in the region.
the region's economic and environmental stability by powerful
According to the results of the Assessment and Causal chain analysis,
monopolies. These monopolies, as Russian President Vladimir Putin
the following priority issues have been chosen for the Policy option
has said "have become a hostile enclave that doesn't follow common
analysis:
rules and laws" (Putin 2004 ). The monopolies evade taxes, exploit and
Chemical
pollution
undervalue natural capital and thereby undermine the fi nancial basis
Oil
spills
of the nature conservation eff orts (Barsegov et al. 2000, Gaff ney et al.
Modifi
cation
of
ecosystems
2000, Lvov 2002).
The Causal chain analysis showed that the root causes of the three
The concept of sustainable development has not taken shape as
issues are quite similar. Therefore a single Policy option analysis can
concrete international programmes and projects in the Arctic region.
be carried out for all three issues combined. The completed analysis
There is an absence of indicators of sustainable development that can
showed that the threats from these issues are evident in: (i) the rapid
be used in common in all Arctic countries. These indicators should be
degradation of fragile Arctic ecosystems; (ii) the increase in the scale
aimed at limiting human impact.
POLICY OPTIONS
61
Political and organisational
for the socio-economic development of the Russian Arctic are being
framework
better enforced. In 2002, the Russian government approved "The
general requirements for the development of plans on prevention
The design of solutions for these problems has as its underlying principle
and elimination of oil-spill accidents" for the prevention of oil spills and
the protection of the rights of the small indigenous populations and
passed "Urgent measures to minimise the risk of oil-spill accidents",
strengthening their role in achieving sustainable development, as has
Nr. 240 from 15.02.2002) as a resolution (see Annex VI).
been identifi ed as an international priority (for example, Agenda 21,
rt III, §26). One of the principal aims of the national and international
Arctic people have seen an increase in incomes and industry is being
policies of the Arctic region's governments should be the harmonisation
restored, and with this, additional tax revenue and growth of spending
of the relationship between people and nature by matching the scopes
on environmental protection can be expected. In July-August 2004 (for
of industrial development with the capacity of natural ecosystems and
the fi rst time since the beginning of 1990s) the Russian government has
improving of the quality of life of the indigenous population. To achieve
declared its intention to support Arctic research expeditions, to rebuild
this, local policy should not be administratively isolated, but should
the hydrometeorological network for monitoring the state of the Arctic
draw on the transboundary consolidation of eff orts and cooperation
environment, and to assist in the development of the northern shipping
between the ethnically-related native populations.
route. The government projects are to shift from annual planning to
short-term (3-5 years) to long-range (10-20 years) forecasting. Long-
The legal basis for the various policy options should be the declarations
range industrial development planning for the Arctic is now being
of the World Summits on Sustainable Development held in Rio de
carried out in the context of the Russian World Ocean Programme. Since
Janeiro 1992 and in Johannesburg 2002. The main principles from
2004, the government has indirectly begun to support diff erent patterns
other International conventions and Russian environmental protection
of business ownership businessmen. These measures emphasise the
legislation and sustainable development should also be used. One of the
need to modernise the transport infrastructure in respect to ecological
main legislative reasons behind the eff ort to improve the environmental
safety (ports, water routes, hydrographs, ice-breakers, navigational aids,
situation in the Russian sector of the Arctic is the Russian Federation
qualifi ed personnel, and scientifi c study of the Arctic region) and the
Constitution, which guarantees a right to a healthy environment and
need for enhanced control of environmental conditions.
access to reliable information about its condition (asset 42). A list of
international conventions, russian federal laws and other federal acts is
Targets and measures aimed at reducing the negative impacts of
provided in Annexes III and IV.
chemical pollution, oil spills and the modifi cation of ecosystems in
Russian Arctic seas have been crafted according to the document
After enduring a setback in industrial production in the Russian Arctic
entitled "Major directions of transition of Russian Arctic Zone to
in the 1990s, there has now been a resumption of industrial production
sustainable development". This document was prepared by the Council
since 2000. Future forecasts predict an increase in the production of
for Industrial Forces Relocation under the Russian Federation's Ministry
hydrocarbon and other mineral resources for the period to 2020
of Economic Development and Trade and the Russian Academy of
(Andreev 2001). In this context, clean-up and control eff orts should be
Sciences (Andreev 2001). Its practical realisation will help eliminate
aimed at the gradual reduction of existing pollution levels as well as the
the root causes of chemical pollution, oil spills and the modifi cation of
gradual rehabilitation of natural ecosystems, along with an increase in
ecosystems in Russian Arctic region.
the quality of life of the native populations. During the reforms some
decrease in the anthropogenic load on sea and freshwater ecosystems
The main goal of the Russian Arctic region's stated environmental
in the Russian Arctic region has been observed. It is necessary not
improvement policy is the creation of proper conditions for preserving
only to preserve this improvement but also to make certain the trend
the critical functions of the biosphere and sustainable development
continues.
based on the balance between socio-economic growth and the
capacity of natural ecosystems. Other goals of this policy are:
Current Russian legislation contains the legal basis for the ownership,
That all administrative decisions in the Russian Arctic region
use and administration of lands and other natural resources by minority
be made according to the environmental capacity of natural
indigenous populations, and also forms the basis for future socio-
systems;
economic development and environmental preservation. Since 2000,
The refi nement of federal and regional environmental protection
the Russian economy is becoming more stable and federal programmes
legislation, ecological criteria and standards;
62
GIWA REGIONAL ASSESSMENT 1A RUSSIAN ARCTIC
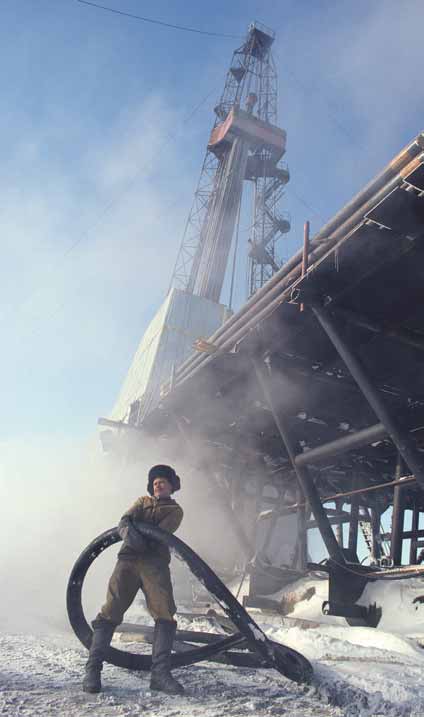
The strict legislative enforcement of the mutual responsibility of
federal, regional and local governments to protect the environment
in the region;
The combination of administrative and economic methods to
prevent environmental degradation and pollution;
The creation of a scientifi c basis for the sustainable development
of Arctic ecosystems;
Eff ective participation in international cooperative eff orts to
incorporate principles of sustainable development in the Arctic
zone, regional, transboundary and global.
Construction of policy options
The following policy options are based on previously described
root causes and existing conditions. The policy measures that can
eliminate the threats to Arctic waters are listed below. The measures
are presented from the perspective of fundamental causes: economic,
technological, governance, public control, education and knowledge,
and legal or political improvements. At the same time it is necessary
to note that elimination of economic and legislative defi ciencies is a
priority because implementing sustainable development in the region
depends on them. To fi nance the elimination of the technological
and other fundamental causes of chemical pollution, oil spills and
modifi cation of ecosystems, to solve the social problems of the
indigenous population and to increase their role in decision-making
for environmental management, to extirpate corruption, to improve the
supply of information, and to fi nance nature conservation measures, the
following policy options are recommended.
Option 1: Economy actions
Figure 21 Gas drilling on the Yamal Peninsula.
In order to decrease the pollution and modifi cation of ecosystems the
(Photo: Arcticphoto)
following economic actions are suggested:
In the sphere of resource exploitation:
- Transition from short-term to long-range forecasts for
- Reformation and development the regional system of
economic development, taking into account the need for
accounting and monetary valuation of natural resources, and
natural systems to recover from their current degraded state,
the development of a system to limit and license consumptive
and recognising the need to improve the quality of life for
resource use on the basis of natural resources cadastres,
indigenous populations.
- Gradual reformation of the local and regional taxation system
with the goal of increasing the share of natural resource
In the sphere of environmental protection:
payments into appropriate budgets,
- Identifi cation of ecological capacity of the Russian Arctic region
- Improvement of economic and fi nancial mechanisms for
according to regional ecological and economic realities,
sustainable natural resources, economic encouragement for
- Development of methods of the economic assessment of
the eff ective use of natural resources, development of a labour
negative ecological impacts according to conditions in the
and service market in the sector of resource use,
region,
POLICY OPTIONS
63
- Improvement of economic and fi nancial mechanisms for
In the sphere of improving monitoring and information:
environmental protection,
- Restoration and modernisation of an observation network
- Creation of the mechanism for insurance, the liquidation
in the Russian sector of Arctic based on the principles of
of ecologically dangerous industries and requirements for
sustainable development;
the payment of compensation for environmentally harmful
- Creation of a national information network, integrated into a
activity,
uniform world information system of oceans;
- Improvement of economic stimulation of activity that protects
- Development and implementation of eff ective administrative
natural resources,
systems to control environmental protection programmes at
- Development of a service market for environmental protection.
various industries;
- Development of systems of territorial ecological control and
Option 2: Technology actions
environmental monitoring including industrial ecological
In order to improve existing technology the following actions are
monitoring;
suggested:
- Maintenance of ecological information by all interested
Development of new methods and technologies in the sphere
administrative and public organisations.
of protection, reproduction and rational use of natural resources;
the stimulation of use of energy and resource conservative
In the sphere of rehabilitation of ecologically damaged territories,
technologies (for example, use of wind power or biomass energy
the concrete measures in this sphere could be the following:
from wood wastes accumulated at timber and lumber companies
- Establish the location of zones of ecological instability and
in Siberia) as well as growth of natural resources reuse and level of
ecological disasters and rehabilitate them;
waste recycling;
- In areas of oil and gas extraction, mining, non-ferrous
Modernisation of the Northern Sea Route transport infrastructure
metallurgy and other dangerous industries, provide site clean-
(ports, icebreaking and other fl eet in recognition of Arctic ice
up and aid to aff ected populations;
conditions);
- Restore degraded elements in the sea, biological resources,
Modernisation of oil and gas production technologies to improve
coastal ecosystems;
pollution prevention, with a priority on the enterprises that pollute
- Tally and safely store environmentally harmful weapons and
the most in the Russian Arctic Zone as listed in Annex VII;
ammunition;
Restoration of a local transport infrastructure, including air routes.
- Increase activity designed to protect the biological diversity
of Arctic ecosystems and landscapes; develop a network of
Option 3: Governance actions
protected natural territories and areas with unique natural
The following governance actions are suggested:
resources and features; and expand zones where resource
In the sphere of improving long-term forecasting using the
exploitation is limited.
principles of sustainable development and a gradual transition to
economic development that is based on these principles:
In the sphere of protecting human health, measures aimed to
- Elaboration of and acceptance at a governmental level of a
prevent or reduce the eff ects of pollution on the health of the
strategy and programmes for sustainable development for
population should provide:
the Russian Arctic region;
- Regulation of drinking water quality at standards protective of
- Creation of ecological and economical zoning along the
human health;
coasts of the Arctic seas and strict regulation of industry and
- Regulate air quality at standards protective of human
commercial activities to protect the environment;
health;
- Financial and methodical support for local initiatives
- Provision of safe healthful food;
and programmes based on the principles of sustainable
- Reduction of the negative impact of contaminated soils;
development;
- Provision
of
environmentally
healthful
communities;
- Perfection of a system of governance for the administration of
- Protection of the population from radiation;
natural resource use in the region;
- Regulation of working conditions at standards protective of
- Coordination of all the activities in the region based on the
human health.
demands of environmental protection and sustainability.
64
GIWA REGIONAL ASSESSMENT 1A RUSSIAN ARCTIC
To achieve the goals listed above and in accordance with Russia's
State support for social and ecological programmes and projects
responsibilities as stated by the Helsinki Declaration on Environment
to protect the health of the population in the Arctic region;
and Health Protection, a regional plan for the Russian Arctic region
Legislative support for the traditional use of natural resources by
regarding human health and the environment is needed.
indigenous populations;
Legislative protection for the rights of the indigenous population,
Option 4: Public control actions
based on the concept of sustainable development, and with help
Actions to improve public control are fi nancial, methodological and
in organising groups for monitoring and the provision of access to
legal support from diff erent levels of authorities, non-governmental
ecological information;
and other public organisations in establishing local control over the
Regulation of transportation in the region;
ecological situation in the region, i.e. help in organising the public
State
support
for
local
self-suffi
ciency (territorial self-management,
oversight groups, and opening ecological information to the public.
and help for local budgets).
Evaluation of foreign experience to determine how best to protect
Option 5: Education and knowledge actions
the indigenous population.
Actions to improve access to education and knowledge:
Creation of a system to educate indigenous and migrant
Moreover, actions on the international level are needed. Policy options
populations about the environment, develop an ecological culture
at the international level are: development of a single strategic
and ideology with priority given to minority indigenous peoples;
approach for sustainable development, so that Arctic countries can
Creation of and support for regional state structures and public
have a common, integrated strategy for management and protection of
institutes that oversee environmental protection;
Arctic resources, and development of a forum or mechanism so that the
Disseminate credible and timely information about environmental
populations of all Arctic Ocean coastal countries can discuss common
conditions via the mass media;
actions that will achieve a transition to sustainable development.
Secure free access to environmental information for citizens and
corporations; provide access to experts from the Russian Naval Fleet
about Arctic conditions;
Provide support for regional and global public environmental
Performance of policy options
movements and attract non-governmental organisations to
analyse and formulate solutions for the unique environmental
The performance of the policy options is evaluated as to their
problems of the Russian Arctic;
eff ectiveness, effi
ciency, equity, political feasibility and ability to be
State support for scientifi c research to create the scientifi c basis for
implemented.
sustainable development of the Arctic, along with the development
of sustainable development indicators.
Effectiveness
The policy options can be highly eff ective in solving the problems of
Option 6: Legal and political actions
pollution and modifi cation of water ecosystem in the Arctic region,
Adoption of legislation to implement a strategy for sustainable
and will help the region's economies move toward sustainable
development in the Arctic;
development.
Creation of a regulatory and legal basis for making administrative
decisions in the Russian Arctic region according to ecological
Efficiency
capacity of natural systems;
The likelihood of accomplishing goals depends on following aspects:
Toughening requirements so that industries operate in a clean,
The Russian government's adoption of the strategy and the
responsible manner in the Arctic region and a shut-down of
programme of sustainable development of the Arctic region and
illegal, polluting industries responsibility for faces accepting
the subsequent implementation of the programme measures;
solution on accommodation industrial production in the Arctic
Survey sources of stable fi nancing for the environmental and socio-
region and supposing unlawful operations in the sphere of nature
economic problems that have been identifi ed in this analysis. This
exploitation;
approach is linked with the solution of another highly complex
Creation (with participation of military experts) of measures to
problem, the elimination of corruption and implementation of
reduce the impact of military activity on the environment;
requirements that the oil and gas industry pay appropriate taxes;
POLICY OPTIONS
65
Raise the level of awareness in the population regarding principles
limit the action of business lobbying groups to carry out this policy.
of sustainable development;
In parallel with this, the infl uence of the public sector should be
Create a system for the eff ective public oversight of environmental
strengthened to make this policy feasible. To carry out this measure,
pollution and industrial activities.
governments must be supported by company owners, especially in
the oil and gas production.
Equity
The responsibility for environmental degradation will be linked to the
Implementation capacity
obligation to pay for the rehabilitation of the environment or to alter
The proposed policy options are required to improve the region's
production techniques (or cease them).
economy and to create a modern monitoring system in the Arctic.
Support for or opposition to this approach will entirely depend upon
Political feasibility
how environmental education is carried out.
Non-polluting producers as well as the population in general will
support the proposed policy options. However, it will be necessary to
66
GIWA REGIONAL ASSESSMENT 1A RUSSIAN ARCTIC
Conclusions and recommendations
The GIWA region Russian Arctic extends from Novaya Zemblya on its
economic and ecological programs for development of the Arctic
western boundary to the Mys Dezhneva (East Cape) on the eastern one.
region;
As a result of human activities such as industrial, urban and agriculture,
Deepening of market mechanisms and stabilisation of the
pollutants enter the Arctic seas via river run-off from the large river
economic situation to create a sustainable fi nancial basis for solving
basins situated in the region. Harmful persistent pollutants are also
ecological and social problems;
transferred via long-range atmospheric transportation from western
Development of a single strategic approach for sustainable
Europe and the East.
development, so that Arctic countries can have a common, integrated
strategy for management and protection of Arctic resources;
The assessment, as carried out in accordance with the GIWA
methodology, has identifi ed pollution, mainly from chemicals and oil
In the long-term, priority should be given to:
spills, and habitat and community modifi cation of neritic, lagoon and
Sequential implementation of the strategy of sustainable
estuarine systems as the most important concerns for the Russian Arctic
development;
region. The analysis of the level of impact of these GIWA issues in the
Deepening of international coordination in terms of Arctic
Kara, Laptev, East Siberian and Chukchi seas showed that the problems
ecosystem conservation and recreation.
are more signifi cant in the Kara Sea sub-system. Therefore, the Causal
chain and Policy options analysis focused on identifying the root causes
The stabilisation of the Russian economy after 2000 and the increase in
of the problems in the Kara Sea sub-system, and evaluated possible
interest in the problems of Arctic by the government allow hope that
options to mitigate them.
the ecological and social situations in Russian Arctic region will improve
in the next two decades. The measures proposed can be eff ective
Successful implementation of the policy options discussed in this
provided the relevant political measures are taken. Political measures
report can be only be provided based on the principles of sustainable
should also be directed against corruption, taxes on the oil and natural
development. In the short term, priority should be given to:
gas industry profi ts will create the fi nancial assets needed to solve the
Beginning the work to create a strategy for sustainable development
environmental and socio-economic problems in the region.
in the Russian Arctic and in legislation as well as in long-term socio-
CONCLUSIONS AND RECOMMENDATIONS
67
References
AMAP (1997). Arctic Pollution Issues: A State of the Arctic Environment
Bidleman T.F., Jantunen, L.M., Falconer, R.L., Barrie, L.A. and Fellin, P.
Report. Arctic Monitoring and Assessment Program. Oslo, Norway.
(1995). Decline of hexachlorocyclohexanes in the arctic atmosphere
AMAP (1998). Arctic Pollution Issues. Wilson, S.J., Murray J.L. and
and reversal of the air-water gas exchange. Geophysical Research
Huntington, H.P. (eds.) Arctic Monitoring and Assessment
Letters 22(3):219-222.
Programme, Oslo, Norway.
Björn, L.O., Callagan, T.V., Gehrke, C., Gwynn-Jones, D., Holmgren, B.,
(2002). Arctic Pollution 2002. Arctic Monitoring and Assessment
Johanson, U. and Sonesson, M. (1997). Eff ects of enhanced UV-
Programme, 2002. Oslo, Norway.
B radiation on sub-Arctic vegetation. p 241-253 In: Woodin, S.J.
Andreev, J. (2001). The Russian Arctic. Drofa Press, Moscow. (In Russian).
and Marquiss M. (eds.) Ecology of Arctic Environments. Blackwell
Anisimov, O.A. and Poljakov, V.Y. (1999). Predicting changes of the air
Science, Oxford, United Kingdom.
temperature in the fi rst quarter of the 21st century. Meteorology
Björn, L.O., Callagan, T.V., Gehrke, C., Gwynn-Jones, D., Lee, J.A., Johanson,
and Hydrology 2:25-31. (In Russian).
U., Sonesson, M. and Buck, N.D. (1999). Eff ects of ozone depletion
Anon. (1998). Major directions of economical and social development
and increased ultraviolet-B radiation on northern vegetation. Polar
of Siberia for the period by 2002. Moscow-Novosibirsk .
Research 18:331-337.
Anon. (2000). Current state of fi sh industry on inland reservoirs of Russia.
Borisov, V.M, Osetrova, N.V., Ponomarenko, V.P., Semenov, V.N. and
St.-Petersburg. (In Russian).
Sochenev, O. (2001). Infl uence of development of marine deposits
Are, F.E. (1999). The role of coastal retreat for sedimentation in the Laptev
of oil and gas on bioresources of the Barents Sea. Moscow, Russian
Sea. p 287-295 In: Kassens, H., Bauch, H.A., Dmitrenko, I., Eicken, H.,
Federation.
Hubberten, H.-W., Melles, M., Thiede, J. and Timokhov, L. (eds.)
Burova, L.P. (1992). About washing the contaminants out of the
Land-Ocean Systems in the Siberian Arctic: Dynamics and History.
atmosphere. Meteorology & Hydrology 9:49-58. (in Russian).
Springer-Verlag, Berlin, Germany.
Callaghan, T.V., Körner, C., Lee, S.E. and Cornelison, J.H.C. (1998). Part 1:
Barsegov, I.G., Solovev, M.N., Tikhomirov, S.N., Mogilevskii, I.M., Lifshits,
scenarios for ecosystem responses to global change. p 11-63 In:
V.M., Korzun, V.A., Zhukova, G.N., Nikitina, E.N. and Dolmatova, S.A.
Global Change in Europe's Cold Regions. Heal, O.W., Callaghan,
(2000). The Arctic; Russian interests and international conditions of
T.V., Cornelissen, J.H.C., Körner, C. and Lee, S.E. (eds.) European
their realisation. Moscow, Russian Federation.
Commission Ecosystems Research Report, 27, Luxembourg.
Beamish, R.J. (1995). Response of anadromous fi sh to climate change in
Chernyak, S.M., Rice, C.P. and McConnell, L.L. (1996). Evidence of
the North Pacifi c. p 123-136 In: Peterson, D.L. and Johnson, D.R. (eds)
currently-used pesticides in air, ice, fog, seawater and surface
Human Ecology and Climate Change. Taylor & Francis, Washington,
microlayer in the Bering and Chukchi seas. Marine Pollution Bulletin
DC, USA.
32(5):410-419.
Bernes, C. (1996). The Nordic Arctic Environment: Unspoilt, Exploited,
Croasdale, K.R. (1993). Climate change impacts on northern off shore
Polluted? The Nordic Council of Ministers, Copenhagen, Denmark.
petroleum operation. p 175-184 In: Wall, G. (ed.) Impacts of Climate
BESIS (1999). The Impacts of Global Climate Change in the Arctic Regions:
Change on Resource Management in the North. Occasional
An Initial Assessment. Bering Sea Impact Study, International Arctic
Paper No. 16, Department of Geography, University of Waterloo,
Science Committee, Oslo, Norway.
Canada.
68
GIWA REGIONAL ASSESSMENT 1A RUSSIAN ARCTIC
Devisov, V.V. (2002). Ecological and geographical fundamentals of
GOIN (1996c). Annual of marine water quality with respect to
sustainable nature management in the shelf seas (ecological
hydrochemical indices for 1994. Obninsk. State Oceanographic
geography of the sea). Apatiti.
Institute, Obninsk. (In Russian).
ESRI (1996). ArcAtlas: our Earth. Temperature . Environmental Systems
GOIN (1996d). Annual of marine water quality with respect to
Research Institute Inc. Redland, California, USA.
hydrochemical indices for 1995. Obninsk. State Oceanographic
Forbes, D.L. and Taylor, R.B. (1994). Ice in the shore zone and the
Institute, Obninsk. (In Russian).
geomorphology of cold coasts. Progress in Physical Geography
Goskomstat (2002). Russian statistical yearbook. Moscow. (In Russian).
18:59-89.
Granberg, I.S., Laverov, N.P and Dodin, D.A. (eds.) (2000). Arctic at the
Freese, C.H. (2000). The Consumptive Use of Wild Species in the Arctic:
threshold of third millennium (resource potential and ecology
Challenges and Opportunities for Ecological Sustainability. Report
problems). Nauka, St. Petersburg, Russia.
submitted to World Wildlife Fund, Arctic Programme, Toronto,
Gunn, A. and Skogland, T. (1997). Responses of caribou and reindeer to
Ontario, Canada.
global warming. Ecological Studies 124:189-200.
Gaff ney, M., Harrison, F. and Titova, G. (2000). Behind coulisses of
Hinckley, D.A., Bidleman, T.F. and Rice, C.P. (1992). Long-range Transport
becoming of economic theories. From the theory to a corruption.
of Atmosphere Organochlorine Pollutants and Air-Sea Exchange
Saint-Petersburg: complex.
of Hexachloro-cyclohexane. p 243-255 In: Nagel, P.A. (ed.) Results
Gallopin, G.C. (1997). Part one-introduction. In: Moldan, B, Billharz, S.,
of the Third Joint US-USSR Bering and Chukchi seas Expedition
and Matravers, R. (eds.) Sustainability Indicators: a report on the
(BERPAC), Summer 1988, US Fish and Wildlife Service, Washington,
project on Indicators of Sustainable Development, p 13-27. SCOPE
DC.
58. J. Wiley & Sons, New York, USA.
Igamberdiev, V.M. and Tereshnikov, O.M. (1994). Assessment of the
Gehrke, C., Johanson, U., Callaghan, T.V., Chadwick, D. and Robinson,
current environmental state: Norilsk industrial region. In: People's
C.H. (1995). The impact of enhanced ultraviolet-B radiation on litter
economy in Komi Republic, p 54-67. Syktyvkar, Russia. (in Russian).
quality and decomposition processes in Vaccinium leaves from the
IGCE (1996). Review of the ecological state of the seas of the Russian
Subarctic. Oikos 72:213-222.
Federation and some regions of the World Ocean for 1993-1995.
Gehrke, C., Johanson, U., Gwynn Jones, D., Björn, L.O., Callaghan, T.V.
Russian Institute of Global Climate & Ecology. (In Russian).
and Lee, J.A. (1996). Eff ects of enhanced ultraviolet B radiation on
IPCC (1996). Climate Change 1995: Impacts, Adaptations, and Mitigation
terrestrial sub-arctic ecosystems and implications for interactions
of Climate Change: Scientifi c-Technical Analyses. Contribution
with increased atmospheric CO . Ecological Bulletin 45:192-203.
of Working Group II to the Second Assessment Report of the
2
GESAMP (2001). A sea of troubles. GESAMP Reports and Studies, 70.
Intergovernmental Panel on Climate Change. Watson, R.T.,
IMO/FAO/UNESCO-IOC/WMO/WHO/IAEA/UN/UNEP Joint Group
Zinyowera, M.C. and Moss, R.H. (eds.). Cambridge University Press.
of Experts on the Scientifi c Aspects of the Marine Environmental
IPCC (2001). Climate Change 2001: Impacts, Adaptation and Vulnerability.
Protection, The Hague, Netherlands.
Contribution of Working Group II to the Third Assessment Report
Gidrometeoizdat (1992). Review of the ecological state of the seas of
of the Intergovernmental Panel on Climate Change. McCarthy,
the Russian Federation and same regions of the World Ocean for
J.J., Canziani, O.F., Leary, N.A., Dokken, D.J. and White, K.S. (eds.)
1991. (In Russian).
Cambridge University Press.
Gidrometeoizdat (1993). Review of the ecological state of the seas of
Izrael, Y.A., and Tsyban, A.V. (eds.) (2000). Dynamics of the Bering and
the Russian Federation and same regions of the World Ocean for
Chukchi seas ecosystems. Nauka publishing house, Moscow, Russia.
1992. (In Russian).
(in Russian).
GOIN (1992). Annual report on marine water quality with respect to
Izrael, Y.A., Tsyban, A.V., Shchuka, S.A. and Mosharov, S.A. (2002). World
hydrochemical indices for 1991. State Oceanographic Institute,
ocean ecosystem changes caused by anthropogenic impacts,
Obninsk. (In Russian).
including climate changes. Atmospheric and ocean physics. Vol.
GOIN (1996a). Annual of marine water quality with respect to
38, Suppl. 1. Izvestiya RAS.
hydrochemical indices for 1992. State Oceanographic Institute,
Izrael, Y.A., Vasilenko, N.V., Dlikman, I.F., Nazarov, I.M. and Fridman, Sh.D.
Obninsk. (In Russian).
(1992). The problem of environmental pollution by benzo(a)pyrene.
GOIN (1996b). Annual of marine water quality with respect to
Meteorology & Hydrology 9:36-48 (In Russian).
hydrochemical indices for 1993. Obninsk. State Oceanographic
Institute, Obninsk. (In Russian).
REFERENCES
69
Izrael, Y.A. and Tsyban, A.V. (eds.) (1992). Review of the ecological state
Mulvaney, K. (1998). Arctic voices: global warming is changing the
of the seas of the USSR and several regions of the world ocean for
traditional Eskimo environment. New Scientist 160(2160):55.
1990. Committee of Hydro-meteorology, Academy of Science of
Myagkov, S. (1995). Geography of natural risks. Moscow State Univiversity
the USSR, Institute of Global Climate and Ecology, St Petersburg
125-228. (In Russian).
(In Russian).
Nuttall, M. (1998). Protecting the Arctic: Indigenous Peoples and
Izrael, Y.A. and Tsyban, A.V. (1989). Anthropogenic ecology of the ocean.
Cultural Survival. Harwood Academic Publishers, Amsterdam, The
Gidrometeoizdat, Leningrad. (In Russian).
Netherlands.
Izrael, Y.A. and Tsyban, A.V. (eds.) (1990). Investigation of the Bering Sea
Oil and Capital (2001) Publication on oil and gas for the Russian and CIS
ecosystem. Issue 2. Gidrometeoizdat, Leningrad. (In Russian).
regions. 2001:2. (In Russian).
Izrael, Y.A. and Tsyban, A.V. (eds.) (1992). Investigation of the ecosystems
ORNL (2003). Landscan 2002. Oak Ridge National Laboratory. Retrieved
of the Bering and Chukchi seas. Issue 3. Gidrometeoizdat, St.
Nov. 2003 from http://www.ornl.gov/gist
Petersburg. (In Russian).
Ono, K.A. (1995). Eff ects of climate change on marine mammals in
Jantunen, L.M. and Bidleman, T.F. (1995). Reversal of the air-water gas
the far north. p 105-122 In: Peterson, D.L. and. Johnson, D.R (eds.)
exchange direction of hexachlorocyclohexanes in the Bering
Human Ecology and Climate Change. Taylor & Francis, Washington
and Chukchi seas: 1993 versus 1988. Environmental Science and
DC, USA.
Technology 29(4):1081-1089.
Patin, S.A. (2001). Oil and ecology of a continental shelf. Moscow: VNIRO.
Langdon, S.J. (1995). Increments, ranges and thresholds: human
(In Russian).
population responses to climate change in northern Alaska. p 139-
Peterson, D.L. and Johnson, D.R. (eds.) (1995). Human Ecology and
154 In: Peterson, D.L. and Johnson, D.R. (eds.) Human Ecology and
Climate Change. Taylor & Francis, Washington DC, USA.
Climate Change. Taylor & Francis, Washington, DC, USA.
Putin V. (2004) President's report to voters. Moscow State University,
Luzanskaya, D.I. (1970). Industrial fi shery in lakes, rivers and reservoirs of
12.02.2004. (In Russian).
USSR in 1959-1966. p 3-137 In: Proceedings of GosNIORCK, Vol.70.
Rees, W.G. and Williams, M. (1997). Satellite remote sensing of the
Leningrad.
impact of industrial pollution on tundra biodiversity. p 253-282 In:
Lvov, D.S. (2002). Economy of development. Moscow, Russia.
Crawford, R.M.M. (ed.) Disturbance and Recovery in Arctic Lands, An
Maxwell, B. (1997). Responding to Global Climate Change in Canada's
Ecological Perspective. Springer Verlag, Berlin, Germany.
Arctic. Volume II of the Canada Country Study: Climatic Impacts and
Regions of Russia. (2002). Socio-Economical Indices. Goskomstat of the
Adaptation. Environment Canada, Downsview, Ontario, Canada.
Russian Federation. (In Russian).
McGillivray, D.G., Agnew, T.A., McKay, G.A., Pilkington, G.R. and Hill, M.C.
Revich, B. (1994). Atmosphere pollution and northern cities population
(1993). Impacts of climatic change on the Beaufort sea-ice regime:
health. Narodnoe hozaistvo Respubliki Komi 1:83-87. (in Russian).
implications for the Arctic petroleum industry. Climate Change
Roshydromet (1996a). Annual of quality of surface water of the Russian
Digest CCD 93-01. Environment Canada, Downsview, Ontario,
Federation. VNIIGMI-MCD, Obninsk (In Russian).
Canada.
Roshydromet (1996b). Annual report on the state of the surface waters
MEPNR (1994). State of the environment of the Russian Federation fi n
in Russia (with respect to hydrobiological indices). VNIIGMI-MCD,
1993. State report. Ministry of the environmental protection and
Obninsk (In Russian).
natural resources of the Russian Federation. Moscow. (in Russian)
Roshydromet (1997). Review of the environmental pollution of the
Mikhailova, L.V. (1995). Chemical contamination - One of the main
Russian Federation for 1996. Roshydromet. (In Russian).
ecological problems of Ob-Irtysh region. Paths and means
Roshydromet (1998). Review of the environmental pollution of the
of reaching of balanced ecologic-economic development in
Russian Federation for 1997. Roshydromet. (In Russian).
petroleum regions of Western Siberia. Nijznevartovsk.
Roshydromet (1999). Review of the environmental pollution of the
Moldan, B. and Billharz, S. (1997). Introduction. p 1-6 In: Moldan, B,
Russian Federation for 1998. Roshydromet. (In Russian).
Billharz, S., and Matravers, R. (eds.) Sustainability Indicators: a report
Roshydromet (2000). Review of the environmental pollution of the
on the project on Indicators of Sustainable Development. SCOPE
Russian Federation for 1999. Roshydromet. (In Russian).
58. J. Wiley & Sons, New York, USA.
Roshydromet (2001). Review of the environmental pollution of the
Moritz, R.E. (ed.) (1990). Arctic System Science, Ocean-Atmosphere-Ice
Russian Federation for 2000. Roshydromet. (In Russian).
Interactions. Proceedings of the Lake Arrowhead Workshop, Joint
Roshydromet (2002). Review of the environmental pollution of the
Oceanographic Institutions.
Russian Federation for 2001. Roshydromet. (In Russian).
70
GIWA REGIONAL ASSESSMENT 1A RUSSIAN ARCTIC
Rovinskiy, F.Y. and Gromov, S.G. (1996). Sources and monitoring of trace
Vilcheck, G.E. and Tishkov, A.A. (1997). Usinsk oil spill: Environmental
metal in air and sediments of Russian Arctic. ACOPS.
catastrophe or routine event? In: Crawford, R.M.M. (ed.) Disturbance
Russian Federal Council (2002). Energetic strategy of Russia until 2020.
and Recovery in Arctic Lands, An Ecological Perspective. NATO-ASI
Problems and ways of Solution. Moscow, Federal Council of the RF
Series, No. 2, Environment, Vol. 25., p 411-420. J. Kluwer Academic
Federal Assembly, 18.10.2002.
Publishers, Dordrecht, The Netherlands.
Sabo, G. (1991). Long-Term Adaptations Among Arctic Hunter-Gatherers.
Vilchek, G., Krasovskaia, T. and Sumina, E. (1996). Problems of the Arctic
Garland Publishing, London, United Kingdom.
pollution. Ecological security of Russia. Proc. Mezvedomstvennaya
SB RF. (1995). Ecological Safety of Russia. Volume 1. Proceedings of
komissia po ecologi-cheskoi bezopasnosty. V.2:232-267. (In
the Inter-Agency Commission on Ecological Safety. October
Russian).
1993-July 1994. Security Council of the Russian Federation. Inter-
Warren, D.M., Slikkerveer, L.J. and Brokensha, D. (eds.) (1995). The Cultural
Agency Commission on Ecological Safety. Moscow: Yuridicheskaya
Dimension of Development: Indigenous Knowledge Systems.
Literatura.
Intermediate Technology Publications, London, United Kingdom.
Sklair, L. (1991). Sociology of the Global System. Harvester Wheatsheaf,
Watson, R.T., Zinyowera, M.C., Moss, R.H. and Dokken, D.J. (eds.) (1998).
London, United Kingdom.
The Regional Impacts of Climate Change. An Assessment of
Taalas, P. (1993). Factors aff ecting the behaviour of tropospheric and
Vulnerability. A Special Report of IPCC Working Group II for the
atmospheric ozone in the European Arctic and in Antarctica. Report
Intergovernmental Panel of Climate Change. Cambridge University
No. 10. Finnish Meteorological Institute Contributions, Finnish
Press, Cambridge, United Kingdom and New York, USA.
Meteorological Institute, Helsinki, Finland.
Weller, G. and Lange, M. (1999). Impacts of Global Climate Change in
Taalas, P., Damski, J., Korpela, A., Koskela, T., Kyro, E. and Braathen, G.
the Arctic Regions. International Arctic Science Committee, Center
(1995). Connections between atmospheric ozone, the climate
for Global Change and Arctic System Research, University of Alaska,
system and ultraviolet-B radiation in the Arctic. p 411-426 In: Wang,
Fairbanks, AK, USA, p. 1-59.
W.C. and Isaksen I.S.A. (eds.) Ozone as a climate gas, Vol. 32. NATO
Yevseev, A. and Krasovskaia, T.(1996a). Modern Subpolar geosystems
ASI Series. Springer-Verlag, Heidelberg, Germany.
of Russia (Ecological-geochemical problems). Smolensk 1:193-217.
Taalas, P., Damski, J., Kyro, E., Ginzburg, M. and Talamoni, G. (1997).
(in Russian).
The eff ect of stratospheric ozone variations on UV radiation and
Yevseev, A. and Krasovskaia, T. (1996b). Recreation resources assessment
on tropospheric ozone at high latitudes. Journal of Geophysical
of the Russian North. Smolensk 2: 5-19. (in Russian).
Research 102 Dl 1533-1539.
Yevseev, A. and Krasovskaia, T. (1996c). Optimisation of nature
Thompson, D.W.J. and Wallace, J.M. (2000). Annual modes in the
management structure in the strategy of sustainable development
extratropical circulation, part II: Trends. Journal of Climate 13:1018-
of the Russian North. Proc. International Conferance Lomonosov
1036.
and national heritage of Russia, Arhangel, 3:(1)26-29.
Tsyban, A.V. (1999). The BERPAC project: Development and overview of
Zalogin, B.S. and Kosarev, A.N. (1999). Seas. Mysl publishing, Moscow.
ecological investigations in the Bering and Chukchi seas. Dynamics
(In Russian).
of the Bering Sea. Loughlin, T.R., and K. Ohtani (eds.). University of
Zenkevich, L.A. (1977). Peculiarity of a biological state of Polar basin
Alaska Sea Grant, AK-SG-99-03, Fairbanks.
and our Northern seas. p 224-230 In: Selected transactions. v. 1.
Tsyban, A.V., Ivanitsa, V.A., Khudchenko, G.V. and Panov, G.V. (1992).
A biology of the Northern and Southern seas of the USSR. Nauka
Ecosystem investigation of the Bering and Chukchi seas. Leningrad,
Moscow. (In Russian).
Gidrometeoizdat. (In Russian).
Vedernikov, V.I., Demidov, A.B. and Sudbin, A.I. (1994). Primary
production and chlorophyll in the Kara Sea in September 1993.
Oceanology 34(5):693-703.
REFERENCES
71
Annexes
Annex I
List of contributing authors and organisations
Name
Institutional affiliation
Country
Field of work
Authors
Prof. Yury A. Izrael
Institute of Global Climate and Ecology of Roshydromet and RAS, Director, Academician of RAS
Russia
Global climate and ecology
Prof. Alla V. Tsyban
Institute of Global Climate and Ecology of Roshydromet and RAS, Deputy Director, Corresponding member or RAS
Russia
Global climate and ecology
Dr. Galina D. Titova
St. Petersburg Research Centre for Ecological Security of RAS,
Russia
Environmental economy
Dr. Sergey A. Shchuka
Institute of Global Climate and Ecology of Roshydromet and RAS
Russia
Marine biology
Dr. Vladimer V. Ranenko
Council on allocation of productive forces of Ministry of Economic Development and Trade and RAS, Center World ocean
Russia
Marine economics
Regional Task team
Prof. Yury A. Izrael
Institute of Global Climate and Ecology of Roshydromet and RAS
Russia
Global climate and ecology
Prof. Alla V. Tsyban
Institute of Global Climate and Ecology of Roshydromet and RAS
Russia
Global climate and ecology
Dr. Galina D. Titova
St. Petersburg Research Centre for Ecological Security of RAS
Russia
Environmental economy
Dr. Sergey A. Shchuka
Institute of Global Climate and Ecology of Roshydromet and RAS
Russia
Marine biology
Dr. Vladimer V. Ranenko
Council on allocation of productive forces of Ministry of Economic Development and Trade and RAS, Center World ocean
Russia
Marine economics
Dr. Thor S. Larsen
UNEP/GRID-Arendal
Norway
Marine biology
Dr. Vitaly A. Kimstach
Arctic Monitoring and Assessment Programme Secretariat (AMAP), Deputy Executive Secretary
Norway
Marine biology
Dr. Sergei M. Chernyak
USGS/ Great Lakes Science Center
USA
Marine biology
Dr. Yury L. Volodkovich
Institute of Global Climate and Ecology of Roshydromet and RAS
Russia
Marine biology
Dr. Tatiana I. Roskoshnaya
St. Petersburg Research Centre for Ecological Security of RAS
Russia
Environmental economy
Prof. Anatoly M. Nikanorov
Institute of Hydrochemistry of Roshydromet, Director, Corresponding member or RAS
Russia
Hydrochemistry
Prof. Stanislav A. Patin
All-Russian Institute of Fishery and Oceanography (VNIRO)
Russia
Ichthyology
Dr. Mikhail A. Zhukov
Ministry of Economic and Development, Director of All-Russian Scientific Coordinating Center North
Russia
Economics
Evgeny I. Soldatkin
Ministry of Economic Development and Trade, Deputy Head of the Section
Russia
Economics
Alexandr M. Ovanesyants
Roshydromet, Head of the Section
Russia
Climate and ecology
Dr. Valeriya M. Telesnina
Ministry of Economic and Development
Russia
Economics
Irina O. Umbrumyants
Institute of Global Climate and Ecology of Roshydromet and RAS
Russia
Marine biology
Dr. Tatiana A. Shchuka
Institute of Global Climate and Ecology of Roshydromet and RAS
Russia
Marine biology
72
GIWA REGIONAL ASSESSMENT 1A RUSSIAN ARCTIC
Annex II
Detailed scoring tables: Kara Sea
I: Freshwater shortage
II: Pollution
Weight
Weight
Environmental
Environmental
Environmental issues
Score
Weight
averaged
Environmental issues
Score
Weight
averaged
concern
concern
score
score
1. Modification of stream flow
0
N/a
Freshwater shortage
0
4. Microbiological
0
N/a
Pollution
2
2. Pollution of existing supplies
1
N/a
5. Eutrophication
0
N/a
3. Changes in the water table
0
N/a
6. Chemical
2
N/a
7. Suspended solids
0
N/a
Criteria for Economics impacts
Raw score
Score
Weight %
8. Solid wastes
1
N/a
Very small
Very large
Size of economic or public sectors affected
1
N/a
0 1 2 3
9. Thermal
0
N/a
Minimum
Severe
Degree of impact (cost, output changes etc.)
1
N/a
10. Radionuclides
1
N/a
0 1 2 3
Occasion/Short
Continuous
Frequency/Duration
1
11. Spills
2
N/a
0 1 2 3
Weight average score for Economic impacts
1
Criteria for Economics impacts
Raw score
Score
Weight %
Criteria for Health impacts
Raw score
Score
Weight %
Very small
Very large
Very small
Very large
Size of economic or public sectors affected
1
N/a
Number of people affected
1
N/a
0 1 2 3
0 1 2 3
Minimum
Severe
Minimum
Severe
Degree of impact (cost, output changes etc.)
1
N/a
Degree of severity
1
N/a
0 1 2 3
0 1 2 3
Occasion/Short
Continuous
Occasion/Short
Continuous
Frequency/Duration
1
N/a
Frequency/Duration
1
N/a
0 1 2 3
0 1 2 3
Weight average score for Economic impacts
1
Weight average score for Health impacts
1
Criteria for Health impacts
Raw score
Score
Weight %
Criteria for Other social and
Raw score
Score
Weight %
community impacts
Very small
Very large
Number of people affected
2
N/a
Very small
Very large
0 1 2 3
Number and/or size of community affected
0
N/a
0 1 2 3
Minimum
Severe
Degree of severity
2
N/a
Minimum
Severe
0 1 2 3
Degree of severity
0
N/a
0 1 2 3
Occasion/Short
Continuous
Frequency/Duration
2
N/a
Occasion/Short
Continuous
0 1 2 3
Frequency/Duration
0
N/a
0 1 2 3
Weight average score for Health impacts
2
Weight average score for Other social and community impacts
0
Criteria for Other social and
Raw score
Score
Weight %
community impacts
N/a = Not applied
Very small
Very large
Number and/or size of community affected
2
N/a
0 1 2 3
Minimum
Severe
Degree of severity
2
N/a
0 1 2 3
Occasion/Short
Continuous
Frequency/Duration
2
N/a
0 1 2 3
Weight average score for Other social and community impacts
2
N/a = Not applied
ANNEXES
73
III: Habitat and community modification
IV: Unsustainable exploitation of fish
Weight
and other living resources
Environmental
Environmental issues
Score
Weight
averaged
concern
score
Weight
Environmental
Environmental issues
Score
Weight %
averaged
Habitat and community
concern
12. Loss of ecosystems
1
N/a
1
score
modification
13. Modification of ecosystems or
Unsustainable
14. Overexploitation
2
N/a
1
ecotones, including community
1
N/a
exploitation of fish
structure and/or species composition
15. Excessive by-catch and
0
N/a
discards
16. Destructive fishing practices
0
N/a
Criteria for Economics impacts
Raw score
Score
Weight %
Very small
Very large
17. Decreased viability of stock
Size of economic or public sectors affected
2
N/a
1
N/a
0 1 2 3
through pollution and disease
Minimum
Severe
18. Impact on biological and
Degree of impact (cost, output changes etc.)
2
N/a
0
N/a
0 1 2 3
genetic diversity
Occasion/Short
Continuous
Frequency/Duration
2
N/a
0 1 2 3
Criteria for Economics impacts
Raw score
Score
Weight %
Weight average score for Economic impacts
2
Very small
Very large
Size of economic or public sectors affected
2
N/a
Criteria for Health impacts
Raw score
Score
Weight %
0 1 2 3
Minimum
Severe
Very small
Very large
Degree of impact (cost, output changes etc.)
2
N/a
Number of people affected
3
N/a
0 1 2 3
0 1 2 3
Occasion/Short
Continuous
Minimum
Severe
Frequency/Duration
2
N/a
Degree of severity
3
N/a
0 1 2 3
0 1 2 3
Occasion/Short
Continuous
Weight average score for Economic impacts
2
Frequency/Duration
3
N/a
0 1 2 3
Criteria for Health impacts
Raw score
Score
Weight %
Weight average score for Health impacts
3
Very small
Very large
Criteria for Other social and
Number of people affected
1
N/a
Raw score
Score
Weight %
0 1 2 3
community impacts
Minimum
Severe
Very small
Very large
Degree of severity
1
N/a
Number and/or size of community affected
3
N/a
0 1 2 3
0 1 2 3
Occasion/Short
Continuous
Minimum
Severe
Frequency/Duration
1
N/a
Degree of severity
3
N/a
0 1 2 3
0 1 2 3
Occasion/Short
Continuous
Weight average score for Health impacts
1
Frequency/Duration
3
N/a
0 1 2 3
Criteria for Other social and
Raw score
Score
Weight %
Weight average score for Other social and community impacts
3
community impacts
Very small
Very large
Number and/or size of community affected
1
N/a
0 1 2 3
N/a = Not applied
Minimum
Severe
Degree of severity
1
N/a
0 1 2 3
Occasion/Short
Continuous
Frequency/Duration
1
N/a
0 1 2 3
Weight average score for Other social and community impacts
1
N/a = Not applied
74
GIWA REGIONAL ASSESSMENT 1A RUSSIAN ARCTIC
V: Global change
Weight
Environmental
Environmental issues
Score
Weight
averaged
concern
score
19. Changes in the hydrological cycle
1
N/a
Global change
1
20. Sea level change
0
N/a
21. Increased UV-B radiation as a
1
N/a
result of ozone depletion
22. Changes in ocean CO2
1
N/a
source/sink function
Criteria for Economics impacts
Raw score
Score
Weight %
Very small
Very large
Size of economic or public sectors affected
1
N/a
0 1 2 3
Minimum
Severe
Degree of impact (cost, output changes etc.)
1
N/a
0 1 2 3
Occasion/Short
Continuous
Frequency/Duration
1
N/a
0 1 2 3
Weight average score for Economic impacts
1
Criteria for Health impacts
Raw score
Score
Weight %
Very small
Very large
Number of people affected
0
N/a
0 1 2 3
Minimum
Severe
Degree of severity
0
N/a
0 1 2 3
Occasion/Short
Continuous
Frequency/Duration
0
N/a
0 1 2 3
Weight average score for Health impacts
0
Criteria for Other social and
Raw score
Score
Weight %
community impacts
Very small
Very large
Number and/or size of community affected
1
N/a
0 1 2 3
Minimum
Severe
Degree of severity
1
N/a
0 1 2 3
Occasion/Short
Continuous
Frequency/Duration
1
N/a
0 1 2 3
Weight average score for Other social and community impacts
1
N/a = Not applied
Comparative environmental and socio-economic impacts of each GIWA concern
Types of impacts
Environmental score
Economic score
Human health score
Social and community score
Concern
Overall score
Rank
Present (a)
Future (b)
Present (a)
Future (b)
Present (a)
Future (b)
Present (a)
Future (b)
Freshwater shortage
0
0
1
1
1
1
0
0
0.5
5
Pollution
2
2
1
1
2
2
2
2
1.8
2
Habitat and community
1
1
2
2
3
3
3
3
2.3
1
modification
Unsustainable exploitation of fish
1
1
2
2
1
1
1
1
1.3
3
and other living resources
Global change
1
1
1
1
0
0
1
1
0.8
4
ANNEXES
75
Annex II
Detailed scoring tables: Laptev, East Siberian, Chukchi seas
I: Freshwater shortage
II: Pollution
Weight
Weight
Environmental
Environmental
Environmental issues
Score
Weight
averaged
Environmental issues
Score
Weight
averaged
concern
concern
score
score
1. Modification of stream flow
0
N/a
Freshwater shortage
0
4. Microbiological
0
N/a
Pollution
1
2. Pollution of existing supplies
0
N/a
5. Eutrophication
0
N/a
3. Changes in the water table
0
N/a
6. Chemical
1
N/a
7. Suspended solids
0
N/a
Criteria for Economics impacts
Raw score
Score
Weight %
8. Solid wastes
0
N/a
Very small
Very large
Size of economic or public sectors affected
1
N/a
0 1 2 3
9. Thermal
0
N/a
Minimum
Severe
Degree of impact (cost, output changes etc.)
1
N/a
10. Radionuclides
0
N/a
0 1 2 3
Occasion/Short
Continuous
Frequency/Duration
1
11. Spills
1
N/a
0 1 2 3
Weight average score for Economic impacts
1
Criteria for Economics impacts
Raw score
Score
Weight %
Criteria for Health impacts
Raw score
Score
Weight %
Very small
Very large
Very small
Very large
Size of economic or public sectors affected
0
N/a
Number of people affected
0
N/a
0 1 2 3
0 1 2 3
Minimum
Severe
Minimum
Severe
Degree of impact (cost, output changes etc.)
0
N/a
Degree of severity
0
N/a
0 1 2 3
0 1 2 3
Occasion/Short
Continuous
Occasion/Short
Continuous
Frequency/Duration
0
N/a
Frequency/Duration
0
N/a
0 1 2 3
0 1 2 3
Weight average score for Economic impacts
0
Weight average score for Health impacts
0
Criteria for Health impacts
Raw score
Score
Weight %
Criteria for Other social and
Raw score
Score
Weight %
community impacts
Very small
Very large
Number of people affected
1
N/a
Very small
Very large
0 1 2 3
Number and/or size of community affected
0
N/a
0 1 2 3
Minimum
Severe
Degree of severity
1
N/a
Minimum
Severe
0 1 2 3
Degree of severity
0
N/a
0 1 2 3
Occasion/Short
Continuous
Frequency/Duration
1
Occasion/Short
Continuous
0 1 2 3
Frequency/Duration
0
N/a
0 1 2 3
Weight average score for Health impacts
1
Weight average score for Other social and community impacts
0
Criteria for Other social and
Raw score
Score
Weight %
community impacts
N/a = Not applied
Very small
Very large
Number and/or size of community affected
2
N/a
0 1 2 3
Minimum
Severe
Degree of severity
2
N/a
0 1 2 3
Occasion/Short
Continuous
Frequency/Duration
2
N/a
0 1 2 3
Weight average score for Other social and community impacts
2
N/a = Not applied
76
GIWA REGIONAL ASSESSMENT 1A RUSSIAN ARCTIC
III: Habitat and community modification
IV: Unsustainable exploitation of fish
Weight
and other living resources
Environmental
Environmental issues
Score
Weight
averaged
concern
score
Weight
Environmental
Environmental issues
Score
Weight %
averaged
Habitat and community
concern
12. Loss of ecosystems
1
N/a
1
score
modification
13. Modification of ecosystems or
Unsustainable
14. Overexploitation
1
N/a
0
ecotones, including community
1
N/a
exploitation of fish
structure and/or species composition
15. Excessive by-catch and
0
N/a
discards
16. Destructive fishing practices
0
N/a
Criteria for Economics impacts
Raw score
Score
Weight %
Very small
Very large
17. Decreased viability of stock
Size of economic or public sectors affected
1
N/a
1
N/a
0 1 2 3
through pollution and disease
Minimum
Severe
18. Impact on biological and
Degree of impact (cost, output changes etc.)
1
N/a
0
N/a
0 1 2 3
genetic diversity
Occasion/Short
Continuous
Frequency/Duration
1
N/a
0 1 2 3
Criteria for Economics impacts
Raw score
Score
Weight %
Weight average score for Economic impacts
1
Very small
Very large
Size of economic or public sectors affected
1
N/a
Criteria for Health impacts
Raw score
Score
Weight %
0 1 2 3
Minimum
Severe
Very small
Very large
Degree of impact (cost, output changes etc.)
1
N/a
Number of people affected
3
N/a
0 1 2 3
0 1 2 3
Occasion/Short
Continuous
Minimum
Severe
Frequency/Duration
1
N/a
Degree of severity
3
N/a
0 1 2 3
0 1 2 3
Occasion/Short
Continuous
Weight average score for Economic impacts
1
Frequency/Duration
3
N/a
0 1 2 3
Criteria for Health impacts
Raw score
Score
Weight %
Weight average score for Health impacts
3
Very small
Very large
Criteria for Other social and
Number of people affected
1
N/a
Raw score
Score
Weight %
0 1 2 3
community impacts
Minimum
Severe
Very small
Very large
Degree of severity
1
N/a
Number and/or size of community affected
3
N/a
0 1 2 3
0 1 2 3
Occasion/Short
Continuous
Minimum
Severe
Frequency/Duration
1
N/a
Degree of severity
3
N/a
0 1 2 3
0 1 2 3
Occasion/Short
Continuous
Weight average score for Health impacts
1
Frequency/Duration
3
N/a
0 1 2 3
Criteria for Other social and
Raw score
Score
Weight %
Weight average score for Other social and community impacts
3
community impacts
Very small
Very large
Number and/or size of community affected
1
N/a
0 1 2 3
N/a = Not applied
Minimum
Severe
Degree of severity
1
N/a
0 1 2 3
Occasion/Short
Continuous
Frequency/Duration
1
N/a
0 1 2 3
Weight average score for Other social and community impacts
1
N/a = Not applied
ANNEXES
77
V: Global change
Weight
Environmental
Environmental issues
Score
Weight
averaged
concern
score
19. Changes in the hydrological cycle
1
N/a
Global change
1
20. Sea level change
0
N/a
21. Increased UV-B radiation as a
1
N/a
result of ozone depletion
22. Changes in ocean CO2
1
N/a
source/sink function
Criteria for Economics impacts
Raw score
Score
Weight %
Very small
Very large
Size of economic or public sectors affected
1
N/a
0 1 2 3
Minimum
Severe
Degree of impact (cost, output changes etc.)
1
N/a
0 1 2 3
Occasion/Short
Continuous
Frequency/Duration
1
N/a
0 1 2 3
Weight average score for Economic impacts
1
Criteria for Health impacts
Raw score
Score
Weight %
Very small
Very large
Number of people affected
0
N/a
0 1 2 3
Minimum
Severe
Degree of severity
0
N/a
0 1 2 3
Occasion/Short
Continuous
Frequency/Duration
0
N/a
0 1 2 3
Weight average score for Health impacts
0
Criteria for Other social and
Raw score
Score
Weight %
community impacts
Very small
Very large
Number and/or size of community affected
1
N/a
0 1 2 3
Minimum
Severe
Degree of severity
1
N/a
0 1 2 3
Occasion/Short
Continuous
Frequency/Duration
1
N/a
0 1 2 3
Weight average score for Other social and community impacts
1
N/a = Not applied
Comparative environmental and socio-economic impacts of each GIWA concern
Types of impacts
Environmental score
Economic score
Human health score
Social and community score
Concern
Overall score
Rank
Present (a)
Future (b)
Present (a)
Future (b)
Present (a)
Future (b)
Present (a)
Future (b)
Freshwater shortage
0
0
1
1
0
0
0
0
0.3
5
Pollution
1
1
0
0
1
1
2
2
1.0
2
Habitat and community
1
1
1
1
3
3
3
3
2.0
1
modification
Unsustainable exploitation of fish
0
0
1
1
1
1
1
1
0.8
4
and other living resources
Global change
1
1
1
1
0
0
1
1
0.8
3
78
GIWA REGIONAL ASSESSMENT 1A RUSSIAN ARCTIC
Annex III
Protection of the Arctic Marine Environment (PAME)
List of important water-related PAME addresses policy and non-emergency response measures related
programmes
to protection of the marine environment from land and sea-based
activities. PAME has responsibilities to take preventative and other
measures, directly or through competent international organisations,
International programmes and projects
regarding marine pollution in the Arctic, irrespective of origin.
Arctic Environmental Protection Strategy (AEPS) 1991
Main issues:
Sustainable Development Working Group (SDWG)
Protect the Arctic ecosystems, including humans;
Established by Arctic Ministers in 1998. The objective is to protect and
Provide for the protection, enhancement and restoration of
enhance the economies, culture and health of the inhabitants of the
environmental quality and sustainable utilisation of natural
Arctic, in an environmentally sustainable manner.
resources, including their use by local populations and indigenous
peoples in the Arctic;
Arctic Climate Impact Assessment (ACIA)
Recognise and, to the extent possible, seek to accommodate the
An international project organised under the auspices of the Arctic
traditional and cultural needs, values and practices of indigenous
Council to evaluate and synthesise knowledge on climate variability,
peoples as determined by themselves, related to the protection of
climate change, and increased ultraviolet radiation and their
the Arctic environment;
consequences.
Review regularly the state of the Arctic environment, identify,
reduce and, as a fi nal goal, eliminate pollution.
International Arctic Science Committee (IASC)
IASC is a non-governmental organisation to encourage and facilitate
The fi ve programmes established under the AEPS are:
cooperation in all aspects of Arctic research, in all countries engaged
Arctic Monitoring and Assessment Programme (AMAP)
in Arctic research and in all areas of the Arctic region. The IASC member
An international organisation established to implement components
organisations are national science organisations covering all fi elds of
of the AEPS. AMAP has responsibilities to monitor the levels of, and
Arctic research.
assess the effects of, anthropogenic pollutants in all compartments
of the Arctic environment, including humans. AMAP is now a
Arctic Environmental Impact Assessment (ARIA)
programme group of the Arctic Council, and its current objective is
The purpose of the project is to develop Guidelines for EIA in the
"providing reliable and sufficient information on the status of, and
Arctic. A circumpolar ad hoc group, whose task was to evaluate a
threats to, the Arctic environment, and providing scientific advice
proposal for an electronic information system supporting Arctic EIAs,
on actions to be taken in order to support Arctic governments in
has recommended that an electronic network on the internet should
their efforts to take remedial and preventive actions relating to
be established.
contaminants".
AMAP's Assessment: State of the Environment Report
Conservation of Arctic Flora and Fauna (CAFF)
During its initial phase of operation (1991-1996), AMAP designed
The Programme for the Conservation of Arctic Flora and Fauna, under
and implemented a monitoring programme and conducted its fi rst
the AEPS, was established to address the special needs of Arctic
assessment of the State of the Arctic Environment with respect to
species and their habitats in the rapidly developing Arctic region.
pollution issues. A special group (the AMAP Assessment Steering Group)
CAFF has responsibilities to facilitate the exchange of information and
was established to oversee the preparation of the AMAP Assessment,
coordination of research on species and habitats of Arctic fl ora and
which is based on input from several hundred scientifi c experts. Two
fauna.
Assessment reports were produced to present the results of the AMAP
assessment fi rstly to decision makers and the general public (the SOAER;
Emergency Prevention, Preparedness and Response (EPPR)
full text), and secondly to fully document the scientifi c basis for the
Established as an expert forum to evaluate the adequacy of
assessment (the AAR). This fi rst AMAP Assessment was presented in
existing arrangements and to recommend necessary systems of
1997.
cooperation.
ANNEXES
79
GEF Projects in the region
Economic and social development of northern minorities up to 2011 year
UNEP-GEF-International Waters
Support for the National Plan of Action in the Russian Federation for
Reduction of diff erences in socio-economic development of regions of
the Protection of the Arctic Marine Environment from Anthropogenic
Russian Federation (2002-2010 and up to 2015)
Pollution.
The project will focus on pre-investment studies of identifi ed priority hot
spots with known signifi cant transboundary consequences. Additional
activities will include the necessary support in the development of
legal, institutional and economic measures.
UNEP-GEF-Biodiversity
An Integrated Ecosystem Approach to Enhance Biodiversity Conservation
and Minimise Habitat Fragmentation in the Russian Arctic.
Other actors and initiatives
European Commission Report on the Northern Dimension,
November 1998.
Conclusions of the Foreign Ministers Conference on the Northern
Dimension, November 1999.
Russian programmes and projects
Federal programme
Economic and social development of northern minorities up to 2000 year
(1996)
Includes the following sub-programmes:
Economy and culture development of northern minorities:
State support of the production of local natural food production is
stipulated. Clubs for 16 800 visitors will be constructed; investments
for the development of trades, publishing of manuals and belles-
lettres in the languages of northern minorities, scientifi c research
work connected with their history and culture are planned in the
federal and local budgets.
Medical and health care:
Permanent regional health monitoring will be organised. Mobile
special medical care will reach all remote northern settlements.
Building of hospitals for 3 500 patients and the construction of 101
obstetric and doctor assistants clinics, along with the modernisation
of health transport are stipulate).
World Ocean
includes the following subprograms:
Development and use of the Arctic region;
Creation of high-tech installations, machines and equipment for marine
production of oil, gas and development of hydrocarbon deposits on
the continental shelf of the Arctic from 2004-2012 (Shelf).
80
GIWA REGIONAL ASSESSMENT 1A RUSSIAN ARCTIC
Annex IV
The International Convention for the Prevention of Pollution
List of conventions and
from Ships (MARPOL)
specific laws that affect
From 1973 and mod ifi ed by the Protocol of 1978 (MARPOL 73/78):
This convention is a combination of two treaties adopted in 1973 and
water use
1978. It covers all the technical aspects of pollution from ships, except
the disposal of waste into the sea by dumping, and applies to ships of
all types. It has fi ve annexes covering oil, chemicals, sewage, garbage,
International Conventions
and harmful substances carried in packages, portable tanks, freight
United Nations Convention on the Law of the Sea (UNCLOS)
containers, etc.
1982, UN Documents A/CONF. 62/122
Convention on the Prevention of Marine Pollution by Dumping
United Nations Conference on Environment and Development
of Wastes and Other Matter ( London Dumping Convention)
(UNCED)
The London Dumping Convention is the pri
mary international
Rio de Janeiro, 1992
agreement regulating ocean dumping of wastes. It has direct
signifi cance for several aspects of environmental protection of the
Rovaniemi Declaration on the Protection of the Arctic Environment
Arctic, particularly in relation to radioactive waste disposal issues. All
Rovaniemi, 1991
eight Arctic countries are Contracting Parties and have signed a recent
comprehensive revision and restructuring of this Convention.
Convention on Biological Diversity (CBD)
Rio de Janeiro, 1992
Vienna Convention for the Protection of the Ozone Layer and
the Montreal Protocol on Substances that Deplete the Ozone
World Summit on Sustainable Development (WSSD)
Layer
Johannesburg, 2002
The Vienna Convention of 1985 identi fi ed the threat to ozone in the
atmosphere and resulted in the adoption of the 1987 Montreal Protocol,
Convention on Long-Range Transboundary Air Pollution (LRTAP)
which limits the production of substances responsible for stratos-
The purpose of the UN Economic Commission for Europe's LRTAP
pheric ozone depletion. Compliance with the protocol including its
Convention is to prevent, reduce, and control transboundary air
amendments is the primary mechanism for protecting stratospheric
pollution from both existing and new sources. This regional, binding
ozone.
agreement and the fi ve related protocols represent the most appro-
priate instrument for addressing relevant components of the Arctic
United Nations Framework Convention on Climate Change
pollution problem. Current negotiations in LRTAP include eff orts to
(UNFCCC)
conclude a new protocol on photo chemical pollution, acidifi cation,
Adopted at the Rio Conference in 1992, the United Nations Framework
and eutrophication, and to prepare new protocols on heavy metals
Convention on Climate Change provides an international framework
and persistent organic pollutants.
to discuss greenhouse gases, especially carbon dioxide. A ministerial
declaration at a meeting of parties at the convention in June 1996
Convention for the Protection of the Marine Environment of the
includes instructions to negotiate binding agreements to reduce
North East Atlantic (OSPAR)
emissions.
OSPAR was developed under the Oslo and Paris Commissions to
update two existing Conventions (the 1974 Paris Convention for the
UNEP Global Programme of Action
Prevention of Marine Pollution from Land-based Sources, and the
The 9th session of the UNEP Governing Council decided to establish a
1972 Oslo Convention for the Prevention of Marine Pollution from
negotiating committee before July 1, 1998 to pre pare a global, legally
Ships and Aircraft). The 1992 OSPAR Convention is currently one of the
binding agreement on at least persistent organic pollutants, and to
most applicable international agreements for addressing Arctic marine
fi nish its work before 2000. This fulfi ls a ministerial agreement within
pollution from various sources.
UNEP's Global Programme of Action for the Protection of the Marine
Environment from Land-based Activities.
ANNEXES
81
Russian-specific federal laws and
other federal acts
The law of the Russian Federation "About natural environment
conservation" (1992, 2002)
The law of the Russian Federation "About natural protected
territories" (from 14.03.1995)
The Water Code of Russian Federation (from 16.11. 1995 with
additions in 2001, 2002)
The Land Code of Russian Federation (from 25.10. 2001)
The law of the Russian Federation "About the continental shelf of
the Russian Federation" (1995)
The law of the Russian Federation "About the Exclusive Economic
Zone of the Russian Federation" (from 17.12.1998)
The law of the Russian Federation "About Earth's interior" (1992)
The law of the Russian Federation "About fundamentals of state
regulating of social and economic development of the Russian
Federation North" (from 19.06.1996).
The law of the Russian Federation "About state guarantees and
compensations for people living and working at the Far North and
similar territories" (from 19.02.1993).
The law of the Russian Federation "About territories of traditional
use of natural resources by the small indigenous peoples of North,
Siberia and Far East of Russian Federation " (2000)
The law of the Russian Federation "About the distribution of
housing subsidies to the citizens leaving from Far North regions
and similar territories» (from 25.07.1998)
The Ukase of the President of Russian Federation "About the
State Strategy of the Russian Federation on the Protection of
Environment and Ensuring of Sustainable Development" (No 236
from 04.02.94).
The Ukase of the President of Russian Federation "About of the
Concept of Transition of the Russian Federation to Sustainable
Development" (No 440 from 01.04.1996).
Federal government regulations "About the statement of
organisation of delivery and carriage of production (goods) for
maintenance of a national economy and population of Far North
regions and similar territories" (No 207 from 06.01.93 and No 450
from 05.05. 95).
Resolution of lower house of Russian Parliament (State Duma)
"About ensuring the sustainable development of Far North regions
and similar territories" (2000)
82
GIWA REGIONAL ASSESSMENT 1A RUSSIAN ARCTIC
Chukchi. For the majority of northern minorities, the female population
Annex V
is slightly larger than the male population (by 8%). The female
The health and social welfare
percentage of the population is lower only for the Kets, the Saami, the
of the Arctic indigenous
Enets, and the Yukagirs. The overall economic crises, which were more
serious in the north, led to a decrease in the population of the Arctic
population in Russia
zone both because of natural decreases and emigration processes.
For the fi rst time in 1994, a natural decrease in the general population
The modern regional demographic situation
was recorded for the regions where northern minorities live. The
The indigenous population of the Russian North belongs to 30 northern
population decrease in 1995 as compared to 1994 was marked for
minorities (about 200 000 people). These minorities live in the territories
the Saami (-14), the Nganasans (-6), the Kets (-3), the Enets (-1). Other
of 27 regions of the Russian Federation. Eleven of these minorities live
minorities have shown a slight natural population increase. The growth
in the Arctic region: the Saami, the Enets, the Nenets, the Khants, the
in migration from economically depressed northern regions of Russia
Nganasans, the Dolgans, the Evens, the Evenks, the Chukchi, the Eskimos
after the collapse of the USSR was accompanied by the abandonment of
and the Yukagirs. Minorities that live in the adjacent regions are the
settlements and has had serious social consequences for the indigenous
Selkups, the Chuvans, the Mansi, the Kets and the Koryaks. On January
population, because it has led to a decrease in the availability of in food,
1, 2001, 1 854 800 people lived on the Arctic coastline of the GIWA
paid services, and medical care.
region Russian Arctic region. The indigenous population comprises
about 3.4% of this total. Population numbers and the ethnic structure
The major part of the indigenous population (more than 90%) of
of the indigenous peoples in the region are presented in Table 1.
the region is rural. The percentage of the population that is urban is
relatively high for the Nenets (17.1%) and the Chukchi (10%). Residence
The indigenous population comprises 60.6% of the Sakha Republic, and
in multinational settlements and cities entirely changes the indigenous
in the autonomous okrugs: 60% in the Nenets, 66.2% in the Yamalo-
peoples' lifestyle, resulting in many negative consequences. Large shifts
Nenets, 64.2% in the Taimyr (the Dolgano-Nenets), and 67.7% in the
in the traditional distribution of the indigenous population are mainly
connected with the development and exploitation of mineral deposits,
Table 1 Rural indigenous population in the Russian Arctic region.
transport routes and construction. This disturbs pastures, hunting lands,
Sakha
Taimyr AO
productive fi shing areas and undermines the indigenous peoples'
Yamalo-
Minority
Republic
(Dolgano-
Murmansk
Nenets AO
Chukchi AO
Nenets AO
natural resources base.
(Yakutia)
Nenets)
Nenets
6
2419
127
474
297
18
Khants
1
-
-
10
7 009
-
Population health
Mansi
1
-
-
-
68
-
Morbidity structure
Evenks
12 914
-
2
3
65
38
The health of people living in the Arctic region is poor. A general decrease
Koryaks
-
-
-
-
-
39
in living standards, a change for the worse in medical care, changes in
the traditional way of life and nutrition patterns combine to increase
Chukchi
403
-
-
-
-
11 605
morbidity and mortality, even in children. Four of the most common
Saami
-
-
1 130
-
-
-
diseases, per 1 000 people, are: infectious and parasitic diseases 54.5,
Enets
-
130
-
-
-
-
nervous system diseases 56.9, respiratory diseases 301.2, traumas and
Nganasans
-
20
-
-
-
-
poisoning 74.2. The mortality rate from diff erent diseases is 2.5 times
Dolgans
87
1
4 872
-
-
-
-
higher than the Russian average. Thus, because of inadequate medical
Yukagirs
560
-
-
-
-
-
care, infant mortality from infectious and parasitic diseases in the Taimyr
Even
6 304
-
-
-
-
115
(Dolgano-Nenets) AD is 60% higher than in Norilsk. Indigenous infants
Eskimo
4
-
-
-
-
1219
often are infected with opistharhosis during the fi rst year of their life. 95%
Selkups
-
3
-
1
1 616
-
of the population experiences hypovitaminoses.
Chuvan
-
-
-
-
-
520
Kets
-
-
-
1
1
-
After 1990, the frequency of active tuberculosis grew by 23%; for the
Total
21 064
7 444
1 259
489
9 056
13 557
Note: AO = Autonomous Okrug
indigenous population this rate is 2-3 times higher than for the rest
ANNEXES
83
of the region's residents. (The Federal programme "Urgent measures
Every twentieth death in the indigenous population is a child one year
for tuberculosis control in Russia in 1995-1999" has resulted in special
or younger, a statistic that is fi ve times higher than the Russian average.
measures for indigenous peoples.) There is a marked tendency towards
The highest infant mortality is found in the Chukchi AD. The mortality
alcoholism and alcoholic psychosis growth. After 1990, alcoholism grew
rate of the able-bodied indigenous population is also 3-4 times higher
by 39% in the Taimyr (Dolgano-Nenets) AD, by 51% in the Yamalo-
than in the non-indigenous population.
Nenets AD, and by 37% in the Chukchi AD (37% growth). Venereal
diseases are also problematic.
Measures to improve overall health in the population
The socio-economic basis for improving the health of the people in the
Morbidity directly connected with environmental pollution is of special
region has been mapped out by "Economic and social development
concern. This problem is most acute in the large industrial cities of the
of northern minorities up to the year 2000 ", a federal programme
region, such as Norilsk and Vorkuta. Chronic illnesses in these cities are
developed in 1996. A special section was directed at the improvement
common, particularly in children. These include bronchitis, pneumonia,
of health in the northern minority population. Permanent regional
lung cancer, bronchial asthma, and allergies. Women have pregnancy
health monitoring will be organised. Mobile special medical care
complications and other reproductive problems. Heavy metals, PAHs
will be created to reach all remote northern settlements. Regional
and other have a strong mutagenic eff ect. In Norilsk the frequency of
problems concerning morbidity of the Arctic zone population will be
congenital defects for infants is 11.2 per 1 000 (the Russian average is
solved by "Northern minorities health", a programme that is currently
6-8), including the Daun 1.05 (as compared to the far from ecologically
being developed.
clean Krasnoyarsk 0.87).
Socio-economic situation
Human life span and mortality
The social structure of the Russian Arctic region has been built within
Recent changes in the lifestyles of the indigenous populations have
the framework of the industrial development of northern territories.
appeared to be greatly adverse for these peoples' overall well-being.
The food supply, along with the supply of and industrial products,
The average life span in the north is 3-4 years less than the Russian
transportation and energy, were provided through connections
average, while for indigenous people the number is 10-11 years lower.
with the parent state. This is why the social structure has developed
The following data shows why indigenous population numbers tend to
unequally, with relatively good services in cities and big industrial
decrease: their general mortality rates are 1.7 higher than the average,
enterprise sites and poor services in rural zones. This is also why it is
and infant mortality 2 times higher than for the region's population in
very vulnerable to economic downturns and weakened links with the
general. The marital status of men has decreased, while the number
more populous and developed south.
of unmarried indigenous women with children is increasing. Non-
traditional families are 25-35% of the total number. About 50% of
Professional occupation and unemployment rate
reindeer herders remain unmarried. In 1990-1993 the birth rate had
The immigrant population of the Russian Arctic mainly works in industry,
decreased by 34% and mortality had increased by 42%, which caused
while the indigenous population is employed in agriculture, hunting
a ten-fold decrease in the population.
and fi shing. There are 154 farms in the region, covering 12 000 ha. They
are concentrated mostly in the Nenets AD, where there are 29 farms,
Nutritional imbalances have resulted because of the adoption of
with 31 farms in the Chukchi AD, and 39 farms in both the Tyumen
European diets, and these diets also mean that not enough calories
region and the Sakha Republic (Yakutia). The average size of farms
are consumed, and the foods that are eaten are poor in microelements.
varies greatly from 1 ha in the Taimyr (Dolgano-Nenets) AD to 141 ha
This is why an increase in the consumption of traditional foods, such as
in the Sakha Republic (Yakutia). The average size is 49 ha. Traditional
reindeer meat, fi sh, wild berries and mushrooms not only solves food
land management is the most important historical component of
problem, but also solves a problem of population ethnic survival. The
northern ecosystems, as it provides ecologically sound forms of nature
poor physiological state of northern minorities, along with their poor
management. It is an important source of raw goods for the market.
physical condition is one of the causes of their shortened life spans.
Thus, 96% of the reindeer herd is concentrated in the region; hunting
Poverty is closely connected with the lost reliance on natural resources
provides 52% of the bulk fur purchases and 58% of wild animal meat.
as a basis for traditional lifestyles. More than 30% of deaths are violent.
The suicides level is 3-4 times higher than the Russian average.
The decrease in production, reduction of investments, and increase
in consumer costs drastically infl uenced socio-economic situation,
84
GIWA REGIONAL ASSESSMENT 1A RUSSIAN ARCTIC
because it resulted in a growth in unemployment, reduction in
Table 2 Indigenous people education level.
indigenous peoples' incomes, and disruptions in the consumer goods
Yamalo-
Taimyr
Sakha
Nenets
Chukchi
Murmansk
Region
Nenets
(Dolgano-
Republic
and services supply. About 25-35% of the indigenous population has no
AO
AO
region
AO
Nenets) AO
(Yakutia)
permanent job and survives only by gathering berries and mushrooms
Primary education (%)
40
50
50
20
38
40
gathering. The unemployment level is especially high for women and
Secondary and special
45
40
40
70
40
45
education (%)
young people. 15% of the unemployed indigenous population has
Higher education (%)
15
10
10
10
12
15
stopped looking for a job.
Note: AO = Autonomous Okrug
Medical care
The current declines in caloric intake and overall living standards,
completed 10-11th grade (Table 2). The majority of the population that
combined with the great diffi
culties in transportation of sick people
have not completed a secondary education are without jobs. Recently
to hospitals has led to a growth in both morbidity and mortality. The
the number of school children studying native languages increased.
existing forms of medical care do not meet the demands of population
Aside from high school, higher education is available to northern
because there are relatively few numbers of settlements scattered over
minorities in ethnology, ethnopolitics, economy and ecology at the
vast territories, and because of the nomadic way of life of indigenous
Polar Academy in St.-Petersburg, which off ers programmes that are
people, which is inadequately factored into health care programmes.
directed at training high-level specialists for work in the Arctic and the
Because of the decrease in the highly educated non-indigenous
creation of a new generation of intellectuals.
population in the region, there is a tendency for the numbers of doctors
and clinics to decrease. Only two-thirds of the medical services that are
The federal programme "Economic and social development of northern
typically found in other regions of Russia are available in the territories
minorities up to 2000 year" envisions the construction of clubs for 16.8
where the indigenous population is found.
thousand visitors, investments that will help in the development of
trades, the publishing of manuals and belles-lettres in the languages
In order to improve medical care, its off erings must be enlarged,
of northern minorities, scientifi c research work connected with their
and aspects of this care must be made more effi
cient, such as the
history and culture. Inadequate attention has paid, however, to the
transportation of the sick to larger hospitals. The medical system must
study of the history and culture of the old settlers population and their
also improve prophylactic care and the availability of medicines. More
part in the Russian national heritage.
indigenous people must be trained as medical personnel, and the use
of traditional treatment methods should be expanded. Sanitary and
Importance of conservation of the marine
veterinary services should also be off ered. Some of these priorities are
environment
refl ected in existing programmes (Children of Russia), new programmes
Because marine environments are closely connected with their
(Economic and social development of northern minorities up to 2000
terrestrial counterparts, the conservation of the Arctic seas is
year" and projects (Women of Russia etc.). For example, in the Federal
important not only for maintaining a stable ecological situation in the
programme "Urgent measures to fi ght tuberculosis in Russia in 1995-
region, but as a basis for the continued existence and development
1999", 13 mobile medical groups for examining and treatment of active
of the ethnocultural northern minorities. It also supplies the region
tuberculosis are planned, as well as 10 ambulances for prophylactics and
with its living environment, from which products are derived. A clean
personnel training from indigenous people. The Federal programme
environment also supplies a place for the recreational activities of the
"Economic and social development of northern minorities up to 2000
local population and migrants.
year" plans the construction of hospitals for 3 500 patients, 101 obstetric
and doctor' assistants clinics, along with the modernisation of health
Preservation of northern minorities ethnocultural formations
transport vehicles, with the purchase of 20 helicopters, 60 automobiles,
The traditional occupations of the peoples who inhabit the region,
10 boats and 5 four-wheel drive transports.
including the Russian old settlers Russian and the Yakut population,
have been hunting, fi shing, and reindeer herding. This last has resulted
Education and culture
in the development of a special type of cultural landscape that in the
The education level of the region's immigrant population does not
best case is perceived as untrammelled virgin lands, but unfortunately
greatly diff er from the Russian average, but the indigenous population
more often as waste lands that do not need any protection. Generations
diff ers greatly from the average. Only 10-15% of indigenous children has
of experience allowed indigenous people to balance economic
ANNEXES
85
demands against the ecological capacity of the fragile environment.
The destruction of collective farms and loss of public property, which
Specialisation and structure of nature management corresponded to
was the structure of all deer husbandry and hunting farms and that
zonal-landscape structure The specialisation and the structure of this
provided prosperity for the workers associated with these farms,
type of nature management corresponded to the natural landscape
resulted in serious problems for the rural population. The loss of
structure, which provided stable functioning of its components and
these traditional economic activities has destroyed the basis for of
supported the ethnic groups who made their living from the land.
the distinctive indigenous population culture. Changes caused by
Local ecological crises of the past have been caused by fi res, cutting of
the social-economic situation, changes in nutrition patterns and the
northern taiga, and overgrazing, but the scale of these disturbances has
decrease in caloric intake, along with the continued spread of European
never been so large as to prevent the ecosystem from rebounding.
culture at the expense of traditional forms and spiritual institutions of
indigenous peoples has worsened the outlook for their survival .
In recent times, the damage to natural ecosystems in these vast
territories of the region has destroyed their ability to support the
Food production
resource-based activities of indigenous peoples. In particular, industrial
The Arctic is an important region for natural food production, not only
development in the Arctic is accompanied by severe losses of many
for the local population, but also, for some items, for the whole of Russia.
natural resources. Recently, such development has resulted in a huge
Local products - deer meat, fi sh, and wild berries have traditionally
decrease in the area available for reindeer pastures and its quality,
occupied an important place in the nutrition of both the indigenous and
resulting in a two- to three -old decrease in forage, and a concomitant
old settlers population. Thus, compared to the newcomer population,
decrease in the reindeer herd. In the European North, the total area of
the indigenous population consumed 3-5 times more deer and wild
reindeer pastures has decreased by 3.6 million ha since 1970, while in
animal meat, 8 times more marine mammal meat and fat, and 2-8 times
the Yamalo-Nenets AD it has decreased by 7.1 million ha.
more river fi sh. Both the indigenous and newcomer population often
eat local wild plants and marine fi sh (Table 3). The production of deer for
Other causes of the decrease in available pasture lands were fi res and
slaughter makes up nearly half of all stock production in the region.
overgrazing. Because lands have been expropriated for industrial uses
and are tainted by pollution, the rural population has lost not only its
Table 3 Production of meat and fi sh.
Meat and meat
Fish and fish
pastures but hunting lands and fi shing sites, as well as territories where
Region
Potatoes (kg)
products (kg)
products (kg)
wild berries and mushrooms can be gathered. Thus in the Tyumen
Yamalo-Nenets autonomous okrug
82.0
21.3
27.9
region alone, 1200 small and 250 big rivers were lost, including
Taimyr (Dolgano-Nenets) autonomous okrug
40.8
90.9
-
more than 20 former fi shing sites, including 20 thousand ha of fi sh
Nenets autonomous okrug
30.6
28.4
60.4
reproduction territories. Pollution of the Ob caused a 10-fold reduction
Sakha Republic (Yakutia)
31.6
56.5
8.8
in salmon harvesting over the last 15 years and 2-fold decrease in the
total number of fi sh caught. Because the Ob and other rivers are
polluted by municipal wastes, as much as 60% of the carp population
The Federal programme "Economic and social development of northern
and a part of the sig population has been infested with opistharhosis
minorities to the year 2000" includes support for local food production.
and other helminth diseases, which are dangerous for the population.
Thus, 24 deer slaughterhouses, 25 meat and wastes processing factories,
In the Yenisey mouth, the catch rate has dropped by 1.5-2 times.
48 processing facilities for wild berries, mushrooms, 20 fi sh processing
plants, 28 plants for the processing of marine mammals harvest., 5 for
During the reform years, the harvest of fi sh, furs, and marine animals
marine products processing and 5 hatcheries for valuable fi sh species.
dropped by one-third, while the gathering of berries, mushrooms,
Many Arctic regions continue to produce natural products although
nuts, medical plants and algae nearly stopped. Because of high
their volumes have been reduced recently. But the continuing
transportation costs 60% what is produced is not shipped to market and
expansion of territories occupied by oil and gas production sites and
is wasted. A lack of local processing facilities for deer meat, fi shing and
pipelines, combined with the activities of environmentally harmful
hunting products means that these traditional branches of economy
enterprises in the big Arctic river basins (the Yenisey, the Ob, the
have become cheap sources of raw materials for other industries.
Northern Dvina) and the transport of pollution (oil, radionuclides) by
The lack of profi tability in the traditional trades has caused a serious
the North Atlantic current are harmful for this production. Some Arctic
unemployment problem.
regions (Pechenga-Nickel, Monchegorsk, Norilsk etc.) are currently
referred to as ecologically unfavourable, and agricultural products,
86
GIWA REGIONAL ASSESSMENT 1A RUSSIAN ARCTIC
along with gathered products, like wild berries that come from these
The recreational development of the Arctic region depends on healthy
regions may contain higher-than-acceptable concentrations of heavy
natural environments, which are attractive to residents of overcrowded
metals and other pollutants.
cities and industrial areas. Unique natural phenomena, such as the
aurora borealis and nesting bird colonies are also of interest to tourists.
The migration of pollutants up through food chains (both terrestrial and
Nature conservation in the Russian Arctic sets the stage for this kind
aquatic) often results in the accumulation of the pollutant at a higher
of recreational use, which in its turn may help to solve several serious
trophic level. Thus, concentrations of organochlorine pollutants (PCBs,
social-economic and ecological problems with the development of a
etc.) in tissues of fi sh-eating gulls and other birds may be 50 thousand
nature reserves system, a reduction in industry, the development of
times higher than is found in plankton. Though DDT compounds and
folk trades and cultural centers. All of these developments have the
pesticides pollution is more typical for the non-Russian Arctic, increased
potential to provide new jobs for the local population, particularly
concentrations of these compounds have been measured in the tissues
women in the service sector, while broadening opportunities for
of marine mammals from the White and the Barents seas. The following
professional employment for the young.
fact is illustrative: large numbers of dear meet shipments from western
Siberia to Scandinavian countries have been rejected as unacceptable
because of higher-than-acceptable concentrations of heavy metals and
radionuclides.
Recreational demands
The Arctic region possesses various recreational resources, providing
a basis for recreation activities for both locals and visitors from other
regions of Russia. The interest in recreation development in northern
regions is stimulated by a necessity to diversify income from the region's
natural environment, the reduction of popular recreation territories in
Russia (particularly in the Baltic sea region, the Carpathians region, and
the Caucuses), the increase in recreational costs as compared to the
decrease in the Russian standard of living, and the worldwide growth
in non-traditional recreation.
The following types of recreational activities are the most promising
for the Arctic region of Russia: health-promoting(natural, hiking and
ecotourism), cognitive (excursion and industrial tourism), sports
recreation including hunting and fi shery. Currently, the recreational
resources of the Russian Arctic are being used and exploited without
controls, which often leads to confl icts with indigenous population
over the use of hunting and fi shing sites. Preliminary studies of the
recreational resources of the Russian Arctic have shown there is a value
in the coastal zone for marine cruises. This activity has been actively
developed in the Murmansk region, which hosts between two to
seven days of marine excursions with tourists from neighbouring
Scandinavian countries. Traditional folk festivals involving the
northern minorities in the Murmansk region and the Chukchi AD
(Sireniki) are also attractive as tourist activities. Tourism that involves
hunting or gathering of wild foods is the most popular for Russia's
urban population (the gathering of berries and mushrooms, fi shing
and hunting).
ANNEXES
87
The maximum possible volume of leakage;
Annex VI
The area of an oil spill;
General requirements for
The year when the damaged object was brought onto operation
development of plans on
and the year of the last overhaul;
The maximum volume of oil kept at an object;
prevention and elimination of
Physical and chemical properties of the spilled oil;
oil spill accidents
Hydrometeorological, hydrogeological and other conditions
infl uencing the spreading of an oil spill;
The presence of terminals for the transport, storage and processing
Requirements were approved by governmental resolution "Urgent
of oil wastes;
measures to minimise the risk of oil spill accidents", No 240 from
The transport infrastructure in the area of an oil spill accident;
15.02.2002. According to the resolution, oil spills are classifi ed as an
The time needed for the transport of liquidation forces to the area
emergency and are to be eliminated according to the legislation of the
of an oil spill accidents;
Russian Federation.
The time of oil spill localisation, which should be less than 4 hours
for an accident at sea and less than 6 hours for an accident on
Depending on the size and volume, the oil spill accidents are classifi ed
land.
as follows:
Local - the volume of oil spill is up to 500 tonnes;
Regional - from 500 to 5 000 tonnes;
Federal - more than 5 000 tonnes.
Depending on the location of an oil spill and hydrometeorological
conditions, the category of emergency may be increased. The plan on
the prevention and elimination of oil spill accidents is developed on
the basis of the existing regulations allowing for the maximum possible
volume of an oil spill.
The plan encompasses:
Monitoring of the possible oil spill accidents;
Number of forces and facilities needed for the liquidation of an oil spill
accident, their correspondence to the tasks of liquidation activities;
Organisation of cooperation between forces;
Composition and dislocation of forces and facilities;
System of control and warning;
Securing of constant readiness of all forces, appointing the
organisations responsible for their upkeep;
System of the information exchange;
Immediate actions right after the emergency alarm;
Geographic, navigational, hydrographic, hydrometeorological and
other features of the area of an oil spill accident, which should be
taken into account when planning the liquidation activities;
Safety of the population, provision of medical aid;
Technical, engineering and fi nancial provision.
When defi ning the number of facilities and forces needed for the liquidation
of an oil spill accident, the following aspects should be taken into account:
88
GIWA REGIONAL ASSESSMENT 1A RUSSIAN ARCTIC
Annex VII
Urgent measures for
environmental protection
Urgent measures for environmental protection are necessary in the
following impact regions of Russian Arctic:
Pechenga
(heavy
metals
pollution);
Murmansk (petroleum, organic compounds, heavy metals pollution,
potential pollution by radionuclides);
Archangel-Severodvinsk (petroleum, organic compounds, heavy
metals pollution, potential pollution by radionuclides);
Ob'-Yamal
(petroleum
pollution);
Norilsk-Enissey (heavy metals, organic compounds, petroleum
pollution);
Lena (petroleum, heavy metals pollution);
Chaun (petroleum, heavy metals pollution, potential pollution by
radionuclides).
Urgent measures of environmental protection to implement NPA-Arctic
should be carried out for the following objects:
Oil producing and oil transporting complexes of West Siberia and
Timan-Pechora provinces;
Oil storage and oil treatment sites for all ports of the Arctic coast of
Russia;
"Pechenganickel" and "Norilsk nickel". It is known, that reconstruction
of "Pechenganickel" requires about 256 million USD and "Norilsk
nickel" requires about 2 billion USD. However even before full
scale reconstruction one can improve the treatment installations
and exclude the discharges of untreated waters;
Archangel and Solombala PPM. In pulp processing it is necessary
to replace chlorination with ozonation. As preliminary step one
can consider improvement of treatment facilities for existent
technologies;
Ob' and Enissey region wood producing combines;
Mining and enrichment combines of Sakha-Yakutia and Chukchi
regions;
Development of modern sewage treatment systems for towns and
settlements on the Arctic coast of Russia;
Unloading of spent nuclear fuel from laid off nuclear submarines
and construction of new storage places for the fuel;
Development of the system of treatment of liquid and solid
radioactive waste at Kola Peninsula and Severodvinsk and
construction of regional disposal sites.
ANNEXES
89
90
GIWA REGIONAL ASSESSMENT 1A RUSSIAN ARCTIC
The Global International
Waters Assessment
This report presents the results of the Global International Waters
Adequately managing the world's aquatic resources for the benefi t of
Assessment (GIWA) of the transboundary waters of the Russian
all is, for a variety of reasons, a very complex task. The liquid state of
Arctic region. This and the subsequent chapter off er a background
the most of the world's water means that, without the construction
that describes the impetus behind the establishment of GIWA, its
of reservoirs, dams and canals it is free to fl ow wherever the laws of
objectives and how the GIWA was implemented.
nature dictate. Water is, therefore, a vector transporting not only a
wide variety of valuable resources but also problems from one area
to another. The effl
uents emanating from environmentally destructive
activities in upstream drainage areas are propagated downstream
The need for a global
and can aff ect other areas considerable distances away. In the case of
international waters
transboundary river basins, such as the Nile, Amazon and Niger, the
assessment
impacts are transported across national borders and can be observed
in the numerous countries situated within their catchments. In the case
of large oceanic currents, the impacts can even be propagated between
Globally, people are becoming increasingly aware of the degradation of
continents (AMAP 1998). Therefore, the inextricable linkages within
the world's water bodies. Disasters from fl oods and droughts, frequently
and between both freshwater and marine environments dictates that
reported in the media, are considered to be linked with ongoing global
management of aquatic resources ought to be implemented through
climate change (IPCC 2001), accidents involving large ships pollute public
a drainage basin approach.
beaches and threaten marine life and almost every commercial fi sh stock
is exploited beyond sustainable limits - it is estimated that the global
In addition, there is growing appreciation of the incongruence
stocks of large predatory fi sh have declined to less that 10% of pre-
between the transboundary nature of many aquatic resources and the
industrial fi shing levels (Myers & Worm 2003). Further, more than 1 billion
traditional introspective nationally focused approaches to managing
people worldwide lack access to safe drinking water and 2 billion people
those resources. Water, unlike laws and management plans, does not
lack proper sanitation which causes approximately 4 billion cases of
respect national borders and, as a consequence, if future management
diarrhoea each year and results in the death of 2.2 million people, mostly
of water and aquatic resources is to be successful, then a shift in focus
children younger than fi ve (WHO-UNICEF 2002). Moreover, freshwater
towards international cooperation and intergovernmental agreements
and marine habitats are destroyed by infrastructure developments,
is required (UN 1972). Furthermore, the complexity of managing the
dams, roads, ports and human settlements (Brinson & Malvárez 2002,
world's water resources is exacerbated by the dependence of a great
Kennish 2002). As a consequence, there is growing public concern
variety of domestic and industrial activities on those resources. As a
regarding the declining quality and quantity of the world's aquatic
consequence, cross-sectoral multidisciplinary approaches that integrate
resources because of human activities, which has resulted in mounting
environmental, socio-economic and development aspects into
pressure on governments and decision makers to institute new and
management must be adopted. Unfortunately however, the scientifi c
innovative policies to manage those resources in a sustainable way
information or capacity within each discipline is often not available or
ensuring their availability for future generations.
is inadequately translated for use by managers, decision makers and
GLOBAL INTERNATIONAL WATERS ASSESSMENT
i
policy developers. These inadequacies constitute a serious impediment
The Global Environment Facility (GEF)
to the implementation of urgently needed innovative policies.
The Global Environment Facility forges international co-operation and fi nances actions to address
six critical threats to the global environment: biodiversity loss, climate change, degradation of
international waters, ozone depletion, land degradation, and persistent organic pollutants (POPs).
Continual assessment of the prevailing and future threats to aquatic
The overall strategic thrust of GEF-funded international waters activities is to meet the incremental
ecosystems and their implications for human populations is essential if
costs of: (a) assisting groups of countries to better understand the environmental concerns of
their international waters and work collaboratively to address them; (b) building the capacity
governments and decision makers are going to be able to make strategic
of existing institutions to utilise a more comprehensive approach for addressing transboundary
policy and management decisions that promote the sustainable use of
water-related environmental concerns; and (c) implementing measures that address the priority
transboundary environmental concerns. The goal is to assist countries to utilise the full range of
those resources and respond to the growing concerns of the general
technical, economic, fi nancial, regulatory, and institutional measures needed to operationalise
public. Although many assessments of aquatic resources are being
sustainable development strategies for international waters.
conducted by local, national, regional and international bodies, past
United Nations Environment Programme (UNEP)
assessments have often concentrated on specifi c themes, such as
United Nations Environment Programme, established in 1972, is the voice for the environment
biodiversity or persistent toxic substances, or have focused only on
within the United Nations system. The mission of UNEP is to provide leadership and encourage
partnership in caring for the environment by inspiring, informing, and enabling nations and
marine or freshwaters. A globally coherent, drainage basin based
peoples to improve their quality of life without compromising that of future generations.
assessment that embraces the inextricable links between transboundary
UNEP work encompasses:
freshwater and marine systems, and between environmental and
Assessing global, regional and national environmental conditions and trends;
Developing international and national environmental instruments;
societal issues, has never been conducted previously.
Strengthening institutions for the wise management of the environment;
Facilitating the transfer of knowledge and technology for sustainable development;
Encouraging new partnerships and mind-sets within civil society and the private sector.
International call for action
University of Kalmar
University of Kalmar hosts the GIWA Co-ordination Offi ce and provides scientifi c advice and
administrative and technical assistance to GIWA. University of Kalmar is situated on the coast of
The need for a holistic assessment of transboundary waters in order to
the Baltic Sea. The city has a long tradition of higher education; teachers and marine offi cers have
been educated in Kalmar since the middle of the 19th century. Today, natural science is a priority
respond to growing public concerns and provide advice to governments
area which gives Kalmar a unique educational and research profi le compared with other smaller
universities in Sweden. Of particular relevance for GIWA is the established research in aquatic and
and decision makers regarding the management of aquatic resources
environmental science. Issues linked to the concept of sustainable development are implemented
was recognised by several international bodies focusing on the global
by the research programme Natural Resources Management and Agenda 21 Research School.
environment. In particular, the Global Environment Facility (GEF)
Since its establishment GIWA has grown to become an integral part of University activities.
The GIWA Co-ordination offi ce and GIWA Core team are located at the Kalmarsund Laboratory, the
observed that the International Waters (IW) component of the GEF
university centre for water-related research. Senior scientists appointed by the University are actively
suff ered from the lack of a global assessment which made it diffi
cult
involved in the GIWA peer-review and steering groups. As a result of the cooperation the University
can offer courses and seminars related to GIWA objectives and international water issues.
to prioritise international water projects, particularly considering
the inadequate understanding of the nature and root causes of
environmental problems. In 1996, at its fourth meeting in Nairobi, the
causes of degradation of the transboundary aquatic environment and
GEF Scientifi c and Technical Advisory Panel (STAP), noted that: "Lack of
options for addressing them. These pro cesses led to the development
an International Waters Assessment comparable with that of the IPCC, the
of the Global International Waters Assessment (GIWA) that would be
Global Biodiversity Assessment, and the Stratospheric Ozone Assessment,
implemented by the United Nations Environment Programme (UNEP) in
was a unique and serious impediment to the implementation of the
conjunction with the University of Kalmar, Sweden, on behalf of the GEF.
International Waters Component of the GEF".
The GIWA was inaugurated in Kalmar in October 1999 by the Executive
Director of UNEP, Dr. Klaus Töpfer, and the late Swedish Minister of the
The urgent need for an assessment of the causes of environmental
Environment, Kjell Larsson. On this occasion Dr. Töpfer stated: "GIWA
degradation was also highlighted at the UN Special Session on
is the framework of UNEP´s global water assessment strategy and will
the Environment (UNGASS) in 1997, where commitments were
enable us to record and report on critical water resources for the planet for
made regarding the work of the UN Commission on Sustainable
consideration of sustainable development management practices as part of
Development (UNCSD) on freshwater in 1998 and seas in 1999. Also in
our responsibilities under Agenda 21 agreements of the Rio conference".
1997, two international Declarations, the Potomac Declaration: Towards
enhanced ocean security into the third millennium, and the Stockholm
The importance of the GIWA has been further underpinned by the UN
Statement on inter action of land activities, freshwater and enclosed
Millennium Development Goals adopted by the UN General Assembly
seas, specifi cally emphasised the need for an investigation of the root
in 2000 and the Declaration from the World Summit on Sustainable
iI
REGIONAL ASSESSMENTS
Development in 2002. The development goals aimed to halve the
International waters and transboundary issues
proportion of people without access to safe drinking water and basic
The term "international waters", as used for the purposes of the GEF Operational Strategy,
sanitation by the year 2015 (United Nations Millennium Declaration
includes the oceans, large marine ecosystems, enclosed or semi-enclosed seas and estuaries, as
well as rivers, lakes, groundwater systems, and wetlands with transboundary drainage basins
2000). The WSSD also calls for integrated management of land, water and
or common borders. The water-related ecosystems associated with these waters are considered
living resources (WSSD 2002) and, by 2010, the Reykjavik Declaration on
integral parts of the systems.
The term "transboundary issues" is used to describe the threats to the aquatic environment
Responsible Fisheries in the Marine Ecosystem should be implemented
linked to globalisation, international trade, demographic changes and technological advancement,
by all countries that are party to the declaration (FAO 2001).
threats that are additional to those created through transboundary movement of water. Single
country policies and actions are inadequate in order to cope with these challenges and this makes
them transboundary in nature.
The international waters area includes numerous international conventions, treaties, and
agreements. The architecture of marine agreements is especially complex, and a large number
The conceptual framework
of bilateral and multilateral agreements exist for transboundary freshwater basins. Related
conventions and agreements in other areas increase the complexity. These initiatives provide
and objectives
a new opportunity for cooperating nations to link many different programmes and instruments
into regional comprehensive approaches to address international waters.
Considering the general decline in the condition of the world's aquatic
the large-scale deforestation of mangroves for ponds (Primavera 1997).
resources and the internationally recognised need for a globally
Within the GIWA, these "non-hydrological" factors constitute as large
coherent assessment of transboundary waters, the primary objectives
a transboundary infl uence as more traditionally recognised problems,
of the GIWA are:
such as the construction of dams that regulate the fl ow of water into
To provide a prioritising mechanism that allows the GEF to focus
a neighbouring country, and are considered equally important. In
their resources so that they are used in the most cost eff ective
addition, the GIWA recognises the importance of hydrological units that
manner to achieve signifi cant environmental benefi ts, at national,
would not normally be considered transboundary but exert a signifi cant
regional and global levels; and
infl uence on transboundary waters, such as the Yangtze River in China
To highlight areas in which governments can develop and
which discharges into the East China Sea (Daoji & Daler 2004) and the
implement strategic policies to reduce environmental degradation
Volga River in Russia which is largely responsible for the condition of
and improve the management of aquatic resources.
the Caspian Sea (Barannik et al. 2004). Furthermore, the GIWA is a truly
regional assessment that has incorporated data from a wide range of
In order to meet these objectives and address some of the current
sources and included expert knowledge and information from a wide
inadequacies in international aquatic resources management, the GIWA
range of sectors and from each country in the region. Therefore, the
has incorporated four essential elements into its design:
transboundary concept adopted by the GIWA extends to include
A broad transboundary approach that generates a truly regional
impacts caused by globalisation, international trade, demographic
perspective through the incorporation of expertise and existing
changes and technological advances and recognises the need for
information from all nations in the region and the assessment of
international cooperation to address them.
all factors that infl uence the aquatic resources of the region;
A drainage basin approach integrating freshwater and marine
systems;
A multidisciplinary approach integrating environmental and socio-
The organisational structure and
economic information and expertise; and
implementation of the GIWA
A coherent assessment that enables global comparison of the
results.
The scale of the assessment
Initially, the scope of the GIWA was confi ned to transboundary waters
The GIWA builds on previous assessments implemented within the GEF
in areas that included countries eligible to receive funds from the GEF.
International Waters portfolio but has developed and adopted a broader
However, it was recognised that a truly global perspective would only
defi nition of transboundary waters to include factors that infl uence the
be achieved if industrialised, GEF-ineligible regions of the world were
quality and quantity of global aquatic resources. For example, due to
also assessed. Financial resources to assess the GEF-eligible countries
globalisation and international trade, the market for penaeid shrimps
were obtained primarily from the GEF (68%), the Swedish International
has widened and the prices soared. This, in turn, has encouraged
Development Cooperation Agency (Sida) (18%), and the Finnish
entrepreneurs in South East Asia to expand aquaculture resulting in
Department for International Development Cooperation (FINNIDA)
GLOBAL INTERNATIONAL WATERS ASSESSMENT
iII
1b
1c
1d
16
15
11
14
12
1a
13
17
28
10
18
25
30
9
19
23
7
22
8
31
6
24
33
20
34
26
2
5
27
50
51
32
21
36
37
41
52
4
49
53
43
54
55
65
42
3
56
42
46
42
47
62
40b
57
40a
40a
47
47
45b
59
39
45a
58
64
60
44
38
61
63
66
© GIWA 2005
1a Russian Arctic (4 LMEs)
8 Gulf of St Lawrence
17 Baltic
Sea
(LME)
26 California Current (LME)
38 Patagonian Shelf (LME)
45b Indian Ocean Islands
52 Arabian
Sea
(LME)
61 Great
Australian
Bight
1b Arctic
Greenland
(LME)
9 Newfoundland
Shelf
(LME)
18 North
Sea
(LME)
27 Gulf of California (LME)
39 Brazil
Current
(LME)
46 Somali Coastal
53 Bay of Bengal
62 Pacifi c Islands
1c Arctic
European/Atlantic
10 Baffi
n Bay, Labrador Sea,
19 Celtic-Biscay
Shelf
(LME)
28 Bering Sea (LME)
40a Northeast Brazil
Current (LME)
54 South China Sea (2 LMEs)
63 Tasman
Sea
1d Arctic North American
Canadian Archipelago
20 Iberian Coastal Sea (LME)
30 Sea of Okhotsk (LME)
Shelf (2 LMEs)
47 East
African
Rift
55 Mekong
River
64 Humboldt Current (LME)
2
Gulf of Mexico (LME)
11 Barents
Sea
(LME)
21 North
Africa
and
31 Oyashio
Current
(LME)
40b Amazon
Valley Lakes
56 Sulu-Celebes
Sea
(LME)
65 Eastern Equatorial
3 Caribbean
Sea
(LME)
12 Norwegian
Sea
(LME)
Nile River Basin (LME)
32 Kuroshio
Current
(LME)
41 Canary
Current
(LME)
49 Red Sea and
57 Indonesian
Seas
(LME)
Pacifi c (LME)
4 Caribbean
Islands
(LME)
13 Faroe
plateau
22 Black Sea (LME)
33 Sea
of
Japan
(LME)
42 Guinea Current (LME)
Gulf of Aden (LME)
58 North Australian
66 Antarctic (LME)
5 Southeast
Shelf
(LME)
14 Iceland
Shelf
(LME)
23 Caspian
Sea
34 Yellow Sea (LME)
43 Lake
Chad
50 Euphrates and
Shelf (LME)
6 Northeast
Shelf
(LME)
15 East
Greenland
Shelf
(LME)
24 Aral Sea
36 East China Sea (LME)
44 Benguela Current (LME)
Tigris River Basin
59 Coral
Sea
Basin
7 Scotian
Shelf
(LME)
16 West
Greenland
Shelf
(LME)
25 Gulf of Alaska (LME)
37 Hawaiian
Archipelago
(LME)
45a Agulhas Current (LME)
51 Jordan
60 Great Barrier Reef (LME)
Figure 1
The 66 transboundary regions assessed within the GIWA project.
(10%). Other contributions were made by Kalmar Municipality, the
Large Marine Ecocsystems (LMEs)
University of Kalmar and the Norwegian Government. The assessment of
Large Marine Ecosystems (LMEs) are regions of ocean space encompassing coastal areas from river
regions ineligible for GEF funds was conducted by various international
basins and estuaries to the seaward boundaries of continental shelves and the outer margin of the
major current systems. They are relatively large regions on the order of 200 000 km2 or greater,
and national organisations as in-kind contributions to the GIWA.
characterised by distinct: (1) bathymetry, (2) hydrography, (3) productivity, and (4) trophically
dependent populations.
The Large Marine Ecosystems strategy is a global effort for the assessment and management
In order to be consistent with the transboundary nature of many of the
of international coastal waters. It developed in direct response to a declaration at the 1992
world's aquatic resources and the focus of the GIWA, the geographical
Rio Summit. As part of the strategy, the World Conservation Union (IUCN) and National Oceanic
and Atmospheric Administration (NOAA) have joined in an action program to assist developing
units being assessed have been designed according to the watersheds
countries in planning and implementing an ecosystem-based strategy that is focused on LMEs as
of discrete hydrographic systems rather than political borders (Figure 1).
the principal assessment and management units for coastal ocean resources. The LME concept is
also adopted by GEF that recommends the use of LMEs and their contributing freshwater basins
The geographic units of the assessment were determined during the
as the geographic area for integrating changes in sectoral economic activities.
preparatory phase of the project and resulted in the division of the
world into 66 regions defi ned by the entire area of one or more
The global network
catchments areas that drains into a single designated marine system.
In each of the 66 regions, the assessment is conducted by a team of
These marine systems often correspond to Large Marine Ecosystems
local experts that is headed by a Focal Point (Figure 2). The Focal Point
(LMEs) (Sherman 1994, IOC 2002).
can be an individual, institution or organisation that has been selected
on the basis of their scientifi c reputation and experience implementing
Considering the objectives of the GIWA and the elements incorporated
international assessment projects. The Focal Point is responsible
into its design, a new methodology for the implementation of the
for assembling members of the team and ensuring that it has the
assessment was developed during the initial phase of the project. The
necessary expertise and experience in a variety of environmental
methodology focuses on fi ve major environmental concerns which
and socio-economic disciplines to successfully conduct the regional
constitute the foundation of the GIWA assessment; Freshwater shortage,
assessment. The selection of team members is one of the most critical
Pollution, Habitat and community modifi cation, Overexploitation of fi sh
elements for the success of GIWA and, in order to ensure that the
and other living resources, and Global change. The GIWA methodology
most relevant information is incorporated into the assessment, team
is outlined in the following chapter.
members were selected from a wide variety of institutions such as
iV
REGIONAL ASSESSMENTS
an assessment did not exist. Therefore, in order to implement the GIWA,
a new methodology that adopted a multidisciplinary, multi-sectoral,
Steering Group
multi-national approach was developed and is now available for the
implementation of future international assessments of aquatic resources.
GIWA Partners
IGOs, NGOs,
Core
Thematic
The GIWA is comprised of a logical sequence of four integrated
Scientific institutions,
Team
Task Teams
private sector, etc
components. The fi rst stage of the GIWA is called Scaling and is a
66 Regional
process by which the geographic area examined in the assessment is
Focal Points
defi ned and all the transboundary waters within that area are identifi ed.
and Teams
Once the geographic scale of the assessment has been defi ned, the
Figure 2
The organisation of the GIWA project.
assessment teams conduct a process known as Scoping in which the
magnitude of environmental and associated socio-economic impacts
universities, research institutes, government agencies, and the private
of Freshwater shortage, Pollution, Habitat and community modifi cation,
sector. In addition, in order to ensure that the assessment produces a
Unsustainable exploitation of fi sh and other living resources, and Global
truly regional perspective, the teams should include representatives
change is assessed in order to identify and prioritise the concerns
from each country that shares the region.
that require the most urgent intervention. The assessment of these
predefi ned concerns incorporates the best available information and
In total, more than 1 000 experts have contributed to the implementation
the knowledge and experience of the multidisciplinary, multi-national
of the GIWA illustrating that the GIWA is a participatory exercise that
assessment teams formed in each region. Once the priority concerns
relies on regional expertise. This participatory approach is essential
have been identifi ed, the root causes of these concerns are identifi ed
because it instils a sense of local ownership of the project, which
during the third component of the GIWA, Causal chain analysis. The root
ensures the credibility of the fi ndings and moreover, it has created a
causes are determined through a sequential process that identifi es, in
global network of experts and institutions that can collaborate and
turn, the most signifi cant immediate causes followed by the economic
exchange experiences and expertise to help mitigate the continued
sectors that are primarily responsible for the immediate causes and
degradation of the world's aquatic resources.
fi nally, the societal root causes. At each stage in the Causal chain
analysis, the most signifi cant contributors are identifi ed through an
analysis of the best available information which is augmented by the
expertise of the assessment team. The fi nal component of the GIWA is
GIWA Regional reports
the development of Policy options that focus on mitigating the impacts
of the root causes identifi ed by the Causal chain analysis.
The GIWA was established in response to growing concern among the
general public regarding the quality of the world's aquatic resources
The results of the GIWA assessment in each region are reported in
and the recognition of governments and the international community
regional reports that are published by UNEP. These reports are designed
concerning the absence of a globally coherent international waters
to provide a brief physical and socio-economic description of the
assessment. However, because a holistic, region-by-region, assessment
most important features of the region against which the results of the
of the condition of the world's transboundary water resources had never
assessment can be cast. The remaining sections of the report present
been undertaken, a methodology guiding the implementation of such
the results of each stage of the assessment in an easily digestible form.
Each regional report is reviewed by at least two independent external
UNEP Water Policy and Strategy
reviewers in order to ensure the scientifi c validity and applicability of
The primary goals of the UNEP water policy and strategy are:
each report. The 66 regional assessments of the GIWA will serve UNEP
(a) Achieving greater global understanding of freshwater, coastal and marine environments by
as an essential complement to the UNEP Water Policy and Strategy and
conducting environmental assessments in priority areas;
(b) Raising awareness of the importance and consequences of unsustainable water use;
UNEP's activities in the hydrosphere.
(c) Supporting the efforts of Governments in the preparation and implementation of integrated
management of freshwater systems and their related coastal and marine environments;
(d) Providing support for the preparation of integrated management plans and programmes for
aquatic environmental hot spots, based on the assessment results;
Global International Waters Assessment
(e) Promoting the application by stakeholders of precautionary, preventive and anticipatory
approaches.
GLOBAL INTERNATIONAL WATERS ASSESSMENT
v
References:
AMAP (1998). Assessment Report: Arctic Pollution Issues. Arctic
Monitoring and Assessment Programme (AMAP), Oslo, Norway.
Barannik, V., Borysova, O. and Stolberg, F. (2004). The Caspian Sea Region:
Environmental Change. Ambio, 33:45-51.
Brinson, M.M. and Malvárez, A.I. (2002). Temperate freshwater wetlands:
types, status, and threats. Environmental Conservation, 29:115-133.
Daoji, L. and Daler, D. (2004). Ocean Pollution from Land-based Sources:
East China Sea, China. Ambio, 33:98-106.
FAO (2001). Reykjavik conference on responsible fi sheries in the marine
ecosystem. Iceland, 1-4 October 2001.
IOC (2002). IOC-IUCN-NOAA Consultative Meeting on Large Marine
Ecosystems (LMEs). Fourth Session, 8-9 January 2002, Paris,
France.
IPCC (2001). Climate Change 2001: The Scientifi c Basis. Contribution
of Working Group I to the Third Assessment Report of the
Intergovernmental Panel on Climate Change. In: Houghton,
J.T., Ding, Y., Griggs, D.J., Noguer, M., van der Linden, P.J., Dai, X.,
Maskell, K. and Johnson, C.A. (eds). Cambridge University Press,
Cambridge, United Kingdom and New York, NY, USA.
Kennish, M.J. (2002). Environmental threats and environmental future of
estuaries. Environmental Conservation, 29:78-107.
Myers, R.A. and Worm, B. (2003). Rapid worldwide depletion of predatory
fi sh communities. Nature, 423:280-283.
Primavera, J.H. (1997) Socio-economic impacts of shrimp culture.
Aquaculture Research, 28:815-827.
Sherman, K. (1994). Sustainability, biomass yields, and health of coastal
ecosystems: an ecological perspective. Marine Ecology Progress
Series, 112:277-301.
United Nations conference on the human environment (1972). Report
available on-line at http://www.unep.org
United Nations Millennium Declaration (2000). The Millennium
Assembly of the United Nations, New York.
WHO-UNICEF (2002). Global Water Supply and Sanitation Assessment:
2000 Report.
WSSD (2002). World Summit on Sustainable Development.
Johannesburg Summit 2002. Key Outcomes of the Summit,
UN Department of Public Information, New York.
v I
REGIONAL ASSESSMENTS
The GIWA methodology
The specifi c objectives of the GIWA were to conduct a holistic and globally
The assessment integrates environmental and socio-economic data
comparable assessment of the world's transboundary aquatic resources
from each country in the region to determine the severity of the
that incorporated both environmental and socio-economic factors
impacts of each of the fi ve concerns and their constituent issues on
and recognised the inextricable links between freshwater and marine
the entire region. The integration of this information was facilitated by
environments, in order to enable the GEF to focus their resources and to
implementing the assessment during two participatory workshops
provide guidance and advice to governments and decision makers. The
that typically involved 10 to 15 environmental and socio-economic
coalition of all these elements into a single coherent methodology that
experts from each country in the region. During these workshops, the
produces an assessment that achieves each of these objectives had not
regional teams performed preliminary analyses based on the collective
previously been done and posed a signifi cant challenge.
knowledge and experience of these local experts. The results of these
analyses were substantiated with the best available information to be
The integration of each of these elements into the GIWA methodology
presented in a regional report.
was achieved through an iterative process guided by a specially
Table 1 Pre-defi ned GIWA concerns and their constituent issues
convened Methods task team that was comprised of a number of
addressed within the assessment.
international assessment and water experts. Before the fi nal version
of the methodology was adopted, preliminary versions underwent
Environmental issues
Major concerns
an extensive external peer review and were subjected to preliminary
1. Modification of stream flow
testing in selected regions. Advice obtained from the Methods task
2. Pollution of existing supplies
I Freshwater shortage
3. Changes in the water table
team and other international experts and the lessons learnt from
preliminary testing were incorporated into the fi nal version that was
4. Microbiological
5. Eutrophication
used to conduct each of the GIWA regional assessments.
6. Chemical
7. Suspended
solids
II Pollution
8. Solid
wastes
Considering the enormous diff erences between regions in terms of the
9. Thermal
10. Radionuclide
quality, quantity and availability of data, socio-economic setting and
11. Spills
environmental conditions, the achievement of global comparability
12. Loss of ecosystems
required an innovative approach. This was facilitated by focusing
III Habitat and community
13. Modification of ecosystems or ecotones, including community
modification
structure and/or species composition
the assessment on the impacts of fi ve pre-defi ned concerns namely;
Freshwater shortage, Pollution, Habitat and community modifi cation,
14. Overexploitation
15. Excessive by-catch and discards
IV Unsustainable
Unsustainable exploitation of fi sh and other living resources and Global
16. Destructive fishing practices
exploitation of fish and
change, in transboundary waters. Considering the diverse range of
17. Decreased viability of stock through pollution and disease
other living resources
18. Impact on biological and genetic diversity
elements encompassed by each concern, assessing the magnitude of
19. Changes in hydrological cycle
the impacts caused by these concerns was facilitated by evaluating the
20. Sea level change
V Global change
impacts of 22 specifi c issues that were grouped within these concerns
21. Increased uv-b radiation as a result of ozone depletion
22. Changes in ocean CO source/sink function
(see Table 1).
2
THE GIWA METHODOLOGY
vii

political boundaries but were instead, generally defi ned by a large but
T
r
ansboundar
The GIWA approach
discrete drainage basin that also included the coastal marine waters into
which the basin discharges. In many cases, the marine areas examined
1
Scaling
st
W
orkshop
Detailed
during the assessment coincided with the Large Marine Ecosystems
y
D
(LMEs) defi ned by the US National Atmospheric and Oceanographic
iagnostic
A
ssessment
Scoping
Administration (NOAA). As a consequence, scaling should be a
relatively straight-forward task that involves the inspection of the
Analy
boundaries that were proposed for the region during the preparatory
Causal Chain
2
sis
nd
Analysis
phase of GIWA to ensure that they are appropriate and that there are
W
orkshop
no important overlaps or gaps with neighbouring regions. When the
Policy Option
proposed boundaries were found to be inadequate, the boundaries of
Analysis
the region were revised according to the recommendations of experts
from both within the region and from adjacent regions so as to ensure
that any changes did not result in the exclusion of areas from the GIWA.
Once the regional boundary was defi ned, regional teams identifi ed all
SAP
the transboundary elements of the aquatic environment within the
SAP
region and determined if these elements could be assessed as a single
Figure 1
Illustration of the relationship between the GIWA
coherent aquatic system or if there were two or more independent
approach and other projects implemented within the
systems that should be assessed separately.
GEF International Waters (IW) portfolio.
The GIWA is a logical contiguous process that defi nes the geographic
Scoping Assessing the GIWA concerns
region to be assessed, identifi es and prioritises particularly problems
Scoping is an assessment of the severity of environmental and socio-
based on the magnitude of their impacts on the environment and
economic impacts caused by each of the fi ve pre-defi ned GIWA concerns
human societies in the region, determines the root causes of those
and their constituent issues (Table 1). It is not designed to provide an
problems and, fi nally, assesses various policy options that addresses
exhaustive review of water-related problems that exist within each region,
those root causes in order to reverse negative trends in the condition
but rather it is a mechanism to identify the most urgent problems in the
of the aquatic environment. These four steps, referred to as Scaling,
region and prioritise those for remedial actions. The priorities determined
Scoping, Causal chain analysis and Policy options analysis, are
by Scoping are therefore one of the main outputs of the GIWA project.
summarised below and are described in their entirety in two volumes:
GIWA Methodology Stage 1: Scaling and Scoping; and GIWA Methodology:
Focusing the assessment on pre-defi ned concerns and issues ensured
Detailed Assessment, Causal Chain Analysis and Policy Options Analysis.
the comparability of the results between diff erent regions. In addition, to
Generally, the components of the GIWA methodology are aligned
ensure the long-term applicability of the options that are developed to
with the framework adopted by the GEF for Transboundary Diagnostic
mitigate these problems, Scoping not only assesses the current impacts
Analyses (TDAs) and Strategic Action Programmes (SAPs) (Figure 1) and
of these concerns and issues but also the probable future impacts
assume a broad spectrum of transboundary infl uences in addition to
according to the "most likely scenario" which considered demographic,
those associated with the physical movement of water across national
economic, technological and other relevant changes that will potentially
borders.
infl uence the aquatic environment within the region by 2020.
Scaling Defining the geographic extent
The magnitude of the impacts caused by each issue on the
of the region
environment and socio-economic indicators was assessed over the
Scaling is the fi rst stage of the assessment and is the process by which
entire region using the best available information from a wide range of
the geographic scale of the assessment is defi ned. In order to facilitate
sources and the knowledge and experience of the each of the experts
the implementation of the GIWA, the globe was divided during the
comprising the regional team. In order to enhance the comparability
design phase of the project into 66 contiguous regions. Considering the
of the assessment between diff erent regions and remove biases
transboundary nature of many aquatic resources and the transboundary
in the assessment caused by diff erent perceptions of and ways to
focus of the GIWA, the boundaries of the regions did not comply with
communicate the severity of impacts caused by particular issues, the
viii
REGIONAL ASSESSMENTS
results were distilled and reported as standardised scores according to
Table 2
Example of environmental impact assessment of
Freshwater shortage.
the following four point scale:
Weight
0 = no known impact
Environmental
Environmental issues
Score
Weight %
averaged
concerns
1 = slight impact
score
2
=
moderate
impact
1. Modification of stream flow
1
20
Freshwater shortage
1.50
3 = severe impact
2. Pollution of existing supplies
2
50
The attributes of each score for each issue were described by a detailed
3. Changes in the water table
1
30
set of pre-defi ned criteria that were used to guide experts in reporting
Table 3
Example of Health impacts assessment linked to one of
the results of the assessment. For example, the criterion for assigning
the GIWA concerns.
a score of 3 to the issue Loss of ecosystems or ecotones is: "Permanent
Criteria for Health impacts
Raw score
Score
Weight %
destruction of at least one habitat is occurring such as to have reduced their
Very small
Very large
surface area by >30% during the last 2-3 decades". The full list of criteria is
Number of people affected
2
50
0 1 2 3
presented at the end of the chapter, Table 5a-e. Although the scoring
Minimum
Severe
Degree of severity
2
30
0 1 2 3
inevitably includes an arbitrary component, the use of predefi ned
Occasion/Short
Continuous
Frequency/Duration
2
20
0 1 2 3
criteria facilitates comparison of impacts on a global scale and also
Weight average score for Health impacts
2
encouraged consensus of opinion among experts.
The trade-off associated with assessing the impacts of each concern
After all 22 issues and associated socio-economic impacts have
and their constituent issues at the scale of the entire region is that spatial
been scored, weighted and averaged, the magnitude of likely future
resolution was sometimes low. Although the assessment provides a
changes in the environmental and socio-economic impacts of each
score indicating the severity of impacts of a particular issue or concern
of the fi ve concerns on the entire region is assessed according to the
on the entire region, it does not mean that the entire region suff ers
most likely scenario which describes the demographic, economic,
the impacts of that problem. For example, eutrophication could be
technological and other relevant changes that might infl uence the
identifi ed as a severe problem in a region, but this does not imply that all
aquatic environment within the region by 2020.
waters in the region suff er from severe eutrophication. It simply means
that when the degree of eutrophication, the size of the area aff ected,
In order to prioritise among GIWA concerns within the region and
the socio-economic impacts and the number of people aff ected is
identify those that will be subjected to causal chain and policy options
considered, the magnitude of the overall impacts meets the criteria
analysis in the subsequent stages of the GIWA, the present and future
defi ning a severe problem and that a regional action should be initiated
scores of the environmental and socio-economic impacts of each
in order to mitigate the impacts of the problem.
concern are tabulated and an overall score calculated. In the example
presented in Table 4, the scoping assessment indicated that concern III,
When each issue has been scored, it was weighted according to the relative
Habitat and community modifi cation, was the priority concern in this
contribution it made to the overall environmental impacts of the concern
region. The outcome of this mathematic process was reconciled against
and a weighted average score for each of the fi ve concerns was calculated
the knowledge of experts and the best available information in order
(Table 2). Of course, if each issue was deemed to make equal contributions,
to ensure the validity of the conclusion.
then the score describing the overall impacts of the concern was simply the
arithmetic mean of the scores allocated to each issue within the concern.
In some cases however, this process and the subsequent participatory
In addition, the socio-economic impacts of each of the fi ve major
discussion did not yield consensus among the regional experts
concerns were assessed for the entire region. The socio-economic
regarding the ranking of priorities. As a consequence, further analysis
impacts were grouped into three categories; Economic impacts,
was required. In such cases, expert teams continued by assessing the
Health impacts and Other social and community impacts (Table 3). For
relative importance of present and potential future impacts and assign
each category, an evaluation of the size, degree and frequency of the
weights to each. Afterwards, the teams assign weights indicating the
impact was performed and, once completed, a weighted average score
relative contribution made by environmental and socio-economic
describing the overall socio-economic impacts of each concern was
factors to the overall impacts of the concern. The weighted average
calculated in the same manner as the overall environmental score.
score for each concern is then recalculated taking into account
THE GIWA METHODOLOGY
ix
Table 4
Example of comparative environmental and socio-economic impacts of each major concern, presently and likely in year 2020.
Types of impacts
Environmental score
Economic score
Human health score
Social and community score
Concern
Overall score
Present (a)
Future (b)
Present (c)
Future (d)
Present (e)
Future (f)
Present (g)
Future (h)
Freshwater shortage
1.3
2.3
2.7
2.8
2.6
3.0
1.8
2.2
2.3
Pollution
1.5
2.0
2.0
2.3
1.8
2.3
2.0
2.3
2.0
Habitat and community
2.0
3.0
2.4
3.0
2.4
2.8
2.3
2.7
2.6
modification
Unsustainable exploitation of fish
1.8
2.2
2.0
2.1
2.0
2.1
2.4
2.5
2.1
and other living resources
Global change
0.8
1.0
1.5
1.7
1.5
1.5
1.0
1.0
1.2
the relative contributions of both present and future impacts and
should be regarded as a framework to guide the analysis, rather than
environmental and socio-economic factors. The outcome of these
as a set of detailed instructions. Secondly, in an ideal setting, a causal
additional analyses was subjected to further discussion to identify
chain would be produced by a multidisciplinary group of specialists
overall priorities for the region.
that would statistically examine each successive cause and study its
links to the problem and to other causes. However, this approach (even
Finally, the assessment recognises that each of the fi ve GIWA concerns
if feasible) would use far more resources and time than those available
are not discrete but often interact. For example, pollution can destroy
to GIWA1. For this reason, it has been necessary to develop a relatively
aquatic habitats that are essential for fi sh reproduction which, in turn,
simple and practical analytical model for gathering information to
can cause declines in fi sh stocks and subsequent overexploitation. Once
assemble meaningful causal chains.
teams have ranked each of the concerns and determined the priorities
for the region, the links between the concerns are highlighted in order
Conceptual model
to identify places where strategic interventions could be applied to
A causal chain is a series of statements that link the causes of a problem
yield the greatest benefi ts for the environment and human societies
with its eff ects. Recognising the great diversity of local settings and the
in the region.
resulting diffi
culty in developing broadly applicable policy strategies,
the GIWA CCA focuses on a particular system and then only on those
Causal chain analysis
issues that were prioritised during the scoping assessment. The
Causal Chain Analysis (CCA) traces the cause-eff ect pathways from the
starting point of a particular causal chain is one of the issues selected
socio-economic and environmental impacts back to their root causes.
during the Scaling and Scoping stages and its related environmental
The GIWA CCA aims to identify the most important causes of each
and socio-economic impacts. The next element in the GIWA chain is
concern prioritised during the scoping assessment in order to direct
the immediate cause; defi ned as the physical, biological or chemical
policy measures at the most appropriate target in order to prevent
variable that produces the GIWA issue. For example, for the issue of
further degradation of the regional aquatic environment.
eutrophication the immediate causes may be, inter alia:
Enhanced nutrient inputs;
Root causes are not always easy to identify because they are often
Increased
recycling/mobilisation;
spatially or temporally separated from the actual problems they
Trapping of nutrients (e.g. in river impoundments);
cause. The GIWA CCA was developed to help identify and understand
Run-off and stormwaters
the root causes of environmental and socio-economic problems
in international waters and is conducted by identifying the human
Once the relevant immediate cause(s) for the particular system has
activities that cause the problem and then the factors that determine
(have) been identifi ed, the sectors of human activity that contribute
the ways in which these activities are undertaken. However, because
most signifi cantly to the immediate cause have to be determined.
there is no universal theory describing how root causes interact to
Assuming that the most important immediate cause in our example
create natural resource management problems and due to the great
had been increased nutrient concentrations, then it is logical that the
variation of local circumstances under which the methodology will
most likely sources of those nutrients would be the agricultural, urban
be applied, the GIWA CCA is not a rigidly structured assessment but
or industrial sectors. After identifying the sectors that are primarily
1 This does not mean that the methodology ignores statistical or quantitative studies; as has already been pointed out, the available evidence that justifies the assumption of causal links should
be provided in the assessment.
x
REGIONAL ASSESSMENTS
responsible for the immediate causes, the root causes acting on those
The policy options recommended by the GIWA are only contributions
sectors must be determined. For example, if agriculture was found to
to the larger policy process and, as such, the GIWA methodology
be primarily responsible for the increased nutrient concentrations, the
developed to test the performance of various options under the
root causes could potentially be:
diff erent circumstances has been kept simple and broadly applicable.
Economic (e.g. subsidies to fertilisers and agricultural products);
Legal (e.g. inadequate regulation);
Global International Waters Assessment
Failures in governance (e.g. poor enforcement); or
Technology or knowledge related (e.g. lack of aff ordable substitutes
for fertilisers or lack of knowledge as to their application).
Once the most relevant root causes have been identifi ed, an
explanation, which includes available data and information, of how
they are responsible for the primary environmental and socio-economic
problems in the region should be provided.
Policy option analysis
Despite considerable eff ort of many Governments and other
organisations to address transboundary water problems, the evidence
indicates that there is still much to be done in this endeavour. An
important characteristic of GIWA's Policy Option Analysis (POA) is that
its recommendations are fi rmly based on a better understanding of
the root causes of the problems. Freshwater scarcity, water pollution,
overexploitation of living resources and habitat destruction are very
complex phenomena. Policy options that are grounded on a better
understanding of these phenomena will contribute to create more
eff ective societal responses to the extremely complex water related
transboundary problems. The core of POA in the assessment consists
of two tasks:
Construct policy options
Policy options are simply diff erent courses of action, which are not
always mutually exclusive, to solve or mitigate environmental and
socio-economic problems in the region. Although a multitude of
diff erent policy options could be constructed to address each root
cause identifi ed in the CCA, only those few policy options that have
the greatest likelihood of success were analysed in the GIWA.
Select and apply the criteria on which the policy options will be
evaluated
Although there are many criteria that could be used to evaluate any
policy option, GIWA focuses on:
Eff ectiveness (certainty of result)
Effi
ciency (maximisation of net benefi ts)
Equity (fairness of distributional impacts)
Practical
criteria
(political
acceptability,
implementation
feasibility).
THE GIWA METHODOLOGY
xi
Table 5a: Scoring criteria for environmental impacts of Freshwater shortage
Issue
Score 0 = no known impact
Score 1 = slight impact
Score 2 = moderate impact
Score 3 = severe impact
Issue 1: Modification
No evidence of modification of stream
There is a measurably changing trend in
Significant downward or upward trend
Annual discharge of a river altered by more
of stream flow
flow.
annual river discharge at gauging stations
(more than 20% of the long term mean) in
than 50% of long term mean; or
"An increase or decrease
in a major river or tributary (basin >
annual discharges in a major river or tributary Loss of >50% of riparian or deltaic
in the discharge of
40 000 km2); or
draining a basin of >250 000 km2; or
wetlands over a period of not less than
streams and rivers
There is a measurable decrease in the area
Loss of >20% of flood plain or deltaic
40 years (through causes other than
as a result of human
of wetlands (other than as a consequence
wetlands through causes other than
conversion or artificial embankment); or
interventions on a local/
of conversion or embankment
conversion or artificial embankments; or
Significant increased siltation or erosion
regional scale (see Issue
construction); or
Significant loss of riparian vegetation (e.g.
due to changing in flow regime (other than
19 for flow alterations
There is a measurable change in the
trees, flood plain vegetation); or
normal fluctuations in flood plain rivers);
resulting from global
interannual mean salinity of estuaries or
Significant saline intrusion into previously
or
change) over the last 3-4
coastal lagoons and/or change in the mean
freshwater rivers or lagoons.
Loss of one or more anadromous or
decades."
position of estuarine salt wedge or mixing
catadromous fish species for reasons
zone; or
other than physical barriers to migration,
Change in the occurrence of exceptional
pollution or overfishing.
discharges (e.g. due to upstream
damming.
Issue 2: Pollution of
No evidence of pollution of surface and
Any monitored water in the region does
Water supplies does not meet WHO or
River draining more than 10% of the basin
existing supplies
ground waters.
not meet WHO or national drinking water
national drinking water standards in more
have suffered polysaprobic conditions, no
"Pollution of surface
criteria, other than for natural reasons; or
than 30% of the region; or
longer support fish, or have suffered severe
and ground fresh waters
There have been reports of one or more
There are one or more reports of fish kills
oxygen depletion
supplies as a result of
fish kills in the system due to pollution
due to pollution in any river draining a
Severe pollution of other sources of
point or diffuse sources"
within the past five years.
basin of >250 000 km2 .
freshwater (e.g. groundwater)
Issue 3: Changes in
No evidence that abstraction of water from Several wells have been deepened because Clear evidence of declining base flow in
Aquifers are suffering salinisation over
the water table
aquifers exceeds natural replenishment.
of excessive aquifer draw-down; or
rivers in semi-arid areas; or
regional scale; or
"Changes in aquifers
Several springs have dried up; or
Loss of plant species in the past decade,
Perennial springs have dried up over
as a direct or indirect
Several wells show some salinisation.
that depend on the presence of ground
regionally significant areas; or
consequence of human
water; or
Some aquifers have become exhausted
activity"
Wells have been deepened over areas of
hundreds of km2;or
Salinisation over significant areas of the
region.
Table 5b: Scoring criteria for environmental impacts of Pollution
Issue
Score 0 = no known impact
Score 1 = slight impact
Score 2 = moderate impact
Score 3 = severe impact
Issue 4:
Normal incidence of bacterial related
There is minor increase in incidence of
Public health authorities aware of marked
There are large closure areas or very
Microbiological
gastroenteric disorders in fisheries product
bacterial related gastroenteric disorders
increase in the incidence of bacterial
restrictive advisories affecting the
pollution
consumers and no fisheries closures or
in fisheries product consumers but no
related gastroenteric disorders in fisheries
marketability of fisheries products; or
"The adverse effects of
advisories.
fisheries closures or advisories.
product consumers; or
There exists widespread public or tourist
microbial constituents of
There are limited area closures or
awareness of hazards resulting in
human sewage released
advisories reducing the exploitation or
major reductions in the exploitation or
to water bodies."
marketability of fisheries products.
marketability of fisheries products.
Issue 5:
No visible effects on the abundance and
Increased abundance of epiphytic algae; or
Increased filamentous algal production
High frequency (>1 event per year), or
Eutrophication
distributions of natural living resource
A statistically significant trend in
resulting in algal mats; or
intensity, or large areas of periodic hypoxic
"Artificially enhanced
distributions in the area; and
decreased water transparency associated
Medium frequency (up to once per year)
conditions, or high frequencies of fish and
primary productivity in
No increased frequency of hypoxia1 or
with algal production as compared with
of large-scale hypoxia and/or fish and
zoobenthos mortality events or harmful
receiving water basins
fish mortality events or harmful algal
long-term (>20 year) data sets; or
zoobenthos mortality events and/or
algal blooms; or
related to the increased
blooms associated with enhanced primary
Measurable shallowing of the depth range
harmful algal blooms.
Significant changes in the littoral
availability or supply
production; and
of macrophytes.
community; or
of nutrients, including
No evidence of periodically reduced
Presence of hydrogen sulphide in
cultural eutrophication
dissolved oxygen or fish and zoobenthos
historically well oxygenated areas.
in lakes."
mortality; and
No evident abnormality in the frequency of
algal blooms.
xii
REGIONAL ASSESSMENTS
Issue 6: Chemical
No known or historical levels of chemical
Some chemical contaminants are
Some chemical contaminants are above
Chemical contaminants are above
pollution
contaminants except background levels of
detectable but below threshold limits
threshold limits defined for the country or
threshold limits defined for the country or
"The adverse effects of
naturally occurring substances; and
defined for the country or region; or
region; or
region; and
chemical contaminants
No fisheries closures or advisories due to
Restricted area advisories regarding
Large area advisories by public health
Public health and public awareness of
released to standing or
chemical pollution; and
chemical contamination of fisheries
authorities concerning fisheries product
fisheries contamination problems with
marine water bodies
No incidence of fisheries product tainting;
products.
contamination but without associated
associated reductions in the marketability
as a result of human
and
catch restrictions or closures; or
of such products either through the
activities. Chemical
No unusual fish mortality events.
If there is no available data use the following
High mortalities of aquatic species near
imposition of limited advisories or by area
contaminants are
criteria:
outfalls.
closures of fisheries; or
here defined as
If there is no available data use the following
Some use of pesticides in small areas; or
Large-scale mortalities of aquatic species.
compounds that are
criteria:
Presence of small sources of dioxins or
If there is no available data use the following
toxic or persistent or
No use of pesticides; and
furans (e.g., small incineration plants or
criteria:
If there is no available data use the following
bioaccumulating."
No sources of dioxins and furans; and
bleached kraft/pulp mills using chlorine);
Large-scale use of pesticides in agriculture
criteria:
No regional use of PCBs; and
or
and forestry; or
Indications of health effects resulting
No bleached kraft pulp mills using chlorine Some previous and existing use of PCBs
Presence of major sources of dioxins or
from use of pesticides; or
bleaching; and
and limited amounts of PCB-containing
furans such as large municipal or industrial Known emissions of dioxins or furans from
No use or sources of other contaminants.
wastes but not in amounts invoking local
incinerators or large bleached kraft pulp
incinerators or chlorine bleaching of pulp;
concerns; or
mills; or
or
Presence of other contaminants.
Considerable quantities of waste PCBs in
Known contamination of the environment
the area with inadequate regulation or has
or foodstuffs by PCBs; or
invoked some public concerns; or
Known contamination of the environment
Presence of considerable quantities of
or foodstuffs by other contaminants.
other contaminants.
Issue 7: Suspended
No visible reduction in water transparency; Evidently increased or reduced turbidity
Markedly increased or reduced turbidity
Major changes in turbidity over wide or
solids
and
in streams and/or receiving riverine and
in small areas of streams and/or receiving
ecologically significant areas resulting
"The adverse effects of
No evidence of turbidity plumes or
marine environments but without major
riverine and marine environments; or
in markedly changed biodiversity or
modified rates of release
increased siltation; and
changes in associated sedimentation or
Extensive evidence of changes in
mortality in benthic species due to
of suspended particulate No evidence of progressive riverbank,
erosion rates, mortality or diversity of flora
sedimentation or erosion rates; or
excessive sedimentation with or without
matter to water bodies
beach, other coastal or deltaic erosion.
and fauna; or
Changes in benthic or pelagic biodiversity
concomitant changes in the nature of
resulting from human
Some evidence of changes in benthic or
in areas due to sediment blanketing or
deposited sediments (i.e., grain-size
activities"
pelagic biodiversity in some areas due
increased turbidity.
composition/redox); or
to sediment blanketing or increased
Major change in pelagic biodiversity or
turbidity.
mortality due to excessive turbidity.
Issue 8: Solid wastes
No noticeable interference with trawling
Some evidence of marine-derived litter on
Widespread litter on beaches giving rise to
Incidence of litter on beaches sufficient
"Adverse effects
activities; and
beaches; or
public concerns regarding the recreational
to deter the public from recreational
associated with the
No noticeable interference with the
Occasional recovery of solid wastes
use of beaches; or
activities; or
introduction of solid
recreational use of beaches due to litter;
through trawling activities; but
High frequencies of benthic litter recovery
Trawling activities untenable because of
waste materials into
and
Without noticeable interference with
and interference with trawling activities;
benthic litter and gear entanglement; or
water bodies or their
No reported entanglement of aquatic
trawling and recreational activities in
or
Widespread entanglement and/or
environs."
organisms with debris.
coastal areas.
Frequent reports of entanglement/
suffocation of aquatic species by litter.
suffocation of species by litter.
Issue 9: Thermal
No thermal discharges or evidence of
Presence of thermal discharges but
Presence of thermal discharges with large
Presence of thermal discharges with large
"The adverse effects
thermal effluent effects.
without noticeable effects beyond
mixing zones having reduced productivity
mixing zones with associated mortalities,
of the release of
the mixing zone and no significant
or altered biodiversity; or
substantially reduced productivity or
aqueous effluents at
interference with migration of species.
Evidence of reduced migration of species
noticeable changes in biodiversity; or
temperatures exceeding
due to thermal plume.
Marked reduction in the migration of
ambient temperature
species due to thermal plumes.
in the receiving water
body."
Issue 10: Radionuclide No radionuclide discharges or nuclear
Minor releases or fallout of radionuclides
Minor releases or fallout of radionuclides
Substantial releases or fallout of
"The adverse effects of
activities in the region.
but with well regulated or well-managed
under poorly regulated conditions that do
radionuclides resulting in excessive
the release of radioactive
conditions complying with the Basic Safety
not provide an adequate basis for public
exposures to humans or animals in relation
contaminants and
Standards.
health assurance or the protection of
to those recommended under the Basic
wastes into the aquatic
aquatic organisms but without situations
Safety Standards; or
environment from
or levels likely to warrant large scale
Some indication of situations or exposures
human activities."
intervention by a national or international
warranting intervention by a national or
authority.
international authority.
Issue 11: Spills
No evidence of present or previous spills of
Some evidence of minor spills of hazardous Evidence of widespread contamination
Widespread contamination by hazardous
"The adverse effects
hazardous material; or
materials in small areas with insignificant
by hazardous or aesthetically displeasing
or aesthetically displeasing materials
of accidental episodic
No evidence of increased aquatic or avian
small-scale adverse effects one aquatic or
materials assumed to be from spillage
from frequent spills resulting in major
releases of contaminants
species mortality due to spills.
avian species.
(e.g. oil slicks) but with limited evidence of
interference with aquatic resource
and materials to the
widespread adverse effects on resources or
exploitation or coastal recreational
aquatic environment
amenities; or
amenities; or
as a result of human
Some evidence of aquatic or avian species
Significant mortality of aquatic or avian
activities."
mortality through increased presence of
species as evidenced by large numbers of
contaminated or poisoned carcasses on
contaminated carcasses on beaches.
beaches.
THE GIWA METHODOLOGY
xiii
Table 5c: Scoring criteria for environmental impacts of Habitat and community modification
Issue
Score 0 = no known impact
Score 1 = slight impact
Score 2 = moderate impact
Score 3 = severe impact
Issue 12: Loss of ecosystems or
There is no evidence of loss of
There are indications of fragmentation Permanent destruction of at least one
Permanent destruction of at least one
ecotones
ecosystems or habitats.
of at least one of the habitats.
habitat is occurring such as to have
habitat is occurring such as to have
"The complete destruction of aquatic
reduced their surface area by up to 30
reduced their surface area by >30%
habitats. For the purpose of GIWA
% during the last 2-3 decades.
during the last 2-3 decades.
methodology, recent loss will be
measured as a loss of pre-defined
habitats over the last 2-3 decades."
Issue 13: Modification of
No evidence of change in species
Evidence of change in species
Evidence of change in species
Evidence of change in species
ecosystems or ecotones, including
complement due to species extinction
complement due to species extinction
complement due to species extinction
complement due to species extinction
community structure and/or species
or introduction; and
or introduction
or introduction; and
or introduction; and
composition
No changing in ecosystem function
Evidence of change in population
Evidence of change in population
"Modification of pre-defined habitats
and services.
structure or change in functional group
structure or change in functional group
in terms of extinction of native species,
composition or structure
composition or structure; and
occurrence of introduced species and
Evidence of change in ecosystem
changing in ecosystem function and
services2.
services over the last 2-3 decades."
2 Constanza, R. et al. (1997). The value of the world ecosystem services and natural capital, Nature 387:253-260.
Table 5d: Scoring criteria for environmental impacts of Unsustainable exploitation of fish and other
living resources
Issue
Score 0 = no known impact
Score 1 = slight impact
Score 2 = moderate impact
Score 3 = severe impact
Issue 14: Overexploitation
No harvesting exists catching fish
Commercial harvesting exists but there One stock is exploited beyond MSY
More than one stock is exploited
"The capture of fish, shellfish or marine
(with commercial gear for sale or
is no evidence of over-exploitation.
(maximum sustainable yield) or is
beyond MSY or is outside safe
invertebrates at a level that exceeds the
subsistence).
outside safe biological limits.
biological limits.
maximum sustainable yield of the stock."
Issue 15: Excessive by-catch and
Current harvesting practices show no
Up to 30% of the fisheries yield (by
30-60% of the fisheries yield consists
Over 60% of the fisheries yield is
discards
evidence of excessive by-catch and/or
weight) consists of by-catch and/or
of by-catch and/or discards.
by-catch and/or discards; or
"By-catch refers to the incidental capture
discards.
discards.
Noticeable incidence of capture of
of fish or other animals that are not the
endangered species.
target of the fisheries. Discards refers
to dead fish or other animals that are
returned to the sea."
Issue 16: Destructive fishing
No evidence of habitat destruction due Habitat destruction resulting in
Habitat destruction resulting in
Habitat destruction resulting in
practices
to fisheries practices.
changes in distribution of fish or
moderate reduction of stocks or
complete collapse of a stock or far
"Fishing practices that are deemed to
shellfish stocks; or
moderate changes of the environment;
reaching changes in the environment;
produce significant harm to marine,
Trawling of any one area of the seabed
or
or
lacustrine or coastal habitats and
is occurring less than once per year.
Trawling of any one area of the seabed
Trawling of any one area of the seabed
communities."
is occurring 1-10 times per year; or
is occurring more than 10 times per
Incidental use of explosives or poisons
year; or
for fishing.
Widespread use of explosives or
poisons for fishing.
Issue 17: Decreased viability of
No evidence of increased incidence of
Increased reports of diseases without
Declining populations of one or more
Collapse of stocks as a result of
stocks through contamination and
fish or shellfish diseases.
major impacts on the stock.
species as a result of diseases or
diseases or contamination.
disease
contamination.
"Contamination or diseases of feral (wild)
stocks of fish or invertebrates that are a
direct or indirect consequence of human
action."
Issue 18: Impact on biological and
No evidence of deliberate or accidental Alien species introduced intentionally
Measurable decline in the population
Extinction of native species or local
genetic diversity
introductions of alien species; and
or accidentally without major changes
of native species or local stocks as a
stocks as a result of introductions
"Changes in genetic and species diversity No evidence of deliberate or accidental
in the community structure; or
result of introductions (intentional or
(intentional or accidental); or
of aquatic environments resulting from
introductions of alien stocks; and
Alien stocks introduced intentionally
accidental); or
Major changes (>20%) in the genetic
the introduction of alien or genetically
No evidence of deliberate or accidental
or accidentally without major changes
Some changes in the genetic
composition of stocks (e.g. as a result
modified species as an intentional or
introductions of genetically modified
in the community structure; or
composition of stocks (e.g. as a result
of escapes from aquaculture replacing
unintentional result of human activities
species.
Genetically modified species
of escapes from aquaculture replacing
the wild stock).
including aquaculture and restocking."
introduced intentionally or
the wild stock).
accidentally without major changes in
the community structure.
xiv
REGIONAL ASSESSMENTS
Table 5e: Scoring criteria for environmental impacts of Global change
Issue
Score 0 = no known impact
Score 1 = slight impact
Score 2 = moderate impact
Score 3 = severe impact
Issue 19: Changes in hydrological
No evidence of changes in hydrological Change in hydrological cycles due
Significant trend in changing
Loss of an entire habitat through
cycle and ocean circulation
cycle and ocean/coastal current due to
to global change causing changes
terrestrial or sea ice cover (by
desiccation or submergence as a result
"Changes in the local/regional water
global change.
in the distribution and density of
comparison with a long-term time
of global change; or
balance and changes in ocean and coastal
riparian terrestrial or aquatic plants
series) without major downstream
Change in the tree or lichen lines; or
circulation or current regime over the
without influencing overall levels of
effects on river/ocean circulation or
Major impacts on habitats or
last 2-3 decades arising from the wider
productivity; or
biological diversity; or
biodiversity as the result of increasing
problem of global change including
Some evidence of changes in ocean
Extreme events such as flood and
frequency of extreme events; or
ENSO."
or coastal currents due to global
drought are increasing; or
Changing in ocean or coastal currents
change but without a strong effect on
Aquatic productivity has been altered
or upwelling regimes such that plant
ecosystem diversity or productivity.
as a result of global phenomena such
or animal populations are unable to
as ENSO events.
recover to their historical or stable
levels; or
Significant changes in thermohaline
circulation.
Issue 20: Sea level change
No evidence of sea level change.
Some evidences of sea level change
Changed pattern of coastal erosion due Major loss of coastal land areas due to
"Changes in the last 2-3 decades in the
without major loss of populations of
to sea level rise has became evident; or
sea-level change or sea-level induced
annual/seasonal mean sea level as a
organisms.
Increase in coastal flooding events
erosion; or
result of global change."
partly attributed to sea-level rise
Major loss of coastal or intertidal
or changing prevailing atmospheric
populations due to sea-level change or
forcing such as atmospheric pressure
sea level induced erosion.
or wind field (other than storm
surges).
Issue 21: Increased UV-B radiation as No evidence of increasing effects
Some measurable effects of UV/B
Aquatic community structure is
Measured/assessed effects of UV/B
a result of ozone depletion
of UV/B radiation on marine or
radiation on behavior or appearance of
measurably altered as a consequence
irradiation are leading to massive loss
"Increased UV-B flux as a result polar
freshwater organisms.
some aquatic species without affecting
of UV/B radiation; or
of aquatic communities or a significant
ozone depletion over the last 2-3
the viability of the population.
One or more aquatic populations are
change in biological diversity.
decades."
declining.
Issue 22: Changes in ocean CO
No measurable or assessed changes
Some reasonable suspicions that
Some evidences that the impacts
Evidences that the changes in
2
source/sink function
in CO source/sink function of aquatic
current global change is impacting the
of global change have altered the
source/sink function of the aquatic
2
"Changes in the capacity of aquatic
system.
aquatic system sufficiently to alter its
source/sink function for CO of aquatic
systems in the region are sufficient to
2
systems, ocean as well as freshwater, to
source/sink function for CO .
systems in the region by at least 10%.
cause measurable change in global CO
2
2
generate or absorb atmospheric CO as a
balance.
2
direct or indirect consequence of global
change over the last 2-3 decades."
THE GIWA METHODOLOGY
xv