

Global International
Waters Assessment
Regional assessments
Other reports in this series:
Caribbean Sea/Small Islands ş GIWA Regional assessment 3a
Caribbean Islands ş GIWA Regional assessment 4
Barents Sea ş GIWA Regional assessment 11
Baltic Sea ş GIWA Regional assessment 17
Caspian Sea ş GIWA Regional assessment 23
Gulf of California/Colorado River Basin ş GIWA Regional assessment 27
Patagonian Shelf ş GIWA Regional assessment 38
Brazil Current ş GIWA Regional assessment 39
Amazon Basin ş GIWA Regional assessment 40b
Guinea Current ş GIWA Regional assessment 42
Lake Chad Basin ş GIWA Regional assessment 43
Indian Ocean Islands ş GIWA Regional assessment 45b
East African Rift Valley Lakes ş GIWA Regional assessment 47
South China Sea ş GIWA Regional assessment 54
Indonesian Seas ş GIWA Regional assessment 57
Pacifi c Islands ş GIWA Regional assessment 62
Global International
Waters Assessment
Regional assessment 36
East China Sea
GIWA report production
Series editor: Ulla Li Zweifel
Editorial assistance: Nancy Bazilchuk, Monique Stolte,
Johanna Egerup, Lena Mňnsson
Maps & GIS: Rasmus G÷ransson
Design & graphics: Erno Lahtinen
Global International Waters Assessment
East China Sea, GIWA Regional assessment 36
Published by the University of Kalmar on behalf of
United Nations Environment Programme
ę 2005 United Nations Environment Programme
ISSN 1651-940X
University of Kalmar
SE-391 82 Kalmar
Sweden
United Nations Environment Programme
PO Box 30552,
Nairobi, Kenya
This publication may be reproduced in whole or in part and
in any form for educational or non-profi t purposes without
special permission from the copyright holder, provided
acknowledgement of the source is made. No use of this
publication may be made for resale or for any other commercial
purpose whatsoever without prior permission in writing from the
United Nations Environment Programme.
CITATIONS
When citing this report, please use:
UNEP 2005. Qu, J., Xu, Z., Long, Q., Wang, L., Shen, X., Zhang, J. and
Y. Cai. East China Sea, GIWA Regional assessment 36. University of
Kalmar, Kalmar, Sweden.
DISCLAIMER
The views expressed in this publication are those of the authors
and do not necessarily refl ect those of UNEP. The designations
employed and the presentations do not imply the expressions
of any opinion whatsoever on the part of UNEP or cooperating
agencies concerning the legal status of any country, territory,
city or areas or its authority, or concerning the delimitation of its
frontiers or boundaries.
This publication has been peer-reviewed and the information
herein is believed to be reliable, but the publisher does not
warrant its completeness or accuracy.
Printed and bound in Kalmar, Sweden, by Sunds Tryck Íland AB.
Contents
Preface 9
Executive summary
10
Abbreviations and acronyms
12
Regional defi nition
14
Boundaries of the East China Sea region
14
Physical characteristics
15
Socio-economic characteristics
22
Assessment 26
Freshwater shortage
26
Pollution
29
Habitat and community modifi cation
35
Unsustainable exploitation of fi sh and other living resources
40
Global change
45
Priority concerns
45
Causal chain analysis
47
Overexploitation of living resources in the East China Sea
47
Eutrophication in the Yangtze River estuary and adjacent inner shelf
49
Habitat and community modifi cation in coastal waters
52
Habitat and community modifi cation in inland systems
54
Conclusion
55
Policy options
56
Overexploitation of living resources in the East China Sea
56
Eutrophication in the Yangtze River estuary and adjacent inner shelf
58
Habitat and community modifi cation
60
Conclusions and recommendations
63
References 64
CONTENTS
Annexes 68
Annex I List of contributing authors and organisations
68
Annex II Detailed scoring tables
69
Annex III List of laws and regulations related to water
73
Annex IV List of laws and regulations related to environmental protection
74
Annex V List of Laws and regulations related to fi sheries
75
Annex VI Other laws and regulations
76
Annex VII Records of main economic freshwater species in the estuary areas of the East China Sea
77
Annex VIII Records of main economic fi shes in the East China Sea
78
Annex IX Environmental quality standards for surface water
81
The Global International Waters Assessment
i
The GIWA methodology
vii
Preface
The critical stage of the aquatic environment has become widely more
economic growth has been remarkably high during the last decades.
apparent not only for experts and scientist, but also for the general
One of the largest rivers on Earth, the Yangtze River, discharges into
public. Freshwater depletion, pollution, habitat destruction and the
the East China Sea; and Shanghai at its mouth is one of the largest
unsustainable exploitation of living resources are serious transboundary
metropolises in the world. The infrastructure development in the river
problems that have developed over a fairly short timeframe. Global
basin is also unique in its size. The Three Gorges dam is one of the largest
climate change will also result in unpredictable transformations that
dams ever constructed and so is the south-to-north water transfer
will alter the Earth's freshwater and marine ecosystems.
scheme intended to bring water into the drought prone Yellow River
basin and the parched north. Thus both the anthropogenic infl uences
Actions to reverse this negative trend are urgently needed. More than
as well as the freshwater to marine interactions is more dominant in this
a billion people lack access to safe drinking water, depleted freshwater
region than in most other regions assessed by GIWA.
resources and the subsequent salinity problems impact negatively on
agriculture and food production and overfi shing threatens the vitality
The laboratory for estuarine research at the East China Normal University
of large fi sh stocks. The UN Millennium Development Goals target
has studied these problem areas for a long time. GIWA has been able to
these problems and have set forth an ambitious schedule to reduce
draw on this accumulated experience.
them by 50% by 2015. UNEP is committed to work for the fulfi llment
of these goals.
The aim of this report is to give a better understanding of the driving
forces in society that lead to environmental pressures and the causal
The present report is one in a series of regional assessment carried out
relationships that underlay the deterioration of the aquatic environment.
under the GIWA project. The East China Sea is unique in many respects
It is my hope that this report will be seen as a roadmap to sustainability
and this is refl ected in the assessment. The drainage basin of the East
and lead to the actions necessary to overcome the environmental
China Sea is one of the most densely populated areas on the Earth.
challenges we all face.
Approximately 300 million people live in this area. Industrialisation and
Dag Daler
Scientifi c Director
UNEP/GIWA
PREFACE
9
Executive summary
The East China Sea is one of the largest marginal seas in the world.
natural variability of the hydrographic properties of downstream
Its surface area covers ca. 770 000 km2 with a broad shelf in the west
and coastal environments, which has had a profound infl uence on
part (70-75%) and the deep Okinawa Trough to the east. This region
the evolution of these ecosystems. Urbanisation, particularly in the
receives tremendous infl ow of freshwater and terrestrial sediments,
coastal area, changes land use from agricultural to a built environment,
mainly from mainland China, of which the Yangtze River alone is
which as a whole results in problems as varied as inadequate sewage
responsible for ca. 90-95%. In the eastern part of the sea, the Kuroshio
treatment capacity and deforestation. Aquaculture and coastal
current, fl ows northward along the continental slope, eff ectively
area reclamation alter natural wetlands and destroy spawning and
isolating the sea from the open Northwest Pacifi c Ocean. This provides
nursery grounds in the East China Sea. Aquaculture may also result
the approximate limits of the region at 24░-30░ N and 118░-130░ E.
in the discharge of wastes into coastal waters and contamination of
marine living resources at the genetic level. The traditional fi shery in
The East China Sea is bounded by China to the west and south, Korea to
the East China Sea is based on the catch of species with high quality
the north and Japan to the east. It connects with the South China Sea
protein that usually have a long growth period. This has shifted to
through the Taiwan Strait in the southwest, the Yellow Sea to the north
smaller-size and low quality; cheaper species, in part as a result of
and the Sea of Japan to the northeast. The connection between the
overfi shing. As a consequence, pollution, destruction of habitats
East China Sea and the northwest Pacifi c Ocean is mainly through straits
and overfi shing are considered to be the most critical large-scale
and/or channels. The most salient feature of the region in the context
environmental concerns to be addressed in the East China Sea region.
of the Global International Waters Assessment (GIWA) is the large
population and rapid economic development in the countries over last
Although the environmental and socio-economic impacts for each
two decades, particularly in China. The problem of keeping a balance
of the predefi ned GIWA issues and concerns are assessed in this
between social and economic progress on the one hand and protection
report for the East China Sea region, the heterogenic character and
of marine ecosystems on the other is a very sensitive issue between
dimensions of the region make it diffi
cult to conduct a causal chain
neighbouring countries and in international trade. For instance, the
analysis and to develop policy options. The report places emphasis
majority of pollutants are generated on land and anthropogenic
on data analyses that allow a comprehensive understanding of
disturbances are in most areas constrained to drainage basins, but the
the eff orts that will be needed for the mitigation of habitat and
subsequent pollution ends up in coastal and oceanic environments,
ecosystem modifi cation, and transboundary pollution in the region,
resulting in degradation of ecosystems and economic impacts.
in view of its social and economic importance in Northeast Asia.
The natural landscape in the region's drainage basins has been
The failures by governments to provide for a sustainable fi shery and
greatly modifi ed by the development and expansion of agriculture,
protection of the environment in the East China Sea region have
which is dramatically accelerating soil erosion and riverine fl ux of
been due to the misconception that natural resources both on land
nutrients and trace organics. The construction of dams has allowed
and in the ocean are inexhaustible. This has led to a domino eff ect
for power production and irrigation and the control of fl oods, but
in terms of the damage that has been done to the ecosystem at
dam development has also changed the seasonal and/or interannual
various levels. Information is needed to implement actions to ensure
10
GIWA REGIONAL ASSESSMENT 36 EAST CHINA SEA
the sustainable use of water resources, and governments need to be
demands for the region's natural resources means that the political
aware of the environmental and social impacts of water and land-
feasibility of any programme must be addressed as well. Otherwise,
based activities in the marine domain and drainage basins. This can
the political feasibility and success of the implementation will be
be done and realised through: (1) research to obtain new information,
threatened, or confl icts may become intensifi ed and uncontrollable.
(2) dissemination of existing knowledge, and (3) conversations within
and/or between governments to coordinate implementation of
The GIWA assessment of the East China Sea region is marked by major
various conservation programmes, (4) training and education to
data gaps in several areas, including demographic and economic
improve public understanding, and (5) legislation and international
sectors. Previous assessment work in this region has not included
agreements. It should be noted that the impetus for establishing a
fi sheries issues in combination with impacts from land-based
framework for the sustainable development of marine ecosystems in
perturbations. For instance, no consensus has been reached on the
the East China Sea is more signifi cant from a social perspective than the
evolution of stock replenishment of threatened species in the East
economics of such an endeavour. The increase in confl icts over various
China Sea.
EXECUTIVE SUMMARY
11
Abbreviations and acronyms
BSA
Bureau of Statistics of Anhui
NBSC
National Bureau of Statistics of China
BSF
Bureau of Statistics of Fujian
NBSC-DPSSTS Department of Population, Social, Science and
BSJ
Bureau of Statistics of Jiangxi
Technology Statistics National Bureau of Statistics of China
BSS
Bureau of Statistics of Shanghai
NBSC-RERT Rural Economics Research Team, National Bureau of Statistics
BSZ
Bureau of Statistics of Zhejiang
of China
CCA
Causal Chain Analysis
NMDIS National Marine Data And Information Service
CCAR/HKUST The Hong Kong University of Science and Technology
PCB Polychlorinated
biphenyls
CFM Chinese
Forestry
Ministry
PSP
Paralytic Shellfi sh Poisoning
CIGEM China Geological Environmental InfoNet
SCMC Shanghai Construction and Management Committee
CNRD China Natural Resource Database
SEPAC State
Environmental
Protection
Administration
of
China
COD
Chemical Oxygen Demand
SEYEBS Shanghai Environment Yearbook Editorial Board and Staff
COYEC China Ocean Yearbook Editor Committee
SOA State
Oceanic
Administration
CPUE Catch
Per
Unit
Eff ort
SSTA
Sea Surface Temperature Anomaly
CWC
Changjiang Water Commitment
TAC
Total Allowed Catch
DDT
Dichloro-Diphenyl-Trichloroethane
TN
Total Nitrogen
DIN
Dissolved Inorganic Nitrogen
TP
Total Phosphorus
DSP
Diarrheic Shellfi sh Poisoning
TSM
Total Suspended Matter
EBM
Ecosystem Based Management
ZOFA
Zhejiang Ocean and Fishery Administration
ECSCC East China Sea Coastal Current
ZPEPB Zhejiang Province Environment Protective Bureau
ENSO El Nino Southern Oscillation
FAO
Food And Agriculture Organization of the United Nations
FBAM Fisheries Bureau of Agricultural Ministry
FOFA
Fujian Ocean and Fishery Administration
GIWA Global International Waters Assessment
HAB
Harmful Algal Blooms
HCH
Hexachlorocyclohexane
HP
Horse Power
IMO International
Maritime
Organization
MWRC Ministry of Water Resources of China
MWRC-TBA Taihu Drainage Basin Administration, Ministry of Water
Resources of China
MSY
Maximum Sustainable Yield
12
GIWA REGIONAL ASSESSMENT 36 EAST CHINA SEA
List of figures
Figure 1
Boundaries of the East China Sea region. . . . . . . . . . . . . . . . . . . . . . . . . . . . . . . . . . . . . . . . . . . . . . . . . . . . . . . . . . . . . . . . . . . . . . . . . . . . . . . . . . . . . . . . . . . . . . . . . . . . . . . . . . . . . . . . . . . . . . . . 14
Figure 2
Seasonal circulation patterns in the East China Sea. . . . . . . . . . . . . . . . . . . . . . . . . . . . . . . . . . . . . . . . . . . . . . . . . . . . . . . . . . . . . . . . . . . . . . . . . . . . . . . . . . . . . . . . . . . . . . . . . . . . . . . . . . . . . 15
Figure 3
The changes of the skyline of Shanghai. . . . . . . . . . . . . . . . . . . . . . . . . . . . . . . . . . . . . . . . . . . . . . . . . . . . . . . . . . . . . . . . . . . . . . . . . . . . . . . . . . . . . . . . . . . . . . . . . . . . . . . . . . . . . . . . . . . . . . . . 23
Figure 4
Gross domestic product in China, Japan and South Korea.. . . . . . . . . . . . . . . . . . . . . . . . . . . . . . . . . . . . . . . . . . . . . . . . . . . . . . . . . . . . . . . . . . . . . . . . . . . . . . . . . . . . . . . . . . . . . . . . . . . . . 23
Figure 5
Contribution of primary, secondary, and tertiary industries to the growth of China's GDP. . . . . . . . . . . . . . . . . . . . . . . . . . . . . . . . . . . . . . . . . . . . . . . . . . . . . . . . . . . . . . . . . . . . . . 24
Figure 6
The urbanisation levels in China, Shanghai, Jiangsu, Zhejiang, Fujian, Anhui, Jiangxi, Japan and Korea. . . . . . . . . . . . . . . . . . . . . . . . . . . . . . . . . . . . . . . . . . . . . . . . . . . . . . . 24
Figure 7
Land use map of the Yangtze River Basin. . . . . . . . . . . . . . . . . . . . . . . . . . . . . . . . . . . . . . . . . . . . . . . . . . . . . . . . . . . . . . . . . . . . . . . . . . . . . . . . . . . . . . . . . . . . . . . . . . . . . . . . . . . . . . . . . . . . . . . 24
Figure 8
Water use by economic sector for Jiangsu, Shanghai, Zhejiang, Fujian, Jiangxi, and Anhui provinces. . . . . . . . . . . . . . . . . . . . . . . . . . . . . . . . . . . . . . . . . . . . . . . . . . . . . . . . . . 25
Figure 9
Change in total irrigation area for Anhui, Jiangsu, Shanghai, Zhejiang, Jiangxi and Fujian provinces.. . . . . . . . . . . . . . . . . . . . . . . . . . . . . . . . . . . . . . . . . . . . . . . . . . . . . . . . . 27
Figure 10
Total industrial water consumption and domestic water use for Anhui, Jiangsu, Shanghai, Zhejiang, Jiangxi and Fujian provinces. . . . . . . . . . . . . . . . . . . . . . . . . . . . 27
Figure 11 Hypoxy areas in the East China Sea. . . . . . . . . . . . . . . . . . . . . . . . . . . . . . . . . . . . . . . . . . . . . . . . . . . . . . . . . . . . . . . . . . . . . . . . . . . . . . . . . . . . . . . . . . . . . . . . . . . . . . . . . . . . . . . . . . . . . . . . . . . . 27
Figure 12 Consumption of chemical fertiliser by province. . . . . . . . . . . . . . . . . . . . . . . . . . . . . . . . . . . . . . . . . . . . . . . . . . . . . . . . . . . . . . . . . . . . . . . . . . . . . . . . . . . . . . . . . . . . . . . . . . . . . . . . . . . . . . . . 28
Figure 13 Industrial and domestic wastewater discharges in Anhui, Jiangsu, Shanghai, Zhejiang, Jiangxi and Fujian provinces. . . . . . . . . . . . . . . . . . . . . . . . . . . . . . . . . . . . . . . . . . 28
Figure 14 Industrial wastewater treatment capacity. . . . . . . . . . . . . . . . . . . . . . . . . . . . . . . . . . . . . . . . . . . . . . . . . . . . . . . . . . . . . . . . . . . . . . . . . . . . . . . . . . . . . . . . . . . . . . . . . . . . . . . . . . . . . . . . . . . . . 29
Figure 15 Consumption of nitrogenous fertiliser by region. . . . . . . . . . . . . . . . . . . . . . . . . . . . . . . . . . . . . . . . . . . . . . . . . . . . . . . . . . . . . . . . . . . . . . . . . . . . . . . . . . . . . . . . . . . . . . . . . . . . . . . . . . . . . . . 30
Figure 16 Consumption of phosphate fertiliser by region. . . . . . . . . . . . . . . . . . . . . . . . . . . . . . . . . . . . . . . . . . . . . . . . . . . . . . . . . . . . . . . . . . . . . . . . . . . . . . . . . . . . . . . . . . . . . . . . . . . . . . . . . . . . . . . . . 30
Figure 17 Distribution of pollution in the coastal area of the Yangtze River estuary. . . . . . . . . . . . . . . . . . . . . . . . . . . . . . . . . . . . . . . . . . . . . . . . . . . . . . . . . . . . . . . . . . . . . . . . . . . . . . . . . . . . . . 30
Figure 18
Trends in harmful algal blooms in the East China Sea. . . . . . . . . . . . . . . . . . . . . . . . . . . . . . . . . . . . . . . . . . . . . . . . . . . . . . . . . . . . . . . . . . . . . . . . . . . . . . . . . . . . . . . . . . . . . . . . . . . . . . . . . . . 31
Figure 19 Water quality in the coastal area of the East China Sea. . . . . . . . . . . . . . . . . . . . . . . . . . . . . . . . . . . . . . . . . . . . . . . . . . . . . . . . . . . . . . . . . . . . . . . . . . . . . . . . . . . . . . . . . . . . . . . . . . . . . . . . . . 31
Figure 20 Suspended solids in the coastal area of East China Sea . . . . . . . . . . . . . . . . . . . . . . . . . . . . . . . . . . . . . . . . . . . . . . . . . . . . . . . . . . . . . . . . . . . . . . . . . . . . . . . . . . . . . . . . . . . . . . . . . . . . . . . . 32
Figure 21 Solid wastes littering the riverside in the Yangtze River drainage basin. . . . . . . . . . . . . . . . . . . . . . . . . . . . . . . . . . . . . . . . . . . . . . . . . . . . . . . . . . . . . . . . . . . . . . . . . . . . . . . . . . . . . . . . . 34
Figure 22 Deforestation in China. . . . . . . . . . . . . . . . . . . . . . . . . . . . . . . . . . . . . . . . . . . . . . . . . . . . . . . . . . . . . . . . . . . . . . . . . . . . . . . . . . . . . . . . . . . . . . . . . . . . . . . . . . . . . . . . . . . . . . . . . . . . . . . . . . . . . . . . . 39
Figure 23 Reforestation areas by region. . . . . . . . . . . . . . . . . . . . . . . . . . . . . . . . . . . . . . . . . . . . . . . . . . . . . . . . . . . . . . . . . . . . . . . . . . . . . . . . . . . . . . . . . . . . . . . . . . . . . . . . . . . . . . . . . . . . . . . . . . . . . . . . . . 39
Figure 24 Fleet strength and numbers of Chinese-owned marine motorised fishing vessels.. . . . . . . . . . . . . . . . . . . . . . . . . . . . . . . . . . . . . . . . . . . . . . . . . . . . . . . . . . . . . . . . . . . . . . . . . . . . . . 40
Figure 25 Catches in the East China Sea. . . . . . . . . . . . . . . . . . . . . . . . . . . . . . . . . . . . . . . . . . . . . . . . . . . . . . . . . . . . . . . . . . . . . . . . . . . . . . . . . . . . . . . . . . . . . . . . . . . . . . . . . . . . . . . . . . . . . . . . . . . . . . . . . . 40
Figure 26 Ecosystem status indicators for Chinese marine waters. . . . . . . . . . . . . . . . . . . . . . . . . . . . . . . . . . . . . . . . . . . . . . . . . . . . . . . . . . . . . . . . . . . . . . . . . . . . . . . . . . . . . . . . . . . . . . . . . . . . . . . . 41
Figure 27
Distribution of Trichiurus lepturus and its migration routes. . . . . . . . . . . . . . . . . . . . . . . . . . . . . . . . . . . . . . . . . . . . . . . . . . . . . . . . . . . . . . . . . . . . . . . . . . . . . . . . . . . . . . . . . . . . . . . . . . . . 42
Figure 28 Distribution of Larimichthys polyacti and its migration routes. . . . . . . . . . . . . . . . . . . . . . . . . . . . . . . . . . . . . . . . . . . . . . . . . . . . . . . . . . . . . . . . . . . . . . . . . . . . . . . . . . . . . . . . . . . . . . . . . 42
Figure 29 Mariculture production in East China Sea coastal provinces.. . . . . . . . . . . . . . . . . . . . . . . . . . . . . . . . . . . . . . . . . . . . . . . . . . . . . . . . . . . . . . . . . . . . . . . . . . . . . . . . . . . . . . . . . . . . . . . . . . . 43
Figure 30 Linkages between the GIWA concerns in the East China Sea. . . . . . . . . . . . . . . . . . . . . . . . . . . . . . . . . . . . . . . . . . . . . . . . . . . . . . . . . . . . . . . . . . . . . . . . . . . . . . . . . . . . . . . . . . . . . . . . . . . . 46
Figure 31
Causal chain diagram illustrating the causal links resulting in overexploitation of resources in the East China Sea. . . . . . . . . . . . . . . . . . . . . . . . . . . . . . . . . . . . . . . . . . . . . 48
Figure 32 Marine capture and CPUE in China.. . . . . . . . . . . . . . . . . . . . . . . . . . . . . . . . . . . . . . . . . . . . . . . . . . . . . . . . . . . . . . . . . . . . . . . . . . . . . . . . . . . . . . . . . . . . . . . . . . . . . . . . . . . . . . . . . . . . . . . . . . . . 48
Figure 33
Causal chain diagram illustrating the causal links of eutrophication in the Yangtze River estuary and the adjacent inner shelf. . . . . . . . . . . . . . . . . . . . . . . . . . . . . . . . . 50
Figure 34 Causal chain diagram illustrating the causal links between habitat and community modification in coastal waters. . . . . . . . . . . . . . . . . . . . . . . . . . . . . . . . . . . . . . . . . . . 52
Figure 35
Three Gorges Dam. . . . . . . . . . . . . . . . . . . . . . . . . . . . . . . . . . . . . . . . . . . . . . . . . . . . . . . . . . . . . . . . . . . . . . . . . . . . . . . . . . . . . . . . . . . . . . . . . . . . . . . . . . . . . . . . . . . . . . . . . . . . . . . . . . . . . . . . . . . . . 54
Figure 36
Causal chain diagram illustrating the causal links among habitat and community modification in inland systems. . . . . . . . . . . . . . . . . . . . . . . . . . . . . . . . . . . . . . . . . . . . 55
List of tables
Table 1
Characteristics of the rivers in the East China Sea. . . . . . . . . . . . . . . . . . . . . . . . . . . . . . . . . . . . . . . . . . . . . . . . . . . . . . . . . . . . . . . . . . . . . . . . . . . . . . . . . . . . . . . . . . . . . . . . . . . . . . . . . . . . . . . 15
Table 2
Characteristics of the main lakes and reservoirs in the East China Sea region.. . . . . . . . . . . . . . . . . . . . . . . . . . . . . . . . . . . . . . . . . . . . . . . . . . . . . . . . . . . . . . . . . . . . . . . . . . . . . . . . . . 16
Table 3
Climate and vegetation of the Yangtze and Zhe-Ming river basins. . . . . . . . . . . . . . . . . . . . . . . . . . . . . . . . . . . . . . . . . . . . . . . . . . . . . . . . . . . . . . . . . . . . . . . . . . . . . . . . . . . . . . . . . . . . . 18
Table 4
General groups of fish in the freshwater part of the East China Sea region. . . . . . . . . . . . . . . . . . . . . . . . . . . . . . . . . . . . . . . . . . . . . . . . . . . . . . . . . . . . . . . . . . . . . . . . . . . . . . . . . . . . . . . 19
Table 5
Fish species in some rivers in Asia. . . . . . . . . . . . . . . . . . . . . . . . . . . . . . . . . . . . . . . . . . . . . . . . . . . . . . . . . . . . . . . . . . . . . . . . . . . . . . . . . . . . . . . . . . . . . . . . . . . . . . . . . . . . . . . . . . . . . . . . . . . . . . 20
Table 6
Main freshwater lakes of the Yangtze River drainage basin.. . . . . . . . . . . . . . . . . . . . . . . . . . . . . . . . . . . . . . . . . . . . . . . . . . . . . . . . . . . . . . . . . . . . . . . . . . . . . . . . . . . . . . . . . . . . . . . . . . . . . 21
Table 7
Annual population growth rate. . . . . . . . . . . . . . . . . . . . . . . . . . . . . . . . . . . . . . . . . . . . . . . . . . . . . . . . . . . . . . . . . . . . . . . . . . . . . . . . . . . . . . . . . . . . . . . . . . . . . . . . . . . . . . . . . . . . . . . . . . . . . . . . 22
Table 8
Population structure in the East China Sea region. . . . . . . . . . . . . . . . . . . . . . . . . . . . . . . . . . . . . . . . . . . . . . . . . . . . . . . . . . . . . . . . . . . . . . . . . . . . . . . . . . . . . . . . . . . . . . . . . . . . . . . . . . . . . . 23
Table 9
Scoring table for the East China Sea region.. . . . . . . . . . . . . . . . . . . . . . . . . . . . . . . . . . . . . . . . . . . . . . . . . . . . . . . . . . . . . . . . . . . . . . . . . . . . . . . . . . . . . . . . . . . . . . . . . . . . . . . . . . . . . . . . . . . . 26
Table 10
Bacterial indices and harmful algal bloom toxins in the coastal area of Fujian Province. . . . . . . . . . . . . . . . . . . . . . . . . . . . . . . . . . . . . . . . . . . . . . . . . . . . . . . . . . . . . . . . . . . . . . . . 29
Table 11
Pollutants discharged to the East China Sea by major rivers. . . . . . . . . . . . . . . . . . . . . . . . . . . . . . . . . . . . . . . . . . . . . . . . . . . . . . . . . . . . . . . . . . . . . . . . . . . . . . . . . . . . . . . . . . . . . . . . . . . . 30
Table 12
Shellfish pollutants of the Shanghai coastal area. . . . . . . . . . . . . . . . . . . . . . . . . . . . . . . . . . . . . . . . . . . . . . . . . . . . . . . . . . . . . . . . . . . . . . . . . . . . . . . . . . . . . . . . . . . . . . . . . . . . . . . . . . . . . . . 31
Table 13
Pollutants in shellfish in nearshore waters in Fujian. . . . . . . . . . . . . . . . . . . . . . . . . . . . . . . . . . . . . . . . . . . . . . . . . . . . . . . . . . . . . . . . . . . . . . . . . . . . . . . . . . . . . . . . . . . . . . . . . . . . . . . . . . . . 32
Table 14
Annual sediment load and suspended solids in Yangtze, Qiantangjiang and Mingjiang rivers. . . . . . . . . . . . . . . . . . . . . . . . . . . . . . . . . . . . . . . . . . . . . . . . . . . . . . . . . . . . . . . . . 32
Table 15
Area of the Dongtinghu Lake. . . . . . . . . . . . . . . . . . . . . . . . . . . . . . . . . . . . . . . . . . . . . . . . . . . . . . . . . . . . . . . . . . . . . . . . . . . . . . . . . . . . . . . . . . . . . . . . . . . . . . . . . . . . . . . . . . . . . . . . . . . . . . . . . . 37
Table 16
Area of main fishing ground in the East China Sea. . . . . . . . . . . . . . . . . . . . . . . . . . . . . . . . . . . . . . . . . . . . . . . . . . . . . . . . . . . . . . . . . . . . . . . . . . . . . . . . . . . . . . . . . . . . . . . . . . . . . . . . . . . . . 40
Table 17
Seasonal changes in the number of species in the East China Sea. . . . . . . . . . . . . . . . . . . . . . . . . . . . . . . . . . . . . . . . . . . . . . . . . . . . . . . . . . . . . . . . . . . . . . . . . . . . . . . . . . . . . . . . . . . . . . 41
Table 18
Changes in the area of Poyanghu Lake since 1954.. . . . . . . . . . . . . . . . . . . . . . . . . . . . . . . . . . . . . . . . . . . . . . . . . . . . . . . . . . . . . . . . . . . . . . . . . . . . . . . . . . . . . . . . . . . . . . . . . . . . . . . . . . . . . 54
ABBREVIATIONS AND ACRONYMS
13
Regional defi nition
This section describes the boundaries and the main physical and
area of 770 000 km2 (Figure 1). The East China Sea has a total water
socio-economic characteristics of the region in order to defi ne the
volume of 398 000 km3, with an average depth of 370 m. To the west,
area considered in the regional GIWA Assessment and to provide
the East China Sea is bordered by China, with tremendous freshwater
suffi
cient background information to establish the context within
inputs and terrigenous sediment loads, notably from the Yangtze
which the assessment was conducted.
River. In the east the Kuroshio current, moves northward along the
shelf edge with a water fl ow of 25-30 Sv (Su 1998). The East China Sea
borders the Pacifi c Ocean along the Ryukyu Archipelago. In the north
Boundaries of the
the East China Sea is separated from the Yellow Sea by a line from the
East China Sea region
northerly tip of the Yangtze River mouth to Cheju Island, and the East
China Sea is connected with the Sea of Japan (i.e. the East Sea) through
The East China Sea forms the largest shelf region in the Northwest
the Korean Strait. The East China Sea is connected with the South China
Pacifi c Ocean. It is located at 24░-30░ N and 118░-130░ E, with a surface
Sea through the Taiwan Strait.
South Korea
Taegu
Fukuoka
Han Shui
g
Kita Kyushu
l
in
t
z
e
g
Jia
n
China
Ya
Chengdu
Japan
Hefei
Nanjing
Wuhan
Shanghai
Chongqing
long Jiang
Yangtze
Y
a
Hangzhou
Elevation/
Depth (m)
Jiang
u
Changsha
W
Nanchang
gn
4000
Guiyang
ingshui Jiang
Sancha H
e
Q
Jia
na
2000
G
Xiang Jiang
1000
Fuzhou
500
Taipei
100
0
T'aichung
-50
Taiwan
-200
-1000
-2000
0
500 Kilometres
ę GIWA 2005
Figure 1
Boundaries of the East China Sea region.
14
GIWA REGIONAL ASSESSMENT 36 EAST CHINA SEA
Physical characteristics
Hydrology
Rivers
Geography
The rivers have signifi cant infl uence on the hydrologic conditions of
The East China Sea is bordered by China, the Korean peninsula, and
the East China Sea, particularly the Yangtze River, Qiantangjiang, and
the Japanese islands of Kyushu and Ryukyu. It is named the East China
Mingjiang (Table 1).
Sea because of its location to the east of mainland China. The length
Table 1
Characteristics of the rivers in the East China Sea.
from the northeast to southwest of the East China Sea is approximately
Drainage area
Length
Water discharge
Sediment load
1 300 km. The width from the east to west is approximate 740 km (Qin
Rivers
( km2)
(km)
(billion m3/year)
(million tonnes/year)
& Zhao 1987).
Yangtze
1 807 200
6 397
928.5
486
Circulation
Qiantangjiang
48 800
604
40.4
7.3
In the East China Sea, the northeast fl ow of the Kuroshio Current limits
Minjiang
61 000
223
53.6
13.4
the transport of East China Sea shelf waters to the Northwest Pacifi c
Jiulongjiang
14 100
245
13.9
2.5
Ocean. The Kuroshio enters the East China Sea from the northeast
(Source: Qin & Zhao 1987)
region of Taiwan and fl ows along the Okinawa Trough; it then turns to
the east and leaves the East China Sea, joining the North Pacifi c Ocean
Yangtze River
at about 30o N through the Tokara Strait (Figure 2).
The Yangtze River (Changjiang) is the longest river in China and one of
the most famous rivers in the world. The Yangtze River is 6 397 km long
The Taiwan Warm Current is formed by water from the Taiwan Strait
and drains an area of 1.81 million km2, of which 19% of is in China. The
and the upwelling of the Kuroshio at the northeast corner of Taiwan
population in the Yangtze River catchment area is 40% of that of China
(Su 1998). The Taiwan Warm Current occupies the broad shelf of the
and the Gross Domestic Product (GDP) of this area is more than 40% of
East China Sea, and aff ects the region off the Yangtze River estuary at
entire country's GDP. Historically, the highest river sediment discharge
water depths of 50 m, inducing local upwelling along the coast in the
has been 560 million tonnes/year. The deposition of river sediments
summer when the south monsoon prevails.
has formed the basis of the modern Yangtze River Delta. The Yangtze
River fl ows across 9 provinces and 167 counties in China. There are many
Historically, the Yangtze
important cities in this drainage, such as Chongqing, Wuhan, Nanjin
YS
Fukuoka
C
Japan
River (Changjiang) car-
and Shanghai (Zhu 1993), which form the most densely populated and
W
Kita Kyushu
ries 928.2 billion m3/year
economically developed areas in China.
C DW
of freshwater and 486
Shanghai
Hangzhou
million tonnes/year of
The landscape of the Yangtze River drainage basin is quite diverse. The
China CC
total suspended matter
area of altiplano, mountain, hill, and basin accounts for 84.7% of the
S
EC
io
(TSM) to the East China
total, with plains accounting for 11.3%, and rivers and lakes occupying
C
Kurush
Sea. In the north, the Yel-
4% (Jiang & Peng 1999). Storm-related fl oods occur frequently in
TW
Fuzhou
Taipei
low Sea Coastal Current
the drainage basin, resulting in substantial annual economic losses.
T'aichung
aff ects the northern part
According to statistical data for 2002, 150 million people were aff ected
Taiwan
ę GIWA 2005
of the East China Sea in
by fl oods, 1 819 persons died in fl ood-related disasters and 120 000 km2
Figure 2
Seasonal circulation patterns
the winter. In the winter,
of farmland were damaged, with 1 460 000 houses destroyed; the direct
in the East China Sea.
the effl
uent plumes from
economic losses combined to approximately 10 billion USD (84 billon
the Yangtze River, as lim-
Yuan) (MCA-DSD 2003).
ited by a salinity of 25-30, fl ow southward along the coast of China,
forming part of the East China Sea Coastal Current (ECSCC), reaching
Qiantangjiang
the northern shelf of the South China Sea. In the summer when the
The Qiantangjiang is the biggest river in Zhejiang Province and is 604 km
Yangtze River fl oods, the freshwater effl
uent plumes disperse eastward
long with a drainage basin of 4.88 million km2. The Qiantangjiang
over the broad shelf at the surface and can reach Cheju Island, aff ecting
has its source in Anhui Province and empties into Hongzhou Bay.
the southern part of the Korean coast, particularly when extreme fl ood
Qiantangjiang is rich in water resources. To date, four reservoirs and
events occur in the Yangtze River drainage basin.
twelve water and electricity stations have been built (Zhu 1993).
REGIONAL DEFINITION
15
Mingjiang
6 000 km2 in 1825 to 2 691 km2 at present because of human activities
The Mingjiang fl ows across the middle of Fujian Province and is 223 km
such as land reclamation (Wang & Dou 1998).
in length, with a total basin area of 61 000 km2. The basin is located in a
subtropical area and the adjacent coastal area is well-vegetated, with a
Taihu
resulting high coverage ratio of forest over the watersheds. Mingjiang
Taihu lake is the third biggest freshwater lake in China and is located
has a low sediment content, with the average sediment discharge at
in Jiangsu Province. The acreage of Taihu is 0.38% of China's area. The
5.70 million tonnes/year (Zhu 1993).
population of this area accounts for 3.08% of that of China. This area is
highly developed and populated, and is called "the Golden Triangle",
Lakes
including Shanghai. Taihu is 68 km long, 35.7 km wide and 2.3 m deep,
Lakes in the area are closely linked to rivers, but are more susceptible to
with an average acreage of 2 425 km2 and a storage capacity of 5.14 km3
anthropogenic eff ects. The plain in the middle of the Yangtze River has
(Wang & Dou 1998).
one of the densest areas of lakes in China (Table 2).
Chaohu
Table 2
Characteristics of the main lakes and reservoirs in the
Chaohu Lake is the fi fth biggest freshwater lake in China and is located
East China Sea region.
in Anhui Province. Chaohu is 61.7 km long, 12.47 km wide and 2.7 m
Lakes
Area ( km2)
Storage ( km3)
Depth (m)
deep, with an average acreage of 770 km2 and a storage capacity of
2.07 km3 (Wang & Dou 1998).
Poyanghu
2 933
14.96
6.5
Dongtinghu
2 432
15.54
6.4
Qiandaohu
Taihu
2 425
5.14
2.3
Qiandaohu Lake is located in Zhejiang Province. It covers 573 km2 and
has an average depth of 34 m. The water transparency is 7-9 m, which
Chaohu
770
2.07
2.7
is considered to be fi rstclass water quality by the local government
Qiandaohu
573
17.84
34
(Qiandao Lake Online 2004).
(Source: Wang & Dou 1998)
Dianshanhu
Poyanghu
Dianshanhu Lake is located in Shanghai, and is Shanghai's freshwater
Poyanghu Lake is the largest freshwater lake in China and is located
fi shing area. Dianshanhu is 12.8 km long, 4.98 km wide and 2.5 m deep,
in Jiangxi Province. The hydrographic parameters of the lake change
with an average acreage of 47.5 km2 and a storage capacity of 0.16 km3
sharply during the year. In the fl ood season, the water level is 21.69 m
(Wang & Dou 1998).
above sea level, and the lake's average width is 17.3 km, with an acreage
of 2 933 km2 and a maximum depth of 29.19 m. But years with the
River input
average lowest water level, the acreage is only 146 km2, or only 5% of
The total riverine input to the East China Sea amounts to 1 200 billion m3/
the largest acreage (Wang & Dou 1998).
year of freshwater and 500 million tonnes/year of suspended sediments,
of which the Yangtze River accounts for 90-95% of both.
Because of human activities such as land reclamation, sedimentation is
aff ecting the fl ood storage capacity of the Poyanghu and its ecosystems
Riverine infl ow to the East China Sea is highly variable with respect to
have deteriorated. According to a national report, the acreage of
water and sediment loads and water quality. The river drainage from the
Poyanghu decreased from 5 000 km2 in the 1950s to 2 933 km2 at
land and islands shows important seasonal patterns, under the infl uence
present, and the loss of fl ood storage capacity is about 490.5 m3 (Wang
of climate zones from sub-tropical in the south to temperate in the north,
& Dou 1998).
and anthropogenic perturbations, such as changes in land use, which
may mean that nutrient concentrations from various rivers may diff er
Dongtinghu
by 5-10-fold (Zhang 2002). Concentrations of nutrients, particularly
Dongtinghu lake is the second largest freshwater lake in China and is
nitrogen, are higher in the catchments with extensive land development,
located in Hunan Province. Dongtinghu is 143 km long, 17 km wide
particularly agriculture. Consequently, the nutrient species ratio can be
and 6.4 m deep, with an average acreage of 2 432 km2 and a storage
up to 100-500 for N:P in the rivers emptying into the East China Sea,
capacity of 15.54 km3. The area of Dongtinghu has also decreased from
which is considerablly higher than in European and North American
16
GIWA REGIONAL ASSESSMENT 36 EAST CHINA SEA
river systems. Other water quality parameters, such as chemical oxygen
coastal region (water depth: up to 50 m), salinity and temperature
demand (COD) and Escherichia coli counts have also been identifi ed as
both have seasonal features: that is, surface water salinity is lower in
problematic in coastal waters aff ected by land drainage.
summer (20-32.5) than winter (30-34.5). Particularly in the region
adjacent to the Yangtze River estuary, the surface water temperature
Chemical parameters
can reach 25-30░C in the summer, but can drop to 10░C in winter. In the
In the East China Sea, a high concentration of riverine nutrient species
broad shelf where water depths average 50-150 m, the water column's
can be identifi ed in the surface waters. The infl uence of land-source
hydrographic parameters are aff ected by plumes of riverine effl
uent
nutrients can be seen at the surface over a distance of up to 250-300 km
and the Taiwan Warm Current, which show as patches of various water
away from the coast. High dissolved inorganic nitrogen/phosphorus
masses. The fl ush period of the East China Sea Shelf is rather short
(DIN/P) and dissolved inorganic nitrogen/silicon (DIN/Si) ratios resulting
(1-2 years), so that the patchy character of hydrographic parameters
from land run-off aff ect a region that is more than about 400-450 km
can be expected to be more important in the East China Sea than in
off the Yangtze River (Zhang 2002).
coastal oceans that have relatively long residence times.
In off shore waters, the concentration of nutrients is relatively low, both
At the shelf edge, the exchange of shelf water with the Kuroshio Current
for surface and near-bottom samples, and a gradient of nutrient species
has an important infl uence on the hydrodynamics of the East China
can be established from the coast to the broad shelf. The Kuroshio
Sea. The incursion of the Kuroshio waters illustrates the upwelling,
Current has a signifi cant impact on the nutrient budget of the East China
particularly off the northeast coast of Taiwan, and the episodic intrusion
Sea. The concentration of nutrients (N, P and Si) in deep waters can be
of surface and sub-surface waters onto the continental shelf. Filaments
one order of magnitude higher than at the surface in the region of the
and frontal eddies from these incursions have been observed at the
Kuroshio. Nutrient concentrations of the Kuroshio subsurface waters are
shelf edge.
5 to 10-fold higher (N, P and Si) than those from the middle shelf area,
which provides a signature of its upwelling across the entire continental
The climate of the Yangtze River Basin can be divided into three
slope. The Kuroshio sub-surface waters have relatively high P/N and
sections as summarised in Table 3: the southwest plateau subregion,
Si/N ratios compared to land-sourced discharges. Thus the Kuroshio
the southwest subtropical monsoon subregion and the East Asia
waters that intrude onto the shelf compensate for the nitrogen-rich
subtropical monsoon subregion. Two-thirds of the Yangtze River Basin
and phosphorus-depleted freshwater effl
uent in coastal areas, such as
belong to the subtropical monsoon subregion. Due to the infl uence of
off the Yangtze River delta, and consequently support high primary
the high Qinghai-Tibet Plateau, the southwest plateau subregion has
productivity in the water column. The change from phosphorus-limited
a long and cold winter but a short summer. The southwest tropical
environments on the coast to nitrogen-limited environments further
monsoon subregion, infl uenced by the air currents from the Indian
off shore can be seen across the broad shelf.
Ocean, is warm and moist in the summer and mild in the winter,
because the high mountains of this region block cold air masses from
Climate and climatic variability
the north. Infl uenced by the hot air currents from the Pacifi c Ocean,
Climate and hydrographic characteristics
the East Asia subtropical monsoon subregion is warmer and humid
The East China Sea is under the strong infl uence of a monsoon climate.
in summer, but colder and drier in winter because of the infl uence of
In winter, a northerly wind prevails, stimulating subsurface surges over
Mongolian high-pressure systems.
the broad shelf, so that the vertical structure of hydrographic parameters
shows mixed profi les in the water column. The southern monsoon
The Zhe-Ming drainage basin belongs to the middle subtropical
starts in the spring and reaches its maximum in the summer and early
monsoon climate zone. It is warmer in the Zhe-Ming Basin than in the
autumn. The water column of East China Sea shelf becomes stratifi ed
Yangtze River Basin. The annual mean temperature is about 20░C. The
in summer with respect to salinity and temperature, particularly in the
monthly average temperature is over 0░C in January and 20-30░C in
middle shelf, most likely due to an increase in freshwater input and
July. The average annual rainfall in the Zhe-Ming Basin is more than
surface heating by radiation.
1 000 mm and increases from north to south.
In the East China Sea, about 70% of the surface area has a water depth
Temperature
of up to 200 m, and deep water is limited to the open boundary at
The temperature of the Yangtze River Basin is infl uenced by many
the Okinawa Trough, where the water depth is up to 2 719 m. In the
factors, such as solar radiation, East Asian atmospheric circulation, the
REGIONAL DEFINITION
17
Qinghai-Tibet plateau, local landforms and so on. The temperature
consequently have large populations or have considerable economic
range over the entire Yangtze River Basin is not too large, with annual
value. Many of these fi shes are species that can be netted by fi shing
mean temperature varying from 15-19░C. But in the upper reaches
boats, such as Sardinella aurita; Sardinella lemurur; Engraulis japonicus;
of the Qinghai-Tibet plateau, the mean annual temperature is about
Argentina semifasciata; Decapterus maruadsi; Larimichthys polyactis;
-4░C and in the lower and middle regions, the annual mean annual
Trichiurus lepturus; and Scomber japonicus.
temperature is 16-18░C. The maximum monthly temperature is in
July with temperatures exceeding 28░C, with the minimum monthly
Freshwater area
temperature of 4-6░C in January.
In China, freshwater aquaculture accounts for approximately 95%
of the total freshwater fi sheries products. As a result of evolution
Precipitation
and diff erentiation of species, the fi sh found in the Yangtze River,
Mean annual rainfall exhibits great spatial variation throughout the
Qiantangjiang and Minjiang are subdivided into general types or
Yangtze River Basin, ranging from 400 mm to 1 600 mm. Annual
groups (Table 4).
precipitation decreases from east to west. In the headwaters of the
Yangtze River Basin, the annual average precipitation is below 400 mm,
Marine waters
but other areas receive 800-1 600 mm of rain per year. At the mouth of
The fi shes living in the East China Sea are divided into 4 groups; the fi rst
the river, the annual average rainfall is about 1 000 mm. On average,
group is composed of tropical species, which represents 61.0% of the
about 60-80 % of rainfall occurs in the summer.
total species identifi ed. The second group is the warm water species,
which represents 37.0% of the total. The third group is cold-temperate
Vegetation
species, of which there are just eight species. These species represent
The Yangtze River basin can be divided into four vegetation regions: the
1.8% of the catch of the East China Sea. The fourth group is the cold-
eastern humid evergreen broad-leaved forest region, the southwestern
water species, which includes only Cololabis saira. Fishes living in the
semi-humid evergreen broad-leaved forest region, the subtropical
East China Sea belong to the fauna of the China-Japan subdivision of
mountainous cold temperate coniferous forest and the Qinghai-Tibet
the India-Western Pacifi c Ocean Division, which is characterised by a
Plateau alpine meadow and grassland region. A short description of
subtropical climate.
climate and vegatation types is shown in Table 3.
Brackish water species, also called estuary fi sh, live their entire life
Fisheries resources
cycle in the waters of the Yangtze River estuary. These include Mugil
The freshwater economic fi shes, listed in Annex VII, are widely
cephalus Linnaeus, Liza haematocheila, Liza carinatus, Lateolabrax
distributed and valuable species in China. Some are fresh and salt
japonicus, Cynoglossus spp., and members of the Tetraodontidae.
species, for example, Coilia mystus, and Coilia ectenes. The reason that
Anadromous fi
shes inhabit coastal waters or off shore areas,
they are listed here is that they are also widely distributed in freshwaters
swimming from the sea to estuaries or the upper reaches of rivers
and have important economic value.
to spawn. After spawning, the parent fi sh die and the off spring go
back to coastal waters or off shore to breed and grow. There are
Annex VIII lists the main economic fi shes of the East China Sea.
more than 10 such species, such as Acipenser sinensis Gray, Coilia
These species have adapted to diff erent kinds of environments and
mystu, Coilia ectenes Jordon et Seale, Salangidae, and Macrura reevesii.
Table 3
Climate and vegetation of the Yangtze and Zhe-Ming river basins.
Average
Mean
River
temperature
precipitation
Climate
Vegetation
basin
(░C)
(mm)
East Asia subtropical monsoon climate Eastern humid evergreen broad-leaved forests. Castanopsis sp. (southern part), Cyclobalanopsis sp. and Quercus sp. (northern part)
Western semi-humid evergreen broad-leaved forests. Cyclobalanopsis delavayi, Castanopsis delavayi, Quercus sp. and Pinus sp.
Yangtze
Southwest subtropical monsoon
15-19
1 067
River
climate
Subtropical mountains cold temperate coniferous forests. Piceaasperanta, Abies fabri and Pinus densata
Southwest plateau climate
Qinghai-Tibet Plateau alpine meadow and grassland. Kobresia pygmea, K. capillifolia and K. humilis
Zhe-Ming
~20
1 000-2 000
Sub-tropical monsoon climate
Southern subtropical evergreen broad-leaved forests
(Source: CWC 2003)
18
GIWA REGIONAL ASSESSMENT 36 EAST CHINA SEA
Table 4
General groups of fi sh in the freshwater part of the East China Sea region.
General fish groups
Species
Ecology
Psephurus gladius; Cyprinus carpio; Carassius auratus; Squaliobarbus curriculus;
Live in areas with slow currents or inshore waters. In addition, these species usually spawn
Survived from the Miocene
Pseudorasbora parva; Misgurnus anguillicaudatus; Siluriformes, Parasilurus asotus L.;
on grass and gravel, and even in the coelome (body cavity) of molluscs. Omnivores and
Epoch and even earlier
and Siniperca chuatsi.
carnivores.
Ctenopharyngodon idellus; Mylopharyngodon piceus; Hypophthalmichthys molitrix;
Aristichthys nobilis; Elopichthys bambusa; Coreius heterodon; Xenocyprininae;
Distributed in the middle and lower reaches of rivers and reservoirs with their spawning timed
River and plains fish cohorts
Megalobrama terminalis; Culter erythroculter; Pseudolaubuca sp.; Parabramis sp.;
to the flood. Most represented.
Hemiculter leucisculus; Aphyocypris and Saurogobio dabryi.
Fish cohorts in middle Asian
Schizothoracinae and Noemacheilus
Distributed in the upper reaches of drainage areas.
mountains
Northern piedmont campestris
Likes living in the gravel bottoms of clear running waters and hyperoxygenated streams with
Acipenser sinensi, Acipenser dabryanus, Hucho taimen and Cobitis linnaeus
fish cohorts
low temperatures. These fish mainly eat aquatic hexapods and benthos species.
Distributed in the middle and lower coastal reaches of rivers, or estuaries and reservoirs,
Channa argus, Clarias fuscus, Macropodus, Eleotris, Mastacembelus aculeatus, Orysias
and live together with fish from the river and plains cohorts, and inhabit tussocks with slow
Indian campestris fish
latipes, Ctenogobius giurinus, Ctenogobius cliffordpopei, Monopterus albus, Bagridae,
currents or stationary waters. Some species have secondary respiratory organs to enable them
and Cyprininae
to survive anaerobic conditions.
Many species have specially adapted organs such as mouths or pectoral fins that have evolved
Homalopteridae, Glyptothorax fukiensis, Vanmanenia, Crossostoma stigmata and
Fish in the Sino Indian mountains
to take the shape of suckers to survive in rapid currents. Their main foods are aquatic insects
Sisoridae
and affixed algae.
Economically important, and which live in the upper river, such as Saurogobio dumerili,
Fishes are small and tend to inhabit the upper river where the water is clean, turbulent and
Mountainous fishes to the south
Acrossocheilus fasciatus, Acrossocheilus (Lissochilichthys) wenchowensis, Varicorhinus
rich in oxygen. Many of the species lay eggs in gravel.
(Scaphesthes) barbatus, Sinibrama macrops, Pelteobagrus fulvidraco and Parabotia maculosa
Cobitis sinensis likes oxygen and has a strong resistance to cold weather while Carassius auratus
Plains fishes to the north
Cobitis sinensis and Carassius auratus
is a polyphageous species with a strong ability to survive in an environment that is low in
oxygen.
Migrating fi shes spend most of their lives in rivers, lakes or streams,
Biodiversity and habitats
migrating to coastal waters or off shore to spawn. These species
Land
include Trachidermus fasciatus and Anguilla japonica, which die after
The Yangtze River Basin has a long history of reclamation. Most forests
spawning. Non-migratory fi sh in shallow inshore waters fi shes spend
have been converted into farmlands. At present, the remnant primary
all of their lives in the Yangtze River estuary or the waters of the coastal
forest is mainly found in remote mountain areas. Much secondary
region. There are more than 10 species, including Periophthalmus
forest is recovering under the government's protection policies. These
cantonensis, and members of the Gobiidae. Fishes in coastal waters
diff erent types of ecosystems provide various habitats for a large
usually live in the sea. During migration for propagation and feeding
number of organisms (birds, insects and fi shes).
off shore of the Yangtze River estuary, they may enter the estuary and
the shallow sea. These fi shes include many species, such as Ilisha
There are 2 653 families and almost 15 000 species of seed plants in the
elongata, Nibea albifl ora, Argyrosomus argentatus, Larimichthys crocea,
Yangtze River Basin, which account for 66.7% and 50% respectively of
Larimichthys polyactis, Scomberomorus niphonius, Trichiurus lepturus,
the numbers found in the country as a whole (Dong 2003).
and Pampus argenteus. Fishes on the edge of the continental shelf
are dominated by Thamnaconus hypargyreus and Ovalipes, occupying
Poyanghu Lake is the biggest freshwater lake in China. The region
26.3% of the catch. Priacanthus macranthus, Carangoides E quula,
contains 350 higher plant species, belonging to 200 genera representing
Tsaius tumifrons, Ommastrephidae, and Daicocus peterseni each
75 families. The wetland vegetation may be divided into four vegetation
represent an additional 7.07-4.67% of the catch. Cubiceps squamiceps
types: aquatic community, marsh, meadow, and sandbank, and more
and Argentina semifasciata are the dominant species among fi shes
than 60 formations (Wang & Wan 2000).
in the middle and upper part of the continental slope, followed by
Priacanthus macranthus, Scombrops boops, Dasyatis microphthalmus,
In Fujian Province, there are 4 703 vascular plant species (including
Doederleinia berycoides, Squalus brevirostris, mini-shrimp, Moridae,
382 ferns, 70 gymnosperm plants and 4 251 angiosperm plants),
and Macrourida. Moridae and Macrouridae are the most important
which account for approximately 18% of the whole country. Among
dominant species among the fi shes in the lower part of continental
them woody plants represent 1 700 species. The number of terrestrial
slope and Kuroshio, followed by Congridae, Rajiformens, Squalus
vertebrate species is 812 (44 amphibians, 155 reptiles, 543 birds, 110
mistsukuris, and Synagrops argyrea.
animals), which account for approximately 28.6% of the whole country.
The province also contains 5 000 insect species, along with a number
REGIONAL DEFINITION
19
of lower plant species, zooplankton and fi shes. The region's forests
River from Chongqing to Pengze in Jiangxi Province. There are 30
cover 60.52% of the area, with this the top ranked amount in China
spawning grounds of the four major Chinese carps in the 1 695 km along
(CNUS 2003).
the mainstream of Yangtze River from Chongqing to Wuxue of Hubei
province, of which 11 spawning grounds lie in between Chongqing
Zhejiang Province has high plant diversity, and has been dubbed the
and Sandouping, 11 between Yichang and Chenglingji, and 8 between
"Plant species treasure of southeastern China". There are 1 400 woody
Chenglingji and Wuxue (Yu 2004). These species of fi shes reproduce
plant species, of which 53 are listed in the rare protection inventory for
in the main stream of rivers, and the spawning behaviour of adults is
Zhejiang Province. There are 635 animal species including animals, birds,
stimulated by water current. The eggs hatch in slow moving water, then
reptiles and amphibians (ZPEPB 2003). The forest coverage of Zhejiang
mature to the larval stage, during which they drif in the stream. This kind
Province is 59.4%.
of life history has, however, been infl uenced by human activity (e.g.
damming) in the middle part of Yangtze River (Li 1989). The Yangtze
Freshwater
River is the primary production area for such dominant species as
The Yangtze River's fi shery diversity and habitat are exemplifi ed by an
Mylopharyngodon piceus, Ctenopharyngodon idellus, Hypophthalmichthys
analysis of the Tianegudao waters of the Yangtze River, in which there
molitrix, Aristichthys nobilis, Acipenser sinensis, Salangidae, Macrura reevesii,
were 8 orders, 18 families and 77 species. Among these, Cypriniforms
Anguilla Japonica, and Eriocheir sinensis. At present, there are 59 species
represents 52 species (67.5%), Perciforms represents 13 species (16.9%);
of freshwater fi shes in Yangtze River, including 24 introduced from
the other orders represent only 1-2 species. In these families, Cyprinidae
abroad and 26 native species, and 9 species from other parts of China.
contains 43 species, which is the maximum number and which
represents 55.8% of the total. The family Cobitidae contains the second
The total number of fi sh species found in the Qiantangjiang basin is
largest number of species, with 6 species accounting for 7.8% of the
202, which belong to 55 families. Cyprinidae has 79 species, representing
sum. The Shannon diversity index is 3.7. Fishes species are abundant in
39.11% of the total. The family Bagridae has 12 species, which is the second
the Yangtze River system, which has 370 species. This is the most of any
largest number and which represents 5.94% of the total. Fifty-three other
drainage basin in China (Table 5).
families contain another 111 species for 54.95% of the total. Six species
of aquicolous wild animals are listed in the national protection project:
The Yangtze River has the largest fi sheries resource of all the drainage
these species are Acipenser sinensis, Psephurus gladius, Trachidermus
basins in China. The maximum catch from the river in 1954 was 450
fasciatus, Andrias davidianus, Neophocaena phocaenoides, and Psephurus
000 tonnes, which was 72% of the country's total freshwater catch.
gladius. Some have almost disappeared, the other species are in severe
The minimum was 180 000 tonnes in 1978, which was still 60% of the
danger. Fish in the Qiantangjiang tend to be distributed according to
freshwater catch in China. From 1988 to 1994, the fry production in the
the following three patterns. Small fi sh species that are capable of
Yangtze River was 63% of the total in China. Endemism dominates the
withstanding high velocity fl ows and that feed on benthic organisms are
ecological habits and characteristics of fi sh in the Yangtze River. The
typically found in the upper reaches of the river that are stream-like. Some
main stem of the Yangtze River contains more than 20 species that
of these species are found in the vicinity of Kaihua and Xiuning, such
spawn with drifting eggs. Ctenopharyngodon idellus, Mylopharyngodon
as Acrossocheilus (Lissochilichthys) wenchowensis, Distoechodon tumiros,
piceus, Hypophthalmichthys molitrix, and Aristichthys nobilis produce a
Sinibrama macrops, Zacco platypus, and Siniperca ronlei. Some widely
particularly large number of eggs. The four major Chinese carps spawn
distributed families and species such as Cyprinidae and Carassius auratus
in 36 areas in a 1 695 km stretch along the mainstream of the Yangtze
are also found in this habitat. In the middle reaches of the river, where
the river is broad and slow fl owing with many shoals or bars, larger size
Table 5
Fish species in some rivers in Asia.
fi sh that feed on benthic species are found, such as Xenocypris argentea,
River
Length (km)
Area (km2)
Genus
Species
Spinibarbus hollandi, Megalobrama terminalis, Squaliobarbus curriculus,
Yangtze River
6 300
1 800 000
37
370
Cyprinus carpio, and Carassius auratus. In the lower reaches of the river
Zhujingjiang
2 100
440 000
49
262
near the estuary the water is wider and deeper with slower fl ows, and
Yellow River
5 464
750 000
27
150
is often aff ected by the tide. Some large fi sh species can be found here,
Heilongjiang
4 370
1 840 000
23
113
including some species that feed on benthos, plankton, or organic
detritus, such as Ctenopharyngodon idellus, Mylopharyngodon piceus,
Red River
1 200
15 000
24
110
Hypophthalmichthys molitrix, Aristichthys nobilis, Megalobrama terminalis,
Mekong River
4 000
790 000
17
255
(Source: Li 2001)
Plagiognathops microleps, Cyprinus carpio, and Carassius auratus.
20
GIWA REGIONAL ASSESSMENT 36 EAST CHINA SEA
There are 160 fi sh species in the in Minjiang system, including 118 pure
carpio, Lateolabrax japonicus, and Oxyeleotris. A habitat description of
freshwater species, of which most belong to the Cyprinoids family and
the major freshwater lakes in the Yangtze River drainage basin is listed
river aquatic fi shes. Minjiang is the main fi shing area for freshwater fi shes
in Table 6.
in Fujian Province. Cyprinoids and Cyprinus carpio are the main fi sh of
economic importance. More than 20 species are commercially fi shed in
Marine waters
the upper reaches of Minjiang, Jianxi, such as Carassius auratus, Cyprinus
The Yangtze River estuary
carpio, Ctenopharyngodon idellus, Squaliobarbus curriculus, Distoechodon
The estuary's habitat is complicated. The area contains 160 species of
tumiros, Plagiognathops microleps, Cirrhinus molitorella, Spinibarbus
phytoplankton, of which 80% are diatoms. Additionally, there are some
caldwelli, Acrossocheilus (Lissochilichthys) wenchowensis, Abbottina
potentially harmful species of dinofl agellates, chrysophyta and blue-
rivularis, Rhinogobio typus, Sinibrama macrops, Silurus asotus, Pelteobagrus
green algae. According to data from 1996-1997, about 90 species of
fulvidraco and Leiocassis spp. Other fi shes have lower commercial
phytoplankton have been identifi ed in the western part of the estuary
value than those listed previously. These are Myxocyprinus asiaticus,
(121░50 ~122░30 E) (Xu et al. 1999).
Opsariichtys bidens, Zacco platypus, Elopichthys bambusa, Hemibarbus
labeo, Saurogobio dabryi, M. terminalis, Pseudolaubuca sinensis, Anguilla
The Yangtze River Estuary also contains 174 species of zooplankton
japonica and Channa asiatica. The dominant species in upper reaches
of which the dominant species as measured by abundance is
of the Minjiang are Xenocypris argentea, Cyprinus carpio, Carassius auratus
crustacean plankton. Others are jellyfi sh and arrow worms. The
and Silurus asotus. The dominant fi sh species in the middle reaches of
dominant zooplankton species are Tortanus vermiculus, Schmackeria
the Minjiang are Cyprinus carpio, Xenocypris argentea, Anguilla japonica,
poplesia, Centropages dorsispinatus, Labidocera euchaeta, Acanthomysis
Culter erythropterus, M. terminalis,and Pelteobagrus fulvidraco. There are
longirostris, Monoculodes limnophilus, Calanus sinicus, Acartia pacifi ca,
more than 20 species of principal economic fi shes in the lower reaches
Sagitta nagae, Sagitta enfl ata, and Muggiaea atlantica. The zooplankton
of the Minjiang, such as Clupanodon thrissa, Clupanodon punctatus, Coilia
species are those off shore species mainly tolerant of wide temperature
ectenes, Salangidae, Cyprinus carpio, Carassius auratus, Plagiognathops
ranges and low salinity, followed by warm water species that are widely
microleps, Hypophthalmichthys molitrix, Aristichthys nobilis, M. terminalis,
distribued in the summer and autumn (Xu et al. 1999). According to
Silurus asotus, Leiocassis sp., Clarias fuscus, Anguilla japonica, Cyprinus
historical data, there are 14 orders represented by 112 species of fi shes
Table 6
Main freshwater lakes of the Yangtze River drainage basin.
Lake
Poyanghu
Dongtinghu
Taihu
Caohu
Dingshanhu
Xihu
Region
Jiangxi
Hunan
Jiangsu
Anhui
Shanghai
Zhejiang
Areas (km2)
2 933
2 432
2 425
2 000
64
6
Storage (km3)
14.96
15.54
5.14
2.07
0.16
0.01
Northern subtropical
Monsoon
Northern subtropical
Northern subtropical
Northern subtropical
Climate
Monsoon
Monsoon
humid
Monsoon
Monsoon
Monsoon
Annual average temperature (░C)
16.5~17.8
16.6~17.0
16.0
16.1
15.5
16.1
Annual mean precipitation (mm)
1 570
1 305
905~1 965
996
1 037
1 473
Soil
Red and yellow brown
Red
Yellow and red brown
Yellow and brown
Rice fi eld
Yellow and brown
Input water (km3/year)
151.02
306.57
8.40
4.46
1.81
0.02
Output water (km3/year)
151.02
302.10
8.14
4.46
1.76
0.02
pH
7.2~8.0
8.1
No data
7.5
8.0
8.5
COD (mg/l)
1.1~1.8
2.6
2.58
4.1
4.0
12.5
Pelagic algae (Number of genera)
154
32
134
71
91
59
Zooplankton (Number of species)
112
81
79
45
34
226
Zoobenthos (Number of species)
65
30
59
55
75
No data
Aquatic higher plant species
119
35
75
54
26
No data
(Number of species)
Fishes (Number of species)
122
114
106
94
10
51
Birds (Number of species)
280
No data
No data
No data
No data
No data
(Source: Wang & Dou 1998)
REGIONAL DEFINITION
21
in the Yangtze River estuary. These can be divided into 3 ecological
and salinity, phytoplankton indicator species, such as Gossleriella
communities: (1) freshwater; (2) brackish; and (3) marine. The estuary
tropica, Asterolampra marylandica, Cheatoceros dadayi, Ceratocorys
contains 17.4% freshwater fi shes from the Cyprinidae and Cobitidae
bipes, Amphisolenia schauinslandi can be found, along with about 20
families, 21.6% brackish water fi shes from the Mugilidae and Gobiidae
zooplankton indicator species, including Euchaeta concinna, Euchaeta
families and 57.2% marine fi shes from the Clupeiformes, Beloniformes,
marina, Pareuchaeta russelli, Sagitta enfl ata Grassi, Liriope tetraphylla,
Perciformes, and Pleuronectiformes families. Coilia mystus and Coilia
Pseudoconchoecia concentrica, and Euphausia tenera.
ectenes are the primary economic species, Acipenser sinensis, Psephurus
gladius, and Trachidermus fasciatus, are the rare species, and the eel parr
Taiwan Strait
of Anguilla japonica is the main parr resource. Exopalaemon annandalei,
The upwelling in southern part of the Taiwan Shoal tends to be
Exopalaemon carinicauda, and species in the Penaeinae family are the
low temperature, high salinity and high density from east to west
main economic shrimp types in the estuary. Eriocheir sinensis, Scylla
throughout the year. This is an area where bottom water travels up
serrata, and Portunus trituberculatus are the main economic crabs.
along the slope and forms an upwelling. According to investigations
from 1987 to 1988, 102 phytoplankton species belonging to 22 families
Zhoushan Archipelago waters
and 38 genera are found in the region (Hong et al. 1991). There were
There are 261 species of phytoplankton in this area (Zheng 2003).
more zooplankton species than phytoplankton species, however,
The predominant species are Skeletonema costatum, Chaetoceros
according to an investigation from 1984 to 1985, which recorded
lauderi, and Nitzschia pungens. Inshore warm temperature species
491 species in total, with 118 species of copepods and 106 species of
are dominant. There are 223 species of zooplankton in this area, with
medusa (Cai et al. 1995). The economically important fi sh species are
abundant summer biomass. The main species are Calanus sinicus,
Sardinella lemuru; Decapterus maruadsi; and Trachurus japonicus.
Labidocera euchaeta, Pseudeuphausia sinica, Acartia pacifi ca, and Sagitta
enfl ata etc. (Zheng 2003). There are 77 species of mollucs, 77 species of
polychaetes, 95 species of crustaceans, and 136 species of protozon in
the benthos. The Zhejiang coastal waters contain 203 species of nekton,
Socio-economic characteristics
and the main fi sh species are Pseudosciaena polyatis, Pseudosciaena
crocea, largehead hairtail, Ilisha elongata, Pampus argenteus, Harpodon
Population and economy
nekereus, Miichthys miiuy, Muraenesox cinereus, Saurida spp., Acetes
Population growth
chinensis, Exopalaemon carinicauda, Portunus trituberculatus Miers, and
Over the last few decades, the annual population growth in China has
Sepiella maindroni.
been 6.45 per million overall. Table 7 shows the natural growth rate
in various parts of the East China Sea region. Shanghai has the lowest
Kuroshio Current
natural growth rate in the region. Shanghai has become an attractive
The Kuroshio Current is one of the largest currents adjacent to the
area for China's young people and for foreigners both because of its
continental shelf in the East China Sea. The fl ows and quantities of heat
unique geographic location and its rapid economic growth, but the
and water have an important infl uence on the shallow waters of the
local natural growth rate remains
Table 7 Annual
population
sea's continental shelf. According to cooperative research conducted
low. Zhejiang and Fujian Province
growth rate.
by China and Japan from 1984 to 1990, the following species have been
have moderate population
Growth rate
Country and region
document in Kuroshio waters: 419 species of phytoplankton, 697 species
(per million)
growth rates, but in relatively less
China
6.45
of zooplankton, and 180 species of fi sh (Zheng 2003).
developed provinces, such as
Shanghai
-0.54
Jiangxi, the population growth
The characteristics of the main biotic community in the Kuroshio
Jiangsu
2.18
rate is higher.
Current are as follows. The phytoplankton is composed of species
China
Zhejiang
3.79
tolerant of high temperatures and salinities, in addition to species that
Fujian
5.78
Population structure
tolerate high temperatures and low salinities and low temperatures
Anhui
6.03
Table 8 shows the population
and high salinities, along with species with a wide range of tolerances.
Jiangxi
8.72
structure of the region.
Zooplankton populations are represented by warm temperate
Japan
2.00
The population of China is
species in the off shore zone and tropical species in the ocean.
Korea
8.00
characterised by a young age
Because the Kuroshio waters are characterised by high temperature
(Source: NBSC-DPSSTS 2003)
structure, with about 21.29%
22
GIWA REGIONAL ASSESSMENT 36 EAST CHINA SEA
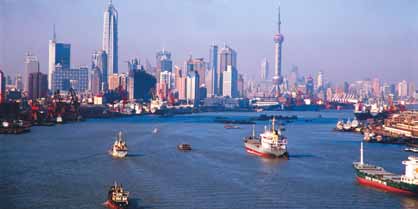
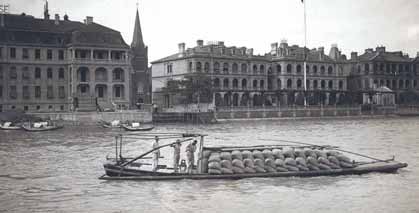
Unemployment rate in urban areas
Of the three Asian countries of China, Japan and Korea, China has
lowest unemployment rate, but the phenomena is changing because
of political reform and the implementation of new economic policies.
The unemployment rate is growing because of business reforms and
lay-off s. This trend is more signifi cant in the coastal area than in inland
regions, particularly in Shanghai, which is considered to be the centre
of the Chinese economy, which makes for more competition for jobs
(NBSC 2003a, 2003b).
Economy
In the last several decades, the economies of China, Japan, and Korea
have grown rapidly. Compared to 1990, China's 2001 GDP has grown
by four-fold (Figure 4). Most coastal cities and provinces, including
Shanghai, Zhejiang, Jiangsu, and Fujian, have shown rapid increases
in GDP (NBSC 2003a). Inland provinces such as Anhui and Jiangxi have
had correspondingly weak economic growth. Figure 5 shows the
contribution of the three main industry sectors to the growth of the
GDP. The contribution of primary industry to the GDP in China is 18-
20%, which is higher than that of Japan and Korea. This indicates that
agriculture is still an important economic factor in Chinese society.
Figure 3
The changes of the skyline of Shanghai.
(Photo: Corbis)
50000
under age 15, and 8.17% over age 65. This trend is more signifi cant in
1990
less developed provinces such as Jiangxi. But Shanghai has 10.72% of its
1998
40000
population under age 15, and 13.44% over age 65, which shows a trend
1999
toward an aging population. According to one report (SFSRG 2002), the
population in the age bracket of age 50-64 will represent 46.67% of the
2000
30000
population in 2015, suggesting the accelerating aging of Shanghai's
2001
population. Japan's population aged 65 and over amounts to 17.6%,
GDP (US dollars)
suggesting a more serious aging problem than in China or Korea.
20000
Table 8
Population structure in the East China Sea region.
10000
Age 0-14
Age 15-64
Age 65 and over
Population
Country and region
(million)
(million)
(%)
(million)
(%)
(million)
(%)
China
1 259
268.0
21.29
888.2
70.55
102.8
8.17
0
Shanghai
16.01
1.716
10.72
12.14
75.83
2.152
13.44
China
Japan
South Korea
Jiangsu
72.97
13.72
18.80
52.04
71.32
7.215
9.89
Figure 4
Gross domestic product in China, Japan and South Korea.
Zhejiang
45.77
7.520
16.43
33.14
72.41
5.104
11.15
(NBSC 2003b)
China
Anhui
62.78
15.19
24.19
42.42
67.57
5.171
8.24
Urbanisation
Fujian
34.13
7.198
21.09
24.34
71.32
2.594
7.60
At present, Shanghai is the most urbanised area of China. The non-
Jiangxi
41.52
10.19
24.54
28.27
68.09
3.058
7.37
agricultural population of Shanghai was 10 million in 2001, which has
Taiwan
22.52
4.60
20.42
15.89
70.56
2.03
9.02
increased by 15.6% as compared to 1990. The urbanisation level has
Japan
127.0
18.36
14.46
86.19
67.87
22.34
17.60
reached 75.3%. In 2000, the immigrant population of Shanghai was
Korea
47.34
10.10
21.34
34.11
72.05
3.31
7.00
(Source: NBSC 2003a, NBSC 2003b)
3.87 million people, which showed an increase of 2.81 million compared
REGIONAL DEFINITION
23
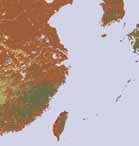


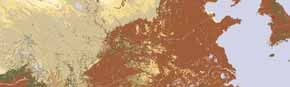


70
Major socio-economic activities
Primary industry
Land use in the Yangtze River Basin
Secondary industry
60
The forests of the Yangtze River Basin are mainly found in western
Tertiary industry
Sichuan Province, northern Yunnan Province, southwestern Hunan
50
Province, southern Anhui Province and northern Jiangxi Province. The
total forest area in the Yangtze River Basin is 390 000 km2, accounting
40
for 29.7% of the country's forested area. The forests cover 21.9% of the
GDP (%)
Yangtze River Basin. Grasslands are mainly found in the headwater region,
30
while farmlands are mainly found in the middle to lower reaches of the
20
Yangtze River Basin (Figure 7). During the last ten years, as a result of
high demographic and developmental pressures, land use in the upper
10
reaches of the Yangtze River Basin has changed dramatically. Forests
have been cut down and converted to agricultural land and human
0
settlements or industrial zones. These changes have resulted in more
China
Japan
Korea
pollutant loads and soil erosion into the Yangtze River (NIES 2004).
Figure 5
Contribution of primary, secondary, and tertiary
industries to the growth of China's GDP.
(NBSC 2003b)
Landuse
South
to 1988. There is an average of two migrants among nine now in
Korea
Developed
Shanghai (Gu 2003). The Yangtze River Delta is the most developed
Cropland
Grassland
Japan
and densely populated area. In 2000, the average urbanisation level
Yangtze
Shrubland
was 49.61%, as compared to the national average of 36.22%. The
Savanna
China
Forest
urbanisation level in the provinces of Jiangsu and Zhejiang is 41.19%
Water
and 48.67%, respectively (Kong 2002). The urbanisation level of Fujian
Wetland
Barren
Taiwan
Province in 2000 was 37% (Huang 2004), equivalent to the national
Tundra
0
500 Kilometres
level. However, in the less developed provinces like Jiangxi and Anhui,
Snow or Ice
ę GIWA 2005
the urbanisation level was only 27.67% in 2000 and 22.3% in 1998
Figure 7
Land use map of the Yangtze River Basin.
respectively (Zhang & Lv 2003, Zhou & Wu 2000), both of which are
Agriculture
lower than the national average. Figure 6 shows the urbanisation level
The number of individuals working in agriculture represents 67.1% of
of the region, which shows that the overall urbanisation level of China is
the total population of China, which is above the average for the world
much lower than the more developed countries of Japan and Korea.
as a whole (Zhang & Tian 2003). About 202.9 million people work in
agriculture in the East China Sea region. The region's main crops are rice,
wheat, corn, cotton, beans, and tubers. In the last fi fteen years, the land
90
use in the lower reaches of the Yangtze River has shifted from farmland
80
to an urban landscape. The amount of farmland as a percentage of
70
the total acreage has decreased from 47.3% in 1985 to 44.3% in 2000.
(%) 60
In contrast, the proportion of urban land use increased from 9.73% in
50
1985 to 13.1% in 1996 (Zhen et al. 2003a). Water usage in agriculture
40
varies according to the level of cultivation and extent of irrigation in
30
each province. Jiangsu Province uses the largest amount of water for
Urbanisation level 20
irrigation. Shanghai uses the least amount of water, which corresponds
10
to the higher industrialisation and urbanisation of the city.
0 China Shanghai Jiangsu Zhejiang Fujian Anhui Jiangxi Japan Korea
Country
Fisheries
Figure 6
The urbanisation levels in China, Shanghai, Jiangsu,
Fisheries contributes signifi cantly to the economy of the coastal
Zhejiang, Fujian, Anhui, Jiangxi, Japan and Korea.
(Gu 2003, Kong 2002, Huang 2004, Zhang & Lv 2003, Zhou & Wu 2000, NBSC 2003b)
regions. The fi sheries forms a major sector in economy, but is also
24
GIWA REGIONAL ASSESSMENT 36 EAST CHINA SEA
critical in providing employment
opportunities, income, and food
80
Agricultural water use 59.7%
security. In 2000, the fi sh catch in the
60
East China Sea emounted 3.8 million
% 40
tonnes (FAO 2003).
20
Tourism
0 Shanghai Jiangsu Zhejiang Anhui
Fujian
Jiangxi
Tourism is becoming increasingly
important for the economy of China's
coastal regions. In the twelve years
from 1990 to 2001, the total number of
80
Industrial water use 29.9%
people who travelled domestically in
60
China increased from 280 million to 784
% 40
million. Incomes also increased from 0.2
20
billion to 4.25 billion USD (1.70 billion to
80
35.22 billion yuan) over the same period
Domestic water use 10.4%
0 Shanghai Jiangsu Zhejiang Anhui
Fujian
Jiangxi
(Xu 2003). With the country's increasing
60
income and national holidays, and
% 40
changes in the Chinese concept of
20
consumption, China's domestic tourism
0 Shanghai Jiangsu Zhejiang Anhui Fujian Jiangxi
has developed rapidly (Xu 2003). East
China, Suzhou, Hangzhou, Shanghai,
Figure 8
Water use by economic sector for Jiangsu, Shanghai, Zhejiang, Fujian, Jiangxi, and
Wuxi and Nanjin have become important
Anhui provinces.
tourist destinations. According to a
(CNRD 2004, MWRC 1999a, MWRC,2001a)
report from regional governments, the
income from tourism in Shanghai exceeded 25.4 million USD over the
and include damaged ecosystems and increased soil erosion, which
holidays of May 1-7, 2004 (Dragon TV of Shanghai 2004).
will bring socio-economic problems and negative eff ects on the coastal
environment. The project to transfer water from China's south to the
Water-related issues
north is designed to solve freshwater shortage problems in northern
Figure 8 shows that agriculture consumes the greatest amount of water
China. Environmental problems that will result from this project,
by sector. Agriculture water usage is 59.7% of the total amount of water
such as soil erosion and ecosystem changes, along with the issue of
use in China. Industry and domestic uses consume 29.9% and 10.4%,
transporting the water itself remain under debate.
respectively. In China, the main use of agriculture water is for irrigation.
With the development of the economy and industrialisation and
Legal and institutional frameworks
urbanisation, non-agricultural water demands will increase dramatically.
At present, China has 6 volumes of environmental protection laws,
Domestic water consumption is lower than agriculture and industry,
9 volumes of resource management laws, many administrative
but with the increasing population in the region, this requirement will
procedures and rules of law pertaining to environment protection
also increase.
and resource management, as well as more than 400 diff erent types of
national environmental standards. These laws and rules together form
Two representative engineering projects are the Three Gorges Project
the framework for the country's legal system. Annex III-VI show a list of
and China's South-North Water Transfer Project. The main purpose of
laws and regulations existing in the region.
Three Gorges Project is to prevent fl oods and produce electric power.
The environmental problems caused by the project are controversial
REGIONAL DEFINITION
25
Assessment
Table 9
Scoring table for the East China Sea region.
This section presents the results of the assessment of the impacts
Assessment of GIWA concerns and issues according
The arrow indicates the likely
of each of the fi ve predefi ned GIWA concerns i.e. Freshwater
to scoring criteria (see Methodology chapter).
direction of future changes.
T
T
C
C
Increased impact
A
A
0 No
known
impact
2 Moderate
impact
shortage, Pollution, Habitat and community modifi cation,
IMP
IMP
T
T
No changes
C
C
A
A
1 Slight
impact
3 Severe
impact
Unsustainable exploitation of fi sh and other living resources,
IMP
IMP
Decreased impact
y
Global change, and their constituent issues and the priorities
a
c
t
s
t
a
l
p
*
*
n
a
c
t
s
identifi ed during this process. The evaluation of severity of each
East China Sea
p
i
c
i
m
nme
Score
m
i
m
communit
y
*
*
*
issue adheres to a set of predefi ned criteria as provided in the
c
t
s
o
c
t
s
v
i
r
o
n
o
a
l
t
h
t
her
erall
En
impa
Ec
He
O
impa
Ov
Priorit
chapter describing the GIWA methodology. In this section, the
Freshwater shortage
1.7*
1
0
0
1.0
4
scoring of GIWA concerns and issues is presented in Table 9.
Modification of stream flow
1
Pollution of existing supplies
2
Changes in the water table
2
Pollution
1.7*
1
1
2
1.5
2
T
C
A
Microbiological pollution
1
Freshwater shortage
IMP
Eutrophication
3
Chemical
1
Environmental impacts
Suspended solids
1
Modifi cation of stream fl ow
Solid waste
1
Thermal 1
In the past century, the expansion of irrigation, development of industry
Radionuclide
0
and population growth have been the major factors behind increased
Spills
1
water demands.
Habitat and community modification
2.0*
1
0
2
1.4
3
Loss of ecosystems
2
Modification of ecosystems
2
The agricultural sector is China's largest consumer of water, representing
Unsustainable exploitation of fish
2.4*
2
1
0
1.6
1
59.7% of total amount of water use, while industrial and domestic uses
Overexploitation of fish
3
together represent only 29.9% and 10.4%, respectively (average values
Excessive by-catch and discards
0
from 1997 to 2002), even though the industrialised sector in Shanghai
Destructive fishing practices
3
Decreased viability of stock
2
consumes 69.0% of the area's water, with 16% and 15% consumed
Impact on biological and genetic diversity
1
respectively by agricultural and domestic use. In most areas of China,
Global change
0.5*
0
0
1
0.5
5
industry and agriculture consume between 59.3-70.1% and 21.4-31.4%
Changes in hydrological cycle
1
of all water, while domestic use is only 8.5-13.9%.
Sea level change
0
Increased UV-B radiation
0
Changes in ocean CO source/sink function
0
2
In the Yangtze River drainage basin, the main use of water in agriculture
*
This value represents an average weighted score of the environmental issues associated
to the concern. For further details see Detailed scoring tables (Annex II).
is irrigation. The eff ective irrigation area increased from 100 000 km2 in
** This value represents the overall score including environmental, socio-economic and
1978 to 115 500 km2 in 1999 (Figure 9). Industry also consumes a great
likely future impacts. For further details see Detailed scoring tables (Annex II).
*** Priority refers to the ranking of GIWA concerns.
deal of water. This consumption is increasing with accelerated economic
26
GIWA REGIONAL ASSESSMENT 36 EAST CHINA SEA
drainage basin with a capacity of 17.53 billion m3, which eff ectively
doubled the existing reservoir capacity. In 2000, the total capacity was
120 000
at 27.28 billion m3 (SCTGPCC 2002). Together with other projects such as
the Three Gorges Dam Project, and the South-to-North Water Diversion
110 000
2
Project, this new construction will presumably result in the reduction
Km
of river run-off , particularly in the dry season, aff ecting the health of
100 000
freshwater ecosystems as well.
90 000
1978
1982
1986
1990
1994
1998
Pollution of existing supplies
Year
Population growth, urbanisation and industrialisation have accelerated
Figure 9
Change in total irrigation area for Anhui, Jiangsu,
environmental pollution and water quality deterioration. The rivers in
Shanghai, Zhejiang, Jiangxi and Fujian provinces.
Shanghai have been seriously polluted, with more than 92.2% of the
(NBSC-RERT 2004, BSA 2003, BSF 2003, BSJ 2003a, BSJ 2003b, BSZ 2003)
river sections monitored containing water that was not acceptable
for domestic use. Pollution of the Yangtze River drainage basin is
development. Industrial water use increased from 37.7 billion m3 in 1997
an important problem too, especially in the delta area. In the area
to 42.7 billion m3 in 2002, with a 2.5% average growth rate per year
adjacent to the Yangtze River Estuary, hypoxia is a problem (Figure 11).
(Figure 10).
The estuary receives fl ows from various land-based pollution sources,
which may alter the ecosystem.
Domestic water use has also shown an increasing trend, from
12.8 billion m3 in 1997 to 15.3 billion m3 in 2002 (Figure 10), with a 3.6%
Monitoring of sections of the Yangtze River system in 2001 and 2002
average growth rate per year. Population growth is the main cause
has shown that water quality has deteriorated. The key pollution
for this increase. This has resulted in a decrease in the available water
indexes reported by the national environmental protection agency
resources per person per year to 1 763 m3 in 2000.
are petroleum hydrocarbons, ammonia, nitrogen and the potassium
permanganate index. Pollution is fairly minimal in rivers of the Zhejiang
The traditional approaches of dam construction, water transfer,
and Fujian Provinces, but problems of water quality are a common
dredging and canal dredging remain the main solutions for meeting
topic of public discussion. The key pollution indicators are petroleum
this increasing water demand. In the late 1980s, 11 930 diff erent-sized
hydrocarbons and ammonia nitrogen. Among 20 monitoring sites in
dams were constructed in the upstream reaches of the Yangtze River
drainage. As of 2002, 650 large-scale (capacity: >108 m3) and medium-
sized (capacity: ~107 m3) reservoirs had been built in Jiangsu, Zhejiang,
Anhui, Fujian and Jiangxi provinces. In the 1990s, there were 11 newly
East China
Sea
built large-scale reservoirs in the upstream reaches of the Yangtze River
Shanghai
16
45
Domestic water use
Industrial water use
15
14
40
3
3
13
Billion m
Billion m
12
35
11
10
30
1997
1998
1999
2000
2001
2002
Dissolved oxygen
Year
< 2 mg/l
Figure 10 Total industrial water consumption and domestic water
< 3 mg/l
use for Anhui, Jiangsu, Shanghai, Zhejiang, Jiangxi and
< 3.5 mg/l
ę GIWA 2003
Fujian provinces.
Figure 11 Hypoxy areas in the East China Sea.
(MWRC 1999a, MWRC,2001a, MWRC 2002a, CNRD 2004)
(Source: Li & Zhang 2002)
ASSESSMENT
27
Taihu Lake in 2002, the percentage that was of grade III, grade IV, grade
COD reached 1.71 million tonnes, while the discharge of industrial
V and worse than grade V was 5%, 35%, 5% and 55% respectively.
wastewater was reduced, with the total amount at 5.74 billion tonnes,
The main pollutants are nitrogen and phosphorus, with the lake at
and a COD of 1.05 million tonnes. Industrial and domestic wastewater
a medium level of eutrophication. Water quality improved slightly
discharges to surface waters resulted in pollution, which results in water
compared relative to 2001 (SEPAC 2001, 2002).
quality problems in meeting water requirements in urban areas.
In the past 30 years, the quality of surface water in China has decreased
Changes in the water table
remarkably. Polluted agricultural run-off , and untreated industrial and
Currently, groundwater in urban areas is used mainly in industry and
domestic wastewater discharges are main sources of pollution. Rivers
for domestic use. Industry and agriculture once accounted for most
and lakes were reported to be polluted by bacteria, nutrients, organic
water consumption, but economic development has led to increasing
compounds and other toxics carried in high-volume wastewater
pollution of surface and groundwater sources and an associated
discharges. Fertilisers and pesticides have both been identifi ed in
increased demand for good quality groundwater. Domestic water use
agricultural run-off . Fertiliser use in agriculture (Figure 12), increase
has also increased, particularly in Fuzhou in Fujian Province and in some
in cultivated area, and nutrient runoff can all lead to harmful algal
cities of Zhejiang Province.
blooms (Shen et al. 1999) in lake and coastal waters (Li & Daler 2004).
An increase in domestic and industrial wastewater discharges is still the
As the consumption of groundwater has always been higher than the
main source of pollution in urban areas in China (Figure 13). In 2000, the
supply, the water table is dropping. This is a worsening problem in
total discharge of domestic wastewater reached 5.44 billion tonnes,
Shanghai, Fuyang in Anhui Province, and Wuxi, Changzhou and Suzhou
in Jiangsu Province. Overextraction of groundwater on the coast has
4
resulted in seawater intrusion; this problem is particularly serious in
Shanghai
Jiangsu
Zhejiang
Anhui
Xiamen in Fujian Province.
3
Fujian
Jiangxi
Excessive extraction of groundwater in China has resulted in a problem
2
called funneling, which results land subsidence, seawater intrusion, and
other serious environmental problems. There are more than 13 places
Million tonnes
where the area aff ected by funneling is larger than 100 km2. The
1
worst case is in the region of Wuxi, Changzhou and Suzhou in Jiangsu
Province in the lower reaches of Yangtze River, where the funnel eff ect
0
1978
1983
1988
1993
1998
2003
covers a total area of over 5 000 km2, which seriously threatens the social
Year
and economic growth of this region. Rapidly dropping water tables
Figure 12 Consumption of chemical fertiliser by province.
have resulted in ground subsidence, particularly in Shanghai, which is
(NBSC 2003a, NBSC-RERT 2004)
located in the region of Yangtze River Delta, where civil construction
8
2.0
works face diffi
cult challenges.
7
1.5
oones
Socio-economic impacts
o
nnes
6
1.0
Freshwater shortages in the coastal area aff ect economic development.
Billion t
C
OD Million t
Water supply is a problem in some coastal areas and islands. In Shanghai
5
0.5
and the mid- to southern region of Jiangsu Province, the average water
4
0.0
volume is 245.85 m3 and 457.55 m3/person/year. It is worse in coastal
1995
1996
1997
1998
1999
2000
2001
2002
areas, such as in the Zhoushang Islands. The 300 000 people who live
Volume of industrial waste water discharge (Billion tonnes)
on the island face water shortages and drinking water problems (Wang
Volume of domestic waste water discharge (Billion tonnes)
et al. 2003).
Amount of industrial COD discharge (Million tonnes)
Amount of domestic COD discharge (Million tonnes)
Figure 13 Industrial and domestic wastewater discharges in
Conclusions and future outlook
Anhui, Jiangsu, Shanghai, Zhejiang, Jiangxi and Fujian
Freshwater shortage has only a slight impact in the East China Sea
provinces.
(NBSC 2002, BSA 2003, BSF 2003, BSJ 2003a, BSJ 2003b, BSZ 2003, SCMC 2002)
region. The growth in water consumption for irrigation use and
28
GIWA REGIONAL ASSESSMENT 36 EAST CHINA SEA
industrial development have caused a decrease in the availability
Table 10
Bacterial indices and harmful algal bloom toxins in the
of water for drinking and agricultural purposes, and a concomitant
coastal area of Fujian Province.
Harmful algal
decrease in fi sh productivity in river basins. While the deterioration of
Total count of
Escherichia coli
Vibrio
Shellfi sh
bloom toxins
bacteria (cell/g)
(cell/g)
(cell/g)
water quality has had only moderate eff ects on human health, there has
(g/g)
been an increase in the cost of water treatment and supply. In the future,
Oyster
2 136
>190
1 100
ND
Sinonovacula
it is anticipated that water withdrawal from rivers and other sources
7 00
>240
3 200
ND
constricta
will increase as a consequence of population growth and expansion
Venerupis variegate
3 000
24
700
ND
of industrialisation and urbanisation, and that the pollution of surface
Note: ND = Not Detected.
and groundwater resources due to excessive use of agrochemicals in
(Source: FOFA 2001)
the region is likely to increase. Freshwater shortage related issues might
become an important environmental problem in the future, unless
are Noctiluca scintillans and Prorocentrum triestinum, followed by
corrective measures are put in place.
Gymnodrium sp. The event caused shellfi sh losses in a 133 400 km2
cultivated area near the coast of Fuding (Zan et al. 2004).
Water supply shortages are increasing in the area and this trend will
persist as a result of the increasing population, intensifi ed urbanisation
The main reason for bacterial pollution in economic shellfi sh is industrial
and the increase in water pollution. The area's urbanisation will make
and domestic wastewaters. In 1995, 41-77% of the total industrial
water shortages increasingly problematic.
wastewater discharges met national standards, and the wastewater
treatment capacity in the coastal regions of the East China Sea was
between 64 -86% of the total discharge (Figure 14). In 1999 the rate of
wastewater treatment was considerably increased, but large amounts
T
C
A
Pollution
IMP
of untreated wastewater continue to be discharged directly to water
bodies, in amounts that have recently increased. The treatment capacity
Environmental impacts
for domestic sewage and household wastes is even lower than the rate
Microbiological pollution
of industrial wastewater treatment. In Shanghai, the treatment rate of
In 2001, an investigation of the bacterial index of economic shellfi sh
domestic sewage is up to 60% and the rate of sanitary disposal of
was conducted in the coastal areas of Shanghai, Zhejiang, and
household refuse is between 70-90%, which has been found to be an
Fujian Provinces. The results show that hygienic indicators such as
important reason for bacterial water pollution. In some badly polluted
total bacterial counts and Escherichia coli in two types of economic
near shore areas, the hepatitis virus, Escherichia coli and other infectious
shellfi sh (Bullacta exarata, and Sinonovacula constricta) in the coastal
virus have been found in the water. In 1988, Scapharca subcrenata was
area of Shanghai meet national standards. Economic shellfi sh in most
contaminated by hepatitis virus in the Lvsi area, which resulted in
coastal areas of Zhejiang Province meet national standards, while in
a hepatitis A outbreak in Shanghai, which infected about 300 000
Shenjiamen, Wenzhou and Taizhou Bay, the amount of fecal Escherichia
people.
coli in economic shellfi sh is above national biological standards by a
factor of 8.0, 8.0, and 1.5, respectively (ZOFA 2001). The standard value
of fecal Escherichia coli in economic shellfi sh is 3 cell/g (fresh meat). In
1995
1999
100
other areas of Zhejiang Province the amount of fecal Escherichia coli
is 0.43- 2.4 cell/g (fresh meat), with the total count of heterotrophic
80
bacteria at about 3 400-83 000 cell/g of fresh meat, and the count of
60
Vibrio as high as 3 960 cell/g fresh meat (ZOFA 2001). In the coastal areas
of Fujian Province, the total count of bacteria in economic shellfi sh is
%
40
lower than the national aquatic product hygienic standards, and no
harmful algal bloom toxins were detected in shellfi sh (Table 10).
20
0
On May 4th 2002, a harmful algal bloom covering about 30 km2 was
Shanghai
Jiangsu
Zhejiang
Anhui
Fujian
Jiangxi
detected in the off shore area of Pufuning Bay in Fujian Province. The
Figure 14 Industrial wastewater treatment capacity.
next day it grew to 500 km2. The dominant harmful algal species
(CNRD 2004)
ASSESSMENT
29
Eutrophication
Since the 1980s, the use of chemical fertiliser has greatly increased
Japan
(Figure 12, 15 and 16), while aquaculture is also expanding. The loss of
nutrients from these activities and the run-off of organic substances,
nitrogen and phosphorus have caused eutrophication to be ubiquitous
Hefei
Nanjing
in rivers, lakes and the coastal sea. The main source of nitrogen is run-off
Shanghai
from agriculture, while most phosphorus comes from domestic sewage
ze
ngt
Ya
and industrial wastewater discharges.
Hangzhou
2.5
Shanghai
Jiangsu
Zhejiang
Anhui
Pollution levels
2.0
Fujian
Jiangxi
Low
Medium
1.5
High
Million tonnes
Very Fu
hi z
gh
1.0
Taipei
ę GIWA 2005
Figure 17 Distribution of pollution in the coastal area of the
0.5
Yangtze River estuary.
(SOA 2003a)
0
1978
1983
1988
1993
1998
2003
The rate of pollution in the East China Sea is beginning to slow (Table 11).
Year
The main areas of pollution remain the Yangtze River estuary and
Figure 15 Consumption of nitrogenous fertiliser by region.
Hangzhou Bay (Figure 17). The main pollutants are inorganic nitrogen
(NBSC 2003a)
and phosphorus, which have concentrations that are much higher
0.6
Shanghai
Jiangsu
than the national standard, particularly in the Yangtze River estuary
Zhejiang
Anhui
and Hangzhou Bay, where the proportion of nutrients is aff ected by
0.5
Fujian
Jiangxi
the freshwater infl ow. The phytoplankton biomass has increased and
0.4
the concentration of chlorophyll-a can be as high as 16 mg/m3 in coastal
areas, resulting in an increased frequency of harmful algal blooms in
0.3
the East China Sea. In 2003, there were 86 harmful algal blooms with a
Million tonnes
0.2
total area of up to 12 990 km2, 8.6 times and 58.4 times of that in 1993
respectively (Figure 18). These blooms had a measurable impact on fi sh
0.1
stocks and other ecosystem services.
0
1978
1983
1988
1993
1998
2003
Year
The main pollutants carried to the East China Sea by the Yangtze
River, Mingjiang, and Jiulongjiang are COD, nutrients, petroleum
Figure 16 Consumption of phosphate fertiliser by region.
(NBSC 2003a)
hydrocarbons, and heavy metals, which have all been on the rise in
Table 11 Pollutants discharged to the East China Sea by major rivers.
COD
Phosphate
Inorganic nitrogen
Heavy metal
Arsenic
Petroleum
Totals
Rivers
Year
(tonnes)
(tonnes)
(tonnes)
(tonnes)
(tonnes)
hydrocarbons (tonnes)
(tonnes)
2002
2 480 000
31500
1 7800 000
15 100
1 550
49 600
4 350 000
Yangtze River
2003
2 7200 000
700 000
30 300
36 300
3 340
69 900
2 930 000
2002
900 000
1 590
10 500
1 780
43
2 810
107 000
Minjiang
2003
1720 000
1 160
19 800
2 530
160
7 760
204 000
2002
1240 000
1 060
2 650
8 410
30
614
136 000
Jiulongjiang
2003
2330 000
2 020
6 930
370
30
420
243 000
(Source: SOA 2002, SOA 2003a)
30
GIWA REGIONAL ASSESSMENT 36 EAST CHINA SEA
Worse than grade IV 24.3%
100
14
Frequency
Area covered
12
80
)2
10
m
Grade II 43.2%
60
Grade IV 12.2%
y
8
40
6
F
r
equenc
4
v
e
red (thousand k
20
2
Area co
Grade III 20.3%
0
0
1993
1995
1997
1999
2001
2003
Year
Figure 19 Water quality in the coastal area of the East China Sea.
(SEPAC 2001)
Figure 18 Trends in harmful algal blooms in the East China Sea.
(SOA 1999, SOA 2000, SOA 2001, SOA,2002, SOA 2003a, SOA 2003b)
Table 12 Shellfi sh pollutants of the Shanghai coastal area.
recent years (Table 11). Effl
uents from the lake contribute to pollution
Petroleum
Zinc (Zn)
Copper (Cu)
Shellfi sh
hydrocarbons
(mg/kg wet wt.)
(mg/kg wet wt.)
in the estuary and make it more diffi
cult to control the pollution. The
(mg/kg wet wt.)
water quality in most estuaries does not meet the requirements of
Oyster
61.70
69.00
278.00
the proposed "national clean water strategy" for the East China Sea.
Bullacta exarata (Philippi, 1848)
20.70
13.10
33.60
(Source: SEYEBS 2003)
Agrochemicals, including fertiliser and livestock manure, have become
an additional source of pollution for the freshwater environment. High
concentrations of nitrates in agricultural run-off have been the main
petroleum hydrocarbons, in the oyster area near Yangtze River estuary
reason for the eutrophication of aquatic systems throughout the
all exceed the standards, with petroleum hydrocarbons and DDT
drainage basin.
exceeding grade II, and Cu and Zn exceeding grade III (Table 12).
Eutrophication caused by nitrogen discharged to the ocean is of
In 2001, pollutant residues like petroleum hydrocarbons were detected
great concern. The available evidence indicates that toxic and harmful
in shellfi sh (Mytilus edulis, Sinonovacula constricta, and Venerupis
plankton species are on the increase in number and in geographic
variegate). DDT and PCB were also detected, but at levels that are
distribution; for example, a single algal bloom in Fujian Province in May
acceptable for human consumption (ZOFA 2001). Most of the coastal
2003 caused damage equivalent to 3 million USD (25 million Yuan)
area of Fujian Province is clean except for the Minjiang estuary, where
(SOA 2004).
the content of Hg is 0.25 g/l. The coastal area of Sishishuanglie Islands
is lightly polluted with copper at levels of 0.015 g/l. The heavy metal
Chemical pollution
(Cu, Pb, Hg, As) content of surfi cial sediments in Fujian Province is within
The coastal water quality in the East China Sea is primarily infl uenced
the range of natural variability. The average DDT content in surfi cial
by phosphorus and nitrogen from land sources. The pollutant load is
sediments is 6.68 g/kg in Xiamen harbour where the DDT content in
dominated by COD, petroleum hydrocarbons and heavy metals (e.g.
surface sediment has dropped 80% as compared to 10 years ago. The
lead), with the majority of the waters of the coastal ocean belonging
PCB content in surfi cial sediments is 1.52 g/kg (FOFA 2002).
to grade II waters. Waters considered worse than grade IV represent
24.3% of the total (Figure 19). The main pollutants include nitrogen
In 2001, 11 kinds of economic shellfi sh from the coastal area of Fujian
and phosphorus, followed by heavy metals (e.g. lead) and oil. Off shore
Province, including oyster, Sinonovacula constricta, Venerupis variegate,
of the Yangtze River estuary, the water quality is grade I and grade II,
Mytilus edulis Linnaeus, and Tegillarca granosa were reported to meet
with the exception of inorganic nitrogen and inorganic phosphorus,
national standards, but petroleum hydrocarbons in Sinonovacula
which exceed national standards .The sediment quality in the coastal
constricta of Mingjiang estuary were found at too high concentrations
area off Shanghai is not seriously polluted as a whole (SEYEBS 2003). In
(Table 13).
the coastal area of the Shanghai, petroleum hydrocarbons in Bullacta
exarata exceeds grade I for biological standards, and copper (Cu)
The concentration of organochlorine compounds such as
exceeds the grade II standard. Heavy metals such as zinc (Zn), Cu, and
hexachlorocyclohexane (HCHs), dichloro-diphenyl-trichloroethane
ASSESSMENT
31
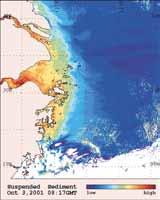
Table 13 Pollutants in shellfi sh in nearshore waters in Fujian.
Table 14 Annual sediment load and suspended solids in Yangtze,
Qiantangjiang and Mingjiang rivers.
Concentration (mg/kg (wet weight))
Pollutant
Sinonovacula
Venerupis
Mytilus
Tegillarca
Paphia
Annual sediment
Average
Hydrology
Suspended solid
constricta
variegate
edulis
granosa
undulata
River
Year
load
station
(kg/m3)
(million tonnes)
Petroleum hydrocarbons
82.3
11.7
ND
ND
ND
ND
2002
275000
0.277
Mercury (Hg)
0.012
0.014
0.029
0.007
0.004
0.014
2001
276000
0.336
Copper (Cu)
3.0
4.3
2.3
1.6
1.7
13.1
Yangtze River
Datong
2000
339000
0.365
Lead (Pb)
0.15
0.12
0.11
0.10
0.006
0.11
1950-2000
433000
0.486
Cadmium (Cd)
0.06
0.13
0.06
2.02
0.19
0.33
2002
237
0.099
Zinc (Zn)
16.0
22.6
10.3
14.1
8.4
67.0
Qiantangjiang
Lanxi
2001
76.2
0.059
Arsenic (As)
0.368
0.077
ND
ND
ND
0.204
1950-2000
216
0.127
DDT
0.0145
0.0084
ND
ND
ND
0.0206
2002
272
0.044
PCB
0.0021
0.0059
ND
ND
ND
0.0069
Mingjiang
Zhuqi
2001
96.7
0.015
(Source: FOFA 2002)
1950-2000
637
0.12
(Source: MWRC 2000b, 2002b)
(DDTs) and polychlorinated biphenyls (PCBs) has been investigated
in sediments from Chinese river and estuarine systems. The results
296 km2 in 1980 to 2 478 km2 in 2001, which made aquaculture one of
show that the large Chinese rivers and estuarine systems are not
the primary sources of pollution in the local coastal area. Population
signifi cantly polluted by the organochlorine compounds measured
increases and the expansion of industrialisation, urbanisation and the
(Wu et al. 1999).
tourist industry increase pressures on the environment of the coastal
zone.
The main coastal contamination comes from industrial sewage,
municipal sewage, and agricultural run-off discharged to the coastal
Suspended solids
area, along with nearshore engineering construction traffi
c and wastes
The main sources of suspended solids in the Yangtze River,
discharged from oil platforms, oil spills, ocean mining and aquaculture.
Qiantangjiang, and Minjiang rivers and the East China Sea coastal
For example, in 2003, the total amount of waste carried by the Yangtze
waters are soil erosion, together with deforestation and intensive
River, Qiantangjiang, Mingjiang and Jiulongjiang was 2 929 000,
cultivation. Reduced coverage of vegetation causes more serious soil
204 000 and 243 000 tonnes respectively; with all these values
erosion. The area of soil erosion in the Yangtze River Basin increased
showing an increase compared to 2002. The main pollutants entering
from 304 200 km2 in 1987 to 572 400 km2 in 1992 (CNRD 2004).
the sea are inorganic nitrogen, inorganic phosphorus, COD, petroleum
The rate of water loss and soil erosion reached 25% in Jiangxi and
hydrocarbon, and heavy metals (Table 14). In 1999, the total discharge
Zhejiang Provinces. These serious losses increased the concentration
of wastewater from the Shanghai, Zhejiang, and Fujian Provinces was
of river sediments, which gradually increases the deposits of silt in
5 billion tonnes, of which 2.8 billion tonnes was directly poured into the
lakes, reservoirs and river courses. Waterway dredging, bridge and
East China Sea. In addition, there are about 33-37 million m3 of
dam construction, mining sands from
dredged materials dumped into the East China Sea. Accidental
riverbeds and reclamation all change
oil spills and marine transportation, especially ballast water from
the concentration of suspended solids
oil ships, are other important sources of pollution in the coastal
(Table 14). For example, the concentration
and marine areas. The amount of cargo handled in the coastal
of suspended solids in the Yangtze River
area of the East China Sea has been on a constant increase,
estuary and Hangzhou Bay is higher in
with the Shanghai and Fujian seaports handling 83.6 million
the fl ood period of July to August than in
tonnes in 1978 to 365.8 million tonnes in 2002 (SCMC 2002, BSF
other seasons (Figure 20).
2003,2004, BSS 1991, 2004, BSZ 1997, 2003, 2004).
Solid wastes
In 2001, the total number of powerboats exceeded 50 000 in
In 1980s, the Chinese government
Fujian Province. These boats produce oily wastewater and gas
Figure 20 Suspended solids in
enacted a policy of encouraging the
the coastal area of
pollution, as well as domestic refuse and sewage. The cultivated
comprehensive use of solid wastes
East China Sea
area in the inshore region of the East China Sea increased from
(Source: CCAR/HKUST 2005)
and reducing the production of refuse.
32
GIWA REGIONAL ASSESSMENT 36 EAST CHINA SEA
With rapid economic development at the end of 1990s, however, the
On June 6, 2000, the cargo ship "Minyou No.1" hit "East Ocean", and
problem of dumping wastes in the suburbs and rural areas emerged.
approximately 100 tonnes diesel oil leaked, contaminating the coastal
The waste accumulated around the cities, smelly rubbish was dumped
area of 4 villages and towns in Fujian Province. On October 15, 2000, a
along rivers, streets or public areas. Many suburban areas were covered
natural gas pipeline on the fl oor of the East China Sea was broken at
by urban rubbish. Toxic chemicals from industrial solid wastes infi ltrated
2.5 km from Daishan Island, leaking 300 m3 of crude oil (SOA 2000).
directly into surface and groundwater.
On April 17, 2001, the Korea bulk cargo vessel "Da Yong" collided with
As the living standards of urban areas have improved, domestic
the Hong Kong vessel "Da Wang" in the coastal area outside of the
wastes have increased quickly. In 1999, the total domestic waste load
Yangtze River estuary, leaking 701 tonnes styrene (Shanghai Ocean
in Shanghai reached 5 million tonnes, equal to 1 kg rubbish produced
Administration 2001).
per person per day. Roughly 85% of this trash was disposed of in sanitary
landfi lls. Rapid industrial development, especially village- and town-
On January 27, 2001, the "Longbo No. 6" oil tanker, owned by the Nanjing
owned enterprises and private companies, which have not been under
Hongyou Transportation Co., loaded with 5 360 tonnes of diesel oil, sank
the strict control of national regulations, resulted in a rapid increase in
after striking a rock near Dongyang Island of Pingtan County. Only 1 800
amount of industrial solid wastes. In 2000, the amount of solid wastes
tonnes of diesel were recovered; the spilled oil damaged the coastal
reached 156 million tonnes, with an average rate of comprehensive use
environment, the fi sheries and nearby aquaculture facilities.
at 65%. However, this rate of use is more than 90% in Shanghai and
Jiangsu but is less than 20% in Jiangxi Province. The total discharges
On September 30, 2001, the "Jin Hai Sun" oil tanker, owned by Zhonghai
of industrial solid wastes increased from 101 million tonnes in 1987 to
Haisheng (South Ocean) Shared Co. Ltd, loaded with 4 439 tonnes of
156 million tonnes in 2000, with some uncontrolled dumping, which
diesel oil, sank after striking a rock near Xiyang Island of Xiapu County.
leads to the pollution of land and surface and groundwater.
Diesel from the accident damaged the nearby marine environment and
the fi sheries (FOFA 2001).
Thermal pollution
Thermal pollution was considered to have little impact in the region.
Socio-economic impacts
Effl
uent discharges of cooling water from power plants, including nuclear
The number of small-scale industries is growing with the economic
stations, were observed, but without large-scale environmental eff ects
restructuring that has taken place in the Yangtze River watershed.
beyond the mixing zones and no signifi cant interference with biological
However, it has proven diffi
cult to manage pollution from these industries.
communities. The region has strict regulations penalising effl
uent
This pollution source was cited as an important reason behind the
discharges that cause water temperature change exceeding 4░ C.
problems in developing sustainable recreational and fi sheries activities.
Spills
The incidence rate of liver diseases and mortality in residents near
The eff ect of oil spills in the coastal waters of the East China Sea is
the discharge area of a chemical factory in the Zhoushan Islands is
episodic. Oil pollution may lead to the death of the halobios and
higher than elsewhere. Many small rivers, streams and canals are not
contamination in the coastal area as well. Spilled oil and oil products
swimmable due to pollution. Problems related to pollution include
generated by shipping and from off shore oil gas fi elds are important
coastal eutrophication and hypoxia, reduced effi
ciency of water
sources of pollution. The most seriously oil-contaminated areas are
treatment, an increase in suspended solids, and fl ooding by poisonous
estuaries, canals and oil fi elds. In 2002 and 2003, the total amount of
pollutants such as heavy metals and persistent organic pollutants.
oil pollutants discharged into the East China Sea by the Yangtze River,
Mingjiang, and Jiulongjiang was 119 500, 10 600 and 1 000 tonnes
The accumulation of poisonous pollutants in fi sh aff ects human health,
respectively (Table 11). During 1999 to 2002, the Pinghu Oil Gas Field
which reduces the economic quality of the resources and causes
in the East China Sea discharged 9.94 million tonnes of wastewater
infectious diseases.
containing 34.8 tonnes of oil (SOA 1999, 2000, 2001, 2002). During
transportation of oil and other chemical products, oil tanker collisions
Conclusions and future outlook
with other vessels or rocks may cause unexpected accidents, leading
At present, the most important sources of pollution in the East China
to oil spills that aff ect inhabitants, biota and regional economies in the
Sea region are chemical fertilisers, sewage and other nutrients that
coastal zone. The following are some examples:
can cause coastal eutrophication. These pollutants originate primarily
ASSESSMENT
33
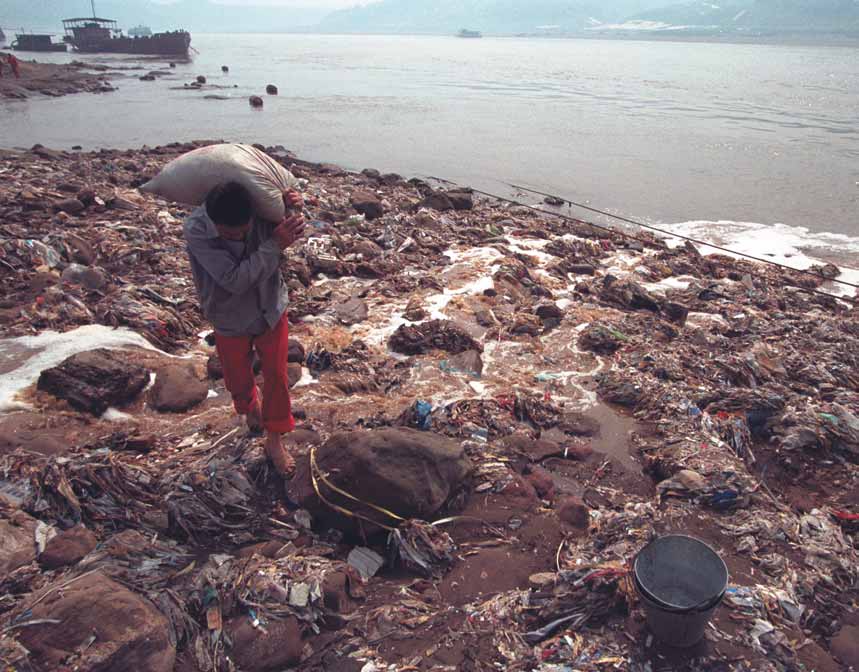
Figure 21 Solid wastes littering the riverside in the Yangtze River drainage basin.
(Photo: Corbis)
from urban centres, and agricultural run-off and aquaculture-related
cause considerable increases in the quantity of wastewater discharge
activities, from which they are transported by rivers and discharged into
to rivers and coastal areas. Eutrophication caused by agrochemicals,
the East China Sea. The socio-economic and health impacts caused by
aquaculture and sewage discharge has become one of the primary
pollution problems are more serious in urban centres than suburban
issues in the East China Sea region. Currently, pollution problems exist
areas, with important consequences for the communities themselves,
primarily at a local scale and are not yet a major concern for the whole
as well as human health. The various forms of pollution lead to increased
East China Sea region.
risks of harming human health, with attendant increases in the costs of
ecosystem protection, medical care, water treatment and clean-up. The
As agriculture is still one of China's important economic sectors,
impact is primarily a consequence of industrialisation and urbanisation
non-point pollution is extensive and diffi
cult to manage. The lack
in the Yangtze River catchment area, particularly as a result of the
of appropriate investments to treat pollution before it is discharged
use of agrochemicals and change in land use, such as an increase in
makes the situation even worse. The main area aff ected by pollution is
aquaculture. Moreover, the impact of pollution is likely to increase in
currently restricted to the coastal Yangtze River estuary and Hangzhou
the future because of industrial development and population growth.
Bay and coastal areas, resulting in frequent harmful algal blooms in the
In addition, the progress of industrialisation and urbanisation is likely to
East China Sea. Although pollution in some regions has decreased, the
34
GIWA REGIONAL ASSESSMENT 36 EAST CHINA SEA

situation does not off er reason for optimism. One possible solution is to
is comparatively dry or seldom fl ooded, while the latter is mostly in
encourage investments in the treatment of non-point pollutants with
the lower fl ats. Other communities can also be found, such as the
approaches such as protective zones and artifi cial wetlands.
Scripus triqueter community, the Carex scabrifolia community and the
Ischaemum aristatum var.glaucum community.
The wetlands in Yangtze River are one of the most important stopovers
T
C
A
Habitat and community
IMP
in a well-known bird migration route, and are also an overwintering
modification
area for water birds. There are nearly 274 kinds of transients inhabiting
the East Beach of Chongming Island, totalling 2 to 3 million birds,
Environmental impacts
representing about 10% of all species in China, and 25% of Shanghai's
Loss of ecosystems or ecotones
total. The dominant bird families are Charadriiformes, Anatidae, Gruidae
The main wetland types in the littoral zones of the East China Sea are
and Laridae.
estuarine wetlands, such as salt marshes and swamp marshes, which
are chiefl y composed of saline marshlands and beach. The wetland
The benthic community is dominated by tidal fl at crustaceans, such
usually is covered with herbaceous plants in the high- and middle-tide
as Metaplax longipes. Members of the Bradybaenidae and Assiminea are
zone. These wetlands provide habitats for many kinds of birds, thus
well-represented. There are diff erent molluscs such as Stenothyra glabra,
forming a marsh - meadow - bird ecosystem. In the littoral zones of the
Mactra veneriformis, Mactra sulcataria and several kinds of crabs found
East China Sea, the wetlands can be found on Chongming Island in the
in the high tidal fl ats, while other crabs, such as Moerella iridescens and
Yangtze River estuary, in the Nanhui district in Shanghai, on the beach
Bullacta exarata live in the low tidal fl ats. The waters near the beaches
in Hangzhou Bay, on the beach of Yongjiang and Oujiang, and in the
are inhabited by Boleoophthalmus pectinirostris, Tetraodontoi dei, Grey
coastal zones in Fujian Province. These wetlands can be classifi ed into
mullet, Hilsa herring, and Chinese sturgeon. The Hilsa herring and
two categories: one is the mangrove swamps in Fujian Province; the
Chinese sturgeon are protected species.
other is the coastal argillaceous beach (salt marsh). With the exception
of the Chongming East Beach of the Yangtze River estuary, the primary
Based on a survey of the Yangtze River estuary, 14 orders and 112 species
status of these wetlands is seriously degraded. The Chongming East
live in the estuary, of which Elasmobranch has 7 families and 9 species.
Beach is a good representative of the coastal argillaceous beaches.
Teleostean has 103 species, about 91.96% of all fi sh in the area. Of these,
Perciformes represent 41 species, or about 36.61% of the order; most of
Yangtze River estuary wetland
these are marine fi sh. Clupeiforms is represented by 17 species, or about
The Yangtze River estuary wetlands are broad and vast, composed of
15.18% of the total. Cypriniformes is represented by 15 species, or about
silt and beach deposits. The wetland is an important breeding and
13.39%. These are all freshwater fi sh species. Pleuronectifornes has 8 species
spawning ground for birds, animals and fi sh. It provides a passageway
and Anguilliformes has 5 species, about 4.46%. The numbers of other
for migratory fi sh to enter the sea or travel to inland waters for
fi sh such as Mugiliformes, Scopeliformes, and Acipenseriformes are quite
spawning, as well as a nursery area whereyoung fi sh can forage and
limited. In these families, Coilia nasus and Coilia ectenes Jordan and Seale
grow. Secondly, the wetland provides an ideal stopping place for
are the main fi sheries species. Chinese sturgeon (Acipenser sinensis) and
migratory birds in the Asia-Pacifi c area and a hibernacle for birds such
the mountain witch (Trachidermus fasciatu) are rare fi shes. The spawning
as wild geese and ducks. Thirdly, the soft substratum is favourable for
stock of Japanese eel is a very important fry resource. The ridgetail white
the growth of wetland plants and provides habitat for benthic fauna.
prawn is the primary economic shrimp. Eriocheir sinensis, Scyna serrata, and
In addition, run-off into the Yangtze River estuary carries nutrients and
Portunus trituberculatus are the primary economic crabs.
organic substances, which are required for the reproduction of both
phytoplankton and zooplankton that furnish resident fauna with food
Mangroves and wetlands in Fujian Province
resources. This results in a productive fi shing ground where both salt-
The Fujian mangrove wetland is found in the estuaries of the Xiahe in
and freshwater fi shes can live, spawn and forage.
Zhaoan County to the Bayou in Fuding County. They are often found in
the area between the Zhangjiang estuary and the Jiulongjiang estuary.
The main vegetation communities in the estuarine tidal zones
The Fujian mangrove contains 10 species representing 8 families and 9
and littoral zones are Phragmites australis and Scripus mariqueter
genera. These species are: Acrostichum aureum, Bruguiera gymnorrioza,
communities. The former is found in the higher tidal zone where it
Kandelia candel, Hibiscas tiliaceus, Excoecaria agalocha, Derris trifoliate,
ASSESSMENT
35
Aegicerae comiculatum, Acanthus ebractealus, Acanthus lilcifolius and
Chongming Island, located in Yangtze River estuary, is the third
Avicennia marina.
largest island in China. Since 1950, Chongming Island has had fi ve
major reclamation eff orts, and more than 40 km2 of fertile farmland
The number of species found in the mangroves declines gradually as
has been added to the island (Least 2004). At present, the total area
the latitude increases. For instance, the number of mangrove species in
of Chongming Island has been doubled from less than 600 km2 in the
the Zhangjiang estuary is the highest along the coast of the East China
1950s to more than 1 200 km2 in 2003 (SouFun 2004).
Sea, with all species represented. The Jiulongjiang estuary contains
six mangrove species: Kandelia candel, Excoecaria agallocha, Aegicerae
Reclamation eff ects on lakes
comiculatum, Acanthus ebractealus, Acanthus lilcifolius, and Avicennia
In the past 50 years in the Yangtze River Basin, about 1 000 small lakes
marina. Quanzhou Bay has four species, Kandelia candel, Excoecaria
have disappeared and the area of 22 big lakes had decreased to about
agallocha, Aegicerae comiculatum and Avicennia marina. Only one
40% of their previous size. For example, the area of Dongtinghu has
species, Kandelia candel, has been found in the north at Sanjian.
decreased to less than half of its maximum size, and the number of
Mangroves are important wetland ecosystems in the southeastern
lakes on the Jianghan plains has decreased from more than 1 000 to just
coastal area of China and play an important role in the protection of
309 (Jin 1998). Because of reclamation and overfi shing, the fi sheries in
the environment and biodiversity. But in recent years, due to intensive
Dongtinghu have been on a continual decline.
development, the area of mangroves has continuously declined and
plant and animal habitats in the mangrove ecosystems have been
Reclamation has resulted in a reduction of the surface area of the Taihu
greatly changed. According to statistics from Fujian Province, about
by 160 km2 over the last 50 years, which represents roughly 5-10 % of the
two-thirds of mangroves have disappeared (Huang 2000).
total surface area. The eastern part of the Taihu lost 68 km2 and the lake's
water volumehas been decreased by 320 million m3, but the average
Loss of wetlands
water level was increased by 9 to 14 cm because of the decrease in
Areas of wetlands along the East China Sea have decreased dramatically
surface area Qin et al. 2002).
in the last two decades, which has increased damage from fl oods in the
rainy season. China's rapid population growth and growing economy
Soil erosion
in the littoral region of the East China Sea are resulting in serious losses
According to historical records, the total area lost to soil erosion in the
and degradation of the habitats of coastal wetlands. China has planned
Yangtze River drainage basin in the 1950s was 363 000 km2, which
to reclaim a further 45% of its current mudfl ats. The largest river fl owing
accounted for more than one-sixth of the total area. In the 1990s, the
into the East China Sea, the Yangtze River, is undergoing signifi cant
area lost to soil erosion amounted to 613 000 km2 (Chen 1998, WWF
changes that will greatly reduce the amount of sediment input, so that
2003). In the 1950s, the amount of water and soil erosion of the whole
future losses of intertidal areas are predicted to occur at an increasing
drainage basin was about 160 million tonnes and in the 1990s the losses
rate due to the combined eff ects of reclamation and reduced sediment
in that of the upper reaches were equal to this earlier amount. Since
input. The loss of wetlands will destroy animal habitats and lead to the
1958, water run-off in the Minjiang drainage basin has increased because
loss of biodiversity.
of the forest cover has been cut down. Soil erosion has become quite
serious and totals 2.5 million tonnes per year (MWRC-TBA 2004a). In the
Reclamation of wetlands of estuary
1950s, the area of the water and soil lost represented 4% of the total area
A sediment load totalling 48.6 million tonnes is deposited in the Yangtze
in Jiangxi Province. In the 1970s, it increased to 13% (CIGEM 2004).
River estuary every year, which creates an environment for continually
expanding wetlands. In the meantime, however, wetlands are being
Rocky coast
continually reclaimed. Since 1949, 840 km2 of coastal wetlands have
Port development, tourism and an expanding industrial base have all
been reclaimed in Shanghai, so that the land area of Shanghai has been
damaged the region's rocky coasts, particularly in Zhejiang Province.
increased by 14%.
Barrage of waterway between lake and river
In the past twenty years, 293 km2 of coastal wetlands have been
The Baiji or Yangtze River dolphin (Lipotes vexillifer) is the world's most
reclaimed in this region. From 1995 to 2000, 120 km2 of coastal wetlands
endangered cetacean species. The Baiji shares its habitat with another
have been converted to other uses in Shanghai (Jin 2004).
small cetacean in the middle and lower reaches of the Yangtze River,
Dongtinghu and Poyanghu. The population in the Yangtze River is a
36
GIWA REGIONAL ASSESSMENT 36 EAST CHINA SEA
unique freshwater sub-species. The population has been in decline in
bloom organisms because it accounts for 55% of all bloom events. The
recent years because of the construction of dams between rivers and
primary species of algal blooms in the Yangtze River estuary and the
lakes on the waterways (Chen & Hua 1989).
coastal waters of Zhejiang before late June are Prorocentrum triestinum, a
dinofl agellate, and Skeletonema costatum, of the Bacillariophyta. Harmful
Hundreds of dams were built in the Yangtze River drainage basin over
algal blooms in the coastal waters of Fujian are dispersed over a small
the last forty years. As migrating fi shes are prevented from moving
area, but there are numerous harmful algae, including Alexandrium sp.,
upstream by the dams, they can no longer enter lakes from the river.
Karenia mikimotoi, Dinophysis fortii, Chattonella marina, Heterosigma
This has led to sharp population declines in both the lake and the river.
akashiwo, and Phaeocystis globosa.
The biodiversity of fi sh species has declined sharply for this reason as
well. For instance, Honghu Lake once had more than 90 species. In 1958,
Harmful algal blooms result in tremendous economic losses. The
a sluice was constructed in the canal linking the lake with the river, thus
harmful algal bloom that occurred in May, 2000, in the Yangtze
severing the connection between the river and the lake. A survey in
River estuary and the coastal waters of the Zhejiang covered more
1964 showed 74 species, while in 1981-1982 just 54 species were left, of
than 7 000 km2, and seriously endangered the region's seawater
which only 33 species were found in the lake, while the other remaining
aquaculture. The Zhoushan Islands experienced direct economic losses
21 species were river fi shes carried into the lake by the channeling of
of 3.6 million USD (30 million Yuan).
the Yangtze River for the purpose of irrigation.
Freshwater environments
Modifi cation of ecosystems or ecotones
Lakes across China have lost both surface area and volume, as a result
Harmful algal blooms in the East China Sea
of a continuous supply of mud from river water and from extensive
According to statistics from the State Oceanic Administration (SOA),
reclamation of wetlands. This is a serious problem throughout the
there have been 107 harmful algal blooms from 1986 to 2000, with these
country. Over the past decade, farming and the lumber trade have
blooms typically occurring in late April to November. Harmful algal
resulted in deforestation that has led to shrinkage in lake sizes in the
blooms occur most frequently from May to August, with an average of
western part of China. Lake losses in the eastern region are mainly caused
60 days per year aff ected by harmful algal blooms. The blooms usually
by precipitation of mud from river
last from 4-6 days, with a minimum of 2 to 3 days to a maximum 20 or
water, and by reclamation of land
Table 15 Area of the
more. Most of the harmful algal blooms in the East China Sea occur
Dongtinghu Lake.
for farmland. For example, the
near the waters off of the Yangtze River estuary, the West Harbour of
Year
Area (km2)
total surface area of Dongtinghu
the Xiamen, Xiangshan Bay, the Sanmen Bay and some aquatic zones.
1825
6 000
Lake was 4 350 km2 in 1949, but
Of these, the Yangtze River estuary showed the highest frequency,
declined to 2 623 km2 in 1995,
1896
5 400
accounting for 70% of the total occurrences. About 70% of all blooms
due to continuous precipitation
1932
4 700
cover an area between 100-1 000 km2, but the biggest bloom recorded
of mud from river water and
1949
4 350
took place in the coastal waters in Zhejiang Province in May of 1990 and
extensive reclamation of farmland
1954
3 915
covered an area of 7 000 km2.
from the lake (Table 15). Lakes and
1958
3 141
their wetlands usually are ideal
In 2001, the coastal area of Zhejiang Province had 26 harmful algal bloom
1971
2 820
homes for many birds. The rich
covering 1 400 km2, the waters of Shanghai experienced 2 harmful
1978
2 691
fi sh and plant resources in lakes
algal blooms covering an area of 1 400 km2, and the coastal waters of
attract hundreds of thousands of
1995
2 623
Jiangsu had 4 harmful algal blooms covering more than 1 200 km2. In
Note: The area is measured when the water
migrant birds each year. With the
level at Chenglinji station is 31.5m.
total, the coastal waters of East China Sea experienced 51 blooms in
reclamation of farmland the lake
(Source: Fang & Zhong 2001)
2002 covering a total area of 9 000 km2. In 2003, 86 harmful algal blooms
is now gradually losing many of
were reported in the East China Sea, with the coastal waters of the
its wetland functions.
Zhejiang Province reporting 49 events, and Fujian reporting 29 events.
The area aff ected by these blooms totalled 12 990 km2.
The catch of fi sh from all lakes has been on a continuous decrease,
so that the current catch is less than half of the historic average. The
More than 100 plankton species cause algal blooms in the East China
lakes' isolation means that they are characterised by rare species that
Sea. Noctiluca scintillans is the most important species among all algal
live in the middle reaches of the Yangtze River. Acipenser linnaeus and
ASSESSMENT
37
Macrura reevesii have almost disappeared in these isolated lakes and
Forests
Luciobrama macrocephalus and Ochetobius elongatus numbers have
According to a survey in 1957, forests covered 22% of the Yangtze River
decreased sharply. At the same time, the proportion of fi shes that trace
drainage basin. By 1986, the coverage dropped to 10%. Over the past 30
to the source in some rivers and lakes has decreased sharply, in some
years, deforestation has decreased forest coverage by half (Figure 22).
cases from 50% in the past twenty years to less than 20% currently (Xie
In some of the upper reaches of the Yangtze River, local people still
& Chen 1995).
use primitive methods of burning natural vegetation to create new
farmland. In the middle to lower reaches of the Yangtze River, the forest
Human activities have resulted in deterioration of the water quality
coverage in Jiangsu and Anhui Provinces has decreased by half from
and biodiversity of the Yangtze River ecosystem. Macrura reevesii is a
the 1950s to 1980s (Jin 1998). But local governments have been making
good example of this problem: since 1975, the output of this fi shery has
great eff orts in reforestation in six provinces (Figure 23 ) and the public
decreased from year to year because of intensive fi shing pressure. The
has come to realise the importance of forests in reducing soil erosion
population has never fully recovered from the fi shing pressures. The
and regulating the climate.
area where the species spawns has greatly decreased (Qiu et al. 1998).
Socio-economic impacts
Pelochelys bibroni and Andrias davidianus are a native rare turtle and
Habitat modifi cation and destruction contributes overfi shing and
salamander, respectively, that live in the Oujiang. At present, these two
pollution, along with declines in fi sh landings, raw materials for
species have almost disappeared in the upper reaches and tributaries
pharmaceutical production and other economic outputs of the
because they have been heavily hunted and their natural egg-laying
ecosystem. There is limited impact in terms of employment opportunity
areas have been destroyed. The remaining habitats are limited to the
reductions associated with habitat alteration, such as might result from
deep water of the river's mid to lower reaches. It has been estimated
harmful algal blooms and the poisoning of seafood. Moderate social
that there are less than 200 Pelochelys bibroni (MWRC-TBA 2004b).
and economic impacts have resulted from the loss of spawning habitat
due to changes in waterways, land reclamation and infrastructure
More than ten thousand tonnes of sands are dredged from the lower
developments, such as dams.
reaches of the Mingjiang each day. Channel dredging has resulted in
saltwater intrusion and infl uenced the original freshwater and wetlands
Conclusions and future outlook
fauna, so some organisms that can only live in freshwater have died
The increasing population, and the development of both industry and
because of saltwater intrusion.
agriculture in the region will increase pressures on wetland, river and
lake ecosystems and thus will lead to increased losses and modifi cations
Farmland
of habitats and communities.
The abuse of chemical fertilisers and pesticides in the Yangtze River
Basin has seriously threatened the health of farmland ecosystems and
In the last two decades, the coastal environment of the East China
has resulted in the pollution of rivers and lakes. The farmlands around
Sea has undergone rapid industrialisation and economic and social
Taihu of south Jiangsu Province consume twice as much nitrogenous
development. With economic development after the early 1980s,
fertiliser as other regions in the past several years.
coastal waters have become a central issue with respect to pollution
resulting from increased economic activities. The heavy reliance on
In the Shanghai countryside, only 30-50% of the total nitrogenous
marine resources in the East China Sea countries requires continued
fertiliser applied to farmlands can be used by crops, while the remainder
vigilance to ensure environmental sustainability of the littoral area and
runs off into streams, rivers or lakes. At present, 72-75% of the total
to protect the resource for the welfare of future generations.
nitrogen in the Taihu comes from fertiliser applied to farmlands around
the Taihu; this has resulted in lake eutrophication. In China, urbanisation
The unprecedented rapid industrial development and population
has greatly decreased the area of arable lands in some provinces. The
growth over the last decade, which has proceeded with little regard
area of paddy fi eld in the south of Jiangsu Province has declined from
for the environment, has been accompanied by the overexploitation
330 km2 in 1999 to 120 km2 in 2003 (NFC 2003). The change in farmland
of resources, causing marine and coastal ecosystems to lose their
area in the past 50 years in Jiangsu Province, shows that paddy fi elds
productive capacity. Some of problems that have occurred are due
have increased, but the area of dry land is decreasing sharply and the
to poor management, inadequate monitoring and lack of information
total farmland area is decreasing (BSJ 2003a).
and resources, poor communication between scientists and managers,
38
GIWA REGIONAL ASSESSMENT 36 EAST CHINA SEA
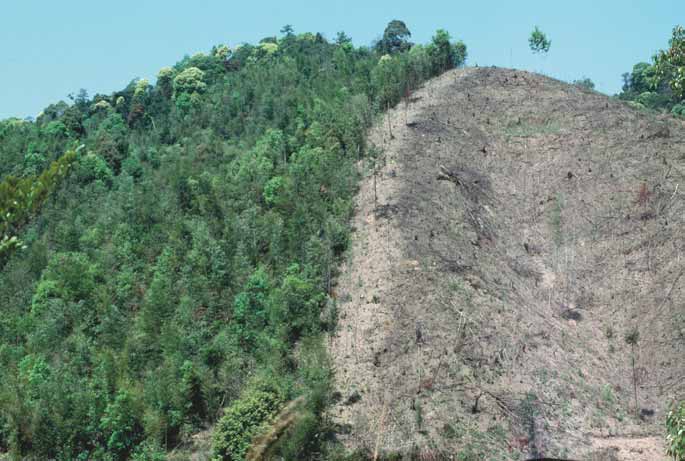
Figure 22 Deforestation in China.
(Photo: Corbis)
a sectoral approach to terrestrial and marine management, ignorance
blooms that have been damaging to the fi shery, aquaculture and
of the costs and economic and social practicalities of implementing
people's health.
solutions, and the lack of will on the part of policymakers in local
Deforestation in the watersheds, vegetation loss and unsustainable
government. The results can be summarised as follows:
agriculture has caused siltation in rivers.
Pollutants transported and dumped in the East China Sea from
A combination of factors including population growth, a demand
land-based sources have a potential link to the harmful algal
for cultivatable land for agriculture, urbanisation, and demand for
timber for domestic and foreign markets has resulted in massive
2002
2001
losses of forest cover in many parts of the upper reaches of the
300 000
region.
Construction of dams or other irrigation engineering structures
250 000
results in the destruction of the lake-river ecosystem by severing
lake connections in the Yangtze River watershed.
200 000
(ha)
Coastal development, including land reclamation, dredging and
conversion of coastal land for industry and housing, aquaculture
150 000
Reforestation
and agriculture activities, tourist resorts and sand mining, are
100 000
major factors in overall habitat deterioration and loss. These
developments result in severe coastal erosion and loss of beach
50 000
habitats, and cause overall water quality deterioration.
0
Shanghai
Jiangsu
Zhejiang
Anhui
Fujian
Jiangxi
Solving these problems requires addressing basic problems of poverty,
political stability, social order and good governance. The dilemma of
Figure 23 Reforestation areas by region.
(CFM 2003)
economic development and sustainable environmental management
ASSESSMENT
39
is likely to command the attention of policymakers, given the desire
350
14000
to achieve economic growth. It will require strong and unwavering
political will based on a clear understanding of the value of the
300
12000
)3
sustainable development of marine and coastal resources so as to
250
10000
)
essel (10
meet long-term national demands and aspirations.
200
8000
kW3
150
6000
e
r (10
ed fishing v
P
o
w
Land use change and degradation, human activity and deforestation
oriz 100
4000
problems are becoming increasingly important throughout the whole
Mot
50
2000
of the Yangtze River catchment area, from its upper reaches to its estuary.
0
0
Although the present impact of these activities on the environment of
1952
1970
1980
1984
1988
1992
1996
2000
Year
the Yangtze River Basin is moderate, if the current trends persist there
Figure 24 Fleet strength and numbers of Chinese-owned marine
will be severe impacts by the year 2020. High demands for fi sh products
motorised fi shing vessels.
cannot be met by aquaculture. The river itself must to be protected
(COYEC 1997-2002, FBAM 2001-2003)
from further water quality degradation to meet the requirements of
the increasing human population. The fi shery must be able to coexist
4000
Perch-likes
with other activities in the area, such as transportation, tourism, and
Other fishes and inverts
Herring-likes
Anchovies
agriculture. There is also a need to measure the spatial extent of the
Crusteceans
3000
Molluscs
Sharks and rays
land degradation under diff erent land-use scenarios and to assess the
Scorpion-fishes
Flatfishes
eff ect of human activity on vegetation community structure over the
onnes)
2000
last several decades, in order to understand how the landscape can be
t
c
h (1000 t
Ca
better managed to reverse negative trends and mitigate losses.
1000
0
1950
1970
1955
1960
1965
1975
1980
1985
1990
1995
2000
Year
T
Figure 25 Catches in the East China Sea.
C
A
Unsustainable exploitation of
IMP
(FAO 2003)
fish and other living resources
Table 16 Area of main fi shing ground in the East China Sea.
About 730 fi sh species have been identifi ed on the East China Sea
Area
Fishing
Area
Fishing
Area
Fishing ground
(km2)
ground
(km2)
ground
(km2)
shelf, along with 91 species of shrimps and crabs and 64 species of
Yangtze River Estuary
9 990
Yuwai
13 880
Minzhong
10 580
cephalopods. The traditional catch in the East China Sea includes the
Jiangwai
9 220
Wentai
6 380
Taibei
13 840
Yellow croaker, ribbonfi sh, Mackerel, and Herring. All of these species
Zhoushan
14 350
Wenwai
16 610
Minnan
13 840
have suff ered from overfi shing since the 1960s. The catch of some
Zhouwai
14 010
Mindong
4 830
Taidong
11 820
economically important species, such as Yellow croaker and Mackerel,
Yushan
15 620
Minwai
9 370
No data
No data
has decreased dramatically since the 1970s (Tang & Su 2000).
(Source: NMDIS 2004a)
Figure 24 shows only the Chinese fi shing eff ort off the Chinese coast. The
characterised by a steady catch and high economic value. Herring-like
fi shing eff ort in the East China Sea has increased dramatically since 1952,
fi sh and anchovies belong to the pelagic species group, which has a
resulting in great pressure on the fi sheries resources in the East China
fl uctuating annual catch. Herring-like fi sh had great yields in the 1980s,
Sea, and which may be the main reason why the fi sheries resources
but this group is currently in poor condition. The anchovy catch has been
in the East China Sea have decreased. Table 16 shows the distribution
increasing lately. Table 17 shows the seasonal species composition of the
of marine fi shing areas in the East China Sea, with respect to diff erent
East China Sea. The maximum number of species (383) is found in the
counties and regions. The annual catch in the East China Sea has not
autumn, followed by the spring and summer, and winter (365, 350 and
increased proportionately with the increase of fi shing eff ort there.
305 respectively). Squid are least abundant in all seasons.
Fish catches for diff erent species and groups over the last 50 years are
described in Figure 25. Perch-like fi sh form the most important group
The maximum number of species is found in the northern part of the
of economically valuable fi shes in the East China Sea. This group is
East China Sea and the minimum is found in Taiwan Strait (Zhen et
40
GIWA REGIONAL ASSESSMENT 36 EAST CHINA SEA
Table 17 Seasonal changes in the number of species in the East
China Sea.
25
3.5
Seasons
Fish
Crustaceans
Squid
Total
A
3.4
Spring
235
102
28
365
20
3.3
Mean level
Summer
224
91
35
350
v
e
l
15
Catch
3.2
Autumn
264
87
32
383
(Million tonnes)
3.1
10
Winter
201
83
18
302
tch
Ca
3.0
Mean trophic le
(Source: Zhen et al. 2003b)
5
2.9
0
2.8
al. 2003b). The number of species is higher in the pelagic area than
off shore. The distribution of fi sh density in a total year is larger in the
75
north than in the south. Fish densities decrease in the following order:
B
70
from the off shore region to the north of the East China Sea, to the
(cm)
65
pelagic sea in the north of the East China Sea to the pelagic sea in the
60
south of the East China Sea to the off shore in the south of the East China
55
Sea and Taiwan Strait. The seasonal fi sh resource density is distributed
50
as follows: in the spring the greatest density is in the pelagic sea to
Mean maximum size
45
the north of the East China Sea, in the summer the greatest density is
40
35
found off shore in the north of the East China Sea, and in the autumn
1950
1960
1970
1980
1990
2000
the greatest density is in the pelagic sea in the north of the East China
Year
Sea. The least densities are found in the Taiwan Strait in the summer, the
autumn and the spring. In winter the highest density is in the south of
Figure 26 Ecosystem status indicators for Chinese marine waters.
A: Nominal catch and mean trophic level of catch.
the East China Sea and the lowest density is in the pelagic sea to the
B: Mean maximum length of species in the catch.
north of the East China Sea. The maximum distributions of fi sh resource
(Pang & Pauly 2001)
weight densities as compared to water depths in the East China Sea
decrease in the following order: the most fi sh are found at 60 m or
to 498 000 tonnes in 1990, the latter owing most likely to an increase in
less, then in 60-100 m of water, then at depths of >150 m and fi nally at
fi shing eff ort. The trends in the major inshore fi sheries are that the catch
depths of 100-150 m. Fish stock weight density varies seasonally in the
tends to be small in size, of low value, young, and of earlier maturation,
following manner: the maximum weight density is at water depths of
like Trichiutus lepturus (Figure 26).
60 m in the spring and autumn; in the summer it is found at depths
between 60 m and 100 m; and in the winter it is at depths of >150 m.
Environmental impacts
Daytime resource weight density and resource number density are 1.49
Overexploitation of living resources
times and 1.33 times more than nighttime densities respectively at the
Largehead hairtail (Trichiurus lepturus) is distributed throughout the
end of the twentieth century (Zhen et al. 2003b).
tropical and temperate waters of the world, including the off shore
waters of China. The Shengshang fi shing ground in Zhejiang Province
The catch from the East China Sea is historically about 50% of the national
is the largest fi shing area for T. lepturus in the East China Sea (Figure 27).
catch; at present it is 42%. Production of some economically important
The Small yellow croaker lives in the Yellow Sea, the East China Sea and
fi sh species from the East China Sea, such as Larimichthys crocea, and
the Bohai Sea, mainly in near shore areas off Jiangsu, Zhejiang, Fujian,
Larimichthys polyactis, had begun to decline even before 1970. Although
Duangdong and Shanghai (Figure 28). It lives in the sublittoral zone in
total production had partly increased, the catch per unit eff ort (CPUE)
sandy mud bottoms. Fish of the species Chinese sturgeon (Acipenser
gradually decreased, and the individuals caught decreased in size (Tang
sinensis) migrate to the upper reaches of the Yangtze River to spawn.
& Su 2000). The catch of high quality fi sh also decreased. For example,
Population numbers have dropped so rapidly in recent years that
catches of Larimichthys polyactis decreased from 163 000 tonnes in 1957
the species has been designated as a national threatened and state
to 23 000 tonnes in 1990. The catches of Larimichthys crocea decreased
endangered species. Fry are found in slow-moving water, adults in
from 178 000 tonnes in 1957 to 25 000 tonnes in 1990, while the yields
deep water.
of Trichiutus lepturus Linnaeus decreased from 577 000 tonnes in 1974
ASSESSMENT
41
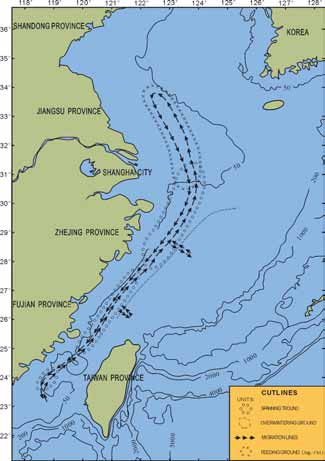
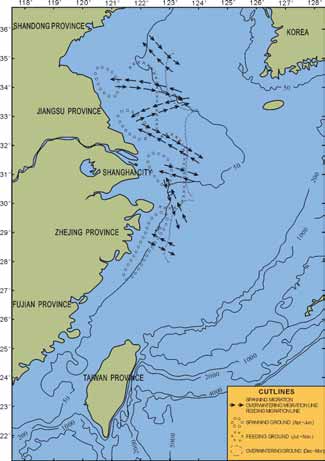
Figure 27 Distribution
of
Trichiurus lepturus and its migration
Figure 28 Distribution of Larimichthys polyacti and its migration
routes.
routes.
(Zhen et al. 2003b)
(Zhen et al. 2003b)
As a pelagic species, the Chub mackerel (Scomber japonicus) lives to in
season was once about 4-5 months, but it has now been reduced to
a lesser extent in epipelagic waters. It stays near the bottom during the
about 3 months. In the past, the Shengshan Fishing Ground was the
day and rises to the surface at night where it feeds on copepods and
main fi shing area in the winter fi shing season, but this area hasn't been
other crustaceans, fi shes and squids. In Asian marine waters, it is said to
opened to fi shing in recent years.
move to deeper water and remain inactive during the winter season.
The catch of Trichiutus lepturus in the East China Sea has increased
Larimichthys polyactis has been in decline over the past few decades,
in recent years as a result of fi shing restrictions. Strong recruitment
in part because of poor fi shing practices such as boat-knocking, a
of Trichiutus lepturus has also contributed to the trend. In the early
traditional Chinese fi shing technique in which the side of the fi shing
1990s, Trichiutus lepturus resources declined radically; fi shing for the
boat is struck to make sounds to damage the fi sh's ear. By the mid-
species was restricted in the summer of 1995. After that time its yields
1970s, yields had dropped dramatically. Larimichthys polyactis catches
increased quickly as a result of conservation eff orts. Trichiutus lepturus
have increased in recent years because of the 1995 closure of the fi shing
is characterised by broad distribution, long-distance migration, a long
season and a ban on fi shing in the Lusi Fishing Ground. As is true with
spawning period and an expansive spawning area. Now the primary
Trichiutus lepturus , the catch increase exceeds recruitment. The average
catch is composed of year-old individuals, which eff ectively results in
age of catch for this fi sh dropped from 3 years in the 1960s to 1.02-1.33
miniaturisation of the catch. The catches average anal length of fi sh
years by the late 1990s. Catch miniaturisation became quite serious in
caught in the summer in the 1990s was 194.9 mm, 32 mm shorter than in
the late 1990s as compared to the 1950s-1960s, when the average age
the 1980s. The average anal length in the winter of the 1990s was 188.5
was 4-6 years. Therefore Larimichthys polyactis can also be considered
mm, 38 mm shorter than in the 1980s. The average anal length now
to be overexploited (Tang & Su 2000).
is 176.34 mm, 15 mm shorter than 1990s. The fi shing period in winter
42
GIWA REGIONAL ASSESSMENT 36 EAST CHINA SEA
Poor fi shing techniques have also contributed to the dramatic decline
is about 8.5░C, and adult fi sh begin to spawn. Hemisalanx prognathus'
of the Large yellow croaker. This species is now rarely can caught in
lifecycle lasts only one year. The larva move down the estuary and stay
traditional fi shing grounds such as Lvsi (north of the Yangtze River
in the bayous of the Yangtze River, Tongsha, and Niupijiao, where the
estuary) and Daiquyang (Zhoushan Islands). The species also cannot
larva feed and overwinter. Based on statistical data from 1959 to 1987,
be found in traditional wintering grounds and the population is still
the maximum production of Hemisalanx prognathus per year was about
declining.The age composition of the Large yellow croaker population is
560 tonnes while the minimum was 21 tonnes. Pollutant discharges
very complex; with a low fecundity and long lives (the oldest specimen
into the Yangtze River bayou destroyed spawning areas for Hemisalanx
was found to be 29 years old), the fi sh do not lend themselves to rapid
prognathus, while overfi shing reduced adult fi sh biomass. Resources of
recovery once the population is destroyed. Therefore, although eff orts
Hemisalanx prognathus were exhausted by the 1990s. Since the 1990s
have been made over the last 20 years to implement a seasonal fi shing
the species has disappeared from the Yangtze River estuary.
ban on the main fi shing grounds, there is no sign of recovery.
Maricultural enterprises in the coastal areas of the East China Sea have
Destructive fi shing practices
developed to the point where in the 1980s they had grown to be an
Beginning in the 1950s, in an eff ort to increase the catch, the idea of
important source of income relative to the traditional fi shery (Figure 29).
"more fi sherman and more nets, more fi shing and bigger catches" was
Large-scale aquaculture led to an increase in organic pollution in the
embraced by policymakers, while resource conservation was ignored.
coastal waters, which in turn aff ected or even destroyed the aquaculture
To improve fi shing capacity, trawling and trap nets were adopted
economy (Ye et al. 2004). Shrimp disease is prevalent in aquaculture farms,
whereas the traditional fi shing methods like drift nets, which are
with many diseases related to environmental pollution from the industry,
relatively benign for the fi sheries resource were abandoned. Fishermen
such as Penaeus chinensis red-leg disease and Zoothamnium disease. In
were equipped with large horsepower boats and nets with small mesh.
the early 1990s, the fatal Penaeus chinensis red-leg disease became so
Fishing shifted from being a seasonal operation to all-year work, so that
widespread that the prawn-culture industry suff ered great losses.
the spawning and wintering stockes were fi shed equally aggressively,
and the resource was terribly destroyed. Illegal fi shing techniques,
3.0
such as electrofi shing, poisoning and fi shing with explosives were also
Shanghai
2.5
reportedly used. Poor fi shing methods intensifi ed resource decline.
Zhejiang
Fujian
Before the 1970s, popular fi shing techniques such as boat-knocking
2.0
resulted in reductions of large yellow croaker and little yellow croaker
1.5
populations, leading to the extinction of the Small yellow croaker in the
Million tonnes
mid 1970s and Large yellow croaker in the mid 1980s.
1.0
0.5
Decreased viability of stock through pollution and disease
Serious pollution leads to eutrophication of coastal waters and results
0
in harmful algal blooms (HAB). In the 1980s, there were more than
1980
1984
1988
1992
1996
2000
Year
220 harmful algal blooms in coastal areas of the East China Sea, with
Figure 29 Mariculture production in East China Sea coastal
127 species of algae capable of producing harmful blooms. Blooms
provinces.
damage the nearshore fi shery, as well as oyster and shrimp farms. The
(NMDIS 2004b)
tidal fl ats in the littoral zone are polluted, which has occasionally led to
extinctions. For example, pollution in the Yangtze River delta region led
Red-leg disease makes a prawn's thoracic limb and abdominal
to the extinction of Hemisalanx prognathus in the 1990s.
appendage appear red. Abnormal behaviour aff ects the shrimp's
ability to swim, search for food and moult. In the end, the shrimp move
Hemisalanx prognathus is an economically valuable fi sh that inhabits
slowly, cannot control their direction, swim around the side of pool,
near shore areas. Around February every year, a spawning population
and fall down to the bottom of the farming pool and die. This fatal
migrates from the East China Sea to rivers to breed. They swim into the
disease attacked the Chinese shrimp culture industry so seriously that it
Yangtze River in March, moving along the south bank of the Yangtze
destroyed most of national cultured shrimp harvest. Organic pollutants,
River estuary during their anadromous migration. From late February
increased water temperatures and poor water quality were identifi ed as
to the middle of March, the temperature of the water in Yangtze River
contributing reasons for the disease (Ye et al. 2004).
ASSESSMENT
43
Impact on biological and genetic diversity
Over the last decade, there have been a few reports of human disease
In 1960s, reclamation in the tidal fl ats of littoral zones of the East China
outbreaks resulting from tainted fi sh or other marine products. Despite
Sea destroyed these areas' biological diversity. Fujiang Province, for
overfi shing and depletion of wild fi sh stocks, the total income from the
example, has a total beach area of about 2 800 km2, but one-third of
region's fi sheries and from other marine products has increased due to
this area was reclaimed for either farmland (746 km2) or salt production
signifi cant increases in aquaculture production. From 1956-1988, the total
(170 km2). Therefore, most of the reclaimed areas have lost their benthic
landings of fi sh in China increased by a factor of eight, but there was a
fauna (such as shellfi sh), and a signifi cant amount of Amphioxus belcheri
shift in the composition of species, from high economic value (e.g. Small
has been lost in recent years. Reclamation on a large scale in the coastal
yellow croakers) to less economically valuable ones (e.g. sardines)
zone has led to the shrinkage of benthic fauna habitat, and increased
the likelihood of soil erosion, which in turn has led to turbidity in
Conclusions and future outlook
nearshore waters.
The marine waters of the East China Sea are one of the most productive
areas in the NW Pacifi c Ocean and are heavily exploited for fi sh and
In Zhejiang Province, inclosures on the tidal fl ats in littoral zones began
other living resources. An important contribution to the world's fi shery
in the 1950s. Up until the end of 1996, about 1 550 km2 of tidal fl at area
production comes from waters in this region, which provides high quality
had been reclaimed, or about one-fi fth of the total area of reclaimed
protein to a large percentage of the region's population. The East China
farmland in China. Although reclamation has helped develop the local
Sea supports a rich diversity of marine fauna and fl ora. The increasing
economy, environmental issues were largely ignored. For example,
population of countries in the coastal areas is partly dependent on
the Zhoushan Fishing Ground is one of the largest fi shing grounds
marine and coastal resources as their main source of food.
in the East China Sea, however, the fi sheries resources there have
declined sharply over the last four decades, and deterioration of the
The fi sheries resources are the basis of fi sheries development, and the
marine environment (as a result of reclamation) is one of the main
quality of the marine environment is the foundation for the fi sheries
reasons. On the Zhoushan Fishing Ground, rock reefs and beaches are
resource and activities. The tradition for many years in the countries
important habitats. Once landforms and the undersea topography had
in this region has been to rely primarily on natural stocks, but heavy
been modifi ed, fi sh habitats and migratory routes were modifi ed or
exploitation has resulted in the depletion of the fi sheries resource at the
destroyed as well. Building farmland on the coast at a large scale is, for
end of the twentieth century, which has retarded the development of
migrating fi sh species, the same as changing the magnetic fi eld for a
the region's fi sheries-related economy.
homing pigeon; the change makes it impossible for them to return to
their habitat. In the last 40 years, the total area of reclaimed farmland
The average fi sh size in today's catch has shrunk because the stocks
in the East China Sea region has added up to 10 000 km2. In the last 20
are fully or overexploited, leaving the fi shery dependent on small
years, nearly 300 km2 of wetland area has been reclaimed along the
pelagic fi sh and young or immature fi sh with lower economic value.
coast of Shanghai. Marine construction, such as building harbours,
Miniaturisation and earlier maturation of fi sh resources are signs that
has destroyed habitats, particularly wetland ecosystems, which has
stocks have been seriously depleted (Tang & Su 2000).
prevented many birds and migratory fi shes from returning to their
nesting and spawning grounds, resulting in biological losses.
Today, the fi shing eff ort and intensity in the East China Sea are expected
to continue to increase. Although protective measures have been
Introduced, non-native species now found in the East China Sea have
enacted, serious problems, such as an increase in the number of fi shing
occupied the habitats of local species and pushed them out. For
boats, still remain. In addition, some illegal fi shing methods, such as
example, various Balanus sp. , Mytilopsis sallei and Spartina angelicahave
trawling with nets with small-sized mesh, and electroshock fi shing, have
outcompeted native species. Competition between introduced species
accelerated the decline of the fi sheries resource. Moreover, some coastal
and native species, has threatened the survival of Scirpus mariqueter,
waters have been so seriously polluted that spawning and hatchery
for example, by Spartina alternifl ora on the East Beach of Shanghai's
grounds have been aff ecting, which in turn aff ects recruitment.
Chongming Island (Ding & Xie 1996).
Compared with other regions of the world, the current fi sheries
Socio-economic impacts
management in the East China Sea is not well developed. Implementation
The catch per unit of eff ort has been reduced by more than 40 times
of approaches such as Ecosystem Based Management (EBM) will require
in last fi ve decades , while wild fi sh stocks have decreased (Jin 2000).
a huge eff ort in order to develop sustainable fi sheries for the region.
44
GIWA REGIONAL ASSESSMENT 36 EAST CHINA SEA
T
C
A
Global change
IMP
the East China Sea, 45 mm higher than for 1975-1986 (State Oceanic
Administration 2004a). In 2003, the sea level rose by 3.1 mm/year, and
Global change is considered a concern of moderate to high importance
the sea level was 66 mm above that for the average of period of 1975-
in the East China Sea region, given the rapid economic growth, dense
1986 (State Oceanic Administration 2004b). On the East China Sea coast,
population and lowland character of the countries bounding the sea. At
the sea level change rate varies considerably from north to south, i.e.
interannual time-scales, the spectra of sea surface temperature anomaly
2.5-3.5 mm/year in 2003.
(SSTA) in the East China Sea show strong signals at the periods of 2.0, 3.7
and 7-8 years, and signifi cant coherence with the Kuroshio at periods
It was predicted that by 2006, the average sea levels for the coast of the
longer than 5 years, which was comparable to the characteristics of
East China Sea will be increased by 6-28 mm relative to 2000; while in
the El Ni˝o 3.4 sea-surface temperature (SST) of Equatorial Pacifi c
2013, sea levels will be 26-55 mm higher than in 2000.
Ocean (Park & Oh 2000). It is known that the infl uence of El Ni˝o causes
changes in the amount of precipitation received by the drainage basins
Socio-economic impacts
and the water fl ow of rivers in this region; however, how anthropogenic
It is diffi
cult at present to identify any regional economic stagnation
activities have aff ected the frequency and magnitude of this natural
in relation to global change. There is no signifi cant evidence
phenomenon remains poorly documented.
suggesting there will be regional human health problems as a result
of global change. Human health concerns are considered to be more
Environmental impacts
important than the economic impacts under consideration. There is no
Change in the hydrological cycle
discernable pattern linking social confl icts relating to resource use, and
Variations in the hydrological cycle are mainly related to human
environmental damage liability and compensation increases over last
activities and climate change, which can be identifi ed in the fl uctuation
4-5 decades with global changes. Sea level change may aff ect human
between high and low water stages in the river, and the dynamics of
settlements and the stability of social and economic frameworks in the
the surface level variation of water bodies. Hydrographic observations
region, in terms of sustainable development.
in the land area bounding the East China Sea can be traced back to the
late nineteenth and early twentieth centuries, in the watersheds of the
Conclusions and future outlook
Yangtze River. The hydrographic data from the lower reaches of the
Global change is a complex process. Although global change aff ects the
Yangtze River show that the annual water discharge varies from 15 000-
economy of the East China Sea, the detailed eff ects remain unclear. In
20 000 m3/s to 40 000-45 000 m3/s in 1920-2000, with an average of ca.
the future, research will be required to determine and address regional
30 000 m3/s. Although the long-term annual water discharge does not
manifestations of global change.
show any increasing or decreasing trends, statistical analysis shows a
signal of interannual changes in water discharge, in synchronisation
with the El Ni˝o Southern Oscillation (ENSO). At interannual time scales,
the water fl ow has periods of 7, 9 and 17 years (Shen et al. 2003). The
Priority concerns
annual average water fl ow in the period of 1960-1980 was 20-30% lower
compared to that for 1930-1950.
GIWA concerns were assessed as slight or moderate in the East
China Sea region. The priorities were assigned based on consensus
Sea level change
decisionmaking using available information and future trends discussed
Sea level change is of major concern in this region, especially with
during the workshop. The assessment considered overexploitation of
respect to the economic development of countries bordering the
fi sh, pollution and habitat modifi cation.
East China Sea. For example, the most economically developed areas
of China are located in the lowland fl uvial plains to the west of the
The GIWA concerns were prioritised as follows:
East China Sea, at elevations of <10-50 m above sea level. Similarly, the
1. Unsustainable exploitation of fi sh and other living resources
coastal area of Korea and Japan and some of the islands in the East China
2. Pollution
Sea will also be aff ected by sea level increases. Based on information
3. Habitat and community modifi cation
from a national monitoring network, the sea level as measured along
4. Freshwater
shortage
China's coastline had increased at rate of 1.0-3.0 mm/year over the last
5. Global change
50 years. In 2000, the sea level increased at a rate of 2.8 mm/year for
ASSESSMENT
45
The most severe problem for the region at present is the unsustainable
coastal areas, unless proper measures are taken at both regional and
exploitation of fi
sh and other living resources, particularly
national levels. Eutrophication caused by agrochemicals, aquaculture
overexploitation of fi sh stocks. The fi shing eff ort in the East China
and sewage discharges has become one of the primary issues in the
Sea has increased hundreds of times since 1952, which results in great
East China Sea coastal region. Cooperation and coordination between
pressure on the fi sheries resources. The annual catch in the East China
countries in the East China Sea will be required to improve the water
Sea has not increased proportionately with the increase of fi shing
quality in the sea, particularly taking into account land-based human
eff ort there. Currently the fi shing eff ort and intensity in the East China
activities, with the outlook of regional ecosystem health and sustainable
Sea are expected to continue to increase. The analysis carried out for
development.
the region predicts that its resources will continue to be overfi shed
despite regulation and control mechanisms. This problem will persist
Habitat modifi cation is expected to increase in the future. Mangroves
in coming years.
are important wetland ecosystems in the southeastern coastal area of
China and play an important role in the protection of environment and
Pollution threatens the environmental sustainability of aquatic
biodiversity. But in recent years, due to high intensity development,
ecosystem in the region. Pollution has aff ected marine species and
the area of mangroves has declined dramatically. Habitats of plants and
modifi ed habitats, with severe consequences for biological diversity
animals in mangrove ecosystems have been greatly changed. Areas
and abundance. Furthermore, these impacts are aff ecting economic
of wetlands along the East China Sea have decreased dramatically
activities. In the past 30 years, China's surface water quality has
over two decades, which has increased damage from fl oods during
declined remarkably. Polluted agricultural run-off along with untreated
the rainy season. Land-use changes and degradation, human activity
industrial and domestic wastewater discharges are the main sources of
and deforestation problems are becoming increasingly important
pollution. Land-based pollution leads to estuarine pollution and makes
throughout the whole of the Yangtze River catchment area, from
it more diffi
cult to control pollution sources effi
ciently. Moreover, the
its headwaters to its estuary. Although the present environmental
impact of pollution is likely to increase in the near future because of
impacts in the Yangtze River Basin are moderate, severe impacts can
industrial development and population growth. In addition, growth
be expected by 2020.
in industrialisation and urbanisation is likely to cause considerable
increases in the quantity of wastewater discharged to the rivers and
The linkages between the GIWA concerns are illustrated in Figure 30.
Very significant
Significant
1. Freshwater shortage
Not significant
3. Habitat and community
2. Pollution
modificxation
4. Unsustainable exploitation of
5. Global change
fish and other living
resources
Figure 30 Linkages between the GIWA concerns in the East China Sea.
46
GIWA REGIONAL ASSESSMENT 36 EAST CHINA SEA
Causal chain analysis
This section aims to identify the root causes of the environmental
particularly the small pelagic fi sh such as scad, young chub, mackerel
and socio-economic impacts resulting from those issues and
and anchovies. The development of capacity to harvest fi sh has grown
concerns that were prioritised during the assessment, so that
the most during the last decade.
appropriate policy interventions can be developed and focused
where they will yield the greatest benefi ts for the region. In order
Nearshore species are migratory fi shes that travel south and north along
to achieve this aim, the analysis involves a step-by-step process
short distances of the coast, consisting mainly of warm-temperate
that identifi es the most important causal links between the
species. Off shore species mainly consist of warm water species due to
environmental and socio-economic impacts, their immediate
the infl uence of Kuroshio warm current. The traditional major fi shery
causes, the human activities and economic sectors responsible
species include: Largehead hairtail, Large yellow croaker, Small yellow
and, fi nally, the root causes that determine the behaviour of those
croaker, Chinese herring, pomfret, Filefi sh (Navodon septentrionalis), Scad
sectors. The GIWA Causal chain analysis also recognises that,
(Ecapterus maruadsi), Spanish mackerel, Chub mackerel, Daggertooth
within each region, there is often enormous variation in capacity
pike-conger (Muraenesox cinereus), White croaker (Argyrosomus
and great social, cultural, political and environmental diversity.
argentatus), Cuttlefi sh (Sepiella maindroni), and Blue crab. At present,
In order to ensure that the fi nal outcomes of the GIWA are viable
the most important fi shery for largehead hairtail is highly dependent on
options for future remediation, the Causal chain analyses of the
recruitment and is fully or overexploited. Most of the species that have
GIWA adopt relatively simple and practical analytical models and
been mainstays of the traditional fi shery are much like the Largehead
focus on specifi c sites within the region. For further details on the
hairtail, fully or overexploited. Large yellow croaker and Filefi sh have
methodology, please refer to the GIWA methodology chapter.
been fully depleted.
An analysis of the causal chain from immediate causes of
overexploitation of fi sh to root causes are illustrated in Figure 31.
Overexploitation of living
resources in the East China Sea
Immediate causes
Increased fi shing eff ort
The last four decades of fi sheries exploitation in the East China Sea
Although landings for marine fi sheries have increased in the last
clearly show the impact of human activities. Rapid development
fi ve decades, the catch per unit eff ort (CPUE) has decreased almost
occurred in the 1950s after the recovery from the civil war, followed
linearly after the mid-1950s, from 37.9 tonnes/horsepower in 1953 to
in the 1960s by overexploitation and fl uctuations in fi sh stocks. In the
3.3 tonnes/ horsepower in 1962, to 2.1 tonnes/horsepower in 1972,
1970s overexploitation was a serious problem, and development of
0.8 tonnes/horsepower in 1982, and below 1 tonnes/horsepower
the fi sheries slowed in spite of an increase in fi shing eff ort. Although
thereafter (Figure 32). Overfi shing in the East China Sea is also the
production still increased by 4% each year, there were serious collapses
result of the growth of the region's fi shing fl eets. China has 12 633 steel
of prime stocks such as Large and Small yellow croaker. Since the
fi shing vessels, of which 890 have more than 600 HP; there are another
1980s, the major economic species have shifted to pelagic species,
80 000 smaller wooden fi shing vessels in China, with more than half of
CAUSAL CHAIN ANALYSIS
47
Issues
Immediate causes
Sectors/Activities
Root causes
Governance
Overexploitation
Increased fishing effort
Fishery
Decreased level of recruitment
Knowledge
Destructive fishing practices
Economic
Species retrogression and
genetic problems
Figure 31 Causal chain diagram illustrating the causal links resulting in overexploitation of resources in the East China Sea.
them with motors less than 15 HP. There are also 13 854 non-motorised
Decreased level of recruitment
fi shing vessels fi shing the coast of the East China Sea. The size of the
There has been a continually decreasing level of recruitment in the
fi shing fl eet has greatly increased over the last few years. The number of
fi sheries resource in the East China Sea, especially in squid and crabs
steel vessels with more than 600 HP engines has shown a 77% increase
which have a short lifespan and rapid growth, and with reproduction
since 1997, the greatest increase to date.
highly dependent on the level of supplemental recruitment. The
increased eff ort in marine fi shing has become a problem in recent years
With the expansion of the fi shing eff ort in the East China Sea,
as this has led to reduced marine resources recruitment. The spawning
overfi shing has threatened more and more marine biological resources.
ground of the common Chinese cuttlefi sh (Sepiella maindroni), one of
Overexploitation can reduce species biomass to the brink of extinction.
the most well-know marine species of economic importance, is situated
Individual species are often targeted because of their value as a
near Zhoushan Island and Ningbo. Under increasing fi shing pressure,
commodity, which results in a shift from big to small individuals (Jin
typifi ed by an increasing number of fi shing boats using improved and
2000). In 2000, 40% of the total marine catch of China came from the
new techniques, the overfi shing of Chinese cuttlefi sh has reached a
East China Sea. Even though it is less important now than previously, the
level that gives stocks no time to recover and reproduce. Now fi shing of
East China Sea is still the most important fi shing area for the countries in
Chinese cuttlefi sh at its spawning and hatchery grounds has dropped
the region, especially the coastal waters of Zhejiang, Fujian Provinces and
to a very low level. Similar serious problems have happened with
Shanghai. Most fi shing grounds are at depths between 100 and 200 m.
recruitment of Yellow croaker (Larimichthys polyactis), Large yellow
croaker (Pseudosciaena crocea), Large shrimp (Penaeus orientalis) and
the crab Portumus trituberculatus.
16
40
CPUE
14
35
Destructive fi shing practices
Marine capture
12
30
These practices include fi shing with explosives, trawling with nets and
10
25
(tonnes/HP)
chains, and using cyanide to stun fi sh so that they can be caught alive,
8
20
CPUE
6
15
and other practices that damage or degrade important fi sh habitats
Landings (million)
4
10
such as reefs and mangroves. Illegal fi shing methods have accelerated
2
5
0
0
resource declines. Before the 1970s, the popular fi shing technique called
1951
1954
1957
1960
1963
1966
1969
1972
1975
1978
1981
1984
1987
1990
1993
1996
1999
boat-knocking destroyed populations of the large yellow croaker and
Year
the Small yellow croaker, fi nally leading to the extinction of the Small
Figure 32 Marine capture and CPUE in China.
yellow croaker in the middle 1970s and the Large yellow croaker in
The Yellow Sea and East China Sea represent 60-80 % of the total.
(Source: Jin 2000)
the middle 1980s. Trawl fi sheries, mainly bottom trawl, have had the
48
GIWA REGIONAL ASSESSMENT 36 EAST CHINA SEA
highest yield of all fi shing fl eets, between 40-61% of the total catch.
Governance
This fl eet accounts for 47% of the total catch which slightly decreased.
There are too many trawlers and static nets in operation, and gill net
The other major fi shing methods are purse seining, driftnetting, and
mesh sizes are smaller than are allowed by national regulations. At
fi xed netting.
present, although China has taken measures such as imposing (1) closed
fi shing seasons and areas, (2) limits on fi shing capacity, (3) controlling
Species retrogression and genetic problems
the licensing of access to fi shing, and (4) restrictions on the construction
Because of species retrogression and genetic problems due to
of fi shing vessels, these measures have not fundamentally reversed the
successive inbreeding aquaculture stocks have shown some genetic
overfi shing situation, owing to a lack of awareness of fi sheries resource
problems such as declines in growth and age at maturity, smaller adult
status, along with no imposition of a total allowed catch (TAC) limit or
fi sh, and an increase in the incidence of diseases (Ye et al. 2004). In
fi shing quotas, compounded by insuffi
cient fi sheries administration
natural populations of silver carp, the female age of maturity is 3-4 years
capability.
with an average body weight of 4.85 kg, and the male age of maturity
is 3 years with an average body weight of 3.81 kg. After inbreeding for
At present, the marine fi sheries resource is a public resource over
fi ve generations, the female age of maturity declined to 2 years with
which none has complete ownership, so anybody can enter the
a body weight of only 1.25 kg and the male age of maturity declined
fi shery without payment and there is little accounting of the social
to one year with a body weight of only 0.69 kg. Severance of the links
costs of resource depletion. Failure to manage fi shing and the fi sheries
between lakes and rivers by hydroelectric and irrigation projects
resource in the East China Sea has led to a number of serious problems
has changed or disrupted dispersal and migration of species. These
that stand in the way of sustainable development. Resource problems
environmental changes accelerate the extinction of remnant species,
are inevitably linked to social and economic problems, including
and consequently decrease biodiversity abundance.
developing population, pollution, disease, income of fi sherman, land
shortages and lack of legislation.
Root causes
Knowledge
Economic
Insuffi
cient knowledge about the maximum sustainable yield (MSY)
Most of the fi shermen along the East China Sea have not been well
of the fi sheries resource and a lack of both systematic monitoring and
educated and lack the money to begin new businesses. People
surveys of fi sh stocks are the main problems in fi shery management.
continue to become fi shers because fi shing still can generate relatively
The dynamics of fi sh resources and the maximum sustainable catch are
higher benefi ts than other occupations. For example, in Shenjiamen in
not well understood, thus marine fi sheries have been managed without
the Zhoushan Islands, the local fi shery authorities are worrying about
any concern for sustainable yields. Many fi shers and marine fi shing
the future of about 1 200 fi shermen who do not have boats. Zhejiang
businesses continue to believe that the marine fi shery is unlimited,
Province now has more than 200 000 fi shermen who need new jobs.
and that the more fi shing vessels that are deployed, the more fi sh will
Without new training, fi shing is their sole option.
be caught.
Trawlers have seriously damaged the juvenile fi sh populations of
major economic species. Moreover, ground trawls damage not only
Eutrophication in the
the fi sheries resource but also the habitat and environment of the
Yangtze River estuary and
inshore and off shore areas. The fi shing grounds for static nets are all
adjacent inner shelf
located in inshore waters or estuaries, and intercept the migration of
fi sh, which causes severe damage to the fi sheries resource, especially
juvenile fi sh. Gill net operations have been greatly increased owing to
The coastal region adjacent to the Yangtze River estuary is one example
the shift in target species to small-size species in recent years. Gill nets
of an area suff ering from the serious impacts of eutrophication, resulting
with small-size mesh catch a large amount of the juveniles of large-size
in the proliferation of phytoplanktonic biomass and algal blooms. This
fi sh species while also catching the small-sized, target fi sh species. In
type of environmental problem has caused great concern in the
addition, all the gill net operations are conducted in inshore areas that
scientifi c community and has become a common topic of discussion
are also the spawning and nursery grounds for fi sh, thus gill net fi shing
in the media, and hence has been studied thoroughly within the
also damages the coastal fi shery.
framework of a Chinese national research project and through
CAUSAL CHAIN ANALYSIS
49
international cooperative eff orts such as the Intergovernmental Oceanic
species has increased dramatically after the1990s, which parallels the
Commission/Scientifi c Committee on Ocean Research, Global Ecology
development of eutrophication in coastal waters. For instance, the HAB
and Oceanography of Harmful Algal Blooms (IOC/SCOR GEOHAB).
events induced by Prorocentrum sp. in May 2000 covered an area of
5 000-10 000 km2 in the region off the Yangtze River estuary.
Eutrophication is an international problem but its form of expression has
a strong regional character: in terms of the East China Sea region, the
Water quality assessments have been conducted in the East China Sea
problem of eutrophication can be linked to either land-source inputs
using the coastal monitoring programs of the SOA and the Ministry of
or human-related issues in coastal waters, or both.
Fisheries, and these assessments have been compared to predictions
made by statistical models, using available information for discharges
The summer effl
uent plumes from the Yangtze River spread eastward
from point and non-point sources, increases in population and other
over the East China Sea shelf and cover a surface area of 80 000-
relevant socio-economic data.
90 000 km2. The front of Yangtze River effl
uent plumes may reach the
break of the continental shelf in the summer. One of the special features
Figure 33 summarises the major characteristics of the causal chain
of the Yangtze River infl ow to the East China Sea is that high N/P and
analysis with regards to coastal eutrophication in the East China Sea,
N/Si ratios can be tracked over a distance of 300-400 km from the river
with links between the problems of eutrophication and immediate
mouth in surface waters.
and root causes.
Although the record of harmful algal blooms in the East China Sea can
Immediate causes
be traced back to the 1930s, the number of HABs increased sharply in
The discharge of nutrients from land sources has increased considerably
1980s when China launched economic improvements. It was reported
over the last two decades. For example, the dissolved inorganic nitrogen
that the number of harmful algal blooms in the 1990s had increased
(DIN) level in the Yangtze River has increased by a factor of 2 on average
to 50-100, which is an increase by a factor of 5 when compared to
from 1980-2000. Additional short-term impacts are due to deforestation
the 1980s (Zhou et al. 2001). Paralytic Shellfi sh Poisoning (PSP) and
and damming in the watersheds, followed by erosion and soil loss and
Diarrhetic Shellfi sh Poisoning (DSP) have been frequently reported.
trapping of sediments in reservoirs. These kinds of activities aff ect the
These illnesses cause human health problems and sometimes death
riverine nutrient fl ux and are also responsible for high turbidity in the
in the area aff ected by HABs (Zhou et al. 2001). The number of HAB
coastal environment.
Issues
Immediate causes
Sectors/Activities
Root causes
Eutrophication
Riverine input
Agriculture
Demographic
Marine culture
Governance
Fishery
Sewage drainage
Aquaculture
Knowledge
Others
Industry
Socio-Cultural
Urbanisation
Figure 33 Causal chain diagram illustrating the causal links of eutrophication in the Yangtze River estuary and the adjacent inner shelf.
50
GIWA REGIONAL ASSESSMENT 36 EAST CHINA SEA
Data on non-point sources of nutrients can be obtained from riverine
as follows: non-point sources, with riverine input of terrestrial plant
monitoring upstream of the estuary. These sources are integrated
nutrients either from soil erosion or fertiliser use, or both; point sources,
and show the overall discharge into the coastal environment. The
which come from sewage discharges, and releases from mariculture.
application of chemical fertilisers may not necessarily induce increased
coastal eutrophication, because nutrients are required for the annual
Additional sources may be atmospherc deposition (dry and wet) of
growth of crops which in turn fi x the nutrients in the watersheds, as
nutrients and other pollutants. Concentrations of ammonia can be
long as the application of fertiliser does not exceed plant demands
higher than nitrates in rainwater, and the N/P ratio of rainwater can be
and the fertilisers are not washed out just after use. Point source inputs
high. In the middle shelf area of the East China Sea, contributions from
of nutrients to the marine environment are closely related to human
atmospheric deposition can be greater than land-source (e.g. river)
behaviour in the coastal region. The coastal provinces and municipal
infl uences (Tang & Su 2000).
cities cover a surface area of about 5% of the country's land area, but
the residential population accounts for about 50% of the national
Demographic
population. The discharge related to human settlements is believed to
Coastal eutrophication is positively correlated with the increase in
be the main source of nutrient concentrations in some areas of the East
population in the coastal area, both as a consequence of urbanisation
China Sea coast. Sewage treatment capacities are generally low and are
and as a result of the eff ort to reduce off shore fi sh catch in recent years
only able to treat about 50% of the total sewage production and daily
and the subsequent increase in mariculture production.
sewage water from Shanghai, which reaches ca. 5 million tonnes. It is
believed that a signifi cant part of this contribution could be avoided
Knowledge
with reforms, and by improving the area's sewage treatment capacity.
Fertiliser is used extensively in agriculture, because of the need to boost
Improvements to the existing water supply and drainage system,
production in response to population increases and the associated
along with social and economic reforms, should be initiated to ensure
demand for agricultural products. Inadequate knowledge about the
that human waste will not enter the coastal waters without proper
use of fertiliser and traditional agricultural practices both contribute
treatment.
to the increasing nutrient loads in surface waters. Failures in sewage
treatment have the same eff ect. In many settlement centers, the sewage
In China, the production of coastal mariculture increased by 50% in
treatment capacity is not up to international standards and/or sewage
the late 1990s and reached ca. 11 million tonnes in 2001, which is a
is discharged without proper treatment. The population is not well
level comparable to the fi sh catch. It was estimated that production in
educated in rural and some urban areas about the links between land-
the tidal fl at accounts for 47% of this increase, while the shallow water
source pollutants and harmful eff ects on the coastal environment.
areas account for 4% and the bay for 7% (State Oceanic Administration
2004c). It is possible that a signifi cant nutrient load has accumulated
Socio-cultural
in concert with mariculture development in the coastal region,
Sewage may be directly discharged without proper treatment to
together with organic wastes, because aquaculture requires the use
reduce costs to industry, or it may result from a simple lack of adequate
of a large amount of organic substances, which have a high of carbon,
capacity, because population growth has outstripped the ability of
nitrogen and phosphorus content. Although at present it is diffi
cult
municipalities to build treatment facilities in a timely manner. The
to estimate the quantity of nutrients and organic carbon discharges
removal of vegetation from coastal wetlands for mariculture (e.g.
related to mariculture, its contribution to the development of coastal
shrimp ponds) has also become common practice, which eliminates the
eutrophication may be comparable to that from the direct discharge
ability of this vegetation to absorb nutrients. Other traditional activities,
of domestic waters. Another important source of pollution comes from
such as fi shing, suff er from the deterioration of product quality (from
the discharge of ballast water, as the East China Sea is an important
disease) while recent advances in sciences and technology are not well
waterway for cargo transport and a number of harbours are located
understood among fi shermen.
along the coast. The discharge of ballast waters may also introduce HAB
species from other regions.
Governance
There is a lack of follow-up with respect to regulations that limit nutrient
Root causes
drainage to the coastal waters, because it is believed that the most effi
cient
Based on the previous discussions, the immediate causes of
way to reduce coastal eutrophication is to have sound environmental
eutrophication in the East China Sea coastal waters can be summarised
management of the watersheds, following principles of sustainable
CAUSAL CHAIN ANALYSIS
51
development. Although there are national laws for the protection
marine habitats are irretrievably being lost owing to the construction
of the marine environment, oversight and management of off shore
of harbours and industrial installations, tourist facilities, aquaculture,
activities are often ineffi
cient. Catchment areas and marine waters must
and from the growth of settlements and cities; (2) severance of the
be managed together using a participatory approach that includes all
links among lakes, rivers and sea channels by construction of sluices
stakeholders from both terrestrial and marine environments, combined
and dikes has led to the impoverishment of the natural fi sheries
with an integration of the eff ects from both public and private sectors.
resource, especially for migratory fi shes, causing a shortage of large-
The study of marine environmental management and protection should
sized economic fi sh species that are mostly migratory among lakes,
be a required part of future industrial and agricultural development plans,
rivers and the sea; (3)estuarine and embayment habitats have been
with these new requirements accommodated for and/or mandated by
modifi ed considerably, so that wetlands areas have been narrowed, and
law, in accordance with United Nations Conventions.
the natural environment of the estuaries and embayments has been
altered by the conversion of beach and wetlands to farmland.
An analysis of the Causal chain from immediate causes of habitat and
Habitat and community
community modifi cation to root causes is shown in Figure 34.
modification in coastal waters
Immediate causes
The environment of the East China Sea has been faced with serious
Loss of wetlands
problems from pollution from the Yangtze River drainage basin and
The wetlands in the East China Sea coastal areas include fragments in the
areas along the coasts where the local economy has expanded.
mud fl ats along rivers. The dominant species in wetlands are fresh and
Improper use of natural resources and a short-term economic outlook
marine water benthos, fi sh, shrimp and aquatic plants. These wetlands are
have resulted in environmental degradation over a fairly short time
feeding and spawning grounds where fi sh and other aquatic animals live.
frame, and degradation has now reached a level at which the health
Modifi cation of aquatic habitats is one of the most important problems
and resources of the coastal region have been damaged.
resulting in the degradation of the fi sheries resource. Water pollution is an
important source of toxic pollutants in wetland ecosystems.
In the last four decades, rapid industrialisation, combined with
economic and social development in the coastal area of the East
Extensive reclamation of farmland from the sea is also a serious problem
China Sea have produced three kinds of environmental problems: (1)
in China. Thousands of hectares of shoals have been reclaimed in the
Issues
Immediate causes
Sectors/Activities
Root causes
Habitat and community
Waterway modification
Reclamation
Lack of knowledge
modification
Industry and transport
Loss of wetlands
Economy
Tourism
Harmful algal blooms
Demographic
Industry
Chemical pollution
Institutional
Agriculture
Forestry
Figure 34 Causal chain diagram illustrating the causal links between habitat and community modifi cation in coastal waters.
52
GIWA REGIONAL ASSESSMENT 36 EAST CHINA SEA
Yangtze River Estuary and other river coastal regions of the East China
both domestic and industrial waste, 2) increased requirements for land,
Sea, especially on Chongming Island, and in the Nanhui district of
3) increased discharges of agricultural chemicals and, 4) increases in
Shanghai, as well as Ningbo, Shaoxing, Zhangzhou and Zhoushan
construction, tourism and transportation. Problems, such as insuffi
cient
Island. Zhejiang Province is in the process of reclaiming 20 000 ha of
fi nancial resources for environmental management, and the need to
shoals. Local governments are eager to have more land to improve the
build institutional capacity to manage these problems, militate against
coastal economy, rather than protect living resources. This is the reason
implementing solutions.
behind much of the wetland conversion into farmland.
Because domestic and industrial effl
uent discharges, atmospheric
Harmful algal blooms
deposition, oil spills and other contaminants from manufacturing
Coastal China is an important economic area characterised by rapid
wastes, shipping, coastal tourism and other economic endeavours
economic development and a growing population. This has led to
are increasing, marine pollution has become a very serious problem
a signifi cant increase of wastewater and sewage discharges directly
in the coastal region. Most of pollutants are composed of nutrients,
into the East China Sea, resulting in eutrophication and harmful algal
toxic chemicals and oil from land-based sources. With the developing
blooms. Fisheries resources and aquaculture operations are aff ected by
economy and increasing population, the concomitant pollutant
these HAB events and eutrophication, which can lead to a reduction in
increase from these land-based sources now aff ects not only on the
ecological diversity, and human health problems.
shallow inshore habitat but also the deeper/wider ocean ecosystem.
Waterway modifi cation
Economic
Construction of dams and dikes among lakes, river and sea has led
Development along the coast of the East China Sea depends heavily on
to the destruction of the lake-river-sea ecosystem by severing the
the shared resources of the sea and the coastal land base. The demand
interconnections that are important for some migratory fi sh species.
for more land motivates local governments to reclaim coastal wetlands
This has caused lakes to be dominated by species of small size and
for industry, ports and tourist facilities, in spite of eff orts to conserve
has diminished the populations of migratory species by limiting their
wetlands. These activities have caused direct harm to coastal habitats,
ability to reproduce.
particularly in the estuarine and coastal systems. The need for land
results in the loss of biological habitats. The problem is so widespread
Chemical pollution
that it is diffi
cult to estimate its signifi cance.
There are two separate threats that are currently being faced by the
East China Sea as a result of the increased discharge of agricultural
Institutional
chemicals. Firstly, pollution from chemical fertilisers that are now
The desire to address marine pollution and other environmental
widely and indiscriminately used on farmland results in direct damage
problems is often hampered by the lack of suffi
cient fi nancial resources.
to marine ecosystems, by causing eutrophication and harmful algal
The problem is particularly acute in China where insuffi
cient budgetary
blooms. Secondly, overuse or misapplication of pesticides harms
allocations are made to control marine pollution and modifi cation of
the biota and the ecological balance of the marine environment.
biological habitats. At present, the constraints on the management of
More serious but indirect physical damage to the coastal and marine
environmental problems in China result from insuffi
cient resources
ecosystem results from soil erosion following deforestation, which is a
(equipment, personnel, training) and inadequate allocation of fi nancial
major outcome of the unsustainable exploitation of forest products,
resources for environmental protection. Funds for garbage collection,
which itself has caused over 1.1 million ha, or about 1%, of the region's
illegal logging and dumping of wastes, operation of existing sewerage
forests to disappear due to overextraction. For example, cutting trees
and sewage treatment facilities are simply unavailable at the levels
reduced forest coverage in the upper reaches of the Yangtze River from
required for environmental protection.
30 to 40% in the 1950s to only 10% by 1998 (NBSC 2001).
Root causes
Lack of knowledge
Demographic
A major problem confronting the countries of the East China Sea
The dense population in the coastal area of the East China Sea has
is the lack of skilled staff to undertake monitoring, surveillance and
inevitably resulted in great pressures on the coastal environment and its
enforcement of environmental regulations. Some problems can be
resources. The most problematic pressures are: 1) increased volumes of
attributed to the fact that local environmental bureaus have helped
CAUSAL CHAIN ANALYSIS
53
fi rms obtain permission to build factories and projects beyond what
Table 18 Changes in the area of Poyanghu Lake since 1954.
is normally permitted to protect local economies or even because of
Area
Coeffi
cient of regulation
Drained areas
Year
(km2)
(%)
(km2)
corruption. Eff ective law enforcement is essential for the protection
1954
5160
17.3
0
of resources and the control of water pollution. In addition, a lack of
1957
5004
16.9
154
education and jobs, and the growth in population in the basin are also
1961
4720
16.0
440
the root causes of the problems in the marine environment.
1965
4410
15.2
750
1967
4128
14.2
1040
1976
3914
13.8
1246
Habitat and community
1984
3890
13.8
1270
modification in inland systems
1995
3860
13.8
1300
(Source: Min 1999)
Reclamation of land from lakes in the middle and lower reaches of rivers,
Han Shui
combined with the construction of dams in the fi rst-order tributaries
Tree Gorges Dam
Hefei
have resulted in serious environmental problems and greatly modifi ed
Jialing
Nanjing
Shanghai
habitats and communities that many species depend on. Central and
Wuhan
Sandouping
Yangtze
local governments have paid more attention to these problems in
Chongqing
China
Hangzhou
recent years.
Figure 35 Three Gorges Dam.
Changes in hydrological regimes and reduced winter and spring run-
off result in both decreased depth of river delta waterways, reduction
1995, while the Poyanghu has been fi lled with 0.62Î109 tonnes of
in delta vegetation (e.g. reeds) and saltwater intrusions. As the winter
sands from 1954 to 1997. These activities not only reduce the area
and spring water fl ows are reduced, the salt water of the East China
of the Poyanghu and change the lake's shape, but also elevate fl ood
Sea will move backward to the estuary of the Yangtze River longer
levels and degrade water quality. Land reclamation may heighten the
periods of time, which in turn limits freshwater resources for domestic
water table during fl ood peak, lengthen the duration of high fl oods,
consumption. Furthermore, migration of fi sh to upper reaches of the
and increase the probability of disasters (Min 1999). Aquatic vegetation
river for spawning is impeded by reductions in river fl ow and essential
and fi sh species are greatly aff ected by the associated loss of habitats
nursery areas become inaccessible for adults. The construction of dams
and/or ecotones.
also destroys spawning sites. Spawning grounds for migratory species
are also lost when delta vegetation is reduced. These factors have
Almost all the large rivers that fl ow into the East China Sea have been
caused a drastic reduction in numbers of some species of fi sh, even
dammed (Figure 35), particularly in the Yangtze River drainage system,
leading to extinction of some species.
to produce energy, prevent fl oods and improve navigation. In the
headwaters of Yangtze River, more than 10 000 dams have now been
There are also concerns that the Three Gorges Dam, 2 000 km upstream
constructed. As a result, plankton, benthos, birds and fi sh communities
from the river mouth, will cause serious negative impacts on the
in rivers are aff ected by these reservoirs. Because of dam construction,
environment of the Yangtze River Basin. In addition, large-scale water
large terrestrial areas have been inundated, which has caused a loss of
diversion projects are under consideration for the transport of water to the
terrestrial habitats. The primary production of the East China Sea has
Yellow River, which may cause further water shortage problems. Scientifi c
changed as a consequence of the changed patterns of river discharge
research is essential, together with monitoring and an understanding of the
and organic loads. The dams have also blocked migration routes and
eff ects of climate changes and anthropogentic activity at a subcontinental
destroyed spawning grounds for anadromous fi sh.
scale associated with such changes in hydrological cycles.
Draining and land reclamation have many adverse infl uences on the
Figure 36 summarises the major characteristics of the causal chain
functions of lakes, like the Poyanghu Lake. Because of reclamation, the
analysis with regards to loss of ecosystems or ecotones and modifi cation
area of the Poyanghu has been reduced by 1 300 km2 from 1954 to
of ecosystems or ecotones in this region, linking the problems of land
1995 (Table 18) and its capacity has been reduced by 8Î109 m3, with
reclamation and changes in stream fl ow with immediate and root
the regulation coeffi
cient decreased from 17.3% in 1954 to 13.8% in
causes.
54
GIWA REGIONAL ASSESSMENT 36 EAST CHINA SEA
Issues
Immediate causes
Sectors/Activities
Root causes
Habitat and community
Changes in stream flow
Agriculture
Legal
modification
Demographic and
Energy production
economic growth
Chemical pollution
Urbanisation and industry
Changes in ecosystems
Lack of knowledge
Figure 36 Causal chain diagram illustrating the causal links among habitat and community modifi cation in inland systems.
Immediate causes
for agriculture and settlement. With the increasing population and
The immediate causes behind land reclamation from lakes can be
economic growth, the demand for resources (electrical energy)
summarised as follows:
increases as well. Thus the construction of facilities (e.g. dams and
Changes in ecosystems: conversion of ecosystems by changes in
power station) cannot be avoided.
land use, for example, conversion of water to farmland, and wetland
to urban areas; and fl ooding of ecosystems as a result of human
Urbanisation and industry
activities, because of land reclamation, so that the capacity of the
More and more arable lands have been taken over for infrastructure
Poyanghu to prevent fl oods is weakened.
development and expansion of cities, which has caused irreversible
Chemical pollution: unsustainable agriculture practices, such as
problems in the basin (e.g. loss of habitats and ecotones).
deforestation and chemical fertiliser use.
Changes in stream fl ow: changes in freshwater and sediment
Lack of knowledge
supplies due to dams.
The population is not been well educated about environmental
protection, and there is a general lack of awareness of environmental
Root causes
protection. There is inadequate scientifi c understanding and unreliable
The root causes that have allowed or resulted in freshwater habitat and
information for industry concerning the problem of environmental
community modifi cation are summarised as follows:
damage.
Legal
There are no appropriate laws and regulations to control this situation
at an international level, and the lack of enforcement of national
Conclusion
environmental legislation in regulating the change of stream fl ow by
hydroelectric construction has resulted in freshwater shortages and
Some specialists who deal with environmental protection projects have
water quality problems, along with a loss of habitats to a substantial
been frank and open about the problems of pollution from land and the
degree. There exist no solutions that can solve the problems of
governmental issues that cause them. In the East China Sea, the level of
economic development and growth while simultaneously promoting
environmental awareness on the part of the population, government
sustainable use of resources.
offi
cials, and business leaders is ever increasing. The problems
enumerated above demand attention. The marine environment in the
Demographic and economic growth
East China Sea is critical to the environmental and economic health
The rapid progress in urbanisation and migration of inland population
of the region. Technical and human resources and fi nancial assistance
to the coast and the increase in population growth has resulted
are available and should be found, both in China itself and from
in the economic development without regard for environment
international support.
impacts, including, for example, the negative eff ects of reclamation
CAUSAL CHAIN ANALYSIS
55
Policy options
This section aims to identify feasible policy options that target
China Sea, the reduction of fi shing eff ort is signifi cant, particularly in its
key components identifi ed in the Causal chain analysis in order to
eff ects on fi shers' daily lives and futures.
minimise future impacts on the transboundary aquatic environment.
Recommended policy options were identifi ed through a pragmatic
Identification of potential policy options
process that evaluated a wide range of potential policy options
Fish farming as an alternative
proposed by regional experts and key political actors according
Overemployment in the fi sheries sector, however, requires China to face
to a number of criteria that were appropriate for the institutional
overall unemployment and underemployment problems, which are
context, such as political and social acceptability, costs and benefi ts
particularly acute for fi shermen and semi-skilled workers. The increasing
and capacity for implementation. The policy options presented in
mobility of China's labor force also contributes directly to the oversupply
the report require additional detailed analysis that is beyond the
of fi shermen and consequent overfi shing. It is necessary to deter poor
scope of the GIWA and, as a consequence, they are not formal
farmers from becoming fi shermen. Back-of-the boat labour is almost
recommendations to governments but rather contributions to
impossible to control because the average income for a fi sherman (500-
broader policy processes in the region.
800 USD per year) is still as much as double what a farmer might earn.
As long as that gap exists, there will be demand for work in the fi shing
industry. To avoid this situation, China has invested money and eff ort
in promoting aquaculture as an alternative. Aquaculture can eff ectively
promote economic development and social progress, through creating
Overexploitation of living
signifi cant employment opportunities, absorbing and using surplus
resources in the East China Sea
fi shing labourers, increasing fi shers' income and assisting in poverty
alleviation. Aquaculture also should be developed as an economic
Background
activity that can provide signifi cant export earnings.
China has a fi ve-year-long vessel-scrapping program, begun in
2002 and funded with 33 million USD per year. The program aims at
Fishing ban
delicensing and scrapping a total of 30 000 ships, or 6 000 vessels each
The Chinese government has promulgated many policies, such as
year, thus reducing the overall capacity of China's 440 000-ship fi shing
forbidding the use of fi shing lines, closing fi shing periods and zones,
fl eet by about 7%. In 2002, China scrapped and withdrew the licenses
licensing, setting minimum mesh sizes and minimum landing sizes.
of 5 000 ships. A related regulation mandates that new fi shing vessels
Among these, the fi shing ban was the most successful. An annual three-
cannot be built unless the new unit will replace and inherit the license
month fi shing ban for commercial fi shing in the East China Sea from
of an existing vessel. Other recent agreements with Japan and Korea
June 15 to September 14 was fi rst issued in 1995. To mitigate pressures
have reduced China's off shore fi shing grounds. The scrapping program
from overfi shing, 100 000 fi shing boats must stay in port during the ban.
is aimed in part at creating nearshore opportunities for fi shermen
Patrol ships and planes are dispatched to the marine areas to enforce the
currently working off shore. Because the increase of fi shing eff ort plays
ban. The campaign aims to reduce illegal activities in the fi shing grounds
an important role in the decline of the fi sheries resources in the East
such as fi shing during the ban and marine contamination. There is also
56
GIWA REGIONAL ASSESSMENT 36 EAST CHINA SEA
currently a two-month freshwater fi shing ban (February-March) in the
fi sheries capacity will require the development of institutional capacity
middle and lower reaches of the Yangtze River. The Bureau of Fisheries
to administrate fi sheries programmes and regulations.
expanded this in 2003 to include a further two-month (April- May) ban
in the upper reaches of the river. There are no plans to lift or relax any of
Shifting employment away from exploitive fi shing
these moratoria. These measures have eff ectively protected juvenile fi sh
Fishing bans pose severe economic challenges for those employed in
so that the overall catch and quality could be increased and improved.
the industry or on their own. Government aid is needed to help with
the economic problems that result from fi sheries management. The
Up until the present the fi shing ban has proven eff ective in protecting
following programmes are necessary to achieve this goal.
fi shing resources and marine life. Catches of Larimichthys polyactis have
Encourage the growth of freshwater and coastal aquaculture, and
increased from none in 1975 to 450 000 tonnes in 2000 (FAO 2004).
encourage technology transfer to improve the breeding and supply
This species is now the second most sought-after fi sh by the Chinese
of young fi sh.
fi shery. To further protect juvenile populations of Larimichthys croceus,
Encourage
fi shing activity in the open sea, with technology transfer
Larimichthys polyactis, Trichiutus lepturus and other economic species, it
and assistance.
is necessary to expand the fi shing ban from the hatching areas such as
Strengthen education and the availability of information to improve
Lvsi and the Zhousan Islands to the areas where young fi sh mature in
public awareness regarding environmental protection.
the north of the East China Sea at the beginning of spring.
Strengthen information and education in the rural population
regarding environmental protection.
Enforcing fi shery management
Other actions for the management of China's marine fi sheries resource
Recommended policy options
should include:
International cooperation
Eff orts to improve the existing legal system to better cope with
The East China Sea is known to be a very productive fi shing area.
overfi shing.
However, management of resources in the area has been complicated
An improved fi shing license system, with a quota system and
due to territorial claims made by Korea, Japan, and China. The three
strengthened management of the fi shing industry.
countries ratifi ed the 1982 United Nations Convention on the Law of
Support for monitoring of fi sheries resources, which is fundamental
the Sea in 1996. To adjust to the new situation arising from overlapping
for the conservation and rational use of the resource, and is also an
claims, the countries need to alter their claims under the United Nations
essential prerequisite for any quota system.
Convention. Thus far there has been a Japan-China Fisheries Agreement
(1997), a Korea-Japan Fisheries Agreement (1998), and a Korea-China
Immediate policy options
Fisheries Agreement (1998), which provide legal frameworks for a
Knowledge
new fi sheries regime. But these bilateral agreements are not enough
Because of insuffi
cient knowledge regarding the limits of the fi sheries
to resolve complex legal issues relating to boundary problems. It is
resource, along with a lack of systematic monitoring and surveys of
necessary for the three countries to cooperate on a new fi sheries order
the fi shery stocks, the dynamics of the resource and the maximum
in the Northeast Asian seas, especially in expanding seasonal fi shing
sustainable catch are not well understood. As a consequence, marine
bans and structured bans.
fi sheries in the East China Sea have been managed without regard
for sustainable yields. Many fi shers and fi shing businesses continue
Legal and institutional frameworks
to believe that the fi sheries resource is unlimited, and that the more
The importance of legal, procedural and institutional frameworks
fi shing vessels are used, the more fi sh will be caught. It is essential that
designed to facilitate sustainable fi shing industry development must be
national scientifi c funding agencies support the study of the dynamics
emphasised in China. There are no universally applicable models. The
of fi sh stocks in the East China Sea.
nature of any improvements will depend on existing laws, traditions, and
institutional structures. But law, traditions and institutional structures
Improved institutional capacity for fi sheries management
need to be modifi ed or adapted to develop a system that is relevant
Although China has taken measures to control fi sheries, these measures
enough to play a role in building a sustainable fi shing industry.
have not fundamentally reversed the overfi shing situation, partly
owing to insuffi
cient capability on the part of government agencies
The ideal framework would allow for vertically (national to regional) and
to administrate fi shing programs. The development of an increased
horizontally (across sectors) integrated policy-making and planning with a
POLICY OPTIONS
57
signifi cant role for strategic, sectoral or regionally integrated environmental
that are seriously harmed by eutrophication. Failure to adequately
assessments as an input to the planning process. Such a framework should
treat sewage has the same eff ect.
allow for adaptation in both directions, i.e. national policy should inform
Economics: Traditional agricultural practices result in increased
local planning; local planning and public involvement should inform the
fertiliser use and soil and water losses. In some regions burning
development or adaptation of policy at higher levels.
before cultivation is quite common in watersheds, as is the
exchange of wastewater from marine culture pounds with clean
The adoption of the "Law of Fisheries of the People's Republic of China"
seawater, which is the most typical and cheapest method for
in 1986 was a very important step in the development of China's fi shery
coastal aquaculture. Coastal mariculture has become one of the
policy. From that time up until the present, laws and regulations under
most important economic forces following fi shery production
the umbrella ofChinese fi sheries law have been established. The
agreements between neighbouring countries in the East China Sea.
Law of Fisheries as a legal provision defi ned a fi shery development
Sustainability of aquacultural practices in the coastal region may
policy suitable for the Chinese economy. It has showns ignifi cant
not be a high priority among the population, because of problems
importance in the adjustment of fi sheries production relationships, in
of land and property tenure. There is little provision for controls or
the standardisation of fi sheries activities, and for the conservation and
monitoring of waste discharges because of attempts to cut costs.
rational use of the fi sheries resource. It is also necessary to take steps
Governance: The reduction of eutrophication will only come
to control illegal, unregulated and unreported fi shing by blacklisting
through a sound environmental management by legislation and
bad actors and enacting strict regulations. A joint fi sheries commission
protection. A combined eff ort on regional agreements and actions
between the East China Sea littoral states should be established as a
will help solve eutrophication problems.
part of new international fi sheries agreements.
Identification of policy options
The cross-link of causes listed above corresponds to numerous possible
policy options in dealing with the problems associated with coastal
Eutrophication in the
eutrophication.
Yangtze River estuary and
adjacent inner shelf
Demographic issue
It is necessary that each country reduce nutrient inputs from land-
based sources. Coastal activities should also be carefully designed and
Eutrophication has been identifi ed as one of major problems that aff ect
managed to reduce direct waste discharges.
the sustainability of East China Sea and its coastal water ecosystems.
In particular, coastal eutrophication has been identifi ed as a key cause
Knowledge
in the deterioration of coastal environment, with subsequent socio-
Awareness on the part of the public about the detrimental
economic eff ects.
consequences of coastal eutrophication needs to be improved. This
issue should be incorporated into the national education curricula.
Root causes for eutrophication in the
While short-term targets are important to convince the population to
East China Sea
improve farming methods and in aquaculture, technological innovations
In the Causal chain analysis section the primary root causes for coastal
can also contribute to reducing nutrient input into marine waters. Such
eutrophication in the East China Sea were identifi ed as the following:
information and knowledge should be freely accessible through the
Demographics: The development of coastal eutrophication is
education of farmers and fi shermen about the appropriate use of fertiliser
correlated with land-source nutrient inputs, which result from
in agriculture and feedstocks in aquaculture as well as the relationship
increased human activities (e.g. growth in population and
between inappropriate cultural activities and the eutrophication of
agriculture). Moreover, the infl uence of domestic wastes can be
coastal waters. Technological improvements should also be adopted to
seriously underestimated owing to the lack of sanitation systems
increase the capacity of water purifi cation systems.
in the watersheds.
Knowledge and education: Rural populations have no
Economic issues
understanding of cause and eff ect that can start with agricultural
Financial constraints constitute one of important causes of these
practices, both on land and coast, and end at marine food şwebs
problems, but the corresponding policy options should go beyond
58
GIWA REGIONAL ASSESSMENT 36 EAST CHINA SEA
improving water quality frameworks. Economics at the provincial level,
should include water profi les, sediment sampling and evaluation
as well as trade barriers and protectionism by industrialised countries
of living organisms.
and diff erences in trade policies for agricultural and fi sheries products
Organisation of an institutional network in the fi eld of marine water
must be addressed, because these issues limit the ability of the region
quality, which will provide an assessment of eutrophication-related
to advance economically.
issues, e.g. eff ects on ecosystems and biodiversity.
Establishment of a network for the systematic observation of
Cultural issues
coastal waters and the defi nition of an observation frequency and
Cultural diff erences are an important constraint in the sound management
measurement parameters.
of the coastal environment. However, overcoming these problems
Defi nition of a fi nancial mechanism for monitoring activities, which
will result from cultural evolution, in which diff erent traditions are
allows inter-comparison of monitoring results from neighbouring
progressively and naturally blended, particularly in coastal areas, where
countries, compilation of monitoring results, and an assessment of
education and economics are on average already mostly developed.
changes in eutrophication-related issues.
Establishment of a joint consultation board, composed of
Governance and Legislation
representative of countries in the East China Sea. National
Coastal waters should be managed as sustainable ecosystems, and
representatives should include experts, policymakers, people from
the authorities, through their governance of water policy both on land
industry and local communities in coastal areas.
and in marine environment, should work towards this goal. Integrated
Other related recommendations for policy options can be outlined
management of water systems within the context of whole East China
at this stage, and can be defi ned in more detail later or altered,
Sea is required, through the eff orts of land and marine authorities in
based on the progess of existing organisations, such as:
neighbouring countries. This approach is already a part of the fi sheries
- Improvement of technological methodologies used in
agreements among the countries of the East China Sea. An East China
agriculture or/and marine fi sheries (such as aquaculture);
Protection organisation should be established, fi rst by creating an
-
Prohibition of economically harmful techniques (traditional
advisorary body, which can gradually be expanded to consultation,
marine culture techniques) through legislation and education;
technical management, and the evaluation of fi nancial allocations for
- Introduction of environmental friendly and non-polluting
water quality improvements.
industries in coastal areas and the replacement of traditional
fi sheries with of new techniques;
Immediate policy option: Establishment of a
-
Reinforcement of mechanisms such as taxes or penalties to
regional monitoring system for water pollution
discourage certain practices that may cause coastal pollution;
and coastal eutrophication.
-
Promotion of the spread of the knowledge and regulation of
The recommended policy options to combat coastal eutrophication
environmental protection through training and education;
in the East China Sea must address the root causes identifi ed above
-
Creation of a communication network between countries to
and should be based on the ongoing national and regional programs
exchange information regarding pollution issues and to inform
with eff orts at the institutional and/or organisational level. Existing
coastal populations;
facilities and databases should be taken into account in designing
-
The IMO regulations for ballast water need to be more strongly
frameworks and projects. Therefore, the recommended policy option
enforced by the East China Sea countries.
is the implementation of a regional monitoring system for coastal
eutrophication in East China Sea, which is critical to the:
Performance of the recommended policy options
Establishment of an agreement between neighbouring countries
The recommended policy options can be implemented, as provisions
(Japan, Korea and China), which should be based on the free
exist for such options in existing regional frameworks agreed to by the
exchange of opinions from provincial governments, industry and
countries of East China Sea, for example, under the umbrella of Northeast
local communities.
Asia Region-Global Ocean Observation Systems (NEAR-GOOS).
Registration and monitoring of pollution sources, which should be
taken into account during the early stages of the formulation of
Effi
ciency
economic and social development programmes.
The recommended policy options can be undertaken in diff erent
Environmental assessment of pollution impacts and selection of
ways, such as by creating a forum where individuals from diff erent
indicator species for marine water quality. Such an assessment
organisations as well as diff erent countries can identify problems, and
POLICY OPTIONS
59
exchange information, ideas and knowledge. The recommendations for
from fertilisers and pesticides, resulting in aquifer contamination. There
regional measurements can be adopted for eutrophication in relation
are also some other problems such as ineff ective regulation, insuffi
cient
to cultural practices in watersheds and coastal areas. The monitoring
resources, the need for capacity building at all levels of government,
system must be carefully designed to be on the same scale as the
and a lack of political will.
problems to be addressed as well as to the fi nancial resources available
long-term to address them. Existing facilities should be used to their
Identification of potential policy options
fullest capacity and should be elevated to a higher level. The system
Reforestation
should enable the production of an annual report on eutrophication
In recent decades, the primary goal has been broadened from solely
in the East China Sea. Follow-up programmes, and comparisons of
increasing growth production to maintaining and enhancing various
indicators/parameters should allow the creation of an early warning
ecological functions such as preventing desertifi cation and coastal
system for authorities in case of serious and rapid coastal water quality
erosion, and reducing run-off in river basins. Eff orts to increase forest
deterioration. The system should also identify sources and impact
cover received a further boost after 1998 when a fl ood caused a heavy
areas to be dealt with, and actions to reduce pollution and to restore
losses in China and widespread deforestation in the upper reaches
damaged ecosystems.
of the Yangtze River was identifi ed as one of the main contributing
factors. Because of deforestation and loss of aquifers, a huge amount
Equity and feasibility
of nutrients generated by agriculture and aquaculture enters water
The proposed policy options are equitable as they aim to include, in equal
bodies of the East China Sea in non-point run-off . Nutrients make
numbers, governmental representatives, industry, research institutions
up the second most important group of pollutants in the marine
and communities. With regards to implementation, the existing regional
environment and are the main reason for eutrophication and harmful
framework is designed to give priority to the actions planned by the
algal blooms. Reforestation is an effi
cient way to achieve the long-term
governments of the East China Sea countries. Political feasibility will be
goal of ecological reconstruction to protect the marine environment
guaranteed by strong cooperation between the countries of the East
of the East China Sea.
China Sea. Furthermore, links between industries and communities will
provide balance and openness during the process.
Controlling use of fertilisers and pesticides
Excessive use of fertilisers and pesticides (fungicides, herbicides and
Implementation capacity
insecticides) has produced serious problems for the health of aquatic
The countries of the East China Sea have suffi
cient human resources
ecosystems. Traditional farming may lead to large quantities of soils
and facilities to carry out such a campaign; however, attention should
entering stream channels and contribute to the sediment load in river
be paid to the upgrading and standardisation of facilities. The existing
discharges to the marine environment.
technical organisations of participatory countries will be the local
contact points for routine data collection and compilation.
Detecting pesticide presence in aquatic environments and removing
it requires expensive methods. Funding such activities will be diffi
cult
at the local level. The high concentration of chemicals from agriculture,
especially fungicides, herbicides and insecticides, in the marine and
Habitat and community
related freshwater environments can result in the loss of biodiversity
modification
and reduction of productivity. There is a need to encourage farmers to
employ environmentally friendly farm practices that minimise the use of
Definition of problems
fertilisers and biocides, and to enhance soil retention of fertilisers.
Numerous factors make it diffi
cult to control pollution of the East China
Sea. Wastes may come from a sewage outfall, a population center or
Wetland protection
a canal. These kinds of point sources are relatively easy to locate and
Reclamation of intertidal areas has been a national priority for many
simple enough to control. But occurrence of marine pollution has often
years. Massive reclamation projects have also been undertaken in the
linked with complicated circumstances. It usually is aff ected by non-
coastal areas of the East China Sea. It is believed that the substantial
point pollution sources, which are much more diffi
cult to treat. For
investments that have already been made in seawalls will continue to
example, the largest agricultural application of irrigation water occurs in
produce losses in wetland habitat.
the Yangtze River drainage basin, which is faced with serious pollution
60
GIWA REGIONAL ASSESSMENT 36 EAST CHINA SEA
Reclamation of wetlands was usually promoted by local governments
Balancing economic and environmental goals
for short-term economic benefi ts. Protecting wetlands will take years
It is often diffi
cult in policy-making to reconcile the confl icting
and will be diffi
cult. Knowledge and institutions will be very important
objectives of economic development and social values associated with
components, and legal frameworks for the Law of Wetland Protection
environmental conservation. Uncontrolled and unplanned industrial,
are another. The law is the only hope of holding out against the
commercial and residential development that does not include adequate
pressures of economic demands for reclaiming wetlands.
provisions for potable water, management of solid waste, and collection
and treatment of wastewater should no longer be allowed.
Reconnecting migratory links
Over the past decades, lakes in the Yangtze River Basin and in the
Pollution penalities
East China Sea region have been artifi cially severed from rivers by
A person, company, or agency responsible for environmental
hydroelectric and irrigation projects, and as a result, migratory fi sh can
damage or actions that cause pollution in the marine environment
no longer move between lakes and sea, or to and from thesea via rivers.
should be made responsible for the cost for remedying the situation.
This has lead to a sharp decline in species such as the Chinese sturgeon
This provision is not universally included in legislation, but has been
(Acipenser sinensis) and Cyprinus, for which both lake and river spawning
adopted as a matter of policy. Compensation should include all the
grounds are essential. The construction of fi shways is a good solution
expenses actually incurred by the government service for the clean-
that can be enacted now. Any future construction of irrigation facilities
up of pollution. Although the government has adopted the principle
should alos consider eff ects on fi shways.
of compensation for damages and penalties for illegal activities
it is often too expensive to stop the pollution. More strict laws or
Reduction in land-based pollution
regulations should be adopted and carried out.
The major pollutants in the East China Sea are oil, inorganic phosphorus,
inorganic nitrogen and heavy metals. Long-term monitoring in coastal
Performance of the recommended policy options
waters from the East China Sea shows that seawater quality is steadily
Legal frameworks
deteriorating. Wastes from domestic, agricultural, and industrial
Since the 1980s, China has been taking steps to complement and
sources, along with sediments and solid wastes, are the major sources
then replace administrative measures with a legislative and regulatory
of pollutants that aff ect both freshwater and coastal systems in the
framework as a foundation for economic and social behaviour. The
Yangtze River and the East China Sea. Land-based sources play a major
legal system has yielded an impressive amount of laws, regulations,
role in both inland and coastal pollution. Ship-based sources, such as
and standards in a way that has truly changed basic rules in Chinese
split oil and ballast water, contribute relatively small amounts. There
society. But the system is still far from complete. Still, the work so far
is a need to collect data on atmospheric inputs, which can also be
to create a legislative and regulatory framework should not ignore the
considered a source of land-based pollution.
fact that administrative measures play an important role as a tool for
environmental actions. Legislation has often been accompanied by
Immediate policy options
large-scale investment projects targeted with government funds. For
Public involvement
example, the government will complement its the marine pollution
Substantial public involvement is a desirable and necessary part of
bills by investing heavily in land-based pollution control, and by closing
any planning initiative with regard to the health of ecosystems. This
down many polluting enterprises.
involvement can take diff erent forms, all of which are important:
Communication of information between decision makers, planners
Integration and coordination
or technical specialists to the public;
By defi nition, integrated coastal management implies a greater level
Participation, shared responsibility and decision making with
of integration than is typical with conventional approaches. It implies
comprehensive public involvement should be increasingly
a holistic analysis and synthesis of complex technical, social, economic
emphasised in any assessment or planning;
and ecological information. It also implies correspondence between
Planning that makes assessments about issues of widespread public
local initiatives and international-level policies. It is necessary to create
concern, the quality of life, the value of resources, and the trade-off s
improved cooperation between diff erent sectors. Increased integration
between diff erent resource uses;
therefore implies increased complexity. Decision-making is likely to be
Requiring any assessments to be properly evaluated and/or
slower and more diffi
cult as the degree of integration increases. Key
validated through the widest possible consultation.
requirements are:
POLICY OPTIONS
61
High quality, well-presented and eff ectively communicated/
to the GIWA endeavour. The assessment of perturbations and feedback
exchanged information,
mechanisms shows that anthropogenic activities have accelerated the
Clearly and widely agreed upon decision criteria,
environmental degradation of natural systems and resources, both on
Clear and transparent decision-making processes; and (if
land and in the East China Sea. Increased land-source nutrient run-
necessary),
off , modifi cation of habitats and overfi shing are the predominant
A clearly designated (and widely agreed upon) fi nal authority and
challenges to development in the region. The improper management
arbiter (whether individual or committee).
of water resources, coastal entrophication and an unsustainable fi shery
have been identifi ed as the most severe issues, while other issues also
Where a single policy alone cannot guarantee the achievement of the
merit attention. It should be recognised that most of the impacts
desired impact, for instance, fi shing quotas, the active involvement of
discussed in this report are very much linked to human activities.
the countries of the East China Sea region will be critical in the follow-up
62
GIWA REGIONAL ASSESSMENT 36 EAST CHINA SEA
Conclusions and recommendations
In the GIWA eff ort in the East China Sea, a fourstep process has been
The analyses of policy options has generated a series of recommenda-
used to provide a series of insights into the main issues in the region,
tions, which include:
based on data compilation and analyses. In addition, the causal chain
Establishment of a regulatory framework in the region and
analysis has resulted in the identifi cation of the following root causes:
improvements in compliance through stakeholder involvement;
Lack of public awareness and education, which slows down the
Investment in legal enforcement and an increase in capacity
distribution of information and existing knowledge;
building to remedy pollution and habitat loss;
Poor organisation/control of investment planning and priorities,
Creation of education programmes to improve public awareness
which results in harmful investments and actions;
and participation in actions;
Inadequate structure and capacity building, which results in an
Improvement in opportunities for increasing revenue and employ-
imbalance between resource consumption and legislation;
ment from environmental protection industries
Weak
international
cooperation
between neighbouring countries,
Enactment of legislation and international agreements to reduce
which hinders coordination of implementation.
pollution from land-based activities.
There are signifi cant knowledge gaps in the quantitative estimates of
Finally, because of the similarity of environmental problems in the East
benefi ts and costs in both physical and fi nancial terms for the East China
China Sea to other marginal seas, the causal chain and policy option
Sea, with respect to water and economic resources. In-depth studies
analyses presented in this report should be combined with documents
should be carried out to establish necessary processes and to determine
from other regions to synthesise a GIWA approach for marginal seas of
input and response feedback loops in various parts of society. This will
the world.
help in the evaluation of potential infl uences on human health and the
determination of mechanisms for the remediation processes.
CONCLUSIONS AND RECOMMENDATIONS
63
References
BSA, Bureau of Statistics of Anhui (2003). Anhui Statistical Yearbook.
Chen, B.H. (1998). The Reason for Floods in Changjiang River Watershed
China Statistics Press, Beijing (in Chinese).
and Forest Water Environmental Theory. The Economic Forest, Vol.
BSF, Bureau of Statistics of Fujian (2003). Fujian Statistical Yearbook.
5: 12-18 (in Chinese).
China Statistics Press, Beijing (in Chinese).
Chen P, and Hua Y. (1989). Distribution, population size and protection
BSF, Bureau of Statistics of Fujian (2004). Fujian Statistical Yearbook.
of Lipotes vexillifer in biology and conservation of the River Dolphins,
China Statistics Press, Beijing (in Chinese).
p.81-85.In Perrin W F, Brownell R L, Zhou K, Liu J. (eds.), Occasional
BSJ, Bureau of Statistics of Jiangsu (2003a). Jiangsu Statistical Yearbook.
Paper of the IUCN Species Survival Commission, Vol.3.
China Statistics Press, Beijing (in Chinese).
CIGEM (2004). Choosing soil erosion areas in Jiangxi Provinces, Retrieved
BSJ, Bureau of Statistics of Jiangxi (2003b). Jiangxi Statistical Yearbook.
January 2004, from http://www.cigem.gov.cn
China Statistics Press, Beijing (in Chinese).
CNRD, China Natural Resource Database (2004). Retrieved March 2004,
BSS, Bureau of Statistics of Shanghai (1991). Shanghai Statistical
from http://www.data.ac.cn/index.asp
Yearbook. China Statistics Press, Beijing (in Chinese).
CNUS (2003). Forest coverage data for Fujian province.
BSS, Bureau of Statistics of Shanghai (2004). Shanghai Statistical
Retrieved November 2003, from http://www.cnus.org/
Yearbook. China Statistics Press, Beijing (in Chinese).
InvestEnv.asp?CNUID=16
BSZ, Bureau of Statistics of Zhejiang (1997). Zhejiang Statistical Yearbook.
COYEC, China Ocean Yearbook Editor Committee (1997). China Ocean
China Statistics Press, Beijing (in Chinese).
Yearbook. China Ocean Press (in Chinese).
BSZ, Bureau of Statistics of Zhejiang (2003). Zhejiang Statistical Yearbook.
COYEC, China Ocean Yearbook Editor Committee (1998). China Ocean
China Statistics Press, Beijing (in Chinese).
Yearbook. China Ocean Press (in Chinese).
BSZ, Bureau of Statistics of Zhejiang (2004). Zhejiang Statistical Yearbook.
COYEC, China Ocean Yearbook Editor Committee (1999). China Ocean
China Statistics Press, Beijing (in Chinese).
Yearbook. China Ocean Press (in Chinese).
Cai, P. J., Lian, G. S. and Lin, G. S. (1995). Character of zooplankton in
COYEC, China Ocean Yearbook Editor Committee (2000). China Ocean
Taiwan's Western Strait. Acta Oceanological Sinica. 17(2):93-98.CAO,
Yearbook. China Ocean Press (in Chinese).
China Association of Oceanography (2004). China's Marine Science
COYEC, China Ocean Yearbook Editor Committee (2001). China Ocean
and Technology in 2020. China Ocean Press, Beijing, 50 pp (in
Yearbook. China Ocean Press (in Chinese).
Chinese).
COYEC, China Ocean Yearbook Editor Committee (2002). China Ocean
CCAR/HKUST (2005). The Hong Kong University of Science and
Yearbook. China Ocean Press (in Chinese).
Technology. Retrieved May 2005 from: http://www.ust.hk/en/
CWC, Changjiang Water Commitment (2003). Climate, vegetation and
index.html,
land use of the Changjiang. Retrieved December 2003, from
CFM, Chinese Forestry Ministry (2003). Artifi cial Forestation Areas in Six
http://www.cjw.gov.cn
/index/information/info-index.asp.
Provinces and Municipalities. Retrieved December 2003, from
Ding, J. Q. and Xie, M. (1996). Mechanical countermeasures employed
http://www.forestry.gov.cn
in China for the control of introduced species. p. 107-128.
Environmental Science Press of China, Beijing (in Chinese).
64
GIWA REGIONAL ASSESSMENT 36 EAST CHINA SEA
Dong, Z.R. (2003). Protection and recovery shape the diversity of
http://www.shanghaiwater.gov.cn/wetland/lunwen.asp?id=3
rivers. Retrieved May 2004, from http://www.chinawater.com.cn/
Kong, X.Z. (2002). Urbanization and city-belt construction in the
magazine/kjzh/20030623/200306200216.asp
Changjiang delta. Journal of Nanjing Institute of Economics, (5):
Dragon TV of Shanghai (2004). Retrieved May 2004, from
1-4 (in Chinese).
http://www.dragontv.cn/detail.php?InfoID=12763
Least (2004). Description of Shanghai. Retrieved April 2004, from
Fang, C.M, and Zhong, Z.Q (2001). The infl uence of decreased capacity
http://www.1east.com/aa/aaa.htm
on fl ood stages in Dongting Lake and in Yangtze River. Journal of
Li, D.J., Zhang, J., Huang, D.J., et al. (2002). Oxygen depletion off the
Hydraulic Engineering, (11): 70-74 (in Chinese).
Changjiang (Yangtze River) Estuary. Science in China (series D),
FAO, Food And Agriculture Organization of the United Nations (2003).
45(12): 1137-1146.
December 2003, from
Li, D.J. and Daler, D. (2004), Ocean pollution from land-based sources:
http://saup.fi
sheries.ubc.ca/lme/SummaryInfo.aspx?LME=47#
East China Sea, China. AMBIO, 33(1-2): 107-113.
FAO, Food and Agriculture Organization of the United Nations (2004).
Li, S. F. (1989). Ecology of the fresh water fi sh population. Agricultural
FAO Nominal Catches of Larimichthys polyactis. Retrieved May 2004,
Press, Beijing (in Chinese).
from http://www.fi shbase.org/search.cfm
Li, S.F. (2001). A Study of the Biodiversity and Protection of Major Fishes
FBAM, Fisheries Bureau of Agricultural Ministry (2001). China Fisheries
in the Yangtze River. Shanghai Science and Technology Press (in
Yearbook. China Agriculture Press (in Chinese).
Chinese).
FBAM, Fisheries Bureau of Agricultural Ministry (2002). China Fisheries
Li, D.J. and Zhang. J. (2002). Oxygen depletion in the Changjiang
Yearbook. China Agriculture Press (in Chinese).
(Yangtze) estuary. Sci. China (Series D) 45:1137-1146.
FBAM, Fisheries Bureau of Agricultural Ministry (2003). China Fisheries
MCA-DSD, Department of Disaster Aid, Ministry of Civil Aff airs of PRC
Yearbook. China Agriculture Press (in Chinese).
(2003). A disaster survey of China in 2002, with direct economic
FOFA, Fujian Ocean and Fishery Administration (2001). Bulletin of the
losses of 171.7 billion RMB (Yuan). Journal of Disaster Reduction, (1):
Quality of the Oceanic Environment in Fujian (in Chinese).
31-35 (in Chinese).
FOFA, Fujian Ocean and Fishery Administration (2002). Bulletin of the
Min, G. (1999). An assessment of fl ood impacts on reclaimed areas of
Quality of the Oceanic Environment in Fujian (in Chinese).
Po Yang Lake. Yangtze River. 30(7): 30-32 (in Chinese).
Gu, D.C (2003). Issues surrounding the process of urbanization
MWRC, Ministry of Water Resources of China (1999a). China Water
development in Shanghai. Urban & Rural Developments, (5): 24-
Resources Bulletin. China Water Power Press (in Chinese).
26 (in Chinese).
MWRC, Ministry of Water Resources of China (2000a). China Water
Hong, H. S., Qiu, S. Y. and Luan, W. Q. (1991). Study of the upwelling
Resources Bulletin. China Water Power Press (in Chinese).
ecosystem in the upwelling of the south part of the Taiwan Shoal
MWRC, Ministry of Water Resources of China (2000b). Bulletin on the
Fishing Ground[M]. Beijing Science Press, 1-50 (in Chinese).
Erosion and Sedimentation of Rivers in China (in Chinese).
Huang, C.Z. (2000). Research into current situation, protection and
MWRC, Ministry of Water Resources of China (2001a). China Water
reasonable exploitation of Fujian wetlands. Forest Resources
Resources Bulletin. China Water Power Press (in Chinese).
Management, 2: 42-44 (in Chinese).
MWRC, Ministry of Water Resources of China (2001b). Bulletin of the
Huang, Z.M. (2004). Evidence for and countermeasures of quick
Erosion and Sedimentation of Rivers in China (in Chinese).
urbanization in Fujian province. Econometric and technique
MWRC, Ministry of Water Resources of China (2002a). China Water
economy research, (2): 43-49 (in Chinese).
Resources Bulletin. China WaterPower Press (in Chinese).
Jiang, Z.H. and Peng, Z.H. (1999). Evaluating the inundation of Changjiang
MWRC, Ministry of Water Resources of China (2002b). Bulletin of the
River Valley in 1998 and countermeasures for fl ood control, Journal
Erosion and Sedimentation of Rivers in China (in Chinese).
of Nanjing Forestry University, 23(2): 1-5 (in Chinese).
MWRC-TBA, Taihu Drainage Basin Administration, Ministry of Water
Jin, H. (1998). Serious ecological problems of the Changjiang River.
Resources of China (2004a). Retrieved February 2004, from
Environmental Education, 4: 32-34 (in Chinese).
http://www.tba.gov.cn
Jin, X.S. (2000). Marine Fishery Resources and Management in China.
MWRC-TBA, Taihu Drainage Basin Administration, Ministry of Water
ICFO Seminar in Qingdao, China 25-29 October 2000. from
Resources of China (2004b) Description of the Oujiang. Retrieved
http://www.lib.noaa.gov/china/index.htm.
February 2004, from ttp://www.tba.gov.cn/lygk/05.asp?s=113
Jin, Z.X. (2004). Protection and usage of Wetlands Resources. Retrieved
NBSC, National Bureau of Statistics of China (2001). China Statistics
March 2004, from
Yearbook. China Statistics Press, Beijing (in Chinese).
REFERENCES
65
NBSC, National Bureau of Statistics of China (2002). China Statistics
SEPAC, State Environmental Protection Administration of China (2001).
Yearbook. China Statistics Press, Beijing (in Chinese).
Report on the state of the environment in China (in Chinese).
NBSC, National Bureau of Statistics of China (2003a). China Statistical
SEPAC, State Environmental Protection Administration of China (2002).
Yearbook. China Statistics Press, Beijing (in Chinese).
Report on the state of the environment in China (in Chinese).
NBSC, National Bureau of Statistics of China (2003b). International
SEYEBS, Shanghai Environment Yearbook Editorial Board and Staff
Statistical Yearbook. China Statistics Press, Beijing (in Chinese).
(2003). Shanghai Environment Yearbook. Shanghai People's
NBSC-DPSSTS, Department of Population, Social, Science and
Publishing House, Shanghai (in Chinese).
Technology Statistics National Bureau of Statistics of China (2003).
SFSRG, Shanghai Finance Scientifi c Research Group (2002). The infl uence
China Population Statistics Yearbook. China Statistics Press, Beijing
of the trend for an aging population on economic development in
(in Chinese).
Shanghai. Chinese Finance Information, (22): 28-39 (in Chinese).
NBSC-RERT, Rural Economics Research Team, National Bureau of
Shanghai Ocean Administration (2001). Bulletin of the Quality of the
Statistics of China (2004). Sannong Data Website. Retrieved March
Oceanic Environment in Shanghai (in Chinese).
2004, from http://www.sannong.gov.cn/tjsj/lssj/2/
Shen, H.T., Mao, Z.C. and Zhu, J.R. (2003). Saltwater Intrusion in the
NFC (2003). Choosing the change the arable areas in southern of Jiangsu.
Changjiang Estuary. China Ocean Press, Beijing, 175 pp (in
Retrieved December 2003, from http://www.nfcmag.com.
Chinese).
NIES (2004). Land-use map of the Changjiang basin watershed.
Shen, X. Q., Jiang, M. and Yuan, Q. (1999) Study of the distribution of
Retrieved March 2004, from
chlorophyll-a in the Changjiang Estuary. J. Fishery Sci. China, 6 (5):
http://www.nies.go.jp/gaiyo/panf2003/basin-e.html
1-5 (in Chinese).
NMDIS, National Marine Data And Information Service (2004a). Data
SOA, State Oceanic Administration (1999). Bulletin of the Quality of
bank for marine economic statistics (in Chinese). Retrieved April
the Oceanic Environment in China. China Ocean Press, Beijing (in
2004, from http://nsii.coi.gov.cn
Chinese).
NMDIS, National Marine Data And Information Service (2004b). Marine
SOA, State Oceanic Administration (2000). Bulletin of the Quality of
Resources Data. Retrieved May, 2004, from http://nsii.coi.gov.cn
the Oceanic Environment in China. China Ocean Press, Beijing (in
Pang, L. and Pauly, D. (2001). The Marine Fisheries of Development and
Chinese).
Reported Catches. Fisheries Centre of University of British Columbia,
SOA, State Oceanic Administration (2001). Bulletin of the Quality of
Canada, Research Reports, 9(2).
the Oceanic Environment in China. China Ocean Press, Beijing (in
Park W.S. and Oh I.S. (2000). Interannual and interdecadal variation of
Chinese).
sea surface temperature in the East Asian Marginal Seas. Progress
SOA, State Oceanic Administration (2002). Bulletin of the Quality of
in Oceanography, 47: 191-204.
the Oceanic Environment in China. China Ocean Press, Beijing (in
Qiandao Lake Online (2004). Retrieved November 2004, from
Chinese).
http://www.qdh.gov.cn/cagk/cagk_gk.asp
SOA, State Oceanic Administration (2003a). Bulletin of the Quality of
Qin, Y.S. and Zhao, Y.Y. (1987). Geology of the East China Sea. Science
the Oceanic Environment in China. China Ocean Press, Beijing (in
Publisher, Beijing (in Chinese).
Chinese).
Qin, B.Q., Wu, Q.N. and Gao, J.F. (2002). Water and environmental issues
SOA, State Oceanic Administration (2003b). Bulletin of Marine Disasters
in China's Taihu Lake: Problems, causes and management. Journal
in China. China Ocean Press, Beijing (in Chinese).
of natural resources, 17(2): 221-228 (in Chinese).
SOA, State Oceanic Administration (2004). Bulletin of Marine Disasters in
Qiu, S.L., Huang, M.G.. and Chen, D.Q. (1998). The Research of Actuality
China, 2003. China Ocean Press, Bejing, 16 pp (in Chinese).
and Decay of macrura reevesii Resource. Fishery of freshwater, 28(1):
SouFun (2004). Reclamation on Chongming Island. Retrieved April 2004,
18-20 (in Chinese).
from http//:news.sh.soufun.com/2003-12-16/224531.htm
SCMC, Shanghai Construction and Management Committee (2002).
State Oceanic Administration (2004a). Sea Level Report for China.
Shanghai Construction Yearbook, from
Retrieved May 2004, from http//:sdinfo.coi.gov.cn/hygb/hpm/
http://www.shucm.sh.cn/jsnj/jsnj_14/jsnj1404.htm
2000
SCTGPCC, State Council for the Three Gorges Project Construction
State Oceanic Administration (2004b). Sea Level Report for China.
Committee (2002). Sediment Problems associated with the Three
Retrieved May, 2004, from http://sdinfo.coi.gov.cn/hygb/hpm/
Gorges Project, Intellectual Property Press, Beijing (in Chinese).
2003
66
GIWA REGIONAL ASSESSMENT 36 EAST CHINA SEA
State Oceanic Administration (2004c). Retrieved May 2004, from
Yu, J. (2004). Distribution of the spawning ground of Silver carp, Bighead
http://www.soa.gov.cn/index.html.
carp, Grass carp and Black carp in the Changjiang River. Retrieved March
Su, J.L. (1998). Circulation dynamics of the China Seas north of 18░N. In:
2004, from http://www.cjw.com.cn/index/river/liuyugk7-10.asp.
A.R. Robinson and K.H. Brink (eds.), The Sea, John Wiley & Sons Inc.,
Zan, A.Z., Li, M.S. and Wu, Y (2004). China Ocean News, (1110). Retrieved
New York, Vol. 11: 483-505.
March 2004, from http://www.coi.gov.cn/hyzh/ccao/11101a.htm
Tang, Q.S. and Su, J.L. (2000). Aspects of Marine Ecosystem Dynamics
Zhang, D.F. and Lv, H. (2003). A Study of regulatory targets and
in China I: Scientifi c Problems and Research Strategy. Science Press,
approaches for the future urbanization development of Jiangxi
Beijing, 252 pp (in Chinese).
province. Journal of Jiangxi Normal University (Natural Science),
Wang, J.L. and Wan, H.L (2000) The Conservation and Sustainable
27(1): 85-88 (in Chinese).
Utilization of Biodiversity of Poyang Lake Wetland Vegetation.
Zhang, J. (2002). Biogeochemistry of Chinese estuaries and coastal
Environment and development, 15(4): 19-21 (in Chinese).
waters: Nutrients, trace metals and biomarkers. Regional
Wang, S.M. and Dou, H.S. (1998). Chinese Lake Notes. Science Press,
Environmental Change, 3: 65-76.
Beijing (in Chinese).
Zhang, Q. and Tian, W. (2003). The issues surrounding the transformation
Wang, Y., Wang, N.H. and Wang, H. (2003). Carrying capacity and
the population from agriculture to the non-agriculture in China.
regulation of development of water resources and water
Agriculture & Technology, 23(4): 29-32 (in Chinese).
environment of Yangtze River Delta and measures for sustainable
Zhen, G.Q., Jiang, N., Yu, X.X. (2003a). Analysis of the evolution of the
development. Water Resource Protection, (6): 34-49 (in Chinese).
structure of land use in the lower Yangtze River basin. Journal of
Wu, Y., Zhang, J. and Zhou, Q. (1999). Persistent organochlorine residues
Natural Resources, 18(5): 568-574 (in Chinese).
in sediments from Chinese river/estuary systems. Environmental
Zhen, Y.J., Chen, X.Z., Cheng, J.H. et al. (2003b). The Biological Resources
Pollution, 105:143-150.
and Environment on the Continental Shelf of the East China Sea.
WWF (2003). Soil erosion in the Changjiang basin. Retrieved November
Shanghai Science and Technology Press, Shanghai (in Chinese).
2003, from http://www.wwfchina.org/man.shtm
Zheng, Y.J.(ed) (2003) East China Sea Shelf Environment and Living
Xie, P. and Chen, Y. Y. (1995). Biodiversity Problems in Freshwater
Resources. Shanghai Press of Science and Technology, Shanghai,
Ecosystems in China: Impact of Human Activities and Loss of
835 pp (in Chinese).
Biodiversity. Nature Science, (4). Retrieved May 2004, from http://
Zhou, B.L. and Wu, J.S. (2000). Breaking through the dual structure of city
www.chinabiodiversity.com/shwdyx/technical%20report/8.htm.
and village and accelerating the harmonization of development
Xu, C.T (2003). China's current domestic tourism and development
of Anhui Province's economy. Journal of Anhui University (Social
trends. Journal of Shandong Normal University (Natural Science),
Science), 24(5): 12-19 (in Chinese).
18(2): 62-65 (in Chinese).
Zhou, M.J., Zhu, M.Y. and Zhang, J. (2001). Status of harmful algal blooms
Xu, Z.L., Bai, X.M., Yuan, Q., Jiang, M. and Gu, X.G., (1999). An ecological
and related research activities in China. Chin. Bull. Life Sci., 13:54-59
study of phytoplankton in the Changjiang Estuary. J. Fishery Sci.
(in Chinese).
China, 6 (5): 52-54(in Chinese).
Zhu, D.Q. (1993). Water System Thesaurus of China, Qindao Publication
Ye, C. C., Lin, Y. and Yang, W. (2004). An important historic story of marine
Press (in Chinese).
culture, resplendence and downfall of the Chinese Prawn. Retrieved
ZOFA, Zhejiang Ocean and Fishery Administration (2001). Bulletin of the
March 2004, from
Quality of the Oceanic Environment in Zhejiang (in Chinese).
http://www.cappma.com/news/readnews.asp?newsid=23341
ZPEPB, Zhejiang Province Environment Protective Bureau (2003).
You, W.H (1997). Wetland resources in the Shanghai region and their
Biodiversity of Zhejiang Province , Retrieved December 2003, from
protection. Shanghai Environmental Science, 16(7): 6 (in Chinese).
http://www.zjep.gov.cn/st/list.asp?category=13&record=105
REFERENCES
67
Annexes
Annex I
List of contributing authors and organisations
Name
Institutional affiliation
Country
Field of work
Jianguo Qu
State Key Laboratory of Estuary & Coastal Research, East China Normal University, Shanghai, 200062 China
China
Environmental Science
Zhaoli Xu
East China Sea Fisheries Research Institute, Chinese Academy of Fisheries Sciences, Shanghai, 200090 China
China
Marine biology
Qian Long
Library of East China Normal University, Shanghai, 200062 China
China
Information Science
Liang Wang
School of Resources and Environment Science, East China Normal University, Shanghai, 200062 China
China
Ecology
Xiaomin Shen
State Key Laboratory of Estuary & Coastal Research, East China Normal University, Shanghai, 200062 China
China
Fishery Resource
Jing Zhang
State Key Laboratory of Estuary & Coastal Research, East China Normal University, Shanghai, 200062 China
China
Chemical Oceanography
Yongli Cai
School of Resources and Environment Science, East China Normal University, Shanghai, 200062 China
China
Ecology
68
GIWA REGIONAL ASSESSMENT 36 EAST CHINA SEA
Annex II
Detailed scoring tables
I: Freshwater shortage
II: Pollution
Weight
Weight
Environmental
Environmental
Environmental issues
Score
Weight
averaged
Environmental issues
Score
Weight
averaged
concern
concern
score
score
1. Modification of stream flow
1
30
Freshwater shortage
1.7
4. Microbiological
1
10
Pollution
1.7
2. Pollution of existing supplies
2
40
5. Eutrophication
3
35
3. Changes in the water table
2
30
6. Chemical
1
20
7. Suspended solids
1
10
Criteria for Economics impacts
Raw score
Score
Weight %
8. Solid wastes
1
10
Very small
Very large
Size of economic or public sectors affected
N/A
N/A
0 1 2 3
9. Thermal
1
5
Minimum
Severe
Degree of impact (cost, output changes etc.)
N/A
N/A
10. Radionuclides
N/A
N/A
0 1 2 3
Occasion/Short
Continuous
Frequency/Duration
N/A
N/A
11. Spills
1
10
0 1 2 3
Weight average score for Economic impacts
1
Criteria for Economics impacts
Raw score
Score
Weight %
Criteria for Health impacts
Raw score
Score
Weight %
Very small
Very large
Very small
Very large
Size of economic or public sectors affected
N/A
N/A
Number of people affected
N/A
N/A
0 1 2 3
0 1 2 3
Minimum
Severe
Minimum
Severe
Degree of impact (cost, output changes etc.)
N/A
N/A
Degree of severity
N/A
N/A
0 1 2 3
0 1 2 3
Occasion/Short
Continuous
Occasion/Short
Continuous
Frequency/Duration
N/A
N/A
Frequency/Duration
N/A
N/A
0 1 2 3
0 1 2 3
Weight average score for Economic impacts
1
Weight average score for Health impacts
0
Criteria for Other social and
Criteria for Health impacts
Raw score
Score
Weight %
Raw score
Score
Weight %
community impacts
Very small
Very large
Number of people affected
N/A
N/A
Very small
Very large
0 1 2 3
Number and/or size of community affected
N/A
N/A
0 1 2 3
Minimum
Severe
Degree of severity
N/A
N/A
Minimum
Severe
0 1 2 3
Degree of severity
N/A
N/A
0 1 2 3
Occasion/Short
Continuous
Frequency/Duration
N/A
N/A
Occasion/Short
Continuous
0 1 2 3
Frequency/Duration
N/A
N/A
0 1 2 3
Weight average score for Health impacts
1
Weight average score for Other social and community impacts
0
Criteria for Other social and
N/A = Not applied
Raw score
Score
Weight %
community impacts
Very small
Very large
Number and/or size of community affected
N/A
N/A
0 1 2 3
Minimum
Severe
Degree of severity
N/A
N/A
0 1 2 3
Occasion/Short
Continuous
Frequency/Duration
N/A
N/A
0 1 2 3
Weight average score for Other social and community impacts
2
N/A = Not applied
ANNEXES
69
III: Habitat and community modification
IV: Unsustainable exploitation of fish
Weight
and other living resources
Environmental
Environmental issues
Score
Weight
averaged
concern
score
Weight
Environmental
Environmental issues
Score
Weight %
averaged
Habitat and community
concern
12. Loss of ecosystems
2
60
2
score
modification
13. Modification of ecosystems or
Unsustainable
14. Overexploitation
3
60
2.4
ecotones, including community
2
40
exploitation of fish
structure and/or species composition
15. Excessive by-catch and
N/A
10
discards
16. Destructive fishing practices
3
10
Criteria for Economics impacts
Raw score
Score
Weight %
Very small
Very large
17. Decreased viability of stock
Size of economic or public sectors affected
N/A
N/A
2
20
0 1 2 3
through pollution and disease
Minimum
Severe
18. Impact on biological and
Degree of impact (cost, output changes etc.)
N/A
N/A
1
10
0 1 2 3
genetic diversity
Occasion/Short
Continuous
Frequency/Duration
N/A
N/A
0 1 2 3
Criteria for Economics impacts
Raw score
Score
Weight %
Weight average score for Economic impacts
1
Very small
Very large
Size of economic or public sectors affected
N/A
N/A
Criteria for Health impacts
Raw score
Score
Weight %
0 1 2 3
Minimum
Severe
Very small
Very large
Degree of impact (cost, output changes etc.)
N/A
N/A
Number of people affected
N/A
N/A
0 1 2 3
0 1 2 3
Occasion/Short
Continuous
Minimum
Severe
Frequency/Duration
N/A
N/A
Degree of severity
N/A
N/A
0 1 2 3
0 1 2 3
Occasion/Short
Continuous
Weight average score for Economic impacts
2
Frequency/Duration
N/A
N/A
0 1 2 3
Criteria for Health impacts
Raw score
Score
Weight %
Weight average score for Health impacts
0
Very small
Very large
Criteria for Other social and
Number of people affected
N/A
N/A
Raw score
Score
Weight %
0 1 2 3
community impacts
Minimum
Severe
Very small
Very large
Degree of severity
N/A
N/A
Number and/or size of community affected
N/A
N/A
0 1 2 3
0 1 2 3
Occasion/Short
Continuous
Minimum
Severe
Frequency/Duration
N/A
N/A
Degree of severity
N/A
N/A
0 1 2 3
0 1 2 3
Occasion/Short
Continuous
Weight average score for Health impacts
1
Frequency/Duration
N/A
N/A
0 1 2 3
Criteria for Other social and
Raw score
Score
Weight %
Weight average score for Other social and community impacts
2
community impacts
Very small
Very large
N/A = Not applied
Number and/or size of community affected
N/A
N/A
0 1 2 3
Minimum
Severe
Degree of severity
N/A
N/A
0 1 2 3
Occasion/Short
Continuous
Frequency/Duration
N/A
N/A
0 1 2 3
Weight average score for Other social and community impacts
0
N/A = Not applied
70
GIWA REGIONAL ASSESSMENT 36 EAST CHINA SEA
V: Global change
Weight
Environmental
Environmental issues
Score
Weight
averaged
concern
score
19. Changes in the hydrological cycle
1
50
Global change
0.5
20. Sea level change
0
50
21. Increased UV-B radiation as a
N/A
N/A
result of ozone depletion
22. Changes in ocean CO2
N/A
N/A
source/sink function
Criteria for Economics impacts
Raw score
Score
Weight %
Very small
Very large
Size of economic or public sectors affected
N/A
N/A
0 1 2 3
Minimum
Severe
Degree of impact (cost, output changes etc.)
N/A
N/A
0 1 2 3
Occasion/Short
Continuous
Frequency/Duration
N/A
N/A
0 1 2 3
Weight average score for Economic impacts
0
Criteria for Health impacts
Raw score
Score
Weight %
Very small
Very large
Number of people affected
N/A
N/A
0 1 2 3
Minimum
Severe
Degree of severity
N/A
N/A
0 1 2 3
Occasion/Short
Continuous
Frequency/Duration
N/A
N/A
0 1 2 3
Weight average score for Health impacts
0
Criteria for Other social and
Raw score
Score
Weight %
community impacts
Very small
Very large
Number and/or size of community affected
N/A
N/A
0 1 2 3
Minimum
Severe
Degree of severity
N/A
N/A
0 1 2 3
Occasion/Short
Continuous
Frequency/Duration
N/A
N/A
0 1 2 3
Weight average score for Other social and community impacts
1
N/A = Not applied
ANNEXES
71
Comparative environmental and socio-economic impacts of each GIWA concern
Types of impacts
Environmental score
Economic score
Human health score
Social and community score
Concern
Overall score
Present (a)
Future (b)
Present (a)
Future (b)
Present (a)
Future (b)
Present (a)
Future (b)
Freshwater shortage
1.7
2
1
1
0
0
0
1
0.84
Pollution
1.7
2
1
1
1
1
2
1
1.34
Habitat and community modification
2
3
1
0
0
0
2
1
1.12
Unsustainable exploitation of fish and
2.4
3
2
0
1
0
0
1
1.18
other living resources
Global change
0.5
1
0
0
0
0
1
1
0.44
Weight averaged environmental and socio-economic impacts of each GIWA concern
Present (%) (i)
Future (%) (j)
Total (%)
60
40
100
Other Social and Community
Environmental (k)
Economic (l)
Health (m)
Total (%)
impacts (n)
40
20
20
20
100
Types of Impacts
Time Weight
Time Weight
Time Weight
Time Weight Averaged
Time Weight
Averaged Economic
Averaged Human
Averaged Social &
Environmental Score
Averaged Overall
Score
Health Score
Community Score
Concern
(o)
Score
(p)
(q)
(r)
Rank
(o)x(k)+(p)x(l)+
(a)x(i)+(b)x(j)
(c)x(i)+(d)x(j)
(e)x(i)+(f)x(j)
(g)x(i)+(h)x(j)
(q)x(m)+(r)x(n)
Freshwater shortage
1.82
1
0
0.4
1.01
4
Pollution
1.82
1
1
1.6
1.45
2
Habitat and community modification
2.40
0.6
0
1.6
1.40
3
Unsustainable exploitation of fish and
2.84
1.2
0.6
0.4
1.58
1
other living resources
Global change
0.70
0
0
1
0.48
5
72
GIWA REGIONAL ASSESSMENT 36 EAST CHINA SEA
Annex III
11. 1996 Decision of the State Council on several issues
List of laws and regulations
concerning environmental protection, came into force on
related to water
Aug. 3, 1996, aims at strengthening the prevention and control of
water pollution in rivers, lakes, reservoirs and coastal waters.
12. 1998 People's Republic of China Exclusive Economic Zone
1. 1974 UNEP Regional Seas Programme, UNEP, established in
and Continental Shelf Law, came into eff ect on 26 June 1998,
1974, is a global program for the sustainable management of coastal
defi nes the EEZ and the continental shelf of PRC China and specifi es
and marine environment areas on a regional basis.
the jurisdictional powers that China will be exercised in these
2. 1979 Rules of the People's Republic of China governing
maritime areas.
vessels of foreign nationality, came into force on Sept. 18, 1979,
13. 1998 Seawater Quality Standard of the People's Republic of
safeguard ports and coastal waters, ensure the safety of navigation
China, came into force on July 1, 1998, classifi es seawater quality
and prevent the pollution of waters.
into four grades, and gives quality standards for each grade of
3. 1983 Regulations of the People's Republic of China on the
seawater.
prevention of vessel-induced sea pollution, came into eff ect
14. 1999 Wetland Biodiversity Conservation and Sustainable
in 1983, aim to protect marine environment.
Use Programme, People's Republic of China, issued by the
4. 1985 Regulations of the People's Republic of China on
State Council on Jan. 1, 1999, provides the foundation for the
control over dumping of wastes in the seawater, come into
conservation and better management of the wetland resources in
eff ect on Mar 6,1985, control dumping of waste.
China.
5. 1990 Regulations of the People's Republic of China on the
15. 2002 Administration Law on the Use of Ocean Space of the
prevention of pollution damage to the marine environment
People's Republic of China, came into eff ect on Jan. 1, 2002,
by land-sourced pollutants, came into eff ect on June 22,1990,
promotes the rational development and sustainable use of ocean
focus on strengthening the supervision and administration of land
space.
pollution sources and preventing pollution damage to the marine
16. Economic and Social Commission for Asia and the Pacifi c
environment by land-sourced pollutants.
(ESCAP), UN, addresses various issues about water.
6. 1991 Law of the People's Republic of China on Water and
17. Large Marine Ecosystem Project, The Large Marine Ecosystem
Soil Conservation, came into force on June 29, 1991, supports
Project is a global eff ort initiated by the World Conservation Union
the decrease of land-based pollution of the marine zone.
(IUCN), the Intergovernmental Oceanographic Commission of
7. 1992 Law of the People's Republic of China on the Territorial
UNESCO (IOC), other United Nations agencies, and the US National
Sea and the Contiguous zone, came into eff ect on Feb. 25, 2002,
Oceanic and Atmospheric Administration (NOAA). The project
defi nes and protect territorial sea and contiguous zone of the
aims to improve the long-term sustainability of resources and
People's Republic of China.
environment of the Large Marine Ecosystems (LMEs) worldwide.
8. 1992 Maritime Code of the People's Republic of China, came
18. Nautilus Institute for Security and Sustainable Development,
into force on Nov. 7, 1992, governs commercial transactions to do
is a policy-oriented research and consulting organisation which
with shipping and navigation.
promotes international cooperation for security and ecologically
9. 1992 North Pacifi c Marine Science Organization (PICES),
sustainable development including the marine environment
established in 1992 with Canada, People's Republic of China,
Japan, Republic of Korea, Russian Federation, and the United
States of America, is an intergovernmental scientifi c organisation
to advance scientifi c knowledge about the ocean environment.
10. 1996 Decision of the Standing Committee of the National
People's Congress on approval of the United Nations
Convention on the Law of the Sea, approved by the Standing
Committee of the National People's Congress on 15 May 1996,
is a full adoption of UNCLOS treaty norms by China, including
particularly the concept of the 200 nm EEZ and a Continental Shelf
generally limited to 200 nm.
ANNEXES
73
Annex IV
11. Mineral Resources Law of the People's Republic of China,
List of laws and regulations
covers the development of the mining industry and promotes the
related to environmental
exploration, development, utilization and protection of mineral
resources in the present and the long term.
protection
1. The Water Act of People's Republic of China, approved by the
Standing Committee of National People's Congress and issued by
the president of People's Republic of China; a law for management,
utilization and protection of water resources.
2. 1982 The Marine Environment Protection Act of People's
Republic of China, approved by the Standing Committee of
National People's Congress on Aug. 23, 1982; a law especially for
marine environment protection.
3.
1983 The Marine Petroleum Exploitation and the
Environment Protection Regulation of People's Republic
of China, issued by the State Council on Dec. 29, 1983; a detailed
and supplementary rule for the Marine Environment Protection
Act.
4. 1983 The Regulation for Preventing Marine Pollution from
Ship, People's Republic of China, issued by the State Council on
Dec. 29, 1983; a detailed rule for the Marine Environment Protection
Act.
5. 1984 The Water Pollution Control Act of People's Republic of
China, approved by the Standing Committee of National People's
Congress and issued by the president of People's Republic of China
on May 1, 1984; a law dealing with inland water pollution control.
6. 1985 The Marine Waste Disposal Management Regulation of
People's Republic of China, issued by the State Council on March
6, 1985; a detailed rule for implementing the Marine Environment
Protection Act.
7. 1988 The Wild Animal Conservation Act of People's Republic
of China, approved by the National People's Congress on Nov 8,
1988; the fi rst law in China dealing with wild animal conservation.
8. 1989 The Environment Protection Act of People's Republic
of China, approved by the Standing Committee of National
People's Congress on Dec. 26, 1989; a basic law for comprehensive
environment protection.
9. 1990 The Regulation for Controlling Marine Pollution by
Inland Pollutants, People's Republic of China, issued by
the State Council on June 22, 1990; a detailed rule for the Marine
Environment Protection Act.
10. 1990 The Regulation for Preventing Marine Pollution from
Coastal Construction, People's Republic of China, issued by
the State Council on May 25, 1990; a detailed rule for the Marine
Environment Protection Act.
74
GIWA REGIONAL ASSESSMENT 36 EAST CHINA SEA
Annex V
11. 1986 The Fishery Act of People's Republic of China, approved
List of laws and regulations
by the Standing Committee of National People's Congress and
related to fisheries
issued by the president of People's Republic of China on Jan.
20, 1986; a basic law dealing with national principle for fi shery
management including aquaculture, fi shing and fi shery resource
1. The Water Act of People's Republic of China, approved by the
enhancement, utilization and conservation.
Standing Committee of National People's Congress and issued by
12. 1987 The Detailed Rule for Implementing The Fishery Act
the president of People's Republic of China; a law for management,
of People's Republic of China, approved by the State Council
utilization and protection of water resources.
and issued by the Ministry of Agriculture on Oct. 19, 1987; a
2. 1953 The Charter of the Ship Inspection Bureau of People's
supplementary regulation for The Fishery Act of People's Republic
Republic of China, approved by the State Council on Oct. 7, 1963;
of China.
a rule suitable to all kinds of ships except military ship, sport boat,
13. 1988 The Wild Animal Conservation Act of People's Republic
tourism boat and small wooden boat.
of China, approved by the National People's Congress on Nov. 8,
3. 1982 The Marine Environment Protection Act of People's
1988; the fi rst law in China dealing with wild animal conservation.
Republic of China, approved by the Standing Committee of
14. 1989 The Environment Protection Act of People's Republic
National People's Congress on Aug. 23, 1982; a law especially for
of China, approved by the Standing Committee of National
marine environment protection.
People's Congress on Dec. 26, 1989; a basic law for comprehensive
4. 1982 The Food Hygiene Act of People's Republic of China,
environment protection.
approved by the Standing Committee of National People's
15. 1989 Regulations on fi shing license management, aimed
Congress on Nov. 19, 1982; a law preventing unhealthy food from
to protect and rationally utilize fi shery resources, regulate fi shing
endangering people's health.
intensity, maintain production order and safeguard the legitimate
5.
1983 The Marine Petroleum Exploitation and the
rights and interests of fi shing operators whilst promoting fi shery
Environment Protection Regulation of People's Republic
development.
of China, issued by the State Council on Dec. 29, 1983; a detailed
16. 1990 The Regulation for Controlling Marine Pollution by
and supplementary rules for the Marine Environment Protection
Inland Pollutants, People's Republic of China, issued by
Act.
the State Council on June 22, 1990; a detailed rule for the Marine
6. 1983 The Regulation for Preventing Marine Pollution from
Environment Protection Act.
Ship, People's Republic of China, issued by the State Council
17. 1990 The Regulation for Preventing Marine Pollution from
on Dec. 29, 1983; a detailed rules for the Marine Environment
Coastal Construction, People's Republic of China, issued by
Protection Act.
the State Council on May 25, 1990; a detailed rule for the Marine
7. The Export Food Hygiene Management Regulation of
Environment Protection Act.
People's Republic of China, issued by the State Commodity
18. 1990 The Regulation on Making and Clearing Fishing Port,
Inspection Bureau and the Ministry of Health on July 16, 1984; a
People's Republic of China, issued by the Ministry of Agriculture
law to guarantee the quality of exported food.
on Jan. 26, 1990; a detailed rule for the management of fi shing
8. 1984 The Water Pollution Control Act of People's Republic of
vessels.
China, approved by the Standing Committee of National People's
19. 1991 The Animal and Plant Import & Export Quarantine
Congress and issued by the president of People's Republic of China
Act of People's Republic of China, approved by the Standing
on May 1, 1984; a law dealing with inland water pollution control.
Committee of National People's Congress on Oct. 31, 1991; a law
9. 1985 The Fishing Vessel Registration Charter, People's
preventing animal and plant disease and pest infection.
Republic of China, issued by the Ministry of Agriculture on Nov. 9,
20. 1993 Regulations of the People's Republic of China for the
1985; a detailed rule for both domestic and foreign fi shing vessels.
implementation of wild aquatic animal protection, Oct 1993;
10. 1985 The Marine Waste Disposal Management Regulation of
aimed at the management and conservation of wild aquatic animal
People' Republic of China, issued by the State Council on March
resources.
6, 1985; a detailed rule for implementing the Marine Environment
Protection Act.
ANNEXES
75
Annex VI
Other laws and regulations
1. 1979 Regulations on the Protection and Breeding of Aquatic
Resources, made public in Feb 1979.
2. 1979 The Law on Environmental Protection of the People's
Republic of China (trial implementation) in Sep 1979.
3. 1983 Circular of the State Council on Strict Protection of
Valued and Rare Wild Animals in 1983.
4. 1984 Forest Law of the People's Republic of China, passed
by the Seventh Session of the standing Committee of the Sixth
National People's Congress on Sep 20, 1984, with a view to
protecting, nurturing and rationally utilizing the forest resources.
5. 1985 The Law on Grasslands of the People's Republic of
China in June 1985.
6. 1986 The Law on Land Management of the People's Republic
of China in June 1986.
7. 1987 The Check-list for the Protection of Key Wild Animals"
in 1987.
8. 1988 The Law on the Protection of Wild Animals of the
People's Republic of China issued in Nov 1988.
9. 1992 The Enforcement Regulations on the Protection of
Terrestrial Wild Animals in the People's Republic of China
in Feb 1992.
10. 2003 Measures regarding the Grant of State-Owned Land
Use Rights by means of Negotiation, approved by Ministry of
Land and Resource on Aug 1, 2003; provided for new minimum
pricing standards with respect to granting land use rights through
negotiation with relevant government departments.
11. 2004 The Port Law of the People's Republic of China, issued
by Standing Committee of the National People's Congress on Jan 1,
2004; establishes the regime for planning, construction, operation
and supervision of China's sea and river ports.
76
GIWA REGIONAL ASSESSMENT 36 EAST CHINA SEA
Annex VII
Records of main economic freshwater species in the estuary
areas of the East China Sea
Species
Species
Coilia mystus (Linnaeus)
Hemibarbus longirostris (Regan)
Coilia ectenes (Jordan et Seale)
Belligobio nummifer (Boulenger)
Salmo gairdneri (Richardson)
Hemibarbus labeo (Pallas)
Protosalanx hyalocranius (Abbott)
Pseudorasbora parva (Temminck et Schlegel)
Anguilla japonica (Temminck et Schlegel)
Sarcocheilichthys sinensis (Bleeker)
Elopichthys bambusa (Richardson)
Pseudogobio vaillanti (Sauvage)
Squaliobarbus curriculus (Richardson)
Coreius heterodon (Bleeker)
Aphyocypris chinensis (GŘnther)
Abbottina rivularis (Basilewsky)
Mylopharyngodon piceus (Richardson)
Saurogobio dabryi (Bleeker)
Ctenopharyngodon idellus
Saurogobio dumerili (Bleeker)
(Cuvier et Valenciennes)
Plagiognathops microleps (Bleeker)
Spinibarbus hollandi (Oshima)
Acrossocheilus (Lissochilichthys) wenchowensis
Xenocypris argentea (GŘnther)
(Wang)
Distoechodon tumirostris (Peters)
Cyprinus carpio (Linnaeus)
Pseudobrama simony (Bleeker)
Carassius auratus (Linnaeus)
Aristichthys nobilis (Bleeker)
Misgurnus anguillicaudatus (Cantor)
Hypophthalmichthys molitrix
Silurus asotus Linnaeus
(Cuver et Valenciennes)
Rhodeus sinensis (GŘnther)
Pelteobagrus fulvidraco (Richardson)
Toxabramis swinhonis (GŘnther)
Glyptothorax fukiensis (Rendahl)
Hemiculter leucisculus (Basilewsky)
Orysias latipes (Temminck et Schlegel)
Culter erythropterus (Basilewsky)
Mugil cephalus (Linnaeus)
Pseudolaubuca sinensis (Bleeker)
Liza hematocheila (Temminck et Schlegel)
Megalobrama amblycephala (Yih)
Monopterus albus (Zuiew)
Megalobrama terminalis (Richardson)
Siniperca chuatsi (Basilewsky)
Sinibrama macrops (GŘnther)
Siniperca undalata (Fang et Chong)
Erythroculter ilishaeformis (Bleeker)
Odontobutis obscura (Temminck et Schlegel)
Erythroculter mongolicus (Basilewsky)
Ctenogobius giurinus (Rutter)
Parabramis pekinensis (Basilewsky)
Boleophthalmus pectinirostris (Linnaeus)
Hemibarbus maculatus (Bleeker)
Channa argus (Cantor)
ANNEXES
77
Annex VIII
Records of main economic fishes in the East China Sea
North of East China Sea
South of East China Sea
Species
Taiwan Strait
Korea
Japan
Pelagic sea
Offshore
Pelagic Sea
Offshore
Raja kenojei (MŘller et Helle, 1841)
Raja porosa (GŘnther, 1874)
Sardinella zunasi (Bleeker, 1854)
Sardinella lemuru (Bleeker, 1853)
Ilisha elongata (Bennett, 1830)
Coilia ectenes (Jordan et Seale, 1905)
Coilia mystus (Linnaeus, 1758)
Engraulis japonicus (Te
mminck et Schlegel, 1846)
Setipinna taty (Valenciennes, 1848)
Argentina semifasciata (Kishinouye, 1904)
Saurida elongata (Temminck et Schlegel, 1846)
S
aurida undosquamis (Richardson, 1848)
Saurida wanieso (Shindo et Yamada, 1972)
Synodus macrops (Tanaka, 1917)
Trachinocephalus myops (Bloch et Schneider, 1801)
Saurida sp.
Harpadon nehereus (Hamilton, 1822)
Alloc
onger anagoides (Bleeker, 1864)
Anago anago (Te
mminck et Schlegel, 1846)
Conger myriaster (Brevoort, 1856)
Rhynchoconger ectenurus (Jordan et Richardson, 1909)
Rhynchocymba sivicola (Matsubara et Ochiai, 1951)
Mur
aenesox cinereus (Forskňl, 1755)
Gym
nothorax reticularis (Bloch, 1795)
Ariosoma shiroanago shiroanago (Asano, 1958)
Dysomma anguillare (Barnard, 1923)
Ophichthus apicalis (Bennett, 1830)
Bregmac
eros macclellandi (Thompson, 1940)
Coelorhynchus multispinulosus (Katayama, 1942)
Neobythites sivicola (Jordan et Snyder, 1901)
Fistularia petimba (LacÚpÚde, 1803)
Sphyraena japonica (Cuvier
et Valenciennes, 1829)
Sphyraena pinguis (GŘnther, 1874)
Eleutheronema tetradactylum (Shaw, 1804)
Doederleinia berycoides (Hilgendorf, 1878)
Synagrops japonicus (Steindachner et D÷derlein, 1884)
Cookeolus boops (Cuvier, 1829)
Priacanthus macracanthus (Cuv
ier et Valenciennes, 1829)
78
GIWA REGIONAL ASSESSMENT 36 EAST CHINA SEA
A
cropoma japonicum (GŘnther, 1859)
Apogon lineatus (T
emmick et Schleger, 1842)
Bran
chiostegus japonicus (Houttuyn, 1782)
Caranx equula (Te
mminck et Schlegel, 1842)
Decapterus maruaelsi (Temminc
k et Schlegel, 1842)
Selar
crumenophthalmus (Bloch, 1793)
Trachurus japonicus (Te
mminck et Schlegel, 1842)
Seriola aureovittata (Temminck et Schlegel, 1845)
Argy
rosomus argentatus (Houttuyn, 1782)
Nibea albiflora (Richardson, 1846)
Collichthys lucidus (Richardson, 1844)
Collichthys niveatus (Jordan et Starks, 1906)
Miichthys miiuy (Basilewsky, 1855)
Larimichthys crocea (Richardson, 1846)
Larimichthys polactis (Bleeker, 1877)
Pagrosomus major (Temminck et Schlegel, 1843)
Evynnis cardinals (LacÚpŔde, 1802)
Sparus macrocephalus (Basilewsky, 1855)
Dentex tumifrons (Te
mminck et Schlegel, 1842)
Banjos banjos (Richardson, 1846)
Hapalogenys mucronatus (
Eydoux et Souleyet, 1841)
Upeneus bensasi (Te
mminck et Schlegel, 1842)
Parapercis sexfasciata (Te
mminck et Schlegel, 1843)
Gnathagnus elongatus (Temminck et Schlegel, 1846)
Uranoscopus japonicus (Houttuyn, 1782)
Ch
ampsodon capensis (Regan, 1908)
Callionymus beniteguri (Jordan et Snyder, 1900)
Callionymus kaianus (GŘnther, 1880)
Callionymus virgi
s (Jordan et Fowler, 1903)
Calliurichthys doryssu
s (Jordan et Fowler, 1903)
Callionymus richardsoni (Bleeker, 1854)
Trichiurus
lepturus (Linnaeus, 1758)
Scomber japonicus (Houttuyn, 1782)
Scomberomoru
s niphonius (Cuvier, 1831)
Sarda orientalis (Temminck et Schlegel, 1844)
Pampus argenteus (Euphrasen, 1788)
Pampus cinereus (Bloch, 1793)
Psenopsis anomala (Temminck et Schlegel, 1844)
Cubiceps squamiceps (Lioyd, 1909)
Amblychaeturichthys hexanema (Bleeker, 1853)
Chaeturichthys stigmatias (Richardson, 1844)
Odontamblyopus rubicundus (Hamilton, 1822)
ANNEXES
79
Ctenotrypauchen chinensis (Steindachner, 1867)
Sebastiscus marmoratus (Cuiver et Valenciennes, 1829)
Scorpaena neglecta (Temminck et Schlegel, 1848)
Minous monodactylus (Bloch et Schneider, 1801)
Chelidonichthys spinosus (McClelland, 1844)
Lepidotrigla abyssalis (Jordan et Starks, 1902)
Lepidotrig
la alata (Houttuyn, 1782)
Lepidotrigla guentheri (Hilgendorf, 1879)
Lepidotrigla japonica (Bleeker, 1857)
Lepidotrigla kishinouyei (Snyder, 1911)
Lepidotrigla micropterus (GŘnther, 1873)
Pterygotrigla hemisticta (Temminck et Schlegel, 1850)
Erisphex pottii (Steindachner, 1897)
Bembras japonicus (Cui
ver et Valenciennes, 1829)
Onigocia spinosus (Temminck et Schlegel, 1843)
Platycephalus indicus (Linnaeus, 1758)
Pseudorhombus arsius (Hamilton, 1822)
Pseudorhombus pentophthalmus (GŘnther, 1862)
Pseudorhombus quinquocellatus (Weber et de Beaufert, 1929)
Arnoglossus tenuis (GŘnther, 1880)
Arnoglossus yamanakai (Fukui, Yamada and Ozawa, 1988)
Pleuronichthys cornutus (Te
mminck et Schlegel, 1846)
Cynoglossus abbreviatus (Gray, 1832)
Cynoglossus Kopsii (Bleeker,1851)
Cynoglossus gracilis (GŘnther, 1873)
Cynoglossus interruptus (GŘnther, 1879)
Cynoglossus oligolepis (Bleeker, 1854)
Triacanthodes anomalus (Temminck et Schlegel, 1847)
Aluterus monoceros (Linnaeus, 1758)
Thamnaconus septemtrionalis (GŘnther, 1874)
Thamn
aconus hypargyreus (Cope,1871)
Takifugu xanthopterus (Temminck et Schlegel, 1847)
Lophiomus setigerus (Vahl, 1797)
Lophius litulon (Jordan, 1902)
Malthopsis luteus (Alcock, 1891)
80
GIWA REGIONAL ASSESSMENT 36 EAST CHINA SEA
Annex IX
Environmental quality
standards for surface water
National Standards of the People's Republic of
China (GHZB1-1999)
This standard is applicable to the surface water bodies of rivers, lakes
and reservoirs within the territory of the People's Republic of China.
The water bodies are divided into fi ve classes according to the utilization
purposes and protection objectives:
Class I is mainly applicable to the water from sources, and the
national nature reserves.
Class II is mainly applicable to fi rst class of protected areas for
centralized sources of drinking water, the protected areas for rare
fi shes, and the spawning fi elds of fi shes and shrimps.
Class III is mainly applicable to second class of protected areas
for centralized sources of drinking water, protected areas for the
common fi shes and swimming areas.
Class IV is mainly applicable to the water areas for industrial use and
entertainment which is not directly touched by human bodies.
Class V is mainly applicable to the water bodies for agricultural use
and landscape requirement.
The water bodies with various functions are classifi ed based on the
highest function.
ANNEXES
81
The Global International
Waters Assessment
This report presents the results of the Global International Waters
Adequately managing the world's aquatic resources for the benefi t of
Assessment (GIWA) of the transboundary waters of the East China
all is, for a variety of reasons, a very complex task. The liquid state of
Sea region. This and the subsequent chapter off er a background
the most of the world's water means that, without the construction
that describes the impetus behind the establishment of GIWA, its
of reservoirs, dams and canals it is free to fl ow wherever the laws of
objectives and how the GIWA was implemented.
nature dictate. Water is, therefore, a vector transporting not only a
wide variety of valuable resources but also problems from one area
to another. The effl
uents emanating from environmentally destructive
activities in upstream drainage areas are propagated downstream
The need for a global
and can aff ect other areas considerable distances away. In the case of
international waters
transboundary river basins, such as the Nile, Amazon and Niger, the
assessment
impacts are transported across national borders and can be observed
in the numerous countries situated within their catchments. In the case
of large oceanic currents, the impacts can even be propagated between
Globally, people are becoming increasingly aware of the degradation of
continents (AMAP 1998). Therefore, the inextricable linkages within
the world's water bodies. Disasters from fl oods and droughts, frequently
and between both freshwater and marine environments dictates that
reported in the media, are considered to be linked with ongoing global
management of aquatic resources ought to be implemented through
climate change (IPCC 2001), accidents involving large ships pollute public
a drainage basin approach.
beaches and threaten marine life and almost every commercial fi sh stock
is exploited beyond sustainable limits - it is estimated that the global
In addition, there is growing appreciation of the incongruence
stocks of large predatory fi sh have declined to less that 10% of pre-
between the transboundary nature of many aquatic resources and the
industrial fi shing levels (Myers & Worm 2003). Further, more than 1 billion
traditional introspective nationally focused approaches to managing
people worldwide lack access to safe drinking water and 2 billion people
those resources. Water, unlike laws and management plans, does not
lack proper sanitation which causes approximately 4 billion cases of
respect national borders and, as a consequence, if future management
diarrhoea each year and results in the death of 2.2 million people, mostly
of water and aquatic resources is to be successful, then a shift in focus
children younger than fi ve (WHO-UNICEF 2002). Moreover, freshwater
towards international cooperation and intergovernmental agreements
and marine habitats are destroyed by infrastructure developments,
is required (UN 1972). Furthermore, the complexity of managing the
dams, roads, ports and human settlements (Brinson & Malvßrez 2002,
world's water resources is exacerbated by the dependence of a great
Kennish 2002). As a consequence, there is growing public concern
variety of domestic and industrial activities on those resources. As a
regarding the declining quality and quantity of the world's aquatic
consequence, cross-sectoral multidisciplinary approaches that integrate
resources because of human activities, which has resulted in mounting
environmental, socio-economic and development aspects into
pressure on governments and decision makers to institute new and
management must be adopted. Unfortunately however, the scientifi c
innovative policies to manage those resources in a sustainable way
information or capacity within each discipline is often not available or
ensuring their availability for future generations.
is inadequately translated for use by managers, decision makers and
GLOBAL INTERNATIONAL WATERS ASSESSMENT
i
policy developers. These inadequacies constitute a serious impediment
The Global Environment Facility (GEF)
to the implementation of urgently needed innovative policies.
The Global Environment Facility forges international co-operation and fi nances actions to address
six critical threats to the global environment: biodiversity loss, climate change, degradation of
international waters, ozone depletion, land degradation, and persistent organic pollutants (POPs).
Continual assessment of the prevailing and future threats to aquatic
The overall strategic thrust of GEF-funded international waters activities is to meet the incremental
ecosystems and their implications for human populations is essential if
costs of: (a) assisting groups of countries to better understand the environmental concerns of
their international waters and work collaboratively to address them; (b) building the capacity
governments and decision makers are going to be able to make strategic
of existing institutions to utilise a more comprehensive approach for addressing transboundary
policy and management decisions that promote the sustainable use of
water-related environmental concerns; and (c) implementing measures that address the priority
transboundary environmental concerns. The goal is to assist countries to utilise the full range of
those resources and respond to the growing concerns of the general
technical, economic, fi nancial, regulatory, and institutional measures needed to operationalise
public. Although many assessments of aquatic resources are being
sustainable development strategies for international waters.
conducted by local, national, regional and international bodies, past
United Nations Environment Programme (UNEP)
assessments have often concentrated on specifi c themes, such as
United Nations Environment Programme, established in 1972, is the voice for the environment
biodiversity or persistent toxic substances, or have focused only on
within the United Nations system. The mission of UNEP is to provide leadership and encourage
partnership in caring for the environment by inspiring, informing, and enabling nations and
marine or freshwaters. A globally coherent, drainage basin based
peoples to improve their quality of life without compromising that of future generations.
assessment that embraces the inextricable links between transboundary
UNEP work encompasses:
freshwater and marine systems, and between environmental and
Assessing global, regional and national environmental conditions and trends;
Developing international and national environmental instruments;
societal issues, has never been conducted previously.
Strengthening institutions for the wise management of the environment;
Facilitating the transfer of knowledge and technology for sustainable development;
Encouraging new partnerships and mind-sets within civil society and the private sector.
International call for action
University of Kalmar
University of Kalmar hosts the GIWA Co-ordination Offi ce and provides scientifi c advice and
administrative and technical assistance to GIWA. University of Kalmar is situated on the coast of
The need for a holistic assessment of transboundary waters in order to
the Baltic Sea. The city has a long tradition of higher education; teachers and marine offi cers have
been educated in Kalmar since the middle of the 19th century. Today, natural science is a priority
respond to growing public concerns and provide advice to governments
area which gives Kalmar a unique educational and research profi le compared with other smaller
universities in Sweden. Of particular relevance for GIWA is the established research in aquatic and
and decision makers regarding the management of aquatic resources
environmental science. Issues linked to the concept of sustainable development are implemented
was recognised by several international bodies focusing on the global
by the research programme Natural Resources Management and Agenda 21 Research School.
environment. In particular, the Global Environment Facility (GEF)
Since its establishment GIWA has grown to become an integral part of University activities.
The GIWA Co-ordination offi ce and GIWA Core team are located at the Kalmarsund Laboratory, the
observed that the International Waters (IW) component of the GEF
university centre for water-related research. Senior scientists appointed by the University are actively
suff ered from the lack of a global assessment which made it diffi
cult
involved in the GIWA peer-review and steering groups. As a result of the cooperation the University
can offer courses and seminars related to GIWA objectives and international water issues.
to prioritise international water projects, particularly considering
the inadequate understanding of the nature and root causes of
environmental problems. In 1996, at its fourth meeting in Nairobi, the
causes of degradation of the transboundary aquatic environment and
GEF Scientifi c and Technical Advisory Panel (STAP), noted that: "Lack of
options for addressing them. These pro cesses led to the development
an International Waters Assessment comparable with that of the IPCC, the
of the Global International Waters Assessment (GIWA) that would be
Global Biodiversity Assessment, and the Stratospheric Ozone Assessment,
implemented by the United Nations Environment Programme (UNEP) in
was a unique and serious impediment to the implementation of the
conjunction with the University of Kalmar, Sweden, on behalf of the GEF.
International Waters Component of the GEF".
The GIWA was inaugurated in Kalmar in October 1999 by the Executive
Director of UNEP, Dr. Klaus T÷pfer, and the late Swedish Minister of the
The urgent need for an assessment of the causes of environmental
Environment, Kjell Larsson. On this occasion Dr. T÷pfer stated: "GIWA
degradation was also highlighted at the UN Special Session on
is the framework of UNEP┤s global water assessment strategy and will
the Environment (UNGASS) in 1997, where commitments were
enable us to record and report on critical water resources for the planet for
made regarding the work of the UN Commission on Sustainable
consideration of sustainable development management practices as part of
Development (UNCSD) on freshwater in 1998 and seas in 1999. Also in
our responsibilities under Agenda 21 agreements of the Rio conference".
1997, two international Declarations, the Potomac Declaration: Towards
enhanced ocean security into the third millennium, and the Stockholm
The importance of the GIWA has been further underpinned by the UN
Statement on inter action of land activities, freshwater and enclosed
Millennium Development Goals adopted by the UN General Assembly
seas, specifi cally emphasised the need for an investigation of the root
in 2000 and the Declaration from the World Summit on Sustainable
iI
REGIONAL ASSESSMENTS
Development in 2002. The development goals aimed to halve the
International waters and transboundary issues
proportion of people without access to safe drinking water and basic
The term "international waters", as used for the purposes of the GEF Operational Strategy,
sanitation by the year 2015 (United Nations Millennium Declaration
includes the oceans, large marine ecosystems, enclosed or semi-enclosed seas and estuaries, as
well as rivers, lakes, groundwater systems, and wetlands with transboundary drainage basins
2000). The WSSD also calls for integrated management of land, water and
or common borders. The water-related ecosystems associated with these waters are considered
living resources (WSSD 2002) and, by 2010, the Reykjavik Declaration on
integral parts of the systems.
The term "transboundary issues" is used to describe the threats to the aquatic environment
Responsible Fisheries in the Marine Ecosystem should be implemented
linked to globalisation, international trade, demographic changes and technological advancement,
by all countries that are party to the declaration (FAO 2001).
threats that are additional to those created through transboundary movement of water. Single
country policies and actions are inadequate in order to cope with these challenges and this makes
them transboundary in nature.
The international waters area includes numerous international conventions, treaties, and
agreements. The architecture of marine agreements is especially complex, and a large number
The conceptual framework
of bilateral and multilateral agreements exist for transboundary freshwater basins. Related
conventions and agreements in other areas increase the complexity. These initiatives provide
and objectives
a new opportunity for cooperating nations to link many different programmes and instruments
into regional comprehensive approaches to address international waters.
Considering the general decline in the condition of the world's aquatic
the large-scale deforestation of mangroves for ponds (Primavera 1997).
resources and the internationally recognised need for a globally
Within the GIWA, these "non-hydrological" factors constitute as large
coherent assessment of transboundary waters, the primary objectives
a transboundary infl uence as more traditionally recognised problems,
of the GIWA are:
such as the construction of dams that regulate the fl ow of water into
To provide a prioritising mechanism that allows the GEF to focus
a neighbouring country, and are considered equally important. In
their resources so that they are used in the most cost eff ective
addition, the GIWA recognises the importance of hydrological units that
manner to achieve signifi cant environmental benefi ts, at national,
would not normally be considered transboundary but exert a signifi cant
regional and global levels; and
infl uence on transboundary waters, such as the Yangtze River in China
To highlight areas in which governments can develop and
which discharges into the East China Sea (Daoji & Daler 2004) and the
implement strategic policies to reduce environmental degradation
Volga River in Russia which is largely responsible for the condition of
and improve the management of aquatic resources.
the Caspian Sea (Barannik et al. 2004). Furthermore, the GIWA is a truly
regional assessment that has incorporated data from a wide range of
In order to meet these objectives and address some of the current
sources and included expert knowledge and information from a wide
inadequacies in international aquatic resources management, the GIWA
range of sectors and from each country in the region. Therefore, the
has incorporated four essential elements into its design:
transboundary concept adopted by the GIWA extends to include
A broad transboundary approach that generates a truly regional
impacts caused by globalisation, international trade, demographic
perspective through the incorporation of expertise and existing
changes and technological advances and recognises the need for
information from all nations in the region and the assessment of
international cooperation to address them.
all factors that infl uence the aquatic resources of the region;
A drainage basin approach integrating freshwater and marine
systems;
A multidisciplinary approach integrating environmental and socio-
The organisational structure and
economic information and expertise; and
implementation of the GIWA
A coherent assessment that enables global comparison of the
results.
The scale of the assessment
Initially, the scope of the GIWA was confi ned to transboundary waters
The GIWA builds on previous assessments implemented within the GEF
in areas that included countries eligible to receive funds from the GEF.
International Waters portfolio but has developed and adopted a broader
However, it was recognised that a truly global perspective would only
defi nition of transboundary waters to include factors that infl uence the
be achieved if industrialised, GEF-ineligible regions of the world were
quality and quantity of global aquatic resources. For example, due to
also assessed. Financial resources to assess the GEF-eligible countries
globalisation and international trade, the market for penaeid shrimps
were obtained primarily from the GEF (68%), the Swedish International
has widened and the prices soared. This, in turn, has encouraged
Development Cooperation Agency (Sida) (18%), and the Finnish
entrepreneurs in South East Asia to expand aquaculture resulting in
Department for International Development Cooperation (FINNIDA)
GLOBAL INTERNATIONAL WATERS ASSESSMENT
iII
1b
1c
1d
16
15
11
14
12
1a
13
17
28
10
18
25
30
9
19
23
7
22
8
31
6
24
33
20
34
26
2
5
27
50
51
32
21
36
37
41
52
4
49
53
43
54
55
65
42
3
56
42
46
42
47
62
40b
57
40a
40a
47
47
45b
59
39
45a
58
64
60
44
38
61
63
66
ę GIWA 2005
1a Russian Arctic (4 LMEs)
8 Gulf of St Lawrence
17 Baltic
Sea
(LME)
26 California Current (LME)
38 Patagonian Shelf (LME)
45b Indian Ocean Islands
52 Arabian
Sea
(LME)
61 Great
Australian
Bight
1b Arctic
Greenland
(LME)
9 Newfoundland
Shelf
(LME)
18 North
Sea
(LME)
27 Gulf of California (LME)
39 Brazil
Current
(LME)
46 Somali Coastal
53 Bay of Bengal
62 Pacifi c Islands
1c Arctic
European/Atlantic
10 Baffi
n Bay, Labrador Sea,
19 Celtic-Biscay
Shelf
(LME)
28 Bering Sea (LME)
40a Northeast Brazil
Current (LME)
54 South China Sea (2 LMEs)
63 Tasman
Sea
1d Arctic
North
American
Canadian Archipelago
20 Iberian Coastal Sea (LME)
30 Sea of Okhotsk (LME)
Shelf (2 LMEs)
47 East
African
Rift
55 Mekong
River
64 Humboldt Current (LME)
2
Gulf of Mexico (LME)
11 Barents
Sea
(LME)
21 North Africa and
31 Oyashio
Current
(LME)
40b Amazon
Valley Lakes
56 Sulu-Celebes
Sea
(LME)
65 Eastern Equatorial
3 Caribbean
Sea
(LME)
12 Norwegian
Sea
(LME)
Nile River Basin (LME)
32 Kuroshio
Current
(LME)
41 Canary
Current
(LME)
49 Red Sea and
57 Indonesian
Seas
(LME)
Pacifi c (LME)
4 Caribbean
Islands
(LME)
13 Faroe
plateau
22 Black Sea (LME)
33 Sea of Japan (LME)
42 Guinea Current (LME)
Gulf of Aden (LME)
58 North Australian
66 Antarctic (LME)
5 Southeast
Shelf
(LME)
14 Iceland
Shelf
(LME)
23 Caspian
Sea
34 Yellow Sea (LME)
43 Lake
Chad
50 Euphrates and
Shelf (LME)
6 Northeast
Shelf
(LME)
15 East
Greenland
Shelf
(LME)
24 Aral Sea
36 East China Sea (LME)
44 Benguela Current (LME)
Tigris River Basin
59 Coral
Sea
Basin
7 Scotian
Shelf
(LME)
16 West
Greenland
Shelf
(LME)
25 Gulf of Alaska (LME)
37 Hawaiian
Archipelago
(LME)
45a Agulhas Current (LME)
51 Jordan
60 Great Barrier Reef (LME)
Figure 1
The 66 transboundary regions assessed within the GIWA project.
(10%). Other contributions were made by Kalmar Municipality, the
Large Marine Ecocsystems (LMEs)
University of Kalmar and the Norwegian Government. The assessment of
Large Marine Ecosystems (LMEs) are regions of ocean space encompassing coastal areas from river
regions ineligible for GEF funds was conducted by various international
basins and estuaries to the seaward boundaries of continental shelves and the outer margin of the
major current systems. They are relatively large regions on the order of 200 000 km2 or greater,
and national organisations as in-kind contributions to the GIWA.
characterised by distinct: (1) bathymetry, (2) hydrography, (3) productivity, and (4) trophically
dependent populations.
The Large Marine Ecosystems strategy is a global effort for the assessment and management
In order to be consistent with the transboundary nature of many of the
of international coastal waters. It developed in direct response to a declaration at the 1992
world's aquatic resources and the focus of the GIWA, the geographical
Rio Summit. As part of the strategy, the World Conservation Union (IUCN) and National Oceanic
and Atmospheric Administration (NOAA) have joined in an action program to assist developing
units being assessed have been designed according to the watersheds
countries in planning and implementing an ecosystem-based strategy that is focused on LMEs as
of discrete hydrographic systems rather than political borders (Figure 1).
the principal assessment and management units for coastal ocean resources. The LME concept is
also adopted by GEF that recommends the use of LMEs and their contributing freshwater basins
The geographic units of the assessment were determined during the
as the geographic area for integrating changes in sectoral economic activities.
preparatory phase of the project and resulted in the division of the
world into 66 regions defi ned by the entire area of one or more
The global network
catchments areas that drains into a single designated marine system.
In each of the 66 regions, the assessment is conducted by a team of
These marine systems often correspond to Large Marine Ecosystems
local experts that is headed by a Focal Point (Figure 2). The Focal Point
(LMEs) (Sherman 1994, IOC 2002).
can be an individual, institution or organisation that has been selected
on the basis of their scientifi c reputation and experience implementing
Considering the objectives of the GIWA and the elements incorporated
international assessment projects. The Focal Point is responsible
into its design, a new methodology for the implementation of the
for assembling members of the team and ensuring that it has the
assessment was developed during the initial phase of the project. The
necessary expertise and experience in a variety of environmental
methodology focuses on fi ve major environmental concerns which
and socio-economic disciplines to successfully conduct the regional
constitute the foundation of the GIWA assessment; Freshwater shortage,
assessment. The selection of team members is one of the most critical
Pollution, Habitat and community modifi cation, Overexploitation of fi sh
elements for the success of GIWA and, in order to ensure that the
and other living resources, and Global change. The GIWA methodology
most relevant information is incorporated into the assessment, team
is outlined in the following chapter.
members were selected from a wide variety of institutions such as
iV
REGIONAL ASSESSMENTS
an assessment did not exist. Therefore, in order to implement the GIWA,
a new methodology that adopted a multidisciplinary, multi-sectoral,
Steering Group
multi-national approach was developed and is now available for the
implementation of future international assessments of aquatic resources.
GIWA Partners
IGOs, NGOs,
Core
Thematic
The GIWA is comprised of a logical sequence of four integrated
Scientific institutions,
Team
Task Teams
private sector, etc
components. The fi rst stage of the GIWA is called Scaling and is a
66 Regional
process by which the geographic area examined in the assessment is
Focal Points
defi ned and all the transboundary waters within that area are identifi ed.
and Teams
Once the geographic scale of the assessment has been defi ned, the
Figure 2
The organisation of the GIWA project.
assessment teams conduct a process known as Scoping in which the
magnitude of environmental and associated socio-economic impacts
universities, research institutes, government agencies, and the private
of Freshwater shortage, Pollution, Habitat and community modifi cation,
sector. In addition, in order to ensure that the assessment produces a
Unsustainable exploitation of fi sh and other living resources, and Global
truly regional perspective, the teams should include representatives
change is assessed in order to identify and prioritise the concerns
from each country that shares the region.
that require the most urgent intervention. The assessment of these
predefi ned concerns incorporates the best available information and
In total, more than 1 000 experts have contributed to the implementation
the knowledge and experience of the multidisciplinary, multi-national
of the GIWA illustrating that the GIWA is a participatory exercise that
assessment teams formed in each region. Once the priority concerns
relies on regional expertise. This participatory approach is essential
have been identifi ed, the root causes of these concerns are identifi ed
because it instils a sense of local ownership of the project, which
during the third component of the GIWA, Causal chain analysis. The root
ensures the credibility of the fi ndings and moreover, it has created a
causes are determined through a sequential process that identifi es, in
global network of experts and institutions that can collaborate and
turn, the most signifi cant immediate causes followed by the economic
exchange experiences and expertise to help mitigate the continued
sectors that are primarily responsible for the immediate causes and
degradation of the world's aquatic resources.
fi nally, the societal root causes. At each stage in the Causal chain
analysis, the most signifi cant contributors are identifi ed through an
analysis of the best available information which is augmented by the
expertise of the assessment team. The fi nal component of the GIWA is
GIWA Regional reports
the development of Policy options that focus on mitigating the impacts
of the root causes identifi ed by the Causal chain analysis.
The GIWA was established in response to growing concern among the
general public regarding the quality of the world's aquatic resources
The results of the GIWA assessment in each region are reported in
and the recognition of governments and the international community
regional reports that are published by UNEP. These reports are designed
concerning the absence of a globally coherent international waters
to provide a brief physical and socio-economic description of the
assessment. However, because a holistic, region-by-region, assessment
most important features of the region against which the results of the
of the condition of the world's transboundary water resources had never
assessment can be cast. The remaining sections of the report present
been undertaken, a methodology guiding the implementation of such
the results of each stage of the assessment in an easily digestible form.
Each regional report is reviewed by at least two independent external
UNEP Water Policy and Strategy
reviewers in order to ensure the scientifi c validity and applicability of
The primary goals of the UNEP water policy and strategy are:
each report. The 66 regional assessments of the GIWA will serve UNEP
(a) Achieving greater global understanding of freshwater, coastal and marine environments by
as an essential complement to the UNEP Water Policy and Strategy and
conducting environmental assessments in priority areas;
(b) Raising awareness of the importance and consequences of unsustainable water use;
UNEP's activities in the hydrosphere.
(c) Supporting the efforts of Governments in the preparation and implementation of integrated
management of freshwater systems and their related coastal and marine environments;
(d) Providing support for the preparation of integrated management plans and programmes for
aquatic environmental hot spots, based on the assessment results;
Global International Waters Assessment
(e) Promoting the application by stakeholders of precautionary, preventive and anticipatory
approaches.
GLOBAL INTERNATIONAL WATERS ASSESSMENT
v
References:
AMAP (1998). Assessment Report: Arctic Pollution Issues. Arctic
Monitoring and Assessment Programme (AMAP), Oslo, Norway.
Barannik, V., Borysova, O. and Stolberg, F. (2004). The Caspian Sea Region:
Environmental Change. Ambio, 33:45-51.
Brinson, M.M. and Malvßrez, A.I. (2002). Temperate freshwater wetlands:
types, status, and threats. Environmental Conservation, 29:115-133.
Daoji, L. and Daler, D. (2004). Ocean Pollution from Land-based Sources:
East China Sea, China. Ambio, 33:98-106.
FAO (2001). Reykjavik conference on responsible fi sheries in the marine
ecosystem. Iceland, 1-4 October 2001.
IOC (2002). IOC-IUCN-NOAA Consultative Meeting on Large Marine
Ecosystems (LMEs). Fourth Session, 8-9 January 2002, Paris,
France.
IPCC (2001). Climate Change 2001: The Scientifi c Basis. Contribution
of Working Group I to the Third Assessment Report of the
Intergovernmental Panel on Climate Change. In: Houghton,
J.T., Ding, Y., Griggs, D.J., Noguer, M., van der Linden, P.J., Dai, X.,
Maskell, K. and Johnson, C.A. (eds). Cambridge University Press,
Cambridge, United Kingdom and New York, NY, USA.
Kennish, M.J. (2002). Environmental threats and environmental future of
estuaries. Environmental Conservation, 29:78-107.
Myers, R.A. and Worm, B. (2003). Rapid worldwide depletion of predatory
fi sh communities. Nature, 423:280-283.
Primavera, J.H. (1997) Socio-economic impacts of shrimp culture.
Aquaculture Research, 28:815-827.
Sherman, K. (1994). Sustainability, biomass yields, and health of coastal
ecosystems: an ecological perspective. Marine Ecology Progress
Series, 112:277-301.
United Nations conference on the human environment (1972). Report
available on-line at http://www.unep.org
United Nations Millennium Declaration (2000). The Millennium
Assembly of the United Nations, New York.
WHO-UNICEF (2002). Global Water Supply and Sanitation Assessment:
2000 Report.
WSSD (2002). World Summit on Sustainable Development.
Johannesburg Summit 2002. Key Outcomes of the Summit,
UN Department of Public Information, New York.
v I
REGIONAL ASSESSMENTS
The GIWA methodology
The specifi c objectives of the GIWA were to conduct a holistic and globally
The assessment integrates environmental and socio-economic data
comparable assessment of the world's transboundary aquatic resources
from each country in the region to determine the severity of the
that incorporated both environmental and socio-economic factors
impacts of each of the fi ve concerns and their constituent issues on
and recognised the inextricable links between freshwater and marine
the entire region. The integration of this information was facilitated by
environments, in order to enable the GEF to focus their resources and to
implementing the assessment during two participatory workshops
provide guidance and advice to governments and decision makers. The
that typically involved 10 to 15 environmental and socio-economic
coalition of all these elements into a single coherent methodology that
experts from each country in the region. During these workshops, the
produces an assessment that achieves each of these objectives had not
regional teams performed preliminary analyses based on the collective
previously been done and posed a signifi cant challenge.
knowledge and experience of these local experts. The results of these
analyses were substantiated with the best available information to be
The integration of each of these elements into the GIWA methodology
presented in a regional report.
was achieved through an iterative process guided by a specially
Table 1 Pre-defi ned GIWA concerns and their constituent issues
convened Methods task team that was comprised of a number of
addressed within the assessment.
international assessment and water experts. Before the fi nal version
of the methodology was adopted, preliminary versions underwent
Environmental issues
Major concerns
an extensive external peer review and were subjected to preliminary
1. Modification of stream flow
testing in selected regions. Advice obtained from the Methods task
2. Pollution of existing supplies
I Freshwater shortage
3. Changes in the water table
team and other international experts and the lessons learnt from
preliminary testing were incorporated into the fi nal version that was
4. Microbiological
5. Eutrophication
used to conduct each of the GIWA regional assessments.
6. Chemical
7. Suspended
solids
II Pollution
8. Solid
wastes
Considering the enormous diff erences between regions in terms of the
9. Thermal
10. Radionuclide
quality, quantity and availability of data, socio-economic setting and
11. Spills
environmental conditions, the achievement of global comparability
12. Loss of ecosystems
required an innovative approach. This was facilitated by focusing
III Habitat and community
13. Modification of ecosystems or ecotones, including community
modification
structure and/or species composition
the assessment on the impacts of fi ve pre-defi ned concerns namely;
Freshwater shortage, Pollution, Habitat and community modifi cation,
14. Overexploitation
15. Excessive by-catch and discards
IV Unsustainable
Unsustainable exploitation of fi sh and other living resources and Global
16. Destructive fishing practices
exploitation of fish and
change, in transboundary waters. Considering the diverse range of
17. Decreased viability of stock through pollution and disease
other living resources
18. Impact on biological and genetic diversity
elements encompassed by each concern, assessing the magnitude of
19. Changes in hydrological cycle
the impacts caused by these concerns was facilitated by evaluating the
20. Sea level change
V Global change
impacts of 22 specifi c issues that were grouped within these concerns
21. Increased uv-b radiation as a result of ozone depletion
22. Changes in ocean CO source/sink function
(see Table 1).
2
THE GIWA METHODOLOGY
vii

political boundaries but were instead, generally defi ned by a large but
T
r
ansboundar
The GIWA approach
discrete drainage basin that also included the coastal marine waters into
which the basin discharges. In many cases, the marine areas examined
1
Scaling
st
W
orkshop
Detailed
during the assessment coincided with the Large Marine Ecosystems
y
D
(LMEs) defi ned by the US National Atmospheric and Oceanographic
iagnostic
A
ssessment
Scoping
Administration (NOAA). As a consequence, scaling should be a
relatively straight-forward task that involves the inspection of the
Analy
boundaries that were proposed for the region during the preparatory
Causal Chain
2
sis
nd
Analysis
phase of GIWA to ensure that they are appropriate and that there are
W
orkshop
no important overlaps or gaps with neighbouring regions. When the
Policy Option
proposed boundaries were found to be inadequate, the boundaries of
Analysis
the region were revised according to the recommendations of experts
from both within the region and from adjacent regions so as to ensure
that any changes did not result in the exclusion of areas from the GIWA.
Once the regional boundary was defi ned, regional teams identifi ed all
SAP
the transboundary elements of the aquatic environment within the
SAP
region and determined if these elements could be assessed as a single
Figure 1
Illustration of the relationship between the GIWA
coherent aquatic system or if there were two or more independent
approach and other projects implemented within the
systems that should be assessed separately.
GEF International Waters (IW) portfolio.
The GIWA is a logical contiguous process that defi nes the geographic
Scoping ş Assessing the GIWA concerns
region to be assessed, identifi es and prioritises particularly problems
Scoping is an assessment of the severity of environmental and socio-
based on the magnitude of their impacts on the environment and
economic impacts caused by each of the fi ve pre-defi ned GIWA concerns
human societies in the region, determines the root causes of those
and their constituent issues (Table 1). It is not designed to provide an
problems and, fi nally, assesses various policy options that addresses
exhaustive review of water-related problems that exist within each region,
those root causes in order to reverse negative trends in the condition
but rather it is a mechanism to identify the most urgent problems in the
of the aquatic environment. These four steps, referred to as Scaling,
region and prioritise those for remedial actions. The priorities determined
Scoping, Causal chain analysis and Policy options analysis, are
by Scoping are therefore one of the main outputs of the GIWA project.
summarised below and are described in their entirety in two volumes:
GIWA Methodology Stage 1: Scaling and Scoping; and GIWA Methodology:
Focusing the assessment on pre-defi ned concerns and issues ensured
Detailed Assessment, Causal Chain Analysis and Policy Options Analysis.
the comparability of the results between diff erent regions. In addition, to
Generally, the components of the GIWA methodology are aligned
ensure the long-term applicability of the options that are developed to
with the framework adopted by the GEF for Transboundary Diagnostic
mitigate these problems, Scoping not only assesses the current impacts
Analyses (TDAs) and Strategic Action Programmes (SAPs) (Figure 1) and
of these concerns and issues but also the probable future impacts
assume a broad spectrum of transboundary infl uences in addition to
according to the "most likely scenario" which considered demographic,
those associated with the physical movement of water across national
economic, technological and other relevant changes that will potentially
borders.
infl uence the aquatic environment within the region by 2020.
Scaling ş Defining the geographic extent
The magnitude of the impacts caused by each issue on the
of the region
environment and socio-economic indicators was assessed over the
Scaling is the fi rst stage of the assessment and is the process by which
entire region using the best available information from a wide range of
the geographic scale of the assessment is defi ned. In order to facilitate
sources and the knowledge and experience of the each of the experts
the implementation of the GIWA, the globe was divided during the
comprising the regional team. In order to enhance the comparability
design phase of the project into 66 contiguous regions. Considering the
of the assessment between diff erent regions and remove biases
transboundary nature of many aquatic resources and the transboundary
in the assessment caused by diff erent perceptions of and ways to
focus of the GIWA, the boundaries of the regions did not comply with
communicate the severity of impacts caused by particular issues, the
viii
REGIONAL ASSESSMENTS
results were distilled and reported as standardised scores according to
Table 2
Example of environmental impact assessment of
Freshwater shortage.
the following four point scale:
Weight
0 = no known impact
Environmental
Environmental issues
Score
Weight %
averaged
concerns
1 = slight impact
score
2
=
moderate
impact
1. Modification of stream flow
1
20
Freshwater shortage
1.50
3 = severe impact
2. Pollution of existing supplies
2
50
The attributes of each score for each issue were described by a detailed
3. Changes in the water table
1
30
set of pre-defi ned criteria that were used to guide experts in reporting
Table 3
Example of Health impacts assessment linked to one of
the results of the assessment. For example, the criterion for assigning
the GIWA concerns.
a score of 3 to the issue Loss of ecosystems or ecotones is: "Permanent
Criteria for Health impacts
Raw score
Score
Weight %
destruction of at least one habitat is occurring such as to have reduced their
Very small
Very large
surface area by >30% during the last 2-3 decades". The full list of criteria is
Number of people affected
2
50
0 1 2 3
presented at the end of the chapter, Table 5a-e. Although the scoring
Minimum
Severe
Degree of severity
2
30
0 1 2 3
inevitably includes an arbitrary component, the use of predefi ned
Occasion/Short
Continuous
Frequency/Duration
2
20
0 1 2 3
criteria facilitates comparison of impacts on a global scale and also
Weight average score for Health impacts
2
encouraged consensus of opinion among experts.
The trade-off associated with assessing the impacts of each concern
After all 22 issues and associated socio-economic impacts have
and their constituent issues at the scale of the entire region is that spatial
been scored, weighted and averaged, the magnitude of likely future
resolution was sometimes low. Although the assessment provides a
changes in the environmental and socio-economic impacts of each
score indicating the severity of impacts of a particular issue or concern
of the fi ve concerns on the entire region is assessed according to the
on the entire region, it does not mean that the entire region suff ers
most likely scenario which describes the demographic, economic,
the impacts of that problem. For example, eutrophication could be
technological and other relevant changes that might infl uence the
identifi ed as a severe problem in a region, but this does not imply that all
aquatic environment within the region by 2020.
waters in the region suff er from severe eutrophication. It simply means
that when the degree of eutrophication, the size of the area aff ected,
In order to prioritise among GIWA concerns within the region and
the socio-economic impacts and the number of people aff ected is
identify those that will be subjected to causal chain and policy options
considered, the magnitude of the overall impacts meets the criteria
analysis in the subsequent stages of the GIWA, the present and future
defi ning a severe problem and that a regional action should be initiated
scores of the environmental and socio-economic impacts of each
in order to mitigate the impacts of the problem.
concern are tabulated and an overall score calculated. In the example
presented in Table 4, the scoping assessment indicated that concern III,
When each issue has been scored, it was weighted according to the relative
Habitat and community modifi cation, was the priority concern in this
contribution it made to the overall environmental impacts of the concern
region. The outcome of this mathematic process was reconciled against
and a weighted average score for each of the fi ve concerns was calculated
the knowledge of experts and the best available information in order
(Table 2). Of course, if each issue was deemed to make equal contributions,
to ensure the validity of the conclusion.
then the score describing the overall impacts of the concern was simply the
arithmetic mean of the scores allocated to each issue within the concern.
In some cases however, this process and the subsequent participatory
In addition, the socio-economic impacts of each of the fi ve major
discussion did not yield consensus among the regional experts
concerns were assessed for the entire region. The socio-economic
regarding the ranking of priorities. As a consequence, further analysis
impacts were grouped into three categories; Economic impacts,
was required. In such cases, expert teams continued by assessing the
Health impacts and Other social and community impacts (Table 3). For
relative importance of present and potential future impacts and assign
each category, an evaluation of the size, degree and frequency of the
weights to each. Afterwards, the teams assign weights indicating the
impact was performed and, once completed, a weighted average score
relative contribution made by environmental and socio-economic
describing the overall socio-economic impacts of each concern was
factors to the overall impacts of the concern. The weighted average
calculated in the same manner as the overall environmental score.
score for each concern is then recalculated taking into account
THE GIWA METHODOLOGY
ix
Table 4
Example of comparative environmental and socio-economic impacts of each major concern, presently and likely in year 2020.
Types of impacts
Environmental score
Economic score
Human health score
Social and community score
Concern
Overall score
Present (a)
Future (b)
Present (c)
Future (d)
Present (e)
Future (f)
Present (g)
Future (h)
Freshwater shortage
1.3
2.3
2.7
2.8
2.6
3.0
1.8
2.2
2.3
Pollution
1.5
2.0
2.0
2.3
1.8
2.3
2.0
2.3
2.0
Habitat and community
2.0
3.0
2.4
3.0
2.4
2.8
2.3
2.7
2.6
modification
Unsustainable exploitation of fish
1.8
2.2
2.0
2.1
2.0
2.1
2.4
2.5
2.1
and other living resources
Global change
0.8
1.0
1.5
1.7
1.5
1.5
1.0
1.0
1.2
the relative contributions of both present and future impacts and
should be regarded as a framework to guide the analysis, rather than
environmental and socio-economic factors. The outcome of these
as a set of detailed instructions. Secondly, in an ideal setting, a causal
additional analyses was subjected to further discussion to identify
chain would be produced by a multidisciplinary group of specialists
overall priorities for the region.
that would statistically examine each successive cause and study its
links to the problem and to other causes. However, this approach (even
Finally, the assessment recognises that each of the fi ve GIWA concerns
if feasible) would use far more resources and time than those available
are not discrete but often interact. For example, pollution can destroy
to GIWA1. For this reason, it has been necessary to develop a relatively
aquatic habitats that are essential for fi sh reproduction which, in turn,
simple and practical analytical model for gathering information to
can cause declines in fi sh stocks and subsequent overexploitation. Once
assemble meaningful causal chains.
teams have ranked each of the concerns and determined the priorities
for the region, the links between the concerns are highlighted in order
Conceptual model
to identify places where strategic interventions could be applied to
A causal chain is a series of statements that link the causes of a problem
yield the greatest benefi ts for the environment and human societies
with its eff ects. Recognising the great diversity of local settings and the
in the region.
resulting diffi
culty in developing broadly applicable policy strategies,
the GIWA CCA focuses on a particular system and then only on those
Causal chain analysis
issues that were prioritised during the scoping assessment. The
Causal Chain Analysis (CCA) traces the cause-eff ect pathways from the
starting point of a particular causal chain is one of the issues selected
socio-economic and environmental impacts back to their root causes.
during the Scaling and Scoping stages and its related environmental
The GIWA CCA aims to identify the most important causes of each
and socio-economic impacts. The next element in the GIWA chain is
concern prioritised during the scoping assessment in order to direct
the immediate cause; defi ned as the physical, biological or chemical
policy measures at the most appropriate target in order to prevent
variable that produces the GIWA issue. For example, for the issue of
further degradation of the regional aquatic environment.
eutrophication the immediate causes may be, inter alia:
Enhanced nutrient inputs;
Root causes are not always easy to identify because they are often
Increased
recycling/mobilisation;
spatially or temporally separated from the actual problems they
Trapping of nutrients (e.g. in river impoundments);
cause. The GIWA CCA was developed to help identify and understand
Run-off and stormwaters
the root causes of environmental and socio-economic problems
in international waters and is conducted by identifying the human
Once the relevant immediate cause(s) for the particular system has
activities that cause the problem and then the factors that determine
(have) been identifi ed, the sectors of human activity that contribute
the ways in which these activities are undertaken. However, because
most signifi cantly to the immediate cause have to be determined.
there is no universal theory describing how root causes interact to
Assuming that the most important immediate cause in our example
create natural resource management problems and due to the great
had been increased nutrient concentrations, then it is logical that the
variation of local circumstances under which the methodology will
most likely sources of those nutrients would be the agricultural, urban
be applied, the GIWA CCA is not a rigidly structured assessment but
or industrial sectors. After identifying the sectors that are primarily
1 This does not mean that the methodology ignores statistical or quantitative studies; as has already been pointed out, the available evidence that justifies the assumption of causal links should
be provided in the assessment.
x
REGIONAL ASSESSMENTS
responsible for the immediate causes, the root causes acting on those
The policy options recommended by the GIWA are only contributions
sectors must be determined. For example, if agriculture was found to
to the larger policy process and, as such, the GIWA methodology
be primarily responsible for the increased nutrient concentrations, the
developed to test the performance of various options under the
root causes could potentially be:
diff erent circumstances has been kept simple and broadly applicable.
Economic (e.g. subsidies to fertilisers and agricultural products);
Legal (e.g. inadequate regulation);
Global International Waters Assessment
Failures in governance (e.g. poor enforcement); or
Technology or knowledge related (e.g. lack of aff ordable substitutes
for fertilisers or lack of knowledge as to their application).
Once the most relevant root causes have been identifi ed, an
explanation, which includes available data and information, of how
they are responsible for the primary environmental and socio-economic
problems in the region should be provided.
Policy option analysis
Despite considerable eff ort of many Governments and other
organisations to address transboundary water problems, the evidence
indicates that there is still much to be done in this endeavour. An
important characteristic of GIWA's Policy Option Analysis (POA) is that
its recommendations are fi rmly based on a better understanding of
the root causes of the problems. Freshwater scarcity, water pollution,
overexploitation of living resources and habitat destruction are very
complex phenomena. Policy options that are grounded on a better
understanding of these phenomena will contribute to create more
eff ective societal responses to the extremely complex water related
transboundary problems. The core of POA in the assessment consists
of two tasks:
Construct policy options
Policy options are simply diff erent courses of action, which are not
always mutually exclusive, to solve or mitigate environmental and
socio-economic problems in the region. Although a multitude of
diff erent policy options could be constructed to address each root
cause identifi ed in the CCA, only those few policy options that have
the greatest likelihood of success were analysed in the GIWA.
Select and apply the criteria on which the policy options will be
evaluated
Although there are many criteria that could be used to evaluate any
policy option, GIWA focuses on:
Eff ectiveness (certainty of result)
Effi
ciency (maximisation of net benefi ts)
Equity (fairness of distributional impacts)
Practical
criteria
(political
acceptability,
implementation
feasibility).
THE GIWA METHODOLOGY
xi
Table 5a: Scoring criteria for environmental impacts of Freshwater shortage
Issue
Score 0 = no known impact
Score 1 = slight impact
Score 2 = moderate impact
Score 3 = severe impact
Issue 1: Modification
No evidence of modification of stream
There is a measurably changing trend in
Significant downward or upward trend
Annual discharge of a river altered by more
of stream flow
flow.
annual river discharge at gauging stations
(more than 20% of the long term mean) in
than 50% of long term mean; or
"An increase or decrease
in a major river or tributary (basin >
annual discharges in a major river or tributary Loss of >50% of riparian or deltaic
in the discharge of
40 000 km2); or
draining a basin of >250 000 km2; or
wetlands over a period of not less than
streams and rivers
There is a measurable decrease in the area
Loss of >20% of flood plain or deltaic
40 years (through causes other than
as a result of human
of wetlands (other than as a consequence
wetlands through causes other than
conversion or artificial embankment); or
interventions on a local/
of conversion or embankment
conversion or artificial embankments; or
Significant increased siltation or erosion
regional scale (see Issue
construction); or
Significant loss of riparian vegetation (e.g.
due to changing in flow regime (other than
19 for flow alterations
There is a measurable change in the
trees, flood plain vegetation); or
normal fluctuations in flood plain rivers);
resulting from global
interannual mean salinity of estuaries or
Significant saline intrusion into previously
or
change) over the last 3-4
coastal lagoons and/or change in the mean
freshwater rivers or lagoons.
Loss of one or more anadromous or
decades."
position of estuarine salt wedge or mixing
catadromous fish species for reasons
zone; or
other than physical barriers to migration,
Change in the occurrence of exceptional
pollution or overfishing.
discharges (e.g. due to upstream
damming.
Issue 2: Pollution of
No evidence of pollution of surface and
Any monitored water in the region does
Water supplies does not meet WHO or
River draining more than 10% of the basin
existing supplies
ground waters.
not meet WHO or national drinking water
national drinking water standards in more
have suffered polysaprobic conditions, no
"Pollution of surface
criteria, other than for natural reasons; or
than 30% of the region; or
longer support fish, or have suffered severe
and ground fresh waters
There have been reports of one or more
There are one or more reports of fish kills
oxygen depletion
supplies as a result of
fish kills in the system due to pollution
due to pollution in any river draining a
Severe pollution of other sources of
point or diffuse sources"
within the past five years.
basin of >250 000 km2 .
freshwater (e.g. groundwater)
Issue 3: Changes in
No evidence that abstraction of water from Several wells have been deepened because Clear evidence of declining base flow in
Aquifers are suffering salinisation over
the water table
aquifers exceeds natural replenishment.
of excessive aquifer draw-down; or
rivers in semi-arid areas; or
regional scale; or
"Changes in aquifers
Several springs have dried up; or
Loss of plant species in the past decade,
Perennial springs have dried up over
as a direct or indirect
Several wells show some salinisation.
that depend on the presence of ground
regionally significant areas; or
consequence of human
water; or
Some aquifers have become exhausted
activity"
Wells have been deepened over areas of
hundreds of km2;or
Salinisation over significant areas of the
region.
Table 5b: Scoring criteria for environmental impacts of Pollution
Issue
Score 0 = no known impact
Score 1 = slight impact
Score 2 = moderate impact
Score 3 = severe impact
Issue 4:
Normal incidence of bacterial related
There is minor increase in incidence of
Public health authorities aware of marked
There are large closure areas or very
Microbiological
gastroenteric disorders in fisheries product
bacterial related gastroenteric disorders
increase in the incidence of bacterial
restrictive advisories affecting the
pollution
consumers and no fisheries closures or
in fisheries product consumers but no
related gastroenteric disorders in fisheries
marketability of fisheries products; or
"The adverse effects of
advisories.
fisheries closures or advisories.
product consumers; or
There exists widespread public or tourist
microbial constituents of
There are limited area closures or
awareness of hazards resulting in
human sewage released
advisories reducing the exploitation or
major reductions in the exploitation or
to water bodies."
marketability of fisheries products.
marketability of fisheries products.
Issue 5:
No visible effects on the abundance and
Increased abundance of epiphytic algae; or
Increased filamentous algal production
High frequency (>1 event per year), or
Eutrophication
distributions of natural living resource
A statistically significant trend in
resulting in algal mats; or
intensity, or large areas of periodic hypoxic
"Artificially enhanced
distributions in the area; and
decreased water transparency associated
Medium frequency (up to once per year)
conditions, or high frequencies of fish and
primary productivity in
No increased frequency of hypoxia1 or
with algal production as compared with
of large-scale hypoxia and/or fish and
zoobenthos mortality events or harmful
receiving water basins
fish mortality events or harmful algal
long-term (>20 year) data sets; or
zoobenthos mortality events and/or
algal blooms; or
related to the increased
blooms associated with enhanced primary
Measurable shallowing of the depth range
harmful algal blooms.
Significant changes in the littoral
availability or supply
production; and
of macrophytes.
community; or
of nutrients, including
No evidence of periodically reduced
Presence of hydrogen sulphide in
cultural eutrophication
dissolved oxygen or fish and zoobenthos
historically well oxygenated areas.
in lakes."
mortality; and
No evident abnormality in the frequency of
algal blooms.
xii
REGIONAL ASSESSMENTS
Issue 6: Chemical
No known or historical levels of chemical
Some chemical contaminants are
Some chemical contaminants are above
Chemical contaminants are above
pollution
contaminants except background levels of
detectable but below threshold limits
threshold limits defined for the country or
threshold limits defined for the country or
"The adverse effects of
naturally occurring substances; and
defined for the country or region; or
region; or
region; and
chemical contaminants
No fisheries closures or advisories due to
Restricted area advisories regarding
Large area advisories by public health
Public health and public awareness of
released to standing or
chemical pollution; and
chemical contamination of fisheries
authorities concerning fisheries product
fisheries contamination problems with
marine water bodies
No incidence of fisheries product tainting;
products.
contamination but without associated
associated reductions in the marketability
as a result of human
and
catch restrictions or closures; or
of such products either through the
activities. Chemical
No unusual fish mortality events.
If there is no available data use the following
High mortalities of aquatic species near
imposition of limited advisories or by area
contaminants are
criteria:
outfalls.
closures of fisheries; or
here defined as
If there is no available data use the following
Some use of pesticides in small areas; or
Large-scale mortalities of aquatic species.
compounds that are
criteria:
Presence of small sources of dioxins or
If there is no available data use the following
toxic or persistent or
No use of pesticides; and
furans (e.g., small incineration plants or
criteria:
If there is no available data use the following
bioaccumulating."
No sources of dioxins and furans; and
bleached kraft/pulp mills using chlorine);
Large-scale use of pesticides in agriculture
criteria:
No regional use of PCBs; and
or
and forestry; or
Indications of health effects resulting
No bleached kraft pulp mills using chlorine Some previous and existing use of PCBs
Presence of major sources of dioxins or
from use of pesticides; or
bleaching; and
and limited amounts of PCB-containing
furans such as large municipal or industrial Known emissions of dioxins or furans from
No use or sources of other contaminants.
wastes but not in amounts invoking local
incinerators or large bleached kraft pulp
incinerators or chlorine bleaching of pulp;
concerns; or
mills; or
or
Presence of other contaminants.
Considerable quantities of waste PCBs in
Known contamination of the environment
the area with inadequate regulation or has
or foodstuffs by PCBs; or
invoked some public concerns; or
Known contamination of the environment
Presence of considerable quantities of
or foodstuffs by other contaminants.
other contaminants.
Issue 7: Suspended
No visible reduction in water transparency; Evidently increased or reduced turbidity
Markedly increased or reduced turbidity
Major changes in turbidity over wide or
solids
and
in streams and/or receiving riverine and
in small areas of streams and/or receiving
ecologically significant areas resulting
"The adverse effects of
No evidence of turbidity plumes or
marine environments but without major
riverine and marine environments; or
in markedly changed biodiversity or
modified rates of release
increased siltation; and
changes in associated sedimentation or
Extensive evidence of changes in
mortality in benthic species due to
of suspended particulate No evidence of progressive riverbank,
erosion rates, mortality or diversity of flora
sedimentation or erosion rates; or
excessive sedimentation with or without
matter to water bodies
beach, other coastal or deltaic erosion.
and fauna; or
Changes in benthic or pelagic biodiversity
concomitant changes in the nature of
resulting from human
Some evidence of changes in benthic or
in areas due to sediment blanketing or
deposited sediments (i.e., grain-size
activities"
pelagic biodiversity in some areas due
increased turbidity.
composition/redox); or
to sediment blanketing or increased
Major change in pelagic biodiversity or
turbidity.
mortality due to excessive turbidity.
Issue 8: Solid wastes
No noticeable interference with trawling
Some evidence of marine-derived litter on
Widespread litter on beaches giving rise to
Incidence of litter on beaches sufficient
"Adverse effects
activities; and
beaches; or
public concerns regarding the recreational
to deter the public from recreational
associated with the
No noticeable interference with the
Occasional recovery of solid wastes
use of beaches; or
activities; or
introduction of solid
recreational use of beaches due to litter;
through trawling activities; but
High frequencies of benthic litter recovery
Trawling activities untenable because of
waste materials into
and
Without noticeable interference with
and interference with trawling activities;
benthic litter and gear entanglement; or
water bodies or their
No reported entanglement of aquatic
trawling and recreational activities in
or
Widespread entanglement and/or
environs."
organisms with debris.
coastal areas.
Frequent reports of entanglement/
suffocation of aquatic species by litter.
suffocation of species by litter.
Issue 9: Thermal
No thermal discharges or evidence of
Presence of thermal discharges but
Presence of thermal discharges with large
Presence of thermal discharges with large
"The adverse effects
thermal effluent effects.
without noticeable effects beyond
mixing zones having reduced productivity
mixing zones with associated mortalities,
of the release of
the mixing zone and no significant
or altered biodiversity; or
substantially reduced productivity or
aqueous effluents at
interference with migration of species.
Evidence of reduced migration of species
noticeable changes in biodiversity; or
temperatures exceeding
due to thermal plume.
Marked reduction in the migration of
ambient temperature
species due to thermal plumes.
in the receiving water
body."
Issue 10: Radionuclide No radionuclide discharges or nuclear
Minor releases or fallout of radionuclides
Minor releases or fallout of radionuclides
Substantial releases or fallout of
"The adverse effects of
activities in the region.
but with well regulated or well-managed
under poorly regulated conditions that do
radionuclides resulting in excessive
the release of radioactive
conditions complying with the Basic Safety
not provide an adequate basis for public
exposures to humans or animals in relation
contaminants and
Standards.
health assurance or the protection of
to those recommended under the Basic
wastes into the aquatic
aquatic organisms but without situations
Safety Standards; or
environment from
or levels likely to warrant large scale
Some indication of situations or exposures
human activities."
intervention by a national or international
warranting intervention by a national or
authority.
international authority.
Issue 11: Spills
No evidence of present or previous spills of
Some evidence of minor spills of hazardous Evidence of widespread contamination
Widespread contamination by hazardous
"The adverse effects
hazardous material; or
materials in small areas with insignificant
by hazardous or aesthetically displeasing
or aesthetically displeasing materials
of accidental episodic
No evidence of increased aquatic or avian
small-scale adverse effects one aquatic or
materials assumed to be from spillage
from frequent spills resulting in major
releases of contaminants
species mortality due to spills.
avian species.
(e.g. oil slicks) but with limited evidence of
interference with aquatic resource
and materials to the
widespread adverse effects on resources or
exploitation or coastal recreational
aquatic environment
amenities; or
amenities; or
as a result of human
Some evidence of aquatic or avian species
Significant mortality of aquatic or avian
activities."
mortality through increased presence of
species as evidenced by large numbers of
contaminated or poisoned carcasses on
contaminated carcasses on beaches.
beaches.
THE GIWA METHODOLOGY
xiii
Table 5c: Scoring criteria for environmental impacts of Habitat and community modification
Issue
Score 0 = no known impact
Score 1 = slight impact
Score 2 = moderate impact
Score 3 = severe impact
Issue 12: Loss of ecosystems or
There is no evidence of loss of
There are indications of fragmentation Permanent destruction of at least one
Permanent destruction of at least one
ecotones
ecosystems or habitats.
of at least one of the habitats.
habitat is occurring such as to have
habitat is occurring such as to have
"The complete destruction of aquatic
reduced their surface area by up to 30
reduced their surface area by >30%
habitats. For the purpose of GIWA
% during the last 2-3 decades.
during the last 2-3 decades.
methodology, recent loss will be
measured as a loss of pre-defined
habitats over the last 2-3 decades."
Issue 13: Modification of
No evidence of change in species
Evidence of change in species
Evidence of change in species
Evidence of change in species
ecosystems or ecotones, including
complement due to species extinction
complement due to species extinction
complement due to species extinction
complement due to species extinction
community structure and/or species
or introduction; and
or introduction
or introduction; and
or introduction; and
composition
No changing in ecosystem function
Evidence of change in population
Evidence of change in population
"Modification of pre-defined habitats
and services.
structure or change in functional group
structure or change in functional group
in terms of extinction of native species,
composition or structure
composition or structure; and
occurrence of introduced species and
Evidence of change in ecosystem
changing in ecosystem function and
services2.
services over the last 2-3 decades."
2 Constanza, R. et al. (1997). The value of the world ecosystem services and natural capital, Nature 387:253-260.
Table 5d: Scoring criteria for environmental impacts of Unsustainable exploitation of fish and other
living resources
Issue
Score 0 = no known impact
Score 1 = slight impact
Score 2 = moderate impact
Score 3 = severe impact
Issue 14: Overexploitation
No harvesting exists catching fish
Commercial harvesting exists but there One stock is exploited beyond MSY
More than one stock is exploited
"The capture of fish, shellfish or marine
(with commercial gear for sale or
is no evidence of over-exploitation.
(maximum sustainable yield) or is
beyond MSY or is outside safe
invertebrates at a level that exceeds the
subsistence).
outside safe biological limits.
biological limits.
maximum sustainable yield of the stock."
Issue 15: Excessive by-catch and
Current harvesting practices show no
Up to 30% of the fisheries yield (by
30-60% of the fisheries yield consists
Over 60% of the fisheries yield is
discards
evidence of excessive by-catch and/or
weight) consists of by-catch and/or
of by-catch and/or discards.
by-catch and/or discards; or
"By-catch refers to the incidental capture
discards.
discards.
Noticeable incidence of capture of
of fish or other animals that are not the
endangered species.
target of the fisheries. Discards refers
to dead fish or other animals that are
returned to the sea."
Issue 16: Destructive fishing
No evidence of habitat destruction due Habitat destruction resulting in
Habitat destruction resulting in
Habitat destruction resulting in
practices
to fisheries practices.
changes in distribution of fish or
moderate reduction of stocks or
complete collapse of a stock or far
"Fishing practices that are deemed to
shellfish stocks; or
moderate changes of the environment;
reaching changes in the environment;
produce significant harm to marine,
Trawling of any one area of the seabed
or
or
lacustrine or coastal habitats and
is occurring less than once per year.
Trawling of any one area of the seabed
Trawling of any one area of the seabed
communities."
is occurring 1-10 times per year; or
is occurring more than 10 times per
Incidental use of explosives or poisons
year; or
for fishing.
Widespread use of explosives or
poisons for fishing.
Issue 17: Decreased viability of
No evidence of increased incidence of
Increased reports of diseases without
Declining populations of one or more
Collapse of stocks as a result of
stocks through contamination and
fish or shellfish diseases.
major impacts on the stock.
species as a result of diseases or
diseases or contamination.
disease
contamination.
"Contamination or diseases of feral (wild)
stocks of fish or invertebrates that are a
direct or indirect consequence of human
action."
Issue 18: Impact on biological and
No evidence of deliberate or accidental Alien species introduced intentionally
Measurable decline in the population
Extinction of native species or local
genetic diversity
introductions of alien species; and
or accidentally without major changes
of native species or local stocks as a
stocks as a result of introductions
"Changes in genetic and species diversity No evidence of deliberate or accidental
in the community structure; or
result of introductions (intentional or
(intentional or accidental); or
of aquatic environments resulting from
introductions of alien stocks; and
Alien stocks introduced intentionally
accidental); or
Major changes (>20%) in the genetic
the introduction of alien or genetically
No evidence of deliberate or accidental
or accidentally without major changes
Some changes in the genetic
composition of stocks (e.g. as a result
modified species as an intentional or
introductions of genetically modified
in the community structure; or
composition of stocks (e.g. as a result
of escapes from aquaculture replacing
unintentional result of human activities
species.
Genetically modified species
of escapes from aquaculture replacing
the wild stock).
including aquaculture and restocking."
introduced intentionally or
the wild stock).
accidentally without major changes in
the community structure.
xiv
REGIONAL ASSESSMENTS
Table 5e: Scoring criteria for environmental impacts of Global change
Issue
Score 0 = no known impact
Score 1 = slight impact
Score 2 = moderate impact
Score 3 = severe impact
Issue 19: Changes in hydrological
No evidence of changes in hydrological Change in hydrological cycles due
Significant trend in changing
Loss of an entire habitat through
cycle and ocean circulation
cycle and ocean/coastal current due to
to global change causing changes
terrestrial or sea ice cover (by
desiccation or submergence as a result
"Changes in the local/regional water
global change.
in the distribution and density of
comparison with a long-term time
of global change; or
balance and changes in ocean and coastal
riparian terrestrial or aquatic plants
series) without major downstream
Change in the tree or lichen lines; or
circulation or current regime over the
without influencing overall levels of
effects on river/ocean circulation or
Major impacts on habitats or
last 2-3 decades arising from the wider
productivity; or
biological diversity; or
biodiversity as the result of increasing
problem of global change including
Some evidence of changes in ocean
Extreme events such as flood and
frequency of extreme events; or
ENSO."
or coastal currents due to global
drought are increasing; or
Changing in ocean or coastal currents
change but without a strong effect on
Aquatic productivity has been altered
or upwelling regimes such that plant
ecosystem diversity or productivity.
as a result of global phenomena such
or animal populations are unable to
as ENSO events.
recover to their historical or stable
levels; or
Significant changes in thermohaline
circulation.
Issue 20: Sea level change
No evidence of sea level change.
Some evidences of sea level change
Changed pattern of coastal erosion due Major loss of coastal land areas due to
"Changes in the last 2-3 decades in the
without major loss of populations of
to sea level rise has became evident; or
sea-level change or sea-level induced
annual/seasonal mean sea level as a
organisms.
Increase in coastal flooding events
erosion; or
result of global change."
partly attributed to sea-level rise
Major loss of coastal or intertidal
or changing prevailing atmospheric
populations due to sea-level change or
forcing such as atmospheric pressure
sea level induced erosion.
or wind field (other than storm
surges).
Issue 21: Increased UV-B radiation as No evidence of increasing effects
Some measurable effects of UV/B
Aquatic community structure is
Measured/assessed effects of UV/B
a result of ozone depletion
of UV/B radiation on marine or
radiation on behavior or appearance of
measurably altered as a consequence
irradiation are leading to massive loss
"Increased UV-B flux as a result polar
freshwater organisms.
some aquatic species without affecting
of UV/B radiation; or
of aquatic communities or a significant
ozone depletion over the last 2-3
the viability of the population.
One or more aquatic populations are
change in biological diversity.
decades."
declining.
Issue 22: Changes in ocean CO
No measurable or assessed changes
Some reasonable suspicions that
Some evidences that the impacts
Evidences that the changes in
2
source/sink function
in CO source/sink function of aquatic
current global change is impacting the
of global change have altered the
source/sink function of the aquatic
2
"Changes in the capacity of aquatic
system.
aquatic system sufficiently to alter its
source/sink function for CO of aquatic
systems in the region are sufficient to
2
systems, ocean as well as freshwater, to
source/sink function for CO .
systems in the region by at least 10%.
cause measurable change in global CO
2
2
generate or absorb atmospheric CO as a
balance.
2
direct or indirect consequence of global
change over the last 2-3 decades."
THE GIWA METHODOLOGY
xv