

Global International
Waters Assessment
Regional assessments
Other reports in this series:
Russian Arctic ş GIWA Regional assessment 1a
Caribbean Sea/Small Islands ş GIWA Regional assessment 3a
Caribbean Islands ş GIWA Regional assessment 4
Barents Sea ş GIWA Regional assessment 11
Baltic Sea ş GIWA Regional assessment 17
Caspian Sea ş GIWA Regional assessment 23
Aral Sea ş GIWA Regional assessment 24
Gulf of California/Colorado River Basin ş GIWA Regional assessment 27
Sea of Okhotsk ş GIWA Regional assessment 30
Oyashio Current ş GIWA Regional assessment 31
Yellow Sea ş GIWA Regional assessment 34
East China Sea ş GIWA Regional assessment 36
Patagonian Shelf ş GIWA Regional assessment 38
Brazil Current ş GIWA Regional assessment 39
Amazon Basin ş GIWA Regional assessment 40b
Canary Current ş GIWA Regional assessment 41
Guinea Current ş GIWA Regional assessment 42
Lake Chad Basin ş GIWA Regional assessment 43
Benguela Current ş GIWA Regional assessment 44
Indian Ocean Islands ş GIWA Regional assessment 45b
South China Sea ş GIWA Regional assessment 54
Mekong River ş GIWA Regional assessment 55
Sulu-Celebes (Sulawesi) Sea ş GIWA Regional assessment 56
Indonesian Seas ş GIWA Regional assessment 57
Pacifi c Islands ş GIWA Regional assessment 62
Humboldt Current ş GIWA Regional assessment 64
Global International
Waters Assessment
Regional assessment 47
East African Rift Valley Lakes
GIWA report production
Series editor: Ulla Li Zweifel
Report editor: Ulla Li Zweifel
Editorial assistance: Johanna Egerup, Malin Karlsson,
Kristin Bertilius and Russel Arthurton
Maps & GIS: Niklas Holmgren
Design & graphics: Joakim Palmqvist
Global International Waters Assessment
East African Rift Valley Lakes, GIWA Regional assessment 47
Published by the University of Kalmar on behalf of
United Nations Environment Programme
ę 2006 United Nations Environment Programme
ISSN 1651-940X
This report has been revised and updated since its fi rst publication 2003.
University of Kalmar
SE-391 82 Kalmar
Sweden
United Nations Environment Programme
PO Box 30552,
Nairobi, Kenya
This publication may be reproduced in whole or in part and in any form for
educational or non-profi t purposes without special permission from the
copyright holder, provided acknowledgement of the source is made. No
use of this publication may be made for resale or for any other commercial
purpose whatsoever without prior permission in writing from the United
Nations Environment Programme.
CITATIONS
When citing this report, please use:
UNEP, 2004. Odada, E.O., Olago, D., Kulindwa, K.A.A., Bugenyi, F., West,
K., Ntiba, M., Wandiga, S. and Karimumuryango, J. East African Rift Valley
Lakes, GIWA Regional assessment 47.
University of Kalmar, Kalmar, Sweden.
DISCLAIMER
The views expressed in this publication are those of the authors and do
not necessarily refl ect those of UNEP. The designations employed and the
presentations do not imply the expressions of any opinion whatsoever
on the part of UNEP or cooperating agencies concerning the legal status
of any country, territory, city or areas or its authority, or concerning the
delimitation of its frontiers or boundaries.
This publication has been peer-reviewed and the information herein
is believed to be reliable, but the publisher does not warrant its
completeness or accuracy.
Publishing house: Kirjastusaktsiaselts MATS, Tallinn
Printed in Estonia by Tallinna RaamatutrŘkikoda, 2006
Contents
Executive summary
9
Abbreviations and acronyms
12
Boundaries of the East African Rift Valley Lakes region
15
Regional defi nition
15
Physical characteristics
16
Socio-economic characteristics
28
Assessment 37
Lake Turkana Basin
Freshwater shortage
38
Pollution
40
Habitat and community modifi cation
42
Unsustainable exploitation of fi sh and other living resources
43
Global change
44
Priority concerns
45
Lake Victoria Basin
Freshwater shortage
47
Pollution
49
Habitat and community modifi cation
53
Unsustainable exploitation of fi sh and other living resources
55
Global change
59
Priority concerns
60
Lake Tanganyika Basin
Freshwater shortage
61
Pollution
62
Habitat and community modifi cation
64
Unsustainable exploitation of fi sh and other living resources
66
Global change
68
Priority concerns
69
Lake Malawi Basin
Freshwater shortage
70
Pollution
71
Habitat and community modifi cation
73
Unsustainable exploitation of fi sh and other living resources
76
Global change
78
Priority concerns
79
CONTENTS
Causal chain analysis
81
Methodology
81
Unsustainable exploitation of fi sh and other living resources
82
Pollution
87
Summary of the analysis
93
Policy options
94
Problem defi nition
94
Options
97
Recommended policy options
102
Conclusions and recommendations
102
References 103
Annexes 116
Annex I List of contributing authors and organisations involved
116
Annex II Detailed scoring tables
117
Annex III Causal chain analysis ş Outline of the process
133
Annex IV List of important water-related programmes and assessments in the region
136
Annex V List of conventions and specifi c laws that aff ect water use in the region
137
Annex VI Addendum: A Journalists Diary for a Lake Victoria Tour
138
The Global International Waters Assessment
i
The GIWA methodology
vii
GIWA REGIONAL ASSESSMENT 47 EAST AFRICAN RIFT VALLEY LAKES
Executive summary
The East African Rift Valley Lakes (EARVL), GIWA region 47, runs from
570 m, with a maximum depth of 1 470 m, making it the world's second
the northern end of Lake Turkana Basin to the southern tip of the Lake
deepest lake. The lake drains westwards through the Lukuga River into
Malawi/Nyasa Basin and includes all the natural habitat and associated
the basin of the Congo River. Lake Malawi is long and narrow, the fourth
human communities found within the Rift Valley and on the adjacent
deepest inland water body in the world (700 m) and the world's fourth
escarpments (Figure 1). It encompasses parts of the following countries;
largest body of freshwater. It drains southwards via the Shire River to
Ethiopia, Kenya, Sudan, Uganda, Tanzania, Rwanda, Burundi, Democratic
the Zambezi Basin.
Republic of Congo (DR Congo), Zambia, Malawi and Mozambique. The
main lakes include Victoria, Tanganyika, Malawi, Turkana, Albert, Edward,
Lakes Victoria, Tanganyika and Malawi are famous for their endemic
George and Kivu. All are tropical and together comprise the African
species fl ocks of cichlid fi shes. Lake Tanganykia hosts a large fl ock,
Great Lakes ecoregion. However, each lake lies within its own separate
estimated to include more than 700 cichlid fi sh species (Snoeks 2000).
drainage basin, with its own assemblage of endemic organisms, most
Lake Malawi's total fi sh fauna comprises some 800 species, more than
notably the cichlid fi sh species-fl ocks. Each lake diff ers substantially
any other lake in the world, and nearly all of its cichlids are endemic
with respect to limnology, catchment dynamics and human impacts
(Ribbink 2001). Lake Victoria's formerly rich cichlid fauna has become
(Hamilton 1982).
drastically reduced in recent decades.
For the purpose of GIWA assessment, the following lakes that are
The EARVL region is home to some of the poorest communities in the
characteristic of most of the transboundary water bodies in the
world. Most of the Lake Turkana Basin is populated with pastoralists,
region were selected for the exercise: Lake Turkana, Lake Victoria, Lake
mostly nomadic, but a few are fi shermen. The lower Omo Valley supports
Tanganyika and Lake Malawi. These are the largest of the East African
subsistence agriculturalists in the north and agro-pastoralists in the
Rift Valley lakes and are among the oldest lakes in the world. All these
south extending to the Kenya border. In the catchment area as a whole,
lakes are extremely sensitive to climate change.
the population is estimated at 15.2 million out of which 12.3 million live in
the Ethiopian part of the catchment. The Basin is the poorest and has the
Lake Turkana, the largest closed-basin lake is up to 115 m deep,
lowest population density and economic activity of all the other large
moderately saline and alkaline, and lies in a topographically closed
lake basins of the region. The Lake Victoria Basin is the most heavily
basin located in the arid northwestern part of Kenya, though the
populated basin, and supports one of the densest rural populations
delta of the Omo River, the principal affl
uent, lies within southwestern
in the world. An estimated population of roughly 30 million people
Ethiopia. Lake Victoria is, by area, the second largest lake in the world
whose incomes are estimated to lie within the ranges of 90-270 USD
and the largest in Africa, though relatively shallow, with a maximum
per capita per year live in the Basin. The catchment is mainly agricultural,
depth of 80-90 m. More than 80% of its water input is derived directly
though most of the population living along the lakeshore relies directly
from rainfall on the lake surface, and about 7% fl ows from the western
or indirectly on the fi shing trade. An estimated 10 million people reside
side of the basin through the Kagera River. It is drained by the Nile River
in the Lake Tanganyika catchment (UNDP 2000); outside urban centres,
from Owen Falls on its northern rim. Lake Tanganyika is the longest lake
subsistence and small-scale commercial fi shing and farming dominate
in the world (673 km) though only 12ş90 km wide. Its average depth is
people's livelihoods (Quan 1996, Meadows & Zwick 2000). In the Lake
EXECUTIVE SUMMARY
9
Malawi Basin, Malawi's land area is densely populated at 116 persons
the concern Unsustainable exploitation of fi sheries and other living
per km2 (UNEP-IETC 2003) representing 80% of the total lakeshore
resources, overexploitation and destructive fi shing practices were
population (World Bank 2003).
identifi ed as key issues; under the concern Pollution, the important
issues identifi ed were microbiological, eutrophication, chemical and
It is only during the past 10 years or so that the East African countries
suspended solids. It was, however, noted that the issue "suspended
have instituted, at government level, policies on the environment
solids" had several components that were interrelated with the
that adopt an integrated and sustainable approach to environmental
microbiological, eutrophication and chemical issues, having both
management. New national environmental policies/acts have been
synergistic and cumulative eff ects in their association. The suspended
enacted in both Ethiopia (1997) and Kenya (1999), and environmental
solids issue was, therefore, nested in the microbiological, eutrophication
authorities have been set up to implement the policies which seek to
and chemical issues.
promote sustainable environmental management and development.
The new Kenya Water Act (2002) provides for the establishment
In the Causal chain analysis for Lake Victoria, the root cause of
of Water Resources Management Authorities that will have wide-
Unsustainable exploitation of fi sh resources was identifi ed as the
ranging powers to manage and protect water resources at river or lake
existence of a market for fi sh, both domestic and, more importantly,
basin scales. International conventions and agreements that Kenya,
export. Other root causes are inadequate regulation, poverty, poor
Uganda and Tanzania are signatories to, or subscribe to, include:
institutional and legal arrangements, low civic education and
Technical Cooperation for the Promotion of the Development and
awareness, low management capacity by communities, availability
Environmental Protection of the Nile Basin (Tecconile), Initiative for
of market for undersized fi sh, and corruption. Whereas these root
Nile Basin Management, the Convention for the Establishment of the
causes lead to unsustainable exploitation practices for subsistence
Lake Victoria Fisheries Organisation (LVFO), the Agreement on the
fi shing, in most cases profi t is the main factor driving the process. The
Preparation of a Tripartite Management Program for Lake Victoria,
environmental degradation of the Lake Victoria Basin over the last three
and the Treaty establishing the EAC. The international conventions
decades (due to high population, massive algal blooms, water-borne
and agreements include: the Convention on Wetlands of International
diseases, water hyacinth infestation, oxygen depletion, introduction of
Importance (Ramsar), the Convention for International Trade in
alien fi sh species etc.) has been determined as placing a present value of
Endangered Species of Wild Fauna and Flora (CITES), the Convention
270ş520 million USD at risk to the lake communities, if the large export
on Conservation of Biological Diversity, and the Code of Conduct for
fi shery for Nile perch was lost (World Bank 1996). The collapse of the
Responsible Fisheries (CCRF).
Nile perch fi shery may become a reality sooner rather than later in the
event that things are left in a "business as usual" scenario.
The assessment identifi ed the priority GIWA concerns for Lake Turkana
as Habitat and community modifi cation and freshwater shortage;
The principal causes of Pollution in Lake Victoria lie in its catchment
for Lake Victoria the priorities were Pollution and Unsustainable
areas in both urban and rural settings. The role of the Kagera River as
exploitation of fi sh and other living resources; and for the lakes
a main contributor of suspended solids, nutrients and water hyacinth
Tanganykia and Malawi the priority concerns were identifi ed as
is an extremely important consideration when evaluating policy
Unsustainable exploitation of fi sh and other living resources and Habitat
options for sustainable management of the Lake. Untreated industrial
and community modifi cation.
and municipal effl
uent together with agricultural run-off are the main
contributors of microbiological and chemical pollution and are a
The Lake Victoria Basin was chosen for Causal chain and Policy options
source of nutrients contributing to eutrophication, while suspended
analyses on account of the diverse, linked issues and complexities
solids are derived from erosion of degraded catchments, riverbanks and
that have contributed to its environmental degradation, as well as
lake-edge environments due to poor agricultural practices and high
the interventions that have been initiated in order to address and
grazing intensities. All these contaminants make the Lake water unfi t for
mitigate the environmental degradation. Because of the similarity
recreation, consumption and other uses, unless a huge processing cost
of environmental problems aff ecting the East African Great Lakes, as
is incurred. Pollution destroys habitats for freshwater life forms while at
well as similarities in the socio-political, economic and health status
the same time making them unavailable for nutritional purposes. For the
of the various riparian countries, the Lake Victoria Causal chain and
majority of people living by the lake shore and subsisting by fi shing, this
Policy options analyses presented in this report are considered to be
implies that malnutrition and health problems will entrench themselves
applicable to the other basins of the region. For Lake Victoria, under
and exacerbate the deepening poverty among their ranks.
10
GIWA REGIONAL ASSESSMENT 47 EAST AFRICAN RIFT VALLEY LAKES
The feasibility of policy options in the Lake Victoria is looked upon
Revision of regulations in urban planning that have not taken into
in conjunction with the establishment of the regional integration of
account environmental issues, and improvement of monitoring and
the East African Community (EAC 2000). The East African Community
enforcement;
off ers a good prospect for the success of the proposed policies, in that
Improvement of natural resource management and farming
it provides a conducive environment for Kenya, Uganda and Tanzania
practices through training, governance and agricultural
to work together towards common goals. Some means are required in
technology;
order to incorporate both Burundi and Rwanda in the management
Stronger vetting of technology promoted by national and
structure of the Lake since, even though they do not share the lake
international agencies;
shore, they form a signifi cant part of the Lake's catchment area and are
Strengthening enforcement of regulations for mandatory effl
uent
a principal polluter, being the source of the highest sediment load and
treatment in municipalities and industries;
the original entry point for water hyacinth.
Incorporating all stakeholders in the drafting of regulations and in
monitoring and enforcing agreed regulations;
Policy options that address overexploitation of fi sh are:
Integration of institutional framework, regulations and laws at two
Quota for fi shing
levels: national and regional;
Quota for processing
Creation of a public complaints institution with powers to
Review of the rules and regulations and existing policies
investigate and recommend prosecution;
Civic education and awareness
Enforcing compliance with international conventions e.g. Ramsar,
CITES, and the Biological Diversity Convention of Agenda 21;
Policy options that address destructive fi shing practices are:
Strengthening the capacity of National Environmental Protection
Strengthening monitoring and enforcement of restrictions;
Authorities to enable a more eff ective enactment of legislation by
enforcing the rule of law;
providing trained manpower and suffi
cient funding.
Provision of civic education and awareness; empowering and
involving more communities in management;
The successful implementation of these policy options will never be
Imposing size restrictions on fi sh processing factories;
achieved without involving, in a participatory manner, the communities
Provision of credit to artisanal fi shers.
living on the lake shores who depend on fi shing as a source of
subsistence livelihood and income generation. Capacity building in
Policy options that address the issues of pollution are:
terms of civic education and leadership and management skills will
Accreditation of analytical laboratories for standards enforcement;
enhance this empowerment.
Liberalisation of waste disposal activities to involve the private
sector and communities;
EXECUTIVE SUMMARY
11
Abbreviations and acronyms
BMU Beach
Management
Unit
LVEMP
Lake Victoria Environmental Management Project
BOD
Biological Oxygen Demand
LVFO
Lake Victoria Fisheries Organisation
CCRF
Code of Conduct for Responsible Fisheries
LVFRP
Lake Victoria Fisheries Research Project
CITES
Convention on International Trade in Endangered Species
LVRLAC
Lake Victoria Regional Local Authorities Cooperation
CPUE
Catch per Unit Eff ort
MCS
Monitoring Control and Surveillance
DRC
Democratic Republic of Congo
MSY Maximum
Sustainable
Yield
EAC
East African Community
NEMC
National Environmental Management Council
EARVL
East African Rift Valley Lakes
NTU Nephelometric
Turbidity
Unit
EIA
Environmental Impact Assessment
PA Protected
Area
ENSO El-Ni˝o-Southern
Oscillation
PPP Purchasing
Power
Parity
EU European
Union
QC Quality
Control
GEF
Global Environment Facility
RRA Rapid
Rural
Appraisal
GDP Gross
Domestic
Product
SADC
Southern Africa Development Community
GNP Gross
National
Product
SAP Strategic
Action
Programme
HACCP
Hazard Analysis Critical Control Point
SSOP
Sanitation Standard Operating Procedures
HDI Human
Development
Index
SST Sea-Surface
Temperature
ITCZ Inter-Tropical
Convergence
Zone
Tecconile Technical Cooperation for the Promotion of the Development
IUCN
International Union for Conservation of Nature
and Environmental Protection of the Nile Basin
LMEMP
Lake Malawi Ecosystem Management Project
UNECIA
Universities of Northern England Consortium for International
LVB Lake
Victoria
Basin
Activities
LVDP Lake
Victoria
Development
Programme
WHO
World Health Organization
12
GIWA REGIONAL ASSESSMENT 47 EAST AFRICAN RIFT VALLEY LAKES
List of figures
Figure 1
Boundaries of the East African Rift Valley Lakes region. . . . . . . . . . . . . . . . . . . . . . . . . . . . . . . . . . . . . . . . . . . . . . . . . . . . . . . . . . . . . . . . . . . . . . . . . . . . . . . . . . . . . . . . . . . . . . . . . . . . . . . . . . 15
Figure 2
Lake Turkana Basin. . . . . . . . . . . . . . . . . . . . . . . . . . . . . . . . . . . . . . . . . . . . . . . . . . . . . . . . . . . . . . . . . . . . . . . . . . . . . . . . . . . . . . . . . . . . . . . . . . . . . . . . . . . . . . . . . . . . . . . . . . . . . . . . . . . . . . . . . . . . 16
Figure 3
Protected areas in the Lake Turkana Basin. . . . . . . . . . . . . . . . . . . . . . . . . . . . . . . . . . . . . . . . . . . . . . . . . . . . . . . . . . . . . . . . . . . . . . . . . . . . . . . . . . . . . . . . . . . . . . . . . . . . . . . . . . . . . . . . . . . . . . 19
Figure 4
Lake Victoria Basin.. . . . . . . . . . . . . . . . . . . . . . . . . . . . . . . . . . . . . . . . . . . . . . . . . . . . . . . . . . . . . . . . . . . . . . . . . . . . . . . . . . . . . . . . . . . . . . . . . . . . . . . . . . . . . . . . . . . . . . . . . . . . . . . . . . . . . . . . . . . . . 19
Figure 5
Lake Tanganyika Basin. . . . . . . . . . . . . . . . . . . . . . . . . . . . . . . . . . . . . . . . . . . . . . . . . . . . . . . . . . . . . . . . . . . . . . . . . . . . . . . . . . . . . . . . . . . . . . . . . . . . . . . . . . . . . . . . . . . . . . . . . . . . . . . . . . . . . . . . 20
Figure 6
Cichlids. . . . . . . . . . . . . . . . . . . . . . . . . . . . . . . . . . . . . . . . . . . . . . . . . . . . . . . . . . . . . . . . . . . . . . . . . . . . . . . . . . . . . . . . . . . . . . . . . . . . . . . . . . . . . . . . . . . . . . . . . . . . . . . . . . . . . . . . . . . . . . . . . . . . . . . . 22
Figure 7
Lake Malawi Basin. . . . . . . . . . . . . . . . . . . . . . . . . . . . . . . . . . . . . . . . . . . . . . . . . . . . . . . . . . . . . . . . . . . . . . . . . . . . . . . . . . . . . . . . . . . . . . . . . . . . . . . . . . . . . . . . . . . . . . . . . . . . . . . . . . . . . . . . . . . . 23
Figure 8
Formation of the African Rift Valley Lakes. . . . . . . . . . . . . . . . . . . . . . . . . . . . . . . . . . . . . . . . . . . . . . . . . . . . . . . . . . . . . . . . . . . . . . . . . . . . . . . . . . . . . . . . . . . . . . . . . . . . . . . . . . . . . . . . . . . . . . 24
Figure 9
Temperature, oxygen and dissolved nutrient concentrations in Lake Malawi. . . . . . . . . . . . . . . . . . . . . . . . . . . . . . . . . . . . . . . . . . . . . . . . . . . . . . . . . . . . . . . . . . . . . . . . . . . . . . . . . . . 26
Figure 10
Surface winds, water movement and upwelling in Lake Malawi. . . . . . . . . . . . . . . . . . . . . . . . . . . . . . . . . . . . . . . . . . . . . . . . . . . . . . . . . . . . . . . . . . . . . . . . . . . . . . . . . . . . . . . . . . . . . . . . 27
Figure 11
Protected areas in the Lake Tanganyika Basin. . . . . . . . . . . . . . . . . . . . . . . . . . . . . . . . . . . . . . . . . . . . . . . . . . . . . . . . . . . . . . . . . . . . . . . . . . . . . . . . . . . . . . . . . . . . . . . . . . . . . . . . . . . . . . . . . . 33
Figure 12
Human population density in the drainage basin of Lake Malawi. . . . . . . . . . . . . . . . . . . . . . . . . . . . . . . . . . . . . . . . . . . . . . . . . . . . . . . . . . . . . . . . . . . . . . . . . . . . . . . . . . . . . . . . . . . . . 35
Figure 13
Turkwel River. . . . . . . . . . . . . . . . . . . . . . . . . . . . . . . . . . . . . . . . . . . . . . . . . . . . . . . . . . . . . . . . . . . . . . . . . . . . . . . . . . . . . . . . . . . . . . . . . . . . . . . . . . . . . . . . . . . . . . . . . . . . . . . . . . . . . . . . . . . . . . . . . . 39
Figure 14
Fluctuations in the level of Lake Turkana, 1888-1990. . . . . . . . . . . . . . . . . . . . . . . . . . . . . . . . . . . . . . . . . . . . . . . . . . . . . . . . . . . . . . . . . . . . . . . . . . . . . . . . . . . . . . . . . . . . . . . . . . . . . . . . . . . 45
Figure 15
Linkages between the GIWA concerns in Lake Turkana. . . . . . . . . . . . . . . . . . . . . . . . . . . . . . . . . . . . . . . . . . . . . . . . . . . . . . . . . . . . . . . . . . . . . . . . . . . . . . . . . . . . . . . . . . . . . . . . . . . . . . . . . 46
Figure 16 The major drainage basins of Lake Victoria. . . . . . . . . . . . . . . . . . . . . . . . . . . . . . . . . . . . . . . . . . . . . . . . . . . . . . . . . . . . . . . . . . . . . . . . . . . . . . . . . . . . . . . . . . . . . . . . . . . . . . . . . . . . . . . . . . . . 48
Figure 17
Water hyacinths. . . . . . . . . . . . . . . . . . . . . . . . . . . . . . . . . . . . . . . . . . . . . . . . . . . . . . . . . . . . . . . . . . . . . . . . . . . . . . . . . . . . . . . . . . . . . . . . . . . . . . . . . . . . . . . . . . . . . . . . . . . . . . . . . . . . . . . . . . . . . . . 50
Figure 18
Fishermen weighing Nile perch. . . . . . . . . . . . . . . . . . . . . . . . . . . . . . . . . . . . . . . . . . . . . . . . . . . . . . . . . . . . . . . . . . . . . . . . . . . . . . . . . . . . . . . . . . . . . . . . . . . . . . . . . . . . . . . . . . . . . . . . . . . . . . . . 56
Figure 19
Total landings of fish in the three riparian countries of Lake Victoria. . . . . . . . . . . . . . . . . . . . . . . . . . . . . . . . . . . . . . . . . . . . . . . . . . . . . . . . . . . . . . . . . . . . . . . . . . . . . . . . . . . . . . . . . . . 57
Figure 20
Linkages between the GIWA concerns in Lake Victoria. . . . . . . . . . . . . . . . . . . . . . . . . . . . . . . . . . . . . . . . . . . . . . . . . . . . . . . . . . . . . . . . . . . . . . . . . . . . . . . . . . . . . . . . . . . . . . . . . . . . . . . . . 60
Figure 21
Linkages between the GIWA concerns in Lake Tanganyika. . . . . . . . . . . . . . . . . . . . . . . . . . . . . . . . . . . . . . . . . . . . . . . . . . . . . . . . . . . . . . . . . . . . . . . . . . . . . . . . . . . . . . . . . . . . . . . . . . . . . 69
Figure 22
Lake shore of Lake Malawi near Money Bay in Lake Malawi National Park. . . . . . . . . . . . . . . . . . . . . . . . . . . . . . . . . . . . . . . . . . . . . . . . . . . . . . . . . . . . . . . . . . . . . . . . . . . . . . . . . . . . . 75
Figure 23
Linkages between GIWA concerns in Lake Malawi. . . . . . . . . . . . . . . . . . . . . . . . . . . . . . . . . . . . . . . . . . . . . . . . . . . . . . . . . . . . . . . . . . . . . . . . . . . . . . . . . . . . . . . . . . . . . . . . . . . . . . . . . . . . . 80
Figure 24
Causal chain diagram illustrating the causal links for Unsustainable exploitation of fish and other living resources. . . . . . . . . . . . . . . . . . . . . . . . . . . . . . . . . . . . . . . . . . . . 82
Figure 25
Trends in catch per unit effort for Nile perch in commercial fisheries of Lake Victoria. . . . . . . . . . . . . . . . . . . . . . . . . . . . . . . . . . . . . . . . . . . . . . . . . . . . . . . . . . . . . . . . . . . . . . . . . . . 83
Figure 26
Trends in landings of the major commercial fish species in the riparian countries of Lake Victoria. . . . . . . . . . . . . . . . . . . . . . . . . . . . . . . . . . . . . . . . . . . . . . . . . . . . . . . . . . . . . . 83
Figure 27
The percent contribution by weight of the four major fishing gears to the Kenyan Lake Victoria catches. . . . . . . . . . . . . . . . . . . . . . . . . . . . . . . . . . . . . . . . . . . . . . . . . . . . . . . 85
Figure 28
Causal chain diagram illustrating the causal links for Pollution. . . . . . . . . . . . . . . . . . . . . . . . . . . . . . . . . . . . . . . . . . . . . . . . . . . . . . . . . . . . . . . . . . . . . . . . . . . . . . . . . . . . . . . . . . . . . . . . 89
Figure 29
Comparison of turbidity, nitrogen and phosphorus levels of four Kenyan rivers, rainy season 2001. . . . . . . . . . . . . . . . . . . . . . . . . . . . . . . . . . . . . . . . . . . . . . . . . . . . . . . . . . . . . 90
List of tables
Table 1
Endangered, endemic and rare fish species of Lake Turkana. . . . . . . . . . . . . . . . . . . . . . . . . . . . . . . . . . . . . . . . . . . . . . . . . . . . . . . . . . . . . . . . . . . . . . . . . . . . . . . . . . . . . . . . . . . . . . . . . . . 18
Table 2
Physiographic statistics for Lake Tanganyika.. . . . . . . . . . . . . . . . . . . . . . . . . . . . . . . . . . . . . . . . . . . . . . . . . . . . . . . . . . . . . . . . . . . . . . . . . . . . . . . . . . . . . . . . . . . . . . . . . . . . . . . . . . . . . . . . . . . 21
Table 3
Basic limnological parameters for Lake Tanganyika. . . . . . . . . . . . . . . . . . . . . . . . . . . . . . . . . . . . . . . . . . . . . . . . . . . . . . . . . . . . . . . . . . . . . . . . . . . . . . . . . . . . . . . . . . . . . . . . . . . . . . . . . . . . 21
Table 4
Inventory of species in Lake Tanganyika. . . . . . . . . . . . . . . . . . . . . . . . . . . . . . . . . . . . . . . . . . . . . . . . . . . . . . . . . . . . . . . . . . . . . . . . . . . . . . . . . . . . . . . . . . . . . . . . . . . . . . . . . . . . . . . . . . . . . . . 23
Table 5
The islands and reefs of Lake Malawi.. . . . . . . . . . . . . . . . . . . . . . . . . . . . . . . . . . . . . . . . . . . . . . . . . . . . . . . . . . . . . . . . . . . . . . . . . . . . . . . . . . . . . . . . . . . . . . . . . . . . . . . . . . . . . . . . . . . . . . . . . . 24
Table 6
Physical and physico-chemical characteristics of Lake Malawi. . . . . . . . . . . . . . . . . . . . . . . . . . . . . . . . . . . . . . . . . . . . . . . . . . . . . . . . . . . . . . . . . . . . . . . . . . . . . . . . . . . . . . . . . . . . . . . . . 25
Table 7
Land use in the Lake Turkana catchment. . . . . . . . . . . . . . . . . . . . . . . . . . . . . . . . . . . . . . . . . . . . . . . . . . . . . . . . . . . . . . . . . . . . . . . . . . . . . . . . . . . . . . . . . . . . . . . . . . . . . . . . . . . . . . . . . . . . . . . 29
Table 8
Quantity of fish (tonnes) landed in Kenya, 1965-1968. . . . . . . . . . . . . . . . . . . . . . . . . . . . . . . . . . . . . . . . . . . . . . . . . . . . . . . . . . . . . . . . . . . . . . . . . . . . . . . . . . . . . . . . . . . . . . . . . . . . . . . . . . 29
Table 9
Socio-economic statistics for Tanganyika's riparian nations. . . . . . . . . . . . . . . . . . . . . . . . . . . . . . . . . . . . . . . . . . . . . . . . . . . . . . . . . . . . . . . . . . . . . . . . . . . . . . . . . . . . . . . . . . . . . . . . . . . 32
Table 10
Some socio-economic indicators of the economies of the Lake Malawi Basin. . . . . . . . . . . . . . . . . . . . . . . . . . . . . . . . . . . . . . . . . . . . . . . . . . . . . . . . . . . . . . . . . . . . . . . . . . . . . . . . . . 35
Table 11
Scoring table for Lake Turkana. . . . . . . . . . . . . . . . . . . . . . . . . . . . . . . . . . . . . . . . . . . . . . . . . . . . . . . . . . . . . . . . . . . . . . . . . . . . . . . . . . . . . . . . . . . . . . . . . . . . . . . . . . . . . . . . . . . . . . . . . . . . . . . . . 37
Table 12
Fish species and habitats in Lake Turkana.. . . . . . . . . . . . . . . . . . . . . . . . . . . . . . . . . . . . . . . . . . . . . . . . . . . . . . . . . . . . . . . . . . . . . . . . . . . . . . . . . . . . . . . . . . . . . . . . . . . . . . . . . . . . . . . . . . . . . 44
Table 13
Scoring table for Lake Victoria. . . . . . . . . . . . . . . . . . . . . . . . . . . . . . . . . . . . . . . . . . . . . . . . . . . . . . . . . . . . . . . . . . . . . . . . . . . . . . . . . . . . . . . . . . . . . . . . . . . . . . . . . . . . . . . . . . . . . . . . . . . . . . . . . 47
Table 14
Demographic and biophysical characterisation of the inlet drainage basins of Lake Victoria. . . . . . . . . . . . . . . . . . . . . . . . . . . . . . . . . . . . . . . . . . . . . . . . . . . . . . . . . . . . . . . . . . 47
Table 15
Scoring table for Lake Tanganyika. . . . . . . . . . . . . . . . . . . . . . . . . . . . . . . . . . . . . . . . . . . . . . . . . . . . . . . . . . . . . . . . . . . . . . . . . . . . . . . . . . . . . . . . . . . . . . . . . . . . . . . . . . . . . . . . . . . . . . . . . . . . . . 61
Table 16
Sources of pollution in the Tanganyika catchment. . . . . . . . . . . . . . . . . . . . . . . . . . . . . . . . . . . . . . . . . . . . . . . . . . . . . . . . . . . . . . . . . . . . . . . . . . . . . . . . . . . . . . . . . . . . . . . . . . . . . . . . . . . . . 63
Table 17
Some water and sediment discharge rates into Lake Tanganyika.. . . . . . . . . . . . . . . . . . . . . . . . . . . . . . . . . . . . . . . . . . . . . . . . . . . . . . . . . . . . . . . . . . . . . . . . . . . . . . . . . . . . . . . . . . . . . . 63
Table 18
Scoring table for Lake Malawi.. . . . . . . . . . . . . . . . . . . . . . . . . . . . . . . . . . . . . . . . . . . . . . . . . . . . . . . . . . . . . . . . . . . . . . . . . . . . . . . . . . . . . . . . . . . . . . . . . . . . . . . . . . . . . . . . . . . . . . . . . . . . . . . . . 70
Table 19
Unsustainable exploitation of fish in Lake Victoria: percentage contribution of issues and immediate causes of the impacts. . . . . . . . . . . . . . . . . . . . . . . . . . . . . . . . . . . 82
Table 20
Export quantities for Nile perch fillets between 1988 and 1999. . . . . . . . . . . . . . . . . . . . . . . . . . . . . . . . . . . . . . . . . . . . . . . . . . . . . . . . . . . . . . . . . . . . . . . . . . . . . . . . . . . . . . . . . . . . . . . . . 84
Table 21
Capacity of fish processing factories, annual landings, and maximum sustainable yield for the three riparian countries in 1999. . . . . . . . . . . . . . . . . . . . . . . . . . . . . . . 85
Table 22
Summary of the processes and actions behind the root causes of overexploitation of fish. . . . . . . . . . . . . . . . . . . . . . . . . . . . . . . . . . . . . . . . . . . . . . . . . . . . . . . . . . . . . . . . . . . . . . 85
Table 23
Summary of the processes and actions behind the root causes of destructive fishing practices. . . . . . . . . . . . . . . . . . . . . . . . . . . . . . . . . . . . . . . . . . . . . . . . . . . . . . . . . . . . . . . . . 86
Table 24
Pollution in Lake Victoria: percentage contribution of issues and immediate causes of the impacts. . . . . . . . . . . . . . . . . . . . . . . . . . . . . . . . . . . . . . . . . . . . . . . . . . . . . . . . . . . . 87
ABBREVIATIONS AND ACRONYMS
13
Table 25
Number of people in urban populations connected to sewerage systems in Lake Victoria Basin. . . . . . . . . . . . . . . . . . . . . . . . . . . . . . . . . . . . . . . . . . . . . . . . . . . . . . . . . . . . . . . . 87
Table 26
Summary of the processes and actions behind the root causes of microbiological pollution.. . . . . . . . . . . . . . . . . . . . . . . . . . . . . . . . . . . . . . . . . . . . . . . . . . . . . . . . . . . . . . . . . . . 88
Table 27
Agricultural characteristics of Lake Victoria Basin. . . . . . . . . . . . . . . . . . . . . . . . . . . . . . . . . . . . . . . . . . . . . . . . . . . . . . . . . . . . . . . . . . . . . . . . . . . . . . . . . . . . . . . . . . . . . . . . . . . . . . . . . . . . . . 91
Table 28
Summary of the processes and actions behind the root causes of eutrophication (and sedimentation). . . . . . . . . . . . . . . . . . . . . . . . . . . . . . . . . . . . . . . . . . . . . . . . . . . . . . . . . 91
Table 29
Summary of the processes and actions behind the root causes of chemical pollution.. . . . . . . . . . . . . . . . . . . . . . . . . . . . . . . . . . . . . . . . . . . . . . . . . . . . . . . . . . . . . . . . . . . . . . . . . . 92
Table 30
Policy options analysis matrix: overexploitation and destructive fishing issues. . . . . . . . . . . . . . . . . . . . . . . . . . . . . . . . . . . . . . . . . . . . . . . . . . . . . . . . . . . . . . . . . . . . . . . . . . . . . . . . . 95
Table 31
Policy options analysis matrix: Pollution issues.. . . . . . . . . . . . . . . . . . . . . . . . . . . . . . . . . . . . . . . . . . . . . . . . . . . . . . . . . . . . . . . . . . . . . . . . . . . . . . . . . . . . . . . . . . . . . . . . . . . . . . . . . . . . . . . 100
14
GIWA REGIONAL ASSESSMENT 47 EAST AFRICAN RIFT VALLEY LAKES


Regional defi nition
This section describes the boundaries and the main physical and
Elevation (m)
socio-economic characteristics of the region in order to defi ne the
Walga
2000-4000
area considered in the regional GIWA assessment and to provide
Ethiopia
1000-2000
suffi
cient background information to establish the context within
500-1000
Wh
Wenz
which the assessment was conducted.
it
Omo
100-500
eNil
Abaya Hayk'
e
Ch'amo Hayk'
Sudan
Ilemi triangle
The Regional defi nition of Lake Tanganyika is excerpted with permission from
- disputed Ch'ew Bahir
the document "Results and Experiences of the UNDP/GEF Conservation Ini-
Ubangi
Lake Tukana
tiative (RAF/92/G32)" compiled by Kelly West in 2001 (West 2001). The GIWA
l
assessment of Lake Tanganyika was based largely on experience gained from
DR Congo
we
rk
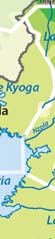
Victoria Nile
Lake Kyoga
Tu
this 5-year UN-sponsored project to study the biodiversity of Lake Tangan-
Lake Albert
aut
Uganda
g
Su
yika and the threats to the Lake, and to devise a management plan.
ki
rio
e
Nzoia
Semli
K
Kenya
Lake Edward
Lake
ara
M
Victoria
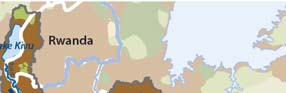
Rwanda
Boundaries of the East African
Lake Kivu
Lake Natron
Rift Valley Lakes region
Rusizi
Burundi
Lake Eyasi
e
Co
The East African Rift Valley Lakes (EARVL), GIWA region 47, runs from the
ng
Igomb
We
Malag
o
arasi
mber
northern end of Lake Turkana Basin to the southern tip of Lake Malawi/
e
L
Ugall
u
Ka
a
vu
Nyasa Basin and includes all the natural habitat and associated human
alaba
Lake Tanganyika
Shama
Lu
communities found within the Rift Valley and on the adjacent escarp-
fuko
Tanzania
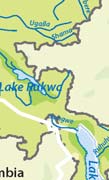
ments (Figure 1). It encompasses parts of the following countries; Ethiopia,
Lukag Lake Rukwa
a
Kenya, Sudan, Uganda, Tanzania, Rwanda, Burundi, Democratic Republic
Songw
of Congo (DR Congo), Zambia, Malawi and Mozambique. The main lakes
e
u
in the region include Victoria, Tanganyika, Malawi, Turkana, Albert, Edward,
uh
Lak Ruh
George and Kivu. All are tropical and together comprise the African Great
Zambia
e
Malawi
Lakes ecoregion. However, each lake lies within its own separate drain-
age basin, with its own assemblage of endemic organisms, most notably
Mozambique
Bua
the cichlid fi sh species-fl ocks. Each lake diff ers
Malawi
substantially with respect to limnology, catch-
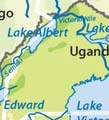
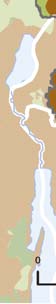
Figure 1
Boundaries of the
ment dynamics and human impacts (Hamil-
0
200
Kilometres
e
East African Rift
Shir
ton 1982).
ę GIWA 2003
Valley Lakes region.
REGIONAL DEFINITION
15

Physical characteristics
Addis Ababa
The Task team decided that the lakes be tackled separately within
Walga
the context of their respective drainage basins. For the purpose of
GIWA assessment, the following lakes that are characteristic of most
Jima
of the transboundary water bodies in the region were selected for the
Gojeb
'
exercise: Lake Victoria, Lake Tanganyika, Lake Malawi and Lake Turkana.
Shete
These four are the largest of the East African Rift Valley lakes and are
atilB
among the oldest lakes in the world ş they are all classed as Ancient
Abaya Hayk'
Arba Minch
Lakes (Brooks 1950). All these lakes are extremely sensitive to climate
r
e
Ch'amo Hayk'
r
iv
la
change. Lake Turkana, for example, is a topographically closed basin
Omo
Ba
Sagan
Sudan
(i.e. no outlet) and its level has varied by 20 m within the past century
ana
Ilemi triangle
Gal
alone (Owen et al. 1982). Over 75% of the water lost from Lake Malawi
Ethiopia
- disputed
Ch'ew Bahir
is by evaporation. If annual rainfall over this lake were to decrease by
30%, the lake level would drop 100 m within 150 years (Owen et al.
Lake Turkana
1990). There is abundant geophysical and sedimentological evidence
Ferguson┤s
gulf
for its level having been 100-200 m lower than present several times in
the past few thousand years (Scholz & Rosendahl 1988). All the four rift
Lodwar
Tu
rk
lakes are sensitive in this way as well as in their chemical and biological
w
e
l
responses to variation in the hydrological budget.
Uganda
Kenya
rio
Ke
Landcover
Lake Turkana
Barren
Lake Turkana is located in the Great Rift Valley in the arid northwestern
Cropland
part of Kenya at about 3░ N and 36░ E (Figure 2). Most of the Lake lies in
Forest
Kenya, but part of the Omo River (which supplies about 90% of water
Grassland
to the Lake) delta lies in southwestern Ethiopia. Lake Turkana is the
Savannah
Shrubland
largest closed-basin lake in the East African Rift, and loses water mainly
Nakuru
0
100
Kilometres
by evaporation. It can be considered as the "arid region end-member"
ę GIWA 2003
of the large rift valley lakes and a modern analogue for ancient rift
Figure 2 Lake
Turkana
Basin.
environments in Africa and elsewhere (Halfman et al. 1989). The Lake's
(Source: data from Loveland et al. 2000)
catchment area is about 130 860 km2 while the Lake is 250 km long,
has a mean width of 30 km and a surface area of about 6 750 km2. The
the south (Dunkelman et al. 1988). Tertiary volcanic rocks are found
average depth is 35 m while the maximum depth is 115 m. The reason
in the south and along most of the western side of the Lake, while
for Turkana's world-wide fame as the purported "Cradle of Mankind",
Quaternary sediments dominate the western and northern side of the
are the fi ndings of early hominids, including remains of various
Lake. Three volcanic islands are found in the Lake; the North, Central
Australopithecus species, Homo habilis, Homo erectus and Homo sapiens
and South islands.
(Finke 2001).
The only perennial river entering the Lake is Omo River, fl owing
Geology and geomorphology
southwards from Ethiopia into a delta at the northern end of the Lake. All
Lake Turkana lies within a broad depression known as the Turkana
the other rivers of the west area with the exception of the Turkwel River
depression, between the Kenya and Ethiopia domes in that part of the
are dry for most of the year, fl owing for only a few days or even hours
East African Rift Valley System known as the Gregory Rift. The Gregory
after rain (Walsh & Dodson 1969). The Omo River provides about 90%
Rift, which is topographically well-defi ned throughout most of Kenya,
of the water fl owing into the Basin (Cerling 1986), draining southward
splays out into a broader, less distinct zone of rifting within the vicinity
from the Ethiopian plateau where mid-year monsoonal rainfall exceeds
of the Lake. The Turkana Depression has generally been regarded as a
1 500 mm (Halfman & Johnson 1988). The River contributes about 19
diff use zone of faulting, linking the rift segments to the north and to
billion m3 of water each year (Beadle 1981).
16
GIWA REGIONAL ASSESSMENT 47 EAST AFRICAN RIFT VALLEY LAKES
The western coastal plain extends up to 25 km inland from the lake
River acacia (Acacia elatior), Soapberry tree (Balanites aegyptiaca) and
shore to the Labur-Lothidok ranges, rising gently westwards to over
Doum palm (Hyphaene coriacea) (Hughes & Hughes 1992). Saltbush
100 m above the lake level (Walsh & Dodson 1969). The drainage pat-
(Salvadora persica) forms a bushland on Central and South islands
tern of the western area centres around two major basins: Lake Turkana
(Hughes & Hughes 1992).
and Lotagipi swamp. The Turkwel River carries water into the Lake via
an extensive delta for several months in a normal year. The River is ap-
Physical and chemical limnology
proximately 300 km long, rising on the slopes of Mount Elgon, where
Lake Turkana receives run-off and sediment from a wide geographical
it is known as the Suam (Dodson 1971). The Turkwel River is now being
area. The Omo River provides about 90% of the water that fl ows into
dammed for hydroelectric power generation at Turkwel Gorge, about
the Lake (Cerling 1986). The seasonal Turkwel and Kerio rivers contribute
150 km west of the Lake.
most of the remaining fl uvial input. Other streams, direct rainfall and
subterranean fl ow are considered insignifi cant in the water budget
Most of the lake's southern shoreline is rocky, consisting of layers of lava
(Yuretich & Cerling 1983). All water input is approximately balanced
boulders or minor cliff faces where recent lava fl ows have extended
by evaporation, the surface level lying at approximately 372 m above
to the water line. In the southwest corner of the Lake, however, the
sea level.
shoreline opens out to form a gently curving arc with sandy and shingle
beaches. The eastern area is generally fairly fl at-lying, with ephemeral
The Lake is moderately saline (2.5), alkaline (pH = 9.2), and is well
streams draining into the Lake, but their contribution to the total water
mixed by strong diurnal winds (Yuretich & Cerling 1983). The principal
and sediment fl ux input is very small.
ions are Na+ (sodium), HCO - (bicarbonate), and Cl- (chloride), with
3
relatively low concentrations of Ca2+ (calcium), Mg2+ (magnesium),
The age of Lake Turkana is given a conservative estimate of 4.3 million
and (SO )2- (sulphate) (Halfman et al. 1989). In the north, salinity is
4
years (by K-Ar and 40Ar/39Ar methods), which is recorded from the
seasonally reduced through mixing with dilute Omo River fl oodwaters.
lowermost tuff bed within the Koobi Fora Basin (McDougall 1985).
The evaporation rate has been estimated at 2 335 mm/year. The Lake
Seismic refl ection profi les of Lake Turkana, penetrating about
undergoes far greater changes in salinity than in temperature (Johnson
60 m below the lake fl oor, show that the predominant pattern of
et al. 1990). Its high alkalinity promotes rapid equilibration of CO with
2
sedimentation is one of simple and rapid basin infi lling; the profi le
the atmosphere (Peng & Broecker 1980). The water has a residence time
suggests an abundance of gas (probably methane) in the Holocene
of about 12.5 years (World Lakes Database 2002). The euphotic zone is
sediments, particularly near the major rivers and in the deepest basins
about 6 m, and the Lake is always turbid (Kallqvist et al. 1988). Yuretich
where sedimentation rates are fairly high (Johnson et al. 1987).
(1979) observed that sediment plumes up to 100 km long extend
southward from the Omo River delta during fl ood seasons.
Climate and vegetation
The mean annual temperature is 30░C, mean annual rainfall is below 255
The water level of this closed basin lake is determined by the balance
mm/year (Survey of Kenya 1977), and the evaporation rate is 2 335 mm/
between the infl ux from rivers and groundwater and the evaporation
year (▒0.347 mm) (Ferguson & Harbott 1982). The annual mean
from the lake surface, and has an annual water level fl uctuation of
maximum temperature range is 30 to 34░C, while the annual mean
about 1.25 m. The lake level is therefore sensitive to climatic variations,
minimum temperature is 23.7░C (Survey of Kenya 1977). The region is
and is subject to marked seasonal fl uctuations as well as to long-term
semi-arid. The majority of the yearly rainfall occurs in two seasons, from
periodical changes.
March to June, with a peak in April, and from October to December, with
a lesser peak in November or December. The occurrence of rainfall is,
The growth of deltas in Lake Turkana is controlled by the erratic supply
however, erratic and unpredictable.
of sediment, and the short- and long-term fl uctuations in lake level are
brought about by climatic change and tectonic activity (Frostick & Reid
Grassy plains with yellow spear grass (Austrostipa fl avescens) and
1986). Although fl uvial activity is generally infrequent (only the Omo
Commuphera and Acacia sp. characterise the vegetation of the region.
River is perennial), the sediment load is high, in common with other arid
Acacia thorn scrub, with larger acacia trees along the river courses,
environments (up to 1 600 tonnes/km2/year), and delta construction is
grow around the Lake. The fairly high alkali content of the Lake's
rapid (Frostick & Reid 1986). Shoreline features of the Lake include major
waters greatly limits the range of species of vegetation. Galleries of
spits of the western lake shore; the shores around Longech, Lolibekai
forest occur along the affl
uent watercourses, being characterised by
and Menar are associated with high energy (Ferguson & Harbott 1982).
REGIONAL DEFINITION
17
Primary spits of the eastern shore such as Mvite and Koobi Fora are
(Lowe-McConnell 1995). Common species include: Alestes baremose,
subject to relatively little wave action but are maintained by currents
African tetras (A. dentex); Nile perch (Lates niloticus); Snooks, endemic (L.
running along both the river and lake margins, creating extensive
longispinis); Bagrid catfi shes (Bagrus bayad); Squeakers or upside-down
submerged and often steep-sided sand bars (Ferguson & Harbott
catfi shes (Synodontis schall); and Cichlids, such as Oreochromis niloticus,
1982).
O. galilaeus; and Tilapia zillii (Hughes & Hughes 1992). A few endemic
species among the non-cichlids refl ect Lake Turkana's geographical
The modern sediments of Lake Turkana are primarily detrital silicates
isolation for a relatively short time (Table 1) (Lowe-McConnell 1995).
and are dominantly fi ne grained (Yuretich 1979, Olago & Odada 2000).
Table 1
Endangered, endemic and rare fi sh species of Lake
Carbonate is the next most abundant component to the detrital silicate
Turkana.
fraction and has two main components; ostracod carapaces, and
Endangered
Endemic
Rare
micron-sized crystals of carbonate (Yuretich 1979, Halfman 1987). The
Bagrus bayad Forsskňl (Catfish)
Lates rudolfianus Worth. (Nile perch)
Hydrocynus forskalii Curier
average sedimentation rate, based on radiocarbon dating by Halfman
Haplochromis rudolfianus Trevaras
Alestes baremose Linn. (Tigerfish)
and Johnson (1988), has been estimated at 2.7 mm/year and constitutes
(Tilapia)
the most reliable rate for Lake Turkana.
Alestes dextrex Linn. (Tigerfish)
Labeo horie Heckel (Barbels)
Alestes imberi Linn. (Tigerfish)
Polypterus bichir GŘnther (Bichirs)
Alestes minutus (Tigerfish)
P. senegalus (Bichirs)
Biological limnology
Alestes nurse RŘppel(Tigerfish)
Lake Turkana is famous for its colour. It is sometimes referred to as
Citharinus intermedius Warth.
the Jade Sea, which is largely due to the presence of blue-green
(Ray-finned fish)
algae in the phytoplankton community. Today, however the lake
Distochordus niloticus Linn.
Barbus bynni rudolfianus
colour, especially in the north, is brown because of sediment (Haack &
Worthington (Minnows and
Messina 2001). The Lake has a little-modifi ed fauna and a low level of
carps)
endemicity with few cichlid fi sh (Lowe-McConnell 1995). The principal
Barbus hindii GŘnther (Minnows
and carps)
emergent macrophytes are the grasses Paspalidium germinatum and
Labeo horie Heckel (Minnows
Sporobolus spicatus which cover the seasonally exposed shallows and
and carps)
(Source: National Biodiversity Unit 1992)
provide important nurseries for fi sh (Hughes & Hughes 1992). There are
extensive Potamogeton (pondweed) beds in the shallow bays (Hughes
& Hughes 1992).
Wildlife
On the eastern side of the Lake is Sibiloi National Park (a Natural World
The dominant phytoplankton are the blue-green algae Microcystis
Heritage Site). Mammals include Burchell's and Grevy's zebras (Equus
ceruginosa and the green algae Botryococcus braunii, while in Ferguson's
burchelli) and (E. grevyi), Grants gazelle (Gazella granti), Beisa oryx (Oryx
Gulf the blue-green algae Anabaenopsis arnoldii is dominant (Kallqvist
gazella beisa), Hartebeest (Alcelaphus buselaphus), Topi (Damaliscus
et al. 1988). The development of phytoplankton is limited by the
lunatus), Lesser kudu (Tragelaphus imberbis), Lion (Panthera leo), and
availability of nitrate and light (Hopson 1982). Light limitation is caused
Cheetah (Acinonyx jubatus). There are many crocodiles along the lake
by turbid water and vertical mixing. The zooplankton are dominated by
shore and on Central Island; Crocodylus niloticus and Varanus niloticus
protozoans in terms of numbers, but by crustaceans in terms of biomass
(Hughes & Hughes 1992).
(Hughes & Hughes 1992). The zooplankton community consists mainly
of Copepods (World Lakes Database 2002). There are fi ve gastropod
Lake Turkana is an important fl yway for north-bound migrants. Over
molluscs and two species of shrimp (Hughes & Hughes 1992).
350 species of aquatic and terrestrial birds have been recorded in the
Lake (Hughes & Hughes 1992). Common resident birds in Lake Turkana
Lake Turkana, although no longer in contact with the Nile, evidently was
include pelicans, fl amingos and herons (Gichuki & Gichuki 1992).
so in the recent past and it has a very similar fi sh fauna to that of Lake
Turkana is an important resting site for large numbers of visiting water-
Albert (Uganda) (Lowe-McConnell 1995). Of the 48 species of fi sh that
edge birds such as Kentish plover (Charadrius alexandrinus), Broad-
have been identifi ed in the Lake (36 species) and infl owing Omo River
billed sandpiper (Limicola falcinellus), Long-tailed skua (Stercorarius
(12 species) (Lowe-McConnell 1995), 30 are widespread Sudanian types,
longicaudus) and Pomerine skua (S. pomarinus) (Gichuki & Gichuki
8 have restricted distributions and 10 are endemic (Hughes & Hughes
1992). Central Island has a breeding population of African skimmer
1992). The 10 endemic species all live in the pelagic zone or deep water
(Rhyncops fl avirostris) which nests in banks. It is also an important
18
GIWA REGIONAL ASSESSMENT 47 EAST AFRICAN RIFT VALLEY LAKES

staging post for migrating birds including warblers, wagtails and little
Lake Victoria
stints (Cunningham Van-Someren 1981).
Lake Victoria (1░ S and 32░ E) is, by area, the second largest lake in the
world and the largest in Africa, being almost twice the size of Lake
Ethiopia
Tanganyika (32 900 km2) and Lake Malawi (28 760 km2) (Figure 4). It is
perched high (1 134 m above sea level) on the African craton between
the western and eastern rift valleys (Johnson et al. 2000). This equatorial
Omo National Park
lake has a surface area of 68 800 km2 and an adjoining catchment area
of 184 000 km2. Lake Victoria is, however, a relatively shallow lake,
Sudan
with a maximum depth of 80-90 m compared to Tanganyika and
Ilemi triangle
Malawi whose maximum depths are 1 470 m (Capart 1949, Tiercelin &
- disputed
Mondeguer 1991) and 700 m (Johnson & Ng'ang'a 1990), respectively.
Sibiloi National Park
Kenya, Uganda and Tanzania border the Lake and share 6%, 43% and
51%, respectively, of the lake surface.
Lake Turkana
Ferguson┤s
gulf
South Island
Kenya
National Park
Mount Kulal
Biosphere Reserve
Uganda
White Nile
Nasolot National
Reserve
South Turkana
Lake Albert
National Reserve
Lake Kyoga
Uganda
Figure 3
Protected areas in the Lake Turkana
Basin.
Nzoia
Kenya
Owen Falls
Kampala
dam
Kisumu
Entebbe
Protected areas and cultural heritage sites
Sondu Miriu
dam
Kavirondo gulf
Omo National Park in southwest Ethiopia is a pro-
Lake Edward
tected area (Figure 3). Koobi Fora, to the north of Alia
Lake Victoria
Bay on the eastern shore of the Lake, is an important
Kagera
archaeological site where extensive palaeontologi-
Bukoba
cal fi nds have been made. Human fossils include the
Rwanda
Mara
remains of Australopithecus rodustus, Homo habilis,
Kigali
i
Homo erectus and Homo sapiens. Central Island is a
Gurumet
part of the protected Sibiloi National Park on the
vu
Mwanza
eastern shore of the Lake. The southeastern sec-
uvu
R
Tanzania
tion of the Lake is also protected in the Mount Kulal
Biosphere Reserve, approved in 1978, and includes
Burundi
the South Island National Park of 3 880 ha. (Hughes
Landcover
& Hughes 1992). Part of the gorge section of the
Barren
Savannah
Turkwel River is protected in the Nasolot National
Cropland
Shrubland
Reserve, and a 25 km section of the left bank of the
Forest
0
100 Kilometres
Dams
Grassland
Kerio River is situated in the South Turkana National
ę GIWA 2003
Reserve, 100 km north of Kitale township (Hughes &
Figure 4 Lake
Victoria
Basin.
Hughes 1992).
(Source: data from Loveland 2000)
REGIONAL DEFINITION
19


Climate
Biological limnology
The interannual variability of rainfall is remarkably coherent throughout
Much of the lake margin is swampy; islands of Cyperus papyrus, with
most of eastern Africa despite quite diverse climatic mean conditions.
its typical associates, detach from the fringing swamps (Hughes &
The largest portion of this variability is accounted for by the "short rains"
Hughes 1992). The current phytoplankton community is dominated
season of OctoberşDecember. Rainfall variability in the region shows
by the cyanobacteria Cylindrospermopsis and Planktolyngbya, and the
strong teleconnections to the rest of Africa and to the global tropics.
diatom Nitzchia (Komarek & Kling 1991, Hecky 1993). Zooplankton
Rainfall in eastern Africa is strongly quasi-periodic, with a dominant time-
consist of abundant copepods and cladocerans (Branstrator et al.
scale of variability of 5 to 6 years (Nicholson 1996). This is also a dominant
1996). As recently as the 1960s, Lake Victoria supported an endemic
time-scale for the El Ni˝o-Southern Oscillation (ENSO) phenomenon and
cichlid fi sh species fl ock of more than 500 species (Seehausen 1996),
for Sea Surface Temperatures (SSTs) fl uctuations in the Equatorial Indian
but these have progressively disappeared from the catches to become
and Atlantic oceans. Rainfall variability is closely linked to both ENSO and
poorly represented today.
SSTs in the Indian and Atlantic Oceans, and it tends to be enhanced in
East Africa during ENSO years (Ropelewski & Halpert 1987, Ogallo 1989).
Lake Tanganyika
At 673 km along its major axis, Lake Tanganyika is the longest lake
The water balance is dominated by rainfall on the Lake, evaporation,
in the world and ranges from 12 to 90 km in width with a shoreline
and the Nile River outfl ow, with river infl ow making minor contributions
perimeter of 1 838 km (Figure 5, Table 2, Hanek et al. 1993). The countries
(Spigel & Coulter 1996). More than 80% of the water is derived directly
of Burundi, Democratic Republic of Congo, Tanzania and Zambia share
from rain onto the lake surface, while evaporation from the Lake
Lake Tanganyika. Of the Lake's shoreline perimeter, 9% is in Burundi,
accounts for a signifi cant amount of its annual water loss (Johnson et
43% is in DR Congo, 36% is in Tanzania, and 12% is in Zambia (Hanek
al. 2000). The Kagera River contributes about 7% of the total infl ow.
et al. 1993).
Physical limnology
Hydrological and hydrodynamic data for Lake Victoria (and other
Rwanda
Lake Kivu
R
East African Lakes) are scarce, fragmentary and often not easily
usizi
accessible. A resurgence of work is now underway over a wide range
Burundi
of disciplines since the Lake has been under severe ecological pressure
Uvira Bujumbura
for the last four decades. The Lake has an intricate and highly indented
shoreline of more than 3 500 km. It has numerous islands, shallow
bays and connecting channels, and extensive areas of wetland. These
morphological features are signifi cant for exchange of water between
Kigoma
Tabora
the littoral and pelagic regions of the Lake (Spigel & Coulter 1996). Lake
Malagarasi
Tanzania
Victoria has a fl ushing time of 140 years and a residence time of 23 years
Kalemie
(Bootsma & Hecky 1993).
DR Congo
Lake Tanganyika
Surface water temperature is between 24 and 28░C (Ochumba 1996),
a
g
u
and evaporative cooling during the dry season is important in the
g
Lu
heat balance and mixing regime (Talling 1966). Temperature profi les
Landcover
measured in Lake Victoria show a lack of well-defi ned mixed layers and
bo
Cropland
l
om
Ka
Forest
seasonal thermoclines; the temperature gradients tend to be more
Mpulungu
Grassland
Lu
diff use, and horizontal variability greater, than in Lake Tanganyika and
fubu
Savannah
Lake Malawi (Spigel & Coulter 1996). Measurements carried out in the
Zambia
Kenya sector of the Lake show that anoxic water occurs below a depth
of 35 m, with the oxycline at 10 to 50 m (20 to 30 m for most of the
year) (Ochumba 1996). Sporadic upsurges of the oxycline to depths as
0
100 Kilometres
ę GIWA 2003
shallow as 10 m in the open lake have been associated with fi sh kills
Figure 5 Lake
Tanganyika
Basin.
(Ochumba 1996).
(Source: data from Loveland 2000)
20
GIWA REGIONAL ASSESSMENT 47 EAST AFRICAN RIFT VALLEY LAKES
Table 2
Physiographic statistics for Lake Tanganyika.
world. Modern annual lake level variation is about 1 m (Edmond et
Latitude
03░20' - 08░48' S
al. 1993). Geologic processes have largely determined the shoreline
Longitude
29░03' - 31░12' E
substrates around the Lake. Of the 1 838 km shoreline perimeter, 43%
Age (years)
about 12 million
is rocky substrate, 21% is mixed rock and sand substrate, 31% is sand
Altitude (m)
773 above sea level
substrate and 10% is marshy substrate (Coenen et al. 1993).
Length (km)
673
Width (km)
12-90, average about 50
Climate
Surface area (km2)
32 600
Lake Tanganyika has two wet seasons in a year, March/April and
Volume (km3)
18 880
Shoreline perimeter (km)
1 838
December, with mean annual rainfall ranging from 1 200 mm in the
Maximum depth (m)
1 320 (northern basin), 1 470 (southern basin)
northern part to 1 600 mm in the southern part (Nicholson 1996). The
Mean depth (m)
570
interannual variability of rainfall is remarkably coherent throughout
Catchment (km2)
220 000
most of eastern Africa and is similar to that described for Lake Victoria
Stratification
permanent, meromictic
(see above).
Oxygenated zone (m)
70 (north), 200 (south)
Temperature (░C)
23-27
Physical limnology
pH
8.6-9.2
Most of Lake Tanganyika's water loss is through evaporation. Calcula-
Salinity ()
~0.46
(Source: modified from Coulter 1994)
tions from Lake Tanganyika's water budget suggest a water residence
time of 440 years and a fl ushing time of 7 000 years (Coulter 1991). Lake
A catchment area of 220 000 km2 feeds Lake Tanganyika (Table 2). The
Tanganyika, with an approximate surface area of 32 600 km2 and volume
Lake's average depth is 570 m, with a maximum depth of 1 320 m in
of 18 880 km3, contains 17% of the Earth's free freshwater (statistics from
the northern basin and 1 470 m in the southern basin, making it the
Hutchinson 1975, Edmond et al. 1993, Coulter 1994).
world's second deepest lake, after Lake Baikal. Lake Tanganyika is fed
by numerous small rivers and two major aff fl uent rivers; the Rusizi
Lake Tanganyika can be generally characterised by the limnological
River draining Lake Kivu to the north, and the Malagarasi River draining
parameters in Table 3 (Bailey-Watts 2000, Bailey-Watts et al. 2000).
western Tanzania south of the Lake Victoria Basin. A single outlet, the
Although permanently oligotrophic in appearance (Wetzel 1983),
Lukuga River, drains Lake Tanganyika, though the fl ow of this river
periodic phytoplankton blooms occur (Dubois 1958, Hecky & Kling
has changed direction in historical times (Beadle 1981). This river is a
1981, Coulter 1991, Salonen et al. 1999). It is stratifi ed into an oxygenated
tributary of the Congo River, which belongs to GIWA region 42, Guinea
upper layer, penetrating to about 70 m depth at the north end and 200
Current.
m at the south, and an anoxic lower layer, which constitutes most of
the Lake's water volume (Beauchamp 1939, Hutchinson 1975, Spigel &
Geology and geomorphology
Coulter, 1996). The oxygenated and anoxic layers generally do not mix,
Based on sediment accumulation rates in the Basin, geologists have
though wind-induced upwelling results in some mixing at the Lake's
estimated that Lake Tanganyika has existed for approximately 12 million
southern end (Spigel & Coulter, 1996). The temperature and pH of surface
years (Scholz & Rosendahl 1988, Cohen et al. 1993a). More recent studies
waters vary between 23-28░C and 8.6-9.2, respectively (Coulter 1994).
indicate that between 4.9 million years and 3.6 million years ago, the
proto-Lake Tanganyika corresponded to an approximately 400 km
Table 3
Basic limnological parameters for Lake Tanganyika.
long lake resembling the present-day lake between the latitudes
Parameter
Lakewide
Burundi
Tanzania
Zambia
3░ and 7░ S (Tiercelin & Lezzar 2002). At about 2 million years ago,
Transparency (m)
7-16
ND
ND
ND
a major episode of rifting associated with intense volcanism in the
Conductivity (ÁS/cm)
700
ND
ND
ND
Kivu Province resulted in the fi nal development of the Kivu and North
Chlorophyll a concentration (Ág/l)
ND
ND
1.5-6
4-14
Tanganyika lake basins (Ebinger et al. 1989, Lezzar et al. 1996) while the
Ammonium-nitrogen (mg/l)
ND
0.5-1.0
ND
ND
southward rift propagation along the Lake Tanganyika Rift resulted in
Nitrate-nitrogen (Ág/l)
ND
500-1 000
< 100
75-130
the fi nal morphology of the Mpulungu sub-basins at the southern end
Phosphate-phosphorous (Ág/l)
ND
500
7-8
12
of Lake Tanganyika from about 2 million years ago up to the present-day
Total phosphorous (Ág/l)
ND
ND
30
12
(Tiercelin & Lezzar 2002). Lake Tanganyika is the oldest of the African
Sulfate (mg/l)
ND
3-4
ND
ND
Lakes, and after Lake Baikal in Russia, it is the second oldest lake in the
Note: ND = No Data. (Source: data from Bailey-Watts 2000)
REGIONAL DEFINITION
21
Biological limnology
copepods, leeches and sponges. Table 4 (modifi ed from Coulter
The Lake's morphology, a steeply sided rift cradling a deep anoxic
1994) lists the numbers of species in Lake Tanganyika by taxonomic
mass capped by a thin oxygenated layer, has profound implications
grouping. The invertebrate species numbers are probably signifi cantly
for the distribution of organisms. Most of Lake Tanganyika's water mass
underestimated, as these groups in general have received relatively little
is uninhabited. Organisms are limited to the Lake's upper oxygenated
attention from taxonomists and in addition, much of Lake Tanganyika's
zone. Because of the steeply sloping sides of the Lake's basin, benthic
coast has not been adequately explored. Nonetheless, it is clear that
organisms (which rely on the substrate for at least some aspect of
this level of invertebrate diversity exceptional. Lake Tanganyika, with
their life cycle) are limited to a thin habitable ring fringing the Lake's
more than 2 000 species of plants and animals, is among the richest
perimeter which extends sometimes only tens of metres off shore.
freshwater ecosystems in the world.
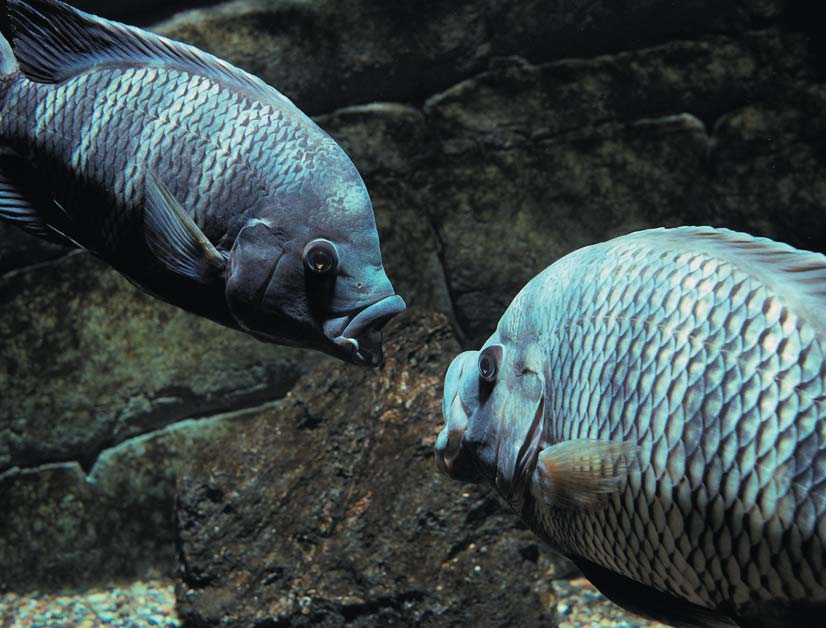
Like lakes Victoria and Malawi, Lake Tanganyika is famous for its
More than 600 of these species are endemic to the Tanganyika Basin,
endemic species fl ocks of cichlid fi shes (Figure 6). It hosts a large fl ock,
i.e. they are not found anywhere else. This includes a remarkable 98%
estimated to include more than 700 cichlid fi sh species (Snoeks 2000).
of the cichlid fi sh species, 59% of the non-cichlid fi sh species, 75% of
More than 250 cichlid species are parsed between several sub-fl ocks
the gastropod species, 60% of the bivalve species, 71% of the ostracod
(Snoeks et al. 1994). However, unlike the other African Great Lakes, Lake
species, 93% of the decapod species, 48% of the copepod species, 60%
Tanganyika also hosts species fl ocks of non-cichlid fi sh and invertebrate
of the leech species, 78% of the sponge species, and others, more than
organisms, including gastropods, bivalves, ostracods, decapods,
600 species in all, are unique to the Tanganyika Basin (Coulter 1994). It
Figure 6 Cichlids.
(Photo: Corbis)
22
GIWA REGIONAL ASSESSMENT 47 EAST AFRICAN RIFT VALLEY LAKES

Table 4
Inventory of species in Lake Tanganyika.
Taxon
Species
Endemic (%)
Algae
759
ND
Songwe
Aquatic plants
81
ND
Protozoans
71
ND
r
u
Cnidarians
2
ND
u
k
u
R
.
Sponges
9
78
N
u
uh
Ruh
Bryozoans
6
33
Flatworms
11
64
Tanzania
Roundworms
20
35
Segmented worms
28
61
Horsehair worms
9
ND
u
ur
Spiny head worms
1
ND
Ruk
Mzuzu
S.
Pentastomids (small group of parasites)
1
ND
Rotifers
70
7
Lake Malawi
Snails
91
75
Likoma island
Clams
15
60
Arachnids (spiders, scorpions, mites, ticks)
46
37
Crustaceans
219
58
Insects
155
12
angwa
Dw
Mozambique
Fish (family Cichlidae)
250
98
a
Fish (non-cichlids)
75
59
Bu
Lichinga
Amphibians
34
ND
Malawi
Reptiles
29
7
e
gw
Birds
171
ND
Lilon
Lilongwe
Mammals
3
ND
e
ip
Total
2 156
Linth
Note: ND = No Data. (Source: modified from Coulter 1994)
Landcover
Shire
is thought that the proto Lake Tanganyika was colonised by organisms
Mozambique
Barren
from the ancient Congo River system (which pre-dates the Lake), and
Cropland
these pioneer species evolved and radiated within the Lake Basin,
Forest
creating the great diversity (Coulter 1994). In many cases these taxa
Savannah
also represent endemic genera and sometimes endemic families. With
Blantyre
0
50
Kilometres
its great number of species, including endemic species, genera and
ę GIWA 2003
families, it is clear that Lake Tanganyika makes an important contribution
Figure 7
Lake Malawi Basin.
(Source: data from Loveland 2000)
to global biodiversity. Lake Tanganyika is an extraordinary biological
system and it provides a natural laboratory for investigating a myriad of
Tanganyika, and the second most voluminous after Lake Tanganyika. The
evolutionary and ecological questions (e.g. Michel et al. 1992).
total catchment area is small for a lake of this magnitude: 126 500 km2 of
which 97 750 km2 is land catchment (Drayton 1984).
Lake Malawi
Lake Malawi is known by a diff erent name in each of its three riparian
A narrow strip along the eastern shore, comprising 7% of the total
countries. In Malawi, it is called Lake Malawi, in Mozambique, it is called
land catchment, is shared between Mozambique and Tanzania
Lake Niassa, and in Tanzania, Lake Nyasa. Lake Malawi is long and narrow
(Eccles 1984). A further 19% consisting of the Ruhuhu Basin (11%), the
and the southernmost of the Western Rift Valley Lakes (Figure 7). The
northern lakeshore and highlands (6%) and part of Songwe Basin (2%)
Lake merits the adjective "great" by almost any measure, e.g. area, depth,
lie in Tanzania. The main part of the catchment, 51%, lies entirely within
age, diversity, but most assuredly it is a great resource for its riparian
Malawi (Eccles 1984). Most of the catchment lies in areas where the
peoples. Lake Malawi is the fourth deepest inland water body in the
natural vegetation are Brachystegia-Julbernardia woodland, although
world, with its greatest depths (700 m) extending below sea level.
considerable areas of the drier southern lakeshore littoral were covered
With a surface area of 28 800 km2, it is the ninth largest by area and the
by forest and dominated by Acacia species, dependent on groundwater
fourth largest body of freshwater on the globe. The Lake is the third
from the Lake or from the escarpments (Eccles 1984).
largest in Africa with respect to surface area after Lake Victoria and Lake
REGIONAL DEFINITION
23


Geology and geomorphology
which rise over 2000 m above the Lake's surface and in many places,
The Lake Basin is situated at the southern end of the western arm of the
especially in its northern half, fall as precipitous escarpments to the
East African Great Rift Valley. The geology of the catchment is relatively
shore and continue underwater with undiminished gradient to great
simple, with most of the Basin consisting of ancient metamorphic
depths (Beadle 1981). This morphological feature has developed from
rocks and granites of the basement complex with scattered coverings
the pattern of rift faulting, where the lake depression consists of series
of Cretaceous sediments in the south, more recent Cenozoic lake
of grabens and half grabens (Johnson & Ng'ang'a 1990).
sediments along parts of the western and southern lakeshores and,
in the north, volcanics of the Rungwe volcanic fi eld in Tanzania. The
Ribbink et al. (1983) note that relative to the sculptured coastline of Lake
process of rifting was accompanied by regional uplift which reinforces
Victoria, Lake Malawi has a smooth coast with few major indentations
the dramatic topography created by graben formation. The age of the
or notable bays. About 70% of the coastline consists of gently sloping
Lake has been estimated to be about 2 million years (e.g. Fryer & lles 1972,
sandy beaches, vegetated areas and swamps. Steep rocky shores
Crossley 1979, Owen et al. 1990) This is, however, an estimate of the time
when the Lake assumed roughly its present form and in which water was
Table 5
The islands and reefs of Lake Malawi.
continuously present (Patterson & Kachinjika 1995). More recent studies
Island
Comment
Bandakusha
Off Bandwe Point. Also called Mphandikusha.
indicate that at about 8.6 million years ago, faulting associated with
Boadzulu
initial volcanic activity in the proto-Rungwe volcanic province resulted
Chemwezi
Chinduga Rocks
Between the Maleri Islands and Chipoka harbour
in a broad asymmetric lake basin prefi guring the northern part of Lake
Chinyamkwazi
Malawi (Ebinger et al. 1989). A major expansion of lacustrine conditions
Chinyamwezi
Chirwa
South of Chilumba
in the Lake Malawi basin about 3.6 million years ago is recorded from
Chisumulu
the fossiliferous Chiwondo Beds as a consequence of a wetter climate
Machili
Membe
(Bromage 1995) in Central and Eastern Africa. Basin subsidence and rift
Chitande
Off Chilumba
tectonics continued up to 450 000 years ago (Tiercelin & Lezzar 2002)
Crocodile Rocks
Domwe
(see Figure 8). The present day lake is fl anked by mountain ranges
Eccles Reef
Harbour
Southern entrance of Monkey Bay
Kanchedza
South of Monkey Bay
Kande
Katale
Near Chilumba
Likoma
Maingano
Masimbwe
Mbamba
Mbuzi
Lundo
Northeast of Mbamba Bay
Maleri
Nakantenga
Nankoma
Mara Rocks
Off Usisya
Mara/Mala Rocks
Off Mara Point 4 nautical miles south of Cobue
Mbamba
Off Mbamba Bay Tanzania
The Rift Valley was flooded and colonised by riverine fishes
Mbenji
Fuawe
Mbowa
Off Usisya
Mehlsaeka Rocks
Between Mbamba Bay and Liuli
Mpandi
Southern eastern Arm
Mphandi
South of Usisya
Mumbo
Namalenji
Ngkuyo
Southeast of Mbamba Bay
Ngkuyo Reef
Southeast of Mbamba Bay
Otter
Off otter point, Lake Malawi National Park
Papia
Luili
Tchulutche Reef
Off Metangula
Thumbi East
Thumbi West
West Reef
Figure 8
Formation of the African Rift Valley Lakes.
Zimbabwe
(Source: redrawn from Ribbink 2001)
(Source: GIWA Task team)
24
GIWA REGIONAL ASSESSMENT 47 EAST AFRICAN RIFT VALLEY LAKES
compose the remaining 30%. The topography of the lake bottom
Table 6
Physical and physico-chemical characteristics of Lake
is poorly known. However, trawling records and data from bottom
Malawi.
profi les collected by research vessels indicate that, in the oxygenated
Physical & physico-chemical characteristics
Area (km2)
28 800
regions at least, most of the bottom is sandy or of mud, sometimes
Max. depth (m)
706
being more of an organic ooze in nature (Ribbink et al. 1983). There
Mean depth (m)
290-426
Depth of oxygenated water (m)
170-210
are numerous islands, islets and rocky reefs/outcrops in the Lake. Table
Altitude (m)
471
Proportion below sea level (m)
230
5 present 47 of the major islands and reefs. A feature of all islands is
Shoreline length (km)
1 500
that the dominant habitat is rocky, with many of the smaller islands
Max lake length (km)
569
Max lake width (km)
87
and reefs being exclusively of rock (Ribbink et al. 1983, Konings 1995).
Mean width (km)
50-60
Secci disc transparency (m)
12-20
The exceptions are the larger islands, Likoma and Chizumulu, which
pH surface
7.9-9.1
do support beaches. The largest island is Likoma, which has several
pH 300 m
7.8
Conductivity surface (S/cm)
215-225
beautiful beaches in addition to its rocky shores.
Conductivity 300m (S/cm)
200-230
Primary productivity (g/m/year)
252
Total catchment (km2)
126 500
Climate
Land catchment (km2)
97 750
Hypolimnion (m)
Below 230
The Lake Basin has a tropical continental climate with maritime
Metalimnion (m)
125-230
infl uences from the Mozambique Channel to the east. Regional climate
Epilimnion (m)
0-125
Volume of hypolimnion(km3)
Ca 2 800
ranges from tropical, warm and semi-arid to sub-tropical and humid
Volume of metalimnion (km3)
Ca 2 600
Volume of epilimnion (km3)
Ca 3 000
and is strongly infl uenced by altitude and the large surface area and
Volume (km3)
Ca 18 400
volume of water of the Lake. Although the Lake has a tropical setting it
Major inflowing rivers
9
Outflowing rivers
1
is suffi
ciently far south to experience marked seasonal variations (Eccles
Inflow (km3/year)
29
Precipitation over lake (km3/year)
41
1974, 1984). The Basin experiences three seasons. A "cool" dry period
Inflow: Malawi (%)
43
from May to August when air temperature at the lakeshore may drop to
Inflow: Mozambique (%)
4
Inflow: Tanzania (%)
53
15░C, though the daily average is 20ş22░C. This period is characterised
Outflow (km3/year)
12 ca (20%)
Evaporation (km3/year)
54 ca (80%)
by strong southeasterly winds that are locally referred to as the Mwera.
Annual fluctuation in level (m)
0.4-1.8
From September to November it is very hot and dry with a daily average
Proportion of world's total available
7
surface freshwater (%)
air temperature around 28░C, but exceeding 40░C from time to time.
Flushing time (year)
750
Residence time (year)
140
From late November to April is the rainy season, which is usually of
Age (year)
Ca 2 million
shorter duration in the southern than in northern part of the Lake Basin.
Number of lake basins
1
Wet season: southern part
November to March
The annual amounts of rainfall average less than 800 mm in the Rift
Wet season: northern part
December to May
South easterly winds (Mwera)
May to September
Valley area, 800-1 000 mm in the Medium-Altitude Plateaux, and from
Northerly winds (Mpoto)
November to March
1 000-1 500 mm in the High-Altitude Plateaux. The prevailing winds
Fish landings (tonnes/year)
60 000
Temperature hypolimnion (░C)
22.1-22.75
during the wet season are northerly and average daily air temperatures
Temperature metalimnion (░C)
22.5-23.5
are 25░C. The lake level rises during the wet season, from rain that falls
Temperature epilimnion (░C)
23.0-29.5
Note: More than one fi gure indicates either the extremes of natural range, as in temperature, or
both on the Lake and in the catchment, giving annual fl uctuations of
extremes in estimates by diff erent sources of information.
(Source: Beadle 1981, Gonfiantini et al. 1979, Drayton 1984, Eccles 1984, Johnson & Ng'ang'a 1990,
level between 0.4 m and 1.8 m. Most of the region receives adequate
Crul 1997, Craig 1992, Patterson & Kachinjika 1995, Government of Malawi 1998).
rainfall for rain-fed agriculture, although there is evidence that droughts
have become more common in the recent years (e.g. Clay et al. 2003).
stratifi cation follow seasonal patterns. Surface water temperatures of
In the high altitudes of the mountains that surround the Lake, air
the open lake range from 23░C in the cool windy season to 28░C in
temperatures are considerably lower, and approach zero at night in
the warm season (Eccles 1974). In more sheltered areas the lake surface
some particularly high elevations of the Nyika Plateau and Livingstone
temperature can be close to 30░C. Below 250 m the temperature is
Mountains.
constantly between 22.5░C and 22.75░C (Gonfi antini et al. 1979), but
above that depth there is a seasonal cycle of stratifi cation (Figure
Physical limnology
9a). From September to December there is a warming of the surface
The principal characteristics of the contemporary Lake are summarised
waters and stratifi cation strengthens. By May the upper 60-90m is
in Table 6. By virtue of its tropical setting, the Lake is permanently
homothermal at about 27░C (Eccles 1974) (Figure 9a). The beginning
stratifi ed thermally (Eccles 1974), though water temperatures and lake
of the cool, windy season heralds a weakening of the thermocline,
REGIONAL DEFINITION
25
Temperature (░C)
23 24
23
25
23
25
27
23
25
27
23
25
22
23
24
25
26
27
200
100
(m)
18 Aug 1958
2 Oct 1958
16 Dec 1958
7 Apr 1959
31 Jul 1959
400
Depth
200
600
5 Aug 1939
21 Jul 1956
4 May 1964
a
300
Temperature (░C)
22
23
24
0
1
2
ÁM P
0
10
20 ÁM N
0
O2
200
NO -
3 -N
100
(m)
(m)
Depth
Depth
400
200
Si
SRP
300
NH +
4 -N
600
Temp ░C
O
ppm
2
SiO
ppm
2
0
100
200
b
c
5
10
ÁM O , Si
2
ppm
Figure 9
Temperature, oxygen and dissolved nutrient concentrations in Lake Malawi.
(a) Temperature and depth profiles showing seasonal development of stratification at a standard station off Nkhata Bay. The profile for 18 August 1958 shows the closest recorded approach to a
homothermal condition (from Eccles 1974 after Iles 1960). The illustration on the extreme right shows the temperature depth profile at the deepest point in the Lake. It also indicates a slight warming
of the hypolimnion between 1939 and 1964 (from Eccles 1974 after Beauchamp 1953).
(b) Profiles of temperature, oxygen and silica at the deepest point of the Lake showing complete deoxygenation at approximately 230 m (from Eccles 1974 after Jackson et al. 1963).
(c) Nutrient and oxygen profiles of the Lake showing deoxygenation with increasing depth and an accumulation of nutrients in deep water (After Bootsma & Hecky 1993).
(Source: redrawn from Ribbink 2001)
so that by July it is poorly defi ned and there is a gradual temperature
Because of the Lake's great depth, wind energy applied to its surface is
gradient of 23░C at the surface to 22.5░C at 250 m. In addition to the
unable to mix the water column beyond 200 m at any time during the
primary thermocline there are shallow diurnal thermoclines that form
annual meteorological cycle; full atmospheric exchange is restricted
on warm calm days. Furthermore, internal waves exist, which may have
to the surface mixed layer which can be as little as 40 m. The surface
an amplitude of 50 m and a periodicity of 16 to 30 days (Jackson et al.
waters, therefore, are well oxygenated, but the oxygen content
1963, Eccles 1974). There is some evidence of warming of the Lake over
decreases with depth until the waters become anoxic between 170 and
time (Figure 9a, extreme right).
210 m depth (Figures 9b-c). All waters deeper than this are devoid of
aerobic life. Thus, in addition to being thermally stratifi ed, the Lake also
26
GIWA REGIONAL ASSESSMENT 47 EAST AFRICAN RIFT VALLEY LAKES
shows marked oxygen and nutrient gradients (Figures 9b-c). The deep-
are suspicions that currents of considerably greater magnitude occur
water anoxia is created by the decomposition of the rain of organic
from time to time. Currents of considerable velocity are recorded on
sediments produced by algal photosynthesis in the well-illuminated,
the navigational charts for the Lake, particularly between Likoma and
euphotic zone of the surface mixed layer. This constant rain of organic
Chisumulu (2 to 3 knots, i.e. nearly 6 km/hour). Indications from the
matter produced in the Lake, in addition to the mineral and terrestrial
movement of plumes and orientation of sand spits on the shoreline
material brought in from the atmosphere and via rivers, transports
suggest that there is a clockwise circular surface current within the Lake.
nutrients into the deep water. Because of the lack of annual turnover
An appreciation of the currents of the Lake may be fundamental to an
of the Lake's volume, as occurs in temperate great lakes, nutrients
improved understanding of some of the major processes.
accumulate to high concentrations in the deep water (Figures 9b-c). The
upper limits on the deep-water nutrient concentrations are determined
The available evidence suggests that natural water circulation of the Lake
by the rate of downward transport by sedimentation, regeneration of
is controlled by winds and radiant energy exchange as well as inputs to
dissolved nutrients from the sedimentary material and the slow return
the Lake from rivers. The lengthwise orientation of the Lake coincides
of nutrients through vertical exchange of the deep water with the
with the southeast winds (Mwera), which dominate the atmospheric
upper 200 m. This vertical exchange of water is slow, with the present-
fl ows of southern Africa. The long, narrow structure constrains horizontal
day deep water having formed more than 50 years ago on average.
circulation. The channelling of the southeasterly winds, especially in July
The physical mechanisms that control this deep-water exchange are
through August, creates a persistent upwelling system: the winds push
still poorly understood but because of the huge mass of nutrient rich
surface waters north, to be replaced with deeper, cooler waters in the
water at depth, any acceleration or slowing of this exchange will have
south; nutrients can be cycled from the nutrient sink in the deep anoxic
signifi cant eff ects on the Lake's biological productivity.
water by these upwellings (Figure 10), and perhaps by the internal
waves (Eccles 1974). Return currents from the north occur primarily at
Currents are common in the Lake and can aff ect nutrient cycling,
depth and cause disturbance and further mixing across the interface
plume dispersal, fi sh feeding (Fryer & lles 1972), fi shing, boat activity
of warm surface waters with deeper, cooler, nutrient rich water (Figure
and swimmers. However, most reports regarding surface currents
10). Although this upwelling system is unable to overcome the Lake's
are anecdotal with little indication of the existence, force, direction,
meromixis (permanent stratifi cation) it does ensure a steady renewal
timing, generation, speed and volume of water involved in currents.
of nutrients to the upper mixed layer with maximum nutrient loading
Eccles (1974) reports currents of 0.5 km/hour, and Hamblin et al. (1999)
in June through August. This upwelling system is the basis of the
have recorded surface currents of a little over 0.83 km/hour but there
productive fi sheries in the southern arms of the Lake.
Mwera Wind
Mwera Wind
Mwera Wind
N
Photonic zone
S
Epilimnion
Metalimnion
Upwelling
Hypolimnion
-Nutrient rich
Oxic-anoxic border
-Anoxic
-Dense
-Cool
-Relatively stable
Figure 10 Surface winds, water movement and upwelling in Lake Malawi.
The southeasterly wind (Mwera) blows up the length of the Lake causing mixing, especially in the photic layer. It pushes the warmer waters northwards, tilting the stratification in the southerly portion
and upwelling occurs, carrying nutrient rich waters to the fishing grounds. When the wind stops blowing, as it does periodically through the Mwera season, then the Lake tends to bounce back causing
seiches and internal waves. These in turn facilitate some mixing of deeper waters and a retrieval of a small part of the nutrient rich deep water and internal waves. These in turn facilitate some mixing of
deeper waters and a retrieval of a small part of the nutrient rich deep water.
(Source: redrawn from Ribbink 2001)
REGIONAL DEFINITION
27
The river infl ows to the Lake are mostly rather short from the
catchments. The only outfl owing river, the Shire, exits to link Lake
escarpments and nearby mountains, and their volume depends
Malawi to Lake Malombe (Figure 7). Jackson et al. (1963) subdivided
directly on the rainfall in the catchment of each stream or river. The
river habitats into upper, middle and lower reaches as well as estuaries.
hydrology is delicately balanced. The level of the Lake and the volume
According to Jackson et al. (1963), the upper reaches are fast fl owing,
of the outfl ow react rapidly to changes in local rainfall between wet
"cold" and highly oxygenated. In the middle and lower reaches the
and dry seasons as well as to longer term fl uctuations (Spigel & Coulter
water slows and becomes warmer; macrophytes (reeds in particular)
1996). These changes may transform certain inshore habitats. Except
are common.
where the escarpments drop directly into the Lake, there are coastal
plains of varying width, which are alternately fl ooded or exposed. The
The broad physical aquatic habitats represent ecological zones within
water level changes can have marked impacts on fi sh catches because
the Basin, each supporting unique communities of organisms, and
the fl oodplains act as very productive nursery areas. The outlet via the
each playing a role in the ecological and evolutionary processes
Shire River to the Zambezi is intermittent, with seasonally dependent
that sustain the biodiversity of the Lake (Ricardo-Bertram et al. 1942,
fl ow rates. The rise and fall of the Lake is seasonal but also exhibits
Jackson et al. 1963, Beadle 1981, Ribbink et al. 1983, Konings 1995). Each
longer-term trends (Eccles 1974, Beadle 1981, Bootsma & Hecky 1999).
of these broad habitats can be subdivided into fi ner resolution and,
For example, from 1896 there was a progressive fall to a minimum in
partly due to the third dimension of aquatic habitats, each of these
1915, at which time the outfl ow ceased. From then on the level rose
subdivisions (sometimes called micro-habitats e.g. Fryer 1959, Jackson
steadily to a maximum in 1935 when, in the wet season, it was about 6
et al. 1963, Fryer & lles 1972, Ribbink et al. 1983, Ribbink 1991) also
m above the maximum of 1915. At this point the outfl ow was resumed
support identifi able communities of organisms. These subdivisions are
once the sand bar that had been built up during the low period was
related to substratum type as well as factors such as depth, exposure
breached. More recently, in 1997, the level dropped so low that the
to wave-action and water fl ow. Associated with depth are changes in
hydroelectric plant on the Shire River was threatened by the possibility
light penetration, aff ecting photosynthesis and visibility, and in oxygen
of not having suffi
cient water to drive it. As Malawi is heavily dependent
availability; all of these factors have individual and cumulative eff ects on
on this electricity source, great concern was engendered.
the distribution of organisms within the Lake. Limnological factors, such
as nutrient cycling, currents and upwelling (both currents and upwelling
Hydrology and biology
can be wind generated) have impacts on those processes that maintain
Lake Malawi has more species of fi sh than any other lake in the world.
productivity and that regulate the distribution of organisms.
The Lake contains a large fi sh fauna comprising some 800 species from
14 families; 99.9% of the cichlids are endemic (Ribbink 2001). The cichlid
fi sh communities of the inshore regions are the richest, most diverse,
most stenotopic, and hence the most vulnerable to fi shing pressure
Socio-economic characteristics
(Ribbink 2001). Many of these fi shes are colourful and highly sought
after by the aquarium trade. The inshore distribution of these fi shes
Lake Turkana
and their inquisitive behaviour make them attractive to view and adds
Population and infrastructure
immeasurably to the tourism potential of the Lake. The existence of this
The area is populated with Turkana pastoralists to the west (Turkana
biodiversity has attracted international interest and together with other
District, Kenya) and Gava pastoralists to the east (Marsabit District,
resource use of this international lake has led to the implementation of
Kenya) of the Lake respectively. The Karo, Hammer and Geleb pastoralists
the SADC/GEF Lake Malawi Biodiversity Conservation Project.
occupy the lower Omo Valley in Ethiopia. Those living to the west and
east of Lake Turkana are mostly nomadic, but a few are fi shermen. Those
More than 260 rivers fl owing into the Lake are depicted by the National
in the lower Omo Valley are subsistence agriculturalists in the north
Atlas of Malawi (Government of Malawi 1985). This is probably an
and agro-pastoralists in the south extending to the Kenya border. They
underestimate, as the Mozambique and Tanzanian coasts, although
obtain their water from Lake Turkana and the surrounding seasonal
included in the atlas, were not given as much detailed attention as the
rivers. In the catchment area as a whole, the population is estimated
Malawi coast. The vast majority of these rivers are short, being less than
at 15.2 million out of which 12.3 million live in the Ethiopian part of
10 km in length, and fl ow in the wet season only. Many of the smaller
the catchment (GIS analysis based on ONRL 2003). There is a good
rivers are in the steeply shelving parts of the shoreline, cutting their
tarmacked access road from the major towns in the south to Lodwar,
way down the mountainsides from their small, but steeply sloping
the district headquarters of the region in Kenya. The Turkana area itself
28
GIWA REGIONAL ASSESSMENT 47 EAST AFRICAN RIFT VALLEY LAKES
has very scarce and poor roads and telecommunication facilities. Both
Fishing takes place both in the unprotected Omo River delta (Hughes
Lodwar and Kalokol towns have well maintained airstrips, and there is
& Hughes 1992) and in the Lake. Based on measured primary
a fairly regular fl ight schedule between Kalokol and Nairobi, Kenya's
phytoplankton productivity, an empirical model predicted a total fi sh
capital city.
yield of 22 000 tonnes per year for Lake Turkana, and the sustainable
yield of traditionally exploited fi sh from the off shore areas of the Lake is
Socio-economic activities
estimated at 15 000 to 30 000 tonnes per year (Kallqvist et al. 1988). The
The Turkana-Marsabit region bordering Lake Turkana to the west and
development of commercial fi sheries began about 1961 at Ferguson's
east, respectively, is classifi ed as one of the poorest regions in Kenya.
Gulf (Hopson 1982). The number of people estimated to be involved
Calorie intake is well below the UNICEF minimum of 2 000 per day.
in commercial fi sheries in Turkana District in 1982 was 30 000 to 40 000
Investment levels are extremely low and consequently the employment
(Kallqvist et al. 1988). Reduced fi sh landings and marketing problems
levels. The mainstay of the economy is fi shing and subsistence
subsequently led to fi sheries being much less profi table: the main
farming, mainly sorghum, maize and millet. Fishing is largely done for
reason for the decline in fi sh landings was the collapse of the tilapia
subsistence. There has been an attempt to introduce commercial fi sh
fi sheries in the Ferguson's Gulf area (Kallqvist et al. 1988). The quantity
farming but this eff ort has not been successful because of the high
of fi sh landed has thus drastically reduced due to under-exploitation,
investment in trawling and shipping. The rest of the economy in this
and today Lake Turkana has less than 3% of total fi sh catches in Kenya
area comprises livestock rearing, especially goats and zebu cattle, The
(Table 8). The number of fi shermen along the west shore of the Lake
vegetation and/or land use within the catchment area is as shown in
has, however, increased to 58 263 (Republic of Kenya 2002b). This
Table 7 (World Lakes Database 2002).
suggests that the fi shing activities are mainly for subsistence. The
fi sheries industry of Lake Turkana is currently operating way below its
Table 7
Land use in the Lake Turkana catchment.
sustainable yield limit.
Area
Area
Land use
Note
(km2)
(%)
p
e
Health
Woody vegetation (semi desert scrub, mainly acacias)
6 543
5
Vector-borne diseases include many tropical ailments, such as malaria,
l
l
a
ndsca
Herbaceous vegetation (semi-desert grassland with
58 887
45
onchocerciasis, and leishmaniasis (CIHI 1996). Diarrhoeal diseases,
a
tura
N
annual and perennial scrub)
which typically result from contaminated drinking water or food, affl
ict
No fertiliser
a
nd
Crop field
3 272
2.5
L
applied
a signifi cant proportion of children and adults throughout Kenya (CIHI
Occasionally
1995). Other common diseases related to quality of water and sanitation
Pasture
62 159
47.5
A
g
r
i
cultural
millet fields
include intestinal worms, schistosomiasis, common eye infections such
Total
130 860
100
as trachoma, and skin diseases (CIHI 1995 and 1996). Guinea worm is
(Source: World Lakes Database 2002)
endemic in the Lake Turkana Basin (CIHI 1995 and 1996). Malaria is
Table 8
Quantity of fi sh (tonnes) landed in Kenya, 1965-1968.
becoming an increasingly signifi cant public health problem in Ethiopia
Source
1965
1970
1975
1980
1985
1990
1995
1998
with perennial transmission taking place near bodies of water, swamps
and irrigation projects (CIHI 1996). In the low-lying, dryland areas around
Lake Victoria
13 000
16 988
16 581
26 914
88 589 185 101 181 888 158 876
Lake Turkana, there is little information on malaria incidence. However,
Lake Turkana
1 095
4 854
4 236
12 384
7 460
3 180
2 232
4 268
in this area, malaria is probably unstable and epidemics may occur only
Others*
3 050
4 003
1 993
2 988
2 630
2 552
2 591
3 709
in years with substantial rainfall (cf. Warsame 1991). Malaria incidence
Fish farming
130
ND
ND
596
1 085
975
1 083
217
and mortality in Ethiopia are thought to be rising due to drug shortages,
insuffi
cient health care services, increasing drug resistance, and the
Total freshwater catch
17 275
25 845
22 810
42 882
99 764 191 808 187 794 167 070
diverse distribution of mosquito vectors (CIHI 1996).
Marine catch
5 725
7 910
4 531
5 336
6 209
9 972
5 995
5 522
Total fish catch
23 000
33 755
27 341
48 218 105 973 201 780 193 789 172 592
Legal and institutional framework
Lake Victoria, share of
56.5
50.3
60.7
55.8
83.6
91.7
93.9
92.1
Drought-related poor food security, insecurity because of wars in
Kenyan fish catch (%)
bordering countries, cattle rustling, ethnic confl icts over grazing
Lake Turkana, share of
4.8
14.4
15.5
25.7
7.0
1.6
1.2
2.5
Kenyan fish catch (%)
grounds, chronic water scarcity, lack of adequate health facilities and
Notes: Others* include other freshwater sources of fish such as lakes, rivers and dams.
health care, poverty, and deforestation are the major political and
ND= No Data.
(Source: Ikiara 1999, updated from Republic of Kenya Economic Survey 1999)
management concerns in the Basin.
REGIONAL DEFINITION
29
currently support about 21 million people in the Basin, with average
New national environmental policies/acts have been enacted in
incomes in the range of 90ş270 USD per year (World Bank 1996). The
both Ethiopia (1997) and Kenya (1999), and environmental authorities
Lake Basin as a whole (lake and catchment) provides for the livelihood
have been set up to implement the policies which seek to promote
of about one third of the combined population of the three East Africa
sustainable environmental management and development. There are
Community Partner States (Kenya, Tanzania and Uganda), and about
no specifi c laws relating to the use of the Lake Turkana or its affl
uent
the same proportion of the combined gross domestic product. Most
river waters, though each country has a water act that covers the use
of the population living along the lakeshore relies directly or indirectly
of waters in all water bodies within the respective countries. The
on the fi shing trade, thus loss of fi sheries has serious socio-economic
new Kenya Water Act (2002) provides for the establishment of Water
implications. While aspects of the future of the Lake such as its
Resources Management Authorities that will have wide-ranging powers
peoples and their activities, environment, climate, agriculture, tourism,
to manage and protect water resources at river or lake basin scales.
industry, commerce, history and geography are of immense interest to
One of the important new regulations in this Act is the recognition
researchers, economic managers and policy planners, the Lake's fi shery
of, and provision for, the public and communities to participate in
tends to receive the greatest attention.
managing the water resources within each catchment area. The
District Development Plans (2002ş2008) for Turkana District (west of
Major economic sectors
Lake Turkana) and Marsabit District (east of Lake Turkana) in Kenya have
The gross economic product in the Lake Basin lies between 3 and
the following priority issues in relation to water resources: improvement
4 billion USD annually (World Bank 1996), and an estimated population
of fi sh production; environmental conservation, improvement of rural
of roughly 30 million people whose incomes are estimated to lie within
water supply and sanitation; disaster management (e.g. droughts,
the range of 90-270 USD per capita per year. The major economic sectors
degradation of natural resources); and improving the tourism potential
in the Lake Victoria Basin, in terms of their contributions to total GDP
of the lake districts (Republic of Kenya 2002a and b).
and employment creation for the countries, are fi sheries, agriculture
and manufacturing. In Tanzania the agriculture sector contributes about
Both countries subscribe to the Desertifi
cation Convention.
45% of total GDP, while manufacturing contributes 7.4% of the total GDP.
Kenya is now a signatory to the Ramsar Convention. One of the
The fi sheries sector contributes about 3% to the GDP of Tanzania and
proposed national actions is to collaborate with Ethiopia to accede
Uganda and 0.5% to the GDP of the Kenyan economy (Bwathondi et
to the Ramsar Convention and to undertake joint transboundary
al. 2001, URT/JICA 2002).
wetland conservation programmes for the Lake Turkana/Omo River
transboundary wetlands.
Fish has traditionally been the most aff ordable source of animal
protein with an average regional per capita consumption of about
Lake Victoria
12 kg (Bwathondi et al. 2001). Tilapia is preferred by about 70% of the
Population and settlements
consumers on average (SEDAWOG 1999, URT/JICA 2002) around the
The Lake Victoria Basin supports one of the densest and poorest rural
Lake with consumers from the Tanzania side of the Lake preferring
populations in the world, with human population density being well
Tilapia by more than 75% (URT/JICA 2002). The fi shing industry
over 100 persons per km2 (Cohen et al. 1996) and up to 1 200 persons
provides employment for between 0.5 and 1 million Ugandans, more
per km2 (Hoekstra & Corbett 1995). It is thus the most heavily populated
than 0.8 million Tanzanians and 0.8-1.5 million Kenyans, and most of the
basin within the East African Rift Valley Lakes region. It is multi-ethnic
fi sh landed in these countries come from Lake Victoria (Bwathondi et al.
in composition, comprising various communities from Kenya, Uganda,
2001). Lake Victoria contributed 48.3% of the fi sh landed in Uganda in
Tanzania, Burundi and Rwanda. The population of the region is
1994, 90% of the fi sh landed in Kenya in 1998, and 60% of the fi sh landed
expected to double within the next two decades (World Bank 1999).
in Tanzania in 1998 and 2001 (Bwathondi et al. 2001).
The annual population growth is 2ş4% in most parts of the Lake Basin
but urban population growth is over 5ş10% per year in most of the
It is estimated that the present value of annual export earnings from
larger towns (Scheren et al. 2000).
the fi shery is about 600 million USD, which represents revenue to
the lake community of 240-480 million USD per year (Duda 2002).
Socio-economic activities
The main/target species in the fi sheries sector is the Nile perch. The
The Lake catchment is mainly (80%) an agricultural catchment (Majaliwa
Nile perch fi sheries produces about 300 000 tonnes of fi sh per year in
et al. 2000). Subsistence agriculture, pastoralism and agro-pastoralism
Lake Victoria (FAO 1998), a market that technically did not exist prior
30
GIWA REGIONAL ASSESSMENT 47 EAST AFRICAN RIFT VALLEY LAKES
to the introduction of that species in the late 1950s. However, there
Legal and institutional framework
are concerns that this income generation is not benefi ting the local
It is only recently, during the past 10 years or so, that the East African
peoples; they lost their favourite species and the perch is harvested
countries have instituted, at government level, policies on the
for foreign markets. The latter is one reason why fi sh consumption has
environment that adopt an integrated and sustainable approach to
declined and there is concern about malnutrition in Lake Victoria region
environmental management. It is, therefore, refreshing that institutions
(Kaufman 1992, Jansen 1997). The fi shery that was multi-species before
that consider conservation and sustainability as priority issues in the
1980 is now a three species fi shery dominated by the Nile perch (Lates
conservation of environmental resources are now beginning to get a
niloticus), Nile tilapia (Oreochromis niloticus) and the native sardine-
foothold in the management of the Lake Victoria Basin. Overwhelmingly,
like cyprinid locally known as Omena/Dagaa/Mukene (Rastrineobola
the politics of management and ownership of Lake Victoria fall into the
argentea). There are currently 31 licensed fi sh processing factories in
larger context of the establishment and development of the East African
the Lake Victoria region (Ntiba et al. 2003).
Community (EAC) (EAC 2001). Within the Community, two institutions
on Lake Victoria have been established. These are Lake Victoria Fisheries
Within the Lake Victoria Basin, there are large-scale farms of coff ee, tea,
Organisation (LVFO), which is specifi c for fi sheries, and the Lake Victoria
cotton, rice, maize, sugar and tobacco (Ntiba et al. 2001). On a more
Development Programme (LVDP) covering general development
local scale, the extensive papyrus that fringes the Lake is harvested for
matters of the Basin. During the 1990s, two other projects were
thatching houses and making carpets/mats. Agricultural production
established, namely, the Lake Victoria Fisheries Research Project (LVFRP),
has increased with the increase in population, for example, between
fi nanced by the European Union, and the Lake Victoria Environmental
1958 and 1988, the population increased by 30% and the agricultural
Management Project (LVEMP), fi nanced by the World Bank and the
production increased by 50% (FAO 1991). In 1995, it was estimated that
Global Environmental Facility (GEF) (Bwathondi et al. 2001). The LVFRP
32% of the catchment land area was under cultivation (Scheren et al.
Phase II, implemented by the research institutes of the riparian countries
2000). For the past two to three decades, subsistence farming without
of Kenya, Uganda and Tanzania, started in June 1997. Its main objectives
proper agronomic practices was the main type of activity being carried
were to encourage sustainable development of the Lake Victoria Basin
out in the lake catchment, and which has led to land degradation by
by assisting the LVFO in the creation and implementation of a viable
enhancing soil erosion (Meertens et al. 1995).
regional management of the lake fi sheries (Bwathondi et al. 2001). The
Lake Victoria Regional Local Authorities Cooperation (LVRLAC) was set
In the manufacturing sector, there are e.g. breweries, sugar refi neries,
up in 1997 to begin to collaborate in addressing the region's socio-
soft drink and food processing factories, oil and soap mills, leather
economic concerns in relation to the deteriorating conditions of Lake
tanning factories, mining companies and textiles (Ntiba et al. 2001).
Victoria and its surroundings (Kiyaga-Nsubuga 2002).
Areas where water-related engineering activities/structures are located
The EAC Partner States recognise three important and convergent
are Yala swamp (Kenya), Sondu-Miriu Dam (Sondu-Miriu River, Kenya)
issues relating to Management of Shared Waters. These are fi rstly,
and Owen Falls Dam (Nile River outlet, Uganda). The Lake Victoria water
that they share an interest in the well-being of the Lake and its living
is mainly used for human consumption by the riparian communities,
resources and in the rational management and sustainability of these
and its water level is protected by the Nile Basin Treaty. Therefore, no
resources. Secondly, the Lake Victoria region needs to develop as an
withdrawals or diversions of the feeder rivers have taken place.
economic growth zone. Thirdly, that management decisions relating
to any portion of the Lake, within the territorial limits of any one of
Health
the Partner States will aff ect the others, and hence the concomitant
Lake Victoria is a source of aff ordable protein in the form of fi sh, and a
necessity that management decisions take such issues into account.
source of water for the communities that live around it. Surprisingly, the
health status of populations living around the Lake is far below what
Prior to the 1960s, most agreements (except the 1929 Nile Waters
it should be, with the most common health issues related to food and
Agreement) dealing with development and uses of the Nile waters
nutrition, and to diseases associated with lack of safe sources of water
have been on bilateral basis (UNECA 2000). In 1967, the United Nations
(Karanja 2002). Some of these health problems arise out of the fact that
Development Programme (UNDP) and the World Meteorological
the Lake is also a repository for human, agricultural, mining and industrial
Organisation (WMO) initiated the Hydromet Project for the
waste. The water for domestic consumption for these communities is
hydrometeorological survey of the equatorial lakes basin. This project
mainly taken without treatment (Bwathondi et al. 2001).
was initially endorsed by Egypt, Sudan, Kenya, Uganda and Tanzania,
REGIONAL DEFINITION
31
and later on included Rwanda, Burundi and DR Congo, with Ethiopia
Table 9
Socio-economic statistics for Tanganyika's riparian
as an observer (UNECA 2000). The Kagera River Basin Agreement was
nations.
signed by Burundi, Rwanda and Tanzania, with establishment of the
Burundi
DR Congo
Tanzania
Zambia
Kagera Basin Organisation (KBO) in 1977.
Population in the country (in millions)
6.7
49.8
32.9
9.9
Other international conventions and agreements that Kenya, Uganda
Population in the Basin (in millions)
2.5
2.6
3.5
0.5
and Tanzania are signatories to or subscribe to are summarised in
Population growth rate (%)
2.0
3.2
2.4
2.2
Bwathondi et al. (2001). The relevant regional agreements include:
Population per km2
249.9
20.6
35.4
12.7
Technical Cooperation for the Promotion of the Development and
Life expectancy at birth (years)
42
51
47
43
Environmental Protection of the Nile Basin (Tecconile), Initiative for
Adult literacy (% > age 14)
45.8
58.9
73.6
76.3
Nile Basin Management, the Convention for the Establishment of the
School enrolment (% of school age
51
78
67
89
Lake Victoria Fisheries Organisation (LVFO), the Agreement on the
population)
Preparation of a Tripartite Management Program for Lake Victoria,
Per capita GNP (USD)
120
110
240
320
and the Treaty establishing the EAC. The international conventions
Population < National poverty line (%)
36.2
ND
51.1
86
and agreements include: the Convention on Wetlands of International
Population living on < 1 USD/day (%)
ND
ND
19.9
72.6
Importance (Ramsar), the Convention for International Trade in
Population without access to:
Endangered Species of Wild Fauna and Flora (CITES), the Convention
Safe water (%)
48
32
34
62
on Conservation of Biological Diversity, and the Code of Conduct for
Health service (%)
20
ND
7
25
Responsible Fisheries (CCRF).
Sanitation (%)
49
ND
14
29
Share of income or consumption (%):
The Nile Basin Initiative was formally launched in 1999 by the Council
poorest 20%
7.9
ND
6.8
4.2
of Ministers of Water Aff airs of the Nile Basin States, and it includes all
richest 20%
41.6
ND
45.5
54.8
Nile countries and provides an agreed basin-wide framework to fi ght
richest 20% - poorest 20%
5.3
ND
6.7
13
poverty and promote socio-economic development in the region. Its
Human Development Index (of 174)
170th
152nd
156th
153rd
vision is "to achieve sustainable socio-economic development through
Note: ND = No Data. (Source: UNDP 2000, World Bank 1999, GIS analysis based on ORNL 2003)
the equitable utilisation of, and benefi t from, the common Nile Basin
water resources". Core support for the Initiative is provided by the Nile
these statistics are in many cases several years old, they provide a
countries. The early partners supporting this Initiative included UNDP,
general idea of the socio-economic situation faced by many citizens
the Canadian International Development Agency (CIDA) and the World
of the Lake Basin.
Bank, but the number of donors is still growing.
An estimated 10 million people reside in the Lake Tanganyika catchment
Lake Tanganyika
(UNDP 2000) representing diverse ethnic groups of predominantly Bantu
Population and settlements
origins. Many Bantu languages are spoken ş Swahili, a national language
The four riparian countries that share Lake Tanganyika (Tanzania,
of Tanzania and DR Congo but also common in the lake regions of
Burundi, DR Congo and Zambia) are among the poorest in the
Burundi and Zambia, is the "lingua franca" on the Lake for commerce,
world. The Human Development Index (HDI) is an indexed measure
transport and communications. Dating back to their respective Belgian
of standard of living (per capita GDP), longevity (life expectancy at
and British colonial periods, Burundi and DR Congo both list French as
birth), and education (combination of adult literacy rates with primary,
an offi
cial language whereas Tanzania and Zambia similarly list English.
secondary, and tertiary school enrolment ratios). In comparison with
Population growth rates range from 2.0-3.2% in Tanganyika's riparian
174 states, DR Congo was ranked 152nd, Zambia 153rd, Tanzania 156th and
nations, resulting in a rapid doubling time of 25ş30 years (World Bank
Burundi 170th (UNDP 2000). See Table 9 (extracted from World Bank 1999
1999). Population densities vary considerably in the Tanganyika Basin. In
and UNDP 2000) for relevant indicator statistics for these countries. Life
1999 World Bank statistics, Burundi's population density was estimated
expectancy in Lake Tanganyika's riparian nations averages 42-51 years.
at 250 persons per km2, DR Congo was 21 persons per km2, Tanzania
Literacy rates range from 45-76%. Per capita income ranges from 110-
35 persons per km2 and Zambia 13 persons per km2. In the Tanganyika
320 USD per year with signifi cant proportions of the populations living
Basin, settlements are typically small and concentrated on areas of
below the national poverty lines and on less than 1 USD per day. While
relatively fl at topography.
32
GIWA REGIONAL ASSESSMENT 47 EAST AFRICAN RIFT VALLEY LAKES


The main lakeside urban settlements for the four countries are:
As a result of clearing land for agriculture and fuel-wood demands,
1 Bujumbura (population 400 000), Burundi, a capital city with
there are fuel-wood shortages in many lakeshore villages (Meadows
an international airport and more than eighty industries (paint,
& Zwick 2000).
brewery, textile, soap, battery etc.);
2
Kalemie (population unknown) and Uvira (population 100 000), DR
Lake Tanganyika is an important resource for its riparian nations. It pro-
Congo. Kalemie has some industries and a rail link to other centres
vides freshwater for drinking and domestic use. Between 165 000 and
in DR Congo, Uvira has cotton processing and sugar production
200 000 tonnes of fi sh are harvested annually from Lake Tanganyika
industries but depends heavily on nearby Bujumbura for goods
(Reynolds 1999). This represents a signifi cant source of protein in the
and services;
local diet. Harvesting, processing, transporting and marketing these
3
Kigoma (population 135 000), Tanzania, the largest transit point for
fi sh ş some of which are sent to markets hundreds of kilometres away
goods and people entering/exiting the Lake region, with a rail link
in Lubumbashi, the Zambian Copper Belt and Dar es Salaam - provides
to other centres in Tanzania;
jobs and livelihoods for more than 1 million people (Reynolds 1999).
4 Mpulungu (population 70 000), Zambia the seat of the industrial
Compared to other parts of these four countries, the Lake Basin is not
fi shing fl eets.
endowed with signifi cant mineral resources or especially fertile agricul-
tural grounds. This, coupled with its distance from seaports resulted in
Refugee movements and wars have ravaged the northern Tanganyika
much of the region being comparatively marginalised during colonial
Basin during the last decade. Much of the Burundi and DR Congolese
administrations. Except for Burundi, which has its capital on the Lake,
coastlines have experienced recurrent fi ghting and instability, dating
the lakeshore regions of DR Congo, Tanzania and Zambia are remote,
back to October 1993 in Burundi and October 1995 in DR Congo. Con-
sequently, 100 000 Burundians were internally displaced while 285 000
sought refuge in Tanzania. In DR Congo 700 000 people were inter-
nally displaced while 118 000 sought refuge in Tanzania (UNHCR 2000).
Rwanda
Lake Kivu
Most refugees reached Tanzania via Lake Tanganyika. While some refu-
Rusizi Natural
gees (not refl ected in these fi gures) settled in relatively unpopulated
Reserve
areas along the Tanzanian coast or in villages with family/friends, many
Burundi
camped within the Kigoma region in order to benefi t from interna-
Kigwena Forest
Natural Reserve
tional assistance. While population movements are concentrated in the
northern basin, all of Tanganyika's riparian nations have hosted refu-
Gombe Stream
National Park
gees. These population movements have had repercussions on society,
the regional economy and the environment. Population movements
Tanzania
and ongoing civil wars have also aff ected the relationship between
Tanganyika's riparian states.
Mahale Mountains
National Park
Socio-economic activities
Lake Tanganyika
At population centres, people are often involved with administration
and aspects of international trade between the four countries. Outside
of these areas, subsistence and small-scale commercial fi shing and
DR Congo
farming dominate people's livelihoods (Quan 1996, Meadows & Zwick
2000). Flat, fertile land in the Tanganyika Basin is extremely limited and
most farming occurs on steep slopes or narrow strips of land between
the rift escarpment and the Lake. The principal crop is cassava, grown
Nsumbu National
Park
Zambia
primarily for subsistence. Cash crops include oil palm and limited rice,
beans, corn and banana production (Meadows & Zwick 2000). Histori-
cally, cattle-herding has not been widespread in the Basin due to tsetse
fl ies, however, regional insecurities have caused some cattle owners in
ę GIWA 2003
Burundi and DR Congo to move their cattle to nearby lakeside areas.
Figure 11 Protected areas in the Lake Tanganyika Basin.
REGIONAL DEFINITION
33
far from international airports, seaports and their countries' capital cit-
Recognising that Lake Tanganyika is a special system, that it is
ies and economic centres. Except for a few large towns and one city,
threatened by a variety of destructive behaviours, and that existing
the Basin still lacks basic infrastructure (electricity, running water, com-
national legislation regarding the Lake is inadequate, Tanganyika's
munications) and little industrialisation has taken place.
riparian countries drafted the Convention for the sustainable use of
the Lake (West 2001). This Convention was signed by the Ministers of
The main lakeside urban settlements are all served by ports, which
the four countries on 12 June 2003. The convention is the result of fi ve
link people and cargo between Tanganyika's riparian nations. Land-
years of technical studies and expert evaluation, and charges member
locked Burundi and eastern DR Congo in particular, depend heavily on
countries with controlling pollution, overfi shing and other human
goods coming by rail from Dar es Salaam to Kigoma or by road from
activities in their territories that threaten the Lake, which supports
South Africa to Mpulungu. Railways link Kalemie and Kigoma to larger
the livelihoods of up to 10 million people in the four countries. The
economic centres in DR Congo and Tanzania, respectively. Mpulungu
Convention provides the necessary rights, responsibilities, institutions
links to other economic centres in Zambia by a paved and maintained
and framework in international law which compel the countries to
road. Burundi has a good road extending the length of its coastline. DR
cooperate in managing Lake Tanganyika. Specifi cally, it creates a binding
Congo has a poor, unmaintained road extending from Uvira to Baraka.
legal framework ensuring certain standards of protection, establishes
Most of the other roads run tangential to the Lake and are not well
the institutions for implementing the Convention, establishes the
maintained.
mechanisms for implementing the Strategic Action Programme (SAP)
and establishes procedures for settling disputes. Simply stated, the SAP
Protected areas
is a participatory strategic planning process to enable scientists and
Riparian governments have designated protected areas (PAs) in several
natural resource managers to identify and prioritise their management
locations bordering the Lake (Figure 11). Burundi has two PAs, the Rusizi
initiatives for the Lake.
Natural Reserve (recently downgraded from National Park) and Kigwena
Forest; Tanzania has two PAs, Gombe Stream National Park and Mahale
The SAP is mandated to
Mountains National Park; and Zambia has one PA, Nsumbu National
"Establish clear priorities that are endorsed at the highest levels
Park. DR Congo currently has no protected areas along the Lake. The
of government and widely disseminated. Priority transboundary
Rusizi Natural Reserve is a site of international ornithological interest
concerns should be identifi ed, as well as sectoral interventions
as it hosts a diverse resident and migrant bird fauna. Gombe Stream
(policy changes, programmes development, regulatory reform,
and Mahale Mountains National Parks, hosting chimpanzees and
capacity-building investments, and so on) needed to resolve
other primates, are the sites of the longest-running primate studies.
the transboundary problems as well as regional and national
Nsumbu National Park harbours elephants, lions, leopards, gazelles
institutional mechanisms for implementing elements of the SAP."
and other game, but in low densities. Both Mahale Mountains and
Nsumbu National Parks provide some protection to the Lake as their
Lake Malawi
borders extend 1.6 km into the Lake. To date, tourism remains relatively
Population
undeveloped because of the remoteness, lack of infrastructure, regional
The countries of Malawi, Mozambique and Tanzania, with human
insecurities, and competition from other locales.
populations of 10 million, 19.1 million and 31.2 million, respectively
(WWF 2003), share Lake Malawi. The Lake Malawi Basin constitutes 70%
Legal and institutional framework
of Malawi's land area, which is highly densely populated at 116 persons
Lake Tanganyika's riparian nations agreed upon a set of principles
per km2 (UNEP-IETC 2003). Indeed, 80% of the total lakeshore population
and values in their quest to ensure the conservation and sustainable
is in Malawi (World Bank 2003). In Mozambique and Tanzania, the Basin
use of the Lake's resources. Many of these principles are embodied
area is sparsely populated due to its remoteness and isolation from the
in existing Conventions to which the four riparian countries are
rest of the Basin (Figure 12) (Ribbink 2001). It is clear that most of the
signatories, in particular the environmental and social principles that
human impact on Lake Malawi is from Malawi which is highly populated
underlie the Convention on Biological Diversity, Agenda 21 and the
and has the largest catchment area.
Dublin principles. These principles include the: Precautionary Principle,
Polluter Pays Principle, Principle of Preventive Action, Principle of
Socio-economic activities
Participation, Principle of Equitable Benefi t Sharing, and Principle of
The value of such a huge aquatic resource in semi-arid, drought-
Gender Equality.
prone southern Africa cannot be overstated. For the people on the
34
GIWA REGIONAL ASSESSMENT 47 EAST AFRICAN RIFT VALLEY LAKES


Land-based anthropogenic activities have an impact on the waters
of the Basin, with direct or indirect consequences for the Lake
(Ribbink 2001). Agriculture, deforestation, and biomass burning are
all contributing to loss of fertility and sustainability of the land, while
aff ecting the Lake through transport of the chemicals (mainly nutrient
precursors) via the watershed and air (Ribbink 2001). The greatest
Tanzania
agricultural development is in the basins of the Linthipe and Bua rivers
in the south of the catchment (Eccles 1984).
Population density
Economic sectors and water-related engineering
(pers/km2)
The countries' GNP per capita is as follows: Malawi 220 USD, Mozambique
0
90 USD and Tanzania 210 USD (UNICEF 2003). The economies of the
2
three countries are heavily dependent on international aid, and poverty
5
remains deep and pervasive (WWF 2003). The economies depend
25
heavily on the countries' natural resource base: agricultural production,
50
Lake Malawi
almost 70% of which comes from smallholder farms, accounts for more
100
than 90% of export earnings in Malawi and contributes 37% of GDP and
500
supports more than 80% of the population (CIA World Fact Book 2002,
2 500
Malawi
World Bank 2003). In Mozambique and Tanzania, the contributions stand
5 000
at 22% and 48% respectively (CIA World Fact Book 2002). Practically all
the people living within the Lake Malawi catchment and along the
shores of the Lake are involved in fi shing and agriculture (WWF 2003).
The key socio-economic indicators of the economies of the region are
shown in Table 10.
Kabulo (in Perrings 2000) notes that the fi sheries industry experienced
rapid growth between the 1960s and 1980s where estimated
landings in 1964 were 15 000 tonnes. Production peaked in 1987 at
88 000 tonnes whereas the 2000 landings average 70 000 tonnes.
The importance of the fi sheries sector in Malawi is given by its 4%
Mozambique
contribution to the country's GDP, direct and indirect employment
Table 10
Some socio-economic indicators of the economies of
the Lake Malawi Basin.
ę GIWA 2003
Malawi
Mozambique
Tanzania
Figure 12 Human population density in the drainage basin of
Lake Malawi.
Population in the Basin (million)
6.5
0.2
1.4
(Source: data from ORNL 2003)
Population density (km2)
98.3
21.8
38
lakeshore, it provides the basis for life itself through abundant water
Population growth rate (%)
2.21
0.82
1.72
for drinking and domestic uses, production of fi sh which provides
GDP (billion USD)
7.2
19.2
22.5
GDP real growth rate (%)
1.2
8
5.2
the cheapest animal protein in human diets, easy transport for lake
GDP per capita PPP* (USD)
670
1 000
630
commerce, and possible use for irrigation of crops. In addition, for the
GDP by sector (%):
country of Malawi currently, the Lake's catchment provides water for
Agriculture
37
22
48
hydroelectric generation and exceptional opportunities for tourism.
Industry
16
23
15
But the Lake is also renowned for its fabulous biodiversity, especially
Services
47
55
37
among the numerous cichlid fi shes, the haplochromine subfamily
Population below poverty line (%)
54
70
36
*PPP=Purchasing Power Parity.
being particularly species-rich and nearly completely endemic.
(Source: CIA World Fact Book 2002, GIS analysis based on ORNL 2003)
REGIONAL DEFINITION
35
of around 240 000 people, and nutrition. Fish provides between 60 to
17% in Zambezia to 40% in Tete, while those with access to sanitation
70% of Malawi's animal protein supply and 40% of total protein supply.
ranges from 6.6% in Zambezia to 66% in Niassa (UNICEF 2003). The
Export trade of ornamental fi sh grew between 1970s and 1980s. Major
incidence of water-borne diseases, such as schistosomiasis, occurs in
customers are North America, Germany, France, and Belgium.
coastal settlements along Lake Malawi and its principle outlet, the Shire
River, but it is related mainly to lack of sanitation rather than agricultural
An overriding problem is that poverty of the population within the
or industrial effl
uent (UNEP-IETC 2003).
Lake Basin and its dependence upon natural resources are making it
increasingly diffi
cult to maintain sustainable use of resources (Ribbink
Legal and institutional framework
2001). Orr and Mwale (2001) noted from their Rapid Rural Appraisal
Open access conditions prevail in most circumstances in the three
(RRA) study that the poor are becoming poorer while at the same time
countries as the right to use natural resources is synonymous with
there were those who reported an improvement in their economic
survival (WWF 2003). At international level, some environmental
status. Livelihood improvement was attributed to market liberalisation
conventions have been endorsed, e.g., Malawi is signatory to the
with respect to income generation from agricultural crops like barley,
Convention on International Trade in Endangered Species (CITES),
tobacco, vegetables, grain legumes and micro enterprise output.
Convention on Biological Diversity, Convention on the Conservation of
Another study observed the rural poverty in Malawi was associated
Migratory Species of Wild Animals, and the Ramsar Wetland Convention.
with the absence of household food security, which was in turn
At regional level, there are a number of policies which guide the
equated to household maize production (Orr et al. 2001). Initiatives
conduct of State Parties in relation to the use of natural resources: SADC
are being set up to address the poverty problem in the region. The
Protocols on Fisheries, Shared Watercourse Systems, Mining, Wildlife
Mtwara Development Corridor is one such development initiative
Conservation, and Law Enforcement (Kasweswe-Mafongo 2003, WWF
of the governments of Mozambique, Malawi, Tanzania and Zambia.
2003). But due to the voluntary nature of their application and a lack
It covers southern Tanzania, northern Mozambique, northern and
of eff ective enforcement institution at regional level, they do not have
central Malawi and eastern and northern Zambia. These are the most
notable impacts (Kasweswe-Mafongo 2003, WWF 2003).
undeveloped regions within each country, particularly in terms of: low
levels of infrastructure development, high incidence of poverty, poorly
Also, all three countries have passed a number of policies and legislation
developed and integrated local economies, dependence of fragile small
on fi sheries, forestry, water, and soil, but these have been developed
holder production regimes and deteriorating natural environmental
independently and without consultation, and they are, therefore,
resource base (Graham 2003).
disjunct. In Malawi, the major statute for the regulation and control of
fi sheries is the Fisheries Act 1974 that is administered by the Department
The only prominent water-engineering project is the Shire Valley
of Fisheries. The Act is charged with the prevention of depletion of fi sh
hydroelectric power plant on the Shire River. There are many irrigation
resources and making harvesting of fi sh sustainable through licensing,
schemes within the catchment particularly on the Malawi side. There
gear restriction and seasonal closing of fi sheries. Policing of these
is increased demand for water for crop irrigation as more and more
regulations, however, is constrained by lack of trained staff and patrol
irrigation schemes are being established (Government of Malawi 1998).
equipment, and also by inadequate penalties for non-compliance. In
Tanzania and Mozambique, the fi sheries policies focus more on marine
Health
fi sheries rather than on inland water bodies such as Lake Malawi (WWF
Out of Malawi's 11 million people, 89% live in rural areas, where 25% of the
2003). There is also some disagreement over political boundaries
males and up to 40% of the females have never attended school (UNEP-
between Tanzania and Malawi.
IETC 2003). An indicator of the low health status of these populations is
the lack of amenities: only 1% of rural households has electricity; 67%
The Lake Malawi Ecosystem Management Project (LMEMP) is an
use a well as a source of water (39% of which are not protected); up to
ecosystem management programme that is being prepared by the
53% of the population use water sources that are classifi ed as unsafe; and
three riparian countries and is funded by GEF and other bilateral
34% of the rural households do not have access to either a fl ush toilet nor
agencies. It aims to maximise the benefi ts to the riparian communities
a traditional pit latrine (UNEP-IETC 2003). In Mozambique, 41 to 62% of
from improved fi sheries management and the sustainable use of soils,
the children under 5 years old living in the provinces, Niassa, Zambezia
forests, wetlands and other resources within the Basin to generate food,
and Tete, that border Lake Malawi have chronic malnutrition (UNICEF
employment and income, while sustaining the ecosystem from which
2003). The number of people with access to safe water ranges from
these benefi ts arise.
36
GIWA REGIONAL ASSESSMENT 47 EAST AFRICAN RIFT VALLEY LAKES
Assessment
This section presents the results of the assessment of the impacts
Table 11
Scoring table for Lake Turkana.
of each of the fi ve predefi ned GIWA concerns i.e. Freshwater
Assessment of GIWA concerns and issues according
The arrow indicates the likely
to scoring criteria (see Methodology chapter)
direction of future changes.
shortage, Pollution, Habitat and community modifi cation,
T
T
C
C
Increased impact
A
A
0 No known impacts
2 Moderate
impacts
IMP
IMP
Overexploitation of fi sh and other living resources, Global
T
T
No changes
C
C
A
A
1 Slight
impacts
3 Severe
impacts
IMP
IMP
Decreased impact
change, and their constituent issues and the priorities identifi ed
t
s
i
t
y
during this process. The evaluation of severity of each issue
t
a
l
un
*
*
n
impac
p
a
c
t
s
m
adheres to a set of predefi ned criteria as provided in the chapter
Lake Turkana
o
m
Score
c
t
s
c
t
s
t
y
***
e
r
c
describing the GIWA methodology. In this section, the scoring of
v
i
r
o
nme
a
l
t
h
i
m
erall
En
impa
E
c
onomic
He
Oth
impa
Ov
P
r
i
o
ri
GIWA concerns and issues is presented in Tables 11, 13, 15 and
Freshwater shortage
1.8*
1.8
1.6
1.8
2.2
2
18. Detailed scoring information is provided in Annex II of this
Modification of stream flow
2
report.
Pollution of existing supplies
1
Changes in the water table
0
Pollution
1.6*
1.0
1.0
1.0
2.0
3
Microbiological pollution
0
Eutrophication
1
Chemical
0
Suspended solids
2
Solid waste
0
Thermal 0
Radionuclide
0
Spills
0
Habitat and community modification
1.5*
2.6
2.3
2.5
2.6
1
Loss of ecosystems
1
Modification of ecosystems
2
Unsustainable exploitation of fish
0.7*
0
0
0
0.9
5
Overexploitation
1
Excessive by-catch and discards
1
Destructive fishing practices
0
Decreased viability of stock
0
Impact on biological and genetic diversity
1
Global change
1.4*
2.0
2.4
3.0
2.1
4
Changes in hydrological cycle
2
Sea level change
1
Increased UV-B radiation
0
Changes in ocean CO source/sink function
0
2
*
This value represents an average weighted score of the environmental issues associated
to the concern. For further details see Detailed scoring tables (Annex II).
** This value represents the overall score including environmental, socio-economic and
likely future impacts. For further details see Detailed scoring tables (Annex II).
*** Priority refers to the ranking of GIWA concerns.
ASSESSMENT
37
Lake Turkana Basin
Pollution of existing supplies
Heavy grazing along the lower Omo valley, especially along watering
T
C
A
Freshwater shortage
IMP
routes and overnight pastures, and settlement close to the rivers
indicates that there is some pollution particularly from human
The only perennial river, and by far the most dominant source of water
and livestock wastes. In Marsabit District (Kenya), only 5.7% of the
to the Lake (90%) (Cerling 1986), is the Omo River. The Omo River
households (1700 out of 30 000 households) have access to potable
drainage basin lies mostly within Ethiopia, while the Lake lies within
water, and the average distance to the nearest potable water point
Kenya. Rainfall in the Lake Basin varies from more than 1500 mm in the
is 25 km (Republic of Kenya 2002a). In Turkana District, the situation
Ethiopian plateau (Halfman & Johnson 1988), to less than 255 mm per
is somewhat better, with 28% of households (23 000 out of 80 921
year in the lake area (Survey of Kenya 1977). The Omo River discharge is
households) having access to potable water, and the average distance
about 19 billion m3 of water each year (Beadle 1981). All the other rivers
to the nearest potable water point is 10 km (Republic of Kenya 2002b).
are seasonal or intermittent, thus there is little overland surface run-off
into the Lake from the surrounding watershed.
Socio-economic impacts
The people in the area are mainly pastoralists, and to a lesser extent,
The lake water itself is not suitable for drinking due to its high alkalinity
agro-pastoralists. Most of the lake drainage basin is used as pastureland
and total dissolved solids concentration (cf. Yuretich & Cerling 1983),
(47.5%) compared to only 2.5% used as crop fi elds (World Lakes
but the affl
uent river waters and shallow wells along the rivers are used
Database 2002). The main people aff ected by freshwater shortage due
as sources of potable water. The Turkwel River, entering the Lake from
to abstraction of water for irrigation, and pollution, would be mainly
southwest, was dammed in 1991 for hydroelectric power generation
those downstream close to the deltas of the Omo and Kerio-Turkwel
at Turkwel Gorge, about 150 km west of the Lake (Figure 13). There is
Rivers (cf. Raymakers 2003). The degree of impact to these downstream
currently no evidence that abstraction of water from aquifers exceeds
users is probably fairly signifi cant, particularly because water abstraction
natural replenishment. Very little hydrogeological data is available for
is a continuous activity, with resultant loss of agricultural uses (crops
eff ective evaluation in the Lake Basin. Groundwater recharge zones
and livestock) and productivity, and increased eff ort to dig more water
and amount of groundwater recharge to the Lake are largely unknown.
wells.
Nevertheless, on account of the land degradation and increasing
number of settlements, it is likely that the groundwater recharge has,
In Africa, nomads have the least access to any health services, and no
to some extent, decreased.
satisfactory strategy has been devised to deliver proper health care to
remote populations (Sheik-Mohamed & Velema 1999). Lack of access
Environmental impacts
to safe water and adequate sanitation remains particularly acute in
Modifi cation of stream fl ow
rural areas of Ethiopia (CIHI 1996) and Kenya (CIHI 1995) and are major
The freshwater shortage in the Basin is due mainly to modifi cation
underlying causes of several diseases. Common diseases related to
of stream fl ow. Along the Omo River in Ethiopia, there has been an
quality of water and sanitation include diarrhoeal diseases, intestinal
extensive increase in small irrigation schemes diverting water from Lake
worms, schistosomiasis, common eye infections such as trachoma,
Turkana. For example, in the Lower Omo Valley in Ethiopia (rainfall 300
and skin diseases (CIHI 1996, Republic of Kenya 2002a and b). Most
mm/year), fodder and food crop production depends almost entirely
watering points are, however, along the rivers and the delta area where
on seasonal fl oodwater from the River Omo and recession farming
permanent settlements and livestock populations are growing. Due
in the old river channels (Kay 2001), and the delta (Raymakers 2003).
also to lack of health care facilities in this remote region (the average
Alexander (1990, in Haack & Messina 2001) estimates that the Omo
distance to the nearest health facility in Turkana and Marsabit areas of
River discharge has been reduced by 50% because of these activities.
Kenya is 50 km and 80 km respectively (Republic of Kenya 2002a and b),
Development and commissioning of the large Turkwel River Dam in
it is expected that more than 25% of the population are aff ected by
1991 has also probably signifi cantly impeded the fl ow of freshwater
bacterial-related gastroenteritic disorders. The freshwater shortage is
in the Turkwel River, and this may have impacted negatively on the
an endemic, age-old situation because of the climatic setting, and the
fi sheries in Ferguson's Gulf through lowered lake levels. Studies are,
respective governments are continually making concerted eff orts to
however, required to quantitatively determine the environmental
improve the situation by digging new wells and boreholes in rural areas,
eff ects of the dam construction.
as well as increasing access to piped water in urban settlements.
38
GIWA REGIONAL ASSESSMENT 47 EAST AFRICAN RIFT VALLEY LAKES
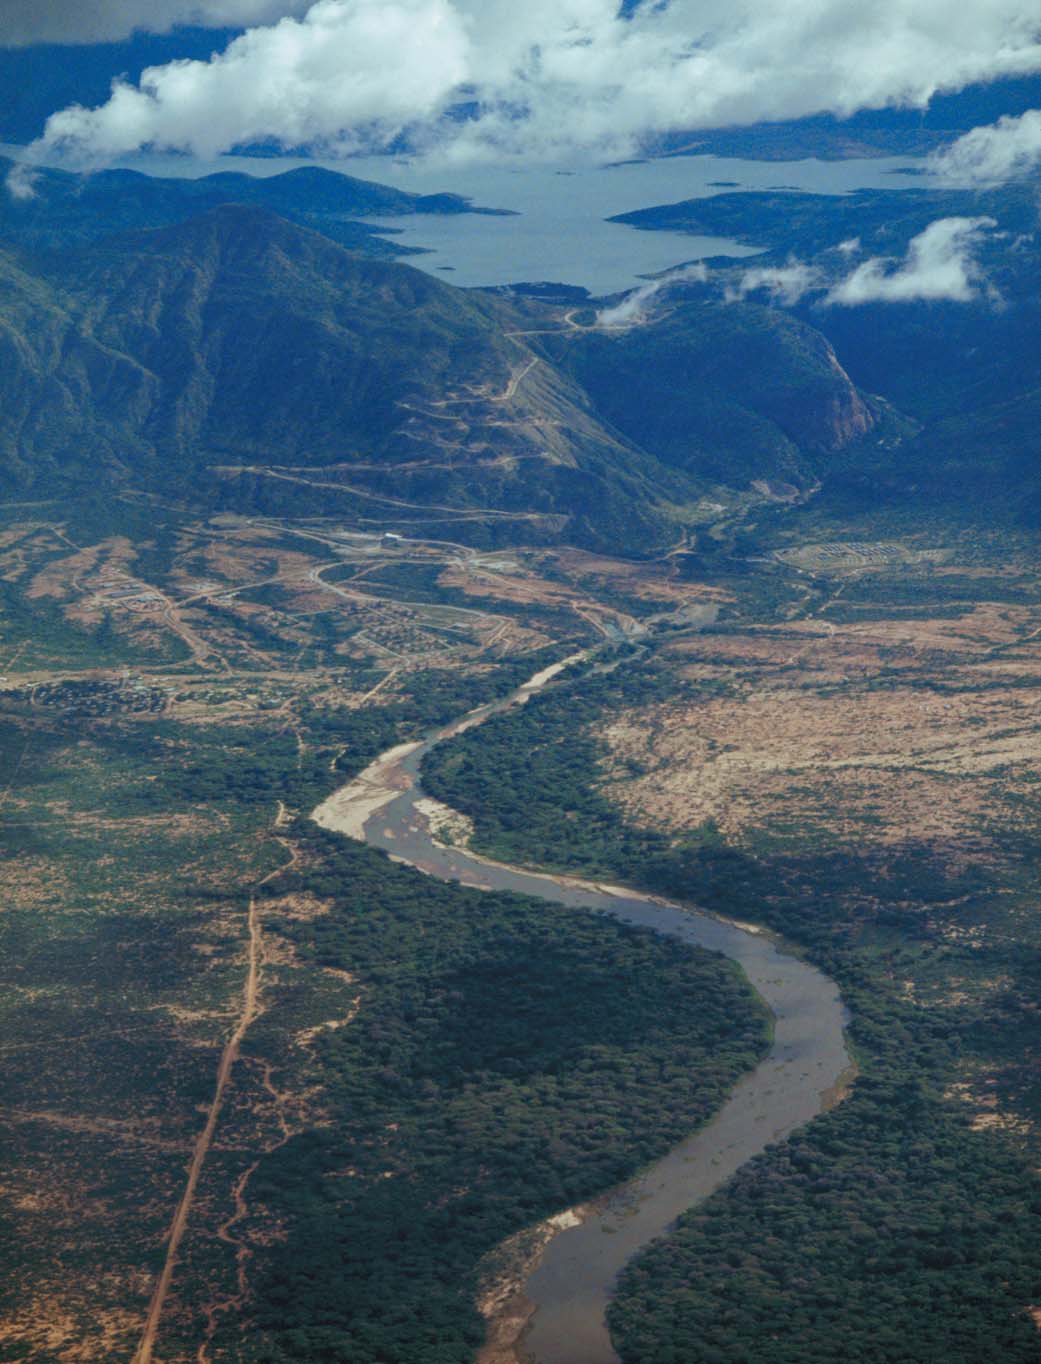
Figure 13 Turkwel
River.
ASSESSMENT
39
Although there is no direct information on the impact of freshwater
Freshwater shortage is likely to become more acute as more and more
shortages resulting from human interventions on the communities, it
water is diverted from the rivers to adjacent farms, and will be acutely
is known that only 10% of the rural people in Ethiopia have access to
accentuated during periods of drought. The higher populations close
potable water, while human waste disposal facilities are non-existent,
to the riverbanks are also likely to pollute the waters to signifi cant
and health services are limited and reach only 46% of the population
levels, thus rendering the freshwater shortage more acute because
(Waktola 1999). This situation likely refl ects the prevailing conditions
of its reduced quality. Economic impacts on downstream settlers will
in the relatively poor and mainly nomadic regions of southwestern
become worse because it would become increasingly more diffi
cult
Ethiopia and northern Kenya. There would be increased potential for
to maintain high agricultural productivity and gain relatively easy
upstream/downstream confl icts that could be quite explosive, and
access to potable water (i.e. from relatively shallow wells) as more
population migration to areas not traditionally within the pastoralists
of the freshwater is diverted for use upstream. Health impacts will
normal range of movement. For example, there are some international
increase due to lack of suffi
cient and potable water supplies, and as
confl icts (e.g. between the Turkana and the Merele of Ethiopia), and
well to unsanitary conditions in the increasingly settled downstream
local ones as well, arising from livestock related issues such as grazing
parts. These factors can lead to a host of diseases such as cholera and
grounds and watering wells (Raymakers 2003); there have been several
typhoid. The potential for upstream/downstream confl icts will further
reports of armed confl ict over ownership of water wells in the region.
increase, as will population migration.
The government-supported irrigation schemes on the Turkwel River
have impinged on traditional croplands of the Turkana, consequently,
disputes have arisen between the traditional cultivators and the
T
C
A
irrigation schemes (Barrow 1988).
Pollution
IMP
Conclusions and future outlook
Pollution generally is not a highly ranked problem within the Lake
The freshwater resources of the Basin are critical for the livelihoods of
Turkana Basin. It is concentrated mainly in the relatively highly
the pastoralists and agro-pastoralists in the largely semi-arid drainage
populated Omo River drainage basin. Little or no use of agrochemicals
basin. River water is used for subsistence agriculture, but the rate of
in the adjacent fl oodplain farms means that water pollution is mainly
abstraction is currently unsustainable and is impacting Lake Turkana.
through contamination by human and livestock waste. The relatively
The construction of dams in the region appears to impact negatively
low population density also suggests that pollution of the waters
on the livelihoods of downstream river users and the lake ecosystem.
would be a gradual, rather than rapid process, partly constrained by
Studies are, however, required to quantitatively determine the
the dilution and dispersion capacities of the rivers and Lake vis-Ó-vis
environmental eff ects of the dam construction. Most of the population
the initial pollution load.
rely on river and shallow water wells for water, and proper sanitation
facilities are basically non-existent. Heavy grazing along the lower
There is no evidence available to show that microbiological and chemical
Omo valley, especially along watering routes and overnight pastures,
pollution, solid wastes, thermal, radionuclide, and spills are currently of
and settlement close to the rivers indicates that there is some pollution
any threat to the Lake and its rivers. There are basically no industrial, large-
particularly from human and livestock wastes, but incidences of water-
scale agricultural or other types of developments in the Basin that can
borne diseases do not appear to have increased signifi cantly. There
singularly or collectively substantially contribute to pollution of the water
is a need to establish groundwater resource value and to initiate its
bodies. As mentioned before, lack of access to safe water and adequate
sustainable development as a source of potable water in the region.
sanitation remains particularly acute in rural areas of Ethiopia (CIHI 1996)
Food security is inextricably linked to the freshwater resources. With
and Kenya (CIHI 1995), but there are no reports available in relation
the very low rainfall in the region, an increasing number of people are
to microbiological pollution to indicate that there is above normal
shifting from pastoralism to agro-pastoralism and becoming more
incidence of, or an increase in, bacterial related gastroenteritic disorders
vulnerable as a consequence. The unsustainable abstraction of Omo
in fi sheries product consumers. There have not been any fi sheries
River waters in upstream areas is beginning to impact on downstream
closures or advisories due to outbreaks of gastroenteritic disorders.
users. Droughts in the past have exacted high costs in terms of loss of
Most heavy metals are present in low and stable concentrations and are
life of humans and livestock and the drought impact will likely increase
naturally derived: aluminium, iron and manganese fl uctuate with rather
as the freshwater resources dwindle.
large changes in concentration in connection with the infl ux of organic
matter (Kallqvist et al. 1988). There is no evidence of signifi cant fertiliser
40
GIWA REGIONAL ASSESSMENT 47 EAST AFRICAN RIFT VALLEY LAKES
use in the agricultural activities being undertaken along the principal
(e.g. through sediment blanketing and increased turbidity), but studies
rivers banks (World Lakes Database 2002).
are needed to ascertain the type and extent of change.
Environmental impacts
Socio-economic impacts
Eutrophication
There are no known studies on the economic impacts of pollution
Although fl uvial activity is generally infrequent (only the Omo River
in Lake Turkana. Economic impacts are related to costs incurred to
is perennial), the sediment load is high, in common with other arid
treat diseases (both human and livestock) arising from lack of access
environments (up to 1600 tonnes/km2/year), and delta construction is
to safe water and poor sanitation. There could also be a problem of
rapid (Frostick & Reid 1986). There is also increased soil erosion on the
reduced fi sh stocks since many of the fi sh that spawn in the infl owing
banks of the affl
uent rivers due to human activities (Waktola 1999, Haack
rivers could be adversely aff ected by increased sedimentation and
& Messina 2001). This has partly contributed to the growth of the Omo
turbidity. Additionally, the food chain could have been disrupted as
River delta, refl ecting a measurable shallowing of the depth range of
phytoplankton, and other pelagic or benthic organisms, may have been
macrophytes. Input of nutrients during the Omo River fl ood season has
negatively impacted by increased turbidity.
been noted as driving phytoplankton population dynamics (Ogari 1981),
although there has not been any monitoring programme to determine
The health impacts are similar to those mentioned under freshwater
whether there has been an increasing trend in abundance of epiphytic
shortage above. An additional eff ect may be loss of traditional fi shing
and planktonic algae with time. During surveys carried out from 1972 to
grounds due to increased sedimentation and turbidity, and hence
1975, nitrate and nitrites were frequently undetectable, with maximum
reduced fi sh catches and lower protein intake that could lead to
concentrations of 17.7 Ág/l being noted in the Omo delta and thought
malnutrition. Loss of a traditional protein source would increase the
to be derived from the Omo River (Ferguson & Harbott 1982). From the
vulnerability of the people living in this area to food or essential nutrient
low levels of nitrate and nitrite in the inshore and open water of the Lake,
shortages. Communities may migrate to areas where there is safe water
Ferguson & Harbott (1982) surmised that nitrates are very rapidly utilised;
and/or are suitable for agriculture, resulting in confl icts over land-based
no nitrate was detected in the highly productive waters of Ferguson's
resources.
Gulf despite a potentially abundant supply from the excreta of the rich
avifauna, cattle and goats, and heterocystous blue-green algae.
Conclusions and future outlook
The main pollution problem is that of high suspended sediment loads
Suspended solids
in the affl
uent rivers, particularly the Omo River. Conservation eff orts
The principal pollution problem in Lake Turkana Basin is that of
should be directed at minimising soil erosion. Settlements within the
suspended solids. Yuretich (1979) observed that sediment plumes up
area need to be planned and have proper sanitation facilities, better
to 100 km long extend southward from the Omo River delta during
animal husbandry needs to be incorporated, and clean water sources of
fl ood seasons. More recent imagery from Landsat and other spaceborne
potable water, such as groundwater should be explored and harnessed
sensors clearly show the heavy sedimentation fl ow into the Lake
to serve the communities.
(Haack & Messina 2001). The rapid and extensive growth of the Omo
River delta over the past few decades refl ects signifi cant changes in
If there are no intervention measures taken soon, then increased
sedimentation. Today the lake colour, especially in the north, is brown
agricultural activities and land degradation along the rivers will result
because of increased suspended solids (Haack & Messina 2001). The
in increased suspended solids being transported to the Lake. There
euphotic zone is about 6 m, and the Lake is always turbid (Kallqvist et
is a likely increase in the use of agro-chemicals as the land becomes
al. 1988). Increased population pressure in the drainage basin of the
less productive, and this will increase the nutrient loading to the Lake
Omo River in Ethiopia has caused increased soil erosion by removal
and thus increase the rate of eutrophication. Microbiological pollution
of the vegetative cover for fuel and conversion to agricultural lands
which is currently not a major problem will increase due to sanitary
(Haack & Messina 2001), increasing the amount of sediment delivery
problems that accompany the growth of settlements. Livestock waste
to the River and Lake. Soil loss from the productive land in the upper
would also signifi cantly contribute to microbiological pollution of
reaches of the Omo River will take its toll on agricultural productivity.
the water bodies. Economic impacts will become worse as sediment
The sedimentation changes that have taken place in the deltas of the
blanketing and increased turbidity infl uences changes in benthic and
Omo and Turkwel rivers, as well as in the northern part of the Lake, have
pelagic biodiversity, aff ecting the fi sheries resources particularly in the
probably aff ected the local aquatic benthic and/or pelagic biodiversity
riverine, shallow water and deltaic areas where subsistence fi shermen
ASSESSMENT
41
fi sh. Health would be aff ected as a result of an anticipated increase
in Ferguson's Gulf. There have not been any comprehensive studies on
in microbiological and chemical contamination from organic wastes
the biodiversity and ecological structure of these ecosystems. It was
(e.g. settlements and agro-chemicals). Other social and community
concluded that loss of ecosystems is occurring in these areas through
impacts would increase as upstream/downstream confl icts increase. Oil
habitat fragmentation as a result of nutrient rich soils being cleared
exploration eff orts off shore of Lake Turkana have been done by several
for agriculture and settlement, and some of the swamps with lush
oil companies, including Project PROBE, Amoco Kenya Petroleum
vegetation being used as grazing areas for livestock.
Company and National Oil Corporation of Kenya. No economically
viable oil deposits have been discovered so far, but this is a prospect
At the Omo River entrance to Lake Turkana, there has developed a
which can signifi cantly raise the threat of pollution in the region.
highly complex and spatially fl uctuating fl oodplain and delta (Haack &
Messina 2001). Landsat imagery has provided spatial information on the
extent of the deltaic growth (particularly signifi cant since 1979) (Haack &
Messina 2001). Aquatic vegetation has taken hold on the emerging delta
T
C
A
Habitat and community
IMP
at the possible expense of, e.g., shallow water benthic organisms.
modification
Modifi cation of ecosystem habitats or ecotones
Lake Turkana Basin is characterised by arid and semi-arid type
Due to climate change and to the extensive land use changes in
vegetation in the lowlands, and forest in highland areas of the Omo
the region, particularly in the Omo River catchment, the amount of
River. Grassy plains with Yellow spear grass and Commuphera and
freshwater entering the Lake has declined steadily over the years,
Acacia sp. characterise the vegetation of the lake region, while Acacia
resulting in the growth of the Omo delta by about 380 km2 between
thorn scrub, with larger acacia trees along the river courses, grow
1973 and 1989 as seen from Landsat images (Haack & Messina 2001). The
around the Lake (Hughes & Hughes 1992). Galleries of forest occur
expansion of the delta wetland is potentially maintaining or increasing
along the affl
uent watercourses, being characterised by Acacia elatior,
the biodiversity of fauna and fl ora, both locally and regionally (Haack &
Balanites aegyptiaca and Hyphaene coriacea (Hughes & Hughes 1992).
Messina 2001). On the other hand, the good soil, lush vegetation and
The Omo River is bordered by levee forest and the delta was forested
availability of water is also attracting permanent human populations,
in comparatively recent times (Hughes & Hughes 1992).
most likely in confl ict with fl ora and fauna (Haack & Messina 2001).
Similarly, the areas with gallery forest that occur along the affl
uent rivers
In the north Omo zone, deforestation is increasing as a consequence
(Hughes & Hughes 1992) are being cleared for cultivation.
of rapidly growing population (Waktola 1999). Cleared lands are more
and more being put under cultivation in the highlands, leading to
The Lake has little-modifi ed fauna and a low level of endemicity with
rapid depletion of soil nutrients and forest resources (Waktola 1999).
few cichlids (Lowe-McConnell 1995). Shallow areas which are fl ooded
On the other hand, the pastoralists of the Lake Turkana region occupy
during seasonal rises in lake level may be important for the reproduction
arid and semi-arid environments where climatic variability causes
of certain fi sh species e.g. tilapia (Kallqvist et al. 1988), and many of
distinct pulses of plant production followed by long periods of plant
the fi sh retain the habit of spawning in the infl owing rivers (Lowe-
dormancy, but in which the pulses of production are not predictable
McConnell 1995). Construction of artifi cial banks to create more room
in terms of time or magnitude (Ellis & Swift 1988). The pastoralists have,
for agriculture, changes of the fl ow characteristics of the rivers due to
with time, developed rational sustainable land use systems based on
diversion of water to irrigate adjacent farms, and increased turbidity,
the mobility of their livestock herds, and making optimal use of the
may place these fi sh at risk. It has been reported that there is a decrease
land both geographically and ecologically (Barrow 1988). Thus, the
in abundance of some species e.g. Hydrocynus, Alestes and Schilbe, and
major perturbations on the Turkana Basin ecosystem are droughts of a
a decrease in individual mean size at fi rst maturity of fi sh.
year's duration or longer (Ellis & Swift 1988) rather than human infl uence
through, e.g. over-grazing and biomass burning.
Socio-economic impacts
The economic impact of deforestation in this area has not been
Environmental impacts
determined. However, the decline in fi sh landings due to the collapse of
Loss of ecosystems or ecotones
the tilapia fi sheries in the Ferguson Gulf had a relatively high economic
The habitats that are aff ected to varying degrees are the swamps, riparian
impact. The number of people estimated to be involved in commercial
belts, deltaic wetlands, river fl oodplains and the periodic standing water
fi sheries in Turkana District in 1982 was 30 000 to 40 000 (Kallqvist et al.
42
GIWA REGIONAL ASSESSMENT 47 EAST AFRICAN RIFT VALLEY LAKES
1988). This is a signifi cant proportion of the districts total population
revive the commercial fi shery. There are virtually no other employment
of 230 000 in 1988 (lower in 1982) (Kallqvist et al. 1988). Reduced fi sh
opportunities for the local populations.
landings and marketing problems subsequently led to fi sheries being
much less profi table: the main reason for the decline in fi sh landings
Better land use practices are critical for the conservation, sustainable
was the collapse of the tilapia fi sheries in the Ferguson's Gulf area due to
use and management of habitats. There is a critical need to initiate
overexploitation and habitat change resulting from lowered lake levels
studies to understand the natural and socio-cultural drivers of the
(aff ecting spawning grounds), and today Lake Turkana has less than 3%
habitat dynamics that have been observed in the region so that
of total fi sh catches in Kenya (Ikiara 1999). Loss of existing income in the
eff ective implementation policies can be drafted. In the absence of
only economic sector (fi sheries) had therefore a severe eff ect, and the
any interventions, it is expected that the economic impact would
eff ects of the fi sheries collapse due to habitat change have persisted
become more severe as a result of further ecosystem loss and habitat
over time. There are virtually no other employment opportunities for
modifi cation. Subsistence fi sheries would be most aff ected as shallow
the local populations.
aquatic areas are lost to land, reducing the local populations capacity
to meet basic food needs. This, in turn, would increase health risks. The
Fish is a primary source of protein in the area. Drastically reduced
prospect of human confl ict would also increase as populations migrate
fi sh landings due to habitat change particularly in Ferguson's Gulf
to areas which still retain their ecosystem integrity.
and reduced opportunities for fi sheries in the Omo River delta area
has negatively impacted on the nutritional status of the population.
Although the food poverty level in some areas, e.g. Turkana District is
T
C
A
high (81%) (Republic of Kenya 2002b), the degree of severity is not very
Unsustainable exploitation of
IMP
high as there are alternative protein sources (primarily livestock). The
fish and other living resources
lack of adequate protein supply is continuous, and its improvement is
dependent on revival of the fi sheries industry.
There are four fi sh communities in the Lake (Table 12): littoral, from
the lakeshore to about 4 m deep; inshore demersal, from the littoral
High rates of deforestation are recorded in the arid and semi-arid lands
zone to 10-15 m deep; off shore demersal, from 8-20 m off shore and
of Kenya (including the Lake Turkana Basin area), resulting in loss of
about 3-4 m above the lake bottom; epipelagic, subdivided into a
indigenous biodiversity, destruction of vital ecosystems and habitats
superfi cial pelagic community above a midwater scattering layer and
(Kirubi et al. 2000). Reduced capacity to meet the basic human need
a deep pelagic community below this layer down to the demersal
for food and fuel aff ects the welfare of the family unit. Global acute
zone, extending down to some 60 m in the deepest part of the Lake
malnutrition rates in Turkana have increased to between 18ş37% in
(Lowe-McConnell 1995). The boundaries of the various communities
May 2003 compared to 11ş21% during the same time in 2002 (UN
shift seasonally, depending on the depth of light penetration (Lowe-
Kenya 2003). It is estimated that fuel wood and charcoal constitute 95-
McConnell 1995).
99% of the total energy demand for cooking, heating and lighting in
the arid and semi-arid lands of Kenya (Kirubi et al. 2000). With the on-
The Lake is currently largely unexploited but has the potential for
going destruction of vital ecosystems and habitats, the already acute
fi shing and tourist attraction (Republic of Kenya 2002a and b). There
situation is likely to get worse. Loss of alternative income has probably
is no evidence of decreased viability of stocks through contamination
aff ected the family units' ability to aff ord education, health services, etc.,
and disease, nor of destructive fi shing practices.
although there is no quantitative information available on its impact.
Environmental impacts
Conclusions and future outlook
Overexploitation
There have not been any comprehensive studies on the biodiversity
Fishing takes place both in the unprotected Omo River delta (Hughes
and ecological structure of the wetland ecosystems that are being
& Hughes 1992) and in the Lake. Based on measured primary
increasingly impacted by human activities including sedimentation and
phytoplankton productivity, an empirical model predicted a total fi sh
modifi cation of river fl ow. Studies need to be carried out to establish
yield of 22 000 tonnes per year for Lake Turkana, and the sustainable
what types of ecosystem habitats have been lost. The economic impact
yield of traditionally exploited fi sh from the off shore areas of the Lake
of deforestation in this area has not been determined. Fisheries off er
is estimated at 15 000 to 30 000 tonnes per year (Kallqvist et al. 1988).
a source of livelihood for the locals and attempts should be made to
The fi sheries of Lake Turkana are, today, operating way below their
ASSESSMENT
43
Table 12
Fish species and habitats in Lake Turkana.
Conclusions and future outlook
Although the Lake Turkana fi sheries sector contributes little to the
Community
Fish species
Habitat
economies of Kenya and Ethiopia, it provides the riparian inhabitants
Oreochromis niloticus, Clarias lazera
Throughout littoral zone
with food options particularly during periods of drought. The
Sarotherodon galilaeus, Alestes nurse,
remoteness of the site and lack of infrastructure is the major stumbling
Over soft deposits
Micralestes acutidens, Chalaethiops bibie
Littoral
block in the development of a thriving fi sheries sector in the region.
Tilapia zillii, Leptocypris (`Barilius') niloticus
Over rocky or stony bottoms
Haplochromis rudolfianus, Aplocheilichthys
Among emergent or submerged
Fisheries is currently mainly a subsistence activity that is not
rudolfianus
macrophytes
contributing much to the economy of the area. The resurgence of
Labeo horie, Citharinus citharus, Distichodus
Over hard substrates
niloticus
commercial fi sheries would have positive eff ects on the economy of the
Inshore demersal
area. Because of the increasing density of settlements and population
Bagrus docmac
Over rocky areas
growth in the area, and the harsh environmental conditions that does
B. bayad, Haplochromis macconelli
Offshore demersal
Deep water
(endemic), Barbus turkanae
not support high agricultural productivity, there may be increased
consumption of fi sheries products. Social confl icts are likely to fl are up
Pelagic zone - midwater
Alestes minutus, A. ferox (both endemic)
scattering layer
particularly between commercial and subsistence fi shermen as fi shing
Alestes baremose, Hysrocynus forskahlii,
Superficial pelagic zone - above
grounds for the latter have been reduced by freshwater shortage,
Epipelagic
postlarval Neoboa stellae, juvenile lake
midwater scattering layer
prawns
pollution, ecosystem change and global change.
N. stellae, Lates longispinus, Schilbe
Below midwater scattering layer
uranoscopus, adult prawns
(Source: Lowe-McConnell 1995)
T
C
A
sustainable yield limits. The impact of overexploitation is scored as slight
Global change
IMP
based on the criteria that "commercial harvesting exists but there is no
evidence of overexploitation".
The Lake Turkana Basin is prone to frequent droughts. Drought is
reportedly occurring more frequently (Waktola 1999), with elders in
Excessive by-catch and discards
Turkana recalling recent droughts in: 1984, 1992-93, 1996, 1997, 1999, and
Although there is no information on current excessive by-catch and
2000 (Hann et al. 2003). The rainfall pattern and distribution is erratic
discard, the issue was categorised as having a slight impact based on
both in time and space, and it tends to fall in brief, violent storms that
the fi shing practices that partly led to the collapse of the fi sheries sector
result in fl ash fl oods (Republic of Kenya 2002b). Lake Turkana responds
in the 1980s and the under-recovery of the fi sh stocks in traditional
drastically to climatic variability.
fi shing bays such as Ferguson's Gulf.
There is no evidence (no studies carried out) of increased UV-B radiation
Impact on biological and genetic diversity
as a result of ozone depletion or of changes in lake CO source/sink
2
The introduction of alien stock (Nile perch) is considered as having
function. Some gas charged sediments are reported in Lake Turkana
a slight impact because there is, apparently, no evidence that it has
from seismic profi ling, but no further work has been done to verify and
caused major changes in the community structure of the Lake.
quantify the fl ux.
Socio-economic impacts
Environmental impacts
Fisheries is currently mainly a subsistence activity that is not contributing
Changes in hydrological cycle and lake circulation
much to the economy of the area. Today, Lake Turkana has less than 3%
The growth of the delta (Haack & Messina 2001) is partly a result of
of total fi sh catches in Kenya (Ikiara 1999), and most of the proceeds
increased aridity. Both a decrease in precipitation within the catchment
from fi sh sales are expatriated to other parts of the country. There are no
basin and an increase in temperature can be contributing factors. An
known health impacts except those that may arise from consumption
increase in temperature would increase evaporation rates from the
of naturally diseased fi sh (which has a very low probability). There are
surface of the Lake and elsewhere in the region and decreased soil
no social impacts as the current fi sh landing rates are far below the
moisture would lessen run-off .
sustainable yield of the Lake's fi sheries resource. Fishing is mainly at
subsistence level.
44
GIWA REGIONAL ASSESSMENT 47 EAST AFRICAN RIFT VALLEY LAKES
An annual cycle of stratifi cation of the lake waters was observed in 1988:
16
stable stratifi cation from March to May and complete circulation in June
12
to July (Kallqvist et al. 1988). The stratifi cation infl uenced the distribution
0 m: ca. 365 m above sea level
(m)
8
of fi sh in the deep water over as much as 20% of the lake area (Kallqvist
els
lev
e 4
et al. 1988). For the rest of the year, there is partly restricted vertical
lak
0
mixing with a temperature gradient of 1 to 2░C from the surface to the
Annual -4
bottom at 70 m (Kallqvist et al. 1988).
-8
1885
1900
1915
1930
1945
1960
1975
1990
Lake-level change
Year
Figure 14 Fluctuations in the level of Lake Turkana, 1888-1990.
On a perennial basis the lake level fl uctuates about 1 m every year
(Source: World Lakes Database 2002)
from the seasonal fl ooding of the Omo River (Ferguson & Harbott
1982) and has fl uctuated over 20 m in the past century (Butzer 1971).
displacement of families, destruction of infrastructure such as schools,
It was 15 m higher at the end of the 19th century and 5 m lower in the
health and water facilities, and disruption of education and farming
1950s (Figure 14). These changes were climatic and to a lesser extent
(Republic of Kenya 2002b).
geomorphological in origin. The changes since then are more dramatic
and more likely to be anthropogenic (Haack & Messina 2001).
Conclusions and future outlook
The projected increases in global temperatures are expected to lead to
Socio-economic impacts
signifi cant local changes in precipitation and evaporation. The volume
Lack of potable freshwater and food during periods of drought have
and level of Lake Turkana is likely to continue fl uctuating widely, with
incurred high economic costs to the two countries at large in terms of
a probable overall downward trend due to global warming and to the
resettlement and food aid (Waktola 1999, Hann et al. 2003). Declining
intensifi cation of land and water use in the catchment (Nyamweru 1992).
water levels in Lake Turkana led to the collapse of the fi shing industry
These changes in lake level will have signifi cant eff ects on the lacustrine
at Kalokol as the catch declined and the shoreline moved 6 km away
wetlands (Nyamweru 1992) and biodiversity, e.g., upstream of the Omo
from the only cooling and fi sh-processing plant. Lack of potable water
River delta is an extensive fl oodplain: the existing combined wetland
and food during periods of drought leads to malnutrition and even
(4░28'-5░13' N; 35░44'-36░13' E) covers 120 000 ha (Hughes & Hughes 1992).
deaths. In southern Ethiopia, for example, during the famine in 1985-
Higher temperatures may also result in longer periods of stratifi cation in
86, there was a 40% increase in mortality among children under fi ve
lakes with reduced dissolved oxygen contents. During periods of stable
years old in "traditional and stable societies" and a three- to fourfold
stratifi cation, there can be conditions where reduced dissolved oxygen
increase for those who were living in relief shelters (CIHI 1996). A lack
will aff ect fi shes, as was noted in May 1988 when stable stratifi cation
of potable water and food during periods of drought leads to large-
infl uenced the distribution of fi sh in the deep water over as much as
scale displacement of populations and fragmentation of family units.
20% of the lake area (Kallqvist et al. 1988). Reduced lake levels will also
Most of the poorest people in Turkana District dwell in the northern
result in increased salinity and pH of the water, which would have
part and central plains where there is recurrent drought and disease
adverse eff ects on phytoplankton, zooplankton, fi sh biodiversity and
(Turkana District Development Plan 2003). Social confl icts increase over
fi sh stocks. Changes in water quality will also aff ect the avian fauna,
the sharing of limited resources (cf. Raymakers 2003). It takes a fairly
particularly water-edge and migrating birds.
long time to revert back to the normal way of life after such events. For
example, during the severe drought that was experienced in 1999ş2000
in the Lake Turkana area, there was heavy loss of livestock resulting
mainly from lack of forage and disease outbreaks, reduced agricultural
Priority concerns
production, necessitating the remobilisation of resources to save the
lives of both humans and livestock through the provision of water, relief
The concerns that are recommended for further analysis based on
food and food supplements, disease control, and provision of health
the outcome of the GIWA assessment are: Habitat and community
services (Republic of Kenya 2002b). Cattle rustling, which is rampant
modifi cation and Freshwater shortage. The concerns were ranked in
in the area around Lake Turkana, is probably partly driven by the need
descending order of severity:
to re-stock livestock herds that have been devastated by drought.
1. Habitat and community modifi cation
Cattle rustling and bandit raids lead to loss of life, loss of property,
2. Freshwater
shortage
ASSESSMENT
45
3. Pollution
hence modifi cation (e.g. loss of ecosystems and changes in population
4. Global change
structure) of the wetland areas in the deltaic and fl oodplain areas of the
5. Unsustainable exploitation of fi sh and other living resources
principal rivers, as well as in the littoral waters of the Lake. The linkages
between the GIWA concerns are shown in Figure 15.
Habitat modifi cation is a result of all the other four GIWA concerns,
although Unsustainable exploitation of fi sh and other living resources
is the least signifi cant in this case and is not discussed further. With
I. Freshwater
respect to Global change, the trend of reducing precipitation and higher
shortage
temperatures can result in increased concentrations of pollution in the
Lake due to reducing lake level (and volume). However, global change is
more important in its infl uence on freshwater through the hydrological
cycle. It can also drive habitat change but this, as a naturally occurring
III. Habitat
II. Pollution
modification
process, would be on the order of decades to millennia. Pollution, which
in this case is due mainly to suspended sediments that originate from
habitat change (land clearance, degradation and increased erosion
rates) in the principal river catchments, can aff ect natural habitats in the
Lake by limiting light penetration and smothering benthic organisms.
IV. Unsustainable
exploitation of living
High microbiological load also reduces the availability of potable water.
V. Global change
resources
Freshwater shortage is most closely linked to habitat modifi cation. The
freshwater shortage arises primarily due to abstraction of river water for
Not significant
Significant
Very significant
irrigation, and damming. This has, in part, led to rapid delta growth and
Figure 15 Linkages between the GIWA concerns in Lake Turkana.
46
GIWA REGIONAL ASSESSMENT 47 EAST AFRICAN RIFT VALLEY LAKES
Gurumeti, Duma, Simiyu, Magoga, Isonga and Kagera (Figure 16, Table
Lake Victoria Basin
14) (Shepherd et al. 2000). Of these, only two are shared; the Kagera by
Tanzania, Rwanda, Burundi and Uganda; and the Mara by Kenya and
Tanzania. The only surface outlet is the Nile River, which has the Owen
Falls hydroelectric power station at its source.
Table 13
Scoring table for Lake Victoria.
Assessment of GIWA concerns and issues according
The arrow indicates the likely
to scoring criteria (see Methodology chapter)
direction of future changes.
T
T
Freshwater shortage has only slight impact in Lake Victoria Basin.
C
C
Increased impact
A
A
0 No
known
impacts
2 Moderate
impacts
IMP
IMP
T
T
No changes
C
C
The freshwater shortage in the Lake Basin, most of which is due to
A
A
1 Slight
impacts
3 Severe
impacts
IMP
IMP
Decreased impact
pollution of existing supplies, is driven principally by pollution as a
i
t
y
major concern. This issue is, therefore, tackled in more detail in the
tal
p
a
c
t
s
un
*
*
p
a
c
t
s
m
ore
section on Pollution.
Lake Victoria
i
c
i
m
o
m
Sc
c
t
s
o
m
c
t
s
t
y
***
e
r
c
o
n
a
l
t
h
i
m
erall
E
n
vironmen
impa
Ec
He
Oth
impa
Ov
P
r
i
o
ri
Environmental impacts
Freshwater shortage
1.7*
0.1
0.6
1.0
1.3
5
Modifi cation of stream fl ow
Modification of stream flow
1
Pollution of existing supplies
2
Some of the infl owing rivers from the catchment have been modifi ed
Changes in the water table
2
by activities involving irrigation (Nyando, Yala and Kagera rivers), valley
Pollution
2.6*
2.0
2.0
2.0
2.1
1
dam construction (Sondu-Miriu and Yala rivers) and for others, the fl ood
Microbiological pollution
3
plains and wetlands have been degraded (most of the affl
uent rivers).
Eutrophication
3
Chemical
2
This leads to reduction of infl ow (Scheren et al. 2000, Lowe-McConnell
Suspended solids
3
1994, Awiti & Walsh 2002), but the eff ects are constrained mostly in the
Solid waste
1
specifi c river drainage basins where water is being abstracted, since
Thermal 0
Radionuclide
0
direct precipitation on the Lake is by far the dominant principle source
Spills
0
of water in the lake system. Out of the total irrigation potential of 469 400
Habitat and community modification
2.5*
1.1
1.2
1.0
1.5
3
ha in Kenya, 214 000 ha (46%) lies within the Lake Victoria Basin where
Loss of ecosystems
2
the unexploited potential is still large (Marenya & Nyaguti 2000).
Modification of ecosystems
3
Unsustainable exploitation of fish
2.6*
2.4
2.2
2.1
1.9
2
Table 14
Demographic and biophysical characterisation of the
Overexploitation
3
inlet drainage basins of Lake Victoria.
Excessive by-catch and discards
2
Mean
Sediment
Countries Basin
Population
Total
Destructive fishing practices
3
River
annual transport Average
sharing
size
density 2000 population
basin
rainfall capacity
% slope
Decreased viability of stock
2
basin
(km2)
(people/km2)
2000
(mm)
index*
Impact on biological and genetic diversity
2
Nzoia/Yala
Kenya
15 143
221 (▒154)
3 346 000
1 306
0.14
2.3
Global change
1.0*
1.3
1.4
1.0
1.3
4
Nyando
Kenya
3 517
174 (▒127)
611 000
1 360
0.30
5.0
Changes in hydrological cycle
1
Sondu
Kenya
3 583
220 (▒148)
788 000
1 415
0.14
2.3
Sea level change
1
Miriu
Increased UV-B radiation
0
Gucha
Kenya
6 612
224 (▒183)
1 481 000
1 300
0.16
2.0
Changes in ocean CO source/sink function
0
2
Kenya
Mara
13 915
46 (▒56)
640 000
1 040
0.15
2.0
*
This value represents an average weighted score of the environmental issues associated
Tanzania
to the concern. For further details see Detailed scoring tables (Annex II).
Gurumeti
Tanzania
12 290
21 (▒26)
258 000
879
0.12
1.6
** This value represents the overall score including environmental, socio-economic and
Mbalaget
Tanzania
5 702
37 (▒22)
211 000
766
0.05
0.6
likely future impacts. For further details see Detailed scoring tables (Annex II).
*** Priority refers to the ranking of GIWA concerns.
Duma/
Tanzania
9 702
50 (▒26)
485 000
804
0.06
0.5
Simiyu
Magoga/
T
Tanzania
5 104
88 (▒47)
449 000
842
0.05
0.4
C
A
Freshwater shortage
Muame
IMP
Isonga
Tanzania
8 972
48 (▒22)
430 000
897
0.04
0.3
Tanzania
The waters of Lake Victoria and its shoreline are shared between three
Uganda
Kagera
59 158
181 (▒196)
10 711 000
1 051
0.24
3.0
Rwanda
countries; Kenya (6%), Uganda (43%) and Tanzania (51%). Additionally,
Burundi
the catchment of the principal affl
uent river, the Kagera, runs through
Kenya
Lake edge
Tanzania
40 682
133 (▒175)
5 411 000
1 077
0.21
1.4
the countries of Rwanda and Burundi. There are 11 main rivers draining
Uganda
* Areas with high indices are those with higher potential for erosion.
into Lake Victoria: Nzoia, Yala, Nyando, Sondu-Miriu, Gucha, Mara,
(Source: Shepherd et al. 2000)
ASSESSMENT
47


0
500 Kilometres
White Nile
Kenya
Nzoia/Yala
DR Congo
Uganda
Nyando
Sondu Miriu
Gucha
L a k e
Kagera
V i c t o r i a
Mara
Rwanda
Gurumeti
Duma/Simiyu
Magoga
Burundi
Isonga
Tanzania
ęGIWA 2003
Figure 16 The major drainage basins of Lake Victoria.
Pollution of existing supplies
2000, Kituyi et al. 2001, Kasozi 2001). However, though the concentration
Lake Victoria provides freshwater supply for domestic, agricultural,
levels are below the acute toxicity level they may be of concern to the
livestock and industrial use. Tropical lakes are at particular risk from
food chain (Wandiga 2002).
pollution hazards, owing to the lower oxygen saturation levels and
high oxygen consumption rates which occur at high temperatures
Many rivers and even sewerage outlets drain through swamp areas
(Cohen et al. 1996). In Lake Victoria, pollution is a major problem. Since
before discharging to the open waters of Lake Victoria. When fl owing
the 1960s, the Lake has experienced a serious decline in water quality
slowly through the swamp, the biological oxygen demand (BOD),
(microbiological and chemical contamination, increased suspended
nutrients, pathogens and other pollutants in the water generally reduce
solids, etc.) negatively impacting on dependent communities. Several
(Kansiime & Nalubega 1999, LVEMP 2001). The wetlands environmental
chemical pollution studies have detected low levels of trace metals
function as a sink for pollutants is, however, potentially in danger
and pesticides in the water, sediments, plants, and fi sh species of the
through loss of ecosystem function as a result of harvesting, clearing,
Lake (Wandiga1981, Wandiga & Onyari 1987, Ejobi et al. 1994, Ruud 1995,
cultivation and diversion of water for irrigation agriculture (Balirwa 1998,
Wasswa 1997, Ssentongo 1998, Henry & Kishimba 2000, Tole & Shitsama
Chapman et al. 2001, LVEMP 2001).
48
GIWA REGIONAL ASSESSMENT 47 EAST AFRICAN RIFT VALLEY LAKES
Changes in the water table
sources are normally groundwater wells and boreholes that have been
Groundwater stored within the Lake Victoria catchment was estimated
constructed by NGOs and national governments.
in 1979 to be of the order of 70 000 million m3, while the total annual
groundwater discharge was about 18 million m3, of which 7.5 million m3
Conclusions and future outlook
was discharge to streams and 4.9 million m3 was that extracted by
Other than the pollution of existing supplies, freshwater shortage is not
pumping (Ongwenyi 1979). These are broad estimates in view of the
yet a critical problem in the Lake Basin. The Kenya National Water Master
fact that no quantitative assessment has been attempted (Ongwenyi
Plan includes plans for dams and water transfer projects from the Basin
1979). In the Kenya sector, the groundwater is of excellent chemical
to other river basins or sub-basins in the country (UNECA 2000). There
quality (total dissolved solids concentration is of the order of 500 ppm
are several localities within the Lake Basin in Kenya where dams have
and rarely exceeds 1000 ppm) and can be put to a variety of uses
been proposed, and recently the Sondu-Miriu Dam on Sondu-Miriu
(Ongwenyi 1979). The only problem is that in places the groundwater
River has been built mainly for hydroelectric power supply. Tanzania
contains excessive fl uoride concentrations far in excess of the 1.5 ppm
also plans to transfer water from the Lake to the Vembere Plateau in
stipulated for drinking water purposes (Ongwenyi 1979). The expansive
the Manonga River Basin in central Tanzania to irrigate between 88 000
and continual land degradation, soil erosion and deforestation that has
and 230 000 ha of land (UNECA 2000). The eff ects of this structure and
been taking place over the past few decades within Kenyan sector of
others proposed may lead to freshwater shortages. Land degradation
the catchment (Swallow et al. 2002), provides indirect evidence that
and deforestation in the watershed regions and the catchment as
there is declining base-fl ow in rivers. There have been reports of over-
a whole will steadily lead to the depletion of natural water supply
abstraction of water in some wells within the region, but the regional
(both surface and groundwater) in the drainage basin, with adverse
extent of this is not known. Studies are required to quantify base-fl ow in
consequences.
rivers and to establish the regional nature of the groundwater aquifers in
the Lake Basin, their quantity and yield, in order to be able to sustainably
Interventions are required to initiate sustainable development within
manage the resource.
the catchment to protect the critical watershed areas and aquatic
systems. Maintenance of the status quo would have adverse impacts
Socio-economic impacts
in the long run. Economic impacts will arise due to loss of; agricultural
There are no signifi cant economic impacts arising from freshwater
uses and productivity (crops, livestock, aquaculture), hydroelectric
shortage in the Lake Basin. Treatment of common water-borne diseases
power production, and industrial uses. There would also be increased
and loss of income due to incapacitation has some eff ect on economic
costs of intake treatment and damage to water-related equipment.
activities and livelihoods in the Basin, and is particularly exacerbated by
Freshwater shortage would also lead to loss of human drinking water
the generally high poverty levels. Many of the people living in villages
supplies, recreational use and aesthetic values, and waste assimilative
along the shoreline and close to the rivers in the catchment area as a
capacity. There will be increased potential for upstream/downstream
whole draw their water directly from these sources for domestic use and
confl icts, and reduced availability of fi sh as food.
consumption without any treatment (Bwathondi et al. 2001, Thompson
& Cairncross 2002). Except for the urban centres, the rural settlements
do not have any treated water supply networks nor sanitation
T
C
A
infrastructure. Although more homes are today supplied with piped
Pollution
IMP
water, the supply is irregular and unevenly distributed (Thompson &
Cairncross 2002). Nzoia, Yala, and Nyando rivers (Shepherd et al. 2000)
In Lake Victoria and its infl uent rivers, pollution is a major problem. From
and the lake area around the large urban centres such as Kisumu,
the catchment areas, there are: diff use pollution sources such as silting
Kampala and Mwanza, are the most polluted. Along the lake edge, the
and agrochemicals which increase biological oxygen demand (BOD)
problem has become worse because the water is often dirty and smelly
and fertilise the Lake; and point pollution sources including industrial
because of the rotting mats of hyacinth weed (NEMA 1998, Mailu 2001),
wastewater effl
uents and solid wastes, domestic sewage and organic
even in areas that are far removed from urban centres. Groundwater
and microbial loads (Wandiga & Onyari 1987, Kansiime & Bugenyi 1996,
development projects conducted by NGOs in these areas have
Kansiime & Nalubega 1999, Scheren et al. 2000).
somewhat mitigated the impact of use and consumption of polluted
water. Polluted water supplies compel the aff ected communities to
Most of the farming systems in the Lake Basin are associated with slash
search farther away from their villages for sources of clean water. These
and burn land management practices. Burning residues left in forest
ASSESSMENT
49
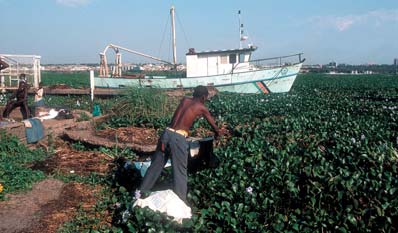
timber harvesting produce an even greater increase in the release
half of the lake fl oor currently experiences prolonged anoxia for several
of ions from the forest litter and mineral soil than the harvesting
months of the year, compared to the 1960s when anoxia was localised
operation itself. The impact of these ions (most of which are nutrients
and sporadic (Talling 1965 and 1966, Hecky 1993). Algal concentrations
like nitrate, phosphate and sulphate) on the Lake has been an increase
are three- to fi vefold greater in the surface waters today than in the
in eutrophication (Hecky 1993). Nutrient loads to the Lake are associated
1960s, refl ecting higher rates of photosynthesis (Mugidde 1993). In
mainly with atmospheric deposition (natural and biomass burning) and
consequence, dissolved silica concentrations in the water column
land run-off (e.g. agriculture), and these together account for about
have plummeted to 10% of their 1960s values (Hecky 1993, Verschuren
90% of phosphorus and 94% of nitrogen input to the Lake (Scheren
et al. 2002). Enhanced denitrifi cation has lowered the N:P ratio and blue-
et al. 2000). Other nutrient sources include riverine input, nitrogen
green algae have replaced diatoms as the dominant phytoplankton in
fi xation, the upward fl ux of nutrients from the water layers below
the Lake (Hecky 1993, Verschuren et al. 2002).
(Hecky 1993), and sewerage effl
uents from urban centres. Millions of
litres of untreated sewage sludge fl ow into the Lake every day from
From satellite imagery, it has been observed that nutrient-rich
major urban centres along the lake shore (Scheren et al. 2000). In
sediment plumes originating from agricultural run-off and the low-
Uganda for example, expired chemicals as well as drugs and partially
lying, deforested riparian zones and other areas surrounding the Lake
treated domestic sewage from the Kampala area is dumped into public
are feeding the water hyacinth (Wilson et al. 1999). For instance, in
waterways, which fi nally ends up in Lake Victoria (Kiremire 1997).
September 1998 the water hyacinth mat covered 400 000 ha of the
Kavirondo Gulf in Kenya (Figure 17). In the same year, four-fi fths of
Environmental impacts
Uganda's shoreline was covered by the hyacinth mat. Its spread has
Microbiological
disrupted fi shing activities, transportation, and has threatened the
Microbial pollution is a big problem with many incidences of epidemics
functioning of various lakeshore-based installations such as water
of cholera, dysentery and intestinal problems (e.g. Karanja 2002). There
purifi cation and hydroelectric power plants (e.g. Twongo 1996).
are major urban centres located near the Lake, such as Kampala and
Proliferation of the water hyacinth leads to reduced oxygen levels, and
Entebbe in Uganda, Bukoba and Mwanza in Tanzania, and Kisumu in
hence reduced fl oral and faunal diversity (Kudhongania et al. 1996). A
Kenya. Large sectors of these and other urban-periurban centres either
study in the Ugandan part of Lake Victoria has shown that in the vicinity
do not have, or are poorly served by a public sewerage system; raw
of the water hyacinth mats, fi sh species number, biomass and diversity
sewage is discharged directly into the Lake (Nriagu 1992). Pit latrines
are reduced, the former two very signifi cantly (Willoughby et al. 1996).
are the most common method of on-site sanitation in Mwanza. This
It, however, provides a protective habitat for some of the endangered
leads to seepage of sewage to low-lying areas and streams. In 1995,
haplochromine species, hippopotamus, crocodiles, snakes, as well as
with the exception of the Mwanza Tanneries, which had a wastewater
bilharziasis carrying snails and mosquitoes.
treatment facility, all the industries in Mwanza drained their wastewaters
into Lake Victoria without any treatment (Kishimba & Mkenda 1995), and
the situation remains signifi cantly unchanged to date.
Eutrophication
Eutrophication has increased drastically within the last four decades
due to high levels of nutrients (Hecky 1993). Landscape disturbance
from the 1930s onwards, and the resulting increase in soil erosion and
sedimentation is the dominant cause of the ongoing eutrophication
(Verschuren et al. 2002). Algal blooms have increased since the 1960s
(Mugidde 1993). The fi lamentous and colony forming blue-green
Figure 17 Water
hyacinths.
algae, known for causing hypoxic conditions that occasionally lead
(Photo: Still Pictures)
to fi sh kills is now very dominant in Lake Victoria (Kling et al. 2001).
Domestic biological oxygen demand exceeds industrial loads in all
regions (Scheren et al. 2000). The use of agrochemicals is increasing in
The extinction of the haplochromine species have been attributed
the Lake Basin where there are large-scale farms of coff ee, tea, cotton,
to occurrence of seasonally persistent deep-water anoxia since the
rice, maize, sugar and tobacco (Ntiba et al. 2001). Consequently, nearly
late 1970s (Kaufman & Ochumba 1993, Hecky et al. 1994); decimation
50
GIWA REGIONAL ASSESSMENT 47 EAST AFRICAN RIFT VALLEY LAKES
of demersal haplochromine fi sh stock by Nile perch since the former
agricultural lands as well as inappropriate cultivation practices, forest
deep-water refugium that protected them from predation had been
removal and high grazing intensities (that, in extreme cases, leave barren
destroyed by lack of oxygen; and historical land use that resulted
environments) lead to unwanted sediment and stream fl ow changes
in massive nutrient load with subsequent algal production in Lake
that impact mainly the downstream communities (Magunda & Majaliwa
Victoria (Verschuren et al. 2002). The last cause indicates that landscape
2000, Botero 1986). Forests and bush are cleared, and wetlands are
disturbance rather than food-web alteration or climate change is the
encroached to create space for human settlement, roads construction
dominant cause of the ongoing eutrophication. All the three factors
and to satisfy wood fuel energy demands. Similarly, pastoral areas are
have contributed to species decline with the major cause being
subjected to growing human and livestock populations, leading to
attributed to land management whose control remains the signifi cant
land degradation, soil erosion and to an increase in the load of non-
remedy for saving the Lake.
point pollutants. Land use activities that alter the type or extent of
vegetative cover on watersheds frequently will change water yield
Chemical
and in some cases, maximum and minimum stream fl ow. The overall
The use of agrochemicals is increasing in the Lake Basin where there are
eff ect of deforestation/change of plant species because of population
large-scale farms of coff ee, tea, cotton, rice, maize, sugar and tobacco
pressures has increased sediment loading to rivers and lakes in the Basin
(Ntiba et al. 2001). In the industrial sector, the polluters include e.g.
(Swallow et al. 2002). The sediment loads from such areas are normally
breweries, sugar refi neries, soft drink and food processing factories,
high in nutrients and organic matter (Ffolliot & Brooks 1986).
oil and soap mills, leather tanning factories and mining companies
(Ntiba et al. 2001). Pollution has also been reported in feeder rivers and
Solid waste
streams (e.g. Wandiga & Onyari 1987, Kishimba & Mkenda 1995). Beer
Solid waste pollution is localised in areas with high population densities,
brewing, pulp and paper production, tanning, fi sh processing, agro-
such as the downstream sections of the rivers, and around the lake edge
processing and abattoirs discharge raw/untreated waste to feeder rivers
close to urban centres or settlements (personal observations). These
and lakes (e.g. Wandiga & Onyari 1987, Ntiba et al. 2001). All these have
waterways are used for dumping of various types of solid wastes such
contributed to the degradation of river and lake water quality for habitat
as plastics, scrap metals, paper, wood and other types of waste from
and drinking use (Wandiga & Onyari 1987, Ntiba et al. 2001).
cottage industries, etc. (personal observations).
Several chemical pollution studies have detected low levels of trace
Socio-economic impacts
metals and pesticides in the water, sediments, plants, and fi sh species
The costs are related to wastewater treatment, the cost of alternative
of the Lake (Wandiga & Onyari 1987, Wasswa 1997, Ejobi et al. 1994,
supplies and the costs of removing invasive weeds (Twongo 1996) plus
Kasozi 2001, Ssentongo 1998, Henry & Kishimba 2000, Wandiga 1981,
the costs of treating diseases (Karanja 2002). The cost of treating the
Kituyi et al. 2001, Ruud 1995, Tole & Shitsama 2000). However, though
water before supplying it to the public is high because of the diverse
the concentration levels are below the acute toxicity level they may
range and high concentrations of pollutants in the water. Suspended
be of concern to the food chain (Wandiga et al. 2002). The increase
solids also raises cost in relation to reduced output capacity and
of small-scale gold mining in Tanzania in particular (gold mining also
cleaning of turbines at the hydroelectric power stations, and reduces
takes place in Kenya) is leading to some contamination of the local
the lifespan of dams. The fi sh kills, migration of fi sh from certain areas
waterways by mercury which is used to amalgamate and recover the
because of anoxic conditions (Hecky 1993) and the cyanotoxins
gold; some traces of heavy metals such as chromium and lead are also
(Mugidde 1993) negatively impact on the output from the fi sheries
found in the Lake, although the problem has not yet reached major
industry. An additional eff ect on this sector is due to loss of income from
proportions. Expired pesticides are disposed of in the Lake, for example,
fi shing because of e.g. fi sh gill clogging by the suspended solids (Awiti &
used chlorine has been dumped into the Lake killing a lot of aquatic
Walsh 2002, Kairu 2001). Pollution and unhygienic conditions resulted in
organisms. Some companies have stockpiles of banned substances
great economic loss (estimated at 300 million USD) after the European
such as DDT and may potentially dispose of these in the Lake.
Union temporarily banned fi sh imports/exports to Europe from East
Africa in 1997 because of the fear of the contaminated fi sh.
Suspended solids
Lake Victoria Basin is mainly (80%) an agricultural catchment (Majaliwa
There are many people aff ected by pollution through using and bathing
et al. 2000). The current population pressure (more than 30 million
in dirty Lake Victoria water or infl uent river waters. Dumping untreated
people in the catchment) on forests, wetlands, rangelands and marginal
sewage in the Lake and nearby rivers exposes people to water-borne
ASSESSMENT
51
diseases, water-related vector borne diseases, faecal/orally transmitted
The riparian communities have relied on the Lake as a steady source
diseases, and health issues related to exposure to agro-chemical
of fi sh protein. In recent years the Lake has provided a near constant
residues (Karanja 2002). These health problems include malaria, cholera,
amount of about 20 000 tonnes of harvestable haplochromine fi shes.
schistosomiasis, typhoid, and dysentery. In several towns around the
In the last 40 years the Lake's ability to provide fi sh has been severely
shores and in the vicinity of the Lake, many epidemics of cholera,
compromised by a host of human impacts. These range from increased
dysentery and other water-borne diseases have been experienced.
soil erosion estimated at 690 million to 19 800 million tonnes per year
The cyanotoxins make the drinking water unpalatable to animals and
(Verschuren et al. 2002) with high nutrients, fertilisers and pesticides
aff ect the people who drink and bathe in this water. The algal blooms
loads from farming and deforestation activities; increased urban run-off
become unsightly after sometime, and have a foul odour. The eff ects of
and sewage spills; accidental introduction of water hyacinth; planned
the deteriorating state of the Lake on fi sh productivity also has negative
introduction of Nile perch; industrial and chemical wastes; and the
implications on the dietary needs of the riparian communities.
destruction of wetlands with contaminant sink potential.
Cockburn & Cassanos (1960) fi rst addressed the association of the
Conclusions and future outlook
bacterium Vibrio cholerae with plankton, observing a correlation
Microbiological pollution, eutrophication, suspended solids and chemical
between the incidence of cholera and presence of increased numbers
pollution are the most important issues in this GIWA concern and occur
of blue-green algae in the water. Cholera and bacillary dysentery have
over a signifi cant proportion of the Lake Victoria Basin. All these pose
become endemic within the lake population in recent years. During an
many problems of an economic, social and/or health nature. The certain
outbreak of cholera in western Kenya between June 1997 and March
population increase will increase demand for freshwater and other land-
1998, there were 14 275 cholera admissions to hospitals in the Nyanza
based resources, leading to greater pressure to modify the stream/river
Province, and a total of 547 cholera-related deaths reported (Shapiro
fl ows and higher rates of land degradation. The governments of the region
et al. 1999). A case-control study to identify major risk factors was
and international agencies such as GEF and the World Bank have provided
conducted at seven sites in the Asembo region, a rural area bordering
funds for water quality assessments with a view to mitigate pollution.
Lake Victoria. Drinking water from Lake Victoria was found to be one of
the independent risk factors for illness. A larger geographical analysis
Failure to address the pollution concern immediately would have far
showed that diarrhoeal patients who had V. cholerae were more likely
reaching and adverse consequences. Pollution in its various forms
to live in a village bordering Lake Victoria than were those with other
would lead to increased risks to human health, with attendant increased
pathogens identifi ed. The authors speculate that infestation of the Lake
costs of human health protection, costs of medical treatment, cost of
with water hyacinth may lead to improved survival of V. cholerae and
water treatment and clean-up, etc. Aquatic species would become
provide a reservoir of endemic infection (Shapiro et al. 1999).
increasingly endangered if pollution is not controlled. Because of the
increase in population, increase in urbanisation, and with no poverty
The Lake Victoria region in Kenya has long been described as one
alleviation programme, there will be a measurable number of people
of the major endemic areas of schistosomiasis in the world (Nelson
whose health and livelihoods will be impacted, even if there is a general
et al. 1962 in Karanja 2002). This situation is unlikely to have changed
increase in awareness of the problem. Other economic impacts would
since the number of people infected or at risk of being infected with
include increased costs of weed control (hyacinth), intake cleaning and
schistosomiasis in many areas has reportedly increased over the last
maintenance of monitoring programmes. Improvement in technology
50 years. The snail vectors that transmit both the intestinal Schistosoma
would make operations cheaper, despite the high capital cost of
mansoni and urinary form S. haematobium are widely distributed
investment. The problem of pollution will have to be addressed within
throughout the Lake Victoria Basin. Schistosomiasis has been shown to
the context of a transboundary integrated land and water management
be very closely associated with Lake Victoria in the three East African
plan. Critical habitats such as watershed areas, river banks and wetlands
countries of Uganda, Tanzania and Kenya (Kabatereine et al. 1996,
need to be urgently protected, and a quantitative assessment of
Karanja 2002, Masaba 1980, McClelland & Jordan 1962). Lake Victoria
sources, pathways and fl uxes of various types of pollutants needs to
Basin is characterised by stable endemic malaria (Bloland et al. 1999)
be carried out in order to initiate eff ective interventions. Rules and
with malaria-associated anemia being a serious cause of morbidity and
regulations governing pollution at national and international level
mortality (Lackritz et al. 1992). The prevalence of malaria in children in
need to be reviewed and enforced, while governments need to put in
Kisumu district ranges from 70-90% (Githeko et al. 1992).
more money into the provision of safe water and the enhancement of
sanitation infrastructure in the Basin.
52
GIWA REGIONAL ASSESSMENT 47 EAST AFRICAN RIFT VALLEY LAKES
T
C
A
Habitat and community
IMP
waterlilies and Pistia stratiotes are found fl oating in quiet spots, and
modification
there are many animals including water turtles, aquatic snakes, monitor
lizards, crocodiles, numerous birds, rodents, otters and Hippopotamus
Degraded and deforested lands (including wetlands) are becoming
amphibius (Hughes & Hughes, 1992).
increasingly characteristic features in the Lake Victoria catchment
(e.g. Shepherd et al. 2000, Swallow et al. 2002). Land use activities that
Ecosystem changes in the catchment area include, for example, the
alter the type or extent of vegetative cover on watersheds frequently
large-scale draining of the Yala swamp in Kenya to create land for
will change water yield and in some cases, maximum and minimum
agriculture and settlement (Grabowsky & Poort 1987). Also, clearing of
stream fl ow. The overall eff ect of deforestation/change of plant species
riparian vegetation has led to erosion and loss of vegetation that acted
because of population pressures is increased sediment loading to rivers
as fi lters (Lowe-McConnell 1994). Indications are that the on-going and
and lakes in the Basin. The sediment loads from such areas are normally
unregulated wetland conversion may contribute to a decline of fl oral
high in nutrients and organic matter (Ffolliot and Brooks 1986). Most of
and faunal diversity through loss of habitat, destruction of refugia, and
the farming systems in the Lake Basin are associated with slash and burn
fl oral/faunal mixing. Studies do, however, need to be conducted to
land management practices. The estimated extent of change of land
estimate the loss of ecosystems in the swamps.
cover as a result of human activities has been outlined in the Regional
defi nition section.
Modifi cation of ecosystems or ecotones
As recently as the 1960s, Lake Victoria supported an endemic cichlid
Lake Victoria is believed to have been invaded by water hyacinth in
fi sh species fl ock of between 300 and 500 members, but these
the late 1980s (Freilink 1991), through the Kagera River (Twongo 1996),
have progressively disappeared from the catches to become poorly
and since then a constant stream of the plant to cover 3 ha per day has
represented today. The losses are attributed to habitat degradation in the
entered the Lake. On entering the Lake it found a fertile environment
catchment, introduction of alien species (particularly Nile perch), heavy
for its multiplication. The weed thrives in bays and inlets which are
fi shing pressure (Ogutu-Ohwayo 1990, Witte et al 1999), proliferation of
sheltered from strong off shore and along-shore winds; have fl at or
fi lamentous and blue-green algae, and development of anoxic conditions
gently sloping, relatively shallow shores (rarely deeper than 6 m); and
within the Lake (Kling et al. 2001). This indeed refl ects a most startling loss
have a muddy bottom rich in organic matter (Twongo 1996).
of fi sh species that has resulted from modifi cation of an ecosystem.
Environmental impacts
Land use change can potentially lead to extreme impacts on food
Loss of ecosystems or ecotones
security in the region. For example, approximately 46% of the 3 516 km2
Land degradation and deforestation in the lake catchment area and
Nyando River Basin (or 1 624 km2) has experienced severe soil physical
along the river banks is probably contributing to loss of ecosystems (e.g.
erosion, and it is estimated that only 868 km2 remains unaff ected by
Shepherd et al. 2000, Swallow et al. 2002). The acreage under cultivation
soil physicochemical degradation or soil nutrient defi ciencies of one
for cash and food crops (namely tea, tobacco, rice, beans, coff ee and
form or another (Swallow et al. 2001). The most degraded parts of
sugar cane) in Nyanza province, for example, has increased from about
the Nyando River Basin, both in terms of nutrient defi ciencies and
15 400 ha in 1968 to 157 000 ha in 1991-1992 (Kairu 2001). Studies are,
soil physical degradation, are areas currently used for open grazing
however, needed to quantify the level of ecosystem loss.
and extraction of fuel wood; areas currently used for subsistence
agriculture are also characterised by both types of degradation but at
Much of the lake margin is swampy, and islands of Cyperus papyrus,
lower prevalence rates than grazing areas (Swallow et al. 2001). In the
with its typical associates, detach from the fringing swamps (Hughes
Mara, Mwanza and Kagera basins, clearing of forests has resulted in
& Hughes 1992). The continuous cropping of papyrus along the lake
deforestation, a dominant feature in most parts of the area where land
shore could have very serious ecological eff ects, including the loss
is left bare following the expansion of settlements, livestock keeping
of large quantities of nutrients removed with the harvested papyrus
and agriculture (Hongo 2000). Further research is, however, required to
biomass that would otherwise be recycled (Muthuri et al. 1989).
establish the linkages between land degradation, and biodiversity and
The interface of papyrus swamps and the open water is also often a
ecosystem change in the rivers and lake.
chemically rich habitat that harbours a high diversity and biomass of
aquatic organisms. The Lake itself contains submerged species such as
The wetlands of the Lake Victoria region have recently witnessed
Ceratophyllum demersum and Potamogeton spp. around the margins,
increased pressure from exploitation due to the need for land to
ASSESSMENT
53
produce more food, space to settle the rapidly growing population
Socio-economic impacts
and for other development projects. The full extent of wetland use
The negative economic impact of the loss of fertile agricultural soils in
and its impacts are not well known (Kairu 2001), but satellite imagery
the Lake Basin as a result of erosion could be fairly high, as described
suggests that it is substantial, based on observed erosion from shoreline
above. The immediate eff ect of wetland modifi cation is somewhat
zones (Wilson et al. 1999). The current degree of modifi cation of the
mixed: although the economic benefi ts of wetland resources could
littoral belt wetlands still needs to be quantifi ed. Some data from the
be high as a result of income from agricultural activities, harvested
inland wetlands provides some clues. For example, the Nakivubo Urban
papyrus sales, brick making, etc. (Schuijt 2002), wetland loss adversely
Wetland close to Kampala, Uganda, is being reclaimed for agricultural,
aff ects the fl ora, fauna, and the natural buff ering and other functions
industrial and residential expansion; already, slightly over half of the total
of the system. The economic costs of controlling the water hyacinth
area (2.9 of 5.29 km2) has been modifi ed or reclaimed for agriculture,
invasive weed (Twongo 1996, Twongo et al. 1995) and for restoration of
industry and settlement, and the danger exists that the entire wetland
the modifi ed ecosystems are high. Costs related to hyacinth clean-up
will be modifi ed and converted for urban expansion purposes (Schuijt
are substantial but they are in localised areas, for example the shipping
2002). The Yala valley swamp in Kenya (along Yala River) is host to many
harbours and water intake points. There have also been losses of
fi sh species, plants, invertebrates and birds as well as mammals and
earning opportunities when fi shermen could not access fi shing and fi sh
reptiles. Currently, part of the swamp has been reclaimed for agricultural
landing sites, and through interference with fi shing gear and clogging
use, and more recently, the government of Kenya has put aside about
of pumps, as a result of water hyacinth infestation (Mailu 2001). Reduced
2.66 million USD to drain the swamp for agricultural purposes (Aloo
access to water resources, possibly enhanced occurrence of diseases
2003). Before the construction of a diversion canal, the Yala River used to
such as schistosomiasis, malaria, increased risk of snake bites etc., are
fl ow through the eastern swamp into Lake Kanyaboli before dispersing
important health outcomes that are in part contributed to by loss or
into the main swamp. After 1970, the Lake was separated from the
modifi cation of habitats, particularly as a result of the water hyacinth
swamp by a silt-clay dyke but connected to it by a drainage channel:
infestation. The negative health knock-on eff ects of water hyacinth
recent reports indicate that the canal has been destroyed by livestock
are inconclusive (see Mailu 2001). Studies need to be carried out to
and very little water now reaches Lake Kanyaboli (Aloo 2003).
determine the relationship between habitat modifi cation or loss vis-
Ó-vis human health.
Recent invasion of the Lake with water hyacinth (Twongo 1966, Twongo
et al. 1995) exemplifi es Lake Victoria as an interesting area for lake-wide
Other social and community impacts include losses of aesthetic
scientifi c studies for years to come. The usually anaerobic conditions
values of these ecosystems, risks to human populations and capital
under which the decay process takes place lead to production of
investments, and reduced capacity to meet basic human needs. For
noxious gases like ammonia and hydrogen sulphide. Together with
example, the high export demand for the introduced Nile perch (which
the light shading eff ects of the dense weed mats, which interfere with
forms about 80% of total fi sh catch) has driven the price of fi sh to levels
photosynthesis, the water environment under the weed mats infl uences
which cannot be aff orded by many local consumers; this has diverted
changes in the diversity and distribution of aquatic biodiversity. The
cheap protein food from local consumers, threatening their nutritional
maximum water hyacinth cover in Lake Victoria was reached between
status as the consumption of fi sh declines (World Bank 1996).
1994 and 1995 when 80% of the Uganda shoreline was covered with
about 4 000 ha of water hyacinth, there was 6 000 ha coverage in Kenya,
Conclusions and future outlook
and about 2000 ha in Tanzania (Mailu 2001). The situation in June 2002
Although there is general land degradation and deforestation in the
showed much reduced, disintegrated, and stunted water hyacinth cover
Lake Basin as a whole, there are some critical habitats that need to be
along the shorelines of all three countries (Mailu 2001). It is argued that
urgently protected. These include the watershed areas, riparian zones
this reduction in water hyacinth is mainly due to the biological control
along river banks, river deltas, and wetlands along the lakeshore. The
method, achieved through the introduction of Neochetina weevils in
lake habitat itself also needs to be protected from further degradation
1996, but further studies are required to make a conclusive statement
to protect the human populations, fi sheries sector and other industries
on this. Recent reports from the LVEMP Secretariats (Nyirambu, personal
that rely on it for transportation, tourism, agriculture, etc. Sustainable
communication), indicate that about 80% of the hyacinth infestation
agricultural practices and soil conservation activities need to be
has been cleared from the Lake.
instituted immediately. There is also a need to measure the spatial extent
of the land degradation under diff erent land use/land cover scenarios
and to assess the eff ect of human land uses on vegetation community
54
GIWA REGIONAL ASSESSMENT 47 EAST AFRICAN RIFT VALLEY LAKES
structure over the last several decades, in order to understand how the
fi shery, economic and social activities around the fi shery improved
landscape can be better managed to reverse the negative trends and
tremendously (Reynolds & Greboval 1995). The higher level of economic
mitigate hotspots (Swallow et al. 2002).
production proved only transient, as the usual overexploitation of the
fi shery continued after the post-Nile perch boom. Other endemic
Methods for controlling the water hyacinth weeds need to be
species of Lake Victoria have similarly been undergoing stressful
developed through more scientifi c studies. Water hyacinth is very
exploitation.
mobile and is moved by the wind easily from one corner of the Lake to
the other. Therefore, its removal may require special tools. However, its
The historical trends in the fi sh catches in Lake Victoria have shown
shredding in the Lake as was done by the Kenya government results
that for each of the East African Community Partner States (through
in seed dispersion. In addition, shredding adds organic matter to the
the 1970s to the late 1990s) a salient feature in the pattern of the fi sh
lake bottom that further depletes the oxygen content. Water hyacinth
output is that it is very low. In the 1960s and the 1970s the combined
seeds once dispersed in the lake bottom may take up to 15 years to
annual catch for the three countries was only 150 000 tonnes. The
germinate. This makes the weed management preferred over weed
catch of the days that followed up to the early 1980s was dominated by
elimination. It has been noted, for example, that ecological succession
haplochromines which were/are small-sized fi sh of the cichlid family of
has made a major contribution to the control of fringing water hyacinth
very limited commercial value. Other species comprising the catch were
in the Ugandan portion of Lake Victoria: pure mats of water hyacinth
the mudfi sh (Clarias sp.), the native tilapia (Tilapia esculentus), Bagrus
are invaded initially by aquatic ferns and/or sedges, often followed
sp., the African lungfi sh (Protopterus sp.), and a mixture of other tilapia
progressively by Hippograss (Vossia cuspidator) that eventually dominate
species. During this period the haplochromines formed a species fl ock
and shade out the water hyacinth (Mailu 2001). Surveys conducted in
of many closely related species renowned for their great evolutionary
1999 indicated that water hyacinth showed increased weed stunting
signifi cance and scientifi c value. Morphological, behaviour and
and disintegration of original mats, refl ecting severe environmental
taxonomic studies (Barel et al. 1985, Greenwood 1951, 1981, 1984 and
stress including that occasioned by the weevils already released into
1994) distinguished hundreds of separate species of haplochromines, of
the Lake (Mailu 2001).
which diff erent groups colonised diff erent bottom types and inlets.
Hydroacoustic surveys indicated that the total biomass in the Lake
is fairly constant at about 2 million tonnes, but the components of
T
C
A
Unsustainable exploitation of
IMP
the biomass during 1999 and 2001 have changed, with Nile perch
fish and other living resources
decreasing from an estimated 1.5 to 0.9 million tonnes while the small
pelagics (R. argentea and haplochromines) increased concurrently from
Fisheries resources of Lake Victoria have been the main concern of the
an estimated 0.5 to 1.2 million tonnes (Bwathondi et al. 2001). Bottom
riparian states since the early 1950s when a number of introductions
trawl surveys in Kenyan waters of Lake Victoria (1997-1998) revealed
took place in order to boost the decreasing level of biomass of fi sh
that areas with relatively consistent high fi sh catches extend from west
(Fisheries Department 1950). Introductions of tilapiine species took
of Maboko Island up to Mbita Channel in the depth range of 5 to 22 m
place around 1954 to boost the production of the endemic Oreochromis
(Getabu & Nyaundi 1999). This area is outside major urban and riverine
esculentus and O. variabilis that were already on the downward trend.
infl uence and is where most of the fi shing eff ort by artisanal fi shermen
Thus the following species were introduced into Lake Victoria;
is currently concentrated (Getabu & Nyaundi 1999).
Oreochromis leucostictus, Tilapia rendalli and T. zillii. Experimentation
towards Nile perch (Lates niloticus) in Lake Victoria accidentally led to
The Universities of Northern England Consortium for International
a full introduction of the fi sh to the Lake. Hamblyn (1960) noted the
Activities (UNECIA) has reported on the indicators of overfi shing
fi rst appearances of Lates niloticus in the fi shermen catches. Full blast
exhibited by Lates niloticus as reduction in age/length at maturity, higher
introductions took place thereafter with Uganda restocking from Lake
mortality caused by fi shing pressure, reduction in catch per unit eff ort
Kyoga and Lake Albert while Kenya reciprocated by introductions from
(CPUE), reduction in mesh size of nets used and increased proportion
Lake Turkana. Since the introductions of Nile perch, the fi shery of Lake
of immature fi sh in the catches. It was noted that similar trends were
Victoria has never been the same (Figure 18). The fi shery of the Lake
observed for Oreochromis niloticus and Rastrineobola argentea. Of all the
was boosted at a much higher level than previously, the economic
changes occurring in Lake Victoria, the impacts on the fi sh species, and
level of the fi shery rose beyond the traditional level of tilapiine
thus the fi shery and its trends, have immediate signifi cance to the East
ASSESSMENT
55
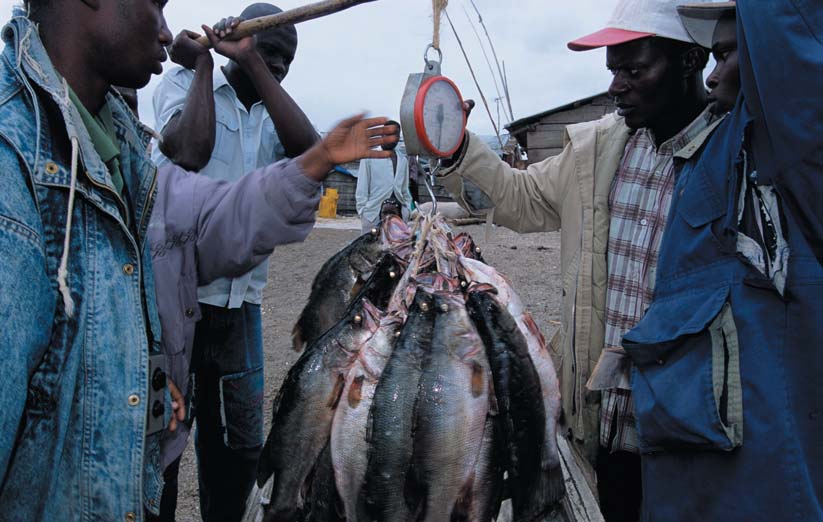
Figure 18 Fishermen weighing Nile perch.
(Photo: Corbis)
Africans, particularly the riparian population. What did it mean for East
Bagrus docmak (Forsskňl), Clarias gariepinus (Burchell), Labeo victorianus
Africa when the fi shery changed from one made up of haplochromines
(Boulenger) and the haplochromines (once important for fi shmeal) have
and other multi-species fi shery to one, after 1980s, principally dominated
almost disappeared (Mkumbo 1999). More recently, even L. niloticus, the
by the Nile perch? This new fi shery has opened export markets and has
most important fi sh in the fi shery, shows signs of declining (Othina &
thus turned the fi sheries sector in Lake Victoria into one of the main
Osewe-Odera cited in Mkumbo 1999). There are indications that the
foreign exchange earners for the riparian peoples and the East African
fi shery yield in Uganda has declined from 135 000 tonnes in 1993 to
countries. What are the challenges and prospects of the Lake Victoria
107 000 tonnes in 1997 (Odongkara & Okaronon 1999).
fi sheries sector for the East African peoples?
The introduction of Nile perch, overfi shing, unregulated gill net
Environmental impacts
mesh sizes and exploitive fi shing techniques have led to the decline
Overexploitation
of nearly all endemic species, most notably the cichlid fi sh species
In the late 1950s, the Nile Perch was introduced to Lake Victoria from
(Bugenyi & Magumba 1996). These practices led to the removal of the
Lake Kyoga. During the early 1980s the Nile perch exploded in numbers
phytophagous haplochromines and native tilapiines (Goldschmidt
causing serious predatory impacts on the Lake's native species (Ogutu-
& Witte 1992). Indicators of overfi shing in the Nile perch fi shery are:
Ohwayo 1990). Oreochromis niloticus (Nile tilapia) also thrived as an
reduction in age/length at maturity, high mortality (especially caused
introduced species (Lehman 1996). The population of haplochromines
by fi shing pressure), reduction in catch per unit eff ort, reduction in mesh
was collapsing due to these introductions (Ogutu-Ohwayo 1990). Signs
size of nets used, and an increased proportion of immature fi sh in the
of overfi shing were reported as early as 1927 when catch rates for tilapia
catches (Bwathondi et al. 2001).
dropped from 50-100 fi sh per 50 m long net with 127 mm stretched
mesh (Wothington & Worthington 1933) to less than 5 fi sh (Ssentongo
Despite a continuous decline in main endemic food species, there has
1972). Many food fi sh species such as Oreochromis esculentus (Graham),
been a rapid increase in total landings from early 1980 to a peak in the
56
GIWA REGIONAL ASSESSMENT 47 EAST AFRICAN RIFT VALLEY LAKES
early 1990s (Figure 19). By the late 1980s the Nile perch and Nile tilapia
since the early 1990s (M. Njiru, unpublished data, cited in Bwathondi
dominated the fi sh catch to near exclusion of all native species except
et al. 2001). Often the lusenga nets and beach seines are fi tted with
for Rastrineobola argentea (Ogutu-Ohwayo 1990). The total catch in
small mesh netting, even mosquito netting, which is thought to be
the late 1980s and early 1990s reached close to 500 000 tonnes. This
especially destructive to stocks since it catches everything, including
attracted many more fi shermen into the lake fi shery. An export market,
juveniles (personal observations). Trawling using undersized mesh
associated with fi sh processing, turned the low-keyed fi shery sector of
nets for target species and indiscriminate fi shing gears or poisons are
the Lake into one of the main foreign currency earner for the riparian
considered serious and in most cases result in indiscriminate catches
countries. Overall, a fi shery that was multi-species before 1980 is now
including juvenile fi sh.
a three species fi shery dominated by the Nile perch, Rastrineobola and
Nile tilapia, respectively. There are currently 31 licensed fi sh processing
Destructive fi shing practices
factories in the Lake Victoria Region (Ntiba et al. 2003).
From as early as 1905 to 1916, gill nets were introduced into the Lake
to exploit the tilapiine cichlids, Oreochromis esculentus and O. variabilis
600
(Katunzi 1996), and catches declined with time as the fi shing activity
Kenya
increased (Graham 1929 cited in Katunzi 1996). As traditional fi shing
500
Uganda
Tanzania
methods are now often considered inadequate for landing a suffi
cient
Total
400
catch, fi shermen increasingly resort to deploying illegal fi shing gear such
1000)
x
as cast nets, fi sh poison and weirs to improve their catches (Ntiba et al.
300
2001). The recommended mesh size for gill nets is 5 inches (~ 127 mm),
onnes
(t 200
but around 36% of the nets in use are below this recommended size
100
and this has increased from around 9% in 1990 (NRIL 2002). Gill nets
Landings
below the minimum legal mesh size (5 inches) constituted about 15%
0
of the gill nets in the fi shery in Lake Victoria in 2000. Uganda had the
1976
1978
1980
1982
1984
1986
1988
1990
1992
1994
1996
1998
2000
Year
highest number of gill nets followed by Tanzania and Kenya. Other
Figure 19 Total landings of fi sh in the three riparian countries of
types of gear in operation does not augur well for the sustainability of
Lake Victoria.
the fi sheries within the Lake particularly within the Kenya part of Lake
(Source: Knaap et al. 2002)
Victoria that had the highest number of beach seine and mosquito
seine (Asila 2001).
Excessive by-catch and discards
Quantitative information on actual by-catch and discards is generally
The introduction and success of the nilotic species followed an episode
not available, but this aspect of overexploitation is refl ected in the
of nearly unregulated reduction of gill net mesh sizes and collapse of
increasing number of juveniles caught, as well as by reduction in size
the traditional tilapia fi sheries, and was contemporaneous with initiation
at fi rst maturity. In other words, excessive by-catch and discards has
of commercial trawling for demersal haplochromines (Lehman 1996).
come about mainly through the destructive fi shing practices which are
Mesh sizes have progressively declined over the past 10 years with
outlined below, particularly the use of undersized mesh nets.
24% of the nets (LVFO 2000, Kulindwa 2001) in Uganda now below
the recommended mesh size of 5 inches, and now more recent beach
There has been a progressive decline in the modal length of Nile perch
surveys (Muhoozi cited in Bwathondi 2001) suggest that this is now as
caught by experimental trawling: in 1988 the modal length was 7080 cm
high as 50%. In Kenya and Tanzania, 3 and 18%, respectively, of the gill
(Ligtvoet & Mkumbo 1991), and it decreased to 50-60 cm in 1992, and
nets are below the legal mesh size limits (Bwathondi et al 2001). Trawling
even further to 40-50 cm in 1994 and it remained around the same level
using undersized mesh nets for target species and indiscriminate
to the end of the 1990s (Nisinda et al. 1999). Similar trends are found
fi shing gears or poisons are considered serious and in most cases
in tilapia and Rastrineobola, and the fi shing mortality on Rastrineobola
result in indiscriminate catches including juvenile fi sh. Trawling does
stocks from the mosquito seine fi shery is very high (Bwathondi et
have adverse biological implications. Bottom trawling disturbs the
al. 2001). Catch rates from the 5 mm and 10 mm mosquito nets for
substrate, the water column and interferes with the breeding ground
Rastrineobola argentea in Tanzanian waters show exploitation of a high
and the spawning process especially for tilapiines and other cichlids. It
proportion of immature fi sh (Bwathondi et al. 2001). For Oreochromis
also destroys larvae and eggs of fi sh, macro- and micro-invertebrates
niloticus, fi shing mortality has increased dramatically in Kenyan waters
at diff erent strata of the Lake. Thus, trawling using non-selective mesh
ASSESSMENT
57
nets may cause overfi shing by taking away both adult and juvenile fi sh
worth about 100 million USD (8 billion Kenyan Shilling). Tanzania was
and therefore reducing their productive potential. Further to that it may
allowed to resume the export of perch products from Lake Victoria
result into mass unemployment by displacing artisanal fi sherfolk (Mbuga
to the European Union in January 2000, followed by Uganda and
et al. 1998). With the near disappearance of many food fi sh species
Kenya in August and December 2000, respectively (Knaap et al. 2002).
(Mkumbo 1999) and signs of decline in L. niloticus (Othina and Osewe-
Other economic impacts of overexploitation include higher costs of
Odera cited in Mkumbo 1999), a number of management measures
management of fi sheries, fuel costs of moving to new fi shing grounds,
were eff ected including a ban on beach seines and undersized mesh
and the loss of fi sheries revenue.
nets (<127 mm stretched mesh) in 1994, and a ban on trawlers in 1996
(Mkumbo 1999). The use of poison led to a ban on fi shing and the sale
A number of deaths were reported among fi sh consumers on the Lake
of fi sh in March 1999 (Ntiba 2003).
because of the use of illegal poisoning to catch fi sh (Knaap et al. 2002).
Consequently, the Uganda government self-imposed bans on fi shing,
Decreased viability of stock through contamination and disease
consumption of fi sh from the Lake, and export in March 1999 which
Recent studies have shown high incidence of infection of Rastrineobola
were eventually lifted in November 2000 (Knaap et al. 2002). The cholera
argentea by Ligula sp., an endoparasite (Ntiba, pers. comm.). Salmonella
outbreak of 1997, which resulted in an EU ban on fi sheries, has not been
spp. were detected by the Spanish Veterinary Authorities in February
clearly linked to the fi sheries sector, but unhygienic conditions in this
1997, resulting in the imposition of compulsory and systematic checks
sector can easily trigger such outbreaks that can lead to high loss of
on Nile perch fi llets for Salmonella in the EU countries (Knaap et al.
human life. The high demand for fi sheries products in export markets
2002). A cholera outbreak which occurred in 1997 led to a six-month
has resulted in a decline of available fi sh for local consumption (Jansen
ban of fi sh exports to the EU from January to June 1998, but this ban
1997), and thus contributes to malnutrition in the region (World Bank
was considered to be unjustifi ed in the region because fi sh products
1996).
are expected to be further processed at their export destination (Knaap
et al. 2002).
The fi sheries sector is important in all three riparian countries in terms
of food security, employment and livelihoods, as well as foreign
Impact on biological and genetic diversity
exchange earnings (NRIL 2002). Fish has traditionally been the most
The Nile perch, introduced in the Lake during the middle to late 1950s,
aff ordable source of animal protein (World Bank 1996, Jensen 1997)
exploded in numbers during the early 1980s (Ogutu-Ohwayo 1990 and
with an average regional per capita consumption of around 12 kg, and
1992, Ntiba & Ogana 2003) causing serious predatory impacts on the
in recent years much of the contribution to economic development
Lake's fi sh species assemblages. At the same time another introduced
and employment has been associated with the export of Nile perch
species of tilapia, Nile tilapia (Oreochromis niloticus), and a native sardine-
(NRIL 2002). The long-term decrease in the commercial viability of
like cyprinid locally known as Omena/Dagaa/Mukene (Rastrineobola
fi shing operations has resulted in unemployment, increasing poverty
argentea) proliferated. According to Witte et al. (1992) a huge proportion
and decreasing food security in the region (World Bank 1996). This is
of 400 endemic species of haplochromine cichlids were almost
refl ected in the increasing fi sh prices over time, declining per capita fi sh
approaching extinction in Lake Victoria in the 1980s. The time and the
consumption, decreasing size of fi sh caught and decreasing average
cause of these dramatic shifts in the lake environmental conditions and
incomes (Abila personal communication).
biotic assemblages is subject to various scientifi c studies. Whether the
answers can be attributed solely to the introduction of the Nile perch
Conclusions and future outlook
and subsequent changes in the trophic relationships in the ecosystem,
There is an immediate need to quantify the actual resource base
or are due to environmental dynamics associated with increased human
in order to establish what would be the actual sustainable level of
population growth, resulting in increased deforestation and agriculture
exploitation of Lake Victoria fi sh as the small-scale fi shermen greatly
in the Lake Basin, urbanisation and the setting up of towns around the
depend on the sustainability of the fi sheries for their livelihoods (Katunzi
Lake, is not conclusive.
1996). Mechanisms for the regulation of the fi sheries sector, including
the export markets and processing factories, the eradication of use of
Socio-economic impacts
destructive fi shing practices, and the creation of alternative avenues for
The EU ban on the fi sheries had a negative impact on the economics
income to sustain the livelihoods of the riparian communities is required
of the fi shery. However, in 1999 with the fi sh ban and water hyacinth
if the overexploitation of fi sheries is to be eff ectively addressed. For
infestation, Kenyan fi shermen still managed to catch and sell fi sh
example, the high demand for the Nile perch from fi lleting factories,
58
GIWA REGIONAL ASSESSMENT 47 EAST AFRICAN RIFT VALLEY LAKES
and their preference for fi llets from juveniles of 0.1-1 kg for some export
rains in the region. These are recurrent features of the climate system
markets, will inevitably lead to a collapse of stocks because too few fi sh
that occur with some measure of predictability. The frequency of
will reach spawning size (Bwathondi et al. 2001). The domestic market is
El Ni˝o Southern Oscillation (ENSO) episodes in East Africa has become
equally open for undersized fi shes and thus urgent remedial measures
irregular and shorter. Through the hydrological cycle, it tends to disrupt
have to be considered (Bwathondi et al. 2001).
mainly agricultural activities and food production.
Currently, projects such as the Lake Victoria Environmental Management
Lake-level change
Project (LVEMP) and the Lake Victoria Fisheries Organisation (LVFO) are
The observed lake-level changes in the past few decades have not
addressing some of the issues, but these need to be nested within the
shown any signifi cant departure from the mean trends. The strong El
wider framework of integrated land and water management, taking into
Ni˝o years such as the 1982/1983 and the 1997/1998 events tend to
consideration issues like population growth, and other development
rapidly raise the lake level and causes widespread fl ooding along the
programmes that can diversify the economic base of the region. The
lake shore and rivers (Birkett et al. 1999, Conway 2002). For example,
introduction of new regulatory laws governing fi sheries (e.g. restrictions
the El Ni˝o phenomenon in 1997/1998 resulted in the water level rise
on free access to fi sheries), and participatory management of fi sheries
by 1.7 m in Lake Victoria, 2.1 m in Lake Tanganyika and 1.8 m in Lake
and other resources may lead to a sustainable use of the resources. This
Malawi (Birkett et al. 1999). The widespread heavy rainfall and fl ooding
may lead to potentially new employment possibilities, and improved
produced adverse wide-ranging agricultural, hydrological, ecological
catch and earnings. There may, however, be confl icts between user
and economic impacts in east Africa (Conway 2002).
groups for shared resources including space. Community participation
and government policies may help to improve the current situation.
Socio-economic impacts
Besides the wide-ranging economic eff ects the health is also important
with respect to global change. One of the eff ects of El Ni˝o-related
fl ooding is the widespread dispersal and elevated concentration of
T
C
A
Global change
IMP
biological contamination of water resources from surface run-off ,
domestic and municipal sewage wastes and other organic pollutants.
The climatic characteristics of the region have been outlined in the
This leads to sporadic higher incidences of water-borne diseases. For
section on Physical characteristics. Lake Victoria is sensitive to climate
example, malaria is the most climate sensitive vector-borne disease.
change as its water balance is dominated by rainfall on the Lake and
In the two warming periods in the 1930s to 1940s and the late 1980s
evaporation, with river infl ow and outfl ow making minor contributions
(IPCC 1996), malaria epidemics were observed in the East African region
(Spigel & Coulter 1996). Global warming will lead to higher temperatures
(Roberts 1964, Githeko & Ndegwa 2001). In 1997, during the El Ni˝o, a
estimated to be between 0.2 and 0.5░C per decade for Africa (Hulme
cholera epidemic occurred in western Kenya. Between June 1997 and
et al. 2001). The major eff ects of climate change on African water
March 1998, 14 275 cholera admissions to hospitals in Nyanza Province
systems will be through changes in the hydrological cycle, the balance
in western Kenya were reported (Shapiro et al. 1999). According to WHO
of temperature, and rainfall (IPCC 2001). Lake Victoria, is now 0.5░C
(1999) similar events occurred in Kenya, Mozambique, Somalia, Uganda,
warmer than in the 1960s (Hecky et al. 1994, Bugenyi & Magumba 1996),
Tanzania, Zambia and Zimbabwe.
in harmony with changes in surface temperature at tropical elevations
above 1 000 m world-wide. There have been no studies on increased
A common problem with fl ooding in the Lake region is related to the
UV-B radiation as a result of ozone depletion, or on changes in lake CO
displacement of people from their villages, the disruption of normal day
2
source/sink function in the region.
to day routine because of lack of exit and access to marooned areas,
lack of shelter and food.
Environmental impacts
Changes in hydrological cycle and lake circulation
Conclusions and future outlook
Changes in the hydrological cycle and lake level are intricately
El Ni˝o is a recurrent phenomenon in the region, but, due to global
intertwined as the water balance of the Lake is dominated by rainfall
changes, the frequency and perhaps the intensity of these events will
and evaporation. The lake level is therefore particularly sensitive to
increase. The current impacts that it has on the communities of the
climatic and hydrological change. All the current impacts of global
Lake Basin are basically as a result of lack of investment in fl ood control
change are related to the El Ni˝o phenomenon or unusually heavy
measures, and lack of disaster preparedness by the governments.
ASSESSMENT
59
The social, economic and health impacts of El Ni˝o can be drastically
deforestation which exposes soil to erosion. The linkages between the
reduced if the afore-mentioned measures are put in place.
GIWA concerns are shown in Figure 20.
Malaria and cholera epidemics have occurred to varying degrees in the
Pollution emerged as another important GIWA concern that merits
eastern African in the last decade. It is critical to know what to expect
further analysis. Pollution poses many problems of an economic,
in the future in terms of disease trends so that adaptive measures can
social and/or health nature. The problem of pollution will have to be
be put in place. Equally it is important to establish the population's
addressed within the context of a transboundary integrated land and
adaptive capacity in terms of the ability to prevent and treat climate
water management plan.
related illnesses.
Although current climate scenarios project small increases in tropical
temperatures, small changes in temperature and water balance can
dramatically alter water levels, as well as mixing regimes and productivity
Priority concerns
(IPCC 1996). High temperatures would increase evaporative losses,
especially if rainfall also declined (IPCC 1996). Minor declines in mean
The concerns that are recommended for further analysis are: Pollution
annual rainfall (10ş20 %) for extended periods would lead to the closure
and Unsustainable exploitation of fi sh and other living resources. The
of the African lake basins even if temperatures were unchanged (IPCC
concerns were ranked in descending order of severity:
1996). There is also likely to be an increase in the frequency and or
1. Pollution
severity of extreme events such as El Ni˝o. Severe droughts and fl oods
2. Unsustainable exploitation of fi sh and other living resources
would adversely impact the socio-economic activities and livelihoods
3. Habitat and community modifi cation
of the inhabitants of the lake basins.
4. Global change
5. Freshwater shortage
I. Freshwater
shortage
Dramatic and highly adverse changes that have enormous ramifi cations
for the tens of millions of inhabitants of the Lake Victoria Basin have
taken place in the fi sheries sector because of overexploitation of fi shery
resources. These changes have been spurred by various unsustainable
III. Habitat
II. Pollution
modification
practices within the catchment and the Lake itself. The adverse
interactions have been related to environment, economy, society,
governance and legislation at national, regional and global levels. Many
of the consequences of Unsustainable exploitation, which has emerged
as a principal GIWA concern for the region, have worked through
IV. Unsustainable
exploitation of living
V. Global change
various pathways that are linked to the other GIWA concerns, namely,
resources
Pollution, Habitat modifi cation, and Freshwater shortage. Unsustainable
exploitation may cause pollution and/or habitat modifi cation through
Indirect
Direct
the use of pesticides or other chemicals to increase fi sh catches, or via
Figure 20 Linkages between the GIWA concerns in Lake Victoria.
60
GIWA REGIONAL ASSESSMENT 47 EAST AFRICAN RIFT VALLEY LAKES
Lake Tanganyika Basin diff erent chemical compositions, the most important one is the Rusizi
River in the north which supplies more than 50% of the total dissolved
Table 15
Scoring table for Lake Tanganyika.
salts. Except for rice production, agriculture in the region is rain-fed.
Assessment of GIWA concerns and issues according
The arrow indicates the likely
Irrigated rice production is seasonal and small-scale and currently does
to scoring criteria (see Methodology chapter)
direction of future changes.
T
T
C
C
Increased impact
not have a signifi cant impact on water levels in the Rusizi River or Lake
A
A
0 No
known
impacts
2 Moderate
impacts
IMP
IMP
T
T
No changes
C
C
A
A
Tanganyika. Power companies utilise the Rusizi River for hydroelectric
1 Slight
impacts
3 Severe
impacts
IMP
IMP
Decreased impact
power generation and have been exploring possibilities to expand the
i
t
y
*
*
network. There is little modifi cation or diversion of Tanganyika's affl
uent
t
a
l
p
a
c
t
s
un
n
Lake Tanganyika
p
a
c
t
s
m
ore
i
c
i
m
o
m
Sc
water supply and the Lake, consequently, has relatively few problems
c
t
s
o
m
t
h
i
m
c
t
s
t
y
***
v
i
r
o
nme
e
r
c
o
n
al
erall
with respect to freshwater shortage. There is currently no evidence that
En
impa
Ec
He
Oth
impa
Ov
P
r
i
o
ri
abstraction of water from aquifers exceeds natural replenishment.
Freshwater shortage
1.0*
0.2
0.2
0.2
1.0
5
Modification of stream flow
1
Pollution of existing supplies
1
Environmental impacts
Changes in the water table
0
Modifi cation of stream fl ow
Pollution
2.4*
1.4
1.0
1.3
2.2
3
Due to diversion of water for irrigation purposes, there is signifi cant
Microbiological pollution
1
but localised loss of wetlands in some areas (e.g. Burundi) (personal
Eutrophication
1
Chemical
2
observations). Dams and irrigation channels are not, however, common
Suspended solids
3
in affl
uent rivers (personal observations). Hydroelectric power production
Solid waste
0
on the Rusizi River also has limited impact on Lake Tanganyika.
Thermal 0
Radionuclide
0
Spills
1
Pollution of existing supplies
Habitat and community modification
2.0*
2.6
0.9
2.0
2.4
2
The Lake provides freshwater for drinking and domestic use, but only
Loss of ecosystems
2
between 32 and 62% of the population has access to safe water, while
Modification of ecosystems
2
Unsustainable exploitation of fish
2.1*
2.9
1.3
2.5
14 to 49% do not have access to sanitation (Table 9) (UNDP 2000,
2.5
1
Overexploitation
3
World Bank 1999). This suggests that, within localised settlements,
Excessive by-catch and discards
0
pollution of existing supplies is a signifi cant threat. Increasing land
Destructive fishing practices
2
use, particularly in the north, is aff ecting the quality of river water. The
Decreased viability of stock
0
Impact on biological and genetic diversity
1
salinity of input from the Rusizi River (0.65) may in part infl uence the
Global change
0.9*
1.3
1.0
1.0
1.5
4
slightly elevated salinity of the Lake (0.5) (Hughes & Hughes 1992).
Changes in hydrological cycle
1
The very large volume of Lake Tanganyika may provide a temporary
Sea level change
2
buff er against deterioration of water quality (Spigel & Coulter 1996), but
Increased UV-B radiation
1
Changes in ocean CO source/sink function
0
there have been several signifi cant fi sh kills in localised areas, especially
2
*
This value represents an average weighted score of the environmental issues associated
in Bujumbura and Kigoma Bays (personal observation, reported in the
to the concern. For further details see Detailed scoring tables (Annex II).
** This value represents the overall score including environmental, socio-economic and
media). Nevertheless, the observed pollution has not compromised the
likely future impacts. For further details see Detailed scoring tables (Annex II).
overall quality of the water supply due to the large size of the reservoir.
*** Priority refers to the ranking of GIWA concerns.
Socio-economic impacts
There has probably been a slight reduction in stream fl ow owing to
T
C
A
Freshwater shortage
IMP
conversion of wetlands, but it is not possible to obtain quantitative
data and there are no known socio-economic or health impacts linked
Lake Tanganyika has a water volume of 18 800 km3; precipitation on
to this issue. The localised pollution that has been observed has not
the lake surface and surface run-off represents about 63% and 37% of
compromised the overall quality of the water supply due to the large
water input, respectively, while evaporation at 94% accounts for the
size of the reservoir, hence the health impact is generally very small.
major loss of water (Beadle 1981, Haberyan & Hecky 1987). The surface
Freshwater shortage is not signifi cant enough to aff ect (periodically
outfl ow through the Lukuga River controls the maximum and present
or continuously) more than a very small proportion of the riparian
lake level. Lake Tanganyika receives water from diff erent rivers with
community, and only in localised areas.
ASSESSMENT
61
Conclusions and future outlook
basin and appears to have prograded by an order of magnitude during
Modifi cation of stream fl ow is not considered a serious problem in Lake
the past 20 years (Cohen 1991).
Tanganyika Basin. Even though power companies utilise the Rusizi River for
hydropower generation, their activities currently have only limited impact
The Lake as a whole has a large nutrient reservoir in the anoxic layer.
on the Lake. More generally, dams and irrigation channels are uncommon.
Relatively strong gradients in concentrations of nutrients and dissolved
Pollution of existing supplies can be signifi cant in localised areas, but the
oxygen approximate a persistent thermocline which divides clear,
large volume of Tanganyika acts as a buff er, diluting to insignifi cant levels
impoverished surface water layers from reservoirs of nutrients resident
the amount of pollutants in the Lake. Consequently, the Lake Basin has
within the anoxic hypolimnion (Langenberg et al. 2002). In the pelagic
relatively few problems with respect to freshwater shortage.
zone at the northern and southern end of the Lake, mean turbidity
values (NTU) ranged between 0.3 and 1.4 (mean=0.6 NTU) in August
Increased agricultural activities in the catchment, abstraction of water
1995 to July 1996 (Langenberg et al. 2002). The impact of land-derived
for irrigation, denser settlements with poor sanitation, and possibly
nutrients is, therefore, constrained to littoral zones within the infl uence
damming of the Rusizi River and increased abstraction of water for
of sediment inputs.
irrigation, coupled with a trend of decreasing precipitation projected
for the region, may result in future freshwater shortage and increased
Pollution abatement facilities in the Basin are extremely limited (West
pollution. Due to the Lake's long residence time, pollution resulting
2001). Untreated wastewater discharge, including; industrial waste from
from the eff ects of human activities and development in its catchment
large cities (e.g., Bujumbura in Burundi, Uvira in DR Congo, Kigoma in
is potentially catastrophic to the Lake's water quality, economic fi sh
Tanzania and Mpulungu in Zambia); agricultural run-off particularly
stocks and overall biodiversity (West 2001, Duda 2002). In addition, it is
from Malagarasi and Rusizi catchments due to increase in the use of
less likely that damage can be reversed once it occurs (Spigel & Coulter
agro-chemicals concomitant with agricultural expansion; and mining
1996). Economic impacts will likely become worse because of increased
waste containing mercury, are major chemical pollution sources (West
demand for water for potable use and irrigation. Health impacts will
2001). While the condition lake-wide is generally satisfactory, some
also increase due to lack of suffi
cient and potable water supplies, and as
areas, like Kigoma Bay, show cause for local concern (Chale 2000,
well to unsanitary conditions in the increasingly settled shoreline. These
Bailey-Watts et al. 2000). Perhaps because of its greater water volume
factors can lead to a host of diseases such as cholera and typhoid.
and lower human population density in its watershed, Lake Tanganyika
appears to be more resilient to diff erent forms of environmental impact
than Lake Victoria (Beeton 2002).
T
C
A
Pollution
IMP
Environmental impacts
Microbiological
Of many serious environmental threats that Lake Tanganyika faces,
Microbiological pollution is an issue, from time to time, on a localised
the most immediate are excessive loads of sediment and nutrients
scale, evidenced by water quality issues in Kigoma Bay and cholera
caused by deforestation and erosion in the watershed, and industrial
outbreaks in Burundi and Zambia (Chale 2000).
and urban pollution. The three most important issues of pollution in
the Lake and infl uent rivers are suspended solids, chemical pollution
Eutrophication
and eutrophication. Increased deforestation and consequently erosion
Kigoma Bay, which is about 4 km long, 3 km wide and 25 m deep, is
in the catchment has caused an increase in suspended sediment
surrounded by Kigoma Town (population 135 000) which draws its
entering the rivers and the Lake (Cohen 1991, Bizimana & Duchafour
domestic water supply from the Bay (West 2001). A comparison of
1991, Tiercelin & Mondeguer 1991). The dynamics and behaviour
water quality between Kigoma Bay and off shore waters, showed that
of river-borne and run-off sediment entering the Lake are complex
Kigoma Bay waters were signifi cantly higher in nutrients and 2.23 times
and not well understood. It appears, however, that much sediment
less transparent than off shore waters (nitrogen 56 Ág/l vs. 36 Ág/ l;
deposition occurs in the littoral zone, precisely where most of the
phosphorus 12.55 Ág/l vs. 6.47 Ág/l) (Chale 2000). A similar trend was
Lake's biodiversity is concentrated. Increased sedimentation rates are
found in comparisons with un-impacted nearshore areas, suggesting
manifested in the Lake by sediment inundated rocky habitats, common
that nutrient input into the Bay from external sources is considerable.
along the Burundi coast, and prograding river deltas, such as the Rusizi
These values are elevated enough to render Kigoma Bay `meso-
River delta. The Rusizi River delta is the major drainage in the northern
eutrophic' on the classifi cation of lake productivity levels (West 2001).
62
GIWA REGIONAL ASSESSMENT 47 EAST AFRICAN RIFT VALLEY LAKES
Kigoma lacks a wastewater treatment facility; many households have
Plain and the Kalemie Trough while plans for nickel mining in Burundi
diverted their plumbing to enter the town's storm drains. These drains
are well underway. Table 16 summarises the various types and sources
thus act as conveyers for domestic effl
uents to enter the bay, which
of pollution identifi ed in the Tanganyika catchment.
may ultimately be responsible for the high nitrogen and phosphorus
concentrations and enrichment in plant nutrients (West 2001).
The impact of these various discharges is poorly understood. While
Environmental Impact Assessments (EIAs) have not been conducted,
Chemical
some studies suggest that pollution has altered, in some areas, the
Of the four riparian countries, Burundi, with the largest population
composition of phytoplankton communities (Cocquyt et al. 1991).
density and the most industries in the Basin, poses the greatest pollution
threat. Bujumbura hosts a variety of industries and potential pollution
Suspended solids
sources within several kilometres of the lakeshore, including a textile-
Cohen (1991) reports that Landsat image analysis revealed that 40ş60%
dying plant, a brewery, paint factories, soap factories, battery factories,
of original forested land in the Lake's central basin, and almost 100%
fuel transport and storage depots, a harbour and a slaughterhouse.
in the northern basin, had been cleared, as evidenced by headward
Fuel depots, Kigoma's harbour and electricity-generating facilities,
erosion, stream incision and gully formation, all features associated with
industrialised fi shing in Mpulungu, and cotton and sugar processing
deforestation. Much of this land was probably cleared for fuel wood,
plants in DR Congo present other cases of potential industrial pollution.
burned and converted for subsistence agriculture or grazing. Analyses
The wastes from these enterprises typically are not treated before they
of sedimentation rates from 14C dated cores (Tiercelin & Mondeguer
are discharged and ultimately make their way to the Lake. The same is
1991) confi rmed the high sediment impact in the northern basin with
true for domestic waste. Even in highly populated areas, no municipal
the southern and central basins receiving <1 500 mm/1 000 years and
or household wastewaters are treated before they are discharged.
<500 mm/1 000 years respectively, compared to the northern basin
which received about 4 700 mm/1 000 years. Bizimana and Duchafour
Run-off of agricultural pesticides may also be an important source of
(1991) have estimated soil erosion rates in the deforested and steep
pollution. There is signifi cant use of pesticides in the catchment, other
sloping Ntahangwa River catchment in northern Burundi to be between
contaminants are also present (water quality studies summarized
20 and 100 tonnes/ha/year. More recent studies by Sichingabula (1999)
in Bailey-Watts 2000). Pesticide residues have been detected in
and Kakogozo et al. (2000) show that annual lake-wide sediment input
molluscs and in the fi sh that are the main targets of the commercial
into Lake Tanganyika is enormous (Table 17). In addition, three signifi cant
fi shing industry (Foxall et al. 2000, Deelstra et al. 1976), indicating that
landslides that occurred near Gatororongo show that, especially in the
pesticides have entered the food chain, although the values are within
rainy season, signifi cant amounts of sediment (estimated at more than
WHO acceptable tolerance ranges. Mercury and other chemicals used
11 280 tonnes at this site alone) can be introduced into the Lake without
in small-scale gold and diamond mining in the catchment represent
transiting through rivers (West 2001).
other potential lake pollutants. Leaks and accidents in the Lake's cargo/
shipping industry, executed by a fl eet of ancient vessels, is another
Excessive sedimentation resulting from high sediment yields from
potential environmental hazard. Finally, although no production is
catchments threatens the diversity of nearshore fi shes (Cohen et al.
occurring yet, petroleum exploration has been conducted on the Rusizi
1996). There is evidence of increased turbidity, and large sediment
Table 16
Sources of pollution in the Tanganyika catchment.
Table 17
Some water and sediment discharge rates into Lake
Tanganyika.
Type of pollution
Sources within the catchment
Water discharge rate
Sediment discharge rate
Industrial wastewater
More than 80 industries in Bujumbura, Burundi
River
Country
(million m3/year)
(tonnes/year)
Urban domestic wastewater
Bujumbura, Uvira, Kalemie, Kigoma, Rumonge, Mpulungu
Kalimabenge
DR Congo
36.5
25.3
Chlorinated hydrocarbons, pesticides
Rusizi Plain, Malagarasi Plain
Kavimvira
DR Congo
9.2
18.8
Heavy metals
North basin waters from industrial wastes
Mulongwe
DR Congo
34.1
21.3
Mercury
Malagarasi River
Izi
Zambia
44.9
456
Ash residues
Cement processing in Kalemie
Kalambo
Zambia
580
14 445
Nutrients associated with fertilisers
Rusizi Plain, Malagarasi Plain and other catchments
Lucheche
Zambia
51.4
510
Organic wastes, sulphur dioxide
Sugarcane refining plant near Uvira
Lufubu
Zambia
3.1
76 140
Fuel, oil
Ports, harbour and shipping and boats in all four countries
Lunzua
Zambia
427
9 478
(Source: modified from Patterson & Makin 1998)
(Source: Sichingabula 1999, Kakogozo et al. 2000)
ASSESSMENT
63
plumes. Signifi cant stretches of coastline have been transformed
pollution in Lake Tanganyika seem to be buff ered by the enormous
from rocky substrates to mixed rocky/sandy substrate or entirely
size of the reservoir. High sediment loading due to deforestation and
sandy substrates (refer to several studies on sedimentation in Lake
erosion in the catchment, particularly in the northern basin where
Tanganyika summarised in West 2001). Increased water turbidity as
deforestation is almost 100%, has contributed to the rapid growth of the
a function of sediment load and sediment deposition thwart algal
Rusizi River delta over the past 20 years (Cohen 1991). In the lake proper,
growth, which may have profound eff ects upon other components
much of the sediment deposition occurs in the littoral zone where most
of the food web. In studying ostracods across a variety of habitats that
of the Lake's biodiversity is concentrated, thus aff ecting the food web
were lightly, moderately or highly disturbed by sediment, Cohen et al.
and reducing species diversity (Alin et al. 1999, West 2001). There are
(1993b) found that ostracods from highly disturbed environments (both
various sources of chemical pollution particularly in the northern basin
hard and soft substrate) were signifi cantly less diverse than those from
area resulting from industry, agriculture, municipal sources etc., but the
the less disturbed environments with diff erences in species richness
impacts of these various discharges is poorly understood.
in the range of 40ş62%. Species richness for deepwater ostracods
followed the same general pattern, though the diff erences were not as
While the Tanganyika Basin is not nearly as industrialised or populated
great. These data suggest that sediment input may have already had an
as other parts of sub-Saharan Africa, pollution is a threat to Lake
important role in altering ostracod community structure. Benthic algae
Tanganyika because the Basin's population is rapidly increasing and
productivity studies show that sediment inputs from deforestation
little legislation exists to protect the environment (West 2001). Given the
probably reduce the amount of available habitat for colonisation,
Lake's fl uid medium for transport and that it is a nearly-closed system,
decrease the nutrient value of the food source, and reduce the feeding
with long water residence and fl ushing times, pollution is potentially
effi
ciency of the primary consumers (O'Reilly 1998).
catastrophic to the Lake's water quality, economically important fi sh
stocks and overall biodiversity. Increased agricultural and industrial
Spills
activities in the catchment, coupled with denser settlements with poor
There have been serious accidental spills, e.g. of DDT in Kigoma harbour
sanitation, will result in further pollution. Petroleum exploration is being
(Alabaster 1981) and fuel oil leakages in Mpulungu harbour, although
undertaken west of the Lake - if oil were discovered and produced in
DDT is no longer used except near the shoreline in the Zambian side
the region, risks of oil spills would arise from well accidents, cross-lake
of the Lake (Cohen et al. 1996). Occasional fi sh kills suggest that spills
transport and harbour spills (Cohen et al. 1996).
exist, but they are not common (personal observation, media reports
and local knowledge).
Economic impacts are likely to become worse as sediment blanketing
and increased turbidity cause changes in benthic and pelagic
Socio-economic impacts
biodiversity, aff ecting the fi sheries resources. Health would be aff ected
There are chemical and microbiological pollution impacts in the
as a result of an anticipated increase in microbiological and chemical
economic sector, however the score is low overall because few people
contamination from organic wastes (settlements, agrochemicals).
are actually contaminated, taking preventative measures or seeking
Other social and community impacts would increase due to increased
medical treatment. In addition, sedimentation and eutrophication have
demand for increasingly limited resources.
indirect economic impacts that are diffi
cult to quantify. These processes
are continuous, and given that the Lake operates as a nearly closed
system due to long residence and fl ushing times, these impacts are
T
C
A
cumulative. However, occasional fi sh kills due to spills have signifi cant,
Habitat and community
IMP
but short-lived, impacts. Sedimentation has a signifi cant eff ect on the
modification
social sector in terms of global biodiversity, but this is not weighted
heavily compared to other criteria and therefore the overall evaluation
Human activities in the catchment, especially agriculture and fuel
is low in terms of impact.
wood gathering, have greatly decreased the original forest cover in
the catchment. Cyperus papyrus, Phragmites mauritianus and Typha
Conclusions and future outlook
domingensis dominate the delta swamps (Hughes & Hughes 1992).
Suspended solids, chemical pollution and eutrophication are the most
Potamogeton species are the predominant macrophytes around much
important sources of pollution in the Lake. Pollution abatement facilities
of the shoreline, with occasional rafts of Nymphaea caerulea and N.
in the Basin are extremely limited. Currently, however, the eff ects of
capensis in shallow sheltered bays (Hughes & Hughes 1992). Phragmites
64
GIWA REGIONAL ASSESSMENT 47 EAST AFRICAN RIFT VALLEY LAKES
mauritianus swamps accompany the Rusizi River (Hughes & Hughes
Modifi cation of ecosystems
1992). The Rusizi River has formed a substantial delta at the north end of
As a result of the modifi cation of ecosystems particularly by
Lake Tanganyika. Ceratophyllum demersum is abundant in the vicinities
sedimentation and overfi shing, the structure of fi sh communities
of affl
uent river mouths (Hughes & Hughes 1992). In the deltas of several
has changed over time as well as some populations of cichlids and
rivers, Azolla pinnata forms immense fl oating mats, green or brown in
molluscs becoming locally extinct during the past 30 years (West 2001,
colour, and there are great submerged beds of Myriophyllum spicatum,
Lake Tanganyika Research project reports, and personal observation).
Najas marina, N. pectinata, Ottelia ulvifolia, Potamogeton pectinatus and
For example, Alin et al. (1999) have noted that sediment inundation of
P. Schweinfurthii (Hughes & Hughes 1992).
lacustrine habitats has reduced species richness and density of molluscs,
and the species richness of ostracods. The changes in ostracod (Cohen
There are extensive wetlands associated with the Rusizi River and its
et al. 1993b) and benthic algal (O'Reilly 1998) communities have an
tributaries. Phragmites mauritianus swamps accompany the Rusizi River
impact on ecosystem structure and function, aff ecting all levels of the
in a belt up to 3 km wide (Hughes & Hughes 1992). Some reptiles are
aquatic food chain.
present including various swamp snakes, as well as several bird species
and some small mammals such as otters, mongooses and water rats
Socio-economic impacts
(Hughes & Hughes 1992). The fl oodplains are intensively cultivated, and
Loss of ecosystems has indirect links to the economic sector in terms of
the wet areas are frequented by domestic cattle in the dry season when
loss of spawning grounds for fi sh and severe impacts on the ornamental
large areas of wetland are burned (Hughes & Hughes 1992). The littoral
fi shing industry, but perhaps the greatest impact is in terms of loss of
zone of Lake Tanganyika includes sandy, rocky, mixed sandy-rocky and
global biodiversity. The population structure of the economically
mud substrates. The Lake contains a large fi sh fauna comprising some
important fi sh stocks has changed, with some diffi
cult to assess impacts
193 species from 13 families; 98% of the cichlids and 57% of the non-
on the economic sector.
cichlid species are endemic (Hughes & Hughes 1992).
About 70% of all fi sh species are found in all three sub-basins of Lake
Environmental impacts
Tanganyika (West 2001). While the commercial fi shery is based on only
Loss of ecosystems
six species, the artisanal and subsistence fi sheries have over 100 species
Deforestation is essentially complete within the Burundi and northern
in their catches and their activities are concentrated in varied habitats
DR Congo portions of the watershed (Cohen et al. 1993b) and land
along the rocky and sandy shoreline, where biodiversity in the Lake
clearing using uncontrolled large fi res is proceeding at an alarming
tends to be concentrated (BDP 2003). Habitat modifi cation through
rate further south (Cohen et al. 1996). Intense cultivation of fl oodplains,
sedimentation, nutrient loading, destructive fi shing practices and
grazing by cattle and burning during the dry season (Hughes & Hughes
overfi shing are leading to reduced fi sh catches: fi sh are important to
1992) has led to signifi cant loss of wetland for example in Burundi. Land
the livelihoods of the numerous artisanal fi shers and their dependants
degradation and deforestation has increased the sediment fl ux to the
in terms of food security and employment. In addition, the loss of
Lake and altered habitats, particularly in the littoral zone. Sediment input
biodiversity is of great concern. Possible impacts of biodiversity loss
has transformed extensive stretches of coastline from rocky habitats to
include e.g. loss of traditional food sources, fuel wood energy sources,
mixed sandy and rocky or even wholly sandy habitats (refer to several
medicinal plants, and tourism. However, research is required to quantify
studies on sedimentation summarised in West 2001). This phenomenon
the rate of loss of biodiversity in the Lake and its catchment, and its
has not been studied quantitatively or rigorously in Lake Tanganyika,
impact on the local, regional and global communities.
but there are two sources of data that underscore the signifi cance of
habitat modifi cation. Comparisons between recent biodiversity surveys
There are no known health impacts other than reduction in protein
and lake-wide ecological studies by Belgian expeditions in the 1940s
sources for the population due to reduced fi sh yields.
revealed that many sites had been transformed within the past forty
years. Also, underwater observations and mapping of littoral substrates
Conclusions and future outlook
(West, unpublished data) has shown that signifi cant stretches of rocky
Land use change, land degradation and deforestation in the catchment
shoreline in Burundi have been transformed to mixed sandy-rocky or
have had profound impacts that are propagated through the rivers, by
wholly sandy substrates since 1986. In some cases more than 1 m of
the land surface and atmosphere to the lowland wetlands and Lake.
sediment has accumulated at these sites.
Intense cultivation of fl oodplains, grazing by cattle and biomass burning
during the dry season (Hughes & Hughes 1992) has led to signifi cant
ASSESSMENT
65
loss of wetland e.g. in Burundi. Land degradation and deforestation
to a few areas (Bujumbura, Uvira, Kigoma and Mpulungu) which have
has increased the sediment fl ux to the Lake and has dramatically
access to larger markets. The subsistence fi shermen primarily target the
altered habitats, particularly in the littoral zone. Sediment input has
sardines and Lates species, though in their eff orts they catch and utilise
transformed extensive stretches of coastline from rocky habitats to
many other species. They operate close to shore, from small canoes.
mixed sandy and rocky or even wholly sandy habitats. Partly in relation
Each of Tanganyika's riparian nations hosts one or more companies
to this, the structure of fi sh communities has changed over time and
which export ornamental fi sh to markets in Europe, America and
some populations of cichlids and molluscs have become locally extinct
Japan. A variety of fi sh, predominately cichlids, are targeted by divers
during the past 30 years.
and snorkellers, captured alive and exported to aquarium enthusiasts
abroad. There are six non-cichlid species that are targeted by artisanal
The pressure on land-based resources is likely to increase with
and industrial fi sheries, and whose potential yield has been estimated
the rapidly increasing population. In addition, a perceived lack of
at 380 000-460 000 tonnes per year. There is no evidence for decreased
sustainability thinking by farmers cultivating the steep slopes of Lake
stock viability in the Lake.
Tanganyika catchment may have more to do with the present political
insecurity than with an inherently short-term view or ignorance of the
Environmental impacts
environmental consequences of a failure to prevent soil erosion (Allison
Overexploitation
2002). If this is indeed the case, then rapid population growth and
Fish production is estimated at 555 130 tonnes per year, while fi sh
political instability in the region does not augur well for sustainable land
catch is at 178 486 tonnes per year: catch per production ratios for the
management, soil conservation, and biodiversity in the future. The rate
whole Lake remain relatively low (average 0.30), but for Lates stappersi,
of loss of ecosystems and/or their modifi cation will increase as result of
it is extremely high in all countries, being lowest in Tanzania (0.76) and
increased sedimentation and reduction in water covered areas, leading
highest in DR Congo (1.12, i.e. clearly unrealistic) (Sarvala et al. 2002).
to loss of wetland and littoral vegetation, fi sh spawning grounds, local
Present fi shing pressure in the Lake is very high. According to FAO
reduction in species diversity, loss of biodiversity, etc. There is already
(2001), the realised catch of planktivorous fi sh in the whole lake was
signifi cant loss of wetlands, local extinction of fi shes and changes in
about 23-28%, and in the most heavily fi shed Burundi waters it was
population structure of vertebrate and invertebrate organisms in the
43.52% of estimated production. For piscivorous fi sh in the whole lake
Lake. Economic impact would become more severe as a result of further
the corresponding fi gure was 61-73%.
ecosystem loss and habitat modifi cation. Subsistence fi sheries would
be most aff ected as shallow spawning grounds and fi sheries are lost
The Lake is fi shed intensively from Bujumbura and other ports in all
due to sedimentation, reducing the local populations' capacity to meet
four countries that border it; the fi shing intensity for all species is
basic food needs. This, in turn, would increase health risks and result in
higher in the southern and northern parts of the Lake than in any other
the loss of jobs.
areas (Hughes & Hughes 1992). Several studies (Petit & Kiyuku 1995,
Pearce 1995, Coulter 1999) have suggested that commercial fi sheries
have already drastically reduced the fi sh stocks, and the impact of
ornamental fi shing on population and community structure could
T
C
A
Unsustainable exploitation of
IMP
be considerable as the rare and alien species are extracted in as high
fish and other living resources
a number as possible because of the high mortality rates in shipping
(West 2001).
Fishing activities on Lake Tanganyika include commercial fi shing
by both industrial and artisanal fi shermen, subsistence fi shing, and
Burundi once hosted a large industrial fi shing fl eet, but by the early
ornamental fi sh extraction for export. Commercial fi shermen target
1990s they could no longer make a living and all the vessels were
the sardine and Lates species and work further off shore in the pelagic
dormant or had been sold to companies in Congo or Zambia (Petit &
zone. Commercial fi shers, both artisanal and industrial, have usually
Kiyuku 1995). Pearce (1995) calculates that the fi shing eff ort in Zambia
made a signifi cant fi nancial investment in gears and motors to access
had tripled by the early 1990s and catches had been decreasing since
the pelagic zone. Artisanal fi shing relies on canoe-catamarans that use
1985. These eff orts have apparently aff ected the community structure
lights to attract fi sh and deploy lift-nets to collect them. Industrial fi shing
of the stocks in Zambia for initially the catch was 50% sardines, 50%
typically employs 15 m purse seines and a number of smaller vessels
Lates (Coulter 1970) whereas since 1986 the catch has been 62ş94%
to attract the fi sh and deploy seines. Industrial fi shing has been limited
Lates stappersi (West 2001). The fi shery has evolved from a six-species
66
GIWA REGIONAL ASSESSMENT 47 EAST AFRICAN RIFT VALLEY LAKES
fi shery (two sardines, four Lates spp.) to a single species fi shery (Lates
demand for fi sh products, so that over the last several decades, the per
stappersi) (West 2001).
capita supply has barely kept pace with overall fi sh production despite
increases in the latter (FAO 2001). Thus, local livelihoods are aff ected
Excessive by-catch and discards
as the principal source of protein in the local diet is reduced due to
There is little by-catch or discards; the economically important fi sh
overexploitation and destructive fi shing practices. The global species
live in the pelagic zone and few other species are present. Inshore
diversity is reduced as a result of overexploitation and destructive
fi sheries occasionally have cichlid by-catch but these, though they are
fi shing practices. Prolonged political unrest in the region (Burundi,
not targeted, are consumed (from Lake Tanganyika Research project
DR Congo and Rwanda), has compounded the eff ects of population
reports, personal observations, reports from Lindley 2000a and b).
growth and drought in increasing the demand for the Lake Tanganyika
fi sheries products (FAO 2001).
Destructive fi shing practices
Beach seining and fi shing with mosquito netting are common (though
Conclusions and future outlook
illegal) (summarised in Lindley 2000a and b). Long-term studies of
Fishing activities on Lake Tanganyika include: commercial fi shing
fi sheries statistics for Lake Tanganyika signal that fi shing practices
by both industrial and artisanal fi shermen, subsistence fi shing, and
have altered the population structure of fi sh communities, especially
ornamental fi sh extraction for export. Several studies (summarised
for the economically important species. Some studies suggest that, in
in West 2001) have suggested that commercial fi sheries have already
some areas, pollution has altered the composition of phytoplankton
drastically reduced the fi sh stocks. Increased fi shing eff ort has
communities. Subsistence fi shermen primarily target the sardines and
apparently aff ected the community structure of the stocks in Zambia,
Lates species, though in their eff orts they catch and utilise many other
changing the fi shery from a six-species fi shery to a single species fi shery
species (West 2001). They operate close to shore, from small canoes,
(Lates stappersi). Destructive and illegal fi shing practices such as beach
using lusenga nets (large, conical scoop nets), bottom-set gill nets,
seining and fi shing with mosquito netting are common. These practices
beach seines, basket traps and hand-lines. Often the lusenga nets and
have contributed to an altered population structure of fi sh communities
beach seines are fi tted with small mesh netting, even mosquito netting,
and degradation of shallow water habitats.
which is thought to be especially destructive to stocks, as it catches
everything, including juveniles. In addition to disrupting population
Without intervention and legislation, unsustainable exploitation of fi sh
structure in this way, beach seines are additionally harmful because
would severely aff ect fi sh stocks, the food web and biodiversity of the
they drag along the bottom, turning-over the substrate, and thus
Lake, with negative ramifi cations on the local populations and world
obliterating food sources and cichlid nests (West 2001).
markets. Declining catches per unit of fi shing eff ort have been noted (e.g.
Roest 1992). In addition to impacting biodiversity by altering population
Impact on biological and genetic diversity
and community structures of fi sh stocks and food webs, overfi shing
Invasive species exist in the Tanganyika Basin, including water hyacinth
and fi shing with destructive methods have negative repercussions on
(Eichhornia crassipes), cattail (Typha spp.), and the fi sh Oreochromis (from
the socio-economic circumstances of riparian communities through
West 2000). There is no available data to quantify their impact.
loss of jobs and livelihoods. For example, collapse of entire segments
of the fi shing industry has occured e.g. the industrial fi shing fl eet of
Socio-economic impacts
Burundi in the early 1990s (Vrampas in Cohen et al. 1996). Collapses in
Fishing activities include commercial fi shing by both industrial and
the fi shing industry are likely to increase in frequency lake-wide. Since
artisanal fi shermen, subsistence fi shing, and ornamental fi sh extraction
fi sh stocks are already drastically depleted, the industry could face a
for export. Overfi shing and fi shing with destructive methods have led
total collapse in the near future, with severe impacts on the mainstay
to loss of jobs and livelihoods even at country scale, e.g. the collapse
fi sheries economy of the region. Because of the increasing density of
of the Burundi industrial fi shing fl eet in the early 1990s (West 2001).
settlements close to the Lake, microbiological pollution is expected
Sample surveys show that fi shers and post-harvest operators are
to increase in these proximal areas. There may be a minor increase in
very pessimistic in their appraisals of catch trends over recent years:
the incidence of bacterial-related gastroenteric disorders in fi sheries
majorities in all the national sectors take the view that they have been
product consumers due to consumption of fi sh from these areas. Social
on the decrease (FAO 2001). Fish accounts for 25-40% of total animal
confl icts are likely to fl are up between commercial and subsistence
protein supply in the Lake Tanganyika Basin (FAO 2001). At the same
fi shermen as fi shing grounds for the latter are being reduced.
time, rapid population growth in the Basin has fuelled an ever increasing
ASSESSMENT
67
Without intervention and legislation, unsustainable exploitation of fi sh
Besides ENSO, a warming was observed in the recent decades in the
would severely aff ect fi sh stocks, the food web and biodiversity of the
air temperature at Lake Tanganyika (>0.7ş0.9░C). This was apparently
Lake, with negative ramifi cations on the local populations and world
linked to a water temperature increase and a higher stability of the
markets. Declining catches per unit of fi shing eff ort have been noted (e.g.
Lake. Decreased winds and changes in fi sh catches were observed
Roest 1992). In addition to impacting biodiversity by altering population
during the same period for the clupeid fi shes and Lates stappersi.
and community structures of fi sh stocks and food webs, overfi shing and
Those observations suggest that the Lake is sensitive to other climate
fi shing with destructive methods have negative repercussions on the
variability such as the recent global temperature increase besides
socio-economic circumstances of riparian communities through loss
ENSO (ENSO Project 2003). It has recently been discovered that local
of jobs and livelihoods. For example, collapse of entire segments of the
temperature rises, less windy conditions and climate change have
fi shing industry has occurred e.g. the industrial fi shing fl eet of Burundi
dramatically altered the nutrient balance of the Lake (O'Reilly et al. 2003,
in the early 1990s (Vrampas in Cohen et al. 1996). Collapses in the fi shing
Verburg et al. 2003): the surface of the Lake is getting warmer, reducing
industry are likely to increase in frequency lakewide. Since fi sh stocks are
mixing of essential nutrients such as nitrogen and sulphur between
already drastically depleted, the industry could face a total collapse in
the epilimnion and hypolimnion, and thus cutting off fi sh production.
the near future, with severe impacts on the mainstay fi sheries economy
Catch per unit eff ort of the main pelagic fi shes was partially correlated
of the region. Because of the increasing density of settlements close
with ENSO for the last 30 years in two stations of Lake Tanganyika, and
to the Lake, microbiological pollution is expected to increase in these
changes in hydrodynamic and upwelling intensity were presented to
proximal areas. There may be a minor increase in the incidence of
explain this (ENSO Project 2003). More wind and lower temperature
bacterial related gastroenteric disorders in fi sheries product consumers
seem favourable for clupeid fi shes (and possibly phytoplankton and
due to consumption of fi sh from these areas. Social confl icts are likely
zooplankton) while Lates stappersi catches are lower maybe because of
to fl are up between commercial and subsistence fi shermen as fi shing
lower transparency unfavourable to this visual predator (ENSO Project
grounds for the latter are being reduced.
2003). The observed decline of primary productivity by about 20%
implies that the fi sh yields have decreased by about 30% over the past
30 years or so (O'Reilly et al. 2003). This suggests that the impact of
regional eff ects of climate change on the aquatic ecosystem functions
T
C
A
Global change
IMP
and services can be larger than that of local anthropogenic activity or
overfi shing (O'Reilly et al. 2003).
Changes in the hydrological cycle and lake level are intricately
intertwined as the water balance of the Lake is dominated by rainfall and
Environmental impacts
evaporation (with river infl ow and outfl ow making minor contributions).
Changes in hydrological cycle and lake circulation
Lake Tanganyika enhances rainfall by about 20% compared to that in
Changes in the hydrological cycle are related to changes in rainfall.
the catchment (Nicholson & Yin 2002). The lake level is therefore
These are ultimately refl ected in lake-level changes as described
particularly sensitive to climatic and hydrological change. The eff ects of
below. During El Ni˝o events, river discharge and sediment load tends
lake level change, CO source-sink function, etc. remain uninvestigated.
to be high, and the rivers breach their banks in the lower reaches. These
2
Signifi cant ENSO teleconnections have been found, with average air
fl oodwaters aff ect the communities living along the river belts.
temperature, maximum and minimum air temperature, humidity,
rainfall, winds, pressure and radiation, through research conducted
Lake-level change
by the ENSO Project (1997-2000). The strongest teleconnections were
Relatively small changes in rainfall and evaporation may lead to shifting
found between monthly air temperature anomalies with the sea
between closed- and open-basin status as has happened in historic
surface temperature anomalies in the west equatorial Pacifi c Ocean.
times for Lake Tanganyika (Spigel & Coulter 1996). The eff ects of global
A time lag of 4ş6 months generally gave the strongest correlation
climate change in the Tanganyika Basin are refl ected mainly in the Lake's
(ENSO Project 2003). ENSO events over the past approximately 50
nutrient dynamics (described above) and in increased frequency and
years were characterised by an average air temperature increase of
intensity of El Ni˝o phenomenon. The El Ni˝o phenomenon in 1997ş
+0.26░C while extreme air temperature could reach ▒0.8░C during a
1998 saw water levels increase, lake-wide, by 2.4 m, but otherwise
strong El Ni˝o. During ENSO events, winds decreased but air pressure
variability is limited (West, Cohen et al. fi eld observations). Such fl ooding
and radiation increased; this seems to impact mixing of the Lake (ENSO
had a serious impact on low-lying urban riparian centres.
Project 2003).
68
GIWA REGIONAL ASSESSMENT 47 EAST AFRICAN RIFT VALLEY LAKES
Socio-economic impacts
Priority concerns
Economic impacts of El Ni˝o are largest in the agricultural sector,
where droughts and fl oods can signifi cantly aff ect the GDP of the
The GIWA concerns are prioritised as follows:
riparian countries, as they are mainly dependent on the agricultural
1. Unsustainable exploitation of fi sh and other living resources
sector for economic growth and food security. Flooding during El Ni˝o
2. Habitat and community modifi cation
years may also lead to increased incidences of water-borne diseases and
3. Pollution
may have an impact on low-lying lakeshore centres, e.g. by inundation
4. Freshwater
shortage
of settlements and disruption of daily activities.
5. Global
change
Conclusions and future outlook
The priority concerns that were selected by the Task team for Lake
El Ni˝o is a recurrent phenomenon in the region, but due to global
Tanganyika are Habitat and community modifi cation and Unsustainable
change the frequency and perhaps the intensity of the event is
exploitation of fi sh and other living resources. The linkages are shown
likely to increase (IPCC 2001). The current impacts that it has on the
in Figure 21 and are described below.
communities of the Lake Basin are basically a result of lack of investment
in fl ood control measures, and lack of disaster preparedness by the
Habitat modifi cation arises primarily as a result of all the other four
governments. The social, economic and health impacts of El Ni˝o can
concerns. Unsustainable exploitation of fi sh and other living resources
be drastically reduced if the afore-mentioned measures are put in place.
has been shown to be inextricably linked to habitat modifi cation. This
Malaria and cholera epidemics have occurred to varying degrees in
has led to loss of ecosystems and changes in population structure of
the East African region in the last decade. It is critical to know what to
the wetland areas in the deltaic and fl oodplain areas of the principal
expect in the future in terms of disease trends so that adaptive measures
rivers, as well as in the littoral and standing waters of the Lake. Pollution,
can be put in place. Equally it is important to establish the population's
which in this case is due mainly to suspended sediments that originate
adaptive capacity in terms of the ability to prevent and treat climate
from habitat change (land clearance, degradation and increased
related illnesses.
erosion rates) in the principal river catchments, contributes to habitat
modifi cation, which in turn also aff ects the living resources. Natural
Although current climate scenarios project small increases in tropical
habitats and living resources are aff ected by e.g. limitation of light
temperatures, small changes in temperature and water balance can
penetration in the lake water due to increased turbidity and sediment
dramatically alter water levels, as well as mixing regimes and productivity
blanketing of benthic organisms. Global change (reducing precipitation
(IPCC 1996). Further, and more immediate and potentially catastrophic
and higher temperatures) can result in increased concentrations of
impacts are the changes in nutrient dynamics and mixing regimes
pollution in the Lake due to reducing lake level (and volume), but is
within the Lake as a result of increased thermal stability as they aff ect
more important by its infl uence on freshwater resources through the
fi sheries production and can completely alter the trophic structure of
hydrological cycle.
the food chain (O'Reilly et al. 2003, Verburg et al. 2003, ENSO Project
2003). High temperatures will increase evaporative losses, especially if
I. Freshwater
shortage
rainfall also declines (IPCC 1996). Slight decreases in precipitation or
increases in either temperature or average wind speeds could convert
Lake Tanganyika to a closed basin (Owen et al. 1990, IPCC 1996), cause
signifi cant changes in the thermal stability of the Lake's water mass and
III. Habitat
II. Pollution
mixing dynamics (Hecky & Bugenyi 1992), and change the lake's water
modification
chemistry (Cohen et al. 1996) etc., aff ecting many aquatic organisms.
Global change would aff ect the riparian communities by perhaps an
increase in the frequency of extreme events e.g. El Ni˝o. Severe droughts
and fl oods would adversely impact the socio-economic activities and
IV. Unsustainable
livelihoods of the inhabitants of the Lake Basin. High economic costs
exploitation of living
V. Global change
resources
due to impact of droughts are unlikely to decrease. Health impacts of
drought, such as malnutrition and deaths are however likely to increase
Not significant
Significant
Very significant
in frequency.
Figure 21 Linkages between the GIWA concerns in Lake Tanganyika.
ASSESSMENT
69
within Tanzania, the country provides 53% of the total infl ow into the Lake,
Lake Malawi Basin
mainly through the Songwe (shared with Malawi), Kirire, Lafi rio, Ruhuru
and Rumakali rivers: annual mean run-off exceeds 10 000 m3/km2 in many
areas (World Bank 2003). The total infl ow into the Lake is calculated
Table 18
Scoring table for Lake Malawi.
to be 920 m3/s out of which 400 m3/s are from Malawi, 486 m3/s are
Assessment of GIWA concerns and issues according
The arrow indicates the likely
from Tanzania and 41 m3/s are from Mozambique, while the average
to scoring criteria (see Methodology chapter)
direction of future changes.
T
T
annual outfl ow is estimated to be 395 m3/s (Government of Malawi
C
C
Increased impact
A
A
0 No
known
impacts
2 Moderate
impacts
IMP
IMP
T
T
No changes
C
C
1998). Most of the infl ows are rather short from the escarpments and
A
A
1 Slight
impacts
3 Severe
impacts
IMP
IMP
Decreased impact
nearby mountains, and their volumes depends directly on the rainfall
i
t
y
in the catchment of each stream or river. The hydrology is delicately
t
a
l
p
a
c
t
s
un
*
*
n
Lake Malawi
p
a
c
t
s
m
ore
i
c
i
m
o
m
Sc
balanced. The level of the Lake and the volume of the outfl ow react
c
t
s
o
m
t
h
i
m
c
t
s
r
i
t
y
*
*
*
v
i
r
o
nme
e
r
c
o
n
al
erall
io
rapidly to changes in local rainfall between wet and dry seasons as
En
impa
Ec
He
Oth
impa
Ov
Pr
well as to longer term fl uctuations. The outlet via the Shire River to the
Freshwater shortage
2.0*
1.1
2.0
0.8
1.8
4
Zambezi River is intermittent, with seasonally dependent fl ow rates.
Modification of stream flow
2
Pollution of existing supplies
2
The rise and fall of the Lake is seasonal but also exhibits longer-term
Changes in the water table
0
trends (Eccles 1974, Beadle 1981, Bootsma & Hecky 1999). Outfl ow may
Pollution
2.0*
1.2
0.6
2.0
2.0
3
increase or decrease quite substantially, depending on the annual
Microbiological pollution
2
rainfall (Beadle 1981).
Eutrophication
2
Chemical
1
Suspended solids
3
Environmental impacts
Solid waste
0
Modifi cation of stream fl ow
Thermal 0
Radionuclide
0
Catchment disturbance through land clearance has resulted in
Spills
1
greatly increased sediment loads and run-off (Calder et al. 1995), and
Habitat and community modification
2.0*
1.7
2.3
2.5
2.5
2
diversion of water for irrigation in some rivers has resulted in reduced
Loss of ecosystems
2
fl ow (Government of Malawi 1998). This is a signifi cant issue due to
Modification of ecosystems
2
Unsustainable exploitation of fish
2.6*
1.7
1.6
2.0
2.5
1
its basin-wide pervasiveness and long-term impact on other aquatic
Overexploitation
3
aspects such as fi sheries and habitat modifi cation. Cattle grazing and
Excessive by-catch and discards
0
agricultural activities (sugar and cotton growing under irrigation) are
Destructive fishing practices
2
common in the marginal areas of the Shire swamps in the lower part
Decreased viability of stock
0
Impact on biological and genetic diversity
1
of the course of the Shire River that supports one of Malawi's most
Global change
1.0*
1.9
1.3
1.4
1.4
5
important fi sheries (Hughes & Hughes 1992). For example, the Dwanga
Changes in hydrological cycle
1
River is completely closed off during the dry season and diverted to
Sea level change
1
sugar cane fi elds; the River was originally an important locality for
Increased UV-B radiation
0
Changes in ocean CO source/sink function
0
potamodromous fi sh runs, these spawning runs have now ceased
2
*
This value represents an average weighted score of the environmental issues associated
completely with the annual diversion (Tweddle 1992).
to the concern. For further details see Detailed scoring tables (Annex II).
** This value represents the overall score including environmental, socio-economic and
likely future impacts. For further details see Detailed scoring tables (Annex II).
Pollution of existing supplies
*** Priority refers to the ranking of GIWA concerns.
A survey of the water resources of Malawi concluded in 1980 that
industrial pollutants and partly treated wastes from sewage had
T
C
A
Freshwater shortage
IMP
reduced the quality of water in many streams too far below acceptable
levels (UNEP-IETC 2003). Today, with the rapidly rising population,
The lake surface area is about 28 800 km2 and the catchment area
lack of sanitation infrastructure, lack of sewage treatment facilities,
is 126 500 km2 (Bootsma & Hecky 1993). The land catchment can be
increased numbers of informal settlements, rampant deforestation, etc.,
divided into a number of short coastal streams and six major river
the situation must be far worse. The principal rivers, used to abstract
basins, of which four and part of the fi fth lie within Malawi (Eccles
potable water, carry suspended loads exceeding WHO guidelines in
1984). Although only 28% of the Lake's total drainage basin area lies
the range of 100 mg/l to over 400 mg/l (Kasweswe-Mafongo 2003).
70
GIWA REGIONAL ASSESSMENT 47 EAST AFRICAN RIFT VALLEY LAKES
The very large volume of Lake Malawi may provide a temporary buff er
of the rivers are now polluted and are unsafe for use as potable water;
against deterioration of water quality (Spigel & Coulter 1996) but
this is prevalent mostly in rivers that fl ow through urban settlements
pollution of existing supplies in rivers and localised shoreline areas
and along the largely unplanned coastal settlements that lack proper
does occur. This problem is particularly associated with the western
sanitation infrastructure. The various forms of pollution have had
shoreline of Lake Malawi which is densely populated, and where the
diverse impacts: siltation threatens the production capacity of the
largely rural population relies on surface waters from the rivers and
hydroelectric power plant and operations of irrigation systems; reduced
lake for domestic consumption without any treatment (Government
water quality and quantity has increased the costs of water treatment
of Malawi 1998).
and water supply, respectively; and agricultural productivity is facing
a decline due to soil loss and inadequate water supply for irrigation. It
Socio-economic impacts
has been suggested that pesticide pollution in the rivers and the Lake
The high silt load in surface water run-off has recently led to signifi cant
itself may have played a role in the decline of the Ntchila (Labeo mesops)
problems in downstream water quality, such as increased suspended
population (Government of Malawi 1998).
solids, organic matter pollution and water treatment costs, decreased
hydroelectric power generation capacity, water fl ow problems and
Increased agricultural activities and land degradation in the catchment
siltation of ports (Government of Malawi 1998). This has most likely
will result in increased suspended solids being transported to the
been associated with increased costs of human health protection, but
rivers and lake. Pollution of both surface and groundwater resources
there is no data to evaluate this.
due to excessive use of agro-chemicals in catchment areas is likely to
increase (Government of Malawi 1998). The very large volume of Lake
The largely rural population is involved in continuously utilising
Malawi may provide a temporary buff er against deterioration of water
untreated water, resulting in adverse health impacts that are localised
quality (Spigel & Coulter 1996), but its long residence time makes it
and confi ned largely to densely populated settlements (Government
more vulnerable to damage from the eff ects of human activities
of Malawi 1998). Up to 53% of the population use water sources that
and development in its catchment. Because of the rapid population
are classifi ed as unsafe, and 34% of the population have no access to
growth, high level of poverty, e.g. 46% of Malawi's population are
fl ush toilets nor traditional pit latrines (UNEP-IETC 2003). As a result, the
currently facing severe poverty (Government of Malawi 1998), and
people suff er from common ailments such as diarrhoea and malaria;
high dependence on subsistence rain-fed agriculture and to a lesser
these diseases are common in coastal communities (UNEP-IETC 2003). It
extent irrigation, demand for the water resources, whose quantity and
has been noted that there has been an increased incidence of bilharzia
quality are increasingly being diminished by abstraction and pollution,
(schistosomiasis) in the last two decades, and outbreaks of cholera
will increase. Since the riparian countries are very poor, they will not be
are common near the lakeshore in the rainy season (Bootsma, pers.
able to meet the associated rising costs of water treatment, sanitation
comm.).
and sewerage infrastructure. Nor will they be able to introduce the
necessary sustainable land management practices that will ensure
Loss of human drinking water supplies, loss of recreational use,
sustainability of the quality and quantity of freshwater resources.
reduction in future use options and transboundary implications are the
identifi ed social and community impacts brought about by pollution
of water. The possibility of contracting schistosomiasis in Lake Malawi
T
C
A
and the negative travel advisories abroad in relation to this disease
Pollution
IMP
have deterred tourists from visiting the Lake's attractions (Bootsma,
pers. comm.).
Most of the pollutants in Lake Malawi come from the Malawi watershed
which is by far the most densely populated;Tanzania and Mozambique
Conclusions and future outlook
watershed areas are lightly populated particularly because most of
Freshwater shortage has only slight impact in Lake Malawi, but a much
the lakeshore on the eastern and northern side is inaccessible due to
greater impact on the rivers that fl ow into the Lake in terms of available
the steep topography. Microbiological, chemical and spill pollution
water for consumption, domestic and livestock use, and irrigation of
are largely local in extent. On the other hand, eutrophication and
crops. Catchment disturbance through land clearance has resulted
suspended solids are much more widespread due to increased run-
in greatly increased sediment loads (Tweddle 1992), and diversion of
off and erosion from the degraded and deforested watershed areas
water for irrigation in some rivers has resulted in reduced fl ows. Most
and large-scale biomass burning during the dry seasons that convey
ASSESSMENT
71
nutrient elements to the Lake via the atmosphere (Bootsma & Hecky
which is likely to be infl uencing changes in plankton composition)
1999). As early as 1960, the high population density of Malawi had led
are from both the atmosphere and rivers resulting from deforestation,
to extensive alteration of the natural vegetation of the catchment
increased agricultural erosion and burning (Bootsma & Hecky 1999).
(Eccles 1984).
They are not linked to fertiliser application, but are the result of nutrient
mobilisation in terrestrial biomass and soils.
Environmental impacts
Microbiological
The water hyacinth is now encroaching into Lake Malawi from a variety of
Microbiological pollution is an issue, at various localities, but there are
sources including its infested Shire River outlet and rivers, such as Bua and
few reports that document its severity, particularly in Tanzania and
Linthipe, that drain the watershed (UNEP-IETC 2003). Some pockets along
Mozambique. The bacteriological quality of major rivers in Malawi is
the Lake already show signs of infestation, e.g. at Chembe, Cape Maclear,
poor due to effl
uent discharges, with the worst quality being found
where clusters of hyacinth were observed in 1996 (UNEP-IETC 2003).
in rivers that fl ow through the cities of Blantyre, Lilongwe, Zomba
and Mzuzu (Government of Malawi 1998). Most rivers contain faecal
Chemical
coliforms exceeding 500 per 100 ml in the dry season: the faecal
Chemical pollution from urban domestic and industrial sources, and
coliforms are largely from unplanned settlements and improper
from fertilisers, herbicides and pesticides used in agriculture has been
waste disposal (Kasweswe-Mafongo 2003). Counts as high as 20 000
increasing (Coulter & Mubamba 1993). Mercury in fi sh is a potential
faecal coliforms per 100 ml have been observed in Linthipe River
health hazard for humans, while organochlorines are unlikely to have
downstream of the sewage plant during periods when the plant has
any health impacts (Bootsma & Hecky 1999). Very heavy application of
broken down (Government of Malawi 1998). In low-income areas of the
copper fungicides is reported near Nbozi, in the Tanzanian portion of
above cities, pit latrines are usually constructed without consideration
the watershed (Alabaster 1981).
to their potential for water resource pollution. Poor sanitation in the
more densely populated areas around the Lake can potentially result
Suspended solids
in serious disease transmission problems, particularly via lake fi sh. For
Changing patterns of land use and erosion resulting from forest clearance
example, the practice of drying fi sh directly on beaches that are also
(Calder et al. 1995) for agriculture to sustain the growing population in
used as untreated effl
uent disposal points can lead to outbreaks of
the southern catchments are the likely factors infl uencing increased
cholera as outlined above.
sediment deposition in southern Lake Malawi (Bootsma & Hecky 1999).
The inshore quality of water along Lake Malawi depends on the eff ect
Eutrophication
of river effl
uent, some of which has high sediment loads (UNEP-IETC
There are three major sources of nutrient inputs to Lake Malawi; land-
2003). River catchments with very high deforestation rates have led to
based discharge, atmospheric deposition, and upwelling return (Lam
increased turbidity and river discharges high in suspended solids. The
et al. 2002). The nutrient and sediment loading to the Lake from its rivers
increasing soil loss poses the greatest threat to sustainable agricultural
is likelyto have increased by 50% within the past few decades with a
production and negatively impacts on water quality (Kasweswe-
few rivers such as the Linthipe, Songwe and Dwanga accounting for
Mafongo 2003). High sediment loads smother nearshore rocky habitats,
much of that increase (World Bank 2003). The likely factors infl uencing
reducing algal growth and habitat diversity, which in turn reduce fi sh
increased sediment deposition (Calder et al. 1995) and nutrient input
abundance and, possibly, diversity. The sediment decreases water clarity
(Bootsma & Hecky 1999) in the southern catchments are deforestation,
and light penetration, further reducing benthic algal growth (which is
increased agriculture, erosion and biomass burning. The environmental
the food base for the species-rich nearshore cichlid communities), and
degradation is driven by the need to sustain the growing population.
may reduce species diversity by preventing females from recognising
con-specifi c males. Phytoplankton, and other pelagic or benthic
The prominence of the blue-green algae Planktolyngbya tallingi in
organisms, will be aff ected by increased turbidity. In addition, many of
the southern region of the Lake (where it has replaced the previously
the fi sh retain the habit of spawning in the infl owing rivers, and thus high
dominant Planktolyngbya nyassensis) and the reported occurrence of
sedimentation and turbidity may reduce fi sh stocks in the Lake.
Cylindrospermopsis raciborskii, a fi lamentous blue-green algae which
is often a climax species in highly eutrophic situations and which
Spills
has toxic forms are indicative of increasing eutrophication (Bootsma
There are no reported spills in the Lake, but these are likely to occur from
& Hecky 1999). The increased nutrient inputs (including phosphorus
time to time in the maritime transport industry.
72
GIWA REGIONAL ASSESSMENT 47 EAST AFRICAN RIFT VALLEY LAKES
Socio-economic impacts
declining responses to fertiliser application, and impaired watershed
Pollution has led to increased costs of human health protection, water
performance (World Bank 2003). While the concentration of solutes
treatment, preventive medicine and loss in fi sheries.
and particulates in rainwater near Lake Malawi are not particularly high
relative to industrial regions or some other parts of Africa, higher than
Microbiological pollution is widespread in the Basin's rivers, particularly
average ammonium-cation ratios, nitrate-anion ratios, and potassium
in those that pass through urban settlements, but is more localised
concentrations suggest that burning is having a signifi cant eff ect on
along the lake shore where it results from poor sanitation infrastructure
atmospheric chemistry around the Lake (Bootsma & Hecky 1999).
and unhygienic handling of fi sh, leading to increased incidence of
Although the direct eff ect of the deposition of these solutes on the
water-borne diseases, particularly in densely populated settlements
Lake may not be deleterious, the burning and soil exposure that these
(Government of Malawi 1998, UNEP-IETC 2003). Pollution leads to
observations refl ect may potentially result in detrimental impacts on the
increased risks to human health. In addition, loss of traditional protein
Lake, such as siltation, accelerated fl ux of nutrients from soil to the Lake,
sources (decline in fi sheries) would increase the vulnerability of the
and a decreased and more variable water supply from rivers (Bootsma &
people living in this area to food or essential nutrient shortages
Hecky 1999). Phosphorus loading resulting from catchment disturbance
(Government of Malawi 1998, Kasweswe-Mafongo 2003).
could have some of the following consequences: reduced water clarity,
resulting in a shallower benthic trophogenic zone; and a shoaling of the
Pollution has to some degree led to loss of potable water supplies, loss
oxic-anoxic boundary and reduction of available fi sh habitat (Bootsma
of tourism or recreational values, loss of aesthetic values, change in
& Hecky 1999).
fi sheries value, loss of wildlife sanctuaries, and avoidance of amenities
and products due to perception of the eff ects of contamination
Soil conservation measures will need to be urgently implemented in
(Government of Malawi 1998, Kasweswe-Mafongo 2003).
order to protect both the rivers and lake, and to preserve or improve
upon current agricultural productivity in the catchment. Because of its
Conclusions and future outlook
high contribution to total river infl ow to Lake Malawi, land management
The problem of eutrophication and increased suspended solids is
within the Tanzania catchment area has a signifi cant impact upon the
widespread and is related to deforestation, agriculture, erosion and
level of nutrients, sediments and other land-based pollution entering
biomass burning in the catchment (Calder et al. 1995, Bootsma &
the Lake. It is clear that further land clearance in the more mountainous
Hecky 1999). This is leading, for example, to changes in phytoplankton
northern areas will have relatively greater negative impacts on the Lake
communities particularly in the southern region of the Lake (Bootsma
due to steeper slopes and higher rainfall (World Bank 2003). Pressure
& Hecky 1999). There is also reported occurrence of Cylindrospermopsis
on the Lake is expected to increase as a direct result of declining
raciborskii, a fi lamentous blue-green algae, which is often a climax
agricultural productivity (World Bank 2003) and increasing pollution
species in highly eutrophic situations (Bootsma & Hecky 1999). The
of rivers, etc., and this has the potential eff ect of adversely aff ecting
water hyacinth is now encroaching Lake Malawi from a variety of
fi sheries, the lake ecosystems and water quality.
sources including its infested Shire outlet and rivers that drain the
watershed (UNEP-IETC 2003). There are no reported spills in the Lake,
but this is likely to occur from time to time in the maritime transport
T
C
A
industry. Pollution (as defi ned in this section) is perhaps the greatest
Habitat and community
IMP
threat to Lake Malawi (Tweddle 1992). Eutrophication, pesticides,
modification
alteration of biological communities and possible consequences of
petroleum extraction are of concern to the Lake Malawi Basin (Hecky
There is a high rate of deforestation within the catchment. The total
& Bugenyi 1992).
land areas under cultivation in the northern and central regions of
Malawi were estimated to be 17% and 22% respectively in 1964-1965;
Pollution will continue to increase as the human population grows
these increased to 22% in the north and 41% in the central region by
and natural landscapes are converted for agriculture, habitation and
1978 (Eccles 1984). Together, these two regions form almost 64% of
transportation (Beeton 2002). Suspended solids and eutrophication
the land catchment and 49% of the total catchment of the Lake, so it is
are the primary pollution issues in Lake Malawi. Soil is declining in
evident that a large proportion of the natural Brachystegia-Julbernardia
fertility due to soil erosion and degradation, and is evidenced by
woodland has been cleared.
increased rates of soil loss, declining yields from unfertilised crops,
ASSESSMENT
73
The fast-fl owing upper reaches of the numerous rivers that drain into
for use as nurseries and for species that are adapted to living among
Lake Malawi support unique communities of animals and plants that are
macrophytes (Ribbink 2001). The habitats of the inshore regions support
not found elsewhere in the system (Jackson et al. 1963, Tweddle & Skelton
the richest, most diverse and most stenotopic cichlid fi sh communities
1993). Small deltas with freshwater swamps occur at the mouths of some
(Ribbink 2001). The rocky shores harbour a wealth of invertebrates
streams entering the Lake on the Tanzania shore. Larger swamps include:
(e.g., harpacticoid copepods, chironomids, ostracods), molluscs and
the Linthipe River delta, 22 km long and 15 km wide, mainly swampy;
the crab Potamonautes lirrangensis, while sandy shores support an
the Karonga Lakeshore Plain, much of which is under cultivation,
almost entirely diff erent invertebrate fauna (copepod and ostracod
along the northwest shore at the Malawi side; Nkhotakota Lakeshore
Crustacea, the prawn Caridina nilotica, chironomid larvae, gastropods,
Lowlands, a strip extending for 125 km along the western shore of Lake
bivalve Mollusca) (Hughes & Hughes, 1992). These communities are
Malawi, containing a number of seasonally fl ooded areas; and Salima
under threat from sediment inundation of the habitats, and overfi shing
Lakeshore Plain, a very wet plain about 90 km long, with large marshes
(Ribbink 2001). Studies are, however, necessary to establish the extent
and the swampy delta of Linthipe River (Hughes & Hughes 1992). Water-
of ecosystem loss and its impacts.
level changes as a result of abstraction or natural fl uctuations in the
hydrological balance can have marked impacts on fi sh catches because
Modifi cation of ecosystems
the fl oodplains act as very productive nursery areas (Ribbink 2001). The
Available evidence indicates that the most seriously threatened fi sh
Shire swamps in the lower part of the course of the Shire River support
species are the riverine and potamodromous species as a result of both
one of Malawi's most important fi sheries. Cattle grazing and agricultural
habitat degradation of rivers and overfi shing (Tweddle 1992, Ribbink
activities (sugar and cotton growing under irrigation) are also common
2001). The Bua River, for example, is important since it supports huge
in the marginal areas (Hughes & Hughes 1992).
breeding runs of the migrating cyprinid fi sh Opsaridium microlepsis,
which is endemic to Lake Malawi and is one of the major commercial
The only area which currently protects the cichlid fi shes is the 94 km2
species in its northern and central parts (Hughes & Hughes 1992). These
Lake Malawi National Park in the southern part of the Lake, declared by
fi shes have now been largely eliminated from Malawian waters through
UNESCO as a World Heritage Site in 1982, but the continuous nature of
a combination of siltation and fi shing pressure (Cohen et al. 1996). They
the lake environment leaves this part vulnerable to large-scale changes
are still common in lightly populated areas of the Mozambiquan coast,
in the Lake and its basin (Figure 22) (World Bank 2003).
but even there spawning grounds are beginning to show signs of
serious deterioration (Massinga 1990). Within the Lake itself, it appears
Environmental impacts
that some of the "key" fi sh stocks are declining. In the area south of
Loss of ecosystems
Boadzulu Island, an area of intensive demersal trawling, many of the
The widespread deforestation within the catchment to pave way for
larger cichlid species have declined with some species becoming locally
agriculture and settlements has resulted in loss of some fl oral and
extinct. More generally, the fi sh community compositions are changing
faunal ecosystems. In addition, the rich genetic pool of fl ora and fauna
within the Lake as a result of overfi shing.
in protected areas such as national parks, game and forest reserves
is diminishing due to habitat destruction and poaching (Kasweswe-
Socio-economic impacts
Mafongo 2003). Habitat degradation of rivers and overfi shing threaten
In Malawi, 85% of the population is below the absolute poverty line: the
riverine and potamodromous fi sh species (Chapman et al. 1992,
major source of income for the population is agricultural production at
Tweddle 1992, Ribbink 2001). In the Bua River, the largest river to
subsistence level, and this is increasingly threatened by soil degradation
enter the Lake from the Malawi side, fi shes e.g. Opsaridium microlepsis
(ADB 1997). It is estimated that 230 000 (ATF 1997) to 290 000 people
have now been largely eliminated from Malawian waters through a
(World Bank 2003) are employed directly or indirectly in the fi shing
combination of siltation and fi shing pressure (Cohen et al. 1996). In
industries, and these jobs are now being threatened by declining fi sh
addition, the Ntchila (Labeo mesops) stocks, which migrate in groups
stocks (ATF 1997). The declining fi sh yields (Mapila 1998, Ribbink 2001),
into rivers to spawn and which used to be abundant in the Lake
partly resulting from habitat change, has contributed to increased
and formed the basis of an important fi shery in the 1950s and l960s,
eff ort per catch unit. Given that the number of fi shermen in the Lake
have declined to less than 1% of their former levels (based on gill net
is increasing against this decline in fi sh yields, the eff ective income per
catches) (Government of Malawi 1998). Although no studies have been
individual in the fi sheries industry has declined. Fish is a primary source
done, anecdotal comments suggest that seine netting has reduced
of protein in the area, so habitat change that results in lower fi sh yields
substantially the vegetated regions, and hence the amount of habitat
leads to declines in nutritional status of the population.
74
GIWA REGIONAL ASSESSMENT 47 EAST AFRICAN RIFT VALLEY LAKES
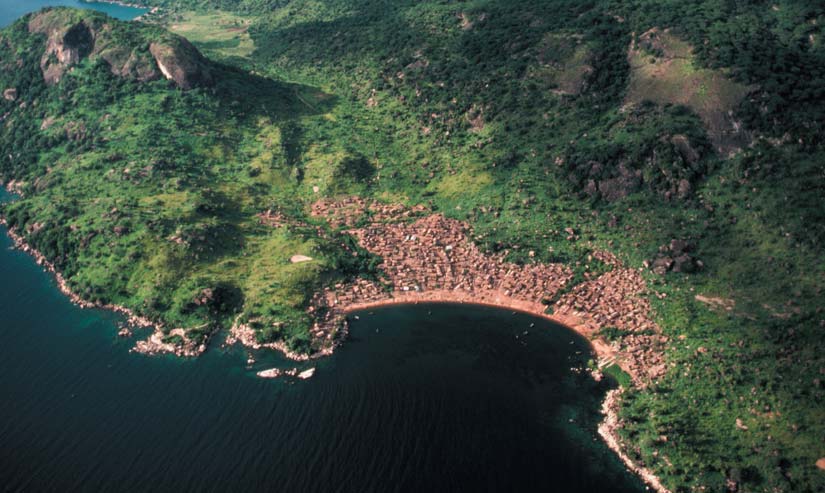
Widespread poverty within the population plays a signifi cant role
global community has only one chance at eff ective management of
in environmental degradation (ATF 1997). More than 90% of energy
this unique resource (World Bank 2003).
requirements are met from biomass supplies, and national wood
consumption stands at double the sustainable production (WWF 2003).
Conclusions and future outlook
Reduced capacity to meet the basic human need for food and fuel
The Lake Malawi Basin has numerous swamps/wetlands that are
aff ects the welfare of the family unit. Loss of species in Lake Malawi is a
important in terms of plant species diversity and nursing grounds for
serious problem caused by a combination of high population growth,
fi sh. Conversion of these swamps/wetlands for cultivation and cattle
rampant poverty and other economic factors (ATF 1997). The harvest
grazing, as well as the use of their waters for irrigation, has adverse
of large quantities of fi sh has altered the ecological balance in the Lake,
impacts on their biodiversity. Increased sedimentation resulting from
reducing the number and species of fi sh and aff ecting other wildlife
land degradation and deforestation in the catchment is also changing
such as birds which feed on fi sh (ATF 1997). Loss of alternative income
riverine and lacustrine habitats that again impacts on biodiversity.
has aff ected the family units' ability to aff ord e.g. education and health
Overfi shing and destructive fi shing practices, acting in concert with
services. This has been compounded by disruption of living patterns
human-induced wetland conversion and increased sedimentation, has
due to commercial fi sheries opening up wider markets and fostering
grave impacts on the fi sh stocks and species diversity, particularly in
increased demand for fi sh, resulting in increased fi sh prices. This has
the wetlands and littoral zones of the Lake. For example, the cyprinid
forced the local people to modify their cultural ways in order to fi nd
fi sh Opsaridium microlepsis, which is endemic to Lake Malawi and is one
alternative food sources (ATF 1997). Reduction of the diversity of the
of the major commercial species in its northern and central regions
genetic pool reduces the available materials for extraction of medicines,
(Hughes & Hughes 1992) has now been largely eliminated from
for agriculture and research (Kasweswe-Mafongo 2003). Human
Malawian waters through a combination of siltation and fi shing pressure
confl icts (e.g. between subsistence and commercial fi shermen) are likely
(Cohen et al. 1996). In addition, water level changes in the fl oodplains
to increase due to competition for diminishing resources, and loss of
can have marked impacts on fi sh catches because the fl oodplains act
habitats leads to intergenerational inequities. Because of the endemicity
as very productive nursery areas (Ribbink 2001).
of the Lake's cichlid fi shes and rich speciation in haplochromines, the
Figure 22 Lake shore of Lake Malawi near Money Bay in Lake Malawi National Park.
(Photo: Corbis)
ASSESSMENT
75
Water hyacinth has been introduced into the rivers of the Basin and
2000). In Malawi, the artisanal fi shery land 80ş90% of the catches, while
through them has entered the Lake. It is currently not a problem as the
in Tanzania and Mozambique, the artisanal fi sheries account for all
Lake does not have suffi
cient nutrients to sustain it, but may become
landings (Ribbink 2001).
so with increased eutrophication. The rate of loss of ecosystems and/or
their modifi cation will increase as result of changes (reduction) in the
All the fi shes in the Lake are edible, consequently, by-catch is not wasted
surface area currently under water, human activities in the catchment
as all fi sh that are caught are eaten, whether targeted or not (Ribbink
and aquatic system as a whole. Changes in salinity due to decreasing
2001). There is no evidence of decreased viability of stock through
water levels and increasing temperatures will also aff ect the current
increased incidence of fi sh contamination and disease.
ecosystem and could result in changes in community structure and
species composition, though this is very unlikely in the near future.
Environmental impacts
Economic impact would become more severe as a result of further
Overexploitation
ecosystem loss and habitat modifi cation. Subsistence fi sheries would
Fish production in Malawi rose dramatically from annual catches
be most aff ected, as shallow aquatic areas are lost to land, reducing the
of 20 000 tonnes in 1965 to 84 000 tonnes in the 1970s and has
local populations capacity to meet basic food needs. This, in turn, would
declined since then to give fl uctuating yields, sometimes dropping
increase health risks. The prospect of enhanced lake deterioration
to 60 000 tonnes per year (Mapila 1998). In Mozambique, there was a
would also increase as populations migrate to areas which still retain
decline in fi shing eff ort due to the civil war but since then there has
their ecosystem integrity in search for unpolluted fi sh food, water,
been an increase in fi shing activity. In Tanzania, the fi shery has shown
agricultural land and fuel wood resources.
steady growth. An increase in the number of boats and in fi shing eff ort
has resulted in a decline in catches (Ribbink 2001). The soft substratum-
associated fi sh communities have been more heavily impacted than the
rocky fi sh-associated communities in the shallower parts of the Lake.
T
C
A
Unsustainable exploitation of
IMP
Overfi shing does not occur throughout the Lake, and the deep pelagic
fish and other living resources
waters of the Lake are probably under-exploited. However, deep water
demersal communities (50-100 m depth) are harvested by off shore
Malawi has about 800 diff erent species of fi sh (Ribbink 2001). Many of
trawlers in particular and have shown changes in species composition
these fi shes are colourful and highly sought after by the aquarium trade.
and standing stock, but nearshore, shallow demersal communities are
The inshore distribution of these fi shes and their inquisitive behaviour
under the greatest pressure (Ribbink 2001). The cichlid fi sh communities
make them attractive to view and adds immeasurably to the tourism
of the inshore regions are the richest, most diverse, most stenotopic,
potential of the Lake.
and hence the most vulnerable to fi shing pressure, yet it is these
vulnerable communities that are subjected to the greatest fi shing eff ort;
By the 1930s, commercial fi sheries had begun in Malawi (Ribbink
the artisanal fi shery land about 85% of the catch and is restricted to
2001), and in the 1940s the fi rst concerns over overfi shing were raised
the nearshore habitats (Ribbink 2001). There are indications that local
(Ricardo-Bertram et al. 1942). The growth of the artisanal fi shery was
overfi shing has taken place because Catch Per Unit Eff ort (CPUE) and
accompanied by the development of a mechanised fi shery which
standing stocks have decreased (Ribbink 2001). In the artisanal and
started in 1943 with the introduction of open plank boats with engines.
commercial fi sheries, species composition of catches has changed, with
Fishing pressure increased in the 1960s when artifi cial twines replaced
the larger fi shes disappearing from the catches (Ribbink 2001). Partly as
natural fi bres, plank boats with outboard engines became popular
a result of overfi shing, the most seriously threatened fi sh species are the
and the fi rst demersal trawlers were introduced (Tarbit 1971). Since
riverine and potamodromous species, some of which have now been
then, the number of small, open vessels has increased progressively,
eliminated (Tweddle 1992, Cohen et al. 1996, Ribbink 2001).
with a growth of more than 80% since 1980 in Malawi, to almost 9 400,
of which 1 700 are planked boats (Malawi Fisheries Department, cited
Destructive fi shing practices
in Ribbink 2001). In Mozambique and Tanzania, the remoteness of the
Although no studies have been done, anecdotal comments on fi shing
Lake from regions of high population density meant that the scale and
in the littoral belt suggest that seine netting has reduced substantially
intensity of fi shing never reached a level comparable to that in Malawi
the vegetated regions, and hence the amount of habitat for use as
(Ribbink 2001). Nevertheless, fi shing pressures grew along the lakeshore
nurseries and for species that are adapted to living among macrophytes
in both countries, despite the relatively low population densities (Booth
(Ribbink 2001).
76
GIWA REGIONAL ASSESSMENT 47 EAST AFRICAN RIFT VALLEY LAKES
Impact on biological and genetic diversity
Conclusions and future outlook
There is no evidence of deliberate or accidental introductions of alien
The Lake Malawi fi sh community has been adversely impacted by
stocks or genetically modifi ed species (Cohen et al. 1996). However,
increased exploitation of inshore fi shes resulting in declining catches
there have been many unintentional species translocations within the
and loss of biodiversity (Turner 1994). Overfi shing does not occur
Lake, mostly by the aquarium trade industry. The translocations disrupt
throughout Lake Malawi, and the deep pelagic waters of the Lake are
existing nearshore species, and may result in the extinction of species
probably under-exploited (Ribbink 2001). However, deep water demersal
at certain locations, and/or homogenisation of the gene pool and loss
communities (between 50ş100 m depth) are harvested by off shore
of genetic diversity (Bootsma, pers. comm.).
trawlers in particular and have shown changes in species composition
and standing stock, but nearshore, shallow demersal communities
Socio-economic impacts
are under the greatest pressure (Ribbink 2001). At the southern end
Fisheries is an important economic sector, supporting thousands of
of the Lake, fi shing has resulted in reduced fi sh size, smaller catches,
permanent inhabitants who are largely dependent upon fi sh for their
and possibly reduced biodiversity. The potamodromous fi shes are
livelihood (Ribbink 2001). The commercial fi sheries from Lake Malawi
subjected to heavy fi shing pressure when adults congregate on their
are currently estimated to contribute 1ş2% to GDP and provides
spawning runs up river; simultaneously, degradation of rivers negatively
employment, directly or indirectly, to up to 290 000 people (World
aff ects breeding success and recruitment, so that populations of several
Bank 2003). The ornamental fi shery provides foreign exchange, and
species are in decline and many are threatened (Tweddle 1992, Ribbink
employment to several hundred people (Ribbink 2001). The per capita
2001). As in Lake Tanganyika, the impact of ornamental fi shing on
consumption of fi sh fell in Malawi from 12.3 kg in 1972 to 7 kg in 1991
population and community structure could be considerable as the
(Mapila 1992), and is believed to have continued to fall, suggesting that
rare and alien species are extracted in as high a number as possible
supply cannot keep up with demand (Ribbink 2001). Overexploitation
because of the high mortality rates in shipping. Declining fi sh yields and
and destructive fi shing methods would lead to reduced economic
CPUE, as well as disappearance of certain fi shes from the catches (while
returns, loss of employment and livelihood, and reduced earnings in one
the number of people involved in fi shing continues to grow), suggests
area by destruction of juveniles in another (migrating populations).
that present levels of exploitation are not sustainable, at least in some
parts of the Lake (Ribbink 2001).
Fish is particularly important to the people during times of drought
(Mapila 1992) as it combats malnutrition when crops fail. Unsustainable
The fi sheries sector is likely to become more important to the GDP of the
exploitation can therefore lead to malnutrition due to loss of protein
region as more people turn from agriculture (which is now exhibiting
sources for human consumption. In Malawi, for example, fi sh from the
declining productivity as a result of land degradation) to fi sheries. In
Lake and rivers provides about 70% of animal protein consumption in
addition, the rapidly increasing population will fuel increased fi shing
the country (Nyambose 1997, World Bank 2003). The poor who rely on
eff ort through sheer numbers alone as the people try to sustain their
fi sh for their daily needs lose out as fi sh stocks decline, and demand and
livelihoods. Under immediate threat are the riverine, potamodromous
prices increase (Nyambose 1997). However, it is not too severe due to
and littoral zone fi sheries. If the Mtwara Development Corridor is
the existence of protein options.
successful in its initiatives, this will open up the remote lakeshore areas
of Mozambique and Tanzania, and will probably also lead to increased
The Lake is one of the world's major biodiversity hotspots. The
fi shing pressure from the two countries. Currently, the deep pelagic
ornamental fi shery stimulates the interest in the biodiversity of the
waters of the Lake are probably under-exploited (Ribbink 2001), but
Lake and focuses international attention on the Lake, which is of benefi t
as the fi sh stocks dwindle in the littoral and shallower areas, these
to promoting donor interest and the tourism industry (Ribbink 2001).
deep pelagic waters will probably become the new fi shing grounds
On the other hand, trawlers sometimes fi sh inshore, creating confl ict
that will be accessible to the large commercial trawlers. In relation
between them and the artisanal fi shermen. With the introduction of
to this, there is the prospect of the collapse of artisanal fi sheries with
commercial large-scale fi shing, the lakeshore people are fi nding it
dire consequences for the hundreds of thousands of people who are
diffi
cult to continue their traditional way of life: in some cases, living
dependent on them for income and food. Negative spin-off s from this
patterns have been dismantled and cultural practices have been
would be increased levels of poverty, malnutrition, and social confl icts
modifi ed in order to fi nd alternative sources of food (Nyambose 1997).
(e.g. between artisanal and commercial fi shermen as is currently the
Intergenerational equity issues also arise due to the environmental
case). Declining fi sh stocks may accentuate the use of destructive
degradation and loss of biodiversity.
fi shing practices which would, in turn, accelerate the elimination of
ASSESSMENT
77
fi sh through direct (overfi shing) and indirect (destruction of habitat,
navigation are often dependent on the hydrological regime in lakes
changes in the food chain, etc.) impacts.
and rivers. A reliable supply of good quality water is required for human
consumption, industry and irrigation (Calder et al. 1995). In the drought
of 1991/1992, the Shire Valley hydrolectric system came close to power
restrictions due to insuffi
cient water fl ow (Clay et al. 2003). Because
T
C
A
Global change
IMP
most rural people depend on agriculture for subsistence, unreliability
of rainfall causes loss of income, and increased general vulnerability
Within the region, changes in the distribution of rainfall take place
to food security (Government of Malawi 1998). The eff ects of sea-level
in response to the movement of the Inter-Tropical Convergence
change, radiation, carbon dioxide source-sink function, and temperature
Zone (ITCZ) and associated belts of distribution. Climate change
change, remain uninvestigated in the Lake Malawi Basin.
and variability are caused amongst others by long-term trends in
the movement and characteristics of the ITCZ, shifts in the global
Environmental impacts
circulation pattern, deforestation, rates of evapotranspiration, global
Changes in hydrological cycle and lake circulation
greenhouse gas emissions and changes in the hydrological system
There has been an increase in the frequency of droughts in recent years
(Government of Malawi 1998). The Lake itself exerts a considerable
(Ribbink 2001). The droughts of 1991/1992, 1994/1995 and 1997/1998
modifying eff ect on the weather and climate in its vicinity (Eccles
were all associated with ENSO (Clay et al. 2003), but the recent disastrous
1984). Average rainfall around the Lake varies regionally, the general
fl oods in Mozambique and the role which the extremely high rainfall in
trend being less rain at the south of the Lake and more at the north
Malawi in 2000/2001 played in the crisis in 2002 have highlighted the
end (Bootsma & Hecky 1999). Using more than two decades of data
risks associated with high rainfall (Clay et al. 2003). Periods of below-
(1954ş1980), Kidd (1983) calculated mean annual rainfall in the south
average or erratic rainfall were less extreme and less general in their
(south of the Dwanga watershed) to be 996 mm, that in the central area
impacts in the 1970s and 1980s than in the 1990s (Clay et al. 2003). High
to be 1 110 mm, and that in the north and northeastern area (Songwe
outfl ows in the Shire River were recorded in 1980 when the discharge
to Ruhuhu watersheds) to be 1 542 mm. The estimated average annual
(963 m3/s) was over twice as high as the mean discharge (395 m3/s),
rainfall directly on the Lake is estimated to be 1 414 mm (Kidd 1983).
and the highest annual outfl ows of 825 m3/s and 820 m3/s occurred in
Global warming will lead to higher temperatures: the rate of warming
1979ş1980 and 1980ş1981 respectively, during an unusually wet period
is estimated to be between 0.2 and 0.5░C per decade for Africa (Hulme
(Government of Malawi 1998).
et al. 2001), and rainfall in southern Africa is projected to decline by 2050
by about 10% (IPCC 2001).
Lake-level change
Lake Malawi is similar to Lake Victoria and Lake Tanganyika in that
The hydrological cycle in the region is closely linked to ENSO cycles
relatively small changes in rainfall and evaporation may lead to shifting
(cf. Nicholson 1996). However, as opposed to eastern Africa, El Ni˝o in
between open- and closed-basin status as has happened in historical
this region is associated with drought rather than excess rainfall. The
times (Beadle 1981, Owen et al. 1990, Spigel & Coulter 1996). Lake Malawi
correlation between El Ni˝o and inter-annual variations in southern
had a lowstand between 1500 and 1850 (210Pb dates) (Owen et al. 1990)
Africa is highly signifi cant, but it is not a simple relationship. Not every
and in 1915 when outfl ow via the Shire River ceased; outfl ow resumed
El Ni˝o event brings low rainfall, and in some years extremely low
in 1935 after the lake level had risen 6 m (Beadle 1981). Lake Malawi, as
annual rainfall is not clearly linked to El Ni˝o events (Clay et al. 2003).
the other east African lakes, also responds dramatically to El Ni˝o events,
Much less well understood oceanic-atmospheric interactions in the
but also to anomalous warming of the Western Equatorial Ocean, such
Indian Ocean and Southern Atlantic are now recognised as important
as that which led to the high rainfall event that occurred in 1997-1998
infl uences on rainfall patterns (Clay et al. 2003).
and resulted in a water level rise in the Lake of 1.8 m (Birkett et al. 1999).
Other high rainfall periods are recorded in the early 1960s and late
Agriculture accounts for between one-third to slightly over one-
1970s. A modelling study of Lake Malawi shows that rainfall variation
half of the GDP of the riparian countries (see Table 10). Most of the
is suffi
cient to explain the lake-level changes on annual and seasonal
agricultural activities are at subsistence level, and depend directly on
resolution over the past century (1896 to 1967) irrespective of changes
rainfall. The region's electricity is dependent largely on hydroelectric
in land use, evaporative demand or in the hydraulic regime of the Lake
power production from the Shire Valley hydroelectric power plant,
(Calder et al. 1995). However, because of a 13% decrease in forest cover
which in turn depends on fl ow from Lake Malawi. Inland fi sheries and
from 1967 to 1990 as a result of human activities, the run-off increased,
78
GIWA REGIONAL ASSESSMENT 47 EAST AFRICAN RIFT VALLEY LAKES
and consequently the lake level was 1 m higher than it would otherwise
have had adverse economic impacts on the agricultural sector, and
have been during the drought of 1992 (Calder et al. 1995).
on infrastructure, housing and communications (Drayton & Crossley
cited in Eccles 1984, Clay et al. 2003). Reductions in rainfall also threaten
Socio-economic impacts
the production of electrical power from the Shire Valley hydroelectric
Impacts of increased frequency and intensity of drought are felt mostly
power plant. Rural communities are the most vulnerable to changes
in agriculture and in other sectors reliant on water, such as hydroelectric
in precipitation as they rely largely on subsistence agriculture for food
power generation. In southern Africa, including Lake Malawi Basin,
security and income generation. Global warming will lead to higher
agricultural performance is optimal with annual rainfall between
temperatures at a rate of 0.2ş0.5░C per decade in Africa (Hulme et al.
95% and 120% of long-term mean total rainfall ş excesses or defi cits
2001), while rainfall in southern Africa is projected to decline by about
will negatively impact on agricultural production such as the 1991/92
10% over the next 50 years (IPCC 2001). The projected decline in rainfall
drought that resulted in a 60% decline in maize production (Clay et al.
relative to today does not appear to be a great threat to the region,
2003). The economic cost of this drought in the southern African region
but there may be associated increased variability and changes in the
was estimated as follows: 1 billion USD in cereal losses at import parity
distribution of precipitation. These are issues which need further, and
prices and 500 million USD in actual logistical costs of importing cereal
urgent, investigation.
into aff ected southern African countries (Clay et al. 2003). Economic
costs of excess rainfall through damage to infrastructure and agriculture
As has been observed in Lake Tanganyika (O'Reilly et al. 2003, Verburg et
can also be quite extensive: in the past, fl oods have destroyed hotel
al. 2003), warming temperatures in the region will cause greater heating
and harbour installations, destroyed crops, and cut off communications.
in surface waters than in deep waters in the meromictic Rift Valley Lakes,
The degradation of catchment areas and marginal lands as a result of
and this could reduce vertical exchange of deep waters with surface
population pressure and inappropriate agricultural activities, has led to
waters and reduced loading from the higher nutrient concentrations
the reduction of base fl ows and increased incidences of fl ood disasters
in those deep waters. Vollmer et al. (2002) have documented a recent
during heavy storms. The fl ood peak levels in 1976 and 1978 caused
reduction in the ventilation of the deep water of Lake Malawi which
considerable diffi
culties to lakeshore dwellers, hotels and harbour
has also reduced nutrient loading from the hypolimnion (Bootsma &
installations (Drayton & Crossley cited in Eccles 1984). The fl oods of
Hecky 1999). Reduced nutrient loading could lead to lower biological
1979 and 1980 inundated large areas of productive land, rendering
production in the Lake Malawi, as in Lake Tanganyika (cf. O'Reilly
many villages uninhabitable, caused the temporary closure of some
et al. 2003). The possibility of a return to historically low levels is of
hotels, threatened communications and overtopped jetties at major
great concern in relation to: the maintenance and planning of future
ports (Drayton & Crossley cited in Eccles 1984). This has resulted in
hydropower development on the rivers draining into the Lake (Calder
temporary displacement of large populations, loss of food resources,
et al. 1995); disruption of electrical power supply from the Shire Valley
and has been a major impediment to communications.
hydroelectric powerplant, and; changes in the littoral and deltaic
habitats and its eff ects on fi sheries. Knowledge of the changes in the
Conclusions and future outlook
hydrological regime, which may result from climate change or land use
A complex interaction between an array of climate parameters
change, is therefore necessary for the planning of future developments
(ITCZ, shifts in the global circulation pattern, deforestation, rate of
(Calder et al. 1995).
evapotranspiration, global greenhouse gas emissions and changes in
the hydrological system) aff ect the climate of the region. The Lake itself
also exerts a strong modifying infl uence on the regional climate. The
hydrological cycle is closely linked to ENSO cycles. Drought is normally
Priority concerns
but not always associated with the ENSO, whose frequency and intensity
has been observed to be increasing, probably as a result of global
The Task team prioritised the GIWA concerns as follows:
warming. However, the increased frequency of drought that has been
1. Unsustainable exploitation of fi sh and other living resources
observed in southern Africa, e.g., in the 1990s, cannot be conclusively
2. Habitat and community modifi cation
linked to ENSO (and global warming), as there are other causes that are
3. Pollution
not necessarily linked to ENSO, such as oceanic-atmospheric cycles in
4. Freshwater
shortage
the Indian Ocean and Southern Atlantic, that signifi cantly aff ect the
5. Global
change
climate of the region (Clay et al. 2003). Changes in the rainfall patterns
ASSESSMENT
79
The concerns that are recommended for further analysis are:
I. Freshwater
Unsustainable exploitation of fi sh and other living resources and Habitat
shortage
and community modifi cation.
The linkages between the GIWA concerns are illustrated in Figure 23
below. All fi shes, but particularly the riverine, the potamodromous
III. Habitat
II. Pollution
and the stenotopic lacustrine species are vulnerable to changes in
modification
water quality (pollution), freshwater shortage and habitat degradation.
Pollution and unsustainable exploitation of living resources are linked
primarily via the eff ect of sediment blanketing and turbidity on fi sh
resources. Habitat modifi cation and unsustainable exploitation of living
IV. Unsustainable
resources are signifi cantly linked as degradation of habitat would also
exploitation of living
V. Global change
lead to declines in fi sh stocks and species loss.
resources
Not significant
Significant
Very significant
Figure 23 Linkages between GIWA concerns in Lake Malawi.
80
GIWA REGIONAL ASSESSMENT 47 EAST AFRICAN RIFT VALLEY LAKES
Causal chain analysis
This section aims to identify the root causes of the environmental
by Kenya, Uganda and Tanzania under the Convention of Fisheries. The
and socio-economic impacts resulting from those issues and
Lake Victoria fi ve-year GEF project was the fi rst of several intended
concerns that were prioritised during the assessment, so that
interventions over time (Duda 2002).
appropriate policy interventions can be developed and focused
where they will yield the greatest benefi ts for the region. In order
Given the intertwined diverse issues and complexities that have all
to achieve this aim, the analysis involves a step-by-step process
contributed to the environmental degradation of its Basin, as well as the
that identifi es the most important causal links between the
interventions that have been initiated in order to address and mitigate
environmental and socio-economic impacts, their immediate
the environmental degradation, the Lake Victoria Basin stands out as
causes, the human activities and economic sectors responsible
the prime choice for Causal chain and Policy options analyses. Because
and, fi nally, the root causes that determine the behaviour of those
of the similarity of environmental problems aff ecting the East African
sectors. The GIWA Causal chain analysis also recognises that,
Great Lakes, as well as similarities in the socio-political, economic and
within each region, there is often enormous variation in capacity
health status of the various riparian countries, the Lake Victoria Causal
and great social, cultural, political and environmental diversity.
chain and Policy options analyses that are presented in this report were
In order to ensure that the fi nal outcomes of the GIWA are viable
considered to be highly applicable to the rest of the region.
options for future remediation, the Causal chain analyses of the
GIWA adopt relatively simple and practical analytical models and
focus on specifi c sites within the region. For further details, please
refer to the chapter describing the GIWA methodology.
Methodology
Of the four transboundary lakes in the East African Rift Valley Lakes
The priority concerns established from the GIWA assessment that was
GIWA region that have been the subjects of this assessment, the Lake
carried out for Lake Victoria were Unsustainable exploitation of fi sh
Victoria Basin (LVB) faces the most complex social, economic, political
and other living resources and Pollution. The major environmental
and technical barriers (Duda 2002). The environmental degradation of
issues and their relative contributions (in % terms) to environmental
Lake Victoria Basin over the last three decades, due to unsustainable
degradation were also identifi ed from the assessment (Table 19 and
use of natural resources, massive algal blooms, water-borne diseases,
24). For Unsustainable exploitation of living resources, the priority
water hyacinth infestation, oxygen depletion, introduction of alien
issues that were identifi ed were overexploitation, and destructive
fi sh species etc., has been determined as placing a present value
fi shing practices. For Pollution, the priority issues that were identifi ed
of 270-520 million USD at risk to the lake communities if the large
were microbiological, eutrophication, chemical and suspended solids.
export fi shery for Nile perch is lost (World Bank 1996). Alarm over the
Given the complex interactions, synergistic and cumulative eff ects
accelerated degradation was the key driving force in the Lake Victoria
of the factors contributing to pollution, it is diffi
cult to clearly and
GEF project being approved in the mid-1990s as the then largest GEF
unambiguously isolate only one or two of the issues as predominantly
international waters project at 77 million USD (Duda 2002). At about the
causing pollution in Lake Victoria. All four issues identifi ed from the
same time, the Lake Victoria Fisheries Organisation (LVFO) was formed
assessment are considered in the Causal chain analysis, but the role
CAUSAL CHAIN ANALYSIS
81
of suspended solids as a pollutant is considered to be nested within
Table 19
Unsustainable exploitation of fi sh in Lake Victoria:
the other three issues, exacting a synergistic and cumulative eff ect on
percentage contribution of issues and immediate
causes of the impacts.
microbiological, eutrophication and chemical pollution.
Issue
% Immediate
cause
%
A detailed assessment was carried out in order to determine the
Increased effort
60
immediate causes, sectors/activities and root causes that related to
*Overexploitation
30
Technological change
40
the priority issues. The data assembled enabled the prioritising of the
Excessive by-catch and discards
20
immediate causes according to criteria such as: 1) the transboundary
Increased effort
40
nature; (2) the size of geographical area aff ected and whether it is
Rent-seeking behaviour
30
widespread or localised; (3) the number of people aff ected including
*Destructive fishing practices
30
their livelihoods and health; (4) the sectors that are aff ected and
Failure of monitoring and
30
enforcement mechanisms
the degree of impact; (5) community benefi ts derived from the
Decreased viability of stock through
10
environmental resources vis-Ó-vis costs of negative environmental
pollution and disease
impacts arising from the use of the resources; (6) the duration and
Impact on biological and genetic
10
diversity
degree of severity of the environmental impacts; (7) eff ectiveness of
*Issues considered relevant for Causal chain and Policy options analysis.
current structures, controls, institutions and legislation in minimising
negative environmental eff ects; and (8) synergistic and cumulative
Overexploitation
eff ects. Some of the hypotheses raised are provided in Annex III. More
Immediate causes
weight was given to issues for which there was recent and quantitative
Overexploitation is mainly due to increased eff ort (Figure 24). An
data than for those which are as yet poorly studied and lack quantitative
experimental trawl Catch Per Unit Eff ort (CPUE) shows a continuous
data.
and signifi cant decline since trawling research began in 1969 (Uganda):
CPUE in waters less than 30 m deep averaged 797 kg/hour during the
1961ş1971 surveys and declined to 115 kg/hour in the 1997ş1998 surveys
(Okaronon, 1999) (Figure 25). The apparent decline in fi sh stocks can only
Unsustainable exploitation of
partially be attributed to change in species composition, and diff erent
fish and other living resources
behaviour and possibly net avoidance of the species presently targeted
by the trawl (Okaronon 1999). The fi shing capacity in the Uganda sector
The important GIWA issues identifi ed for Unsustainable exploitation of
increased from about 3 200 fi shing canoes in 1972 to 8 000 by 1990 and
living resources were overexploitation and destructive fi shing practices
was estimated to be about 10 000 canoes in 1998 (Okaronon 1999).
(Table 19).
The number of fi shermen in Lake Victoria increased from 83 816 in
Issues
Immediate causes
Sectors/Activities
Root causes
Economic
Increased effort
Fisheries
Demographic
Governance
Overexploitation
Technological
Infrastructure provision
Technological change
Governance
Economic
Fisheries
Demographic
Increased effort
Governance
Destructive
Rent-seeking behaviour
Fisheries
Economic
fishing practices
Governance
Lack of effective
Economic
Fisheries
control mechanisms
Governance
Figure 24 Causal chain diagram illustrating the causal links for Unsustainable exploitation of fi sh and other living resources.
82
GIWA REGIONAL ASSESSMENT 47 EAST AFRICAN RIFT VALLEY LAKES
1990/1991 to 121 941 in 2000. In Kenya the fi shermen increased from
CPUE (kg/boat/day)
440
24 000 to 33 037, in Uganda the increase was from 30 000 to 32 461
Gill nets
400
while in Tanzania the fi shermen increased from 29 816 to 56 443 over
Long lines
360
the same period (Hoekstra et al. 1991, Asila 2001). The increases in the
Beach seines
320
Mosquito seines
number of fi shermen in Uganda (~8%) appear to be minimal compared
280
the increases in Tanzania (~90%) and Kenya (~38%).
240
200
For the 1990s, data on the fi shery yield for Uganda are fragmented, and
160
poor quality catch assessment data have prevented any evaluation of
120
trends in Tanzania (Bwathondi et al. 2001). The increase in fi shing eff ort
80
40
and investment (Uganda) was made without clear knowledge of the
0
magnitude and sustainability of the stocks (Okaronon 1999). Trends in
1989
1990
1991
1992
1993
1994
1995
1996
1997
1998
Year
fi sh landings in Kenyan waters of Lake Victoria (1976ş1988) show that
Figure 25 Trends in catch per unit eff ort for Nile perch in
landings reached a maximum of 200 000 tonnes per year in 1989ş1991
commercial fi sheries of Lake Victoria.
as Nile perch catches increased due to an expansion in stock size and
(Source: Okaronon 1999, Othina 1999 in Bwathondi et al. 2001)
increased fi shing eff ort (Othina 1999). CPUE peaked at 180 kg/boat/
day in 1989 and decreased thereafter with increasing eff ort (Othina
200
Lates niloticus
1999). With increased fi shing pressure, predation, and competition
160
Kenya
among species, the multispecies fi shery of Lake Victoria changed to
Tanzania
1000)
x 120
Uganda
only three species: Nile perch (Lates niloticus), the pelagic cyprinid-
onnes 80
dagaa (Rastrineobola argentea Pellegrin), and the introduced tilapia
(t
(Oreochromis niloticus L.) (Figure 26). By 1998, total Nile perch catches
40
were half those at the beginning of the decade despite increased eff ort,
Landings
0
and catches of Rastrineobola argentea have also levelled off despite
1976
1978
1980
1982
1984
1986
1988
1990
1992
1994
1996
1998
2000
Year
increased eff ort (Othina 1999).
120
Bottom trawl surveys in Kenyan waters of Lake Victoria (1997-1998)
Rastrineobola argentea
100
Kenya
revealed that areas with relatively consistent high catches extend from
Tanzania
80
1000)
west of Maboko Island up to Mbita Channel in the depth range of 5-
x
Uganda
60
22 m (Getabu and Nyaundi 1999). This area is outside major urban and
onnes
(t 40
riverine infl uence and is where most of the fi shing eff ort by artisanal
20
fi shermen is currently concentrated (Getabu and Nyaundi 1999).
Landings
0
Despite increased total fi shing eff ort, effi
ciency of fi shing gear and
1976
1978
1980
1982
1984
1986
1988
1990
1992
1994
1996
1998
2000
extension of fi shing grounds to maintain the yield, there has been a
Year
progressive decline in CPUE and mean size of fi sh caught (Ligtvoet &
Mkumbo 1992, Mkumbo & Cowx 1999). In all three countries, eff orts in
Tilapias
30
terms of boats and numbers of fi shermen have more than doubled in
Kenya
25
Tanzania
the past 10 years (Namisi 2001, Asila 2001). The unrestricted access status
1000)
x 20
Uganda
of the Lake and lack of enforcement of existing legislation is linked to
15
onnes
(t
increasing and crippling fi shing eff ort (Bwathondi et al. 2001).
10
5
Landings
Overexploitation is secondarily due to technological changes in the
0
1976
1978
1980
1982
1984
1986
1988
1990
1992
1994
1996
1998
2000
effi
ciency of fi shing gears, motorisation of canoes and increase in total
Year
fi shing eff ort to maintain production since the mid-1990s (Bwathondi et
Figure 26 Trends in landings of the major commercial fi sh species
al. 2001). Most of the region's factories suff er from fi sh supply problems,
in the riparian countries of Lake Victoria
(Source: Knaap et al. 2002)
attributed to low catches and competition with other fi sh factories
CAUSAL CHAIN ANALYSIS
83
(SEDAWOG 1999) and, in order to stay operational, they drive fi shermen
processing factories, whose capacity is about 120 000 tonnes per year
to catch more fi sh by supplying nets, outboard engines, etc.
(Table 21) versus the total landings for the Lake being in the region of
210 000 tonnes, is an important driver of exploitation of the fi shery. Nile
Sectors/activities
perch is purchased and processed mainly by the large-scale processors
Increased eff ort has been driven by a much greater demand for fi sh by
(Bwathondi et al. 2001).
recently established fi sh processing factories that have a large capacity
for processed products (Abila 2002). Nile perch fi sheries opened up
Of the factories currently operating in the region, the majority
greater employment opportunities, attracting more fi shers (artisanal
commenced operations after 1990, an indication of the region's relatively
to large-scale), more fi shing gear and vessels to access the resource,
recent entry into the global fi sh market (SEDAWOG 1999). Fifteen out of
and the establishment of fi sh fi lleting factories (Bwathondi et al.
25 factories surveyed in the region have been obliged to close down at
2001). Industrial fi sh processors in Uganda are presently the main link
least once during 1997/1998 to carry out modifi cations so as to comply
between the artisanal fi sherfolk and the overseas export markets; their
with EU import regulations (SEDAWOG 1999). Many of the fi sh processed
entry into the market has tended to stabilise and expand the market for
are small-sized because demand from export markets is for small fi llets,
the artisanal fi sherfolk while increasing their average earnings (Namisi
which are less fatty and portion-sized (Bwathondi et al. 2001).
2001). Dwindling fi sh stocks are necessitating increased eff ort in order
to maintain the same level of catch (Kulindwa 2001). In other words,
The establishment of the Dutch Government-sponsored Fish Meal
resource rents are being reduced over time until the increase in fi shing
Plant in Mwanza (Tanzania) in the 1970s contributed substantially to
eff ort will no longer be benefi cial.
the decline of the haplochromines in the Lake since the factory targeted
this fi sh group (Bwathondi et al. 2001). The decline of fi sh catches over
Technological change has come about mainly due to demand for higher
time has also necessitated the use of illegal degrading technologies in
fi sh catches to supply the fi sh processing factories and consequently the
order to catch more fi sh (Kulindwa 2001, Abila 2002).
huge export market (Table 20). A number of fi sh processing plants have
been constructed along the shores of the Lake, 11 of which are licensed
Root causes
to operate in the Uganda sector of the Lake (Odongkara & Okaronon
The high demand for processed fi sh products is driven mainly by the
1999), 12 in Kenya and 12 in Tanzania (Ntiba 2003). The large number of
large export market for Nile perch fi llets that emerged in the early
1990s (Kulindwa & Mbelle 2002, Kulindwa 2000, Abila 2002). Increasing
Table 20
Export quantities for Nile perch fi llets between 1988
population within the Basin, poor governance in the fi shing industry,
and 1999.
and the unrestricted access status of the Lake are secondary drivers
Kenya
Uganda
Tanzania
Year
(Table 22). The large export fi shery for the Nile perch is estimated at
(tonnes)
(tonnes)
(tonnes)
270-520 million USD (Duda 2002). Fishers annual incomes (per capita)
1988
ND
ND
37
are estimated as follows: Kenya, 3 269 USD; Tanzania, 2 294 USD; and
1989
ND
18 347
ND
Uganda, 1 157 USD (Bwathondi et al. 2001). The gap between the richest
1990
4 350
1 590
ND
and poorest fi shers in some beaches is widening, and the gap between
1991
6 364
4 751
ND
the benefi ts obtained from the fi shery by vessel owners and labouring
classes is also widening (Bwathondi et al., 2001). Due to high demand
1992
11 312
7 831
9 850
for Nile perch (both export and local markets), processors are providing
1993
8 189
6 337
6 123
loans to some fi shers who then repatriate the outlays through catches
1994
9 439
6 564
8 454
to the companies (SEDAWOG 1999, Bwathondi et al. 2001). The scarcity
1995
10 983
12 971
9 904
of fi sh has increased fi sh prices at the landing sites (Bwathondi et al.
2001). Thus rich fi rms are able to displace less rich processors, some of
1996
16 472
16 397
15 000
whom have been forced to close down: this has led to serious impacts
1997
11 167
9 839
ND
in the fi sheries sector and has intensifi ed the existing confl icts between
1998
10 126
13 755
ND
users (Yongo 2000). By-products from the factories are numerous and
1999
9 765
ND
ND
include skins, off -cuts (`chips'), swim bladders and carcasses (`frames').
Note: ND = No Data.
Swim bladders are the most valuable and are exported to the Far East
(Source: Fisheries Department 1950, Gibbon 1997, Department of Fisheries Kenya, Unpublished
LVFO data, from Bwathondi et al. 2001)
(SEDAWOG 1999).
84
GIWA REGIONAL ASSESSMENT 47 EAST AFRICAN RIFT VALLEY LAKES
Table 21
Capacity of fi sh processing factories, annual landings,
Eastern countries but also to Japan, Australia, North and South America
and maximum sustainable yield for the three riparian
(Bwathondi et al. 2001). The price ranges for fi sh products such as chilled
countries in 1999.
fi llets, frozen fi llets, portions, head-on gutted fi sh, head-off gutted fi sh
Maximum
Full capacity
Used capacity
Annual landings
Country
sustainable yield
and kosher products is 2-4.5 USD per kilo (SEDAWOG 1999).
(tonnes)
(%)
(tonnes)
(tonnes)
Kenya
35 260
49
64 000
39 200
Destructive fishing practices
Tanzania
104 520
69
95 000
98 500
Immediate causes
Uganda
74 100
45
72 632
75 500
(Source: Bwathondi et al. 2001)
Destructive fi shing practices are due mainly to increased eff ort (Figure 24,
Table 19). There has been a reduction in mesh size of nets used, and an
Table 22
Summary of the processes and actions behind the root
increased proportion of immature fi sh in the catches (Bwathondi et al.
causes of overexploitation of fi sh.
2001). Mesh sizes have progressively declined over the past 10 years
Root
Sectors/
Immediate
Remarks
causes
Activities
causes
with 24% of the nets (LVFO 2000, Kulindwa 2001) in Uganda now
1. Export markets. The processing industries are geared to
below the recommended mesh size of 5 inches (127 mm). More recent
export markets which have a high demand for fish and
beach surveys suggest that this is now as high as 50% (Muhoozi cited
fish by-products and at higher cost per kg than local
markets.
in Bwathondi 2001). In Kenya and Tanzania, 3 and 18%, respectively, of
i
c
2. Poverty. The rich (processing factories) provide loans to
o
m
Increased
Fisheries
the poor (artisanal fishers) to increase the catch for fish
the gillnets are below the legal mesh size limits (Bwathondi et al 2001).
o
n
effort
Ec
processing factories so that they can operate at optimal
Trends (1987ş1997) in percentage contribution by weight of the four
capacity to service the export markets.
3. Lack of alternative economic activities for sustenance
major fi shing gears to the Kenya Lake Victoria catches are as follows:
of livelihoods. Nile perch fishery opened up greater
employment opportunities.
mosquito seine landings increased from 25% of the total catch in 1987
1. In all three countries, efforts in terms of boats and
to 50-60% from 1994 to 1997 (Kenya); the gillnet contribution declined
numbers of fishermen have more than doubled in the
from over 50% to 20%; the long-line contribution declined from 10% to
Increased
past 10 years, partly as a result of demand from export
Fisheries
effort
markets, but also due to the very rapid population
5%; while the beach seine contribution has increased from 10% to 20%
Demographic
growth and consequently higher demand for fish food in
the region.
despite a ban on their use (Figure 27) (Othina 1999, Kulindwa 2001, Abila
1. The Lake has an unrestricted access status.
2002). Rent-seeking behaviour probably accounts for up to 20% of the
2. There are lack of rules and regulations, such as fishing
contribution to destructive fi shing practices. Beach seines and trawls,
quotas, to govern the fisheries sector.
Increased
3. Bans on certain types of fishing gears and trawlers have
Fisheries
10 of which were operating in Kenyan waters until recently (Njiru cited
effort
been imposed in all three countries but there is lack of
enforcement by government officials.
in Bwathondi et al. 2001), are banned gears in the Lake.
4. Lack of taxes or other form of finance to support
enforcement of regulations in fisheries sector
Reduced capacity to meet human needs can account for up to 40% of
1. Increased number of fish processing factories have been
v
e
rnance
established and licensed to operate without regard
the destructive fi shing practices. As traditional fi shing methods are now
Go
to sustainability of the fisheries resource (in all three
countries)
often considered inadequate for landing a suffi
cient catch, fi shermen
Infrastructure Technological
2. Operations and of fish processing factories have become
provision
change
more efficient to comply with EU import regulations.
3. Fish processing factories are located close to major
roads and airports, while motorised canoes and trawlers
100
reduce time taken to access fish landings and offload
fish.
90
Mosquito seine
1. Technological change (more fishing gear, vessels) is
80
Beach seine
t
c
h
driven mainly by demand for higher fish catches to
ca 70
Long line
supply the processing factories and consequently the
t
o
Technological
Gill net
o
l
o
g
i
c
a
l
Infrastructure
huge export market.
60
n
provision
change
c
h
2. Change in the efficiency of fishing gears, motorisation
Te
50
of canoes have contributed to the signs of decline of the
ntribution
Nile perch since the mid 1990s.
c
o 40
nt 30
r
c
e
e
P 20
The marketing of Lake Victoria's fi sh was localised within the riparian
10
states during the pre-Nile perch era, but as most fi sh fi lleting factories
0 87
88
89
90
91
92
93
94
95
96
97
Year
were established in the 1990s, both the regional and international
Figure 27 The percent contribution by weight of the four major
trade expanded (Bwathondi et al. 2001, Kulindwa 2001, Abila 2002).
fi shing gears to the Kenyan Lake Victoria catches.
The Nile perch is now sold not only to the traditional EU and Middle
(Source: Othina 1999)
CAUSAL CHAIN ANALYSIS
85
increasingly resort to deploying illegal fi shing gear such as cast nets,
Table 23
Summary of the processes and actions behind the root
fi sh poison and weirs to improve their catches (Ntiba 2003). Some of
causes of destructive fi shing practices.
Root
Sectors/
Immediate
the gears used to fi sh are fallouts from other sectors such as the fl ower
Remarks
causes
Activities cause
industry, where fi ne mesh nets that are used to protect fl owers from
1. Export markets. The high demand for fish and fish by-products
coupled with dwindling stocks of Nile perch, tilapia and
birds are now being used. In a 1999 LVRFP study of 1 066 fi shers in
haplochromines has led to destructive fishing practices (illegal
all three countries of the Lake, 33% of respondents linked declines in
fishing gear, poison, weirs and trawling) in order to, at least,
maintain the fish supply level.
the stock to the contravention of fi shing regulations, 32% felt this was
2. The reduction of taxes on all nets has resulted in more net
Increased
Fisheries
purchases.
due to excessive fi shing eff ort and 11% to pollution or the presence
effort
3. Increased competition for fish supply amongst fish processing
of water hyacinth (SEDAWOG 2000). In most cases, these reasons
factories.
4. Poverty. The rich (processing factories) provide loans to the
provided for catch declines indicate a widespread acknowledgement
poor (artisanal fishers) to increase the catch for fish processing
factories so that they can operate at optimal capacity to service
amongst the Lake's fi shing communities that eff ort levels are excessive,
i
c
the export markets.
o
m
that damaging fi shing techniques are in use and that regulations are
o
n
1. Some of the gear used to fish, i.e. fine mesh nets, are a fallout
Ec
from other sectors such as the flower industry.
generally ignored (Bwathondi et al. 2001).
Rent-
2. Theft (of fishing gears, vessels, etc.) and piracy are rampant on
Fisheries
seeking
the Lake, and may become worse as the disparity in distribution
behaviour
of benefits from the fishery becomes more polarised.
Sectors/activities
3. Greed- individual interests take precedence over community
interests.
Most of the region's factories suff er from fi sh supply problems,
1. As traditional fishing methods are now often considered
attributed to low catches and competition with other fi sh factories
Lack of
inadequate for landing a sufficient catch, fishermen
effective
increasingly resort to deploying illegal fishing gear such as cast
(SEDAWOG 1999). Due to the boom in the Nile perch export market,
Fisheries
control
nets, fish poison and weirs to improve their catches.
many more people who were never fi shermen moved to cash in on
mechanisms 2. Lack of resources in government to create new avenues for
employment and improve livelihoods.
the "lucrative" industry. This may have pushed traditional fi shermen to
1. The increase in population and increased settlements along
resort to the use of destructive fi shing methods to sustain their level
the lake shore has resulted in increased demand for fish
Increased
Fisheries
(particularly Tilapia) for local consumption, hence, for example,
of livelihood and food requirements. The use of poison, which led to
effort
continued use of beach seining that has been banned in all
three countries.
a ban on fi shing and the sale of fi sh in March 1999 (Ntiba 2003), was
Lack of
1. Entry of people from other sectors (e.g. horticultural) into the
probably largely due to rent-seekers. The remoteness of some of the
Demographic
effective
fisheries sector who do not heed the rules and regulations of
Fisheries
control
the fisheries sector.
landing sites and the inadequate transportation infrastructure impose
mechanisms 2. Political patronage.
severe constraints on the post-harvest sector of the Lake Victoria
1. The Lake has an unrestricted access status, and there is no
recognition of property rights and entitlements.
fi shery (Bwathondi et al. 2001). Handling facilities, ice plants, storage
2. There are lack of rules and regulations, such as fishing quotas,
facilities, sanitary conditions (including boats with containers) are either
to govern the fisheries sector.
3. There is weak regional integration and poorly co-ordinated and
lacking or inadequate at landing sites, contributing to poor fi sh quality
disparate legal and institutional arrangements governing the
Increased
fishing industry.
(Bwathondi et al. 2001).
Fisheries
effort
4. Bans on certain types of fishing gears, beach seining and
trawlers have been imposed in all three countries (1994-1996)
but there is lack of policing and enforcement by government
Root causes
officials.
5. There is a low level of civic education and awareness amongst
The reduction of taxes on all nets has resulted in more net purchases.
some of the fisher-folk on the mid- to long-term consequences
The increase in population has resulted in increased demand for fi sh
of destructive fishing methods.
1. The policy of free and unrestricted access to the Lake Victoria
(particularly tilapia) for local consumption. The unrestricted access
fisheries appears to be the major loophole that was exploited
v
e
rnance
status of the Lake and lack of enforcement of existing legislation is linked
by the rent-seekers.
Go
2. Corruption is rampant ş officials charged with monitoring and
to increasing and crippling fi shing eff ort (Bwathondi et al. 2001). There is
Rent-
enforcement of rules and regulations in the fisheries sector are
Fisheries
seeking
often bribed to overlook the contraventions.
also a lack of awareness amongst some of the fi sherfolk on the mid- to
behaviour
3. There is a lack of institutional and legal capacity to promote
long-term consequences of destructive fi shing methods. The policy of
compliance and enforce arrangements and policies.
4. There is inadequate integration of environmental
free and unrestricted access to the Lake Victoria fi sheries appears to be
considerations in planning and management.
5. Lack of stakeholder participation.
the major loophole that was exploited by the rent-seekers (Table 23).
1. Inadequate legal and judicial framework.
With the near disappearance of many food fi sh species (Mkumbo
Lack of
2. Lack of co-ordination and co-operation between all
effective
stakeholders in the fisheries sector.
1999) and signs of decline in Nile perch (Othina & Osewe-Odera cited
Fisheries
control
3. Inability of government and other stakeholders to control catch
in Mkumbo 1999), a number of management measures were eff ected,
mechanisms
and cost of fish.
4. Lack of incorporation of stakeholders when drafting legislation.
including a ban on beach seines and undersized mesh nets (<127 mm
stretched mesh) in 1994, and a ban on trawlers in 1996 (Mkumbo
86
GIWA REGIONAL ASSESSMENT 47 EAST AFRICAN RIFT VALLEY LAKES
1999). Failure in monitoring and enforcement of these bans is evident,
Microbiological
for example, beach seining in Kenyan waters continues despite its ban.
Four immediate causes have been linked to microbiological pollution,
Overfi shing and the use of damaging or illegal fi shing gear is only in
namely: municipal untreated sewage, run-off and stormwater, animal
part a refl ection of the failure of centralised management strategies
waste, and maritime transport waste (Figure 28). Of these immediate
on the Lake, and are symptomatic of broader social, economic and
causes, the two most important are municipal untreated sewage, and
developmental dislocations (Bwathondi et al. 2001) such as poverty
run-off and stormwater.
and lack of employment. Theft (of fi shing gears, vessels, etc.) and piracy
are rampant on the Lake, and may become worse as the disparity in
Immediate causes
distribution of benefi ts from the fi shery becomes more polarised
There are a number of human pathogens (e.g. Vibrio cholerae and
(Bwathondi et al. 2001).
Escherichia coli) that can remain viable in raw wastewater and sewage.
Direct discharges of municipal untreated effl
uent into rivers and the
Lake directly contribute to microbiological pollution. These have
contributed to the degradation of river and lake water quality for
Pollution
habitat and drinking use (Wandiga & Onyari 1987, Ntiba et al. 2001). The
low standards of health in the region are caused by a general lack of
The following pollution issues: microbiological, eutrophication, chemical
awareness in good hygiene practices, direct contamination of beach
and suspended solids, were identifi ed as being the most important
waters through bathing and washing, and uncontrolled waste disposal
(Table 24). It was noted that suspended solids are part and parcel of the
around the shoreline (Karanja 2002). Reduction of the Biological
factors that contribute to microbiological, eutrophication and chemical
Oxygen Demand (BOD) load of such effl
uent can signifi cantly reduce
pollution, and that their role is more important in its synergies with
the occurrence of water-borne diseases such as typhoid and cholera
the other three issues rather than on its own. Therefore, the issue
which are common in the Lake. Run-off and stormwater collect a lot
suspended solids is nested within microbiological, eutrophication and
of animal, plant and human waste from point and non-point sources
chemical pollution and is excluded from direct further analysis.
and channel these to rivers and the Lake. Animal waste directly
abets microbiological pollution of water by creating an environment
that supports microbiological pathogens, while harbour and bilge
Table 24
Pollution in Lake Victoria: percentage contribution of
discharges compound the microbiological pollution problem.
issues and immediate causes of the impacts.
Issue
% Immediate
cause
%
Sectors/activities
Animal waste
10
There are two major sectors from which the municipal untreated
Municipal untreated effluent
40
* Microbiological
20
effl
uent is derived, i.e., agro-industry and urbanisation. Beer brewing,
Run-off and stormwater
40
pulp and paper production, tanning, fi sh processing, agro-processing
Maritime transport waste
10
and abattoirs discharge raw/untreated waste to feeder rivers and lakes
Enhanced effluent discharge
30
(e.g. Wandiga & Onyari 1987, Ntiba et al. 2001). The annual population
*Eutrophication
20
Enhanced discharge of solids
10
growth is 2-4% in most parts of the Lake Basin but urban population
Run-off and stormwater
60
growth is over 5-10% per year in most of the larger towns (Scheren
Enhanced effluent discharge
40
et al. 2000). The number of people in urban population connected to
Enhanced discharge of solids
20
* Chemical
20
sewerage systems are as shown in Table 25 (Scheren et al. 2000).
Run-off and stormwater
20
Table 25
Number of people in urban populations connected to
Atmospheric deposition
20
sewerage systems in Lake Victoria Basin.
Habitat modification
40
Total population
Urban population (1 000 people)
Number of
*Suspended solids
20
Enhanced erosion of lake shore and river channels
30
(1 000 people)
towns
Connected
Not connected
Increased sediment deposition
30
Kenya
10 200
390
630
18
Solid wastes
10
Uganda
5 600
210
870
9
Tanzania
5 200
27
340
4
Thermal
0
Rwanda
5 900
ND
400
5
Radionuclide
0
Burundi
2 800
ND
140
4
Spills
10
Total
29 700
627
2 380
40
*Issues considered relevant for Causal chain and Policy option analysis.
Note: ND = No Data. (Source: Scheren et al. 2000)
CAUSAL CHAIN ANALYSIS
87
An assessment of BOD loading of Lake Victoria (corrected for purifi cation
5
Table 26
Summary of the processes and actions behind the root
in treatment plants, rivers and wetlands) shows that domestic pollution
causes of microbiological pollution.
accounts for most of the BOD load, with the contribution of industry
Root
Sectors/
Immediate
Remarks
causes
Activities
causes
(mainly from breweries, sugar cane factories and soap and oil factories)
i
c
being relatively low (Scheren et al. 2000). Kenya contributes a BOD load
Municipal
o
m
1. There is lack of economic incentives to encourage the
Agro-industry
untreated
o
n
industries to install clean technologies.
of 7 510 tonnes per year, Uganda contributes a BOD load of 4 540 tonnes
Ec
effluent
per year while Tanzania contributes a BOD load of 3 920 tonnes per
Municipal
1. Industries located within the municipalities have none,
Agro-industry
untreated
year (Scheren et al. 2000). 75% of the BOD load from Uganda originates
inadequate or dilapidated treatment facilities.
effluent
from Kampala, while in Kenya, 50% of the BOD load originates from
1. There are inadequate and dilapidated treatment
facilities in all three countries, so, for example, raw
Kisumu (Scheren et al. 2000). Water hyacinth infestations have also been
Municipal
untreated sewage is pumped directly into the Lake e.g.
reported to lower the water quality in Kenya, Uganda and Tanzania (in
Urbanisation
untreated
in Kisumu.
effluent
2. There is poor sanitation infrastructure and poor waste
terms of colour, pH, turbidity of water) and increase the treatment
l
f
f
o
r
d
a
b
i
l
i
t
y)
disposal facilities in all settlements around the entire
f
a
Lake.
costs, particularly associated with keeping the water intake points free
o
l
o
g
i
ca
n
Run-off and
o
t
i
o
n
o
Urbanisation
1. There is poor waste management in urban settlements.
of water hyacinth (Mailu 2001).
stormwater
T
e
ch
e n
h
1. Poor animal husbandry and land management results
Run-off and
Agro-industry
in animal wastes being discharged in raw form into the
stormwater
There are several sectors that contribute to microbiological pollution of
c
l
u
d
e
s t
waterways.
(
i
n
1. There is a lack of alternative energy sources, so
run-off and stormwater: these include the agriculture, urban, forestry
Run-off and
Forestry
deforestation takes place, and trees and bushes are cut
stormwater
and rural settlement sectors. Run-off and stormwater discharge are
down for woodfuel.
Rural
Run-off and
highest during the rainy seasons and consequent fl ooding is associated
1. Poor sanitation infrastructure.
settlements
stormwater
with increased incidence of water-related diseases.
Municipal
1. There is lack of compliance to operating standards in
Agro-industry
untreated
the industry.
effluent
g
a
l
There are two major sectors from which the animal waste is derived,
Le
Municipal
Urbanisation
untreated
1. Outdated and inadequate regulations.
i.e., agriculture (livestock) and wildlife. The large increase in livestock
effluent
populations are exemplifi ed in the trends for Nyanza province (Kenya),
Municipal
1. There is lack of monitoring and enforcement of
Agro-industry
untreated
existing legislation and regulations relating to effluent
where in 1968 there were 988 571 cattle compared to 1 620 146 in 1991
effluent
discharge from the industries.
(Kairu 2001). Within most of the communities, cattle are a source of
Municipal
1. There is lack of enforcement of regulations.
Urbanisation
untreated
wealth and status symbol so there is a tendency to keep large herds.
2. Poor urban planning.
effluent
Poor animal husbandry in cattle-keeping results in high animal waste
1. Poor urban planning.
v
e
rnance
Run-off and
Urbanisation
2. Lack of monitoring and enforcement of waste disposal
load that can be reduced by zero-grazing methods. There are few
Go
stormwater
regulations.
ranches in the Basin due to the tsetse fl y, and most of the herds are kept
Rural
Run-off and
1. Lack of monitoring and enforcement of waste disposal
Settlements
stormwater
regulations.
at subsistence levels following age-old traditions. Higher populations
Run-off and
1. Lack of monitoring and enforcement of regulations
Forestry
of wildlife during times of drought move towards watering points in
stormwater
governing the forestry sector.
the Basin, and there are also large hippo herds along the lake shore.
Municipal
2. Industries are located close to the lake shore,
Agro-industry
untreated
discharging raw and untreated effluents in all three
Increased trade in the Lake Basin region has led to increased maritime
effluent
countries.
raphic
1. High wildlife population close to or along the lake shore
transport, both human and in number of vessels plying the Lake, and
Geog
Run-off and
Wildlife
and generated waste leads to microbial contamination
stormwater
hence larger quantities of harbour and bilge discharges.
of the water.
Municipal
1. Increased rural-to-urban migration.
Urbanisation
untreated
2. High-density of human populations.
Root causes
effluent
1. High animal population in the Lake Victoria Basin
The treatment works in municipalities are either inadequate, using old
Run-off and
Agro-industry
generates a large amount of diffuse waste that finds its
stormwater
and obsolete technology, have ageing components, or have simply
way into the waterways and lake.
Demographic
1. High wildlife population in the Lake Victoria Basin
ground to a halt (Table 26). They have also not been able to expand to
Run-off and
Wildlife
generates a large amount of diffuse waste that finds its
stormwater
keep pace with the increasingly larger populations. The municipal by-
way into the waterways and lake.
laws, such as those of Kisumu City, did not predict the growth and type
t
a
l
Run-off and
1. El Ni˝o rains wash a lot of organic wastes into the
Urbanisation
e
n
stormwater
waterways and the Lake.
of industries existing today, and so there is no capacity to manage the
m
v
i
r
o
n
Run-off and
1. El Ni˝o rains wash a lot of organic wastes into the
waste from these industries. Industries fl out the by-laws and regulations
Agro-industry
En
stormwater
waterways and the Lake.
as there is no monitoring and enforcement mechanism. Poor planning,
88
GIWA REGIONAL ASSESSMENT 47 EAST AFRICAN RIFT VALLEY LAKES
Issues
Immediate causes
Sectors/Activities
Root causes
Economic
Municipal untreated
Technological
Agro-industry
Legal
effluent
Governance
Geographic
Urbanisation
Technological
Governance
Animal waste
Wildlife
Geographic
Technological
Microbiological
Technological
Maritime
Agriculture
Environmental
transport waste
Demographic
Urbanisation
Governance
Run-off and
Forestry
Governance
stormwater
Technological
Rural settlements
Economic
Industry
Geographic
Legal
Demographic
Enhanced
Governance
Urbanisation
Technological
effluent discharge
Wildlife
Geographic
Governance
Enhanced discharge
Eutrophication
Technological
of solids
Economic
Agriculture
Governance
Knowlegde
Demographic
Run-off and
Technological
Urbanisation
Governance
stormwater
Knowlegde
Knowlegde
Forestry
Governance
Economic
Agriculture
Technological
Economic
Enhanced
Industry
Legal
effluent discharge
Governance
Mining
Mining
Technological
Industry
Atmospheric deposition
Economic
Legal
Mining
Governance
Chemical
Technological
Agriculture
Legal
Knowlegde
Enhanced discharge
of solids
Health
Technological
Governance
Agriculture
Technological
Run-off and
Technological
Urbanisation
Governance
stormwater
Legal
Technological
Industry
Governance
Infrastructure provision
Technological
Technological
Economic
Habitat modification
Agriculture
Environmental
Knowledge
Governance
Urbanisation
Demographic
Governance
Increased sediment
Knowledge
Suspended solids
Forestry
Governance
deposition
Economic
Technological
Agriculture
Legal
Governance
Enhanced erosion
of lakeshore and
Urbanisation
Demographic
Governance
river channels
Knowledge
Governance
Forestry
Economic
Demographic
Figure 28 Causal chain diagram illustrating the causal links for Pollution
CAUSAL CHAIN ANALYSIS
89
maintenance and inadequate investment in municipality wastewater
treatment systems have contributed to the increased untreated effl
uent
450
400
discharge. If the present treatment plants in Kisumu would perform
100)
x
NTU
350
optimally, the BOD loads could be brought down by 50% (Scheren et al.
Nx100
(mg/l 300
2000). Water supply to both municipalities and villages is also aff ected
P
Px100
r
o 250
by water hyacinth: in municipalities, water hyacinth interferes with the
N 200
water intake points through blockage, which lowers the quantity of
(NTU), 150
water pumped. In Kisumu the water supply has dropped from 20 000 m3
y
100
to 10 000 m3 per day (Mailu 2001). This decline in water supply invariably
urbidit
50
T
causes more people to look for alternative, and often untreated, water
0
Nyando
Nzoia
Yala
Sondu
sources.
River
Figure 29 Comparison of turbidity, nitrogen and phosphorus
Flooding is common in the region, particularly around the lake shore,
levels of four Kenyan rivers, rainy season 2001.
during the rainy season and its impact is exacerbated by poor practices
(Source: Swallow et al. 2002)
when carrying out activities in the above sectors. Contamination of
The sediment load of the Nyando River, for example, has increased by
drinking water results from poor sanitation, hygiene and poor fl oodwater
7.5 times during the last 16 years, with turbidity measured at 527 NTU
management. For example, there were 14 275 cholera admissions in
in the rainy season 2001 (Figure 29) (Swallow et al. 2002).
Nyanza province (LVB Kenya) alone between June 1997 and March 1998,
with 547 deaths reported (Karanja 2002). One of the major risk factors
Habitat modifi cation through vegetation clearance for infrastructure
identifi ed for cholera among a sample of these patients was drinking
provision, agriculture, urban settlements and the use of various plants
water from Lake Victoria or a stream (Karanja 2002).
for building materials, furniture making and fuel wood, etc., exposes the
soil to erosion and defl ation, thus contributing to increased suspended
The gross discharge of animal wastes into rivers and the Lake results
solids. Enhanced erosion of the lake shore and river channels is also
from high livestock and wildlife populations within the Lake Victoria
directly contributing to increased suspended solids in the Lake. Soaps and
Basin, and poor animal husbandry and waste management. In Tanzania,
detergents that are being used within the Basin are outdated or banned
however, the government is encouraging villagers to plan their land use
and are contributing to eutrophication. Analysis of nutrients (nitrogen and
to control livestock and game. Transport-related pollution (harbour and
phosphorus) in the rainy season of 2001 in the Nyando, Sondu, Nzoia and
bilge discharges) are likely to become more important on the Lake as
Yala rivers indicates that continued addition of input of such high nutrient
trade increases in the region (Cohen et al. 1996).
concentrations into the Winam Gulf will seriously aff ect aquatic systems
and water quality (Figure 29) (Swallow et al. 2002). Nutrient loads to the
Eutrophication (and sedimentation)
Lake are associated mainly with atmospheric deposition and land run-off ,
Three immediate causes are identifi ed for eutrophication; enhanced
together accounting for about 90% of the phosphorus and 94% of the
effl
uent discharge, run-off and stormwater, and enhanced discharge
nitrogen input into the Lake (Scheren et al. 2000).
of solids (Figure 28). Enhanced effl
uent discharge, and run-off and
stormwater are the most important immediate causes of eutrophication.
Sectors/activities
The enhanced discharge of solids is largely a component of increased
The changes from small-scale to large-scale industrial production and
run-off and stormwater to the Lake and is therefore nested in this
from small to large farms have all contributed to enhanced effl
uent
immediate cause.
discharge. The acreage under cultivation for cash and food crops
(namely tea, tobacco, rice, beans, coff ee and sugar cane) in the Nyanza
Immediate causes
province, for example, has increased from about 15 400 ha in 1968 to
Analysis of sediment cores from the Lake show an increasing rate of
157 000 ha in 1991/1992 (Kairu 2001). The agricultural characteristics for
sedimentation over the past 150 years (Swallow et al. 2002, Verschuren
the Lake Victoria Basin as a whole are as shown in Table 27.
et al. 2002). There are many densely cultivated areas in the Lake Victoria
Basin, especially in Kenya, Rwanda and Burundi (Scheren et al. 2000).
Increased rates of urbanisation and agriculture in the region have
Some rivers, such as the Sio, Nzoia, Yala, Sondu, Nyando and Kuja in the
increased the per capita demand for land (Kairu 2001), and hence
Lake Victoria Basin (Kenya) drain highly productive agricultural areas.
more land is cleared to create the additional space required for these
90
GIWA REGIONAL ASSESSMENT 47 EAST AFRICAN RIFT VALLEY LAKES
Table 27
Agricultural characteristics of Lake Victoria Basin.
Table 28
Summary of the processes and actions behind the root
causes of eutrophication (and sedimentation).
Catchment land area (1 000 ha)
Country
Sectors/
Immediate
Cultivated
Non-cultivated
Total
Root causes
Remarks
Activities
causes
Kenya
1 470
3 400
4 870
1. There is increasing growth in industries that
Enhanced
Industry
generate effluents.
Uganda
1 400
2 100
3 500
effluent
Urbanisation
2. There are lack of economic incentives to encourage
i
c
discharge
the industries to install clean technologies.
Tanzania
1 500
5 540
7 040
o
m
o
n
Run-off and
1. There are lack of economic incentives to encourage
Rwanda
930
1 130
2 060
Ec
Agriculture
stormwater
proper management of farms etc.
Burundi
670
640
1 310
Run-off and
1. Poverty is driving people to cut down vegetation
Forestry
stormwater
cover for fuel wood, timber etc.
Total
5 970
12 810
18 780
f
1. There is a lack of clean technologies, e.g. recycling.
Enhanced
(Source: Scheren et al. 2000)
Industry
2. Poor sanitation.
l
effluent
y
)
Urbanisation
3. Use of inappropriate or obsolete technology.
o
t
i
o
n
o
discharge
e n
4. Inadequate treatment facilities.
o
l
o
g
i
ca
h
sectors. There is, for example, large-scale draining of the Yala swamp
n
d
abilit
Run-off and
1. There are poor or no waste disposal facilities.
for
Urbanisation
stormwater
2. There is poor waste management.
(LVB Kenya) to create land for agriculture and settlement (Grabowsky &
T
e
ch
af
c
l
u
d
e
s t
(
i
n
Run-off and
1. Poor agricultural practices.
Agriculture
Poort 1987). Clearing of riparian vegetation has led to erosion and loss of
stormwater
2. Use of agro-chemicals.
vegetation that acted as fi lters (Lowe-McConnell 1994), while nutrient-
Enhanced
1. There is lack of compliance to regulations in the
g
a
l
Industry
effluent
industries.
Le
Urbanisation
rich sediments from agricultural run-off and also low-lying, deforested
discharge
2. Poor standards that need to be updated.
riparian zones and other areas surrounding the Lake contribute to
1. There is lack of monitoring and enforcement of
Enhanced
Industry
existing legislation and regulations relating to
effluent
eutrophication, and feed the carpets of water hyacinth (Wilson et al.
Urbanisation
effluent discharge from the industries and urban
discharge
settlements.
1999). During the process of the expansion and growth of agriculture,
Run-off and
1. Government failure in provision of waste disposal
Urbanisation
some wetlands have been drained (Kairu 2001, Gichuki 2003), leading
stormwater
facilities.
v
e
rnance
1. No enforcement of regulations.
to increased sediment deposition in the rivers and lake. The degree to
Go
Run-off and
Agriculture
2. Lack of integrated knowledge and policy
stormwater
which urban run-off and solid wastes contribute to suspended solids
implementation (internal/external).
Run-off and
1. Lack of monitoring and enforcement of regulations
load has not been assessed (Ntiba 2003).
Forestry
stormwater
governing the forestry sector.
Enhanced
1. Industries are located close to the lake shore,
Industry
effluent
discharging raw and untreated effluents in all three
Root causes
Urbanisation
raphic
discharge
countries.
There has been a lack of monitoring and enforcement of regulations
Geog
Run-off and
1. High wildlife population generating unmanaged
Wildlife
stormwater
waste.
(Table 28). Those industries that have tried to install recycling facilities
Enhanced
in urban areas have not had support from the regulating authorities.
Urbanisation
effluent
1. Increasing populations in urban areas.
discharge
The food and cash crops grown on wetlands require the application of
1. High livestock population in the Lake Victoria Basin
fertilisers and pesticides (Kairu 2001). Unsustainable land use practices
Run-off and
generates a large amount of diffuse waste that finds
Agriculture
stormwater
its way into the waterways and lake.
lead to increased soil erosion and nutrient land run-off (Scheren et al.
2. Overstocking and over-grazing.
Demographic
2000). The high atmospheric nutrient loads are attributed to forest
1. High wildlife population in the Lake Victoria Basin
Run-off and
generates a large amount of diffuse waste that finds
burning and increased dust due to soil erosion (Bootsma & Hecky
Wildlife
stormwater
its way into the waterways and lake.
1993). Sand harvesting activity is mainly performed 5-10 km away from
2. Overstocking and over-grazing.
1. Lack of information, training and education, leading
the Lake, particularly in Winam and Ahero Divisions (LVB Kenya), but
to over-grazing and overstocking.
some sand harvesting is undertaken right on the shores of the Lake
Run-off and
2. Inadequate access to technical and scientific
Agriculture
stormwater
information.
(Kairu 2001). This activity increases sediment mobility, and also results
ledge
3. Inadequate scientific understanding, e.g. replacement
w
of traditional crops with commercial crops.
in physical alteration and destruction of the environment.
Kno
1. Lack of information, training and education e.g. on
Run-off and
soil conservation.
Forestry
stormwater
2. Inadequate scientific understanding at the local
An important source of income is papyrus harvested for thatching
level.
houses and the making of mats, baskets, furniture (chairs), fi shing
fl oats, rafts, etc., while both shrubs and papyrus are used for wood
fuel (Kairu 2001). There are farms, roads, fi shing camps and housing
Chemical pollution
developments close to or on the wetlands (Kairu 2001). Soil erosion in
The identifi ed immediate causes for chemical pollution are: enhanced
the wetlands is generally connected with cultivation, but specifi cally to
effl
uent discharge, enhanced discharge of solids, run-off and stormwater,
farming methods and management (Kairu 2001).
and atmospheric deposition (Figure 28). The latter is currently the least
CAUSAL CHAIN ANALYSIS
91
important but, in terms of supply of nutrients such as nitrogen and
Table 29
Summary of the processes and actions behind the root
phosphorus, it may become increasingly important as land use in the
causes of chemical pollution.
Root
Sector/
Immediate
Basin and outside cumulatively reduces the vegetation cover, thus
Remarks
causes Activities
causes
increasing the atmospheric load of fi ne particulate matter.
1. There is increasing growth in industries that generate
Agriculture
Enhanced
effluents.
Industry
effluent
2. There are lack of economic incentives to encourage the
i
c
C
Mining
discharge
Immediate causes
industries to install clean technologies.
o
m
o
n
1. There is increasing growth in industries that generate
Enhanced chemical effl
uent discharges go directly into the rivers and the
Ec
Enhanced
Industry
effluents.
discharge of
Lake. Agro-chemicals used in agriculture contaminate the rivers and the
Mining
1. There are lack of economic incentives to encourage the
solids
industries to install clean technologies.
Lake. Leachates from mining tailings that are close to the rivers or the lake
Agriculture
Enhanced
1. There is a lack of clean technologies.
shore, industrial wastes such as barley waste and chemicals are dumped
Industry
effluent
2. Use of inappropriate, dilapidated or obsolete technology.
Mining
discharge
3. Inadequate treatment facilities.
into the Lake in a non-regulated manner. There is also disposal of expired
1. There is a lack of clean technologies.
pesticides, medical waste, petrol station wastes, bunkering wastes, etc.
2. Use of inappropriate, dilapidated or obsolete technology.
Agriculture
Enhanced
3. Inadequate or lack of treatment facilities.
Industry
Some companies have stockpiles of banned substances such as DDT.
discharge of
4. There are poor or no waste disposal facilities, e.g. lack
o
l
o
g
i
c
a
l
Mining
n
solids
of proper disposal of food processing waste and lack of
c
h
Health
scientifically acceptable waste disposal from medical
Te
Sectors/activities
institutions.
Run-off and
Most industry is located in the larger towns bordering the Lake;
Agriculture
1. Use of agro-chemicals.
stormwater
Kampala and Jinja in Uganda, Mwanza and Musoma in Tanzania, and
Run-off and
Urbanisation
1. Lack of stormwater drainages.
stormwater
Kisumu in Kenya, with the exception of the large sugar factories in
1. Lack of compliance to regulations, e.g. improper disposal
Kenya located at some distance from the Lake (Scheren et al. 2000).
Agriculture
Enhanced
of chemicals used.
Industry
effluent
2. Non-regulation of the use of chemicals e.g. pesticides and
Small-scale mining is increasing in parts of the Tanzanian catchment,
Mining
discharge
fertiliser in the agriculture industry.
leading to contamination of the waterways by mercury. There is a lack
3. Poor standards that need to be updated.
g
a
l
1. Lack of compliance to regulations, e.g. improper disposal
of incorporation of clean technologies in the industrial sector. For
Le
Agriculture
Enhanced
of chemicals used.
example, Panpaper Limited in Kenya (discharging into Nzoia River)
Industry
discharge of
2. Non-regulation of the use of chemicals e.g. pesticides and
Mining
solids
fertiliser in the agriculture industry.
could use an extra processing step of scrubbing technology to reduce
3. Poor standards that need to be updated.
Run-off and
SO and produce sulphuric acid (added value product). Used chlorine
Urbanisation
1. Lack of compliance to building codes.
2
stormwater
has been dumped into the Lake killing a lot of aquatic organisms. In
Agriculture
Enhanced
1. There is lack of monitoring and enforcement of existing
Industry
effluent
legislation and regulations relating to effluent discharge
Uganda for example, expired chemicals as well as drugs and partially
Mining
discharge
from the industries.
treated domestic sewage from Kampala area is dumped into public
Agriculture
Enhanced
1. There is lack of monitoring and enforcement of existing
Industry
waterways, which fi nally end up in Lake Victoria (Kiremire 1997).
discharge of
legislation and regulations relating to discharge of solids
Mining
v
e
rnance
solids
from the industries.
Health
Go
1. Poor waste management in industry and urban areas.
The use of agro-chemicals is increasing in the Lake Basin where
Industry
Run-off and
2. Poor urban planning.
there are large-scale farms of coff ee, tea, cotton, rice maize, sugar
Urbanisation
stormwater
3. Lack of monitoring and enforcement of regulations in
planning, design and structures development.
and tobacco (Ntiba et al. 2001). The food and cash crops grown on
Agriculture
1. Most of these industries are located close to rivers, and
Enhanced
wetlands require the application of fertilisers and pesticides (Kairu 2001).
Industry
empty their waste into these rivers. Some are located
effluent
Mining
along the Lake shoreline and discharge the waste directly
Much of Ugandan industrial effl
uents drain through wetlands before
discharge
Health
into the Lake.
reaching the Lake surface water (Scheren et al. 2000). The urban and
Agriculture
1. Most of these industries are located close to rivers, and
Enhanced
raphic
Industry
empty their waste into these rivers. Some are located
peri-urban growth is rapid and largely unplanned; many buildings are
discharge of
Mining
along the Lake shoreline and discharge the waste directly
solids
Geog
Health
into the Lake.
erected without authorisation, run-off rates are increased due to lack
Agriculture
1. Most of these industries are located close to rivers, and
of stormwater drainages to handle urban run-off , and proper waste
Industry
Run-off and
empty their waste into these rivers. Some are located
Mining
stormwater
along the Lake shoreline and discharge the waste directly
disposal is poorly or not at all co-ordinated by municipal authorities.
Health
into the Lake.
Most of the poorly disposed urban wastes are then washed into water
Enhanced
1. Lack of information, training and education, leading to
courses and eventually reach the Lake.
ledge
w
Agriculture
discharge of
misuse of pesticides and fertilisers.
Kno
solids
Root causes
In Tanzania and Uganda the industrial wastewater treatment facilities
are generally absent, but in Kenya a majority of factories operate a
92
GIWA REGIONAL ASSESSMENT 47 EAST AFRICAN RIFT VALLEY LAKES
treatment plant (Scheren et al. 2000). Some recent studies have shown
Summary of the analysis
that fi sh in Lake Victoria contain varying levels of organochlorine
pesticide residues (Mitema & Gitau 1990), refl ecting the transport of
Although there are a large number of root causes identifi ed in the
agro-chemical residues from farms within the catchment, through rivers
Causal chain analysis, the specifi c factors relating to the various root
to the Lake. Only a minority of industries are connected to an urban
causes are to a large extent similar and converge into only a few issues.
sewerage system (Scheren et al. 2000). Growth in industries has taken
These include: export markets for the fi sheries; improvements in fi sh
place against a backdrop of no infrastructure development for disposal
handling capacities and technologies used in the fi sheries industry;
of effl
uents. The currently existing sewage infrastructure has not been
the unrestricted access status of the Lake; lack of fi shing quotas; lack
expanded or improved for decades. However, some of the industries
of compliance to and enforcement of regulations and legislation
are being allowed to establish their operations in areas that have been
governing the industries; weak regional integration of legal, institutional
designated as "non-industrial", so they lack the infrastructure to handle
and implementing mechanisms; lack of involvement of stakeholders
their waste products. There is no enforcement of existing regulations
in decision-making processes; a low level of civic education and
regarding chemicals use and their disposal, and the current legislations
awareness at all levels; corruption; lack of cross-sectoral harmonisation
are out-dated and in need of revision (Table 29). Lack of monitoring and
of legislation in closely related industries; poor urban planning; use of
poor scientifi c knowledge has led to the use of inappropriate or obsolete
old, dilapidated and inappropriate technologies; poor maintenance of
technologies to the detriment of the environment. The governments of
treatment plants; lack of waste treatment and disposal mechanisms;
the three riparian countries have taken no deliberate actions to put in
poor agricultural/land use practices; poor standards for industrial
capital resources to meet economic development needs.
operations; lack of incentives to industry to engage clean technologies;
government failure in service provision; and, in most sectors, lack of
resources and will on the part of the governments to mitigate the
environmental problems.
CAUSAL CHAIN ANALYSIS
93
Policy options
This section aims to identify feasible policy options that target
microbiological, eutrophication, chemical and suspended solids, but
key components identifi ed in the Causal chain analysis in order
the latter has been integrated into the former three issues.
to minimise future impacts on the transboundary aquatic
environment. Recommended policy options were identifi ed
In the Causal chain analysis, the root cause of Unsustainable exploitation
through a pragmatic process that evaluated a wide range of
of fi sh resources was identifi ed as the existence of a market for fi sh,
potential policy options proposed by regional experts and
both domestic and, more importantly, export. This is not to say that
key political actors according to a number of criteria that were
the market is undesirable, but that it should be regulated. Other root
appropriate for the institutional context, such as political
causes are inadequate regulation, poverty, poor institutional and legal
and social acceptability, costs and benefi ts and capacity for
arrangements, low civic education and awareness, low management
implementation. The policy options presented in the report
capacity by communities, availability of market for undersized fi sh,
require additional detailed analysis that is beyond the scope
and corruption. Whereas these root causes lead to unsustainable
of the GIWA and, as a consequence, they are not formal
exploitation practices for subsistence fi shing, in most cases profi t is the
recommendations to governments but rather contributions to
main factor driving the process. This prompts people to even indulge
broader policy processes in the region.
in rent-seeking behaviour for short-term gain regardless of future
outcome. As a result of these mainly illegal practices, individuals and
governments end up losing out on income and revenue, respectively.
The EU export ban is a relevant case in point where fi sh contamination
Problem definition
as a result of using poison for fi shing resulted in a boycott of fi sh from
Lake Victoria by the EU in 1999. The environmental degradation of the
Lake Victoria is an international water body that off ers the riparian
Lake Victoria Basin over the last three decades (due to high population,
communities several environmental services. Over the past three
massive algal blooms, water-borne diseases, water hyacinth infestation,
decades or so, the Lake has come under increasing and considerable
oxygen depletion, introduction of alien fi sh species etc.) has been
pressure from a variety of inter-linked human activities such as
determined as placing a present value of 270ş520 million USD at risk to
overfi shing, species introductions, industrial pollution, eutrophication,
the lake communities, if the large export fi shery for Nile perch was lost
and sedimentation. The waters of Lake Victoria and its shoreline are
(World Bank 1996). The collapse of the Nile perch fi shery may become
shared between three countries; Kenya (6%), Uganda (43%), and
a reality sooner rather than later in the event that things are left in a
Tanzania (51%). Additionally, the catchment of the principal affl
uent
"business as usual" scenario. However, many of these concerns are
river, the Kagera, runs through the countries of Rwanda and Burundi.
being addressed through a 30 million EUR grant, from the European
The two GIWA concerns that are addressed for Lake Victoria are:
Union to the East African Community States, being implemented by
Unsustainable exploitation of fi sh and other living resources, and
the Secretariat of the Lake Victoria Fisheries Organization.
Pollution. Under the fi rst concern, the two important issues that were
identifi ed were overexploitation and destructive fi shing practices.
Sources and causes of pollution in Lake Victoria have also been
Under the concern Pollution, the important issues identifi ed were
discussed in the Causal chain analysis. Four types of pollution issues
94
GIWA REGIONAL ASSESSMENT 47 EAST AFRICAN RIFT VALLEY LAKES
have been identifi ed: microbiological, eutrophication, chemical and
When developing the Policy options for Lake Victoria, a multitude of
suspended solids. All these emanate from the catchment areas in
options were discussed and evaluated. Tables 30 and 31 present the
both urban and rural settings. The role of the Kagera River as a main
various Policy options that were considered for mitigating the identifi ed
contributor of suspended solids, nutrients and water hyacinth is an
problems in the Lake Basin.
extremely important consideration when evaluating policy options
for sustainable management of the Lake. Untreated industrial and
Political and organisational frameworks
municipal effl
uent together with agricultural run-off are the main
The feasibility of policy options in Lake Victoria is looked upon in
contributors of microbiological and chemical pollution and are a
conjunction with the establishment of the regional integration of
source of nutrients contributing to eutrophication, while suspended
the East African Community (EAC 2001). The East African Community
solids are derived from erosion of degraded catchments, riverbanks
off ers a good prospect for the success of the policies, which have been
and lake-edge environments due to poor agricultural practices and
proposed here, in that it provides a conducive environment for Kenya,
high grazing intensities. All these contaminants make the Lake water
Uganda and Tanzania to work together towards common goals. It thus
unfi t for recreation (swimming), consumption and other uses unless
provides a good framework for policy harmonisation and closer co-
a huge processing cost is incurred. Pollution destroys habitat for
operation in overseeing closer and eff ective implementation of activities
freshwater life forms while at the same time making them unavailable
collectively agreed upon. Article 112 in the East African Community
for nutritional purposes. For the majority of people living by the lake
Treaty (EAC 2001) lists areas of agreement in the management of the
shore and subsisting by fi shing, this implies that malnutrition and health
environment as follows:
problems will entrench themselves and exacerbate the deepening
The development of a common environmental management
poverty among their ranks.
policy;
Table 30
Policy options analysis matrix: overexploitation and destructive fi shing issues.
Issue
Root cause
Policy options
Effectiveness
Efficiency
Equity
Political feasibility
Implementation capacity
High
Moderate
Moderate
Quota for fisheries
High
Moderate
All stakeholders to benefit
Existence of political will Existing capacity could be boosted
(in order to restrict effort).
Existence of BMUs.
Community participation.
Availability/access
intergenerational.
in EAC.
with new programmes.
to markets for fish.
High
Low
Moderate
High
High
Quota for processing.
Restriction of demand
Structure of fish supply left
Existence of political will
Few processing plants.
Existing national fisheries offices.
hence supply.
intact.
in EAC.
Review of the rules and
High
High
High
regulations and existing
High
High
Some of the regulations Will address present and
Policies and rules geared
fisheries policies.
Existence of political will National fisheries departments
erexploitation
and penalties are
future environmental and towards safeguarding the
Political will to implement rules
in EAC.
with EAC secretariat.
Ov
inadequate.
social needs.
sustainability of fisheries.
and regulations.
Governance
High
Civic education and awareness.
Will enhance
High
High
Moderate
Moderate
Incorporation of environmental compliance and
Enhanced awareness of rights EAC framework
NGOs and government
Cost of training high.
education in school curricula.
community co-
and obligations.
facilitates.
departments exist.
operation.
Moderate
Moderate
Poor institutional
Moderate
Strengthening monitoring and
High
High set-up cost
High
Cost element should be solved
and legal
Exists under EAC
enforcement of restrictions.
Curb illegal gear use.
for monitoring and
Involves all beneficiaries.
by involving communities under
arrangements.
initiative.
enforcement.
co-management.
High
Moderate
High
High
Safeguarding values
High
Fight against corruption Existing police and legal
Corruption
Enforce rule of law.
Reduced illegal
of resources and
Fairness in access to resources is a priority by all three authorities and the community at
activities.
enhancement of
enhanced.
tices
EAC governments.
large in all three EAC countries.
sustainability.
prac
Low civic education
High
Provide civic education and
and awareness and
Will enhance
High
High
Moderate
i
shing
awareness, empower and
Moderate
e
f
low management
compliance and
Enhanced awareness of rights EAC framework
NGOs and government
involve more communities in
Cost of training high.
capacity by
community co-
and obligations.
facilitates.
departments exist.
management.
communities
operation.
t
r
u
c
t
iv
Des
Moderate
Availability of
High
Impose slot size restrictions on
Maybe jeopardised
High
Moderate
markets for
Moderate
Sustainability of fishery
the fish processing factories.
by unscrupulous civil
Everyone wins in the long run.
Cost of monitoring high.
undersized fish.
at stake.
servants.
High
Moderate
High
High
Moderate
Provision of credit to artisan
Most people in need of
Poverty
Improved methods of
Enable poor to exploit
Included in national
NGOs, relevant government
fishers.
credit do not access it
fishing.
economic opportunities.
development policies
departments programs.
presently.
POLICY OPTIONS
95
The development of special environmental management strategies;
is bound to facilitate a greater co-ordination and success in conserving
Taking measures to control transboundary air, land and water
the natural environment while benefi ting from it.
pollution arising from developmental activities;
Integrating environmental management and conservation
A lot of work has been done on sustainable development in the Lake
measures in all development activities.
Victoria Basin, which has been designated as a regional economic
growth zone to be exploited jointly to maximise economic and social
The Treaty further spells out the Partner States' intention in the
benefi ts while ensuring eff ective environmental management and
management of natural resources: conserve natural resources; co-
protection (EAC 2001:40). Amongst these areas of cooperation are:
operate in the management of natural resources for the conservation
(a) The implementation of the Fisheries Management Plan for Lake
of the eco-systems and the arrest of environmental degradation; and
Victoria through the Lake Victoria Fisheries Organisation (LVFO) by
adopt common regulations for the protection of shared aquatic and
a grant to the East African Community States from the European
terrestrial resources (in Article 114).
Union;
(b) Establishment of the Lake Victoria Fisheries Organisation Secretariat,
Due to the recognition of the inevitability of negative impact on the
an information clearing-house for fi sheries related information on
environment and natural resources depletion arising from development
Lake Victoria;
activities, the Treaty further highlights areas of co-operation in its
(c) Review of a study report on the Economic Potential and Constraints
chapter 19, Article 111, as to:
for Sustainable Development of Lake Victoria Basin as an Economic
(a) Foster cooperation in the joint and effi
cient management and
Growth Zone;
sustainable utilisation of natural resources;
(d) Extension of Lake Victoria Environmental Management Programme
(b) Co-operate and co-ordinate policies and actions for the protection
(LVEMP) for Tanzania and Uganda, while Kenya has applied for a 2-
and conservation of the natural resources and environment against
year extension from the World Bank.
all forms of degradation arising from developmental activities;
(c) Adopt common policies for control of transboundary movement
Reports on progress and achievements of LVEMP, since its inception,
of toxic and hazardous waste including nuclear materials and any
show that work on various issues pertaining to the environment and
other undesirable materials;
natural resources is continuing. Some of the ongoing work includes:
(d) Provide timely and relevant information on natural and human
i. Treatment of plastic materials with special emphasis on
activities that may or are likely to have signifi cant transboundary
polyethylene materials. A study is to be conducted;
environmental impact, and consultation at an early stage;
ii. Development of a shared EAC Water Vision, Common Water Policy
(e) Develop and promote capacity building programmes for a
and Comprehensive Development Strategy;
sustainable management of natural resources.
iii. Implementation of the Lake Victoria Development Programme
through the establishment of a Sectoral Council. The Committee
The above actions, which have been agreed by the community
on the Lake Victoria Development Programme also recommended
member states, aim to:
that ways should be explored to ensure that the next phases of the
(a) Process, protect and enhance quality of the environment;
LVEMP are funded on a grant basis, since most of the programmes
(b) Contribute towards sustainability of the environment;
are of a biodiversity nature with global benefi ts;
(c) Ensure sustainable utilisation of natural resources such as lakes,
iv. Apart from emphasising the enforcement of slot size prohibiting
wetlands, forests and other aquatic and terrestrial ecosystems;
processing of fi sh less than 50 cm or greater than 85 cm for Nile
(d) Jointly develop and adopt water resources conservation and
perch harvesting, the Lake Victoria Fisheries Organisation (LVFO)
management policies that ensure sustainability and preservation
has been urged to initiate the patenting of the Victoria Perch by
of ecosystems.
the EAC, Council of Ministers of the LVFO;
v. Other measures of practical nature which have been discussed
In Article 112, the Partner States further agree to, "integrate
include establishing a proper monitoring, control and surveillance
environmental management and conservation measures in all
(MCS) mechanism, issuing of seizure forms for confi scated items
developmental activities such as trade, transport, agriculture, industrial
and offi
cial receipts for any fi nes, the use of courts of law for culprits
development, mining and tourism in the community". This agreement is
and the sharing of this information with Partner states, etc., and a
crucial to the integrity of the natural environment of member states and
strong condemnation of fi sh smuggling.
96
GIWA REGIONAL ASSESSMENT 47 EAST AFRICAN RIFT VALLEY LAKES
The above are only some of the developments taking place in the EAC
will fi ght against it if they are not well informed of its benefi t, namely, the
co-operation on environment and natural resources management.
sustainability of the fi shery. Some business people, however, may not
There has been good progress in the implementation of the decisions
be interested in sustainability, but would want to reap the highest profi t
taken by the Council although there are funding problems. During
allowed by the market. As long as their market exists, they may continue
the year 2002, the Lake Victoria Development Programme (LVDP) put
to provide eff ective demand to fi shers by buying what is available in
emphasis on activities, which lead to strengthening and consolidating
the market. This implies that quota for fi shing should be combined
its role in promoting, coordinating and harmonising the various
with other policy options such as quota for processing to make the
programmes and projects in the Lake Victoria Basin. The LVDP has
market conditions binding. The sustainability of fi shery means that the
already established and operationalised National Focal Points in the
presently threatened livelihood of the majority of the riparian people
Partner States' Ministries responsible for Lake Victoria development.
would be assured. The implementation cost for this policy option
These Ministries include the Ministry of Environment and Natural
is large considering aspects such as monitoring and enforcement.
Resources in Kenya, the Ministry of Water Livestock Development
However, it need not be an obstacle if communities are involved in a
in Tanzania and the Ministry of Foreign Aff airs in Uganda. Other
participatory manner. The communities, properly empowered through
achievements include studies conducted to form a basis for objective
co-management, will absorb most of these costs.
decisions on environmental and natural resources management in the
implementation of the Treaty. The implication for East Africa is that
Option 2: Quota for processing
the feasibility of policy options suggested here has a high probability
This policy option should follow the same lines as the quotas for fi sheries.
of success owing to the solid foundation of the co-operation, which
However, this measure will not provide for equity since the basis for
manifests the existence of political will among the member countries.
redistribution of benefi ts lies in the fi shing and selling of fi sh. It does not
guarantee fair distribution of access to fi sh. However, it holds the highest
possibility of controlling the amount of fi sh landed by restricting the
main market. Resistance is expected from both sellers and buyers of
Options
fi sh, but with the dwindling stock of fi sh and reduced supply, in terms
of both quantity and quality, it is expected that proper awareness
Overexploitation of fish
will avoid this obstacle. Recently (April/May 2003), fi shers in Musoma,
Policy options that can address overexploitation of fi sh are (see also
Tanzania, were on strike for several days withholding fi sh supplies to
Table 30):
the processing plants in the area of Musoma demanding better prices
Quota for fi shing
and the establishment of a new buying and selling arrangement. The
Quota for processing
fi shers wanted to sell directly to the processing plants instead of dealing
Review of the rules and regulations and existing policies
with middlemen or agents. They succeeded in getting processing plant
Civic education and awareness
owners to consider their demands. Such development indicates the
possibility of achieving a consensus between fi shers and processors in
Option 1: Quota for fi shing
controlling catch quantity and quality in terms of size.
This policy option has a high probability of success in the medium-term
(5 years). There should be involvement of stakeholders (fi shers in co-
Option 3: Review of the rules and regulations and existing policies
management) and a change of attitude from a government-driven to a
In order for co-management to succeed, a favourable environment
community-driven process including ownership. The process should be
should be provided. This includes the recognition of property rights and
initiated in areas where there is a felt need. This will ensure self-regulation
entitlements. This option is highly eff ective since the existing situation
and sustainability. A conducive environment should be created for the
provides a loophole for off enders to escape justice through diff erent
success of the instruments required (revision of by-laws, scientifi c basis
rules and policies or uncoordinated implementation. The existing rules
for decision-making, education and training; fi nancial and technological
on buying and selling fi sh allow buyers to accept or even demand fi sh
assistance, etc.). This should control the number of entrants and ensure
below the recommended size. Revision of these policies, regulations
that eff orts are at a sustainable level with minimum cost. The wise use
and rules alone does not mean success. They also require enforcement.
of resources and democratisation of political processes for sustainable
Benefi ts from the review of policies and regulations are enormous across
development should be politically feasible and provide equitable
all stakeholder groups. Curbing overexploitation will greatly facilitate
dividends to stakeholders. There is, however, the risk that some people
the sustainability of fi sheries. In this case everybody wins. The review
POLICY OPTIONS
97
of policies, rules and regulations is already being worked out under
aimed to reduce the number of civil servants so as to increase labour
EAC. This, however, should be carried out in conjunction with eff ective
productivity and effi
ciency. The outcome of this exercise has been to
enforcement. The policy option will have a high probability of success
cut down the number of fi eld staff to below the necessary requirement
if well implemented in a participatory manner, with stakeholders in the
for effi
cient operation, thus encouraging rampant law-breaking. This
fi shing communities along the lake shores, as has already begun under
includes non-compliance with restrictions of fi shnet mesh size and the
co-management through the Beach Management Units (BMUs).
use of illegal gear such as beach seines. The eff ectiveness of this policy
is high, especially considering the political will and intention towards
Option 4: Civic education and awareness
strengthening the management of Lake Victoria through the EAC
It is important to increase public participation in order to enhance
initiative. The move towards co-management should be supported as
eff ective decision-making and compliance by self-regulation. There
it involves communities in eff ective management at a lower cost, thus
is, however, a risk of failure in some localised areas due to lack of
making it possible to achieve the monitoring and enforcement goal.
political will at grassroots level in communities where political leaders
benefi t from passivity and ignorance among the constituents. Such
Option 6: Provide civic education and awareness; empowering
political leaders will obstruct and hinder the move to make villagers
and involving more communities in management
aware of their rights and obligations. This is a localised risk and should
The lack of awareness of the fi shery status and trends, and of the impact
not constitute a major obstacle to the success public participation in
of their actions, may be a contributing factor to the irresponsible
decision-making, as such passive communities are very few and widely
behaviour of the people. The lack of knowledge of their rights
scattered. There is political will at regional level, as demonstrated by
and obligations in bringing about a conducive environment for a
the EAC treaty document and the implementation of the intended
sustainable fi shery may also undermine an eff ective participation in the
objectives so far. This option will help to remove corrupt, irresponsible
management of natural resources, fi sheries in particular. Empowering
and authoritarian leadership and to bring in transparent, democratic
the community in both these and other forms of awareness would go a
and accountable leaders. This means more popular participation of
long way towards eff ective management and consequently sustainable
communities in environmental, economic and development issues
utilisation of fi sheries resources. As with overexploitation, implementing
that aff ect their livelihoods. It would also be more inclusive in terms of
this policy option has a risk of failure. However, with proper and careful
sharing accruing costs and benefi ts. Environmental education should
planning and implementation, bearing in mind that there are leadership
also be incorporated in school curricula as an eff ective long-term
elements who might want to reject the idea, success can be achieved.
policy.
Option 7: Imposing size restrictions on fi sh processing factories
Destructive fishing practices
Fish processing factories are the major buyers of Nile perch, in other
The policy options that can address destructive fi shing practices are
words they provide the market for the majority of fi shers and buyers. It
listed below (see also Table 30).
has been alleged that the processing factories prefer smaller size fi sh
Strengthening monitoring and enforcement of restrictions;
to meet the demand of European buyers. The argument put forward
enforcing the rule of law;
is that small size fi sh (1 kg) contain less fat than larger fi sh. Scientists
Provision of civic education and awareness; empowering and
argue that at 1 kg, the Nile perch is still growing and has not reached
involving more communities in management;
the reproductive stage. Therefore, discouraging the sale of small size
Imposing size restrictions on fi sh processing factories;
fi sh will facilitate reproduction and replenish stocks. This policy option is
Provision of credit to artisanal fi shers.
achievable when processing plant owners realise that the availability of
fi sh is becoming a problem. In Tanzania, a meeting between processing
Option 5: Strengthening monitoring and enforcement of
plant owners and offi
cials from the Fisheries Department achieved
restrictions and the rule of law
consensus on this issue.
Monitoring and enforcement of regulations and restrictions encourages
compliance. As has been noted, good policies and regulations exist
Option 8: Provision of credit to artisanal fi shers
though some may be outdated. However, without enforcement,
Lack of capital for the purchase of recommended fi shing gear hampers
compliance among the target group (fi shers) is reduced due to
compliance by small-scale fi shers. Having being dispossessed of their
the desire to maximise benefi t at minimum cost, threatening the
illegal gear, they cannot aff ord to buy new legal fi shing gear. The
sustainability of fi shery. The civil service reforms in Tanzania have
provision of credit to fi shers will facilitate compliance with restrictions
98
GIWA REGIONAL ASSESSMENT 47 EAST AFRICAN RIFT VALLEY LAKES
and regulations by enabling them to purchase the required gear,
already underway to address this situation, where the capacity for
which does not endanger sustainability. With the experience gained
implementation exists within the three EAC countries.
by numerous NGOs in credit provision to small-scale entrepreneurs,
this policy option has a high probability of success. It has a double
Option 10: Liberalisation of waste disposal activities to involve the
advantage of alleviating poverty among the fi shing communities
private sector and communities
while at the same time facilitating sustainable utilisation of fi sheries
Waste disposal activities have been the mandate of the government
resources.
through its municipal councils. With the implementation of the
Structural Adjustment Programmes where civil service reforms were
Pollution
undertaken, there arose a situation of inadequate capacity to carry out
Policy options that address the issues of pollution are listed below (see
effi
cient waste disposal services. In addition, government withdrawal
also Table 31).
from commercial activities under the economic liberalisation banner,
Accreditation of analytical laboratories for standards enforcement;
made the case for private sector participation in the economy even
Liberalisation of waste disposal activities to involve the private
stronger, particularly for Tanzania. This is obviously important in order
sector and communities;
to fi ll the void left by public institutions, which used to render these
Revision of regulations in urban planning that have not taken into
services. The eff ectiveness of this policy option is in it being a business
account environmental issues, and improvement of monitoring and
venture with the capability of generating enough income to justify its
enforcement;
feasibility. This is already manifested by the existence of environmental
Improvement of natural resource management and farming
and sanitation companies in urban centres of Dar es Salaam and other
practices through training, governance and agricultural towns. In some places community youth groups are formed which
technology;
engage in waste collection and disposal from residential areas.
Stronger vetting of technology promoted by national and
international agencies;
Option 11: Revision of regulations in urban planning that have
Strengthening enforcement of regulations for mandatory effl
uent
not taken into account environmental issues and improvement of
treatment in municipalities and industries;
monitoring and enforcement
Incorporating all stakeholders in the drafting of regulations and in
Urban centres are expanding all over East Africa due to population
monitoring and enforcing agreed regulations;
pressure. Apart from increased population in cities and towns, changing
Integration of institutional framework, regulations and laws at two
consumption patterns driven by a modern consumerist society lead to
levels: national and regional;
more waste being generated today than before. In some cases town
Creation of a public complaints institution with powers to
planning ignores such changes. In addition, most urban centres have
investigate and recommend prosecution;
a signifi cant number of squatters in shanty structures haphazardly
Enforcing compliance with international conventions e.g. Ramsar,
constructed without regard to the need for waste collection, disposal
CITES, and the Biological Diversity Convention of Agenda 21;
facilities, or provisions for access by disposal trucks. This is a result of
Strengthening the capacity of National Environmental Protection
outdated urban planning regulations and inadequate town planning,
Authorities to enable a more eff ective enactment of legislation by
resulting in squatting due to a lack of surveyed plots. New approaches
providing trained manpower and suffi
cient funding.
are being implemented to facilitate the survey of building plots in
urban centres through clients' contributions towards the survey cost.
Option 9: Accreditation of analytical laboratories for standards
Previously, budgetary inadequacy constrained the survey exercise.
enforcement
More plots are surveyed today under this scheme which has led to less
Currently, results from analytical laboratories in the Lake Victoria Basin
haphazard building. Capacity to undertake the revision and corrective
are not recognised internationally. In order to achieve recognition, East
measures exists within relevant land offi
ces in the EAC partner states.
African laboratories must send samples to Europe or USA and other
places for tests. This process is costly in both time and money. In order to
Option 12: Improvement of natural resource management and
facilitate water quality standards enforcement in a cost effi
cient way, the
farming practices through training, governance and agricultural
accreditation of water quality laboratories is essential. Implementation
technology
of this policy option will go a long way in reducing health costs
Bad farming practices result in eutrophication of the Lake, through
and increase labour productivity. Under the EAC, programmes are
pollution. Deforestation and loss of vegetation cover cause soil erosion
POLICY OPTIONS
99
Table 31
Policy options analysis matrix: Pollution issues.
Issue
Root cause
Policy option
Effectiveness
Efficiency
Equity
Political feasibility
Implementation capacity
Microbiological
Lack of water quality
Accreditation of analytical
High
High
High
High
High
Eutrophication
standards and/or
laboratories for standards
Enable convenient
Reduces health costs
Better health for
Programs already
Exists within the EAC partner
Chemical
enforcement.
enforcement.
& acceptable water
& increase labour
all and sustained
underway within EAC
countries.
Suspended solids
quality monitoring
productivity.
fishery.
protocol.
at a cheaper cost.
Microbiological
Inadequate capacity
Liberalisation of waste disposal High
High
High
High
High
for environmental
activities to involve the
Reduced pollution
(benefits include
All win due to clean Approach already
Environmental sanitation
sanitation.
private sector & communities
due to increased
improved health)
environment .
practiced under economic
companies, NGOs and community
particularly in large urban
waste disposal
liberalisation.
groups already work in some areas.
centres.
capacity.
Chemical
Inadequate
Revise regulations in urban
High
Moderate
High
High
High
Microbiological
regulations and weak planning that have not taken
Most urban centres
(improvement of
Improved
Exists under EAC.
Exists with relevant lands offices in
enforcement of urban into account environmental
do not have proper
urban environment
sanitation and
EAC partner countries.
and rural planning
issues and improve monitoring infrastructure for
at a cost of relocating
reduced of medical
and implementation. and enforcement.
waste disposal.
some people)
bills.
Eutrophication
Bad farming
Improve natural resource
High
Moderate
High
High
Moderate
practices.
management, farming
A large area is used
Reduced pollution
Protection of
Political will exists
Exists within the LVEMP/LVFO
practice through training
for unsustainable
but cost of
lake environment
exhibited by the existence
and relevant departments in the
governance and technologies
farming practices of
implementation.
for all.
of LVEMP/ LVFO.
partner states.
in agriculture.
cotton and coffee.
Chemical
Inappropriate
Stronger vetting of
High
High
High
Moderate
High
Suspended solids
technologies used in
technologies that are being
Will reduce pollution Reduced pollution but Protection of
Existence of business
Existence of relevant national
farming.
promoted by the national and
to some extent
high cost may delay
lake environment
lobby that may delay
institutions e.g. Tanzania Bureau
international agencies.
by stopping the
implementation.
for all.
implementation.
of Standards.
used of prohibited
chemicals.
Chemical
Weak monitoring
Strengthen enforcement of
High
Moderate
High
High
Moderate
and enforcement
regulations requiring effluent
Most industrial
Financial constraints.
Cleaner & safer
Existence of LVEMP/LVFO
Exists within the LVEMP/LVFO
of regulations for
treatment in municipalities
establishments
environment
and other like programs is a and relevant departments in the
effluent treatment.
and industries.
possible to be
for all.
testimony.
partner states.
monitored.
Microbiological
Implementation
Incorporate all stakeholders
High
Moderate
High
High
High
Eutrophication
failure of policies and in drafting of regulations and
Ownership
Cost element.
Sustainability is
Exercise of participatory
General acceptance of regulations.
Chemical
regulations.
in monitoring and enforcing
assured.
processes.
Suspended solids
agreed upon regulations.
Microbiological
Uncoordinated
Integration of institutional
High
Moderate
High
High
High
Eutrophication
institutional level
framework at two levels:
Taking place under
Budgetary constraints, Region-wide
EAC
Region-wide agreed regulations.
Chemical
frameworks.
national and regional.
EAC.
implementation
acceptance.
Suspended solids
rigidities.
Microbiological
Conflicting and
Integration of regulations and
High
Moderate
High
High
High
Eutrophication
unsupportive rules
laws at two levels: national and Taking place under
Budgetary constraints, Common basis for
EAC
Commonly accepted
Chemical
and regulations at
regional.
EAC.
implementation
regulations.
regulations,e.g. EAC.
Suspended solids
national and regional
rigidities.
levels.
Microbiological
Inadequate
Legal and economic
High
High
High
Moderate
Moderate
Eutrophication
capacity & lack of
empowerment of institutions
Reduction of
Harmonious
Popular
Dependent on successful
Budgetary constraints.
Chemical
legitimacy of national e.g. LVFO.
transboundary
co-existence of
participation in
establishment of EAC
Suspended solids
implementing
conflicts.
EAC partner states
conflict resolution.
institutional framework.
institutions in
inhabitants.
conflict resolution.
Microbiological
Low compliance
Enforce compliance to
Moderate
Moderate
High
Moderate
Moderate
Eutrophication
of international
international conventions e.g.
Difficult to
Budgetary constraints, Resource
Vested interests by
Budgetary constraints,
Chemical
conventions.
Ramsar, CITES, & Biological
implement at local
implementation
conservation for
individuals and group
implementation rigidities.
Suspended solids
Diversity Convention of
level.
rigidities.
the benefit of all.
lobbies.
Agenda 21*.
Microbiological
Weak capacity of
Strengthening of capacity
High
High
High
High
High
Eutrophication
national environment of National Environmental
Process on-going for Protection of
Enhancement
Feasibility manifested
Existence of Environmental
Chemical
protection agencies.
Protection Authorities in order
Tanzania, Kenya and environment.
of sustainable
by the existence of the
protection agencies and laws in
Suspended solids
to be more effective.
Uganda.
livelihoods.
National environmental
Kenya, Uganda and Tanzania.
protection authorities.
*It should be noted that compliance to regional treaties/conventions such as the EAC and LVFO Convention, and international conventions such as POPs and BASEL conventions can go a long way in
helping to tie up legislation, regulations and laws that would operate at regional levels.
(including in wetlands). In addition, lack of buff ering results in the fl ow
and avoid bad farming practices, which result in pollution of the Lake,
of pollutants into the Lake. Furthermore, poor waste management, lack
is essential. Currently, run-off from cotton and coff ee farms carries
of stormwater drainage, and destruction of wetlands exacerbate the
with it solid organic waste. This is mainly due to lack of education
situation. Training farmers around the Lake to practice clean production
and awareness. The establishment of a proper waste management
100
GIWA REGIONAL ASSESSMENT 47 EAST AFRICAN RIFT VALLEY LAKES
infrastructure, and educating farmers as to the importance of wetlands,
to this new way of doing things. This approach has its setbacks in
together with strengthening monitoring and enforcement, will improve
terms of speed of the process and implementation costs. However,
the environmental status of the Lake. The implementation capacity of
high success rates have been experienced across the region in several
this policy option exists within partner states and the political and
project implementations.
technical feasibility is manifested by LVEMP.
Option 16: Integration of institutional framework, regulations and
Option 13: Stronger vetting of technology promoted by national
laws at two levels: national and regional
and international agencies
In order to have a consistent and smooth policy implementation for
Some chemical pollution is due to the use of prohibited chemicals such
the management of the Lake, a harmonisation of policies, regulations
as DDT. Stronger vetting of such chemicals will reduce the risk of adverse
and legislation is vital. Any loopholes would make the eff ort ineff ective.
eff ect on human health and the environment. The political feasibility of
This work is underway within the auspices of EAC for fi sheries, the
this policy option is moderate owing to the fact that a business lobby
environment and natural resources management. However, this may
will fi ght to maximise their benefi ts, regardless of the cost imposed on
take time and requires extensive negotiation. At the end of the day, it
people and the environment. However, communities could be a good
will facilitate smooth implementation of collective objectives.
counter lobby to pressure their governments to take the right decisions
through constituent representation in parliament.
Option 17: Creation of a public complaints institution with powers
to investigate and recommend prosecution
Option 14: Strengthening enforcement of regulations for
Given that confl icts occur between people from the partner states,
mandatory effl
uent treatment in municipalities and industries
the current practice is that national rules, regulations and institutions
While rules and regulations exist in all three countries on waste disposal,
are used to solve such transboundary problems. In order to avoid
their enforcement is seriously lacking. Under Tanzanian industrial law,
complaints from outside parties in confl ict, the establishment of
all processing plants must have waste treatment facilities. However,
an impartial institution is recommended to take care of all disputes
few industries have "working" treatment plants or ponds. Wastewater
related to fi sheries; the number of such disputes has lately increased
and solid waste is left to spread to streams and residential areas where
between Kenya and Uganda, and between Kenya and Tanzania.
they aff ect the health of inhabitants living in the vicinity and who use
A more harmonious co-existence among inhabitants of the three states
contaminated water from streams and rivers. In other places in Tanzania,
sharing the same resources will be created through the reduction of
outside the Lake Basin, the disposal of industrial and municipal effl
uent
transboundary confl icts. The political feasibility and success of this
leads to huge economic losses through the destruction of tourist
policy option will depend on the success of the establishment of an
attractions such as coral reefs. With the enactment of environmental
EAC institutional framework and budgetary aspects.
policies and frame-work legislation in all three partner states, and
the establishment of environmental protection agencies, this policy
Option 18: Enforcing compliance with international conventions
option has a high probability of succeeding. The existence of LVEMP
e.g. Ramsar, CITES, and the Biological Diversity Convention of
adds another dimension of seriousness and commitment in the three
Agenda 21
partner states towards proper management of the Lake.
All the partner states have ratifi
ed international conventions
including the ones mentioned above. However, not all the ratifi ed
Option 15: Incorporating all stakeholders in the drafting of
conventions are implemented as desired. Non-implementation of
regulations and in monitoring and enforcing agreed regulations
such conventions is as good as non-ratifi cation. This has resulted in
Participatory approaches have been found to be eff ective in the
exacerbated environmental degradation and biodiversity decline with
implementation of policies and decisions which require the input of
disastrous eff ects. Conventions such as Agenda 21 set the ground for
the community and where the communities in turn stand to benefi t
sustainable national, and ultimately global development. Disregarding
from the process. This is because involvement of the benefi ciaries
or not honouring such conventions means that the future of the Lake
instils a sense of responsibility and participation. They share the cost
Victoria Basin is bleak. Due to the vested business interest in natural
of implementation and the benefi t accrues to them, thus becoming
resources exploitation, a huge lobby exists which may provide a
eff ective partners ensuring proper and successful implementation. This
signifi cant obstacle. However, with proper awareness, mobilisation and
policy option has a high probability of success. However, traditional
commitment, popular participation seems to be one way of facilitating
practices of bureaucrats and politicians may pose an initial obstacle
the achievement through putting pressure on relevant authorities.
POLICY OPTIONS
101
Option 19: Strengthening the capacity of National Environmental
ş Enforcing compliance with international conventions e.g. Ramsar,
Protection Authorities in order to be more eff ective
CITES, and the Biological Diversity Convention of Agenda 21;
To date, the National Environmental Management Council (NEMC) of
ş Strengthening the capacity of National Environmental Protection
Tanzania has been a "toothless dog" in that it has not had legal backing
Authorities in order to be more eff ective;
to enable it to execute the mandate of an eff ective environmental
ş
Provide economic incentives for the use of clean technology;
protection agency, as we know it. Hopefully, this situation will soon
ş
Promote self-regulation in fi sheries and pollution management.
be relegated to history books. With the work on Institutional and
Legal Framework for Environmental Management in Tanzania nearing
completion and with the formulation of the environmental framework
law, NEMC will have executive powers to monitor and enforce rules and
Conclusions and
regulations pertaining to environmental management and protection.
recommendations
As for Uganda's and Kenya's National Environment Management
Authority (NEMA), the situation is also much improved.
In several cases, more than one policy option should be adopted in
order to achieve the desired impact. This is true for quotas for fi shing
and processing. Also the successful implementation of these policy
options will never be achieved without involving, in a participatory
Recommended policy options
manner, the communities living on the lake shores who depend on
fi shing as a source of subsistence livelihood and income generation.
In summary, the Policy options analysis resulted in the following
Capacity building in terms of civic education and leadership and
recommended options to combat the identifi ed priority concerns in
management skills will enhance this empowerment.
the Lake Victoria Basin:
Overexploitation
Knowledge gaps exist when it comes to quantitative estimates of
ş Fish
processing
quota.
benefi t and cost in both physical and monetary terms of the Lake
Destructive fi shing practices
Victoria water and fi sheries resources. The EAC has identifi ed natural
ş
Provide civic education and awareness; empowering and involving
resource valuation and accounting as highly important aspects in
more communities in management.
planning and development. The economic, social and environmental
Microbiological
pollution
values of natural resources must be understood in order to allow
ş Liberalisation of waste disposal activities to involve the private
effi
cient and equitable allocation for present and future generations.
sector and communities.
Studies on the impact of pollution and decline of fi sh are required to
Eutrophication
establish the extent and the gravity of the situation. In-depth studies
ş Improvement of natural resource management and farming
should be carried out to establish the processes involved and to analyse
practices through training, governance and agricultural the impact on various groups of people. This will help to address the
technology.
impact and establish who to include in the remediation process.
Chemical
pollution
ş Strengthening enforcement of regulations for mandatory effl
uent
Immediate further studies are required on:
treatment in municipalities and industries.
Water quality assessment;
Suspended
solids
Socio-cultural issues (holistic, rather than only focusing on the
ş Improving natural resource management, soil conservation,
fi sheries sector, encompassing health, agriculture, education, etc.
farming practices through training, governance and agricultural
within the entire Lake Basin);
technology, improved road construction design to minimise
Resource inventory, mapping and use (including mapping of critical
erosion.
resources);
Cross-cutting
Assessment and harmonisation of the legal and institutional
ş Integration of institutional framework at two levels: national and
status of National Acts, regional and international treaties and
regional;
conventions;
ş Integration of regulations and laws at two levels: national and
Study of the biology of the Nile perch, suspected to have up to
regional;
three diff erent sub-populations.
102
GIWA REGIONAL ASSESSMENT 47 EAST AFRICAN RIFT VALLEY LAKES
References
Abila, R.O. (2002). The Development of the Lake Victoria Fishery:
Bailey-Watts, A. (2000). Summary Technical Report. Pollution Special
A Boon or Bane for Food Security? Retrieved 2003 from
Study. Pollution Control and Other Measures to Protect Biodiversity
http://www.iucn.org/themes/wetlands/docs/Report8.doc
in Lake Tanganyika (UNDP/GEF/RAF/92/G32).
Abila, R.O. and Jansen, E. (1997). From Local to Global Markets. IUCN
Bailey-Watts, A., Foxall, C. and West, K. (2000). Overall fi ndings of
Report No. 2.
the study. Pollution Special Study. Pollution Control and Other
ADB (1997). Country Environmental Profi le, Malawi. African Development
Measures to Protect Biodiversity in Lake Tanganyika (UNDP/GEF/
Bank, African Development Fund.
RAF/92/G32).
Alabaster, J. (1981). Review of the state of aquatic pollution of East
Balirwa, S.J. (1998). Lake Victoria wetlands and the ecology of the Nile
African inland waters. FAO/CIFA Occas. Paper 9.
tilapia, Oreochromis niloticus Linne. Ph.D Desertation, Balkema
Alin, S.R., Cohen, A.S., Bills, R., Gashakaza, M.M., Michel, E., Tiercelin, J-J.,
Publishers, Rotterdam, Netherlands.
Martens, K., Coveliers, P., Mboko, S.K., West, K., Soreghan, M., Kimbadi,
Barel, C., Dorit, R., Greenwood, P., Fryer, G., Hughes, N., Jackson, P.B.N.,
S. and Ntakimazi, G. (1999). Eff ects of landscape disturbance on
Kawanabe, H., Lowe-McConnell, R., Nagoshi, M., Ribbink, A.,
animal communities in Lake Tanganyika, East Africa. Conservation
Trewavas, E., Witte, F. and Yamaoka, K. (1985). Destruction of fi sheries
Biology, 13:1017-1033.
in Africa's Lakes. Nature 315:19-20.
Allison, E.H. (2002). Sustainable management of the African Great
Barel, C., Ligtvoet, W., Goldschmidt, T., Witte, F. and Goudswaard, P.
Lakes: science for development? Aquatic Ecosystem Health and
(1991). The haplochromine cichlids in Lake Victoria: an assessment
Management, 5:315-327.
of biological and fi sheries interests. In: Keeleyside, M. (ed), Cichlid
Aloo, P.A. (2003). Biological diversity of the Yala Swamp lakes, with
Fishes, Behaviours, Ecology and Evolution. Chapman and Hall,
special emphasis on fi sh species composition, in relation to
London, p 258-279.
changes in the Lake Victoria Basin (Kenya): threats and conservation
Barrow, E. (1988). Trees and pastoralists: the case of the Pokot and
measures. Biodiversity and Conservation, 12:905-920.
Turkana. ODI Social Forestry Network, Network Paper 6b.
Asila, A.A. (2001). Working document for Lake Victoria fi sheries
BDP (2003). Biodiversity Brief 11 on Fish and Biodiversity.
management decisions. Lake Victoria Fisheries Research Project,
Biodiversity Development Project. Retrieved Sept., 2003 from
March 2001, Jinja, Uganda.
http://www.wcmc.org.uk/biodev/briefs/bb11-eng.pdf
ATF (1997). Preserving the Future for Lake Malawi. Africa Technology
Beadle, L.C. (1981). The Inland Waters of Tropical Africa: An Introduction
Forum. Retrieved Sept., 2003, from: http://web.mit.edu/africantech/
to Tropical Limnology. 2nd edition. Longman, London.
www/articles/Lake_Malawi.html
Beauchamp, R.S.A. (1939). Chemistry and hydrography of Lakes
Awiti, A. and Walsh, M. (2002). In: Improved land management in the
Tanganyika and Nyassa. Nature, 146:253-256.
Lake Victoria basin: Linking Land and Lake, research and extension,
Beauchamp. R.S.A. (1953). Hydrological data from Lake Nyasa. Journal
catchment and Lake basin. Final Technical Report. International
of Ecology, 41:226-239.
Centre for Research in Agroforestry/Ministry of Agriculture and
Beeton, A. (2002). Large freshwater lakes: present state, trends and
Rural Development, Nairobi, Kenya, p 30-33.
future. Environmental Conservation, 29:21-38.
REFERENCES
103
Birkett, C.M., Murtugudde, R. and Allan, J.A. (1999). Indian Ocean
Bwathondi, P.O.J., Ogutu-Ohwayo, R. and Ogari, J. (2001). Lake Victoria
climate event brings fl oods to East Africa's lakes and Sudd Marsh.
Fisheries Management Plan. In: Cowx I.G. and Crean K. (eds), LVFRP/
Geophysical Research Letters, 26:1031-1034.
TECH/01/16, Technical Document No. 16.
Bizimana, M. and Duchafour, H. (1991). A drainage basin management
Calder, I.R., Hall, R.L., Bastable, H.G., Gunston, H.M., Shela, O., Chirwa, A.
study: the case of the Ntahangwa River Basin. In: Cohen, A.S. (ed),
and Kafundu, R. (1995). The impact of land use change on water
Report on the First International Conference on the Conservation
resources in sub-Saharan Africa: a modelling study of Lake Malawi.
and Biodiversity of Lake Tanganyika. March, 1991. Bujumbura.
Journal of Hydrology, 170:123-135.
Biodiversity Support Program, p 43-45.
Capart, A. (1949). Sondage et carte bathymetrique du Lac Tanganyika.
Bloland P.B., Ruebush, T.K., McCormick, J.B., Ayisi, J., Boriga, A., Oloo,
Resultats scientifi ques de l'exploration hydrobiologique du Lac
A.J., Beach, R., Hawley, W., Lal, A., Nahlen, Bl, Udhayakumar, V.
Tanganyika (1946-1947). Institut Royal des Sciences Naturelles de
and Campbell, C.C. (1999). Longitudinal cohort study of the
Belgique 2, p 1-16.
epidemiology of malaria infections in an area of intense malaria
Cerling T.E. (1986). A mass balance approach to basin sedimentation:
transmission. Description of Study site, general methodology,
constraints on the recent history of the Turkana basin.
and study population. American Journal of Tropical Medicine and
Palaeogeography, Palaeoclimatology Palaeoecology, 43:129-151.
Hygiene, 60:635-640.
Chale, F. (2000). Studies in Tanzanian Waters. Pollution Special Study.
Booth, V. (2000). Lake Malawi/Niassa/Nyasa Ecoregion-based
Pollution Control and Other Measures to Protect Biodiversity in Lake
Conservation Program: Socio-economical Reconnaissance. WWF
Tanganyika (UNDP/GEF/RAF/92/G32).
Southern Africa, Harare, Zimbabwe.
Chapman, L., Chapman, C., Kaufman, L. and Liem, K. (1992). The role
Bootsma, H.A. and Hecky, R.E. (1993). Conservation of the African Great
of papyrus swamps as barriers to fi sh dispersal: A case study
Lakes: a limnological perspective. Conservation Biology (Special
and implications for fi sh diversity in the Lake Victoria basin. In:
Issue), 7:644-656.
Biodiversity, Fisheries and the Future of Lake Victoria, Conference
Bootsma, H.A. and Hecky, R.E. (1999). Water Quality Report: Lake Malawi/
Abstracts, p 6.
Nyasa Biodiversity Convservation Project. SADC/GEF Lake Malawi
Chapman, L.J., Balirwa, J.S., Bugenyi, F.W.B., Chapman, C.A. and
Nyasa/Niassa Biodiversity Conservation Project, Senga Bay.
Crismman, T.A. (2001). Wetlands of East Africa: Biodiversity,
Botero, L.S. (1986). Incentives for community involvement in upland
Exploitation, and Policy Perspectives. In: Gopal, B; Junk, W.J., and
conservation. In: Strategies, approaches and systems in integrated
Davis, J.A. (eds), Biodiversity in Wetlands: assessment, function
watershed management. FAO Conservation Guide 14.
and Conservation. Volume 2. Backhuys Publishers, Leiden, The
Branstrator, D.K., Ndawula, L.M. and Lehman, J.T. (1996). Zooplankton
Netherlands, p 101-131.
dynamics in Lake Victoria. In: Johnson, T.C. and Odada E.O. (eds), The
CIA World Fact Book (2002). Retrieved Nov., 2003, from
Limnology, Climatology and Paleoclimatology of the East African
http://www.cia.gov/cia/publications/factbook
Lakes. Gordon and Breach, Toronto, p 337-355.
CIHI (1995). CIHI Country Health Profi le Series: Kenya Country Health
Bromage, T. (1995). Paleobiogeography of the Malawi Rift: Vertebrate
Profi le 1995. Center for International Health Information, Arlington,
and invertebrate faunal contexts of the Chiwondo Beds, northern
Virginia USA.
Malawi. Journal of Human Evolution, 28:37-58.
CIHI (1996). CIHI Country Health Profi le Series: Ethiopia Country Health
Brooks, J.L. (1950). Speciation in ancient lakes. Quarterly Review of
Profi le 1996. Center for International Health Information, Arlington,
Biology (Baltimore), 25:131-176
Virginia USA.
Bugenyi, F.W.B. and Magumba, K.M. (1996). The present physicochemical
Clay, E., Bohn, L., Ammas, E.B. de., Kabambe, S. and Thale, H. (2003).
ecology of Lake Victoria, Uganda. In: Johnson, T.C. and Odada E.O.
Malawi and Southern Africa: Climate Variability and Economic
(eds), The Limnology, Climatology and Paleoclimatology of the East
Performance. Disaster Risk Management Working Paper Series No.
African Lakes. Gordon and Breach, Toronto, p 141-154.
7., The World Bank, Washington D.C.
Butzer K.W. (1971). Recent history of an Ethiopian Delta. Department of
Cockburn, T.A and Cassonos, J.G. (1960). Epidemiology of endemic
Geography Research Paper No.136, Chicago.
cholera. Public health reports, 75:791-803.
Butzer K.W., Isaac G.L., Richardson J.L. and Washbourne-Kamau C.
Cocquyt, C., Caljon, A. and Vyverman, W. (1991). Aspects saisonnier
(1972). Radiocarbon dating of East African lake levels. Science, 175:
et spatial du phytoplancton dans le lac Tanganyika. Actes du XI
1069-1076.
Colloque des Diatomistes de Langue Franšaise Douai, du 24 au 27
Septembre 1991, p 213-216.
104
GIWA REGIONAL ASSESSMENT 47 EAST AFRICAN RIFT VALLEY LAKES
Coenen, E.J., Hanek, G. and Kotilainen, P. (1993). Shoreline classifi cation
Crul, R.C.M. (1997). Limnology and hydrology of Lakes Tanganyika and
of Lake Tanganyika Based on the Results of an Aerial Frame Survey.
Malawi. UNESCO/IHP-IV, Project M-5.1. UNESCO Pub., Paris. Studies
FAO/FINNIDA Research for the Management of the Fisheries on
and reports in hydrology 54.
Lake Tanganyika. GCP/RAF/271/FIN-TD/10.
Cunningham Van-Someren, C.R., (1981). Lake Turkana Biological Survey:
Cohen, A.S. (1991). Report on the First International Conference on the
Birds. Report to the National Museum of Kenya, Nairobi.
Conservation and Biodiversity of Lake Tanganyika. March, 1991.
Deelstra, H., Power, J.L. and Kenner, C.T. (1976). Chlorinated hydrocarbon
Bujumbura. Biodiversity Support Program.
residues in the fi sh of Lake Tanganyika. Bulletin of Environmental
Cohen, A.S., Soreghan, M.J. and Scholz, C.A. (1993a). Estimating the age
Contamination and Toxicology, 15:689-698.
of formation of lakes: an example from Lake Tanganyika, East African
Dodson R.G. (1971). Geology of the area south of Lodwar. Geological
Rift system. Geology, 21:511-514.
Survey of Kenya, Report No. 87.
Cohen, A.S., Bills, R., Cocquyt, C.Z. and Caljon, A.G. (1993b). The
Drayton, R.S. (1984). Variations in the level of Lake Malawi. Hydrological
impact of sediment pollution on biodiversity in Lake Tanganyika.
Sciences/Journal des Sciences Hydrologiques, 29:1-12.
Conservation Biology, 7:667-677.
Dubois, J. Th. (1958). Evolution de la temperature and de l'oxygen
Cohen, A.S., Kaufman, L. and Ogutu-Ohwayo, R., (1996). Anthropogenic
dissous et de la transparence dans la baie Nord du Lac Tangannyika.
threats, impacts and conservation strategies in the African Great,
Hydrobiologia, 10:215-240.
Lakes: A review. In: Johnson, T.C. and Odada E.O. (eds), The
Duda, A. (2002). Restoring and protecting the African Great Lake Basin
Limnology, Climatology and Paleoclimatology of the East African
ecosystems ş lessons from the North American Great Lakes and
Lakes. Gordon and Breach, Toronto, p 575-624.
the GEF. In: Odada, E.O. and Olago, D.O. (eds), The East African Great
Conway, D. (2002). Extreme rainfall events and lake level changes in
Lakes: Limnology, Palaeolimnology and Biodiversity. Advances in
East Africa: recent events and historical precedents. In: Odada, E.O.
Global Change Research, Kluwer Academic Publishers, p 537-556.
and Olago, D.O. (eds), The East African Great Lakes: Limnology,
Dunkelman T.J., Karson J.A. and Rosendahl B.R. (1988). Structural style
Palaeolimnology and Biodiversity. Advances in Global Change
of the Turkana Rift, Kenya. Geology, 16:258-261.
Research, Kluwer Academic Publishers, p 63-92.
EAC (2001). Treaty for the establishment of the East African Community.
Coulter, G.W. (1970). Population changes within a group of fi sh species
East African Community, Arusha, Tanzania.
in Lake Tanganyika following their exploitation. Journal of Fish
Ebinger, C. J., Deino, A. L., Drake, R. E. and Tesha, A. L. (1989). Chronology
Biology, 2:329-353.
of Volcanism and Rift Basin Propagation: Rungwe Volcanic Province,
Coulter, G.W (1991). Lake Tanganyika and its Life. 1st edition. Oxford
East Africa, Journal of Geophysical Research, 94:15785-15803.
University Press, New York.
Eccles, D.H. (1974). An outline of the physical limnology of Lake Malawi
Coulter, G.W. (1994). Lake Tanganyika. In: Martens, K., Goddeeris, B.
(Lake Nyasa). Limnology and Oceanography, 19:730-742.
and Coulter, G. (eds), Speciation in Ancient Lakes. Archiv fŘr
Eccles, D.H. (1984). On the recent high levels of Lake Malawi. South
Hydrobiologie, 44:13-18.
African Journal of Science, 80:461-468.
Coulter, G.W. (1999). Sustaining both biodiversity and fi sheries in ancient
Edmond, J.M., Stallard, R.F., Craig, H., Weiss, R.F., and Coulter, G.W.
lakes, the cases of Lakes Tanganyika, Malawi/Nyasa and Victoria.
(1993). Nutrient chemistry of the water column of Lake Tanganyika.
In: Kawanabe, H., Coulter, G.W. Roosevelt, A.C. (eds), Ancient Lakes:
Limnology and Oceanography, 38:725-738.
Their Cultural and Biological Diversity. Kenobi Productions, Belgium.
Ejobi, F., Kanja, L.W., Kyule, M.N., Mull, P., Kruger, J., Nyeko, J.H.P. and
p. 177-187.
Latigo, A.A.R. (1994). Organochlorine pesticide residues in cows
Coulter, G.W. and Mubamba, R. (1993). Conservation in Lake Tanganyika
milk in Uganda. Bulletin of Environmental Contamination and
with special reference to underwater parks. Conservation Biology,
Toxicololgy, 56:551-557.
7:678-685.
Ellis, J.E. and Swift, D.M. (1988). Stability of African pastoral ecosystems:
Craig, J.F. (1992). Human-induced changes in the composition of fi sh
alternate paradigms and implications for development. Journal of
communities in the African Great Lakes. Reviews in Fish Biology
Range Management, 41:450-459.
and Fisheries, 2:93-124.
ENSO Project (2003). Summary of the ENSO project. Retrieved Mar., 2003,
Crossley, R. (1979). Variations in the level of Lake Malawi. Malawian
from: http://members.tripod.com/tanganyika/id39_m.htm
Geographer, 19:5-13.
FAO (1991). Sustainable development and management of land
resources. FAO/Netherlands Conference on Agriculture and the
Environment. Hortogenbosch, The Netherlands.
REFERENCES
105
FAO (1998). Fisheries Statistics: Capture production.
Gichuki, C.M. and Gichuki, N.N. (1992). Wetland birds of Kenya. In: Crafter,
FAO (2001). Research for the Management of Fisheries on Lake
S.A., Njuguna, S.G. and Howard G.W. (eds), Wetlands of Kenya. IUCN
Tanganyika (LTR): Burundi, Democratic Republic of Congo, Tanzania
1992, p 37-44.
and zambia. Project Findings and Recommendations, FAO, Rome.
Gichuki, N.N. (2003). Review of wetland research activities in Lake
Ferguson A.J.D. and Harbott B.J. (1982). Geographical, physical and
Victoria basin, Kenya: Analysis and Synthesis Report. SIDA/Inter-
chemical aspects of Lake Turkana. In: Hopson, A.J. (ed), Lake
University Council for East Africa. Kampala, Uganda.
Turkana: A Report on the Findings of the Lake Turkana Project, 1972-
Githeko, A.K., Brandling-Bennett, A.D., Beier, M., Atieli, F., Owaga, M. and
1975, Overseas Development Administration, London, p 1-107.
Collings, F.H. (1992). The resevoir of Plasmodium falciparum malaria
Ffolliot, P.E. and Brooks, K.N. (1986). Multiple uses: achieving diversifi ed
in a holoendemic area of western Kenya. Transactions of the Royal
and increased income within a watershed management framework.
Society of Tropical Medicine and Hygiene, 86:355-358.
In: Strategies, approaches and systems in integrated watershed
Githeko A. K., and Ndegwa, W. (2001). Predicting malaria epidemics in
management. FAO Conservation Guide 14.
the Kenyan Highlands using climate data: a tool for decision makers.
Finke, J. (2001). Lake Turkana Mankind's Origins. Retrieved from
Global change and Human Health, 2:54-63.
http://bluegecko.crosswinds.net/tribes/turkana/prehist.htm
Goldschmidt, T. and Witte, F. (1992). Explosive speciation and adaptive
Fisheries Department (1950). Lake Victoria Fisheries Service Annual
radiation of haplochromine cichlids from Lake Victoria: an
Report, 1950. East Africa High Commission, Government Printer,
illustration of the scientifi c value of a lost species fl ock. Mitteilungen
Nairobi.
Internationale Vereinigung Limnologie, 23:101-107.
Foxall, C., Chale, F., Bailey-Watts, A., Patterson, G. and West, K. (2000).
Gonfi antini, R., Zuppi, G.M., Eccles, D.H. and Ferro, W. (1979). Isotope
Pesticide and heavy metals in fi sh and molluscs of Lake Tanganyika.
investigation of Lake Malawi. In: Isotopes in lake Studies.
Pollution Special Study. Pollution Control and Other Measures to
Proceedings on the application of nuclear techniques to study
Protect Biodiversity in Lake Tanganyika (UNDP/GEF/RAF/92/G32).
of lake dynamics organized by the International Atomic Energy
Freilink, A.B. (1991). Water hyacinth in Lake Victoria. A report on an aerial
Agency. IAEA, Vienna, p 195-205.
survey on 12-13 June 1990. In: Thompson, K. (ed), Workshop on
Government of Malawi (1985). The National Atlas of Malawi. Department
Water Hyacinth in Uganda: Ecology, Distribution, Problems and
of Surveys, Blantyre, Malawi.
Strategies for Control, 22-23 October 1991, Kampala, Uganda.
Government of Malawi (1998). State of Environment Report for Malawi.
Frostick L.E. and Reid, I. (1986). Evolution and sedimentary character of
Department of Environmental Aff airs, Lilongwe, Malawi.
lake deltas fed by ephemeral rivers in the Turkana basin, northern
Grabowsky and Poort B.V. and African Development and Economic
Kenya. In: Frostick, L.E., Renaut, R.W., Reid, I., and Tiercelin, J.-J. (eds),
Consultants Ltd. (1987). Yala Swamp Reclamation and Development
Sedimentation in the African Rifts, Geological Society Special
Project. Inception Report. Ministry of Energy and Regional
Publication No. 25, p 113-125.
Development, Government of Kenya and Ministry of Foreign Aff airs,
Fryer, G. (1959). The trophic interrelationships and ecology of some
Government of the Netherlands, Nairobi (unpubl.).
littoral communities of Lake Nyasa with special reference to
Graham S. (2003). An Overview of the Mtwara Development Corridor,
the fi shes, and a discussion of the evolution of a group of rock-
Commonwealth ş Tanzania Investment Offi
ce, Toyal Palm,
frequenting Cichlidae. Proceedings of the Zoological Society of
Dar es Salaam, May 28-30, 2003. Retrieved Aug., 2003, from
London, 132:153-281.
http://www.cbcglobelink.com/cbcglobelink/events/ Tanzania/
Fryer, G. and Isles, T.D. (1972). The Cichlid Fishes of the Great Lakes of
Presentations/Graham_Smith.pdf
Africa, Their Biology and Evolution. Oliver and Boyd, Edinburgh.
Greenwood. P. H. (1951). Evolution of the African cichlid fi shes: the
Getabu, A. and Nyaundi, J. (1999). Results from RV Utafi ti Research
haplochromines species fl ock of Lake Victoria. Nature, 167:1192-
Cruises. In: Tweedle, D. and Cowx, I.G. (eds), Lake Victoria Fisheries
1201.
Research Project Phase II: Part 1 - Report on Third FIDAWOG
Greenwood, P.H. (1981). The Haplochromine Fishes of the East African
Workshop held at the Triangle Hotel, Jinja, 29 March to 1 April 1999.
Lakes: Collected papers on their taxonomy, biology and evolution
LVFRP/TECH/99/06, Technical Document No. 6, p 84-90.
(with an introduction and a species index). Krau International,
Gibbon, P. (1997). Of saviours and punks: the political economy of the
MŘnich.
Nile perch marketing chain in Tanzania. CDR Working Paper 97.3.
Greenwood, P.H. (1984). African cichlids and evolutionary theories. In:
Copenhagen, Centre for Development Research, June 1997.
Echelle, A.A. and Kornfi eld, I. (eds), Evolution of Fish Apecies Flocks,
Univ-Marine at Orono Press, Orono, p 141-154.
106
GIWA REGIONAL ASSESSMENT 47 EAST AFRICAN RIFT VALLEY LAKES
Greenwood, P.H. (1994). The species fl ock of cichlid fi shes in Lake Victoria
Hecky, R.E. and Bugenyi, F.W.B. (1992). Hydrology and Chemistry of
and those of other African Great Lakes. Archiv fŘr Hydrobiologie -
the African Great Lakes and Water Quality issues: Problems and
Advances in Limnology 44:347-354.
Solutions. Mitteilungen Internationale Vereinigung fŘr Theoretische
Haack, B. and Messina, J. (2001). Satellite remote sensing: Monitoring
und Angewandte Limnologie, 23:45-54.
the Omo River Delta in East Africa using remote sensing. Earth
Hecky R.E., Bugenyi F.W.B., Ochumba, P, Talling J.F., Mugidde R., Gophen
Observation Magazine (EOM), 2001.
M. and Kaufman L. (1994). Deoxygenation of the deep water of Lake
Haberyan, K. and Hecky, R.E. (1987). The Late Pleistocene and Holocene
Victoria, East Africa. Limnology and Oceanography, 39:1476-1480.
stratigraphy and paleolimnology of Lakes Kivu and Tanganyika.
Henry, L. and Kishimba, M.A. (2000). Levels of pesticide residues in
Palaeogeography, Palaeoclimatology, Palaeoecology, 61:169-197.
southern Lake Victoria and its basin. Lake Victoria 2000: A new
Halfman J.D. (1987). High-Resolution Sedimentology and
Beginning; International Conference, Jinja.
Palaeoclimatology of Lake Turkana, Kenya. Ph.D. Thesis, Duke
Hoekstra, T.M., Asila, A., Rabuor, C. and Rambiri, O. (1991). Report of
University, Durham, North Carolina.
a census of fi shing boats and gear in the Kenyan waters of Lake
Halfman J.D. and Johnson T.C. (1988). High-resolution record of cyclic
Victoria. FAO/UNDP Regional Project for Inland Fisheries Planning
climatic change during the past 4Ka from Lake Turkana, Kenya.
Development in Eastern/Central/Southern Africa, Bujumbura,
Geology, 16:496-500.
Burundi. FAO/UNDP, RAF/87/099-TD/26/91, FAO, Rome.
Halfman J.D., Johnson T.C., Showers W.J. and Lister G. (1989). Authigenic
Hoekstra, D. and Corbett, J. (1995). Sustainable Agricultural Growth
low Mg-calcite in Lake Turkana, Kenya. Journal of African Earth
for Highlands of East and Central Africa: Prospects to 2020. Paper
Sciences, 8:533-540.
presented at the Ecoregions of the Developing World: A Lens for
Hamblin, P.F., Bootsma, H.A., Hecky, R.E., and McCullough, G. (1999).
Asessing Food, Agriculture and the Environment to the Year 2020,
Surface meteorological, thermal and fl ow regimes of Lake Malawi/
held at Washington DC, USA. Organised by the International Food
Nyasa: preliminary results and future studies. In: Ribbink, A.J. and
Policy Research Institute.
Ribbink A.C. (eds), SADC/GEF Lake Malawi/Nyasa/Niassa Biodiversity
Hongo, H. (2000). The relationship, between Human Activities in the
Conservation Project I. Senga Bay Conference: Extended
Fringing Wetlands of Lake Victoria and Causes of Pollution to the
Abstracts. Ministry of Forestry, Fisheries, and Environmental Aff airs,
lake Victoria. (Draft Paper).
Government of Malawi, Lilongwe, Malawi, p 86-87.
Hopson A.J. (ed.) (1982). Lake Turkana: A Report on the Findings of the
Hamblyn, E.L. (1960). The Nile perch project. EAFRO Annual Report,
Lake Turkana Project, 1972-1975, Vols. 1-6, Overseas Development
Appendix G, p 26-32.
Administration, London.
Hamilton, A.C. (1982). Environmental History of East Africa; A Study of
Hughes, R.H. and Hughes, J.S. (1992). A Directory of African Wetlands.
the Quaternary. Academic Press.
IUCN/UNEP/WCMC.
Hanek, G., Coenen, E.J. and Kotilainen, P. (1993). Aerial Frame Survey
Hulme M., Doherty R.M., Ngara T., New M.G. and Lister D. (2001). African
of Lake Tanganyika Fisheries. FAO/FINNIDA Research for the
climate change: 1900-2100. Climate Research, 17:145-168.
Management of the Fisheries on Lake Tanganyika. GCP/RAF/271/
Hutchinson, G.E. (1975). A Treatise on Limnology. Vol. I, Part 1, Geography
FIN-TD/09.
and Physics of Lakes. Wiley, Chichester.
Hann, N., Farmer, G. and Wheeler, R. (2003). Chronic vulnerability to
Ikiara, M. (1999). Sustainability, Livelihoods, Production and Eff ort Supply
food insecurity in Kenya 2001. A WFP Pilot Study for Improving
in a Declining Fishery: The Case of Kenya's Lake Victoria Fisheries.
Vulnerability Analysis.
Thela Thesis, Amsterdam, 1999.
Hecky, R.E. (1993). The Eutrophication of Lake Victoria. The Proceedings
Iles, T.D. (1960). A group of zooplankton feeders of the genus
of the International Association of Theoretical and Applied
Haplochromis (Cichlidae) in Lake Nyasa. Annals and Magazine of
Limnology, 25:39-48.
Natural History Series 13, 2:257-280.
Hecky, R.E. and Kling, H.J. (1981). The phytoplankton and
IPCC (1996). Climate Change 1995: Impacts, Adaptations and Mitigation
protozooplankton of the euphotic zone of Lake Tanganyika: species
of Climate Change, Scientifi c and Technical Analysis. Contribution
composition, biomass, chlorophyll content, and spatio-temporal
of Working Group II to the Second Assessment Report of the Inter-
distribution. Limnology and Oceanography, 26:548-564.
governmental Panel on Climate Change. Chapter 10, Hydrology and
Freshwater Ecology. Cambridge University Press.
REFERENCES
107
IPCC (2001). Special Report on The Regional Impacts of Climate Change:
Kasozi, G.N. (2001). Analysis of organochlorine pesticide residues in the
An Assessment of Vulnerability. Intergovernmental Panel on Climate
aquatic ecosystem of Lake Victoria. M.Sc. Thesis, Department of
Change, WMO/UNEP.
Chemistry, Makerere University.
Jackson, P.B.N., Iles, T.D., Harding, D. and Fryer, G. (1963). The fi shes
Kasweswe-Mafongo, W.M. (2003). Legal, policy and institutional
of Nyasaland with especial reference to Northern Lake Nyasa.
framework for environmental management in Malawi. Retrieved
In: Report on the Survey of Northern Lake Nyasa 1954-55 by the
Sept., 2003, from http://www.acts.or.ke/GE-Chapter5.pdf
Joint Fisheries Research Organization. Government Printer, Zomba,
Katunzi, E.F.B. (1996). A review of Lake Victoria fi sheries with
Malawi, p 55-117.
recommendations for management and conservation. In:
Jansen, E. G. (1997). Rich fi sheries - Poor Fisherfolk: Some Preliminary
Johnson, T.C. and Odada E.O. (eds), The Limnology, Climatology
Observations About the Eff ects of Trade and Aid in the Lake Victoria
and Paleoclimatology of the East African Lakes. Gordon and Breach,
Fisheries. Report No. 1. IUCN.
Toronto, p 357-364.
Johnson T.C., Halfman J.D., Rosendahl B.R. and Lister G.S. (1987).
Kaufman, L. (1992). Catastrophic Change in species-rich freshwater
Climatic and tectonic eff ects on sedimentation in a rift valley lake:
ecosystems: The Lessons from Lake Victoria. BioScience, 42:846-
evidence from high-resolution seismic profi les, Lake Turkana, Kenya.
858.
Geological Society of America Bulletin, 98:439-447.
Kaufman L. and Ochumba, P. (1993). Evolution and conservation biology
Johnson T.C. et al. (1990). Text to NSF Proposal, Unpublished.
of cichlid fi shes as revealed by faunal remnants in northern Lake
Johnson, T.C. and Ng'ang'a, P. (1990). Refl ections on a Rift Lake. In: Katz
Victoria. Conservation Biology, 7:719-730.
B.J. (ed), Lacustrine Basin Exploration: case studies and modern
Kay, M. (2001). Smallholder Irrigation Technology: Prospects for Sub-
analogs. Tulsa. American Association of Petroleum Geologists
Saharan Africa. International Programme for Technology and
Memoirs, p 113-135.
Research in Irrigation and Drainage, Knowledge Synthesis Report
Johnson, T.C., Kelts, K. and Odada, E. (2000). The Holocene history of
No. 3, March, 2001. FAO.
Lake Victoria. Ambio, 29:2-14.
Kidd, C.H.R. (1983). A water resources evaluation of Lake Malawi and the
Kabatereine N.B., Kazibwe, F. and Kamijumbe, J. (1996). The epidemiology
Shire River. Malawi Technical Report (MLW/77/012), UNDP, WMO.
of schistosomiasis in Kampala, Uganda. East African Medical Journal,
Geneva, Switzerland.
73:795-800.
Kiremire, B.T. (1997). The status of Chemicals in Uganda and a survey of
Kairu, J.K. (2001). Wetland use and impact on Lake Victoria, Kenya region.
Disposal Methods, February 1997, Lake View hotel, Mbarara.
Lakes and Reservoirs: Research and Management, 6:117-125.
Kirubi, C., Wamicha, W.N. and Laichena, J.K. (2000). The eff ects of
Kakogozo, B., Kahindo, N., Mwenyemaile, B. and Drieu O. (eds) (2000).
woodfuel consumption in the ASAL areas of Kenya: the case of
Etude Hydrologique du Bassin Nord-Ouest du Lac Tanganyika
Marsabit Forest. African Journal of Ecology, 38:47-52.
(R. D. Congo). Pollution Control and Other Measures to Protect
Kishimba, M. and Amkenda, A. (1995). The Impact of Structural
Biodiversity in Lake Tanganyika (UNDP/GEF/RAF/92/G32).
Adjustment Programmes on Urban Pollution and Sanitation:
Kallqvist, T., Lien, L. and Liti, D. (1988). Lake Turkana Limnological Study
Empirical Evidence from Urban Centres in Tanzania. In: Bagachwa,
1985-1988. Norwegian Institute for Water Research (NIVA) and Kenya
M.S.D. and Limbu, F. (eds), Policy reform and the Environment in
Marine Fisheries Research Institute (KEMFRI).
Tanzania. Dar es Salaam University Press, Dar es Salaam.
Kansiime, F. and Bugenyi, F.W.B. (1996). Specifi c studies on limnology and
Kituyi, E., Marufu, L., Wandiga, S.O., Jumba, I.O., Andreae, M.O. and Helas,
hydrology of the Great East African Lakes: A case study of nutrient
G. (2001). Biofuel availability and domestic use pattern in Kenya.
and pollutant loading into the Northern Region of Lake Victoria,
Biomass and Bioenergy, 20:71-82.
Uganda. Final Report, Kampala, sponsored by UNESCO ROSTA.
Kiyaga-Nsubuga, J. (2002). Cross-border Local Governments
Kansiime, F. and Nalubega, M. (1999). Wastewater treatment by a
Collaboration for Poverty Eradication in Africa: the Lake Victoria
Natural Wetland: The Nakivubo swamp, Uganda - processes and
Regional Authorities Cooperation Experience. Fifth Governance
implications. A Balkema Rotterdam.
Forum (AGF V) on Local Governance for Poverty Reduction in
Karanja, D.M.S. (2002). Health and diseases: a case study of Lake Victoria
Africa, Maputo, Mozambique. Issue Paper No. 5.
basin. In: The Lake Victoria Training Project, Annual Report 2002.
Pan-African START Secretariat, Nairobi.
108
GIWA REGIONAL ASSESSMENT 47 EAST AFRICAN RIFT VALLEY LAKES
Kling, H.J., Mugidde, R. and Hecky, R.E. (2001). Recent changes in
Lehman, J.T. (1996). Pelagic food webs of the East African Great Lakes.
the phytoplankton community of Lake Victoria in response to
In: Johnson, T.C. and Odada E.O. (eds), The Limnology, Climatology
eutrophication. In: Munawar, M. and Hecky, R.E. (eds), Great Lakes
and Paleoclimatology of the East African Lakes. Gordon and Breach,
of the World: Food Webs, Health and Integrity. Backhuys, Leiden,
Toronto, p 281-301.
p 47-66.
Lezzar, K.-E., Tiercelin, J.-J., De Batist, M., Cohen, A.S., Bandora, T., Van
Knaap, van der M., Ntiba, M.J. and Cowx, I.G. (2002). Key elements of
Rensbergen, P., Le Turdu, C., Mifundu, W. and Klerkx, J. (1996).
fi sheries management on Lake Victoria. Aquatic Ecosystem Health
New seismic stratigraphy and Late Tertiary history of the North
and Management, 5:245-254.
Tanganyika Basin, East African Rift System, deduced from
Komarek, J. and Kling, H. (1991). Variation in six planktonic cyanophyte
multichannel and high-resolution refl ection seismic data and
genera in Lake Victoria (East Africa). Archiv fŘr Hydrobiolgie
piston core evidence. Basin Research, 8:1-28.
Supplement, 61:21-45.
Ligtvoet, W. and Mkumbo, O.C. (1991). A pilot sampling survey for
Konings, A. (1995). Malawi Cichlids in their Natural Habitat. Cichlids Press,
monitoring the artisanal Nile perch Lates niloticus fi shery in the
Zevenhuizen, Holland.
southern Lake Victoria (East Africa). In: Cowx, A.G. (ed), Catch Eff ort
Kudhongania, A.W., Ocenodongo, D.L. and Okaronon, J.O. (1996).
Sampling Strategies: Their Application in Fresh Water Fisheries
Anthropogenic perturbations on the Lake Victoria exosystem. In:
Management. Fishing News Books, p 349-360.
Johnson, T.C. and Odada E.O. (eds), The Limnology, Climatology
Lindley, R. (2000a). The fi shing gears of Lake Tanganyika at the turn of
and Paleoclimatology of the East African Lakes. Gordon and Breach,
the millennium. Pollution Control and Other Measures to Protect
Toronto, p 625-632.
Biodiversity in Lake Tanganyika (UNDP/GEF/RAF/92/G32).
Kulindwa, K.A. (2000). Economics of water resources: key issues
Lindley, R. (ed) (2000b). Final situation report: Fishing in the waters
and challenges. Tanzania Journal of Population Studies and
adjoining the National Parks bordering Lake Tanganyika [Gombe
Development, 7:17-35.
Stream and Mahale Mountains, Nsumbu, and Rusizi.]. Pollution
Kulindwa, K.A. (2001). The Contribution of Lake Victoria Fisheries to
Control and Other Measures to Protect Biodiversity in Lake
the Tanzanian Economy. Report Submtted to: The Vice President's
Tanganyika (UNDP/GEF/RAF/92/G32).
Offi
ce, Lake Victoria Environmental Management Project (LVEMP),
Lowe-McConnell, R. (1994). The changing ecosystem of Lake Victoria,
Dar es Salaam.
East Africa. Freshwater Forum, 4:76-89.
Kulindwa, K. and Mbelle, A.V.Y. (2002). Environmental Consequences
Lowe-McConnell, R.H. (1995). Ecological Studies in Tropical Fish
of globalisation on Natural Resources. In: The Nyerere Legacy and
Communities. Cambridge Tropical Biology Series, Cambridge
Economic Policy Making in Tanzania. DUP, Dar es Salaam.
University Press.
Lackritz, E.M., Campbell, C.C., Reubush, T.K., Hightower, A.W., Wakube,
LVEMP (2001). Cost Benefi t Analysis of Wetlands Resources, Uganda.
W., Steketee, R.W. and Were J.B.O. (1992). Eff ects of blood transfusion
Prepared by consultants: Acere, T. O., Bugenyi, F.W.B., Kasenene,
of survival among children in a Kenyan hospital. The Lancet, 340:
J.M., Raad, H.J., Timmerman, J., Smithe, J., and Evraat, R.K. (CMS and
524-528.
HASKONING consultancy fi rms).
Lam, D.C.L., Leon, L., Hecky, R., Bootsma, H. and McRimmon, R.C. (2002).
LVFO (2000). The results of the fi rst regional fi sheries frame survey on
A modelling approach for Lake Malawi/Nyasa/Niassa: integrating
Lake Victoria. Lake Victoria Fisheries Organization Publication. Jinja,
hydrological and limnological data. In: Odada, E.O and Olago, D.O.
Uganda.
(eds), The East African Great Lakes: Limnology, Palaeolimnology
Magunda, M.K and Majaliwa, M. (2000). A review of the eff ects of
and Biodiversity. Advances in Global Change Research, Kluwer
population pressure on wetlands management practices in the
Academic Publishers, p 189-208.
Lake Victoria basin. African Journal of Tropical Hydrobiology and
Langenberg, V.T., Mwape, L.M., Tshibangu, K., Tumba, J.-M., Koelmans,
Fisheries, 19:78-91.
A.A., Roijackers, R., Salonen, K., Sarvala, J. and M÷lsń, H. (2002).
Mailu, A.M. (2001). Preliminary assessment of the social, economic
Comparison of thermal stratifi cation, light attenuation and
and environmental impacts of water hyacinth in the Lake Victoria
chlorophyll-a dynamics between the ends of Lake Tanganyika.
basin and the status of control. In: Julien, M.H. and Hill, M.P. (eds),
Aquatic Ecosystem Health and Management, 5:255-265.
Biological and Integrated Control of Water Hyacinth, Eichornia
crassipes. ACIAR Proceedings, 102:130-139.
REFERENCES
109
Majaliwa, M.J.G, Magunda, M.K. and Tenywa M. (2003). Eff ect of contour
Mitema, E.S. and Gitau, F.K. (1990). Organochlorine residues in fi sh from
bunds on soil erosion from major agricultural land-use systems in
Lake Victoria, Kenya. African Journal of Ecology, 28:234-239.
selected micro-catchments of Lake Victoria Basin. Paper presented
Mkumbo, O.C. (1999). Recent trends in the distribution patterns and
at 18th SSSEA Conference, December 3rd-9th, Mombasa, Kenya (in
catch rates from trawl surveys in Lake Victoria, Tanzania. In: Tweddle,
press).
D. and Cowx, I.G. (eds), Lake Victoria Fisheries Research Project
Mapila, S.A. (1992). The fi sheries statistics of Lake Malawi/Niassa. In:
Phase II: Part 1 - Report on Third FIDAWOG Workshop held at the
Ssentongo, G.W. and Dampha, N.J. (eds), Technical Consultaion
Triangle Hotel, Jinja, 29 March to 1 April 1999. LVFRP/TECH/99/06,
between Malawi and Mozambique on the Development and
Technical Document No. 6, p 18-29.
Management of the Fisheries of Lakes Malawi, Chilwa and Chiuta.
Mkumbo, O.C. and Cowx, I.G. (1999). Catch trends from Lake Victoria
Report, FAO, Bujumbura, Burundi.
ş Tanzanian waters. In: Cowx, I.G and Tweddle, D. (eds), Report on
Mapila, S.A. (1998). Fisheries. In: Environmental Aff airs Department
Fourth FIDAWOG Workshop held at Kisumu, 16-20 August 1999.
(ed), State of Environment Report for Malawi, 1998. Government of
LVFRP/TECH/99/07, The Lake Victoria Fisheries Research Project
Malawi, Lilongwe, Malawi.
Technical Document No. 7, p 99-107.
Marenya, M. and Nyaguti, J.O. (2000). Irrigation and drainage
Mugidde, R. (1993). The increase in phytoplankton productivity and
development in Kenya. Proceedings of Nyanza Professional Caucus,
biomass in Lake Victoria (Uganda). International Association of
Symposium on Water Resources and Sanitation Management in
Theoretical and Applied Limnology, Proceedings, 25:846-849.
Kenya, 11-12 May 2000.
Muthuri, F.M., Jone, M.B. and Imbamba, S.K. (1989). Primary Productivity
Masaba C.S. (1980). The epidemiology of schistosomiasis in Kisumu
of Papyrus (Cyperus Papyrus) in a Tropical Swamp: Lake Naivasha,
Municipality. Medicom, 2:47-51.
Kenya. Biomass, 18:1-14.
Massinga, A. (1990). River impact on the cyprinid fi shery of the
Namisi, P.W. 2001. Socio-economic implications of the fi sh export
Mozambican side of Lake Nyassa/Malawi, with particular reference
trade on the fi shers and fi sheries of Lake Victoria in Uganda.
to the genus Osparidium and the importance of long-term data
LVFRP Technical Document No. 14. LVFRP/TECH/01/14. Jinja, Socio-
collection. In: Fisheries of the African Great Lakes, International
economic Data Working Group of the Lake Victoria Fisheries
Agricultural Center, Wageningen, Netherlands, Occas. Paper 3,
Research Project.
96-108.
National Biodiversity Unit (1992). The Costs, Benefi ts and Unmet Needs
Mbuga, J.S., Getabu, A., Asila, A., Medard, M., and Abila, R. (1998). Trawling
of Biodiversity Conservation in Kenya. Report, 1992.
in Lake Victoria, IUCN, Report No. 3.
NEMA (1998). State of the Environment Report for Uganda.
McClelland, F.J. and Jordan, P. (1962). Schistosomiasis at Bukoba,
Nicholson, S.E. (1996). A Review of Climate Dynamics and Climate
Tanganyika, on L. Victoria. Annals of Tropical Medicine and
Variability in Eastern Africa. In: Johnson, T.C., and Odada, E.O. (eds),
Parasitology, 56:396.
The Limnology, Climatology and Paleoclimatology of the East
McDougall, I. (1985). K-Ar and 40Ar/39Ar dating of the hominid-bearing
African Lakes. Gordon and Breech, p 25-56.
Plio-Pliestocene sequence at Koobi Fora, Lake Turkana, northern
Nicholson, S.E. and Yin, X. (2002). Mesoscale patterns of rainfall,
Kenya. Geological Society of America Bulletin, 96:159-175.
cloudiness and evaporation over the Great Lakes of East Africa. In:
Meadows, K. and Zwick, K. (2000). The SESS recommendations to the
Johnson, T.C. and Odada E.O. (eds), The Limnology, Climatology
Strategic Action Programme. Report No. IV, Final Report. Pollution
and Paleoclimatology of the East African Lakes. Gordon and Breach,
Control and Other Measures to Protect Biodiversity in Lake
Toronto, p 93-119.
Tanganyika (UNDP/GEF/RAF/92/G32).
Nriagu J. (1992). Toxic metal pollution in Africa. The Science of the Total
Meertens, H.C., Ndege, L.J. and Enserink, H.J. (1995). Dynamics in farming
Environment, 121:1-37.
systems: changes in time and space in Sukumaland, Tanzania, Royal
NRIL (Natural Resources International Limited) (2002). Fisheries
Tropical Institute/Amsterdam.
Management Plan of the Lake Victoria Fisheries Organisation:
Michel, A.E., Cohen, A.S., West, K.A., Johnston, M.R. and Kat, P.W.
Feasibility Study. Final Report, April 2002.
(1992). Large African lakes as natural laboratories for evolution:
Ntiba, M.J. (2003). Capacity building for shared water ecosystems in the
examples from the endemic gastropod fauna of Lake Tanganyika.
Lake Victoria region. In Press. United Nations University Press. Tokyo,
Mitteilungen Internationale Vereinigung fŘr Theoretische und
Japan (In press).
Angewandte Limnologie, 23:85-99.
110
GIWA REGIONAL ASSESSMENT 47 EAST AFRICAN RIFT VALLEY LAKES
Ntiba, M.J. and Ogana, W. (2003). Potential Impact of Climate Change
Okaronon, J.O. (1999). The fi sh stocks of Lake Victoria (Uganda). In:
on fi sheries of Lakes Naivasha and Victoria, Kenya. In proceedings
Tweddle, D. and Cowx, I.G. (eds), Lake Victoria Fisheries Research
of Lake Victoria 2000: A new beginning. United Nations University
Project Phase II: Part 1 - Report on Third FIDAWOG Workshop held
Press (In Press).
at the Triangle Hotel, Jinja, 29 March to 1 April 1999. LVFRP/TECH/
Ntiba, M.J., Bugenyi, F. W. B. and Odada, E.O. (2003). Fish in the Lake
99/06, Technical Document No. 6, p 30-37.
Victoria waters and the development of the people of East
Olago, D.O. and Odada, E.O. (2000). An interbasinal study of the
Africa;challenges and prospects for the region (In press).
sedimentology of late Holocene sediments in the rift valley Lake
Ntiba, M.J., Kudoja, W.M. and Mukasa, C.T. (2001). Management issues
Turkana, Kenya. Journal of African Earth Sciences, 31:237-252.
in the Lake Victoria watershed. Lakes and Reservoirs: Research and
Ongweyi, G.S. (1979). Water resources of the Lake Victoria basin in Kenya.
Management, 6:211-216.
In: Okidi, C.O. (ed), Natural Resources and the Development of Lake
Nyambose, J. (1997). Preserving the future for Lake Malawi.
Victoria Basin of Kenya. Institute of Development Studies, University
African Technology Forum. Retrieved July, 2003, from:
of Nairobi, Occasional Papers No. 34.
http://web.mit.edu/africantech/www/articles/Lake_Malawi.html
O'Reilly, C. (1998). Impact of sedimentation on primary production.
Nyamweru, C.K. (1983). Rifts and Volcanoes: A Study of the East African
Pollution Control and Other Measures to Protect Biodiversity in
Rift System. Thomas Nelson and Sons, Nairobi.
Lake Tanganyika (UNDP/GEF/RAF/92/G32).
Nyanda, M. (2000). Report on the Study of Agrochemical use and
O'Reilly, C.M., Alin, S.R., Plisnier, P.-D., Cohen, A.S. and McKee, B.A. (2003).
handling in the Lake Zone, Tanzania.
Climate change decreases aquatic ecosystem productivity of Lake
Ochumba, P.B.O. (1996). Measurement of water currents, temperature,
Tanganyika, Africa. Nature, 424:766-768.
dissolved oxygen and winds on the Kenyan Lake Victoria. In:
Orr, A. and Mwale, B. (2001). Adapting to Adjustment:Smallholder
Johnson, T.C. and Odada E.O. (eds), The Limnology, Climatology
livelihood Strategies in Southern Malawi. World Development, 29:
and Paleoclimatology of the East African Lakes. Gordon and Breach,
1325-1343.
Toronto, p 155-167.
Orr, A., Mwale, B. and Saiti, D. (2001). Market Liberalisation household
Odongkara, O.K. and Okaronon, J.O. (1999). Impact of economic reforms
food security and Rural Poor in Malawi. European Journal of
on the performance of fi sh processing fi rms and the fi sheries
Development Research, 13:47-69.
resource. In: Bahiigwa, G. (ed), Capacity Building for Integrating
Othina, A. (1999). The status of the artisanal fi shery of Lake Victoria,
Environmental Considerations in Development Planning and
Kenya. In: Tweddle, D. and Cowx, I.G. (eds), Lake Victoria Fisheries
Decision-Making with particular reference to the Fishing Industry
Research Project Phase II: Part 1 - Report on Third FIDAWOG
in Uganda. Economic Policy Research Centre, Makerere University
Workshop held at the Triangle Hotel, Jinja, 29 March to 1 April 1999.
Campus, Kampala, Uganda, p 8-26.
LVFRP/TECH/99/06, Technical Document No. 6, p 73-78.
Ogallo, L. J. (1989). The spatial and temporal patterns of the East African
Owen R.B., Barthelme J.W., Renaut R.W. and Vincens A. (1982).
seasonal rainfall derived from principal components analysis.
Palaeolimnology and archeology of Holocene deposits north-east
International Journal of Climatology, 9:145-167.
of Lake Turkana, Kenya. Nature, 298:523-529.
Ogari, J. (1981). A review of Lake Turkana fi sheries. Proceedings of the
Owen, R., Crossley, R., Johnson, T., Tweddle, D., Kornfi eld, I., Davison, S.,
Workshop of KMFRI on Aquatic Resources of Kenya, July 13-19,
Eccles, D. and Engstrom, D. (1990). Major low levels of Lake Malawi
1981.
and their implications for speciation rates in cichlid fi sheries.
Ogutu-Ohwayo, R. (1990). The decline of the native fi shes of Lakes
Proceedings of the Royal Society of London, Series B, 240:519-553.
Victoria and Kyoga (East Africa) and the impact of introduced
Owino, J.P. (1999). Traditional and Central Management Systems of the
species, esprcially Nile perch, Lates niloticus and Nile tilapia
Lake Victoria Fisheries in Kenya. IUCN Report No. 4.
Oreochromis niloticus. Environmental Biology of Fishes, 27:81-86.
Patterson, G. and Kachinjika, O. (1995). Limnology and phytoplankton
Ogutu-Ohwayo, R. (1992). The purpose costs and benefi ts of
ecology. In: Menz, A. (ed), The Fishery Potential and Productivity of
introductions with specifi c reference to the Great Lakes of Africa.
the Pelagic Zone of Lake Malawi/Niassa: Scientifi c Report of the UK/
International Association of Theoretical and Applied Limnology,
SADC pelagic fi sh resource assessment project. Natural Resources
Proceedings 23:34-44.
Institute, Kent, UK. p 1-67.
REFERENCES
111
Patterson, G. and Makin, J. (1998). The State of Biodiversity in Lake
Ribbink, A.J. (1991). Distribution and ecology of the cichlids of the
Tanganyika - A Literature Review. Pollution Control and Other
African Great Lakes. In: Keenleyside, M.H.A. (ed), Cichlid Fishes
Measures to Protect Biodiversity in Lake Tanganyika (UNDP/GEF/
Behaviour, Ecology, and Evolution. Chapman and Hall, London, UK.
RAF/92/G32). Natural Resources Institute, Chatham, UK.
Fish and Fisheries Series, p 36-59.
Pearce, M.J. (1995). Eff ects of exploitation on the pelagic fi sh community
Ribbink, A.J. (2001). Lake Malawi/Niassa/Nyasa Ecoregion: Biophysical
in the south of Lake Tanganyika. In: Pitcher, T.J. and Hart, P.J.B. (eds),
Reconnaissance. WWF Southern African Regional Programme
The Impacts of Species Changes in African Lakes. Chapman and
Offi
ce (WWF SARPO), Harare, Zimbabwe.
Hall, London, p 425-442.
Ricardo-Bertram, C.K, Borley, H.J.H. and Trewavas, E. (1942). Report on the
Peng T. and Broecker W.S. (1980). Gas exchange rates for three closed
fi sh and fi sheries of Lake Nyasa. Pub. on behalf of the government of
basin lakes. Limnology and Oceanography, 25:789-796.
Nyasaland by the Crown agents for the colonies, London.
Perrings, C. (ed) (2000). The Economics of Biodiversity Conservation
Roberts, J. M. D. (1964). Control of epidemic malaria in the highlands
in sub-Sahara Africa: Mending the Ark. Elgar: Chelterham, UK and
of Western Kenya, Part III. After the campaign. Journal of Tropical
Northampton, Mass.
Medicine & Hygiene, 67:230-237.
Petit, P. and Kiyuku, A. (1995). Changes in the pelagic fi sheries of
Roest, F. C. (1992). The pelagic fi sheries resources of Lake Tangnyika.
northern Lake Tanganyika during the 1980s. In: Pitcher, T.J. and
Mitteilungen Internationale Vereinigung fŘr Limnologie, 23:11-15.
Hart, P.J.B. (eds), The Impacts of Species Changes in African Lakes.
Ropelewski, C.F. and Halpert, M.S. (1987). Global and regional scale
Chapman and Hall, London. p 443-455.
precipitation patterns associated with the El Ni˝o/Southern
Quan, J. (1996). Social, economic, and sectoral features of the Lake
Oscillation. Monthly Weather Review, 115:1606-1626.
Tanganyika Basin: Baseline review. (Vol. One: Executive summary,
Ruud, C.M. (1995). Conservation and management of the African Great
analysis and workplan; Vol. Two (Annexes): Detailed fi ndings; Vol.
Lakes, Victoria, Tanganyika and Malawi. UNESCO/IHP-IV project. M-
Three: Environmental Education.). Pollution Control and Other
51. Comparative and comprehensive study of Great Lakes, p 6-9.
Measures to Protect Biodiversity in Lake Tanganyika (UNDP/GEF/
Salonen, K., Savala, J., Jńrvinen, M., Aro, E., Huttula, T., Kotilainen, P., Kurki,
RAF/92/G32). Natural Resources Institute, Chatham.
H., Langenberg, V., Mannini, P., Peltonen, A., Plisnier, P-D., Vuorinen,
Raymakers, B. (2003). South Omo: pocket areas requiring food aid, overall
I., M÷lsń, H. and Lindqvist, O. (1999). Trophic structure of Lake
situation necessitates close monitoring into 2003. DPPC/WFP/UN-
Tanganyika: carbon fl ows in the pelagic food web. Hydrobiologia,
EUE Multi Agency Food Security & Agricultural Assessment Mission:
407:149-173.
1 to 6 October 2002. UN-Emergencies Unit for Ethiopia (UN-EUE).
Sarvala, J., Tarvainen, M., Salonen, K. and Molsa, H. (2002). Pelagic food
Republic of Kenya (1999). Economic Survey 1999. Government Printers,
web as the basis of fi sheries in Lake Tanganyika: a bioenergetic
Nairobi.
modelling analysis. Aquatic Ecosystem Health and Management,
Republic of Kenya (2002a). Marsabit District Development Plan, 2002-
5:283-292.
2008. Ministry of Finance and Planning. Government Printers.
Scheren, P.A.G.M., Zanting, H.A. and Lemmens, A.M.C. (2000). Estimation
Republic of Kenya (2002b). Turkana District Development Plan, 2002-
of water pollution sources in Lake Victoria, East Africa: Application
2008. Ministry of Finance and Planning. Government Printers.
and elaboration of the rapid assessment methodology. Journal of
Reynolds, J. E. (1999). Lake Tanganyika Framework Fisheries Management
Environmental Management, 58:235-248.
Plan. FAO/Norway Programme of Assistance to Developing
Scholz, C.A. and Rosendahl, B.R. (1988). Low lake stands in Lakes Malawi
Countries for the Implementation of the Code of Conduct for
and Tanganyika, East Africa, delineated with multifold seismic data.
Responsible Fisheries (GCP/int/648/NOR). FAO, Rome.
Science, 240:1645-1648.
Reynolds, J.E. and Greboval, D.F. (1995). Socio-economic eff ects of the
Schuijt, K. (2002). Land and Water Use of Wetlands in Africa: Economic
evolution of Nile perch fi sheries in Lake Victoria: a review. FAO: CIFA
Values of African Wetlands. International Institute for Applied
Technical Paper 17.
Systems Analysis, Interim Report IR-02-063, Austria.
Ribbink, A.J., Marsh, B.A., Marsh, A.C., Ribbink, A.C. and Sharp, B.J. (1983).
SEDAWOG (1999). Marketing study. LVFRP/TECH/99/02, The Lake
A preliminary survey of the cichlid fi shes of rocky habitats in Lake
Victoria Fisheries Research Project Technical Document No. 2,
Malawi. South African Journal of Zoology, 18:149-310
Jinja, Uganda.
112
GIWA REGIONAL ASSESSMENT 47 EAST AFRICAN RIFT VALLEY LAKES
SEDAWOG (2000). Fisheries co-management options at Kiumba
Ssentongo, J. (1998). Assessment of pollution to Lake Victoria by
beach: a participatory pilot study. LVFRP/TECH/00/08, The Lake
industrial and municipal activities in Uganda. Thesis, Chemistry
Victoria Fisheries Research Project Technical Document No. 6,
Department, Makerere University.
Jinja, Uganda.
Survey of Kenya (1977). National Atlas of Kenya, 3rd edition, Nairobi, p
Seehausen, O. (1996). Lake Victoria Rock Cichlids: Taxonomy, Ecology,
15-21.
and Distribution. Verduijn Press, Zevenhuizen, The Netherlands.
Swallow, B., Walsh, M., Nyantika, D., Muriithi, S., Noordin, Q., Ong, C.,
Shapiro, R.L., Otieno, M.R., Adcock, P.M., Phillips-Howard, P.A., Hawley,
Shepherd, K., Place, F., Awiti, A., Hai, M., Ochieng, O., Cohen, M.,
W.A., Kumar, L., Waiyaki, P., Nahlen, B.L. and Slutsker, L. (1999).
Mugo, F., Oyasi, S., Omuto, C., Cohen, L. and Okono. A. (2002).
Transmission of epidemic Vibrio cholerae O1 in rural western
Improved land management in the Lake Victoria Basin. Annual
Kenya associated with drinking water from Lake Victoria: An
Technical Report July 2001 to June 2002. World Agroforestry
environmental reservoir for cholera? American Journal of Tropical
Centre (ICRAF), Natural Resource Problems, Priorities and Policies
Medicine and Hygiene, 60:271-276.
Programme, Working Paper Series, Working Paper 2002-2. World
Sheik-Mohammed, A. and Velema, J.P. (1999). Where health care has no
Agroforestry Centre and National Agricultural and Livestock
access: the nomadic populations of sub-Saharan Africa. Tropical
Extension Programme of the Kenya Ministry of Agriculture and
Medicine and International Health, 4:695-707.
Rural Development, Nairobi, Kenya.
Shepherd, K., Walsh, M., Mugo, F., Ong, C., Hansen, T.S., Swallow, B.,
Talling, J.F. (1965). The photosynthetic in East African Lakes. International
Awiti, A., Hai, M., Nyantika, D., Ombao, D., Grunder, M., Mbote, F.
Review of Hydrobiology, 50:1-32.
and Mungai, D. (2000). Improved Land Management in the Lake
Talling, J.F. (1966). The annual cycle of stratifi cation and phytoplankton
Victoria Basin: Linking Land and Lake, Research and Extension,
growth in Lake Victoria. Internationale Revue der gesamten
Catchment and Lake Basin. Final Technical Report, Startup Phase,
Hydrobiologie und Hydrographie, 51:545-621.
July 1999 to June 2000, Working Paper Series, Working Paper
Tarbit, J. (1971). Lake Malawi Trawling Survey: Interim Report 1969-1971.
2000-2. International Centre for Research in Agroforestry and
Malawi Fisheries Department. Fisheries Bulletin, Lilongwe, 2:1-16.
Kenya Ministry of Agriculture and Rural Development, Soil and
Thompson, J. and Cairncross, S. (2002). Drawers of Water: assessing water
Water Conservation Branch, National Soil and Water Conservation
in Africa. Bulletin of the World Health Organization, 80:61-62.
Programme, Nairobi, Kenya.
Tiercelin, J.-J. and Mondeguer, A. (1991). The geology of the Tanganyika
Sichingabula, H. (1999). Analysis and results of discharge and sediment
trough. In: Coulter, G.W. (ed), Lake Tanganyika and its Life. Oxford
monitoring activities in the southern Lake Tanganyika basin, Zambia.
University Press, London, p 7-48.
Pollution Control and Other Measures to Protect Biodiversity in Lake
Tiercelin, J.-J. and Lezzar, K.-E. (2002). Geological and structural setting of
Tanganyika (UNDP/GEF/RAF/92/G32).
the East African lakes. In: Odada, E.O. and Olago, D.O. (eds), The East
Snoeks, J. (2000). How well known is the ichthyodiversity of the large
African Great Lakes: Limnology, Palaeolimnology and Biodiversity.
East African Lakes? In: Rossiter, A. and Kawanabe, H. (eds), Ancient
Advances in Global Change Research, Kluwer Academic Publishers,
Lakes: Biodiversity, Ecology and Evolution. Advances in Ecological
p 3-60.
Research, 31:17-38.
Tole, M.P. and Shitsama, J.M. (2000). Concentrations of Heavy metals
Snoeks, J., Ruber, L. and Verheyen, E. (1994). The Tanganyika problem:
in water, fi sh and sediments of the Winam Gulf, Lake Victoria. Lake
comments on the taxonomy and distribution patterns of its cichlid
Victoria 2000: A new Beginning; International Conference, Jinja.
fauna. In: Martens, K., Goddeeris, B. and Coulter, G. (eds), Speciation
Turner, G. (1994). Fishing and conservation of the endemic fi shes of Lake
in Ancient Lakes. edited by Archiv fŘr Hydrobiologie, 44:355-372.
Malawi. Archiv fŘr Hydrobiologie, 44:481-494.
Spigel, R.H. and Coulter, G.W. (1996). Comparison of hydrology and
Tweddle, D. (1992). Conservation and threats to the resources of Lake Malawi.
physical limnology of the East African Great Lakes: Tanganyika,
Mitteilungen Internationale Vereinigung Limnologie, 23:17-24.
Malawi, Victoria, Kivu and Turkana (with reference to some North
Tweddle, D. and Skelton, P.H. (1993). River fi shes of the Lake Malawi
American Great Lakes). In: Johnson, T.C. and Odada E.O. (eds), The
catchment area. Part II: First record of the blotched catfi sh, Clarias
Limnology, Climatology and Paleoclimatology of the East African
stappersii Boulenger, in Malawi, Nyala, 16:73-76.
Lakes. Gordon and Breach, Toronto, p 103-139.
Ssentongo, G.W. (1972). Yield isopleths of O. esculenta (Graham) 1928 in
Lake Victoria and O. niloticus (Linnaeus) 1757 in Lake Albert. African
Journal of Tropical Hydrobiology and Fisheries, 2:121-128.
REFERENCES
113
Twongo, T. (1996). Growing impact of water hyacinth on near shore
Wandiga, S. and Onyari, J. (1987). The concentration of heavy metals: Mn,
environments of Lakes Victoria and Kyoga (East Africa). In:
Fe, Cu, Zn, Cd and Pb in sediments and fi sh from the Winam Gulf
Johnson, T.C. and Odada E.O. (eds), The Limnology, Climatology
of Lake Victoria and fi sh bought in Mombasa town markets. Kenya
and Paleoclimatology of the East African Lakes. Gordon and Breach,
Journal of Science, 8:5-18.
Toronto, p 633-642.
Wandiga, S.O, Kaigwara, P.N. and Lalah, J.O. (2002). Pesticides in Kenya: In:
Twongo, T., Bugenyi, F.W.B., and Wanda, F. (1995). The potential for
Taylor, M.D., Klaine, S.J., Carvalho, F.P., Barcelo, D. and Everaats, J. (eds),
further proliferation of water hyacinth in Lakes Victoria, Kyoga and
Pesticide Residues in Coastal Tropical Ecosystems. Distribution, fate
Kwania and some urgent aspects of research. African Journal of
and eff ects. Taylor and Fancis, London and New York, p 49-80.
Tropical Hydrobiology and Fisheries, 6:1-10.
Warsame, M. (1991). Impact of population movement on malaria
UN Kenya (2003). Kenya Humanitarian Update, May 2003. Disaster
transmission in Somalia. In: Malaria and Development in Africa:
Prevention, Management and Coordination Unit, UN Kenya
a Cross-Sectoral Approach. American Association for the
Resident Coordinator Offi
ce, Nairobi.
Advancement of Science. Sub-Saharan Africa Program, Washington
UNDP (2000). The Human Development Report. Available at:
DC, p 217-221.
http://www.undp.org/hdro/
Wasswa, J. (1997). Determination of Pollutants within Sediments in Water
UNECA (2000). Transboundary River/Lake Basin Water Development in
Channels from Industries and in selected parts of Lake Victoria.
Africa: Prospects, Problems and Achievements.
Thesis, Makerere University.
UNEP-IETC (2003). Planning and Management of Lakes and Reservoirs:
West, K. (ed.) (2001). Lake Tanganyika: Results and Experiences
An Integrated Approach to Eutrophication. Retrieved July, 2003,
of the UNDP/GEF Conservation Initiative. Lake Tanganyika
from: http://www.unep.or.jp/ietc/publications/techpublications/
Biodiversity Project. UNDP/GEF/UNOPS, RAF/92/G32. Available
techpub-11/2-5-2c.aspURT, 2002.
http://www.ltbp.org.
UNHCR (2000). Retrieved from http://www.unhcr.org
Wetzel, R.G. (1983). Limnology. 2nd edition. CBS College Publishing,
UNICEF (2003). Country Statistics. Retrieved Aug., 2003, from
New York.
http://www.unicef.org
WHO (1999) Outbreak news.
URT/JICA (2002). The Master plan study on Fisheries Development in
Willoughby, N.G., Watson, I.G. and Twongo, T. (1996). Preliminary studies
the United Republic of Tanzania. Fisheries Department, Ministry of
on the eff ects of water hyacinth on the diversity, abundance and
Natural Resources and Tourism, Dar es Salaam.
ecology of the littoral fi sh fauna in Lake Victoria, Uganda. In:
Verburg, P., Hecky, R.E. and Kling, H. (2003). Ecological consequences of a
Johnson, T.C. and Odada E.O. (eds), The Limnology, Climatology
century of warming in Lake Tanganyika. Science, 301:468-469.
and Paleoclimatology of the East African Lakes. Gordon and Breach,
Verschuren, D., Johnson, T.C., Kling, H.J., Edgington, D.N., Leavitt, P.R.,
Toronto, p 643-655.
Brown, E.T., Talbot, M.R. and Hecky, R.E. (2002). History and timing
Wilson, E., Sutherland, J. and Ekola, A. (1999). Scientists discover previously
of human impact of Lake Victoria, East Africa. Proceedings of the
unknown source of pollution that is killing the world's second
Royal Society of London, Series B, 269:289-294.
largest freshwater lake. Retrieved Oct., 2002, from Future Harvest,
Vollmer, M.K., Weiss, R.F. and Bootsma, H.A. (2002). Ventilation of Lake
from: http://www.futureharvest.org/news/11051999.shtml
Malawi/Nyasa. In: Odada, E.O. and Olago, D.O. (eds), The East
Witte, F., Goldschmidt, T., Wanink, J.M., Oijen, M.J.P., Van Witte-Mass,
African Great Lakes: Limnology, Palaeolimnology and Biodiversity.
E.L.M. and Bouton N. (1992). The destruction of endemic species
Advances in Global Change Research, Kluwer Academic Publishers,
fl ock; quantitative data on decline of haplochromine cichlids of
p 209-233.
Lake Victoria. Environmental Biology of Fishes, 29:1-28.
Waktola, A. (1999). Exploratory study of two regions in Ethiopia to
Witte, F., Goldschmidt, T., Goudswaard, P.C., Katunzi, E.F.B, Mkumbo, O.C.,
identify target areas and partners for intervention. Drylands
Seehausen, O. and Wanink, J.H. (1999). Lake Victoria's ecological
Coordination Group, Report No. 6.
changes and their relationships with the riparian societies. In:
Walsh J. and Dodson R.G. (1969). Geology of Northern Turkana.Geological
Kawanabe, H., Coulter, G.W. and Roosevelt, A.C. (eds), Ancient Lakes:
Survey of Kenya, Report No. 82.
their cultural and biological diversity. Kenobi Productions, Ghent,
Wandiga, S.O. (1981). The concentrations of zinc, copper, lead,
Belgium, p 189-202.
manganese, nickel and fl uoride in rivers and lakes of Kenya, SINET:
World Bank (1996). Kenya, Tanzania and Uganda: Lake Victoria
Ethiopian Journal of Science, 3:67-74.
Environmental Management Project. GEF Documentation Report
No. 15541 ş ARF.
114
GIWA REGIONAL ASSESSMENT 47 EAST AFRICAN RIFT VALLEY LAKES
World Bank (1999). Country profi les (Burundi, D.R. Congo, Tanzania,
Yongo, E. (1991). Socio-economic aspects of fi sh utilisation and
Zambia). Retrieved from http://www.worldbank.org.html.extdr/
marketing. Kisumu Kenya Marine and Fisheries Research Institute
off rep/afr.
document.
World Bank (2003). Malawi ş Lake Malawi Ecosystem and Management
Yongo, E.O. (2000). Poor fi sheries, poor fi sherfolk: sustaining the fi sheries
Project. Africa Regional Offi
ce, Project ID MWPL-66196. Report.
of Lake Victoria for future use. Unpublished M.Sc. Thesis, University
Retrived Sept., 2003, from http://www.cbnrm.net/pdf/worldbank_
of Hull.
007_projrct_malawi_001_ecosystemgmt_pid.pdf
Yuretich R.F. (1979). Modern sediments and sedimentary processes
World Lakes Database (2002). Lake Turkana. Retrieved Jan., 2002, from
in Lake Rudolf (Lake Turkana), Eastern Rift Valley, Kenya.
http://www.ilec.or.jp/database/afr/afr-20.html
Sedimentology, 26:313-331.
Wothington, S. and Worthington, E.B. (1933). Inland Waters of Africa.
Yuretich R.F. and Cerling T.E. (1983). Hydrogeochemistry of Lake Turkana,
MacMillan and Co., London.
Kenya: mass balance and mineral reactions in an alkaline lake.
WWF (2003). Lake Malawi/Niassa/Nyasa Ecoregion: Report on the
Geochimica et Cosmochimica Acta, 47:1099-1109.
Donors and Partners Meeting, Club Makokola, Malawi, 12-13
May 2003. In: Wright, A. and Chafota, J. (eds), WWF Ecoregion
Personal communication
Conservation Programme. Retreived Sept., 2003, from Abila, R.O. (Kenya Marine and Fisheries Research Institute, Kenya)
http://www.ramsar.org/mtg_malawi_wwf_2003_annex3.pdf
Bootsma, H.A. (Great Lakes Water Institute, University of Wisconsin-
Milwaukee, United States)
REFERENCES
115
Annexes
Annex I
List of contributing authors and organisations involved
Lead authors
Name
Institutional affiliation
Country
Field of work
Prof. Eric O. Odada (regional co-ordinator)
Pan African START Secretariat (PASS), Geology Department, University of Nairobi
Kenya
Sediment geochemistry
Dr. Daniel Olago
Pan African START Secretariat (PASS), Geology Department, University of Nairobi
Kenya
Environmental geology and geolimnology
Dr. Kassim A. A. Kulindwa
Economic Research Bureau, University of Dar es Salaam
Tanzania
Socio-economy
Prof. Fred Bugenyi
Department of Zoology, Makerere University, Kampala
Uganda
Wetland ecosystem management
Dr. Kelly West
IUCN Eastern Africa Regional Office, Nairobi
Kenya
Wetlands and water biodiversity of the African Great Lakes
Prof. Micheni Ntiba
Department of Zoology, University of Nairobi
Kenya
Fisheries biology
Prof. Shem Wandiga
Department of Chemistry, University of Nairobi
Kenya
Environmental chemistry
Dr. Jerome Karimumuryango
NECN Institute National pour L'Environnement et ala Conservation de la Nature, Gitega
Burundi
Socio-environment and development
Contributing authors
Name
Institutional affiliation
Country
Field of work
Mr. Ernest Yongo
Kenya Marine Fisheries Research Institute, Kisumu
Kenya
Resource economy
Mr. Richard Abila
Kenya Marine Fisheries Research Institute, Kisumu
Kenya
Economy
Mr. Andrew Asila
Kenya Marine Fisheries Research Institute, Kisumu
Kenya
Statistics
Dr. Diana Karanja
Kenya Medical Research Institute, Kisumu
Kenya
Freshwater diseases in the Lake Victoria environment
Dr. N Gichuki
Centre for Biodiversity, National Museums of Kenya, Nairobi
Kenya
Ecology
Dr. Maggie Opondo
Department of Geography, University of Nairobi
Kenya
Human geography
Dr. Pius S Achola
Kenya
Community health
Dr. Peninah Aloo-Obudho
Kenyatta University, Nairobi,
Kenya
Fisheries expert/aquatic ecologist
Dr. Obiero Ong'ang'a
OSIENALA (Friends of Lake Victoria), Kisumu
Kenya
Prof. Charles Okidi
Institute of Development Studies, University of Nairobi
Kenya
Environmental law
Dr. George M Wamukoya
Centre for Research and Education on Environmental Law (CREEL), Nairobi
Kenya
Environmental policy
Mr. Peter G Ambenje
Drought Monitoring Centre, Nairobi
Kenya
Climate change
116
GIWA REGIONAL ASSESSMENT 47 EAST AFRICAN RIFT VALLEY LAKES
Anne
Annex II
x II
Detai
Deta l
i ed sc
l
or
ed sco i
r n
i g ta
n
bles
g ta
: Lake Turkana
I: F
: r
F eshw
esh a
w t
a er shor
t
tage
II: Pollution
Weight
Weight
Environmental
Environmental
Environmental issues
Score
Weight %
averaged
Environmental issues
Score
Weight %
averaged
concern
concern
score
score
1. Modification of stream flow
2
80
Freshwater shortage
1.8
4. Microbiological
0
0
Pollution
1.6
2. Pollution of existing supplies
1
20
5. Eutrophication
1
40
3. Changes in the water table
0
0
6. Chemical
0
0
7. Suspended solids
2
60
8. Solid wastes
0
0
Criteria for Economic impacts
Raw score
Score
Weight %
9. Thermal
0
0
Size of economic or public sectors
Very small
Very large
1
30
affected
0 1 2 3
Degree of impact (cost, output changes
Minimum
Severe
10. Radionuclide
0
0
2
60
etc.)
0 1 2 3
Occasion/Short
Continuous
11. Spills
0
0
Frequency/Duration
3
10
0 1 2 3
Weight average score for Economic impacts
1.8
Criteria for Health impacts
Raw score
Score
Weight %
Criteria for Economic impacts
Raw score
Score
Weight %
Very small
Very large
Number of people affected
2
40
Size of economic or public sectors
Very small
Very large
0 1 2 3
1
30
affected
0 1 2 3
Minimum
Severe
Degree of severity
1
50
Degree of impact (cost, output changes
Minimum
Severe
0 1 2 3
1
50
etc.)
0 1 2 3
Occasion/Short
Continuous
Frequency/Duration
3
10
Occasion/Short
Continuous
0 1 2 3
Frequency/Duration
1
20
0 1 2 3
Weight average score for Health impacts
1.6
Weight average score for Economic impacts
1.0
Criteria for Other social and
Raw score
Score
Weight %
community impacts
Criteria for Health impacts
Raw score
Score
Weight %
Number and/or size of community
Very small
Very large
2
35
Very small
Very large
affected
0 1 2 3
Number of people affected
1
40
0 1 2 3
Minimum
Severe
Degree of severity
2
45
Minimum
Severe
0 1 2 3
Degree of severity
1
50
0 1 2 3
Occasion/Short
Continuous
Frequency/Duration
1
20
Occasion/Short
Continuous
0 1 2 3
Frequency/Duration
1
10
0 1 2 3
Weight average score for Other social and community impacts
1.8
Weight average score for Health impacts
1.0
Criteria for Other social and
Raw score
Score
Weight %
community impacts
Number and/or size of community
Very small
Very large
1
30
affected
0 1 2 3
Minimum
Severe
Degree of severity
1
50
0 1 2 3
Occasion/Short
Continuous
Frequency/Duration
1
20
0 1 2 3
Weight average score for Other social and community impacts
1.0
ANNEXES
117
III: Habitat and community modification
IV: Unsustainable exploitation of fish
Weight
Weight
Environmental
Environmental
Environmental issues
Score
Weight %
averaged
Environmental issues
Score
Weight %
averaged
concern
concern
score
score
Habitat and community
Unsustainable
12. Loss of ecosystems
1
50
1.5
14. Overexploitation
1
20
0.7
modification
exploitation of fish
13.Modification of ecosystems or
15. Excessive by-catch and
1
30
ecotones, including community
discards
2
50
structure and/or species
composition
16. Destructive fishing practices
0
20
17. Decreased viability of stock
0
10
through pollution and disease
18. Impact on biological and
1
20
Criteria for Economic impacts
Raw score
Score
Weight %
genetic diversity
Size of economic or public sectors
Very small
Very large
2
40
affected
0 1 2 3
Degree of impact (cost, output changes
Minimum
Severe
3
50
etc.)
0 1 2 3
Criteria for Economic impacts
Raw score
Score
Weight %
Occasion/Short
Continuous
Frequency/Duration
3
10
0 1 2 3
Size of economic or public sectors
Very small
Very large
0
60
affected
0 1 2 3
Weight average score for Economic impacts
2.6
Degree of impact (cost, output changes
Minimum
Severe
0
10
etc.)
0 1 2 3
Criteria for Health impacts
Raw score
Score
Weight %
Occasion/Short
Continuous
Frequency/Duration
0
30
0 1 2 3
Very small
Very large
Number of people affected
3
55
Weight average score for Economic impacts
0
0 1 2 3
Minimum
Severe
Degree of severity
1
35
0 1 2 3
Criteria for Health impacts
Raw score
Score
Weight %
Occasion/Short
Continuous
Frequency/Duration
3
10
0 1 2 3
Very small
Very large
Number of people affected
0
55
0 1 2 3
Weight average score for Health impacts
2.3
Minimum
Severe
Degree of severity
0
30
0 1 2 3
Criteria for Other social and
Raw score
Score
Weight %
Occasion/Short
Continuous
community impacts
Frequency/Duration
0
15
0 1 2 3
Number and/or size of community
Very small
Very large
3
40
Weight average score for Health impacts
0
affected
0 1 2 3
Minimum
Severe
Degree of severity
2
50
Criteria for Other social and
0 1 2 3
Raw score
Score
Weight %
community impacts
Occasion/Short
Continuous
Frequency/Duration
3
10
0 1 2 3
Number and/or size of community
Very small
Very large
0
40
affected
0 1 2 3
Weight average score for Other social and community impacts
2.5
Minimum
Severe
Degree of severity
0
50
0 1 2 3
Occasion/Short
Continuous
Frequency/Duration
0
10
0 1 2 3
Weight average score for Other social and community impacts
0
118
GIWA REGIONAL ASSESSMENT 47 EAST AFRICAN RIFT VALLEY LAKES
V: Global change
Weight
Environmental
Environmental issues
Score
Weight %
averaged
concern
score
19. Changes in the hydrological
2
45
Global change
1.4
cycle
20. Sea level change
1
45
21. Increased UV-B radiation as a
0
0
result of ozone depletion
22. Changes in ocean CO 2
0
10
source/sink function
Criteria for Economic impacts
Raw score
Score
Weight %
Size of economic or public sectors
Very small
Very large
1
30
affected
0 1 2 3
Degree of impact (cost, output changes
Minimum
Severe
3
50
etc.)
0 1 2 3
Occasion/Short
Continuous
Frequency/Duration
1
20
0 1 2 3
Weight average score for Economic impacts
2.0
Criteria for Health impacts
Raw score
Score
Weight %
Very small
Very large
Number of people affected
2
40
0 1 2 3
Minimum
Severe
Degree of severity
3
50
0 1 2 3
Occasion/Short
Continuous
Frequency/Duration
1
10
0 1 2 3
Weight average score for Health impacts
2.4
Criteria for Other social and
Raw score
Score
Weight %
community impacts
Number and/or size of community
Very small
Very large
3
50
affected
0 1 2 3
Minimum
Severe
Degree of severity
3
45
0 1 2 3
Occasion/Short
Continuous
Frequency/Duration
2
5
0 1 2 3
Weight average score for Other social and community impacts
3.0
ANNEXES
119
Comparative environmental and socio-economic impacts of each GIWA concern
Types of impacts
Environmental score
Economic score
Human health score
Social and community score
Concern
Overall score
Present (a)
Future (b)
Present (c)
Future (d)
Present (e)
Future (f)
Present (g)
Future (h)
Freshwater shortage
1.8
3
1.8
3
1.6
2
1.8
2
2.1
Pollution
1.6
3
1.0
2
2.0
2
2.0
2
2.0
Habitat and community
1.5
3
2.6
3
2.3
3
2.5
3
2.6
modification
Unsustainable exploitation of fish
0.7
2
0
1
0
1
0
1
0.7
and other living resources
Global change
1.4
2
2.0
2
2.4
2
3.0
3
2.2
If the results in this table were not giving a clear prioritisation, the scores were weighted by assigning diff erent relative importance to present/future
and environmental/socio-economic impacts in the following way:
Weight averaged environmental and socio-economic impacts of each GIWA concern
Present (%) (i)
Future (%) (j)
Total (%)
50
50
100
Other social and
Environmental (k)
Economic (l)
Health (m)
Total (%)
community impacts (n)
40
20
20
20
100
Types of impacts
Time weight averaged
Time weight averaged
Time weight averaged
Time weight averaged
Time weight averaged overall
Social and community
Environmental score (o)
Economic score (p)
Human health score (q)
score
Concern
score (r)
Rank
(a)x(i)+(b)x(j)
(c)x(i)+(d)x(j)
(e)x(i)+(f)x(j)
(g)x(i)+(h)x(j)
(o)x(k)+(p)x(l)+(q)x(m)+(r)x(n)
Freshwater shortage
2.4
2.4
1.8
1.9
2.2
2
Pollution
2.3
1.5
2.0
2.0
2.0
3
Habitat and community
2.3
2.8
2.7
2.8
2.6
1
modification
Unsustainable exploitation of fish
1.4
0.5
0.5
0.5
0.9
5
and other living resources
Global change
1.7
2.0
2.2
3.0
2.1
4
120
GIWA REGIONAL ASSESSMENT 47 EAST AFRICAN RIFT VALLEY LAKES
Annex II
Detailed scoring tables: Lake Victoria
I: Freshwater shortage
II: Pollution
Weight
Weight
Environmental
Environmental
Environmental issues
Score
Weight %
averaged
Environmental issues
Score
Weight %
averaged
concern
concern
score
score
1. Modification of stream flow
1
30
Freshwater shortage
1.7
4. Microbiological
3
20
Pollution
2.6
2. Pollution of existing supplies
2
40
5. Eutrophication
3
25
3. Changes in the water table
2
30
6. Chemical
2
20
7. Suspended solids
3
25
8. Solid wastes
1
5
Criteria for Economic impacts
Raw score
Score
Weight %
9. Thermal
0
0
Size of economic or public sectors
Very small
Very large
0
35
affected
0 1 2 3
Degree of impact (cost, output changes
Minimum
Severe
10. Radionuclide
0
0
0
55
etc.)
0 1 2 3
Occasion/Short
Continuous
11. Spills
0
5
Frequency/Duration
1
10
0 1 2 3
Weight average score for Economic impacts
0.1
Criteria for Health impacts
Raw score
Score
Weight %
Criteria for Economic impacts
Raw score
Score
Weight %
Very small
Very large
Number of people affected
0
40
Size of economic or public sectors
Very small
Very large
0 1 2 3
2
30
affected
0 1 2 3
Minimum
Severe
Degree of severity
1
50
Degree of impact (cost, output changes
Minimum
Severe
0 1 2 3
2
50
etc.)
0 1 2 3
Occasion/Short
Continuous
Frequency/Duration
1
10
Occasion/Short
Continuous
0 1 2 3
Frequency/Duration
2
20
0 1 2 3
Weight average score for Health impacts
0.6
Weight average score for Economic impacts
2.0
Criteria for Other social and
Raw score
Score
Weight %
community impacts
Criteria for Health impacts
Raw score
Score
Weight %
Number and/or size of community
Very small
Very large
35
35
Very small
Very large
affected
0 1 2 3
Number of people affected
2
40
0 1 2 3
Minimum
Severe
Degree of severity
45
45
Minimum
Severe
0 1 2 3
Degree of severity
2
50
0 1 2 3
Occasion/Short
Continuous
Frequency/Duration
20
20
Occasion/Short
Continuous
0 1 2 3
Frequency/Duration
2
10
0 1 2 3
Weight average score for Other social and community impacts
1.0
Weight average score for Health impacts
2.0
Criteria for Other social and
Raw score
Score
Weight %
community impacts
Number and/or size of community
Very small
Very large
3
30
affected
0 1 2 3
Minimum
Severe
Degree of severity
1
50
0 1 2 3
Occasion/Short
Continuous
Frequency/Duration
3
20
0 1 2 3
Weight average score for Other social and community impacts
2.0
ANNEXES
121
III: Habitat and community modification
IV: Unsustainable exploitation of fish
Weight
Weight
Environmental
Environmental
Environmental issues
Score
Weight %
averaged
Environmental issues
Score
Weight %
averaged
concern
concern
score
score
Habitat and community
Unsustainable
12. Loss of ecosystems
2
50
2.5
14. Overexploitation
3
30
2.6
modification
exploitation of fish
13.Modification of ecosystems or
15. Excessive by-catch and
2
20
ecotones, including community
discards
3
50
structure and/or species
composition
16. Destructive fishing practices
3
30
17. Decreased viability of stock
2
10
through pollution and disease
18. Impact on biological and
2
10
Criteria for Economic impacts
Raw score
Score
Weight %
genetic diversity
Size of economic or public sectors
Very small
Very large
1
40
affected
0 1 2 3
Degree of impact (cost, output changes
Minimum
Severe
1
50
etc.)
0 1 2 3
Criteria for Economic impacts
Raw score
Score
Weight %
Occasion/Short
Continuous
Frequency/Duration
2
10
0 1 2 3
Size of economic or public sectors
Very small
Very large
2
60
affected
0 1 2 3
Weight average score for Economic impacts
1.1
Degree of impact (cost, output changes
Minimum
Severe
3
10
etc.)
0 1 2 3
Criteria for Health impacts
Raw score
Score
Weight %
Occasion/Short
Continuous
Frequency/Duration
3
30
0 1 2 3
Very small
Very large
Number of people affected
1
55
0 1 2 3
Weight average score for Economic impacts
2.4
Minimum
Severe
Degree of severity
1
35
0 1 2 3
Criteria for Health impacts
Raw score
Score
Weight %
Occasion/Short
Continuous
Frequency/Duration
3
10
0 1 2 3
Very small
Very large
Number of people affected
2
55
0 1 2 3
Weight average score for Health impacts
1.2
Minimum
Severe
Degree of severity
2
30
0 1 2 3
Criteria for Other social and
Raw score
Score
Weight %
Occasion/Short
Continuous
community impacts
Frequency/Duration
3
15
0 1 2 3
Number and/or size of community
Very small
Very large
1
40
affected
0 1 2 3
Weight average score for Health impacts
2.2
Minimum
Severe
Degree of severity
1
50
Criteria for Other social and
0 1 2 3
Raw score
Score
Weight %
community impacts
Occasion/Short
Continuous
Frequency/Duration
1
10
0 1 2 3
Number and/or size of community
Very small
Very large
2
40
affected
0 1 2 3
Weight average score for Other social and community impacts
1.0
Minimum
Severe
Degree of severity
2
50
0 1 2 3
Occasion/Short
Continuous
Frequency/Duration
3
10
0 1 2 3
Weight average score for Other social and community impacts
2.1
122
GIWA REGIONAL ASSESSMENT 47 EAST AFRICAN RIFT VALLEY LAKES
V: Global change
Weight
Environmental
Environmental issues
Score
Weight %
averaged
concern
score
19. Changes in the hydrological
1
50
Global change
0.7
cycle
20. Sea level change
1
20
21. Increased UV-B radiation as a
0
20
result of ozone depletion
22. Changes in ocean CO 2
0
10
source/sink function
Criteria for Economic impacts
Raw score
Score
Weight %
Size of economic or public sectors
Very small
Very large
1
30
affected
0 1 2 3
Degree of impact (cost, output changes
Minimum
Severe
2
50
etc.)
0 1 2 3
Occasion/Short
Continuous
Frequency/Duration
0
20
0 1 2 3
Weight average score for Economic impacts
1.3
Criteria for Health impacts
Raw score
Score
Weight %
Very small
Very large
Number of people affected
1
40
0 1 2 3
Minimum
Severe
Degree of severity
2
50
0 1 2 3
Occasion/Short
Continuous
Frequency/Duration
0
10
0 1 2 3
Weight average score for Health impacts
1.4
Criteria for Other social and
Raw score
Score
Weight %
community impacts
Number and/or size of community
Very small
Very large
1
50
affected
0 1 2 3
Minimum
Severe
Degree of severity
1
45
0 1 2 3
Occasion/Short
Continuous
Frequency/Duration
1
5
0 1 2 3
Weight average score for Other social and community impacts
1.0
ANNEXES
123
Comparative environmental and socio-economic impacts of each GIWA concern
Types of impacts
Environmental score
Economic score
Human health score
Social and community score
Concern
Overall score
Present (a)
Future (b)
Present (c)
Future (d)
Present (e)
Future (f)
Present (g)
Future (h)
Freshwater shortage
1.7
3
0.1
1
0.6
0
1.0
1
1.1
Pollution
2.6
3
2.0
2
2.0
1
2.0
1
2.0
Habitat and community
2.5
3
1.1
0
1.2
0
1.0
1
1.2
modification
Unsustainable exploitation of fish
2.6
2
2.4
1
2.2
1
2.1
1
1.8
and other living resources
Global change
0.7
2
1.3
2
1.4
1
1.0
1
1.3
If the results in this table were not giving a clear prioritisation, the scores were weighted by assigning diff erent relative importance to present/future
and environmental/socio-economic impacts in the following way:
Weight averaged environmental and socio-economic impacts of each GIWA concern
Present (%) (i)
Future (%) (j)
Total (%)
50
50
100
Other social and
Environmental (k)
Economic (l)
Health (m)
Total (%)
community impacts (n)
40
20
20
20
100
Types of impacts
Time weight averaged
Time weight averaged
Time weight averaged
Time weight averaged
Time weight averaged overall
Social and community
Environmental score (o)
Economic score (p)
Human health score (q)
score
Concern
score (r)
Rank
(a)x(i)+(b)x(j)
(c)x(i)+(d)x(j)
(e)x(i)+(f)x(j)
(g)x(i)+(h)x(j)
(o)x(k)+(p)x(l)+(q)x(m)+(r)x(n)
Freshwater shortage
2.4
0.6
0.3
0.5
1.3
5
Pollution
2.8
2.0
1.5
1.5
2.1
1
Habitat and community
2.8
0.6
0.6
1.0
1.5
3
modification
Unsustainable exploitation of fish
2.3
1.7
1.6
2.1
1.9
2
and other living resources
Global change
1.4
1.7
1.2
1.0
1.3
4
124
GIWA REGIONAL ASSESSMENT 47 EAST AFRICAN RIFT VALLEY LAKES
Annex II
Detailed scoring tables: Lake Tanganyika
I: Freshwater shortage
II: Pollution
Weight
Weight
Environmental
Environmental
Environmental issues
Score
Weight %
averaged
Environmental issues
Score
Weight %
averaged
concern
concern
score
score
1. Modification of stream flow
1
50
Freshwater shortage
1.0
4. Microbiological
1
10
Pollution
2.4
2. Pollution of existing supplies
1
50
5. Eutrophication
1
20
3. Changes in the water table
0
0
6. Chemical
2
20
7. Suspended solids
3
40
8. Solid wastes
0
5
Criteria for Economic impacts
Raw score
Score
Weight %
9. Thermal
0
0
Size of economic or public sectors
Very small
Very large
0
30
affected
0 1 2 3
Degree of impact (cost, output changes
Minimum
Severe
10. Radionuclide
0
0
0
60
etc.)
0 1 2 3
Occasion/Short
Continuous
11. Spills
1
5
Frequency/Duration
2
10
0 1 2 3
Weight average score for Economic impacts
0.2
Criteria for Health impacts
Raw score
Score
Weight %
Criteria for Economic impacts
Raw score
Score
Weight %
Very small
Very large
Number of people affected
0
40
Size of economic or public sectors
Very small
Very large
0 1 2 3
1
30
affected
0 1 2 3
Minimum
Severe
Degree of severity
0
50
Degree of impact (cost, output changes
Minimum
Severe
0 1 2 3
1
50
etc.)
0 1 2 3
Occasion/Short
Continuous
Frequency/Duration
2
10
Occasion/Short
Continuous
0 1 2 3
Frequency/Duration
3
20
0 1 2 3
Weight average score for Health impacts
0.2
Weight average score for Economic impacts
1.4
Criteria for Other social and
Raw score
Score
Weight %
community impacts
Criteria for Health impacts
Raw score
Score
Weight %
Number and/or size of community
Very small
Very large
0
35
Very small
Very large
affected
0 1 2 3
Number of people affected
1
40
0 1 2 3
Minimum
Severe
Degree of severity
0
45
Minimum
Severe
0 1 2 3
Degree of severity
1
50
0 1 2 3
Occasion/Short
Continuous
Frequency/Duration
2
20
Occasion/Short
Continuous
0 1 2 3
Frequency/Duration
1
10
0 1 2 3
Weight average score for Other social and community impacts
0.2
Weight average score for Health impacts
1.0
Criteria for Other social and
Raw score
Score
Weight %
community impacts
Number and/or size of community
Very small
Very large
2
30
affected
0 1 2 3
Minimum
Severe
Degree of severity
1
50
0 1 2 3
Occasion/Short
Continuous
Frequency/Duration
1
20
0 1 2 3
Weight average score for Other social and community impacts
1.3
ANNEXES
125
III: Habitat and community modification
IV: Unsustainable exploitation of fish
Weight
Weight
Environmental
Environmental
Environmental issues
Score
Weight %
averaged
Environmental issues
Score
Weight %
averaged
concern
concern
score
score
Habitat and community
Unsustainable
12. Loss of ecosystems
2
50
2.0
14. Overexploitation
3
40
2.1
modification
exploitation of fish
13.Modification of ecosystems or
15. Excessive by-catch and
0
5
ecotones, including community
discards
2
50
structure and/or species
composition
16. Destructive fishing practices
2
40
17. Decreased viability of stock
0
5
through pollution and disease
18. Impact on biological and
1
10
Criteria for Economic impacts
Raw score
Score
Weight %
genetic diversity
Size of economic or public sectors
Very small
Very large
2
40
affected
0 1 2 3
Degree of impact (cost, output changes
Minimum
Severe
3
50
etc.)
0 1 2 3
Criteria for Economic impacts
Raw score
Score
Weight %
Occasion/Short
Continuous
Frequency/Duration
3
10
0 1 2 3
Size of economic or public sectors
Very small
Very large
3
60
affected
0 1 2 3
Weight average score for Economic impacts
2.6
Degree of impact (cost, output changes
Minimum
Severe
2
10
etc.)
0 1 2 3
Criteria for Health impacts
Raw score
Score
Weight %
Occasion/Short
Continuous
Frequency/Duration
3
30
0 1 2 3
Very small
Very large
Number of people affected
1
55
0 1 2 3
Weight average score for Economic impacts
2.9
Minimum
Severe
Degree of severity
1
35
0 1 2 3
Criteria for Health impacts
Raw score
Score
Weight %
Occasion/Short
Continuous
Frequency/Duration
0
10
0 1 2 3
Very small
Very large
Number of people affected
1
55
0 1 2 3
Weight average score for Health impacts
0.9
Minimum
Severe
Degree of severity
1
30
0 1 2 3
Criteria for Other social and
Raw score
Score
Weight %
Occasion/Short
Continuous
community impacts
Frequency/Duration
3
15
0 1 2 3
Number and/or size of community
Very small
Very large
3
40
affected
0 1 2 3
Weight average score for Health impacts
1.3
Minimum
Severe
Degree of severity
1
50
Criteria for Other social and
0 1 2 3
Raw score
Score
Weight %
community impacts
Occasion/Short
Continuous
Frequency/Duration
3
10
0 1 2 3
Number and/or size of community
Very small
Very large
3
40
affected
0 1 2 3
Weight average score for Other social and community impacts
2.0
Minimum
Severe
Degree of severity
2
50
0 1 2 3
Occasion/Short
Continuous
Frequency/Duration
3
10
0 1 2 3
Weight average score for Other social and community impacts
2.5
126
GIWA REGIONAL ASSESSMENT 47 EAST AFRICAN RIFT VALLEY LAKES
V: Global change
Weight
Environmental
Environmental issues
Score
Weight %
averaged
concern
score
19. Changes in the hydrological
1
45
Global change
1
cycle
20. Sea level change
1
45
21. Increase UV-B radiation as a
0
0
result of ozone depletion
22. Changes in ocean CO 2
0
10
source/sink function
Criteria for Economic impacts
Raw score
Score
Weight %
Size of economic or public sectors
Very small
Very large
1
30
affected
0 1 2 3
Degree of impact (cost, output changes
Minimum
Severe
2
50
etc.)
0 1 2 3
Occasion/Short
Continuous
Frequency/Duration
0
20
0 1 2 3
Weight average score for Economic impacts
1.3
Criteria for Health impacts
Raw score
Score
Weight %
Very small
Very large
Number of people affected
1
40
0 1 2 3
Minimum
Severe
Degree of severity
1
50
0 1 2 3
Occasion/Short
Continuous
Frequency/Duration
1
10
0 1 2 3
Weight average score for Health impacts
1.0
Criteria for Other social and
Raw score
Score
Weight %
community impacts
Number and/or size of community
Very small
Very large
1
50
affected
0 1 2 3
Minimum
Severe
Degree of severity
1
45
0 1 2 3
Occasion/Short
Continuous
Frequency/Duration
1
5
0 1 2 3
Weight average score for Other social and community impacts
1.0
ANNEXES
127
Comparative environmental and socio-economic impacts of each GIWA concern
Types of impacts
Environmental score
Economic score
Human health score
Social and community score
Concern
Overall score
Present (a)
Future (b)
Present (c)
Future (d)
Present (e)
Future (f)
Present (g)
Future (h)
Freshwater shortage
1.0
2
0.2
1
0.2
1
0.2
1
0.8
Pollution
2.4
3
1.4
2
1.0
2
1.3
3
2.0
Habitat and community
2.0
3
2.6
3
0.9
2
2.0
3
2.3
modification
Unsustainable exploitation of fish
2.1
3
2.9
3
1.3
2
2.5
3
2.5
and other living resources
Global change
0.9
2
1.3
2
1.0
2
1.0
2
1.5
If the results in this table were not giving a clear prioritisation, the scores were weighted by assigning diff erent relative importance to present/future
and environmental/socio-economic impacts in the following way:
Weight averaged environmental and socio-economic impacts of each GIWA concern
Present (%) (i)
Future (%) (j)
Total (%)
50
50
100
Other social and
Environmental (k)
Economic (l)
Health (m)
Total (%)
community impacts (n)
40
20
20
20
100
Types of impacts
Time weight averaged
Time weight averaged
Time weight averaged
Time weight averaged
Time weight averaged overall
Social and community
Environmental score (o)
Economic score (p)
Human health score (q)
score
Concern
score (r)
Rank
(a)x(i)+(b)x(j)
(c)x(i)+(d)x(j)
(e)x(i)+(f)x(j)
(g)x(i)+(h)x(j)
(o)x(k)+(p)x(l)+(q)x(m)+(r)x(n)
Freshwater shortage
1.5
0.6
0.6
0.6
1.0
5
Pollution
2.7
1.7
1.5
2.2
2.2
3
Habitat and community
2.5
2.8
1.5
2.5
2.4
1
modification
Unsustainable exploitation of fish
2.6
3.0
1.7
2.8
2.5
2
and other living resources
Global change
1.5
1.7
1.5
1.5
1.5
4
128
GIWA REGIONAL ASSESSMENT 47 EAST AFRICAN RIFT VALLEY LAKES
Annex II
Detailed scoring tables: Lake Malawi
I: Freshwater shortage
II: Pollution
Weight
Weight
Environmental
Environmental
Environmental issues
Score
Weight %
averaged
Environmental issues
Score
Weight %
averaged
concern
concern
score
score
1. Modification of stream flow
2
80
Freshwater shortage
2.0
4. Microbiological
2
20
Pollution
2
2. Pollution of existing supplies
2
20
5. Eutrophication
2
20
3. Changes in the water table
0
0
6. Chemical
1
20
7. Suspended solids
3
30
8. Solid wastes
0
5
Criteria for Economic impacts
Raw score
Score
Weight %
9. Thermal
0
0
Size of economic or public sectors
Very small
Very large
1
30
affected
0 1 2 3
Degree of impact (cost, output changes
Minimum
Severe
10. Radionuclide
0
0
1
60
etc.)
0 1 2 3
Occasion/Short
Continuous
11. Spills
1
5
Frequency/Duration
2
10
0 1 2 3
Weight average score for Economic impacts
1.1
Criteria for Health impacts
Raw score
Score
Weight %
Criteria for Economic impacts
Raw score
Score
Weight %
Very small
Very large
Number of people affected
2
40
Size of economic or public sectors
Very small
Very large
0 1 2 3
1
30
affected
0 1 2 3
Minimum
Severe
Degree of severity
2
50
Degree of impact (cost, output changes
Minimum
Severe
0 1 2 3
1
50
etc.)
0 1 2 3
Occasion/Short
Continuous
Frequency/Duration
2
10
Occasion/Short
Continuous
0 1 2 3
Frequency/Duration
2
20
0 1 2 3
Weight average score for Health impacts
2.0
Weight average score for Economic impacts
1.2
Criteria for Other social and
Raw score
Score
Weight %
community impacts
Criteria for Health impacts
Raw score
Score
Weight %
Number and/or size of community
Very small
Very large
1
35
Very small
Very large
affected
0 1 2 3
Number of people affected
1
40
0 1 2 3
Minimum
Severe
Degree of severity
0
45
Minimum
Severe
0 1 2 3
Degree of severity
0
50
0 1 2 3
Occasion/Short
Continuous
Frequency/Duration
2
20
Occasion/Short
Continuous
0 1 2 3
Frequency/Duration
2
10
0 1 2 3
Weight average score for Other social and community impacts
0.8
Weight average score for Health impacts
0.6
Criteria for Other social and
Raw score
Score
Weight %
community impacts
Number and/or size of community
Very small
Very large
2
30
affected
0 1 2 3
Minimum
Severe
Degree of severity
2
50
0 1 2 3
Occasion/Short
Continuous
Frequency/Duration
2
20
0 1 2 3
Weight average score for Other social and community impacts
2.0
ANNEXES
129
III: Habitat and community modification
IV: Unsustainable exploitation of fish
Weight
Weight
Environmental
Environmental
Environmental issues
Score
Weight %
averaged
Environmental issues
Score
Weight %
averaged
concern
concern
score
score
Habitat and community
Unsustainable
12. Loss of ecosystems
2
50
2.0
14. Overexploitation
3
60
2.6
modification
exploitation of fish
13.Modification of ecosystems or
15. Excessive by-catch and
0
0
ecotones, including community
discards
2
50
structure and/or species
composition
16. Destructive fishing practices
2
40
17. Decreased viability of stock
0
0
through pollution and disease
18. Impact on biological and
1
0
Criteria for Economic impacts
Raw score
Score
Weight %
genetic diversity
Size of economic or public sectors
Very small
Very large
1
40
affected
0 1 2 3
Degree of impact (cost, output changes
Minimum
Severe
2
50
etc.)
0 1 2 3
Criteria for Economic impacts
Raw score
Score
Weight %
Occasion/Short
Continuous
Frequency/Duration
3
10
0 1 2 3
Size of economic or public sectors
Very small
Very large
1
60
affected
0 1 2 3
Weight average score for Economic impacts
1.7
Degree of impact (cost, output changes
Minimum
Severe
2
10
etc.)
0 1 2 3
Criteria for Health impacts
Raw score
Score
Weight %
Occasion/Short
Continuous
Frequency/Duration
3
30
0 1 2 3
Very small
Very large
Number of people affected
3
55
0 1 2 3
Weight average score for Economic impacts
1.7
Minimum
Severe
Degree of severity
1
35
0 1 2 3
Criteria for Health impacts
Raw score
Score
Weight %
Occasion/Short
Continuous
Frequency/Duration
3
10
0 1 2 3
Very small
Very large
Number of people affected
2
55
0 1 2 3
Weight average score for Health impacts
2.3
Minimum
Severe
Degree of severity
1
30
0 1 2 3
Criteria for Other social and
Raw score
Score
Weight %
Occasion/Short
Continuous
community impacts
Frequency/Duration
1
15
0 1 2 3
Number and/or size of community
Very small
Very large
3
40
affected
0 1 2 3
Weight average score for Health impacts
1.6
Minimum
Severe
Degree of severity
2
50
Criteria for Other social and
0 1 2 3
Raw score
Score
Weight %
community impacts
Occasion/Short
Continuous
Frequency/Duration
3
10
0 1 2 3
Number and/or size of community
Very small
Very large
3
40
affected
0 1 2 3
Weight average score for Other social and community impacts
2.5
Minimum
Severe
Degree of severity
1
50
0 1 2 3
Occasion/Short
Continuous
Frequency/Duration
3
10
0 1 2 3
Weight average score for Other social and community impacts
2.0
130
GIWA REGIONAL ASSESSMENT 47 EAST AFRICAN RIFT VALLEY LAKES
V: Global change
Weight
Environmental
Environmental issues
Score
Weight %
averaged
concern
score
19. Changes in the hydrological
1
50
Global Change
1.0
cycle
20. Sea level change
1
50
21. Increased UV-B radiation as a
0
0
result of ozone depletion
22. Changes in ocean CO 2
0
0
source/sink function
Criteria for Economic impacts
Raw score
Score
Weight %
Size of economic or public sectors
Very small
Very large
3
30
affected
0 1 2 3
Degree of impact (cost, output changes
Minimum
Severe
2
50
etc.)
0 1 2 3
Occasion/Short
Continuous
Frequency/Duration
0
20
0 1 2 3
Weight average score for Economic impacts
1.9
Criteria for Health impacts
Raw score
Score
Weight %
Very small
Very large
Number of people affected
2
40
0 1 2 3
Minimum
Severe
Degree of severity
1
50
0 1 2 3
Occasion/Short
Continuous
Frequency/Duration
0
10
0 1 2 3
Weight average score for Health impacts
1.3
Criteria for Other social and
Raw score
Score
Weight %
community impacts
Number and/or size of community
Very small
Very large
1
50
affected
0 1 2 3
Minimum
Severe
Degree of severity
2
45
0 1 2 3
Occasion/Short
Continuous
Frequency/Duration
0
5
0 1 2 3
Weight average score for Other social and community impacts
1.4
ANNEXES
131
Comparative environmental and socio-economic impacts of each GIWA concern
Types of impacts
Environmental score
Economic score
Human health score
Social and community score
Concern
Overall score
Present (a)
Future (b)
Present (c)
Future (d)
Present (e)
Future (f)
Present (g)
Future (h)
Freshwater shortage
2.0
2
1.1
2
2.0
2
0.8
2
1.7
Pollution
2.0
3
1.2
2
0.6
2
2.0
2
1.9
Habitat and community
2.0
3
1.7
2
2.3
3
2.5
3
2.4
modification
Unsustainable exploitation of fish
2.6
3
1.7
3
1.6
3
2.0
2
2.4
and other living resources
Global change
1.0
2
1.9
1
1.3
1
1.4
1
1.3
If the results in this table were not giving a clear prioritisation, the scores were weighted by assigning diff erent relative importance to present/future
and environmental/socio-economic impacts in the following way:
Weight averaged environmental and socio-economic impacts of each GIWA concern
Present (%) (i)
Future (%) (j)
Total (%)
50
50
100
Other social and
Environmental (k)
Economic (l)
Health (m)
Total (%)
community impacts (n))
40
20
20
20
100
Types of impacts
Time weight averaged
Time weight averaged
Time weight averaged
Time weight averaged
Time weight averaged overall
Social and community
Environmental score (o)
Economic score (p)
Human health score (q)
score
Concern
score (r)
Rank
(a)x(i)+(b)x(j)
(c)x(i)+(d)x(j)
(e)x(i)+(f)x(j)
(g)x(i)+(h)x(j)
(o)x(k)+(p)x(l)+(q)x(m)+(r)x(n)
Freshwater shortage
.20
1.6
2.0
1.4
1.8
4
Pollution
2.5
1.6
1.3
2.0
2.0
3
Habitat and community
2.5
1.9
2.7
2.8
2.5
2
modification
Unsustainable exploitation of fish
2.8
2.4
2.3
2.0
2.5
1
and other living resources
Global change
1.5
1.5
1.2
1.2
1.4
5
132
GIWA REGIONAL ASSESSMENT 47 EAST AFRICAN RIFT VALLEY LAKES
Annex III
Causal chain analysis ş Outline of the process
Unsustainable exploitation of fish and other living resources: Issue 1 ş Overfishing
Questions asked
Hypotheses
Assumptions
Evidence
Poverty is driving more people to the fishing industry.
Fishermen are normally hired or employed and will change fishing grounds
Agriculture has failed, so more people are turning to
depending on the catches (Katunzi 1996).
There are increasing numbers of fishermen.
fishing.
People with few options for employment were drawn to a lucrative industry (Cohen
There are increased number of nets per
More people are involved in fishing as a result of
et al. 1996).
fisherman.
increased urban settlements along the Lakeshore.
The heaviest populations (both urban and rural) are concentrated within a short
Fishing methods requiring more nets are used as a result
distance of the Lake (Bootsma & Hecky 1993).
of declining fish catch per net.
"Multiple hanging" of nets emerged in late 1994 (Gibbon 1997, Kulindwa 2001).
Increasing efforts by fishermen (e.g. increased Increased fishing is not driven by greed.
gear and greed).
Increased fishing is not driven by increased access to gear.
The government is deliberately trying to
The government is encouraging fishing among local
increase the number of fishermen.
populations for economic returns and food security.
The price of fish per unit effort has increased over the
Price of fish has been increasing.
last few years.
There is increased demand for fisheries export
The demand for fish is not offset by increasing fish
Why is there
(regionally and internationally).
landings from other inland lakes.
increased effort?
There is more demand for inland fish than
For socio-cultural reasons the regional population insist
marine fish.
on inland fish.
Animal and plant protein costs more than fish protein.
Fish is the least expensive form of animal protein available.
There is no alternative cheap source of protein. There is increasing lack of land for subsistence farming
Fish comprises over 50% of the animal protein consumed in the intralacustrine region
due to increasing population.
of eastern Africa (Hecky & Bugenyi 1992).
There are reduced taxes and subsidies in the
More people are able to purchase fishing gear etc. at
fishing industry.
reduced cost.
There are credits/support available to
More people are turning to fisheries as a result.
fishermen.
The resource base (MSY) still needs to be identified (Katunzi 1996).
Lack of information on the size of the Nile perch stock has strongly limited the
Current fishing efforts are still way below the
The maximum sustainable yield is known.
planning and development of the fishery (Katunzi 1996).
maximum sustainable yield.
The average size of fish caught in the gill-net fishery has decreased over the years
(Katunzi 1996).
Reduced taxes and subsidies on nets have
enabled more fishermen to purchase nets,
Gill-nets and beach seines are still in use (Katunzi 1996).
leading to higher catch per unit effort.
Proper net sizes are used to catch the target fish.
The use of hooks is encouraged since the required investment is low and the gear is
Beach seining as a large scale technique of
Proper net size not used.
highly selective, but still only few fishermen use them (Katunzi 1996).
fishing for the market provides opportunities
The number of fishermen has not increased significantly.
Beach seines are still in use though they are officially banned. (Mbuga et al. 1998,
for employment but also destroys the habitat,
Kulindwa 2001).
enhances indiscriminate harvesting of fish
(juvenile and adults) etc.
Processing industries have increased in
There is a higher demand for fish as the capacity for
There has been rapid expansion of the fish processing factories on the Tanzania side of
number.
processing fish has increased.
the Lake (Katunzi 1996).
Demand for fish in the world market is high and
The transformation of the Victoria from a locally based fishery to a commercial fishery
Processing industries are geared to export
increasing.
has been the result of the strong demand from the global markets (Abila & Jansen
markets.
1997).
How is
There is more demand for fish as a result.
technological
Use of trawlers expanded greatly during the 1970s with the original targets being
change contributing
abundant benthic haplochromine cichlids (Cohen et al. 1996).
to overfishing?
Trawling has increased to meet demand
No fish quotas are in place.
With the collapse of the indigenous fauna in Lake Victoria (Barel et al. 1991), a new
for fish.
open-lake trawl fishery developed for the Nile perch with heavy foreign subsidy
(Cohen et al. 1996).
Improvements have been made in fish storage Capacity for storage and transport has increased.
and transport.
There is lack of fish storage facilities at fish
Fresh fish tends to spoil if not taken immediately to
Fishermen are exploited by middlemen who buy at throw-away prices, forcing the
landing sites.
processing factories or markets.
fishermen to intensify their fishing.
Rastrineobola argentia (80%) is sold dry after sun-drying on the beaches
(Katunzi 1996).
There is improper use of technology (e.g. nets) Fine mesh sizes are used.
Nets are produced for various industries, e.g. horticultural industry where fine mesh
leading to overfishing.
nets are used to guard against birds. These are now being used in the fishing industry.
There are no refrigeration facilities and
There is more reliance on inland fisheries on a regional
infrastructure for fish transport at the coast.
scale.
ANNEXES
133
Unsustainable exploitation of fish and other living resources: Issue 2 ş Destructive fishing practices
Questions asked
Hypotheses
Assumptions
Evidence
A progressive decrease in mesh size of gill nets (Nile perch) has been noted (Ligtvoet &
Mkumbo, 1992), increasing the likelihood of overexploitation (Katunzi 1996).
Recommended fishing gear is not used
Evidence shows that the availability of all type of fish and particularly Nile Perch is
ş smaller size nets are used to capture
There is a decline in catch per unit effort.
declining (Kulindwa 2001).
target fish.
Beach seining catches a lot of juvenile fish and destroys breeding sites and eggs
(Katunzi 1996).
Higher demand for fish leads to a scramble
There exists high demand of Nile Perch in the regional and Export of Nile Perch increased over time from 1996 (Kulindwa & Mbelle 2002,
Why is there
for limited resources by increasing numbers
world market.
Kulindwa, 2001, Abila, 2002).
increased effort?
of fishermen.
There are credits/support available to
More people are turning to fisheries as a result.
fishermen.
Gill-nets have had a devastating effect impact around river mouths during spawning
Lack of adequate enforcement.
migrations of potadromous fishes (Ogutu-Ohwayo 1990).
Failure of agricultural production due to
The change of occupation coincided with the decline of cotton and coffee price
adverse weather conditions and inadequate
Lack of alternative livelihoods.
declines (Kulindwa 2001) and decline in food production due to bad weather
markets for cotton, coffee etc.
conditions (Abila 2002).
Number of fish processing industries and trawlers has increased.
Profit maximisation is a major motivating force.
With the collapse of the indigenous fauna in Lake Victoria (Barel et al. 1991), a new
More commercial fishermen are setting up in the region.
open-lake trawl fishery developed for the Nile perch with heavy foreign subsidy
There are windfall profits for those dealing
Lack of regulation, enforcement and monitoring capacity.
(Cohen et al 1996).
with the export market.
Dwindling fish stocks are leading to use of unconventional Pesticides have been used to kill fish (leading to EU ban on fish from LVB).
fishing methods to meet market demand.
Illegal fishing practices such as the use of beach seine, poison or smuggling continue
despite the efforts made by the government (Kulindwa 2001, Mbuga et al. 1998)
Fish exports increasing due to increased world market demand (Abila 2002) despite
There is lack of fishing quotas, or fishing
Over fishing is occurring in main fishing grounds due to
efforts to limit exports by limiting the number of cargo planes per week (Kulindwa
quotas are not enforced.
free access.
2001).
Why is rent-seeking
In some areas, the large number of new fishing operations, particularly large-scale
behaviour
operations, has undermined traditional paths of authority which governed fishing
There are no clear-cut property rights or
There are scuffles in fishing grounds among fishermen
prominent?
rights (Yongo 1991).
entitlements.
competing for fishing territory.
Fishing camps by processing plants create havoc between the company fishermen and
small-scale fishermen (Kulindwa 2001)
There are no legal or institutional
The existing fisheries regulation regarding mesh sizes needs revision because they are
arrangements between governments and
outdated and are no longer binding (Katunzi 1996).
resource users.
Although trawling in bays, gulfs, and inlets at depths of 20m or less is prohibited,
Political patronage and corruption protects
most of the trawling and beach seining operations are made in these places without
commercial fishermen when they flout
Regulations exist but are not being enforced.
permission (Katunzi 1996).
regulations.
Those assigned duties of enforcing regulations at the village level have been accused
of accepting bribes (Bwathondi et al. 2001).
Issuing of licences for fishing is not enforced.
Excess fishing licences results into excessive fishing effort. Licences used for tax collection and fund raising (Owino 1999).
Inadequate monitoring and enforcement
How does failure
Use of small sized fishnets, beach seines, multiple
Illegal fishing practices continue despite efforts by government to curb them (URT/
capacity results in destructive fishing
of monitoring
hanging and poison exists.
JICA 2002, Kulindwa 2001, Abila 2002).
practices.
and enforcement
mechanisms
Corruption is rampant.
contribute to
There is no regional integration of
The proposal to ban beach seining in the Lake has met with partial success in Uganda
destructive fishing
institutions, laws and enforcement.
and Kenya, but is yet to be implemented in Tanzania (Katunzi 1996).
practices?
Lack of resources in government to police
the Lake.
Pollution: Issue 1 ş Microbiological
Questions asked
Hypotheses
Assumptions
Evidence
Increase in animal waste is directly proportional to
Why is there
There are larger populations of livestock and wildlife
increases in livestock and wildlife populations.
The dense rural human population of LVD (>100/km2) (Cohen et al., 1996), is
increased animal
in the catchment.
Efforts to manage livestock waste are minimal and
matched by an equally high cattle population (Bootsma & Hecky 1993).
waste?
insignificant.
Increase in municipal effluent discharge is directly
The number and size of urban settlements and agro-
Human population density in LVB is >100km2 and rapidly growing (Cohen
proportional to increases in human population and
Why is there
industries are growing.
et al. 1996).
industry.
enhanced municipal
There is no provision made to manage the existing and
The highest population concentrations (both urban and rural) are within a
effluent discharge
Untreated municipal effluents are largely discharged
increasing effluents.
short distance of the Lake (Bootsma & Hecky 1993).
that contributes
directly into the Lake.
Current effluent treatment technologies are outdated or
Except for Mwanza Tanneries, all the industries in Mwanza discharged their
to microbiological
non-functioning.
raw effluent into the Lake (Kishimba & Amkenda 1995).
pollution?
Rules and regulations for managing effluent from
There is no enforcement of rules and regulations.
industry are not adhered to.
134
GIWA REGIONAL ASSESSMENT 47 EAST AFRICAN RIFT VALLEY LAKES
The highest population concentrations (both urban and rural) are within a
short distance of the Lake (Bootsma & Hecky 1993).
There has not been a significant change in rainfall patterns
How do runoff
Rapid population growth has resulted in rapid conversion of forest
Land clearance for agriculture and settlements has led and amount.
and stormwater
and savannah woodland habitats to agricultural and range land
to increased run-off and stormwater.
There is increased erosion due to lack of soil conservation
contribute to
(Cohen et al. 1996).
measures.
microbiological
Terracing is practiced by only about 25% of farmers in western Kenya today
pollution?
and this is probably a maximum for the region (Cohen et al. 1996).
Poor urban planning has enhanced runoff and
There has not been a significant change in rainfall patterns The highest population concentrations (both urban and rural) are within a
stormwater.
and amount.
short distance of the Lake (Bootsma & Hecky 1993).
How does maritime
There are a large number of craft that in total make a
waste contribute
There are no regulations on over-board dumping of
significant contribution to microbiological pollution in
to microbiological
wastes.
the Lake.
pollution?
Pollution: Issue 2 ş Eutrophication
Questions asked
Hypotheses
Assumptions
Evidence
There is no provision made to manage the existing and
Why is there
increasing effluents.
The highest population concentrations (both urban and rural) are within a
The number and size of urban settlements and agro-
enhanced effluent
short distance of the Lake (Bootsma & Hecky 1993).
industries are growing.
discharge?
Current effluent treatment technologies are outdated or
non- functioning.
Land clearance for agriculture and settlements, poor
Why is there
Rapid population growth has resulted in rapid conversion of forest
waste disposal mechanisms or practices, and lack
There has not been a significant change in rainfall
enhanced discharge
and savannah woodland habitats to agricultural and range land
of soil conservation measures have led to increased
patterns and amount.
of solids?
(Cohen et al. 1996).
discharge of solids.
Rapid population growth has resulted in rapid conversion of forest and
savannah woodland habitats to agricultural and range land (Cohen et al.
1996).
There has not been a significant change in rainfall
Land clearance for agriculture and settlements has
The highest population concentrations (both urban and rural) are within
patterns and amount.
led to increased load of nutrient elements in run-off
a short distance of the Lake (Bootsma & Hecky 1993). The most densely
There is increased erosion due to lack of soil conservation
How do runoff
and stormwater.
populated (human and livestock) Lake margins are also areas where
measures.
and stormwater
eutrophication problems are most serious (Cohen et al. 1996).
contribute to
Terracing is practiced by only about 25% of farmers in western Kenya today
eutrophication?
and this is probably a maximum for the region (Cohen et al. 1996).
Poor urban planning has enhanced amounts of
There has not been a significant change in rainfall
nutrient elements in runoff and stormwater.
patterns and amount.
The use of fuel wood among rural populations has accelerated deforestation
Widespread biomass burning has contributed to the
Atmospheric dry and wet deposition is significant to the
and has enhanced nutrient load to the Lake (via particles carried by wind
total nutrient flux to the Lake.
nutrient budget of the Lake.
(Hecky & Bugenyi 1992, Bootsma & Hecky 1993, Cohen et al. 1996).
Pollution: Issue 3 ş Chemical
Questions asked
Hypotheses
Assumptions
Evidence
Manufacturing industries in Mwanza discharge their raw effluent direct into
Inadequate or non-existent treatment of effluents prior to streams, rivers and into the Lake (Kishimba & Mkenda 1995).
Increase in industrial processing, mining, and use of
discharge in the rivers and Lake.
Kisumu effluent treatment facilities dysfunctional (actual observation) and
agro-chemicals.
What has caused
effluent discharge from industrial areas flow into the Lake through black
enhanced effluent
river (actual observation).
discharge to the
Sufficient regulations exists which if adhered to would
Lack of monitoring and enforcement of regulations,
rivers and Lake?
greatly minimise the chemical load in industrial and agro-
hence non-compliance by industry.
chemical effluents.
Incentives exist for incorporation of clean technologies in
Use of inadequate or outdated technologies.
industrial processes.
Solids are dumped close or into rivers and the Lake.
Why is there
Lack of regulations governing dumping of chemical
enhanced discharge
Sufficient regulations exist and if adhered to would
Mining dumps.
waste
of solids?
greatly minimise the chemical load in industrial and agro-
chemical effluents.
There has not been a significant change in rainfall patterns
and amount.
Terracing is practiced by only about 25% of farmers in western Kenya today
How do runoff
Excessive use of agro-chemicals in agriculture.
and this is probably a maximum for the region (Cohen et al. 1996).
and stormwater
There is increased erosion due to lack of soil conservation
contribute to
measures.
chemical pollution?
Poor waste management leads to enhanced chemical
There has not been a significant change in rainfall patterns
load in stormwater drains.
and amount.
ANNEXES
135
Annex IV
List of important water-related programmes and assessments in
the region
Programme
Aims / Objectives
Puts emphasis on activities which lead to strengthening and consolidation of its role in promoting, coordinating and harmonising the various
East African Community Secretariat : Lake Victoria Development
programmes and projects in the Lake Victoria Basin. The LVDP has already established and operationalised National Focal Points in the Partner
Programme (LVDP)
States' Ministries, responsible for Lake Victoria development.
Lake Victoria Regional Authorities Cooperation (LVRLAC)
Socio-economic concerns.
Kenya Agricultural Research Institute (KARI)
Introduction of weevils from Australia, South Africa and Uganda to control water hyacinth.
Lake Victoria Environmental Management Programme (LVEMP)
Programme to monitor water quality, control water hyacinth, and manage fisheries, wetlands and land use
East African Communities Organisation for Management of Lake
Clean productive Lake with a healthy and productive community.
Victoria (ECOVIC)
Urban Management Programme of the World Bank, in partnership
with the Municipal Development Programme (MDP) of East and
Mobilising city/municipal governments along Lake Victoria to develop a programme on environmental management/improvement for poverty
Southern Africa, and the Swedish International Development Agency reduction in the lake region.
(Sida)
Protect and restore the Lake: foster cooperation among the three East African countries on Lake issues, coordinate and harmonise national
Lake Victoria Fisheries Organisation (LVFO)
measures for the sustainable utilisation of the living resources of the Lake, develop and adopt conservation and management measures.
Lake Victoria Fisheries Research Project (LVFRP)
Status of fish stocks in the Lake, and socio-economics of the fisheries sector.
Lake Victoria Water Research Project (LVWRP)
Addressing issues of Lake water balances.
Kenya Marine Fisheries Research Institute (KMFRI)
Tanzania Fisheries Research Institute (TAFIRI)
Fisheries Research Institute of Uganda (FIRI)
Kenya Medical Research Institute (KEMRI)
Lake Basin Development Authority (LBDA)
The Nile Perch Fishery Project, IUCN
The Vulnerability Assessment of Lake Victoria basin to Environmental
Change, UNEP-DEWA
National Environment Action Plans (NEAP) for Kenya, Uganda and
Regional cooperation to address problems such as water pollution, biodiversity loss, land degradation, deforestation, damage to wetlands.
Tanzania
136
GIWA REGIONAL ASSESSMENT 47 EAST AFRICAN RIFT VALLEY LAKES
Annex V
List of conventions and specific laws that affect water use in the
region
East African Community Treaty
LVFO Convention
RAMSAR Convention
CITES Convention
Biological Diversity Convention of Agenda 21
Persistent Organic Pollutants (POPs) Convention
BASEL Convention
National Environmental Coordination Acts
National Fisheries Acts
National Water Acts
Nile Basin Treaty
SADC Protocols on Fisheries, Shared Watercourse Systems, Mining, Wildlife Conservation, and Law Enforcement
ANNEXES
137
Annex VI
Addendum: A Journalists Diary for a Lake Victoria Tour
Lake Victoria Basin: So Rich Yet So Poor
By Parsellelo Kantai
The East African, Magazine, Monday, January 14, 2002
Many blame the introduction of the Nile Perch, that voracious carnivore,
The Lake Victoria Basin is, potentially, the richest region in East Africa.
for the disappearance of the native fi sh species. "That's garbage,"
So why are its people so poor, its environment in such deep crisis?
says Okoth Mireri, a chemist by training and an environmentalist by
Special Correspondent PARSELELO KANTAI toured the region, looking
profession, working with Osienala (Dholuo for `Friends of Lake Victoria').
for answers.
"What destroyed those species? Our poor environmental practices, our
agricultural practices that have resulted in chemicals entering the lake
Of the 320 odd fi sh species native to Lake Victoria 40 years ago, only
through the rivers; our land use patterns that have brought a lot of silt
eight remain. Their disappearance from the lake has been described as
into the lake. The fi sh have disappeared because the water quality in the
"the greatest mass extinction of modem times.
Winam Gulf and around the shoreline has changed. We have destroyed
the sub-ecosystems of the shoreline where most of the fi sh, like Tilapia,
Its problems begin in bulging middle-age. At its source near Londiani,
would breed in the littoral zone. The riverine fi sh species are threatened
the River Nyando bubbles with the clarity and rebelliousness of youth.
because their breeding grounds are polluted."
But age quickly thickens and corrupts it; travel darkens it. The Nyando's
winding course down the Rift Valley and into Lake Victoria is a grim
The Nyando is one of 10 rivers that drain into Lake Victoria from the
study in waste mismanagement. Municipalities, farms - large and small,
Kenya side. Another 10 feed the lake, four from Uganda and six from
industries and markets - all empty their waste into the river, so that by
Tanzania. The Nyando is a dirty mirror image of them all. They may not
the time it nears the lake, the Nyando shows none of the purity of its
be as polluted, but they all suff er, in varying degrees, from the same
youth. It has, in fact, become the fi lthiest of all the rivers fl owing into
disease: untreated sewage from municipalities and rural towns, toxic
Lake Victoria. Old and drunk - a sampling of its
effl
uent from industries and, above all else, sediment - the biggest
waters some time ago revealed they were actually alcoholic - the
contributor of pollution in the lake basin.
Nyando is a danger to itself and to all those that use it or dwell within it.
At Ahero Bridge, some 20 kilometres from the lakeshore, it is impossible
"The sheer magnitude of soil and land degradation is phenomenal," says
to see more than an inch or two into the murk.
Markus Walsh, an ecologist researching land degradation in the lake
basin. "This sort of destruction is, I think, unparalleled in Africa."
The River Nyando is also an important spawning ground for some of
the lake's native fi sh species. At the start of the mating season they
The state of the Nvando illustrates a widelvheld view: of the three East
swim upriver, their course determined by a remarkable sensitivity
African countries that share this resource, Kenya's impact on the lake's
to the quality of water. Today, many of them are either endangered
ecological health is by tar the most severe, "All the East African countries
or extinct, unable or unwilling to breed in the Nyando's foul waters.
contribute to the pollution of the lake basin in general and Lake Victoria
Synodontis victorianus, Okoko in Dholuo: rare. Barbus spp., Adel: rare.
in particular," says Tom Anyonge of SIDA, the Swedish development
The Eel, Mastecebelus spp.: extinct. Of the 320 odd fi sh species native
agency which funds much of the research into the environmental
to Lake Victoria 40 years ago, only eight remain. Their disappearance
problems of the lake basin. "75 per cent of the lake's recharge comes
from the lake has been described as "the greatest mass extinction of
from Kenya. Kenya is also the biggest polluter of the lake, and it is doing
modem times."
the least about it."
138
GIWA REGIONAL ASSESSMENT 47 EAST AFRICAN RIFT VALLEY LAKES
A 1998 SIDA-funded report. The Lake Victoria Basin Hot Spots Study,
The lake sustains the largest freshwater fi sheries in the world. In the
paints a terrifying picture of pollution from all sides of the lake basin:
1990s, and, paradoxically, thanks to the introduction of the Nile Perch
broke and broken-down municipalities - Kisumu's sewer treatment
and the Nile Tilapia, total fi sh catches in Lake Victoria accounted for
works, for instance, stopped functioning 10 years ago; largely
25 per cent of all the fi sh caught in Africa's inland fi sheries. In 1999 at
unregulated, agro-industries dump untreated or partially treated
the height of the EU fi sh ban and water hyacinth infestation, Kenyan
effl
uent into rivers or directly into the lake; fertilisers, herbicides and
fi shermen still managed to catch and sell fi sh worth about Ksh
pesticides all fi nd their way into river systems and the lake.
8 billion($100 million).
On the banks of" the Nyando, at the junction of the new Kisii road and
Water hyacinth
the main Nakuru -Kisumu road, Ahero town is alive with activity. The
The lake's resource wealth is further increased by the fact that its soils
market centre, located close to the river and fl ush against the road,
are among the most fertile in East Africa. The varied and rich cultures
is crammed with hotels, lodgings and hundreds of hawkers selling
of its peoples, its breathtaking scenery and abundant wildlife as well
anything from those noisy alarm clocks on off er along Nairobi's Uhuru
as the sheer vastness of the lake make it, potentially, a prime tourism
Highway to vegetables, dried fi sh, fried and smoked fi sh, nyama choma
destination. Factor in the region's capacity for industry, its potential for
and mitumba of all kinds. Music in three languages fi lls the market
hydro-electricity, the gold and other mineral deposits in such places as
place, competing with shouted off ers for clothes, shoes, trinkets and
Geita in Tanzania and Macalder in Kenya, and you are looking at, again
toys, and motor vehicle spare parts. Itinerant photographers hover.
potentially, the richest region in East Africa.
Two-man welding operations squeeze between the kiosks and hotels.
quick-servicing the vehicles that ply the various Nyanza routes. Matatus
And yet the people of the lake basin are among the poorest in the
enter the market, hooting like there's a medical emergency. Touts holler.
world. On the Uganda side. 55 per cent of the population is classifi ed as
Everybody's doing roaring, raucous business. The age of trinkets and
absolutely poor. In Kenya and Tanzania, offi
cial statistics suggest poverty
second-hand clothes has arrived. Liberalisation and rural poverty are
levels of 42 per cent and 52 per cent respectively. Malnutrition is rife.
a heady mix.
Child mortality high, protein defi ciency, in this richest of protein-rich
zones, acute. Add to this the economic, social and environmental cost
Behind the market and across the road, on the banks of the river, are
of HIV/Aids, whose incidence in the lake basin is, once again, among the
scenes of people living the sort of semi-rural existence that is repeated
highest in the world, and a grim picture begins to appear tragic.
a thousand times throughout East Africa. Scores of mabati shanties
interspersed with jua kali workshops; tiny shambas line the banks.
Why?
The entire weight of Ahero's waste rolls down into River Nyando,
There are clues, but no easy answers. The dreams for the lake basin's
transported by rainwash or dumped directly into the river.
development were as grand as the area's size and potential; fi sheries,
sugar production, irrigation schemes for rice and cotton. In Kenya,
In towns like these, whose existence is incidental to the larger aims
however, where much of the early development look place, many of the
of cross-country trade, the need to connect towns and cities located
dreams' monuments are either unfi nished or rusting from disuse, giant
hundreds of kilometres apart by tarmac, the presence of a river is
jokes wilt painfully farcical punch-lines. A molasses plant that never look
frequently disastrous. For all of its chequered upstream history of
off ; the new offi
ces of the Lake Basin Development Authority, which cost a
human activity and rural waste, the Nyando is also Ahero's only source
reported Ksh900 million ($11.25 million) but never got past the foundation
of drinking water.
stage; limping sugar factories, an empty cotton mill, disused fi sh-ponds;
a rice-plantation scheme now fi lled with maize; an abandoned irrigation
"This water is used directly for domestic consumption. That is the sad part
scheme at Yala Swamp. The road between Homa Bay and Mbita Point is
of it. There is no sewage trealment at Ahero, no sewer works." explains
offi
cially tarmacked, the contractor paid, but it remains a dirt road, bone-
Okoth Mireri, who is also our guide during our Nyanza tour. "The toilets of
shaking when it's dry, nearly impassable when it rains.
Ahero are the banks of the river. Everybody shits into the river."
Waste in the lake basin is a two-lane highway: fl owing down into the
For all of its problems, however, the Lake Victoria Basin also contains
lake is the waste and pollution generated upstream. In the opposite
immense natural wealth. "The lake is this region's IMF and World Bank,"
direction, leaving the basin, fl ows the region's wealth. Few other places
says Okoth Mireri. "But only if we manage it correctly."
display such a lack of re-investment in the midst of such riches.
ANNEXES
139
Take Mbita Point, for instance. Facing the open lake, with its back to the
fi sherman's fi rm belief that there is always more where that came from.
Winam Gulf, its waters are rich fi shing grounds. So rich. in fact, that the
Drink today, for tomorrow we fi sh. It's a trend that extends across the
brokers and agents of various, mostly foreign-owned fi sh processing
lake basin, beyond borders.
companies, riding in fl eets of two-Ion Isuzu trucks, make up to three
round-trips a day from Mbita to Homa Ray, a 40 km, 90-minute trip over
"A fi sherman is a hard person to tame," says Magero. "He doesn't
the barest excuse for a road.
understand the idea of saving. We tried to implement a credit system,
whereby we buy their fi sh and pay them after three days, or they could
On each departure, their trucks are laden with the lake's harvest,
be paid in Homa Bay through a bank. They rejected that. They want to
belching smoke and the fumes of dead fi sh. Lates niloticus, Nile Perch.
be paid directly and immediately."
At the beach landing sites on an especially desperate day, the fi shermen
will sell a kilo of Nile Perch for Ksh20 (25 US cents). On a good day, it
The money left over has, presumably, helped construct the many semi-
may go for Ksh9O, just over $l. A mature Nile Perch weighs between
permanent structures, the mabati shops, the kiosks, hotelis and bars
30 and 180 kg, the heaviest ever recorded. The brokers, who sell to the
that populate this one-street township, but there is little if any evidence
processors, claim to make a paltry fi ve shillings on every kilo; "These are
of long-term prosperity here.
bad times. After fuel and maintenance, there's nothing left." said Ali, a
broker we met at a fi sh banda in Mbita, supervising the weighing and
The region's challenges remain enormous. Waste and poverty make
lugging of a 52 kg Nile Perch into his van.
awful bedfellows, and in the lake basin, they have spawned a demon
child - a debilitating culture of dependency.
The Nile Perch has been a blessing and a curse. To paraphrase the
fi ndings of a study by International Union for Conservation of Nalure
"If you ask fi shermen on the Kenya side of the lake, `Who owns the fi sh?',
(IUCN), "Rich Fisheries, Poor Fisherfolk," over the past two decades its
they will tell you that it belongs to the government," says Mireri. Such
presence has dramatically increased the total fi sh harvest from Lake
attitudes indicate the extent to which many feel that they have lost out
Victoria. It has commercialised fi shing and created employment; it
or lack a stake in managing their own resources. It doesn't help either,
has also left itinerant fi shermen at the mercy of wealthy industrial fi sh
that with the many disasters that have stalked the region in the recent
exporters, and is rapidly pushing local fi sh traders out of existence.
past, have also come armies of aid agencies and NGOs, doing little more
Along the Mbita Causeway, fi sh mamas sell the dried skeletons of
than taking the place of Mama na Baba, the government.
small, immature Nile Perch, or dried Tilapia from distant Lake Turkana.
Of the huge tonnage caught from the waters off Mbila Point, this is what
The region needs a lot more than fresh injections of funding. "Ultimately,
remains for local consumption. Small fry. The big fi sh have been loaded
the lake basin's problems can only be solved by the people of the lake
onto the trucks, headed for Nairobi, Mombasa, the export market.
themselves," says Tom Anyonge. Uganda seems to have taken this
sentiment to heart in its campaign to protect and boost the wetland
"One problem we have here is the middleman. There is a lot of money
ecologies that fringe the lake and serve as a crucial natural fi lter.
going out but the fi shermen remain poor." explains Malachi Magero, the
fi nance manager of the Suba District Co-operative Union. "At times they
Launched in 1989, the key to the Uganda National Wetlands Programme's
will bid down to less than Ksh20 per kilo. They sell the fi sh at throwaway
success has been community involvement, and specifi cally women,
prices because they can't store it," Once processed into fi llet, a kilo will
because, as one observer put it, "the government recognises that they
go for Ksh475 (S5.9) in Nairobi's supermarkets, and at least twice that
are the guardians of water and fi re in the community. They know best
on the international market.
how to manage those resources."
There is little evidence of re-investment in Mbita - or any of the fi shing
The programme also off ers a fi ve-week course in wetland management,
towns and villages on the Kenya side of the lake. In 1992, Kenyan fi shermen
trains communities in making a range of products from sustainably-
caught 219,000 tonnes offi
sh. At an average ofKsh50 ($0.6)per kilo, this
harvested wetland plants such as papyrus, rattan cane and hyacinth,
translates to nearly Ksh11 billion ($137.5 million). Where did it all go?
and is in the process of quantifying the economic contribution of the
wetlands' natural services.
Whatever money left behind in Mbita is quickly frittered away, drained
down the urinals of the many bars and hotels, testimony to the
140
GIWA REGIONAL ASSESSMENT 47 EAST AFRICAN RIFT VALLEY LAKES
Pollution must also be aggressively tackled at its source. Before Okoth
Mireri and Osienala began preaching the virtues of waste treatment to
the managers at Muhoroni Sugar Factory and its molasses-producing
counterpart, Agrochemicals and Foods Ltd, the two were among the
worst industrial polluters in the lake basin. Effl
uent released from
Agrochemicals had a BOD (biological oxygen demand, a measure
of its pollutants) of 95 000 milligrammes per litre. The World Health
Organisation recommended level is 100.
The giant mollasses plant in Kisumu has never taken off .
Like many other factories, they had taken advantage of weak
environmental laws and opted to pay ridiculously small fi nes rather
than improving their treatment plants. Osienala was faced with the
choice of either exposing them, eventually getting them closed down
and leaving thousands of people unemployed, or working with them
to steadily reduce their pollution-levels. They chose the latter.
Working with the District Development Committee, they managed to
get the government to off er them some tax breaks. Eventually, and
at a huge cost to both companies - Ksh300 million for Agrochemicals
and Kshl20 million for Muhoroni ($3.75 million/$1.5 million) - the two
installed new treatment works and are
gradually reducing the toxicity of their effl
uents.
All of these opportunities, bright spots fl ickering on the horizon, are
fragile, easily extinguished. And they won't amount to much overall if
the fundamental problem of the lake basin is not addressed: resource
ownership. It is not for lack of laws - whether old or new - that fi shermen
poison fi sh, that industries fl ush their untreated waste down rivers, that
municipal councils endanger the lives of their citizens by emptying
raw sewage directly into the lake. These acts of irresponsibility are
nurtured in an environment where entire communities have been
disenfranchised and the extraction and exportation of wealth have
become the dominant trends. Until these basic issues are addressed,
the region's economic potential will be something we'll be talking
about forever.
This article was fi rst published in `Ecoforum' magazine.
ANNEXES
141
The Global International
Waters Assessment
This report presents the results of the Global International Waters
Adequately managing the world's aquatic resources for the benefi t of
Assessment (GIWA) of the transboundary waters of the East
all is, for a variety of reasons, a very complex task. The liquid state of
African Rift Valley Lakes. This and the subsequent chapter off er a
the most of the world's water means that, without the construction
background that describes the impetus behind the establishment of
of reservoirs, dams and canals it is free to fl ow wherever the laws of
GIWA, its objectives and how the GIWA was implemented.
nature dictate. Water is, therefore, a vector transporting not only a
wide variety of valuable resources but also problems from one area
to another. The effl
uents emanating from environmentally destructive
activities in upstream drainage areas are propagated downstream
The need for a global
and can aff ect other areas considerable distances away. In the case of
international waters
transboundary river basins, such as the Nile, Amazon and Niger, the
assessment
impacts are transported across national borders and can be observed
in the numerous countries situated within their catchments. In the case
of large oceanic currents, the impacts can even be propagated between
Globally, people are becoming increasingly aware of the degradation of
continents (AMAP 1998). Therefore, the inextricable linkages within
the world's water bodies. Disasters from fl oods and droughts, frequently
and between both freshwater and marine environments dictates that
reported in the media, are considered to be linked with ongoing global
management of aquatic resources ought to be implemented through
climate change (IPCC 2001), accidents involving large ships pollute public
a drainage basin approach.
beaches and threaten marine life and almost every commercial fi sh stock
is exploited beyond sustainable limits - it is estimated that the global
In addition, there is growing appreciation of the incongruence
stocks of large predatory fi sh have declined to less that 10% of pre-
between the transboundary nature of many aquatic resources and the
industrial fi shing levels (Myers & Worm 2003). Further, more than 1 billion
traditional introspective nationally focused approaches to managing
people worldwide lack access to safe drinking water and 2 billion people
those resources. Water, unlike laws and management plans, does not
lack proper sanitation which causes approximately 4 billion cases of
respect national borders and, as a consequence, if future management
diarrhoea each year and results in the death of 2.2 million people, mostly
of water and aquatic resources is to be successful, then a shift in focus
children younger than fi ve (WHO-UNICEF 2002). Moreover, freshwater
towards international cooperation and intergovernmental agreements
and marine habitats are destroyed by infrastructure developments,
is required (UN 1972). Furthermore, the complexity of managing the
dams, roads, ports and human settlements (Brinson & Malvßrez 2002,
world's water resources is exacerbated by the dependence of a great
Kennish 2002). As a consequence, there is growing public concern
variety of domestic and industrial activities on those resources. As a
regarding the declining quality and quantity of the world's aquatic
consequence, cross-sectoral multidisciplinary approaches that integrate
resources because of human activities, which has resulted in mounting
environmental, socio-economic and development aspects into
pressure on governments and decision makers to institute new and
management must be adopted. Unfortunately however, the scientifi c
innovative policies to manage those resources in a sustainable way
information or capacity within each discipline is often not available or
ensuring their availability for future generations.
is inadequately translated for use by managers, decision makers and
GLOBAL INTERNATIONAL WATERS ASSESSMENT
i
policy developers. These inadequacies constitute a serious impediment
The Global Environment Facility (GEF)
to the implementation of urgently needed innovative policies.
The Global Environment Facility forges international co-operation and fi nances actions to address
six critical threats to the global environment: biodiversity loss, climate change, degradation of
international waters, ozone depletion, land degradation, and persistent organic pollutants (POPs).
Continual assessment of the prevailing and future threats to aquatic
The overall strategic thrust of GEF-funded international waters activities is to meet the incremental
ecosystems and their implications for human populations is essential if
costs of: (a) assisting groups of countries to better understand the environmental concerns of
their international waters and work collaboratively to address them; (b) building the capacity
governments and decision makers are going to be able to make strategic
of existing institutions to utilise a more comprehensive approach for addressing transboundary
policy and management decisions that promote the sustainable use of
water-related environmental concerns; and (c) implementing measures that address the priority
transboundary environmental concerns. The goal is to assist countries to utilise the full range of
those resources and respond to the growing concerns of the general
technical, economic, fi nancial, regulatory, and institutional measures needed to operationalise
public. Although many assessments of aquatic resources are being
sustainable development strategies for international waters.
conducted by local, national, regional and international bodies, past
United Nations Environment Programme (UNEP)
assessments have often concentrated on specifi c themes, such as
United Nations Environment Programme, established in 1972, is the voice for the environment
biodiversity or persistent toxic substances, or have focused only on
within the United Nations system. The mission of UNEP is to provide leadership and encourage
partnership in caring for the environment by inspiring, informing, and enabling nations and
marine or freshwaters. A globally coherent, drainage basin based
peoples to improve their quality of life without compromising that of future generations.
assessment that embraces the inextricable links between transboundary
UNEP work encompasses:
freshwater and marine systems, and between environmental and
Assessing global, regional and national environmental conditions and trends;
Developing international and national environmental instruments;
societal issues, has never been conducted previously.
Strengthening institutions for the wise management of the environment;
Facilitating the transfer of knowledge and technology for sustainable development;
Encouraging new partnerships and mind-sets within civil society and the private sector.
International call for action
University of Kalmar
University of Kalmar hosts the GIWA Co-ordination Offi ce and provides scientifi c advice and
administrative and technical assistance to GIWA. University of Kalmar is situated on the coast of
The need for a holistic assessment of transboundary waters in order to
the Baltic Sea. The city has a long tradition of higher education; teachers and marine offi cers have
been educated in Kalmar since the middle of the 19th century. Today, natural science is a priority
respond to growing public concerns and provide advice to governments
area which gives Kalmar a unique educational and research profi le compared with other smaller
universities in Sweden. Of particular relevance for GIWA is the established research in aquatic and
and decision makers regarding the management of aquatic resources
environmental science. Issues linked to the concept of sustainable development are implemented
was recognised by several international bodies focusing on the global
by the research programme Natural Resources Management and Agenda 21 Research School.
environment. In particular, the Global Environment Facility (GEF)
Since its establishment GIWA has grown to become an integral part of University activities.
The GIWA Co-ordination offi ce and GIWA Core team are located at the Kalmarsund Laboratory, the
observed that the International Waters (IW) component of the GEF
university centre for water-related research. Senior scientists appointed by the University are actively
suff ered from the lack of a global assessment which made it diffi
cult
involved in the GIWA peer-review and steering groups. As a result of the cooperation the University
can offer courses and seminars related to GIWA objectives and international water issues.
to prioritise international water projects, particularly considering
the inadequate understanding of the nature and root causes of
environmental problems. In 1996, at its fourth meeting in Nairobi, the
causes of degradation of the transboundary aquatic environment and
GEF Scientifi c and Technical Advisory Panel (STAP), noted that: "Lack of
options for addressing them. These pro cesses led to the development
an International Waters Assessment comparable with that of the IPCC, the
of the Global International Waters Assessment (GIWA) that would be
Global Biodiversity Assessment, and the Stratospheric Ozone Assessment,
implemented by the United Nations Environment Programme (UNEP) in
was a unique and serious impediment to the implementation of the
conjunction with the University of Kalmar, Sweden, on behalf of the GEF.
International Waters Component of the GEF".
The GIWA was inaugurated in Kalmar in October 1999 by the Executive
Director of UNEP, Dr. Klaus T÷pfer, and the late Swedish Minister of the
The urgent need for an assessment of the causes of environmental
Environment, Kjell Larsson. On this occasion Dr. T÷pfer stated: "GIWA
degradation was also highlighted at the UN Special Session on
is the framework of UNEP┤s global water assessment strategy and will
the Environment (UNGASS) in 1997, where commitments were
enable us to record and report on critical water resources for the planet for
made regarding the work of the UN Commission on Sustainable
consideration of sustainable development management practices as part of
Development (UNCSD) on freshwater in 1998 and seas in 1999. Also in
our responsibilities under Agenda 21 agreements of the Rio conference".
1997, two international Declarations, the Potomac Declaration: Towards
enhanced ocean security into the third millennium, and the Stockholm
The importance of the GIWA has been further underpinned by the UN
Statement on inter action of land activities, freshwater and enclosed
Millennium Development Goals adopted by the UN General Assembly
seas, specifi cally emphasised the need for an investigation of the root
in 2000 and the Declaration from the World Summit on Sustainable
ii
REGIONAL ASSESSMENTS
Development in 2002. The development goals aimed to halve the
International waters and transboundary issues
proportion of people without access to safe drinking water and basic
The term "international waters", as used for the purposes of the GEF Operational Strategy,
sanitation by the year 2015 (United Nations Millennium Declaration
includes the oceans, large marine ecosystems, enclosed or semi-enclosed seas and estuaries, as
well as rivers, lakes, groundwater systems, and wetlands with transboundary drainage basins
2000). The WSSD also calls for integrated management of land, water and
or common borders. The water-related ecosystems associated with these waters are considered
living resources (WSSD 2002) and, by 2010, the Reykjavik Declaration on
integral parts of the systems.
The term "transboundary issues" is used to describe the threats to the aquatic environment
Responsible Fisheries in the Marine Ecosystem should be implemented
linked to globalisation, international trade, demographic changes and technological advancement,
by all countries that are party to the declaration (FAO 2001).
threats that are additional to those created through transboundary movement of water. Single
country policies and actions are inadequate in order to cope with these challenges and this makes
them transboundary in nature.
The international waters area includes numerous international conventions, treaties, and
agreements. The architecture of marine agreements is especially complex, and a large number
The conceptual framework
of bilateral and multilateral agreements exist for transboundary freshwater basins. Related
conventions and agreements in other areas increase the complexity. These initiatives provide
and objectives
a new opportunity for cooperating nations to link many different programmes and instruments
into regional comprehensive approaches to address international waters.
Considering the general decline in the condition of the world's aquatic
the large-scale deforestation of mangroves for ponds (Primavera 1997).
resources and the internationally recognised need for a globally
Within the GIWA, these "non-hydrological" factors constitute as large
coherent assessment of transboundary waters, the primary objectives
a transboundary infl uence as more traditionally recognised problems,
of the GIWA are:
such as the construction of dams that regulate the fl ow of water into
To provide a prioritising mechanism that allows the GEF to focus
a neighbouring country, and are considered equally important. In
their resources so that they are used in the most cost eff ective
addition, the GIWA recognises the importance of hydrological units that
manner to achieve signifi cant environmental benefi ts, at national,
would not normally be considered transboundary but exert a signifi cant
regional and global levels; and
infl uence on transboundary waters, such as the Yangtze River in China
To highlight areas in which governments can develop and
which discharges into the East China Sea (Daoji & Daler 2004) and the
implement strategic policies to reduce environmental degradation
Volga River in Russia which is largely responsible for the condition of
and improve the management of aquatic resources.
the Caspian Sea (Barannik et al. 2004). Furthermore, the GIWA is a truly
regional assessment that has incorporated data from a wide range of
In order to meet these objectives and address some of the current
sources and included expert knowledge and information from a wide
inadequacies in international aquatic resources management, the GIWA
range of sectors and from each country in the region. Therefore, the
has incorporated four essential elements into its design:
transboundary concept adopted by the GIWA extends to include
A broad transboundary approach that generates a truly regional
impacts caused by globalisation, international trade, demographic
perspective through the incorporation of expertise and existing
changes and technological advances and recognises the need for
information from all nations in the region and the assessment of
international cooperation to address them.
all factors that infl uence the aquatic resources of the region;
A drainage basin approach integrating freshwater and marine
systems;
A multidisciplinary approach integrating environmental and socio-
The organisational structure and
economic information and expertise; and
implementation of the GIWA
A coherent assessment that enables global comparison of the
results.
The scale of the assessment
Initially, the scope of the GIWA was confi ned to transboundary waters
The GIWA builds on previous assessments implemented within the GEF
in areas that included countries eligible to receive funds from the GEF.
International Waters portfolio but has developed and adopted a broader
However, it was recognised that a truly global perspective would only
defi nition of transboundary waters to include factors that infl uence the
be achieved if industrialised, GEF-ineligible regions of the world were
quality and quantity of global aquatic resources. For example, due to
also assessed. Financial resources to assess the GEF-eligible countries
globalisation and international trade, the market for penaeid shrimps
were obtained primarily from the GEF (68%), the Swedish International
has widened and the prices soared. This, in turn, has encouraged
Development Cooperation Agency (Sida) (18%), and the Finnish
entrepreneurs in South East Asia to expand aquaculture resulting in
Department for International Development Cooperation (FINNIDA)
GLOBAL INTERNATIONAL WATERS ASSESSMENT
iii
1b
1c
1d
16
15
11
14
12
1a
13
17
28
10
18
25
30
9
19
23
7
22
8
31
6
24
33
20
34
26
2
5
27
50
51
32
21
36
37
41
52
4
49
53
43
54
55
65
42
3
56
42
46
42
47
62
40b
57
40a
40a
47
47
45b
59
39
45a
58
64
60
44
38
61
63
66
ę GIWA 2006
1a Russian Arctic (4 LMEs)
8 Gulf of St Lawrence
17 Baltic
Sea
(LME)
26 California Current (LME)
38 Patagonian Shelf (LME)
45b Indian Ocean Islands
52 Arabian
Sea
(LME)
61 Great
Australian
Bight
1b Arctic
Greenland
(LME)
9 Newfoundland Shelf (LME)
18 North Sea (LME)
27 Gulf of California (LME)
39 Brazil Current (LME)
46 Somali Coastal
53 Bay of Bengal
62 Pacifi c Islands
1c Arctic
European/Atlantic
10 Baffi
n Bay, Labrador Sea,
19 Celtic-Biscay Shelf (LME)
28 Bering Sea (LME)
40a Northeast Brazil
Current (LME)
54 South China Sea (2 LMEs)
63 Tasman
Sea
1d Arctic North American
Canadian Archipelago
20 Iberian Coastal Sea (LME)
30 Sea of Okhotsk (LME)
Shelf (2 LMEs)
47 East
African
Rift
55 Mekong
River
64 Humboldt Current (LME)
2
Gulf of Mexico (LME)
11 Barents
Sea
(LME)
21 North Africa and
31 Oyashio Current (LME)
40b Amazon
Valley Lakes
56 Sulu-Celebes Sea (LME)
65 Eastern Equatorial
3 Caribbean
Sea
(LME)
12 Norwegian
Sea
(LME)
Nile River Basin (LME)
32 Kuroshio
Current
(LME)
41 Canary Current (LME)
49 Red Sea and
57 Indonesian
Seas
(LME)
Pacifi c (LME)
4 Caribbean
Islands
(LME)
13 Faroe
plateau
22 Black Sea (LME)
33 Sea
of
Japan
(LME)
42 Guinea Current (LME)
Gulf of Aden (LME)
58 North Australian
66 Antarctic (LME)
5
Southeast Shelf (LME)
14 Iceland
Shelf
(LME)
23 Caspian
Sea
34 Yellow Sea (LME)
43 Lake Chad
50 Euphrates and
Shelf (LME)
6 Northeast Shelf (LME)
15 East Greenland Shelf (LME)
24 Aral Sea
36 East China Sea (LME)
44 Benguela Current (LME)
Tigris River Basin
59 Coral
Sea
Basin
7
Scotian Shelf (LME)
16 West Greenland Shelf (LME)
25 Gulf of Alaska (LME)
37 Hawaiian Archipelago (LME)
45a Agulhas Current (LME)
51 Jordan
60 Great Barrier Reef (LME)
Figure 1
The 66 transboundary regions assessed within the GIWA project.
(10%). Other contributions were made by Kalmar Municipality, the
Large Marine Ecocsystems (LMEs)
University of Kalmar and the Norwegian Government. The assessment of
Large Marine Ecosystems (LMEs) are regions of ocean space encompassing coastal areas from river
regions ineligible for GEF funds was conducted by various international
basins and estuaries to the seaward boundaries of continental shelves and the outer margin of the
major current systems. They are relatively large regions on the order of 200 000 km2 or greater,
and national organisations as in-kind contributions to the GIWA.
characterised by distinct: (1) bathymetry, (2) hydrography, (3) productivity, and (4) trophically
dependent populations.
The Large Marine Ecosystems strategy is a global effort for the assessment and management
In order to be consistent with the transboundary nature of many of the
of international coastal waters. It developed in direct response to a declaration at the 1992
world's aquatic resources and the focus of the GIWA, the geographical
Rio Summit. As part of the strategy, the World Conservation Union (IUCN) and National Oceanic
and Atmospheric Administration (NOAA) have joined in an action program to assist developing
units being assessed have been designed according to the watersheds
countries in planning and implementing an ecosystem-based strategy that is focused on LMEs as
of discrete hydrographic systems rather than political borders (Figure 1).
the principal assessment and management units for coastal ocean resources. The LME concept is
also adopted by GEF that recommends the use of LMEs and their contributing freshwater basins
The geographic units of the assessment were determined during the
as the geographic area for integrating changes in sectoral economic activities.
preparatory phase of the project and resulted in the division of the
world into 66 regions defi ned by the entire area of one or more
The global network
catchments areas that drains into a single designated marine system.
In each of the 66 regions, the assessment is conducted by a team of
These marine systems often correspond to Large Marine Ecosystems
local experts that is headed by a Focal Point (Figure 2). The Focal Point
(LMEs) (Sherman 1994, IOC 2002).
can be an individual, institution or organisation that has been selected
on the basis of their scientifi c reputation and experience implementing
Considering the objectives of the GIWA and the elements incorporated
international assessment projects. The Focal Point is responsible
into its design, a new methodology for the implementation of the
for assembling members of the team and ensuring that it has the
assessment was developed during the initial phase of the project. The
necessary expertise and experience in a variety of environmental
methodology focuses on fi ve major environmental concerns which
and socio-economic disciplines to successfully conduct the regional
constitute the foundation of the GIWA assessment; Freshwater shortage,
assessment. The selection of team members is one of the most critical
Pollution, Habitat and community modifi cation, Overexploitation of fi sh
elements for the success of GIWA and, in order to ensure that the
and other living resources, and Global change. The GIWA methodology
most relevant information is incorporated into the assessment, team
is outlined in the following chapter.
members were selected from a wide variety of institutions such as
iv
REGIONAL ASSESSMENTS
an assessment did not exist. Therefore, in order to implement the GIWA,
Steering Group
a new methodology that adopted a multidisciplinary, multi-sectoral,
multi-national approach was developed and is now available for the
implementation of future international assessments of aquatic resources.
GIWA Partners
IGOs, NGOs,
Core
Thematic
The GIWA is comprised of a logical sequence of four integrated
Scientific institutions,
Team
Task Teams
private sector, etc
components. The fi rst stage of the GIWA is called Scaling and is a
66 Regional
process by which the geographic area examined in the assessment is
Focal Points
defi ned and all the transboundary waters within that area are identifi ed.
and Teams
Once the geographic scale of the assessment has been defi ned, the
Figure 2
The organisation of the GIWA project.
assessment teams conduct a process known as Scoping in which the
magnitude of environmental and associated socio-economic impacts
universities, research institutes, government agencies, and the private
of Freshwater shortage, Pollution, Habitat and community modifi cation,
sector. In addition, in order to ensure that the assessment produces a
Unsustainable exploitation of fi sh and other living resources, and Global
truly regional perspective, the teams should include representatives
change is assessed in order to identify and prioritise the concerns
from each country that shares the region.
that require the most urgent intervention. The assessment of these
predefi ned concerns incorporates the best available information and
In total, more than 1 000 experts have contributed to the implementation
the knowledge and experience of the multidisciplinary, multi-national
of the GIWA illustrating that the GIWA is a participatory exercise that
assessment teams formed in each region. Once the priority concerns
relies on regional expertise. This participatory approach is essential
have been identifi ed, the root causes of these concerns are identifi ed
because it instils a sense of local ownership of the project, which
during the third component of the GIWA, Causal chain analysis. The root
ensures the credibility of the fi ndings and moreover, it has created a
causes are determined through a sequential process that identifi es, in
global network of experts and institutions that can collaborate and
turn, the most signifi cant immediate causes followed by the economic
exchange experiences and expertise to help mitigate the continued
sectors that are primarily responsible for the immediate causes and
degradation of the world's aquatic resources.
fi nally, the societal root causes. At each stage in the Causal chain
analysis, the most signifi cant contributors are identifi ed through an
analysis of the best available information which is augmented by the
expertise of the assessment team. The fi nal component of the GIWA is
GIWA Regional reports
the development of Policy options that focus on mitigating the impacts
of the root causes identifi ed by the Causal chain analysis.
The GIWA was established in response to growing concern among the
general public regarding the quality of the world's aquatic resources
The results of the GIWA assessment in each region are reported in
and the recognition of governments and the international community
regional reports that are published by UNEP. These reports are designed
concerning the absence of a globally coherent international waters
to provide a brief physical and socio-economic description of the
assessment. However, because a holistic, region-by-region, assessment
most important features of the region against which the results of the
of the condition of the world's transboundary water resources had never
assessment can be cast. The remaining sections of the report present
been undertaken, a methodology guiding the implementation of such
the results of each stage of the assessment in an easily digestible form.
Each regional report is reviewed by at least two independent external
UNEP Water Policy and Strategy
reviewers in order to ensure the scientifi c validity and applicability of
The primary goals of the UNEP water policy and strategy are:
each report. The 66 regional assessments of the GIWA will serve UNEP
(a) Achieving greater global understanding of freshwater, coastal and marine environments by
as an essential complement to the UNEP Water Policy and Strategy and
conducting environmental assessments in priority areas;
(b) Raising awareness of the importance and consequences of unsustainable water use;
UNEP's activities in the hydrosphere.
(c) Supporting the efforts of Governments in the preparation and implementation of integrated
management of freshwater systems and their related coastal and marine environments;
(d) Providing support for the preparation of integrated management plans and programmes for
aquatic environmental hot spots, based on the assessment results;
Global International Waters Assessment
(e) Promoting the application by stakeholders of precautionary, preventive and anticipatory
approaches.
GLOBAL INTERNATIONAL WATERS ASSESSMENT
v
References:
AMAP (1998). Assessment Report: Arctic Pollution Issues. Arctic
Monitoring and Assessment Programme (AMAP), Oslo, Norway.
Barannik, V., Borysova, O. and Stolberg, F. (2004). The Caspian Sea Region:
Environmental Change. Ambio, 33:45-51.
Brinson, M.M. and Malvßrez, A.I. (2002). Temperate freshwater wetlands:
types, status, and threats. Environmental Conservation, 29:115-133.
Daoji, L. and Daler, D. (2004). Ocean Pollution from Land-based Sources:
East China Sea, China. Ambio, 33:98-106.
FAO (2001). Reykjavik conference on responsible fi sheries in the marine
ecosystem. Iceland, 1-4 October 2001.
IOC (2002). IOC-IUCN-NOAA Consultative Meeting on Large Marine
Ecosystems (LMEs). Fourth Session, 8-9 January 2002, Paris,
France.
IPCC (2001). Climate Change 2001: The Scientifi c Basis. Contribution
of Working Group I to the Third Assessment Report of the
Intergovernmental Panel on Climate Change. In: Houghton,
J.T., Ding, Y., Griggs, D.J., Noguer, M., van der Linden, P.J., Dai, X.,
Maskell, K. and Johnson, C.A. (eds). Cambridge University Press,
Cambridge, United Kingdom and New York, NY, USA.
Kennish, M.J. (2002). Environmental threats and environmental future of
estuaries. Environmental Conservation, 29:78-107.
Myers, R.A. and Worm, B. (2003). Rapid worldwide depletion of predatory
fi sh communities. Nature, 423:280-283.
Primavera, J.H. (1997) Socio-economic impacts of shrimp culture.
Aquaculture Research, 28:815-827.
Sherman, K. (1994). Sustainability, biomass yields, and health of coastal
ecosystems: an ecological perspective. Marine Ecology Progress
Series, 112:277-301.
United Nations conference on the human environment (1972). Report
available on-line at http://www.unep.org
United Nations Millennium Declaration (2000). The Millennium
Assembly of the United Nations, New York.
WHO-UNICEF (2002). Global Water Supply and Sanitation Assessment:
2000 Report.
WSSD (2002). World Summit on Sustainable Development.
Johannesburg Summit 2002. Key Outcomes of the Summit,
UN Department of Public Information, New York.
vi
REGIONAL ASSESSMENTS
The GIWA methodology
The specifi c objectives of the GIWA were to conduct a holistic and globally
The assessment integrates environmental and socio-economic data
comparable assessment of the world's transboundary aquatic resources
from each country in the region to determine the severity of the
that incorporated both environmental and socio-economic factors
impacts of each of the fi ve concerns and their constituent issues on
and recognised the inextricable links between freshwater and marine
the entire region. The integration of this information was facilitated by
environments, in order to enable the GEF to focus their resources and to
implementing the assessment during two participatory workshops
provide guidance and advice to governments and decision makers. The
that typically involved 10 to 15 environmental and socio-economic
coalition of all these elements into a single coherent methodology that
experts from each country in the region. During these workshops, the
produces an assessment that achieves each of these objectives had not
regional teams performed preliminary analyses based on the collective
previously been done and posed a signifi cant challenge.
knowledge and experience of these local experts. The results of these
analyses were substantiated with the best available information to be
The integration of each of these elements into the GIWA methodology
presented in a regional report.
was achieved through an iterative process guided by a specially
Table 1 Pre-defi ned GIWA concerns and their constituent issues
convened Methods task team that was comprised of a number of
addressed within the assessment.
international assessment and water experts. Before the fi nal version
of the methodology was adopted, preliminary versions underwent
Environmental issues
Major concerns
an extensive external peer review and were subjected to preliminary
1. Modification of stream flow
testing in selected regions. Advice obtained from the Methods task
2. Pollution of existing supplies
I Freshwater shortage
3. Changes in the water table
team and other international experts and the lessons learnt from
preliminary testing were incorporated into the fi nal version that was
4. Microbiological
5. Eutrophication
used to conduct each of the GIWA regional assessments.
6. Chemical
7. Suspended
solids
II Pollution
8. Solid wastes
Considering the enormous diff erences between regions in terms of the
9. Thermal
10. Radionuclide
quality, quantity and availability of data, socio-economic setting and
11. Spills
environmental conditions, the achievement of global comparability
12. Loss of ecosystems
required an innovative approach. This was facilitated by focusing
III Habitat and community
13. Modification of ecosystems or ecotones, including community
modification
structure and/or species composition
the assessment on the impacts of fi ve pre-defi ned concerns namely;
Freshwater shortage, Pollution, Habitat and community modifi cation,
14. Overexploitation
15. Excessive by-catch and discards
IV Unsustainable
Unsustainable exploitation of fi sh and other living resources and Global
16. Destructive fishing practices
exploitation of fish and
change, in transboundary waters. Considering the diverse range of
17. Decreased viability of stock through pollution and disease
other living resources
18. Impact on biological and genetic diversity
elements encompassed by each concern, assessing the magnitude of
the impacts caused by these concerns was facilitated by evaluating the
19. Changes in hydrological cycle
20. Sea level change
V Global change
impacts of 22 specifi c issues that were grouped within these concerns
21. Increased uv-b radiation as a result of ozone depletion
22. Changes in ocean CO source/sink function
(see Table 1).
2
THE GIWA METHODOLOGY
vii
political boundaries but were instead, generally defi ned by a large but
T
r
ansboundar
The GIWA approach
discrete drainage basin that also included the coastal marine waters into
which the basin discharges. In many cases, the marine areas examined
1
Scaling
st
W
orkshop
Detailed
during the assessment coincided with the Large Marine Ecosystems
y
D
(LMEs) defi ned by the US National Atmospheric and Oceanographic
iagnostic
A
ssessment
Scoping
Administration (NOAA). As a consequence, scaling should be a
relatively straight-forward task that involves the inspection of the
Analy
boundaries that were proposed for the region during the preparatory
Causal Chain
2 nd
Analysis
sis
phase of GIWA to ensure that they are appropriate and that there are
W
orkshop
no important overlaps or gaps with neighbouring regions. When the
Policy Option
proposed boundaries were found to be inadequate, the boundaries of
Analysis
the region were revised according to the recommendations of experts
from both within the region and from adjacent regions so as to ensure
that any changes did not result in the exclusion of areas from the GIWA.
Once the regional boundary was defi ned, regional teams identifi ed all
SAP
the transboundary elements of the aquatic environment within the
SAP
region and determined if these elements could be assessed as a single
Figure 1
Illustration of the relationship between the GIWA
coherent aquatic system or if there were two or more independent
approach and other projects implemented within the
systems that should be assessed separately.
GEF International Waters (IW) portfolio.
The GIWA is a logical contiguous process that defi nes the geographic
Scoping ş Assessing the GIWA concerns
region to be assessed, identifi es and prioritises particularly problems
Scoping is an assessment of the severity of environmental and socio-
based on the magnitude of their impacts on the environment and
economic impacts caused by each of the fi ve pre-defi ned GIWA concerns
human societies in the region, determines the root causes of those
and their constituent issues (Table 1). It is not designed to provide an
problems and, fi nally, assesses various policy options that addresses
exhaustive review of water-related problems that exist within each region,
those root causes in order to reverse negative trends in the condition
but rather it is a mechanism to identify the most urgent problems in the
of the aquatic environment. These four steps, referred to as Scaling,
region and prioritise those for remedial actions. The priorities determined
Scoping, Causal chain analysis and Policy options analysis, are
by Scoping are therefore one of the main outputs of the GIWA project.
summarised below and are described in their entirety in two volumes:
GIWA Methodology Stage 1: Scaling and Scoping; and GIWA Methodology:
Focusing the assessment on pre-defi ned concerns and issues ensured
Detailed Assessment, Causal Chain Analysis and Policy Options Analysis.
the comparability of the results between diff erent regions. In addition, to
Generally, the components of the GIWA methodology are aligned
ensure the long-term applicability of the options that are developed to
with the framework adopted by the GEF for Transboundary Diagnostic
mitigate these problems, Scoping not only assesses the current impacts
Analyses (TDAs) and Strategic Action Programmes (SAPs) (Figure 1) and
of these concerns and issues but also the probable future impacts
assume a broad spectrum of transboundary infl uences in addition to
according to the "most likely scenario" which considered demographic,
those associated with the physical movement of water across national
economic, technological and other relevant changes that will potentially
borders.
infl uence the aquatic environment within the region by 2020.
Scaling ş Defining the geographic extent
The magnitude of the impacts caused by each issue on the
of the region
environment and socio-economic indicators was assessed over the
Scaling is the fi rst stage of the assessment and is the process by which
entire region using the best available information from a wide range of
the geographic scale of the assessment is defi ned. In order to facilitate
sources and the knowledge and experience of the each of the experts
the implementation of the GIWA, the globe was divided during the
comprising the regional team. In order to enhance the comparability
design phase of the project into 66 contiguous regions. Considering the
of the assessment between diff erent regions and remove biases
transboundary nature of many aquatic resources and the transboundary
in the assessment caused by diff erent perceptions of and ways to
focus of the GIWA, the boundaries of the regions did not comply with
communicate the severity of impacts caused by particular issues, the
viii
REGIONAL ASSESSMENTS
results were distilled and reported as standardised scores according to
Table 2
Example of environmental impact assessment of
Freshwater shortage.
the following four point scale:
Weight
0 = no known impact
Environmental
Environmental issues
Score
Weight %
averaged
concerns
1 = slight impact
score
2 = moderate impact
1. Modification of stream flow
1
20
Freshwater shortage
1.50
3 = severe impact
2. Pollution of existing supplies
2
50
The attributes of each score for each issue were described by a detailed
3. Changes in the water table
1
30
set of pre-defi ned criteria that were used to guide experts in reporting
Table 3
Example of Health impacts assessment linked to one of
the results of the assessment. For example, the criterion for assigning
the GIWA concerns.
a score of 3 to the issue Loss of ecosystems or ecotones is: "Permanent
Criteria for Health impacts
Raw score
Score
Weight %
destruction of at least one habitat is occurring such as to have reduced their
Very small
Very large
surface area by >30% during the last 2-3 decades". The full list of criteria is
Number of people affected
2
50
0 1 2 3
presented at the end of the chapter, Table 5a-e. Although the scoring
Minimum
Severe
Degree of severity
2
30
0 1 2 3
inevitably includes an arbitrary component, the use of predefi ned
Occasion/Short
Continuous
Frequency/Duration
2
20
0 1 2 3
criteria facilitates comparison of impacts on a global scale and also
Weight average score for Health impacts
2
encouraged consensus of opinion among experts.
The trade-off associated with assessing the impacts of each concern
After all 22 issues and associated socio-economic impacts have
and their constituent issues at the scale of the entire region is that spatial
been scored, weighted and averaged, the magnitude of likely future
resolution was sometimes low. Although the assessment provides a
changes in the environmental and socio-economic impacts of each
score indicating the severity of impacts of a particular issue or concern
of the fi ve concerns on the entire region is assessed according to the
on the entire region, it does not mean that the entire region suff ers
most likely scenario which describes the demographic, economic,
the impacts of that problem. For example, eutrophication could be
technological and other relevant changes that might infl uence the
identifi ed as a severe problem in a region, but this does not imply that all
aquatic environment within the region by 2020.
waters in the region suff er from severe eutrophication. It simply means
that when the degree of eutrophication, the size of the area aff ected,
In order to prioritise among GIWA concerns within the region and
the socio-economic impacts and the number of people aff ected is
identify those that will be subjected to causal chain and policy options
considered, the magnitude of the overall impacts meets the criteria
analysis in the subsequent stages of the GIWA, the present and future
defi ning a severe problem and that a regional action should be initiated
scores of the environmental and socio-economic impacts of each
in order to mitigate the impacts of the problem.
concern are tabulated and an overall score calculated. In the example
presented in Table 4, the scoping assessment indicated that concern III,
When each issue has been scored, it was weighted according to the relative
Habitat and community modifi cation, was the priority concern in this
contribution it made to the overall environmental impacts of the concern
region. The outcome of this mathematic process was reconciled against
and a weighted average score for each of the fi ve concerns was calculated
the knowledge of experts and the best available information in order
(Table 2). Of course, if each issue was deemed to make equal contributions,
to ensure the validity of the conclusion.
then the score describing the overall impacts of the concern was simply the
arithmetic mean of the scores allocated to each issue within the concern.
In some cases however, this process and the subsequent participatory
In addition, the socio-economic impacts of each of the fi ve major
discussion did not yield consensus among the regional experts
concerns were assessed for the entire region. The socio-economic
regarding the ranking of priorities. As a consequence, further analysis
impacts were grouped into three categories; Economic impacts,
was required. In such cases, expert teams continued by assessing the
Health impacts and Other social and community impacts (Table 3). For
relative importance of present and potential future impacts and assign
each category, an evaluation of the size, degree and frequency of the
weights to each. Afterwards, the teams assign weights indicating the
impact was performed and, once completed, a weighted average score
relative contribution made by environmental and socio-economic
describing the overall socio-economic impacts of each concern was
factors to the overall impacts of the concern. The weighted average
calculated in the same manner as the overall environmental score.
score for each concern is then recalculated taking into account
THE GIWA METHODOLOGY
ix
Table 4
Example of comparative environmental and socio-economic impacts of each major concern, presently and likely in year 2020.
Types of impacts
Environmental score
Economic score
Human health score
Social and community score
Concern
Overall score
Present (a)
Future (b)
Present (c)
Future (d)
Present (e)
Future (f)
Present (g)
Future (h)
Freshwater shortage
1.3
2.3
2.7
2.8
2.6
3.0
1.8
2.2
2.3
Pollution
1.5
2.0
2.0
2.3
1.8
2.3
2.0
2.3
2.0
Habitat and community
2.0
3.0
2.4
3.0
2.4
2.8
2.3
2.7
2.6
modification
Unsustainable exploitation of fish
1.8
2.2
2.0
2.1
2.0
2.1
2.4
2.5
2.1
and other living resources
Global change
0.8
1.0
1.5
1.7
1.5
1.5
1.0
1.0
1.2
the relative contributions of both present and future impacts and
should be regarded as a framework to guide the analysis, rather than
environmental and socio-economic factors. The outcome of these
as a set of detailed instructions. Secondly, in an ideal setting, a causal
additional analyses was subjected to further discussion to identify
chain would be produced by a multidisciplinary group of specialists
overall priorities for the region.
that would statistically examine each successive cause and study its
links to the problem and to other causes. However, this approach (even
Finally, the assessment recognises that each of the fi ve GIWA concerns
if feasible) would use far more resources and time than those available
are not discrete but often interact. For example, pollution can destroy
to GIWA1. For this reason, it has been necessary to develop a relatively
aquatic habitats that are essential for fi sh reproduction which, in turn,
simple and practical analytical model for gathering information to
can cause declines in fi sh stocks and subsequent overexploitation. Once
assemble meaningful causal chains.
teams have ranked each of the concerns and determined the priorities
for the region, the links between the concerns are highlighted in order
Conceptual model
to identify places where strategic interventions could be applied to
A causal chain is a series of statements that link the causes of a problem
yield the greatest benefi ts for the environment and human societies
with its eff ects. Recognising the great diversity of local settings and the
in the region.
resulting diffi
culty in developing broadly applicable policy strategies,
the GIWA CCA focuses on a particular system and then only on those
Causal chain analysis
issues that were prioritised during the scoping assessment. The
Causal Chain Analysis (CCA) traces the cause-eff ect pathways from the
starting point of a particular causal chain is one of the issues selected
socio-economic and environmental impacts back to their root causes.
during the Scaling and Scoping stages and its related environmental
The GIWA CCA aims to identify the most important causes of each
and socio-economic impacts. The next element in the GIWA chain is
concern prioritised during the scoping assessment in order to direct
the immediate cause; defi ned as the physical, biological or chemical
policy measures at the most appropriate target in order to prevent
variable that produces the GIWA issue. For example, for the issue of
further degradation of the regional aquatic environment.
eutrophication the immediate causes may be, inter alia:
Enhanced nutrient inputs;
Root causes are not always easy to identify because they are often
Increased
recycling/mobilisation;
spatially or temporally separated from the actual problems they
Trapping of nutrients (e.g. in river impoundments);
cause. The GIWA CCA was developed to help identify and understand
Run-off and stormwaters
the root causes of environmental and socio-economic problems
in international waters and is conducted by identifying the human
Once the relevant immediate cause(s) for the particular system has
activities that cause the problem and then the factors that determine
(have) been identifi ed, the sectors of human activity that contribute
the ways in which these activities are undertaken. However, because
most signifi cantly to the immediate cause have to be determined.
there is no universal theory describing how root causes interact to
Assuming that the most important immediate cause in our example
create natural resource management problems and due to the great
had been increased nutrient concentrations, then it is logical that the
variation of local circumstances under which the methodology will
most likely sources of those nutrients would be the agricultural, urban
be applied, the GIWA CCA is not a rigidly structured assessment but
or industrial sectors. After identifying the sectors that are primarily
1 This does not mean that the methodology ignores statistical or quantitative studies; as has already been pointed out, the available evidence that justifies the assumption of causal links should
be provided in the assessment.
x
REGIONAL ASSESSMENTS
responsible for the immediate causes, the root causes acting on those
The policy options recommended by the GIWA are only contributions
sectors must be determined. For example, if agriculture was found to
to the larger policy process and, as such, the GIWA methodology
be primarily responsible for the increased nutrient concentrations, the
developed to test the performance of various options under the
root causes could potentially be:
diff erent circumstances has been kept simple and broadly applicable.
Economic (e.g. subsidies to fertilisers and agricultural products);
Legal (e.g. inadequate regulation);
Global International Waters Assessment
Failures in governance (e.g. poor enforcement); or
Technology or knowledge related (e.g. lack of aff ordable substitutes
for fertilisers or lack of knowledge as to their application).
Once the most relevant root causes have been identifi ed, an
explanation, which includes available data and information, of how
they are responsible for the primary environmental and socio-economic
problems in the region should be provided.
Policy option analysis
Despite considerable eff ort of many Governments and other
organisations to address transboundary water problems, the evidence
indicates that there is still much to be done in this endeavour. An
important characteristic of GIWA's Policy Option Analysis (POA) is that
its recommendations are fi rmly based on a better understanding of
the root causes of the problems. Freshwater scarcity, water pollution,
overexploitation of living resources and habitat destruction are very
complex phenomena. Policy options that are grounded on a better
understanding of these phenomena will contribute to create more
eff ective societal responses to the extremely complex water related
transboundary problems. The core of POA in the assessment consists
of two tasks:
Construct policy options
Policy options are simply diff erent courses of action, which are not
always mutually exclusive, to solve or mitigate environmental and
socio-economic problems in the region. Although a multitude of
diff erent policy options could be constructed to address each root
cause identifi ed in the CCA, only those few policy options that have
the greatest likelihood of success were analysed in the GIWA.
Select and apply the criteria on which the policy options will be
evaluated
Although there are many criteria that could be used to evaluate any
policy option, GIWA focuses on:
Eff ectiveness (certainty of result)
Effi
ciency (maximisation of net benefi ts)
Equity (fairness of distributional impacts)
Practical criteria (political acceptability, implementation feasibility).
THE GIWA METHODOLOGY
xi
Table 5a: Scoring criteria for environmental impacts of Freshwater shortage
Issue
Score 0 = no known impact
Score 1 = slight impact
Score 2 = moderate impact
Score 3 = severe impact
Issue 1: Modification
No evidence of modification of stream
There is a measurably changing trend in
Significant downward or upward trend
Annual discharge of a river altered by more
of stream flow
flow.
annual river discharge at gauging stations
(more than 20% of the long term mean) in
than 50% of long term mean; or
"An increase or decrease
in a major river or tributary (basin >
annual discharges in a major river or tributary Loss of >50% of riparian or deltaic
in the discharge of
40 000 km2); or
draining a basin of >250 000 km2; or
wetlands over a period of not less than
streams and rivers
There is a measurable decrease in the area
Loss of >20% of flood plain or deltaic
40 years (through causes other than
as a result of human
of wetlands (other than as a consequence
wetlands through causes other than
conversion or artificial embankment); or
interventions on a local/
of conversion or embankment
conversion or artificial embankments; or
Significant increased siltation or erosion
regional scale (see Issue
construction); or
Significant loss of riparian vegetation (e.g.
due to changing in flow regime (other than
19 for flow alterations
There is a measurable change in the
trees, flood plain vegetation); or
normal fluctuations in flood plain rivers);
resulting from global
interannual mean salinity of estuaries or
Significant saline intrusion into previously
or
change) over the last 3-4
coastal lagoons and/or change in the mean
freshwater rivers or lagoons.
Loss of one or more anadromous or
decades."
position of estuarine salt wedge or mixing
catadromous fish species for reasons
zone; or
other than physical barriers to migration,
Change in the occurrence of exceptional
pollution or overfishing.
discharges (e.g. due to upstream
damming.
Issue 2: Pollution of
No evidence of pollution of surface and
Any monitored water in the region does
Water supplies does not meet WHO or
River draining more than 10% of the basin
existing supplies
ground waters.
not meet WHO or national drinking water
national drinking water standards in more
have suffered polysaprobic conditions, no
"Pollution of surface
criteria, other than for natural reasons; or
than 30% of the region; or
longer support fish, or have suffered severe
and ground fresh waters
There have been reports of one or more
There are one or more reports of fish kills
oxygen depletion
supplies as a result of
fish kills in the system due to pollution
due to pollution in any river draining a
Severe pollution of other sources of
point or diffuse sources"
within the past five years.
basin of >250 000 km2 .
freshwater (e.g. groundwater)
Issue 3: Changes in
No evidence that abstraction of water from Several wells have been deepened because Clear evidence of declining base flow in
Aquifers are suffering salinisation over
the water table
aquifers exceeds natural replenishment.
of excessive aquifer draw-down; or
rivers in semi-arid areas; or
regional scale; or
"Changes in aquifers
Several springs have dried up; or
Loss of plant species in the past decade,
Perennial springs have dried up over
as a direct or indirect
Several wells show some salinisation.
that depend on the presence of ground
regionally significant areas; or
consequence of human
water; or
Some aquifers have become exhausted
activity"
Wells have been deepened over areas of
hundreds of km2;or
Salinisation over significant areas of the
region.
Table 5b: Scoring criteria for environmental impacts of Pollution
Issue
Score 0 = no known impact
Score 1 = slight impact
Score 2 = moderate impact
Score 3 = severe impact
Issue 4:
Normal incidence of bacterial related
There is minor increase in incidence of
Public health authorities aware of marked
There are large closure areas or very
Microbiological
gastroenteric disorders in fisheries product
bacterial related gastroenteric disorders
increase in the incidence of bacterial
restrictive advisories affecting the
pollution
consumers and no fisheries closures or
in fisheries product consumers but no
related gastroenteric disorders in fisheries
marketability of fisheries products; or
"The adverse effects of
advisories.
fisheries closures or advisories.
product consumers; or
There exists widespread public or tourist
microbial constituents of
There are limited area closures or
awareness of hazards resulting in
human sewage released
advisories reducing the exploitation or
major reductions in the exploitation or
to water bodies."
marketability of fisheries products.
marketability of fisheries products.
Issue 5:
No visible effects on the abundance and
Increased abundance of epiphytic algae; or
Increased filamentous algal production
High frequency (>1 event per year), or
Eutrophication
distributions of natural living resource
A statistically significant trend in
resulting in algal mats; or
intensity, or large areas of periodic hypoxic
"Artificially enhanced
distributions in the area; and
decreased water transparency associated
Medium frequency (up to once per year)
conditions, or high frequencies of fish and
primary productivity in
No increased frequency of hypoxia1 or
with algal production as compared with
of large-scale hypoxia and/or fish and
zoobenthos mortality events or harmful
receiving water basins
fish mortality events or harmful algal
long-term (>20 year) data sets; or
zoobenthos mortality events and/or
algal blooms; or
related to the increased
blooms associated with enhanced primary
Measurable shallowing of the depth range
harmful algal blooms.
Significant changes in the littoral
availability or supply
production; and
of macrophytes.
community; or
of nutrients, including
No evidence of periodically reduced
Presence of hydrogen sulphide in
cultural eutrophication
dissolved oxygen or fish and zoobenthos
historically well oxygenated areas.
in lakes."
mortality; and
No evident abnormality in the frequency of
algal blooms.
xii
REGIONAL ASSESSMENTS
Issue 6: Chemical
No known or historical levels of chemical
Some chemical contaminants are
Some chemical contaminants are above
Chemical contaminants are above
pollution
contaminants except background levels of
detectable but below threshold limits
threshold limits defined for the country or
threshold limits defined for the country or
"The adverse effects of
naturally occurring substances; and
defined for the country or region; or
region; or
region; and
chemical contaminants
No fisheries closures or advisories due to
Restricted area advisories regarding
Large area advisories by public health
Public health and public awareness of
released to standing or
chemical pollution; and
chemical contamination of fisheries
authorities concerning fisheries product
fisheries contamination problems with
marine water bodies
No incidence of fisheries product tainting;
products.
contamination but without associated
associated reductions in the marketability
as a result of human
and
catch restrictions or closures; or
of such products either through the
activities. Chemical
No unusual fish mortality events.
If there is no available data use the following
High mortalities of aquatic species near
imposition of limited advisories or by area
contaminants are
criteria:
outfalls.
closures of fisheries; or
here defined as
If there is no available data use the following
Some use of pesticides in small areas; or
Large-scale mortalities of aquatic species.
compounds that are
criteria:
Presence of small sources of dioxins or
If there is no available data use the following
toxic or persistent or
No use of pesticides; and
furans (e.g., small incineration plants or
criteria:
If there is no available data use the following
bioaccumulating."
No sources of dioxins and furans; and
bleached kraft/pulp mills using chlorine);
Large-scale use of pesticides in agriculture
criteria:
No regional use of PCBs; and
or
and forestry; or
Indications of health effects resulting
No bleached kraft pulp mills using chlorine Some previous and existing use of PCBs
Presence of major sources of dioxins or
from use of pesticides; or
bleaching; and
and limited amounts of PCB-containing
furans such as large municipal or industrial Known emissions of dioxins or furans from
No use or sources of other contaminants.
wastes but not in amounts invoking local
incinerators or large bleached kraft pulp
incinerators or chlorine bleaching of pulp;
concerns; or
mills; or
or
Presence of other contaminants.
Considerable quantities of waste PCBs in
Known contamination of the environment
the area with inadequate regulation or has
or foodstuffs by PCBs; or
invoked some public concerns; or
Known contamination of the environment
Presence of considerable quantities of
or foodstuffs by other contaminants.
other contaminants.
Issue 7: Suspended
No visible reduction in water transparency; Evidently increased or reduced turbidity
Markedly increased or reduced turbidity
Major changes in turbidity over wide or
solids
and
in streams and/or receiving riverine and
in small areas of streams and/or receiving
ecologically significant areas resulting
"The adverse effects of
No evidence of turbidity plumes or
marine environments but without major
riverine and marine environments; or
in markedly changed biodiversity or
modified rates of release
increased siltation; and
changes in associated sedimentation or
Extensive evidence of changes in
mortality in benthic species due to
of suspended particulate No evidence of progressive riverbank,
erosion rates, mortality or diversity of flora
sedimentation or erosion rates; or
excessive sedimentation with or without
matter to water bodies
beach, other coastal or deltaic erosion.
and fauna; or
Changes in benthic or pelagic biodiversity
concomitant changes in the nature of
resulting from human
Some evidence of changes in benthic or
in areas due to sediment blanketing or
deposited sediments (i.e., grain-size
activities"
pelagic biodiversity in some areas due
increased turbidity.
composition/redox); or
to sediment blanketing or increased
Major change in pelagic biodiversity or
turbidity.
mortality due to excessive turbidity.
Issue 8: Solid wastes
No noticeable interference with trawling
Some evidence of marine-derived litter on
Widespread litter on beaches giving rise to Incidence of litter on beaches sufficient
"Adverse effects
activities; and
beaches; or
public concerns regarding the recreational
to deter the public from recreational
associated with the
No noticeable interference with the
Occasional recovery of solid wastes
use of beaches; or
activities; or
introduction of solid
recreational use of beaches due to litter;
through trawling activities; but
High frequencies of benthic litter recovery
Trawling activities untenable because of
waste materials into
and
Without noticeable interference with
and interference with trawling activities;
benthic litter and gear entanglement; or
water bodies or their
No reported entanglement of aquatic
trawling and recreational activities in
or
Widespread entanglement and/or
environs."
organisms with debris.
coastal areas.
Frequent reports of entanglement/
suffocation of aquatic species by litter.
suffocation of species by litter.
Issue 9: Thermal
No thermal discharges or evidence of
Presence of thermal discharges but
Presence of thermal discharges with large
Presence of thermal discharges with large
"The adverse effects
thermal effluent effects.
without noticeable effects beyond
mixing zones having reduced productivity
mixing zones with associated mortalities,
of the release of
the mixing zone and no significant
or altered biodiversity; or
substantially reduced productivity or
aqueous effluents at
interference with migration of species.
Evidence of reduced migration of species
noticeable changes in biodiversity; or
temperatures exceeding
due to thermal plume.
Marked reduction in the migration of
ambient temperature
species due to thermal plumes.
in the receiving water
body."
Issue 10: Radionuclide No radionuclide discharges or nuclear
Minor releases or fallout of radionuclides
Minor releases or fallout of radionuclides
Substantial releases or fallout of
"The adverse effects of
activities in the region.
but with well regulated or well-managed
under poorly regulated conditions that do
radionuclides resulting in excessive
the release of radioactive
conditions complying with the Basic Safety
not provide an adequate basis for public
exposures to humans or animals in relation
contaminants and
Standards.
health assurance or the protection of
to those recommended under the Basic
wastes into the aquatic
aquatic organisms but without situations
Safety Standards; or
environment from
or levels likely to warrant large scale
Some indication of situations or exposures
human activities."
intervention by a national or international
warranting intervention by a national or
authority.
international authority.
Issue 11: Spills
No evidence of present or previous spills of
Some evidence of minor spills of hazardous Evidence of widespread contamination
Widespread contamination by hazardous
"The adverse effects
hazardous material; or
materials in small areas with insignificant
by hazardous or aesthetically displeasing
or aesthetically displeasing materials
of accidental episodic
No evidence of increased aquatic or avian
small-scale adverse effects one aquatic or
materials assumed to be from spillage
from frequent spills resulting in major
releases of contaminants
species mortality due to spills.
avian species.
(e.g. oil slicks) but with limited evidence of
interference with aquatic resource
and materials to the
widespread adverse effects on resources or
exploitation or coastal recreational
aquatic environment
amenities; or
amenities; or
as a result of human
Some evidence of aquatic or avian species
Significant mortality of aquatic or avian
activities."
mortality through increased presence of
species as evidenced by large numbers of
contaminated or poisoned carcasses on
contaminated carcasses on beaches.
beaches.
THE GIWA METHODOLOGY
xiii
Table 5c: Scoring criteria for environmental impacts of Habitat and community modification
Issue
Score 0 = no known impact
Score 1 = slight impact
Score 2 = moderate impact
Score 3 = severe impact
Issue 12: Loss of ecosystems or
There is no evidence of loss of
There are indications of fragmentation Permanent destruction of at least one
Permanent destruction of at least one
ecotones
ecosystems or habitats.
of at least one of the habitats.
habitat is occurring such as to have
habitat is occurring such as to have
"The complete destruction of aquatic
reduced their surface area by up to 30
reduced their surface area by >30%
habitats. For the purpose of GIWA
% during the last 2-3 decades.
during the last 2-3 decades.
methodology, recent loss will be
measured as a loss of pre-defined
habitats over the last 2-3 decades."
Issue 13: Modification of
No evidence of change in species
Evidence of change in species
Evidence of change in species
Evidence of change in species
ecosystems or ecotones, including
complement due to species extinction
complement due to species extinction
complement due to species extinction
complement due to species extinction
community structure and/or species
or introduction; and
or introduction
or introduction; and
or introduction; and
composition
No changing in ecosystem function
Evidence of change in population
Evidence of change in population
"Modification of pre-defined habitats
and services.
structure or change in functional group
structure or change in functional group
in terms of extinction of native species,
composition or structure
composition or structure; and
occurrence of introduced species and
Evidence of change in ecosystem
changing in ecosystem function and
services2.
services over the last 2-3 decades."
2 Constanza, R. et al. (1997). The value of the world ecosystem services and natural capital, Nature 387:253-260.
Table 5d: Scoring criteria for environmental impacts of Unsustainable exploitation of fish and other
living resources
Issue
Score 0 = no known impact
Score 1 = slight impact
Score 2 = moderate impact
Score 3 = severe impact
Issue 14: Overexploitation
No harvesting exists catching fish
Commercial harvesting exists but there One stock is exploited beyond MSY
More than one stock is exploited
"The capture of fish, shellfish or marine
(with commercial gear for sale or
is no evidence of over-exploitation.
(maximum sustainable yield) or is
beyond MSY or is outside safe
invertebrates at a level that exceeds the
subsistence).
outside safe biological limits.
biological limits.
maximum sustainable yield of the stock."
Issue 15: Excessive by-catch and
Current harvesting practices show no
Up to 30% of the fisheries yield (by
30-60% of the fisheries yield consists
Over 60% of the fisheries yield is
discards
evidence of excessive by-catch and/or
weight) consists of by-catch and/or
of by-catch and/or discards.
by-catch and/or discards; or
"By-catch refers to the incidental capture
discards.
discards.
Noticeable incidence of capture of
of fish or other animals that are not the
endangered species.
target of the fisheries. Discards refers
to dead fish or other animals that are
returned to the sea."
Issue 16: Destructive fishing
No evidence of habitat destruction due Habitat destruction resulting in
Habitat destruction resulting in
Habitat destruction resulting in
practices
to fisheries practices.
changes in distribution of fish or
moderate reduction of stocks or
complete collapse of a stock or far
"Fishing practices that are deemed to
shellfish stocks; or
moderate changes of the environment;
reaching changes in the environment;
produce significant harm to marine,
Trawling of any one area of the seabed
or
or
lacustrine or coastal habitats and
is occurring less than once per year.
Trawling of any one area of the seabed
Trawling of any one area of the seabed
communities."
is occurring 1-10 times per year; or
is occurring more than 10 times per
Incidental use of explosives or poisons
year; or
for fishing.
Widespread use of explosives or
poisons for fishing.
Issue 17: Decreased viability of
No evidence of increased incidence of
Increased reports of diseases without
Declining populations of one or more
Collapse of stocks as a result of
stocks through contamination and
fish or shellfish diseases.
major impacts on the stock.
species as a result of diseases or
diseases or contamination.
disease
contamination.
"Contamination or diseases of feral (wild)
stocks of fish or invertebrates that are a
direct or indirect consequence of human
action."
Issue 18: Impact on biological and
No evidence of deliberate or accidental Alien species introduced intentionally
Measurable decline in the population
Extinction of native species or local
genetic diversity
introductions of alien species; and
or accidentally without major changes
of native species or local stocks as a
stocks as a result of introductions
"Changes in genetic and species diversity No evidence of deliberate or accidental
in the community structure; or
result of introductions (intentional or
(intentional or accidental); or
of aquatic environments resulting from
introductions of alien stocks; and
Alien stocks introduced intentionally
accidental); or
Major changes (>20%) in the genetic
the introduction of alien or genetically
No evidence of deliberate or accidental
or accidentally without major changes
Some changes in the genetic
composition of stocks (e.g. as a result
modified species as an intentional or
introductions of genetically modified
in the community structure; or
composition of stocks (e.g. as a result
of escapes from aquaculture replacing
unintentional result of human activities
species.
Genetically modified species
of escapes from aquaculture replacing
the wild stock).
including aquaculture and restocking."
introduced intentionally or
the wild stock).
accidentally without major changes in
the community structure.
xiv
REGIONAL ASSESSMENTS
Table 5e: Scoring criteria for environmental impacts of Global change
Issue
Score 0 = no known impact
Score 1 = slight impact
Score 2 = moderate impact
Score 3 = severe impact
Issue 19: Changes in hydrological
No evidence of changes in hydrological Change in hydrological cycles due
Significant trend in changing
Loss of an entire habitat through
cycle and ocean circulation
cycle and ocean/coastal current due to
to global change causing changes
terrestrial or sea ice cover (by
desiccation or submergence as a result
"Changes in the local/regional water
global change.
in the distribution and density of
comparison with a long-term time
of global change; or
balance and changes in ocean and coastal
riparian terrestrial or aquatic plants
series) without major downstream
Change in the tree or lichen lines; or
circulation or current regime over the
without influencing overall levels of
effects on river/ocean circulation or
Major impacts on habitats or
last 2-3 decades arising from the wider
productivity; or
biological diversity; or
biodiversity as the result of increasing
problem of global change including
Some evidence of changes in ocean
Extreme events such as flood and
frequency of extreme events; or
ENSO."
or coastal currents due to global
drought are increasing; or
Changing in ocean or coastal currents
change but without a strong effect on
Aquatic productivity has been altered
or upwelling regimes such that plant
ecosystem diversity or productivity.
as a result of global phenomena such
or animal populations are unable to
as ENSO events.
recover to their historical or stable
levels; or
Significant changes in thermohaline
circulation.
Issue 20: Sea level change
No evidence of sea level change.
Some evidences of sea level change
Changed pattern of coastal erosion due Major loss of coastal land areas due to
"Changes in the last 2-3 decades in the
without major loss of populations of
to sea level rise has became evident; or
sea-level change or sea-level induced
annual/seasonal mean sea level as a
organisms.
Increase in coastal flooding events
erosion; or
result of global change."
partly attributed to sea-level rise
Major loss of coastal or intertidal
or changing prevailing atmospheric
populations due to sea-level change or
forcing such as atmospheric pressure
sea level induced erosion.
or wind field (other than storm
surges).
Issue 21: Increased UV-B radiation as No evidence of increasing effects
Some measurable effects of UV/B
Aquatic community structure is
Measured/assessed effects of UV/B
a result of ozone depletion
of UV/B radiation on marine or
radiation on behavior or appearance of
measurably altered as a consequence
irradiation are leading to massive loss
"Increased UV-B flux as a result polar
freshwater organisms.
some aquatic species without affecting
of UV/B radiation; or
of aquatic communities or a significant
ozone depletion over the last 2-3
the viability of the population.
One or more aquatic populations are
change in biological diversity.
decades."
declining.
Issue 22: Changes in ocean CO
No measurable or assessed changes
Some reasonable suspicions that
Some evidences that the impacts
Evidences that the changes in
2
source/sink function
in CO source/sink function of aquatic
current global change is impacting the
of global change have altered the
source/sink function of the aquatic
2
"Changes in the capacity of aquatic
system.
aquatic system sufficiently to alter its
source/sink function for CO of aquatic
systems in the region are sufficient to
2
systems, ocean as well as freshwater, to
source/sink function for CO .
systems in the region by at least 10%.
cause measurable change in global CO
2
2
generate or absorb atmospheric CO as a
balance.
2
direct or indirect consequence of global
change over the last 2-3 decades."
THE GIWA METHODOLOGY
xv