
Global International
Waters Assessment
Regional assessments
Other reports in this series:
Russian Arctic ş GIWA Regional assessment 1a
Caribbean Sea/Small Islands ş GIWA Regional assessment 3a
Caribbean Islands ş GIWA Regional assessment 4
Barents Sea ş GIWA Regional assessment 11
Baltic Sea ş GIWA Regional assessment 17
Caspian Sea ş GIWA Regional assessment 23
Gulf of California/Colorado River Basin ş GIWA Regional assessment 27
Yellow Sea ş GIWA Regional assessment 34
East China Sea ş GIWA Regional assessment 36
Patagonian Shelf ş GIWA Regional assessment 38
Brazil Current ş GIWA Regional assessment 39
Amazon Basin ş GIWA Regional assessment 40b
Guinea Current ş GIWA Regional assessment 42
Lake Chad Basin ş GIWA Regional assessment 43
Benguela Current ş GIWA Regional assessment 44
Indian Ocean Islands ş GIWA Regional assessment 45b
East African Rift Valley Lakes ş GIWA Regional assessment 47
South China Sea ş GIWA Regional assessment 54
Sulu-Celebes (Sulawesi) Sea ş GIWA Regional assessment 56
Indonesian Seas ş GIWA Regional assessment 57
Pacifi c Islands ş GIWA Regional assessment 62
Global International
Waters Assessment
Regional assessment 41
Canary Current
GIWA report production
Series editor: Ulla Li Zweifel
Editorial assistance: Johanna Egerup,
Monique Stolte, Nancy Bazilchuk
Maps & GIS: Niklas Holmgren
Design & graphics: Joakim Palmqvist
Global International Waters Assessment
Canary Current, GIWA Regional assessment 41
Published by the University of Kalmar on behalf of
United Nations Environment Programme
ę 2005 United Nations Environment Programme
ISSN 1651-940X
University of Kalmar
SE-391 82 Kalmar
Sweden
United Nations Environment Programme
PO Box 30552,
Nairobi, Kenya
This publication may be reproduced in whole or in part and
in any form for educational or non-profi t purposes without
special permission from the copyright holder, provided
acknowledgement of the source is made. No use of this
publication may be made for resale or for any other commercial
purpose whatsoever without prior permission in writing from the
United Nations Environment Programme.
CITATIONS
When citing this report, please use:
UNEP, 2005. Tayaa, M., Saine, A., Ndiaye, G. and M. Deme. Canary
Current, GIWA Regional assessment 41. University of Kalmar,
Kalmar, Sweden.
DISCLAIMER
The views expressed in this publication are those of the authors
and do not necessarily refl ect those of UNEP. The designations
employed and the presentations do not imply the expressions
of any opinion whatsoever on the part of UNEP or cooperating
agencies concerning the legal status of any country, territory,
city or areas or its authority, or concerning the delimitation of its
frontiers or boundaries.
This publication has been peer-reviewed and the information
herein is believed to be reliable, but the publisher does not
warrant its completeness or accuracy.
Contents
Executive summary
9
Acknowledgements 11
Abbreviations and acronyms
13
Regional defi nition
15
Boundaries of the region
15
Physical characteristics
16
Socio-economic characteristics
21
Assessment 24
Freshwater shortage
25
Pollution
29
Habitat and community modifi cation
32
Unsustainable exploitation of fi sh and other living resources
34
Global change
38
Priority concerns for further analysis
39
Causal chain analysis
40
Stream fl ow modifi cation ş Senegal River Basin
40
System description
41
Causal chain analysis
42
Lowering of the water table ş Souss-Massa River Basin
48
System description
48
Causal chain analysis
49
Overexploitation of fi sh ş Canary Current
55
System description
55
Causal chain analysis
57
Policy options
64
Stream fl ow modifi cation ş Senegal River Basin
64
Defi nition of the problem
64
Policy options
65
Identifi ed policy options
66
Conclusions and recommendations
66
CONTENTS
Lowering of the water table ş Souss-Massa River Basin
67
Defi nition of the problem
67
Policy options
67
Identifi ed policy options
68
Conclusions and recommendations
69
Overexploitation of fi sh ş Canary Current
70
Defi nition of the problem
70
Policy options
70
Conclusions and recommendations
72
References 73
Annexes 77
Annex I List of contributing authors and organisations
77
Annex II Detailed scoring tables
78
The Global International Waters Assessment
i
The GIWA methodology
vii
Executive summary
The GIWA region Canary Current encompasses Cape Verde, the Canary
The regime fl ow of Senegal River in particular has been signifi cantly
Islands, Mauritania, Senegal, The Gambia, Mali, Guinea, Guinea-Bissau
modifi ed by the construction of the Manantali and Diama dams, which
and the western part of Morocco that drains into the Atlantic Ocean.
has altered the River's hydrological regime and has consequently
In order to conduct a suitable assessment, the region was divided
caused transboundary problems.
into two sub-systems in recognition of signifi cant ecological, climatic
and cultural diff erences. The northern sub-system covers part of
The environmental impacts of stream fl ow modifi cation and changes in
northern Mauritania and the western part of Morocco. The southern
the water table have led to serious socio-economic impacts that often
sub-system includes the southern part of Mauritania, Senegal, The
have signifi cant transboundary implications. These socio-economic
Gambia, Mali, Guinea, Guinea-Bissau, Cape Verde and the Canary
impacts include the loss of agricultural income and potential, increased
Islands. The boundary between the two sub-systems is at Cape-Timiris
costs associated with the construction of dams and inter-basin transfer
at approximately 19░ N.
schemes to supply water, the costs of alternative sources of water,
the cost of deepening wells and pumping, increases in water-borne
The population in the region totals approximately 45.2 million people, out
diseases and confl icts about water supplies.
of which an estimated 70% are directly dependant on international waters
for their livelihoods. The growth rate fl uctuates between 0.8% and 3.03%
Unsustainable exploitation and particularly the overexploitation of fi sh
with an average of 2.3% for the region. This population is engaged mostly
stocks is another major issue in the region. Most if not all the coastal
in marine fi sheries, agricultural production and tourism activities.
countries have already taken steps in terms of regulating fi sheries at
the national an international level, as demonstrated by discussions with
Mean annual rainfall ranges from 10 mm to more than 2 000 mm. The
the European Community over the renewal of fi shing agreements with
total annual renewable water resource in the region is on the average
the diff erent countries in the region. All these countries are aware that
about 342 km3 per year and average freshwater is approximately 15 km3
a moratorium on certain fi sh stocks is needed and that there is a need
per year. It is estimated that more than 80% of all water withdrawals are
for conserving and improving fi sheries management overall. In addition,
for agricultural use.
specifi c policy measures intended to control industrial fi shing pressures
have been instituted.
Based upon the assessment, the main tranboundary GIWA concerns in
the region are Freshwater shortage and Unsustainable exploitation of
Causal chain and policy options analyses were conducted for three
fi sh and other living resources. In the northern sub-system, a declining
issues:
groundwater base fl ow is a major issue linked to the long dry periods
Stream fl ow modifi cation for the Senegal River Basin;
that the region as a whole has experienced for more than 30 years. For
Lowering of the water table in the Souss-Massa River Basin;
the last two to three decades, the average aquifer draw down in the
Overexploitation of fi sh in the Canary Current.
Souss River Basin has varied from 0.5 to 1.5 m per year. The southern
sub-system has been suff ering from water shortage problems for
The Senegal River Basin actually experiences two types of stream
the last three years and will most likely suff er in the next 20 years.
fl ow modifi cation: the reduction of discharges to the River due to
EXECUTIVE SUMMARY
9
the drought, leading to an intrusion of seawater; and a reduction of
Overexploitation of fi sh has been analysed for marine fi sheries. Two
stream fl ow due to damming. The fi rst type of modifi cation is natural,
immediate causes were identifi ed to explain the overexploitation;
while the second one is artifi cial and superimposed on the fi rst one
excessive fi shing eff orts and unsustainable fi shing practices. Both
and characteristic of the Senegal River Delta. Therefore, while the
the industrial and artisanal fi sheries are sectors responsible for the
focus was on the damming of the River, reduced precipitation has
overexploitation. One of the root causes for industrial overfi shing is
been considered as an immediate cause. Three major root causes
that all countries of the region, except The Gambia have ongoing
were identifi ed:
fi shing agreements with the European Union. The agreements target
Demographic growth, urbanisation and poverty;
on already highly treated species. Another root cause is the discard
Lack of appropriate governance;
of small juvenile fi sh by industrial freezer trawlers. Examples of root
Ineffi
cient irrigation technology.
causes from the artisanal sector are lack of enforcement of regulations
and fuel subsidy for artisanal canoes. Policy options identifi ed in the
Within the existing regional organisations such as the Organisation for
analysis are:
the Development of the Senegal River Basin (OMVS, Organisation pour
Artisanal fi shing licence system;
la Mise en Valeur du Fleuve SÚnÚgal) immediate policy options can be
Regulation of access to resources;
implemented for the Senegal River Basin. The consolidation of OMVS
Banning use of the beach seine;
assets is one option that can be pursued. Institutional instruments such
Joint negotiation of fi shing agreements.
as the Environment Observatory would be a way to ensure monitoring
and management of the River Basin. The Standing Committee of Water
The current rate of water usage in the region is unsustainable if no
constitutes a framework for dialogue regarding the technical aspects
drastic water policy changes are made. Overpumping of the Souss
of water resources management; the committee can formulate and
aquifer has resulted in signifi cant water level declines and deserves
present recommendations to the Ministers' Council. The role of these
special attention. Governance measures in the Senegal River Basin will
two bodies should be reinforced. Capacity building of the institutions
have to be accompanied by capacity building in order to facilitate the
in charge of water resources management must accompany all good
implementation of the applicable laws, agreements and regulations
governance measures, such as implementation of laws and regulations
at the local, national and regional level. The establishment of Marine
at the local, national and regional level. It is also essential to determine
Protected Areas form a key step in the preservation of the coastal
the implications of recommendations on stakeholders, and to make
area and is of crucial importance for the restoration of fi sh stocks and
certain stakeholders are informed.
biodiversity.
The main issues addressed in the causal chain and policy options
analysis of freshwater shortages in the Souss-Massa Basin concerned
lowering of the water table. Five major root causes of the lowering of
the water table in Souss River Basin were identifi ed:
Demographic growth and population changes;
Socio-cultural
constraints;
Governance and enforcement of water regulation;
Technological
changes;
Economic
causes.
The policy option concerning lowering of water table in the Souss-
Massa River Basin is proposed to be of a holistic approach. The general
framework of this scenario assumes a clear understanding of an
integrated system (technical, institutional, political and economical
settings) and full stakeholder participation through consultation and
education. A new water pricing policy in combination with institutional
changes are part of the proposed option.
10
GIWA REGIONA ASSESSMENT 41 CANARY CURRENT
Acknowledgements
The lead author and coordinator would like to thank the regional
Task team and experts who contributed to this report through
their participation and the material they have prepared for the two
workshops.
Special thanks are also due to:
Mr Amadou Saine and Moustapha Demer for the preparation of the
Causal chain and Policy option analysis for the overexploitation of
fi sh in the Canary Current;
Prof. Tayed Ameziane and Abdelaziz Sbai who helped in the
preparation of the Causal chain and Policy options analysis for
Lowering of the water table in the Souss-Massa River Basin;
Mr Gora Ndiaye who prepared the part concerning the Causal chain
and Policy options for Streamfl ow modifi cation in the Senegal River
Basin;
The peer reviewers of this report, including the GIWA Core team
and regional coordinators;
The GEF, University of Kalmar, the GIWA Core team, UNEP and
Sida for providing the funding and technical support required to
undertake this study.
Finally, in writing this report, reference has been made to a number of
publications as well as unpublished material. We are highly indebted
to all the authors.
ACKNOWLEDGEMENTS
11
12
GIWA REGIONA ASSESSMENT 41 CANARY CURRENT
Abbreviations and acronyms
ACP
African, Caribbean, Pacifi c countries
MCS
Monitoring, Control & Surveillance
AUEA Water
User
Associations
MPA Marine
Protected
Area
CCS
Senegalese Sugar Company
NORAD
Norwegian Agency for Development Cooperation
CSRP
Subregional Fisheries Commission
ORMVA
Regional Agricultural Development Authority
COSEC Senegalese
council
of
shippers
OMVS
Organisation for the Development of the Senegal River
CPE
Standing Water Committee
Basin
CRODT
Centre for Oceanographic Research of Dakar-Thiaroye
ONAS
Senegal National Sanitation Board
CSEC
Moroccan High Council for Water and Climate
ONEP
Drinking Water Agency
EEZ
Exclusive Economic Zone
ORVASM Souss-Massa
Irrigation
Agency
FAO
Food and Agriculture Organisation of the United Nations
RAMSA Agadir
Municipal
Authority
FCFA
Franc CFA, the basic monetary unit of UEMOA
RBA
Souss-Massa River Basin Agency
GAIPES
Association of Vessel Owners and Industrial Marine Fisheries
SAED
Management and Exploitation Society for Senegal Delta River
of
Senegal
SDE
Water Supply Company
GDP Gross
Domestic
Product
SEMOS
Gold Mining Company of Sadiola
GNI
Gross National Income
SOCAS
Senegalese Canned Food Company
GIWA
Global International Waters Assessment
SOGED Diama
Dam
Company
GRT
Gross Registered Tonnage
SOCU
Surveillance Operations Co-ordination Unit
IMROP National Mauritanian Institute for Oceanographic and
SPO
Socio-Professional Organisation
Fisheries
Research
SRFC Sub-Regional
Fisheries
Commission
ITF
Intertropical Front
UEMOA West African Economic and Monetary Union
ISRA
Agricultural Research Institute of Senegal
UPAMES Union of Fishermen and Export Traders of Senegal
List of figures
Figure 1
Boundaries of the Canary Current region. . . . . . . . . . . . . . . . . . . . . . . . . . . . . . . . . . . . . . . . . . . . . . . . . . . . . . . . . . . . . . . . . . . . . . . . . . . . . . . . . . . . . . . . . . . . . . . . . . . . . . . . . . . . . . . . . . . . . . . 15
Figure 2
Major river basins in the Canary Current region. . . . . . . . . . . . . . . . . . . . . . . . . . . . . . . . . . . . . . . . . . . . . . . . . . . . . . . . . . . . . . . . . . . . . . . . . . . . . . . . . . . . . . . . . . . . . . . . . . . . . . . . . . . . . . . . 16
Figure 3
Senegal River Basin. . . . . . . . . . . . . . . . . . . . . . . . . . . . . . . . . . . . . . . . . . . . . . . . . . . . . . . . . . . . . . . . . . . . . . . . . . . . . . . . . . . . . . . . . . . . . . . . . . . . . . . . . . . . . . . . . . . . . . . . . . . . . . . . . . . . . . . . . . . . 18
Figure 4
Gambia River Basin. . . . . . . . . . . . . . . . . . . . . . . . . . . . . . . . . . . . . . . . . . . . . . . . . . . . . . . . . . . . . . . . . . . . . . . . . . . . . . . . . . . . . . . . . . . . . . . . . . . . . . . . . . . . . . . . . . . . . . . . . . . . . . . . . . . . . . . . . . . . . 19
Figure 5
Souss-Massa River Basin. . . . . . . . . . . . . . . . . . . . . . . . . . . . . . . . . . . . . . . . . . . . . . . . . . . . . . . . . . . . . . . . . . . . . . . . . . . . . . . . . . . . . . . . . . . . . . . . . . . . . . . . . . . . . . . . . . . . . . . . . . . . . . . . . . . . . . . 20
Figure 6
Sebou River Basin. . . . . . . . . . . . . . . . . . . . . . . . . . . . . . . . . . . . . . . . . . . . . . . . . . . . . . . . . . . . . . . . . . . . . . . . . . . . . . . . . . . . . . . . . . . . . . . . . . . . . . . . . . . . . . . . . . . . . . . . . . . . . . . . . . . . . . . . . . . . . . 20
Figure 7
Population density in the Canary Current region. . . . . . . . . . . . . . . . . . . . . . . . . . . . . . . . . . . . . . . . . . . . . . . . . . . . . . . . . . . . . . . . . . . . . . . . . . . . . . . . . . . . . . . . . . . . . . . . . . . . . . . . . . . . . . . . 21
Figure 8
Senegal River discharge variation at Bakel, 1903-1994. . . . . . . . . . . . . . . . . . . . . . . . . . . . . . . . . . . . . . . . . . . . . . . . . . . . . . . . . . . . . . . . . . . . . . . . . . . . . . . . . . . . . . . . . . . . . . . . . . . . . . . . . 26
Figure 9
Fish catch in the Canary Current Large Marine Ecosystem. . . . . . . . . . . . . . . . . . . . . . . . . . . . . . . . . . . . . . . . . . . . . . . . . . . . . . . . . . . . . . . . . . . . . . . . . . . . . . . . . . . . . . . . . . . . . . . . . . . . . . 35
Figure 10
Catch of Pink shrimp (Parapenaeus longirostis) in the Canary Current region. . . . . . . . . . . . . . . . . . . . . . . . . . . . . . . . . . . . . . . . . . . . . . . . . . . . . . . . . . . . . . . . . . . . . . . . . . . . . . . . . . 36
Figure 11
Fishing effort for Pink shrimp (Parapenaeus longirostis) in the Canary Current region. . . . . . . . . . . . . . . . . . . . . . . . . . . . . . . . . . . . . . . . . . . . . . . . . . . . . . . . . . . . . . . . . . . . . . . . . . 36
Figure 12
Causal chain diagram illustrating the causal links for stream flow modification in the Senegal River Basin.. . . . . . . . . . . . . . . . . . . . . . . . . . . . . . . . . . . . . . . . . . . . . . . . . . . . 42
ABBREVIATIONS AND ACRONYMS
13
Figure 13
Annual rainfall at St Louis 1892-2000. . . . . . . . . . . . . . . . . . . . . . . . . . . . . . . . . . . . . . . . . . . . . . . . . . . . . . . . . . . . . . . . . . . . . . . . . . . . . . . . . . . . . . . . . . . . . . . . . . . . . . . . . . . . . . . . . . . . . . . . . . 44
Figure 14
Irrigated area in the Senegal River Basin 1975-1998. . . . . . . . . . . . . . . . . . . . . . . . . . . . . . . . . . . . . . . . . . . . . . . . . . . . . . . . . . . . . . . . . . . . . . . . . . . . . . . . . . . . . . . . . . . . . . . . . . . . . . . . . . . . 45
Figure 15
Export of fruits and vegetables in the Souss-Massa River Basin. . . . . . . . . . . . . . . . . . . . . . . . . . . . . . . . . . . . . . . . . . . . . . . . . . . . . . . . . . . . . . . . . . . . . . . . . . . . . . . . . . . . . . . . . . . . . . . . . 49
Figure 16
Groundwater balance in the Souss River Basin. . . . . . . . . . . . . . . . . . . . . . . . . . . . . . . . . . . . . . . . . . . . . . . . . . . . . . . . . . . . . . . . . . . . . . . . . . . . . . . . . . . . . . . . . . . . . . . . . . . . . . . . . . . . . . . . . 50
Figure 17
Causal chain diagram illustrating the causal links for lowering of the water table in the Souss-Massa River Basin. . . . . . . . . . . . . . . . . . . . . . . . . . . . . . . . . . . . . . . . . . . . . . 50
Figure 18
Inter-annual variation in the water table depth in the Souss aquifer.. . . . . . . . . . . . . . . . . . . . . . . . . . . . . . . . . . . . . . . . . . . . . . . . . . . . . . . . . . . . . . . . . . . . . . . . . . . . . . . . . . . . . . . . . . . 51
Figure 19
Cropped area for irrigated cash crops in the Souss-Massa River Basin. . . . . . . . . . . . . . . . . . . . . . . . . . . . . . . . . . . . . . . . . . . . . . . . . . . . . . . . . . . . . . . . . . . . . . . . . . . . . . . . . . . . . . . . . . 52
Figure 20
Present and projected domestic water needs in the Souss-Massa River Basin. . . . . . . . . . . . . . . . . . . . . . . . . . . . . . . . . . . . . . . . . . . . . . . . . . . . . . . . . . . . . . . . . . . . . . . . . . . . . . . . . . . 52
Figure 21
Population in Souss -Massa River Basin. . . . . . . . . . . . . . . . . . . . . . . . . . . . . . . . . . . . . . . . . . . . . . . . . . . . . . . . . . . . . . . . . . . . . . . . . . . . . . . . . . . . . . . . . . . . . . . . . . . . . . . . . . . . . . . . . . . . . . . . 52
Figure 22
Irrigation water use efficiency in the Souss Massa River Basin. . . . . . . . . . . . . . . . . . . . . . . . . . . . . . . . . . . . . . . . . . . . . . . . . . . . . . . . . . . . . . . . . . . . . . . . . . . . . . . . . . . . . . . . . . . . . . . . . . 54
Figure 23
Causal chain diagram illustrating the causal links for overexploitation in the Canary Current region.. . . . . . . . . . . . . . . . . . . . . . . . . . . . . . . . . . . . . . . . . . . . . . . . . . . . . . . . . . 57
Figure 24
Number of shrimp trawlers fishing in the Gambian waters 1993-2002. . . . . . . . . . . . . . . . . . . . . . . . . . . . . . . . . . . . . . . . . . . . . . . . . . . . . . . . . . . . . . . . . . . . . . . . . . . . . . . . . . . . . . . . . . 58
Figure 25
Annual shrimp production in The Gambia. . . . . . . . . . . . . . . . . . . . . . . . . . . . . . . . . . . . . . . . . . . . . . . . . . . . . . . . . . . . . . . . . . . . . . . . . . . . . . . . . . . . . . . . . . . . . . . . . . . . . . . . . . . . . . . . . . . . . 58
Figure 26
Local water management system in the Souss-Massa River Basin. . . . . . . . . . . . . . . . . . . . . . . . . . . . . . . . . . . . . . . . . . . . . . . . . . . . . . . . . . . . . . . . . . . . . . . . . . . . . . . . . . . . . . . . . . . . . . 68
Figure 27
Tuna fishing boat at sea off the coast of Mauritania.. . . . . . . . . . . . . . . . . . . . . . . . . . . . . . . . . . . . . . . . . . . . . . . . . . . . . . . . . . . . . . . . . . . . . . . . . . . . . . . . . . . . . . . . . . . . . . . . . . . . . . . . . . . 71
List of tables
Table 1
Physical characteristics of the countries in the Canary Current region. . . . . . . . . . . . . . . . . . . . . . . . . . . . . . . . . . . . . . . . . . . . . . . . . . . . . . . . . . . . . . . . . . . . . . . . . . . . . . . . . . . . . . . . . . 16
Table 2
Renewable water resources and freshwater withdrawal in the Canary Current region. . . . . . . . . . . . . . . . . . . . . . . . . . . . . . . . . . . . . . . . . . . . . . . . . . . . . . . . . . . . . . . . . . . . . . . . . . . 17
Table 3
Population in the Canary Current region. . . . . . . . . . . . . . . . . . . . . . . . . . . . . . . . . . . . . . . . . . . . . . . . . . . . . . . . . . . . . . . . . . . . . . . . . . . . . . . . . . . . . . . . . . . . . . . . . . . . . . . . . . . . . . . . . . . . . . . . 21
Table 4
Population charactersitics of the Canary Current region. . . . . . . . . . . . . . . . . . . . . . . . . . . . . . . . . . . . . . . . . . . . . . . . . . . . . . . . . . . . . . . . . . . . . . . . . . . . . . . . . . . . . . . . . . . . . . . . . . . . . . . 22
Table 5
Gross National Income and annual growth of GDP in the Canary Current region. . . . . . . . . . . . . . . . . . . . . . . . . . . . . . . . . . . . . . . . . . . . . . . . . . . . . . . . . . . . . . . . . . . . . . . . . . . . . . . 22
Table 6
Livestock distribution in the Canary Current region. . . . . . . . . . . . . . . . . . . . . . . . . . . . . . . . . . . . . . . . . . . . . . . . . . . . . . . . . . . . . . . . . . . . . . . . . . . . . . . . . . . . . . . . . . . . . . . . . . . . . . . . . . . . 23
Table 7
Conventions that affect water use in the region. . . . . . . . . . . . . . . . . . . . . . . . . . . . . . . . . . . . . . . . . . . . . . . . . . . . . . . . . . . . . . . . . . . . . . . . . . . . . . . . . . . . . . . . . . . . . . . . . . . . . . . . . . . . . . . . 23
Table 8
Scoring tables for the Canary Current region. . . . . . . . . . . . . . . . . . . . . . . . . . . . . . . . . . . . . . . . . . . . . . . . . . . . . . . . . . . . . . . . . . . . . . . . . . . . . . . . . . . . . . . . . . . . . . . . . . . . . . . . . . . . . . . . . . . 24
Table 9
Access to safe drinking water sources in urban and rural areas in the region. . . . . . . . . . . . . . . . . . . . . . . . . . . . . . . . . . . . . . . . . . . . . . . . . . . . . . . . . . . . . . . . . . . . . . . . . . . . . . . . . . . 27
Table 10
Water-borne diseases in Morocco 1990-1994. . . . . . . . . . . . . . . . . . . . . . . . . . . . . . . . . . . . . . . . . . . . . . . . . . . . . . . . . . . . . . . . . . . . . . . . . . . . . . . . . . . . . . . . . . . . . . . . . . . . . . . . . . . . . . . . . . 28
Table 11
Suspended solids in the Gambia and Senegal rivers. . . . . . . . . . . . . . . . . . . . . . . . . . . . . . . . . . . . . . . . . . . . . . . . . . . . . . . . . . . . . . . . . . . . . . . . . . . . . . . . . . . . . . . . . . . . . . . . . . . . . . . . . . . . 30
Table 12
Threatened species in the Canary Current region.. . . . . . . . . . . . . . . . . . . . . . . . . . . . . . . . . . . . . . . . . . . . . . . . . . . . . . . . . . . . . . . . . . . . . . . . . . . . . . . . . . . . . . . . . . . . . . . . . . . . . . . . . . . . . . 33
Table 13
National and international protected areas in the Canary Current region. . . . . . . . . . . . . . . . . . . . . . . . . . . . . . . . . . . . . . . . . . . . . . . . . . . . . . . . . . . . . . . . . . . . . . . . . . . . . . . . . . . . . . 34
Table 14
Maximum sustainable yield for fish stocks in Gambia, 1997. . . . . . . . . . . . . . . . . . . . . . . . . . . . . . . . . . . . . . . . . . . . . . . . . . . . . . . . . . . . . . . . . . . . . . . . . . . . . . . . . . . . . . . . . . . . . . . . . . . . 35
Table 15
Fish production in Gambia 1990-1999. . . . . . . . . . . . . . . . . . . . . . . . . . . . . . . . . . . . . . . . . . . . . . . . . . . . . . . . . . . . . . . . . . . . . . . . . . . . . . . . . . . . . . . . . . . . . . . . . . . . . . . . . . . . . . . . . . . . . . . . . 35
Table 16
Fishing potential and exploitation of the main stocks in Cape Verde. . . . . . . . . . . . . . . . . . . . . . . . . . . . . . . . . . . . . . . . . . . . . . . . . . . . . . . . . . . . . . . . . . . . . . . . . . . . . . . . . . . . . . . . . . . 35
Table 17
Fishing potential and exploitation status of fish stocks in waters off Senegal and Mauritania. . . . . . . . . . . . . . . . . . . . . . . . . . . . . . . . . . . . . . . . . . . . . . . . . . . . . . . . . . . . . . . . . . 35
Table 18
Unreported landings and discards in Morocco. . . . . . . . . . . . . . . . . . . . . . . . . . . . . . . . . . . . . . . . . . . . . . . . . . . . . . . . . . . . . . . . . . . . . . . . . . . . . . . . . . . . . . . . . . . . . . . . . . . . . . . . . . . . . . . . . 36
Table 19
Licensed vessels in Gambia 1993-1997. . . . . . . . . . . . . . . . . . . . . . . . . . . . . . . . . . . . . . . . . . . . . . . . . . . . . . . . . . . . . . . . . . . . . . . . . . . . . . . . . . . . . . . . . . . . . . . . . . . . . . . . . . . . . . . . . . . . . . . . . 37
Table 20
Countries in the Senegal River Basin. . . . . . . . . . . . . . . . . . . . . . . . . . . . . . . . . . . . . . . . . . . . . . . . . . . . . . . . . . . . . . . . . . . . . . . . . . . . . . . . . . . . . . . . . . . . . . . . . . . . . . . . . . . . . . . . . . . . . . . . . . . 40
Table 21
Rainfall in the Senegal River Basin. . . . . . . . . . . . . . . . . . . . . . . . . . . . . . . . . . . . . . . . . . . . . . . . . . . . . . . . . . . . . . . . . . . . . . . . . . . . . . . . . . . . . . . . . . . . . . . . . . . . . . . . . . . . . . . . . . . . . . . . . . . . . 41
Table 22
Hydrological characteristics of the main tributaries of the Senegal River. . . . . . . . . . . . . . . . . . . . . . . . . . . . . . . . . . . . . . . . . . . . . . . . . . . . . . . . . . . . . . . . . . . . . . . . . . . . . . . . . . . . . . . 41
Table 23
Recession flood farming area in the Senegal Basin in 1987 before the damming of the River. . . . . . . . . . . . . . . . . . . . . . . . . . . . . . . . . . . . . . . . . . . . . . . . . . . . . . . . . . . . . . . . . . . 45
Table 24
Drinking water needs in the Senegal River Basin. . . . . . . . . . . . . . . . . . . . . . . . . . . . . . . . . . . . . . . . . . . . . . . . . . . . . . . . . . . . . . . . . . . . . . . . . . . . . . . . . . . . . . . . . . . . . . . . . . . . . . . . . . . . . . . 46
Table 25
Industrial water needs in Senegal River Basin. . . . . . . . . . . . . . . . . . . . . . . . . . . . . . . . . . . . . . . . . . . . . . . . . . . . . . . . . . . . . . . . . . . . . . . . . . . . . . . . . . . . . . . . . . . . . . . . . . . . . . . . . . . . . . . . . . 46
Table 26
Irrigated crops in Souss-Massa River Basin. . . . . . . . . . . . . . . . . . . . . . . . . . . . . . . . . . . . . . . . . . . . . . . . . . . . . . . . . . . . . . . . . . . . . . . . . . . . . . . . . . . . . . . . . . . . . . . . . . . . . . . . . . . . . . . . . . . . . 48
Table 27
Dams in Souss River Basin. . . . . . . . . . . . . . . . . . . . . . . . . . . . . . . . . . . . . . . . . . . . . . . . . . . . . . . . . . . . . . . . . . . . . . . . . . . . . . . . . . . . . . . . . . . . . . . . . . . . . . . . . . . . . . . . . . . . . . . . . . . . . . . . . . . . . 49
Table 28
Water demand by sector in the Souss Massa Basin. . . . . . . . . . . . . . . . . . . . . . . . . . . . . . . . . . . . . . . . . . . . . . . . . . . . . . . . . . . . . . . . . . . . . . . . . . . . . . . . . . . . . . . . . . . . . . . . . . . . . . . . . . . . . 51
Table 29
Summary of the evaluation of pelagic stocks in Mauritania. . . . . . . . . . . . . . . . . . . . . . . . . . . . . . . . . . . . . . . . . . . . . . . . . . . . . . . . . . . . . . . . . . . . . . . . . . . . . . . . . . . . . . . . . . . . . . . . . . . . 56
Table 30
Number of licensed industrial vessels operating in The Gambia from 1993-2002. . . . . . . . . . . . . . . . . . . . . . . . . . . . . . . . . . . . . . . . . . . . . . . . . . . . . . . . . . . . . . . . . . . . . . . . . . . . . . . 58
Table 31
Number of vessels authorised to fish in Mauritania 1990-2000. . . . . . . . . . . . . . . . . . . . . . . . . . . . . . . . . . . . . . . . . . . . . . . . . . . . . . . . . . . . . . . . . . . . . . . . . . . . . . . . . . . . . . . . . . . . . . . . . 59
Table 32
Coastal artisanal canoes in The Gambia. . . . . . . . . . . . . . . . . . . . . . . . . . . . . . . . . . . . . . . . . . . . . . . . . . . . . . . . . . . . . . . . . . . . . . . . . . . . . . . . . . . . . . . . . . . . . . . . . . . . . . . . . . . . . . . . . . . . . . . 59
Table 33
Unlicensed/delinquent vessels in The Gambia.. . . . . . . . . . . . . . . . . . . . . . . . . . . . . . . . . . . . . . . . . . . . . . . . . . . . . . . . . . . . . . . . . . . . . . . . . . . . . . . . . . . . . . . . . . . . . . . . . . . . . . . . . . . . . . . . . 60
List of boxes
Box 1
Impacts of stream reduction in the Souss-Massa Basin. . . . . . . . . . . . . . . . . . . . . . . . . . . . . . . . . . . . . . . . . . . . . . . . . . . . . . . . . . . . . . . . . . . . . . . . . . . . . . . . . . . . . . . . . . . . . . . . . . . . . . . . . 25
Box 2
Transboundary problems resulting from the Diama and Manantali Dams on the Senegal River. . . . . . . . . . . . . . . . . . . . . . . . . . . . . . . . . . . . . . . . . . . . . . . . . . . . . . . . . . . . . . . . 26
Box 3
Health impacts due to stream flow modification: Damming of the Senegal River Basin. . . . . . . . . . . . . . . . . . . . . . . . . . . . . . . . . . . . . . . . . . . . . . . . . . . . . . . . . . . . . . . . . . . . . . . . 28
Box 4
Pollution in the city of Dakar. . . . . . . . . . . . . . . . . . . . . . . . . . . . . . . . . . . . . . . . . . . . . . . . . . . . . . . . . . . . . . . . . . . . . . . . . . . . . . . . . . . . . . . . . . . . . . . . . . . . . . . . . . . . . . . . . . . . . . . . . . . . . . . . . . . 30
Box 5
Damming of the Sebou River.. . . . . . . . . . . . . . . . . . . . . . . . . . . . . . . . . . . . . . . . . . . . . . . . . . . . . . . . . . . . . . . . . . . . . . . . . . . . . . . . . . . . . . . . . . . . . . . . . . . . . . . . . . . . . . . . . . . . . . . . . . . . . . . . . . . 31
14
GIWA REGIONA ASSESSMENT 41 CANARY CURRENT
Regional defi nition
This section describes the boundaries and the main physical and
The region has limited mineral resources and has reached low to
socio-economic characteristics of the region in order to defi ne the
medium levels of industrialisation. Hence, the drainage systems
area considered in the regional GIWA assessment and to provide
contribute signifi cantly to rural as well as urban development.
suffi
cient background information to establish the context within
Waterways are exploited for crop and livestock development, rural as
which the assessment was conducted.
SebouFes
Boundaries of the region
Rabat
Casablanca Meknes
Madeira (Portugal)
The GIWA Canary Current region covers the Canary Current Large
Marrakech
Marine Ecosystem, and the river basins fl owing in to it. The region
Morocco
sa
Agadir
Sous Mas
extends from 36░ N, 5░ W at Strait of Gibraltar to 11░ N, 16░ W in Guinea-
Bissau. The estimated coastline of the region is 3 900 km (Morocco
Santa Cruz de Tenerife
Draa
1 300 km, Western Sahara 1 110 km, Mauritania 754 km, Senegal 531 km,
Canarias (Spain)
Algeria
Hamra
Guinea-Bissau 125 km, and The Gambia 80 km). The region also includes
Canary Current North
the Canary and Cape Verde Islands and Madeira situated off the coast
of Senegal. These islands have a coastline of 3 505 km and total land
Western
Mali
area of approximately 12 300 km2. Administratively, the region covers
Sahara
the Islands of Cape Verde and the Canary Islands, as well
as the countries of Mauritania, Senegal, The Gambia,
Elevation/
Mali, Guinea, Guinea-Bissau and the western part
Mauritania
Depth (m)
of Morocco (Figure 1).
4 000
2 000
Nouakchott
The region has several drainage systems of
Canary Current South
1 000
500
both national and international signifi cance
Cape Verde
100
Seneg
Senegal
0
that are highly dependant on rainfall patterns,
Thies
al
Dakar
-50
Kaolack
and given the signifi cant variability, some of
-200
The Gambia
-1 000
these rivers fl ow only during the rainy season.
Ziguinchor
Gambia
Guinea-
-2 000
The main river systems in the Canary Current
Bissau
Bafing
Labe
South sub-system are Senegal and Gambia rivers,
0
500 Kilometres
Guinea
ę GIWA 2004
in the the Canary Current North it is the Sebou and
Figure 1 Boundaries of the Canary Current region.
Souss rivers (Figure 2).
Note: Western Sahara is a disputed territory. The depiction and use of boundaries,
geographic names and related data shown on maps are not warranted to be error
free nor do they necessarily imply official endorsement or acceptance by the UNEP.
REGIONAL DEFINITION
15
signifi cant ecological, climatic and cultural diff erences. The northern
part of the region has a Mediterranean climate, with areas that are arid
Sebou Basin
and semi-arid, while the southern part is dominated by savanna and
rainforests. These diff erences have a signifi cant impact on patterns of
Morocco
resource use. The Canary Current North sub-system covers northern
Souss-Massa Basin
Mauritania and western Morocco, while the Canary Current South
sub-system covers southern Mauritania, Senegal, The Gambia,
Mali, Guinea, Guinea-Bissau, Cape Verde and the Canary Islands.
Western
The boundary between the two sub-systems is at the Cape-Timiris
Sahara
Mauritania
approximately 19░ N (Figure 1).
Senegal Basin
Physical characteristics
Cape Verde
Senegal
Gambia Basin
Mali
The Gambia
The physical characteristics of the countries of the region are shown
Guinea-Bissau
in Table 1. In the Canary Current North sub-system, the topography
Guinea
of the area features the Atlas Mountain range and vast plateaus,
0
500 Kilometres
ę GIWA 2004
bordered by the Atlantic, with narrow coastal plains widening in the
Figure 2
Major river basins in the Canary Current region.
lower reaches along the Atlantic coast, and low-lying areas towards
Note: Western Sahara is a disputed territory. The depiction and use of boundaries,
the southern parts most of which fall within the Sahelian zone. The
geographic names and related data shown on maps are not warranted to be error
free nor do they necessarily imply official endorsement or acceptance by the UNEP.
high and middle Atlas ranges have summits exceeding 3 000 and
4 000 m.
well as urban domestic water needs and industrial development. In
The Canary Current South sub-system is generally low-lying. Mauritania
the majority of cases, the natural vegetation has been overexploited.
has fl at plains with a few hilly outcrops, Senegal has low, rolling plains
In order to conduct a suitable assessment, the Canary Current
with some foothills in the southeast, with the highest point at 581 m
region was divided into two sub-systems in recognition of the area's
above sea level near Nepen Diakha. The Gambia is dominated by the
Table 1
Physical characteristics of the countries in the Canary Current region.
Area in the region
Area total
Continental Shelf
Exclusive Economic
Contiguous Zone
Territorial Sea
Country
(km2)
(nm)
Zone (nm)
(nm)
(nm)
(km2)
(%)
Algeria
359 561
15
2 381 740
-
32-52
-
12
Cape Verde
4 031
100
4 033
-
200
24
12
Guinea
43 570
18
245 857
-
200
-
12
Guinea-Bissau
633
2
36 120
-
200
-
12
Mali
231 972
18
1 240 000
-
-
-
-
Mauritania
841 205
81
1 030 700
200
200
24
12
Morocco
303 741
75
446 550
200
200
24
12
Portugal (Madeira)
774
1
-
200
200
24
12
Senegal
190 521
97
196 700
200
360
24
12
Spain (Canary Islands)
7 556
1
-
200
24
12
The Gambia
10 721
100
11 300
200
200
18
12
Western Sahara
269 067
100
266 000
-
-
-
-
Total
2 263 351
(Source: EROS Data Center 2003, ESRI 2002, CIA 2003)
16
GIWA REGIONA ASSESSMENT 41 CANARY CURRENT
Gambian River fl oodplains fl anked by some low hills; the highest
Climate and renewable water resources
elevation is 53 m above sea level. Guinea-Bissau is dominated by
There are signifi cant climatic variations among the North and South
coastal low plains rising to savanna in the northeast corner that reaches
sub-systems and the Atlantic Ocean archipelago. The Canary Current
approximately 300 m above sea level. Guinea is also generally low-lying
North sub-system features a Mediterranean type of climate, primarily
with a few hills and a mountainous interior rising to approximately
in Morocco, with a desert climate in Mauritania. The latter is constantly
1 752 m above sea level at Mount Nimba. Most of the terrain of Mali is
hot, dry and dusty most of the year. In the Canary Current South
low-lying, with rolling northern plains and rugged hills in the northeast
sub-system, Senegal, The Gambia, Guinea-Bissau and Guinea have
rising to approximately 1 155 m above sea level at the Hombori Tondo.
a tropical climate, while Mali has a tropical and arid climate. Senegal
The Cape Verde and Canary Islands both feature steep, rugged, rocky
in particular experiences a hot and humid rainy season from May to
volcanic terrain.
November accompanied by strong southeast winds. Senegal's dry
season extends from December to April and is dominated by hot and
Canary Current Large Marine Ecosystem
dry harmattan winds. The Gambia is generally hot with a rainy season
The marine ecosystem of the region is considerably infl uenced by the
during the months of June to November and a cooler and drier season
Canary Current, which fl ows along the West African coast from north to
during November to May. Guinea-Bissau and Guinea are generally hot
south between 30░ N and 10░ N and off shore to 20░ W (Fedoseev 1970).
and humid with a monsoon-type rainy season during the months of
Like other eastern boundary currents, it is wide (1 000 km) and slow (10-
June to November with southwesterly winds, and a dry season during
30 cm/s), and it fl ows year-round towards the Equator (Wooster et al.
December to May with northeasterly harmattan winds. In Mali, the
1976, Batten et al. 2000). Its surface waters are relatively cool because as
months of November to June are generally hot and dry. However, June
it fl ows southwards, it entrains water that has upwelled from the coast
to November are characterised by some rainfall with humid weather.
(Mittelstaedt 1991).
Both the Canary Islands and Cape Verde have a temperate climate with a
warm, dry summer; precipitation tends to be meager and very erratic.
On average, the Current is about 500 m deep (Wooster et al. 1976) and
fl ows at a speed of 10-15 cm/s (Zhou et al. 2000). The Canary Island
The total annual renewable water resources in the region is about
archipelago forms an obstacle to the fl ow of the Canary Current (Batten
342 km3/year, with a maximum of 226 km3/year for Guinea and a
et al. 2000). The Canary Current system contains coastal upwelling,
minimum of 0.3 km3/year for Cape Verde (Gleick 1998) (Table 2). The total
fi laments, and eddies (Johnson & Stevens 2000) with length scales
freshwater withdrawal is approximately 15 km3/year for the whole region,
of 100 to 300 km from along the coastal boundary of the current
with Morocco having the highest withdrawal. On average, agriculture
(Mittelstaedt 1991). The eddy kinetic energy values are less than
accounts for more than 80% of the water withdrawals in the region.
100 cm2/s2 (Zhou et al. 2000).
Generally, rainfall over the region exhibits high spatial and temporal
The Canary Current LME is classifi ed as a Class I, highly productive
variability. The mean annual rainfall ranges from as low as 10 mm in
(> 300 g C/m2/year) ecosystem, based on global primary productivity
Table 2
Renewable water resources and freshwater withdrawal
estimates from SeaWiFS (LME 2004). The region supports fi sh and also
in the Canary Current region.
millions of migrating birds. Sardines, pilchards, Horse mackerel, Chub
Renewable
Total
Use (%)
mackerel and Hake are some of the commercial species found in the
water
freshwater
Country
aesources
withdrawal
Domestic Industrial Agricultural
region.
(km3/year)
(km3/year)
Cape Verde
0.3
0.03
10
19
88
In the last three or four decades there has been an increase in catches
Gambia
8
0.02
7
2
91
of the European pilchard Sardina pilchardus as a result of increased
Guinea
226
0.74
10
3
87
fi shing pressure. Additionally, due to collapsing fi shing stocks in
Guinea Bissau
27
0.02
60
4
36
Europe, European countries are transferring their fi shing eff orts to the
Mauritania
11.4
1.63
6
2
92
waters of the region as a result of a bilateral fi shing agreement. Among
Morocco
30
11.05
5
3
92
the species threatened are the Sea bream (Dentex canariensis), along
Senegal
39.4
1.36
5
3
92
with certain pelagic species such as the Chub mackerel (Scomber
Total
342
15
-
-
-
japonicus) (LME 2004).
Average
-
-
15
5
83
(Source: Gleick 1998)
REGIONAL DEFINITION
17
the innermost core (Mali and Mauritania) of the Sahara to more than
River basins
2 000 mm in parts of the equatorial regions (Guinea, Guinea-Bissau and
The region has several drainage basins of both international and national
The Gambia) and other parts of West Africa. The coeffi
cient of rainfall
importance. The four major river basins in the region are (Figure 2):
variability in the region exceeds 200% in the deserts, whereas it is about
Senegal River Basin
40% in most semi-arid areas, and between 5 and 20% in the wettest
Gambia
River
Basin
areas (IPCC 2001).
Souss-Massa River Basin
Sebou
River
Basin
Biodiversity
The African Environmental Outlook (UNEP 2002) reported that habitat
Senegal River Basin (Canary Current South sub-system)
diversity in Africa ranges from desert, semi-desert and savanna to
The Senegal River is a transboundary water system shared by the
tropical forest, mangroves, freshwater lakes and inland and coastal
four West African countries of Mali, Guinea, Mauritania and Senegal
wetlands. The upper Guinea forests are a biologically unique system
(Figure 3). It is 1 800 km long, has an area of 475 000 km2 and has an
that is considered one of the world priority conservation areas because
annual average fl ow of 23 billion m3, 45 million m3 of which is used
of its high endemism, with nearly 200 plants, 4 mammals, 20 000
(Finger & Teodoru 2003). The source of the River is in Mali at the
butterfl y and moth species and 15 species of even-toed ungulates.
confl uence of the Bafi ng and the Bakoye rivers, 1 000 km inland from
The northern section of Senegal, which is part of the Sahel, consists
its outlet to the Atlantic Ocean.
largely of savanna grass, trees and spiny shrubs. The Gambia River
lowlands are mostly composed of woodlands. In the extreme south
Annual precipitation
are mangrove swamps and dense forests of mangroves, teak and
Mauritania
bamboo. Wildlife is diverse but larger mammals such as lions, cheetah
100 mm/year
200 m
and antelopes are largely confi ned to the less-populated eastern half of
m/year
the country. Hippopotamuses, crocodiles, cobras and boar snakes can
Podor
Senega
also be found. The upper part of Mauritania has little plant life and few
l
Gorgol
animals. However, in the south there is a strip of steppe with acacia and
Saint Louis
400 mm/year
ro
o
commiphoa trees, which are home to lions and monkeys.
rak
Boun
Ú
oum
aK
in
b
m
600 mm/year
Koli
Senegal
Kayes
The southern Sahara zone of Mali has mimosa and gum trees. Thorny
Ú
Mali
Úm
desert trees are common in the central region and in the south kapok,
Fal
Bakoye
1000 mm/year
The Gambia
baobab and shea trees are common. Common animal species include
Manantali dam
the cheetah, oryx, gazelle, giraff e, warthog, lion, leopard, antelope and
1 400 mm/year
jackal. Mangroves and rubber vine are common tree species in The
Guinea Bissau
g
in
2
Baf
Gambia, while cedar and mahogany trees abound. Wildlife includes
00
0 m
Guinea
leopards, wild boars, crocodiles, hippopotamus and several species of
m/year
0
200 Kilometers
antelopes. Game birds such as guinea fowls and grouses are plentiful.
ę GIWA 2004
Figure 3
Senegal River Basin.
In Morocco, the mountainous regions contain extensive areas of forest,
including large stands of corks, oak, evergreen oak, juniper, cedar, fi r,
The Senegal River fl ows across the western part of Mali, Guinea, and
and pine. Except for areas under cultivation, the plains are usually
downstream the River defi nes the border between Senegal and
covered with scrub brush and alfa grass. On the plains of Souss near
Mauritania before discharging into the Atlantic Ocean near Saint
the southern border a large forest of Argan (Argania spinosa) can be
Louis in Senegal. Other signifi cant tributaries include the FalÚmÚ,
found. These thorny trees are found principally in Morocco. The wildlife
KolimbinÚ, Karakoro, and Gorgol rivers, all located south of the
population is a mixture of European and African species. Of the animals
Manantali Dam.
characteristic of Europe, the fox, rabbit otter, and squirrel can be found
in large numbers, while the African animal species are dominated by the
The Senegal River is navigable from the Atlantic Ocean to Podor,
gazelle, wild boar, panther, wild goat, baboon, and horned viper.
Senegal, and to Kayes in Mali during the rainy season. Grassland covers
68% of the Basin, 4.8% is in crop production, 3.6% is wetland and 0.1%
18
GIWA REGIONA ASSESSMENT 41 CANARY CURRENT
is forest. About 82% of the surface area is desert; arid and virtually
In May, the river discharge falls below 0.5 m│/s. Because of the fl at
unproductive. Water availability is estimated to be 5 775 m3 per year
topography of The Gambia and the low river discharges during the dry
(Finger & Teodoru 2003).
season, saltwater moves up about 70 km upstream in the wet season
and 250 km upstream in the dry season. The tidal variation at the river
The Senegal River is quite important to the countries it fl ows through,
mouth is about 1.6 m.
because its waters are used for crop and livestock production, and
irrigated farming is an important economic activity along the River.
Dense mangrove swamps fringe the lower river as far as 97 km inland,
Pastoral and nomadic inhabitants who herd livestock, particularly
after which freshwater swamps and salt fl ats on low-lying stretches
in Mauritania, are highly dependant on this river. Fishing is also an
alternate with dense clumps of small trees and shrubs. On the higher
important economic activity along the river course. There are 115 fi sh
slopes of the riverbank, swamps and shrubs give way to parkland and
species in the river system, 26 of which are endemic.
tall grass with wild oil palm grows found along the valley bottom. The
vegetation of the River and of its creeks provides a favourable habitat
Gambia River Basin (Canary Current South sub-system)
for insects, animals, and birds. The swamps encourage mosquitoes and
The Gambia River (Figure 4) is another transboundary river in the Canary
tsetse fl ies to breed. The river system abounds in fi sh and river creatures,
Current region that is shared among the three West African countries
including the hippopotamus and the crocodile. Among the 400 bird
of The Gambia, Senegal, and Guinea. From its source in the Fouta
species that have been recorded are Kingfi sher, Cuckoo, Swallow,
Djallon (Futa Jallon) in Guinea the River fl ows west through Senegal
Heron, Sunbird, Hawk, and Grass warbler. The annual fl ooding of the
and The Gambia before draining into the Atlantic Ocean near Saint
fertile alluvial loams of the middle fl ats makes them especially suitable
Mary's Island.
for intensive rice cultivation. On the light sandy and well-drained soils
of the higher slopes, peanuts (groundnuts) grow particularly well.
Cultivation and settlement have therefore taken place in the middle
fl ats and on the higher slopes, with many villages being located on the
borderline between the fl ats and the plateau.
Senegal
Approximately 20 million inhabitants in the region depend on the
ou
Gambia R
Sandoug
Georgetown
iv
e
Gambia River for their livelihood, making it one of the most important
Banjul
Kerewan
er
non
Sa
The Gambia
K
rivers in the area. The River is used for irrigation downstream, where the
oulontou
Senegal
Kekreti dam - planned
potential has been estimated at 20 000 ha, with enormous potential
for additional 60 000 ha of suitable soils in the Senegalian part of the
Guinea-Bissau
Gambie
Basin (Saine 2001).
Mali
Gambia River
Guinea
Perennial
There are about 10 4200 ha of swamps in the Basin, of which 33 500 ha
Nonperennial
0
100 Kilometres
ę GIWA 2004
are cultivated. Mangroves account for an additional 67 000 ha. In the dry
Figure 4
Gambia River Basin.
season, the saltwater moves upstream at a rate of 15-20 km per month.
It is thought that an additional withdrawal of 1 m│/s would increase
The Gambia River is approximately 1 120 km long with a catchment
the penetration of saltwater by 1 km per month during the dry season
area covering approximately 490 000 km2. Its major tributaries are
(Saine 2001). The safe limit for irrigation from the Gambia River without
the Sandougou and the Sofi aniama rivers. The total quantity of water
a major dam construction is estimated to be no more than 2 400 ha in
leaving Guinea for Senegal is estimated at 3 km3/year. The River then
the dry season. However, if the planned Kekreti Dam on the Gambia
fl ows northwards to enter The Gambia in the extreme eastern part of
River in Senegal is constructed, it is expected that 15 000 ha can be
the country. An average of 4 km3/year (average of 1951-1990) to nearly
irrigated in Senegal and 55 000 ha in The Gambia. Moreover, this dam
10 km3/year enters The Gambia from Guinea (Saine 2001). The fl ow of
could prevent salt intrusion during the dry season. The development
the River is reported to be highly seasonal, with a peak discharge of
of these 55 000 ha would require 0.275 km│ per year of water. A further
about 2 000 m3/s, but for six months the infl ow at the Gambian border
25 000 ha of mangrove cultivation would require 0.125 km│ per year of
is less than 10 m3/s (Saine 2001).
water (Saine 2001).
REGIONAL DEFINITION
19
Patterns of settlement in The Gambia refl ect three habitats, found
high-cash crop commodities; and (iv) an equally important amount of
on both banks of the River, consisting of the swamps adjacent to
irrigation water is currently pumped from the transboundary aquifer,
the River (and not extending above Kaur), the riverine fl ats known as
around two-thirds of the total water used for irrigation purposes.
banto faros (from a Malinke word meaning "beyond the swamp"), and
the sandstone uplands. Most rural settlement is concentrated on the
Average rainfall for the Souss-Massa River Basin is about 270 mm per
uplands, which have the best-drained soils. A number of settlements
year, making this part of Morocco a semi-arid environment. The rainfall
are located in the banto faros on the middle course of the River, where
that does occur in the Basin comes in short storm bursts, which creates
there is less danger of fl ooding than in the swamps. Many villages are
serious fl ooding conditions. The high intensity rainfall is not easily used
built on the boundary between the uplands and the riverine fl ats. The
by irrigation because of the short, high intensity duration. Storms in the
River is navigable for the entire length of The Gambia; oceangoing
Basin result in fl ash fl oods, which create sediment problems in the River;
vessels can reach Georgetown 280 km upstream. The River is the main
the sediment is subsequently carried over into the reservoirs. Sediment
transportation artery for The Gambia and provides access to interior
deposition in the reservoirs has decreased the active storage pool for
sections of Senegal and Guinea.
most reservoirs. Flash fl oods also pose a danger to the population
(CSEC 2001). In 1971 the population of the Souss-Massa River Basin was
Souss-Massa River Basin (Canary Current North sub-system)
938 000 and in 1994 it has grown to 1 541 000 and is expected to almost
The Souss-Massa River Basin is located in the southwestern Morocco
double by the year 2020 (CSEC 2001). Land use is dominated by forest
between the Atlantic Ocean and the high Atlas Mountains. It
and pasture land (80%) (Baroud 2002).
encompasses the Souss River and all its tributaries, the Massa River and
all its tributaries, and the coastal river basins of Tamri and Tamraght
Modern irrigation systems are used in 60% of the irrigated area. Citrus
(Figure 5). The Souss River Basin covers a total area of 27 000 km2.
and vegetables represent almost 44% of crops grown in the irrigated area
(Baroud 2002). The predominant source of water, not only for domestic
use but also for irrigated land, is from groundwater. Groundwater levels
have been dropping over the years as water is extracted for use.
Morocco
a
ss
Mt .Siroua
Ma
(3304 m)
i
Tamr
Tamri
Sebou River Basin (Canary Current North sub-system)
Aoulouz
Tamraght
The Sebou River is one of the largest Moroccan rivers, draining
Agadir Sous
Taroudant
approximately 40 000 km2 (Figure 6). It runs across some 600 km from
its source in the middle Atlas Mountains to the Atlantic Ocean. The
upper part of the Sebou Basin rises over 2 800 m and is underlined by
Irherm
E R
Tafraout
R
Tiznit
I F
Morocco
M O U N T A I N S
Al Whada dam
0
50 Kilometers
ę
GIWAę
2004
Lower Sebou
Figure 5
Souss-Massa River Basin.
G H A R B P L A I N
Fes
S
Even though the Souss-Massa Basin is located entirely in Morocco,
N
Rabat
I
there are several tranboundary issues that are relevant for this report:
Meknes
A
T
(i) a signifi cant portion of the available water resources of the Souss-Massa
N
U
Basin can be lost to the Atlantic Ocean when a strong fl ash fl ood occurs;
O
M
(ii) a large proportion (roughly 60%) of the national production of fresh
S
A
fruits and vegetables that are exported from Morocco to international
L
T
markets originates in the Basin; (iii) a correspondingly large amount of
0
50 Kilometres
A
ę GIWA 2004
`virtual water' is exported annually through the export of commercial
Figure 6
Sebou River Basin.
20
GIWA REGIONA ASSESSMENT 41 CANARY CURRENT
calcareous rocks. The Basin receives a mean annual rainfall of more than
1 000 mm. The middle part is located mainly in the Rif and the Pre Rif
Sebou
Rabat Fes
Casablanca
mountains, characterised by a mean elevation of 2 000 m above sea
Meknes
Madeira (Portugal)
Morocco
level with relatively steep slopes, bedrock that consists of schist, marl
Marrakech
Agadir
and marly sandstones, and high rainfall averaging 2 000 mm per year.
Sous Massa
Canarias (Spain)
The lower Sebou Basin encompasses a large plain called the Gharb
Draa
Santa Cruz de Tenerife
Algeria
plain. The estuary extends over 90 km of the lower river.
Hamra
Canary Current North
Presently, there are 16 dams constructed along the Sebou River. The
Western
Sahara
Mauritania
most recently constructed dam (the Al Wahda Dam) is the second
most important dam in North Africa after the Aswan High Dam. Its
Mali
storage capacity is 3 800 km3 with a height of 800 m. The reservoir
Nouakchott
Population density
of the Al Wahda Dam is designed to irrigate 100 100 ha, generate
(persons/km2)
Canary Current South
<1
400 GWh per year of hydroelectricity, transfer 600 million m3 to the
Cape Verde
Senegal
1-2
Thies Senegal
southern region of Morocco, and to protect the Gharb Plain from fl oods
Dakar
3-5
Kaolack
The Gambia
6-10
(Arthurton et al. 2002).
Gam
Ziguinchor
bia
11-100
g
Guinea-
>100
0
500 Kilometres
Bissau Labe
Bafin
Guinea
ę GIWA 2004
Figure 7
Population density in the Canary Current region.
(Source: ORNL 2003)
Socio-economic characteristics
Note: Western Sahara is a disputed territory. The depiction and use of boundaries,
geographic names and related data shown on maps are not warranted to be error
free nor do they necessarily imply official endorsement or acceptance by the UNEP.
Population
The total population for the region is approximately 45.2 million
in the 15-64 years age group. Approximately 41% of the population is
people (Table 3), of which an estimated 70% are directly dependant
younger than 15 years of age and only about 3.5% are above 65 years
on international waters for their livelihoods. Figure 7 shows the
of age (World Bank 2001).
population density in the region. Growth rates fl uctuate between
0.8% (Cape Verde) and 3.03% (The Gambia) with an average of 2.3%
The current infant mortality rate is 73 per 1 000 live births on average
for the region. An average of 54% of the population in the region falls
in the region, with the highest recorded at 120 (Mali) and the lowest
recorded at 32.2 (Algeria) (CIA 2003) (Table 4). This is a slight decline
Table 3
Population in the Canary Current region.
from 1997 statistics where the average rate for the region was 86 (World
Country
Population in the country
Population in the region
Growth rate (%)
Bank 2001). In the Canary Current region the literacy level is low for the
majority of countries (Table 4). The rate of urbanisation is relatively high
Algeria
32 130 000
100 000
1.28
for all the countries but signifi cantly higher for Morocco, Mauritania and
Cape Verde
412 000
400 000
0.79
Cape Verde. The average urbanisation rate for the region was 40.2% in
Guinea
9 030 000
1 400 000
2.37
1997 and had slightly increased to 43.6% in 2001 (World Bank 2001).
Guinea Bissau
1 360 000
0
2.02
Mali
11 340 000
2 000 000
2.97
The majority of the countries in the region are among the poorest
Mauritania
2 910 000
2 600 000
2.91
countries in Africa. From Table 5 the countries with incomes above the
Morocco
3 1680 000
25 300 000
1.64
African GNI per capita average of 635 USD are Mauritania, Morocco,
Portugal
10 520 000
200 000
0.41
Senegal and Cape Verde. Some of the factors contributing to the low
Senegal
10 580 000
10 000 000
2.56
GDP in the region are the terms of trade for agricultural products
Spain
40 280 000
1 500 000
0.16
and fi sheries, which form the primary backbone of the economy.
The Gambia
1 400 000
1 400 000
3.03
Furthermore, the industrial sector made a very weak contribution to
Western Sahara
270 000
270 000
ND
the GDP for 1999. However, the services sector contribution to the GDP
Total
45 200 000
in 1999 appeared to be stronger (World Bank 2001).
Note: ND = No Data.
(Source: CIA 2003, ORNL 2003)
REGIONAL DEFINITION
21
Table 4
Population charactersitics of the Canary Current region.
Birth rate
Death rate
Migration rate
Infant mortality rate
Life expectancy at
Total fertility rate
Literacy level
Country
(per 1 000)
(per 1 000)
(per 1 000)
(per 1 000 live births)
birth (year)
(born per women)
(%)
Algeria
17.8
4.6
-0.39
32.2
72.7
2.04
70.0
Cape Verde
27.0
6.9
-12.16
50.5
69.8
3.77
71.6
Guinea
42.5
15.7
-3.14
93.3
49.5
5.9
35.9
Guinea-Bissau
38.4
16.6
-1.6
110.3
47.0
5.07
53.9
Mali
48.4
18.3
-0.35
119.6
47.4
6.73
31
Mauritania
42.2
13.0
0
73.8
51.9
6.08
46.7
Morocco
23.3
5.8
-1.03
44.9
70.0
2.89
43.7
Senegal
36.2
10.9
0.21
57.6
56.4
4.93
33.1
The Gambia
40.8
12.4
1.89
74.9
54.4
5.53
47.5
(Source: CIA 2003)
Table 5
Gross National Income and annual growth of GDP in
employment (ONEM 2001). In Cape Verde, fi sheries contribute only 5%
the Canary Current region.
to the GNP and employs around 11 000 people. Fish protein is the main
Income per capita 1999
Average annual growth of GDP (%)
source of animal protein in the diet of residents, and exports of fi sheries
Country
(USD)
Growth (%)
1980-1990
1990-1999
products are of considerable importance to the economy of the region
Algeria
1 550
3.3
ND
ND
(Fonseca 2000). The Senegalese fi shing industry, which consists of
Cape Verde
1 174
0.66
ND
ND
small-scale artisanal fi shing and large-scale trawler fi shing, employs
Guinea
514
0.92
ND
4.2
about 100 000 people (LME 2004). In Mali, where fi sheries are primarily
Guinea-Bissau
317
4.48
4
0.3
inland-based, production is around 99 500 tonnes with a potential yield
Mali
273
2.16
0.8
3.6
ranging between 37 000 and 60 000 tonnes (Ticheler 2000).
Mauritania
607
3.01
1.8
4.2
Morocco
1 066
-1.74
4.2
2.3
About 90% of the industries in Senegal are located in the Dakar coastal
Senegal
820
3.62
3.1
3.3
zone, along Hann Bay, which ranges from the port of Dakar to Thiaroye
The Gambia
314
4.06
3.6
2.8
village, with a 3 km long coastline. These industries employ a substantial
Note: ND = No Data.
number of the population and include fi sh processing, textile,
(Source: World Bank 2001)
pharmaceutical, painting, food processing and slaughterhouses (JICA
1999, Arthurton et al. 2002). It is estimated that over 0.5 million people
Domestic saving for the countries are far too low to sustain the required
in Mauritania, Guinea-Bissau and Senegal depend directly on fi sheries
investment and growth at the level needed to substantially reduce
for their income and food supply (IPS 2001).
poverty, especially with the high population growth rates. In general,
most African countries with extremely low per capita incomes, as is the
By 2001 the agriculture sector was still one of the driving forces for
case is for this region, cannot promote saving, and instead reliance on
economic development in many countries of the region. In Mauritania
subsistence farming reduces household income substantially. Another
and Mali, the main crops produced are millet, pulses, rice, dates, yams,
common factor in the region is the diff erence in income distribution
watermelons and maize. In the region's savanna areas (The Gambia
between and among households, among regions, and among rural
and Senegal), groundnuts, maize and rice are the major food crops
and urban populations. Traditional land tenure systems in the region
produced (Senegal produced 828 300 tonnes of peanuts in 2000,
tend to be biased and discriminatory against certain group of people,
providing a signifi cant percentage of foreign exchange). The crops
especially women (World Bank 2001).
grown for industrial purposes are cotton and sugar cane. In the
rainforest areas (Guinea and Guinea-Bissau) agriculture production is
Economic activities
dominated by subsistence farming, with the main food crops being
The population that lives in the region's coastal areas is engaged mostly
rice, peanuts, cassava, plantain, maize, vegetables and fruits. While
in marine fi sheries, agricultural production and tourism. In Morocco 80%
industrial crops include cashew nuts and cotton, the common crops
of the industrial infrastructure of the country is situated along the Atlantic
are perennials (vegetables and fruits). In Morocco, the principal crops
coast and tourism contributes to more than 54% (296 680 people) of the
are cereals, particularly wheat and barley (4.8 million tonnes in 2001),
22
GIWA REGIONA ASSESSMENT 41 CANARY CURRENT
Table 6
Livestock distribution in the Canary Current region.
approximately 10 000 ha of rice. The latter also provides a potential of
approximately 125 000 ha of rice in Mauritania. For the Senegal River
Livestock (million)
Country
valley, there is a potential for 240 000 ha from the Diama and Manantali
Sheep
Goats
Cattle
Poultry
Dams (FAO 1997, Vincke & Thiaw 1995). In the Souss Basin in Morocco,
Mauritania
6.2
4.1
1.3
3.1
fi ve concrete dams and nine earthen dams have been constructed and
Mali
6
8.5
6.1
24.5
designed to irrigate 134 294 ha and provide drinking water for the city
Senegal
4.3
3.6
3
45
of Agadir and the region (CSEC 2001).
Morocco
6.3
5.1
2.7
ND
Note: ND = No Data.
(Source: Diop 2001, Tandia & Dieng 2001, ORMVA/SM 2001)
Nearly 80% of the water in the region is used by the agriculture sector
for irrigation. The high demand is mostly in arid and semi-arid countries
along with roots crops such as potatoes and sugar beets (1.1 million),
of the region (Morocco, Mauritania, Mali and Senegal). The increasing
vegetables including tomatoes and watermelons (3.2 million), fruits,
proliferation of urban centres, particularly along the coast, has led
particularly grapes and dates (2.6 million), and sugar cane (1.3 million).
to increased water demand not only for domestic use but also for
A wide variety of other fruits and vegetables are also grown. The
industrial development. This however, may consume only about 10%
livestock industry is also of major importance, particularly in Mauritania
of the overall water use.
and Mali (Table 6).
Legal framework
Water resources
All of the countries in the region are signatories to various international
Due to considerable rainfall variability, most of the rivers in the region
conventions related to water use such as the United Nations Framework
have been dammed for irrigation and energy production. The Senegal
Convention on Climate Change, United Nations Convention to Combat
River has been subjected to signifi cant water resources development
Desertifi cation, Ramsar Convention on Wetlands, Convention on
projects. Two dams have been constructed on the Diama River. One near
International Trade in Endangered Species, United Nations Convention
its mouth, designed to exclude saline water, and the other at Manantali
of the Law of the Sea, and Convention on the Prevention on Marine
in Mali was designed to provide electricity and water for a potential of
Pollution (Table 7).
Table 7
Conventions that aff ect water use in the region.
Convention
Morocco
Mali
Mauritania
Senegal
Cape Verde
The Gambia
Guinea Bissau
Guinea
Convention on Biological Diversity
1
United Nations Framework Convention on Climate Change
United Nations Convention to Combat Desertification
Convention on International Trade in Endangered Species of Wild Fauna and Flora
Convention on the Control of Tranboundary Movements of Hazardous Wastes and their
Disposal (Basel Convention)
Convention on the Prevention of Marine Pollution by Dumping of Wastes and Other
Matter (London Convention)
Nuclear Test Ban Treaty
Convention for the Protection of the Ozone Layer (Vienna Convention)
International Convention for the Prevention of Pollution from Ships (MARPOL)
Convention on Wetlands (Ramsar Convention)
2
International Convention for the Regulation of Whaling
United Nations Convention of the Law of the Sea
Environmental Modification Convention
Convention on Fishing and Conservation of Living Resources of the High Seas
Notes: 1 Signed and ratified. 2 Signed but not ratified.
REGIONAL DEFINITION
23
Assessment
This section presents the results of the assessment of the impacts of each of the fi ve predefi ned GIWA concerns i.e. Freshwater shortage,
Pollution, Habitat and community modifi cation, Unsustainable exploitation of fi sh and other living resources, Global change, and
their constituent issues and the priorities identifi ed during this process. The evaluation of severity of each issue adheres to a set of
predefi ned criteria as provided in the chapter describing the GIWA methodology. In this section, the scoring of GIWA concerns and
issues is presented in Table 8.
Table 8
Scoring tables for the Canary Current region.
T
T
C
C
Increased impact
A 0 No
known
impact
A
2 Moderate
impact
Assessment of GIWA concerns and issues according
The arrow indicates the likely
IMP
IMP
T
T
No changes
C
C
to scoring criteria (see Methodology chapter).
direction of future changes.
A 1 Slight
impact
A
3 Severe
impact
IMP
IMP
Decreased impact
y
y
Canary Current
a
l
a
c
t
s
a
c
t
s
p
*
*
a
l
p
*
*
a
c
t
s
Canary Current
a
c
t
s
ent
p
ent
p
m
i
c
i
m
Score
m
i
c
i
m
Score
North
n
i
m
n
i
m
c
t
s
m
m
o
communit
c
t
s
communit
r
i
t
y
*
*
*
South
c
t
s
o
c
t
s
r
i
t
y
*
*
*
v
i
r
o
n
n
o
a
l
t
h
a
l
t
h
t
her
erall
io
v
i
r
o
o
t
her
erall
io
En
impa
Ec
He
O
impa
Ov
Pr
En
impa
Ec
He
O
impa
Ov
Pr
Freshwater shortage
1.5*
2.0
0.8
1.0
1.9
1
Freshwater shortage
1.8*
2.0
2.2
1.4
2.3
1
Modification of stream flow
1
Modification of stream flow
2
Pollution of existing supplies
1
Pollution of existing supplies
2
Changes in the water table
2
Changes in the water table
1
Pollution
1.0*
1.0
1.0
1.0
1.1
3
Pollution
1.8*
1.0
1.0
1.8
2.0
4
Microbiological pollution
0
Microbiological pollution
1
Eutrophication
1
Eutrophication
2
Chemical
1
Chemical
2
Suspended solids
2
Suspended solids
2
Solid waste
1
Solid waste
2
Thermal 0
Thermal 0
Radionuclides
0
Radionuclides
0
Spills
1
Spills
1
Habitat and community modification
2.0*
1.6
0
0
0.7
5
Habitat and community modification
3.0*
2.6
1.8
1.0
1.8
3
Loss of ecosystems
3
Loss of ecosystems
3
Modification of ecosystems
1
Modification of ecosystems
3
Unsustainable exploitation of fish
2.3*
2.0
0
1.6
1.4
2
Unsustainable exploitation of fish
2.5*
2.5
1.2
2.4
1.8
2
Overexploitation
3
Overexploitation
3
Excessive by-catch and discards
2
Excessive by-catch and discards
2
Destructive fishing practices
2
Destructive fishing practices
3
Decreased viability of stock
0
Decreased viability of stock
0
Impact on biological and genetic diversity
2
Impact on biological and genetic diversity
2
Global change
0.8*
1.0
0
1.0
1.1
4
Global change
0.8*
1.0
1.0
1.0
1.5
5
Changes in hydrological cycle
1
Changes in hydrological cycle
1
Sea level change
1
Sea level change
1
Increased UV-B radiation
0
Increased UV-B radiation
0
Changes in ocean CO source/sink function
0
Changes in ocean CO source/sink function
0
2
2
*
This value represents an average weighted score of the environmental issues associated to the concern.
** This value represents the overall score including environmental, socio-economic and likely future impacts.
*** Priority refers to the ranking of GIWA concerns.
24
GIWA REGIONA ASSESSMENT 41 CANARY CURRENT
It should be noted that the present assessment is based upon available
Box 1
Impacts of stream reduction in the Souss-Massa Basin.
In the northern part of the Canary region, the Moroccan government has built
data. A number of data gaps and an imbalance in the availability of data
several dams along the Souss River. Hundreds of small, seasonal springs flow
exist, which makes the assessment speculative in some cases. To adequately
down from the Anti-Atlas Mountains into the Souss. While the construction of
dams supports industrial agriculture (citrus and tomato exports) in the region,
address the concerns and issues, empirical evidence from research elsewhere
it has disturbed the ecological equilibrium of Souss-Massa's Natural Reserve.
Since less water is able to reach its wetlands, the size of the reserve has decreased
was used and applied to the regional context.
dramatically. This lack of free-flowing water affects wildlife in the region. Fewer
migratory birds, for example, linger at the reserve, and fewer still select it as their
final destination. For the most part modernisation has improved water quality.
Wells are all lined and most have a bib or a concrete border on the ground around
the well to prevent seepage of contaminants into the wells. Technology has also
made it possible to treat wells with bleach and iodine. In some villages more
Freshwater shortage
modern methods have made it easier to retrieve water such as a tap system, or
electric pump that eliminates the need to use a pulley system. An even more
modern washer/wheel method has made drawing water from wells less laborious.
However, these modern techniques have not reached Tagmoute and the washer/
T
T
wheel pump cannot be used to make drawing water easier in Tagmoute because
C
C
A
A
the wells are too deep. So as of 1999, villagers rely on old pulley systems that
IMP
Canary Current North
IMP
Canary Current South
are quite laborious. The introduction of plastic has made for some lighter water
containers that are more hygienic. Unfortunately the increase in garbage caused
The region has limited mineral resources and has generally attained low
by packaging and the lack of a suitable garbage site has led villagers to discard
trash in the dried up riverbed. Garbage is also found throughout the oasis, which
to medium levels of industrialisation. Hence, the region's river basins
will obviously harm the local vegetation and animals. The water situation is greatly
improved by the presence of wells and a piping system that delivers drinkable
contribute signifi cantly to both rural and urban development. Rivers are
water to every home. This saves women in the village endless hours when they
do not have to spend gathering water from the well. Aside from the saltwater
exploited for crop and livestock development, rural and urban domestic
that enters wells due to the ocean's proximity, the problem is drought. In 2002,
water needs and industrial development.
Morocco's dams were filled to 75% of their capacity. Water shortage is a problem
that is mounting with increasing desertification, deforestation, and population
growth. Farmers are highly cognisant of the water shortage, as some of their fields
depend on rainfall for water. The fields closer to the River have irrigation to help
A large portion of the region is located in the Sahel region, meaning
them, but these, too, are affected when the water level drops in the River.
that surface water is limited to areas with signifi cantly high levels of
(Source: Powell et al. 2003)
rainfall. This eff ectively controls the characteristics of the rivers in the
region. Within this context, the uneven distribution of surface waters is
Fundamentally, the hydrological regime of the Senegal, Gambia, Souss
quite notable in the region. Mauritania and Mali are characteristically dry
and Sebou rivers has been subjected to considerable changes in annual
countries while substantial parts of Senegal, The Gambia, Guinea and
discharge and surface area during the past four decades. While drastic
Guinea-Bissau are characterised by ample amounts of annual rainfall.
changes in the region's river and stream discharges have occurred
With these characteristics, overextraction of large amounts of water
due to natural factors (climate change), a signifi cant proportion of the
by upstream nations automatically jeopardises the availability of the
changes are due to dynamic human activities. Increasing demographic
resource for downstream users. Overextraction also leads to changes
characteristics and urban and industrial growth are among the factors
in biodiversity.
that have contributed to the changing landscape and thereby, to
modifi ed stream fl ow (See Box 1).
The primary concern of this assessment is focused on rivers of
transboundary nature; the Senegal and Gambia rivers for the Canary
The regime fl ow of Senegal River in particular has been signifi cantly
Current South and the Souss-Massa and Sebou rivers for the Canary
modifi ed by the construction in 1987 of the Manantali Dam, which is
Current North sub-system.
located upstream in Mali. Similarly, the construction in 1997 of the Diama
Dam downstream in Senegal near the river mouth has contributed to
Environmental impacts
coastal erosion. Construction of the Diama Dam helped curb the back
Modifi cation of stream fl ow
fl ow of saline water (JICA 1999). Small dams on the Gambia River (Kekret
Stream or river fl ow may be altered by natural causes and this is
and Kouya Dams) have similar impacts on their respective river regimes
discussed under the Global change concern. However, stream fl ow
(Diagana 1994).
modifi cation, particularly in the Canary Current South sub-system,
has been caused primarily through damming of rivers that in turn has
The most common impact of damming includes inundation of large
resulted in changes in fl ow regimes, losses of fl ood plains, losses or
areas, siltation, salinisation and other consequences from infrastructure
degradation of wetlands and increased erosion of riverbanks. Many
construction, such as, roads, building, and vegetation removal. It
seasonal rivers and streams drain this sub-system and provide support
is reported that construction of the Manantali Dam changed the
to food production. These seasonal rivers run for a very limited period
pattern of fl ooding, resulting in severe problems for the agro-pastoral
and their economic impacts are therefore very limited.
communities (Diagana 1994).
ASSESSMENT
25
of the drainage area, some of which are rated among wetlands of
1 400
international importance under the Ramsar Convention (Vincke &
1 200
Flow
Mean
Thiaw 1995). In the Senegal River, the sediment load is as high as 1.18 to
1 000
)
/s
800
2.86 million tonnes per year, which has threatened lagoon-based cities
3
(m
600
near the river mouth (Arthurton et al. 2002).
w
Flo
400
200
Pollution of existing supplies
0
For the Canary Current South sub-system, the African Environment
1903
1908
1913
1918
1923
1928
1933
1938
1943
1948
1953
1958
1963
1968
1973
1978
1983
1988
1993
Outlook (UNEP 2002) has reported "rising levels of pollution of surface
Year
and groundwater resources." Pollution of existing water supplies is
Figure 8
Senegal River discharge variation at Bakel, 1903-1994.
(Source: Diagana 1994)
attributed to sewage and industrial effl
uents, agricultural run-off ,
sedimentation due to poor farming techniques, sand storms (wind
erosion), and coastal erosion (JICA 1999).
A standardised time series study of the annual discharge of the Senegal
River shows that the River has had a period of signifi cant defi cit after
In Morocco, some rivers and aquifers in contact with saliferous terrains
1970 (Figure 8). The percentage of reduction between the mean annual
contain as much salt as 320 g/l. In the Tadla area in Morocco, the main
discharge over the years before 1970 and the defi cient periods is over
river has its source in a saliferous zone and carries 3 g/l during the
40% (Diagana 1994).
period of minimum fl ow. It is estimated that more than 130 000 km2
of land in Morocco have no outlet to the sea. In these hydrologically
Human activities such as damming, urbanisation, agro-industrial
closed systems, water is not renewed and the concentration of salts
development and settlements along major rivers in the region have
has increased over time. An example of this situation is the in Gharb
caused erosion in coastal areas (Box 2). Deforestation, particularly of
region (in the Sebou River) where incoming surface waters are of good
native forests, has been very signifi cant in the Senegal Basin. According
quality (electrical conductivity of about 1 mmhos/cm) but groundwater
to the World Resource Institute (WRI 2003) all the indigenous forests
frequently contains more than 10 g/l of dissolved salts, especially when
along the River have been exploited. Exploitation of exotic forest species
water table is shallow (Tayaa & Bazza 1994). Salinisation has also been
is estimated to be about 5% per year. Nevertheless, 6% of the drainage
enhanced through anthropogenic activities such as inadequate
area is designated as protected. Wetlands occupy approximately 4%
irrigation with saline waters and fl oodwaters. The spreading of fl ood
Box 2
Transboundary problems resulting from the Diama and Manantali Dams on the Senegal River.
The Diama and Manantali dams were constructed on the Senegal River in 1985 and 1988 respectively. Each of the dams was built for a specific purpose, the Diama was built
downstream of the Senegal (around 30 km upstream from the river mouth) for the purpose of preventing saltwater intrusion. It is closed during the dry season from November
to June, and is gradually opened during the rainy season, generally around July. The Manantali Dam was built 1 200 km upstream from the river mouth on one of the main
tributaries of the Senegal River for hydroelectric power purposes. The main goal of this construction was to provide water for irrigation along the Senegal River valley and a
freshwater supply for Lake Guiers, which itself is a water supply for Dakar, the capital of Senegal. The environmental impacts of the dams are:
- Water quality modification, particularly in the delta region, with increased water-borne parasitic diseases (specifically, increased intestinal bilharzia, which had never
been observed before the construction of the dam, in the region of Richard Toll, 60 km upstream of Diama Dam). A field survey between 1988 and 1989 of 1 000 randomly
selected individuals of all ages showed a prevalence rate of 60% for intestinal bilharzia (Talla 1992). Furthermore, it is reported that dissolved oxygen levels have markedly
decreased, with an associated accumulation of nitrate and nitrite (BÔ 1992).
- Reduction of fish yields downstream of the Diama Dam.
- Inundation of certain localities near the main city, Saint Louis, downstream of the dam during particularly rainy seasons.
Detailed studies between 1989 and 1992 (Michel et al. 1993) have shown that, after the construction of the Diama Dam, complex and unstable coastal systems, such as
the Senegal River Delta, have undergone profound changes. While the Senegal river mouth is located on a sandy coast with a weak tide, the equilibrium (erosion and
sedimentation) of the coastline (the "Langue de Barbarie" sand spit, in particular) and the inner part of the river mouth are both highly dependent on the longshore drift and
the transported sand. Therefore, the construction and operation of the Diama Dam greatly affects the river mouth and coastal geomorphology during both the dry and rainy
seasons. For example, between 1986 (when the Diama Dam began to function) and 1994, the Senegal River mouth moved southwards more than 3 500 m, and is now located
to the extreme south of its former location. Furthermore, a higher sedimentation rate on the marine side as compared to the riverside contributed to reinforcement of the
marine side of the "Langue de Barbarie". The Senegal River mouth will certainly be maintained for a while at the southern part of the Delta. Field measurements (including
topo-bathymetry transects and sedimentological analysis), spot imagery processing and recent topographical map comparisons have allowed a better understanding of the
functioning and evolution of the Senegal River Delta.
Construction of the Diama and Manantali Dams created an additional 240 000 ha of land for irrigation on the Senegalese side of the Senegal River, giving the country the
opportunity to diversify its crop base and increase food production, but this was achieved at a cost. The two dams also created controversy by altering the hydrological regime
of the River, thus generating transboundary problems. Upon completion of the dams, farmers and fishermen living downstream were exposed to increased health problems
from water-borne diseases such as malaria and schistosomiasis. Operation of the upstream dam also reduced annual floods along the floodplain, where an ancient and
productive form of recessional irrigation had been practiced for hundreds of years. Recessional irrigation is still practiced along these flood plains on an estimated 50 000 ha,
but floodwaters from the Manantali Dam do not carry the same load of nutrient-rich silts which are deposited on the fields after the flood waters retreat.
(Source: Diop et al. 2000)
26
GIWA REGIONA ASSESSMENT 41 CANARY CURRENT
waters leach some of the salts present in the soil at the time of
Table 9
Access to safe drinking water sources in urban and
application but cause actual evaporation to increase and new salts
rural areas in the region.
are brought up to the soil surface. Water quality is a problem in some
Access safe drinking water
Country
peri-urban areas along the coast, where wastewater has exacerbated
Urban areas (%)
Rural areas (%)
problems (CSE 1988).
Senegal
90
65
Mali
75
60
In Yeumbeul, Senegal, 7 000 households are dependant on groundwater
The Gambia
95
77
sources that are contaminated by high levels of nitrates over and above
Guinea-Bissau
79
49
the WHO recommendations of 50 mg/l (UNEP 2002). In Dakar, most of
Morocco
99
57
the industries discharge raw industrial waste into water-bodies, due to
Mauritania
33
40
lack of treatment plants. Furthermore, tourist facilities such as hotels
(Source: WHO 2001)
also discharge pollutants in water-bodies. Another pollutant source is
intensive agriculture, which consumes a great quantity of fertilisers. The
Senegal River and Lake Guiers are examples of water bodies polluted
makes groundwater exploitation very likely in the years to come. Data
by fertilisers. In recent years, the Great Dakar region has experienced
availability for aquifers in the region is, however, quite limited.
chronic water defi cits of potable water (JICA 1999). As an example,
aquifer waters taken from wells around Dakar showed very high
In the Canary Current North sub-system, data from Morocco show that
concentration of sodium, potassium, calcium, magnesium, sulfates,
in the Souss-Massa Basin irrigated perimeter, the aquifer drawdown can
nitrates, bicarbonates and chlorides (JICA 1999). The highest bicarbonate
be as high as 2 m per year and has ranged between 10 to 65 m since
concentrations were recorded along the sea front (3.41 mg/l) and an
1970 (CSEC 2001). Because of decades of drought, recharge rates are
area of unconfi ned aquifer the least infl uenced by human settlement
very low and there are problems with overabstraction.
(1.32 mg/l). In terms of nitrate, 20 mg/l was recorded in the eastern
sector of the peri-urban area, which is less impacted by human
In the Canary Current South sub-system, the decline has been linked
settlement. However, excessive concentrations above 200 mg/l were
to the long dry periods (more than 30 years) and overextraction of
recorded in the peri-urban district of Dakar, which is without sanitation
groundwater for irrigation (Diene 1995). In Pout and SÚbikhotane in
system and is characterised by a predominance of slums. In addition,
Senegal, the aquifer drawdown is 1.5 m per year. There are substantial
Niang-Diop et al. (2002) noted that approximately 660 000 ha in Senegal
groundwater aquifers, but because of low precipitation, recharge rates
has been aff ected by salinisation, with 260 000 ha of this area along the
are very low and there are problems with overextraction, especially near
coast, and the remaining 400 000 ha found in the Casamance Basin, near
Dakar (AWRMI 2001).
the Senegal river mouth.
Socio-economic impacts
In summary, pollution of groundwater in the region exacerbates
Agriculture, fi sheries, industry and tourism are the socio-economic
freshwater shortages. Nevertheless, countries from the region in general
activities most aff ected by these water problems. The majority of the
have experienced considerable improvement in to safe drinking water
countries in the region rely heavily on the agricultural sector for food
(WHO standards), particularly for urban populations (Table 9).
security, raw materials for industrial development and export earnings.
Therefore any impact on the productivity of this sector depresses the
Changes in the water table
entire economy of countries involved. However, it should be recognised
The coastal areas of Morocco, Mauritania and Senegal have substantial
that the construction of dams on the Senegal and Gambia rivers have
groundwater aquifers (Senegal-Mauritanian Basin, Taoudeni Basin,
also contributed to hydropower generation and irrigated farming.
Souss-Massa Basin and Errachidia Basin) (ONEM 2001). Major constraints
on the use of groundwater arise from the lack of precise data about
The inland fi sheries is equally important in terms of food security and
aquifers, such as capacity, depth and contamination. However, the
income generation. The Canary Current South sub-system countries rely
GIWA Task team recognised that over the past three decades, there has
on fi sheries from the Senegal and Gambia rivers. High fi sh catches are
emerged clear evidence of declining base fl ow in most of groundwater
achieved during high river peak seasons and is lowest with increased
systems in the region. This rapid decline is due to increasing population
catch eff ort during low fl ow periods. Therefore, the increasing
pressure and the diversifi cation of economic activities. This scenario
fl uctuation in the river regime, particularly as a result of diversions
ASSESSMENT
27
and climate change, has negative impacts on the fi shing sector and in
Box 3
Health impacts due to stream fl ow modifi cation:
essence contributes to indirect costs in time spent on the activity. ACOPS
Damming of the Senegal River Basin.
Water reservoirs combined with channeling of water for irrigation have created
(2001), reported losses of up to 50 000 tonnes (1972) and 30 000 tonnes
debilitating health problems for the people living in the Senegal River Basin. The
permanent presence of standing water in the valley has led to a continuing increase
(1990) of estuarine fi sheries in the rivers due to stream fl ow modifi cation.
of water-borne diseases that were already common in the area: malaria, diarrhoea,
Inland fi sheries provide regular employment for millions of poor people,
intestinal parasitic diseases, and particularly bilharzias, for which the Senegal valley
unfortunately holds the world record (Verhoef 1996). Intestinal bilharzia had never
and seasonal or part-time employment for many more. This work is
been observed in the Canary Current South sub-system before the construction
of the dam 60 km upstream of Diama Dam. A field survey between 1988 and 1989
closely linked to other activities such as farming, livestock rearing, and
of 1 000 randomly chosen subjects of all ages showed a prevalence rate of 60% for
intestinal bilharzia (Talla 1992). Cholera outbreaks, which typically used to occur
fuel wood collection. It has been reported that salt intrusion along the
only during the rainy season, appear to have become quasi-endemic. The increase
in schistosomiasis has resulted from the creation of freshwater bodies, such as
coastal areas of Senegal was partly the reason for the abandonment of
irrigation canals and ponds, where disease-bearing snails that were previously
the Katakalouss shrimp culture project (Bousso et al. 1993).
controlled by seasonal fluctuations and salt inflows are now able to breed. The
mortality rate caused by water-related disease as calculated in 1997 was 8 000 per
year. It was estimated that measures to manage flows from the dams could reduce
the annual number of deaths by 2 500.
Economic impacts of freshwater shortage are also refl ected in the
(Source: Finger & Teodoru 2003)
high costs associated with the construction of dams and inter-basin
transfer schemes to supply water. The Senegal River has a number of
large-scale dams, as mentioned above. Morocco has also developed
These fertile riparian areas frequently remain uninhabited for fear of
intensive and extensive water resources networks that involve high
infection. Out of some 120 million people worldwide that are at risk
investment and maintenance costs. Landlocked Mali has a severe
of onchocerciasis, 96% are in Africa, and majority of these are in the
shortage of freshwater and has been highly dependent on donor
countries of the Canary Current South sub-system (Tandia & Dieng
funding to pay for alternative water sources in recent years. Additional
2001). In addition, previous surveys have shown that groundwater
economic impacts associated with freshwater shortages are the
pumped specifi cally for drinking in suburban areas is contaminated
increased costs from pumping groundwater that results from the need
with the parasites and bacteria that lead to diarrhoea, particularly in
to drill deeper wells. A signifi cant percentage of the population of the
children.
Cape Verde Islands depends on groundwater for domestic use, and the
increasing costs make this dependency extremely expensive. The same
Health impacts are relatively small in the Canary Current North sub-
situation applies to Morocco, which relies on groundwater for irrigation
system, based on the size of aff ected population in comparison to the
development. The majority of the countries in the region are dependant
population as a whole. However, in Morocco, water-borne diseases
on hydroelectric power for their energy supply, which in turn is directly
caused by changes in the quantity of freshwater resources aff ect
aff ected by changes in the water regime. This impact is also refl ected in
mainly the rural population. In 1994, it was reported that 206 people
the costs of desertifi cation, and increased eff ort required for searching
had paludism, 3 582 people had epidemic hepatitis and 1 108 people
for alternative water resources.
had bilharzia (Table 10) (ONEM 2001).
Health impacts were assessed slight and moderate in the Canary
In the Senegal and Gambia rivers, for example, it has been reported
Current North annd South sub-systems respectively. Polluted water
that aquatic weeds have increased due to construction of dams
supplies are source for microorganisms that can cause water-borne
and therefore navigation has been restricted. Habitats for migratory
diseases. Reservoirs associated with dams provide a hospitable
birds have also been aff ected due to dam construction. Similarly,
environment for carriers of water-borne diseases such as bilharzias
fi sh composition has been altered. Confl icts in uses of the resources
and guinea worm, which leads to river blindness (Box 3). Against this
within the watercourse do occur, but with limited intensity. In Senegal,
backdrop, health impacts were ranked based on the eff ect of these
modifi cation of the hydrologic regime of the Senegal River as a result of
water borne diseases, particularly diarrhoea, cholera and bilharzia and
guinea worm, which constitutes a major health problem mainly in
Table 10
Water-borne diseases in Morocco 1990-1994.
Mali, Senegal, Guinea, Guinea-Bissau, Mali, and Niger. Onchocerciasis
Number of affected people
Disease
(river blindness), the world's second leading infectious cause of
1990
1991
1992
1993
1994
blindness, is found in 36 African countries. As a public health problem
Paludism
838
499
405
198
206
the disease is most closely associated with Africa, where it constitutes
Epedimic hepatitis
2 357
2 286
2 586
2 502
3 582
a serious obstacle to socio-economic development. A black fl y that
Bilharzia
3 487
3 705
2 358
1 137
1 108
abounds in fertile riverside areas is the vector that causes the disease.
(Source: ONEM 2001)
28
GIWA REGIONA ASSESSMENT 41 CANARY CURRENT
damming increased agricultural productivity downstream, but this was
demand for the Greater Dakar region is expected to grow by 30% over
achieved at the expense of livestock husbandry that had traditionally
the next decade, and triple over the next 30 years (at an annual growth
been carried out in the fl ood plains. This upstream-downstream shift
of about 3%) (AWRMI 2001).
in resources also created potential bilateral confl icts between Senegal
and Mauritania, as reported by Niang (1999). Persistent confl icts are
In general, in the majority of the countries of the region, there is a
mostly common among the pastoral and nomadic livestock keepers
growing concern and awareness about water shortage and scarcity
in Mauritania and Mali. As mentioned earlier, freshwater shortages
as well as about drought and the eff ects of climate change on water
contribute signifi cantly to economic and health problems. Naturally,
resources. Several measures have been taken since the middle of the
these factors are inter-related and in essence, the most common
1980s and the beginning of 1990s. Such measures include campaigns
impact on the communities is an aggravation of poverty. People have
aimed at the general public about the importance of conserving
moved away from traditional lands due to shortages of freshwater,
drinking water, actions to implement more effi
cient water use practices
which results in changes in community lifestyles. In Africa, per capita
in irrigation, development of improved water harvesting methods in
consumption rates of fi sh are very high, and millions of consumers
rain-fed areas and the use of wastewater for irrigation. In Morocco for
count on inland fi sh as a major source of protein, making this resource
example, since the beginning of the 1990s, the General Department
important for food security (Ticheler 2000). While marine fi sheries
of Hydraulics has been developing a comprehensive, fl exible water
production is increasingly entering export markets, inland fi sh
resources master plan for the country's major river basins. Moreover, the
production largely continues to feed local populations. However, in
institutional framework and setting for water resources management
the Canary Current region, the assessment showed that the degree
and development such as the creation of river basin agencies, a
of severity of the freshwater shortage is small and localised. The
consultative national council for water and climate, and various water
frequency and duration of the impacts is still short term with seasonal
regulations are being launched.
variations.
Conclusion and future outlook
The current environmental status of freshwater shortages in the
Pollution
Canary Current region shows that there are signifi cant impacts
due to stream fl ow modifi cation, pollution of existing supplies and
T
T
C
C
A
A
IMP
Canary Current North
IMP
Canary Current South
changes in the water table. High population rates, urbanisation with
limited additional infrastructure, industrialisation and agricultural
Eutrophication due to pollution has been identifi ed as a problem,
development are among the major contributors to the problem, as well
particularly in the Canary Current South sub-system. Furthermore,
as the benefi ciaries of the resources. Many transboundary rivers have
chemical pollution and suspended solids were also ranked as a major
multiple dams that cause environmental problems. Due to shortage
problem in the Canary Current region as a whole. Microbiological
of surface water, many countries continue to extract groundwater for
pollution and oil spills were assessed as slight in the Canary Current
various needs. The number of people aff ected (in terms of economics,
South sub-system. In the Canary Current North sub-system, the
and social and health eff ects) is high particularly in the Canary Current
problems encountered are chemical pollution, suspended solids from
South sub-system.
agriculture (from the use of fertilisers and pesticides in major irrigated
perimeters in the major watersheds) and industrial activities. Pollution
In the future, an increase in water demand for irrigation, drinking
along and in the Atlantic waters is a transboundary problem and
water and industrial water associated with a decrease in water supply
aff ects all the other Atlantic coast countries in the region (The Gambia,
due to drought will put pressure on available water resources. As a
Mauritania and Morocco). The most critical problem in Cape Verde is
consequence, more river regulation to provide additional water storage
marine dumping, especially hazardous wastes.
will likely result. In fact, Morocco has already more than 90 large and
small dams and the authorities are planning more construction the
For other GIWA issues, such as thermal and radionuclide pollution,
next 20 years (ONEM 2001). In addition, countries will be more likely
there is no evidence or data concerning these activities in the region.
to look to redistribute water through inter-basin transfer. Again in the
There is some evidence of minor spills of hazardous materials, but these
case of Morocco, inter-basin transfer options from north to south have
are limited to harbors and fi shing ports (UNEP 2002). These issues are
been considered since the beginning of the 1990s (CSE 1988). The water
therefore not further discussed.
ASSESSMENT
29
Box 4
Pollution in the city of Dakar.
Morocco, 98% of the phosphorus and 85% of the nitrates originate
Senegal's industrial enclave is along the Hann Bay in the capital city of Dakar, which
from fertiliser uses upstream of the reservoir (ONEM 2001).
is also the most populated area in the whole country. Some of these industries
involve highly toxic chemicals that are used in the production of paint, textiles
and pharmaceuticals. There are also fish, slaughterhouses and food processing
industries. The 1999 Japanese International Development Cooperation Report on
Chemical
the status of the environment in Senegal noted that raw surface waters were highly
Like most rivers draining deserts, the Senegal River contains some
polluted. The report noted that this pollution was concentrated along the densely
populated Hann Bay in Dakar where 30% of the industries discharge their waste
salt. The level increases sharply between December and June and
directly into the bay (30%), 12% is discharged through sewers, 12% is discharged
after pre-treatment and 4% passes through septic tanks or in open sites. The total
drops towards the end of July. There is no regular monitoring of
amount of wastewater discharged is estimated to be 41 000 m3 per day. Run-off
from agriculture also contributes very significantly to pollution of water, as can be
chemical pollutants in the region neither in inland nor in marine
observed in Lake Guiers, and the Senegal and Casamance Rivers. Tourist facilities
along the Atlantic coast also discharge to waters, and oil spills can be observed
waters. However, the intensive use of pesticides and fertilisers in the
around oil refineries in Dakar
agricultural and irrigated areas in the region (Morocco and Senegal
(Source: JICA 1999)
River valley for example), is a well-known fact. In 2001, the agricultural
sector in Morocco used 8 500 tonnes per year of nitrogen as a fertiliser.
Environmental impacts
This use is expected to climb to 15 200 tonnes per year by the year
Microbiological
2015. In addition, it has been reported that nitrate concentrations
Coastal cities in the region such as Dakar, Nouakchott, Banjul, without
in several wells in the Oum Errabia Basin are more 50 mg/l with a
adequate sanitation and waste treatment facilities, are hubs for
yearly increase of 5 mg/l. It is also estimated that 0.5 to 1% of the
microbial pollution. In addition, these coastal cities are primary centres
total pesticides used in Morocco reach the country's rivers via run-
of industrial development and a high population density (Arthurton et
off (ONEM 2001).
al. 2002). According to the African Environmental Outlook (UNEP 2002),
microbial and bacteriological contamination is a particular concern in
Suspended solids
the Hann Bay, near Dakar (Senegal) (See Box 4). Water-borne diseases
The region is characterised by desertifi cation, overgrazing of fragile
due to microbiological pollution for the Canary Current South sub-
ecosystems, cultivation of crops on steep slopes (Cape Verde), and soil
system are listed in the section on health impacts of pollution.
erosion. These anthropogenic activities lead to run-off and increases in
turbidity in the major rivers and lakes in the region.
Eutrophication
The assessment of eutrophication is based on the artifi cially enhanced
Data on suspended solids for the Gambia and Senegal rivers in the
primary productivity in receiving water basins as related to the
Canary Current South sub-system is shown in Table 11. Fundamentally,
increased availability or supply of nutrients. In the Canary Current
these statistics show that the Senegal River has a fairly high concentration
South sub-system the increasing proliferation and invasion of aquatic
of suspended solids (196 mg/l) compared to other major African rivers.
species (Typha australis, Salvinia molesta) forming green carpets on the
In contrast, the Gambia River has low concentrations, amounting to
water surface along the rivers and particularly in the Senegal River Delta
only 19.5 mg/l (Martins & Probst 1991). In terms of total dissolved solids,
is partly as a result of increased nutrient loading. Under such conditions
the two rivers have minimal levels, especially in comparison with other
biological resources (fi sh and plants, in particular) are aff ected (Tandia &
major African rivers.
Dieng 2001). The decay of organic matter depletes oxygen particularly
in areas around major cities, the bays and ports, creating anoxia and
In the Senegal River and Lake Guiers, total suspended and total
fi sh mortality (Tandia & Dieng 2001). In addition, some toxic algae in
dissolved solids are increasing. In particular, total suspended solids
Lake Guiers have been reported (Tandia & Dieng 2001). The problem of
are quite signifi cant in the Senegal River and fairly moderate in the
eutrophication has been assessed as having moderate impacts in the
Gambia River. The cause for these loads are partly due to increasing
Canary Current South sub-system.
Table 11
Suspended solids in the Gambia and Senegal rivers.
For the Canary Current North sub-system, eutrophication eff ects are
Run-
Transport
Precipitation
RC
TDS
TSS
River
off
(million tonnes)
TSS/
to certain degree only found in large dam reservoirs. This is due mainly
(mm)
(%)
(mg/l)
(mg/l)
TDS
(mm)
TDS
TSS
to pollution loads and the use of fertilisers upstream of reservoirs,
Gambia
1 100
219
20
17
19.5
0.08
0.09
1.10
which increase the presence of algal blooms that in turn result in a
Senegal
650
48
7
42
196
0.4
1.9
2.44
deterioration of the quality of drinking water. As an example, in Sidi
Note: RC = Run-off coefficient. TDS = Total Dissolved Solid. TSS = Total Suspended Solid.
Mohammed Ben Abdellah reservoir, which supplies Rabat City in
(Source: Martins & Probst 1991)
30
GIWA REGIONA ASSESSMENT 41 CANARY CURRENT
Box 5
Damming of the Sebou River.
Even where collection is not a problem, disposal through uncontrolled
Sediment fluxes of the Sebou River were estimated based the on suspended
dumping remains the norm. There are no specifi c provisions for
sediment load transported by the River to the coast. The study reported an
exceptionally high sediment yield (850 tonnes/km2/year) before the construction
industrial, toxic, hazardous and medical wastes in the region, although
of the dams. The sediment load was due to the combination of steep slopes that
generate landslides and mud flows, easily eroded material, high precipitation
larger medical facilities own and operate incinerators. In Morocco,
and human activities such as vegetation removal and change in land use. It was
municipal waste totaled 3.7 million tonnes in 1992, of which 2% is
estimated that the sediment load from 1940 to1972 before the construction of
dams was about 34 million tonnes per year. After the construction of five dams
recycled through an informal recycling sector (UNEP 2002).
on the River, the sediment yield was not more than 1.36 million tonnes per year.
Thus, more than 95% of the River's sediment load was trapped by these dams. In
addition, damming of the Sebou River appears to have had a pronounced effect
on the coastal zones, which reached a new dynamic equilibrium in response to the
Socio-economic impacts
changed sediment regime. The estuarine behavior of the lower stretches of the
River downstream of the dams has greatly disturbed the river outlet topography
The economic sectors aff ected by pollution in the Canary Current
and coastal stability.
region are agriculture, fi sheries and tourism. Impacts on fi sheries and
(Source: Arthurton et al. 2002)
agriculture sectors can have severe economic eff ects beyond direct
losses since these sectors contribute very signifi cantly to the overall
anthropogenic activities as described earlier, and partly because of the
national product (more than 30% of GDP in the region). Pollution
decrease in stream fl ow following the construction of Manantali and
along the coast near densely populated cities such as Dakar are a
Diama dams.
major cause for losses of up to 40% in tourism industry in this country.
Pollution adds additional costs for water purifi cation in major cities, as
In Morocco, dam siltation is a problem, where the country's agricultural
well as for alternative supplies. In Morocco for example, the increase
output is dependent on irrigated farming. Siltation has reduced dam
in suspended sediment concentrations in reservoirs requires the use
storage capacities and reduced the life span of dams. It is estimated
of primary clarifi cation procedures, which adds to the treatment cost
that 50 million m3 in storage capacity is lost annually, or about 0.5%
per cubic metre.
of the total design storage capacity of the existing dams (Box 5). To
date, a total of more than 820 million m3 of the total storage capacity
In a small fi shing village in the district of Hann (Dakar region), 35% of
has been lost (ONEM 2001). Morocco loses an estimated 22 000 ha of
the patients examined by physicians at the university hospital have
arable land annually. Deforestation contributes to this problem with
skin disease. It is believed that the skin disease is from marine water
an annual loss of 31 000 ha of forested land, of which more than two-
pollution due to industrial activity in the Hann Bay. A limited number of
thirds is used for fi rewood. The impact of soil erosion on water quality
cases of poisoning, mainly in children, have also been reported. These
is signifi cant (ONEM 2001).
problems were due to the grilled fi sh consumed by children (Dieng
pers. comm.).
Solid wastes
Household and industrial solids wastes are discharged directly into
The people aff ected are those who live near polluted water, the
rivers and the ocean which in turn results in the deterioration of water
people who consume fi sh or shellfi sh from polluted water bodies, and
quality. In Senegal, the amount of solid waste generated throughout
the people who swim in these waters. The number of communities
the country is estimated to be 744 250 tonnes per year, of which
aff ected and their size, the degree of severity and the frequency and
280 000 tonnes are generated in Dakar (JICA 1999). Due to the lack
duration have been judged to be limited, and were considered slight
of household waste collection, most domestic wastes remain in
in both two sub-systems.
the streets, open canals or illicit dumpsites throughout the city. The
problem also aff ects the coastal beaches, giving rise to public concern
Conclusions and future outlook
about recreational use.
For the last decade there has been growing concern about water
quality and pollution in general in the region. But governmental
The quantity of municipal wastes generated per inhabitant per day
authorities are to a certain degree much more concerned with water
ranges between 0.4 and 0.9 kg/inhabitant/day in Morocco, where solid
quantity and supply and other social problems. This lack of concern
waste collection ranges from virtually nonexistent in rural areas to as
and therefore mitigation will likely lead to the deterioration of water
much as 85% in the major cities of Casablanca and Rabat. The rate of
supplies due to urbanisation, migration, a greater concentration of
waste collection is relatively satisfactory, and could range between 70
population and industries, intensifi cation of agricultural production,
to 90% (ONEM 2001).
an increase in irrigated areas and poor land use practices upstream of
the diff erent major basins in the region. Pollution in the Canary Current
ASSESSMENT
31
region will therefore worsen over the next 20 years. The environment
In the Canary Current North sub-system, lakes in the Atlas Mountains,
impacts of this pollution will be moderate to severe. It is expected that
for example, are drying up very fast due to natural and anthropogenic
problems resulting from pollution from eutrophication, microbiological
causes (ONEM 2001).
and chemical sources, solid wastes and suspended solids will worsen
the most.
Modifi cation of ecosystem or ecotones
Ecosystems that have not been destroyed are being modifi ed because
of continuing human activities. Examples include: modifi cation of the
tannes (wetlands) in Senegal, and the proliferation of rodents and
Habitat and community
aquatic weeds in the Senegal River Basin valley.
modification
The main change recorded for mangrove forests is its reduction in
T
T
C
C
A
A
area, which is due to sulfato-acid soils. These soils are responsible for
IMP
Canary Current North
IMP
Canary Current South
the replacement of mangroves by tannes (salted soils) in the Saloum
There has been considerable loss and degradation of both aquatic and
estuary in southwestern Senegal. This is observed mainly in the central
terrestrial habitats in the region during the last two to three decades.
and eastern parts of the estuary where the number of dead mangrove
The impact has been partly due to natural factors such as drought but
increases until they completely disappear after Foundiougne. Together
signifi cantly due to human activities such as poor and unsustainable
with this reduction in the area, there is a reduction in tree size (Diouf
agricultural practices, urbanisation, mining, industrial development and
1996). The mangrove in Casamance has retreated since 1970, although
other natural resources use.
the fi gures are diff erent depending on the authors. Sall (1982) observed
that between 1973 and 1979 the area of tannes had increased by
Environmental impacts
107 km2 while the mangrove area was reduced by 87 km2. On the other
Loss of ecosystems or ecotones
hand, Marius (1985) estimated that 70 to 80% of the Rhizophora had
Despite being among the most biologically productive ecosystems in
disappeared since 1979. Badiane (1986) indicated a reduction of the
Africa, wetlands are often regarded locally as wastelands, habitats for
mangrove area which had occupied between about 1 200 km2 before
pests and threats to public health or as potential areas for agriculture.
1968-1970 to 930 km2 in 1973 and 830 km2 in 1983. The Rhizophora were
As a result many wetlands are being lost (UNEP 2002). The combined
partly replaced by Avicennia but this species was fi nally reduced by
eff ect of drought and ever-increasing human activities (aff orestation,
hypersalinity.
deforestation, alien encroachment, overgrazing, and river regulation
aff ecting and reducing water supply for riparian vegetation) has
According to Rue (1994), the observed retreat of the mangroves in
contributed to the loss of specifi c types of wetland habitats; marshes,
Senegal could be related to the weakness of the fl uviatile behavior of
swamps, and mangroves over the past two to four decades.
the rivers (linked to the diminution of freshwater fl ow, itself induced
by the prolonged drought) that induces the growth of sand spits that
To date, approximately 30% surface area of these and other wetland
delimit the estuaries, thus diminishing the entrance of seawater into the
habitats have been permanent destroyed in the Canary Current
estuary. This, in turn, favours salt penetration in the soils thus allowing
South sub-system (UNEP 2002). Examples of these include: the Niayes
the development of tannes. It also limits the possible extension of the
wetlands in Senegal, lakes in The Gambia and Senegal, and mangroves
mangroves as well as the area able to be inundated. This, combined
in Senegal (Sine Saloum). In Mauritania, wetlands ecosystems such as
with a lack of pelitic infl ow, contributes to the reduction of the area
pools and creeks have disappeared.
covered by mangroves.
The combined impacts of human activities and drought on these
Another modifi cation of the mangrove community in the estuarine
types of habitats are quite signifi cant. Due to prolonged droughts in
system of Senegal was observed due to the breaching of the Sangomar
the northern and interior part of the region, open and running water
sand spit in 1987. Signifi cant quantities of sands coming from the coastal
ecosystems have suff ered tremendous losses (Tandia & Dieng 2001).
erosion of the ocean side of the spit accumulated partly in the external
Eutrophic lakes in particular, have disappeared. In the Canary Current
fringe of the mangroves, just in front of the new mouth. This substrate
South sub-system, most eutrophic lakes (except those lakes close to or
change is responsible for the death of the mangroves. In addition, data
in contact with Senegal River) have disappeared.
indicate the extension of water lilies in estuaries and bays, particularly
32
GIWA REGIONA ASSESSMENT 41 CANARY CURRENT
due to fl ow alteration and reduction, along with the frequency, intensity
damage to fi sheries and tourism, and high costs in terms of loss of water
and timing of fl ood events, inappropriate development, pollution
quality. Finally, losses or transformation of wetlands leads to shortage
from a number of sources, and overexploitation, all contribute to the
of wood for fuel, which is very vital to the majority of households in
modifi cation of estuarine systems in the region (UNEP 2002).
rural areas of the region. The size of the population aff ected is very
important since all the countries in the region are relying mainly on
In the Canary Current North sub-system, continental wetlands in
agriculture. The degree of impact is diff erent according to the area
Morocco are being degraded, and marshlands in the northwestern
within the region or even within the country. In the northern Senegal
part of the country (the Gharb area) and Sebkha in the southwest (Draa
valley, ecosystem loss greatly aff ects agriculture (animal husbandry).
area) have dried up and been cultivated (ONEM 2001). In addition, there
In other regions in Senegal, the energy sector is aff ected due to wood
is some evidence of change in species composition resulting from
loss. The loss of natural ecosystems that attract tourists costs these
species extinction or introduction. Reports indicate the extension in
countries dearly.
the 1970s of two well-known bird species, one of which is the rosy
fl amingo (Phoenicopterus rubber) in the Iriki water empoundment in the
Wetlands and other aquatic as well as terrestrial resources are the
lower Draa River valley due the construction of El Mansour Eddahbi Dam
sources of livelihoods for majority of people in the region, so any
upstream (ONEM 2001). In the case of certain lagoons in the Atlantic
type of impact translates to the loss of livelihoods and suff ering, even
Ocean there has been a progressive extinction of certain endemic algae
illness. Loss and degradation of habitats compromises water quality as
species such as Psidona oceanica due to proliferation of Caulerpa prolifera.
wetlands generally act as sinks for pollutants from land-based activities.
Another example is the introduction of a red algae species (Antithamnion
These impacts in turn escalate health problems.
algeriensis and Asparagopsis armata) in certain lagoons (ONEM 2001).
Against this backdrop, the assessment recognised that a greater
Because of this ecosystem and ecotone modifi cation, several species
percentage of the population in the Canary Current South sub-system
are being threatened. Table 12 shows the number of endangered
suff er from these impacts as compared to the North. Intestinal bilharzia
species in the respective countries of the region.
in Senegal, for example, erupted after the construction of Antisel Dam at
Diama, because the dam created favorable conditions for the mollusks
Table 12
Threatened species in the Canary Current region.
that are the intermediate hosts for the organism. The infection can
result in some hepatic complications for children and adults. The risks
Taxonomic group
of complication are linked to the intensity of the infection; serious
Country
Other
Mammals Birds Reptiles Amphibian Fishes Mollusks inverte- Plants Total
pathologies have tendency to be concentrated in communities where
brates
the prevalence of the organism is greatest. In certain villages along
Cape Verde
3
2
0
0
1
0
0
2
8
the Senegal River, infections can sometimes reach a rate of 75%, as is
Guinea
12
10
1
1
0
0
3
21
48
the case in Richard Toll, a village close to Lake Guiers (Tandia & Dieng
Guinea Bissau
3
0
1
0
1
0
1
4
10
2001). Urinary bilharzias associated with complications of impotence
Mali
13
4
1
0
1
0
0
6
25
among men and sterility among women is widespread particularly in
Mauritania
10
2
2
0
0
0
0
0
14
Tambacounda region, where 385 982 inhabitants (with a prevalence
Morocco
16
9
2
0
1
0
7
2
37
rate of 80%) are aff ected (Tandia & Dieng 2001). Onchocercciasis is
Senegal
12
4
6
0
1
0
0
7
30
widespread southeast of Tambacounda, Kolda, in an area that includes
The Gambia
3
2
1
0
1
0
0
3
10
456 villages. The disease is caused by organisms whose larvae develop
(Source: IUCN 2002)
in running water. In Senegal, 200 000 people are exposed, 65 000
are infested and 2 800 are blind. In Guinea, out of 510 000 recorded
Socio economic impacts
cases, 9 000 are blind; in Guinea-Bissau, out of 3 300 cases recorded,
Loss of wetlands usually means the loss of vital functions they play
100 are blind; and in Mali, out of 196 000 cases recorded, 2 700 are
in nature vis-Ó-vis, spawning areas for fi sh, improving water quality
blind (Tandia & Dieng 2001). Trypanosomes are re-emerging in certain
through the purifi cation mechanisms, and other ecological functions.
countries where it had disappeared. Changes in the ecosystem have
All these losses translate into high economic costs for the national
created a favorable environment for the tsetse fl y. Currently the disease
as well as household economies. Similarly, loss or modifi cations of
is widespread in Guinea-Bissau.
wetlands translate to losses of revenue from livestock, wildlife losses,
ASSESSMENT
33
In the Canary Current South sub-system, the impacts are signifi cant,
International eff orts to conserve natural habitats have been very
because of the large numbers of aff ected people, and the sectors
successful in these countries, mainly as a result of ratifi cation of the
that are involved. These impacts include: migration (occasionally
Ramsar Convention, and the Convention on Biological Diversity. There
even transboundary migration), confl icts, and settling of nomads. In
are eight Biosphere Reserves in the region, four World Heritage Sites, and
Mauritania for example, the number of nomads decreased from 60%
18 Ramsar sites. Many more sites are proposed for protection (Hegazy et
to less than 5% in less than 15 years (Diop 2001).
al. 2001). However, in spite of such eff orts, the total area offi
cially declared
as protected in the region remains less than the international target of
Conclusions and future outlook
10%, although some countries are aiming to increase their protected
Some habitats and communities are already lost, so that the remaining
areas to more than 15% within the next three decades.
are becoming more important for the region. A social awareness
about marine resources is starting to develop, helping to stop
their degradation. As regards continental habitats and ecosystems,
conservation areas are being created and some restoration is taking
Unsustainable exploitation of
place in the currently degraded areas. The majority of the countries in
fish and other living resources
the region are altering their regulations and have already adhered to or
T
T
are in the process of adhering to international conventions. For example,
C
C
A
A
IMP
Canary Current North
IMP
Canary Current South
Morocco has already ratifi ed the Convention on Biological Diversity and
50 others conventions related to the preservation of the environment
Fishing activities in the region have increased for the last three decades
such as the International Trade Convention on Endangered Species,
with the pressure from the industrial and traditional fl otilla from
Ramsar, and Framework Convention on Climatic Change to name just
European and Asian countries as well as from fl eets originating in the
a few (see Table 7). The Task team that evaluated the environmental
respective countries themselves (Figure 9). The marine fi sheries sector
impacts of habitat and community modifi cation knows as a result of this
in the region is characterised by operations at industrial and artisanal
that an improvement over the next 20 years can be expected but the
levels which target pelagic and demersal stocks. These stocks constitute
impacts of the current degradation will likely still be moderate.
vital renewable natural resources that provide food and income for local
populations, revenues for the national governments, foreign exchange
The countries in the region have responded to the problems of habitat
earnings as well as employment opportunities.
loss by placing natural areas under protection. However, the number
and size of protected areas varies from country to country. At present
Environmental impacts
there are 42 national terrestrial protected areas in the region, with a
Overexploitation
combined area of more than 5.5 million ha and 30 marine protected
Overexploitation currently constitutes a major issue in the majority
areas (World Bank 2001). Details of national and international protected
of the countries in the Canary Current region. Fish catches in many
areas are given in Table 13.
countries of the region have shown a systematic decline since 1974.
Table 13
National and international protected areas in the Canary Current region.
National protected area
International protected area
Country
Terrestrial
Marine
Biosphere Reserves
World Heritage Sites
Ramsar Sites
Number
Area (ha)
Land area (%)
Number
Number
Area (ha)
Number
Area (ha)
Number
Area (ha)
Gambia
6
23 000
2
5
0
0
0
0
1
20 000
Guinea
3
164 000
0.7
1
2
133 000
1
13 000
6
225 000
Guinea Bissau
0
0
0
2
1
110 000
0
0
1
39 000
Mauritania
9
1 746 000
1.7
5
0
0
1
1 200 000
2
1 231 000
Morocco
12
317 000
0.7
10
2
ND
0
0
4
14 000
Senegal
12
2 181 000
11.1
7
3
1 094 000
2
929 000
4
100 000
Total
42
4 431 000
16
30
8
1 337 000
4
2 142 000
18
1 629 000
Note: ND = No Data. Data not available for Cape Verde. Some Biosphere Reserves are also World Heritage Sites or Ramsar sites.
(Source: Ramsar 2002, UNDP 2000, UNESCO 2002, World Bank 2001)
34
GIWA REGIONA ASSESSMENT 41 CANARY CURRENT
Table 16
Fishing potential and exploitation of the main stocks in
3
Cape Verde.
Other countries
Latvia
Estimated total allowable catch
Expansion potential
Norway
Stock
(tonnes)
(tonnes)
2.5
Gambia
Germany
Tuna species
25 000-30 000
17 500-22 500
Netherlands
Greece
Portugal
2
Small pelagics
10 000-12 000
7 600-9 600
Poland
Korea (South)
Italy
Dermesal
3 000-5 000
2 100-4 100
Japan
1.5
Romania
Lobster
50-70
Fully exploited
(million tonnes)
Other nei
Mauritania
Ukraine
Total
38 000-47 000
27 200-36 200
Catch
1
Russian Federation
(Source: INDP 1999 in Fonseca 2000)
Spain
Senegal
Morocco
0.5
USSR (former)
Table 17
Fishing potential and exploitation status of fi sh stocks
in waters off Senegal and Mauritania.
0
Senegal
Mauritania
Fish stock
1950
1955
1960
1965
1970
1975
1980
1985
1990
1995
2000
(tonnes)
(tonnes)
Year
Large pelagics
15 000-20 000
Fully exploited
1 000
ND
Figure 9
Fish catch in the Canary Current Large Marine
Small pelagics
200 000-450 000 Moderately exploited
800 000
Moderately exploited
Ecosystem.
Dermesal
130 000
Slightly overexploited
12 800
Slightly overexploited
(Source: LME2005)
Total
545 000-700 000
813 800
Note: ND = No Data.
(Source: FAO 1997 in Fonseca 2000)
Uncontrolled exploitation of the fi sheries by foreign vessels is also
leading to the depletion of some fi sh stocks. It has also been observed
Discussions between the European Community and a number of the
that the Gambian dermesal production over the past decade has been
countries in the region for the renewal of fi shing agreements are under
near and even above the 15 000-17 000 tonnes MSY set for dermesal
way. With the exception of Cape Verde (Table 16), the intensifi cation
fi sh (Tables 14 and 15).
of fi shing activities in the region has had a drastic impact on the state
of fi sheries resources such as pelagic fi sh, which notably underwent
Table 14
Maximum sustainable yield for fi sh stocks in
a strong decline in productivity (Table 17). The infection of coastal
Gambia, 1997.
waterways by fl oating weeds has also led to a decline in fi sheries
Maximum sustainable yield
Stocks
activities due to clogging of waterways, estuaries and lagoons.
(tonnes)
Pelagics
65 000-75 000
Stocks in Senegal and Morocco have also experienced overexploitation.
Dermesals
15 000-17 000
Figures 10 and 11 illustrate the fi shing eff ort as well as the catch for the
Crustaceans & other shell fishes
1 000
Pink shrimp (Parapenaeus longirostis). The recorded landings of Moroccan
Total
80 000-92 000
fi sheries in the Atlantic increased by a factor of two from 1950 (139 700
(Source: Gambia Fisheries Department 2002)
tonnes) to 1974 (264 300 tonnes) and a factor of fi ve from 1950 to 1998
(708 700 tonnes). This substantial increase was due to increase in the
Table 15
Fish production in Gambia 1990-1999.
fi shing eff ort for all fl eets (small-scale, coastal and industrial) and to
Industrial production
Artisanal production
Total
Year
(tonnes)
(tonnes
(tonnes
the addition of the Western Sahara catches in 1975. During the period
1990
18 486
2 793
21 279
1985-1998 demersal species were dominants; their catch increased
1991
19 564
2 087
21 651
from 5 400 tonnes in 1985 to 23 700 tonnes in 1998. The octopus catch
1992
4 822
1 312
6 134
increased from 3 000 tonnes in 1993 to 15 000 tonnes in 1998. The
1993
6 843
2 519
9 362
catch of sparids (Seabreams) decreased from 13 124 tonnes in 1984 to
1994
6 767
2 398
9 165
3 240 tonnes in 1998, suggesting that these species may be overfi shed.
1995
6 049
85 170
11 219
The total catch of small pelagic species in Morocco increased from 110 800
1996
7 302
6 172
13 475
tonnes in 1995 to 485 500 tonnes in 1998 (Baddyr & GuÚnette 1998).
1997
6 131
6 673
12 803
For more fi gures and data on overexploitation in the Canary Current
1998
5 043
3 507
8 550
(Source: Gambia Fisheries Department 2002)
region, please refer to the Causal chain and policy option sections.
ASSESSMENT
35
Table 18
Unreported landings and discards in Morocco.
20 000
18 000
Unreported landing and discard
Guinea-Bissau
16 000
Fleet
Fishery
Senegal/Gambia
14 000
Mauritania
1970s
1980s
1990s
12 000
Morocco
onnes)
Unreported landings (% of total landing)
(t 10 000
h
8 000
47-60
23
23
Catc
6 000
Coastal
All
(El Mamoun 1999,
(Assumed)
(El Hannach , 1986)
4 000
Durand 1995)
2 000
47
47-60
0
Industrial
All
ND
1980 1982 1984 1986 1988 1990 1992 1994 1996 1998 2000 2002
(Assumed)
(Durand 1995)
Year
Discards (%of total catch)
Figure 10 Catch of Pink shrimp (Parapenaeus longirostis) in the
4
4
Pelagic
ND
Canary Current region.
(Assumed)
(El Mamoun 1999)
Coastal
(Source: Diop 2001)
12
Dermesal
ND
ND
(El Mamoun 1999)
Dermesal
66
46
30
Industrial
trawlers
(Balguerias 1997)
(Balguerias 1997)
(Haddad 1994)
Note: ND = No Data.
80 000
Morocco
(Source: Baddyr & GuÚnette 1998)
70 000
Mauritania
Senegal/Gambia
60 000
s)
y
Guinea-Bissau
50 000
time as the human population increased, and refrigerated transport
t
(da
or 40 000
facilities increased.
30 000
ishing eff
F 20 000
Studies of discards in the Atlantic Coast of Morocco for the Spanish
10 000
cephalopod commercial trawl fi shery documented large rates of
discards (Balgueiras 1997). The species composition of the discards
0
1980
1982
1984 1986
1988
1990
1992
1994
1996 1998
2000
2002
was dominated by invertebrates other than cephalopods (16-28%),
Year
Sea breams (4-9%), Elasmobranchs (5%), Triglidae (Searobins, 10%)
Figure 11 Fishing
eff ort for Pink shrimp (Parapenaeus longirostis)
in the Canary Current region.
and various other dermesal species (Haddad 1994). In comparison,
(Source: Diop 2001)
Mauritania cephalopod trawlers fi shing in Mauritania and Senegal
were found to discard 72% and 60-75% of their catch respectively, while
Excessive by-catch and discards
the Senegalese mixed fl eet (which was targeting fi nfi sh and shrimp
By-catch and discards are mostly caused by the use of net types that
in shallow waters) had a discard rate of 67% (Balguerias 1997). As an
capture fi shes that are later considered to be undesirable, a problem
indication of the changes in the shrimp fi sheries, Senegalese shrimp
that is especially common in traditional fi shing. Table 18 shows the
trawlers operating in Senegal and Guinea are thought to have discarded
percentage of unreported landings and the discard rate by decade in
38.5% of their catch in the mid-1980s (Baddyr & GuÚnette 1998).
the case of Morocco. In 1984, the unreported landing of the coastal
fi sheries was estimated at 23% of the total reported landings in the
Destructive fi shing practices
port of Tangier, Casablanca and Agadir (El Hannach 1986). In 1999, a
The use of destructive fi shing practices such as explosives and
study using direct observations and a fi shers' survey described the
inappropriate nets have been reported in the region (Deme et al.
illegal trading of fi shery products (El Mamoun 1999) and showed
2001, Dahou & Deme 2001). In spite of a prohibition against their
that, except for Tangier, landings arrived from boats or transiting
use, explosives are employed by some fi shers in the region, causing
through ports are reported in a larger proportion (30-60%) than
serious damage to the resource and to the environment. The use of the
those being transported by trucks (12%). Underreporting seemed to
dynamite destroys the rocky zones that provide an essential breeding
be more important for cephalopods and crustaceans. The diff erence
place for many species. In the same way, although prohibited by
between the results obtained in 1984 and 1999 is large and most
regulations, nets manufactured from monofi laments and multi-
likely corresponds to a change in social and economic incentives in
monofi laments elements are still in use in the artisanal fi shing in the
Morocco. Prior to the 1990s fi sh were not consumed much by the local
region. These nets are non-biodegradable and quite often are left
population, thus the opportunity to sell fi sh locally and directly was
in the ocean. Finally, the use of non-selective gear and small mesh
scarce. In the 1990s demand for fi sh increased sharply at the same
size and the lack of respect for minimum fi sh weights accentuates
36
GIWA REGIONA ASSESSMENT 41 CANARY CURRENT
the overexploitation of fi sh resources in the region. Consequently,
Unsustainable exploitation of fi sh leads to a decrease in the commercial
fi sh catches have decreased, prices for the producer have increased,
viability of fi shing activities, and results in unemployment, particularly
local markets suff er disruptions in supplies, household food security is
for younger people, who may fi nd themselves without any job
threatened, and the tensions between socio-professional categories for
opportunities. This condition results in increased cases of delinquency
the access to the products has increased.
and poverty. Loss of employment in the fi shery sector in Senegal may
be as high as 80%. Unsustainable exploitation of fi sh also leads to bitter
Socio-economic impacts
competition among diff erent user groups (Deme et al. 2001).
The economic diffi
culties caused by unsustainable exploitation of
living resources are considerable given the fact that fi sheries is an
Conclusion and future outlook
important sector in the economy of the region. Fisheries provide
The major issue in the Canary Current region is presently
substantial momentum for the GDP of the various countries. Similarly,
overexploitation. Most if not all the coastal countries are already taking
its contribution at the household level is signifi cant in terms of
steps in terms of regulating the use of the fi sh stocks at the national
employment, food and trade. Additionally, changes or losses in this
and international level as demonstrated by discussions with the
sector can have severe repercussions for human health. Approximately
European Community regarding the renewal of fi shing agreements
two thirds of the population of the Canary Current region lives in the
with the diff erent countries in the region. All these countries have
coastal zone, and particularly in cities located on the Atlantic coastline.
determined that there is overexploitation of their fi sh stocks and have
This heavy concentration is dictated by the search for employment that
therefore determined that the ecosystem needs a rest. In addition,
is readily available in industry, particularly the marine fi shing industry.
government fi sheries institutions that used to be departments in
the Ministry of Agriculture have been elevated to the status of their
Unsustainable exploitation of living resources harms the fi sheries
own Ministry of Fisheries. In addition, there is a growing concern
sector and leads to unacceptable levels of environmental degradation.
and awareness of the need for conserving fi sheries and improving
Considerable numbers of people are employed in this sector, such
management and control. In the region, fi sheries authorities have
as fi shermen, traders and processors, the majority of whom bear the
instituted certain policy measures to control industrial fi shing
burden of any environmental degradation. Degradation in the sector
pressure by reducing the fi shing eff ort. Since the beginning of the
translates into signifi cant negative impacts on employment. Loss of
1990s, governments have been implementing a policy of gradually
employment translates into impoverishment and suff ering of people,
reducing the number of licenses issued annually to fi shing vessels.
mostly among vulnerable groups such as women, children and the
Table 19 shows an example from The Gambia.
elderly. Fish processing industries suff er when overexploitation takes
place because it means that these industries operate below capacity.
Table 19
Licensed vessels in Gambia 1993-1997.
There are negative impacts on state income, losses in the fi shing
Number of vessels
Type of vessel
industry, reduction of food supply, the increase in costs for inshore
1993 1994
1995
1996
1997
maritime surveillance, the loss of biological diversity and loss of
Tuna purse seiner
23
18
15
1
0
employment.
Tuna long liner
31
8
5
7
1
Shrimp trawler
30
16
15
17
9
Overexploitation of living resources results in a reduction of protein
sources, since the majority of fi sh are exploited for export, leaving a
Stern trawler
18
8
5
5
6
bare minimum for the local market. This in turn contributes to the
Pair trawler
0
0
2
6
3
accentuation of protein defi cits, particularly for small children, through
Total
101
50
42
36
19
nutritional diseases such as kwashiorkor (protein-caloric malnutrition
(Source: Gambia Fisheries Department 1998)
disease), which is a widespread problem in the Canary Current South
sub-system. This malnutrition is accentuated mostly in rural areas
In addition, there has been a regional eff ort among countries to
where livestock (sources of protein) are under severe threat from
coordinate their diff erent fi sheries regulations under the framework
droughts brought about by the vagaries of climate change. In the
of a committee called CSRP (Commission Sous RÚgionale des Pŕches/
Canary Current North sub-system, few people are aff ected by this
Under-Regional Fisheries Sub Committee). This committee includes
concern.
Mauritania, Senegal, The Gambia, Guinea, Cape Verde and Guinea-
Bissau.
ASSESSMENT
37
Global change
average about 20% of the GDP for the entire region (19% for Morocco,
20% for Senegal, and 26% for Mauritania). Based on these statistics, it is
T
T
C
C
A
A
clear that the single most serious economic impact of global change
IMP
Canary Current North
IMP
Canary Current South
is on agriculture. Fisheries are also aff ected, as are tourism and wildlife.
Environmental impacts
The public sectors aff ected include health, education and infrastructure
Changes in hydrological cycle and ocean circulation
(in the cases of fl ooding). Income from traditional agriculture, which
Although global model simulations project little signifi cant change to
relies on rainfall, has decreased by 10 to 15% in the last decades. Other
rainfall amount and its seasonal distribution in the region in the next
costs include: construction of dams and inter-basin transfer schemes
two decades, models of run-off show slight reductions over the whole
to supply water, the costs of alternative sources of water (especially by
area, especially around the Mediterranean, leading to reduced water
desalination), the costs of deepening wells and pumping. The diff erent
availability. Temperature increases will also increase water stress on crops
countries in the region have had to expend a great deal of eff ort and
across much of the region. Despite the fact that clear scientifi c evidence
money to alleviate the impact of the drought and the desertifi cation in
has yet to be provided, some analysists argue that drought frequency
order to limit migration, both within or out of the country.
and severity have already increased in conjunction with climate change
in the region, with dramatic impacts on water availability.
Drought results in habitat and community modifi cation (see section
above), which in turn aff ects human health by promoting increased
Predicted changes in rainfall amounts and distribution are much less
rates of urinary Bilharzias (with prevalences more than 80% in certain
reliable (Morton & Saer 2001). However, available information tends to
villages in the Senegal River valley and in Tabcounda region) (Tandia &
indicate that in recent decades, some parts of the region have become
Dieng 2001). This is equally true for other regions in Mali.
wetter while other parts are now drier than they used to be. In Morocco,
the rainfall pattern has varied with a rate of -7% to +0% in the northern
These impacts are felt by a large number of people: some migrate
region and about -7.5 to +2.8% in the southern part of the country.
(occasionally even transboundary), there are confl icts, and nomads may
be forced to abandon their lifestyle and settle down. In Mauritania, for
Sea level change
example, the number of nomads decreased from 60% to less than 5%
A recent review of the scientifi c basis for climate change in the region
in less than 15 years.
(Morton & Saer 2001) suggests that small increases in temperatures
across the region have occurred in recent decades, although lower
Conclusions and future outlook
than the global average median forecast of 0.35░C per decade, or
The impact of global change has a direct eff ect on freshwater.
0.7░C by 2020 for the region as a whole (Alibou 2002). In Morocco,
Freshwater shortage is therefore the main problem in most countries
the use of several simulation models predicts temperature increases
of the region. As predicted by the Intergovernmental Panel for Climate
on the order of 0.7 to 1░C by 2020 (Alibou 2002). As a result, sea level
Change model simulations (IPCC 2001), water scarcity may be severely
would rise between 2.6 and 15.6 cm during the period 1990-2020. In
problematic as a result of changing climatic patterns in the region, with
the Canary Current South sub-system, there is also some evidence of
dramatic eff ects on the availability of drinking water. Global change
sea level change, but without major harm to populations or organisms
would have a pervasive infl uence on future demand for, and supply and
(Alibou 2002). However, the GIWA Task team pointed out that advanced
quality of freshwater in the region, and would add to the pressure on
erosion on small islands and fl ooding at Saint Louis (Senegal) obliged
water and environment resources, as well as coastal systems currently
the authorities to build a protection dam. The same problem has been
under stress. The region's irrigation systems are also under stress. In
experienced by a community of fi shers in the zone of the Arguin Bench
nearly all countries of the region, irrigated agriculture is adversely
in Mauritania.
aff ected by salinity and waterlogged soils. It is estimated that in some
countries of the region, up to 50% of irrigated land suff ers from some
Socio-economic impacts
degree of salinity. Another issue is the overexploitation of groundwater.
The economic sectors mainly aff ected by drought are agriculture and
Indeed, global change would also aff ect the fauna and fl ora of habitats
fi sheries and to a lesser extent industry and tourism. The impact on the
in the region and result in a great loss of biodiversity.
agricultural sector is signifi cant since both crop and animal production
rely heavily on rainfall and changes in climate result in high variability
All sectors of the economy, environment and society may be vulnerable
and associated variability in yields. The agriculture sector contributes on
to one degree or another, where steps to increase the capacity to adapt
38
GIWA REGIONA ASSESSMENT 41 CANARY CURRENT
to greater climatic and hydrological variability, including more frequent
impacts that often have signifi cant transboundary implications. These
fl ood and drought extremes are required.
socio-economic impacts include the loss of agricultural income and
potential, the high costs associated with the construction of dams and
inter-basin transfer schemes to supply water, the costs of alternative
sources of water, and the cost of deepening wells and pumping,
Priority concerns for further
increases in water-borne diseases, and confl icts about water.
analysis
Unsustainable exploitation of living resources is also considered as a
Based upon this assessment, the main concerns and issues are
main concern in the Canary Current region. Most of the countries in
freshwater shortage (stream fl ow modifi cation, pollution of existing
the region bordering the Atlantic Ocean have important marine fi sh
supplies and change in water table) and the unsustainable exploitation
stocks. Fishing activities have increased for the last three decades with
of fi sh. The concerns were ranked in descending order of severity for the
pressure of fl eets from both the bordering countries as well as from the
two sub-systems as follows:
traditional and inustrial fl eets from European and Asian countries. The
eff orts of the state of the region to develop and use these fi sh stocks
Canary Current North
in a sustainable manner are limited by the lack of adequate manpower
1. Freshwater
shortage
and fi nancial and material resources.
2. Unsustainable exploitation of living resources
3. Pollution
4. Global change
5. Habitat and community modifi cation
Canary Current South
1. Freshwater
shortage
2. Unsustainable exploitation of living resources
3. Habitat and community modifi cation
4. Pollution
5. Global
change
The ranking was based on overall scoring. The Canary Current South
sub-system has been suff ering from water shortage problems
(modifi cation of stream fl ow) for the last three decades and will most
likely suff er in the next 20 years from water shortage. The annual
discharge of the Senegal River shows a period of signifi cant defi cit
after 1970. The percentage of reduction between the mean annual
discharge over the years before 1970 and the defi cient periods is more
than 40%. The same tendency has been also reported for other major
river basins in the region.
In the Canary Current North sub-system, the declining groundwater
base fl ow is a major issue that is linked to the long dry periods (more
than 30 years) that the region as a whole is experiencing. Data show that
in the last two decades, the average aquifer draw down in the Souss-
Massa River Basin varied from 0.5 to 1.5 m per year (CSEC 2001).
The environmental impacts of stream fl ow modifi cation, water regime
change and a dropping water table lead to very serious socio-economic
ASSESSMENT
39
Causal chain analysis
This section aims to identify the root causes of the environmental and socio-economic impacts resulting from those issues and concerns
that were prioritised during the assessment, so that appropriate policy interventions can be developed and focused where they will
yield the greatest benefi ts for the region. In order to achieve this aim, the analysis involves a step-by-step process that identifi es the
most important causal links between the environmental and socio-economic impacts, their immediate causes, the human activities
and economic sectors responsible and, fi nally, the root causes that determine the behaviour of those sectors. The GIWA Causal chain
analysis also recognises that, within each region, there is often enormous variation in capacity and great social, cultural, political and
environmental diversity. In order to ensure that the fi nal outcomes of the GIWA are viable options for future remediation, the Causal
chain analyses of the GIWA adopt relatively simple and practical analytical models and focus on specifi c sites within the region. For
further details, please refer to the chapter describing the GIWA methodology.
Stream flow modification ş
Senegal River Basin
The Senegal River Basin is located in West Africa and occupies an area
The management and the development of water resources in the
of roughly 475 000 km2 (Figure 3 in the Regional defi nition). The entire
Basin are carried out within the framework of the Organisation for the
Basin, including the upstream catchments, is drained by the 1 800
Development of the Senegal River Basin (OMVS), which represents
km-long Senegal River and its tributaries. The area of the River Basin
Mali, Mauritania and Senegal. During the last 30 years, important
accounts for about 1.6% of the African continent and lies within the
territory of four diff erent countries: Guinea, Mali, Mauritania and Senegal
Table 20
Countries in the Senegal River Basin.
(Table 20).
Country area within the Basin
% of the total
Country area
Country
area of the
(km2)
(km2)
%
country
The Basin is divided into three distinct regions; the upper basin lies in
Guinea
245 857
30 610
6.4
12.5
the mountains of Mali; the middle valley forms the 500 km long border
Mali
1 240 190
48 940
31.2
12.0
between Senegal and Mauritania; and the delta in the lower valley is
Mauritania
1 025 520
219 710
45.9
21.4
where the Senegal River discharges into the Atlantic Ocean. The delta
Senegal
196 720
78 680
16.5
40.0
is about 80 km long and consists of numerous estuaries that form a
Senegal River Basin
477 940
100
complex canal system.
(Source: Finger & Teodoru 2003, EROS Data Center 2003, ESRI 2002)
40
GIWA REGIONA ASSESSMENT 41 CANARY CURRENT
actions have been conducted, particularly the implementation of the
Table 21
Rainfall in the Senegal River Basin.
hydroagricultural and the hydroelectric infrastructures as well as the
Average annual rainfall in the Basin (mm)
extension of urban areas. The consequences of these actions have been
Country
Min
Max
Mean
a reduction of freshwater resources linked to the modifi cations of the
Guinea
1 120
2 100
1 475
observed regime of the River as well as deterioration of water quality
Mali
455
1 410
855
and the lowering of the groundwater table.
Mauritania
55
600
270
Senegal
270
1 340
520
(Source: Finger & Teodoru 2003)
System description
valley and the delta, it is generally low and exceeds rarely more than
The Senegal River is the second largest river in West Africa. It is formed
500 mm per year (Table 21) (Finger & Teodoru 2003). Flooding can occur
by the confl uence of two smaller rivers, the Bafi ng and the Bakoye,
during the high fl ow period between June and October. During this
which occurs near BafoulabÚ in Mali, about 1 083 km from the Atlantic
high water period, the River overfl ows its banks and fl oods the broad
Ocean. Downstream of BafoulabÚ the River fl ows northwest, crossing
alluvial plain of the middle valley. This has enabled farmers to grow
the arid lands of western Mali. About 200 km further downstream,
crops during the dry season, after the waters have receded and the
the FalÚmÚ River gushes into the Senegal River. From this point on
low-water period has started. In areas of low rainfall, the River's annual
the Senegal River forms a natural border between Mauritania and
fl ood is a necessity to life.
Senegal fl owing westwards towards the Atlantic Ocean. All three main
tributaries of the Senegal River (the Bafi ng, Bakoye and FalÚmÚ) have
The fl ow rate of the River depends mainly upon events in the upper
their sources in the Fouta Djallon Mountains of Guinea and in the
basin in Guinea, which is, hydrologically speaking, the most active part
southwestern part of Mali. Several other small tributaries, originating
of the Basin. The total annual discharge leaving Guinea is estimated at
in Mauritania, also discharge into the Senegal River. One of them, the
about 8 km3, with an increase as a result of the infl ow of the diff erent
Karakoro River, enters the Senegal River at more or less the same point
tributaries of up to 20 km3 by the time the River reaches the meeting
as the FalÚmÚ River. About 200 km further downstream, the Gorgol
point at the juncture of Mali, Mauritania and Senegal (SGPRE 1994). The
River enters the Senegal River. Downstream from Bakel, the River does
mean annual discharge and volume of the main tributaries are shown
not have any more important tributaries. The slope of the streambed
in Table 22.
decreases gradually until the River is essentially fl at in the valley and
the delta. This area is characterised by a broad fl ood plain and many
Table 22
Hydrological characteristics of the main tributaries of
depressions supplied by the river fl ow: Lake Guiers, Lake R'kiz, Three
the Senegal River.
Backwaters and Djoudj. The Senegal River discharges in the Atlantic
Outlet/control
Mean annual
River
Mean volume (km3)
station
discharge (m3/s)
Ocean downstream from St Louis City.
Bafing
Bafing Makana
271.0
8.55
Bakoye
Toukoto
58.4
1.84
The Senegal River Basin presents many geological, topographic, climatic
BaoulÚ
Siramakana
44.9
1.42
and hydrological contrasts due to its extension between latitudes
FalÚmÚ
Kidira
148.0
4.67
11░ N and 18░ N. The eastern and the southeastern parts of the Basin
Senegal Basin
Bakel
648.0
20.40
consist of geologic formation from the Precambrian era (Fouta Djallon
(Source: SGPRE 1994)
Mountains), characterised by impermeable rocks such as schists and
granites, and clay soils. The topography is undulating and the elevation
The Senegal river fl ow is controlled by two dams, the Diama and the
can exceed 1 000 m. To the west, elevations are relatively low and can
Manantali. The Diama Dam is located 30 km upstream of the city of
be below sea level.
St Louis. It was built in 1986 in order to stop the dry season intrusion
of seawater along the river bed. In fact during dry years, saltwater
The climatic regime in the Basin can be divided into three seasons:
could penetrate as far as 100 km inland, which makes the whole delta
a rainy season from June to September, a cold and dry season from
unsuitable for agriculture use (Gac 1986a & 1986b). The construction
October to February, and a hot and dry season from March to June.
of the Diama was supplemented by the damming of the upper left
Rainfall in the Basin can be as high as about 2 000 mm per year. In the
and right bank located between Rosso and Diama. The second dam,
CAUSAL CHAIN ANALYSIS
41
Issues
Immediate causes
Sectors/Activities
Root causes
Modification of
Demographic growth,
stream flow
Agriculture
Deforestation
urbanisation and
poverty
Lack of appropriate
Water supply
government
Damming and embarkement
Inefficient irrigation
Navigation
technology
Energy production
Natural causes
Reduced precipitation
Figure 12 Causal chain diagram illustrating the causal links for stream fl ow modifi cation in the Senegal River Basin.
the Manantali, was completed in 1988 and is located in Mali 1 200 km
Causal chain analysis
upstream from the Senegal River outlet. Its storage capacity is 12.8 km3.
It was built on the Bafi ng River, which supplies approximately 60% of the
During the period 1966 to 1970, a marked shift in the climate was
annual fl ow of the Senegal River in a reservoir (Gac 1986a,b).
observed. This gave rise to a prolonged drought characterised by a
reduction in the annual rainfall and in the length of the rainy season
The major development objectives assigned to the two dams are
(DaCosta 1993, Diouf 1996, Malou et al. 1998). The consequence was
(SGPRE 1994, OMVS/SOGED 2003):
a reduction in river discharges as well as an invasion of seawater in all
Regulate the River's discharge at a rate of 2 500 m3/s during the rainy
the estuaries. The mean annual discharge of Senegal River decreased
season to allow the traditional fl ood-recession farming;
from 25.9 billion m3 for the period 1903-1967 to 13.8 billion m3 for the
Regularisation of river fl ows to 300 m3/s at Bakel;
period 1968-1999, indicating a trend in the reduction of stream fl ows
Irrigate 375 000 ha of former fl oodplain for two crops per year,
since about 1967 (SGPRE/PNUE/DHI/TROPIS 2002).
especially for rice production;
Produce hydropower (800 GWh per year);
The main issues addressed in the analysis of the freshwater shortage
Provide a 1 500 km transport line network to assure energy delivery
in the Senegal River Basin concern stream fl ow modifi cation. In reality
to inter-connected networks in the three member states;
there are two types of modifi cation: (i) the reduction of river discharges
Make the River navigable all year round between Saint Louis at the
due to the drought, leading to an intrusion of the river by seawater;
river mouth and AmbibÚdi in Mali (about 900 km).
and (ii) a reduction/exclusion of seawater intrusion in the river due to
damming. The fi rst type of modifi cation is natural, while the second
In 1988, the population of the Basin was 1.55 million inhabitants,
one is artifi cial. This reduction of seawater has been superimposed on
including 767
000 Senegalese, 696
000 Mauritanians and the reductions in river fl ow due to the drought, with the combination
80 000 Malians (OMVS/SOGED 2003). With a growth rate of 2.2%,
now characteristic of the Senegal River Delta. Therefore, the focus of
the population in 2000 was a little bit over 2 million inhabitants.
the causal chain analysis will be on the damming of the River, with the
The population is concentrated mainly in rural areas; however
drought considered as an immediate cause. Figure 12 illustrates the
recent demographic trends show a tendency for an increase in the
causal links for stream fl ow modifi cation in the Senegal River Basin.
urban population. A large ethnic diversity characterises the Basin's
population, with Peuls, Toucouleurs, Soninkes, Malinkes, Bambaras,
Environmental and socio-economic impacts
Wolofs and Moors. However, there is an internal migratory fl ow
Reduced wetland areas (Ndiael, Djoudj) and the risk of losses in
(periodic transhumance towards the pastures) and an external
biological diversity
migratory fl ow towards to the cities or even outside the countries,
The persistence of the drought, the road and hydraulic infrastructure
particularly towards Europe (OMVS/SOGED 2003).
installations have resulted in a reduction in wet areas. This is
accompanied by important biodiversity losses (SGPRE/PNUE/DHI/
TROPIS 2002). The Ndiael reserve, classifi ed as a Ramsar site, has been
42
GIWA REGIONA ASSESSMENT 41 CANARY CURRENT
drying out, with the socio-economic and environmental consequences
Flooding of St Louis City
being vegetation degradation, wind erosion, tannes formation,
With the reduction in the cross-section of the river mouth due to
reduction in biodiversity (particularly in icthyofauna and avifauna) and
sediments, fl oods have become more frequent in St Louis, most
a loss of breeding grounds for migratory birds.
recently in 1999 and 2003. During the most recent fl ood in 2003, the
authorities were obliged to open a channel to dump excess water
Water quality changes due to the accumulation of salt and
into the ocean. During fl ood periods in St Louis there is a rise in the
pollutants
groundwater level mainly due to soil saturation and the stagnation
The deterioration of water quality becomes a problem of primary
of run-off . In Lake Guiers, this rise in water levels is at the origin of the
importance for the delta because of drainage from irrigated areas or
destruction of the embankment and fl ooding of tracks, houses and
water stagnation, inappropriate domestic use, the mismanagement of
irrigated perimeters.
solid waste, the discharge of industrial waste water from Senegalese
Sugar Company factory into Lake Guiers as well as the proliferation of
Groundwater level rise and soil salinisation
aquatic plants. The lack of an appropriate discharge outlet in low Ferlo
An increase in soil salinity has been observed in some badly drained
and a high evaporation rate has resulted in a salt accumulation in Lake
cultivated perimeters and certain wastewater discharge basins. In
Guiers. Data indicate that salt concentration in the Lake can reach as
irrigated areas, water losses generated by less effi
cient irrigation
much as 40 000 tonnes per year in the Lake Guiers/low Ferlo system
practices contribute to the rise in groundwater levels. In low Ferlo,
(SGPRE 1999). The aquatic plant proliferation has caused excessive
salinity can exceed 5 g/l because of industrial wastewater from the
evapotranspiration losses, which are estimated to be 3 billion m3 per
sugar factory, evaporation and lack of water circulation; this salinity
year (OMVS/SOGED 2003). Aquatic plants also constitute a tight curtain
makes the water quasi unusable.
that prevents access to water uses by the population.
Water-borne diseases
Reproduction areas not accessible to fi sh
The permanent presence of standing water in the valley and the
The absence of a fi sh ladder in the Diama Dam and the presence of
suppression of the periodic salt concentration increase favours the
gates and embankments prevent fi sh from migrating to spawning areas.
aquatic plants and pathogenic germs development. As a consequence,
This contributes to the reduction of the fi sh population of the River. The
the incidence of water-borne diseases already found in the area have
abrupt changes of water salinity related to the discharge of the Diama
increased. The diseases are malaria, urinary schistosomiasis, diarrhoea,
Dam are often the cause of fi sh mortality.
and intestinal parasitic diseases (Verhoef 1996). The delta has become
a hotbed of bilharzia and prevalence rates of 80% were observed in
Erosion and sedimentation
certain villages (SGPRE 1999).
During the last several years, strong erosion of the banks in the
Gandiolais area has been observed. There is also an accumulation of
Migration due to the loss of arable land
coarse sand sediments at the outlet of the River. Bank erosion is also
The cultivated area experienced a notable reduction because
widespread in the high river valley. Water and wind erosion are greatly
of abandonment of certain private areas where the irrigation
accentuated in the Basin and involve the progressive degradation of
infrastructure was rudimentary. The deterioration of the irrigation
the land and the loss of vegetation cover. Soil erosion and vegetation
infrastructure, soil salinisation due to the lack of drainage, and the
degradation in the River Basin result in run-off and the transport of
competition from imported agricultural products (such as rice) are the
sediments, and the appearance of laterite. Sediments deposited in the
causes of the abandonment of these perimeters and the associated
river outlet is one of the most frequent causes of fl ooding in St Louis
migration of farmers to other sectors or other places (Tandia & Dieng
City (SGPRE/PNUE/DHI/TROPIS 2002).
2001).
Loss of mangrove forest
Reduced access for transhumant cattle farmers
Downstream from Diama, marine dynamics prevails from December
There is a severe reduction in natural pasture areas due to the increase
to July. This increases the salinity and stresses the mangrove swamps.
of the irrigated perimeters. In addition, access to the River became very
With the loss of mangroves, the formerly fl ooded mud holes gradually
diffi
cult for cattle. This situation generates frequent confl icts between
turn into tannes (salted soils).
stockbreeders and farmers.
CAUSAL CHAIN ANALYSIS
43
Reduced freshwater fi shing potential
are dominant during the winter. The reinforcement of the trade winds
With the permanent standing freshwater, aquatic plants developed
at the beginning of the winter induces a delay of the rainy seasons,
to excess and now prevent access to the water. The Cattail (Typha
especially in the delta. The annual rainfall is highly variable, especially in
australis) constitutes a refuge and a spawning area for fi sh. However,
the northern part of the Basin. The coeffi
cient of variation reaches 0.41
the abundance of vegetation also constitutes an obstacle for fi shing.
in Dagana, 0.19 in KÚdougou and 0.25 at the center of Senegal in Bakel.
In addition, infrastructure installations represent obstacles for fi sh
The inter-annual average rainfall is 1 250 mm at KÚdougou, 489 mm at
migration to spawning areas.
Bakel and 282 mm at Dagana.
Reduced water access
Since 1968, there is a decrease in rainfall. Figure 13 shows that the
In spite of the water availability in the Basin, natural reservoirs and
average rainfall decreased from 370 mm (1892-1967) to 238 mm
lakes as well as irrigated perimeters are poorly supplied because of the
(1967-2000) in St Louis (SPRE/PNUE/DHI/TROPIS 2002). The same
following factors:
tendency has been observed at other stations such as Dagana and
Wind erosion and sediment deposits are abundant in the delta.
KÚdougou. It should be mentioned, however, that recent years have
They limit the transport capacity of the main waterways through
been characterised by a resumption of rainfall. For example, rainfall
the formation of dikes.
in St Louis exceeded 400 mm in 2000 and 1 500 mm in KÚdougou
Aquatic plants form an obstacle to stream fl ow.
in 2003.
The majority of the gates are obsolete and date back to 1940 or
1950. They were designed before the existence of the dams.
1 000
The water intake pipe is sometimes above the actual water
St Louis
7 yeras moving average
800
level.
Average 1989-1967
Average 1968-2000
(mm) 600
The results are that, during high fl ows, certain areas are fl ooded and
infall
a 400
others are subjected to a severe water defi cit in spite of their proximity
R
200
to the River. In the estuary, marine sediment deposits represent a
constraint for navigation.
0
1892 1900 1908 1916 1924 1932 1940 1948 1956 1964 1972 1980 1988 1996
Year
Immediate causes
Figure 13 Annual rainfall at St Louis 1892-2000.
Reduced precipitation
(Source: SGPRE/ PNUE/DHI/TROPIS 2002)
The Senegal River Basin presents important climatic contrasts because
of its extension between the tropical wet areas in the south and the
Damming and embankments
arid areas in the north, located at the limit of the Sahara. The climate of
Since 1988, the Senegal River has been regulated by the Diama
the Basin is marked by the rhythmical movements of the Inter-Tropical
Dam, with its embankments, and the Manantali Dam. The Diama
Front (ITF), which separates the monsoon from the harmattan. The
Dam serves to block seawater intrusion and thereby protects water
monsoon conveys humid air masses coming from the southwest from
and irrigation wells, and raises the level of the upstream water body,
the anticyclone of St Helene. These humid air masses are dominants in
creating reserves that enable irrigation and double cropping. The
the winter (May-June to October-November).
Manatali Dam is supposed to attenuate extreme fl oods, generate
electric power and store water in the wet season to augment dry-
The season is aff ected when the ITF moves up north. The rainfall is
season fl ow for the benefi t of irrigation and navigation. The water
very variable in the Basin, with a marked decrease towards the north
management objectives for these dams have been defi ned by the
(SGPRE 1994, Rochette 1975). Rainfall in the upper part of the Basin (the
Standing Water Committee (Commission Permanente des Eaux, CPE).
Guinean and Sahelian climatic domain) ranges from 1 300 to 2 000 mm
The instructions for water use are defi ned as satisfying the needs for
per year. In the valley and the delta, which belong to the Sahelian
various water uses while taking into account dams and population
climatic domain, annual rainfall varies from 200 to 800 mm. In dry
safety measures. In the rainy season, the objectives are to: (i) fi ll up
season (November-April), the Basin is subjected to the harmattan wind,
the Manantali Dam; (ii) augment dry-season fl ow for the benefi t
which blows from the northeast and brings hot and dry air masses. On
of irrigation and navigation; (iii) attenuate extreme fl oods; and (iv)
the coast, maritime trade winds blowing from the Azores anticyclone
produce electrical energy. In the dry season the goal is to: (i) support
44
GIWA REGIONA ASSESSMENT 41 CANARY CURRENT
and sustain low fl ows to allow seasonal and industrial cropping; (ii)
Table 23 Recession
fl ood farming area in the Senegal Basin in
supply drinking water for urban centres; and (iii) permit navigation
1987 before the damming of the River.
from the outlet of the River to Kayes.
Areas
Flooded area (ha)
Cultivated area (ha)
Collected area (ha)
Left bank
31 000
20 150
18 780
The blockage of salt intrusion has allowed the proliferation of aquatic
Right bank
27 000
19 170
17 200
plants and water-borne diseases. Recent studies undertaken by the
Upper part
4 500
1 125
810
Diama Dam Company (SOGED) show that invasive plants currently
Senegal River Basin
62 500
40 445
36 790
occupy 150 000 ha in the delta (OMVS/SOGED 2003). These species are
(Source: OMVS 2000)
mainly Cattail (Typha australis) and the Water salads.
damming of the river) irrigated areas covered almost 40 000 ha, located
Deforestation
mainly in the delta and the low valley, with another 2 700 ha in the area
In the Senegal River Basin, deforestation and soil degradation are major
of Lake R'kiz (OMVS 2000). Recession fl ood farming areas in the River
problems that tend to be widespread across the Basin. In the upper part,
Basin are shown in Table 23.
the valley and the delta, there is a decrease in the vegetation cover and
a loss of soil fertility, often due to anthropogenic causes. The results
It well recognised that the damming increased the availability of water
are an increase in stream fl ow and sediment transport. This creates
in the Basin. However, agriculture in the valley is currently faced with
fl ooding problems in the villages located near river tributaries and the
many problems, and the benefi ts from the dam are below expectation.
destruction of roads. The deforestation phenomenon is worsened by
This situation resulted mainly from the limited fi nancial capacity of
wind action, rainfall defi cits, increases in salinity and the lack of drainage
poorer residents, for whom the equipment investment is too costly. Rice
in the irrigated perimeters.
production decreased from 130 600 tonnes in 1994 to 85 300 tonnes in
1996. According to Devey (1997), this is due essentially to the fact that
Sector activities
the rice produced locally is less competitive with imported rice. Other
The construction of the Diama and Manantali dams on the Senegal River
diffi
culties are:
was designed to solve two main problems closely linked to the drought
The rate of irrigation infrastructure installation is low and does not
and its impacts: the availability of arable lands and water supply. The
reach 2 000 ha per year.
other two objectives assigned to these dams were the navigability
Crops produced (rice and onions) does not adequately meet food
between St Louis and Kayes and the production of hydroelectricity.
needs and must be supplemented with imports.
Agriculture is the major sector activity of concern, followed by water
The lack of professionalism and the low quality of the irrigation
supply, fl uvial transport and energy production.
infrastructure.
Agriculture
The development of the irrigated area since 1975 in the Senegal River
Agriculture is the main economic sector in Senegal and was for many
Basin is illustrated in Figure 14. Long-term projections are: 98 000 ha for
decades characterised by a quasi monopoly for peanut production.
Senegal in year 2010, 73 377 ha for Mauritania in year 2017 and 14 500 ha
Impacts of the drought combined with inadequate agricultural
for Mali in year 2025 (OMVS 2000).
practices resulted in a general degradation of the soils, particularly in
the "peanut basin" (ThiŔs, Diourbel, Kaolack and Fatick regions). The
140 000
persistence of the drought weakened peanut production, which is
Right bank
120 000
Left bank
solely dependent on rainfall. In the river valley, agriculture practiced
Upper basin
100 000
Total
mainly in fl ood prone areas ("waalo"), was compromised as a result of
(ha)
80 000
the decrease in the river discharge (Olivry 1983, Handschumacher et al.
Area
60 000
1992). In the Senegal River Basin, it is estimated that 400 000 ha of soils
40 000
were aff ected by salinisation (Sadio 1991). Consequently, it was decided
20 000
to build the Diama and Manantali dams.
0
1975 1977 1979 1981 1983 1985 1987 1989 1991 1993 1995 1997
Year
One of the objectives of the Senegal River damming was to allow the
Figure 14 Irrigated area in the Senegal River Basin 1975-1998.
development of irrigated crops, particularly rice. In 1987 (before the
(Source: OMVS 2000)
CAUSAL CHAIN ANALYSIS
45
Water supply
Table 24
Drinking water needs in the Senegal River Basin.
The second main objective of the Diama Dam was to ensure a water
1999
2010
2025
supply, especially for Dakar. Lake Guiers, with the Ngnith station pumps,
Area
m3/s
m3/day
m3/s
m3/day
m3/s
m3/day
provides a drinking water volume of 64 000 m3 per day for the city of
Dakar
0.76
64 000
2.38
199 000
2.35
199 000
Dakar. The construction of a new water treatment plant at Keur Momar
Sarr in the southern Lake Guiers is planned within the framework of the
Nouakchott
ND
ND
0.99
84 150
1.91
161 500
Long Term Water Project. The treatment plant is expected to provide an
Urban centres
1.18
99 491
1.31
110 999
1.52
128 866
additional volume of 65 000 m3/day during the fi rst phase of the project
Other areas
0.69
58 649
0.87
73 971
1.25
105 725
(2003-2007) and 135 000 m3 per day in the second phase (after 2008).
Total
2.63
222 140
5.55
468 120
7.03
59 091
ND = No Data.
(Source: OMVS 2000)
This increase in water supply volume will make it possible to stop the
overexploitation of groundwater resources of Dakar and ThiŔs. It is
also expected that 85% of water supply for the city of Nouakchott in
Table 25
Industrial water needs in Senegal River Basin.
Mauritania will be provided by the Senegal River, with the remaining
Company
Water needs (km3)
15% provided by the Trarza aquifer.
Senegalese Sugar Company (CSS)
549
Gold mining Company of Sadiola in Mali (SEMOS)
5 790
On the right bank of the River, the annual water supply production
Senegalese canning food Company (SOCAS)
549
for Rosso in 1999 was 584 000 m3, with a monthly average volume of
Total
6 888
48 600 m3. In the same year on the left bank of the River, the private
(Source: OMVS 2000)
Water Supply Company (SÚnÚgalaise des Eaux, SDE) supplied a total
of more than 27.5 million m3 of drinking water for St Louis, Richard Toll,
Dagana, Podor, Matam and Bakel. In the Malian part of the upper
Energy production
Senegal River Basin, the drinking water supply volume was close to
Forest product ; either fi rewood, 1.5 million tonnes, or charcoal,
2.7 million m3 in 1999.
330 000 tonnes per year, provide 61% of the energy used in Senegal,
followed by imported petroleum (37%). As early as 1981, new strategies
In 1999, the total drinking water supply for the population in the River
have been developed to try to change this energy consumption
Basin was 2.63 m3/s and it is expected to triple (7.03 m3/s) in year 2025
pattern (Devey 1997). The construction of the Manantali Dam is a
(OMVS 2000) (Table 24). The industrial water supply demand for the
part of this strategy. It allows the production of 800 GWh per year of
Senegal River Basin is about 6 888 km3 per year (Table 25). The main
hydroelectricity. This production is not totally consumed. Since 2001,
industrial companies are: the Senegalese Sugar Company (CSS), the
the diff erence is restored to the downstream of the dam to be used
Senegalese Canned Food company (SOCAS) located on the left bank,
for other needs.
and the gold mining Company of Sadiola (SEMOS) in Mali.
Root causes
Navigation
Demographic growth, urbanisation and poverty
Another objective of the dams was to ensure the navigability of the
The population in the Senegal River Basin was 1.55 million inhabitants
River between its mouth and Kayes (940 km upstream in Mali). The
in 1988 and approximately 2 million inhabitants in 2000 (OMVS/SOGED
continuous decrease in the river discharge has considerably reduced
2003). This population exerts a pressure either directly on water
the use of the Senegal River for transport and trade since 1972. The
resources of the Basin or indirectly in terms of the search for income.
establishment of a stable river discharge (227 m3/s) in Bakel allows
Another problem linked to demographic growth is poverty that
the resurgence of this activity. Actually, the Organisation for the
aggravates the negative impacts of the population pressure.
Development of the Senegal River Basin (OMVS) is in charge of the
navigability between St. Louis and Kayes while Senegalese council of
The population growth resulted in a high water demand for diff erent
shippers (COSEC) will consider the building of a new harbour in St Louis
uses and an increase in water pollution. In addition, there is an
as well an access from the sea. A feasibility study was begun in 2001
uncontrolled expansion of urban areas, which are generally established
(Niang-Diop et al. 2002).
in the riverbed, which results in a reduction of the River's cross-section
and more frequent fl ooding. The urbanisation rate increased from
46
GIWA REGIONA ASSESSMENT 41 CANARY CURRENT
23% in 1960 to 39% in 1988 and 41.2% in 1996. In Dakar, for example,
Illiteracy and the lack of appropriate environmental education are
population density increased considerably, from 930 inhabitans/km2 in
also causes of water pollution. This is refl ected by poor agricultural
1960 to 2 730 in 1988 and 4 081 in 1999. This rapid growth of Dakar and
practices; for example, in certain irrigated perimeters, polluted drained
other major cities is due to a high natural fertility rate and the important
water is discharged directly into freshwater. The Senegalese Sugar
migratory fl uxes that have been exacerbated by the drought.
Company and the neighbouring irrigated perimeters are discharging
polluted water into Lake Guiers, the Ndiael, and the Senegal River.
Poverty is a critical problem for the populations and communities of
Data indicates that the Senegalese Sugar Company is discharging the
the Basin. This is represented by of the root causes of poor quality
equivalent of 40 000 tonnes of salt per year in Lake Guiers (SGPRE 1999).
water resources infrastructure installations, inappropriate or even the
The population in the neighbouring localities is not always aware of
lack of drainage control design in the irrigated perimeters, and the
the dangers represented by the pollution, the mismanagement of
lack of adequate drinking water systems. The population of the Basin
solid waste and the direct use of untreated raw water for domestic
is primarily rural with a relatively low income that does not allow for
and purposes.
investments that would result in a better life.
Ineffi
cient irrigation technology
Lack of appropriate governance
Irrigation water use effi
ciency is very low. In some irrigated perimeters
The lack of appropriate governance is manifested by the lack of
in the river valley, water use effi
ciency is quite often lower than 50%,
enforcement of regulations, the absence of an adequate institutional
particularly in those areas cultivated in rice and market gardening
setting and the absence of democracy, which means that stakeholders
crops, where furrow irrigation is practiced. This is linked to the lack
cannot participate in decision-making and are not held accountable for
of farmer education or insuffi
cient fi nancial resources for install
their actions. In many cases, powerless and unwilling partners endure
appropriate irrigation systems. The main water supply pipes are not
decisions that are often dictated by powerful economic operators.
well maintained. In many cases, drainage systems are not taken into
Problems related to the lack of appropriate governance and the
account. Consequently, several pollution problems are observed in the
institutional setting are well identifi ed and are well known, particularly
region such as the pollution of Lake Guiers and the drainage of the SAED
the insuffi
ciency or the absence of the organisation and location of
perimeter in the Ndiael.
activities that are the source of many confl icts concerning the water
resources use and the deterioration of living conditions.
Natural causes
The stream fl ow in the Senegal River is strongly related to rainfall. For the
The institutional setting is less effi
cient because of the rapid changes
period 1904-1999, the mean annual fl ow volume was 22.1 billion m3 at
in institutions, stakeholders and the division of power. Projects and
Bakel (SGPRE 1999). The maximum and the minimum volume observed
decisions are often taken without taking into account the opinion
were 42 billion m3 (1924) and 6.5 billion m3 (1984) respectively. The
of the others. Lack of appropriate governance is also illustrated by
average stream fl ow volume at Bakel decreased from 25.9 billion m3
the numerous problems related to information; the absence of any
(1904-1967) to 13.78 billion m3 (1967-1999) (SGPRE 1999).
circulation of information, the defi ciency at times in the quality of
information, the insuffi
ciency of the sensitisation to environmental
degradation and the lack of environmental education (SGPRE/PNUE/
DHI/TROPIS 2002).
CAUSAL CHAIN ANALYSIS
47
Lowering of the water table ş
Souss-Massa River Basin
In Morocco, the consequences of increased industrialisation and a
System description
rapidly growing population have accentuated the growth in demands
for water resources and have promoted their intensive use. For the
The Souss River Basin covers approximately 27 000 km2. It is located
last three decades the emphasis was on maximising the capture of
at the southern end of the Atlas Mountains. It is bounded on the
Morocco's surface water resources for irrigated agriculture, potable
north by the High Atlas Mountains and on the south by the Anti Atlas
water supplies, industrialisation and energy generation. Important
Mountains (Figure 5 in Regional defi nition). The two mountains ranges
infrastructure to capture and use about two-thirds of surface water is
joint at Mount Siroua (3 304 m above sea level) to form the drainage
already in place, and a number infrastructure projects are in advanced
divide between the Souss-Massa Basin to the west and the Draa Basin
stages of planning and construction to capture most of the remaining
to the east. The River Basin encompasses the Souss River, the Massa
potential.
River and the coastal river basins of Tamri and Tamraght, all of which
discharge into the Atlantic Ocean. In 1994, the population in the Basin
Despite remarkable achievements, Morocco faces growing challenges
was 1 541 000 inhabitants.
in the water sector. One of the major issues is the decline in water
resources. The mean annual rainfall is 150 billion m3 but the renewable
The land use in general is dominated by forest (48%), pasture land
water resources do not exceed 29 billion m3. Taking into account
(33%) and arable land (19%) (Baroud 2002). The potential irrigated area
potential storage sites and groundwater development possibilities,
is 250 000 ha, with 134 295 ha Table 26 Irrigated crops in Souss-
only 20 billion m3 are divertible. A number of river basins are already
currently under irrigation. Citrus
Massa River Basin.
experiencing water shortages, which will impose costly interbasin
and vegetables represent 44% of
Irrigated area*
Crop
(%)
transfers. Some of the more intensively used aquifers are now
crops grown in the irrigated area
Citrus
27
considered to be under stress with serious drawdowns and saltwater
(Table 26). With a year-round
Vegetables
17
intrusion in the coastal ones. This is the case of the Souss aquifer in the
growing season, irrigation from
Cereals
17
Souss-Massa Basin (Ait Kadi 2002).
reservoirs and groundwater
Olive tree
17
enables the region to produce
Fodders
10
The focus of the causal chain analysis is to determine the source, the
more than 60% of Morocco's
Banana
2
underlying constraints and the root causes of the shortage of freshwater
agricultural exports (mostly
Others
10
in this region. The reasoning behind the choice of focusing the causal
citrus and tomatoes), but the
Total
100
chain analysis on freshwater shortages can be argued in view of the
overdrawn aquifer is falling by Note: * During a normal year.
observed trends in water table depletion in the whole region and
more than 1.5 m per year in (Source: Baroud 2002)
the need to address the issue of water shortage to prevent further
some areas (Rhodes 1999).
environmental deterioration. The underlying characteristics and
assumptions of the water table depletion problem are summarised
The region is arid to semi-arid, and receives 270 mm of rain in an average
below:
year. The Souss and Massa rivers are the primary sources of surface water
Recent problematic trends in the water balance of the Souss
in the area. The normally available surface water each year ranges from
aquifer;
341 to 635 million m3, but it can drop as low as 35 million m3 in dry
Increased agricultural water demand;
years, as it did in 1960-1961, and as high as 2 160 million m3 (1962-1963).
Increased non-agricultural water demand;
Surface water is collected and stored in seven reservoirs with a total
Unsustainable water table drawdown.
storage capacity of more than 750 million m3 (CSEC 2001) (Table 27).
Groundwater is obtained from two major aquifers (DGH 1999):
The Souss aquifer, limited to the north by the High Atlas Mountains
and to the south by the Anti-Atlas Mountains and to the west by
48
GIWA REGIONA ASSESSMENT 41 CANARY CURRENT
Table 27
Dams in Souss River Basin.
500 000
Storage capacity
Fruits
Dam
Use
(million m3)
450 000
Vegetables
Yousssef Ben Tachefine
303
Irrigation and drinking water
400 000
Potato
Abdelmoumen
214
Irrigation and drinking water
350 000
Tomato
Aoulouz
110
Groundwater recharge
Total
300 000
onnes)
(t
t
Med Mokhtar Soussi
50
Irrigation
250 000
Imin El Kheng
12
Irrigation and groundwater recharge
Expor 200 000
Moulay Abdellah
110
No data
150 000
Total
799
100 000
(Source: CSEC 2001)
50 000
0
1992
1993
1994
1995
1996
1997
1998
1999
2000
2001
Year
the Atlantic Ocean and covers 4 150 km2. Its capacity is estimated
Figure 15 Export of fruits and vegetables in the Souss-Massa
to be 30 billion m3 with a depth ranging form 150 m to 500 m;
River Basin.
The Chtoukas aquifer, which is located south west of the Souss
(Source: MCE 2001)
valley and covers an area of 940 km2. Its estimated capacity is
1 billion m3 with a depth ranging from 50 to 300 m.
The region is one of the most water-poor regions in the world and
signifi cant eff orts are being made to improve the management of water
Even though the Souss-Massa Basin is located entirely in Morocco,
resources. Although there is still room for further progress, particularly
there are several tranboundary issues that are relevant for this report: (i)
regarding irrigation effi
ciency, the region appears to be structurally
a signifi cant portion of the available water resources of the Souss-Massa
unable to feed its increasing population and will probably need to rely
Basin can be lost to the Atlantic Ocean when a strong fl ash fl ood occurs;
more and more on virtual water, such as food imports, mainly in the
(ii) a large proportion (roughly 60%) of the national production of fresh
form of grain cereals.
fruits and vegetables that are exported from Morocco to international
markets originates in the Basin; (iii) a correspondingly large amount of
`virtual water' is exported annually through the export of commercial
high-cash crop commodities; and (iv) an equally important amount of
Causal chain analysis
irrigation water is currently pumped from the transboundary aquifer,
around two-thirds of the total water used for irrigation purposes.
In recent years, agriculture has developed in the central plain of Souss-
Massa River Basin, in spite of the natural dryness of the soil. Nevertheless,
Despite the water scarcity in the region, the international character
agriculture is not a new economic activity in the area. Traditionally,
of the Souss-Massa Basin is refl ected in the level of export of what is
water for irrigation was obtained by digging almost horizontal galleries
known as `virtual water'. This refers to the volume of water contained in
to the groundwater table, and then letting the water fl ow by gravity
commodities that are exported, both food and non-food. For example,
down the gallery. At present, water is pumped from the subsurface.
as 1 tonnes of tomato production is approximately between 80 and 90%
For the last three or four decades pumping has depleted the water
of water by weight, the export of 195 000 tonnes of Moroccan tomatoes
table. In some places, the aquifer drawdown can be as high as 2 m
to Europe in 2001 would correspond to the export of 165 750 tonnes
per year and has ranged between 10 to 65 m since 1970 (CSEC 2001).
of water, of which 60% were produced in the Souss-Massa Basin. The
Along with increasing pumping costs to a considerable degree, the
fi gure is even higher when considering the total export of fruits and
lowering of the water table means that the system will reach a point
vegetables from this region, totaling about 380 000 tonnes or an export
where the availability of water will not meet the demand. In addition,
equivalent of 323 000 tonnes of virtual water during the same year (MCE
the high evaporation and infi ltration rates in the central plain means
2001). Over the last decade, total export of fruits and vegetables from
that rivers in the Basin tend to dry up before reaching the main stream.
the region to the international market varied between 257 570 tonnes
In general, run-off occurs only after consecutive rainy days and, mostly,
in 1996 to 456 723 tonnes in 1999, demonstrating a large inter-annual
the horizontal movement of water takes place in the deep groundwater
variability (Figure 15).
system.
CAUSAL CHAIN ANALYSIS
49
more frequent and more widespread as the region's water utilisation
870
850
Recharge
rate increases.
750
Discharge
637
650
614
Balance
550
478
442
450
Therefore, management of the freshwater shortage in the Souss
3
405
410
335
350
aquifer is not only a major environmental concern; but it is also a
233
256
250
220
165
illion m 150
108
crucial problem for the local community's well being. Furthermore,
M
50
it is indeed a severe constraint for future development of commercial
-50
-107
-150
agriculture and tourism industry, the two most important sources of
-185
-250
-245
revenue in the region.
-350
-370
-358
-450
1976
1979
1985
1994
1996
1998
Year
The main issues addressed in the analysis of the freshwater shortage
Figure 16 Groundwater balance in the Souss River Basin.
in the Souss-Massa Basin concerned the lowering of water table
(Source: DGH 1999)
level and the rapid depletion of underground water resources and
the modifi cation of stream fl ow in the River (Figure 17). The changes
Intensive irrigation development, urban and industrial growth, and
in water table may be considered as part of a global change that is
the expansion of the tourist industry are making increasingly heavy
occurring in the whole region, as described under the Global change
demands on the area's water resources. The situation is worsened by the
concern. However, the lowering of water table is considered to be more
Basin's arid ecological conditions. The region is therefore experiencing
critical in the context of the Souss-Massa Basin than the modifi cation of
chronic water defi cits.
stream fl ow. Therefore, the focus of the causal chain analysis has been
placed on the underground water table depletion issue (DGH 1999).
Evidence based on existing meteorological and hydrological records
clearly indicates that the impacts of freshwater shortages are becoming
Immediate causes
more and more acute in the Souss-Massa region. Figure 16 provides a
The immediate causes underlying the stream fl ow modifi cation
good illustration of recent trends in the water balance deterioration.
problem are associated with decreased input, drop in annual rainfall
patterns and decreased infl ow. These may be considered a part of the
The impacts are most severe during the dry season, which lasts for at
global change described earlier.
least six months each year, and the situation is further complicated by
the frequent occurrence of drought episodes in Morocco as a whole
Excessive pumping
and in the region in particular. While the freshwater shortage creates
The drop in the water table has mainly resulted from excessive
periodic water scarcity, which in time will become more acute due to
pumping for agricultural irrigation purposes and from reduced
the increases in water demand (population growth, tourism, industrial
recharge. The evidence for excessive underground water pumping
activities), the additional water shortages created by droughts will be
is refl ected in the fact that out of 918 million m3 of water that is used
Issues
Immediate causes
Sectors/Activities
Root causes
Lowering of the
Demographic
water table
Agriculture
Excessive pumping
Socio-cultural
Tourism
Changes in rainfall patterns and
Governance and
stream flow modification
enforcement of water
regulations
Industry
Technological changes
Reduced recharge
Urbanisation
Economic
Natural causes
Figure 17 Causal chain diagram illustrating the causal links for lowering of the water table in the Souss-Massa River Basin.
50
GIWA REGIONA ASSESSMENT 41 CANARY CURRENT
annually, 618 million m3, or 67% of the total volume, is withdrawn from
average drawdown of 0.8 m/year and a maximum of 1.5 m/year for
the groundwater (CSEC 2001). Groundwater, which is the major water
1990 and 1997. The low rate of renewable groundwater (0.29 billion m3)
source for the region, is obtained primarily from the alluvium in the
exacerbates the reduced recharge problem, which is further aggravated
Souss-Massa valley. In 2002, more than 13 000 wells were used to
by run-off losses (DGH 1999).
withdraw groundwater for domestic, industrial, and agricultural uses.
The number of wells has rapidly increased with the more frequent
Sector activities
drought episodes experienced in the region over the past two decades.
The main sector activities that generate freshwater shortages in
Generally, the water quality in the alluvium is good, with most wells
the Souss-Massa Basin are associated with the allocation of water
producing fairly good quality water. Some wells, however, show
resources for: irrigated agriculture, tourism and industrial activities,
deteriorated water quality.
and urbanisation.
Changes in rainfall patterns and stream fl ow modifi cation
Table 28
Water demand by sector in the Souss Massa Basin.
The excessive pumping is exacerbated by low and variable rainfall
Water demand (million m3)
Sector
and surface water. Rainfall in the Basin is highly variable and averages
1993
2000
2020*
280 mm per year in the northeast Souss Valley and 265 mm per year in
Total
915
1 005
1 075
the southwest area of the valley. The Souss River, the main river in the
Agricultural sector
Surface water
300
315
315
basin, is characterised by an irregular fl ow and frequently dries up for as
Groundwater
615
690
760
many as 310 days per year. During the last 80 years, Morocco in general
Non-agricultural sector
ND
50.8
88.6
and the Souss-Massa River Basin in particular experienced 27 years of
Note: ND = No Data. * Projected demand.
drought recurring at a three-year interval (Swearingen & Bencherifa
(Source: CSEC 2001)
1996). Prior to the construction of major dams, groundwater was the
only source of water for irrigation during the dry periods.
The water demand by sector is summarised in Table 28. The data
indicate that through the sustained eff ort of water mobilisation in
Reduced recharge
the Souss-Massa Basin, about 1 056 million m3 were regulated in
The reduced recharge of the Souss aquifer is illustrated in Figure 16
2000 and about 690 million m3 were extracted from aquifers, making
above. The evidence for this problem is also refl ected in the inter-
roughly 1 005 million m3 available for irrigation, and the remaining
annual variation of the depth of water table over the period 1969-
51 million m3 for tourism, industrial and domestic water (CSEC 2001). It
1999, as shown in Figure 18. The data indicate that the defi cit ranges
is worth noting the steady increase in water demand by sector and the
from -185 million m3 in 1976 to -358 million m3 in 1996 and that the
corresponding projected fi gures for 2020, which predicts the levels will
water table level dropped from -15 m in 1969 to -35 m in 1999 with an
reach 1 075 million m3 for agriculture and 88.6 million m3 for the non-
agricultural sector. The resulting consequences of the increasing water
demand in both agricultural and non-agricultural sector activities have
1
led to a major deterioration of the groundwater balance to meet the
-3
growing needs.
-7
(m) -11
Irrigated agriculture
-15
r table
In terms of water use, irrigated agriculture is the main user of the
t
e
a -19
available water in the region, as is the case for the whole of Morocco.
-23
In 2000, only 51 million m3 were allocated to industrial activities and
Depth of w
domestic water, making the agricultural water sector consumption at
-27
around 95% of the total available water in the region (CSEC 2001).
-31
The increased agricultural water demand in the Souss-Massa region
-35
69
72
75
78
81
84
87
90
93
96
99
resulted from a steady increase in irrigated acreages over the past
Year
three decades. The recent fi gures indicate that total irrigated area
Figure 18 Inter-annual variation in the water table depth in the
increased from 134 295 ha in 1993 to 140 455 ha in 2000; the projected
Souss aquifer.
(Source: DGH 1999)
increase by 2020 is 150 000 ha (CSEC 2001). Changes in the cropping
CAUSAL CHAIN ANALYSIS
51
10 000
90
83.2
9 000
Vegetables
) 80
Urban
3
Rural
72.9
8 000
Cirus
70
Total
(ha)
7 000
Banana
60
ea
6 000
50.6
(million m 50
44.3
5 000
40
37.6
31.8
4 000
r needs 30
opped ar
t
e
Cr
3 000
a 20
W
12.5
13
11.3
2 000
10
1 000
0
1997
2000
2020
0
84/85
86/87
88/89
90/91
92/93
94/95
96/97
98/99
Year
Year
Figure 20 Present and projected domestic water needs in the
Souss-Massa River Basin.
Figure 19 Cropped area for irrigated cash crops in the Souss-
(Source: CSESC 2001)
Massa River Basin.
(Source: CSEC 2001)
almost to double by the year 2020 (CSEC 2001) (Figure 21). The region's
patterns for the last three decades have also contributed through
population is equally divided between rural and urban settlements. Urban
the introduction of new high-water-demand cash crops such as
populations have grown enormously in the past decade, as drought has
bananas, along with the development of the vegetable crop for
pushed people out of subsistence farming, and economic opportunities
export (Figure 19).
have pulled people into towns where there is at least seasonal work in
export agriculture, tourism, fi shing, and transportation.
The water losses through evaporation associated with the use of
traditional open irrigation canals, and the limited maintenance of the
The estimated water demand for domestic use, which is currently about
water transport system through the canals also explain the increased
75 liters per capita per day, is expected to increase to 120-160 liters per
agricultural water demand observed in the region. However, the
capita per day by the year 2020 (Reiss & Ouattar 2002). A comparatively
predominance of ineffi
cient traditional irrigation systems, comprised
much higher water demand is expected to apply to the tourism
of 50% fl ood irrigation and 28% sprinkler irrigation, represents the main
industry, as in 2002 it already ranged from 450 to 1 600 liters per capita
reason for the 40 to 50% water use effi
ciency index observed in the
per day in some hotels in Agadir. The corresponding total water demand
region (Kent & Ouattar 2002).
would total 83.2 million m3.
Tourism, industry and urbanisation
Socio-cultural
In parallel with the steady increase in the agricultural water demand,
In Morocco, water is traditionally considered a free public resource. This
the non-agricultural water demand is also rapidly increasing as a
inevitably infl uences the enforcement of regulations. The Moroccan
result of demographic pressure, an improving standard of living,
government eff ectively has total rights to all of the country's water and
urbanisation and the development of tourism and other industrial
in 1995 passed a law authorising the management of the country's
activities. Presently, it is estimated that almost 60% of the potable water
supply in the Agadir area comes from groundwater wells and 40% from
surface water reservoirs (Kent & Ouattar 2002). Figure 20 documents
3.0
Urban
such development and indicates an alarming projected water demand
2.5
Rural
by 2020 on the order of 83 million m3. Fully 86% of this demand would
2.0
Total
(million)
be allocated to meet urbanisation needs.
1.5
1.0
Root causes
habitants
I
n
0.5
Demographic
0
In 1971, the population of the Souss-Massa River Basin was
1971
1982
1994
2000
2010
2020
Year
938 000 inhabitants (about 6.1% of the total population of Morocco). In
Figure 21 Population in Souss -Massa River Basin.
1994, the population had grown to 1 541 000 inhabitants and is expected
(Source: CSEC 2001)
52
GIWA REGIONA ASSESSMENT 41 CANARY CURRENT
water at the basin level. This law, when fully implemented, will result in
responsibilities, and charge each farmer for water that is used to
a more decentralised and participatory process for water management.
maintain the distribution systems. If user groups have not been
The newly established Souss-Massa River Basin Agency must work with
formed, the Regional Agricultural Development Authority (Offi
ces
fi ve major public existing organisations currently operating in the water
RÚgionaux de Mise en Valeur Agricole, ORMVA) collects money
sector: irrigation, potable water, environment and health, in addition to
directly from the farmers for operation and maintenance of the
water user associations (see Root cause: Governance and enforcement
distribution system.
of water regulations below).
The revision of the Moroccan Water Law in 1995 introduced many new
Historically, water rights and water management issues have been
considerations about the management of water at the national and
handled by local communities that are located in traditional irrigation
local level. One of the important aspects is the offi
cial recognition of
zones. The modern legislation applies to large, commercial irrigation
planning by the state of water mobilisation and allocation as the main
areas, which have developed during the past 30 years. The Moroccan
instrument for decision-making about public infrastructure, water
legal system includes a mixture of community, Islamic and newly
allocation and water transfer. The Water Basin Plan is to be prepared
developed water rights and rules from the 1995 Water Law, which now
by the Regional Basin Agency (RBA) and to be submitted to the High
constitutes the main legal context for water management, rights and
Council for Water and Climate (CSEC) in order to adopt it formally.
use. The law recognises that all water resources are a public good and
Once adopted, the master plan, which is comprised of an integrated
that water should be managed at a river basin level.
management of water resource at the hydrological basin level, is the
main document for the support of intersectoral water allocation,
Governance and enforcement of water regulations
extraction agreements and concessions. It also includes goals in terms
In Morocco, several active institutional bodies intervene to one extent
of quality (CSEC 2001).
or another in water management at the local, regional and national
levels. These include:
A number of new tools have been implemented to enforce the new
The High Council for Water and Climate (Conseil SupŔrieur de l'Eau
water management rules. These include:
et du Climat, CSEC) is a national consultative body that approves
The introduction of the Regional Basin Agency, as the main entity
national and regional water resource master plans.
in charge of water issues at the water basin level.
The Irrigation Agency (Offi
ce Regional de Mise en Valeur Agricole de
The introduction of new taxes, (River Basin recovering tax) based
Souss Massa, ORVASM), responsible for irrigation perimeters, planning
on extraction and pollution levels.
and construction of irrigation canals and transporting water from
The formal introduction of the National Hydrological Plan as the
reservoirs to farmers. It has also drilled numerous irrigation wells used
main tool for solving allocation confl icts.
for irrigation. In the absence of a Water User Association, it collects
The introduction of new instruments to deal with pollution and
money directly from farmers for operation and maintenance of the
drought; specifi cally fees for polluters, subsidies for investments to
irrigation system, but capital costs are not recovered.
reduce pollution and new powers so that the administration can
The Souss-Massa River Basin Agency (Agence RÚgionale de Bassin,
deal with drought.
RBA) was created recently and is responsible for reservoirs and
However, more time is needed for the 1995 Water Law prescriptions
hydraulic infrastructure maintenance and for upgrading regional
to come into force, and presently the decision-making process is
master plans and planning for the use of water resources in the
highly concentrated, which results in poor enforcement of regulations.
basin, including groundwater. In addition it coordinates water
The fact that a ministerial department (the Secretary of State for
management committees at the basin level.
Water) is entirely devoted to water issues may help speed up the
The Drinking Water Agency (Offi
ce National de l'Eau Potable,
implementation of the Water Law principles in practice, and yield
ONEP)provides wholesale water to the Agadir Municipal Authority
a more comprehensive package for water management, including
and directly to other small towns and villages in the area.
enforcement of regulations.
The Agadir Municipal Authority (RÚgie Autonome Multi Service
d'Agadir, RAMSA) is an autonomous state-controlled water utility
Technological changes
company that distributes and sells drinking water to Agadir.
Ineffi
cient irrigation systems
Water User Associations (Association des Usagers d `Eau Agricole,
In spite of the fact that the Souss-Massa region is technologically more
AUEA) have been created to take over operation and maintenance
advanced than the rest of Morocco, most of the land is still under fl ood
CAUSAL CHAIN ANALYSIS
53
irrigation. Flood irrigation still covers almost 50% of irrigated land,
maintenance costs. There are also social and cultural obstacles to
sprinkler irrigation is used on another 28%, and drip and irrigation
charging a fee for water for irrigation and even for other uses.
covers only 25% of all irrigated agricultural land in the Souss River Basin
(Kent & Ouattar 2002). Thus, water-saving technologies have been
This is why the policies initially implemented overemphasised irrigation
slow to reach farmers. The region invested heavily in mobilising and
subsidies. The eff ective rate of subsidies for investment was as high
managing the water supply at macro-scale level, and little attention was
as 95% for small farms, which represent the majority of the farming
devoted to saving water and improving water demand management.
community. Although the subsidy rate was revised to 40% in 1984, most
Water-savings data indicates that global water losses at the farm level as
exemptions were maintained and only 10% of the investment cost was
well as in the irrigation systems range from 45% to 95% with an average
included in water rate charges. In 1996, following the 1995 Water Law,
of 69% for the period 1987-1999 (Tayaa 2002) (Figure 22).
all exemptions have been cancelled and the 40% subsidy is to be
recovered independently of water rate charges (BenAberrazik 2002).
100
The average urban charge for water in Agadir is 0.24 USD per m3 for users
90
Water use efficiency
(%) 80
Mean
consuming less than 24 m3 per month and 0.76 USD per m3 for those
y 70
consuming more than 60 m3 per month (Kent & Ouattar 2002). The
60
50
average charge for irrigation water is approximately 0.052 USD per m3.
40
Because neither urban nor irrigation rates include the capital cost of
30
t
er use efficienc
a 20
construction of dams, urban charges frequently cover only 50% of the
W 10
full cost of water and irrigation charges less than 10% of the full cost of
0 1987 1988 1989 1990 1991 1992 1993 1994 1995 1996 1997 1998 1999
water. Private well owners do not currently pay for water. When the 1995
Year
Water Law becomes fully implemented, it will allow the Souss-Massa
Figure 22 Irrigation water use effi
ciency in the Souss Massa River
Basin.
Basin Agency to charge approximately 0.002 USD per m3 for groundwater
(Source:Tayaa 2002)
pumped from private wells. Therefore, water pricing is still not suffi
ciently
compelling to stimulate water savings. In fact water distributed to farmers
Inappropriate well technologies
within the irrigated Massa perimeter is priced at half its real distribution
The lowering of the groundwater table is further complicated by the
cost (0.052 USD per m3 paid by farmers, as compared to 0.123 USD per
use of inappropriate well digging technologies, which are similar to
m3 for the estimated operation and maintenance cost). If we include
that used by commercial oil prospecting companies. The policies thus
the investment cost, the diff erence between the price paid and the real
far implemented have failed to provide local farming communities the
cost is even higher. Investment costs are still supported by government
necessary incentives to participate in responsible water management
budgets. Pricing reform, implemented during the last years, which aims
decisions. This is true both from the perspective of technology use and
at increasing gradually water irrigation prices, has been slow to achieve
water pricing.
its goals. Improving water allocation effi
ciency, via water pricing, is still
considered an important strategic objective.
Economic
The economic root causes elaborated in this section include water
Natural causes
pricing policies, water market failures and distortions due to subsidies,
Rainfall in the Souss-Massa Basin is highly variable and the Souss River
and users' behaviors and attitudes. There is a great paradox regarding the
is characterised by an irregular fl ow and frequently dries up. During
economics of the freshwater shortage issues in the Souss-Massa Basin
the last 80 years, the River Basin has experienced 27 years of drought,
and in Morocco as a whole. On the one hand, low-priced water provides
recurring at a three-years interval (Swearingen & Bencherifa 1996).
little incentive for farmers to invest in water-saving technologies such as
drip irrigation. Instead, it encourages farmers to overuse water, thereby
exacerbating the problems of decreases in the groundwater table, with
associated waterlogging and salinity problems. On the other hand,
sustainability of the irrigation systems is at stake: at present, water for
irrigation is practically free, mainly because a large number of farmers
cannot aff ord to pay water charges, even to cover the operating and
54
GIWA REGIONA ASSESSMENT 41 CANARY CURRENT
Overexploitation of fish ş Canary Current
At least seven of the countries in Canary Current region, Morocco,
oriented production. Investment in the artisanal sub-sector is relatively
Mauritania, Senegal, Cape Verde, The Gambia, Guinea, and Guinea-
small, with fi sherfolk operating from many dispersed, and often
Bissau, as well as the Canary Islands, are coastal states bordering the
isolated, landing sites. Most of the industrial vessels are large, off -shore
Atlantic Ocean and have important marine fi sheries stocks. Generally,
and foreign-owned while the artisanal vessels are locally built wooden
the marine fi sheries of the region consist of two sub-sectors, industrial
canoes. Senegalese artisanal fi shermen dominate fi shing in the region
and artisanal, which target pelagic and demersal stocks. These stocks
because of their recognised fi shing skills and willingness to migrate
constitute, for the states, vital renewable natural resources that provide
along the entire marine coastline from Mauritania in the north to Guinea
food and income for local populations, foreign exchange earnings,
in the south.
revenue for the national governments (balance of payments) and
employment opportunities. Throughout the region, local populations
Fisheries resources potentials
are engage in artisanal fi shing, whereas exploitation at the industrial
The marine zone of the region is characterised by a high biological
level is dominated by fl eets of vessels, equipped with ultra effi
cient
diversity and signifi cant fi sheries resources. Generally, the fi sh stocks
state-of-the-art fi sh detection and capture equipment.
that are exploited in the region can be divided into two main groups;
pelagics and demersals species.
The fi sheries sector, which is vital for social stability and the survival
of local populations, is threatened by destructive, unsustainable
In Senegal, the resources are further characterised by two major
fi shing methods and practices, ever-increasing fi shing eff ort without
groups; off shore and coastal pelagic resources, and deep sea and
due consideration of the ability of the resources to support the
coastal demersal resources. The Republic of Cape Verde, off the coast
exploitation. This results in overexploitation, excessive by-catches of
of Senegal, has a vast fi shing zone of some 734 000 km▓ with abundant
non-target organisms, including endangered and protected species,
stocks of tuna, spiny lobsters and pelagics. The Gambia groups its
and discards.
fi sheries resources into three main classes; pelagics, demersals and
crustaceans (including shellfi sh).
The eff orts of the states of the region to develop and to use these fi sh
stocks in a sustainable manner are limited by the lack of adequate
Mauritania, like Senegal, classifi es its resources into two large groups;
skilled manpower and fi nancial and material resources. Furthermore,
demersal resources and pelagic resources. The resources have an
the poor and precarious state of their national economies compel these
exploitable potential of about 1 500 000 tonnes per year, of which
countries to grant fi shing access rights to vessels, the majority of them
65% are pelagic fi sh, 20% are clams and 15% are demersal fi sh, tuna
foreign-owned, at a level that exceeds sustainable harvesting. This
and crustaceans (UNEP/CNROP 2002). Regarding pelagic resource, a
has resulted in the overexploitation of several stocks such as shrimps,
dozen species out of 50 are exploitable stocks; for example Sardine,
cephalopods, demersal and pelagic fi shes, and other aquatic organisms.
Horse mackerel, Mackerel, Anchovy and Mullet. These stock evaluations
Another constraint is that the existing fi sheries resources management
indicate that tuna, horse mackerel, sardines, and mackerel have the
regime grants little power to local communities in decision-making
potential to supply 1 million tonnes per year in the EEZ of Mauritania
regarding allocation of fi shing access rights.
alone.
Status of resources
The various global results available regarding on the coastal demersal
System description
resources indicate a serious overexploitation. The signs of overfi shing of
coastal demersal resources are manifestly evident, declining production
Marine fi sheries of the region
of industrial fi shing units, exacerbation of the confl icts between artisanal
Generally, the marine fi sheries sector in the region is characterised
and industrial fi shing and even within the artisanal fi shery, adoption of
by operations at industrial and artisanal levels, with the industrial
new fi shing strategies, a signifi cant reduction in mean individual sizes
sub-sector being distinguished by large-scale investment in export
of landed species, and stagnation or reduction in landings per type of
CAUSAL CHAIN ANALYSIS
55
fi shing in spite of the increasing level of fi shing eff ort. For example, the
Sparidae group, particularly with regard to the Sparus species, whose
most recent resource evaluations by Senegal's oceanographic research
relative abundance declined from more than 40 kg/hour to less than
centre, CRODT, confi rm this overexploitation (Barry et al. 2002).
10 kg/hour, and that of guitar-fi shes, which changed from 60 kg/hour
to 5 kg/hour respectively.
The change in indices of abundance of the species captured by
bottom trawls during the CRODT trawl campaigns shows, in all species
In Mauritania, the level of knowledge on the state of the resources is
combined, a signifi cant reduction between the 1970s-1980s and the
uneven. The evaluation results for pelagic and cephalopod species,
1990s. Nearly all fi sh species are aff ected by the decrease. The total
notably the octopus, are considered to be more reliable than those for
catches, all species included, declined from about 1 000 kg/hour in 1986
other stocks, such as the crustaceans and demersal fi sh. Details of the
to only 500 kg/hour in 1991 for the entire Senegalese continental shelf,
quality of the results are given in Table 29. The table shows that most of
corresponding to a 50% reduction (PNUD/ENDA 2001). The Serranidae
the demersal resources are fully exploited to overexploited. The octopus
group declined from mean abundance level of about 30 kg/hour for all
and the White grouper are overexploited. The hakes and shrimps are fully
species, already relatively low, to less than 10 kg/hour within the same
exploited, as is true for the majority of the big demersal species.
period (UNEP/ETP 2002). The same phenomenon is observed for the
Table 29
Summary of the evaluation of pelagic stocks in Mauritania.
Current catches
Maximum Sustainable Excessive
Resources
Natural variability 1
Exploitation
Management recommendation
(tonnes)
Yield 2 (tonnes)
effort 3
Cephalopods
Productivity dependent
35 000 (26 000-43 000
Reduce fishing effort. Maintain closed
Octopus
20 000
on up-welling and not
Overexploitation, declining indices of abundance.
25-40 %
according to up-welling)
season
on exploitation level
Precautionary approach and encourage
Cuttlefish 4
6000
Stable
Probably fully to overexploited
10 000
Unknown
selective gears
Squids 4
4000
Average
Unknown
6 000
Unknown
-
Demersal
Emerging statistics:
Average (stock
Target species fully exploited. Others probably
Unknown, probably near
Probably
Freeze effort due to lack of stock evaluation
continental shelf
Estimated 40 000-50 000
dependent)
under- to fully exploited
current catch.
weak
Probably under-exploited. High indices of
Black hake
13 000
Unknown
12 000
0
Maintain effort at current levels
abundance
Mullets 4
17 000
Big increase in effort
Unknown
Unknown
Freeze effort
Crustaceans
Deep sea shrimps 4
Most likely
Freeze effort (high amount of by-
(Parapenaeus longirostris,
3 300/400
High
Probably fully exploited
Unknown
0 or weak
catches)
Aristeus varidens)
Coastal shrimps 4
(Penaeus notialis, P.
1 900
High
Probably fully exploited
Unknown
Weak
Freeze effort.
kerathurus)
Crabs 5 (Gerion)
160
High
Probably fully exploited
400
0
Freeze effort
Red lobsters 5
200
High
-
800
Unknown
-
Green lobsters 5
100
High
Northern stock probably recovering
220
Weak
Delay any increase in effort
Clams 5
Venus rosalina
0
High
Not exploited
< 300 000
0
-
Venus verrucos
0
High
Not exploited
500-1 000
0
-
Coastal pelagics
Sardinella
480 000
-
Fully exploited (excepting S. eba in Mauritania
500 000
0
Freeze global in the regional-
Horse mackerel
192 000
-
Moderately exploited
400 000
Weak to 0
Maintain effort
Green horse mackerel
21 000
-
No evaluation
Unknown
Weak to 0
-
Mackerel
159 000
-
Moderately exploited
Unknown
Weak to 0
-
Scabbard fish
-
-
-
Unknown
-
-
Sardine
-
-
-
Unknown
-
-
Anchovy
-
-
-
Unknown
-
-
Albacore
135 000 (East Atlantic)
-
Fully exploited
Atlantic stock 144 000
0
Freeze effort and minimum size
Listao
112 000 (East Atlantic)
-
Exploited to fully exploited
Unknown
Weak
None
Patudo
99 000 (East Atlantic)
-
Fully exploited
Atlantic stock 94 000
0
Freeze effort
Note: 1 Natural stock variability independent of exploitation (recruitment variability). 2 Maximum Sustainable Yield (MSY) (This potential cannot be reached without setting the effort to the
corresponding level (fMSY), which implies in some cases effort reduction). 3 Current excessive fishing effort to reach the MSY. 4 No evaluation 2002, values and recommendations are from 1998.
5 No evaluation since 1993, 1993 or 1988 values and recommendations.
(Source: IMROP 2002)
56
GIWA REGIONA ASSESSMENT 41 CANARY CURRENT
Production
54% of foreign-exchange infl ows and more than 27% of the State budget
Regardless of the species, the total capture production of the countries
in 1998 (UNEP/CNROP 2002). The sector's share of GNP is considerable
in the region is well over 1 million tonnes per year. There is a disparity in
and varied between 5% and 6% between 1984 and 1995 and reached
the individual production by country. According to FAO (2002) statistics
7% in 1996. The number of jobs created by the various branches in the
the capture production in 2002 was 45 800 tonnes in The Gambia and
fi sheries sector was probably about 27 000 in 2000, 21 000 of them in
895 000 tonnes in Morocco. Senegalese and Mauritanian produced
non-industrial fi shing and about 6 000 in industrial fi shing.
about 79 000 and 376 000 respectively. Cape Verde on the other hand,
had a production of 8 000 tonnes.
In Senegal, earnings from the export of fi shery products usually exceeds
160 billion FCFA (approximately 280 million USD), about 20% of earnings
Contribution to the economy
from exports (Diouf et al. 2002). With annual fi sh landings of over
Due to the particularly productive environment, the sector makes an
400 000 tonnes (80% caught by artisanal fi shermen), the Senegalese
important contribution to food security, employment and national
marine fi sheries provide over 600 000 employment opportunities.
treasuries of the region. Fish is largely the only source of cheap animal
In Cape Verde most of the fi sheries production is exported to the
protein. In Senegal and The Gambia, 40% of animal protein is from
European Union (EU). The fi sheries sector also contributes to national
fi sh. In spite of the signifi cant quantities exported from the region,
earnings through various bilateral agreements and fi shing licence fees.
the average per capita consumption (about 20 kg per year) of fi sh is
The fi nancial compensation paid to six countries within the region by
much more than the African average of 8.2 kg per year. The average
the EU within the framework of bilateral fi shing agreements amounted
consumption of fi sh in the European Union is estimated at 22.1 kg per
to 50 million USD between 1992 and 1995 (Saine 1999).
year and household. The fi sheries sector provides direct and indirect
employment for some 300 000 people, meaning that about 4% of the
active population of the region works in the fi sheries sector, engaged in
fi sh harvest, processing and marketing. About 400 local and 300 foreign
Causal chain analysis
industrial vessels operate in the region.
Figure 23 illustrate the causal links for overexploitation of fi sh in the
The marine fi sheries sector is also an important source of revenue for
Canary Current region.
national economies and national treasury revenues, which are often
used for servicing local and foreign debts. The contribution of the sector
Immediate causes
to national economies varies from country to country. Fishing is of vital
There has been an increase in both the artisanal and industrial fi shing
importance for the Mauritanian economy. It accounted for more than
eff ort in the Canary Current and capacity targeting an apparently
Issues
Immediate causes
Sectors/Activities
Root causes
Overexploitation
Political
of fish
Industrial fishery
Excessive fishing effort
Scientific knowledge
Artisanal fishery
Unsustainable
fishing practices
Institutional
Governance
Economic
Socio-cultural
Demographic
and poverty
Figure 23 Causal chain diagram illustrating the causal links for overexploitation in the Canary Current region.
CAUSAL CHAIN ANALYSIS
57
declining resource base. An increasing demand for fi sh and fi sh products
70
has motivated the use of all means to land more fi sh by increasing eff ort
60
and by using destructive and unsustainable fi shing methods. The
50
immediate causes of the overexploitation of fi sh throughout the region
wlers
a 40
are excessive fi shing eff ort and unsutainable fi shing practices.
30
20
Excessive fi shing eff ort
Number of tr 10
The sector activities that encourage the increasing excessive fi shing
0
1993
1994
1995
1996
1997
1998
1999
2000
2001
2002
eff ort for coastal demersal resources are essentially the industrial
Year
demersal fi sheries (various shrimp trawls, red mullet, fi sh and
Figure 24 Number of shrimp trawlers fi shing in the Gambian
cephalopods) and the artisanal canoe fi sheries (hand lines, hook and
waters 1993-2002.
(Source: Gambia Fisheries Department 2002)
line, cages, set nets, etc.).
Industrial fi shing eff ort
6 000
As the demand for fi sh and fi sh products increases and fi sh stocks in
5 000
several parts of the world are depleted, operators have shifted fi shing
ear) 4 000
operations to the West African region. This has translated into an
increasing number of licensed industrial vessels fi shing in these waters,
onnes/y 3 000
(t
an increase that is not appropriate given the state of the fi sh stocks. The
h
2 000
Catc
growth of national industrial fl eets was marked by the arrival of more
1 000
and more powerful and bigger vessels with more powerful engines and
medium to high Gross Registered Tonnage (GRT).
0
1985
1985
1985
1985
1985
1985
1985
1985
1985
1985
1985
1985
1985
1985
1985
1985
1985
Year
In 1994, the Gambian government started implementing its policy of a
Figure 25 Annual shrimp production in The Gambia.
systematic reduction in the number of licensed industrial vessels. Until
(Source: Gambia Fisheries Department 2002)
1999, the number of licensed shrimp trawlers remained low (below
40 were licensed yearly) (Figure 24). This was followed by a dramatic
and steady increase in 2000. An analysis of catch data from the industrial
licenses to satisfy the demands of countries in the north in exchange
fi sheries in The Gambia also indicates declining annual shrimp (coastal)
for fi nancial and development assistance (Table 30). In Mauritania, the
production and export during the past decade (Figure 25).
industrial fl eet was 69 vessels in 1990 but by 2000, the fl eet had grown
to about 400 vessels and then about 500 in 2001 (Table 31). These
Furthermore, due to the acute need for funds for socio-economic
vessels are comprised of Mauritanian vessels as well as vessels from
development, governments were compelled to grant more fi shing
Eastern European countries.
Table 30
Number of licensed industrial vessels operating in The Gambia from 1993-2002.
1993
1994
1995
1996
1997
1998
1999
2000
2001
2002
Vessel
Jan-
Jul-
Jan-
Jul-
Jan-
Jul-
Jan-
Jul-
Jan-
Jul-
Jan-
Jul-
Jan-
Jul-
Jan-
Jul-
Jan-
Jul-
Jan-
Jun
Dec
Jun
Dec
Jun
Dec
Jun
Dec
Jun
Dec
Jun
Dec
Jun
Dec
Jun
Dec
Jun
Dec
Jun
Stern trawlers
14
22
15
13
5
10
15
10
18
16
15
17
21
42
22
24
14
16
12
Shrimp trawlers
25
33
19
12
13
19
13
20
18
18
9
16
7
13
15
31
22
37
19
Tuna Long-Liners
20
0
12
4
5
15
8
0
5
1
1
4
3
0
2
1
1
0
2
Pair trawlers
0
0
0
0
1
1
2
2
0
0
0
0
0
0
0
0
0
0
0
Tuna Purse Seniors
0
24
0
17
0
0
0
0
0
0
0
0
0
0
0
0
0
0
0
Long Liners
2
0
0
0
0
0
0
0
0
0
0
0
0
0
0
0
0
0
0
Gill Netters
0
0
0
0
0
0
0
0
3
3
0
7
0
0
0
0
0
0
0
Multiple Purpose
0
0
0
0
0
0
0
0
0
5
0
0
0
0
0
0
0
1
0
/Processing Vessels
Total
61
79
46
46
24
45
38
32
39
40
25
44
31
55
39
56
37
54
33
(Source: Gambia Fisheries Department 2002)
58
GIWA REGIONA ASSESSMENT 41 CANARY CURRENT
Table 31
Number of vessels authorised to fi sh in Mauritania 1990-2000.
Type of vessel
1990
1991
1992
1993
1994
1995
1996
1997
1998
1999
2000
2001
Cephalopod vessels
0
113
116
120
134
172
224
239
206
159
160
200
Shrimp vessels
32
25
21
18
22
33
32
41
41
47
42
68
Hake vessels
37
42
37
70
67
71
0
0
0
40
43
40
Demersal vessels
0
0
0
0
0
0
0
0
0
0
0
45
Pelagic vessels
0
59
102
83
53
72
84
61
0
80
83
82
Tuna vessels
0
0
31
34
35
38
34
35
37
65
73
65
Total
69
239
307
325
311
386
374
376
284
391
401
500
(Source: IMROP 2002)
Table 32
Coastal artisanal canoes in The Gambia.
multiple kinds of fi shing gear also became important. In Mauritania, the
artisanal fl eet consists of 3 000 canoes and 12 000 artisanal fi shermen,
Year
Total number of canoes
Motorised canoes (%)
representing more than three times the number of individuals aboard
1980
290
89
industrial vessels (IMROP 2002).
1981
490
66
1983
397
66
Unsustainable fi shing practices
1986
346
65
Some fi shing methods or practices employed by operators in both
1990
472
60
the industrial and artisanal sub-sectors accentuate overexploitation of
1992
492
76
the fi sh stocks. The following non-selective fi shing gear and harmful
1994
503
83
fi shing practices/methods are considered destructive and contribute
1997
494
87
to overfi shing:
1999
467
95
2000
580
97
Beach seining
(Source: Gambia Fisheries Department 2002)
The beach seine, used by artisanal small-scale fi shermen, is destructive
fi shing gear due to its mesh size, which is smaller than the regulation
Artisanal fi shing eff ort
size. This gear catches juveniles and small-sized fi sh as well as breeding
An increase in fi shing eff ort has been observed in the artisanal sector
or spawning adults that are found inshore or along the coast. The adults
during the past three decades. An increasing number of people have
and other medium-size fi shes are retained while the tiny fi shes are often
been entering the sector due to declining agricultural production.
discarded or abandoned on the beach. This fi shing gear was banned
A 1996 socio-economic survey of The Gambia's artisanal fi sheries
by an act of the Gambian Parliament in 1989, but is used in all countries
sector estimated the growth rate of the sector (fi shermen and related
of the region.
industries) at about 5% per year (Mendy 1996). Table 32 clearly shows
the increasing trend in the number and percentage of motorised
Trawling
canoes operating along the Atlantic coast of The Gambia.
This fi shing method destroys marine habitats of demersal and benthic
organisms as well as the ecosystem. The majority of the licensed
The scenario is similar in other countries of the region. The Senegalese
industrial fi shing vessels in the region are foreign-owned and an
fl eet of artisanal canoes is by far the largest in the region. In 2002, the
increasing number of them are trawlers. Considering the huge number
number of the operational fi shing units counted along the marine
of trawlers fi shing in the marine waters of the region under various
coastline between DjifŔre and Saint-Louis was about 9 000, compared
international agreements, it is easy to see that substantial and often
to only about 100 at the beginning of the 1960s. Some signifi cant
irreparable damage is being done to the nursery, sheltering and feeding
modifi cations have been made to the types of fi shing practised by
grounds, as well as critical habitats of aquatic organisms and the entire
the artisanal demersal fl eet. These were mainly the introduction and
ecosystem. Furthermore, the catches of these trawls invariably include
development of hook and line fi shing in 1987 and a considerable
a high amount of by-catches comprised of non-target species, juvenile
increase in the number of canoes with ice holds onboard as well as those
fi sh, sharks, green turtles and dolphins.
fi shing with hand line and/or cuttlefi sh cages. The increase in the use of
CAUSAL CHAIN ANALYSIS
59
Some studies have found that about two-thirds of shrimp trawler
small-scale fi sheries operators. Licensed industrial fi shing vessels are
catches are discarded at sea. Out of about 47 321 tonnes landed by
compelled to fi sh outside and beyond this reserved zone. However,
Senegalese trawlers in 1998, 2 056 tonnes were discarded at sea (Baddyr
industrial fi shing trawlers often fi sh in this area, thereby destroying the
& Guenette 1998).
nursery and feeding grounds of juvenile fi sh, damaging the fi shing nets
and other gear of artisanal fi shermen and causing confl ict. Table 33
Stow nets (artisanal shrimp fi shing)
shows records of the activity of unlicensed/delinquent vessels in The
The negative impacts of this gear, used in the shrimp fi shery, are that
Gambia in 2000 and 2001.
the mesh sizes do not normally comply with regulations. Smaller mesh
sizes are often used, resulting in the catch of small juvenile shrimps and
Table 33
Unlicensed/delinquent vessels in The Gambia.
fi sh. Small shrimp are retained and sold at lower prices while juvenile
Number of
Number of vessels
Violating
Number of
Year
violating
or small fi sh are discarded. This constitutes a serious waste of resources
spotted
regulations (%)
arrested
regulations
and a destructive and unsustainable way of fi shing. As there are no
2000
816
85
10
7
closed seasons or restrictions on the fi shing zones for shrimps and also
2001
103
8
8
5
no rigorous enforcement of the mesh size regulations, estuarine shrimp
(Source: Jones pers. comm.)
fi shing by artisanal small-scale fi shermen has become a destructive
fi shing activity.
With increasing eff ort and declining fi sh resources, artisanal fi shermen
Shark fi shing
are also motivated to go further out to sea in search of fi sh, thus going
The development of a distinctive artisanal shark fi shery started towards
beyond the area reserved for them and entering the industrial fi shing
the end of the 1960s, pioneered by an immigrant Ghanaian fi shing
zone where they come into confl ict with industrial fi shing trawlers.
community that had developed specialised skills in the catching,
Despite the regulations delimiting fi shing zones and all the eff ort being
processing and exporting of dried, salted shark meat from their base in
made to monitor and control industrial fi shing, several vessels annually
The Gambia (Saine 2000). These Ghanaian shark fi shermen now operate in
are caught poaching (fi shing without license) or fi shing in the wrong
coastal countries throughout the region from Mauritania to Guinea. In the
zone or using unauthorised/illegal fi shing gear. The Sub-Regional
early 1970s a lucrative shark fi n market emerged in Southeast Asia. Prior to
Marine Fishing Surveillance Project (AFR/013) of the Sub-Regional
these dates, there was no direct intense targeting of sharks by the artisanal
Fisheries Commission (SRFC) based in Banjul reported that between
fi shery. By-catches were simply processed, marketed and consumed.
2000 and 2001, only 12 out of a total of 93 vessels were arrested after
being spotted by the Project's aerial surveillance aircraft while violating
The shark fi shing industry has become a lucrative business because of
fi sheries regulations (Lux-Development/FAO/SRFC 1999).
the attractive prices being paid for shark fi ns in Southeast Asia. In a bid
to land more shark fi ns, artisanal fi shermen have cut off the fi ns of the
Use of explosives
animals and the living animals are thrown back into the water. A new
With diminishing fi sh stocks, artisanal fi shermen in some countries
twist in the shark fi shing techniques is the use of dolphin meat as bait
in the region such as Senegal and Mauritania, have resorted to using
(Anane 2001).
explosives in fi shing. It has been unanimously acknowledged that the
use of dynamite destroys the rocky zones that are essential breeding
Scientists at Ghana's Centre for Industrial and Scientifi c Research have
grounds for several important species.
concluded that shark fi shing contributes to the reduction of dolphin
populations in Ghanaian waters due to the use of dolphin meat as
Root causes
bait for catching sharks. This practice by Ghanaian fi shermen, leaders
The root causes of overexploitation of fi sh have been analysed for
of the shark fi shery throughout the West African region, is a danger to
industrial and artisanal fi sheries. Root causes are categorised under
dolphins, which are already protected as threatened species in several
these two themes as described below.
West African states.
Excessive fi shing eff orts - Industrial fi sheries
Poaching
Economic
Fisheries regulations in all countries of the region have reserved
Beginning in the 1970s most governments in the region implemented
the inshore and off shore parts of their fi sheries waters for artisanal
policies aimed at development of the industrial sub-sector by providing
60
GIWA REGIONA ASSESSMENT 41 CANARY CURRENT
assistance for the construction of fi shing vessels. These policies provided
Now that the national fl eets are able to exploit these stocks, and do so
industrial gear and semi-industrial vessels to the artisanal fi sheries and
fully, there is no reserve left over that could justifi ably be sold to any
resulted in the introduction of new types of coastal demersal fi shing. All
foreign fl eet. The real reason for these agreements could be assigned to
these interventions invariably resulted in overcapitalisation.
the huge fi nancial compensation off ered by the European Community
to the signatory coastal countries.
In the early 1980s, government support was oriented toward facilitating
the development of fi sheries products for exports. This support
Scientifi c knowledge
included the provision of duty-free concessions and incentives
The management of the stocks is largely based on scientifi c knowledge
such as exemptions from various duties (subsidy on export, 25% for
related to biological, economic, sociological and technological factors.
value-added industrial products) and taxes (Deme 1999). The Lome
The limited scientifi c knowledge concerning some of the stocks
Convention facility, which granted a duty and tax exemption for
constrains the participants from using optimal strategies and tactics
fi sheries products entering Europe from ACP countries, along with
and establishing plans for responsible use necessary for the sustainable
fi shing agreements contributed to the increasing link of the sector to
development of the fi sheries sector.
external markets for countries in the region.
Governance
The objective of all this fi scal support was to facilitate the establishment
Management of the fi sheries sector in virtually all countries of the
of fi sh-processing enterprises to take advantage of the growth in world
region is characterised by an ineffi
cient system of the monitoring,
demand for fi sheries products, notably in developed countries. This was
control and surveillance. The inadequacies in the monitoring, control,
expected to reduce the balance of trade defi cit through the acquisition
and surveillance systems are blamed for the frequent incursions by
of foreign exchange. The activities of these numerous enterprises have
industrial vessels into the coastal zone reserved for artisanal fi shing
exacerbated the demand for exportable products, resulting in the
(spawning grounds), the use of unauthorised fi shing gear, destruction
intensifi cation of the fi shing eff ort and seriously threatening demersal
of the resources and the marine environment, frequent illegal fi shing
stocks.
(poaching) by unlicensed industrial vessels and the fraudulent shipment
of catches at sea to the detriment of local markets and industries.
Institutional
Countries of the region have signed fi shing access agreements with
The regulations are, in some cases, inappropriate and diffi
cult to
foreign countries and interest groups, by far most the important of
implement. Both fi sheries regulations and legislation are characterised
which are those with the European Union that target already highly
by a command and control approach, which is further limited by a
threatened species. Presently, all the countries in the region bordering
lack of education, information and communication. National and local
the Atlantic Ocean, excepting The Gambia, have an ongoing fi shing
advisory bodies do not have suffi
cient power to make decisions. All
agreement with the European Union. These agreements were entered
these practices constitute a serious threat to the sustainability of the
into primarily because the stocks were believed to be abundant enough
fi sheries and to the maintenance of biodiversity. They encourage the
to satisfy the requirements of citizens of the countries in the region
overexploitation of resources, particularly coastal demersals.
and also because the countries did not have the capacity to exploit
their fi sh stocks.
Political
For strategic and empowerment purposes, and to enhance their
The fi shing agreements are viewed by several experts as one of the
negotiating capabilities, operators in the industrial fi sheries sub-
main causes of overexploitation of the marine resources in African
sectors have formed diff erent Socio-Professional Organisations (SPO)
countries. By lowering the production costs of fi shing units, the
such as the Association of Vessel Owners and Industrial Marine Fisheries
agreements encourage them to fi sh beyond the economic optimum
(GAIPES), the Union of Fishermen and Export Traders in Senegal
compatible with sustainable use of the resources. Furthermore, since
(UPAMES) and the Association of Industrial Fishing Companies in the
the agreements involve specifi c, allocated industrial fi shing, the vessels
Gambia. These SPOs, at the political level, are powerful lobbies that
would not hesitate to reject non-target species or small individuals, in
protect the interests of their profession members. These interests are
order to maximise the value of their catches. On the other hand, this
not always in the best interests of sustainable development and use of
fi shing activity by foreign fi shing fl eets is not being properly monitored
the fi sheries resources.
due to the lack of adequate surveillance resources.
CAUSAL CHAIN ANALYSIS
61
Excessive fi shing eff ort - Artisanal canoe fi sheries
fuel subsidy had an important impact on the increase in the time spent
Demographic
at sea by hand-line canoes equipped with iceboxes. This contributed to
At the current growth rate of around 2%, the population of the region,
the intensifi cation of fi shing eff ort for demersal fi sheries. Maintaining the
will increase by two-fold practically every 25 years. This population
subsidy under current conditions, where the profi tability of fi shing units
explosion is linked to a high urbanisation rate essentially due to rural
targeting the export market has improved, is no longer justifi able.
migration. The urban population could soon exceed 60%. There will be
a net increase in the demand for fi sheries products by the local market
These eff orts by the countries involved have enabled the sub-sector to
as well as for export. If the 22 kg consumption per capita estimated for
be modernised and integrated into the world market. Far from confi ning
the urban area is maintained, the demand for fi sheries products would
itself to simply supplying the local market, new types of artisanal fi shing
be 1 million tonnes in 2012. To maintain the same level of export, the
have been developed for export markets (cage fi shing, for example).
production of about 2.1 million tonnes would be necessary.
This redeployment of artisanal fi shing eff ort to supply the international
market, stimulated by the present administrative set-up, contributed
Poverty and lack of awareness
largely to the current state of demersal resources overexploitation.
The poverty rate in the coastal zones of the region is particularly high
Because the artisanal sub-sector provides raw material (more than 60%
and there is a great dependence on coastal resources, particularly fi sh,
in Senegal) for factories, these indirect subsidies also benefi t the export
for income generation and food security. Generally, resource users, the
operators to the same if not greater extent than local populations.
coastal communities and other stakeholders lack awareness about
the state of the resources and the eff ects of overexploitation on its
Overexploitation of demersal resources is likely to worsen, especially
sustainability.
since the possibility of reconverting artisanal fi shers is limited.
Although it is evident that some of the resource users are aware of the
Institutional
problems with regard to the general state of the resources, poverty
There are no fees or requirements that govern entry into artisanal fi shing
and the absence of alternative sources of livelihoods compel them
or access to the resource. This free and open access to the resource
to persist in these unsustainable resource use practices. Most of the
partly explains the industry's spectacular growth. For example, in
resource users and other stakeholders have known nothing aside from
Senegal, the artisanal canoe fl eet grew from a few hundred units in
fi shing and fi shing-related activities for their livelihoods. The changing
the 1960s to close to 15 000 canoes today. This sub-sector accounts for
trends in society and cultural values have little positive eff ects on how
more than two-thirds of fi sheries production, yet operates without any
they view these resources, along with ownership and access. Generally,
control on its fi shing eff ort. The free and open access to the fi sheries
these resources are considered common property and open-access
resource has enabled industrial fi shers without fi shing licenses to have
resources.
access to the resource by collaborating with or sponsoring artisanal
units. Close to 95% of the Senegalese canoe fl eet targets coastal
Economic
demersal species.
Initially, the state intervened in favour of production by the artisanal
sector, and in this connection motorisation of canoes was facilitated.
Socio-cultural
Outboard engines became the trend in the artisanal fi sheries sub-
Generally, the artisanal fi shing profession is handed down from
sector. Motorisation was accompanied by several supporting provisions,
father to son. With the particularly high demographic growth rate
such as duty waivers, fuel subsidies, and the creation of fi nancial
in fi sheries communities, the opportunities for reconversion are very
institutions to fund the sector. The objective was to reduce production
limited and with the economic crisis aff ecting most countries in the
(exploitation) costs of the artisanal fi shing units to enable them supply
region, the number of artisanal fi sheries operators is bound to increase
the local market with prices commensurate with the incomes of the
exponentially. As resources are not unlimited, there is the possibility
local population.
of a biological disruption of several demersal species if the present
tendencies are not reversed.
The fuel subsidy for artisanal canoes was a determining factor in the
modernisation of fi shing equipment. It enabled fi shermen to use more
Governance
powerful outboard engines and bigger canoes, and to stay longer at sea,
The artisanal fi sheries in the region operate with several diff erent types
which allowed access to new fi shing grounds. There is no doubt that the
of gear and target diff erent species at the same time. They operate on
62
GIWA REGIONA ASSESSMENT 41 CANARY CURRENT
a long coastline (Mauritania 745 km and Senegal 531 km) and land on
compliance with the regulations governing their activities. This is
countless fi sh landing sites (more than 200 in Senegal, about 50 in The
not the case with all Senegalese registered vessels. National vessels
Gambia). Confronted with scarce resources in waters under Senegalese
commit the majority of recorded infringements, or incursions into
jurisdiction, the artisanal fi shermen are now found in several coastal
reserved zones, mesh-size violations, and the use of unauthorised gear
countries of the region (The Gambia, Mauritania, Guinea-Bissau).
by licensed vessels.
Additionally, as a way to fi sh all year round, artisanal fi shermen have
adopted the use of a combination of several types of gear. Because it is
Unsustainable fi shing practices - Artisanal fi shing
a very complex sub-sector, artisanal fi shing is faces acute governance
Economic
problems in its management. The situation is made more diffi
cult by
By off ering attractive prices for certain desirable species, hotels
very limited logistical and human resources for the administration of
encourage the fi shing of immature species (small White groupers,
the fi sheries.
young Pink sea breams, lobsters and small-sized locust lobsters). An
increase in these activities has been reported as related to tourism in
Political
the region. In Senegal, the large demand from fi sh feed meal factories
In all of the countries in the region, recognised Socio-Professional
in Dakar and traders from countries in the Gulf of Guinea also encourage
Organisations (SPO) bring together actors in the artisanal fi sheries sub-
the landing of juvenile fi sh.
sector. Actors in all areas of activity are involved; fi shing, marketing, and
artisanal processing of fi sh products. In Senegal, these organisations
Socio-cultural
have created a federation to better defend their interests. This big
Beach seines with nets more than 1 000 m in length represent the gear
lobby of artisanal fi shermen through their infl uential SPO is blocking
used by a great percentage of the canoe fl eet. Ownership profi les show
the institution of an artisanal fi shing license system.
that these units are in general village-based. Although beach seines
play a vital role in production and socio-economic development,
Unsustainable fi shing practices - Industrial fi shing
they mostly capture juvenile fi sh and thus seriously threaten the
Economic
sustainability of the fi shery.
A factor accelerating the reduction in species abundance is the discards
at sea by industrial freezer trawlers, which retain individuals of acceptable
Institutional
size while rejecting small juvenile fi sh caught by their nets. These
A lack of enforcement of regulations has enabled certain artisanal
discards, which constitute a waste of precious diminishing resources,
operators to resort to illegal fi shing techniques (fi shing with explosives
pose socio-economic risks as they aff ect the catch of other fi sheries that
in Senegal and Mauritania) and gear (mono-fi lament, nylon nets in
target these rejected species. Discards also have a signifi cant impact on
almost all states of the region). Such practices are largely responsible
the equilibrium that exists among the diff erent exploited stocks.
for the destruction of marine fauna and fl ora. It has been unanimously
acknowledged that the use of dynamite destroys the rocky zones that
Institutional
are essential breeding grounds for several important species. These
Unsustainable fi shing practices by the industrial fi sheries sector
nylon nets are non-biodegradable and therefore remain in the sea.
can be attributed to a lack of compliance with fi sheries regulations.
A lack of enforcement of the mesh size regulations and the allowed
The presence of observers aboard licensed industrial fi shing vessels
minimal sizes and weights for fi sh to be landed also exacerbates
operating within the framework of fi shing agreements ensures
overexploitation of the resource.
CAUSAL CHAIN ANALYSIS
63
Policy options
This section aims to identify feasible policy options that target key components identifi ed in the Causal chain analysis in order to minimise
future impacts on the transboundary aquatic environment. Recommended policy options were identifi ed through a pragmatic process
that evaluated a wide range of potential policy options proposed by regional experts and key political actors according to a number of
criteria that were appropriate for the institutional context, such as political and social acceptability, costs and benefi ts and capacity for
implementation. The policy options presented in the report require additional detailed analysis that is beyond the scope of the GIWA
and, as a consequence, they are not formal recommendations to governments but rather contributions to broader policy processes in the
region.
Stream flow modification ş
Senegal River Basin
Definition of the problem
of new development, to assure food security, to create jobs
and to guarantee a good livelihood for the populations of the
Stream fl ow modifi cations were observed in Senegal River Basin at
Basin, particularly in urban zones that are subjected to a strong
levels equivalent to what can be seen in other basins of the region.
demographic pressure.
The main consequence is the problem of water resources availability,
Technologies used are limited or are inappropriate. It is the reason
in terms of quantity or quality.
why water resources control and use in the Basin have not been
mastered and installations are generally poorly designed. This is
The major causes of stream fl ow modifi cation in the Senegal River relate
due essentially to the insuffi
ciency of fi nancial resources and to the
primarily to climatic change, population growth and its implications,
lack of education.
problems in implementation of appropriate management, and
Constraints related to water resources management are the
insuffi
ciencies in technology and fi nancial resources. These causes are
insuffi
ciency of knowledge and tools for monitoring, the absence
summarised as follows:
of an appropriate institutional setting, the absence of water and
Since 1968, the climate of the region has been characterised by
environment regulations or their lack of enforcement, and the lack
decreased and irregular rainfall and thus a reduction in river fl ow.
of stakeholder accountability.
Demographic growth has resulted in pressing demands from
water infrastructure installations in order to supply the needs
64
GIWA REGIONA ASSESSMENT 41 CANARY CURRENT
Policy options
Feasibility studies and environment impact assessment studies should
be realised in a systematic way for all projects in order to identify and to
Diff erent actions can be carried out to face these problems and to
evaluate the risks early on and to carry out the necessary accompanying
ameliorate the impacts of the reduction of freshwater resources in
measures (preventive or curative). The insuffi
ciency of fi nancial resources
the Senegal River Basin. For each major cause, specifi c measures and
of the populations and the institutions involved is also one of the major
recommendations that have been identifi ed from the previous analysis
constraints that is linked to demographic aspects. To this end, a better
are described below.
organisation of the trade relationships for agricultural products and
a better distribution of wealth (loans, investments in infrastructures)
Reduced precipitation
are also essential to fi ght against poverty in the Basin, to improve the
This phenomenon is very complex and its scale exceeds the framework
fi nancial resources of populations in order to enable them to get better
of the Basin, since it has a regional or even a worldwide extent and
water-saving technologies.
implications. Its temporal evolution in the region is not well known, as
even time series show an alternation of dry and wet periods. However,
Water sector technology
a predominance of dry years has been observed after 1968, but it would
The weakness in technology is due primarily to insuffi
cient fi nancial
be diffi
cult to conclude with certainty about future climatic trends
means for intervention. It is also due to the lack of professionalism and
based on these records. Nevertheless, the persistence of this tendency
the lack of enforcement of regulations. The means for intervention
is worrisome in view of the history of the Sahara Desert, which was once
and fi nancial resources could be reinforced by better organisation
wet and populated. Some Senegal River tributaries such as the Ferlo are
of trade relationships and a better distribution of wealth. Educating
not active anymore because of climatic change, which is also the reason
and sensitising the population would make it possible to improve
behind a general decrease in groundwater recharge.
professionalism of diff
erent breeders (farmers, fi
shermen, and
technicians) in terms of water-saving technologies, pollution control
Taking into account the space and time scale variation of this
and the appropriate design of installations. To this end, it is also essential
phenomenon, the actions to be carried out should be implemented
to create a system for feasibility studies as well as environmental impact
within the framework of regional programmes aiming at limiting
assessment studies for each planned project.
the negative eff ects of climate change; soil and water conservation
(protecting the existing vegetation cover and reforestation),
Agriculture practices such as cultivation after slash-burning and
preventing the use of inappropriate agricultural practices, preventing
deforestation, bush fi res, ineffi
cient irrigation systems and poorly
bush fi res, controlling atmospheric pollution, and coming up with a
designed drainage systems, and misuse of fertilisers and pesticides
system for environmental impact assessments for all new projects.
should all be banished. Taking into account the increase in water
These programmes should also be accompanied by monitoring of
demand, the re-use of treated water is one possible way to increase
environmental indicators, with scientifi c research and by environmental
water resource availability. The Senegal National Sanitation Board
education and sensitisation activities.
(ONAS) produces nearly 10 000 m3 per day of treated wastewater,
which can be made profi table for farm gardening, reforestation and
Demographic aspects
arboriculture. In urban areas, it is essential to improve purifi cation
The Senegal River Basin is far from being overpopulated. Certain parts
systems to reduce groundwater pollution by nitrates. In the Thiaroye
of the Basin such as the FalÚmÚ and Ferlo basins are even under-
area in Dakar, the nitrate concentration in the aquifer can reach
populated. What is needed however, is an appropriate land use
200 mg/l, which compromises its use as drinking water.
planning strategy that would:
Avoid the population concentration in the irrigated perimeters;
Water governance
Avoid the pollution of water resources;
Many problems related to the management and the mobilisation of
Better distribute the resource between areas with a surplus of water
water resources in the Senegal River Basin are in reality due to the lack
and others with water defi cits;
of good governance. Some examples of this problem are:
Facilitate the access to water in order to avoid the confl icts between
The
ineffi
ciency of the actual institutional setting which in general
users;
encompasses non-functional structures;
Limit the risks of fl oods;
The absence of democracy or the lack of inclusion of all stakeholders
Optimise existing infrastructures.
in the design of the projects or in the decision-making process;
POLICY OPTIONS
65
The lack of information dissemination;
management will have to accompany all governance measures, in
The failure to enforce existing regulations (water and environment
particular the implementation at the local, national and regional level of
laws) or the insuffi
ciency of these regulations;
the various laws, agreements and regulations (Water Code, Environment
The
insuffi
ciency of the coordination of existing regulations;
Code, Forest Code, Cleansing and Hygiene Code, Charter of the Irrigated
The
insuffi
ciency or the absence of monitoring indicators;
Field, OMVS Charter of Water) and the diff erent planning tools at the
The
insuffi
ciency of education and sensitising policies concerning
community level (Local Plan of Development, Plan of Installation and
good agricultural and forest practices, and appropriate water
Land Occupation).
management technologies.
Finally, the following concerns must also be addressed:
Monitoring
of
diff erent indicators and the inclusion and informing of
all stakeholders through dialogue and management committees;
Identified policy options
The creation of a system for feasibility and environmental impacts
studies for all projects;
Addressing these problems will require major changes. Attention
The reinforcement of fi nancial capacities in both institutions and
should also be paid to the transboundary issues, since water resources
residents by establishing agricultural credit and equitable sharing
in the Basin are shared and the problems are quickly transported
of national resources.
elsewhere, whether the proliferation of invasive plants, or the transport
of pollutants and water-borne diseases, or other, similar problems that
know no boundaries. This demonstrates how essential it is to maintain
permanent appropriate institutional organisations such as the
Organisation for the Development of the Senegal River Basin (OMVS)
and the irrigated domain network of the Management and Exploitation
Society for Senegal Delta River (SAED) and to promote and implement
the diff erent existing regulations related to water and environmental
law in the countries concerned.
Conclusions and
recommendations
Senegal River Basin is a good example of how joint programmes
can be implemented in the context of a regional institution such
as OMVS. The consolidation of OMVS assets is one of the major and
immediate options to be pursued, particularly a concerted follow-up
and monitoring of the water resources at the basin scale. Institutional
instruments such as the Environment Observatory are one possible
way to ensure the monitoring and the management of the River Basin.
The Standing Committee of Water (Commission Permanente des Eaux,
CPE) constitutes a framework for dialogue concerning the technical
aspects of water resources management; the committee can formulate
and present recommendations for the Ministers' Council. The role of
these two bodies (the Environment Observatory and CPE) should be
reinforced.
Capacity building in the institutions in charge of water resources
66
GIWA REGIONA ASSESSMENT 41 CANARY CURRENT
Lowering of the water table ş
Souss-Massa River Basin
Definition of the problem
Policy options
In many cases, the great expansion of irrigated lands using groundwater
Three options for water resource exploitation are presented and ranked
has caused the overdraft of aquifer reserves largely beyond their
from the least feasible to the most workable.
recharge capacity. This process may lead to depletion in the mid-term.
Five main root causes for lowering of the water table in the Souss-Massa
Governmental control
River Basin were identifi ed:
Government agencies collect water and distribute it to users without
Demographic growth and population changes;
any charges and the cost are fully supported by the government. The
Socio
-
cultural
constraints;
consequences of such a policy are:
Governance and enforcement of water regulation;
Free water results in poor effi
ciency in water use;
Technological
changes;
A burden on the government budget.
Economic
causes.
This option is not workable because of scarce fi nancial resources. This
The approach aims to create a management system of the aquifer
policy prevailed in Morocco up until the 1980s within the framework
as well as to explore appropriate techniques for its appropriate
of a planned economy governed by the objective of "food self-
exploitation. The following analysis considers both supply and
suffi
ciency" mainly for strategic crops, primarily sugarcane and sugar
demand management, including socio-economic and environmental
beets, vegetable oil, soft wheat, milk, and meat.
perspectives. Therefore the process must involve the majority of
economic and social agents aff ected.
Free market distribution
The free market would be the most effi
cient way to allocate water
The development of management tools, which can harmonise
resources among users. But water is actually not a good that can be
resource exploitation while ensuring suffi
cient reserve sustainability,
freely traded; instead its trade is ruled by customs and Islamic inheritance
must therefore be an objective of any potential policy. The purpose of
practices (i.e. the Moroccan Ulama Malekite school interpretation) and
the policy options are:
the fact that the rights to most water resources in Morocco belongs to
Basin
level:
the government. Therefore this setting can be made workable only if
- Increase agricultural and non-agricultural production.
the following two-stage scheme is considered:
- Improve
effi
ciency of water use.
Basin level: Government fi nancing; government agencies will
Local
level:
take care of environmental issues (erosion, reforestation, pollution
- Satisfy domestic and industrial needs for water;
prevention)
- Provide agriculture with enough irrigation water;
Local level: Supply and demand basis: concession approach; a
- Alleviate transaction costs linked to regulation enforcement;
cost and benefi ts analysis will have to be employed in decision-
- Generate
a
technological
change;
making.
- Shift farmers' behaviour toward more rational water use.
Holistic approach
The situation in the Souss-Massa Basin is paradoxal: Water supply
The general framework of this scenario assumes a clear understanding
decreases and demand for water increases while production intended
of an integrated system (technical, institutional, political and economical
to increase. Proper socio-economic management can be achieved
settings) and full stakeholder participation through consultation and
only if it is founded on a decision making process which takes into
education (Figure 26). It is only through this participation that benefi ts
consideration the diff erent possible options.
from future actions can eff ectively be transferred from the level at which
policies are made down to the people aff ected by them.
POLICY OPTIONS
67
The GIWA Task team expects this policy to result in:
ARB
DEEE
ONEP
RAMSA
ORMVASM
Some technological change (more progressive irrigation systems)
Changes in cropping patterns (the introduction of more value-
added crops)
Local
communities
CRGEO
Institutional instruments
Water user
associations
Any pricing policy will not work without institutional change. In fact, the
institutions, rules and property rights needed for reform already exist,
Prospecting & Increasing
Water
- Distribution
but they are not operating eff ectively. Moreover, there is no alternative
water resources
production &
- R&M of the distribution
- Dam maintenance
mobilisation
network
for existing institutions because at this stage, the market cannot allocate
- New dams
- Information, Education
- Groundwater
Water recycling
on water savings
water resources based on supply and demand.
- Water saving
& reuse
- Sanitation
- Water quality
Regulation and governance could be the responsibility of para-state
CRGEO: Regional Council of Coordination, Management and Water Savings; DEEE: Water, Environment and Equipment Department;
ARB: Regional Basin Agency; ONEP: Drinking Water Agency; ORMVASM: Souss Massa Irrigation Agency; RAMSA: Agadir Drinking Water Agency
agencies that are already established in the region. Their mission would
Figure 26 Local water management system in the Souss-Massa
be guided by:
River Basin.
Governance will be achieved by para-state agencies with
autonomous fi nancing status
The policy option most suitable for the Souss-Massa case is based on:
Para-state agencies will also have responsibility for education,
The existing water law (1995);
information and creating awareness about water use and the need
Existing regulations ("Code des Investissments Agricoles");
for environmental protection.
Traditional water rights and local rules.
Given the previous facts, this option is intended to be eff ective, effi
cient,
equitable and politically feasible.
Identified policy options
Economic instruments: Pricing policy
The expected results of the recommended policy are as follows:
Prior to the 1980s, Morocco employed diff erent pricing policies, ranging
from a land betterment levy, volumetric charges, and pumping charges.
Effectiveness
From 1983, agricultural sector adjustment reforms have been introduced
An adequate pricing policy will: (i) have an eff ective impact on non-
and one of the main concerns is about the impending water shortage
agricultural water use (rational, not wasteful, water use); (ii) improve
and the need for conserving water and managing demand.
water governance and lower transaction costs; and (iii) encourage
technological changes (water-saving techniques).
The proposed water price for Souss-Massa case should include:
(i) private cost (cost of pumping); and (ii) social cost, to partially
Efficiency
compensate for the damage caused by overexploiting the aquifer.
No additional cost is required to implement and enforce the proposed
To make irrigation water use more rational, and to take in to account
policy and more advantages are associated with this policy (rational
the root and immediate causes, any pricing policy should embody
water use).
a component of fi nancial cost (fully or partially) and the social cost
(environmental variable). Moreover, the irrigation water charge should
Equity
be one that is aff ordable, even by small producers.
Price scaling according to acreages and volumetric charges are
fundamental techniques for ensuring equity in cost distribution.
Based on the principles listed above and using various techniques to
lower transaction costs, this should result in fi nding "the right price". A
Political feasibility
volumetric charge and the acreage involved might be two criteria that
Agreements between stakeholders (users, government agencies, NGO's)
would give farmers incentives to conserve water.
could be reached via the existing High Council for Water and Climate at
the national level and the Water User Associations at the local level.
68
GIWA REGIONA ASSESSMENT 41 CANARY CURRENT
Conclusions and
recommendations
In the Souss-Massa Basin, even under the best planning conditions, the
current rate of water usage is unsustainable if no drastic water policy
changes are made. The overpumping of the aquifer has resulted in
signifi cant water level declines and by the year 2010, groundwater levels
will be suffi
ciently low in some locations that it may be uneconomical
to pump. Some land now under cultivation may have to be abandoned,
with an associated loss of agricultural employment.
The lowering of the groundwater table is further complicated by the
use of inappropriate well digging technology that is similar to that used
by commercial oil prospecting companies. The policies thus far used
have failed to give local farming communities the necessary incentives
to participate in responsible water management decisions, both from
the perspectives of technology use and water pricing.
Furthermore, with the current irrigation systems and practices, there
is a little opportunity for change without implementing new policies
and mechanisms that encourage adoption of innovative water-saving
technologies. The effi
cient use of water is therefore not adequately
addressed in the region, despite the fact that water is a scarce factor
in agricultural production and that the groundwater resource is being
overused.
The most critical water management issue in the region will be the
ability of the River Basin Management Authority to reverse or slow the
declining water levels in the aquifer to prevent the cost of pumping
water from becoming too excessive for economical crop production.
Unless policies are implemented to conserve water, the export
economy of the Souss-Massa Basin may decline with severe economic
impacts to the region.
For the Souss-Massa region and for Morocco as a whole, ongoing
global climate change will have a pervasive infl uence on the future
demand, supply and quality of freshwater resources, and will add
pressure to water and environment resources, and coastal systems
currently under stress. All sectors of the economy, environment and
society may be vulnerable to one degree or another, and measures
to increase the capacity to adapt to greater climatic and hydrological
variability, including more frequent fl ood and drought extremes will
be required.
POLICY OPTIONS
69
Overexploitation of fish ş Canary Current
Definition of the problem
or unfavourable terms of trade aff ecting other products. Furthermore,
fi shing remains the only sector open to those who have lost
Excessive fi shing eff ort
opportunities in the other sectors of the economy.
The artisanal fi sheries, which account for a large proportion of the
fi sheries production throughout the region, have always operated
The feasibility of an artisanal license system poses a number of
outside of the system that controls fi shing eff ort. Free access to the
problems also linked to the availability of certain basic information
fi sheries resources is not without undesirable eff ects on fi shermen,
to determine the optimal number of licenses for canoes, gears and
who are faced with problems of overproduction and low prices during
tonnage. A license system also requires people and mechanisms for
periods of glut.
control and regulation of the system like administrative staff , material
and fi nancial resources. The artisanal fi sheries sector operates along a
Unsustainable fi shing practices
several hundred kilometres-long coastline with more than 1 000 landing
The use of unsustainable fi shing methods and gear has signifi cantly
sites and countless related ancillary service providers. Confronted with
exacerbated the overexploitation of resources in most coastal countries
declining resources, artisanal fi shers have adopted several strategies so
of the West African region. The consequences are inter-connected;
they can fi sh year-round: migration along the coast and a combination
decreased catches, increased production costs, disruption in supplies
of diff erent kinds of fi shing gear.
to local markets and threats to household food security.
Regulation of access to resources
This method of regulation aims to set the mesh sizes of fi shing nets
and trawl nets used in the fi shery, the minimum authorised sizes and
Policy options
minimum weights of species that could be landed and the prohibition
of certain types of fi shing such as explosives, drift nets, beach seines
Artisanal fishing license system
and mono-fi lament (nylon) nets.
The current thinking in the region is to explore the possibility of
instituting a licensing system for the artisanal fi shing units as a way to
Immediate application of this management method could pose a
manage access to the resource. This approach will consist of controlling
problem of equity. In view of the high investments made by the fi shers
fi shing eff ort through various components, such as restricting the
to equip themselves with monofi lament nets, it would be necessary to
number of fi shing units and their actual fi shing capacity and the
grant them a grace period to allow them to time to change gear before
issuance of restrictive licenses. These licenses would confer fi shing
the strict application of all these regulations.
rights to license holders only. The benefi ts of issuing artisanal fi shing
licenses would be that it would be possible to control fi shing capacity
As far as effi
ciency is concerned, the proposed regulation would protect
and the catches by these fi shing units and it would also systematically
juveniles, reduce discards at sea and encourage the catching of bigger
eliminate excessive fi shing capacity.
individuals of commercial value. Thus, by modifying the selectivity
of fi shing gear, one modifi es the size of fi sh caught, and thereby the
However, an artisanal fi shing license system invariably poses the
average age at fi rst capture. The individuals protected as a result of this
problem of equity or fairness related to the allocation of the licenses
change could then contribute to the recruitment of future stocks. These
both in the choice of the fi rst benefi ciaries (fi shermens, canoe owners)
measures must be accompanied with measures aimed at exercising
and the conditions of issuance (the modalities and duration of licenses,
direct control of fi shing, such as a ban on the landing and marketing of
payment of fees etc.). The solution of this problem is critical as artisanal
species with sizes or weights below certain set limits.
fi shing is currently handed from fathers to sons, and it is unlikely that
those denied licences will convert to other ways of making a living.
This regulation is already being applied in the Senegalese fi sheries and
Other sectors of the national economy are already being undermined
is addressed by a provision in the Fishing Code. The main problem
by successive crises, for example, the drought, which aff ects agriculture,
is its effi
cient application. In Senegal, as in most coastal countries of
70
GIWA REGIONA ASSESSMENT 41 CANARY CURRENT
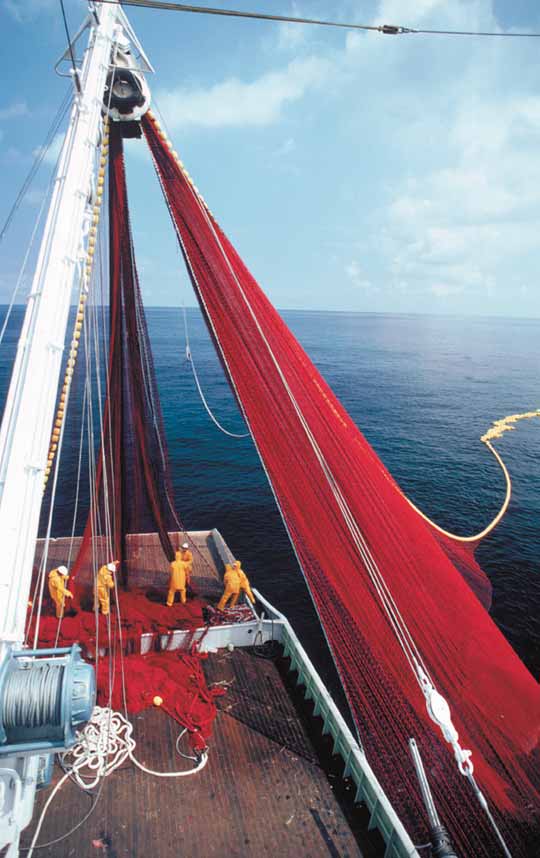
the region, a lack of enforcement of the fi sheries
regulations and the control and surveillance of
unsustainable fi shing methods and practices
can be attributed to the lack of adequate human,
fi nancial and logistical resources.
Banning use of the beach seine
The ban on the use of the beach seine, enacted
by the Gambian Parliament in 1989, could be an
example to be emulated in the region. But this
measure needs to be carefully assessed before it
can be applied in other states such as Senegal,
where banning use of the beach seine could
have far reaching socio-economic and political
implications.
Joint negotiation of fishing
agreements
The Sub-Regional Fisheries Commission (SRFC),
comprised of seven countries in the West African
region, has as its objectives the strengthening
of cooperation and coordination of member
states by coordinating policies on preservation,
conservation and exploitation of marine resources
in the region. It also works to develop regional
cooperation in the area of fi sheries surveillance
and to develop the capacity of states to conduct
fi sheries research at the regional level.
The motivation for the establishment of the SRFC
is the fact that several fi sh stocks are either shared
by one or two states or are highly migratory or
both. Successful management and sustainable
exploitation of such stocks requires regional
cooperation by the nations that share these
stocks.
The most signifi cant singular initiative of the
Sub-Regional Fisheries Commission (SRFC) is the
establishment of a mechanism that would enable
member states to conduct joint negotiation of
fi shing agreement with third parties seeking
access to fi sheries resources of member states. This
initiative has not made much progress because of
insuffi
cient commitment and political will on the
Figure 27 Tuna
fi shing boat at sea off the coast of Mauritania.
part of member states to see it through.
(Photo: Corbis)
POLICY OPTIONS
71
Conclusions and
recommendations
A primary initiative is to create a programme to promote the restoration
of sensitive and degraded marine habitats by the immersion of artifi cial
reefs. The objective of restoring degraded habitats is the reconstitution
of ecosystems to make them favourable for the return and maintenance
of species. Stabilisation of the ecosystems will contribute to keeping
artisanal fi shermen to the areas reserved for them. The promotion of
skills and reduction of confl icts between the diff erent fi sheries justifi es
this policy.
In recent years, national and local organisations and institutions in West
Africa have been working to promote coastal planning. Several Marine
Protected Areas (MPAs) have been established along the coastline
by West African states, chiefl y by state members of the Subregional
Fisheries Commission (CSRP). These areas make it possible to preserve
some of the coast's key hot spots which are of crucial importance for
the replenishment of fi sh stocks and biodiversity as a whole.
Coalition of environment and fi
sheries ministers from West
African nations have agreed to establish a network of national and
transboundary Marine Protected Areas in the region and restore
fi sheries to sustainable levels, among other goals. The Regional
Strategy for Marine Protected Areas in West Africa aims to allow the
harmonisation of protection eff orts within fi ve years, based on a shared
vision of sustainable development and poverty reduction. It will involve
the governments of Cape Verde, The Gambia, Guinea, Guinea-Bissau,
Mauritania and Senegal, which signed the Policy Statement in 2003.
72
GIWA REGIONA ASSESSMENT 41 CANARY CURRENT
References
ACOPS (2001). Report of the Consultations on the Second Phase of the
Balguerias, E. (1997). Discards in fi sheries form the eastern Central
GEF MSP Sub-Saharan Project Development and Protection of the
Atlantic. Technical consultation on reduction of wastage in fi sheries,
Coastal and Marine Environment in Sub-Saharan Africa (GF/6010-
Tokyo, Japan. FAO Fisheries Report No 547 Supplement. United
0016). Advisory Committee on Protection of the Sea.
Nations Food and Agricultural Organization, Rome, Italy.
Ait Kadi, M. (2002). Irrigation water pricing policy in Morocco's Large Scale
Baroud, A. (2002). Changements climatiques et gestion de l'irrigation dans
Irrigation Projects. Conference on Irrigation Water Policies: Micro and
la zone d'action de l'ORMVA du Souss-Massa. Offi
ce RÚgional de Mise
Macro Considerations. Agadir, Morocco 15-17 June 2002.
en Valeur Agricole du Souss Massa Agadir, Morocco. (In French)
Alibou, J. (2002). Impacts des changements climatiques sur les resources
Barry, M.D., Laurans, M., Thiao, D. and Gascuel, D. (2002). Diagnostic
en eau et les zones humides au Maroc. Report presented to the
de l'Útat d'exploitation de cinq espŔces dÚmersales c˘tiŔres
Mediterranean Water Week, jointly organisd by GWMed and IUCN.
sÚnÚgalaises. SystÚme d'Information et d'Analyse des Pŕches,
December 2002, Athens, Greece. (In French)
Symposium Siap. Dakar, Senegal June 2002. (In French)
Anane, M. (2001) Shark Exploitation in Ghana Hastens Global Collapse.
Batten, M.L., Martinez, J.R., Bryan, D.W. and Buch, E.J. (2000). A modeling
Environment News Service. Retrieved Jan. 2004 from: http://
study of the coastal eastern boundary current system off Iberia and
www.ens-newswire.com/ens/aug2001/2001-08-28-02.asp
Morocco. Journal of Geophysical Research 105:14173-14195.
Arthurton, R.S., Kremer, H.H., Odada, E., Salomons, W. and Marshall
BenAbderrazik, H. (2002). Pricing of irrigation water in Morocco.
Crossland, J.I. (2002). African basins: LOICZ Global change
Conference on Irrigation Water Policies: Micro and Macro
assessment and synthesis of river catchment - Coastal sea
Considerations 15-17 June, Agadir, Morocco.
interaction and human dimensions. LOICZ Reports and Studies No
Bousso, T., Diadhiou, H.D., Diouf, P.S. and Le Reste, L. (1993). L'aquaculture
25. LOICZ, Texel, The Netherlands.
en milieu continental au SÚnÚgal. p 343-363 In: Diaw, A.T., BÔ, A.,
AWRMI (2001). Africa Water Resources Management Initiative - A
Bouland, P., Diouf, P.S., Lake, L-A., Mbouw, M.A., Ndiaye, P. and Thiam,
Progress Report, 06/01. World Bank.
M.D. (eds.) Gestion des ressources c˘tiŔres et littorales du SÚnÚgal.
BÔ, M. (1992). L'Estuaire du Fleuve SÚnÚgal: Impact des Barrages de
IUCN. (In French)
Diama et Manantali sur la QualitÚ Chimique des Eaux. Gestion des
CIA (2003). The World Factbook. U.S. Central Intelligence Agency.
Ressources CotiŔres et Littorales du SÚnÚgal, Actes de l'Atelier de
CSE (1988). AmÚnagement optimal des eaux de l'oued Ouergha:
GorÚe. 27-29 July 1992, IUCN. (In French)
RÚalisation du barrage Mjara. Conseil SupÚrieur de l'Eau, Rabat,
Baddyr, M.S. and GuÚnette, S. (1998). The fi sheries off the Atlantic Coast
Marocco. (In French)
of Morocco 1950-1997. p 191-205 In: Zeller, D., Watson, R. and Pauly D.
CSEC (2001). Plan directeur pour le dÚveloppement des ressources en
(eds.) Fisheries Impacts on North Atlantic Ecosystems: Catch, Eff ort and
eau des basins du Souss Massa. Conseil supÚrieur de l'eau et du
National/Regional Data Sets. Fisheries Centre Research Reports 9:(3).
climat, Morocco. (In French)
Badiane, S. (1986). La mangrove de Casamance. p 82-88 In: Le Reste,
DaCosta, H. (1993). VariabilitÚ des prÚcipitations sur le bassin versant du
L., Fontana, A. and Samba, A. (eds.) L'estuaire de la Casamance:
Saloum. p 87-103 In: Diaw, A.T., BÔ, A., Bouland, P., Diouf, P.S., Lake,
environnement, pŕche, socio-Úconomie. Actes SÚminaire
L-A., Mbouw, M.A., Ndiaye, P. and Thiam, M.D. (eds.) Gestion des
Ziguinchor, June 1986, ISRA/CRODT, Dakar, Morocco. (In French)
ressources c˘tiŔres et littorales du SÚnÚgal. IUCN. (In French)
REFERENCES
73
Dahou, K. and Deme, M. (2001). Accords de pŕche UE- SÚnÚgal
El Mamoun, M. (1999). Les hors-circuits dans la pŕche c˘tiŔre au Maroc:
et commerce international respect des rÚglementations
Cas du port de Casablanca, d'Agadir, de Nador et de Tanger. ThŔse
internationales, gestion durable des ressources et sÚcuritÚ
de troisiŔme cycle. IAV. Hassan II. (In French)
alimentaire. Contribution Ó l'atelier L'impact des politiques
EROS Data Center (2002). Hydro 1K. Retrieved Nov. 2003 from: http://
nationales et europÚennes de pŕche sur la sÚcuritÚ alimentaire
edcdaac.usgs.gov/gtopo30/hydro/
des populations des pays en dÚveloppement, Dakar, SÚnÚgal, 12-13
ESRI (2002). Country borders. Data & Map CD-rom. Environmental
June 2001, CRODT/CEMARE (University of Portsmouth). (In French)
Systems Research Institute, Inc.Redlands, California, US.
Deme, M. (1999). International markets and sustainability of marine
FAO (1997). Irrigation potential in Africa: A basin approach. FAO Land
resources: Case of the Senegalese small-scale fi shery. Contribution
and Water Bulletin 4. FAO Land and Water Development Division.
to the Working Group Markets, Global Fisheries and development,
United Nations Food and Agricultural Organization, Rome, Italy.
Christian Michelsen Institute, March 22-23, Bergen, Norway.
Retrieved Feb. 2004 from: http://www.fao.org/docrep/W4347E/
Deme, M., Sall, A. and Samb, A. (2001). Approvisionnement du marchÚ
w4347e00.htm
local en produits halieutiques: contraintes et perspectives.
FAO (2002). Yearbook of Fishery Statistics, Summary Tables 2002.
Contribution Ó l'atelier L'impact des politiques nationales et
Capture production by countries and areas. United Nations Food
europÚennes de pŕche sur la sÚcuritÚ alimentaire des populations
and Agricultural Organization, Rome, Italy.
des pays en dÚveloppement, Dakar, SÚnÚgal, 12-13 June 2001,
Fedoseev, A. (1970). Geostrophic circulation of surface waters on
CRODT/CEMARE (University of Portsmouth). (In French)
the shelf of northwest Africa. Rapports et Proces-Verbaux des
Devey, M. (1997). SÚnÚgal. MarchÚs Tropicaux, NumÚro H.S. (In French)
Reunions Conseil International pour l'Exploration de la Mer 159:
Diagana, A. (1994). Etudes hydrogÚologiques dans la vallÚe du Fleuve
32-37. (In French)
SÚnÚgal de Bakel Ó Podor : Relations eaux de surface et eaux
Finger, D. and Teodoru, C. (2003). Case study Senegal River. ETH
souterraines. ThŔse de doctorat de troisiŔme cycle, UCAD. (In
Seminar on the Science and Politics of the International
French)
Freshwater Management. Retrieved Feb 2004 from http://
Diene, M. (1995). Etude hydrogÚologique, hydro chimique et isotopique
www.eawag.ch/research_e/apec/seminars/Case%20studies/2003/
de la nappe superfi cielle du ferlo septentrional (nord du SÚnÚgal).
Senegal%20River.pdf
ThŔse de doctorat de troisiŔme cycle. (In French)
Fonseca B.D. (2000). Expansion of pelagic fi sheries in Cape Verde:
Diop, M. 2001. General Report about Mauritania. Prepared for the GIWA
A feasibility study. The United Nation University Training
Scaling and Scoping workshop, Rabat, Morocco.
Programme.
Diop, S., Nakamura, T., Smith D. and Dkhaka, E. (2000). Implication of
Gac, J.Y. and Kane, A. (1986a). Le fl euve SÚnÚgal I - Basin hydrologique
Dams on the Freshwater and Coastal Environment and its Resources
et fl ux continentaux de matiŔres particulaires Ó l'embouchure.
in Senegal. World Commission on Dams env107.
Sciences Geologiques Bulletin 39(1):90-130. (In French)
Diouf, P.S. (1996). Les peuplements de poissons des milieux estuariens
Gac, J.Y. and Kane, A. (1986b). Le fl euve SÚnÚgal II - Flux continentaux de
de l'Afrique de l'Ouest: l'exemple de l'estuaire hyperhalin du Sine-
matiŔres dissoutes Ó l'embouchure. Sciences Geologiques Bulletin
Saloum. ORSTOM, Paris, Coll. ThŔses et Documents Microfi chÚs, No
39(1):151-172. (In French)
156. (In French)
Gambia Fisheries Department (1998). Fisheries statistics, The
Diouf, P.S., SanÚ, K. and Lankester, K. (2002). Workshop on the Promotion
Government of Gambia, Statistics Unit.
of Sustainable and Equitable Fisheries Access Agreement. p 46-50
Gambia Fisheries Department (2002). Fisheries statistics, The
In: Lankester, K., P. Diouf, S. and SanÚ, K. (eds.) Fisheries access in
Government of Gambia, Statistics Unit.
West Africa. Proceedings of the two workshops, Saly Portudal,
Gleick, P.H. (1998). The World's Water 1998-1999. Island Press, Washington
Senegal March 2001, and Nouakchott, Mauritania November 2001.
DC, US.
DGH (1999). Ressources en eau dans les basins Souss Massa et c˘tiers
Haddad, N. (1994). Evaluation de l'expÚrience de l'observateur
Nord d'Agadir: Etat actuel et perspectives d'avenir. Direction
scientifi que Marocain. ThŔse de Doctorat. Institut Agronomique et
GÚnÚrale de l'Hydraulique, Morocco. (In French)
VÚtÚrinaire Hassan II, Rabat, Morocco. (In French)
El Hannach, A. (1986). Estimation d'une partie des captures de la pŕche
Handschumacher, P., Herve, J.P. and G. Hebrard (1992). Des
non enregistrÚe au long de l'Atlantique Marocain (de Tanger Ó
amÚnagements hydroagricoles dans la vallÚe du fl euve SÚnÚgal
Agadir). Actes de l'IAV Hassan II 6(1):41-42. (In French)
ou le risque de maladies hydriques en milieu sahÚlien. SÚcheresse,
Paris, 219-226:3(4). (In French)
74
GIWA REGIONA ASSESSMENT 41 CANARY CURRENT
Hegazy, A.K., Fahmy, A.G. and Mohamed, H.M. (2001). Shayeb El-Banat
Mittelstaedt, E. (1991). The ocean boundary along the northwest African
Mountain Group On The Red Sea Coast: A Proposed Biosphere
coast: Circulation and oceanographic properties at the sea surface.
Reserve. Symposium on Natural Resource Conservation in Egypt
Progress in Oceanography, 26:307-355.
and Africa, 19ş21 March 2001. Cairo University, Egypt.
Morton, J and Sear, C. (2001). Challenges for drought management
IMROP (2002). National Mauritanian Institute for Oceanographic and
in West Asia and North Africa. Paper prepared for the Ministerial
Fisheries Research. 5th Working Group December 2002.
Meeting on Opportunities for sustainable investment in rainfed
IPCC (2001). Intergovernmental Panel on Climate Change Climate
areas of West Asia and North Africa. Rabat, Morocco, 25-26 June.
change: Impacts, Adaptation and Vulnerability. McCarthy, J.J.,
Niang, A. (1999). Suivi de l'environnement et gestion qualitative des
Canziani, O.F., Leary, N.A., Dokken, D.J. and White, K.S. (eds.)
eaux du lac de Guiers. Approche globale et perspectives de la
Cambridge University Press.
tÚlÚdÚtection et des systŔmes d'information gÚographique. ThŔse
IPS (2001). Three West African Nations To Ban EU Fishing Fleets. Report
3Ŕme cycle, GÚographie Physique, University of Dakar. (In French)
By Brian Kenety, 14 March 2001. IPS, Brussels.
Niang-Diop, I. (1993). Coastal erosion in Senegal. The case of Rufi sque.
IUCN (2002). Red list of threatened species, Summary statistics. Retrieved
p 75-89 In: Awosika, L.E., Ibe, A.C. and Shroader, P. (eds.) Coastlines
Feb 2004 from: http://www.redlist.org/search/search-basic.html
of Western Africa. ASCE, New York, US.
JICA (1999). Country Profi le on Environment: Senegal. Japan International
ONEM (2001). Rapport sur l'Etat de l'Environnement du Maroc.
Cooperation Agency.
Observatoire National de l'Environnement au Maroc. (In French)
Johnson, J. and Stevens, I. (2000). A fi ne resolution model of the eastern
Olivry, J.C. (1983). Le point en 1982 sur l'Úvolution de la sÚcheresse en
North Atlantic between the Azores, the Canary Islands and the
SÚnÚgambie et dans les ţles du Cap Vert. Examen de quelques
Gibraltar Strait. Deep-Sea Research 47:875-899.
sÚries de longue durÚe (dÚbits et prÚcipitations). Cah. ORSTOM,
Kent, B. and Ouattar, S. (2002). Groundwater mining of the Souss valley
Ser. Hydrol., Paris, XX (1):47-69. (In French)
alluvial aquifer, Morocco. Geological Society of America, Denver
ORMVA/SM (2001). Monographie. Conseil d'Administration Exercice.
annual Meeting, October 27-30.
Offi
ces rÚgionaux de mise en valeur agricole du Maroc. (In French)
LME (2004). Large Marine Ecosystems of the World: LME # 27 Canary
OMVS (2000). Programme d'optimisation de la gestion des rÚservoirs.
Current. Retrieved Feb 2004 from: http://www.edc.uri.edu/lme/
POGR, 2000-2001 Organisation pour la mise en valeur du fl euve
text/canary-current.htm
SÚnÚgal. (In French)
LME (2005). Large Marine Ecosystems: LME Canary Current.
OMVS/SOGED. (2003). Etude pour la restauration du rÚseau hydraulique
Retrieved March 2005 from: http://saup.fi sheries.ubc.ca/lme/
du basin du fl euve SÚnÚgal, AGER. Organisation pour la mise en
SummaryInfo.aspx?LME=27
valeur du fl euve SÚnÚgal/ SociÚtÚ de Gestion et d'Exploitation de
Lux-Development/FAO/SRFC (1999). Consolidated Project Document,
Diama. (In French)
AFR/013 Monitoring, Control and Surveillance of Industrial Fishing in
ORNL (2003). Landscan 2002. Oak Ridge National Laboratory. Retrieved
the Member States of the Sub-Regional Fisheries commission.
Nov. 2003 from: http://www.ornl.gov/gist
MCE (2001). Statistic du MinistŔre du Commerce ExtÚrieur,
PNUD/ENDA (2001). Impacts socio-Úconomiques et environnementaux
Gouvernement du Maroc. (In French)
de la libÚralisation du commerce sur la gestion durable des
Malou, R., Dacosta, H., Gaye, A., Tandia, A. and. Diene, M. (1998). Etude
ressources naturelles : Útude de cas sur le secteur de la pŕche
de la vulnÚrabilitÚ des ressources en eau. Mesures d'adaptation et
sÚnÚgalaise. FÚvrier. (In French)
d'attÚnuation. Rapp. InÚdit, Dakar. (In French)
Powell, R., Bohman, J., Olson, E., Seem, J. and Giebus, B. (2003).The
Marius, C. (1985). Mangroves du SÚnÚgal et de la Gambie. PÚdologie,
Environment and Agriculture in Morocco. Retrieved Jan. 2004
gÚochimie, mise en valeur et amÚnagement. Trav. Doc. ORSTOM,
from: www.peacecorps.gov/wws/water/africa/countries/morocco/
Paris, 193. (In French)
enviroagric.html
Martins, O. and. Probst, J.L. (1991). Biogeochemistry of Major African
Ramsar (2002). List of Wetlands of International Importance. The Ramsar
Rivers: Carbon and Mineral Transport (part 6). In: Degens, E.T,
Convention on Wetlands.
Kempe, S. and Richey, J. (eds.) Biochemistry of Major World River.
Reiss, P, and Ouattar, S. (2002). Gestion intÚgrÚe des ressources en eau
Scientifi c Committee on Problems of the Environment. Wiley U.K.
dans le Souss-Massa, USAID-SIWM, Rabat, Maroc. (In French)
Mendy, A.N. (1996). Review of the situation of fi sh resources and
Rhodes, T.E. (1999). Integrating Urban and Agricultural Water
management measures implemented in The Gambia. Fisheries
Management in Southern Morocco. Arid Lands Newsletter No 45.
Department, The Gambia. Unpublished.
REFERENCES
75
Rochette, C. (1975). Monographie hydrologique du basin du fl euve
UNDP (2000). People and Ecosystems the Fraying Web of Life. UNDP,
SÚnÚgal, ORSTOM. (In French)
UNEP, World Bank, WRI 2000-2001. World Resources Institute,
Rue, O. (1994). UnitÚ et diversitÚ des mangroves de l'Afrique de l'Ouest.
Washington D.C.
Fiction pour un dÚbat. p 27-31 In: Cormier-Salem, M-C. (ed.)
UNEP (2002). Africa Environment Outlook, Past, Present and Future
Dynamique et usages de la mangrove dans les apys des RiviŔres
Perspectives. United Nations Environment Programme. Earthprint
du Sud (du SÚnÚgal Ó la Sierra Leone). ORSTOM, Paris, Colloques et
Limited, UK.
SÚminaires. (In French)
UNEP/CNROP (2002). Environmental impact of trade liberalization and
Sall, M.M. (1982). Dynamique et morphogenŔse actuelles au SÚnÚgal
trade-linked measures in the fi sheries sector. Draft document.
occidental. ThŔse Doctoral Etat Lettres. Strasbourg University,
United nations Environment Programme and Mauritanian National
Gemany. (In French)
Oceanographic and Fisheries Research Centre, Nouadhibou,
Sadio, S. (1991). PÚdogenŔse et potentialitÚs forestiŔres des sols sulfatÚs
Mauritania.
acides salÚs des tannes du Sine-Saloum. ORSTOM, Paris. (In French)
UNEP/ETP (2002). Integrated Assessment of Trade Liberalization and
Saine, A. (1999). Fisheries, International Trade and the Bio-diversity
Trade-Related Policies A Country Study on the Fisheries Sector in
Convention Case Study: The Gambia. Consultancy Report prepared
Senegal. United Nations Environment Programme/Economic and
for the International Union for the Conservation of Nature (IUCN).
Trade Programme. UNEP/ETB/2002/0010.
Saine, A. (2000). The Management and Conservation of Shark Stocks
UNESCO (2002). World Network of Biosphere Reserves 411 Reserves in
in The Gambia: Biological Aspects. Consultancy Report prepared
94 Countries. United Nations Educational, Scientifi c and Cultural
for the Sub-Regional Fisheries Commission (SRFC) within the
Organisation, MAB Secretariat, France
framework of the elaboration of a sub-regional Plan of Action for
Vincke, P.P and Thiaw, I. (1995). Protected areas and dams: the case of
the conservation of sharks and rays.
the Senegal River delta. Parks 5:2.
Saine, A. (2001). General report about Gambia. Prepared for the GIWA
Verhoef, H. (1996). Health aspects of Sahelian plain d'inondation
Scaling & Scoping workshop, Rabat , Morocco.
development. p 35-50 In: Acreman, M.C. and Hollis, G.E. Water
SGPRE (1994). Bilan Diagnostic des Ressources en Eau du SÚnÚgal.
management and Wetlands in Sub-Saharan Africa. UICN, Gland
Service de gestion et de planifi cation des ressources en eau,
& Cambridge.
Senegal. (In French)
WRI (2003). Watersheds of the World. World Conservation Union
SGPRE (1999). Etude bathymÚtrique et limnologique du lac de Guiers,
(IUCN), International Water Management Institute (IWMI), Ramsar
PSE. Service de gestion et de planifi cation des ressources en eau,
Convention Bureau, World Resources Institute (WRI).
Senegal. (In French)
World Bank. (2001). African Development Indicators 2001. The World
SGPRE/PNUE/DHI/TROPIS (2002). Vers une gestion intÚgrÚe du littoral et
Bank Washington D.C.
du bassin fl uvial du SÚnÚgal. Service de gestion et de planifi cation
Wooster, W.S., Bakum, A. and. McLain, D.R. (1976). The seasonal upwelling
des ressources en eau, Senegal. (In French)
cycle along the eastern boundary of the North Atlantic. Journal of
Swearingsen, W.D., and Bencherifa, A. (1996). The North African
Marine Research, 34:131-140.
Environment at Risk. Westview Press, Boulder, Colorado.
WHO (2001). World Health Organisation Statistical Information System.
Talla, I. (1992). L'Epidemie de Bilharziose Intestinale Ó Richard-Toll.
Retrieved Feb 2004 from: http://www.who.int/whosis
Gestion des Ressources C˘tiŔres et Littorales du SÚnÚgal, Actes de
Zhou, M., Paduan, J.D. and Niiler, P.P. (2000). Surface currents in the
l'Atelier de GorÚe, 27-29 July, IUCN. (In French)
Canary Basin from drifter observations. Journal of Geophysical
Tandia, A. and Dieng, Y. (2001). General Report about Senegal. Prepared
Research 105:21893-21911.
for the GIWA Scaling and Scoping workshop, Rabat, Morocco.
Tayaa , M. and Bazza M. (1994). Watershed and water resources in Morocco:
Personal communication
policy issues and priority areas for research. EPAT/MUCIA.
Dieng, Y. (Department of Parasitology, Faculty of Medicine and
Tayaa, M. (2002). ModŔle de Gestion des allocations Cas du barrage
Pharmacy, University of Cheikh Anta Diop, Senegal)
Abdelmoumen. Consultant report, Souss Integrated Watershed
Jones, J. J. (Director of Surveillance Operations Co-ordination Unit,
Management Project. USAID/ Morocco. (In French)
SOCU, Banjul, Gambia)
Ticheler, H. (2000). Fish biodiversity in West African wetlands. Wetlands
International. Wageningen, The Netherlands.
76
GIWA REGIONA ASSESSMENT 41 CANARY CURRENT
Annexes
Annex I
List of contributing authors and organisations
Name
Institutional affiliation
Country
Field of work
Lead author and coordinator
Prof. Mhammed Taya 1
Institut Agronomique et VÚtÚrinaire Hassan II, Rabat
Morocco
Hydrologist
Contributors
Abdoulaye Sene
Institut des Sciences de l'Environnement (ISE), FacultÚ des Sciences et Techniques, UniversitÚ Cheikh Anta DIOP (UCAD), Dakar
Senegal
Socio-economy
Abou Amani
Sahel Institute (CILSS) Centre Regional Agrhymet
Niger
Freshwater, climatic change
Abdelaziz Sbai
Institut Agronomique et VÚtÚrinaire Hassan II, Rabat
Morocco
Socio-economy, policy
Abdoul Aziz Tandia
Department of Geology, Faculty of Sciences and Techniques, UniversitÚ Cheikh Anta Diop, Dakar Fann
Morocco
Freshwater water quality and pollution
Amadou Saine 2
Fisheries Department, Department of State for Fisheries, Natural Resources and the Environment, Banjul
Gambia
Fisheries
Diop Mika Samba
IMROP BP 22, Nouadhibou
Mauritania
Fisheries biology
Mohammedine Diop
SociÚtÚ Nationale pour le DÚveloppement Rural, Nouakchott
Mauritania
Socio-economy
Mohamed Vall Ould EL Kebir
DÚpartement de Biologie, FacultÚ des Sciences et Techniques, Nouakchott
Mauritania
Coastal marine biology
Moustapha Deme
Centre for Oceanographic Research of Dakar-Thiaroye-ISRA, Dakar
Senegal
Economy, fisheries
Gora Ndiay 3
Direction de Gestion et de Planification des Ressources en Eau, MinistŔre de l'Agriculture et de l'Hydraulique, Dakar
Senegal
Hydrology
Ould Mohamed Ahmed Ahmeda
National Program Officer, FAO Nouakchott
Mauritania
Biology
Tayeb Ameziane El hassani
Observatoire National de la SÚcheresse, IAV Hassan II, BP 6202, Rabat Instituts Rabat
Morocco
Drought management
Yemou Dieng
DÚpartment de parasitologie, FacultÚ de medicine et de Pharmacie, UniversitÚ Cheikh Anta Diop, Dakar Fann
Senegal
Environmental health
Notes: 1 Mhammed Tayaa coordinated all the work and prepared the Scaling and Scoping part as well as the Causal chain and Policy options for the Souss Massa River. With contribution from Tayeb
Ameziane and Abdelaziz Sbai in the preparation of the Causal chain and Policy options for the Souss Massa River.
2 Prepared the Causal chain and Policy options analyses for the marine fisheries. With contributions from Moustapha DEME and Mika Samba DIOP.
3 Gora Ndiaye prepared the Causal Chain analysis and Policy options of the Streamflow modification of the Senegal River.
ANNEXES
77
Annex II
Detailed scoring tables: Canary Current North
I: Freshwater shortage
II: Pollution
Weight
Weight
Environmental
Environmental
Environmental issues
Score
Weight
averaged
Environmental issues
Score
Weight
averaged
concern
concern
score
score
1. Modification of stream flow
1
30
Freshwater shortage
1.5
4. Microbiological
0
10
Pollution
1.0
2. Pollution of existing supplies
1
40
5. Eutrophication
1
40
3. Changes in the water table
2
40
6. Chemical
1
20
7. Suspended solids
2
10
Criteria for Economics impacts
Raw score
Score
Weight %
8. Solid wastes
1
10
Very small
Very large
Size of economic or public sectors affected
2
30
0 1 2 3
9. Thermal
0
0
Minimum
Severe
Degree of impact (cost, output changes etc.)
2
40
10. Radionuclides
0
0
0 1 2 3
Occasion/Short
Continuous
Frequency/Duration
2
30
11. Spills
1
10
0 1 2 3
Weight average score for Economic impacts
2.0
Criteria for Economics impacts
Raw score
Score
Weight %
Criteria for Health impacts
Raw score
Score
Weight %
Very small
Very large
Very small
Very large
Size of economic or public sectors affected
1
40
Number of people affected
1
40
0 1 2 3
0 1 2 3
Minimum
Severe
Minimum
Severe
Degree of impact (cost, output changes etc.)
1
40
Degree of severity
1
40
0 1 2 3
0 1 2 3
Occasion/Short
Continuous
Occasion/Short
Continuous
Frequency/Duration
1
20
Frequency/Duration
0
20
0 1 2 3
0 1 2 3
Weight average score for Economic impacts
1.0
Weight average score for Health impacts
0.8
Criteria for Health impacts
Raw score
Score
Weight %
Criteria for Other social and
Raw score
Score
Weight %
community impacts
Very small
Very large
Number of people affected
1
40
Very small
Very large
0 1 2 3
Number and/or size of community affected
1
40
0 1 2 3
Minimum
Severe
Degree of severity
1
40
Minimum
Severe
0 1 2 3
Degree of severity
1
40
0 1 2 3
Occasion/Short
Continuous
Frequency/Duration
1
20
Occasion/Short
Continuous
0 1 2 3
Frequency/Duration
1
20
0 1 2 3
Weight average score for Health impacts
1.0
Weight average score for Other social and community impacts
1.0
Criteria for Other social and
Raw score
Score
Weight %
community impacts
Very small
Very large
Number and/or size of community affected
1
40
0 1 2 3
Minimum
Severe
Degree of severity
1
20
0 1 2 3
Occasion/Short
Continuous
Frequency/Duration
1
40
0 1 2 3
Weight average score for Other social and community impacts
1.0
78
GIWA REGIONA ASSESSMENT 41 CANARY CURRENT
III: Habitat and community modification
IV: Unsustainable exploitation of fish
Weight
and other living resources
Environmental
Environmental issues
Score
Weight
averaged
concern
score
Weight
Environmental
Environmental issues
Score
Weight %
averaged
Habitat and community
concern
12. Loss of ecosystems
3
50
2.0
score
modification
13. Modification of ecosystems or
Unsustainable
14. Overexploitation
3
30
2.3
ecotones, including community
1
50
exploitation of fish
structure and/or species composition
15. Excessive by-catch and
2
25
discards
16. Destructive fishing practices
2
20
Criteria for Economics impacts
Raw score
Score
Weight %
Very small
Very large
17. Decreased viability of stock
Size of economic or public sectors affected
2
2
0
0
0 1 2 3
through pollution and disease
Minimum
Severe
18. Impact on biological and
Degree of impact (cost, output changes etc.)
1
3
2
25
0 1 2 3
genetic diversity
Occasion/Short
Continuous
Frequency/Duration
2
3
0 1 2 3
Criteria for Economics impacts
Raw score
Score
Weight %
Weight average score for Economic impacts
1.6
Very small
Very large
Size of economic or public sectors affected
2
30
Criteria for Health impacts
Raw score
Score
Weight %
0 1 2 3
Minimum
Severe
Very small
Very large
Degree of impact (cost, output changes etc.)
2
50
Number of people affected
0
40
0 1 2 3
0 1 2 3
Occasion/Short
Continuous
Minimum
Severe
Frequency/Duration
2
20
Degree of severity
0
40
0 1 2 3
0 1 2 3
Occasion/Short
Continuous
Weight average score for Economic impacts
2.0
Frequency/Duration
0
20
0 1 2 3
Criteria for Health impacts
Raw score
Score
Weight %
Weight average score for Health impacts
0
Very small
Very large
Criteria for Other social and
Number of people affected
0
30
Raw score
Score
Weight %
0 1 2 3
community impacts
Minimum
Severe
Very small
Very large
Degree of severity
0
50
Number and/or size of community affected
0
40
0 1 2 3
0 1 2 3
Occasion/Short
Continuous
Minimum
Severe
Frequency/Duration
0
20
Degree of severity
0
40
0 1 2 3
0 1 2 3
Occasion/Short
Continuous
Weight average score for Health impacts
0
Frequency/Duration
0
20
0 1 2 3
Criteria for Other social and
Raw score
Score
Weight %
Weight average score for Other social and community impacts
0
community impacts
Very small
Very large
Number and/or size of community affected
2
40
0 1 2 3
Minimum
Severe
Degree of severity
1
40
0 1 2 3
Occasion/Short
Continuous
Frequency/Duration
2
20
0 1 2 3
Weight average score for Other social and community impacts
1.6
ANNEXES
79
V: Global change
Weight
Environmental
Environmental issues
Score
Weight
averaged
concern
score
19. Changes in the hydrological cycle
1
70
Global change
0.8
20. Sea level change
1
10
21. Increased UV-B radiation as a
0
10
result of ozone depletion
22. Changes in ocean CO2
0
10
source/sink function
Criteria for Economics impacts
Raw score
Score
Weight %
Very small
Very large
Size of economic or public sectors affected
1
40
0 1 2 3
Minimum
Severe
Degree of impact (cost, output changes etc.)
1
40
0 1 2 3
Occasion/Short
Continuous
Frequency/Duration
1
20
0 1 2 3
Weight average score for Economic impacts
1.0
Criteria for Health impacts
Raw score
Score
Weight %
Very small
Very large
Number of people affected
0
40
0 1 2 3
Minimum
Severe
Degree of severity
0
40
0 1 2 3
Occasion/Short
Continuous
Frequency/Duration
0
20
0 1 2 3
Weight average score for Health impacts
0
Criteria for Other social and
Raw score
Score
Weight %
community impacts
Very small
Very large
Number and/or size of community affected
1
40
0 1 2 3
Minimum
Severe
Degree of severity
1
40
0 1 2 3
Occasion/Short
Continuous
Frequency/Duration
1
20
0 1 2 3
Weight average score for Other social and community impacts
1.0
Comparative environmental and socio-economic impacts of each GIWA concern
Types of impacts
Environmental score
Economic score
Human health score
Social and community score
Concern
Overall score
Rank
Pr
esent (a)
F
uture (b)
Pr
esent (a)
F
uture (b)
Pr
esent (a)
F
uture (b)
Pr
esent (a)
F
uture (b)
Freshwater shortage
1.5
3.0
2.0
3.0
0.8
2.0
1.0
2.0
1.9
1
Pollution
1.0
2.0
1.0
1.0
1.0
1.0
1.0
1.0
1.1
3
Habitat and community
2.0
1.0
1.6
1.0
0
0.0
0
0.0
0.7
5
modification
Unsustainable exploitation of fish
2.3
1.0
2.0
1.0
0
2.0
1.6
1.0
1.4
2
and other living resources
Global change
0.8
2.0
1.0
2.0
0
1.0
1.0
1.0
1.1
4
80
GIWA REGIONA ASSESSMENT 41 CANARY CURRENT
Detailed scoring tables: Canary Current South
I: Freshwater shortage
II: Pollution
Weight
Weight
Environmental
Environmental
Environmental issues
Score
Weight
averaged
Environmental issues
Score
Weight
averaged
concern
concern
score
score
1. Modification of stream flow
2
30
Freshwater shortage
1.8
4. Microbiological
1
10
Pollution
1.8
2. Pollution of existing supplies
2
40
5. Eutrophication
2
40
3. Changes in the water table
1
40
6. Chemical
2
20
7. Suspended solids
2
10
Criteria for Economics impacts
Raw score
Score
Weight %
8. Solid wastes
2
10
Very small
Very large
Size of economic or public sectors affected
2
30
0 1 2 3
9. Thermal
0
0
Minimum
Severe
Degree of impact (cost, output changes etc.)
2
40
10. Radionuclides
0
0
0 1 2 3
Occasion/Short
Continuous
Frequency/Duration
2
30
11. Spills
1
10
0 1 2 3
Weight average score for Economic impacts
2.0
Criteria for Economics impacts
Raw score
Score
Weight %
Criteria for Health impacts
Raw score
Score
Weight %
Very small
Very large
Very small
Very large
Size of economic or public sectors affected
1
40
Number of people affected
2
40
0 1 2 3
0 1 2 3
Minimum
Severe
Minimum
Severe
Degree of impact (cost, output changes etc.)
1
40
Degree of severity
2
40
0 1 2 3
0 1 2 3
Occasion/Short
Continuous
Occasion/Short
Continuous
Frequency/Duration
1
20
Frequency/Duration
3
20
0 1 2 3
0 1 2 3
Weight average score for Economic impacts
1.0
Weight average score for Health impacts
2.2
Criteria for Health impacts
Raw score
Score
Weight %
Criteria for Other social and
Raw score
Score
Weight %
community impacts
Very small
Very large
Number of people affected
1
40
Very small
Very large
0 1 2 3
Number and/or size of community affected
2
40
0 1 2 3
Minimum
Severe
Degree of severity
1
40
Minimum
Severe
0 1 2 3
Degree of severity
1
40
0 1 2 3
Occasion/Short
Continuous
Frequency/Duration
1
20
Occasion/Short
Continuous
0 1 2 3
Frequency/Duration
1
20
0 1 2 3
Weight average score for Health impacts
1.0
Weight average score for Other social and community impacts
1.4
Criteria for Other social and
Raw score
Score
Weight %
community impacts
Very small
Very large
Number and/or size of community affected
2
40
0 1 2 3
Minimum
Severe
Degree of severity
1
20
0 1 2 3
Occasion/Short
Continuous
Frequency/Duration
2
40
0 1 2 3
Weight average score for Other social and community impacts
1.8
ANNEXES
81
III: Habitat and community modification
IV: Unsustainable exploitation of fish
Weight
and other living resources
Environmental
Environmental issues
Score
Weight
averaged
concern
score
Weight
Environmental
Environmental issues
Score
Weight %
averaged
Habitat and community
concern
12. Loss of ecosystems
3
50
3.0
score
modification
13. Modification of ecosystems or
Unsustainable
14. Overexploitation
3
30
2.5
ecotones, including community
3
50
exploitation of fish
structure and/or species composition
15. Excessive by-catch and
2
25
discards
16. Destructive fishing practices
3
20
Criteria for Economics impacts
Raw score
Score
Weight %
Very small
Very large
17. Decreased viability of stock
Size of economic or public sectors affected
2
40
0
0
0 1 2 3
through pollution and disease
Minimum
Severe
18. Impact on biological and
Degree of impact (cost, output changes etc.)
3
40
2
25
0 1 2 3
genetic diversity
Occasion/Short
Continuous
Frequency/Duration
3
20
0 1 2 3
Criteria for Economics impacts
Raw score
Score
Weight %
Weight average score for Economic impacts
2.6
Very small
Very large
Size of economic or public sectors affected
2
30
Criteria for Health impacts
Raw score
Score
Weight %
0 1 2 3
Minimum
Severe
Very small
Very large
Degree of impact (cost, output changes etc.)
3
50
Number of people affected
2
40
0 1 2 3
0 1 2 3
Occasion/Short
Continuous
Minimum
Severe
Frequency/Duration
2
20
Degree of severity
2
40
0 1 2 3
0 1 2 3
Occasion/Short
Continuous
Weight average score for Economic impacts
2.5
Frequency/Duration
1
20
0 1 2 3
Criteria for Health impacts
Raw score
Score
Weight %
Weight average score for Health impacts
1.8
Very small
Very large
Criteria for Other social and
Number of people affected
1
30
Raw score
Score
Weight %
0 1 2 3
community impacts
Minimum
Severe
Very small
Very large
Degree of severity
1
50
Number and/or size of community affected
1
40
0 1 2 3
0 1 2 3
Occasion/Short
Continuous
Minimum
Severe
Frequency/Duration
2
20
Degree of severity
1
40
0 1 2 3
0 1 2 3
Occasion/Short
Continuous
Weight average score for Health impacts
1.2
Frequency/Duration
1
20
0 1 2 3
Criteria for Other social and
Raw score
Score
Weight %
Weight average score for Other social and community impacts
1.0
community impacts
Very small
Very large
Number and/or size of community affected
3
40
0 1 2 3
Minimum
Severe
Degree of severity
2
40
0 1 2 3
Occasion/Short
Continuous
Frequency/Duration
2
20
0 1 2 3
Weight average score for Other social and community impacts
2.4
82
GIWA REGIONA ASSESSMENT 41 CANARY CURRENT
V: Global change
Weight
Environmental
Environmental issues
Score
Weight
averaged
concern
score
19. Changes in the hydrological cycle
1
70
Global change
0.8
20. Sea level change
1
10
21. Increased UV-B radiation as a
0
10
result of ozone depletion
22. Changes in ocean CO2
0
10
source/sink function
Criteria for Economics impacts
Raw score
Score
Weight %
Very small
Very large
Size of economic or public sectors affected
1
40
0 1 2 3
Minimum
Severe
Degree of impact (cost, output changes etc.)
1
40
0 1 2 3
Occasion/Short
Continuous
Frequency/Duration
1
20
0 1 2 3
Weight average score for Economic impacts
1.0
Criteria for Health impacts
Raw score
Score
Weight %
Very small
Very large
Number of people affected
1
40
0 1 2 3
Minimum
Severe
Degree of severity
1
40
0 1 2 3
Occasion/Short
Continuous
Frequency/Duration
1
20
0 1 2 3
Weight average score for Health impacts
1.0
Criteria for Other social and
Raw score
Score
Weight %
community impacts
Very small
Very large
Number and/or size of community affected
1
40
0 1 2 3
Minimum
Severe
Degree of severity
1
40
0 1 2 3
Occasion/Short
Continuous
Frequency/Duration
1
20
0 1 2 3
Weight average score for Other social and community impacts
1.0
Comparative environmental and socio-economic impacts of each GIWA concern
Types of impacts
Environmental score
Economic score
Human health score
Social and community score
Concern
Overall score
Rank
Pr
esent (a)
F
uture (b)
Pr
esent (a)
F
uture (b)
Pr
esent (a)
F
uture (b)
Pr
esent (a)
F
uture (b)
Freshwater shortage
1.8
3.0
2.0
3.0
2.2
3.0
1.0
2.0
2.3
1
Pollution
1.8
3.0
1.0
2.0
1.0
2.0
1.8
3.0
2.0
4
Habitat and community
3.0
2.0
2.6
2.0
1.8
1.0
1.0
1.0
1.8
3
modification
Unsustainable exploitation of fish
2.5
1.0
2.5
2.0
1.2
1.0
2.4
2.0
1.8
2
and other living resources
Global change
0.8
2.0
1.0
2.0
1.0
2.0
1.0
2.0
1.5
5
ANNEXES
83
The Global International
Waters Assessment
This report presents the results of the Global International Waters
Adequately managing the world's aquatic resources for the benefi t of
Assessment (GIWA) of the transboundary waters of the Canary
all is, for a variety of reasons, a very complex task. The liquid state of
Current region. This and the subsequent chapter off er a background
the most of the world's water means that, without the construction
that describes the impetus behind the establishment of GIWA, its
of reservoirs, dams and canals it is free to fl ow wherever the laws of
objectives and how the GIWA was implemented.
nature dictate. Water is, therefore, a vector transporting not only a
wide variety of valuable resources but also problems from one area
to another. The effl
uents emanating from environmentally destructive
activities in upstream drainage areas are propagated downstream
The need for a global
and can aff ect other areas considerable distances away. In the case of
international waters
transboundary river basins, such as the Nile, Amazon and Niger, the
assessment
impacts are transported across national borders and can be observed
in the numerous countries situated within their catchments. In the case
of large oceanic currents, the impacts can even be propagated between
Globally, people are becoming increasingly aware of the degradation of
continents (AMAP 1998). Therefore, the inextricable linkages within
the world's water bodies. Disasters from fl oods and droughts, frequently
and between both freshwater and marine environments dictates that
reported in the media, are considered to be linked with ongoing global
management of aquatic resources ought to be implemented through
climate change (IPCC 2001), accidents involving large ships pollute public
a drainage basin approach.
beaches and threaten marine life and almost every commercial fi sh stock
is exploited beyond sustainable limits - it is estimated that the global
In addition, there is growing appreciation of the incongruence
stocks of large predatory fi sh have declined to less that 10% of pre-
between the transboundary nature of many aquatic resources and the
industrial fi shing levels (Myers & Worm 2003). Further, more than 1 billion
traditional introspective nationally focused approaches to managing
people worldwide lack access to safe drinking water and 2 billion people
those resources. Water, unlike laws and management plans, does not
lack proper sanitation which causes approximately 4 billion cases of
respect national borders and, as a consequence, if future management
diarrhoea each year and results in the death of 2.2 million people, mostly
of water and aquatic resources is to be successful, then a shift in focus
children younger than fi ve (WHO-UNICEF 2002). Moreover, freshwater
towards international cooperation and intergovernmental agreements
and marine habitats are destroyed by infrastructure developments,
is required (UN 1972). Furthermore, the complexity of managing the
dams, roads, ports and human settlements (Brinson & Malvßrez 2002,
world's water resources is exacerbated by the dependence of a great
Kennish 2002). As a consequence, there is growing public concern
variety of domestic and industrial activities on those resources. As a
regarding the declining quality and quantity of the world's aquatic
consequence, cross-sectoral multidisciplinary approaches that integrate
resources because of human activities, which has resulted in mounting
environmental, socio-economic and development aspects into
pressure on governments and decision makers to institute new and
management must be adopted. Unfortunately however, the scientifi c
innovative policies to manage those resources in a sustainable way
information or capacity within each discipline is often not available or
ensuring their availability for future generations.
is inadequately translated for use by managers, decision makers and
GLOBAL INTERNATIONAL WATERS ASSESSMENT
i
policy developers. These inadequacies constitute a serious impediment
The Global Environment Facility (GEF)
to the implementation of urgently needed innovative policies.
The Global Environment Facility forges international co-operation and fi nances actions to address
six critical threats to the global environment: biodiversity loss, climate change, degradation of
international waters, ozone depletion, land degradation, and persistent organic pollutants (POPs).
Continual assessment of the prevailing and future threats to aquatic
The overall strategic thrust of GEF-funded international waters activities is to meet the incremental
ecosystems and their implications for human populations is essential if
costs of: (a) assisting groups of countries to better understand the environmental concerns of
their international waters and work collaboratively to address them; (b) building the capacity
governments and decision makers are going to be able to make strategic
of existing institutions to utilise a more comprehensive approach for addressing transboundary
policy and management decisions that promote the sustainable use of
water-related environmental concerns; and (c) implementing measures that address the priority
transboundary environmental concerns. The goal is to assist countries to utilise the full range of
those resources and respond to the growing concerns of the general
technical, economic, fi nancial, regulatory, and institutional measures needed to operationalise
public. Although many assessments of aquatic resources are being
sustainable development strategies for international waters.
conducted by local, national, regional and international bodies, past
United Nations Environment Programme (UNEP)
assessments have often concentrated on specifi c themes, such as
United Nations Environment Programme, established in 1972, is the voice for the environment
biodiversity or persistent toxic substances, or have focused only on
within the United Nations system. The mission of UNEP is to provide leadership and encourage
partnership in caring for the environment by inspiring, informing, and enabling nations and
marine or freshwaters. A globally coherent, drainage basin based
peoples to improve their quality of life without compromising that of future generations.
assessment that embraces the inextricable links between transboundary
UNEP work encompasses:
freshwater and marine systems, and between environmental and
Assessing global, regional and national environmental conditions and trends;
Developing international and national environmental instruments;
societal issues, has never been conducted previously.
Strengthening institutions for the wise management of the environment;
Facilitating the transfer of knowledge and technology for sustainable development;
Encouraging new partnerships and mind-sets within civil society and the private sector.
International call for action
University of Kalmar
University of Kalmar hosts the GIWA Co-ordination Offi ce and provides scientifi c advice and
administrative and technical assistance to GIWA. University of Kalmar is situated on the coast of
The need for a holistic assessment of transboundary waters in order to
the Baltic Sea. The city has a long tradition of higher education; teachers and marine offi cers have
been educated in Kalmar since the middle of the 19th century. Today, natural science is a priority
respond to growing public concerns and provide advice to governments
area which gives Kalmar a unique educational and research profi le compared with other smaller
universities in Sweden. Of particular relevance for GIWA is the established research in aquatic and
and decision makers regarding the management of aquatic resources
environmental science. Issues linked to the concept of sustainable development are implemented
was recognised by several international bodies focusing on the global
by the research programme Natural Resources Management and Agenda 21 Research School.
environment. In particular, the Global Environment Facility (GEF)
Since its establishment GIWA has grown to become an integral part of University activities.
The GIWA Co-ordination offi ce and GIWA Core team are located at the Kalmarsund Laboratory, the
observed that the International Waters (IW) component of the GEF
university centre for water-related research. Senior scientists appointed by the University are actively
suff ered from the lack of a global assessment which made it diffi
cult
involved in the GIWA peer-review and steering groups. As a result of the cooperation the University
can offer courses and seminars related to GIWA objectives and international water issues.
to prioritise international water projects, particularly considering
the inadequate understanding of the nature and root causes of
environmental problems. In 1996, at its fourth meeting in Nairobi, the
causes of degradation of the transboundary aquatic environment and
GEF Scientifi c and Technical Advisory Panel (STAP), noted that: "Lack of
options for addressing them. These pro cesses led to the development
an International Waters Assessment comparable with that of the IPCC, the
of the Global International Waters Assessment (GIWA) that would be
Global Biodiversity Assessment, and the Stratospheric Ozone Assessment,
implemented by the United Nations Environment Programme (UNEP) in
was a unique and serious impediment to the implementation of the
conjunction with the University of Kalmar, Sweden, on behalf of the GEF.
International Waters Component of the GEF".
The GIWA was inaugurated in Kalmar in October 1999 by the Executive
Director of UNEP, Dr. Klaus T÷pfer, and the late Swedish Minister of the
The urgent need for an assessment of the causes of environmental
Environment, Kjell Larsson. On this occasion Dr. T÷pfer stated: "GIWA
degradation was also highlighted at the UN Special Session on
is the framework of UNEP┤s global water assessment strategy and will
the Environment (UNGASS) in 1997, where commitments were
enable us to record and report on critical water resources for the planet for
made regarding the work of the UN Commission on Sustainable
consideration of sustainable development management practices as part of
Development (UNCSD) on freshwater in 1998 and seas in 1999. Also in
our responsibilities under Agenda 21 agreements of the Rio conference".
1997, two international Declarations, the Potomac Declaration: Towards
enhanced ocean security into the third millennium, and the Stockholm
The importance of the GIWA has been further underpinned by the UN
Statement on inter action of land activities, freshwater and enclosed
Millennium Development Goals adopted by the UN General Assembly
seas, specifi cally emphasised the need for an investigation of the root
in 2000 and the Declaration from the World Summit on Sustainable
iI
REGIONAL ASSESSMENTS
Development in 2002. The development goals aimed to halve the
International waters and transboundary issues
proportion of people without access to safe drinking water and basic
The term "international waters", as used for the purposes of the GEF Operational Strategy,
sanitation by the year 2015 (United Nations Millennium Declaration
includes the oceans, large marine ecosystems, enclosed or semi-enclosed seas and estuaries, as
well as rivers, lakes, groundwater systems, and wetlands with transboundary drainage basins
2000). The WSSD also calls for integrated management of land, water and
or common borders. The water-related ecosystems associated with these waters are considered
living resources (WSSD 2002) and, by 2010, the Reykjavik Declaration on
integral parts of the systems.
The term "transboundary issues" is used to describe the threats to the aquatic environment
Responsible Fisheries in the Marine Ecosystem should be implemented
linked to globalisation, international trade, demographic changes and technological advancement,
by all countries that are party to the declaration (FAO 2001).
threats that are additional to those created through transboundary movement of water. Single
country policies and actions are inadequate in order to cope with these challenges and this makes
them transboundary in nature.
The international waters area includes numerous international conventions, treaties, and
agreements. The architecture of marine agreements is especially complex, and a large number
The conceptual framework
of bilateral and multilateral agreements exist for transboundary freshwater basins. Related
conventions and agreements in other areas increase the complexity. These initiatives provide
and objectives
a new opportunity for cooperating nations to link many different programmes and instruments
into regional comprehensive approaches to address international waters.
Considering the general decline in the condition of the world's aquatic
the large-scale deforestation of mangroves for ponds (Primavera 1997).
resources and the internationally recognised need for a globally
Within the GIWA, these "non-hydrological" factors constitute as large
coherent assessment of transboundary waters, the primary objectives
a transboundary infl uence as more traditionally recognised problems,
of the GIWA are:
such as the construction of dams that regulate the fl ow of water into
To provide a prioritising mechanism that allows the GEF to focus
a neighbouring country, and are considered equally important. In
their resources so that they are used in the most cost eff ective
addition, the GIWA recognises the importance of hydrological units that
manner to achieve signifi cant environmental benefi ts, at national,
would not normally be considered transboundary but exert a signifi cant
regional and global levels; and
infl uence on transboundary waters, such as the Yangtze River in China
To highlight areas in which governments can develop and
which discharges into the East China Sea (Daoji & Daler 2004) and the
implement strategic policies to reduce environmental degradation
Volga River in Russia which is largely responsible for the condition of
and improve the management of aquatic resources.
the Caspian Sea (Barannik et al. 2004). Furthermore, the GIWA is a truly
regional assessment that has incorporated data from a wide range of
In order to meet these objectives and address some of the current
sources and included expert knowledge and information from a wide
inadequacies in international aquatic resources management, the GIWA
range of sectors and from each country in the region. Therefore, the
has incorporated four essential elements into its design:
transboundary concept adopted by the GIWA extends to include
A broad transboundary approach that generates a truly regional
impacts caused by globalisation, international trade, demographic
perspective through the incorporation of expertise and existing
changes and technological advances and recognises the need for
information from all nations in the region and the assessment of
international cooperation to address them.
all factors that infl uence the aquatic resources of the region;
A drainage basin approach integrating freshwater and marine
systems;
A multidisciplinary approach integrating environmental and socio-
The organisational structure and
economic information and expertise; and
implementation of the GIWA
A coherent assessment that enables global comparison of the
results.
The scale of the assessment
Initially, the scope of the GIWA was confi ned to transboundary waters
The GIWA builds on previous assessments implemented within the GEF
in areas that included countries eligible to receive funds from the GEF.
International Waters portfolio but has developed and adopted a broader
However, it was recognised that a truly global perspective would only
defi nition of transboundary waters to include factors that infl uence the
be achieved if industrialised, GEF-ineligible regions of the world were
quality and quantity of global aquatic resources. For example, due to
also assessed. Financial resources to assess the GEF-eligible countries
globalisation and international trade, the market for penaeid shrimps
were obtained primarily from the GEF (68%), the Swedish International
has widened and the prices soared. This, in turn, has encouraged
Development Cooperation Agency (Sida) (18%), and the Finnish
entrepreneurs in South East Asia to expand aquaculture resulting in
Department for International Development Cooperation (FINNIDA)
GLOBAL INTERNATIONAL WATERS ASSESSMENT
iII
1b
1c
1d
16
15
11
14
12
1a
13
17
28
10
18
25
30
9
19
23
7
22
8
31
6
24
33
20
34
26
2
5
27
50
51
32
21
36
37
41
52
4
49
53
43
54
55
65
42
3
56
42
46
42
47
62
40b
57
40a
40a
47
47
45b
59
39
45a
58
64
60
44
38
61
63
66
ę GIWA 2005
1a Russian Arctic (4 LMEs)
8 Gulf of St Lawrence
17 Baltic
Sea
(LME)
26 California Current (LME)
38 Patagonian Shelf (LME)
45b Indian Ocean Islands
52 Arabian
Sea
(LME)
61 Great
Australian
Bight
1b Arctic
Greenland
(LME)
9 Newfoundland
Shelf
(LME)
18 North
Sea
(LME)
27 Gulf of California (LME)
39 Brazil
Current
(LME)
46 Somali Coastal
53 Bay of Bengal
62 Pacifi c Islands
1c Arctic
European/Atlantic
10 Baffi
n Bay, Labrador Sea,
19 Celtic-Biscay
Shelf
(LME)
28 Bering Sea (LME)
40a Northeast Brazil
Current (LME)
54 South China Sea (2 LMEs)
63 Tasman
Sea
1d Arctic North American
Canadian Archipelago
20 Iberian Coastal Sea (LME)
30 Sea of Okhotsk (LME)
Shelf (2 LMEs)
47 East
African
Rift
55 Mekong
River
64 Humboldt Current (LME)
2
Gulf of Mexico (LME)
11 Barents
Sea
(LME)
21 North
Africa
and
31 Oyashio
Current
(LME)
40b Amazon
Valley Lakes
56 Sulu-Celebes
Sea
(LME)
65 Eastern Equatorial
3 Caribbean
Sea
(LME)
12 Norwegian
Sea
(LME)
Nile River Basin (LME)
32 Kuroshio
Current
(LME)
41 Canary
Current
(LME)
49 Red Sea and
57 Indonesian
Seas
(LME)
Pacifi c (LME)
4 Caribbean
Islands
(LME)
13 Faroe
plateau
22 Black Sea (LME)
33 Sea
of
Japan
(LME)
42 Guinea Current (LME)
Gulf of Aden (LME)
58 North Australian
66 Antarctic (LME)
5 Southeast
Shelf
(LME)
14 Iceland
Shelf
(LME)
23 Caspian
Sea
34 Yellow Sea (LME)
43 Lake
Chad
50 Euphrates and
Shelf (LME)
6 Northeast
Shelf
(LME)
15 East
Greenland
Shelf
(LME)
24 Aral Sea
36 East China Sea (LME)
44 Benguela Current (LME)
Tigris River Basin
59 Coral
Sea
Basin
7 Scotian
Shelf
(LME)
16 West
Greenland
Shelf
(LME)
25 Gulf of Alaska (LME)
37 Hawaiian
Archipelago
(LME)
45a Agulhas Current (LME)
51 Jordan
60 Great Barrier Reef (LME)
Figure 1
The 66 transboundary regions assessed within the GIWA project.
(10%). Other contributions were made by Kalmar Municipality, the
Large Marine Ecocsystems (LMEs)
University of Kalmar and the Norwegian Government. The assessment of
Large Marine Ecosystems (LMEs) are regions of ocean space encompassing coastal areas from river
regions ineligible for GEF funds was conducted by various international
basins and estuaries to the seaward boundaries of continental shelves and the outer margin of the
major current systems. They are relatively large regions on the order of 200 000 km2 or greater,
and national organisations as in-kind contributions to the GIWA.
characterised by distinct: (1) bathymetry, (2) hydrography, (3) productivity, and (4) trophically
dependent populations.
The Large Marine Ecosystems strategy is a global effort for the assessment and management
In order to be consistent with the transboundary nature of many of the
of international coastal waters. It developed in direct response to a declaration at the 1992
world's aquatic resources and the focus of the GIWA, the geographical
Rio Summit. As part of the strategy, the World Conservation Union (IUCN) and National Oceanic
and Atmospheric Administration (NOAA) have joined in an action program to assist developing
units being assessed have been designed according to the watersheds
countries in planning and implementing an ecosystem-based strategy that is focused on LMEs as
of discrete hydrographic systems rather than political borders (Figure 1).
the principal assessment and management units for coastal ocean resources. The LME concept is
also adopted by GEF that recommends the use of LMEs and their contributing freshwater basins
The geographic units of the assessment were determined during the
as the geographic area for integrating changes in sectoral economic activities.
preparatory phase of the project and resulted in the division of the
world into 66 regions defi ned by the entire area of one or more
The global network
catchments areas that drains into a single designated marine system.
In each of the 66 regions, the assessment is conducted by a team of
These marine systems often correspond to Large Marine Ecosystems
local experts that is headed by a Focal Point (Figure 2). The Focal Point
(LMEs) (Sherman 1994, IOC 2002).
can be an individual, institution or organisation that has been selected
on the basis of their scientifi c reputation and experience implementing
Considering the objectives of the GIWA and the elements incorporated
international assessment projects. The Focal Point is responsible
into its design, a new methodology for the implementation of the
for assembling members of the team and ensuring that it has the
assessment was developed during the initial phase of the project. The
necessary expertise and experience in a variety of environmental
methodology focuses on fi ve major environmental concerns which
and socio-economic disciplines to successfully conduct the regional
constitute the foundation of the GIWA assessment; Freshwater shortage,
assessment. The selection of team members is one of the most critical
Pollution, Habitat and community modifi cation, Overexploitation of fi sh
elements for the success of GIWA and, in order to ensure that the
and other living resources, and Global change. The GIWA methodology
most relevant information is incorporated into the assessment, team
is outlined in the following chapter.
members were selected from a wide variety of institutions such as
iV
REGIONAL ASSESSMENTS
an assessment did not exist. Therefore, in order to implement the GIWA,
a new methodology that adopted a multidisciplinary, multi-sectoral,
Steering Group
multi-national approach was developed and is now available for the
implementation of future international assessments of aquatic resources.
GIWA Partners
IGOs, NGOs,
Core
Thematic
The GIWA is comprised of a logical sequence of four integrated
Scientific institutions,
Team
Task Teams
private sector, etc
components. The fi rst stage of the GIWA is called Scaling and is a
66 Regional
process by which the geographic area examined in the assessment is
Focal Points
defi ned and all the transboundary waters within that area are identifi ed.
and Teams
Once the geographic scale of the assessment has been defi ned, the
Figure 2
The organisation of the GIWA project.
assessment teams conduct a process known as Scoping in which the
magnitude of environmental and associated socio-economic impacts
universities, research institutes, government agencies, and the private
of Freshwater shortage, Pollution, Habitat and community modifi cation,
sector. In addition, in order to ensure that the assessment produces a
Unsustainable exploitation of fi sh and other living resources, and Global
truly regional perspective, the teams should include representatives
change is assessed in order to identify and prioritise the concerns
from each country that shares the region.
that require the most urgent intervention. The assessment of these
predefi ned concerns incorporates the best available information and
In total, more than 1 000 experts have contributed to the implementation
the knowledge and experience of the multidisciplinary, multi-national
of the GIWA illustrating that the GIWA is a participatory exercise that
assessment teams formed in each region. Once the priority concerns
relies on regional expertise. This participatory approach is essential
have been identifi ed, the root causes of these concerns are identifi ed
because it instils a sense of local ownership of the project, which
during the third component of the GIWA, Causal chain analysis. The root
ensures the credibility of the fi ndings and moreover, it has created a
causes are determined through a sequential process that identifi es, in
global network of experts and institutions that can collaborate and
turn, the most signifi cant immediate causes followed by the economic
exchange experiences and expertise to help mitigate the continued
sectors that are primarily responsible for the immediate causes and
degradation of the world's aquatic resources.
fi nally, the societal root causes. At each stage in the Causal chain
analysis, the most signifi cant contributors are identifi ed through an
analysis of the best available information which is augmented by the
expertise of the assessment team. The fi nal component of the GIWA is
GIWA Regional reports
the development of Policy options that focus on mitigating the impacts
of the root causes identifi ed by the Causal chain analysis.
The GIWA was established in response to growing concern among the
general public regarding the quality of the world's aquatic resources
The results of the GIWA assessment in each region are reported in
and the recognition of governments and the international community
regional reports that are published by UNEP. These reports are designed
concerning the absence of a globally coherent international waters
to provide a brief physical and socio-economic description of the
assessment. However, because a holistic, region-by-region, assessment
most important features of the region against which the results of the
of the condition of the world's transboundary water resources had never
assessment can be cast. The remaining sections of the report present
been undertaken, a methodology guiding the implementation of such
the results of each stage of the assessment in an easily digestible form.
Each regional report is reviewed by at least two independent external
UNEP Water Policy and Strategy
reviewers in order to ensure the scientifi c validity and applicability of
The primary goals of the UNEP water policy and strategy are:
each report. The 66 regional assessments of the GIWA will serve UNEP
(a) Achieving greater global understanding of freshwater, coastal and marine environments by
as an essential complement to the UNEP Water Policy and Strategy and
conducting environmental assessments in priority areas;
(b) Raising awareness of the importance and consequences of unsustainable water use;
UNEP's activities in the hydrosphere.
(c) Supporting the efforts of Governments in the preparation and implementation of integrated
management of freshwater systems and their related coastal and marine environments;
(d) Providing support for the preparation of integrated management plans and programmes for
aquatic environmental hot spots, based on the assessment results;
Global International Waters Assessment
(e) Promoting the application by stakeholders of precautionary, preventive and anticipatory
approaches.
GLOBAL INTERNATIONAL WATERS ASSESSMENT
v
References:
AMAP (1998). Assessment Report: Arctic Pollution Issues. Arctic
Monitoring and Assessment Programme (AMAP), Oslo, Norway.
Barannik, V., Borysova, O. and Stolberg, F. (2004). The Caspian Sea Region:
Environmental Change. Ambio, 33:45-51.
Brinson, M.M. and Malvßrez, A.I. (2002). Temperate freshwater wetlands:
types, status, and threats. Environmental Conservation, 29:115-133.
Daoji, L. and Daler, D. (2004). Ocean Pollution from Land-based Sources:
East China Sea, China. Ambio, 33:98-106.
FAO (2001). Reykjavik conference on responsible fi sheries in the marine
ecosystem. Iceland, 1-4 October 2001.
IOC (2002). IOC-IUCN-NOAA Consultative Meeting on Large Marine
Ecosystems (LMEs). Fourth Session, 8-9 January 2002, Paris,
France.
IPCC (2001). Climate Change 2001: The Scientifi c Basis. Contribution
of Working Group I to the Third Assessment Report of the
Intergovernmental Panel on Climate Change. In: Houghton,
J.T., Ding, Y., Griggs, D.J., Noguer, M., van der Linden, P.J., Dai, X.,
Maskell, K. and Johnson, C.A. (eds). Cambridge University Press,
Cambridge, United Kingdom and New York, NY, USA.
Kennish, M.J. (2002). Environmental threats and environmental future of
estuaries. Environmental Conservation, 29:78-107.
Myers, R.A. and Worm, B. (2003). Rapid worldwide depletion of predatory
fi sh communities. Nature, 423:280-283.
Primavera, J.H. (1997) Socio-economic impacts of shrimp culture.
Aquaculture Research, 28:815-827.
Sherman, K. (1994). Sustainability, biomass yields, and health of coastal
ecosystems: an ecological perspective. Marine Ecology Progress
Series, 112:277-301.
United Nations conference on the human environment (1972). Report
available on-line at http://www.unep.org
United Nations Millennium Declaration (2000). The Millennium
Assembly of the United Nations, New York.
WHO-UNICEF (2002). Global Water Supply and Sanitation Assessment:
2000 Report.
WSSD (2002). World Summit on Sustainable Development.
Johannesburg Summit 2002. Key Outcomes of the Summit,
UN Department of Public Information, New York.
v I
REGIONAL ASSESSMENTS
The GIWA methodology
The specifi c objectives of the GIWA were to conduct a holistic and globally
The assessment integrates environmental and socio-economic data
comparable assessment of the world's transboundary aquatic resources
from each country in the region to determine the severity of the
that incorporated both environmental and socio-economic factors
impacts of each of the fi ve concerns and their constituent issues on
and recognised the inextricable links between freshwater and marine
the entire region. The integration of this information was facilitated by
environments, in order to enable the GEF to focus their resources and to
implementing the assessment during two participatory workshops
provide guidance and advice to governments and decision makers. The
that typically involved 10 to 15 environmental and socio-economic
coalition of all these elements into a single coherent methodology that
experts from each country in the region. During these workshops, the
produces an assessment that achieves each of these objectives had not
regional teams performed preliminary analyses based on the collective
previously been done and posed a signifi cant challenge.
knowledge and experience of these local experts. The results of these
analyses were substantiated with the best available information to be
The integration of each of these elements into the GIWA methodology
presented in a regional report.
was achieved through an iterative process guided by a specially
Table 1 Pre-defi ned GIWA concerns and their constituent issues
convened Methods task team that was comprised of a number of
addressed within the assessment.
international assessment and water experts. Before the fi nal version
of the methodology was adopted, preliminary versions underwent
Environmental issues
Major concerns
an extensive external peer review and were subjected to preliminary
1. Modification of stream flow
testing in selected regions. Advice obtained from the Methods task
2. Pollution of existing supplies
I Freshwater shortage
3. Changes in the water table
team and other international experts and the lessons learnt from
preliminary testing were incorporated into the fi nal version that was
4. Microbiological
5. Eutrophication
used to conduct each of the GIWA regional assessments.
6. Chemical
7. Suspended
solids
II Pollution
8. Solid
wastes
Considering the enormous diff erences between regions in terms of the
9. Thermal
10. Radionuclide
quality, quantity and availability of data, socio-economic setting and
11. Spills
environmental conditions, the achievement of global comparability
12. Loss of ecosystems
required an innovative approach. This was facilitated by focusing
III Habitat and community
13. Modification of ecosystems or ecotones, including community
modification
structure and/or species composition
the assessment on the impacts of fi ve pre-defi ned concerns namely;
Freshwater shortage, Pollution, Habitat and community modifi cation,
14. Overexploitation
15. Excessive by-catch and discards
IV Unsustainable
Unsustainable exploitation of fi sh and other living resources and Global
16. Destructive fishing practices
exploitation of fish and
change, in transboundary waters. Considering the diverse range of
17. Decreased viability of stock through pollution and disease
other living resources
18. Impact on biological and genetic diversity
elements encompassed by each concern, assessing the magnitude of
19. Changes in hydrological cycle
the impacts caused by these concerns was facilitated by evaluating the
20. Sea level change
V Global change
impacts of 22 specifi c issues that were grouped within these concerns
21. Increased uv-b radiation as a result of ozone depletion
22. Changes in ocean CO source/sink function
(see Table 1).
2
THE GIWA METHODOLOGY
vii

political boundaries but were instead, generally defi ned by a large but
T
r
ansboundar
The GIWA approach
discrete drainage basin that also included the coastal marine waters into
which the basin discharges. In many cases, the marine areas examined
1
Scaling
st
W
orkshop
Detailed
during the assessment coincided with the Large Marine Ecosystems
y
D
(LMEs) defi ned by the US National Atmospheric and Oceanographic
iagnostic
A
ssessment
Scoping
Administration (NOAA). As a consequence, scaling should be a
relatively straight-forward task that involves the inspection of the
Analy
boundaries that were proposed for the region during the preparatory
Causal Chain
2
sis
nd
Analysis
phase of GIWA to ensure that they are appropriate and that there are
W
orkshop
no important overlaps or gaps with neighbouring regions. When the
Policy Option
proposed boundaries were found to be inadequate, the boundaries of
Analysis
the region were revised according to the recommendations of experts
from both within the region and from adjacent regions so as to ensure
that any changes did not result in the exclusion of areas from the GIWA.
Once the regional boundary was defi ned, regional teams identifi ed all
SAP
the transboundary elements of the aquatic environment within the
SAP
region and determined if these elements could be assessed as a single
Figure 1
Illustration of the relationship between the GIWA
coherent aquatic system or if there were two or more independent
approach and other projects implemented within the
systems that should be assessed separately.
GEF International Waters (IW) portfolio.
The GIWA is a logical contiguous process that defi nes the geographic
Scoping ş Assessing the GIWA concerns
region to be assessed, identifi es and prioritises particularly problems
Scoping is an assessment of the severity of environmental and socio-
based on the magnitude of their impacts on the environment and
economic impacts caused by each of the fi ve pre-defi ned GIWA concerns
human societies in the region, determines the root causes of those
and their constituent issues (Table 1). It is not designed to provide an
problems and, fi nally, assesses various policy options that addresses
exhaustive review of water-related problems that exist within each region,
those root causes in order to reverse negative trends in the condition
but rather it is a mechanism to identify the most urgent problems in the
of the aquatic environment. These four steps, referred to as Scaling,
region and prioritise those for remedial actions. The priorities determined
Scoping, Causal chain analysis and Policy options analysis, are
by Scoping are therefore one of the main outputs of the GIWA project.
summarised below and are described in their entirety in two volumes:
GIWA Methodology Stage 1: Scaling and Scoping; and GIWA Methodology:
Focusing the assessment on pre-defi ned concerns and issues ensured
Detailed Assessment, Causal Chain Analysis and Policy Options Analysis.
the comparability of the results between diff erent regions. In addition, to
Generally, the components of the GIWA methodology are aligned
ensure the long-term applicability of the options that are developed to
with the framework adopted by the GEF for Transboundary Diagnostic
mitigate these problems, Scoping not only assesses the current impacts
Analyses (TDAs) and Strategic Action Programmes (SAPs) (Figure 1) and
of these concerns and issues but also the probable future impacts
assume a broad spectrum of transboundary infl uences in addition to
according to the "most likely scenario" which considered demographic,
those associated with the physical movement of water across national
economic, technological and other relevant changes that will potentially
borders.
infl uence the aquatic environment within the region by 2020.
Scaling ş Defining the geographic extent
The magnitude of the impacts caused by each issue on the
of the region
environment and socio-economic indicators was assessed over the
Scaling is the fi rst stage of the assessment and is the process by which
entire region using the best available information from a wide range of
the geographic scale of the assessment is defi ned. In order to facilitate
sources and the knowledge and experience of the each of the experts
the implementation of the GIWA, the globe was divided during the
comprising the regional team. In order to enhance the comparability
design phase of the project into 66 contiguous regions. Considering the
of the assessment between diff erent regions and remove biases
transboundary nature of many aquatic resources and the transboundary
in the assessment caused by diff erent perceptions of and ways to
focus of the GIWA, the boundaries of the regions did not comply with
communicate the severity of impacts caused by particular issues, the
viii
REGIONAL ASSESSMENTS
results were distilled and reported as standardised scores according to
Table 2
Example of environmental impact assessment of
Freshwater shortage.
the following four point scale:
Weight
0 = no known impact
Environmental
Environmental issues
Score
Weight %
averaged
concerns
1 = slight impact
score
2
=
moderate
impact
1. Modification of stream flow
1
20
Freshwater shortage
1.50
3 = severe impact
2. Pollution of existing supplies
2
50
The attributes of each score for each issue were described by a detailed
3. Changes in the water table
1
30
set of pre-defi ned criteria that were used to guide experts in reporting
Table 3
Example of Health impacts assessment linked to one of
the results of the assessment. For example, the criterion for assigning
the GIWA concerns.
a score of 3 to the issue Loss of ecosystems or ecotones is: "Permanent
Criteria for Health impacts
Raw score
Score
Weight %
destruction of at least one habitat is occurring such as to have reduced their
Very small
Very large
surface area by >30% during the last 2-3 decades". The full list of criteria is
Number of people affected
2
50
0 1 2 3
presented at the end of the chapter, Table 5a-e. Although the scoring
Minimum
Severe
Degree of severity
2
30
0 1 2 3
inevitably includes an arbitrary component, the use of predefi ned
Occasion/Short
Continuous
Frequency/Duration
2
20
0 1 2 3
criteria facilitates comparison of impacts on a global scale and also
Weight average score for Health impacts
2
encouraged consensus of opinion among experts.
The trade-off associated with assessing the impacts of each concern
After all 22 issues and associated socio-economic impacts have
and their constituent issues at the scale of the entire region is that spatial
been scored, weighted and averaged, the magnitude of likely future
resolution was sometimes low. Although the assessment provides a
changes in the environmental and socio-economic impacts of each
score indicating the severity of impacts of a particular issue or concern
of the fi ve concerns on the entire region is assessed according to the
on the entire region, it does not mean that the entire region suff ers
most likely scenario which describes the demographic, economic,
the impacts of that problem. For example, eutrophication could be
technological and other relevant changes that might infl uence the
identifi ed as a severe problem in a region, but this does not imply that all
aquatic environment within the region by 2020.
waters in the region suff er from severe eutrophication. It simply means
that when the degree of eutrophication, the size of the area aff ected,
In order to prioritise among GIWA concerns within the region and
the socio-economic impacts and the number of people aff ected is
identify those that will be subjected to causal chain and policy options
considered, the magnitude of the overall impacts meets the criteria
analysis in the subsequent stages of the GIWA, the present and future
defi ning a severe problem and that a regional action should be initiated
scores of the environmental and socio-economic impacts of each
in order to mitigate the impacts of the problem.
concern are tabulated and an overall score calculated. In the example
presented in Table 4, the scoping assessment indicated that concern III,
When each issue has been scored, it was weighted according to the relative
Habitat and community modifi cation, was the priority concern in this
contribution it made to the overall environmental impacts of the concern
region. The outcome of this mathematic process was reconciled against
and a weighted average score for each of the fi ve concerns was calculated
the knowledge of experts and the best available information in order
(Table 2). Of course, if each issue was deemed to make equal contributions,
to ensure the validity of the conclusion.
then the score describing the overall impacts of the concern was simply the
arithmetic mean of the scores allocated to each issue within the concern.
In some cases however, this process and the subsequent participatory
In addition, the socio-economic impacts of each of the fi ve major
discussion did not yield consensus among the regional experts
concerns were assessed for the entire region. The socio-economic
regarding the ranking of priorities. As a consequence, further analysis
impacts were grouped into three categories; Economic impacts,
was required. In such cases, expert teams continued by assessing the
Health impacts and Other social and community impacts (Table 3). For
relative importance of present and potential future impacts and assign
each category, an evaluation of the size, degree and frequency of the
weights to each. Afterwards, the teams assign weights indicating the
impact was performed and, once completed, a weighted average score
relative contribution made by environmental and socio-economic
describing the overall socio-economic impacts of each concern was
factors to the overall impacts of the concern. The weighted average
calculated in the same manner as the overall environmental score.
score for each concern is then recalculated taking into account
THE GIWA METHODOLOGY
ix
Table 4
Example of comparative environmental and socio-economic impacts of each major concern, presently and likely in year 2020.
Types of impacts
Environmental score
Economic score
Human health score
Social and community score
Concern
Overall score
Present (a)
Future (b)
Present (c)
Future (d)
Present (e)
Future (f)
Present (g)
Future (h)
Freshwater shortage
1.3
2.3
2.7
2.8
2.6
3.0
1.8
2.2
2.3
Pollution
1.5
2.0
2.0
2.3
1.8
2.3
2.0
2.3
2.0
Habitat and community
2.0
3.0
2.4
3.0
2.4
2.8
2.3
2.7
2.6
modification
Unsustainable exploitation of fish
1.8
2.2
2.0
2.1
2.0
2.1
2.4
2.5
2.1
and other living resources
Global change
0.8
1.0
1.5
1.7
1.5
1.5
1.0
1.0
1.2
the relative contributions of both present and future impacts and
should be regarded as a framework to guide the analysis, rather than
environmental and socio-economic factors. The outcome of these
as a set of detailed instructions. Secondly, in an ideal setting, a causal
additional analyses was subjected to further discussion to identify
chain would be produced by a multidisciplinary group of specialists
overall priorities for the region.
that would statistically examine each successive cause and study its
links to the problem and to other causes. However, this approach (even
Finally, the assessment recognises that each of the fi ve GIWA concerns
if feasible) would use far more resources and time than those available
are not discrete but often interact. For example, pollution can destroy
to GIWA1. For this reason, it has been necessary to develop a relatively
aquatic habitats that are essential for fi sh reproduction which, in turn,
simple and practical analytical model for gathering information to
can cause declines in fi sh stocks and subsequent overexploitation. Once
assemble meaningful causal chains.
teams have ranked each of the concerns and determined the priorities
for the region, the links between the concerns are highlighted in order
Conceptual model
to identify places where strategic interventions could be applied to
A causal chain is a series of statements that link the causes of a problem
yield the greatest benefi ts for the environment and human societies
with its eff ects. Recognising the great diversity of local settings and the
in the region.
resulting diffi
culty in developing broadly applicable policy strategies,
the GIWA CCA focuses on a particular system and then only on those
Causal chain analysis
issues that were prioritised during the scoping assessment. The
Causal Chain Analysis (CCA) traces the cause-eff ect pathways from the
starting point of a particular causal chain is one of the issues selected
socio-economic and environmental impacts back to their root causes.
during the Scaling and Scoping stages and its related environmental
The GIWA CCA aims to identify the most important causes of each
and socio-economic impacts. The next element in the GIWA chain is
concern prioritised during the scoping assessment in order to direct
the immediate cause; defi ned as the physical, biological or chemical
policy measures at the most appropriate target in order to prevent
variable that produces the GIWA issue. For example, for the issue of
further degradation of the regional aquatic environment.
eutrophication the immediate causes may be, inter alia:
Enhanced nutrient inputs;
Root causes are not always easy to identify because they are often
Increased
recycling/mobilisation;
spatially or temporally separated from the actual problems they
Trapping of nutrients (e.g. in river impoundments);
cause. The GIWA CCA was developed to help identify and understand
Run-off and stormwaters
the root causes of environmental and socio-economic problems
in international waters and is conducted by identifying the human
Once the relevant immediate cause(s) for the particular system has
activities that cause the problem and then the factors that determine
(have) been identifi ed, the sectors of human activity that contribute
the ways in which these activities are undertaken. However, because
most signifi cantly to the immediate cause have to be determined.
there is no universal theory describing how root causes interact to
Assuming that the most important immediate cause in our example
create natural resource management problems and due to the great
had been increased nutrient concentrations, then it is logical that the
variation of local circumstances under which the methodology will
most likely sources of those nutrients would be the agricultural, urban
be applied, the GIWA CCA is not a rigidly structured assessment but
or industrial sectors. After identifying the sectors that are primarily
1 This does not mean that the methodology ignores statistical or quantitative studies; as has already been pointed out, the available evidence that justifies the assumption of causal links should
be provided in the assessment.
x
REGIONAL ASSESSMENTS
responsible for the immediate causes, the root causes acting on those
The policy options recommended by the GIWA are only contributions
sectors must be determined. For example, if agriculture was found to
to the larger policy process and, as such, the GIWA methodology
be primarily responsible for the increased nutrient concentrations, the
developed to test the performance of various options under the
root causes could potentially be:
diff erent circumstances has been kept simple and broadly applicable.
Economic (e.g. subsidies to fertilisers and agricultural products);
Legal (e.g. inadequate regulation);
Global International Waters Assessment
Failures in governance (e.g. poor enforcement); or
Technology or knowledge related (e.g. lack of aff ordable substitutes
for fertilisers or lack of knowledge as to their application).
Once the most relevant root causes have been identifi ed, an
explanation, which includes available data and information, of how
they are responsible for the primary environmental and socio-economic
problems in the region should be provided.
Policy option analysis
Despite considerable eff ort of many Governments and other
organisations to address transboundary water problems, the evidence
indicates that there is still much to be done in this endeavour. An
important characteristic of GIWA's Policy Option Analysis (POA) is that
its recommendations are fi rmly based on a better understanding of
the root causes of the problems. Freshwater scarcity, water pollution,
overexploitation of living resources and habitat destruction are very
complex phenomena. Policy options that are grounded on a better
understanding of these phenomena will contribute to create more
eff ective societal responses to the extremely complex water related
transboundary problems. The core of POA in the assessment consists
of two tasks:
Construct policy options
Policy options are simply diff erent courses of action, which are not
always mutually exclusive, to solve or mitigate environmental and
socio-economic problems in the region. Although a multitude of
diff erent policy options could be constructed to address each root
cause identifi ed in the CCA, only those few policy options that have
the greatest likelihood of success were analysed in the GIWA.
Select and apply the criteria on which the policy options will be
evaluated
Although there are many criteria that could be used to evaluate any
policy option, GIWA focuses on:
Eff ectiveness (certainty of result)
Effi
ciency (maximisation of net benefi ts)
Equity (fairness of distributional impacts)
Practical
criteria
(political
acceptability,
implementation
feasibility).
THE GIWA METHODOLOGY
xi
Table 5a: Scoring criteria for environmental impacts of Freshwater shortage
Issue
Score 0 = no known impact
Score 1 = slight impact
Score 2 = moderate impact
Score 3 = severe impact
Issue 1: Modification
No evidence of modification of stream
There is a measurably changing trend in
Significant downward or upward trend
Annual discharge of a river altered by more
of stream flow
flow.
annual river discharge at gauging stations
(more than 20% of the long term mean) in
than 50% of long term mean; or
"An increase or decrease
in a major river or tributary (basin >
annual discharges in a major river or tributary Loss of >50% of riparian or deltaic
in the discharge of
40 000 km2); or
draining a basin of >250 000 km2; or
wetlands over a period of not less than
streams and rivers
There is a measurable decrease in the area
Loss of >20% of flood plain or deltaic
40 years (through causes other than
as a result of human
of wetlands (other than as a consequence
wetlands through causes other than
conversion or artificial embankment); or
interventions on a local/
of conversion or embankment
conversion or artificial embankments; or
Significant increased siltation or erosion
regional scale (see Issue
construction); or
Significant loss of riparian vegetation (e.g.
due to changing in flow regime (other than
19 for flow alterations
There is a measurable change in the
trees, flood plain vegetation); or
normal fluctuations in flood plain rivers);
resulting from global
interannual mean salinity of estuaries or
Significant saline intrusion into previously
or
change) over the last 3-4
coastal lagoons and/or change in the mean
freshwater rivers or lagoons.
Loss of one or more anadromous or
decades."
position of estuarine salt wedge or mixing
catadromous fish species for reasons
zone; or
other than physical barriers to migration,
Change in the occurrence of exceptional
pollution or overfishing.
discharges (e.g. due to upstream
damming.
Issue 2: Pollution of
No evidence of pollution of surface and
Any monitored water in the region does
Water supplies does not meet WHO or
River draining more than 10% of the basin
existing supplies
ground waters.
not meet WHO or national drinking water
national drinking water standards in more
have suffered polysaprobic conditions, no
"Pollution of surface
criteria, other than for natural reasons; or
than 30% of the region; or
longer support fish, or have suffered severe
and ground fresh waters
There have been reports of one or more
There are one or more reports of fish kills
oxygen depletion
supplies as a result of
fish kills in the system due to pollution
due to pollution in any river draining a
Severe pollution of other sources of
point or diffuse sources"
within the past five years.
basin of >250 000 km2 .
freshwater (e.g. groundwater)
Issue 3: Changes in
No evidence that abstraction of water from Several wells have been deepened because Clear evidence of declining base flow in
Aquifers are suffering salinisation over
the water table
aquifers exceeds natural replenishment.
of excessive aquifer draw-down; or
rivers in semi-arid areas; or
regional scale; or
"Changes in aquifers
Several springs have dried up; or
Loss of plant species in the past decade,
Perennial springs have dried up over
as a direct or indirect
Several wells show some salinisation.
that depend on the presence of ground
regionally significant areas; or
consequence of human
water; or
Some aquifers have become exhausted
activity"
Wells have been deepened over areas of
hundreds of km2;or
Salinisation over significant areas of the
region.
Table 5b: Scoring criteria for environmental impacts of Pollution
Issue
Score 0 = no known impact
Score 1 = slight impact
Score 2 = moderate impact
Score 3 = severe impact
Issue 4:
Normal incidence of bacterial related
There is minor increase in incidence of
Public health authorities aware of marked
There are large closure areas or very
Microbiological
gastroenteric disorders in fisheries product
bacterial related gastroenteric disorders
increase in the incidence of bacterial
restrictive advisories affecting the
pollution
consumers and no fisheries closures or
in fisheries product consumers but no
related gastroenteric disorders in fisheries
marketability of fisheries products; or
"The adverse effects of
advisories.
fisheries closures or advisories.
product consumers; or
There exists widespread public or tourist
microbial constituents of
There are limited area closures or
awareness of hazards resulting in
human sewage released
advisories reducing the exploitation or
major reductions in the exploitation or
to water bodies."
marketability of fisheries products.
marketability of fisheries products.
Issue 5:
No visible effects on the abundance and
Increased abundance of epiphytic algae; or
Increased filamentous algal production
High frequency (>1 event per year), or
Eutrophication
distributions of natural living resource
A statistically significant trend in
resulting in algal mats; or
intensity, or large areas of periodic hypoxic
"Artificially enhanced
distributions in the area; and
decreased water transparency associated
Medium frequency (up to once per year)
conditions, or high frequencies of fish and
primary productivity in
No increased frequency of hypoxia1 or
with algal production as compared with
of large-scale hypoxia and/or fish and
zoobenthos mortality events or harmful
receiving water basins
fish mortality events or harmful algal
long-term (>20 year) data sets; or
zoobenthos mortality events and/or
algal blooms; or
related to the increased
blooms associated with enhanced primary
Measurable shallowing of the depth range
harmful algal blooms.
Significant changes in the littoral
availability or supply
production; and
of macrophytes.
community; or
of nutrients, including
No evidence of periodically reduced
Presence of hydrogen sulphide in
cultural eutrophication
dissolved oxygen or fish and zoobenthos
historically well oxygenated areas.
in lakes."
mortality; and
No evident abnormality in the frequency of
algal blooms.
xii
REGIONAL ASSESSMENTS
Issue 6: Chemical
No known or historical levels of chemical
Some chemical contaminants are
Some chemical contaminants are above
Chemical contaminants are above
pollution
contaminants except background levels of
detectable but below threshold limits
threshold limits defined for the country or
threshold limits defined for the country or
"The adverse effects of
naturally occurring substances; and
defined for the country or region; or
region; or
region; and
chemical contaminants
No fisheries closures or advisories due to
Restricted area advisories regarding
Large area advisories by public health
Public health and public awareness of
released to standing or
chemical pollution; and
chemical contamination of fisheries
authorities concerning fisheries product
fisheries contamination problems with
marine water bodies
No incidence of fisheries product tainting;
products.
contamination but without associated
associated reductions in the marketability
as a result of human
and
catch restrictions or closures; or
of such products either through the
activities. Chemical
No unusual fish mortality events.
If there is no available data use the following
High mortalities of aquatic species near
imposition of limited advisories or by area
contaminants are
criteria:
outfalls.
closures of fisheries; or
here defined as
If there is no available data use the following
Some use of pesticides in small areas; or
Large-scale mortalities of aquatic species.
compounds that are
criteria:
Presence of small sources of dioxins or
If there is no available data use the following
toxic or persistent or
No use of pesticides; and
furans (e.g., small incineration plants or
criteria:
If there is no available data use the following
bioaccumulating."
No sources of dioxins and furans; and
bleached kraft/pulp mills using chlorine);
Large-scale use of pesticides in agriculture
criteria:
No regional use of PCBs; and
or
and forestry; or
Indications of health effects resulting
No bleached kraft pulp mills using chlorine Some previous and existing use of PCBs
Presence of major sources of dioxins or
from use of pesticides; or
bleaching; and
and limited amounts of PCB-containing
furans such as large municipal or industrial Known emissions of dioxins or furans from
No use or sources of other contaminants.
wastes but not in amounts invoking local
incinerators or large bleached kraft pulp
incinerators or chlorine bleaching of pulp;
concerns; or
mills; or
or
Presence of other contaminants.
Considerable quantities of waste PCBs in
Known contamination of the environment
the area with inadequate regulation or has
or foodstuffs by PCBs; or
invoked some public concerns; or
Known contamination of the environment
Presence of considerable quantities of
or foodstuffs by other contaminants.
other contaminants.
Issue 7: Suspended
No visible reduction in water transparency; Evidently increased or reduced turbidity
Markedly increased or reduced turbidity
Major changes in turbidity over wide or
solids
and
in streams and/or receiving riverine and
in small areas of streams and/or receiving
ecologically significant areas resulting
"The adverse effects of
No evidence of turbidity plumes or
marine environments but without major
riverine and marine environments; or
in markedly changed biodiversity or
modified rates of release
increased siltation; and
changes in associated sedimentation or
Extensive evidence of changes in
mortality in benthic species due to
of suspended particulate No evidence of progressive riverbank,
erosion rates, mortality or diversity of flora
sedimentation or erosion rates; or
excessive sedimentation with or without
matter to water bodies
beach, other coastal or deltaic erosion.
and fauna; or
Changes in benthic or pelagic biodiversity
concomitant changes in the nature of
resulting from human
Some evidence of changes in benthic or
in areas due to sediment blanketing or
deposited sediments (i.e., grain-size
activities"
pelagic biodiversity in some areas due
increased turbidity.
composition/redox); or
to sediment blanketing or increased
Major change in pelagic biodiversity or
turbidity.
mortality due to excessive turbidity.
Issue 8: Solid wastes
No noticeable interference with trawling
Some evidence of marine-derived litter on
Widespread litter on beaches giving rise to
Incidence of litter on beaches sufficient
"Adverse effects
activities; and
beaches; or
public concerns regarding the recreational
to deter the public from recreational
associated with the
No noticeable interference with the
Occasional recovery of solid wastes
use of beaches; or
activities; or
introduction of solid
recreational use of beaches due to litter;
through trawling activities; but
High frequencies of benthic litter recovery
Trawling activities untenable because of
waste materials into
and
Without noticeable interference with
and interference with trawling activities;
benthic litter and gear entanglement; or
water bodies or their
No reported entanglement of aquatic
trawling and recreational activities in
or
Widespread entanglement and/or
environs."
organisms with debris.
coastal areas.
Frequent reports of entanglement/
suffocation of aquatic species by litter.
suffocation of species by litter.
Issue 9: Thermal
No thermal discharges or evidence of
Presence of thermal discharges but
Presence of thermal discharges with large
Presence of thermal discharges with large
"The adverse effects
thermal effluent effects.
without noticeable effects beyond
mixing zones having reduced productivity
mixing zones with associated mortalities,
of the release of
the mixing zone and no significant
or altered biodiversity; or
substantially reduced productivity or
aqueous effluents at
interference with migration of species.
Evidence of reduced migration of species
noticeable changes in biodiversity; or
temperatures exceeding
due to thermal plume.
Marked reduction in the migration of
ambient temperature
species due to thermal plumes.
in the receiving water
body."
Issue 10: Radionuclide No radionuclide discharges or nuclear
Minor releases or fallout of radionuclides
Minor releases or fallout of radionuclides
Substantial releases or fallout of
"The adverse effects of
activities in the region.
but with well regulated or well-managed
under poorly regulated conditions that do
radionuclides resulting in excessive
the release of radioactive
conditions complying with the Basic Safety
not provide an adequate basis for public
exposures to humans or animals in relation
contaminants and
Standards.
health assurance or the protection of
to those recommended under the Basic
wastes into the aquatic
aquatic organisms but without situations
Safety Standards; or
environment from
or levels likely to warrant large scale
Some indication of situations or exposures
human activities."
intervention by a national or international
warranting intervention by a national or
authority.
international authority.
Issue 11: Spills
No evidence of present or previous spills of
Some evidence of minor spills of hazardous Evidence of widespread contamination
Widespread contamination by hazardous
"The adverse effects
hazardous material; or
materials in small areas with insignificant
by hazardous or aesthetically displeasing
or aesthetically displeasing materials
of accidental episodic
No evidence of increased aquatic or avian
small-scale adverse effects one aquatic or
materials assumed to be from spillage
from frequent spills resulting in major
releases of contaminants
species mortality due to spills.
avian species.
(e.g. oil slicks) but with limited evidence of
interference with aquatic resource
and materials to the
widespread adverse effects on resources or
exploitation or coastal recreational
aquatic environment
amenities; or
amenities; or
as a result of human
Some evidence of aquatic or avian species
Significant mortality of aquatic or avian
activities."
mortality through increased presence of
species as evidenced by large numbers of
contaminated or poisoned carcasses on
contaminated carcasses on beaches.
beaches.
THE GIWA METHODOLOGY
xiii
Table 5c: Scoring criteria for environmental impacts of Habitat and community modification
Issue
Score 0 = no known impact
Score 1 = slight impact
Score 2 = moderate impact
Score 3 = severe impact
Issue 12: Loss of ecosystems or
There is no evidence of loss of
There are indications of fragmentation Permanent destruction of at least one
Permanent destruction of at least one
ecotones
ecosystems or habitats.
of at least one of the habitats.
habitat is occurring such as to have
habitat is occurring such as to have
"The complete destruction of aquatic
reduced their surface area by up to 30
reduced their surface area by >30%
habitats. For the purpose of GIWA
% during the last 2-3 decades.
during the last 2-3 decades.
methodology, recent loss will be
measured as a loss of pre-defined
habitats over the last 2-3 decades."
Issue 13: Modification of
No evidence of change in species
Evidence of change in species
Evidence of change in species
Evidence of change in species
ecosystems or ecotones, including
complement due to species extinction
complement due to species extinction
complement due to species extinction
complement due to species extinction
community structure and/or species
or introduction; and
or introduction
or introduction; and
or introduction; and
composition
No changing in ecosystem function
Evidence of change in population
Evidence of change in population
"Modification of pre-defined habitats
and services.
structure or change in functional group
structure or change in functional group
in terms of extinction of native species,
composition or structure
composition or structure; and
occurrence of introduced species and
Evidence of change in ecosystem
changing in ecosystem function and
services2.
services over the last 2-3 decades."
2 Constanza, R. et al. (1997). The value of the world ecosystem services and natural capital, Nature 387:253-260.
Table 5d: Scoring criteria for environmental impacts of Unsustainable exploitation of fish and other
living resources
Issue
Score 0 = no known impact
Score 1 = slight impact
Score 2 = moderate impact
Score 3 = severe impact
Issue 14: Overexploitation
No harvesting exists catching fish
Commercial harvesting exists but there One stock is exploited beyond MSY
More than one stock is exploited
"The capture of fish, shellfish or marine
(with commercial gear for sale or
is no evidence of over-exploitation.
(maximum sustainable yield) or is
beyond MSY or is outside safe
invertebrates at a level that exceeds the
subsistence).
outside safe biological limits.
biological limits.
maximum sustainable yield of the stock."
Issue 15: Excessive by-catch and
Current harvesting practices show no
Up to 30% of the fisheries yield (by
30-60% of the fisheries yield consists
Over 60% of the fisheries yield is
discards
evidence of excessive by-catch and/or
weight) consists of by-catch and/or
of by-catch and/or discards.
by-catch and/or discards; or
"By-catch refers to the incidental capture
discards.
discards.
Noticeable incidence of capture of
of fish or other animals that are not the
endangered species.
target of the fisheries. Discards refers
to dead fish or other animals that are
returned to the sea."
Issue 16: Destructive fishing
No evidence of habitat destruction due Habitat destruction resulting in
Habitat destruction resulting in
Habitat destruction resulting in
practices
to fisheries practices.
changes in distribution of fish or
moderate reduction of stocks or
complete collapse of a stock or far
"Fishing practices that are deemed to
shellfish stocks; or
moderate changes of the environment;
reaching changes in the environment;
produce significant harm to marine,
Trawling of any one area of the seabed
or
or
lacustrine or coastal habitats and
is occurring less than once per year.
Trawling of any one area of the seabed
Trawling of any one area of the seabed
communities."
is occurring 1-10 times per year; or
is occurring more than 10 times per
Incidental use of explosives or poisons
year; or
for fishing.
Widespread use of explosives or
poisons for fishing.
Issue 17: Decreased viability of
No evidence of increased incidence of
Increased reports of diseases without
Declining populations of one or more
Collapse of stocks as a result of
stocks through contamination and
fish or shellfish diseases.
major impacts on the stock.
species as a result of diseases or
diseases or contamination.
disease
contamination.
"Contamination or diseases of feral (wild)
stocks of fish or invertebrates that are a
direct or indirect consequence of human
action."
Issue 18: Impact on biological and
No evidence of deliberate or accidental Alien species introduced intentionally
Measurable decline in the population
Extinction of native species or local
genetic diversity
introductions of alien species; and
or accidentally without major changes
of native species or local stocks as a
stocks as a result of introductions
"Changes in genetic and species diversity No evidence of deliberate or accidental
in the community structure; or
result of introductions (intentional or
(intentional or accidental); or
of aquatic environments resulting from
introductions of alien stocks; and
Alien stocks introduced intentionally
accidental); or
Major changes (>20%) in the genetic
the introduction of alien or genetically
No evidence of deliberate or accidental
or accidentally without major changes
Some changes in the genetic
composition of stocks (e.g. as a result
modified species as an intentional or
introductions of genetically modified
in the community structure; or
composition of stocks (e.g. as a result
of escapes from aquaculture replacing
unintentional result of human activities
species.
Genetically modified species
of escapes from aquaculture replacing
the wild stock).
including aquaculture and restocking."
introduced intentionally or
the wild stock).
accidentally without major changes in
the community structure.
xiv
REGIONAL ASSESSMENTS
Table 5e: Scoring criteria for environmental impacts of Global change
Issue
Score 0 = no known impact
Score 1 = slight impact
Score 2 = moderate impact
Score 3 = severe impact
Issue 19: Changes in hydrological
No evidence of changes in hydrological Change in hydrological cycles due
Significant trend in changing
Loss of an entire habitat through
cycle and ocean circulation
cycle and ocean/coastal current due to
to global change causing changes
terrestrial or sea ice cover (by
desiccation or submergence as a result
"Changes in the local/regional water
global change.
in the distribution and density of
comparison with a long-term time
of global change; or
balance and changes in ocean and coastal
riparian terrestrial or aquatic plants
series) without major downstream
Change in the tree or lichen lines; or
circulation or current regime over the
without influencing overall levels of
effects on river/ocean circulation or
Major impacts on habitats or
last 2-3 decades arising from the wider
productivity; or
biological diversity; or
biodiversity as the result of increasing
problem of global change including
Some evidence of changes in ocean
Extreme events such as flood and
frequency of extreme events; or
ENSO."
or coastal currents due to global
drought are increasing; or
Changing in ocean or coastal currents
change but without a strong effect on
Aquatic productivity has been altered
or upwelling regimes such that plant
ecosystem diversity or productivity.
as a result of global phenomena such
or animal populations are unable to
as ENSO events.
recover to their historical or stable
levels; or
Significant changes in thermohaline
circulation.
Issue 20: Sea level change
No evidence of sea level change.
Some evidences of sea level change
Changed pattern of coastal erosion due Major loss of coastal land areas due to
"Changes in the last 2-3 decades in the
without major loss of populations of
to sea level rise has became evident; or
sea-level change or sea-level induced
annual/seasonal mean sea level as a
organisms.
Increase in coastal flooding events
erosion; or
result of global change."
partly attributed to sea-level rise
Major loss of coastal or intertidal
or changing prevailing atmospheric
populations due to sea-level change or
forcing such as atmospheric pressure
sea level induced erosion.
or wind field (other than storm
surges).
Issue 21: Increased UV-B radiation as No evidence of increasing effects
Some measurable effects of UV/B
Aquatic community structure is
Measured/assessed effects of UV/B
a result of ozone depletion
of UV/B radiation on marine or
radiation on behavior or appearance of
measurably altered as a consequence
irradiation are leading to massive loss
"Increased UV-B flux as a result polar
freshwater organisms.
some aquatic species without affecting
of UV/B radiation; or
of aquatic communities or a significant
ozone depletion over the last 2-3
the viability of the population.
One or more aquatic populations are
change in biological diversity.
decades."
declining.
Issue 22: Changes in ocean CO
No measurable or assessed changes
Some reasonable suspicions that
Some evidences that the impacts
Evidences that the changes in
2
source/sink function
in CO source/sink function of aquatic
current global change is impacting the
of global change have altered the
source/sink function of the aquatic
2
"Changes in the capacity of aquatic
system.
aquatic system sufficiently to alter its
source/sink function for CO of aquatic
systems in the region are sufficient to
2
systems, ocean as well as freshwater, to
source/sink function for CO .
systems in the region by at least 10%.
cause measurable change in global CO
2
2
generate or absorb atmospheric CO as a
balance.
2
direct or indirect consequence of global
change over the last 2-3 decades."
THE GIWA METHODOLOGY
xv