
Global International
Waters Assessment
Regional assessments
Global International
Waters Assessment
Regional assessment 11
Barents Sea
GIWA report production
Series editor: Ulla Li Zweifel
Editorial assistance: Johanna Egerup and Marianne Lindström
Maps & GIS: Niklas Holmgren
Design & graphics: Joakim Palmqvist
Global International Waters Assessment
Barents Sea, GIWA Regional assessment 11
Published by the University of Kalmar on behalf of
United Nations Environment Programme
© 2004 United Nations Environment Programme
ISSN 1651-940X
University of Kalmar
SE-391 82 Kalmar
Sweden
United Nations Environment Programme
PO Box 30552,
Nairobi, Kenya
This publication may be reproduced in whole or in part and
in any form for educational or non-profit purposes without
special permission from the copyright holder, provided
acknowledgement of the source is made. No use of this
publication may be made for resale or for any other commercial
purpose whatsoever without prior permission in writing from the
United Nations Environment Programme.
CITATIONS
When citing this report, please use:
UNEP, 2004. Matishov, G., Golubeva, N., Titova, G., Sydnes, A. and
B. Voegele. Barents Sea, GIWA Regional assessment 11. University
of Kalmar, Kalmar, Sweden.
DISCLAIMER
The views expressed in this publication are those of the authors
and do not necessarily reflect those of UNEP. The designations
employed and the presentations do not imply the expressions
of any opinion whatsoever on the part of UNEP or cooperating
agencies concerning the legal status of any country, territory,
city or areas or its authority, or concerning the delimitation of its
frontiers or boundaries.
This publication has been peer-reviewed and the information
herein is believed to be reliable, but the publisher does not
warrant its completeness or accuracy.
Printed and bound in Kalmar, Sweden, by Sunds Tryck Öland AB.
CONTENTS
Contents
Executive summary
9
Abbreviations and acronyms
10
Regional definition
13
Boundaries of the Barents Sea region
13
Physical characteristics
13
Socio-economic characteristics
18
Assessment
32
Freshwater shortage
32
Pollution
35
Habitat and community modification
44
Unsustainable exploitation of fish and other living resources
48
Global change
51
Priority concerns
51
Causal chain analysis
53
Overexploitation of fish
53
Modification of ecosystems
57
Radionuclides
60
Oil spills
62
Policy options
66
Overexploitation of fish
66
Modification of ecosystems
71
Radionuclides
72
Oil spills
74
Conclusions and recommendations
77
References
79
Annexes
86
Annex I List of contributing authors and organisations
86
Annex II Detailed scoring tables
87
Annex III Detailed assessment tables
90
Annex IV Certification of fisheries to the MSC Standard
94
Annex V List of important water-related programmes and assessments
95
Annex VI List of conventions and specific laws that affect water use in the region
99
The need for a global international waters assessment
i
The GIWA methodology
vii
CONTENTS
Executive summary
The Barents Sea is a unique Arctic marine ecosystem, characterised by
long-term plans and legislation was identified as a recurring root cause
distinct bathymetry and bottom topography, a large oceanic shelf, an
for many issues. A set of policy options for dealing with the issues of
extensive polar front, high productivity, and a high abundance and
overexploitation, modification of ecosystems, and future threats from oil
diversity of flora and fauna. The majority of the Barents Sea drainage
spil s and radioactive contamination have been recommended. However,
basin is located in Russian territory, with smal parts located in Norway
it should be noted that in practice, the implementation of the policy
and Finland. As the meeting point between the Atlantic and the Arctic
options will require a substantial amount of time and resources.
Oceans, and Western Europe and Russia, the Barents Sea has attracted
significant attention from many politicians and researchers, who are
It is recommended that new regulations for different sectors should
interested in its biological resources, its oil and gas reserves, as wel as
be adopted and enforced, along with rigorous adherence to existing
the potential risks of radioactive pollution.
international agreements. For example, there is a need for a long-
term strategy for the handling and storage of radioactive wastes. With
The most pressing issues for the Barents Sea ecosystem were identified as
respect to fisheries, implementing and enforcing appropriate standards
the overexploitation of fish, oil spil s, radionuclide contamination, and the
for fisheries management wil require careful conflict resolution by the
modification of ecosystems by invasive species. Overexploitation of fish
Joint Norwegian-Russian Fisheries Commission. Because parties have
was considered as the most important issue since the major commercial
expressed commitments towards international agreements for the
fish stock (cod and haddock) are exploited beyond safe biological limits.
conservation and management of the marine environment, including
Currently, the impacts of pol ution by oil spil s and radioactive wastes remain
the Convention on Biodiversity, the UN Fish Stocks Agreement, and
slight. However, due to the expansion of the oil and gas industry in the
the World Summit on Sustainable Development, it is assumed that the
region, as wel as increased shipments of oil and gas through the Barents
management of fisheries in the Barents Sea will improve over time.
Sea, the risk of accidental oil spil s is likely to increase in the near future. There
are also apprehensions that storage facilities for radioactive wastes could
This report presents the results of the UNEP/GIWA Assessment for the Barents
result in radioactive contamination of the environment, as the Murmansk
Sea region as concluded during four workshops. The first two workshops were
Region houses more radioactive wastes than any other region in the world.
conducted in Murmansk, Russia, in September 2001 and February 2002. In
With respect to the modification of ecosystems, there are concerns that the
these two meetings, only Russian experts participated. Since a small part of the
invasive Red king crab wil compete with native species for forage reserves,
Barents Sea drainage basin belongs to Norway and Finland, partners were found
which could result in the decrease of commercial fish stocks of the Barents
in Norway on the recommendation of the Programme authorities, and the last
Sea. Another problem, linked to oil transportation, is the risk of unintentional
two workshops were carried out with support from Norwegian partners, one in
introduction of alien species in the bal ast water of oil tankers.
Tromsř, Norway, in February 2003 and the other in Murmansk, Russia, in October
2003. The Task team was made up of local experts having a wide and long-term
Causal chain analyses conducted for each of the four main issues
expertise concerning the environmental and socio-economic impact assessment
il ustrated clear links between environmental and socio-economic
in the Barents Sea region. In their work, the experts used various data obtained
impacts, and described how factors such as economic incentives,
from a wide range of different international programmes and projects carried out
governance arrangements, politics, and the lack of knowledge are often
in the region. The results provided are based on the conclusions from the Russian
major root causes for the identified problems. The absence of effective
Task team, with support from the Norwegian experts and other invitees.
EXECUTIVE SUMMARY
9
Abbreviations and acronyms
AC
The Arctic Council
LME
Large Marine Ecosystem
ACIA
Arctic Climate Impact Assessment
LRW
Liquid Radioactive Wastes
AEPS
Arctic Environmental Protection Strategy
MAC
Maximum Al owable Concentration
AMAP
Arctic Monitoring and Assessment Program
MAHMS Murmansk Region Administration for Hydrometeorology and
APPE
Arkhangelsk Pulp and Paper Enterprise
Environment Monitoring
ARIA
Arctic Environmental Impact Assessment
MMBI
Murmansk Marine Biological Institute
BASIS
Barents Sea Impact Study
MSY
Maximum Sustainable Yield
Bpa
Biomass precautionary approach
NEFCO
Nordic Environment Finance Corporation
BaP
Benza Pyrene
NGO
Non-Governmental Organisation
CAFF
Conservation of Arctic Flora and Fauna
OCPs
Organochlorine pesticides
COP
Chlorine organic pesticides
OPA
Oil Pollution Act
DDD
Dichlorodiphenyldichloroethane
PAHs
Polycyclic Aromatic Hydrocarbons
DDE
Dichlorodiphenylethane
PAME
Protection of the Arctic Marine Environment
DDT
Dichlorodiphenyltrichloroethane
PCBs
Polychlorinated biphenyls
EC
European Community
PINRO
Polar Scientific Research Institute of Fisheries and Oceanography
EEZ
Exclusive Economic Zone
POPs
Persistent Organic Pollutants
EIA
Environmental Impact Assessment
RF
Russian Federation
EPPR
Emergency Prevention, Preparedness and Response
RSFSR
Russian Soviet Federative Socialist Republic
EU
European Union
RTE
Repairing and Technological Enterprise
FAO
United Nation's Food and Agriculture Organization
SDU
Sustainable Development and Utilisation
GDP
Gross Domestic Product
SDWG
Sustainable Development Working Group
GIWA
Global International Waters Assessment
SFT
Norwegian Pollution Control Authority
-HCH
alpha-hexachlorocyclohexane
SNF
Spent Nuclear Fuel
-HCH
gamma-hexachlorocyclohexane
SPA
Scientific and Production Association
HRW
Hard Radioactive Wastes
TAC
Total Al owable Catch
IASC
International Arctic Science Committee
UNEP
United Nations Environment Programme
ICES
International Council for the Exploration of the Sea
VMS
Vessel Monitoring Systems
IUCN
International Council of Conservation of Nature
VNIRO
Al -Russian Research Institute of Fishery
ISM
Institute of Community Medicine
VOC
Volatile Organic Compounds
IUPAC
International Union of Pure and Applied Chemistry
USSR
Union of Soviet Socialist Republics
JAMP
Joint Assessment and Monitoring Program
JSC
Joint Stock Company
KSCRAS Kola Scientific Center Russian Academy of Sciences
10
GIWA REGIONAL ASSESSMENT 11 BARENTS SEA
ABBREVIATIONS AND ACRONYMS
11
List of figures
Figure 1
The Barents Sea region.. . . . . . . . . . . . . . . . . . . . . . . . . . . . . . . . . . . . . . . . . . . . . . . . . . . . . . . . . . . . . . . . . . . . . . . . . . . . . . . . . . . . . . . . . . . . . . . . . . . . . . . . . . . . . . . . . . . . . . . . . . . . . . . . . . . . . . . . . 13
Figure 2
Average long-term air temperature, January.. . . . . . . . . . . . . . . . . . . . . . . . . . . . . . . . . . . . . . . . . . . . . . . . . . . . . . . . . . . . . . . . . . . . . . . . . . . . . . . . . . . . . . . . . . . . . . . . . . . . . . . . . . . . . . . . . . . 14
Figure 3
Average long-term air temperature, July. . . . . . . . . . . . . . . . . . . . . . . . . . . . . . . . . . . . . . . . . . . . . . . . . . . . . . . . . . . . . . . . . . . . . . . . . . . . . . . . . . . . . . . . . . . . . . . . . . . . . . . . . . . . . . . . . . . . . . . . 15
Figure 4
Land cover in the Barents Sea region. . . . . . . . . . . . . . . . . . . . . . . . . . . . . . . . . . . . . . . . . . . . . . . . . . . . . . . . . . . . . . . . . . . . . . . . . . . . . . . . . . . . . . . . . . . . . . . . . . . . . . . . . . . . . . . . . . . . . . . . . . . . 17
Figure 5
Population density.. . . . . . . . . . . . . . . . . . . . . . . . . . . . . . . . . . . . . . . . . . . . . . . . . . . . . . . . . . . . . . . . . . . . . . . . . . . . . . . . . . . . . . . . . . . . . . . . . . . . . . . . . . . . . . . . . . . . . . . . . . . . . . . . . . . . . . . . . . . . 18
Figure 6
Main economic sectors and industry branches in the region. . . . . . . . . . . . . . . . . . . . . . . . . . . . . . . . . . . . . . . . . . . . . . . . . . . . . . . . . . . . . . . . . . . . . . . . . . . . . . . . . . . . . . . . . . . . . . . . . . . . 21
Figure 7
Relative proportion of products comprising industrial output in 2001. . . . . . . . . . . . . . . . . . . . . . . . . . . . . . . . . . . . . . . . . . . . . . . . . . . . . . . . . . . . . . . . . . . . . . . . . . . . . . . . . . . . . . . . . . 22
Figure 8
Total catch dynamics of the main commercial fisheries in the Barents and Norwegian Seas. . . . . . . . . . . . . . . . . . . . . . . . . . . . . . . . . . . . . . . . . . . . . . . . . . . . . . . . . . . . . . . . . . . . 25
Figure 9
Fish catches in Northwest Russia. . . . . . . . . . . . . . . . . . . . . . . . . . . . . . . . . . . . . . . . . . . . . . . . . . . . . . . . . . . . . . . . . . . . . . . . . . . . . . . . . . . . . . . . . . . . . . . . . . . . . . . . . . . . . . . . . . . . . . . . . . . . . . . 25
Figure 10 Dynamics of the Russian catches in the Barents Sea. . . . . . . . . . . . . . . . . . . . . . . . . . . . . . . . . . . . . . . . . . . . . . . . . . . . . . . . . . . . . . . . . . . . . . . . . . . . . . . . . . . . . . . . . . . . . . . . . . . . . . . . . . . . 25
Figure 11 Landings of cod Finnmark 1985-2003. . . . . . . . . . . . . . . . . . . . . . . . . . . . . . . . . . . . . . . . . . . . . . . . . . . . . . . . . . . . . . . . . . . . . . . . . . . . . . . . . . . . . . . . . . . . . . . . . . . . . . . . . . . . . . . . . . . . . . . . . . 26
Figure 12 Oil and gas structures of the Barents and Kara Seas. . . . . . . . . . . . . . . . . . . . . . . . . . . . . . . . . . . . . . . . . . . . . . . . . . . . . . . . . . . . . . . . . . . . . . . . . . . . . . . . . . . . . . . . . . . . . . . . . . . . . . . . . . . . 26
Figure 13 The scheme of setting of TACs for the shared stocks of the Barents Sea. . . . . . . . . . . . . . . . . . . . . . . . . . . . . . . . . . . . . . . . . . . . . . . . . . . . . . . . . . . . . . . . . . . . . . . . . . . . . . . . . . . . . . . . . 29
Figure 14 Location of the sources of radioactive contamination on the coast of Kola and Motovsky bays.. . . . . . . . . . . . . . . . . . . . . . . . . . . . . . . . . . . . . . . . . . . . . . . . . . . . . . . . . . . . . . . . 42
Figure 15 Red king crab. . . . . . . . . . . . . . . . . . . . . . . . . . . . . . . . . . . . . . . . . . . . . . . . . . . . . . . . . . . . . . . . . . . . . . . . . . . . . . . . . . . . . . . . . . . . . . . . . . . . . . . . . . . . . . . . . . . . . . . . . . . . . . . . . . . . . . . . . . . . . . . . . . 45
Figure 16 Total biomass of the Northeast Arctic cod 1946-1999.. . . . . . . . . . . . . . . . . . . . . . . . . . . . . . . . . . . . . . . . . . . . . . . . . . . . . . . . . . . . . . . . . . . . . . . . . . . . . . . . . . . . . . . . . . . . . . . . . . . . . . . . . . 48
Figure 17 Scientific recommendations and TACs for the Northeast arctic cod 1995-2003. . . . . . . . . . . . . . . . . . . . . . . . . . . . . . . . . . . . . . . . . . . . . . . . . . . . . . . . . . . . . . . . . . . . . . . . . . . . . . . . . 48
Figure 18 Causal chain diagram illustrating the causal links for overexploitation of fish.. . . . . . . . . . . . . . . . . . . . . . . . . . . . . . . . . . . . . . . . . . . . . . . . . . . . . . . . . . . . . . . . . . . . . . . . . . . . . . . . . 57
Figure 19 Red king crab in the Barents Sea. . . . . . . . . . . . . . . . . . . . . . . . . . . . . . . . . . . . . . . . . . . . . . . . . . . . . . . . . . . . . . . . . . . . . . . . . . . . . . . . . . . . . . . . . . . . . . . . . . . . . . . . . . . . . . . . . . . . . . . . . . . . . . . 58
Figure 20 Causal chain diagram illustrating the causal links for modification of ecosytems. . . . . . . . . . . . . . . . . . . . . . . . . . . . . . . . . . . . . . . . . . . . . . . . . . . . . . . . . . . . . . . . . . . . . . . . . . . . . . 60
Figure 21 Causal chain diagram illustrating the causal links for oil spills. . . . . . . . . . . . . . . . . . . . . . . . . . . . . . . . . . . . . . . . . . . . . . . . . . . . . . . . . . . . . . . . . . . . . . . . . . . . . . . . . . . . . . . . . . . . . . . . . 64
Figure 22 Fishing boat at sea.. . . . . . . . . . . . . . . . . . . . . . . . . . . . . . . . . . . . . . . . . . . . . . . . . . . . . . . . . . . . . . . . . . . . . . . . . . . . . . . . . . . . . . . . . . . . . . . . . . . . . . . . . . . . . . . . . . . . . . . . . . . . . . . . . . . . . . . . . . . . 68
List of tables
Table 1
Characteristics of the largest rivers in the Barents Sea region. . . . . . . . . . . . . . . . . . . . . . . . . . . . . . . . . . . . . . . . . . . . . . . . . . . . . . . . . . . . . . . . . . . . . . . . . . . . . . . . . . . . . . . . . . . . . . . . . . . . 15
Table 2
Population density.. . . . . . . . . . . . . . . . . . . . . . . . . . . . . . . . . . . . . . . . . . . . . . . . . . . . . . . . . . . . . . . . . . . . . . . . . . . . . . . . . . . . . . . . . . . . . . . . . . . . . . . . . . . . . . . . . . . . . . . . . . . . . . . . . . . . . . . . . . . . . 19
Table 3
Urban population in the Russian sector of the region. . . . . . . . . . . . . . . . . . . . . . . . . . . . . . . . . . . . . . . . . . . . . . . . . . . . . . . . . . . . . . . . . . . . . . . . . . . . . . . . . . . . . . . . . . . . . . . . . . . . . . . . . . . 19
Table 4
Changes in population in the Russian sector of the region.. . . . . . . . . . . . . . . . . . . . . . . . . . . . . . . . . . . . . . . . . . . . . . . . . . . . . . . . . . . . . . . . . . . . . . . . . . . . . . . . . . . . . . . . . . . . . . . . . . . . . . 19
Table 5
Life expectancy at birth. . . . . . . . . . . . . . . . . . . . . . . . . . . . . . . . . . . . . . . . . . . . . . . . . . . . . . . . . . . . . . . . . . . . . . . . . . . . . . . . . . . . . . . . . . . . . . . . . . . . . . . . . . . . . . . . . . . . . . . . . . . . . . . . . . . . . . . . . 19
Table 6
Gross Domestic Product per capita in Russia and the Russian sector of the region. . . . . . . . . . . . . . . . . . . . . . . . . . . . . . . . . . . . . . . . . . . . . . . . . . . . . . . . . . . . . . . . . . . . . . . . . . . . . . . 19
Table 7
Indices of industrial production in the Russian sector of the region. . . . . . . . . . . . . . . . . . . . . . . . . . . . . . . . . . . . . . . . . . . . . . . . . . . . . . . . . . . . . . . . . . . . . . . . . . . . . . . . . . . . . . . . . . . . 20
Table 8
Indices of physical volume of the Gross Domestic Product in the Russian sector of the region. . . . . . . . . . . . . . . . . . . . . . . . . . . . . . . . . . . . . . . . . . . . . . . . . . . . . . . . . . . . . . . . . . 20
Table 9
Population and employees in the Russian sector of the Barent Sea region. . . . . . . . . . . . . . . . . . . . . . . . . . . . . . . . . . . . . . . . . . . . . . . . . . . . . . . . . . . . . . . . . . . . . . . . . . . . . . . . . . . . . . 20
Table 10
Number of employed persons and the unemployment rate in Finnmark County, Norway. . . . . . . . . . . . . . . . . . . . . . . . . . . . . . . . . . . . . . . . . . . . . . . . . . . . . . . . . . . . . . . . . . . . . . 20
Table 11
Population changes in the coastal villages and settlements of the northern regions of Russia and Finnmark, Norway.. . . . . . . . . . . . . . . . . . . . . . . . . . . . . . . . . . . . . . . . . . 21
Table 12
The share of economic sectors in GDP in the Russian sector of the region in 2000.. . . . . . . . . . . . . . . . . . . . . . . . . . . . . . . . . . . . . . . . . . . . . . . . . . . . . . . . . . . . . . . . . . . . . . . . . . . . . . . 21
Table 13
Industrial production in the northern Russian regions.. . . . . . . . . . . . . . . . . . . . . . . . . . . . . . . . . . . . . . . . . . . . . . . . . . . . . . . . . . . . . . . . . . . . . . . . . . . . . . . . . . . . . . . . . . . . . . . . . . . . . . . . . 23
Table 14
Production of the most important kinds of agricultural products in the northern Russian regions. . . . . . . . . . . . . . . . . . . . . . . . . . . . . . . . . . . . . . . . . . . . . . . . . . . . . . . . . . . . . . 23
Table 15
Farmed area and number of reindeer units in Finnmark 1994-2001.. . . . . . . . . . . . . . . . . . . . . . . . . . . . . . . . . . . . . . . . . . . . . . . . . . . . . . . . . . . . . . . . . . . . . . . . . . . . . . . . . . . . . . . . . . . . 23
Table 16
Scoring table for the Barents Sea region.. . . . . . . . . . . . . . . . . . . . . . . . . . . . . . . . . . . . . . . . . . . . . . . . . . . . . . . . . . . . . . . . . . . . . . . . . . . . . . . . . . . . . . . . . . . . . . . . . . . . . . . . . . . . . . . . . . . . . . . 32
Table 17
Russian water quality guidelines (Maximim Allowable Concentration - MAC) for the protection of aquatic life, based on toxilogical criteria. . . . . . . . . . . . . . . . . . . 33
Table 18
Concentration of heavy metals in the Barents Sea region. . . . . . . . . . . . . . . . . . . . . . . . . . . . . . . . . . . . . . . . . . . . . . . . . . . . . . . . . . . . . . . . . . . . . . . . . . . . . . . . . . . . . . . . . . . . . . . . . . . . . . 37
Table 19
Concentration of organic pollutants in the Barents Sea region. . . . . . . . . . . . . . . . . . . . . . . . . . . . . . . . . . . . . . . . . . . . . . . . . . . . . . . . . . . . . . . . . . . . . . . . . . . . . . . . . . . . . . . . . . . . . . . . . 37
Table 20
The Norwegian Pollution Control Authority (SFT) classification of environmental quality: contaminants in marine bottom sediments. . . . . . . . . . . . . . . . . . . . . . . . 39
Table 21
The Norwegian Pollution Control Authority (SFT) classification of environmental quality: contaminants in blue mussels. . . . . . . . . . . . . . . . . . . . . . . . . . . . . . . . . . . . . . 39
Table 22
Average annual concentrations of trace elements in the tissues of the most important commercial fish species of the Barents Sea in 2000. . . . . . . . . . . . . . . . . . . . . 39
Table 23
Artificial radionuclide fallout over the Russian Polar North and on the Kola Bay surface.. . . . . . . . . . . . . . . . . . . . . . . . . . . . . . . . . . . . . . . . . . . . . . . . . . . . . . . . . . . . . . . . . . . . . . . 40
Table 24
Strontium and cesium in the Onega, Severnaya Dvina, and Pechora rivers. . . . . . . . . . . . . . . . . . . . . . . . . . . . . . . . . . . . . . . . . . . . . . . . . . . . . . . . . . . . . . . . . . . . . . . . . . . . . . . . . . . . . 41
Table 25
Tritium in the Severnaya Dvina and Pechora rivers. . . . . . . . . . . . . . . . . . . . . . . . . . . . . . . . . . . . . . . . . . . . . . . . . . . . . . . . . . . . . . . . . . . . . . . . . . . . . . . . . . . . . . . . . . . . . . . . . . . . . . . . . . . . . 41
Table 26
Total input of artificial radionuclides since the installation of the LRW purification facility at RTE ATOMFLOT.. . . . . . . . . . . . . . . . . . . . . . . . . . . . . . . . . . . . . . . . . . . . . . . . . . 41
Table 27
Artificial radionuclide concentrations measured in the Kola Bay. . . . . . . . . . . . . . . . . . . . . . . . . . . . . . . . . . . . . . . . . . . . . . . . . . . . . . . . . . . . . . . . . . . . . . . . . . . . . . . . . . . . . . . . . . . . . . . 42
Table 28
Fishprocessing in Finnmark. . . . . . . . . . . . . . . . . . . . . . . . . . . . . . . . . . . . . . . . . . . . . . . . . . . . . . . . . . . . . . . . . . . . . . . . . . . . . . . . . . . . . . . . . . . . . . . . . . . . . . . . . . . . . . . . . . . . . . . . . . . . . . . . . . . . 50
10
GIWA REGIONAL ASSESSMENT 11 BARENTS SEA
ABBREVIATIONS AND ACRONYMS
11
Table 29
Registered fishermen in Finnmark 1992-2002. . . . . . . . . . . . . . . . . . . . . . . . . . . . . . . . . . . . . . . . . . . . . . . . . . . . . . . . . . . . . . . . . . . . . . . . . . . . . . . . . . . . . . . . . . . . . . . . . . . . . . . . . . . . . . . . . . 50
Table 30
Severity analysis of the concerns for the present and 2020.. . . . . . . . . . . . . . . . . . . . . . . . . . . . . . . . . . . . . . . . . . . . . . . . . . . . . . . . . . . . . . . . . . . . . . . . . . . . . . . . . . . . . . . . . . . . . . . . . . . . . 51
Table 31
Cod quota and the number of middle-sized vessels in the Russian cod fishery. . . . . . . . . . . . . . . . . . . . . . . . . . . . . . . . . . . . . . . . . . . . . . . . . . . . . . . . . . . . . . . . . . . . . . . . . . . . . . . . . . 54
Table 32
Norwegian fishing fleets total engine power 1992-2002. . . . . . . . . . . . . . . . . . . . . . . . . . . . . . . . . . . . . . . . . . . . . . . . . . . . . . . . . . . . . . . . . . . . . . . . . . . . . . . . . . . . . . . . . . . . . . . . . . . . . . . . 54
Table 33
Fishing vessels participating in the cod fishery, Norwegian coastal fleet 1990-2002. . . . . . . . . . . . . . . . . . . . . . . . . . . . . . . . . . . . . . . . . . . . . . . . . . . . . . . . . . . . . . . . . . . . . . . . . . . . 54
Table 34
Fishing vessels by length in Finnmark 1990-2000.. . . . . . . . . . . . . . . . . . . . . . . . . . . . . . . . . . . . . . . . . . . . . . . . . . . . . . . . . . . . . . . . . . . . . . . . . . . . . . . . . . . . . . . . . . . . . . . . . . . . . . . . . . . . . . 54
Table 35
Possible effects of oil spills on marine organisms and communities in pelagic (1) and littoral (2) zones. . . . . . . . . . . . . . . . . . . . . . . . . . . . . . . . . . . . . . . . . . . . . . . . . . . . . . . . . 62
Table 36
Planned oil transport along the coast of the Murmansk Region. . . . . . . . . . . . . . . . . . . . . . . . . . . . . . . . . . . . . . . . . . . . . . . . . . . . . . . . . . . . . . . . . . . . . . . . . . . . . . . . . . . . . . . . . . . . . . . . 63
Table 37
Root causes and policy options for overexploitation of fish in the Barents Sea region.. . . . . . . . . . . . . . . . . . . . . . . . . . . . . . . . . . . . . . . . . . . . . . . . . . . . . . . . . . . . . . . . . . . . . . . . . . 70
12
GIWA REGIONAL ASSESSMENT 11 BARENTS SEA
Regional definition
This section describes the boundaries and the main physical and
Boundaries of the
socio-economic characteristics of the region in order to define the
Barents Sea region
area considered in the regional GIWA Assessment and to provide
sufficient background information to establish the context within
The boundaries of GIWA region 11 fol ow the traditional geographic
which the assessment was conducted.
boundaries of the Barents Sea and stretches from north to south
between the latitudes 82° N and 59° N and from east to west between
0°E
20°E
40°E
60°E
80°E
the longitudes 68° E and 15° E (Figure 1). To ensure the comparison of
Elevation/
the Assessment results with other UNEP/GIWA regions, the Barents Sea
Depth (m)
Svalbard (Norway)
Franz Joseph Land
region was considered as a single system of international waters.
2 000
1 000
500
The fol owing systems of the Barents Sea drainage basin were
100
0
considered in the Assessment:
-50
The Kola River and the Kola Bay;
a
-200
Bear Island
-1 000
The White Sea and the Severnaya Dvina River;
The Pechora River and the Pechenga River;
vaya Zemly
B a r e n t s S e a
The Barents Sea.
No
70°N
Norway Pechenga Bay
Vaigatch Island
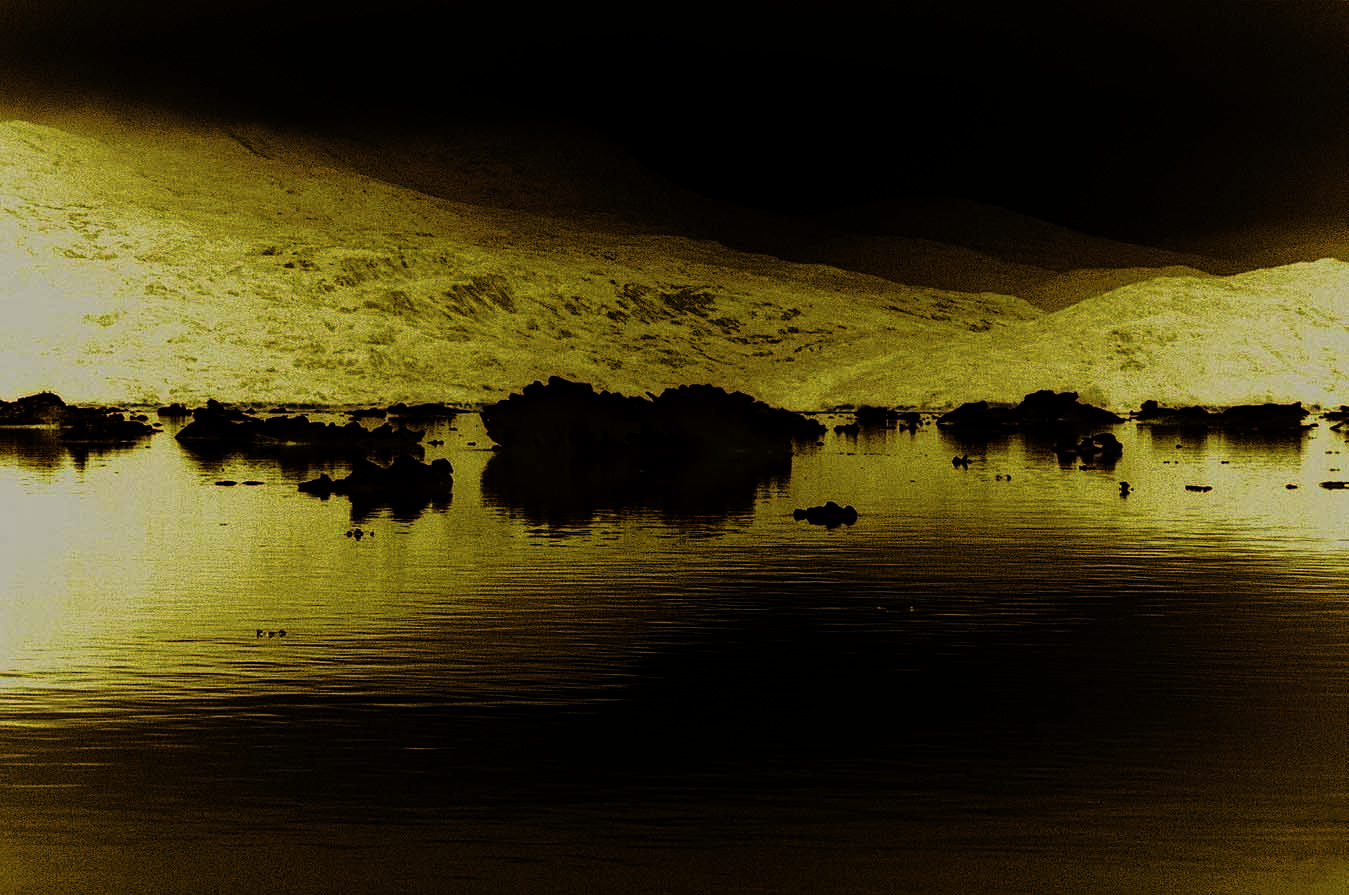
Physical characteristics
Kola Bay
Pehora Sea
Tuloma
Murmansk
The Barents Sea region is situated in the extreme northeast of Europe
Finland Kola Kola Peninsula
s
Ponoi
P
in
e
(Figure 1). Its open water area is approximately 1.5 million km2 (Barents
chor
ta
Russia a
nu
Sea: 1 424 000 km2, White Sea: 90 000 km2) and the catchment area is
Karelia
o
White Sea
l m
1 386 000 km2. The White Sea covers approximately 6% of the total open
Mezen
'
ra
Arkhangelsk
U
water area and comprises only 2% of the total volume of marine water,
On
Se
but it receives more than half of the river run-off in the region which is
ega
vernay
a Dvina
of great ecological importance.
60°N
The drainage basin lies almost entirely within the boundaries of Russia.
In the extreme southwest of the Barents Sea, a small part of the basin
© GIWA 2004
belongs to Norway and Finland. However, these territories are sparsely
Figure 1
The Barents Sea region.
(Source: elevations based on USGS 2003)
populated and do not impose any considerable ecological burdens on
REGIONAL DEFINITION
13


the basin. The White Sea is a semi-enclosed (domestic) sea of Russia.
The Barents Sea shelf belongs to Russia and Norway (its National
delimitation is presently under discussion).
The Barents and the White Seas are entirely located on the Arctic shelf
and thus, the geological structure of the continental and marine parts
of the basin is considered as a single unit. The Kola Peninsula and Karelia
lie completely within the limits of the Baltic crystal ine shield, where
bedrocks of Proterozoic and Archean ages predominate at the surface.
The remaining terrestrial part of the basin, as well as the marine areas of
the Barents and White Seas, lie within the limits of the Russian platform
(Richter 1966). The modern terrestrial topography and the marine relief
were formed during the Quaternary period under the infl uence of the
continental and shelf glaciation.
The Barents and White Sea shelf is rather deep. In the Barents Sea more
than 50% of the area have depths of 200-500 m. The average depth is
approximately 200 m and the maximum depth in the Norwegian trench
reaches 513 m and in the Franz Josef Land straits it exceeds 600 m. In the
White Sea, a considerable part of the shelf consists of shal ow bays with
an average depth of only 67 m and a maximum of 350 m.
General y, the terrestrial basin relief is formed by plains and low
highlands (up to 450 m), fringed in the east by the meridian Ural Range
and its continuation towards the north; the Novaya Zemlya mountains.
In the west the Scandinavian mountains and low mountain massifs of
the Kola Peninsula (up to 1 200 m) edge the basin, whereas in the
Figure 2
Average long-term air temperature, January.
(Source: temperature curves redrawn from Terziev et al. 1990, icecover at sea based
southwest and south, the basin is limited by a low watershed.
on NSIDC 2004)
Climate
zero over the ice-free area of the Sea and 30°C below zero in the north
The main climate-forming factors are latitudinal changes in the
and southeastern part. On land, in remote areas far from the Sea, air
incidence of solar radiation and the infl uence of the warm Atlantic
temperatures reach 50°C below zero.
water masses, entering the Barents Sea in the west. In the terrestrial
part of the region the climate is transitional from marine to continental,
Summer temperature distribution depends fi rst of al on the solar
with the continental infl uence increasing with distance from the
radiation (Figure 3). Temperature maximum, close to 35°C, are attained
coast. The climatic impacts of increasing continental infl uence are
in all parts of the land area, including the coastal zone. Corresponding
decrease in cyclonic activity, increased range of air temperature,
values, calculated for off shore areas, vary from 30°C over the coastal
and decrease in number of cloudy days and days with precipitation
water mass to 24°C at the boundary of Atlantic and Arctic water masses
(Terziev et al. 1990).
(74° N) (Matishov et al. 1998).
The main feature of the winter air temperature distribution (Figure 2)
The total annual precipitation decreases northwards within the
is the so-cal ed warmth pole in the ice-free southwestern Barents Sea,
boundaries of the catchment area from 600 mm in the upper reaches
where the average January sea temperature is close to 0°C. In the
of the Severnaya Dvina to 400 mm at the coast. At the same time, the
eastern part of the region, the severity of the winter regime both on
humidity does not vary much, as evaporation decreases almost in the
land and in the southeastern Barents Sea increases sharply. The absolute
same proportion (from 250 to 100 mm per year). Over the Barents Sea,
air temperature minimum in the Barents Sea region reach 20°C below
the total annual precipitation increases in the ice-free southwestern
14
GIWA REGIONAL ASSESSMENT 11 BARENTS SEA
REGIONAL DEFINITION
15
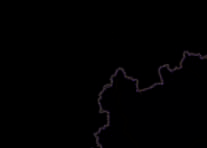


Table 1
Characteristics of the largest rivers in
the Barents Sea region.
Location of
Catchment
Discharge
River
Length (km)
discharge
area (km˛)
(mł/s)
Tuloma
Barents Sea
64
22 800
200
Kola
Barents Sea
83
3 800
40
Voronya
Barents Sea
155
9 800
110
Iokan'ga
Barents Sea
197
6 020
60
Ponoi
White Sea
410
15 200
140
Kem'
White Sea
200
28 000
270
Vyg
White Sea
308
29 500
290
(Belomorsko-Baltiysky canal)
Onega
White Sea
416
57 600
575
Severnaya Dvina (from the
White Sea
730
360 000
3 500
Sukhona entering the Vychegda)
Mezen'
White Sea
910
76 500
840
Pechora
Barents Sea
1 790
327 000
4 100
Pechenga
Barents Sea
~100
1 820
22.2
Pasvik
Barents Sea
143
18 340
201
Note: Among these rivers only the Pasvik River is transboundary. (Source: Richter 1966)
The main source for the rivers is melting waters that comprise 50-55% of
the run-off . Strong increases in river fl ow during the period of snow melt,
low run-off during summer and winter, and variable autumn fl oods,
determined by high precipitation levels and decreased evaporation,
are typical for the majority of rivers. The rivers of the Kola Peninsula and
Karelia are characterised by a more even run-off throughout the year.
Figure 3
Average long-term air temperature, July.
Hydrological characteristics
(Source: temperature curves redrawn from Terziev et al. 1990, icecover at sea based
on NSIDC 2004)
The volume of the Barents Sea is, according to the most recent
assessments, 282 000 km3 and that of the White Sea 6 000 km3. The
part to 800-1 000 mm/year. In the north of the Barents Sea and the
Barents Sea is marginal; its water exchange with the Norwegian Sea and
Arctic archipelagos, annual levels of 300-400 mm are typical.
the Arctic basin is free and is part of a circulation involving the waters
of the North Atlantic and the Arctic Ocean. The length of the cycle of
River basins
Barents Sea water renewal is about 6 years (Terziev et al. 1990). For the
The drainage basin of the Barents and White Seas is characterised by
White Sea water balance, the determining factor is river run-off , which is
numerous middle-sized and small lakes, which are, as a rule, of glacial
approximately 230 km3/year or 4% of the volume (Glukhovsky 1991).
origin (Richter 1966).
The seasonal ice-cover, which is characterised by considerable
The southern part of the region is noted for a dense river network,
inter- and intra-annual variability, is formed in the Barents and White
abundant river run-off and considerable water resources comprised
Seas. The White Sea is covered by drift ice in November-December,
of numerous lakes and water reservoirs. On the Kola Peninsula and
fol owed by 5-6 winter months when the ice cover is close to 100%.
in Karelia the relief and geological structure al ow the formation
In the Barents Sea, the ice conditions contrast between practical y no
of many river basins, which drain directly into the Sea. Lakes and
ice at al in the southwestern part, to ice appearing also in the summer
water reservoirs regulate the run-off of most of the rivers in this part
(under certain synoptic conditions), in the northern part. Processes
of the region. The characteristics of the largest rivers of the region
of summer heating and autumn-winter convection determine the
are presented in Table 1. Among these rivers only the Pasvik River is
changes in water temperatures in both the Barents and the White
transboundary.
Seas during the year.
14
GIWA REGIONAL ASSESSMENT 11 BARENTS SEA
REGIONAL DEFINITION
15
Salinity in the Barents Sea is close to oceanic salinity (approximately
Sea zooplankton consists of boreal, arctic, and transitional species
35 in the open areas and 34.5 in coastal waters). In the White Sea,
(Matishov et al. 2000).
as a result of intensive mixture of river and marine waters, it decreases
to 25-26 in summer and 26-27 in winter (Matishov et al. 1998,
Phytobenthos
Glukhovsky 1991).
Algal macrophytes are an important source of raw materials for food
and pharmaceutical industries. Fucoids (Ascophyl um nodosum, Fucus
Marine biodiversity
distichus, F. serratus, F. vesiculosus) and blade kelps (Laminaria saccharina,
The composition and migratory habits of living organisms in the Barents
L. digitata) belong to the commercial algae of the Barents and White
Sea are determined by the contrast of the environmental conditions
Seas. At present, the stocks of commercial algae in the investigated
between the Atlantic and the local water masses (Matishov 1986a).
areas of the Barents Sea are estimated to 350 000-450 000 tonnes. Most
of them are concentrated on the Murman coast (Matishov 1998).
Benthos
Al types of invertebrates, apart from chaetognaths, which are
Ichthyoplankton
planktonic organisms, are represented in the Barents and White Seas
The Atlantic waters, dominating in the west of the Barents Sea, are noted
benthos. At present, no less than 3 245 zoobenthos species have been
for high productivity and high diversity of commercial fish species (cod,
identified (Sirenko 2001). The majority of species belongs to widely
haddock, Atlantic herring, catfish, plaice, halibut etc.). More simple food
distributed Arctic boreal and Arctic high-boreal biogeographic groups.
links are typical of the eastern and northern areas of the Sea where huge
The taxonomic groups with highest species numbers are Polychaeta,
concentrations of Arctic cod and capelin, forming the feeding base for
Hydroidea, Mol usca, Crustacea and Bryozoa. Many of the White and
the Gadidae family, are recorded (Matishov & Denisov 2000). The most
Barents Seas invertebrates are commercial y exploited e.g. Icelandic
important commercial resource of the freshwater basin is the salmon,
scal op (Chlamys islandica) and Common mussels (Mytilus edulis), or
which enters the rivers of the Kola Peninsula, the Mezen River, the Pechora
are potential y subject to exploitation e.g. the Northern sea urchin
River and smal rivers of the southeastern Barents Sea and the Norwegian
(Strongylocentrotus droebachiensis) and the sea cucumber Cucumaria
coast.
frondosa. At present, there is a commercial fishery for the Red king crab
(Paralithodes camtschatica) which was introduced in the 1960s and has
Birds and mammals
since increased in abundance. This fishery is now under discussion
Marine birds and mammals are top consumers in marine ecosystems.
(Kuzmin & Gudimova 2002).
Many species are rare and endangered. There are 24 marine bird species
in the Barents Sea (Krasnov et al. 1995). The marine ornithofauna in the
Plankton
southern part of the Barents Sea mainly consists of gulls; Herring gull
The list of Barents Sea phytoplankton includes at present more than
(Larus argentatus) and Great black-backed gul (Larus marinus). In the
310 reliably distinguished species belonging to the Bacil oriophyta,
northern Barents Sea Glaucous gul (Larus hyperboreas) and Fulmars
Dinophyta, Chrysophyta, Chlorophyta, Haptophyta, Prasinophyta,
(Fulmarus glacialis) dominate. The largest bird colonies of the Barents
Euglenophyta and Cryptophyta. According to the phytogeographic
Sea are located along the western coast of Novaya Zemlya and along
characteristics, approximately 40% of the Barents Sea phytoplankton
the coast of Murman. The most abundant species at these sites are
species can be characterised as Arctic species, more than 20% as
Brunnich's guil emot (Uria lomvia) and Kittiwake (Rissa tridactyla) (Anker-
boreal species and the rest as cosmopolitan or with an undesignated
Nilssen et al. 2000).
geographic distribution (Matishov et al. 2000).
Marine mammals, such as polar bears and different whales and
A total of 145 marine species and varieties of phytoplankton are
pinnipeds, inhabit the Barents Sea region either seasonal y or
recorded for the White Sea (Semina & Sergeeva 1983). There are
constantly. The majority of the Barents Sea pinnipeds and whales are
fewer diatom species than in the Barents Sea but the number of
representatives of rare or protected species included in the Red Books
dinoflagel ates species is higher in the White Sea (Makarevich et al.
of the IUCN, USSR and RSFSR.
1991). In the Barents Sea pelagic fauna, more than 200 zooplankton
species are represented. The most commonly observed and the
In total, there are 12 whale species in the Barents Sea (Matishov 1999).
most numerous are representatives of the crustacean class, including
Among them five can be considered as regular inhabitants: the Arctic
copepods (Copepoda). By its zoogeographic characteristic, the Barents
right whale (Balaena mysticetus), the Narwhal (Monodon monoceros), the
16
GIWA REGIONAL ASSESSMENT 11 BARENTS SEA
REGIONAL DEFINITION
17
White whale (Delphinapterus leucas), the Bagridae family (e.g. Orcinus
(needleleaf forest and broadleaf forest), where coniferous species are
orca) and the Little piked whale (Balaenoptera acutorostrata). The most
dominant. The western part of the region is dominated by Norway
abundant species of the Barents and White Seas are white whales and
spruce, pine, and European larch and in the eastern part Siberian spruce,
little piked whales, which are the traditional commercial species.
fir, cedar, and Siberian larch predominate.
The area of Murman and the Western Arctic is inhabited by seven
The composition of the terrestrial fauna corresponds to two main
species of pinnipeds. One of the most numerous species is the Harp seal
landscape zones, the tundra and the taiga. The most dominant mammal
(agophilus groenlandica), which is closely associated with cold waters
species of the tundra are lemming and polar fox, among birds polar owl
and is of great economic importance in Russia (Isaksen & Wiig 1995).
and tundra partridge predominate together with numerous passerines.
Reindeer, which in the past were wild and widespread in the tundra
The Polar bear (Thalassarctos (Ursus) maritimus) is a rare species, until
and taiga, now survive in the form of domesticated populations and
recently listed as an endangered species in the Red Books of the IUCN,
are the basis of economic activity in the Pechora tundra, as well as in
USSR, and RSFSR. Its distribution is related to the islands of Frantz Josef
the central areas of the Kola Peninsula. Fur-bearing mammals such as
Land, Novaya Zemlya, and Svalbard.
Blue hare, marten, squirrel, fox, stoat, etc. as well as moose, wolves, and
bears are typical of the taiga zone. Typical bird species are tits and
Terrestrial ecosystems
woodpeckers. Species of commercial value are Hazel hen, Black cock,
Figure 4 shows the landcover in the terrestrial part of the region. More
Capercaillie and White grouse. Both landscape zones are characterised
than two thirds of the territory of the basin are under taiga forests
by large populations of waterfowl and near-water birds, e.g. woodcocks,
teals, geese, ducks and swans.
Land cover
Among the freshwater fishes, the most valuable are whitefish, burbot, and
Snow/Ice
Svalbard (Norway)
Franz Joseph Land
trout. Perch, ruff and pike are widely spread.
Tundra
Barren
Shrubland
Physical and geographical sectors
Grassland
For the purpose of this report, three geographic sectors were
Needleleaf forest
identified: the White Sea, Pechora and Fennoscandia (the northern
Broadleaf forest
and northeastern slopes of the Baltic shield). The boundaries of the
a
Fennoscandia
Wetland
Cropland
sectors are shown in Figure 4.
Developed
vaya Zemly
The river basins of Fennoscandia belong to both the Barents and the
No
White Seas, but in both cases, their influence on the marine waters
Norway
is comparatively slight. The river run-off does not play a significant
role for the western part of the Barents Sea. The state of the aquatic
environment is determined by the water exchange with the deepwater
oceanic basins, transboundary transfers of contaminants in the ocean
Finland K o l a P e n i n s u l a
Pono
Pechora
s
i
and in the atmosphere, and on the discharges of contaminants directly
in
tan
from the coast to the coastal waters.
u
Russia
o
l m
ra
The main factor influencing the ecology of the White Sea sector is the
U
White Sea
run-off from the Severnaya Dvina, Mezen and Onega rivers. In total, they
transport 80% of the freshwater entering the White Sea, comparable
parts of particulate and dissolved run-off and practical y the entire load
of chemical contaminants. The impacts of these sources on the Barents
Sea can be shown only indirectly through their impact on the White Sea
© GIWA 2004
water mass (Berger & Dahle 2001).
Figure 4
Land cover in the Barents Sea region.
(Source: based on USGS 2002)
16
GIWA REGIONAL ASSESSMENT 11 BARENTS SEA
REGIONAL DEFINITION
17
In the Pechora sector, the formation of water and the chemical balance is
migration from these regions during the last two decades. In Finnmark,
in principle determined by the run-off of the Pechora River. Here, unlike the
Norway, the population size decreased slightly over the same period
other two marine sectors, seasonal changes in salinity and the chemical
and was 1.52 persons per km2 in 2002 (Figure 5 and Table 2). However,
composition of marine waters are pronounced since the volume of the
the population density in Finnmark has always been significantly below
river run-off is comparable to the volume of coastal marine waters. The
the Norwegian average, which was 14.0 persons per km2 in 2002 (State
Pechora sector also differs in the character of its anthropogenic impact
Statistics Committee 2002a).
and its source distribution: there are fewer large industrial centres and
the agricultural activity is negligible. However, the terrestrial and marine
The urban population in the Russian part of the region is rather high
oil and gas complexes, present in al their aspects including geological
(79.9% in 2001) (Table 3) (State Statistics Committee 2002a). In Finnmark,
and geophysical prospecting, exploratory dril ing, and hydrocarbon
the level of urbanisation is low. The population of the four regional
extraction and transportation, have been developing quickly.
centers Vadsř, Hammerfest, Alta and South-Varanger is about 42 000,
compared to a total population of approximately 74 000 for Finnmark
as a whole. The population development in the northern regions
of Russia, 1990 being the starting point, is negative (Table 4) (State
Socio-economic characteristics Statistics Committee 2002b).
Although the Barents Sea region is constituted as one geographic
The main reason for the decrease in population is natural population
system, there are two separate socio-economic regions, Norway and
loss. In the four Russian regions considered for the region the number
Russia, which are discussed separately in this section as well as further
in the Causal chain analysis.
Population density
(persons/km2)
Svalbard (Norway)
Franz Joseph Land
Protection of the Barents Sea environment is a common responsibility
< 1
of al border countries. Changes in environmental and social conditions
1 - 2
are highly interdependent. Environmental conditions and trends affect
3 -5
6 - 10
human health and quality of life. Social conditions and outcomes need
> 10
to be reviewed when designing and implementing environmental
a
management activities and policies.
vaya Zemly
The state of water systems in the Barents Sea region is influenced by
No
the water catchments of:
Four administrative regions of the Russian Federation located on
the coast of the Barents and White Seas: the Murmansk Region, the
Norway
Vadso
Arkhangelsk Region, Karelia, and the Nenets Autonomous Region;
The easternmost county of Norway, Finnmark, located on the
Murmansk
Tuloma
Vorkuta
westcoast of the region.
Kola Peninsula
Kola
Naryan-Mar
Finland
s
Pon
in
oi
Pechor
tan
In this report, socio-economic factors that can influence the state of
a
Russia
uo
White Sea
aquatic ecosystems with respect to GIWA concerns, such as growth of
l m
Meze
ra
Arkhangelsk
n
industrial and agricultural production, fisheries development, population
'
U
development and social problems, have been considered.
On
Se
e
vernay
ga
a D
City populations
vina
Population
Less than 50 000
Syktyvkar
50 000 to 100 000
Kotlas
The population density in the four Russian regions considered for the
100 000 to 250 000
Barents Sea region is 3.5 persons per km2, which is lower than the average
250 000 to 500 000
© GIWA 2004
Russian density of 8.5 (Figure 5 and Table 2) (State Statistics Committee
Figure 5
Population density.
2002a). This is a consequence of the population decrease, including
(Source: data from ORNL 2003)
18
GIWA REGIONAL ASSESSMENT 11 BARENTS SEA
REGIONAL DEFINITION
19
of deaths exceeds the number of births. Analysis of the indices of birth
Comparable statistical data for Finnmark County are not available.
and death per 1 000 persons showed that the number of persons
However, the gross income per employee over 17 years of age shows a
born in al the regions of the Northwest Russia, starting since 1985,
steady increase, which is not only caused by the inflation rate, but also
decreased. The other reason for the negative population development
by increased economic activities in the region. The annual gross income
is the number of people migrating from the regions compared to
per employee in Finnmark in 1994 was 19 802 USD, then increased in
the number of people immigrating, caused by state policy. In coastal
the subsequent years and in 2000 it was 28 512 USD. The index of the
settlements, negative tendencies in demographic and migration
growth in USD constituted 144% (Finnmark County statistical data).
processes manifest themselves more severely. Life expectancy at birth
is the most commonly used statistical value for assessing population
The annual gross income per employee in Karelia, Arkhangelsk Region,
health. This characteristic is directly dependent on the socio-economic
Nenets Autonomous Region, and Murmansk Region in 2000 constituted
development of the region. While for all northern Russian regions the
945 USD, 867 USD, 1 305 USD, and 1 444 USD respectively. Thus, the
life expectancy has decreased, it is increasing in Finnmark County,
annual gross income per employee in these four Russian regions in
Norway (Table 5) (State Statistics Committee 2002b).
2000 was lower than in Finnmark, Norway, by 97%, 97%, 96%, and 95%
respectively (State Statistics Committee 2001).
Economic indicators
The average material welfare can be defined by the Gross Domestic
A stable increase in industrial production and GDP in the four Russian
Product (GDP) per capita. Table 6 shows that the growth of GDP was
regions considered for Barents Sea region began as late as in 1999
broken by the crisis of 1998. In 2000, GDP per capita was 36.2% lower
(Tables 7 and 8) (State Statistics Committee 2001). The Russian economy
than in 1997 (State Statistics Committee 2001). The highest average level
experienced a heavy crisis during the last decade and suffered not
of the material welfare was in 1997. However, this does not reflect the late
only a sharp decrease in production volumes but also an increase in
1990s, as it was the time when the USD was very much undervalued in
unemployment. Table 9 il ustrates not only a considerable reduction
Russia (up to August 1998). Then in 1999 it was substantial y overvalued,
in population of the northern regions of Russia, but also an increase in
and the difference was significant (Table 6). At present, the GDP has not
unemployment (State Statistics Committee 2002b).
yet reached the level of 1997.
The population decreased in 2000 and 2001 and continues decreasing.
Table 2
Population density.
This negative trend will continue if measures to reduce poverty are not
1985
1990
2002
taken. At the same time it should be noted that there has been a slight
(people/km2)
(people/km2)
(people/km2)
reduction in unemployment since 2002, caused by the growth of
Russia (four regions considered)
3.77
3.93
3.5
industrial production and GDP (State Statistics Committee 2002b).
Finnmark (Norway)
1.55
1.52
1.52
(Source: State Statistics Committee 2002a)
Table 3
Urban population in the Russian sector of the region.
1959
1985
1990
1992
1994
1996
1998
1999
2000
2001
Total population
2 486 000
3 463 500
3 549 700
3 495 600
3 417 100
3 336 100
3 267 200
3 225 500
3 191 800
3 162 900
Urban population
1 598 000
2 767 100
2 898 300
2 778 400
2 711 300
2 648 300
2 598 500
2 548 100
2 544 200
2 525 700
Urban population (%)
64.3
79.9
81.6
79.5
79.3
79.4
79.5
79.0
79.7
79.9
(Source: State Statistics Committee 2002a)
Table 4
Changes in population in the Russian sector of the region.
1990
1991
1992
1993
1994
1995
1996
1997
1998
1999
2000
2001
Russia (four regions considered)
4.1
2.2
-0.9
-4.8
-5.9
-5.7
-4.3
-3.7
-3.3
-5.6
-5.8
-5.6
(per 1 000 persons)
Note: 1990 being the starting point. (Source: State Statistics Committee 2002b)
Table 5
Life expectancy at birth.
Table 6
Gross Domestic Product per capita in Russia and the Russian sector of the region.
1994
1995
1996
1997
1998
1999
2000
2001
2002
1999
2000
2001
(USD)
(USD)
(USD)
(USD)
(USD)
(USD)
(USD)
(USD)
(USD)
Russia (four regions
Russia (four regions
65.1
64.3
64.2
2 288
2 408
2 546
2 551
1 760
1 252
1 627
ND
ND
considered)
considered)
Finnmark
72.0
72.3
72.7
Russia
ND
2 116
2 593
2 654
1 672
1 134
1 589
1 904
2 515
(Source: State Statistics Committee 2002b)
Note: ND=No Data. (Source: State Statistics Committee 2001, 2003)
18
GIWA REGIONAL ASSESSMENT 11 BARENTS SEA
REGIONAL DEFINITION
19
Table 7
Indices of industrial production in the Russian sector of
employed in the fisheries sector and aquaculture was at the same
the region.
time reduced by 1 069 (22.1%). The unemployment in Norway in total
1994
1995
1996
1997
1998
1999
2000
2001
decreased from 5.2% in 1994 to 2.7% in 2001, in Finnmark County the
(% )1
(% )1
(% )1
(% )1
(% )1
(% )1
(% )1
(% )1
Russia (four
unemployment rate decreased from 5.6% in 1994 to 4.8% in 2001
region
82
97
90
105
98
117
116
103
(Table 10) (Finnmark County Statistical data). It should be noted that
considered)
Note: 1 % of previous year. (Source: State Statistics Committee 2001)
the unemployment rate in Finnmark is two times higher than in Norway
Table 8
Indices of physical volume of the Gross Domestic
as a whole, primarily caused by the reduction in the number employed
Product in the Russian sector of the region.
in the fisheries sector.
1997
1998
1999
2000
(% )1
(% )1
(% )1
(% )1
Russia (four regions considered)
98.4
95.0
109.6
109.6
The crisis in the Russian fisheries sector, together with a reduction in
Note: 1 % of previous year. (Source: State Statistics Committee 2001)
the number of units of the Northern Navy, which was the only support
for some coastal settlements, has had the most negative impact on
According to the data, the number of unemployed in 2001 increased
the coastal settlements and vil ages. Coastal fishery and appropriate
compared to 1992: in Karelia by 157.6%, in the Arkhangelsk Region by
social policy could raise the living standard on the coast. However, the
164.4%, and in the Murmansk Region by 208.5%.
coastal fishery declined in the 1960s and 1970s. The fishing kolkhozes
(cooperative groups) were mainly occupied in oceanic trawling fishing,
The unemployment (the ratio of unemployed compared to the number
though supporting the social sphere of the coastal settlements and
of the economically active) during these years varied: in Karelia from
vil ages before the market reforms. During the last decade the quotas
5.0% in 1992 to 16.6% in 1998 and 8.7% in 2001, in the Arkhangelsk Region
for the Barents Sea fisheries decreased, which resulted in the reduction
from 4.9% in 1992 to 14.9% in 1999 and 8.8% in 2001, in the Murmansk
of fishing subsidies. All this dramatical y increased social and economic
Region from 5.5% in 1992 to 21.1% in 1998 and 12.8% in 2001.
problems on the coast.
The economic crisis had an impact on the fishing industry as well, to
Table 11 shows the change of the population number in the coastal
which the majority of the population was connected and which solved
settlements and vil ages of the northern regions of Russia and Finnmark
many social problems in the region in the past. In the end of the 1980s
in Norway. In the Murmansk Region, in the fishing kolkhozes and coastal
approximately 75 000 people were employed in the fisheries sector.
settlements previously occupied by the military, the population
During the 1990s, the fishery outside the Barents Sea was stopped
decreased from 1989 to 2000 by almost 12 000 persons (33.7%).
and coastal fish processing reduced, which resulted in an employment
decrease in the sector of 60%.
Economic sectors
The most important economic sectors in Finnmark County, Norway,
The total number of employed in Finnmark County, Norway, increased
are fishery and fish processing, reindeer breeding, the service sector
in 2001, compared to 1994, by 822 persons (2.5%). The number of
and trade.
Table 9
Population and employees in the Russian sector of the Barent Sea region.
1985
1990
1995
1999
2000
2001
Population at the end of the year
3 413 500*
3 551 700*
3 369 900*
3 270 700
3 191 800
3 162 900
Average annual number of employees
1 714 300*
1 747 000*
1 479 600*
1 361 600
1 375 100
1 382 400
Ratio of employed to the total population (%)
50.2*
49.1*
43.9*
41.6
43.1
43.7
Note: *Without the Nenets Autonomous Region. (Source: State Statistics Committee 2002b)
Table 10 Number of employed persons and the unemployment rate in Finnmark County, Norway.
1994
1995
1996
1997
1998
1999
2000
2001
Number of employed persons
32 451
33 413
33 548
33 694
33 740
33 474
33 720
33 273
Number of employees in the fisheries sector and aquaculture
4 841
4 881
4 533
4 532
4 248
4 038
3 925
3 772
The unemployment rate, Norway (%)
5.2
4.8
4.2
3.3
2.4
2.6
2.7
2.7
The unemployment rate, Finnmark (%)
5.6
6.1
6.7
5.5
4.5
4.8
4.9
4.8
(Source: Finnmark County Statistical data)
20
GIWA REGIONAL ASSESSMENT 11 BARENTS SEA
REGIONAL DEFINITION
21
Table 11 Population changes in the coastal villages and
Low economic development, poor infrastructure, dominance of
settlements of the northern regions of Russia and
mining and energy industries, insufficient development of energy-
Finnmark, Norway.
preserving and environmental y friendly technologies;
Population
Coastal villages and settlements
Increased cost of goods due to increased expenses for the development
1950
1970
1989
2000
of production and the social sphere, transport expenses, increase in the
Karelia
2 073
1 085
795
688
share of imported goods, and salary expenses;
Arkhangelsk Region
ND
9 424
6 985
6 077
Low competition in many sectors of the economy on the local
Nenets Autonomous Region
ND
4 317
3 412
3 047
market;
Murmansk Region
ND
ND
35 510
23 536
Lack of elasticity regarding the size of enterprises. Most of the
Eastern Finnmark
12 000
12 500
10 100
9 800
enterprises are either very large or too smal . For instance, in the
Note: ND = No Data. (Source: Russia: Local administrations data, Finnmark: County statistical data)
Arkhangelsk Region there are practical y no enterprises with 200
Table 12 The share of economic sectors in GDP in the Russian
to 2 000 employees. Thus, an issue of great concern is the problem
sector of the region in 2000.
of so-cal ed town-forming enterprises.
Industry
Agriculture
Building
Retail trade
(%)
(%)
(%)
(%)
Russia (four regions considered)
65.2
4.4
4.2
26.2
The structure of industrial production in the region is presented in
(Source: Batchaev et al. 2002)
Figure 7. The major industrial branches in the Murmansk Region are
non-ferrous metallurgy, food industry, chemical industry, and electric
The four Russian regions considered for the Barents Sea region
power production.
are industrial y developed regions. Table 12 shows that agriculture
constitutes an insignificant part of the total GDP: 4.4% (in Karelia 4.7%,
Extractive industry
Industry branches
in the Arkhangelsk Region 7.7%, in the Nenets Autonomous Region
Coal
Fuel
0.4%, and in the Murmansk Region 1.5%) (Batchaev et al. 2002).
Petroleum
Non-ferrous metallurgy
Natural gas
Chemical and petrochemical
Ferrous metal ores
Machine-building
The determining factors for economic development of the Russian coast
Base metal ores
Timber, wood and pulp & paper
Raw material for chemical industry
Food
of the Barents Sea region are the exploitation of natural resources.
Large power plants
Agriculture regions
The main branches of industry are the fol owing (Figure 6):
Heat station
Cattle breeding, flax, grain
Mining industry and metallurgy (Karelia, Murmansk Region);
Nuclear power station
Deer raising & trade
Lumber with farming &
Forestry, wood-processing, and pulp and paper industry (Karelia,
Fishery
cattle breeding spots
Sub-urban agriculture
Arkhangelsk Region);
Oil and gas industry (Arkhangelsk Region, Nenets Autonomous
Region);
Fishery and fish-processing industry (Murmansk Region,
Norway Vadso
Vaigatch Island
Arkhangelsk Region, Nenets Autonomous Region);
Nikel'
Electric power production (Murmansk Region);
Murmansk
Production of building materials (Karelia, Murmansk Region).
Monchegorsk
Kola Peninsula
Finland
s
Apatity
in
The Murmansk and Arkhangelsk regions house shipbuilding enterprises,
Russia
tanuo
including those strategical y important for the entire country. The ports
Arkhangelsk
l m
of Murmansk and Arkhangelsk are among the largest ports of Russia.
Nadvoitsy
ra
Ukhta
U
One of the main features of the Russian part of the region is insufficient
development of the railway and motor transport infrastructure; the
Syktyvkar
density of the road net decreases both from west to east and from
Kotlas
south to north.
© GIWA 2004
The fol owing features of the economy of the northern Russian regions
Figure 6
Main economic sectors and industry branches in the region.
should be noted:
(Source: Central Directorate of Geodesy and Cartography 1983))
20
GIWA REGIONAL ASSESSMENT 11 BARENTS SEA
REGIONAL DEFINITION
21


In Karelia, the forestry sector is the most important and constitutes
100
1.2
55.4% of the regional production volume (Figure 7). The forestry sector
10.6
7.8
10.2
12.7
is also the leading branch for the Arkhangelsk Region. In second place
13.7
12.6
80
10.0
19.9
0.1
is the electric power production.
4.9
0.3
0.2
7.7
15.7
8.0
60
96.2
38.0
The oil industry is the backbone for the Nenets Autonomous Region;
8.5
%
7.1
4 mil ion tonnes of oil were extracted in the region in 2000. In
40
55.4
general, the Nenets Autonomous Region occupies second place in oil
20.5
50.9
14.4
production in Northwest Russia (34.1%). A large volume of construction
4.5
0.4
20
5.0
3.2
1.0
work in the region is linked to the exploitation of oil deposits.
0.5
1.7
0.4
1.7
0.1
0.4
1.5
17.4
13.9
7.8
7.8
0.2
0
1.6
0.9
0.3
2.4
0.7
Table 13 presents the production dynamics in the northern Russian
Russian
Republic of
Nenets AR
Federation
Karelia
Region
Region
regions. The data show that the production volumes in the region,
Electric power
Non-ferrous metallurgy
Timber, wood,
Light
including the dominant sectors, decreased during the 1990s. This can
production
pulp and paper
Chemical and
Food
Fuel
petrochemical
Building materials
Flour grinding,
be explained by the economic crisis caused by the difficulties faced
Engineering and
Glass, porcelain and
cereals and mixed
Ferrous metallurgy
metal working
highly glazed pottery
fodder production
and the mistakes made during the transition period from a planned
Figure 7
Relative proportion of products comprising industrial
to a market economy. However, the production decrease is over and,
output in 2001.
except for food production, a slight increase is observed. Nevertheless,
(Source: State Statistics Committee 2002c)
the growth rates are not high and a significant increase compared to the
The Murmansk Region provides (State Statistics Committee 2002c):
basic period (1985-1990) cannot be expected. In addition, the structure
100% of the total Russian production of apatite and nepheline
of industrial production has changed during the period analysed. In
concentrate;
1990, the share of the metallurgy complex in the region accounted for
8.5% of iron-ore concentrate;
approximately 30% of the industrial production and the share of fishery
17% of copper;
accounted for up to 40%. During recent years, the share of metallurgy
45% of nickel;
has increased while the share of fishery decreased (State Statistics
11.5% of fish products;
Committee 2002c).
2% of electric power (the share of the branch in the northwest
Russia is 20.8%).
Agriculture
The most important agricultural branches in Northwest Russia are
The backbone of the Murmansk Region's economy is mining and
cattle breeding, poultry farming, breeding of animals for furs, reindeer
metal urgy. The leading enterprises in the non-ferrous metal urgy are
breeding and growing potatoes and vegetables (Table 14) (State
the Kola Mining Company (which, together with traditional productions
Statistics Committee 2002c).
like nickel, copper, cobalt, gold and platinum, is developing the
production of non-traditional metals) and Kandalaksha Aluminium
The radical restructuring of the agricultural sector ended in 1995.
Plant (one of the two aluminium plants in the Northwest Russia). In
Nowadays, 86% of agricultural production enterprises are private.
the ferrous metallurgy industry, the largest enterprise is the Kovdor Ore
About 15% of agricultural holdings have the form of kolkhozes
Processing Plant producing iron ore concentrate.
(cooperative groups). Reforms in the agricultural sector caused the
disruption of inter-regional and inter-sectorial connections. This has
The apatite ore processing plant in Apatity is the 12th largest chemical
had a negative impact on large agricultural holdings specialising in beef
enterprise in Northwest Russia. The Murmansk Shipping Company
and pork production, poultry, breeding of pedigree cattle, raising seeds
is the only shipping company in Russia able to work in the Arctic all
of cereals, potato and perennial herbs. However, the past decrease in
year round. Possessing a unique fleet of nuclear powered icebreakers,
production in the agricultural sector is over and positive tendencies
it enables yearly navigation along the Northern Sea Rout. The port of
have been observed over the last few years. The dairy- and meat
Murmansk takes fourth place among 42 Russian ports and is the largest
production slightly increased over the period 1997-2000. However, the
port in Northwest Russia, able to dock ships with dead-weights up to
agricultural sector in Northwest Russia still faces a number of problems
250 000 tonnes.
such as:
22
GIWA REGIONAL ASSESSMENT 11 BARENTS SEA
REGIONAL DEFINITION
23
Table 13 Industrial production in the northern Russian regions.
Ratio 2001 to
1985
1990
1995
1998
1999
2000
2001
1985
Electric power (TWh)
29.2
31.4
27.1
26.4
25.9
27.4
27.3
93.4
Iron ore (mil ion tonnes)
20.6
41.6
13.1
13.8
14.5
7.1
7.0
34.0
Tractor (pieces)
11 841
10 661
1 419
903
1 409
1 300
700
5.9
Timber (mil ion m3)
34.1
31.6
13.1
11.2
13.6
14.2
14.4
42.2
Saw-timber (m3)
2 299 800
2 009 000
875 800
490 500
710 800
890 000
807 100
35.1
Cel ulose (tonnes)
787 100
768 200
325 300
223 200
308 500
383 700
410 800
52.2
Paper (tonnes)
1 592 000
1 617 000
843 000
735 000
912 000
1 022 000
1 001 000
62.9
Stock brick (mil ion bricks)
435
462
114.2
34.9
35.4
40.0
40.6
9.3
Bakery (tonnes)
390 500
392 800
281 500
178 700
191 800
176 600
164 300
42.1
Meat (tonnes)
63 500
74 900
24 300
12 600
10 200
13 000
14 200
22.4
Unskimmed milk products (tonnes)
412 000
499 000
110 900
67 800
64 200
79 100
90 700
22.0
Oil and condensate (mil ion tonnes)
0.0
1.2
2.7
3.4
3.8
4.5
4.6
383.3
Wooden slab (mil ion conventional m3)
20.3
22.4
13.5
12.6
17.5
18.1
18.4
90.6
Pasteboard (tonnes)
602 000
628 000
400 000
460 000
575 000
620 000
627 000
104.2
Cement (tonnes)
1 325 000
1 355 000
335 000
289 000
272 000
225 000
327 000
24.7
Reinforced concrete constructions (m3)
610 000
720 000
157 000
42 300
36 900
49 800
73 800
12.1
Apatite concentrate (mil ion tonnes)
8.1
8.1
3.3
3.7
4.2
4.2
3.9
48.1
Nepheline concentrate (mil ion tonnes)
1.6
1.6
1.0
0.9
0.9
0.8
1.0
62.5
(Source: State Statistics Committee 2002c)
Table 14 Production of the most important kinds of agricultural products in the northern Russian regions.
Ratio 2001
1985
1990
1995
1998
1999
2000
2001
to 1985
Grain crops (tonnes)
106 300
100 000
46 000
18 300
12 900
14 700
14 700
13.8
Potatoes (tonnes)
327 300
276 600
610 900
545 300
608 500
591 300
591 800
180.8
Vegetables (tonnes)
65 800
52 000
95 600
102 700
123 500
133 700
132 600
201.5
Livestock and poultry, in slaughter weight (tonnes)
92 700
111 600
56 000
34 200
28 700
31 000
31 300
33.8
Milk (tonnes)
597 900
649 800
350 500
294 700
276 500
274 900
275 400
46.1
Cattle (heads)
509 100
524 800
332 800
217 800
206 600
181 400
180 800
35.5
Pigs (heads)
313 900
419 700
183 400
71 900
72 900
75 900
80 000
25.5
(Source: State Statistics Committee 2002c)
Insufficient production volumes of some agricultural products for
Table 15 Farmed area and number of reindeer units in Finnmark
the local market (mainly meat and dairy products);
1994-2001.
Inefficiency and unstable functioning of many agricultural
1994
1995
1996
1997
1998
1999
2000
2001
enterprises;
Farmed area (km2)
95.3
96.0
97.3
98.0
102.1
105.5
107.4
-
Under-development, lack of modern equipment and a dramatic
Reindeer
Eastern Finnmark
201
184
168
169
172
179
173
182
decrease in supplies of agricultural machines;
units
Western Finnmark
274
244
217
215
216
220
227
236
Social degradation in rural areas, low wages, decrease in living
(Source: Finnmark County statistical data)
standard in most of the vil ages;
Lack of legislative and regulatory initiatives at state- and regional
Forestry
levels;
Forestry has a vital role in the economy of the Russian part of the
Inefficiency and under-development of private farms.
region. First of all this is true for Karelia and the Arkhangelsk Region,
where the share of the forestry sector in the total production volume
In Finnmark County, Norway, reindeer breeding dominates over
constitutes 55.4% and 50.9% respectively. 60% of the whole export
agricultural production. However, a slight increase in the farmed areas
from Karelia comes from the forestry sector. The increase of the share
was observed over the period 1994-2001 (Table 15).
of the forestry sector has been accompanied by an improvement in
the structure of the production. The share of the pulp and paper
22
GIWA REGIONAL ASSESSMENT 11 BARENTS SEA
REGIONAL DEFINITION
23
industry has increased while logging has been reduced. This is
The major factors for the successful work of the forestry sector are
mainly caused by an increase in recycling. This enables forest
favourable conditions for export and demand on the home market.
resources to be used more effectively and increases local incomes.
The income from the exports of the wood manufacturing industry
More than 70% of the potential logging areas in the region are
increased in 2000 by 19.3%. This was caused by an increase in sale
exploited nowadays.
volume (by 18.5%) and the increase in price of cel ulose (by 33%). On
the home market, there is an increase in demand for furniture and wood
Karelia produces:
building materials.
Paper: 22.6% of the total production volume in Russia (first place in
the Northwest Russia);
Further perspectives of development of the forestry sector in Northwest
Timber: 6.1% of the total production volume in Russia;
Russia present an optimistic picture. The demand for the products of
Sawn timber: 4.3% of the total production volume in Russia.
the wood manufacturing industry will have increased by a factor of 2
by year 2006 (State Statistics Committee 2002c).
The major products of the wood manufacturing industry in the region
encompass:
However, there are a number of problems to be solved, which are
Sawn timber: 39.2%;
hampered by the lack of funding:
Timber: 30.8%;
To increase the marketability and quality of the wood products;
Paper: 14.9%;
To increase the share of recycling;
Plywood: 8.3%.
To increase the introduction of modern, environmental y friendly
technologies.
The Murmansk Region is the northernmost of the four Russian regions
considered for the Barents Sea region and its forest reserves are of low
Fishery
productivity. Thus, in spite of 67.5% of the territory being covered with
The fishing industry constitutes one of the backbones of the coast
forests, the share of the forestry sector in the economy of the region
of northern Norway and is a sector for economic development
constitutes no more than 0.6%. However, it is of importance for the
in Northwest Russia. The commercial y most important fisheries
employment of the population as it is the only activity in a number of
of the Barents Sea are for cod (dus rhua rhua L.), haddock
settlements.
(lanogrmmus glefinus L.), shrimp, capelin (olltus villosus villosus
ul er) and saithe (Pollachius virens).
After the financial crisis of 1998, the export of timber from the Russian
sector of the region and from Russia as a whole was substantial y
The economical y and political y dominant fishery in the Barents Sea
increased. Russian timber companies were able to increase export of
is for Northeast Arctic cod. The haddock fishery can be regarded
wood products significantly after the drop of the Ruble compared to
as supplemental to the cod fishery. The capelin fishery undergoes
the USD and other major international currencies by several hundred
substantial cyclical variations rendering it unreliable as a resource basis.
percents. Demand for Russian timber on Western markets increased
The Norwegian spring-spawning herring spends part of its lifecycle in
(though it is still much lower than it used to be in mid-1980s). Demand
the Barents Sea, while mainly being caught in the Norwegian Sea. Saithe
for sawn timber also increased. Many Russian timber companies were
is an exclusively Norwegian stock, while shrimp is mainly caught west
able to build or upgrade their sawmills and obtained drying kilns
of Svalbard.
(mostly from German and Italian producers). Production of timber
and sawn timber in Russia went down practical y every year since the
The above-mentioned fisheries constitute 90% of the total catch. Such
late 1980s up to 1999. As a result of that, in different regions of Russia
species as Black halibut (Rinhardtius hippoglossoides hippoglossoides
production decreased approximately 3-5 times during last 10-12 years
Walbaum), Polar cod (rgadus saida Lepechin), perch (Sebastes
of the past century. The wood-processing sector was especial y affected
marinus L.), deep-water prawn (Pandalus borealis Kröyer), scal op
and many sawmil s were closed. In the meantime, since 1999 the trend
(Chlamus islandica Mül er) and others are caught with special gears
has changed, and timber production and production of secondary
in insignificant amounts. Plaice (leurnts latss L.), American
wood products went up in practical y all regions of Russia involved in
plaice (Hippogolossoides latessoides limandoides L.), catfishes (genus
forest industry and wood processing.
nrhichas), saithe (Pollachius virens L.) and others are mainly caught as
by-catch during the cod fishery.
24
GIWA REGIONAL ASSESSMENT 11 BARENTS SEA
REGIONAL DEFINITION
25
Several of the commercial y important Barents Sea fisheries straddle
the geographical boundaries of the Barents Sea and the Norwegian
1.8
Republic of Karelia
Sea. In the period 1992-2001 an average of 36-54% of cod was caught
1.6
Archangel Region
in the Barents Sea1. This il ustrates that fishing beyond the Barents
1.4
Nenets AR
)
Sea has a substantial impact on the Barents Sea fisheries and the
Murmansk Region
1.2
ecosystem in general. Available statistics from ICES do not overlap
Total
1.0
with the GIWA definition of the Barents Sea, complicating estimates on
the geographical distribution of catches2 (ICES 2003a).
0.8
a
t
c
h
(million tonnes
C
0.6
Figure 8 presents the catch dynamics of the main commercial fisheries
0.4
in the Barents Sea over the past 50 years (ICES 2003a). The figure shows
0.2
that from the 1960s, a continuous decrease in catches is observed
0
reflecting the negative trend of the total catch and the spawning fish
1985 1990 1991 1992 1993 1994 1995 1996 1997 1998 1999 2000
stocks.
Year
Figure 9
Fish catches in Northwest Russia.
(Source: State Statistics Committee 2000)
2.5
2950
Herring
1.2
Cod
2.0
Cod (USSR)
Total
Capelin
1.0
Cod
Capelin
1.5
0.8
1.0
0.6
a
t
c
h
(million tonnes)
C 0.5
a
t
c
h
(million tonnes)
0.4
0.2
C
1950
1955
1960
1965
1970
1975
1980
1985
1990
1995
0.2
Year
Figure 8
Total catch dynamics of the main commercial fisheries
0
in the Barents and Norwegian Seas.
1964 1965 1966 1967 1968 1969 1970 1971 1972 1973 1974 1975 1976 1977 1978 1979 1980 1981 1982 1983 1984 1985 1986 1987 1988 1989 1990 1991 1992 1993 1994 1995 1996 1997 1998 1999 2000
(Source: ICES 2003a)
Year
Figure 10 Dynamics of the Russian catches in the Barents Sea.
There has been an overal decrease in catches both in Finnmark and
(Source: State Statistics Committee 2000)
Northwest Russia. The annual Russian catch by the end of the 1980s
was 1.6-1.8 million tonnes including 50-70% outside the Barents Sea in
There has been an overal reduction in annual catches for the fishing
the Northwest and Central Atlantic (Figures 9 and 10). In 2001 the total
fleet of Finnmark as for the Norwegian fishing fleet in general, though
catch constituted 924 000 tonnes, thus it was reduced over the period
there are substantial periodic variations. In terms of the landing of
considered by a factor of 2.
catches, the situation in Finnmark has seemingly not been as severe as
in Northwest Russia. A main reason has been the Russian landings of
Reduced catches resulted in decreased importance of the fisheries sector
catches in Finnmark. These landings constituted more than 50% of the
in the economic structure of Northwest Russia, increased unemployment
total cod landings in the county and were of great importance to the
and aggravated social problems. At the end of the 1980s the contribution
Norwegian processing industry. However in recent years a substantial
of fisheries to the GDP of the Murmansk Region was 30%, in the
quantity of the Russian landings have gone to freezing terminals for
Arkhangelsk Region 8-10%, in Karelia 5-6%. Its present contribution to
further export to the international market, without being processed
the GDP has decreased to 14-17% in the Murmansk Region, 4-5% in the
in Finnmark. As such, Finnmark for a large part functions as a portal for
Arkhangelsk Region and 3-4% in Karelia. Decreased catches in Russia can
Russian fishing vessels to the international market. Figure 11 therefore
be explained by the reduction of fish stocks, the difficult market situation,
presents a distorted picture of the actual situation. In 2003 the fishing
as wel as by political mistakes and miscalculations made during the
industry in Finnmark underwent a serious crisis, with a series of
period (State Statistics Committee 2002b).
bankruptcies (Norwegian Directorate of Fisheries 2003).
1 Pending on whether ICES statistical Area IIb is included or not. Havets Ressurser, 2002:13.
2CES statistical areas in the region are the Barents Sea (Area I), Bear Island/Spitsbergen (Area IIb) and the Norwegian coast (Area IIa).
24
GIWA REGIONAL ASSESSMENT 11 BARENTS SEA
REGIONAL DEFINITION
25
Oil and gas
180 000
Cod
Unique reserves of oil and gas on the Arctic shelf of Russia may constitute
160 000
Haddock
the basis for an increased development of Russia in the 21st century. At
140 000
Saithe
present, 62.5 tril ion m3 of natural gas and 9 bil ion tonnes of oil have
120 000
100 000
been discovered in the seas of the Arctic Ocean and 3.5 billion tonnes
80 000
of oil have been discovered on the coast (Figure 12). This constitutes
a
t
c
h
(tonnes)
C 60 000
25% of the world reserves (Denisov 2002).
40 000
20 000
0 1985 1987 1989 1991 1993 1995 1997 1999 2001 2003
Svalbard (Norway)
Franz Joseph Land
Year
Figure 11 Landings of cod in Finnmark 1985-2003.
Note: Figure includes landings from foreign vessels (Russian).
(Source: Norwegian Directorate of Fisheries 2003)
K a r a
S e a
Aquaculture
a
The aquaculture industry is expected to grow rapidly both on the
Bear Island
Norwegian and Russian side of the Barents Sea. Governments and
vaya Zemly
the industry in both countries show great interest in increasing the
B a r e n t s S e a
No
production of farmed fish; there is also an excel ent scientific potential
in the region. Development of aquaculture in the Murmansk region
Norway
Vaigatch Island
is considered as one of the most important for the nearest 15 years.
Aquaculture in Northwest Russia is traditional y developed in the
Murmansk
fol owing directions:
s
Industrial fishery and fish-breeding in inland water reservoirs based
Finland
Kola Peninsula
in
ta
on aquaculture;
n
Russia
uo
Breeding of commercial fish on natural and artificial food in fish
White Sea
l m
farms;
raU
Arkhangelsk
Reproduction of fish stocks.
Oil and gas structures
© GIWA 2004
Figure 12 Oil and gas structures of the Barents and Kara Seas.
The production of farmed salmon (Salmo salar) and Rainbow trout
(Source: Denisov 2002)
(Parasalmo mykiss) in northern Norway has seen a rapid growth
in recent years. In Norway, fish farming is an important industry,
If the present average volumes per year of oil and gas extraction remain,
providing jobs and income in rural Arctic areas. In Finnmark,
these reserves wil last for 250 years. The largest oil and gas deposits, the
according to official information from the Norwegian Directorate on
Stockman gas condensate deposit, the Prirazlomnoye oil deposit, and a
Fisheries (2004), the total production of salmon was 20 292 tonnes
number of coastal deposits are being exploited already. These deposits
in 2000, and 32 893 tonnes in 2001; Rainbow trout production was
wil determine the social and economic development of Northwest
0 and 282 000 tonnes, respectively. There is stil growth potential
Russia for the next 25-50 years. The problem of extraction and transport
in this market (LENKA 1990). Marine species such as cod (Gadus
of oil and gas is becoming a strategical y important task.
morhua), halibut (Hippoglossus hippoglossus), sea urchin, Red king crab
(Paralithodes camschaticus), Arctic char (Salvelinus alpinus) and wolfish
It is planned to transport up to 7 mil ion tonnes of oil each year from
(Anarhichas spp.) are also potential for aquaculture in addition to
the Prirazlomnoye oil deposit in the Pechora Sea, which is now being
salmonids. Sea-based aquaculture activities are currently smal in the
developed by the Rosshelf and Gazprom companies. Considerable
Russian part of the region, primarily due to lack of investment funds
volumes of oil transport are also expected from other deposits located
(Larsen et al. 1994), but are expected to grow in the future in both the
in the Pechora Sea, from the Timano-Pechora oil and gas province
Barents and White Seas regions.
bordering the Pechora Sea, from the Ob Bay area, from the area of the
Ob and Yenisey rivers, and from other areas. In addition to oil transport,
26
GIWA REGIONAL ASSESSMENT 11 BARENTS SEA
REGIONAL DEFINITION
27
large volumes of gas condensate transport are also expected. There are
cooperation between the authorities from northern Finland and
large reserves of natural gas in the Stockman gas condensate deposit
Northwest Russia, Finnmark is a leader of a project to strengthen tourism
in the Barents Sea, as wel as in Rusanovskoye and Leningradskoye
in the north (the Image Project). The project aims at a joint profile for the
deposits in the Kara Sea. Large gas fields have also been discovered in
area, which wil be the basis for future promotion of the "Arctic triangle".
the Laptev and North Siberian Seas.
The Regional Development Programme funds the initiative.
The development of oil and gas deposits in northern Russia will
Three national parks exist in Finnmark and there are plans to extend
increase oil transport to 40 mil ion tonnes by the year 2020. This will
their areas and increase the number of national parks by another three.
correspondingly increase the pressure on the Northern Sea Rout by a
Additional y, the landscape structure of many other areas is protected.
factor of 6. To develop only the enumerated deposits, 18 ice-resistant
These are of great potential for outdoor and adventure tourism.
platforms, 10-12 ice-breakers, including three to four nuclear powered
ice-breakers, about 60 vessels for technical maintenance, and large
The outdoor and adventure tourism in the Russian sector of the region
amounts of tankers with a total deadweight of 4 million tonnes, need
has gained specific features: from al the branches of tourism offered
to be constructed.
to foreign tourists, the most profitable one is sport fishing and hunting.
The reasons for increased profitability in this sector are that, firstly, most
Tourism
of the clients are foreigners. Secondly, there are no fees for the use of
The unique geopolitical location of the region and the opening of
unique recreational resources in the region and the nature protection
the Russian borders have contributed to increased cooperation across
regulations are less strict compared to European countries. Thirdly, there
the borders during recent years, and transboundary tourism plays a
is availability of a cheap labour force.
significant role in this cooperation. A new project on international
tourism within the EU programme MACIS "Development of tourism in
Since mid-late 1990s, many western tourists have visited places in the
the Russian part of the Barents Region" started in the year 2001 with a
Murmansk Region to practise sport fishing, several Russian and some
budget of 1.1 mil ion EUR. This project is of fundamental importance for
joint venture companies do business in the area. However, functions
tourism in the region, especial y for outdoor and adventure tourism, the
of tourist agents and tourist operators are not clearly defined between
two sectors with the fastest growth. There are seven national and nature
Russian and foreign firms. There is such a phenomenon as "capture of
parks in the Russian part of the region (one in the Arkhangelsk Region,
rent" by foreign firms and loss of income for both private Russian joint
one in the Nenets Autonomous Region, five in Karelia, and none in the
stock and for budgets at all levels.
Murmansk Region).
Competition in the market of recreational branches of tourism in the
The development of the tourism sector is of great socio-economic
region is hampered by interests of criminal circles in this sphere.
importance for the development of the region. It stimulates new
investments and leads to increased income for the local communities,
Cooperation on the protection of the environment
creates new jobs, and improves international and inter-regional cultural
Environmental protection is part of the agenda of many of the
cooperation. The main task is to include as many new areas as possible
international and national organisations in the Barents region and the
into the sector, create a positive tourist image and promote the region
Arctic. The integration of environmental issues into economic activities
on the European market.
and the efforts to promote sustainable development have brought
environmental chal enges to the forefront in the activities of all of the
The most popular branch of tourism in the northwest, cruise travel,
main institutions and organisations in the Barents region. The main
is growing. Western tour operators and ship owners are interested in
international organisations and bodies dealing with environmental
voyages along the Belomorsko-Baltiysky canal, as wel as along the
issues in the Arctic and Barents region are described in the fol owing.
coast of the Barents Sea. The number of cruise tourists can be increased
without implementing solid land based investment, but by adopting
The Barents Euro-Arctic Council
new laws, which al ow foreign vessels in the internal waters of Russia.
The Council has established a Task Force on the Environment. The
Task Force handles issues concerning e.g. air pol ution abatement,
Finnmark is also a very attractive tourist destination within the "Arctic
environmental technology, the foundation and maintenance of
triangle" (Sodankylä (Finland) Alta (Finnmark) Murmansk). In close
protected areas, radioactive pol ution and clean water supply. The
26
GIWA REGIONAL ASSESSMENT 11 BARENTS SEA
REGIONAL DEFINITION
27
Task Force works in close cooperation with the Barents Council's
research cooperation. In addition, the promotion of environmental
Economic Working Group and an ad hoc Working Group on Energy. The
sustainability is part of the NF's agenda. The cooperation between the
Environmental Task Force adopted its Environment Action Programme
NF and the Barents Regional Council is being developed.
in 1994, and the five main issue areas are prevention of radioactive
pol ution, environmental capacity building, reduction of pol ution
Bi-lateral programmes
from industry, nature conservation and cooperation between regional
Finland, Sweden, and Norway al have bi-lateral environmental
authorities.
programmes and projects under way with Russia in the Barents region.
The countries in the Barents region are involved in around 150 bi-
The Task Force has engaged the Nordic Environment Finance
and multilateral environmental projects. For example, the Research
Corporation (NEFCO) to identify environmental hot spots in the
Programme for Environmental Technology (PRIRODA) was started in
Barents region and to make feasibility studies on the implementation of
1991 between Russia and Norway. Finland has put efforts especial y into
pol ution reduction projects. Subsequently, the Task Force has fol owed
the handling and storage of radioactive waste in the Murmansk Oblast,
the progress of these projects. Separately, the Environmental Task Force
as well as water supply and cleaning projects.
has, together with the Economic Working Group of the Barents Council,
prioritised seven projects of environmental and economic significance
The Nordic Council
in the Barents region. This so-cal ed "Joint List of Environmental y
The Nordic Council has also taken part in Arctic environmental
Sustainable Investment Projects", has also been studied by the Task
cooperation. In 1993, the parliamentarians of the Nordic Council e.g.
Force. Furthermore, the Task Force has coordinated and promoted
established a permanent Arctic committee, which has subsequently
projects on biodiversity and forestry issues, as wel as environmental
participated in the work of the Arctic Environmental Protection Strategy.
capacity building.
The Nordic Council's working group on the neighbouring areas has also
worked in cooperation with the Barents region organisations.
The Barents Regional Council
The Regional Council has set up a Regional Environmental Committee,
Non-governmental organisations
which consists of environmental officials from the administrations of all
Final y, there are many non-governmental organisations (NGOs) involved
10 member-regions. In addition, the Nenets Autonomous Region has its
in environmental cooperation in the Barents region and the Arctic as a
own representative, and the Sami population is also represented. The
whole. Some of the most active are the WWF, the International Arctic
Committee has drawn up a regional environmental action programme
Science Committee (IASC), the Sami Council, the Inuit Circumpolar
for the Barents region, with priorities on human health, biodiversity and
Conference, the International Union for the Conservation of Nature
environmental awareness.
(IUCN), as well as NGOs in the Nordic countries and Northwest Russia.
The Arctic Council
International programmes and agreements
The work of the Arctic Council (AC) has two main pil ars. One is the
related to water
promotion of sustainable development. The other is to integrate and
The water protection activities in the Barents Sea region are regulated
continue the Arctic Environmental Protection Strategy (the so-cal ed
by, and carried out through a number of international programmes
Rovaniemi Process), which started original y in 1989 and official y in
and agreements.
1991, within the framework of the AC. There are five main programmes
in the latter process: The Arctic Monitoring and Assessment Programme
Rovaniemi Declaration on the Protection of the Arctic Environment
(AMAP), Conservation of Arctic Flora and Fauna (CAFF), Protection
In 1991, the Rovaniemi Declaration on the Protection of the Arctic
of the Arctic Marine Environment (PAME), Emergency Prevention,
Environment, was launched by the representatives of the governments
Preparedness and Response (EPPR), and Sustainable Development
of Canada, Denmark, Finland, Iceland, Norway, Sweden, the former
and Utilization (SDU).
Soviet Union and the United States. The Declaration addresses threats
to the Arctic environment and the impact of pollution on fragile
The Northern Forum
Arctic ecosystems. Within the framework of the Arctic Council, the
The Northern Forum (NF) consists of administrative regions from Arctic
Declaration adopted the Arctic Environmental Protection Strategy
countries including Japan. The NF concentrates on several issues such
(AEPS) and elaborated a joint Action Plan for its implementation and
as economic development, the utilisation of natural resources, and
further development. The major objectives of the Strategy are: to protect
28
GIWA REGIONAL ASSESSMENT 11 BARENTS SEA
REGIONAL DEFINITION
29
the Arctic ecosystems, including humans; to provide for the protection,
within the Arctic Monitoring and Assessment Programme (AMAP). The
enhancement and restoration of environmental quality and sustainable
conference also raised the questions of radioactive pol ution. The
utilisation of natural resources; to review regularly the state of the Arctic
importance of international cooperation was noted in the fol owing
environment; and to identify, reduce and, as a final goal, eliminate
areas: expanded monitoring of ecology and radioactivity in the
pol ution. At least three of its five programmes deal with the protection
region; enhanced work on the operational safety of nuclear facilities;
of the marine environment: the Protection of the Arctic Marine
and rehabilitation of areas that have been pol uted as a result of the
Environment (PAME) addresses policy and non-emergency response
operation of nuclear facilities.
measures related to protection of the marine environment from land
and sea-based activities. The second programme, Arctic Monitoring and
Fisheries management cooperation
Assessment Programme (AMAP), deals with the research and control
Most major fish stocks are shared with other countries, as is the case of
over the state of the Arctic marine environment. It has responsibilities to
the Barents Sea fisheries, with the exception of saithe. This means that
monitor the levels of, and assess the effect of, anthropogenic pol utants
key regulatory decisions are taken in bi- and multilateral arrangements.
in al compartments of the Arctic environment, including humans. The
The Total Al owable Catch (TAC) is therefore a given factor that the
third programme, Emergency Prevention, Preparedness and Response
national regulatory regime has to deal with.
(EPPR), is responsible for the preparedness in cases of emergency in the
Arctic region and is called to provide a framework for future cooperation
Norway and Russia manage their shared fish stocks in the Barents Sea
in responding to the threat of environmental emergencies.
(cod, haddock and capelin) through the Joint Norwegian-Russian
Fisheries Commission, established in 1975. The Commission sets TACs
Kirkenes Declaration
for the shared fish stocks, throughout their migratory routes across
In 1993 the Ministers of Foreign Affairs or representatives of Denmark,
borders of jurisdiction in the Barents Sea. The TACs are based on
Finland, Iceland, Norway, the Russian Federation, Sweden and the
scientific advice from the International Council for the Exploration of
Commission of the European Communities signed the Kirkenes
the Sea (ICES) and national research institutions (see Figure 13). The
Declaration at the conference on cooperation in the Barents Euro-
parties also al ot a quota for third-countries with "historical rights" to the
Arctic region, which took place in Kirkenes, Norway. The conference
fisheries (e.g. EU and Iceland). The parties also exchange fishing quotas
was also attended by observers from the United States, Canada, France,
according to established fishing patterns and provide mutual access to
Germany, Japan, Poland, and the United Kingdom. The participants
fish in each other's national Exclusive Economic Zones (EEZ). During the
expressed their conviction that expanded cooperation in the Barents
1990s cooperation in control and enforcement and marine research has
Euro-Arctic region will substantial y contribute to stability and progress
been strengthened (Hoel 1994).
in the area and in Europe as a whole, where partnership is now replacing
the confrontation and division of the past. The participants felt that
Marine research
such cooperation wil contribute to international peace and security.
It was decided that regional cooperation in the Barents Euro-Arctic
region would comprise the county of Lapland in Finland, the counties
Scientific advice from ICES
of Finnmark, Troms and Nordland in Norway, the counties of Murmansk
and Arkhangelsk in Russia, and the county of Norrbotten in Sweden.
It was also noted that the region might be extended to include other
Meetings of the Joint
counties in the future. The participants recal ed the Joint Declaration
Norwegian-Russian Fisheries Commission
from the meeting of the Ministers of Environment of the Nordic
countries and the Russian Federation in Kirkenes on 3 September, 1993,
Agreed Total Allowable Catch
and the Convention for the Protection of the Marine Environment of
the Northeast Atlantic signed on 22 September, 1992, and underlined
the importance of strengthening bi-lateral and multilateral cooperation
to protect the vulnerable environment of the region. The participants
also re-affirmed their commitment to the Strategy for Protection of the
Norwegian quota
Russian quota
Third country
Arctic Environment, adopted at the Ministerial Meeting in Rovaniemi in
Figure 13 The scheme of setting of TACs for the shared stocks of
1991, and to the ongoing work in implementing that strategy, especial y
the Barents Sea.
28
GIWA REGIONAL ASSESSMENT 11 BARENTS SEA
REGIONAL DEFINITION
29
There is a border dispute between Russia and Norway in the Barents
Convention on Nuclear Safety
Sea. Norway and Russia (then the Soviet Union) established their
Russia is a signatory-state of the Convention on Nuclear Safety, provided
EEZ in 1976, fol owing the developments at the third United Nations
for the re-enforcing of national measures and international cooperation
Conference on the Law of the Sea (1973-1982). Due to disputes
in the field of safe exploitation of nuclear power plants, prevention of
regarding the delimitation of the bordering EEZs, agreement was
accidents and mitigation of their consequences.
reached in 1977 on a temporary Grey Zone where both Norway
and Russia regulate and control their own fishers. The Grey Zone
Convention on Early Notification of a Nuclear accident
agreement has been renewed annual y by the parties. Another area of
To develop the Convention on Early Notification of a Nuclear Accident
contention is the Fishery Protection Zone around Svalbard, established
(1986), bilateral agreements were reached, which exceed the limits of
by Norway in 1977. The management of these waters is subject to the
the Convention. The agreements are provided for mutual exchange
Svalbard Treaty of 1920. The Norwegian claims to sovereign rights
of information on the status and exploitation of nuclear power plants
over the Protection Zone have not been supported by the other
located in the mutual y agreed border areas of the corresponding states.
signatories of the Svalbard Treaty. In practice, the regulations in the
Such agreements were reached with Great Britain, Germany, Norway,
Protection Zone are similar to those of the Norwegian EEZ. However,
Poland, Finland, and Sweden. Nowadays negotiations are being carried
fleets with fishing rights in the Barents Sea are not sanctioned. In the
out to reach such agreements with other countries.
northeast of the Barents Sea there is an area of high seas beyond
the jurisdiction of coastal states, the so-cal ed loophole (Churchil &
Convention on the Physical Protection of Nuclear Material
Ulfstein 1992).
Russia also ratified the Convention on the Physical Protection of Nuclear
Material, which obliges contracting States to ensure during international
Cooperation on radiological protection
nuclear transport the protection of nuclear material within their territory
The Barents Sea region is somewhat a unique world region in terms of
or on board their ships or aircrafts.
nuclear energy. No other place in the world houses so many sources of
potential radiological threats like the Murmansk Region of the Russian
Convention on Assistance in the Case of Nuclear Accident or
Federation, one of the four Russian regions considered for the Barents
Radiological Emergency
Sea region.
Convention on Assistance in the Case of Nuclear Accident or
Radiological Emergency sets out an international framework for
Major problems of radiological protection and safety in the Russian
cooperation among parties and with the International Atomic Energy
sector of the region that need active international cooperation
Agency (IAEA) to facilitate prompt assistance and support in the event
and financial and technical support from foreign partners are the
of nuclear accidents or radiological emergencies.
fol owing:
Safety of spent nuclear fuel and radioactive waste management;
Joint projects between Russia and other countries
Complex dismantlement and remediation of decommissioned
In June 2003, Russia signed the frame agreement on the multilateral
nuclear powered submarines and civilian vessels, nuclear support
nuclear ecological programme in the Russian Federation. The list of
and service vessels and nuclear storage vessels, remediation of
participants, in addition to the Russian Federation, includes Belgium,
radioactively dangerous sites;
Great Britain, Germany, Denmark, Netherlands, Norway, the United
Construction of storages for spent nuclear fuel and radioactive
States, Finland, France, Sweden, and EU. The Agreement provides for
waste;
the cooperation in the field of safe handling of spent nuclear fuel and
Improvement and upgrading of systems for monitoring, control,
radioactive waste, dismantlement of decommissioned nuclear powered
prevention and response to emergencies, and protection against
submarines and icebreakers in Northwest Russia. There is also a special
radiological terrorism;
fund managed by the European Bank for the Reconstruction and
Improvement of safety systems for the transportation of radioactive
Development for these purposes.
material.
In addition to the international projects, programmes and conventions
The radiological protection activities in the region are regulated by a
functioning in the territory of the Russian Federation, there are special
number of national and international conventions and agreements:
projects for Kola Peninsula. Germany assigned 300 mil ion EUR for
projects on dismantlement of Russian nuclear powered submarines
30
GIWA REGIONAL ASSESSMENT 11 BARENTS SEA
REGIONAL DEFINITION
31
including 25 mil ion EUR for 2003. The Agreement between the Ministry
of Atomic Energy of the Russian Federation and the German Ministry
of Economy has been signed to construct a complex for the long-term
storage of piles from dismantled nuclear powered submarines in the
Saida Bay (Murmansk Region).
Agreements on the dismantlement of two multipurpose nuclear
powered submarines have been reached with Norway. A number of
joint projects between Russia, Norway, Great Britain and the U.S. are
carried out to increase the capacity of storages and treatment plants
for spent nuclear fuel and radioactive waste.
The EU has contributed to radiological protection projects in the
Barents region. One of the most important projects the EU has
been involved in concerns the removal of radioactive waste from a
decommissioned carrier vessel, the Lepse, which is lying in the Kola
Fjord near the city of Murmansk. The TACIS programme between Russia
and EU aims at improving nuclear safety of nuclear power plants in
the territory of Russia. The programme also includes the construction
of a regional storage for radioactive waste and spent nuclear fuel in
Northwest Russia.
Arctic Military Environmental Cooperation
Trilateral Norwegian-U.S.-Russian military environmental cooperation
began in 1996. The aim of the cooperation is to clean pol uted
military areas in Northwest Russia, including radioactive pol ution
sites. It consists of several projects, part of them aimed at ensuring
the appropriate security for military radioactive waste. One of the
most promising projects in the framework of this programme is the
elaboration and testing of a ferro-concrete container for the storage
and transportation of spent nuclear fuel from out-of-duty nuclear
powered submarines.
Nuclear safety has also been a priority of the Barents Council since
its foundation. Several projects are under way. For example, Finnish
and Norwegian authorities have cooperated with Russian experts to
upgrade the safety of the Kola Nuclear Power Plant in Polyarnye Zori. A
Finnish energy company, IVO Power Engineering, has also completed
work on purifying and concentrating liquid radioactive waste generated
by the ATOMFLOT's nuclear-powered icebreakers.
30
GIWA REGIONAL ASSESSMENT 11 BARENTS SEA
REGIONAL DEFINITION
31
Assessment
This section presents the results of the assessment of the impacts
Table 16 Scoring table for the Barents Sea region.
of each of the five predefined GIWA concerns i.e. Freshwater
Assessment of GIWA concerns and issues according
The arrow indicates the likely
to scoring criteria (see Methodology chapter).
direction of future changes.
shortage, Pollution, Habitat and community modification,
T
T
C
C
Increased impact
P
A 0 No known impact
P
A 2 Moderate impact
I
M
I
M
Unsustainable exploitation of fish and other living resources,
T
T
No changes
C
C
P
A 1 Slight impact
P
A 3 Severe impact
I
M
I
M
Decreased impact
Global change, and their constituent issues and the priorities
identified during this process. The evaluation of severity of each
p
a
c
t
s
u
n
i
t
y
e
n
t
a
l
m
p
a
c
t
s
m
issue adheres to a set of predefined criteria as provided in the
Barents Sea
i
c i
m
c
o
r
e
*
*
o
m
chapter describing the GIWA methodology. In this section, the
p
a
c
t
s
p
a
c
t
s
E
n
v
i
r
o
n
m
i
m
E
c
o
n
o
m
H
e
a
l
t
h i
O
t
h
e
r c
i
m
O
v
e
r
a
l
l S
P
r
i
o
r
i
t
y
*
*
*
scoring of GIWA concerns and issues is presented in Table 16.
Freshwater shortage
1*
1
1
0
1
4
Modification of stream flow
0
Pol ution of existing supplies
2
Changes in the water table
0
T
C
Pollution
1*
2
1
0
2
2
P
A
Freshwater shortage
I
M
Microbiological pol ution
0
Eutrophication
0
The Barents Sea region is notable for its abundant water reserves. The
Chemical
1
Suspended solids
0
total annual precipitation decreases from south to north within the
Solid waste
1
boundaries of the drainage basin: from 600 mm in the upper reaches
Thermal
0
of the Severnaya Dvina River to 400 mm on the coast. At the same
Radionuclide
1
Spil s
1
time, the humidity does not vary much since the evaporation decreases
Habitat and community modification
1*
1
0
1
1
3
nearly in the same proportion (from 250 to 100 mm per year). This results
Loss of ecosystems
1
in a dense river and lake network; there are more than 160 000 lakes in
Modification of ecosystems
1
the Russian part of the region. Marshes represent a considerable part
Unsustainable exploitation of fish
2*
2
1
2
2
1
of water reserves due to the low permeability of crystalline rocks and
Overexploitation of fish
3
Excessive by-catch and discards
1
frozen ground, and low evaporation.
Destructive fishing practices
1
Decreased viability of stock
0
As a result of these hydrological features, the freshwater supply in the
Impact on biological and genetic diversity
2
region is high (more than 50 000 m3 per year and person). The total
Global change
0*
0
0
0
0
5
Changes in hydrological cycle
0
water consumption in 1999 in the Russian sector of the region was
Sea level change
0
4.25 mil ion m3. During the past several years, an insignificant increase in
Increased UV-B radiation
0
water consumption has been noticed. In Finnmark there are no industries
Changes in ocean CO source/sink function
0
2
* This value represents an average weighted score of the environmental issues associated
with high freshwater consumption, the population is low and there are
to the concern. For further details see Detailed scoring tables (Annex II).
great volumes of freshwater resources. Freshwater shortage in the region
** This value represents the overall score including environmental, socio-economic and
likely future impacts. For further details see Detailed scoring tables (Annex II).
is therefore not expected and the two issues modification of stream flow
*** Priority refers to the ranking of GIWA concerns.
32
GIWA REGIONAL ASSESSMENT 11 BARENTS SEA
ASSESSMENT
33
and changes in the water table was considered as irrelevant for the region.
Table 17 Russian water quality guidelines (Maximim Allowable
They were assessed as having no known impact and are therefore not
Concentration - MAC) for the protection of aquatic life,
based on toxilogical criteria.
further discussed. However, there is evidence of local pol ution of the
Mollusc &
Marine
surface waters in the region and the issue pol ution of existing supplies
Freshwater
Seawater
Fish
Contaminant
crustaceans
algae
(mg/l)
(mg/l)
(mg/kg ww)
(mg/kg ww)
(mg/kg ww)
was assessed as moderate. It should be noted though that the impact of
Oil hydrocarbons
0.05
0.05
-
-
-
river water on the quality of international waters is insignificant because
Aluminum (Al)
0.04
0.04
-
-
-
of the Barents Sea openness, giving free water exchange with the Atlantic
Iron (total) (Fe)
0.1
0.05
-
-
-
and Arctic Oceans, and the relatively low river run-off (AWI 1994),
Copper (Cu)
0.001
0.005
10.0
30.0
-
Pollution of existing supplies
Cadmium (Cd)
0.005
0.01
0.2
2.0
-
Large smelter complexes, mining and metallurgy, ore processing and
Chromium (Cr)
0.02
0.02
-
-
-
pulp and paper industries have a pronounced and increasing negative
Cobalt (Co)
0.01
0.005
-
-
-
impact on rivers and lakes located in the vicinity of the enterprises.
Arsenic (As)
0.05
0.01
5.0
5.0
-
The poor coverage by sewage treatment plants, as well as ineffective
Nickel (Ni)
0.01
0.01
-
-
-
treatment in the existing plants, have led to pol ution of freshwater
Lead (Pb)
0.01
0.1
1.0
10.0
0.5
resources. Pol uted water from municipal services, poultry farms and
Mercury (Hg)
0.00001
0.00001
0.5
0.2
0.1
cel ulose and pulp industries is discharged into the Severnaya Dvina,
Zinc (Zn)
0.01
0.05
40.0
200.0
-
Pechenga and Kola rivers.
DDT (Technical)
0.00001
0.00001
0.2
-
-
HCH
0.00001
0.00001
0.2
-
-
Severnaya Dvina River
PCB
-
-
2.0
-
-
The water and bottom sediments of the Severnaya Dvina are
Note: ww=wet weight. (Source: VNIRO 1999, State Committee for sanitary and Epidemiological
Control of the Russian Federation 1997)
contaminated mainly due to pulp and paper industries and timber
rafting. Contamination by easily oxidising organic substances, phenols,
oil products, and compounds of copper and iron is typical of the river
heavy metals in the estuarine water can vary within a wide range,
water. Contamination with methanol, formaldehyde and lignin is typical
averaging 3 MAC for copper and 1-2 MAC for zinc (Table 17).
of the estuary which is characterised by dissolved oxygen deficiency in
Concentrations of trace elements in bottom sediments of the same
the spring-winter period.
area vary for copper in the range 13-22 mg/g, for zinc 40-159 mg/g,
lead 7-30 mg/g, cadmium 0.1-0.4 mg/g, cobalt 18-21 mg/g and nickel
Analysis of data presented in the Arkhangelsk Region Environment Status
34-49 mg/g (Aibulatov 2001).
reports for the period 1995-2000, shows that at the Severnaya Dvina
River mouth, in the area of sewage discharge from theArkhangelsk Pulp
The levels of organochlorine pesticides were detected in traceable
and Paper Enterprise (APPE), a steady increase of water contamination
amounts, up to 0.006 mg/l in 2001-2002 (Arkhangelsk Region
was observed. The annual average concentration of lignosulfonates,
Directorate of Natural Resources and Environmental Protection 2002).
a pol utant specific for the Arkhangelsk Pulp and Paper Enterprise,
Oil products were detected in concentrations close to 1 MAC.
ranged from 2.5 to 5 times the Maximum Al owable Concentration
(MAC - the standard set by Russian regulations), and the concentrations
Pechora River
of aluminium compounds up to 2 MAC (Table 17). Occasional cases of
Pol ution of the Pechora River is mainly caused by the activity of the
ammonia, methanol and formaldehyde contamination (up to 2 MAC)
Timano-Pechora oil and gas province (Bryzgalo & Ivanov 1999a, Bryzgalo
were also registered. High levels of bacteria in a addition to a high
et al. 1999). The levels of oil products in the water therefore require
content of poorly oxidised organic compounds create problems with
special attention. Paraffin concentrations in the river mouth varied
providing drinking water to the population in the Arkhangelsk industrial
from 0.003 to 0.036 mg/l in year 2000, which is lower than maximum
corridor (the cities of Arkhangelsk, Severodvinsk and Novodvinsk)
al owable concentration. According to Sevgidromet (1994, 1995, 1996)
(Arkhangelsk Region Administration 2003).
and the Research Institute of the Atmospheric Air Protection (1998),
the situation in this region has not changed significantly during recent
According to data from Arkhangelsk Region Directorate of Natural
years and the concentration of oil hydrocarbons remains approximately
Resources and Environmental Protection (2002) the levels of
at the same levels.
32
GIWA REGIONAL ASSESSMENT 11 BARENTS SEA
ASSESSMENT
33
Concentrations of heavy metals in the Pechora River water are lower
observed (Murmansk Region Directorate of Natural Resources and
than MAC and organochlorine pesticides are detected in insignificant
Environmental Protection 2001).
amounts (up to 0.005 mg/l) (Arkhangelsk Region Directorate of Natural
Resources and Environmental Protection 2002).
Pasvik River
Smelting of copper-nickel ore in the cities of Nikel and Zapolyarnyy on
Kola River
the Kola Peninsula is the main air pollution source in the border areas.
The Kola River and its tributaries are affected by: sewage and filtration
The emissions peaked at approximately 380 000 tonnes SO per year in
2
waters from the areas of manure repositories and liquid manure
1979 (Henriksen et al. 1997). The emissions have later been reduced to
col ectors of the sovkhozes (state farms) of Murmansk, Prigorodny and
approximately 150 000 tonnes per year due to lower production in the
Kolsky; the experimental industrial farm Voskhod; the integrated poultry
early 1990s and later due to cessation in the use of Norilsk ore (SFT 2002).
farms Murmanskaya and Snezhnaya; and industrial and municipal
The air emissions also include metals, particularly nickel (maximum
sewage and stormwaters from industrial enterprises and settlements
emissions approximately 500 tonnes per year), copper (maximum
situated on the Kola river banks.
300 tonnes per year), and other environmental contaminants (SFT 2002).
In addition to the air pollution, the mining activity in Nikel discharges
Maximum concentrations of copper and manganese were registered in
approximately 50 tonnes nickel per year directly to the Kolosjohki River
1993-1995 (Sevgidromet 1994, 1995, 1996). At the same time, other toxic
of which 40 tonnes reach the transboundary Pasvik River (Arnesen et
metals such as mercury, chrome, nickel, cadmium and lead exceeded
al. 1996). The impacts of the emissions on the environment are largest
MAC considerably. In 1995-2000 the situation at the river mouth
on the Russian side of the border closest to the pollution sources but
improved somewhat, but by the year 2000 the concentration of copper
the easternmost parts of Norway are also affected. The emissions have
(5 MAC), nickel (3 MAC) and manganese (6 MAC) remained at high levels
led to acidification of soils and surface waters, direct effects of SO on
2
(Sevgidromet 1994, 1995, 1996, State Environmental Committee of the
vegetation, and higher concentrations of some metals in terrestrial and
Murmansk Region 1999, 2001).
aquatic ecosystems.
Pollution by oil products were less than 0.02 mg/l up to the year 1998
During the previous decade, the environmental situation within
(State Environmental Committee of the Murmansk Region 1999).
the border area has been investigated as part of Norwegian,
However, the concentrations abruptly increased to 0.1 mg/l in 1998
Finnish and Russian national monitoring programmes as wel as
and 0.08 mg/l in 2002. According to Sevgidromet (1995) the average
part of the Joint Norwegian-Russian Commission on Environmental
annual input of oil products in 1993 and 1994 was 17 and 10 tonnes
Cooperation, Finnish-Russian Environmental Cooperation and during
respectively but at present, the values are somewhat higher.
implementation of research projects carried out by various scientific
institutes. Long-term monitoring of water chemistry in lakes and rivers
Pechenga River
shows that extensive acidification of surface water has taken place,
In 1994 and 1995, extremely high concentrations of heavy metals were
particularly on the Norwegian side of the border (Amundsen et al. 1993,
observed in the River caused by accidental wastewater discharges
1997, Kashulin et al. 1997, 1999, 2003, Skjelkvĺle et al. 2001, Traaen et al.
from the Pechenganikel smelter. For example, copper concentrations
1991 etc.). Critical loads are exceeded in large areas of South-Varanger
reached 6.6 mg/l and 10.3 mg/l respectively and extremely high
municipality, especially in the Jarord area, and in areas situated around
contamination by zinc, nickel, manganese, and high contamination
Nikel and Zapolyarny.
with chrome, cadmium and cobalt was also registered. By now, the
situation has normalised but some contamination of the Pechenga
Economic impacts
River is still prevalent; in year 2000 the concentration of copper, nickel
Economic impacts were assessed as having a slight impact. Pol uted
and manganese exceeded the MAC with 4, 3 and 2 times respectively
water from municipal services, poultry farms, and pulp and paper
(Murmansk Region Directorate of Natural Resources and Environmental
industries is discharged into the Severnaya Dvina, Pechenga, and Kola
Protection 2001).
river basins, which are the sources of drinking water for the people
living in the area. In periods of increased discharges and during intense
Up to 1998, the concentration of oil products remained within the
snow melting, the population is affected by shortage of freshwater. As
background range of 10-20 mg/l (Bryzgalo & Ivanov 1999b). However,
a result, a more active use of the less polluted groundwaters is required
in 1998 and 2000, an increase in concentration up to 70-80 mg/l was
in the region. However, an existing programme to increase the use of
34
GIWA REGIONAL ASSESSMENT 11 BARENTS SEA
ASSESSMENT
35
groundwater makes only slow progress because of the financial
increase since despite a slight growth of the production volumes,
situation and the potential groundwater resources are currently poorly
measures will be taken to decrease the inputs of contaminants into the
explored.
air, as well as pollution of water (Batchaev et al. 2002, Murmansk Region
Administration 2001, 2002).
Health impacts
Health impacts were assessed as having no known impact. There are
no statistical data on diseases caused by freshwater pol ution, but there
T
C
are single records of diseases related to the quality of freshwater e.g.
P
A
Pollution
I
M
dysentery and hepatitis. This is in agreement with results from the joint
Russian-Norwegian studies carried out by the Institute of Community
Various pollutants enter the Barents Sea via two main and complicated
Medicine (ISM) in the Barents region which are based on an initiative by
pathways: external advection (marine and atmospheric) which
the Ministry of Environment in both countries to explore the possible
dominates, and local economic activities (effluents from land, transport
effects of air pollution coming from the nickel industry on the Russian
activities etc.).
side of the border. The Health Group of Norwegian and Russian scientists,
headed by the ISM, was founded in 1991. The group decided to carry
Atmospheric pollution over the Barents Sea water area is conditioned
out a health study in the Norwegian-Russian border area to map human
by the global processes of dissipation and transport of anthropogenic
exposure and to investigate possible health effects of local air pol ution.
pollutants from sources located in medium and high latitudes of Asia,
Human urinary nickel levels were substantial y higher on the Russian
Europe, and North America. However, local sources influence as well
side, and highest in the vicinity to the nickel smelters. Despite that, the
and one of the features of the region is the presence of large mining,
Russian women had lower prevalence of nickel al ergy compared to the
metal urgy, ore processing and pulp and paper industries. Analysis of
Norwegian. Airway symptoms were frequently reported in Russia, but
the infrastructure of anthropogenic pol uters in the Russian sector of
lung function was better than predicted on both sides. No associations
the Barents Sea drainage basin (in the interconnection with their annual
between sulphur dioxide concentrations in air and lung function could
power) has shown that the main sources of emission of toxic substances
be verified. The study revealed no major health effects from the nickel
are concentrated in the northern part of the drainage basin, and closest
on either side of the border (AMAP 1998, 2002, Dotterud et al. 2000 2001,
to the coast. This results in increased atmospheric contamination
Odland et al. 1999, Odland 2000, Smith-Sivertsen et al. 2001 etc.).
over the Barents Sea open water area with substances such as trace
elements, including heavy metals, polycyclic aromatic hydrocarbons,
Other social and community impacts
persistent organic pollutants, and sulphur compounds.
There are no records of other social and community impacts (e.g.
increased damage to water-related equipment, and damage to
Water and ice exchange with adjacent areas has a significant role in
infrastructure).
the pol ution of the Barents Sea. The Barents Sea is the unloading
zone of the Atlantic water currents, thus, it is important to take into
Conclusions and future outlook
consideration the possibility of advection of the pol utants with the
Freshwater shortage is not relevant for the Barents Sea region and
outside sea currents. Water exchange with the White Sea has also
the transboundary aspect is largely missing. Therefore, a slight impact
some impact.
was assigned to the present conditions. The freshwater shortage is
predicted to be reduced or at least stay at the same level of impact by
The issues of microbiological pol ution, eutrophication, suspended solids,
2020. According to predictions, the major production of the Kola Mining
and thermal pol ution were considered as irrelevant and were assessed
and Metallurgy Company, which is one of the major polluters of air and
as having no known impacts. Microbiological pollution is caused by
the aquatic environment, will decrease by 50% and thus, pollution of
municipal sewage discharged into the freshwater resources, e.g. Kola
the water resources will decrease as wel .
and Northern Dvina rivers. The impact is local and not relevant for the
region in general. There are hotspots of eutrophication in the estuarine
Efforts aimed at technical re-equipment of industries wil facilitate
zone of the Kola River, but no records of eutrophication of the Barents
a reduction of pol ution. For example, pol ution of water resources
Sea. As for suspended solids, no significant increased turbidity of waters
in the Arkhangelsk Region and Karelia from enterprises of the pulp
within the region has been observed. Thermal pol ution is localised and
and paper and mining and processing industries is not predicted to
mainly observed in the area of the Kola Nuclear Power Station.
34
GIWA REGIONAL ASSESSMENT 11 BARENTS SEA
ASSESSMENT
35
Chemical
(Table 18). As a whole, their concentrations are less than the maximum
The coastal areas of the Barents Sea are most exposed to anthropogenic
al owable concentration (Table 17) and the concentration is also low in
activities. However, even in coastal areas, the levels of chemical pol utants
bottom sediments. The levels of trace elements in the area considered,
are general y lower than the Russian water quality guidelines (Maximum
probably depend on atmospheric precipitation and advection with
Allowable Concentration, MAC) and the Norwegian Pollution Control
Atlantic waters.
Authority (SFT) environmental quality assessment criteria (Molvaer et al.
1997) and lower than in other parts of Russia or European seas. The Kola
According to Sevgidromet (1992), average concentrations of -HCH
Bay, with its high contamination load, is an exception and annual studies
and -HCH in 1991 were 0.0004 µg/l and 0.002 µg/l respectively in the
of its waters and bottom sediments reveal high levels of pol utants. The
open part of the Barents Sea (Table 19). During subsequent years, HCH
Kola Bay ecosystem has not experienced any considerable changes
concentrations in the Barents Sea waters were significantly lower.
recently, and in some areas the situation is close to critical. The southern
and to a lesser degree the central parts of the bay are the most pol uted.
DDT concentrations in the central Barents Sea bottom sediments are
Pol utants entering the Barents Sea with river run-off only have a slight
shown in Table 19. The maximum concentration has been registered
impact on the ecosystem since the river run-off is low.
in the area of the Stockman gas-condensate deposit (Matishov &
Nikitin 1997).
The data available on pol ution levels in the abiotic and biotic
components of the White Sea ecosystem show a moderate level of
HCH concentrations in the bottom sediments of the central area are
contamination. Increased levels of some chlorine organic mpounds
not high (Table 19) and the maximum concentrations are mainly found
are found in different abiotic and biotic components. In general
in shal ow water areas. The HCH isomer lindane is found in many areas
however, the anthropogenic impact on the ecosystems of the White
and constitutes 49% or more of the sum of three HCH isomers (Matishov
Sea is comparatively low as wel . The only exceptions are the areas of
& Nikitin 1997).
Kandalaksha and Dvina bays. They are heavily pol uted by untreated
sewage from a number of rivers, especial y from the Severnaya Dvina,
PCB levels in bottom sediments of the Barents Sea central area are less
delivering about 90% of all the pollutants entering the White Sea.
than 0.0005 µg/g (Matishov & Nikitin 1997, Loring et al. 1995, Klungsřyr
et al. 1995). Thus, the levels of chlorinated hydrocarbons in the water
Atmospheric pollution
and the surface layer of bottom sediments in the Barents Sea central
Measurements of contaminants over the Barents Sea open water
part can be characterised as background values.
area are few. Murmansk Marine Biological Institute (MMBI) carried out
measurements of heavy metals in 2001 (see Table 18). The levels are the
On average, the level of oil contamination in seawater is not high
same as for the West European sector of the Arctic and one order lower
and does not exceed MAC (0.05 mg/l). In the western areas the
than in background areas (areas located significantly far from emission
average long-term concentration of oil products is somewhat higher
sources) in the European part of Russia.
(0.030 mg/l) than in the eastern areas (0.026 mg/l). PAH levels in the
Barents Sea bottom sediments are relatively low and average 0.11 mg/g
Persistent organic pol utants (POPs), including organochlorine pesticides
(Matishov & Nikitin 1997, Loring et al. 1995, Klungsřyr et al. 1995).
(OCPs), polychlorinated biphenyls (PCBs) and polycyclic aromatic
pol utants (PAHs), are present in concentrations typical of background
Kola Bay
areas in northern and western Europe. Average concentrations are
In the Kola Bay the concentration of most trace elements in the water are
estimated at 0.060 ng/m3 for OCPs, 0.037 ng/m3 for PB, and 0.002 g/m3
low (Table 18) and less than MAC (Il in & Dahle 1997). The only exception
for benzo(a)pyrene, being an indicator-substance for PAH.
is copper and mercury. Maximum mercury levels, 2 orders higher than
MAC, has been registered in the central part of the bay (42 µg/l). However,
Due to low levels of contaminants in the atmosphere, their contribution
in the southern and northern parts of the bay mercury concentrations
to the Barents Sea pollution is low.
are significantly lower (down to 0.026 µg/l). In the same investigation,
copper levels were found to vary within the range 0.4-25 µg/l, exceeding
Barents Sea open waters
MAC on occasion. In the Kola Bay waters the levels of -HCH and -HCH
According to the MMBI data from the open part of the Barents Sea,
varied from 0.0013-0.0017 µg/l in the 1990s and from 0-0.0012 µg/l in
the levels of trace elements, including heavy metals in water, are low
1991 (Aibulatov 2001), which is less than MAC.
36
GIWA REGIONAL ASSESSMENT 11 BARENTS SEA
ASSESSMENT
37
Table 18 Concentration of heavy metals in the Barents Sea region.
Cadmium
Copper
Nickel
Lead
Zinc
Cobalt
Chromium
Mercury
Arsenic
Barents Sea, atmospheric pol ution over open water (ng/m3)
0.022
4.0
0.28
0.15
2.3
0.16
0.34
0.67
ND
Barents Sea, open water (µg/l)
0.03
0.66
0.83
0.51
ND
0.1
ND
ND
ND
Kola Bay, bottom sediments (µg/l dw)
0.1-0.2
4.2-5.9
5.1-12.4
16.5-20.5
ND
ND
ND
ND
ND
Kola Bay, coastal waters (µg/l)
0.01-0.06
0.4-25
0.3-1.6
0.65-1.1
ND
ND
13-59
0.026-42
ND
Kola Bay, ports of Murmansk and Severomorsk (µg/g dw)
0.06-0.2
9.5-26.2
3.15-23
5.5-45.0
ND
ND
20.8-64.9
ND
ND
Kola Peninsula, near-shore bottom sediments (µg/g dw)
0.04-0.05
2.3-3.1
3-3.4
8.3-10.2
ND
ND
3-3.4
0.007
ND
Pechora Sea, open water (mg/g dw)
0.0-0.2
1.1-7.3
3.6-13.7
1.2-3.7
ND
ND
20.0-93.6
0.0-0.08
ND
White Sea, bottom sediment (mg/l)
ND
0.5-15.9
1.6-34.1
1.9-63
ND
0.7-19.9
1.2-17.1
0.04-0.1
ND
Kola Peninsula, sea algae (mg/kg dw)
ND
32-36
ND
ND
ND
ND
ND
0.3-0.4
7-8
Kola Peninsula, benthos invertebrates (mg/kg dw)
24
66
ND
ND
ND
ND
ND
ND
ND
Note: dw = dry weight, ND = No Data.
(Source: APN 2003, Sevigdromet 1992, 1996, Aibulator 2001, Matishov & Nikitin 1997, Loring et al. 1995, Klunsřyr et al. 1995, Illin & Dahle 1997, measurements by the Murmansk Marine Biological Institute 2001)
Table 19 Concentration of organic pollutants in the Barents Sea region.
-HCH
-HCH
HCH
DDT
PCB
PAH
DDE
DDD
Barents Sea, open water (µg/l)
0.0004
0.002
ND
ND
ND
ND
ND
ND
Barents Sea, bottom sediments (µg/g)
ND
ND
0.003
0.0032
0.0005
110
ND
ND
Kola Bay, bottom sediments (µg/g dw)
0.12-0.52
0.43-0.92
ND
1.9-9.1
1.02-15.7
ND
ND
ND
Kola Peninsula, near-shore waters (µg/l)
0.3-0.5
0.2-0.4
ND
0.001
0.02-0.05
ND
ND
ND
Pechenga Bay, bottom sediments (mg/g dw)
ND
ND
0.05-0.68
0.27-36.7
1.11-37.9
ND
ND
ND
Pechora Sea, open water (µg/l)
0.6-2.2
0.6-2.0
ND
0.11-0.54
ND
ND
0.03-0.032
0.05-0.39
Pechora Sea, bottom sediments (µg/g)
0.58
0.00028
ND
ND
ND
ND
ND
ND
White Sea (Aibulatov 2001) (µg/l)
0.5-10
0.3-12
ND
3
ND
ND
ND
ND
Kola Peninsula, red king crab muscle (ng/g ww)
ND
ND
0.6-3.2
0.06-0.25
0.6-32.2
ND
ND
ND
Note: dw = dry weight, ww = wet weight, ND = No Data.
(Source: APN 2003, Sevigdromet 1992, 1996, Aibulator 2001, Matishov & Nikitin 1997, Loring et al. 1995, Klunsřyr et al. 1995, Illin & Dahle 1997, measurements by the Murmansk Marine Biological Institute 2001)
The distribution of trace metals in bottom sediments is characterised by
bottom sediments, however there is an indication on elevated
a marked tendency towards decreased concentrations in the direction
toxaphene and brominated flame retardant levels in some areas of the
from south to north. The water areas adjacent to the port of Murmansk
Kola Bay (Savinova et al. 2000). More detailed studies are needed on
and the port centre of Severomorsk are the territories of extremely high
sources and levels of these contaminants within the study area.
accumulation levels of practical y all metals (Table 18).
Kola Peninsula near-shore area (Fennoscandia)
Investigations of POPs in the Kola Bay bottom sediments were carried
Concentrations of trace metals in bottom sediments along the coast
out in 1999 (Table 19). The highest PCB levels were observed in the
are of uniform character (Table 18), and are considerably lower than
area of the town of Zapolyarny; 1.65-8.7 µg/g dw (dry weight). At
the values for the Kola Bay. There are practical y no data on POP levels
present, the bottom sediments themselves are likely a source of
in the Kola Peninsula near-shore waters. According to APN (2003) all
water pol ution. The levels of oil hydrocarbons in bottom sediments
levels of -HCH and -HCH, DDT and PCB were 1-2 orders lower than
vary within the range of 80 mg/g dw (the northern part of the
MAC (Table 19).
Kola Bay) to 1 280 mg/g dw (the southern part of the Kola Bay)
(Sevgidromet 1992).
According to Aibulatov (2001), water pol ution with organochlorine
pesticides in the Motovsky and Teribersky bays was as a whole
PAH concentrations in sediments also decrease from south t north,
insignificant during the past five years. In the bottom sediments of the
reaching the highest values in the area of the city of Murmansk
above-mentioned areas, -HCH and -HCH levels in 1992-1993 were
(9 µg/g) and in the Severomorsk area (10.8 µg/g) (APN 2003). Only
0.3-0.4 mg/g dw. POP levels in the Pechenga Bay bottom sediments in
limited information exists on so-cal ed "new" POP compounds in
1997 is shown in Table 19.
36
GIWA REGIONAL ASSESSMENT 11 BARENTS SEA
ASSESSMENT
37
The concentration of oil hydrocarbons in the Kola Bay coastal waters
levels are observed in the Dvina Bay (Table 19) but are stil less than MAC.
is low (0.05-0.06 mg/l). The highest level of pol ution for the waters
The concentrations of DDT and its metabolites are also observed in low
of Motovsky and Teribersky bays was observed in the 1980s reaching
levels (Table 19) (Aibulatov 2001). In bottom sediments, organochlorine
0.61 mg/l (Aibulatov 2001).
pesticides of the DDT family prevail due to their greater persistence
(Aibulatov 2001).
PAH concentrations in the Guba Pechenga surface sediments vary in
the range 428-3 257 ng/g dw, which is considerably higher than in the
In the central part of the Sea, in Onega and Mezen bays, the levels of
adjacent areas Guba Bol'shaya Volokovaya, Guba Malaya Volokovaya,
oil hydrocarbons in seawater are on average lower than or equal the
and Varangerord, where PAH levels vary between 151-442 ng/g dw
MAC level (0.01-0.05 mg/l). In areas adjacent to the Kandalaksha Bay
(Savinov et al. 2003a).
and Mezen Bay, the concentration of oil hydrocarbons are higher and
may reach 1.5-5 MAC. In the water area of the port of Kandalaksha, oil
The Pechora Sea
hydrocarbon concentrations are observed at levels of 0.1-0.26 mg/l.
The Pechora Sea water masses are characterised by pol utant
Dvina Bay is the most pol uted; the levels here may reach 0.3 mg/l
concentrations that are one order lower than MAC, except for
(Aibulatov 2001). The highest concentrations of oil hydrocarbons
copper (3.9 mg/l). Concentrations of trace elements in bottom
are observed in bottom sediments of the Dvina and Kandalaksha
sediments are also lower than the values characteristic of the Kola Bay
bays (0.20-0.29 and 0.15-0.17 mg/g dw, respectively) (Sapozhnikov &
(Table 18). POP levels in the Pechora Sea in 1995 is shown in Table 19
Sokolova 1994). PAH concentrations in the White Sea bottom sediments
(Sevgidromet 1996).
are 2-3 times lower compared to the northwestern and southeastern
parts of the Barents Sea, but are comparable to the levels reported for
DDT concentrations in bottom sediments is also shown in Table 19.
sediments from the Pechora Sea (Savinov et al. 2000).
The highest concentrations of this pol utant (0.0019 and 0.001 mg/g)
have been registered in the shal ow water areas between the Island
Finnmark
of Vaigach and the Island of Dolgy, and in the central Pechora Sea
Levels of PAHs and trace elements in bottom harbour sediments
(0.001 mg/g). The total HCH levels in bottom sediments vary within
col ected in 1994 in Finnmark show, according to the Norwegian
the range 0.08-0.84, averaging 0.28 ng/g, which is one order lower than
Pollution Control Authority (SFT) classification (Table 20) (Molvaer et al.
the values for the Barents Sea central part (1.53-5.18 ng/g).
1997), "background" and "moderate" contamination, except at Vardř,
where "strong" contamination was found (Konieczny 1996).
Chlorinated hydrocarbons in the Pechora Sea bottom sediments is low
even compared with relatively clean bottom sediments of the Barents
POP and trace element levels in bottom sediments from Finnmark
Sea. The most contaminated area is to the southwest of the Island of
have been studied in Varangerord during the Joint Assessment
Vaigach (silty-sandy character of the sediments) and the central Pechora
and Monitoring Program (JAMP) (Green 1997, 1999). A comparative
Sea (grey clay, silt).
study was conducted on POP levels in sediments from harbours
in northern Norway and Northwest Russia (Dahle et al. 2000). The
In 1999, according to the hydrometeorology data service, the average
highest concentrations of PCB were found in the harbours of Harstad,
oil hydrocarbon level in the Pechora Sea surface waters was 0.04 mg/l.
Hammerfest and near Severomorsk. Al those harbours had elevated
In the Pechora Bay the concentration of oil hydrocarbons increased
DDT and PCB levels, and, according to SFT classification (Table 20)
up to 0.66 mg/l while in bottom sediments the level was on average
were classified as "marked". In contrast, PCB levels in Finnmark show
23.7 mg/g dw.
mainly background levels (Green 1997, 1999).
The White Sea
Levels of POPs in blue mussels and fish from the Varangerord area
The analysis of the heavy metal content in bottom sediments carried
studied in the frame of JAMP were low and a tendency for decreasing
out by Aibulatov (2001) suggests low levels of contaminants in the
levels of DDT and PCB was observed. The results confirmed that POP
White Sea (Table 18).
and trace element levels in commercial fish from the coastal areas of
northern Norway were below the safety threshold levels for human
Most of the organochlorine pesticides enter the White Sea with river
consumption (Table 21).
run-off, the rest from the atmosphere. The highest -HCH and -HCH
38
GIWA REGIONAL ASSESSMENT 11 BARENTS SEA
ASSESSMENT
39
Table 20 The Norwegian Pollution Control Authority (SFT)
Table 21 The Norwegian Pollution Control Authority (SFT)
classification of environmental quality: contaminants in
classification of environmental quality: contaminants in
marine bottom sediments.
blue mussels.
Marine bottom sediments (upper limit for classes I-V)
Blue mussels (upper limit for classes I-V)
Contaminant
Contaminant
I:
II:
III:
IV:
V: Very
I:
II:
III:
IV:
V: Very
Background Moderate
Marked
Strong
strong
Background Moderately
Markedly
Strongly
strongly
Arsenic (As) (mg/kg dw)
<20
20-80
80-400
400-1 000
>1 000
Arsenic (As) (mg/kg dw)
<10
10-30
300-100
100-200
>200
Lead (Pb) (mg/kg dw)
<30
30-120
120-600
600-1 500
>1 500
Lead (Pb, mg/kg dw)
<3
3-15
15-40
40-100
>100
Cadmium (Cd) (mg/kg dw)
<0.25
0.25-1
1-5
5-10
>10
Cadmium (Cd) (mg/kg dw)
<2
2-5
5-20
20-40
>40
Copper (Cu) (mg/kg dw)
<35
35-150
150-700
700-1 500
>1 500
Copper (Cu) (mg/kg dw)
<10
10-30
30-100
100-200
>200
Chromium (Cr) (mg/kg dw)
<70
70-300
300-1 500
1 500-5 000
>5 000
Chromium (Cr) (mg/kg dw)
<3
3-10
10-30
30-60
>60
Mercury (Hg) (mg/kg dw)
<0.15
0.15-0.6
0.6-3
3-5
>5
Mercury (Hg) (mg/kg dw)
<0.2
0.2-0.5
0.5-1.5
1.5-4
>4
Nickel (Ni) (mg/kg dw)
<30
30-130
130-600
600-1 500
>1 500
Nickel (Ni) (mg/kg dw)
<5
5-20
20-50
50-100
>100
Zinc (Zn) (mg/kg dw)
<150
150-700
700-3 000
3 000-10 000
>10 000
Zinc (Zn) (mg/kg dw)
<200
200-400
400-1 000
1 000-2 500
>2 500
TBT (µg/kg dw)
<1
1-5
5-20
20-100
>100
PAH (µg/kg ww)
<50
50-200
200-2 000
2 000-5 000
>5 000
PAH (µg/kg ww)
<300
300-2 000
2 000-6 000
6 000-20 000
>20 000
B(a)P (µg/kg ww)
<1
1-3
3-10
10-30
>30
B(a)P (µg/kg ww)
<10
10-50
50-200
200-500
>500
DDT (µg/kg ww)
<2
2-5
5-10
10-30
>30
PCB-7 (µg/kg ww)
<5
5-25
25-100
100-300
>300
HCB (µg/kg ww)
<0.1
0.1-0.3
0.3-1
1-5
>5
HCB (µg/kg ww)
<0.5
0.5-2.5
2.5-10
10-50
>50
HCH (µg/kg ww)
<1
1-3
3-10
10-30
>30
DDT (µg/kg ww)
<0.5
0.5-2.5
2.5-10
10-50
>50
PCB-7 (µg/kg ww)
<4
4-15
15-40
40-100
>100
TE
(ng/kg ww)
<0.01
0.01-0.03
0.03-0.10
0.10-0.5
>0.5
TE
(ng/kg ww)
<0.2
0.2-0.5
0.5-1.5
1.5-3
>3
PCDF/D
PCDF/D
(Source: Molvaer et al. 1997)
(Source: Molvaer et al. 1997)
Biota contamination
Table 22 Average annual concentrations of trace elements in the
Levels of trace elements in the sea algae Laminaria saccharina,
tissues of the most important commercial fish species
of the Barents Sea in 2000.
Ascophyllum nodosum and Fucus vesiculosus in the Kola Peninsula near-
Lead
Copper
Cadmiumn
Mercury
Zinc
Arsenic
shore zone are less than MAC (Table 18). The highest concentrations are
Species
(mg/g dw)
(mg/g dw)
(mg/g dw)
(mg/g dw)
(mg/g dw)
(mg/g dw)
observed for mercury, arsenic and copper.
Cod
0.2±0.01
0.72±0.05 0.03±0.003 0.03±0.002
3.7±0.2
0.2±0.03
Haddock
0.2±0.02
0.8±0.1
0.02±0.002 0.03±0.004
4.1±0.3
0.3±0.05
Concentrations of microelements in benthic invertebrates (Gammarus
American plaice
0.2±0.03
0.7±0.03
0.02±0.002 0.02±0.002
3.5±0.2
0.2±0.01
oceanicus, Littorina rudis, Nucella lapillus, Mytilus edulis, Arenicola marina)
Plaice
0.2±0.03
0.8±0.05
0.02±0.004
0.02±0.1
4.5±0.6
0.2±0.1
from the Kola Peninsula near-shore areas are considerably lower than
Perch
0.2±0.01
1.0±0.06
0.02±0.001 0.03±0.002
3.9±0.2
0.2±0.03
MAC for lead and zinc, but close to the MAC level and higher for copper
Herring
0.2±0.01
1.0±0.03
0.02±0.002 0.03±0.002
5.2±0.2
0.4±0.02
and cadmium. The concentrations of the latter might reach 66 and
24 mg/kg dw respectively. The levels of accumulation of heavy metals
Coalfish
0.9±0.09
0.2±0.03
0.02±0.006 0.03±0.005
3.9±0.4
0.4±0.02
in the Red king crab muscles from the Kola and Motovsky bays have low
Halibut
0.2±0.02
0.9±0.2
0.02±0.02
0.04±0.1
3.0±0.3
0.3±0.02
values as wel , about one order lower than MAC.
Capelin
0.1±0.2
0.8±0.1
0.02±0.003 0.03±0.004
5.4±0.5
0.3±0.04
Mackerel
0.1±0.02
0.9±0.06
0.02±0.002 0.03±0.002
5.2±0.3
0.3±0.03
The data on the levels of trace elements in muscles of fish species are
Spiny skate
0.3±0.06
1.02±0.09 0.02±0.007
0.13±0.04
0.5±0.3
ND
presented in Table 22. The highest concentrations are registered for zinc.
Note: ND = No Data. (Source: SRW/MMBI 2000)
Nickel, cobalt and chromium levels are lower than the detection limit
of the applied analysis techniques. Lead, cadmium and mercury levels
In 2000, the total content of hexachlorcyclohexan isomers in muscles of
varied within a very narrow range and correspond to a greater degree
commercial fish species varied from 0.1 to 0.68 ng/g fresh weight; DDT
to the natural background level.
and its metabolites from 0.3 to 5.86 ng/g fresh weight; polychlorinated
biphenyls from 0.3 to 5.7 ng/g fresh weight and did not exceed
According to the MMBI and APN (2003), DDT, HCH and PCB levels
the al owable levels for unprocessed and processed food products
in Red king crab muscles from the Kola Peninsula near-shore areas vary
(SRW/MMBI 2000). Spiny skate was characterised by relatively high
within the fol owing ranges: 0.06-0.25 ng/g ww, 0.6-3.2 ng/g ww, 0.6-
OCPs (organochlorine pesticides) and PCB contents (36.7±5.4 and
32.2 ng/g ww respectively.
98±39 ng/g respectively).
38
GIWA REGIONAL ASSESSMENT 11 BARENTS SEA
ASSESSMENT
39
Higher levels of contaminants were detected in higher trophic levels
the Novaya Zemlya: Chernaya and Sul'meneva bays and Matochkin
such as seabirds, marine mammals and polar bears, since pol utants
Shar Strait, and later the Chernobyl accident in Ukraine. To assess
accumulate via food-web transport (Muir et al. 2003, Savinov et al.
the levels of artificial radionuclide fal out on the Barents Sea surface,
2003).
the Roshydromet data has been used (Sevgidromet 1996, Murmansk
Region Directorate of Natural Resources and Environmental Protection
Solid waste
2001, Makhon'ko 1987-1995). The values of atmospheric fal out in the
Observations of the Barents Sea show that the areas of South-Svalbard
Roshydromet's Annual-books are presented as the average over the
and Sřrkapp Currents, the northern branch of the Nordkapp Current,
Russian Polar North i.e. Murmansk, Norilsk, Nar'yan-Mar, Dixon, Khanty-
the Bear, and the southern branch of the Nordkapp Currents are
Mansijsk, Turukhansk, Amderma, Salekhard, and Kandalaksha.
the most pol uted areas in the northwest. Due to the fact that the
polar front in these areas is distinctly expressed in the surface layers,
A temporal analysis of the atmospheric fal out of artificial radionuclides
pol utants concentrate along the frontal zone, forming long drawn-
shows that maximum atmospheric fal out of radionuclides was
out plait stripes, which at times are traced by clots of foam. They are
observed in 1986 connected with the Chernobyl accident (Table 23)
mainly composed of timber and ligneous wastes as well as municipal
(Namyatov 1998). In 1987 atmospheric fal out of artificial radionuclides
waste of various origin.
abruptly decreased compared to the previous year. Since 1987 a stable
decrease has been observed, both in the region in general and onto
In the central Barents Sea, the zone of intensive pol ution is also
the Kola Bay surface in particular (Namyatov 1998).
conditioned by the character of circulation and is located in the frontal
zone between the central branch of Nordkapp Current and the Central
Table 23 Artificial radionuclide fallout over the Russian Polar
North and on the Kola Bay surface.
Current. Here, like in the northwest, the waste is mainly composed of
timber and municipal waste. The southwestern part is also polluted by
Nuclide
1986
1987
1988
1990
1991
1992
1993
timber and other waste.
Russian Polar North (107 Bq/km2 /year)
137Cs
15.355
0.407
0.268
0.246
0.150
0.228
0.208
Radionuclide
90Sr
1.306
0.814
0.692
0.029
0.0376
0.0786
0.0702
The main sources of artificial radionuclides into the Barents Sea are
239.240Pu
ND
ND
0.0070
0.006
0.0039
0.0059
0.0054
atmospheric fal out, river transport, discharges from West European
134Cs
7.692
0.141
0.085
ND
ND
ND
ND
nuclear reprocessing plants entering the region with the Gulf Stream,
144Ce
0.851
0.248
0.013
ND
ND
ND
ND
discharges of liquid radioactive waste from sources located on the
106Ru
7.015
0.127
0.100
ND
ND
ND
ND
Kola Peninsula, as wel as accidents causing the release of artificial
Tritium
256.0
247.9
333.0
115.81
164.4
200.4
178.3
radionuclides.
Kola Bay surface (109 Bq/year)
137Cs
32.921
0.872
0.575
0.527
0.322
0.489
0.446
Among the radionuclides entering the atmosphere as a result of
90Sr
2.800
1.745
1.484
0.062
0.081
0.169
0.151
nuclear and thermonuclear explosions, plutonium-239, strontium-
239.240Pu
ND
ND
0.015
0.014
0.008
0.013
0.012
90, cesium-137, iodine-131, cobalt-60 and carbon-14 are particularly
134Cs
16.492
0.302
0.182
ND
ND
ND
ND
dangerous (Matishov et al. 1994). The majority of these radionuclides
144Ce
1.825
0.532
0.028
ND
ND
ND
ND
are transported into the oceans via complex physical, chemical and
106Ru
15.040
0.272
0.214
ND
ND
ND
ND
biological pathways.
Notes: ND = No data. The Russian Polar North: Murmansk, Norilsk, Nar'yan-Mar, Dixon, Khanty-
Mansijsk, Turukhansk, Amderma, Salekhard, and Kandalaksha. (Source: compiled by Namyatov 1998)
The condition in Kola Bay has attracted increased attention as a
River run-off
possible source of chemical and radioactive pol ution of the Barents
The Kola Bay water catchment area is 27 720 km2. Unfortunately, there
Sea. Therefore, an assessment of the ecological state of the region
are no studies devoted to investigations of radioactive contamination of
should be carried out in this coastal area.
the rivers on the Kola Peninsula. Therefore, data presenting the average
content of cesium-137, strontium-90 and tritium in the Nordic rivers is
Global atmospheric fallout
used (the Onega, the Severnaya Dvina, and the Pechora) (Makhon'ko
The main source of artificial radionuclides into the atmosphere was
1987-1995, Cheluykanov & Savel'ev 1992) (Tables 24 and 25). It is assumed
nuclear weapons tests in the 1950s and 1960s at three polygons of
that the contamination level of these rivers is comparable to that of
40
GIWA REGIONAL ASSESSMENT 11 BARENTS SEA
ASSESSMENT
41
Table 24 Strontium and cesium in the Onega, Severnaya Dvina,
towns of Murmansk, Severomorsk, Polyarny, and Gadjievo, as wel as
and Pechora rivers.
Sayda, Olenya, Pala, Zapadnaya Litsa, Ura and Ara bays (Figure 14).
River
1961
1962
1963
1964
1965
1966
1967-1985
1986
1987-1989
90Sr (Bq/m3)
Before 1986, all liquid radioactive waste (LRW) from the Northern Navy
Onega
ND
29.6
118.4
125.8
114.7
81.4
22.2-55.5
14.8
11.1-14.8
and the Repairing Technological Enterprise (RTE) ATOMFLOT1 was
Severnaya 11.1 29.6
ND
103.6
44.4
40.7
18.5-48.1
18.5
18.8
transported to the Barents Sea and discharged there. Reprocessing
Dvina
(purification) of liquid radioactive waste at ATOMFLOT has been carried
Pechora
22.2
25.9
62.9
37.0
44.4
51.8
62.9
7.4
11.1
out since 1989. The purification of liquid radioactive waste is intended
Average
16.7
28.4
90.6
88.8
67.8
58.0
34.5
13.6
14.0
for reprocessing waste from the Civil Atomic Fleet2 vessels and the
137Cs (Bq/m3)
sites of special production at ATOMFLOT. Waste with a total specific
Average
ND
ND
ND
ND
31.2
26.7
10.4
2.7
2.8
ND = No Data. (Source: compiled by Namyatov 1998)
beta activity of not more than 11.1105 Bq/l to the level of 37 Bq/l is
reprocessed by the sorption method, with subsequent dilution into
Table 25 Tritium in the Severnaya Dvina and Pechora rivers.
the system of industrial and municipal sewage to the level of 3.7-11 Bq/l
River
1981-1985
1986
1987
1989
1990
1991
1992
1993
before discharge. Nowadays, all liquid radioactive waste coming from
Tritium (Bq/m3)
atomic icebreakers and some supporting vessels of the Northern Navy
Severnaya
5 809
4 958
5 106
3 182
3 922
3 200
3 500
2 600
ships, is processed at the ATOMFLOT instal ation. Table 26 presents data
Dvina
Pechora
7 918
4 477
5 328
4 338
2 960
4 500
4 300
3 600
on the input of artificial radionuclides after the liquid radioactive waste
Average
6 864
4 718
5 217
3 760
3 441
3 850
3 900
3 100
purification facility was put into operation.
ND = No Data. (Source: compiled by Namyatov 1998)
A major source of pol ution by 137s and 90Sr in the Kola Bay is discharges
the rivers of Kola Peninsula. Such an assumption is justified by the
from the RTE ATOMFLOT. During 1992, the annual discharge of these
absence of any publications showing abnormal contents of artificial
nuclides was the greatest; 2.1108 and 2.6107 Bq/year, respectively.
radionuclides in the soils of the water catchment area of these rivers or
During the period 1989-1994, the average annual discharges were
in the soils of the Kola Peninsula river catchment areas.
1.6107 and 7.6107 Bq/year respectively (see Table 26).
The data on the 90Sr concentrations are taken from Cheluykanov and
Table 26
Total input of artificial radionuclides since the instal ation
of the LRW purification facility at RTE ATOMFLOT.
Savel'ev (1992). Measurements of 137Cs in rivers were found to be very
rare (Bochkov et al. 1983, Makhon'ko et al. 1977, Kolvulehto et al. 1980,
Nuclide
Year
Total
Nuclide/
(1989- Average 137
Salo & Voipio 1972); a summary of available results was presented in
(106 Bq/year)
Cs
1994)
1989
1990
1991
1992
1993
1994
Bochkov et al. (1983). Based on these values, the 137Cs and 90Sr transport
90Sr
7.4
5.6
2.5
26.3
15.5
37.0
94.0
15.7
0.21
into the Kola Bay with the river run-off from the catchment area was
137Cs
20.7
31.1
5.56
208.7
94.0
97.3
457.0
76.2
1
calculated as 2.6×10¹⁰ and 1.3×10¹¹ Bq/year respectively.
134Cs
6.3
9.2
3.3
62.8
31.5
27.0
139.1
23.2
0.30
125Sb
28.1
39.2
26.6
185.0
92.1
40.7
411.8
68.6
0.90
Discharge of liquid radioactive waste from sources located on
60Co
31.8
44.4
10.0
130.2
72.2
81.0
369.6
61.6
0.81
the Kola Peninsula
154Eu
47.0
65.1
40.0
160.6
139.5
84.4
536.9
89.5
1.18
The main potential sources of radioactive pollution in the region are:
152
Nuclear submarine bases;
Eu
20.0
27.8
18.1
105.0
79.2
50.3
299.3
50.0
0.65
Ship-repairing yards for nuclear submarines;
95Zr
10.7
12.6
5.2
35.5
51.4
30.3
147.6
24.6
0.32
Civil enterprises, where civil vessels with nuclear energy instal ations
95Nb
9.2
12.5
5.2
30.3
22.6
17.0
96.9
16.2
0.21
are based, repaired and maintained;
54Mn
10.4
14.1
10.4
34.4
25.5
22.9
117.7
19.2
0.26
Sites for temporary storage of radioactive waste and spent nuclear
144Ce
25.9
29.6
35.9
159.8
130.9
81.0
463.2
77.2
1.01
fuel.
58Co
9.6
13.3
8.1
32.6
27.8
16.3
107.7
18.0
0.24
106Ru
81.4
111.0
46.6
270.8
199.4
115.8
825.1
137.5
1.82
In total, there are 10 sites with radioactively dangerous objects in the
103Ru
6.3
8.5
5.2
20.4
22.9
12.6
77.7
13.0
0.17
water and at the coast of the Kola and Motovsky bays. These are the
(Source: Matishov 1997)
1 The Repairing and Technological Enterprise ATOMFLOT is a treatment facility for radioactive waste as well as a permanent base for the nuclear-powered ships of the Civilian Atomic Fleet.
2The Civilian Atomic Fleet is controlled by the Ministry of Transport of the Russian Federation and the ships of the Fleet are federal property. The ships are exploited by the Murmansk Shipping Company
on a treaty between the Company and the Murmansk Region Committee for the Control of the State Property.
40
GIWA REGIONAL ASSESSMENT 11 BARENTS SEA
ASSESSMENT
41
32°E
33°E
0
50 Kilometres
Ribachy Peninsula
4.7
Zapadnya Litsa Bay
Ara Bay
8.0
Nuclear submarine base
Nuclear submarine base
The naval shipyard
12.30
Storage of radioactive liquid waste
Storage of radioactive solid waste
2.70
69°30'N
-
37.54
6.50
5.70
-
-
-
-
4.9
27.60
Ara Bay
Ura Bay
4.81
Ura Bay
11.98
Nuclear submarine base
1.76
3.10
Gadjievo
Sayda Bay
Nuclear submarine base
Nuclear submarine base
Storage of radioactive liquid waste
Storage of radioactive liquid waste
Storage of radioactive solid waste
Storage of radioactive solid waste
22.70
Olenja Bay
19.10
Nuclear submarine base
Pala
Pala Bay
Polyarny
2.10
Naval shipyard
Storage of radioactive liquid waste
Storage of radioactive solid waste
Polyarny
Surface sediments
Nuclear submarine base
(Bq/kg, dw)
ATOMFLOT - Nuclear ice-breaker base
137
Storage of radioactive liquid waste
Cs
Severomorsk Marine Base
60
Storage of radioactive solid waste
Co
Intermediate storage for unused and used fuel assemblies
Kola Bay
241Am
Severomorsk
Processing of radioactive liquid waste
Water
The Naval shipyard of "Sevmorput"
(Bq/m3)
Murmansk
Storage of radioactive liquid waste
137
69°N
Cs
Storage of radioactive solid waste
© GIWA 2004
Figure 14 Location of the sources of radioactive contamination on the coast of Kola and Motovsky bays.
(Source: MMBI expedition data in May-June 1996)
Input from Western European reprocessing facilities
Table 27 Artificial radionuclide concentrations measured in the
via the Gulf Stream
Kola Bay.
Data shows that artificial radionuclide discharges into the marine
Depth
Average
Nuclide
0 m
100 m
280 m
environment from the enterprises located in Western Europe, such as
1982
1992
1982
1992
1982
1982
1992
Sel afield in the UK and La Hague in France, are transported northeast-
137Cs (Bq/m3)
33
5.1
28
4.4
22
27
4.8
wards with warm Atlantic waters and reach the Barents, White and Kara
90Sr (Bq/m3)
10
4.2
10
3.6
6
8.6
3.9
seas. Sel afield has been a major source of artificial radionuclides into
99Tc (10-3 Bq/m3)
ND
144
ND
ND
ND
ND
144
the Irish Sea during the past years and consequently into the entire
238Pu (10-3 Bq/m3)
ND
0.2
ND
ND
ND
ND
0.2
basin of the Arctic Ocean (Joint Norwegian-Russian Expert Group 1992,
239/240Pu (10-3 Bq/m3)
ND
7.5
ND
11.5
ND
ND
9.5
Vakulovsky et al. 1993, Vakulovsky et al. 1985). However, for the Barents
241Am (10-3 Bq/m3)
ND
0.7
ND
0.2
ND
ND
0.45
Sea the input from Sel afield is much lower.
134Cs (Bq/m3)
0.7
ND
0.6
ND
0.5
0.6
ND
Note: ND = No Data. (Source: Namyatov 1998)
Radioactive contamination of the Barents Sea
The most wel known investigations of artificial radionuclides in
The data presented show that between 1982 and 1992, artificial
seawater in the immediate vicinity of the Kola Bay were carried out
radionuclide inputs into the Barents Sea waters decreased almost
in 1982 by the specialists working at the SPA Typhoon (Vakulovsky et
6-fold. This is explained first of al by the fact that the discharges of
al. 1985) and in 1992 within the framework of the Russian-Norwegian
liquid radioactive waste at the enterprises in Sel afield and La Hague
joint expedition (Joint Norwegian-Russian Expert Group 1992). The
decreased (Commission of the European Community 1990). Besides the
measured concentrations in seawater during these expeditions at the
above nuclides, the seawater contains tritium. Unfortunately, there are
station located closest to the Kola Bay are presented in Table 27.
very few publications devoted to tritium in the Barents Sea.
42
GIWA REGIONAL ASSESSMENT 11 BARENTS SEA
ASSESSMENT
43
In the 1990s concentrations of artificial nuclides in seawater were
guillemot (0.43 Bq/kg); Little auk (0.4-1.1 Bq/kg); Black-headed gul (about
relatively low. The levels of 137Cs varied within the range 2-15 Bq/m3,
1 Bq/kg); Eider (0.1-3.3 Bq/kg); Kittiwake (0.5-3.3 Bq/kg); Glaucous gull
90Sr 1-7 Bq/m3 and 239.240Pu 4-8 Bq/m3, which is consistent with the
(2.4-5.6 Bq/kg); and Great skua (3-4 Bq/kg) (Matishov & Matishov 2001).
global radioactive background (Matishov & Matishov 2001). In general,
Such regularity is conditioned by both the composition of the birds'
137Cs levels in surface waters have decreased by more than 1 order of
diet and the place of feeding. There is a tendency towards a decrease
magnitude. A significant exception is the Chernaya Bay ecosystem in
in the radioactivity levels in birds feeding on marine crustaceans and
the south of the Novaya Zemlya. In the 1990s, 137Cs concentrations in the
other representatives of zooplankton and benthos.
waters of the bay were 14-190 Bq/m3. Such contamination levels remain
as a result of the atomic explosions in the area of the bay.
Spills
At present, spil s of crude oil in the Barents Sea are scarce. Single smal oil
Artificial radionuclides in bottom sediments
spil s have been recorded in the Kola Bay, in the Pechora River and in the
The available data on radionuclides indicate low 137Cs and 90Sr levels in
White Sea. In the period 1990-2000, discharge of petroleum products
the bottom sediments of the central Barents Sea. Minimum (1.6 Bq/kg
into the Kola Bay varied in the range 55-70 tonnes per year (Murmansk
dry sediment) and maximum (8.4 Bq/kg) 137Cs values represent a small
Region Directorate of Natural Resources and Environmental Protection
range (Matishov & Matishov 2001). However, the near-shore ecosystem
2001). In the vicinity of Kolguev Island, where oil is currently extracted,
acts as an efficient marginal filter and accumulator of artificial
an oil film covering the entire southeastern part of the Barents Sea has
radionuclides. 137Cs, 90Sr and 239.240Pu levels in bottom sediments from
been recorded (Ivanov 2002). The Barents Sea is covered with numerous
bays and ords are 1-2 orders higher than in shelf troughs. The closer
navigation routes, including the Northern Sea Route. Thousands of large
to the nuclear testing areas of the Novaya Zemlya the higher are
vessels, fishing boats, merchant vessels and tankers navigate the Barents
the levels of these radionuclides in bottom sediments (up to 30-45,
Sea throughout the year. This increases the Barents Sea pol ution by oil
4-6, 5-15 Bq/kg respectively) (Matishov & Matishov 2001). The same
hydrocarbons. Pol ution of the Barents Sea wil increase further with the
tendency has been observed for the bottom fauna.
development of new oil deposits and increased oil transport by tankers. In
winter two thirds of the Barents Sea water area is covered with drifting and
Radioactive contamination of biota
packed ice. As ice accumulates pol utants, oil spil s represent an increasing
In a study conducted in 2001 the radioactive contamination of biota
threat in the Barents Sea region. During spring ice melting, concentrated
in the Barents Sea was investigated (Matishov & Matishov 2001). The
oil products and other toxicants enter the marine environment.
macrophyte belt on the Barents Sea littoral and sub-littoral was shown
to have a great accumulative function. Levels for 137Cs, 90Sr and 239.240Pu
At present, the issue was assessed as having a slight impact but
in the Barents Sea algae varied between 0.5-9, 0.4-3 and 0.02-0.3 Bq/kg
the impact wil very likely increase in the future due to the rapid
respectively. Local emissions from nuclear bases and dumping sites result
development of the Arctic shelf. Oil spil s therefore represent a potential
in 60Co and 137Cs accumulation in macrophytes and sediments (1-20 Bq/kg
future threat for the environment and is one of the issue chosen for the
and 40-260 Bq/kg respectively) (Matishov & Matishov 2001).
Causal chain analysis.
137Cs, 90Sr and 239.240Pu concentrations in zoobenthos (0.1-3.0, 0.01-0.4
Economic impacts
and 0.01-0.05 Bq/kg respectively (Matishov & Matishov 2001)) reflect the
Pollution was considered to have moderate economic impacts in the
dynamics of global fal out. Radioactive uptake by benthic organisms is
region. Economic impacts relate to the lack of funding needed to
a function of the type and assortment of the diet. An example of this
reconstruct and modernise water treatment plants, to decrease the
is the phenomenon of relatively high 137Cs accumulation in silt-feeding
pollution of the Kola and Severnaya Dvina rivers and the Kola Bay. An
worms. 137Cs, 90Sr and 239.240Pu levels in the Barents Sea fish varied within
issue of particular concern is radiological protection activities as this
the ranges 0.4-2.0, 0.3-1.0, 0.001-0.005 Bq/kg respectively (Matishov &
implies high levels of expenditure.
Matishov 2001). The level of artificial radionuclides accumulation in fish
is at present not high and remains within the established limits (State
Health impacts
Committee for Sanitary and Epidemiological Control 1997).
Within the Barents Sea region there are large metal urgy, pulp and
paper, mining, and chemical enterprises, which are the main sources
The level of 137Cs accumulation in species of Barents Sea birds can
of contaminants, potential y affecting the health of people living in the
be placed in the fol owing sequence: Goosander (0.2 Bq/kg); Black
neighbouring territories. An increased negative impact of air pol utants,
42
GIWA REGIONAL ASSESSMENT 11 BARENTS SEA
ASSESSMENT
43
especial y of SO , on human health in the Russian Euro-Arctic region
For these reasons the concern Pol ution was assessed as having an
2
has been observed. The analysis based on evaluation of long-term
overal moderate impact; and two issues (oil-spil s and radionuclides)
exposure effects, shows a close association between mean monthly
were chosen for the Causal chain analysis.
SO rates and the corresponding mean monthly variations in mortality
2
rate in the area of Nikel and Zapolyarny. Excess mortality is evident at
mean monthly SO concentrations exceeding 100 µg/m3. Males seem
2
T
C
to have an increased mortality risk when SO levels in the air exceed
P
A
Habitat and community
2
I
M
the mean monthly indices. However, increased mortality within the
modification
adult population can be a result of short-term episodic discharges
with SO concentrations varying from 10 to 50 µg/m3 (36 µg/m3 on the
Clear changes in the species composition in some regions of the
2
average) as wel . Highest mortality can be observed during the next
Barents Sea have been recorded, mainly changes caused by intentional
couple of days after an episodic discharge. The above-mentioned data
introduction of new species. The most important species are Humpback
are from accidental discharges and related mainly to atmospheric air
salmon, Red king crab, and Snow crab. The expected changes in the
contamination (Tchachtchine & Talykova 1997).
future caused by intentional and unintentional introduction of alien
species cause a great potential risk for the region.
Overal , health impacts were assessed as having a slight impact as there
are no statistical evidences of diseases directly caused by pollution of
Loss of ecosystems or ecotones
marine and freshwaters, but the risk of diseases related to sewage
There are no records of serious loss of habitats in the region, but
discharges still exists (dysentery, hepatitis).
evidence of slight degradation of some habitats. The issue was therefore
considered as having a slight impact in the region.
Other social and community impacts
There is a lack of data on any other social and community impact. No
Modification of ecosystem or ecotones
evidences have been registered for loss of tourism and recreational
Changes in faunal composition have been observed after the intentional
values of water objects. The same applies to the loss of wildlife
introduction of new species, especial y the Red king crab (Paralithodes
sanctuaries and protected areas (as a result of pol ution), increased costs
camtschatichus). A shortage of food has been noted, both for the crab
of animal protection, damage to equipment, loss of property values,
and for competing species, together with an increase in diseases and
costs of insurance, litigations, unforeseen changes and elimination of
the spread of fish parasites through the crab as an interim host. The issue
public anxiety. Other social and community impacts were therefore
was considered as having a slight impact in the region at present.
assessed as having no known impact.
Humpback salmon (Oncorhynchus gorbuscha)
Conclusions and future outlook
Soviet scientists conducted the first experiments on the introduction
Overal , the impact of Pollution under present conditions was assessed
of the Far East species Humpback salmon (Oncorhynchus gorbuscha)
as slight. The most relevant issues for the Barents Sea were identified
to rivers of the Kola region in the 1930s. As these experiments were
as: oil spil s, chemical and radioactive pollution. At present the Barents
unsuccessful, a bigger introduction programme started in 1956, which
Sea ecosystem is in a quite satisfactory condition except for the area
continued at least until 1978. Eggs at the eye stage were delivered by
of the Kola Bay. However, due to the rapid development of oil and gas
aeroplanes mainly from Sakhalin Island to fish farms in the Murmansk
deposits on the Arctic shelf and the increased volume of oil and gas
Region. For several years, these farms released 6-36 mil ion specimens of
transport through the Barents Sea, the situation may change and oil
outgrown juveniles but the return was very low. A mass return of fishes
spil s are considered a future threat.
released from the fish farms in the White Sea Basin was registered during
some years, but this phenomenon remained unexplained. Humpback
Radionuclides has little effect on the environment of the region at
salmon introduced along the Russian coast have been caught long
present but may increase dramatical y in the future. To prevent this,
distances from the area of release for example in rivers of Finnmark,
regional authorities should be increasingly focused on radiological
the coasts of Scotland, West-Spitsbergen and Iceland. In the eastern
protection activities and be prepared for any eventualities to ensure the
direction, Humpback salmon has been registered in the Ob and Yenisey
accident-free exploitation of nuclear reactors, storages of radioactive
rivers and in the Kara Sea. According to scientists from the Polar Scientific
waste and spent nuclear fuel.
Research Institute of Fisheries and Oceanography (PINRO), release of
44
GIWA REGIONAL ASSESSMENT 11 BARENTS SEA
ASSESSMENT
45
Humpback salmon has not been conducted since
1989, and the regular catches of Humpback salmon
in Norwegian rivers are an indication for successful
establishment at Kola. However, there is no evidence of
self-reproducing populations in Norwegian rivers yet.
Many investigations have been conducted on the
biology of Humpback salmon but there is stil a lack of data
on the sea-life period of the species after acclimatisation.
Investigations on competitive behaviour of Atlantic salmon and
Humpback salmon have been conducted, but this literature is
stil not translated from Russian to English, and is therefore not
Figure 15 Red king crab.
available for scientists in other countries. The same applies to
(Photo: Corbis)
research on diet of juveniles and any other investigations on negative
interactions between the two species, as wel as for general monitoring
The crabs were transported by aeroplane to the Barents Sea. The
data from Russian territories.
majority were caught in the Peter the Great Bay, only one batch in
1965 (31 specimens) was from the Ozernovsky Fish Enterprise (West
Snow crab (Chionoecetes opilio)
Kamchatka). The crabs were released into smal inlets adjacent to the
Until recently, the Snow crab (Chinoecetes opilio) inhabited the northern
Kola Bay. During the period 1961-1969, 1.5 mil ion larvae, 10 000 juveniles
seas of the Pacific Ocean and the northwest Atlantic. In 1996, this
and more than 3 000 adult crabs were released into the Barents Sea (Orlov
species was recorded for the first time in the Barents Sea (Kuzmin et al.
1965, 1977).
1998, 1999). It is assumed that the Snow crab arrived to the Barents Sea
through bal ast water discharged by ships returning from the northwest
The first specimen (a female with eggs) was caught in 1974 (Orlov
Atlantic. Repeated catches of the crab over several years, including
1978). From this time the number of crabs caught, both adult and
catches of females with external eggs, proved its establishment in the
juvenile individuals, increased steadily, indicating that a reproductive
southern part of the Barents Sea (Kuzmin 2000, 2001).
population had established in the Barents Sea. After a significant
increase in abundance, an analysis of the possibilities of commercial
Snow crab has been recorded in trawl catches from 100-324 m depth in
exploitation of Red king crab was carried out. Results of investigations
the central Barents Sea, mainly from the Geese fishing area and further
carried out in the Barents Sea show that the acclimatisation of the Red
to the west to 30°E. An increase in the number of male individuals has
king crab fol ows the classic steps for the introduction of new species
been recorded from the Geese fishing ground towards west and south.
(intended or unintended introduction). From the 1970s to the mid-
In Finnmark, the first individual was observed in April 2003 and some
1990s the acclimatisation process underwent the two first stages:
months later a Norwegian research vessel observed the crab in northern
survival of the resettled specimens (phase one), and reproduction and
Barents Sea.
growth of the population (phase two). In the second half of the 1990s,
the population growth and the growth of commercial crab fisheries
It is likely that the Snow crab wil be able to form a significant population
were exponential. Now, the population is in its third stage of the
in the Barents Sea in the future. However, the reproduction and other
acclimatisation process; the abundance burst. In the fourth stage, an
biological features seem to be significantly different from those of
increased conflict between the introduced species and the surrounding
the Red king crab and competition between these two species is not
biota can be expected. A decrease in individual fecundity might be
expected.
evidence that the crab abundance in the Murmansk area already has
reached its limit, and natural mechanisms restricting population growth
Red king crab (Paralithodes camtschaticus)
have started acting.
The greatest intended large-scale change in the Barents Sea coastal
ecosystem was the introduction of another Far East species, the Red
In Finnmark, however, a reduction in fecundity has not been observed
king crab (Paralithodes camtschatichus) by Soviet scientists during the
yet, and further growth of the population and expansion to the west
1960s (Figure 15).
is expected.
44
GIWA REGIONAL ASSESSMENT 11 BARENTS SEA
ASSESSMENT
45
The introduction of the Red king crab, which is a large mobile predator
As the algal genus that serves as a habitat in the Pacific (Ahnfeltia) does
and polyphage, influences the existing community. Through rapid
not have any significant abundance in the Barents Sea, the Red king
population growth, food access was limited for the king crab as well
crab have changed the habitat for the early larval stages, and uses the
as for other benthic organisms including fish fry. Furthermore the king
genera Laminaria and Desmarestia instead. Most of the year, the crab is
crab is an intermediate host for a parasite on cod fry and an increased
found in soft bottom habitats. Investigations of its diet performed by
infection rate is expected in the coming years, including a potential
Fiskeriforskning (now Norwegian Institute of Marine Research) show
decrease in cod abundance.
that it eats whatever is available of bottom living organisms. Small
mussels, bristle worms (particularly Pectinaria spp.) and echinoderms
A number of investigations during recent years show changes in the
are the main prey items, but also dead fish and algae are eaten by the
benthic community structure along the Finnmark and Murmansk
crab. The latest analyses have documented that the crab also eats fish
coast, including Kola and Motovsky bays. In Zelenetskaya Bay (Dal'niye
eggs. An ongoing research programme is now being carried out to
Zelentsy settlement area), for example, a decrease in sea-urchin
investigate the intensity of foraging on capelin eggs and the potential
biomass by a factor of 5 compared to the period before the Red king
effect on the capelin population. The adult crab has no natural
crab introduction has been recorded. These might be natural changes
predators, but bottom-dwel ing fish, such as catfish, cod and several
in abundances, but similar changes in a number of areas might be
flatfishes, eat juvenile crabs.
evidence for the impact of the crab on benthic communities.
New commensal relations are formed with species of the local fauna,
Distribution of the Red king crab along the warm Atlantic water masses
as for example with the fish leech Johanssonia arctica. The leech is
and expansion into new warm water habitats have been observed. In
connected with the crab in the Pacific, but has not yet been recorded
the east it has likely already reached its distribution limits. In the north, it
in the Barents Sea. However, it is expected that the Barents Sea species
has been recorded by fishermen at the west coast of Spitsbergen (these
will migrate westwards together with the Red king crab and expand its
records have not been proved by scientists yet) (Kirkeng-Andersen
previous range (Sundet 2003).
2003). In the west, it will continue its expansion along the Norwegian
coast. The central area of distribution is the coastal zone of the Kola
Economic impacts
Peninsula from Cape Teriberka to Varanger Bay.
In Russia, traditional salmon rivers have lost economic, recreational and
aesthetic value because of the introduction of the Humpback salmon,
The Red king crab has not changed its typical behavioural
which is less valuable than the Atlantic salmon with regard to sport- and
characteristics in the Barents Sea, despite the change in abiotic
commercial fisheries. There are increased costs for the state authorities
conditions. As in its original area, it migrates depending on age
caused by the number of intentional y introduced species that have to
and season. Hatching, spawning and mating takes place during
be managed, especial y the Red king crab. Monitoring programmes,
spring in shal ow waters (10-30 m) and both sexes appear together.
research and international agreements on management and quotas
A female crab may spawn from 25 000-400 000 eggs, depending on
have to be funded.
body size. The larvae live in the pelagic for 1-2 months before they
metamorphose in shallow waters. During their first years, they stay
The number of employees in the king crab processing industry has
in shal ow waters and move to deeper waters at a size of 50-70 mm
increased in Norway, but over the past years the number of people
carapace length.
employed in the traditional fish processing industry has declined. It is
too early to give any information on the development of the region with
The crabs have a social behaviour, and usual y appear in aggregated
regard to the introduction of the Red king crab.
groups of the same sex and size. Reproduction and availability of food
are considered the most important factors governing the migration
The development of the Russian Arctic shelf during recent years has
patterns of the crab throughout the year. The successful reproduction
lead to increased oil transport through the Barents Sea. This represents
and high abundance of the crab in the Barents Sea show its ability to
a serious threat of introduction of alien species with bal ast water.
adjust to the environmental conditions of the region, such as polar
day and night and the seasonal characteristics of biological processes
About 45 alien marine species are already established in Norwegian
typical for high latitudes.
waters, the potential socio-economic damage of expected introductions
can be estimated by calculating the damage caused by already
46
GIWA REGIONAL ASSESSMENT 11 BARENTS SEA
ASSESSMENT
47
introduced species. The examples are taken from southern Norwegian
Conclusions and future outlook
areas where the amount of bal ast water discharge is the highest and
At present, Habitat and community modification was assessed as having
where negative effects of alien species have already been recorded.
a slight impact. The most important issue is modification of ecosystems,
The potentially most damaging alien species in Norway are toxic
caused by the introduction into the Barents Sea of Humpback salmon,
phytoplankton such as Chattonel a causing loss to the aquaculture
Snow crab and Red king crab. These species that have acclimatised in
industry of approximately 25 million NOK in 2001 (Botnen & Jelmert
the Barents Sea have an impact on the ecosystem resulting in changes
2002) and parasites and pathogens as furunculosis and Gyrodactylus
in the structure of benthic communities and reduction of food reserves
salaris, which have caused at least 4 bil ion NOK of damage to farmed and
for fish.
wild Atlantic salmon in Norway over the past 15 years (Hopkins 2000).
Phytoplankton, parasites and pathogens are generally small-sized,
In Russia, the rate of increase in the Red king crab population has slowed
very difficult to detect, cause serious impacts and are hard to control.
down, and conflicts between the introduced and native species wil
As the export volume (especially of petroleum products) from the
most probably lead to a decrease in abundance of the Red king crab.
Barents Sea increases dramatical y, similar situations can be expected.
The king crab might be subject to both intra-specific and inter-specific
Fisheries and aquaculture are two of the main industries in Norway and
competition, and preliminary observations seem to prove it. The conflicts
in 1999 they had an export volume of 8.7% of al exports from Norway
are caused by overpopulation of the habitats with maximum exploitation
(30 bil ion NOK). A substantial proportion of this originates from northern
and a depletion of the food resources as a consequence, as wel as by
Norwegian waters, including coastal areas and the Barents Sea (Hopkins
impacts from predators, parasites, and pathogens. The food shortage
2001). Alien species therefore pose a serious threat to the economy of
may lead to an increased mortality in the Red king crab population, as
northern Norway as wel as for coastal communities in Russia. Due to the
wel as migration into other areas. The consequences can be an increased
ecological and socio-economic value of the living marine resources in
ecosystem disturbance in adjacent areas, as wel as an improvement of
the Barents Sea and their sensitivity to the threats associated with human
the present situation by recovery of disturbed habitats.
development, a potential risk from the introduction of alien species has
to be taken very seriously. Otherwise the ecological and economic
Along the Norwegian coast, the situation is different as a rapid growth
impacts can potential y be enormous (Barbier 2001).
in abundance is stil taking place. As mentioned above, the crab eats
fish eggs, and may therefore have a potential effect on abundance and
Health impacts
distribution of fish stocks, including the commercial species. It spends
Spreading of human pathogens or parasites by the Red king crab has
most of its lifetime on soft bottoms and it may have severe effects on
not yet been recorded, with the exception of one Anisakis sp. observed
these communities, both through physical disturbance of the habitat
in a stomach sample. Further sampling to confirm this is necessary.
and through disturbance related to grazing on soft bottom fauna. These
Thus, the indicator was assessed as having no known impact in the
disturbances may lead to reduced biomass and benthic biodiversity,
region at present.
predominance of opportunistic species and reduced sediment stability.
The crab may also compete with commercial and non-commercial
Other social and community impacts
species of fish and other crabs for food resources, which can delimit
The populations of the coastal regions, both in Norway and Russia are
stocks significantly.
increasingly focused on introduced species in general, and especially
the Red king crab. The increased abundance of the Red king crab has
The spectrum of possible scenarios ranges from no effects to severe
a strong impact on the traditional fishery both along the coast of the
effects. Potential y the king crab has no serious long-term effects on
Kola Peninsula and in northern Norway, especial y because of the
the ecosystem of the Barents Sea, and a sustainable exploitation of the
constant by-catches of Red king crab during the coastal spring and
king crab is possible. This wil improve the economic situation of the
summer fishery (cod, lump sucker etc.). The autumn fishery, however,
coastal areas both in Russia and in Norway. However, as the Red king
seems to have increased, which extends the season by several months,
crab eats fish eggs and is a host for a cod parasite its proliferation can
and potential y helps to establish new jobs in the regions. As with the
lead to severe impacts on the wild fish stocks including reduction of the
Atlantic salmon, the Red king crab represents an important marine
harvestable stocks, which wil have consequences for the economy and
product, which can open up new international markets as wel as
the coastal population (Costanza et al. 1997). In addition, competition
attract tourists. The indicator was assessed as having a slight impact
with fish fry and benthic fauna for food resources can lead to a stock
in the region.
reduction with consequences for the fisheries (Seterĺs 2001).
46
GIWA REGIONAL ASSESSMENT 11 BARENTS SEA
ASSESSMENT
47
Another issue of concern is the rapid development of the Arctic shelf
5
1.5
and increased oil transport through the Barents Sea increasing the risk
Age 3 years and older
of unintentional introduction of alien species into the Barents Sea with
Spawning stock biomass
Catches
4
1.2
Catches
bal ast water from tankers.
3
0.9 (million tonnes)
Thus, based on the data presented, the GIWA Task team came to the
2
0.6
(million tonnes)
conclusion that the impacts of Habitat and community modification
1
0.3
Stock
will increase in the future. Overall the concern was therefore assessed
0
0
as increasing from slight impact at present to moderate impact in the
1946
1949
1952
1955
1958
1961
1964
1967
1970
1973
1976
1979
1982
1985
1988
1991
1994
1997
2000
future and the issue modification of habitats was chosen for Casual
Year
chain analysis.
Figure 16 Total biomass of the Northeast Arctic cod 1946-1999.
(Source: Toresen 2000)
In the 1960s, the main fishing pressure in the cod fishery was on
T
C
P
A
Unsustainable exploitation of
I
M
immature fish. In the 1970s, there was an increase of fishing effort
fish and other living resources
(2 times higher than in the 1950s and 1.6 times higher compared to the
1960s). Catches of cod exceeded safe biological limits by a factor of 2
For Norway, the assessment of the concern is based on the fisheries
or even 3, which led to overexploitation. At the end of the 1970s to the
within the geographical boundaries of the GIWA Barents Sea region.
early 1980s, the cod stock decreased to a minimum of 760 000 tonnes
However, it should be noted that several comercial y important fish
(in 1984), i.e. 30% of the average value for 1950-1980 (2.8 million tonnes)
stocks straddle beyond the boundaries of the Barents Sea and into
(Matishov 1986).
the Norwegian Sea, and fishing operations for the Barents Sea fisheries
are conducted as far south as 62° N in the Norwegian Sea. In addition,
Since 1996, a steady decrease in the stocks of commercial and spawning
the assessment is focused (implicitly) on wild fisheries conducted
cod has taken place. At the beginning of 2000, the commercial stock
outside the coastline of Finnmark (cod, haddock, capelin and saithe)
was 1.5 million tonnes, and the spawning stock 300 000 tonnes, which
while aquaculture has been left out as wel as anadromous fisheries
is significantly lower than average long-term values (2.5 mil ion and
(salmon).
600 000 tonnes, respectively) (Borovkov et al. 2001). To a certain degree,
the Total Al owable Catch (TAC) established at the annual meetings
Decreased viability of stock through pol ution and disease was assessed
of the Joint Russian-Norwegian Fisheries Commission (Figure 17),
as irrelevant for the region. Increased reports of parasite infections
within some fisheries were noted, but without severe impacts on the
1.2
main stock.
Recommended
Agreed
1.0
Overexploitation of fish
Overexploitation of fish was assessed as severe since the major
(million tonnes) 0.8
commercial fisheries (cod and haddock) in the Barents Sea are exploited
beyond safe biological limits.
0.6
0.4
Figure 16 shows an obvious decrease in the cod stock and catches during
the second half of the 20th century: the stock and catches become lower
T
o
tal allowable catches 0.2
and the periods of stock crises more prolonged requiring more time for
the stock to rebuild (Toresen 2000). The most serious decrease in the
0
cod stock was in 1989-1990, which resulted from a number of factors:
1995
1996
1997
1998
1999
2000
2001
2002
2003
Year
abiotic factors (cooling), overexploitation, and a dramatic reduction of
Figure 17 Scientific recommendations and TACs for the Northeast
food reserves caused by the col apse of the capelin stock (destruction
arctic cod 1995-2003.
of the trophic web of the ecosystem).
(Source: Norwegian Institute of Marine Research 2003)
48
GIWA REGIONAL ASSESSMENT 11 BARENTS SEA
ASSESSMENT
49
reflects the negative trend. In the period 1997-2002, TAC was reduced
The lack of reliable data on discards of under-sized fish leads to
by 50%. The past three years, the TACs have been stable at the level
uncertainty in the evaluation of the stock size and fishery conditions
of 453 000 tonnes set according to economical and political rather
(PINRO 2000). According to the regulations, al by-catches are to be
than scientific considerations (Mukhin & Solodovnikov 2002). This
landed but is general y believed that discards occur. However, there
has particularly been the case for Northeast Arctic cod and haddock,
is uncertainty as to the extent of such practices, due to problems of
which at present both are fished outside safe biological limits.
monitoring and control. In view of this, slight impact was regarded as
According to the unofficial opinions of marine experts (especial y in
the most appropriate estimate.
Norway), the TACs of the past years (beginning from 1999) have been
set 50-100% too high (435 000 tonnes instead of scientifical y justified
Destructive fishing practices
110 000-260 000 tonnes). An issue of great concern is the small size of
In the Barents Sea, cod and other bottom fish species (catfish, perch,
the spawning stock, which has decreased during several years from
plaice, Greenland halibut, American plaice), which have relatively small
800 000 tonnes to 275 000-300 000 tonnes (Shevelev & Yaragina
stocks, are negatively impacted by the trawl fishery as it destroys the
1998). Based on the data presented it might be concluded that
bottom biocenoses. It also results in by-catch of non-target resources,
overexploitation exists in the Barents Sea.
which are not registered in the fishery statistics. It is believed that
trawling has had a slight impact on habitats.
In the mid-1980s, there was a serious cod crisis and a col apse in the
capelin stock. Capelin, a major prey for cod, was subjected to intensive
Impact on biological and genetic diversity
exploitation during 10 years (1975-1985), which resulted in the reduction
Measurable impact on biological and genetic diversity was noted in
of its commercial stock from 7 million tonnes to almost zero. After that,
regional hot spots where the introduction of Red king crabs has led to
the capelin fishery was banned. Both anthropogenic factors and natural
changes in the community structure. The issue was assessed as having
variations are believed to contribute to the dramatic changes in the
a moderate impact. However, it is believed that the issue should be
capelin stock (Skjoldal 2000).
analysed in the framework of Habitat and community modification.
There have been disagreements within the Joint Norwegian-Russian
Economic impacts
Fisheries Commission regarding the appropriate annual TACs, in certain
Fisheries and related (public and private) economic activities, constitute
cases threatening the ability of the parties to reach agreement. The
the backbone of most coastal communities in eastern Finnmark and
tension within the Commission seems to have increased in later years,
on the Russian coast of the Barents Sea. Overexploitation of fish and
as the stock-levels have decreased.
reduced catches, have severe economic consequences, in terms of
employment, income, investment activity and population rate. There is
Another factor affecting the unsustainable exploitation of fish is
re-allocation of resources in Russia and loss of food sources (e.g. sources
unregistered catches or poaching that leads to overexploitation.
of protein) for human or animal consumption.
This il egal fishery amounts to 20% of cod in the Barents Sea
(Mukhin & Solodovnikov 2002). Scientists consider over-quota fishery
As noted in the Regional definition, reduced cod catches by a factor of
especial y dangerous since it simultaneously generates al types of
2 over the past 10 years have had a negative impact on the economy of
overexploitation.
the Norwegian and Russian coasts of the Barents Sea. The globalisation
of the market for fish products has also had a substantial impact on
Excessive by-catch and discards
the economic situation of the fishing industry in the Barents region,
In the Barents Sea, by-catch is mainly a side result of the cod fishery. In
resulting in even fewer catches being landed for processing and/or
1996, by-catch of smal -size cod was 15 000 tonnes (VNIERH 1997). In
consumption in the region.
addition, 7-8% of unregistered by-catch is used on board the Russian
vessels for the private consumption of the crew. In total, the non-
Health impacts
accounted part of discard of the target object (cod) in the Barents
It is difficult to find evidence of any direct relation between the
Sea might constitute 10-15%, and has a tendency to increase. Based
exploitation-level of the Barents Sea fish stocks and the health of
on Murmansk Marine Biological Institute (MMBI) investigations and
the population. Therefore the indicator was assessed as having slight
unofficial assessments, discards of smal -size fish reach 30%. In addition
impacts in the region.
to cod, other fish species are also discarded.
48
GIWA REGIONAL ASSESSMENT 11 BARENTS SEA
ASSESSMENT
49
Other social and community impacts
fish consumption in the north of Russia was reduced by 50% in 2001
Other social and community impacts were linked to unemployment,
compared to 1990.
reduced fish consumption by the population, increase in poaching,
conflicts for the access to bio-resources and corruption. The fishing
The crisis in the fisheries sector of Russia particularly increased the
industry is important for the social structure of coastal communities.
socio-economic problems in coastal settlements and vil ages, for
Unemployment and reduced income due to crises in the fisheries,
which fishery was the main activity. At the beginning of the 1990s the
combined with a lack of alternative job opportunities, have led to
quotas and subsidies for the coastal fishery in the Barents and White
unemployment and a decrease in the population both in Finnmark,
Seas were dramatical y reduced. Due to the increased competition
and in Russia. The social impacts largely derive from the economic
for the resources there has been an increase in the number of il egal
impacts noted above.
transactions, conflicts between groups of fishers and corruption. Other
social and community impacts were therefore scored moderate.
The number of fishermen in Finnmark was reduced in the period
1992-2002 from 1 903 persons to 1 291 (see Table 29). The number
Conclusions and future outlook
of fish processing enterprises was halved (from 88 to 41) in the
Overexploitation and discards in the Barents Sea wil likely remain in the
period 1985-2002. This was also the case for the number of people
coming years. However the frequency and duration of the crises in the
employed at fish processing enterprises, which decreased from 3 383
fisheries are commonly medium-term, al owing for stocks to rebuild.
to 1 656 persons (see Table 28).
In spite of the difficult economic situation, the Government of Russia
Reduced fish catches have had a particularly severe impact on the
is believed to take measures to stabilise the economy in the nearest
living standard of the Russian population, where the problem of
five years, which will somewhat mitigate the severity of the situation in
overexploitation was aggravated
the fisheries sector. The regional dependency on the fishing industry
Table 28 Fishprocessing
by the difficulties of the transition
in northern Russia and Norway wil likely be reduced in the coming
in Finnmark.
period. At the end of the 1980s in
decades, partly due to developments in other marine sectors. This, most
Fish-
Northwest Russia 75 000 people
probably, will reduce the economic and social impacts of future crises
Year
processing Employment
companies
were employed in the fisheries
in the fishing industry. However, such predictions are hampered by a
1985
88
3 383
sector, among them 30 000
high degree of uncertainty.
1986
80
3 352
fishermen. By the end of the 1990s
1987
75
3 219
the number of employed in the
It is assumed that the situation wil improve as environmental principles
1988
60
2 884
fisheries sector was reduced by
and standards pertaining to fisheries management, over time wil be
1989
54
2 437
a factor of 2.5, and the number
implemented for the Barents Sea fisheries through the Joint Norwegian-
1990
43
2 003
of fishermen by a factor of 1.4.
Russian Fishery Commission. This is to a large extent driven by the
In addition, for the past 10 years
parties' commitments to international agreements pertaining to the
1991
42
1 921
the employment of fishermen at
conservation and management of the marine environment and living
1992
42
2 037
fisheries operations was reduced
marine resources, as for example the Convention on Biodiversity, the
1993
40
2 281
from 6-12 months to 2-6 months
UN Fish Stocks Agreement and the World Summit on Sustainable
1994
41
2 478
per year. This means that the
Development. Thus, a reduction in overexploitation is expected.
1995
38
2 388
earnings of fishermen abruptly
However, the same score was given for environmental and economic
1996
38
2 181
decreased and the unemployment
impacts under future conditions as for present conditions.
1997
41
2 180
increased by a factor of 2. In addition
1998
43
2 033
to the increased unemployment,
1999
41
1 723
2000
33
1 703
Table 29 Registered fishermen in Finnmark 1992-2002.
2001
40
1 656
1992
1993
1994
1995
1996
1997
1998
1999
2000
2001
2002
2002
41
ND
Finnmark
1 903
1 867
1 564
1 649
1 647
1 568
1 403
1 477
1 361
1 288
1 291
Note: ND = No Data.
Total
19 779
19 072
16 442
17 160
17 087
16 661
15 141
15 328
14 270
13 700
13 913
(Source: Norwegian Institute of fisheries
and Aquaculture Ltd.)
(Source: Norwegian Directorate of Fisheries 2002)
50
GIWA REGIONAL ASSESSMENT 11 BARENTS SEA
ASSESSMENT
51
T
C
P
A
Global change
I
M
not constitute any threat to human health. However, two issues of the
Pollution concern were chosen for further analysis since their impacts
The overall score no known impact was assigned to the concern. In the
may increase significantly in the future: oil spil s and radionuclides.
opinion of the GIWA Task team, there is at present no known negative
impacts of the four environmental issues related to Global change on
There are many concerns over the increased exploitation of and
the Barents Sea drainage basin.
prospecting for oil and gas reserves in the Barents Sea, as wel as
increased volumes of oil and gas transport through the Barents Sea.
That is why the issue of oil spil s requires increased attention and has
been chosen for further causal chain analysis.
Priority concerns
At present, radioactive pol ution has an insignificant impact on the
In the course of several workshops, the priority of the concerns
Barents Sea ecosystems. However, the potential threat of radioactive
considered for region 11 Barents Sea were discussed according to the
pollution in the region is very high. That is the reason for considering
GIWA methodology. Table 30 presents the results of the assessment.
radioactive pollution as a factor of priority for the Barents Sea region.
The significance of this factor may increase dramatical y in the future.
The GIWA concerns were prioritised as fol ows:
To prevent this, regional authorities should be increasingly focused on
1. Unsustainable exploitation of fish and other living resources
radiological protection activities to ensure the accident-free exploitation
2. Pollution
of nuclear reactors, storages of radioactive waste and spent nuclear fuel
3. Habitat and community modification
and should therefore be prepared for any eventualities.
4. Freshwater shortage
5. Global change
Another serious problem that may increase considerably in the future, is
modification of ecosystems. Oil and gas transport through the Barents
The most alarming problem for the region at present is the
Sea has increased dramatical y over recent years and is going to increase
Unsustainable exploitation of fish and other living resources and in
further. All this causes large volumes of bal ast water to be discharged
particular the issue overexploitation of fish. The analysis carried out
into the Barents Sea. The unintended introduction of alien marine
for the region suggests that fish in the Barents Sea continue to be
species into the Barents Sea via bal ast water can have severe effects
overfished despite measures of regulation and control. This problem
on marine diversity and ecosystems.
is believed to remain in the coming years. However, it is expected that
increased activities in other sectors in the Barents Sea (e.g. aquaculture
Another issue of concern is the intentional introduction of alien
and dril ing for gas) may mitigate the socio-economic impacts of
species, mainly the Red king crab, which nowadays represents both
reduced fishing opportunities. However, the predictions are hampered
a resource and a potential threat for fish stocks and local fauna. In
by a certain degree of uncertainty.
Russia, the growth of the Red king crab population has slowed down,
and conflicts between the crab and native speices will most probably
The conditions of the Barents Sea ecosystem, judging from the major
lead to a decrease in abundance of the Red king crab. The king crab
pollutants, is satisfactory at present. The levels of pollutants suggests
might be subject to both intra-specific and inter-specific competition.
that the Barents Sea is much cleaner than other European seas and does
The conflicts may be caused by overpopulation of the habitats with
depletion of the food resources as a consequence, as wel as by impacts
Table 30 Severity analysis of the concerns for the present
from predators, parasites, and pathogens.
and 2020.
Present score
Future score
Major concern
The crab eats fish eggs, and may therefore have a potential effect on
(2020)
abundance and distribution of fish stocks, including the commercial
Freshwater shortage
1
1
species. It spends most of its lifetime on soft bottoms and it may
Pol ution
1
2
have severe effects on these communities, both through physical
Habitat and community modification
1
2
disturbance of the habitat and through disturbance related to grazing
Unsustainable exploitation of fish and other living resources
2
2
on soft bottom fauna. These disturbances may lead to reduced
Global change
0
1
Note: Scoring criteria as in Table 16.
biomass and benthic biodiversity, predominance of opportunistic
50
GIWA REGIONAL ASSESSMENT 11 BARENTS SEA
ASSESSMENT
51
species and reduced sediment stability. The crab may also compete
with commercial and non-commercial species of fish and other crabs
for food resources, which can delimit stocks significantly. For the above-
mentioned reasons the issue modification of ecosystems has been
chosen for Causal chain analysis.
52
GIWA REGIONAL ASSESSMENT 11 BARENTS SEA
Causal chain analysis
This section aims to identify the root causes of the environmental
Overexploitation of fish
and socio-economic impacts resulting from those issues and
concerns that were prioritised during the assessment, so that
Environmental and socio-economic impacts
appropriate policy interventions can be developed and focused
The environmental impacts of overfishing manifest themselves in the
where they will yield the greatest benefits for the region. In order
reduction of commercial fish stocks during the past several decades.
to achieve this aim, the analysis involves a step-by-step process
This is particularly the case for the cod, as the spawning stock has been
that identifies the most important causal links between the
reduced over the past few years by a factor of 3. Overexploitation of
environmental and socio-economic impacts, their immediate
commercial species, especial y of those with short life cycles (e.g.
causes, the human activities and economic sectors responsible
capelin), have caused changes in food web structure and decreased
and, finally, the root causes that determine the behaviour of those
the stability of the Barents Sea ecosystem.
sectors. The GIWA Causal chain analysis also recognises that,
within each region, there is often enormous variation in capacity
Overexploitation of fish and reduced catches have severe economical
and great social, cultural, political and environmental diversity.
consequences in terms of employment, income, investment activity
In order to ensure that the final outcomes of the GIWA are viable
and population rate both in Northwest Russia and in Finnmark.
options for future remediation, the Causal chain analyses of the
At the beginning of the 1990s, the consumption of fish by the
GIWA adopt relatively simple and practical analytical models and
population in Russia was reduced by a factor of 2. Due to increased
focus on specific sites within the region. For further details on the
competition for the resources, there has been an increase in the
methodology, please refer to the GIWA methodology chapter.
number of illegal transactions, conflicts between groups of fishers
and corruption.
As a result of the Scaling and scoping analysis, the fol owing issues were
Immediate causes
identified as issues of highest priority for the Barents Sea region:
Overexploitation in the Barents Sea is, first of al , a result of fisheries
Overexploitation of fish;
pressure, which has increased during the past 20 to 25 years. The growth
Modification of ecosystems;
of fisheries pressure is characteristic both of Norwegian and Russian
Radionuclide pollution;
fisheries. Increased fishing effort has resulted in fish catches exceeding
Potential oil spil s.
scientific recommendations by a factor of 2 or even 3, which has led to
overfishing (Matishov 1986).
All these issues are further assessed in this section.
In the Barents Sea fisheries, there has been a clear tendency that the
annual Total Al owable Catch (TAC) have been set beyond scientific
recommendations in years when these have recommended low
TACs. This has particularly been the case for Northeast Arctic cod and
haddock, which at present both are fished outside safe biological limits
CAUSAL CHAIN ANALYSIS
53
(see Assessment, Unsustainable exploitation of fish and other living
been introduced in Iceland and other EU countries, are of low effect as
resources, Overexploitation and Figure 12).
they reduce but do not eliminate overfishing.
At present, the total capacity of fishing vessels in the Russian fisheries
In Norway and Finnmark there has been a slight reduction in the total
exceeds TACs for cod, haddock and halibut by a factor of 3-4. Middle-
number of fishing vessels in the period 1992-2002 (Tables 33 and 34)
sized vessels with an annual capacity of more than 2 000 tonnes operate
while the total engine power for the same period increased by a factor
in the cod fishery. For the past 10 years, quotas for these vessels have
of 1.2 and 1.3 (Table 32). In Finnmark, the number of smal - and middle-
been 2-5 times lower than their nominal capacity.
sized vessels decreased while the number of large-size vessels (more
than 40 m long) increased slightly (Table 34).
Table 31 shows that for the period 1993-1998, the total Russian quota
and the vessel-quota grew in the Barents Sea. The growth of the vessel-
Root causes
quota exceeded the growth of the total Russian quota because the
In the course of the causal chain analysis, the root causes, which together
number of vessels decreased during this period by a factor of 1.2. By
have led to overexploitation of fish stocks, have been defined. These
the year 2002, compared to 1998, the total cod quota was reduced by
root causes can be divided into the fol owing categories: Economic,
a factor of 1.6, while the vessel-quota was reduced almost by a factor
Technological, Governance, Legal, Knowledge, and Political.
of 2 (from 977 to 511 tonnes per year). At the same time the number of
fishing vessels increased by a factor of 1.2.
Economic
Economic root causes encompass negative effects of fishing subsidies,
The comparison of the vessels' nominal capacity, quotas and time at sea,
taxes, fish prices, payments for the access to fishing resources and
suggests that a large part of all catches are not registered when landed,
prices of vessels' quota-rights, failures of economic reforms and market
which leads to overfishing. To reduce the negative effect of overfishing,
failures.
the time at sea for vessels was limited in 2002 and a vessel-monitoring
system was introduced. However, these measures, that already have
Fishing subsidies
Fishing subsidies are recognised by many as one of the major root
Table 31 Cod quota and the number of middle-sized vessels in
causes of overcapacity and overinvestment in the world's fishing
the Russian cod fishery 1993-2002.
fleet. At the same time, fishing subsidies are the immediate cause for
1993
1995
1998
2000
2002
overfishing (FAO 1993, Iudicel o et al. 1999, Porter 1997, Titova 2003).
Number of middle-sized vessels
341
314
288
341
342
This is also the case for the Norwegian fishing industry. The Norwegian
Total cod quota (tonnes)
225 900
252 000
281 300
155 500
174 700
fishing industry has traditional y received substantial State support by
Vessel-quota (tonnes)
663
802
977
456
511
way of subsidies, loans and direct investments. This has also been the
(Source: State Statistics Committee 2002b)
Table 32 Norwegian fishing fleet's total engine power 1992-2002.
1992
1993
1994
1995
1996
1997
1998
1999
2000
2001
2002
Finnmark (HP)
157 095
160 247
154 349
164 508
164 713
162 342
171 403
184 765
189 327
191 523
210 364
Total (HP)
1 522 969
1 529 434
1 527 734
1 564 738
1 595 224
1 635 561
1 683 681
1 749 217
1 796 957
1 854 856
1 837 394
(Source: Norwegian Directorate of Fisheries 2002)
Table 33 Fishing vessels participating in the cod fishery, Norwegian coastal fleet 1990-2002.
1990
1991
1992
1993
1994
1995
1996
1997
1998
1999
2000
2001
2002
Cod Gr I
3 468
2 330
3 617
3 627
3 579
3 400
3 202
2 978
2 858
2 683
2 607
2 502
2 583
Cod Gr II
4 001
5 264
4 428
4 357
3 944
3 720
3 347
2 937
3 100
3 420
3 552
3 573
3 342
Notes: Gr I = coastal vessels with full quota rights, Gr II = coastal vessels with limited quota rights. (Source: Norwegian Ministry of Fisheries 2002-2003)
Table 34 Fishing vessels by length in Finnmark 1990-2000.
1990
1991
1992
1993
1994
1995
1996
1997
1998
1999
2000
0 to 39.9 m
1 861
1 981
1 934
1 964
1 776
1 669
1 670
1 667
1 677
1 642
1 660
More than 40 m
22
19
22
23
21
23
23
22
21
25
26
(Source: Norwegian Directorate of Fisheries 2001)
54
GIWA REGIONAL ASSESSMENT 11 BARENTS SEA
CAUSAL CHAIN ANALYSIS
55
case for Finnmark, recognised as the most fisheries-dependent region
vessels with limited quota-rights (coastal fleet) and licenses (trawlers),
of the country. A common criticism of previous and present State
have risen dramatical y. This has mainly been due to the price of the
involvement in the fishing industry has been that it has contributed to
vessels' quota-rights. This implies that vessel-owners are dependent on
maintain an overcapacity both in the fish-processing industry and in
a higher economic return from the fisheries to cover their investments.
the fishing fleet. The end to direct price-subsidies in Norway (fol owing
This is perceived by many as a root-cause for the increased fishing effort
the European Free Trade Agreement in 1990) has put the fleet in the
in the Norwegian Barents Sea fishery (Holm et al. 2002).
Barents Sea under increased economic pressure.
A difference in prices between smal -size and large-size fish in Norway
The fishing fleet has not been subsidised in Russia. The major root cause
and on the international market causes discards of smal -size cod and
in Russia is mistakes and difficulties in introducing market reforms.
other by-catch species. The prices for cod 56-70 cm and 71-100 cm long
at present are 2.0 and 2.7 times higher than for cod 35-45 cm long. The
Failures of economic reforms in Russia in implementation for the
Russian fishery faced the problem of discards with the beginning of
fisheries sector
market reforms. Before 1990, under the conditions of State control over
The rapid transition from the centralised planned economy to the
the purchase prices, all fish caught of any size, including by-catch, were
free market system in Russia did not al ow market structures and an
kept and reprocessed independent of market price and the expenses of
adequate system of auctions in the fisheries sector to be created. Due
fishing. Thus, discards of by-catches and smal -size fish was limited.
to imperfections in privatisation rules, most of the enterprises in Russia
suffered quick disruption of economic links within the infrastructure
Market failures
of the fishing industry, first of all between fishery and fish-processing
One of the clear causes of overfishing is the continuously growing
plants. Emerging stock companies and smal enterprises have had much
imbalance between the fishing effort and the potential biological
more difficulties in solving both financial and productive problems
production. According to Iudicel o et al. (1999) and Voitolovsky et al.
(FAO 1997).
(2003) the balance can be achieved by a reduction in the available
fishing capacity, that is, by decreasing the number of vessels. This
Failures of privatisation were aggravated by the fact that foreign trade
process cannot be left to market forces alone, as the relevant fish stocks
liberalisation had led to the sharp growth of interest rates and prices for
may be depleted before an equilibrium has been reached. It should be
fuel and materials. However in the difficult transitional period in Russia,
supported by a comprehensive approach combining decommissioning
the fishing industry did not receive sufficient State support (subsidies
schemes and regulatory measures, which reduce the fishing effort on
as in EU). New vessel owners lack the financial resources to be invested
the stocks (Iudicel o et al. 1999, Voitolovsky et al. 2003). Such regulations
into the modernisation of the fleet and fishing equipment, resources
to reduce the overcapacity are being implemented for the Norwegian
needed to make them meet the requirements of sustainable fishing.
fishing fleet.
Decrease in profitability of fishing has led to the growth of poaching
and increases in unregistered landings to avoid taxation. Ship-owners
Technological
obtain a smal fish quota that clearly does not al ow them to pay for
By-catch and discards in the Barents Sea are often side effects of the
the vessels' maintenance. However, the weak enforcement and control
fishery for cod. According to expert estimates, the total excessive by-
enable them to catch much more fish than the quota al ows.
catch and discards amount to 30% of the total catch. The main causes
of discards are: imperfections in the selectivity of the fishing gear, use
Payments for the access to bioresources, prices of the vessels,
of inappropriate or il egal fishing gear, and fishing in areas limited or
quota-right, taxes and fish prices
banned for fishery. Trawling also has a negative impact on the fisheries
High taxes in the fisheries sector in Russia, and the non-conformity of
(cod, catfish, perch, plaice, Black halibut, American plaice), by way of
the tax system to the specific character of the fishery, leads many fishers
destruction of bottom habitats (Denisov 2002).
to overfish the quota to compensate for tax expenses. The introduced
fishing auctions with prices for quota-rights have only increased
Governance
overfishing (Titova 2001).
Causes related to Governance encompass imperfection of the system
of fishery control, gaps in fishery statistics, non-compliance of fishers to
Fol owing the introduction of access and quota regulation in the
regulations and imperfection of the system of fisheries management.
Norwegian fisheries in the Barents Sea, the second-hand price of
54
GIWA REGIONAL ASSESSMENT 11 BARENTS SEA
CAUSAL CHAIN ANALYSIS
55
Fishery control
Legal
Overexploitation can be proved indirectly by the fact that vessel
One of the main reasons for the unsustainable fishery in Russia is the
owners usual y get a quota that is not enough to cover exploitation
absence of a Fishery Law, which would reflect the current market
costs. The fact that fishing vessels continue operations for several
situation in Russia and contain the main principles of a sustainable
years may indicate that: (i) fishermen catch more resources ("industrial"
fishery.
poaching) than the quota al ows; and (i ) that the existing system of
the fisheries control and management is unable to enforce regulations
Knowledge
effectively. The Norwegian control of the Barents Sea fisheries is
A high degree of scientific uncertainty and lack of catch- and stock data
conducted on land and at sea by the Directorate of Fisheries, The
hamper scientific recommendations and predictions. The Barents Sea
Norwegian Coast Guard and the mandated sales organisations. Per
is characterised by clearly marked annual fluctuations of abiotic factors
date, the frequency of controls in the Norwegian Exclusive Economic
resulting in fluctuations of stock sizes. These fluctuations are general y
Zone represents merely 0.5% of the 400 000 annual landings of
not reflected in scientific predictions (Alekseev & Ponomarenko
fish. In general, the inspection frequency increases with the size of
1998, Objectives and uncertainties in fisheries management 1997).
vessels. However, this seems to be wel below sufficient. The low
Changing natural conditions such as water temperature, cannibalism,
inspection frequency represents a substantial uncertainty regarding
predation, and anthropogenic factors such as by-catch, discards
the compliance of fishers to established regulations, and as such, to
and unregistered landings, al impose uncertainty on the scientific
the actual annual catches in the Barents Sea. Based on experiences,
recommendations. Therefore the scientific recommendations and
the Norwegian Directorate of Fisheries has estimated that non-
predictions from ICES have varied greatly and been subject to severe
compliance of Norwegian fishers represent 0-20% catch beyond the
uncertainties. Retrospective estimates of scientific predictions for the
annual Norwegian TACs (Norwegian Directorate of Fisheries 2002). An
period 1984-1994 showed an overestimation of stock-levels by 25%
estimate of Russian catches in the Barents Sea conducted in 1992 by
(Nakken 1998). While researchers are aware of the uncertainties related
Norwegian fishery authorities indicated overfishing of the Russian TAC
to their scientific recommendations, politicians and the industry to a
by 25% (Hřnneland 2000). There are no reasons to believe that these
lesser degree take scientific uncertainty into consideration.
figures have been reduced.
Political
Fishery statistics
The tendency that the annual TACs have been set beyond scientific
Many catches in Russia are misreported (both not reported and
recommendations in years when low TACs have been recommended, is
misreported by area). An increase in a number of different ownership
a witness to that TACs in some cases have been set according to political
forms has had a negative effect on the col ection of catch statistics
and economical, rather than scientific and biological considerations.
(MegaPesca 1999, Iudicel o et al. 1999, Titova 2003). According to
There have also been disagreements within the Joint Norwegian-
Norwegian regulations, al catches of commercial stocks are to be
Russian Fisheries Commission regarding the appropriate annual TACs, in
reported when landed. This also includes the landing of Russian
certain cases threatening the ability of the parties to reach agreement.
catches in the Norwegian zone. However, fisheries authorities assume
The issue of contention between Norway and Russia, to a large extent,
that misreporting and discards are relatively common. This is to avoid
refers to the size of the annual TAC. Though the negotiations are close
being caught overfishing the vessels' individual quotas for specific
to the public, there is a general understanding that Russia, in years with
fisheries (e.g. cod), and the infringements this leads to.
low scientific recommendations, wants to set higher TACs than Norway.
However, the Norwegian delegation does not always follow the scientific
Compliance
advice of ICES either. The tension within the Commission seems to have
One of the main chal enges of fisheries management is ensuring the
increase over later years, as the stock-levels have decreased1. One of the
compliance of fishers to regulations. The sustainability of fish stocks
disagreements is that in the Barents Sea fisheries, Norway and Russia
may be seriously threatened through by-catch, unregistered landings,
apply different approaches as to mesh size of trawl nets (125 mm mesh
discards and catch of undersized fish. Secondly, non-compliance leads
size of the trawl nets in Russia and 135 mm in Norway).
to a high degree of uncertainty in the catch- and stock data which
provide a basis for the scientific models applied to estimate stock sizes,
Another issue of concern is that the negotiations of the Joint
biomass, which in turn are the scientific bases for setting annual TACs
Norwegian-Russian Fisheries Commission are not open to the public.
(ICES 2003).
The national delegations are composed of officials from the relevant
1The Norwegian Ministry of Fisheries annually publishes a white paper for the Parliament regarding Norwegian fisheries cooperation with other states (for 2000-2001 see: http://odin.dep.no./fid/norsk/publ/
stmeld/008001-040006/index-dok000-b-n-a.html). There are also annual protocols of the meetings of the Joint Norwegian-Russian Fisheries Commission. Both are available at: http://odin.dep.no./fid/).
56
GIWA REGIONAL ASSESSMENT 11 BARENTS SEA
CAUSAL CHAIN ANALYSIS
57
Impacts
Issues
Immediate causes
Sectors/Activities
Root causes
Environmental:
Economic:
- Unstable ecosystem
- Fishing subsidies
- Lower productivity of fish stocks
- Unequal payments for the access to
bioresources, price of vessels quota-
High exploitation rate
Fisheries:
Socio-economic:
right, high taxes and fish price
Overexploitation
commercial fishing and
- Low and unstable
- Failures of economic reforms in Russia
of fish
the fishing industry
quotas/supply of fish
- Market failures
Non-compliance of fishers
- Reduced economic returns
to regulations
Technological:
- Loss of employment
Overfishing of quotas for
- Low selectivity of fishing gear
- Migrating population
the most valuable
- Lack of alternative fishing gear
- Reduced fish consumption by
commercial species
population in Russia due to the
Political:
increased export volume of fish
- Disagreements within the Joint
- Increase of poaching,
Excessive fishing effort
Norwegian-Russian Fisheries
corruption, illegal transactions,
and fleet capacity
Commission regarding the setting of
competition for the access to
annual TAC
bioresources
Governance:
- Imperfection of fishery control system
- Gaps in fishery statistics
- Faults of the fishery management system
Legal:
- Inappropriate legislation regulating
the fisheries sector in Russia
Knowledge:
- Scientific uncertainty
- Inappropriate assessment methods
Figure 18 Causal chain diagram illustrating the causal links for overexploitation of fish.
national authorities, scientific experts and representatives from the
in the Barents Sea fisheries (Matishov & Rodin 1996, Kotenev 2000,
most important industrial non-governmental organisations (NGOs)2.
Shevchenko et al. 2001, Denisov 2002). The Causal chain analysis
The lack of transparency has raised questions regarding the influence
shows that there are clear linkages between environmental and
of the industrial NGOs on the setting of annual TACs. At present non-
socio-economic impacts, immediate causes and root causes of
industrial NGOs have no influence on the conservation of biologic
overexploitation of fish in the Barents Sea. These linkages are presented
diversity of the sea, while the influence of NGOs on the conservation of
in Figure 18.
biologic diversity of land animals has increased.
Conclusions
The fol owing root causes have lead to the overexploitation of fish:
Modification of ecosystems
Economic: fishing subsidies, unequal payments for the access to
marine bioresources, price of vessels' quota-rights, taxes and fish
Environmental impacts
prices, and economic reform failures and market failures;
The introduction of alien species into new ecosystems always has
Technological: low selectivity and lack of alternative fishing gear;
impacts on the latter. The intended introduction of the Red king
Governance: imperfections of the fishery control system, gaps in
crab (Paralithodes camtschatica) into the Barents Sea has lead to the
fishery statistics, non-compliance of fishers to regulations, and
spread of this species over a large territory and an increase of its
faults in the system of coordination of fisheries management;
population (Figure 19). This resulted in an increased conflict between
Legal: inappropriate legislation regulating the fisheries sector in
the introduced species and the surrounding biota. Through the rapid
Russia;
population growth, food access was limited for the king crab as well as
Knowledge: inappropriate assessment methods;
for other benthic organisms including fish fry. Furthermore, the king
Political: disagreements withing the Joint Norweigan-Russian
crab is a potential threat for cod abundance as it is an intermediate host
Fisheries Commission regarding the setting of annual TAC.
for a parasite on cod fry.
Numerous scientific assessments show that al above-mentioned
Investigations of the Red king crab's diet performed by Fiskeriforskning
causes act in one direction at present; in the direction of deterioration
(now Norwegian Institute of Marine Research) show that the crab eats
2The Norwegian Ministry of Fisheries has separate meetings with environmental NGOs and the three northern counties (Nordland, Troms and Finnmark), prior to the meetings of the Joint Norwegian
Russian Fisheries Commission.
56
GIWA REGIONAL ASSESSMENT 11 BARENTS SEA
CAUSAL CHAIN ANALYSIS
57


Distribution of
Red king crab
2001
2000
1999
1995-1997
1992
1990
1961-1969
2 500 000
Russian Economic Zone
2 000 000
ing crab
Norwegian Economic Zone
Total
1 500 000
1 000 000
500 000
Numbers of Red k
0
1995
1996
1997
1998
1999
2000
2001
Year
Figure 19 Red king crab in the Barents Sea.
(Source: Matishov & Denisov 2000)
whatever is available of bottom living organisms. Smal mussels,
However, the reproduction and other biological features seem to be
bristle worms (particularly Pectinaria spp.) and echinoderms are the
significantly different from those of the Red king crab and competition
main prey items, but the crab eats also dead fish and algae. The latest
between these two species is not expected.
analyses have documented that the crab also eats fish eggs. A research
programme is now carried out to investigate the intensity of foraging
Socio-economic impacts
on capelin eggs and the potential effect on the capelin population. The
There are increased costs for the state authorities caused by the number
adult crab has no predators, but bottom-dwelling fish, such as catfish,
of intentional y introduced species that have to be managed, especial y
cod and several flatfishes eat juvenile crabs.
the Red king crab. Monitoring programmes, research and international
agreements on management and quotas have to be funded. The crab
In other areas, the Red king crab has formed new commensal relations
represents both a resource and a potential threat for fisheries. The threat
with species of the local fauna, for example with the fish leech
arises through the crab's direct or indirect effects on the stock of other
Johanssonia arctica, inhabiting the Pacific. The leech has not been
commercial species, and through demolition of fishing equipment.
recorded in the Barents Sea yet but it is expected that some Barents
Sea species wil migrate westwards together with the king crab and
By-catch of king crab in gil -nets and longline fishery has been a
expand their previous range.
major economic problem in Finnmark and Russia and fishermen and
scientists put great efforts into solving this problem. Fishing equipment
The impact of another introduced species, the Humpback salmon
has been modified and developed and modifications of the traditional
(Oncorhynchus gorbuscha), on the ecosystems of the Barents Sea is
equipments are now used commonly. Even though it is more time-
poorly investigated. There is still a lack of data on negative interactions
consuming to use the new equipment, the fishermen are expected to
between Humpback salmon and Atlantic salmon, a native species for
benefit from it. In 2001, the by-catches of Red king crab were reduced
the Barents Sea.
compared to earlier years. It is forbidden to keep by-catches of the crab,
but most of the crabs die from the injuries in such catches. By-catches
As for the Snow crab (Chionoecetes opilio), it is likely that this species will
have therefore represented an important contributor to the mortality
be able to form a significant population in the Barents Sea in the future.
rate in the king crab population.
58
GIWA REGIONAL ASSESSMENT 11 BARENTS SEA
CAUSAL CHAIN ANALYSIS
59
Norwegian and Russian authorities cooperate through the Joint
Immediate causes
Russian-Norwegian Fisheries Commission (established in 1977) in
The immediate causes of modification of ecosystems are the intentional
the management of the joint fisheries resources of the Barents Sea,
or unintentional introductions of non-indigenous species and further
including management of the Red king crab as a resource for fisheries.
growth of their population (abundance burst). Non-indigenous
This commission decides the size of the catch quotas for the two
species (invasive, alien species etc.) are species, which have extended
countries and has agreed to catch 20% of the legal-sized stock.
their habitat over their natural geographical range (Carlton & Gel er
1993, Sandlund et al. 1996, Weidema 2000). They are considered as a
In 1992, the Joint Russian-Norwegian Fisheries Commission decided
major threat for ecosystems worldwide (ICES 1995, 2000) and several
to start joint investigations of the Red king crab in the Barents Sea
international agreements and instruments deal with this threat (e.g.
and, for both countries, the expenses for the joint work increased. In
IMO 1997).
1994 Norwegian research fishing of the Red king crab started. The
aim was to obtain information on the crab's biology and population.
Alien species can have severe effects on marine diversity and ecosystems
The commercial fishing started in 2002. Fishing takes place from the
no matter if they are introduced intentional y or unintentional y
middle of October to the end of December, and it is only al owed to sell
(Gol asch & Leppäkoski 1999, Weidema 2000, Leppäkoski et al. 2003).
male crabs over a defined size. The fishermen who are most affected
Two species have been introduced intentional y into the Barents Sea;
by by-catch of Red king crab, mainly in eastern Finnmark, have first
the Humpback salmon and the Red king crab. An increasing threat to
priority for commercial fishing quotas. In 2002 the total Norwegian
the ecosystem of the Barents Sea is the unintentional introduction of
quota was 100 000 crabs and for 2003 the quota has been doubled to
alien species.
200 000 crabs. With the commercial exploitation of the Red king crab
resources, a highly valuable species on the world market, a new fishing
Of al vectors for alien marine species, shipping is considered as one
industry has been established in Russia and Norway. The number
of the most important (Gol asch & Leppäkoski, 1999). Unintended
of employees in the king crab processing industry has increased in
introductions and transfers caused by shipping mainly occur by
Norway, but in recent years, the number of people employed in the
transport and discharge of bal ast water and to a lesser degree by
traditional fish processing industry declined. It is too early to give any
transport of fouling organisms on hul s. An additional risk, that fol ows
information on the development of the region with regard to the
the introduction of an alien species, is the transfer of species associated
introduction of the Red king crab.
with the original alien species. Examples of such associated species
are spores of macrophytes or phytoplankton found on or in benthic
Impacts on human health can be caused by transfer of pathogens
organisms as wel as parasites and pathogens. Once an alien species
via bal ast water, but are under the prevailing climatic conditions not
is introduced into an area, natural transfer processes cause further
very likely. The populations of the coastal regions, both in Norway and
spreading (ocean and coastal currents).
Russia, are increasingly focused on introduced species in general, and
especial y the Red king crab. The increased abundance of the Red king
Russia has increased the export volume of oil dramatical y during the
crab has a strong impact on the traditional fishery both along the coast
past years and is going to increase these activites further. Great volumes
of the Kola Peninsula and in northern Norway, especial y because of
of bal ast water are already discharged into the Barents Sea and these
the constant by-catches of Red king crab during the coastal spring and
volumes will increase. Within the year 2010 the yearly export of oil from
summer fishery (cod, lump-sucker etc.).
Russia shipped through the Barents Sea will be 150 million tonnes and
the amount of discharged ballast water calculated conservatively will
Autumn fishery, however, seems to be increasing, which extends the
be at least 50 million tonnes per year. Introductions of additional alien
season by several months, and potential y helps to establish new jobs in
species (as already has happened with the Snow crab) are likely and can
the regions. As with the Atlantic salmon, the Red king crab represents an
have severe consequences for the Barents Sea ecosystem in the future,
important sea product, which can open for new international markets
including a potential col apse of fishery resources.
as well as attract tourists. These impacts depend on the type of species
introduced in the future and cannot be assessed today. But definitely,
Root causes
further research, monitoring and management of Red king crab and
An issue of concern is the lack of knowledge and investigations of alien
Humpback salmon will require financial support from the public.
species' biology and lack of funding to prevent negative effects of the
introduction of alien species. The former Soviet Union carried out large-
58
GIWA REGIONAL ASSESSMENT 11 BARENTS SEA
CAUSAL CHAIN ANALYSIS
59
Impacts
Issues
Immediate causes
Sectors/Activities
Root causes
Environmental:
- Changes in food web
Economic:
structure
- Increased oil and gas export from
- Reduced fish stocks
Russia through the Barents Sea
Introduction of alien
Modification of
species (both intentional
Transportation
Technological:
ecosystems
and unintentional
- Lack of tank- and hull cleansing
through ballast water)
facilities
Legal:
- Lack of regulations on treatment of
ballast water and farming and
Socio-economic:
introduction of commercial species
- Reduced revenue from
at the regional, national and
fisheries and aquaculture
international levels.
- Loss of employment
Scientific:
- Decrease in living
- Lack of knowledge on the
standard in coastal
acclimatisation of alien species in
settlements
the Barents Sea.
Figure 20 Causal chain diagram illustrating the causal links for modification of ecosytems.
scale activities aimed at deliberate introducing and acclimatising new
Conclusions
commercial species in its national waters. The activities were regulated
The analysis al ows concluding that the immediate causes of the
by state institutions and were strongly supported and approved by
modification of ecosystems in the Barents Sea are the alien species
the State. The result of these activities is the two Pacific species, the
introduced intentional y and unintentional y. The latter are related to
Humpback salmon and the Red king crab, introduced intentional y into
the increased shipping and discharge of bal ast water. The root causes
the Barents Sea with all the consequences that this implies.
underlying these processes are the fol owing:
Economic: increased oil and gas export from Russia through the
Another root cause applies to unintentional introduction of alien
Barents Sea.
species. The tactics of refuelling fishing vessels operating outside the
Technological: lack of tank- and hull cleansing facilities.
Barents Sea from its home tankers, was general y applied in the former
Legal: lack of regulations on treatment of bal ast water and farming
Soviet Union. This caused large volumes of fuel shipped through the
and introduction of commercial species at the regional, national
Barents Sea al the year round and the corresponding volumes of bal ast
and international levels.
water discharged into the Barents Sea.
Scientific: lack of knowledge on the acclimatisation of alien species
in the Barents Sea. A large-scale biological experiment was initiated
Nowadays Russia is implementing a long-term energy programme
and conducted without scientific assessment of its consequences
aimed at intensive development of the Arctic shelf and exploiting its
for the ecosystem as a whole.
oil and gas reserves. The major focus here is on the increased export
of oil and gas. Russia places great hopes on oil and gas export, as it will
The linkages between the root and immediate causes and their
provide for the social and economic development of its Northwest
environmental and socio-economic consequences are presented in
region, as wel as of the country as a whole. Al this implies increased
the casual chain diagram (Figure 20).
tanker navigation through the Barents Sea.
However, Russia is somewhat unprepared for its long-term energy
requirements since it stil lacks appropriate regulations and a wel -
Radionuclides
balanced programme for the development of the Arctic. This hampers
the Russian oil companies from investing into re-equipping the tanker
Environmental impact
fleet, as well as into ecological programmes, including those aimed at
A stable tendency towards decrease in atmospheric fal out of artificial
decreasing the introduction of alien species with bal ast water from
radionuclides has been observed during the last decades. Within the years
tankers. It is not very likely that any of the ships calling at Russian ports
1981-1993, the input of tritium into the Kola Bay via river run-off decreased
have treatment systems on board and there are stil no international
by 1.5. The input of 137Cs in 1965-1989 decreased 11-fold while the input of
regulations on treatment of bal ast water.
90Sr in the period 1961-1989 only decreased by a factor of 1.2.
60
GIWA REGIONAL ASSESSMENT 11 BARENTS SEA
CAUSAL CHAIN ANALYSIS
61
A major source for the Kola Bay pollution by 137Cs and 90Sr is discharges
Wrecks of nuclear powered submarines and surface vessels are a serious
from the treatment of liquid radioactive waste at ATOMFLOT in
threat to the environment. At least three nuclear powered submarines
Murmansk. The annual discharge of these nuclides was greatest during
have sunk in the Barents Sea since 1989: Komsomolets (1989), Kursk
1992; 2.1×10⁸ and 2.6×10⁷ Bq/year, respectively. From 1989 to 1994 the
(2000), and K-159 (2003). At present, two of them are stil lying on the
average annual values were 1.6×10⁷ and 7.6×10⁷ Bq/year respectively. In
sea bottom with their reactors on board. Another threat is posed by the
the 1990s 137Cs levels in the Barents Sea surface waters varied within the
numerous smal accidents continuously happening when exploiting
ranges 2-15 Bq/m3, 90Sr 1-7 Bq/m3, 239.240Pu 4-8 Bq/m3, which corresponds
nuclear reactors and nuclear weapons.
to the global radioactive background.
Root causes
137Cs and 239.240Pu concentrations in the Barents Sea bottom sediments
In the 1950s, a unique combination of geopolitical factors resulted in the
clearly correlate with the type of deposits and correspondingly increase
creation of a nuclear powered surface and submarine fleet on the Kola
up to a maximum in clay silts of the shelf troughs. In the 1980-1990s the
Peninsula. This is perceived by many as a root cause for the increased
accumulative levels of radionuclides in the Barents Sea biota reflected
potential threat of radioactive contamination. The creation of the
global fal out and was low.
nuclear powered fleet required in turn the creation of an infrastructure
for nuclear fuel supplies and reprocessing of radioactive waste. Active
Immediate causes
operation of the nuclear powered fleet resulted in a large amount of
At present, there are about 100 decommissioned nuclear powered
radioactive waste and caused problems in storage and burial.
submarines on the naval bases of the Russian Northern Navy, some with
nuclear fuel on board. The fuel is kept on board the submarines due to
Nowadays no other place on the earth has such a concentration of
the shortage of coastal depositories. Economic and technical problems
nuclear energy as the Kola Peninsula. There are four reactors of the Kola
also hamper the transport of spent nuclear fuel for processing at the
Nuclear Power Plant, 13 reactors of the Civil Atomic Fleet, and more than
Mayak plant in Chelyabinsk Region. Decommissioned submarines are
200 reactors of the Northern Navy. There are four plants maintaining
based in naval stations of the Kola Peninsula and in Severodvinsk, and
nuclear reactors of the Civil Atomic Fleet and the Northern Navy. In
the Arkhangelsk Region, with practical y no maintenance and upkeep.
addition to this, there are two ore-processing plants, in Lovozero and
In addition to decommissioned submarines, there are coastal
Kovdor, extracting and processing natural radioactive raw material.
depositories for spent nuclear fuel (SNF) and radioactive waste located
From 1972 until 1984, three subterranean explosions of low power were
in naval bases. The largest storage for SNF from submarine reactors is
made for research purposes in the vicinity of the town of Kirovsk.
located in the Andreyeva Guba (inlet), Zapadnaya Litsa Bay (Figure 14).
SNF from about 90 reactors is stored there at present. The storage,
Near the town of Murmansk, there is a depository for radioactive waste
which was constructed in the 1980s, needs urgent upkeep. Another
from the Radon plant, which within the period 1964-1994 received
large storage of radioactive waste is located in the naval base in
solid radioactive waste from enterprises located in the Murmansk and
Gremikha, on the east of Kola Peninsula.
Arkhangelsk regions. Radioactive waste has not been buried there since
1995. However, this storage is a potential threat to the environment,
Enterprises of the nuclear industry emit and discharge radioactive
since it needs reconstructing (State Environmental Committee of the
substances in low volumes in the course of their technological process.
Murmansk Region 1999). Nowadays, the level of radiological protection
However, in certain years there have been a number of large leaks and
on the Kola Peninsula, in general, meets the requirements of regulations
accidents accompanied by uncontrol ed emissions of radioactive
and recommendations of international organisations.
substances into the water and the atmosphere. The accident in the
storage of radioactive waste located in the Andreyeva Bay, which
Conclusion
happened in 1982, resulted in a leak of radionuclides into the water
The economic crisis in Russia in the 1990s generated a number of
area with a total activity of 37×1012 Bq. An accident on a submarine in
serious problems. In particularly, it significantly reduced the possibilities
the Ara Bay, which happened in 1989, leaked radionuclides into the
of the state funding for the activities related to reduction in the number
water area with a total activity of 74×1012 Bq. Since 1989, the treatment
of nuclear weapons, decommissioning nuclear powered submarines,
plant for liquid radioactive waste at ATOMFLOT is an acting source of
reprocessing of large amounts of radioactive waste and maintenance
radioactive pollution (Matishov & Matishov 2001).
of nuclear power plants.
60
GIWA REGIONAL ASSESSMENT 11 BARENTS SEA
CAUSAL CHAIN ANALYSIS
61
Oil spills
Table 35 Possible effects of oil spills on marine organisms and
communities in pelagic (1) and littoral (2) zones.
Environmental impacts
Situation and
Group of
parameters of Possible impacts
organisms
No severe effects of oil spil s have been registered in the Barents Sea.
impacts
Changes in photosynthesis, species composition, and other
However, as a potential threat to the ecosystem of the Barents Sea oil
Phytoplankton
1
impacts, which disappear after the dissipation of the oil spill
spil s should be taken into account in the light of the rapid development
(within hours or days).
Physiological and biochemical anomalies, local decrease in
of activities on the Russian Arctic shelf and the dramatical y increased oil
Zooplankton
1
numbers, and other impacts, which disappear within several days
and gas exploitation and transport in the Barents Sea. Table 35 presents
after the dissipation of the oil spil .
Zoobenthos
Negative changes are unlikely due to the absence of oil
likely effects oil spil s in the Barents Sea ecosystem. The coastal zone
1
(pelagic zone)
contamination in bottom sediments.
of the Kola Peninsula (the Barents and White Seas) is notable for high
Possible sub-lethal reactions, decrease in numbers, and local
Zoobenthos
2
destruction of species composition of benthic communities with
levels of biodiversity, including rare and especial y protected birds and
(littoral zone)
the period of rebuilding up to 1 year and more.
mammals.
Behavioral reactions in the form of avoidance of contaminated
Ichthyofauna
1
areas by fish; ichthyoplankton lesion; population changes are
(pelagic zone)
indistinguishable on the background of natural fluctuations.
Socio-economic impacts
Ichthyofauna
Decrease of food for fish; possible changes in fish migration and
2
(littoral zone)
population changes of local character.
According to the strategy for the development of the Murmansk
Reaction of avoidance of contaminated areas by mammals,
Region until year 2015, the restoration of coastal settlements of the
destruction of habitats, physiological stresses, injuries. For
Mammals
1, 2
animals with hair cover, direct contact with oil can lead to lethal
Kola Peninsula is dependent on the development of coastal fishery
outcome.
and aquaculture (western Murman). In the 12-nautical mile zone about
Stresses and death from the contact with oil, deterioration of
Birds
1, 2
habitat and reproduction conditions in the contaminated areas,
40% of cod and 32% of haddock, most of the Red king crab and other
reversible population changes of local character.
valuable bioresources are concentrated. The aquaculture production of
Notes: 1 = Temporary (up to several days) contamination by oil of the surface water layer with the
concentration of oil hydrocarbons up to 1 mg/l at depth of 1 m.
salmon by 2015 is planned to be 15 000 tonnes per year. Deterioration
2 = Temporary (up to several months and more) contamination of the coastal zone with
concentration of oil hydrocarbons in the water in the range 0.1-1 mg/l and their accumulation in
of the environment in the coastal zone because of oil spil s will upset
bottom sediments up to a level of 102 mg/kg.
(Source: Patin 2001)
the planned socio-economic programme and cause unemployment
in coastal settlements. The Barents and White Seas coasts of the Kola
Peninsula are of important cultural and historical value, and constitute
The annual volume of petroleum products transported from the port
perspective resources for tourism and recreation. With the development
of Vitino in 2002 was 2.8 million tonnes. In winter the oil was shipped
of the region, all this will attract numerous tourists. Oil spil s will likely
by tankers of 20 000 tonnes deadweight, while in summer tankers of
decrease the economic, recreational and aesthetic value of most
40 000 tonnes were used. From the port of Arkhangelsk 2 mil ion tonnes
prominent sites for tourism.
of oil were shipped in 2002 by tankers of 20 000 tonnes. From the
Varandey terminal 240 000 tonnes of oil were transported in 2002; from
Immediate causes
Kolguev Island 120 000 tonnes; and 100 000 tonnes of gas condensate
Increased oil transport through the Barents Sea
from the basin of the rivers Ob and Lena. Some of the oil transported
At present, the shipping of crude oil and oil products is carried out along
from these points was reloaded on tankers of 100 000-150 000 tonnes
the coast of the Murmansk Region from the ports of Vitino, Arkhangelsk,
in the Murmansk area. In 2002, 700 000 tonnes of oil were transported
and Murmansk for further export to European countries and the United
to the Murmansk area from the Barents Sea to be further reloaded and
States. Some petroleum products from ports in the White Sea and oil
transported to European ports. In addition to this, 600 000 tonnes of
deposits located in the east of the Barents Sea are transported to the
petroleum products were transported by railway to the Murmansk
Murmansk area where they are reloaded onto large-tonnage tankers to
fishing port, and then reloaded on tankers for further export. Thus, in
be further exported to the west.
total 5.86 million tonnes of oil were shipped for export along the coast
of Kola Peninsula in 2002 (Murmansk Region Administration 2003).
This technology is expected to be further developed in the very
near future and the export volume is expected to increase up to
In addition to the oil transport for export, the shipping of fuel oil
9 mil ion tonnes. For these purposes, three reloading complexes are
for icebreakers and other types of vessels is carried out along the
planned in the Kola Bay (in the area of Kulonga, Belokamenka, and
Murman coast in the period from May until October. The volume of
Mishukovo).
fuel oil shipped through the Barents Sea constitutes 5 000 tonnes. The
transport of petroleum products to the ports of the Novaya Zemlya
62
GIWA REGIONAL ASSESSMENT 11 BARENTS SEA
CAUSAL CHAIN ANALYSIS
63
Island and Vil'nitskiy Island and to the ports on the Pechora Sea and the
Table 36 Planned oil transport along the coast of
Yenisey Bay, constitutes about 10 000 tonnes.
the Murmansk Region.
Planned oil transport (mil ion tonnes)
Port/oil terminal
2005
2010
2015
The volumes of oil transport planned for 2005, 2010 and 2015 along the
Varandey terminal
3
6.51
121
coast of the Murmansk Region are shown in Table 36. The total transport
Kolguev Island and Ob-Yenisey basin
0.4
0.9
1.5
in 2005 is planned to be 8.5 mil ion tonnes. In 2010, 6.5 mil ion tonnes of
Port of Vitinio
3
3.4
4
Port of Arkhangelsk
2.1
2.3
2.5
oil is planned to be transported from the port of Varandey if ice-class
Prirazlomnoe deposit
-
6.5
8
tankers with a deadweight of 70 000 tonnes are constructed by that
Port of Belomorsk
-
-
0.52
time. If not, the volume of oil transport from the port of Varandey wil
Total
8.5
19.6
28.5
Notes: 1Only if ice-class tankers with a deadweight of 70 000 tonnes are constructed by that time,
be 3 mil ion tonnes. In total 19.6 mil ion tonnes of oil are planned to be
otherwise the volume will be 3 million tonnes. 2The port is planned to be constructed by that time.
transported along the coast of the Kola Peninsula in 2010.
(Source: Murmansk Region Administration 2003)
In 2015, 12 mil ion tonnes of oil are planned to be shipped from the
exactly the vessels that are in focus when speaking of the increased oil
port of Varandey if ice-class tankers are constructed by that time. In
transport in the region. During recent years, Finnish tankers of Vikia,
addition, construction of a new pipeline is planned, by which oil will
Tebo Olimpia and Kihu Classes mainly carried out the shipping of oil
be piped from deposits in West Siberia to Murmansk, to be reloaded
from Murmansk. Some of them have double hul s.
there on large-capacity tankers. The pipeline will be laid either on the
bottom of the White Sea Gorlo (the strait connecting the White Sea with
Insufficient potential of emergency services
the Barents Sea) or on land from the Leningrad Region. The planned
The main control ing body over oil spills in the Russian part of the
volumes of oil transport by the pipeline are 80 million tonnes per year
region is the Murmansk Basin Agency for Emergency Situations
(Murmansk Region Administration 2003).
equipped with necessary equipment for cleaning up relatively small
oil spills (up to 500 tonnes) in the vicinity of the Kola Peninsula coast.
Lack of experience in large-tonnage tanker navigation under
However, this organisation is unable to cope with large-scale oil spil s
Arctic conditions
especial y any occurring under ice conditions in the remote areas of
Tanker transportation under Arctic conditions entails a set of natural
the Pechora Sea.
factors; polar night, seasonal ice and frequent storms. Al this
presupposes special requirements of the crew. With the increase of
Root causes
tonnage (from 20 000-49 000 tonnes to 150 000-300 000 tonnes),
Economic and political (strategic)
hydrometeorological and navigational risks grow correspondingly,
An export-oriented Russian economy is perceived by many as a root
especial y in narrow passages, close by the coastline and under ice
cause for increased oil and gas exploitation and transport in the Barents
conditions when icebreakers pilot the tankers.
Sea, and, as a result, for possible increase in oil spil accidents. At present,
this leads to:
Oil and petroleum products in the Arctic are mainly shipped by ice-class
tankers. Most tankers have a deadweight of less than 20 000 tonnes.
The opening of new oil and gas provinces including those of the Arctic
A binding requirement for ice-class tankers is double hul and sides
shelf
regulated by the International MARPOL Convention. To ship oil products
According to the energy strategy of Russia for the period before 2020,
in the Arctic, until recently the ice-class tankers of the Ventspils and
the exploitation of oil and gas deposits on the sea shelf is defined as one
Partizanok Classes with deadweights of 16 500 and 2 500 tonnes were
of the priority directions in the development of the Russian oil and gas
used in Russia.
industry. The marine share of oil extraction in Russia might reach 10 to
15% by the year 2010 with further growth anticipated. The reserves of
In 1984-1985 a series of six Ventspils Class tankers with double hull was
the continental shelf are able to provide for high levels of oil extraction,
constructed. At present, these vessels are out of date and their operation
which may constitute in 2020 up to 20% of the total volume of oil and
under Arctic conditions are limited. To replace them the Astrakhan' Class
up to 45% of the total volume of gas in Russia.
tanker was proposed, which can operate without being escorted by an
icebreaker and which is able to break ice 0.5-1 m thick. Eight such vessels
The Pechora and south Barents areas are the most prominent as regards
with a deadweight of 20 000 tonnes have been constructed. These are
to oil and gas supplies on the Russian shelf. 10 million tonnes of oil and
62
GIWA REGIONAL ASSESSMENT 11 BARENTS SEA
CAUSAL CHAIN ANALYSIS
63
Impacts
Issues
Immediate causes
Sectors/Activities
Root causes
Environmental:
Economic and political (strategic):
- Reduced abundance of
- Russian long-term export-oriented
macrophytes and zoobenthos
energetic strategy aimed at
- Reduction of fish stocks
Increased oil transport
increased development of the
- Increased mortality of birds and
through the Barents Sea
Oil spill accidents
Oil extraction and
Arctic shelf and exploitation of its
mammals
transport
oil and gas reserves
Lack of experience in
Corporative and economic (tactical):
tanker navigation under
Socio-economic:
Arctic conditions
- Domination of short-term aims over
- Increased costs for clean-up
long-term ones for the most of
- Reduced revenue from fisheries
Russian oil companies
and aquaculture
Insufficient potential of
- Insufficient investments of oil
- Loss of employment and
rescue and technical services
companies into ecological
decrease in living standard in
(lack of equipment for clean-
programmes and modernisation of
coastal settlements
up of large oil spills)
tankers
- Loss of recreational use and
aesthetic value for tourist sites
Legislative and regulatory:
- Reduced tourism revenue
- Insufficient legislation
- Absence of the coordinated
ecological and economic
programmes for the development
of the Russian Arctic shelf
Figure 21 Causal chain diagram illustrating the causal links for oil spills.
50 million m3 of gas are expected to be extracted there in 2010 with an
pipeline is going to be laid from Siberia to the Murman coast (the area
increase by the year 2020 of up to 30 million tonnes and 130 million m3
of Teriberka, Kil'din Island and Ura Bay). This wil significantly increase
respectively (Murmansk Region Administration 2003).
the export volume of oil through the Barents Sea.
The oil and gas complexes in the region will be based on the deposits
Corporative and economic (tactical)
already exploited (Prirazlomnoe, Severo-Medynskoye, Severo-
Dominance of short-term and medium-term goals over the long-
Gulyayevskoye, Varandey-more, Pomorskoye, and Dolginskoye) and will
term for most of the Russian oil companies;
be further developed with the opening of new oil and gas deposits.
Insufficient investment in infrastructure (information centres,
The basis for gas exploitation is the Stockman gas condensate deposit.
emergency services, monitoring systems, construction of double-
Its supplies, together with the Ledovoye and Ludlovskoye deposits,
hull tankers, etc.) in most of the companies;
constitute a good resource potential for gas extraction. Coastal and
The absence of coordinated plans and activities on the exploitation
marine oil and gas complexes will be able to use the system of oil and
of oil deposits, oil transport to temporary terminals and to export
gas pipes already existing and those planned for construction for home
destinations.
and export purposes.
Legislative and regulatory
The other way of oil and gas transport for export to the west (the U.S.
There are stil too many gaps in the Russian legislation, including
and European countries) and to the East (the U.S. and countries of the
that concerning the Arctic. An insufficient legislative system, not
Asian-Pacific region) is the Northern Sea Rout. The leading role here
answering to the Arctic conditions, is a serious problem effecting
wil belong to large-tonnage ice-class tankers (Murmansk Region
further development of the Russian Arctic and consequently its
Administration 2003).
impact on the environment.
Russia has not yet joined the OSPAR international conventions
Rapid growth of oil export volume
and the Protocol of the European Commission on Strategic
At present, part of the oil from the ports in the White Sea and oil
Environmental Assessment.
deposits located in the eastern part of the Barents Sea, in the Nenets
The absence of EIA procedures for complex oil and gas activities
Autonomous Region and Siberia, is transported to the port of Murmansk.
in Russia (fitting out several neighbouring oil deposits, floating
There it is reloaded on large-tonnage tankers to be further exported to
terminals and other sources of potential danger for environment).
the west. This technology is going to be further developed in the very
The absence of a coordinated ecological and economic programme
near future with an increase in export volume of up to 9 million tonnes.
for the development of oil and gas activities on the Arctic shelf in
For this purpose, three floating terminals are intended in the Kola Bay
the framework of sustainable exploitation of, and management
(in the areas of Kulonga, Belokamenka and Mishukovo). A new oil
over, marine resources of the region.
64
GIWA REGIONAL ASSESSMENT 11 BARENTS SEA
CAUSAL CHAIN ANALYSIS
65
Conclusion
The analysis suggests the fol owing immediate causes of potential oil
spil s in the Barents Sea:
Increased oil transport through the Barents Sea;
Lack of experience in large-tonnage tanker navigation under Arctic
conditions;
Underdevelopment of emergency services (lack of equipment for
clean-up of large oil spil s).
The root causes of the issue are:
Economic and political; overal direction of the Russian economy
in the sphere of oil and gas exploitation to the increased export of,
and prospecting for oil and gas, where the Russian Arctic shelf plays
a significant role;
Absence of long-term, wel -coordinated plans for the development
of the Arctic shelf, preventing oil companies from investing into
ecological programmes and re-equipment of the tanker fleet;
Lack of legislative initiative.
The linkages between root and immediate causes and their
environmental and socio-economic consequences are presented in
Figure 21.
64
GIWA REGIONAL ASSESSMENT 11 BARENTS SEA
CAUSAL CHAIN ANALYSIS
65
Policy options
This section aims to identify feasible policy options that target
in both Russia and Norway. Overfishing is also a focus of interest of the
key components identified in the Causal chain analysis in order to
UNO, FAO and other world organisations related to the environmental
minimise future impacts on the transboundary aquatic environment.
protection. Thus, although the concern Unsustainable exploitation of
Recommended policy options were identified through a pragmatic
fish and other living resources was assessed as having moderate impact
process that evaluated a wide range of potential policy options
at present, it was predicted to improve by 2020, both regarding the
proposed by regional experts and key political actors according
environmental and the socio-economic impacts.
to a number of criteria that were appropriate for the institutional
context, such as political and social acceptability, costs and benefits
Root causes
and capacity for implementation. The policy options presented in
The root causes behind overexploitation of fish were identified as:
the report require additional detailed analysis that is beyond the
Economic: overinvestment, unequal payments for the access to
scope of the GIWA and, as a consequence, they are not formal
bioresources, price of vessels' quota-rights, high taxes and fish
recommendations to governments but rather contributions to
prices, failures of economic reforms in Russia, and market failures.
broader policy processes in the region.
Technological: low selectivity of fishing gear, and lack of alternative
fishing gear.
According to the results of the Scaling and scoping, and the Causal
Political: disagreements within the Joint Norwegian-Russian
chain analysis, the following issues were chosen for the Policy option
Fisheries Commission regarding the setting of annual TAC.
analysis:
Governance: imperfection of fishery control systems, gaps in fishery
Overexploitation of fish;
statistics, and faults in the fishery management system.
Modification of ecosystems;
Legal: inappropriate legislation regulating the fisheries sector in
Oil spil s;
Russia.
Radionuclides.
Knowledge: scientific uncertainty, and inappropriate assessment
methods.
Policy framework
Overexploitation of fish
The legal basis for fishery policies in the Barents Sea region is the Third
United Nations Conference on the Law of the Sea (UNCLOS) from 1982,
Problems
and national regulations on the protection of water living resources
The analysis of the root causes behind the overexploitation of fish
adopted in accordance with the Law of the Sea Convention.
concludes that the existing fisheries practices during the past two
decades have the potential to completely undermine the stocks of the
The national regulations relevant to overexploitation of fish are:
commercial y most valuable fish species in the Barents Sea. However, such
a) In Norway:
a pessimistic prediction is believed to be unlikely, as an understanding of
Law on the Norwegian Territorial Sea and contingent zone of
the necessity to stabilise the situation in the fisheries sector has increased
27.06.2003, establishing a 12 nautical mile territorial sea.
66
GIWA REGIONAL ASSESSMENT 11 BARENTS SEA
POLICY OPTIONS
67
Law on the Norwegian Exclusive Economic Zone of 17.12.1976,
agreed upon and several actions to achieve sustainable fisheries were
establishing the Norwegian Exclusive Economic Zone (EEZ).
suggested (WSSD 2002). The UNCED Agreement sketched the key
The Law on the right to participate in the fisheries of 26.03.1999,
provisions for the protection of the marine environment and coastal
which regulates the participation in the fisheries. It establishes that
areas and protection, rational use and development of living marine
participation is limited to nationals, technical criteria for the fishing
resources.
vessels and registration and licensing regulations.
The Law on first-hand sales of fish of 14.12.1951, which regulates the
The above-mentioned national and international laws and agreements
sale of fish at first-hand, from fisher to buyer. It dictates that all such
have formed the basis for the suggested policy options.
sales shal be conducted through mandated sales organisations.
These organisations have the mandate to regulate prices and, in
Achievements and unsolved problems
specific cases, the conduct of fisheries.
Although measures to decrease overexploitation of fish have been taken
in both Norway and Russia in recent years, serious problems stil remain.
b) In Russia:
Therefore, both the main achievements leading to improvement of the
Federal Law on the continental shelf of the Russian Federation from
situation in the fisheries sector and the obstacles that stil remain are
1995.
presented.
Federal Law on the Exclusive Economic Zone of the Russian
Federation.
Achievements
The United Nations Fish Stocks Agreement of 1995 (UN 1995),
The principles regulating the work of the Joint Norwegian-Russian
applying to straddling fish stocks such as cod and herring, dictates
Fisheries Commission (Norwegian Ministry of Fisheries 2004) have also
that States shal apply the precautionary approach (Article 6).
been taken into consideration. The Commission sets total al owable
To execute this agreement, the principles, parameters and
catches (TACs) for the shared fish stocks (cod, haddock and capelin),
models applied for stock assessments in the Barents Sea have
throughout their migratory routes across borders of jurisdiction in
been changed. For example, recommendations have changed
the Barents Sea. The TACs are based on scientific advice from the
from one specific catch-level, to a series of options with various
International Council for the Exploration of the Sea (ICES 2003b) and
consequences. ICES's recommendations have changed from being
national research institutions. The parties also exchange fishing quotas
based on maximum sustainable yields (MSY) to be based on the
according to established fishing patterns and provide mutual access
basis of the precautionary approach. Moreover, fol owing a revision
to fish in each others national EEZs. During the 1990s, cooperation
of historical catch data, the precautionary reference points (B 1
pa
in control and enforcement as wel as in marine research has been
and B 2
lim ) for the cod stock were altered (ICES 2003).
strengthened.
To handle political pressures within the Joint Norwegian-Russian
For the policy option analysis, other international documents and
Fisheries Commission and the scientific uncertainties related to the
agreements, aimed at improvement and better coordination of
development of fish stocks, the parties have established a decision-
international cooperation on the problem of overfishing, have also been
making rule for the setting of TACs for cod and haddock entering
used, e.g. United Nations Food and Agriculture Organization (FAO 2004)
into force in 2004. Based on the scientific estimates of F 3
pa for the
and FAO's Code of Conduct for Responsible Fisheries (FAO 1995).
fol owing 3 years, the TACs shal be set according to the average value
of the 3-years prediction. The fol owing year, the same procedure
Also at the international level the policy to achieve sustainable fisheries
is fol owed, however the TACs shal not vary more than ±10% for
management and sustainable development of marine and coastal areas
cod and ±25 for haddock, from the previous year's TAC (Norwegian
and their resources was defined in the text of the two international
Ministry of Fisheries 2002). In cases where the stocks fal bel ow
documents: World Summit on Sustainable Development (WSSD 2002)
precautionary levels (Bpa), lower quotas shal be considered by the
and United Nations Conference on Environment and Development
Commission. The effectiveness of the decision-making rule to ensure
(UNCED 1992).
the sustainability of the Barents Sea fisheries remains to be seen.
At the World Summit on Sustainable Development in Johannesburg
Since 1993, Norway and Russia have increased their cooperation
in 2002, sustainable fisheries were discussed and an action plan was
on control and enforcement through a permanent working-
1B = Biomass precautionary approach reference point. 2B = Biomass below which recruitment is impaired. 3F = Fishing mortality precautionary approach reference point.
pa
lim
pa
66
GIWA REGIONAL ASSESSMENT 11 BARENTS SEA
POLICY OPTIONS
67
Figure 22 Fishing boat at sea.
(Photo: Getty Images)
group under the Joint Norwegian-Russian Fisheries Commission.
directions of the state policy in the sphere of the development of
The cooperation of enforcement agencies has been formalised
the fisheries sector of Russia for a long-term period. The conception
facilitating the exchange of catch information, inspection data and
presents an analysis of the current situation in the Russian fisheries
exchange of inspectors. In addition, both parties have implemented
sector, its problems, aims and tasks to be solved.
vessel-monitoring systems (VMS), in the Norwegian case for vessels
over 24 m. In Russia, to decrease negative effects of overexploitation
Existing problems
of fish stocks, the time at sea for vessels was limited in 2002 and
a) General problems:
the above-mentioned vessel-monitoring system was introduced.
Increased competition in the world fisheries and general
However, such practices, already introduced in some EU countries,
deterioration of fisheries conditions.
have proven to have low effectiveness as they only reduce but do
Dominance of political and economical considerations in the
not eliminate overfishing (Ozolin'sh & Spiridonov 2001).
work of the Joint Norwegian-Russian Fisheries Commission,
Norway is to establish an integrated management plan for the
which in some cases leads to TACs being set beyond scientific
Barents Sea in 2005. The aim of this plan is to provide for industrial
recommendations. Negotiations of the Joint Norwegian-Russian
development and environmental protection within the framework
Fisheries Commission on the setting of TACs are not open to the
of an ecosystem approach. The plan is to be developed in
public.
cooperation between the Ministries of Fisheries, the Environment,
Inability of the Commission to establish other regulatory
and Foreign Affairs and of Petroleum and Energy.
measures.
In 2003, Russia established the Conception of the development of
Overcapacity of the fishing fleet exceeding the stocks of commercial
its fishery sector till the year 2020. The conception defines the main
species in the Barents Sea.
68
GIWA REGIONAL ASSESSMENT 11 BARENTS SEA
POLICY OPTIONS
69
Lack of an efficient state regulatory system for sustainable long-
The analysis of the root causes and achievements in the sphere of the
term management of marine living resources.
protection of living resources, and existing problems, al ows an array of
Vulnerability of fisheries to the impact of anthropogenic factors and
measures to be developed, aimed at sustainable exploitation of living
natural variability which increases the financial risk both in fisheries
resources in the Barents Sea.
and the fishing industry as a whole.
Lack of efficient state policy to decrease unemployment among
Policy options
fishermen, to support the coastal fishery and to increase the
Table 37 presents the root causes and policy options for overexploitation
living standard of coastal settlements, for which the fishery is the
of fish. Some of the policy options have been discussed by Government
traditional backbone of the economy.
of the Russian Federation (2003), Dvornyakov (2000), Voitolovsky et al.
Lack of an efficient mechanism to control il egal fishing.
(2003) and Titova (2003).
Gaps in fisheries statistics, low quality of collected data on which
science is based.
The main purpose of the development of the fisheries sector for the
Lack of knowledge on the ecology of some commercial species
period til 2020 is the restoration of the fish stocks and the increased
and the features of the Barents Sea ecosystem. All this implies great
sustainability of their exploitation. There are several international
scientific uncertainty.
agreements relating to sustainable fisheries and suggested actions to
Lack of knowledge on the impacts of natural variability and
increase sustainability of the world fisheries.
anthropogenic factors on the Barents Sea ecosystem, which makes
their effects difficult to forecast and reduces the quality of long-
World Summit on Sustainable Development (WSSD) concerning
term predictions.
Sustainable Fisheries
Paragraph 31 of the WSSD (2002) suggests to; "maintain or restore stocks
b) Russian problems:
to levels that can produce the maximum sustainable yield with the aim of
Economic crisis resulting from mistakes made in the transitional
achieving these goals for depleted stocks on an urgent basis and where
period. Lack of efficient state policy and state support for the
possible not later than 2015". The Barents Sea ecosystem is dynamic, and
national fishery sector under the conditions of market reforms.
capelin and herring undergo cycles, which not only has consequences
High level of mechanical wear and obsolescence of the fishing fleet
for these stocks but also the availability of food for cod and haddock
in Russia, and a low selectivity of the fishing gear.
(major commercial species in the Barents Sea fisheries). Thus, managers
Overfishing of the commercial y most valuable species on the
have to take into account ecosystem considerations (anthropogenic and
world market (cod and haddock) together with the decrease in
biophysical factors) in the management of the Barents Sea fisheries.
state control over the fishermen's export activities.
Increased export-oriented fishery with a reduction in fish
The document also suggests an "implementation of the 1995 Code of
consumption by the population in Russia.
Conduct for Responsible Fisheries..." and a development of national
Lack of an efficient policy to control by-catches and discards and
and regional plans of action for eliminating il egal, unreported and
lack of financial support for the processing of fish of low market
unregulated fisheries by 2004. Another suggestion was to "establish
value.
effective monitoring, reporting and enforcement, and control of fishing
Lack of transparency in the system of al ocation of fishing quotas,
vessels" (WSSD 2002).
which leads to increased corruption, il egal transactions and
conflicts between groups of fishermen.
United Nations Conference on Environment and Development
Under-development of financial-credit relationships, lack of an
Chapter 17 in UNCED (1992) "Protection of the Oceans, All Kinds of Seas,
efficient market for fish products and market infrastructure.
Including Enclosed and Semi-enclosed Seas, and Coastal Areas, and the
Absence of a Federal Law on fishery, protection and conservation
Protection, Rational Use and Development of Their Living Resources"
of marine living resources, which would meet the requirements
suggests several actions:
of sustainable exploitation of living resources, market realities and
"To consider establishing, or where necessary strengthening,
prevention of poaching and corruption. Without such a law many
appropriate coordinating mechanisms (such as a high-level policy
provisions of the "Conception of the development of the fishery sector
planning body) for integrated management and sustainable
of the Russian Federation til the year 2020" cannot be realised.
development of coastal and marine areas and their resources, at
both the local and national levels."
68
GIWA REGIONAL ASSESSMENT 11 BARENTS SEA
POLICY OPTIONS
69
Table 37 Root causes and policy options for overexploitation of fish in the Barents Sea region.
Root cause
Policy option
- To develop the joint Norwegian-Russian conception for the sustainable exploitation of fish in the Barents Sea and a long-term strategy to realise its conceptional
Political:
provisions.
- Disagreements within the Joint Norwegian-
- To improve the legislative and organisation base for cooperation between the two countries to create favourable conditions in the Barents Sea for sustainable
Russian Fisheries Commission regarding the
exploitation of fish on the basis of the precautionary approach.
setting of annual TACs.
- To ensure the transparency of the work of the Joint Norwegian-Russian Fisheries Commission when setting the TACs for public non-governmental organisation.
Legal:
- To adopt the Law on the Protection and Exploitation of Marine Living Resources of the Russian Federation aimed at establishing the principles of sustainable fishery.
- Inappropriate legislation regulating the fisheries - To form priorities of the policy aimed at sustainable exploitation of living resources and creation of a single state system to realise these priorities.
sector in Russia.
- To develop long-term national programmes to realise the provisions of the Code of Conduct for Responsible Fisheries under the conditions of the Barents Sea.
- To develop and realise financial mechanisms contributing to establishing the principles of responsible fisheries.
Economic:
- To create state funds to support the reduction in number of fishing vessels operating in the fisheries sector to decrease the overcapacity of the fishing fleet.
- Over-investment;
- State support of alternative measures to decrease the fishing load on the natural fish stocks (e.g. artificial reproduction of fish stocks, development of aqua- and
- Unequal payments for the access to bioresources; mariculture).
- Price of vessels quota-right;
- To develop and realise measures to increase socio-economic sustainability of the fisheries sector.
- High taxes and fish price;
- To adjust the taxation system to the specific character of the fisheries sector (increased risk due to instability of fish reserves), reinforcement of control over the
- Failures of economic reforms in Russia;
increased prices for fuel.
- Market failures;
- To initiate the protection of interests of coastal fishery and coastal fishing settlements and communities.
- Socio-economic problems in the fisheries sector. - For Russia: To develop and realise the state social strategy for the fisheries sector aimed at securing optimal employment and stable earnings of the employed in the
fisheries sector.
- State support of the development of coastal infrastructure of the fishing industry and aquaculture on the coast of the Barents Sea.
Technological:
- To develop legislative and organisation measures to establish the system for ecological y safe fisheries (ecological certification of fisheries) (see Annex IV).
- Low selectivity of fishing gear;
- For Russia: To adapt to Russian conditions the positive Norwegian experience in the struggle against by-catches and discards.
- Lack of alternative fishing gear;
- To develop measures of state support to increase the selectivity of the fishing gear and re-equip the fishing fleet.
- Il egal fishing methods.
- State support of the development of the system for processing of commercial y less valuable fish, which is caught as by-catch.
- To develop and realise measures to increase the effectiveness of the system of the state control over the exploitation and protection of marine living resources.
- More stringent measures on enforcement and control.
Governance:
- More stringent control over vessel documentation and fishing statistics.
- Imperfection of fishery control system;
- For Russia: To adjust the quotas to the vessels capacity (e.g. a quota should not be less than 70% of the vessel capacity as low quotas provoke increased il egal fishery).
- Gaps in fishery statistics;
- More stringent control over the time of vessels at sea.
- Fault of the fishery management system.
- To increase the transparency and justice of the state system of quotas al ocation, providing of free quotas for smal -scale coastal fishery and coastal settlements.
- Obligatory registration of all catches and all export transactions on land.
- Reinforcement of state control over the export of fish.
Knowledge:
- Scientific uncertainty;
- Detailed analysis of the gaps in knowledge, development of long-term research programme for their elimination.
- Inappropriate assessment methods.
"To undertake measures to maintain biological diversity and
sustainable use of fisheries resources so as to ensure that fisheries
productivity of marine species and habitats under national
operate under economic conditions that promote responsible
jurisdiction."
fisheries. Such mechanisms should include monitoring of the
"To improve their capacity to col ect, analyse, assess and use
capacity of fishing fleets.
information for sustainable use of resources, including environmental
The efficacy of conservation and management measures and their
impacts of activities affecting the coastal and marine areas."
possible interactions should be kept under constant review.
"To cooperate international y."
States and sub-regional and regional fisheries management
organisations and arrangements, in the framework of their
Code of Conduct for Responsible Fisheries
respective competences, should introduce measures for depleted
The Food and Agriculture Organization, FAO, has developed this
resources and those resources threatened with depletion that
code of conduct to set out principles and international standards of
facilitate the sustained recovery of such stocks. They should make
behaviour for responsible practices (FAO 1995). The objective is to
every effort to ensure that resources and habitats critical to the
prepare guidelines for the effective conservation, management and
wel -being of such resources, which have been adversely affected
development of living aquatic resources, with due respect to the
by fishing or other human activities, are restored.
ecosystem and biodiversity. Here four fishing management measures
relevant for overfishing in the Barents Sea Region are stated:
The policy options concerning elimination of gaps in knowledge and
States should ensure that the level of fishing permitted is
scientific uncertainty identified in this report are closely connected
commensurate with the state of fisheries resources.
to the actions suggested by WSSD (2002) paragraph 36 such as:
Where excess fishing capacity exists, mechanism should be
"improving the scientific understanding and assessment of marine
established to reduce capacity to levels commensurate with the
and coastal ecosystems as a fundamental basis for sound decision
70
GIWA REGIONAL ASSESSMENT 11 BARENTS SEA
POLICY OPTIONS
71
making..." and "building capacity in marine science, information and
Scientific: lack of knowledge on the acclimatisation of alien species
management, through, inter alia, promoting the use of environmental
in the Barents Sea. A large-scale biological experiment was initiated
impact assessments and environmental evaluation and reporting
and conducted without scientific assessment of its consequences
techniques, for projects or activities that are potentially harmful to
for the ecosystem as a whole.
the coastal and marine environments and their living and non-living
Legal: lack of regulations on treatment of bal ast water and farming
resources". The above-mentioned international agreements have
and introduction of commercial species at the regional, national
formed a basis for the suggested policy options for the Barents Sea
and international levels.
region.
Policy framework
Conclusions
The major international document on mitigation of the modification
In the course of the Causal chain analysis the GIWA Task team
of ecosystems and maintenance of their biological diversity is the
concluded that the root causes behind overexploitation of fish are
Convention on Biological Diversity (CBD 1992). At least 157 States,
difficult to change in a short-term period; time and considerable
including Russia and Norway, signed the Convention. The objectives
resources are required. In addition to compliance to international
of this Convention, to be pursued in accordance with its relevant
agreements, disagreements in the decision-making process within the
provisions, are the conservation of biological diversity, the sustainable
Joint Norwegian-Russian Fisheries Commission should be eliminated.
use of its components and the fair and equitable sharing of the benefits
The elimination of root causes of overexploitation first of al relates
arising out of the utilisation of genetic resources, including appropriate
to the development and implementation of measures to formulate
access to genetic resources and appropriate transfer of relevant
compatible rules for al countries. Furthermore, measures to reduce
technologies, taking into account al rights over those resources and
unemployment among fishermer must be taken to establish a system
technologies, and appropriate funding.
of social protection for coastal settlements and coastal fishery. For
Russia a matter of special concern is improving of standard of living
Article 6 "General Measures for Conservation and Sustainable Use" of the
of the population.
CBD (1992) suggests: "Each Contracting Party shal , in accordance with
its particular conditions and capabilities; Develop national strategies,
plans or programmes for the conservation and sustainable use of
biological diversity or adapt for their purpose existing strategies, plans
Modification of ecosystems
or programmes which shal reflect, inter alia, the measures set out in this
Convention relevant to the Contracting Party concerned; and Integrate,
Problems
as far as possible and as appropriate, the conservation and sustainable
The fol owing problems can be defined:
use of biological diversity into relevant sectoral and cross-sectoral plans,
Intentional introduction of commercial species into the Barents Sea
programmes and policies."
by the former Soviet Union;
Increased export volumes of oil shipped through the Barents Sea
Article 8 "In-situ Conservation" of the CBD (1992), also suggests actions
and a corresponding increase in volume of bal ast water into the
such as: "prevent the introduction of, control or eradicate those alien
Barents Sea;
species which threaten ecosystems, habitats or species" and to "develop
Inadequate infrastructure; the absence of tank/hul cleansing
or maintain necessary legislation and/or other regulatory provisions
facilities;
for the protection of threatened species and populations" (CBD
Lack of national and regional regulations for farming and
1992). According to article 10 (CBD 1992) it is important to "integrate
introduction of commercial species, as wel as for treatment of
consideration of the conservation and sustainable use of biological
bal ast water.
resources into national decision-making".
Root causes
The policy to achieve sustainable use of biological resources and
The root causes identified for modification of ecosystems were:
avoid or mitigate the modification of ecosystems was also defined
Economic: increased oil and gas export from Russia through the
in the WSSD (2002), paragraph 34: "Enhance maritime safety and
Barents Sea.
the protection of the marine environment from pol ution by actions
Technological: lack of tank- and hull cleansing facilities.
at al levels to: Accelerate the development of measures to address
70
GIWA REGIONAL ASSESSMENT 11 BARENTS SEA
POLICY OPTIONS
71
invasive alien species in bal ast water. Urge the International Maritime
three years in special depositories at coastal stations of the Northern
Organization to finalise its draft International Convention on the Control
Navy and on the floating bases Lotta and Imandra of the Murmansk
and Management of Ship's Bal ast Water and Sediments".
Shipping Company. SNF is transported to the radioactive waste
treatment plant Mayak in a special train. Accumulation of large amounts
Other suggestions were to "effectively conserve and sustainably use
of SNF is a potential source for radioactive accidents.
biodiversity, promote and support initiatives for hot spot areas and
other areas essential for biodiversity and promote the development
In addition to the problem of storage and transportation of SNF, there
of national and regional ecological networks and corridors" and to
is another problem of considerable importance for the Kola Peninsula:
"strengthen national, regional and international efforts to control
the treatment of SNF that cannot be reprocessed at Mayak. There are
invasive alien species, which are one of the main causes of biodiversity
642 heat-emitting constructions no longer in use, with an activity
loss, and encourage the development of effective work programme on
28×1015 Bq, that are kept on the floating technical base Lepse; SNF
invasive alien species at all levels" (WSSD 2002, paragraph 44).
not subjected to treatment that is kept on the floating technical base
Lotta; and defective SNF at coastal stations of the Northern Navy (State
Policy options
Environmental Committee of the Murmansk Region 1999).
The above-mentioned international agreements have formed a basis
for the suggested policy options, which are:
Handling radioactive waste
Compliance to recommendations of scientific organisations when
Liquid radioactive waste (LRW)
developing the policies, plans and programmes for the exploitation
The Civil Atomic Fleet has not been discharging LRW into the sea
of the introduced species;
since 1986, and the Northern Navy not since 1992. Accumulation and
Compliance to regulations for the transport of alien commercial
temporary storage of LRW is carried out in special coastal depositories
species;
or on special vessels, which are almost total y fil ed in the Northern
Increased measures to control the introduction of invasive alien
Navy. LRW is not accumulated in the Civil Atomic Fleet as it is being
species, including the introduction through bal ast water;
entirely reprocessed at the Repairing and Technological Enterprise (RTE)
Fines for non-compliance;
ATOMFLOT. LRW from the Northern Navy is only partial y reprocessed
Adoption of regulations at the international level, including those
at this enterprise. The experimental radioactive waste treatment plant
regulating the treatment of bal ast water.
at RTE ATOMFLOT is being modernised at present. The purpose of the
modernisation is to increase its capacity from 2 000 to 5 000 m3 per
year and the possibility to reprocess LRW of all types. Realisation of this
project will enable the problems of the treatment of LRW from the Civil
Radionuclides
Atomic Fleet and the Northern Navy based in the region to be solved.
Problems
Another vital problem for the Northern Navy is the technical state of
The fol owing problems can be defined in the field of ensuring nuclear
special vessels used for the accumulation and storage of LRW. Their life
and radioactive security in the region:
(exploitation period) is over and their maintenance is highly expensive.
Storage and treatment of spent nuclear fuel (SNF);
Since the beginning of the exploitation of the Kola Nuclear Power
Storage and treatment of liquid radioactive waste (LRW) and hard
Plant, more than 6 000 m3 of LRW have been accumulated, which are
radioactive waste (HRW);
now kept in special reservoirs. The reservoirs are fil ed up to 80% (State
Radiological safety of decommissioned nuclear powered
Environmental Committee of the Murmansk Region 1999).
submarines and coastal technical stations of the Russian Navy;
Storage and transportation of radioactively dangerous materials,
Hard radioactive waste (HRW)
radioactive substances and isotope products;
Most of the HRW comes from the maintenance and repair of nuclear
Radiation (radiological) terrorism.
power plants. At present more than 16 000 m3 of HRW are kept in
depositories of the Civil Atomic Fleet, Northern Navy and the Kola
Storage and treatment of spent nuclear fuel
Nuclear Power Plant. The Kola Nuclear Power Plant reprocesses
Spent nuclear fuel (SNF) is a product of military and civil transport
combustible HRW at a combustion instal ation. Other types of HRW
reactors. When unloaded from a reactor, SNF must be kept for about
are kept without treatment in depositories, which are now almost total y
72
GIWA REGIONAL ASSESSMENT 11 BARENTS SEA
POLICY OPTIONS
73
fil ed up. HRW from the Civil Atomic Fleet is kept in special depositories
Root causes
at RTE ATOMFLOT and on special vessels for technical maintenance.
The root causes identified for radionuclide pollution were:
Depositories for the storage of definite types of HRW are now fil ed
Geopolitical: creation of a powerful nuclear-powered navy and
up to 100%.
icebreaker fleet in the former Soviet Union, which has lead to the
Kola Peninsula being overcrowded with radioactively dangerous
The Northern Navy has not enough depositories for its HRW. Those
sites, objects and decommissioned submarines.
available do not correspond to standards, are exposed to precipitation,
Economic: lack of funding for timely reprocessing of spent
and are not being equipped with drainage systems, thus contaminating
nuclear fuel and radioactive waste and nuclear reactors from
the surrounding soils with radioactive substances.
decommissioned nuclear powered submarines and for radiological
protection activities.
The total activity of the accumulated HRW is 37×1012Bq. The total volume
of HRW increases by 1 000 m3 each year. If the intensification of work on
Policy options
the treatment of decommissioned nuclear powered submarines is taken
To decrease the possibility of radioactive contamination in the region,
into account, the amount should be double that presently available.
the activities of the State in the field of ensuring nuclear and radiation
There is no equipment for environmental friendly conditioning of HRW
security should encompass the fol owing:
in the Murmansk Region. Al HRW is kept under unacceptable conditions
Intensification of safety measures on the exploitation of civil and
(State Environmental Committee of the Murmansk Region 1999).
military nuclear reactors;
Timely reprocessing of SNF and decommissioned nuclear powered
Radiation safety for decommissioned nuclear powered
submarines;
submarines and coastal technical stations of the Russian Navy
Timely reprocessing of fissile substances from different kinds of
Since the end of the 1980s, many nuclear powered submarines have
weapon;
been decommissioned in Russia. The number of decommissioned
Timely transport of radioactive waste to reprocessing plants;
submarines greatly exceeds those reprocessed. In total, by September
Intensification of safety measures on the storage of radioactive
2003, 192 nuclear powered submarines have been decommissioned
materials;
in Russia, of which only 89 have been reprocessed. The unsatisfactory
Modernisation of systems of protection and control over
technical state of decommissioned submarines may result in
radioactively dangerous objects;
their accidental sinking, which may cause severe radio-ecological
Construction of new temporary storages for spent nuclear fuel and
consequences for the environment.
radioactive waste.
Storage and transportation of radioactively dangerous
The immediate cause of radioactive pol ution is the large amount of
materials, radioactive substances and isotope products
potential sources of radioactivity in the Russian part of the Barents Sea
Each year about 1 800 transportations of radioactive waste are carried
region. The economic causes are related to the radiological protection
out. On average, six to seven special trains transport radioactive
activities, the timely reprocessing of spent nuclear fuel and radioactive
materials every day. However, the available number of special trains
waste, and the accident-free exploitation of nuclear reactors of any
is unable to provide timely transport of radioactive materials from the
kind and radioactive waste storages. This is hampered by the overall
Kola Peninsula. There is a Russian-Norwegian Agreement aiming at
economic situation in Russia and lack of funding and to a certain
secure treatment of SNF, which may give the possibility of constructing
degree it also depends on taking political initiatives and on improving
new special carriages and vessels for the transport of SNF (State
the legislative base and eliminating bureaucratic obstacles. Thus, the
Environmental Committee of the Murmansk Region 1999).
root causes of the issue are difficult to change in the near future and
wil largely depend on the political and economic initiatives at both
Radio-ecological terrorism
national and regional levels.
Under the increasing threat of terrorism, the problem of security for
nuclear and radioactively dangerous productions and objects is an
issue of great concern. Radiological terrorism with the use of sources
of ionising radiation, widely used in different spheres of life, is of
considerable danger.
72
GIWA REGIONAL ASSESSMENT 11 BARENTS SEA
POLICY OPTIONS
73
Oil spills
Negotiations are being carried out to create an International Centre
for rescue operations at sea (Russia and Norway).
Problems
On the basis of the causal chain analysis, the fol owing conclusions
Unsolved problems
have been made:
Lack of appropriate equipment for the treatment of oil spil s under
Oil spil accidents in the region are inevitable in the future. They
ice conditions (Pechora Sea);
will be caused by a number of factors such as: increased navigation
The technical equipment and facilities of the Murmansk Basin Agency
activity, severe climatic conditions, lack of experience in tanker
for Emergency Situations is insufficient for the treatment of large or
navigation, imperfection of information system, and lack of double-
remote oil spil s occurring in areas hundreds of kilometres distant
hull tankers.
from the place of the Agency's location (e.g. in the Pechora Sea);
The possible scenarios for oil spil accidents are the fol owing: in the
Lack of double-hull tankers;
open sea, in ice, and in the coastal zone with the possible discharge
The general delay for five to seven years in the previously agreed
of oil to the coast (or in the coastal zone under ice conditions).
timetable of the development of the Russian Arctic shelf is
The environmental and socio-economic impacts for these three
hampering the funding of ecological programmes by oil and gas
scenarios will be different but the most severe consequences are
companies on a long-term basis;
likely for the third case. The possible damage wil depend on a
Increased volumes of oil transport in the Barents Sea increase the
number of factors such as: season, geographical extent, abundance
risk of oil spil accidents under the conditions of under-development
of bioresources in the contaminated area, duration in time, etc.
of coastal services;
Russia stil lacks a federal law regulating the responsibility for oil
Root causes
pollution like the Oil Pollution Act in the U.S.
The root causes identified for oil spil s were:
Economic and political (strategic): the overal direction of the
The Oil Pol ution Act (OPA) was prepared by the U.S. Congress and
Russian economy in the sphere of oil and gas exploitation to the
signed into law in August 1990, largely in response to rising public
increased export of, and prospecting for, oil and gas where the
concern fol owing the Exxon Valdez incident. The OPA improved the
Russian Arctic shelf plays a significant role.
nation's ability to prevent and respond to oil spills by establishing
Corporative and economic (tactical): absence of long-term,
provisions that expand the federal government's ability, and provide
wel -coordinated plans for the development of the arctic
the money and people necessary, to respond to oil spil s. The OPA also
shelf, preventing oil companies from investing into ecological
created the national Oil Spil Liability Trust Fund, which is available to
programmes and re-equipment of the tanker fleet.
provide up to 1 billion USD per spill incident.
Legal: lack of legislative initiative, and insufficient legislative base.
The OPA increased penalties for regulatory non-compliance, broadened
Achievements and unsolved problems
the response and enforcement authorities of the Federal government,
Achievements
and preserved State authority to establish law governing oil spill
At present in the Murmansk Region, the fol owing measures are realised
prevention and response. Russia has no similar law, while the existing
to decrease the risk of oil spill accidents:
legislation related to oil spil s is discrepant and does not provide strict
A plan for the clean-up of the Murmansk Region coast in case of an
control over the responsibility for oil pollution or effective measures to
oil spill has been developed and approved by the Governor of the
prevent and respond to oil spil s.
Murmansk Region;
On the initiative of the Murmansk Marine Shipping Company, a
Policy framework
system has been arranged for informing the governors of the
Measures to prevent oil spills accidents in the region are legislative
northern counties of Norway, Sřr-Varanger and Finnmark, of the
and technical. The legislative measures include international
number of Russian tankers heading westward along the Norwegian
conventions and agreements, national and regional legislation of
coast, and of their navigation schedule;
the Russian Federation. At the international level, measures on the
The Murmansk Basin Agency for Emergency Situations carries
prevention and clean-up of oil spills are regulated by international
out regular joint training at sea together with Norwegian rescue
conventions.
services;
74
GIWA REGIONAL ASSESSMENT 11 BARENTS SEA
POLICY OPTIONS
75
OSPAR Convention
out of the utilisation of genetic resources (CBD 1992). According to the
The Convention for the protection of the marine environment of the
Convention: "States have, in accordance with the Charter of the United
North-East Atlantic (known as the OSPAR Convention) is the basis for
Nations and the principles of international law, the sovereign right
national laws governing the discharge of off-shore drilling waste in the
to exploit their own resources pursuant to their own environmental
waters of the OSPAR signatory states: Belgium, Denmark (including,
policies, and the responsibility to ensure that activities within their
for these purposes, the self-governing provinces of the Faeroe
jurisdiction or control do not cause damage to the environment of
Islands), Finland, France, Germany, Iceland, Ireland, the Netherlands,
other States or of areas beyond the limits of national jurisdiction".
Norway, Portugal, Spain, Sweden and the United Kingdom of Great
Britain and Northern Ireland. OSPAR regulations thus cover al the
National level
oil-producing states of Western Europe. The EU is also a signatory,
At the national level in Russia, the measures to control oil spill accidents
as are Luxembourg and Switzerland. Russia has not yet joined this
are regulated by:
international agreement.
The Federal Law on environmental protection (adopted
27 December 2001);
The International Convention for the prevention of pollution of
The Federal Law on the wild life;
ships, 1973 (MARPOL 73/78)
The Law on the protected territories;
The Convention was adopted in 1973. This convention was subsequently
The Law on the ecological expertise;
modified by the Protocol 1978 relating thereto, which was adopted in
The Water Codex of the Russian Federation.
1978. The Protocol introduced stricter regulations for the survey and
certification of ships. It is to be read as one instrument and is usual y
Local level
referred to as MARPOL 73/78.
At the local level, control, treatment and remediation of oil spills
are regulated by the Regional Plan for the Liquidation of Oil-spill
This International Maritime Organization (IMO) Convention is the
Accidents. The link between the legislative base and concrete plans
most important global treaty for the prevention of pol ution from
and programmes is the Resolution of the Government of the Russian
the operation of ships. It governs the design and equipment of ships;
Federation of 21 August 2000 "Urgent measures to minimise the risk of
establishes the system of certificates and inspections; and requires
oil spil accidents" (the last wording of 15 April 2002). The Resolution
states to provide reception facilities for the disposal of oily waste and
approves "The general requirements for the development of plans
chemicals. It covers al the technical aspects of pol ution from ships,
on prevention and elimination of oil spil accidents". According to
except the disposal of waste into the sea by dumping, and applies to
the Resolution, oil spil s are classified as an emergency and are to be
ships of all types, although it does not apply to pollution arising out of
eliminated according to the legislation of the Russian Federation.
the exploration and exploitation of sea-bed mineral resources.
Depending on the size and volume, the oil spill accidents are classified
The Regulations for the Prevention of Pollution by Oil
as fol ows:
The Regulations entered into force 2 October 1983 and provide details
Local - the volume of oil spill is up to 500 tonnes;
on the discharge criteria and requirements for the prevention of
Regional - from 500 to 5 000 tonnes;
pollution by oil and oily substances. They maintain predominantly the
Federal - more than 5 000 tonnes.
oil discharge criteria prescribed in the 1969 amendments to the 1954
Oil Pollution Convention. Besides technical guidelines they contain the
Depending on the location of an oil spil and climatic conditions, the
concept of "special areas" which are considered to be vulnerable to
category of emergency may be increased. The plan on the prevention and
pol ution by oil. Discharges of oil within them have been completely
elimination of oil spil accidents is developed on the basis of the existing
prohibited, with minor wel -defined exceptions.
regulations al owing for the maximum possible volume of an oil spil .
Convention on Biological Diversity, 1992
The plan encompasses:
The Convention is a key instrument for the conservation and sustainable
Monitoring of possible oil spill accidents;
use of biological diversity. The objectives of the Convention are
Number of forces and facilities needed for treatment and
the conservation of biological diversity, the sustainable use of its
remediation following an oil spil accident and their correspondence
components and the fair and equitable sharing of the benefits arising
to the tasks of treatment activities;
74
GIWA REGIONAL ASSESSMENT 11 BARENTS SEA
POLICY OPTIONS
75
Organisation of cooperation between forces;
Composition and location of forces and facilities;
System of control and warning;
Securing of constant readiness of al forces, appointing the
organisations responsible for their upkeep;
System of information exchange;
Immediate actions after an emergency alarm;
Geographical, navigational, hydrographical, climatic and other
features of the area of an oil spill accident, which should be taken
into account when planning treatment and remediation activities;
Safety of the population, provision of medical aid;
Technical, engineering and financial provision.
When defining the number of facilities and forces needed for the
liquidation of oil spill accidents, the fol owing aspects should be taken
into account:
The maximum possible volume of leakage;
The area where the damaged object was brought into operation
and the year of the last overhaul of an oil spil ;
The maximum volume of oil kept at an object;
Physical and chemical properties of the spil ed oil;
Climatic, hydrographical, geographical and other conditions
influencing the spreading of an oil spil ;
The presence of terminals for the transport, storage and processing
of oil waste;
The transport infrastructure in the area of an oil spill accident;
The time needed for the transport of treatment and remedial forces
to the area of an oil spill accidents;
The time of oil spill localisation, which should be less than 4 hours
for an accident at sea and less than 6 hours for an accident on
land.
76
GIWA REGIONAL ASSESSMENT 11 BARENTS SEA
Conclusions and recommendations
The assessment carried out according to the GIWA methodology
Develop measures for cooperation and integration of
identified Unsustainable exploitation of fish and other living resources,
environmental and socio-economic aspects into the decisions of
Pol ution, and Habitat and community modification as the most
the Joint Norwegian - Russian Fisheries Commission;
important concerns for the Barents Sea region.
Ensure that the work of the Joint Norwegian-Russian Fisheries
Commission when setting the TACs, is ful y transparent to the
Among these concerns, Unsustainable exploitation of fish has the
public as well as non-governmental organisations.
most severe impacts on the Barents Sea aquatic system under present
conditions. Within this concern, overexploitation of fish is the most
Pol ution was identified as the second most important concern in
pressing issue. The Causal chain analysis identified the fol owing root
the Barents Sea region. The analysis performed in the framework of
causes for the overexploitation of fish:
this report, as wel as other publications of the past few years, has
Economic: overinvestment, unequal payments for the access
demonstrated that pollution of the Barents Sea is relatively low at the
to bioresources, price of vessels' quota-rights, high taxes, high
present time. The analysis suggests that the Barents Sea is much cleaner
fish prices, failures of economic reforms in Russia, and market
than other European seas, and that pol ution does not constitute a
failures;
threat to human health or ecosystems. However, due to the expansion
Technological: low selectivity of fishing gear, and lack of alternative
of oil and gas industries in the region, as well as increased shipments
fishing gear;
of oil and gas from east to west through the Barents Sea, the risk of
Political: disagreements within the Joint Norwegian-Russian
accidental oil spil s is expected to increase in the near future.
Fisheries Commission regarding the setting of annual TAC;
Governance: imperfection of fishery control systems, gaps in fishery
Root causes for potential oil spil s were identified as:
statistics, and fault of the fishery management system;
Economic and political (strategic): overall direction of the Russian
Legal: inappropriate legislation regulating the fisheries sector in
economy to increase exports of oil and gas, where prospecting
Russia;
and oil and gas development in the Russian Arctic shelf plays a
Knowledge: scientific uncertainty, and inappropriate assessment
significant role;
methods.
Corporate and economic (tactical): absence of long-term wel -
coordinated plans for the development of the Arctic shelf, which
Numerous scientific investigations have shown that al of the above-
prevents oil companies from investing in ecological programmes
mentioned root causes aggravate the situation in the fisheries of the
and re-equipment of the tanker fleet;
Barents Sea. To improve fisheries management, the fol owing set of
Legal: lack of legislative initiatives, and insufficient legislative base.
policy options have been suggested:
Use the Joint Norwegian-Russian Fisheries Commission to develop
Based on the world's experience in oil production on the sea shelf
measures for the sustainable exploitation of fish in the Barents Sea,
and taking into account the climatic and hydrographic features of the
including regulatory and economic instruments;
Barents Sea, a set of measures have been suggested to reduce the risk
of potential emergencies, including develop safety plans to prevent
CONCLUSIONS AND RECOMMENDATIONS
77
accidental oil spills, and contingency plans to respond to accidents,
of the Red king crab, as well as other alien species. There are concerns
which would encompass:
that competition between the Red king crab and commercial and non-
Systems of safety and monitoring of oil spill accidents;
commercial species for forage reserves could result in the decrease of
Forces and facilities needed for treatment and remediation
some commercial y important fish stocks of the Barents Sea.
fol owing an oil spill accident;
Organise cooperation between forces;
Another aspect of the problem is the unintentional introduction
Features of the area of an oil spil accident (geographic, navigational,
of alien species through bal ast water of oil tankers. Alien species
hydrographic, climatic, etc.) should be taken into account when
introduced unintentional y form a serious threat to the economy of
planning treatment and remediation activities.
northern Norway as wel as to coastal communities in Russia. Due to
the ecological and socio-economic value of living marine resources
The Murmansk Region houses more radioactive waste than any other
in the Barents Sea, and their sensitivity to the threats associated with
region of the world. Although current levels of radioactivity are low and
human development, the potential risks posed by the introduction of
do not pose any threat to human health or the environment, there is
alien species should be taken very seriously.
need for long-term strategies for the handling of stored nuclear material
in the region, as there are apprehensions that storage facilities could
Identified root causes for the modification of ecosystems by invasive
result in radioactive contamination of the environment.
species include:
Scientific: intentional introduction of new commercial species into
The root causes identified for radioactive pollution in the region were:
the Barents Sea by the former Soviet Union;
Geopolitical: radioactive wastes on the Kola Peninsula are a legacy
Economic: increased export of oil shipped through the Barents
of the former Soviet Union's powerful nuclear-powered navy and
Sea, and a corresponding increase in the volume of bal ast water
icebreaker fleet, as well as infrastructure for their maintenance;
discharged into the Barents Sea;
Economic: lack of funding for activities such as the timely
Technological: inadequate infrastructure, and absence of tank/hull
reprocessing of spent nuclear fuel and radioactive wastes, the
cleansing facilities;
decommissioning of nuclear powered submarines, and radiological
Legal: lack of national and regional regulations for aquaculture,
protection.
the introduction of commercial species, as well as for the issue of
discharges of bal ast water.
To decrease the possibility of radioactive contamination in the region,
the activities of the State in the field of ensuring nuclear and radiation
The fol owing policy options are recommended to mitigate the impacts
safety should encompass the fol owing:
of invasive species:
Enhance safety measures on the exploitation of civilian and military
Policies, plans and programmes for the exploitation of
nuclear reactors;
introduced species should be based on scientific knowledge and
Spent nuclear fuel and radioactive material from different weapons
recommendations;
should be reprocessed in a timely fashion;
Regulations for the transport of exotic commercial species should
Dismantling of decommissioned nuclear submarines combined
be enforced;
with the safe transport of radioactive wastes to reprocessing
Regulations at the international level should be adopted, including
plants;
those for regulating the treatment of bal ast water.
Construction of new temporary storage facilities for spent nuclear
fuel and radioactive wastes, and the intensification of safety
measures for stored radioactive materials;
Modernise systems of protection and control for radioactively
dangerous sites.
The fourth most important issue for the Barents Sea is the Modification
of ecosystems by invasive species. It is also possible that the significance
of this issue will increase substantial y in the future. The composition of
the Barents Sea fauna has been changed by the intentional introduction
78
GIWA REGIONAL ASSESSMENT 11 BARENTS SEA
References
Aibulatov, N.A. (ed.) (2001). Geoecology of the shelf and shores of the
Arnesen, R.T., Traaen, T.S., Moiseenko, T., Mokrotovarova, O., and
Russian seas. Moscow, Noosfera. (In Russian).
Kudryavtseva, L. (1996). Heavy metals from the Nikel area
Alekseev, A.P. and Ponomarenko, V.P. (1998). On the fishery forecasts
Investigation in Kolosjoki river 1995, Kola Peninsula, Russia.
expertise. Abstracts of presentations of the VI Al -Russian
Norwegian Institute for Water Research. Report 3543.
Conference on the problems of the sea forecasts. Murmansk, 7-9
AWI (1994). Berichte zur Polarforschung. Alfred Wegener Institute for
October 1998. p 24-25. (In Russian).
Polar and Marine Research. Bremenhaven. Vol. 144.
AMAP (1998). Assessment Report: Arctic Pol ution Issues. Oslo: Arctic
Barbier, E.B. (2001). A note on the economics of biological invasions.
Monitoring and Assessment Programme (AMAP).
Ecological Economics 39(2):197-202.
AMAP (2002). Arctic Monitoring and Assessment Program Vol. I (AMAP).
Batchaev A.R., Slutsky E.G., Sovershaeva L.P., Solodukhin Yu.N., Khazova
Hansen, J.C., Gilman, A., Klopov, V. and Odland, J.O. (eds.) Assessment
E.V. and Khodachek A.N. (2002). Major directions of the strategy
Report: Arctic Pollution Issues. Oslo: AMAP Secretariate: In press.
for social and economic development of the Northwest Federal
Amundsen, P.-A. Staldvik, F., Lukin, A., Kashulin, N., Reshetnikov, Y.S. and
District of the Russian Federation till the year 2015. St. Petersburg,
Popova, O. (1993). Ecology and heavy metal contaminations in the
Russia. (In Russian).
fish communities of the Pasvik River System. Report. Norwegian
Berger, V. and Dahle, S. (eds.) (2001). White Sea. Ecology and Environment.
Col ege of Fishery Science, University of Tromsř.
Tromsř, Akvaplan-Niva AS. Zoological Institute, St. Petersburg.
Amundsen, P.-A., Staldvik, F., Lukin, A., Kashulin, N., Reshetnikov, Y. S. and
Bochkov, L.P., Vakulovsky, S.M., Nikitin, A.I., Tertyshnik, E.G. and Chumichev
Popova, O.A. (1997). Heavy metal contaminations in freshwater fish
V.B. (1983). On the cesium 137 contents in the surface watres of the
from the border region between Norway and Russia. The Science
land. Meteorology and hydrology, 8:79-83. (In Russian).
of the Total Environment 201: 211-224.
Borovkov, V.A., Shevelev, M.S. and Shleinik V.N. (2001). Current status
Anker-Nilssen, T., Bakken, V., Strom, H., Golovkin, A.N., Bianki, V.V., and
and dynamics of the commercial ecosystem of the Barents Sea.
Tatarinkova, I.P. (eds.) (2000). The Status of marine birds breeding in
Biological resources of the Russian Arctic coastal zone: materials to
the Barents Sea Region. Rapport 113. Norsk Polarinstitutt. Tromsř.
symposium. Belomorsk. April. Moscow, VNIRO. p 13-18. (In Russian)
213 pp.
Botnen, H. and Jelmert, A. (2002). Bal astvann - en fare for det norske
APN (2003). Environmental status of the Varanger-Kola Coastal area.
havmiljřet? (Bal ast water - dangerous for the Norwegian marine
Report APN-414.2127.
environment?). Havets Miljř, 2002. (In Norwegian).
Arkhangelsk Region Administration (2003). From the official web-
Bryzgalo, V.A., Graevsky, A.P. and Ivanov, V.V. (1999). Accidental oil-spill
site of the Arkhangelsk Region Administration (In Russian): http:
impact in the Pechora River on water and bottom sediments in the
//www.dvinaland.ru
mouth part. Ecological chemistry. 8:177-185. (In Russian).
Arkhangelsk Region Directorate of Natural Resources and Environmental
Bryzgalo, V.A. and Ivanov, V.V. (1999a). Hydrochemical regime of the
Protection (2002). Environmental status and protection in the
Pechora River under the conditions of anthropogenic impact.
Arkhangelsk Region in 2001. Report. Arkhangelsk, Russia. (In
Ecological chemistry. 8:91-100. (In Russian).
Russian).
REFERENCES
79
Bryzgalo, V.A. and Ivanov, V.V. (1999b). Ecological consequences of the
FAO (1995). Code of Conduct for Responsible Fisheries. Twenty-
anthropogenic impact on the mouth areas of the rivers of the
eighth FAO Conference, 31 December 1995. Available at: http://
Russian Arctic Seas. Ecological chemistry. 8(4):224-241. (In Russian)
www.fao.org/fi/agreem/codecond/codecon.asp
Carlton, J.T. and Gel er, J.B. (1993). Ecological roulette: The global
FAO (1997). Review of the state of world aquaculture. FAO Inland Water
transport of non-indigenous marine organisms. Science261:78-82.
Resources and Aquaculture Service, Fishery Resources Division.
CBD (1992). Convention on Biological Diversity. United Nations Conference
FAO Fisheries Circular. No. 886, Rev. 1. Rome, FAO. Retrieved from:
on Environment and Development. Rio de Janeiro, Brazil. 3-14 June.
http://www.fao.org/docrep/003/w7499e/w7499e09.htm
Available at: www.biodiv.org/convention/articles.asp
FAO (2004). Fisheries Information Center. United Nations Food and
Central Directorate of Geodesy and Cartography (1983). Atlas of the
Agriculture Organization. Retrieved from: http://www.fao.org./
USSR, Moscow.
fi/default_al .asp
Cheluykanov, V.V. and Savel'ev, V.A. (1992). On the radiation situation in
Fiskeridirektoratets havforskningsinstitutt (1997). The Precautionary
the area of the polygon for nuclear weapons tests on the Novaya
Approach to North Sea Fisheries Management. Oslo, 9-10 Sept.,
Zemlya. Meteorology and hydrology. 2:107-109. (In Russian).
1996: Seminar report. Fisken og havet #1.
Churchil , R. and Ulfstein, G. (1992). Marine Management in disputed
Glukhovsky, B.Kh. (ed.) (1991). Hydrometeorology and hydrochemistry
areas: the case of the Barents Sea. London, Routledge.
of the seas of the UUSR. Volume 2. White Sea. Leningrad,
Commission of the European Community (1990). The Radiological
Hydrometeoizdat. (In Russian).
Exposure of the Population of the European Community from the
Gol asch, S. and Leppäkoski, E. (eds.) (1999). Initial risk assessment of alien
Radioactivity in the North European Marine Waters. Project Marina,
species in Nordic coastal waters. Nord 1999:8.
Report No. EUR 12483, Office for Official Publication of the European
Government of the Russian Federation (2003). The Conception of the
Community, Luxembourg.
Development of the Fisheries Sector of the Russian Federation for
Costanza, R., R., D'Arge, R., De Groot, S., Farber, M., Grasso, B., Hannon, S.,
the period until 2020. Report #1265-r (02.09.2003). (In Russian).
Naeem, K., Limburg, J., Paruelo, R.V., O'Neil , R., Raskin, P., Sutton and
Green, N. (1997). Joint Assessment and Monitoring Program (JAMP).
van den Belt, M. (1997). The value of the world's ecosystem services
National Comments to the Norwegian data for 1995. Norwegian
and natural capital. Nature 387:253-260.
Pol ution Control Authority, Monitoring report no 685/97 TA no.
Dahle, S., Matishov, G., Savinov, V., Savinova, T., Velvin, R., Jřrgensen,
1405/1997. NIVA pr. 80106, report N 3597-97: 124 pp.
E., Virin, A. and Evanset, A. (2000). Organochlorines in harbours in
Green, N. (1999). Joint Assessment and Monitoring Program in
northern Norway and Russia. In: Workshop on Persistent Organic
Norway (JAMP). Contaminants- Osloord area, Lista, Sřrorden,
Pol utants (POPs) in the Arctic: Human health and Environmental
Hardangerorden, Břmlo, Lofoten and Varangerord. NIVA pr.
Concerns, Rovaniemi 18-20 January 2000.
80106, 18.1.1999.
Denisov, V.V. (2002). Ecological and geographical basis for the efficient
Henriksen, A., Mannio, J., Wilander, A., Moiseenko, T., Traaen, T.S.,
nature-use in shelf seas (ecological geography of the sea). Apatity,
Skjelkvĺle, B.L., Fjeld, E. and Vuorenmaa, J. (1997). Regional lake
Russia. (In Russian).
survey in the Barents region of Finland - Norway - Sweden and
Dotterud, L.K., Odland, J.O., and Falk, E.S. (2000). Atopic diseases among
Russian Kola 1995 - results. Acid Rain Research Report 45.
adults in the two geographical y related arctic areas Nikel, Russia
Hoel, A.H. (1994). The Barents Sea: Fisheries Resources for Europe and
and Sor-Varanger, Norway: possible effects of indoor and outdoor
Russia. In: Stokke, O.S. and Tunander, O. (eds.) The Barents Sea
air pol ution. Journal of the European Academy of Dermatology and
Region. Cooperation in Arctic Europe. London, SAGE Publications.
Venereology 14:107-111.
Holm, P., Rĺnes, S.A. and Hersoug, B. (2002). Political attributes of rights-
Dotterud L.K., Odland, J.O., and Falk E.S. (2001). Atopic diseases among
based management systems: the case of individual vessel quotas
schoolchildren in Nikel, Russia, an Arctic area with heavy air
in the Norwegian coastal cod fishery. In: Symes, D. (ed.) Powerty
pollution. Acta Dermato-Venereologica 81:198-201.
rights and regulatory systems in the fisheries. Oxford, Fishing News
Dvornyakov, V.A. (2000). Fisheries of Russia: on the eve of change.
Books, p 113-126.
Moscow, International relations. (In Russian).
Hřnneland, G. (2000). Coersive and Discussive Compliance Mechanisms
FAO (1993). Marine Fisheries and The Law of the Sea: A Decade of
in the Management of Natural Resources. A case study from the
Change. Special chapter (rev.) in The State of Food and Agriculture
Barents Sea Fisheries. Kluwer Academic Publishers.
1992. Fisheries Circular FAO, No. 853. Rome.
80
GIWA REGIONAL ASSESSMENT 11 BARENTS SEA
REFERENCES
81
Hopkins, C.C.E. (2000). A review of introductions and transfers of alien
Kashulin, N.N., Lukin, A.A. and Amundsen, P.-A. (1999). Fish of subarctic
marine species in the North Sea area. Report to the Norwegian
freshwater systems as bioindicators of industrial pol ution. Kola
Ministry of the Environment for the Fifth Ministerial Conference on
Science Centre, Russian Academy of Sciences. Monograph. (In
the Protection of the North Sea. AquaMarine Advisers.
Russian with an English summary).
Hopkins, C.C.E. (2001). Actual and potential effects of introduced marine
Kashulin, N.A., Amundsen, P.-A. Břhn, T., Dalsbř, L., Koroleva, I.M.,
organisms in Norwegian waters, including Svalbard. Report to the
Kudrecetcheva, L.P., Sandimirov, S.S. and Terentev, P.M. (2003).
Norwegian Directorate of Nature Management. Research Report
Environmental monitoring in the Pasvik watercourse 2002. Report,
DN 2001-1.
INEP Kola Science Centre, and NFH, University of Tromsř.
ICES (1995). ICES Code of Practice on the Introductions and Transfers of
Klungsřyr, J., Saetre, R., Fřtn, L. and Loeng, H. (1995). Man's impact on
Marine Organisms 1994. ICES Coop. Res. Rep. No. 204.
the Barents Sea. Arctic 48(3): 279-296.
ICES (2000). Report of the Working Group on Introductions and
Kolvulehto, M., Saxen, R., Tuominen, K. (1980). Radioactivity in Finland,
Transfers of Marine Organisms, Parnu, Estonia, 27-29 March 2000.
1978. Annual Report, STL-A-32, Helsinki.
International Council for the Exploration of the Sea, Copenhagen.
Konieczny R.M. (1996). Sonderende undersřkelser i norske havner og
ICES CM 2000/ACME: 07 Ref.: E+F, Copenhagen.
utvalgte kystomreder. Miljřgifter i sedimenter pe strekningen
ICES (2003a). Report of the ICES Advisory Committee on Fishery
Ramsund-Kirkenes. NIVA-rapport nr. 0-93177. SFT-rapport nr. 608/
Management 2002. ICES Cooperative Research Report No. 255.
95, TA nr. 1215/1995. - Oslo: NIVA. 1996. (In Norwegian).
ICES (2003b). International Council for the Exploration of the Sea.
Kotenev, V.N. (2000). Problems of the home fishery. The ways out of the
Retrieved from: http://www.ices.dk/
crisis. Fishery of Russia. # 3. p 11-14. (In Russian).
Il in, G.V., and Dahle, S. (1997). Heavy metals in bottom sediments.
Krasnov, Yu.V., Matishov, G.G., Galaktionov, K.V. and Savinova, T.N. (1995).
Kola Bay: oceanography, biology, ecosystems, pol utants. Russian
Murman's colonial seabirds. St. Petersburg, Nauka. (In Russian).
Academy of Sciences, Kola Scientific Center, Apatity.
Kuzmin, S.A., Akhtarin, S.M. and Menis, D.T. (1998). First founding of
IMO (1997). Guidelines for the Control and Management of Ships' Bal ast
snow crab Chionoecetes opilio (Fabricius) (Decapoda, Majidae) in
Water to Minimize the Transfer of Harmful Aquatic Organisms
the Barents Sea. Zoological Journal. 77(4):489-491. (In Russian).
and Pathogens. Resolution A.868(20), International Maritime
Kuzmin S.A., Akhtarin S.M. and Menis D.T. (1999). The first finding of the
Organization, London.
snow crab Chionoecetes opilio (Fabricius) (Decapoda, Majidae) in
Institute of Marine Research (2002). Havets Ressurser. Havforsknings-
the Barents Sea. Canadian Technical Report of Hydrography and
instituttet. Bergen.
Ocean Sciences. 5667:1-5.
Isaksen, K. and Wi g, O. (eds.) (1995). Conservation value assessment and
Kuzmin, S.A. and Gudimova, E.N. (2002). Introduction of the red king
distribution of selected marine mammals in the Northern Barents
crab in the Barents Sea. Peculiarities of biology, perspectives of
Sea. Editors:. Norsk Polarinstitutt. Oslo, Norway.
fishery. Apatity, KSC RAS Publishing House. (In Russian).
Iudicel o, S., Weber, M., and Wieland, R. (1999). Fish, Markets, and
Kuzmin, S.A. (2001). New data on the distribution of snow crab
Fishermen. The Economics of Overfishing. London. EARTHSCAN.
Chionoecetes opilio (Fabricius) in the Barents Sea. In: Ivanov B.G.
Ivanov, G.I. (2002). Methodology and results of the Barents Sea
(ed.) Investigations of commercial crustaceans and algae biology
ecogeochemical research. St. Petersburg. (In Russian).
in Russian seas: Col ection of scientific papers. Moscow. VNIRO.
Joint Norwegian-Russian Expert Group (1992). A Survey of Artificial
p 94-97. (In Russian).
Radionuclides in the Kara Sea. Results from the Russian-
Kuzmin, S.A. (2000). Spreading of snow crab Chionoecetes opilio
Norwegian 1992 expedition to the Barents and Kara Seas. Joint
(Fabricius) in the Barents Sea. In: ICES C.M Documents 2000 (88th
Norwegian-Russian Expert group for Investigation of Radioactive
Statutory Meeting, Annual Science Conference 2000, Bruges,
Contamination in the Northern Areas. Norway.
Belgium and the 2000 ICES Annual Report.
Kashulin, N.A., Reshetnikov, Y.S. and Amundsen, P.-A. (1997). Response
Larsen, L.H.,Fieler, R., Řiestad, V., Bjřrvatn, T. and Aslaksen, J.A. (1994).
of whitefish (Coregonus lavaretus L.) to heavy metal pol ution in
Masterplan for Aquaculture in Northweatern Russian Federation.
lakes at the Norwegian-Russian border. In: Reiersen, L.-O., Stone, D.,
Ministry of Foreign Affairs, Norway.
Liljelund, L.-E., Facius, F. and Wilson, S. (eds.) The AMAP International
LENKA (1990). National-wide suitability assessment of the Norwegian
Symposium on Environmental Pollution in the Arctic, Tromsř, June
coastal zone and rivers for aquaculture. Norwegian official report
1-5, 1997. p 210-212.
(NOU):22. (In Norwegian).
80
GIWA REGIONAL ASSESSMENT 11 BARENTS SEA
REFERENCES
81
Leppäkoski, E., S. Gol asch and Olenin, S. (2003). Invasive aquatic
Matishov, G.G. (ed.) (1997). The Kola Bay: oceanography, biology,
species of Europe - distribution, impact and management. Kluwer
ecosystems, pollutants. Apatity: Publ. KSC RAS.
Academic Publishers, Dordrecht, the Netherlands.
Matishov, G.G. (ed.) (1998). Harvesting and perspective algae and
Loring, D.H., Naes, K., Dahle, S., Matishov, G.G. and Illin, G. (1995). Arsenic,
invertebrates for uses of the Barents and white Seas. Apatity, KSC
trace metals, and organic micro comtaminants in sediments from
RAS Publishing House. (In Russian).
the Pechora Sea, Russia. Marine Geology. International Journal of
Matishov, G.G. (ed.) (1999). Adaptation and evolution in biota of polar
Marine Geology, Geochemistry and Geophysics, 128(3-4):153-167.
seas under the oceanic periglacial conditions. Apatity, KSC RAS
Makarevich, P.R., Druzhkov, N.V. and Bobrov, Yu.A. (1991). Phytoplankton
Publishing House. (In Russian).
of the mixing zone between Barents and White Seas. In: Agarova,
Matishov, G.G. and Rodin, A.V. (eds.) (1996). Atlantic cod: biology,
I.Ya. and Gupalo, E.Yu. (eds.). Phytoplankton researches in monitoring
ecology, and fishery. St. Petersburg. Publ. "Nauka". (In Russian).
of Baltic and other seas of the USSR. Moscow: 121-134. (In Russian).
Matishov, G.G. and Nikitin, B.A. (eds.) (1997). Scientific and methodological
Makarevich, P.R. and Larionov, V.V. (1992). Taxonomic composition
approaches to the environmental impact assessment of oil and gas
of phytoplankton and history of phytoplankton studies in the
extraction on the ecosystems of Arctic seas. Apatity.
Barents Sea. In: Kuznetsov, L.L. (ed.) Phytoplankton of the Barents
Matishov, G.G. and Denisov, V.V. (2000). Ecosystems and biological
Sea. Apatity: 17-51. (In Russian).
resources of Russian European Seas on the turn of the 21st century.
Makhon'ko, K.P. (ed.) (1987). Radiation situation on the territory of the
Murmansk, MMBI.
UUSR. Annual-book. Obninsk. SPA "Typhoon". (In Russian).
Matishov, D.G. and Matishov, G.G. (2001). Radiation ecological
Makhon'ko, K.P. (ed.) (1988). Radiation situation on the territory of the
oceanology. Apatity: Publishing House of the Kola Scientific Center
UUSR. Annual-book. Obninsk. SPA "Typhoon". (In Russian).
RAS. (In Russian).
Makhon'ko, K.P. (ed.) (1989). Radiation situation on the territory of the
Matishov, G.G., Matishov, D.G., Shchipa, E. and Rissanen, K. (1994).
UUSR. Annual-book. Obninsk. SPA "Typhoon". (In Russian).
Radionuclides in the ecosystem of the Barents and Kara Sea
Makhon'ko, K.P. (ed.) (1990). Radiation situation on the territory of the
region. Apatity, Publishing House of the Kola Scientific Center RAS.
UUSR. Annual-book. Obninsk. SPA "Typhoon". (In Russian).
(In Russian).
Makhon'ko, K.P. (ed.) (1991). Radiation situation on the territory of the
Matishov, G.G., Zuev, A., Golubev, V., Adrov, N., Slobodin, V., Levitus
UUSR. Annual-book. Obninsk. SPA "Typhoon". (in Russian)
S. and Smolyar I. (1998). Climatic atlas of the Barents Sea 1998:
Makhon'ko, K.P. (ed.) (1992). Radiation situation on the territory of
temperature, salinity, oxygen. Murmansk Marine Biological Institute,
Russia and adjacent states. Annual-book. Obninsk. SPA "Typhoon".
National Oceanographic Data Center, Ocean Climate Laboratory,
(In Russian).
Washington, U.S.
Makhon'ko, K.P. (ed.) (1993). Radiation situation on the territory of
Matishov, G., Makarevich, P., Timofeev, S., Kuznetsov, L., Druzhkov, N.,
Russia and adjacent states. Annual-book. Obninsk. SPA "Typhoon".
Larionov, V., Golubev, V., Zuyev, A., Adrov, N., Denisov, V., Iliyn, G.,
(In Russian).
Kuznetsov, A., Denisenko, S., Savinov, V., Shavikyn, A. Smolyar, I.,
Makhon'ko, K.P. (ed.) (1994). Radiation situation on the territory of
Levitus, S., O'Brien, T. and Baranova, O. (2000). Biological Atlas of
Russia and adjacent states. Annual-book. Obninsk. SPA "Typhoon".
Artic Seas - Plankton of the Barents and Kara Seas. Silver Spring.
(In Russian).
World Oceanographic Data Center.
Makhon'ko, K.P. (ed.) (1995). Radiation situation on the territory of
Matishov, G.G., Denisov, V.V., Dzenyuk, S.L., Tarasov, G.A. and Khasankaev,
Russia and adjacent states. Annual-book. Obninsk. SPA "Typhoon".
V.B. (2001). Problems and methods of ecological monitoring of the
(In Russian).
west arctic seas and coastal zones. Apatity, KSC RAS Publishing
Makhon'ko, K.P., Avramenko, A.S., Bobovnikova, C.I. and Chumichev, V.B.
House. (In Russian).
(1977). Coefficient of strontium 90 and cesium 137 discharge from
MegaPesca. (1999). Study of the discards in Fisheries. Draft Final Report
the surface of the soils of river basin. Meteorology and hydrology,
No. EP/IV/B/STOA/98/1701. April 1999. Portugal. Available at:
#10. (In Russian).
http://www.megapesca.com/stoapo~2.htm
Matishov, G.G. (ed.) (1986a). Life and conditions of its existence in the
Molvćr, J., Knutzen, J., Magnusson, J., Rygg, B., Skei, J and Sřrensen,
Barents Sea benthal zone. Apatity. (In Russian).
J. (1997). Klassifisering av miljřkvalitet i order og kystfarvann.
Matishov, G.G. (ed.) (1986b). Fish fauna and conditions of its existence
Veiledning. (Classification of environmental quality in ords and
in the Barents Sea. Monograph. Apatity. (In Russian).
coastal waters. A guide) SFT veiledning 97: 03. (In Norwegian).
82
GIWA REGIONAL ASSESSMENT 11 BARENTS SEA
REFERENCES
83
Muir, D., Savinova, T., Savinov, V., Alexeeva, L., Potelov, V., and Svetochev,
Objectives and uncertainties in fisheries management with emphasis
V. (2003). Bioaccumulation of POPs and chlorinated pesticides in
on three north Atlantic ecosystems (1997). An international Fisheries
seals, fishes and invertebrates from the White Sea, Russia. The
Symposium Bergen, Norway 3-5 June 1997, Bergen, Norway, 1997.
Science of the Total Environment 306:111-132
Odland, J.O., Nieboer, E., Romanova, N., Thomassen, Y., Norseth, T.
Mukhin, A.I. and Solodovnikov, L.G. (2002). Al -Russian fishery in 2001
and Lund, E. (1999). Urinary nickel concentrations and selected
(Review). Fishery 2:21-27. (In Russian).
pregnancy outcomes in delivering women and their newborns
Murmansk Region Administration (2001). Conception of the social and
among arctic populations of Norway and Russia. Journal of
economic development of the Murmansk Region for the period till
Environmental Monitoring 1:153-161.
2015. Report #47-pg of 08.02.2001. Apatity-Murmansk. (In Russian).
Odland, J.O. (2000). Doctoral thesis: Environmental and occupational
Murmansk Region Administration (2002). Major principles of the
exposure, life-style factors and pregnancy outcome in arctic and
strategy for the development of the Murmansk Region for the
sub-arctic populations of Norway and Russia. ISM Skriftserie Nr. 50.
period til 2015. Report #251-pp of 20.12.2001. Apatity-Murmansk.
Institute of Community Medicine, University of Tromsř, 2000.
(In Russian).
Orlov, Yu.I. (1965). On the Works on the acclimatisation of the Kamchatka crab
Murmansk Region Administration (2003). The Plan for the clean-up
in the Barents Sea//ICES CM 1965. Shel fish Committee. No124:2
of the Murmansk Region coast in the case of an oil-spil . Saint-
Orlov, Yu.I. (1977). Introduction of commercial crabs into the Barents Sea.
Petersburg, 2003. (In Russian).
Fishery 9. p 20-22. (In Russian).
Murmansk Region Directorate of Natural Resources and Environmental
Orlov, Yu.I. (1978). Red king crab - a new inhabitant of the Barents Sea.
Protection (1999). Environmental Status and Protection in the
Nature 3. (In Russian).
Murmansk Region in 1998. Annual Report. (In Russian)
ORNL (2003). Landscan 2002. Oak Ridge National Laboratory. Retrieved
Murmansk Region Directorate of Natural Resources and Environmental
November 2003 from: http://www.ornl.gov/gist
Protection (2001). Environmental Status and Protection in the
Ozolin'sh, A.V. and Spiridonov, V.A. (2001). The strategy for conservation
Murmansk Region in 2000. Annual Report. (In Russian).
of the coastal zone biodiversity of the Fareastern ecoregion. WWF
Nakken, O. (1998). Past, Present and Future Exploitation and
Project. Vladivostok. (In Russian).
Management of Marine Resources in the Barents Sea and Adjacent
Patin, S.A. (2001). Oil and continental shelf ecology. Moscow. VNIRO.
Areas. Fisheries Research. V. 37/1-3. p 23-35.
(In Russian).
Namyatov, A.A. (1998). Radiation contamination of the Kola and
PINRO (2000). Recommendations of the VI I Al -Russian Conference on
Motovsky Bays of the Barents Sea. Thesis for a Candidate's Degree
the problems of the sea forecasts. Murmansk, 23-25 October. (In
(11.00.11). Saint-Petersburg.
Russian).
Norwegian Directorate of Fisheries (2001). Notat. Tiltak for a styrke
Porter, G. (1997). The Role of Trade Policies in the Fishing Sector //
ressurskontrol en, Bergen. (In Norwegian)
Background paper for UNEP/WWF Workshop, Fishing Subsidies,
Norwegian Directorate of Fisheries (2002). Economic and
Overfishing, and Trade, June 2-3, Geneva, Switzerland.
biological key figures from Norwegian Fisheries. Available at:
Research Institute of the Atmospheric Air Protection (1998). Pol utant
http://www.fiskeridir.no/sider/statistikk/nokkeltal /nokkeltal 02.pdf.
discharges into the atmosphere of the cities and regions of the
Norwegian Directorate of Fisheries (2003). Finnmark and Norges
Russian Federation in 1997. Annual-book. St. Petersburg. (In
Rĺfisklag Available at: www.rafisklaget.no. (In Norwegian)
Russian).
Norwegian Directorate of Fisheries (2004). Retrieved from:
Richter, G.D. (ed.) (1966). The North of the European Part of the USSR.
www.fiskeridir.no
Moscow: Nauka. (In Russian).
Norwegian Ministry of Fisheries (2002). Protocol for the 31 Session of the
Salo, A., Voipio, A. (1972). Transport of radionuclides in lake and river
Joint Norwegian-Russian Fisheries Commission, November, 2002.
system flowing through areas characterized by Precambrian
Available at: http://odin.dep.no./fid/.
bedrock peat bogs. Radioactive Contamination of the Marine
Norwegian Ministry of Fisheries (2002-2003). St meld # 20, Attachment 5
Environment. Proceedings of a Symposium, Seattle, 10-14 July.
Norwegian Ministry of Fisheries (2004). Retrieved from:
Sandlund, O.T., Schei, P.J. and Viken, A. (eds.) (1996). Proceedings of the
http://odin.dep.no./fid/
Norway/UN Conference on Alien Species. Trondheim, Norway, 1-5
NSIDC (2004). Sea ice trends and climatologies from SMMR and
July 1996. Directorate for Nature Management (DN) and Norwegian
SSM/I. Retrieved May 2004 from: http://nsidc.org/data/smmr_
Institute for Nature Research (NINA).
ssmi_ancil ary/gis/index.html
82
GIWA REGIONAL ASSESSMENT 11 BARENTS SEA
REFERENCES
83
Sapozhnikov, V.A. and Sokolova, S.A. (1994). Contaminants in the White
Skjelkvĺle, B.L., Andersen, T., Fjeld, E., Mannio, J., Wilander, A., Johansson,
Sea water and Bottom sediments. Complex investigations of the
K., Jensen, J.P., and Moiseenko, T. (2001). Heavy metal surveys i
White Sea ecosystem. Moscow, VNIRO. (In Russian).
Nordic lakes; concentrations, geographic patterns and relation to
Savinov, V., Savinova, T., Carrol , J., Matishov, G., Dahle, S. and Naes, K.
critical limits. Ambio 30:2-10.
(2000). Polycyclyc aromatic hydrocarbons (PAHs) in sediments of
Skjoldal, H.R. (2000). Management of Marine Living Resources in a
the White sea, Russia. Marine Pollution Bul etin 40: 807-818.
Changing Ocean Climate. Institute of Marine Research. Bergen,
Savinova, T., Chernyak, S., Dahle, S., Matishov, G., Begnoche, L., James, P.,
Norway.
Hickey, J., Savinov, V. and Virin, A. (2000). Levels and distribution of
Smith-Sivertsen, T., Bykov, V., Melbye, H., Tchachtchine, V., Selnes, A. and
organochlorine residues in surface bottom sediments from the Kola
Lund E. (2001). Sulphur dioxide exposure and lung function in a
Bay and Guba Zapadnaya Litsa, Barents Sea; Russia. In: Workshop on
Norwegian and Russian population living close to a nickel smelter.
Persistent Organic Pol utants (POPs) in the Arctic: Human health and
International Journal of Circumpolar Health 60(3):342-59.
Environmental Concerns", Rovaniemi 18-20 January 2000.
SRW/MMBI (2000). Contamination assessment of the Barents Sea
Savinov, V., Savinova, T., Matishov, G.G., Dahle, S. and Naes, K. (2003a).
commercial species. Regional program. Report on the SRW/MMBI
Polycyclic aromatic hydrocarbons (PAHs) and organochlorines
KSC RAS, 2000. Murmansk. (In Russian).
(OCs) in bottom sediments of the Guba Pechenga, Barents Sea,
State Committee for Sanitary and Epidemiological Control of the Russian
Russia. Science of the Total Environment 306:39-56.
Federation (1997). Hygienic requirements for the quality and safety
Savinov, V., Savinova, T. and Gabrielsen, G. (2003b). Cadmium, zinc,
of foodstuffs, sanitary standards and rules (SanPin 2.3.2.). Report
copper, arsenic, selenium and mercury in seabirds from the Barents
#27 (24.10.96). Moscow: State System of Sanitary-epidemiological
sea: levels, inter-specific and georgaphical differences. Science of
regulations of the Russian Federation, 1997: 560-96. (In Russian).
the Total Environment 306:1333-158.
State Environmental Committee of the Murmansk Region (1999).
Semina, H.I. and Sergeeva, O.M. (1983). Plankton flora and bio-
Environmental status and ecological problems on the Kola
geographical description of phytoplankton of the White Sea. Trugy
Peninsula in 1998. Report. Murmansk. (In Russian).
Belomorskoy Biologicheskoy stantsii MGU. 6: 3-17.
State Statistics Committee of the Russian Federation (2001). Regions of
Seterĺs, S. (2001). Kommersiell fangst av kongekrabbe i 2002. In "Fiskets
Russia. Statistics Reference Book. Moscow. (In Russian).
gang". (In Norwegian).
State Statistics Committee of the Russian Federation (2002a).
Sevgidromet (1992). Annual-book of the sea waters quality by
Demographic Annual. Statistics Annual Book. Moscow. (In Russian).
hydrochemical indices for 1991. "Obninsk". (In Russian).
State Statistics Committee of the Russian Federation (2002b). Regions of
Sevgidromet (1994). Annual-book of the sea waters quality by
Russia. Statistics Reference Book. Moscow. (In Russian).
hydrochemical indices for 1993. "Obninsk". (In Russian).
State Statistics Committee of the Russian Federation (2002c). The
Sevgidromet (1995). Annual-book of the sea waters quality by
Industry of Russia. Statistics Reference Book. Moscow (In Russian).
hydrochemical indices for 1994. "Obninsk". (In Russian).
State Statistics Committee of the Russian Federation (2003). Demographic
Sevgidromet (1996). Annual-book of the sea waters quality by
Annual. Statistics Annual Book. Moscow. (In Russian).
hydrochemical indices for 1995. "Obninsk". (In Russian).
Sundet, J. (2003). Kongekrabbe. In: Michalsen, K. (ed.) Havets Ressurser
SFT (2002). Air Pollution Effects in the Norwegian - Russian Border Area.
2003, Fiske og Havet, 1:130-132. (In Norwegian).
Norwegian Pollution Control Authority. TA 1860/2002.
Tchachtchine, V.P. and Talykova, L.V. (1997). Air pol ution and non-violent
Shevchenko, V.V., Nikonorov, I.V. and Komlichenko, V.V. (2001). Biological
mortality in arctic cities of Russia: a time trend analysis. The AMAP
and economic efficiency of marine resources exploitation in the
International Symposium on Environmental Pollution in the Arctic.
Northern Basin of Russia. Problems in fishery. Vol. 2. 2(6):194-222
Tromso, Norway, June 1-5, 1997.
(In Russian).
Terziev, F.S. et al. (eds.). 1990. Hydrometeorology and hydrochemistry
Shevelev, M.S. and Yaragina, N.A. (1998). Investigations of the Barents
of the seas of the UUSR. Volume 1. Barents Sea. Issue 1.
Sea bottom fish species from "Andrey Pervozvanny" to nowadays.
Hydrometeorological conditions. Leningrad, Hydrometeoizdat.
Abstracts of presentations of the VII Al -Russian Conference on the
(In Russian).
problems of the sea forecasts. Murmansk, 7-9 October. p 188-189.
Titova, G. (2001). Rental Payments for Aqua Bioresources. Part 1. An
(In Russian).
evaluation of Russia's state quotas management system. UK.
Sirenko, B.I. (ed.). (2001). List of species of free-living invertebrates of
Geophylos, Autumn No. 01(2), p 116-128
Eurasian arctic seas and adjacent deep waters. St. Petersburg.
84
GIWA REGIONAL ASSESSMENT 11 BARENTS SEA
REFERENCES
85
Titova, G.D. (2003). Crisis in the world fisheries: economic and legal
Voitolovsky, G.K., Kireev, V.E., Korzun, V.A., Ranenko, V.V. and Titova, G.D.
problems. St. Petersburg. (In Russian).
(2003). Reflecting on fisheries (in search of solution). Moscow, SOPS.
Toresen, R. (ed.) 2000. Havets Ressurser. Fisken og havet, 1:2000.
(In Russian).
Havforsknings instituttet, Med Bidrag Fra Fiskeriforskning Februar
Weidema, I.R. (ed.) (2000). Introduced species in the Nordic countries.
2000.
Nord 2000:13.
Traaen, T.S., Moiseenko, T., Dauvalter, V., Rognerud, R., Henrikesen A.
WSSD (2002). World Summit on Sustainable Development.
and L.Kudravseva (1991). Acidification of Surface Waters, Nickel and
Johannesburg, South Africa. 26 August - 4 September. Available at:
Copper in Water and Lake Sediments in the Russian-Norwegian
www.johannesburgsummit.org/html/documents/summit_docs/
Border Areas. Progress Report for 1989-1990. Working Group for
131302_wssd_report_reissued.pdf
Water and Environmental Problems under the Norwegian-Soviet
Environmental Protection Commission. Oslo and Apatity.
UN (1995). Agreement for the Implementation of the Provisions of the
United Nations Convention on the Law of the Sea of 10 December
1982 Relating to Conservation and Management of Straddling
Fish Stocks and Highly Migratory Fish Stocks. United Nation
Conference on Straddling Fish Stocks and Highly Migratory Fish
Stocks. Sixth session. New York. 24 July - 4 August 1995. Available at:
http://www.un.org/Depts/los/convention_agreements/texts/fish_
stocks_agreement/CONF164_37.htm
UNCED (1992). United Nations Conference on Environment and
Development. Rio de Janeiro, Brazil. 3-14 June 1992. Agenda 21,
the United Nations Program of Actions from Rio. Available at:
www.un.org/esa/sustdev/documents/Agenda21/
UNCLOS (1982). United Nations Convention on the Law of the
Sea. Montego Bay, Jamaica, 10 December. Available at:
http://www.un.org/Depts/los/convention_agreements/texts/
unclos/closindx.htm
USGS (2002). Global GIS database: Global Land Cover Characteristics.
CD-rom. US Department of the Interior, US Geological Survey,
Flagstaff, USA.
USGS (2003). GROPO30. Retrieved September 2003 from: http://
edcdaac.usgs.gov/gtopo30.asp
Vakulovsky, S.M., Nikitin, A.I. and Chumichev, V.B. (1985). On the
contamination of the Arctic seas by the wastes from the West
European radio-technical enterprises. Atomic energy. 58(6):445-
449. (In Russian).
Vakulovsky, S., Nikitin, A., Chumichev, V. and Malyshev, S. (1993).
Radioactive Contamination of the Barents and Kara Seas.
International meeting on Assessment of Actual and Potential
Consequences of Dumping of Radioactive Waste into the Arctic
Seas. Working material. p 53-55.
VNIERH (1997). Decree of the XLI I Plenum of the Interdepartmental
ichthyological Commission dated March 20, 1997. Moscow. (In
Russian).
84
GIWA REGIONAL ASSESSMENT 11 BARENTS SEA
REFERENCES
85
Annexes
Annex I
List of contributing authors and organisations
Name
Organisation/Institution
Country
Prof. Academician Gennady G. Matishov
Murmansk Marine Biological Institute KSC RAS, Director
Russia
Dr. Natalia I. Golubeva
Murmansk Marine Biological Institute KSC RAS, Director's Deputy
Russia
Dr. Galina D. Titova
Ecological Safety Scientific Research Centre RA
Russia
Dr. Are K. Sydnes
Norwegian Col ege of Fishery Science, University of Tromsř
Norway
Ms. Barbara Voegele
Akvaplan-niva
Norway
Dr. Tatiana N. Savinova
Akvaplan-niva
Norway
Dr. Vladimir V. Denisov
Murmansk Marine Biological Institute KSC RAS, Director's Deputy
Russia
Dr. Sergey L. Dzhenyuk
Murmansk Marine Biological Institute KSC RAS, Science Secretary
Russia
Mr. Anatoly M. Vasilyev
Arctic Centre of the Economical Problems Institute KSC RAS, Director's Deputy
Russia
Dr. Sergey A. Kuzmin
Murmansk Marine Biological Institute KSC RAS
Russia
Ms. Nadezhda E. Kasatkina
Murmansk Marine Biological Institute KSC RAS
Russia
Mr. Vitaly V. Ponomarev
Murmansk Marine Biological Institute KSC RAS
Russia
Dr. Dmitry G. Matishov
Murmansk Marine Biological Institute KSC RAS, Deputy Director
Russia
Mr. Roman Mikhalyuk
Murmansk Marine Biological Institute KSC RAS
Russia
Dr. Konstantin V. Drevetnyak
Polar Scientific Research Institute of Fisheries and Oceanography (PINRO)
Russia
Dr. Nikolay A. Kashulin
The North Industrial Ecology Problems Institute KSC RAS, Director's Deputy
Russia
Prof. Martin G. Khublaryan
Institute of Water Problems RAS, Director
Russia
Dr. Georgy P. Kiselyev
The North Ecological Problems Institute of the Ural Branch RAS
Russia
Ms. Valentina M. Knyagnitskaya
Murmansk Regional Natural Resources Committee of the Ministry of Natural Resourcesof the Russian Federation
Russia
Dr. Petr A. Lozovik
The North Water Problems Institute of the Karelian Scientific Centre RAS, Hydrochemistry and hydrogeological Laboratory Chief
Russia
Ms. Olga I. Mokrotovarova
Murmansk Regional Administration for Hydrometeorology and Environment Monitoring, Environmental Monitoring Centre Chief
Russia
Dr. Aleksey A. Namyatov
Murmansk Marine Biological Institute KSC RAS
Russia
Dr. Natalia F. Plotitsina
Polar Scientific Research Institute of Fisheries and Oceanography (PINRO)
Russia
Dr. Tatiana I. Roskoshnaya
Ecological Safety Scientific Research Centre RAS.
Russia
Dr. Vladimir S. Selin
Economical Problems Institute KSC RAS, Director
Russia
Mr. Anatoly V. Semenov
Murmansk Regional Administration for Hydrometeorology and Environment Monitoring, Director
Russia
86
GIWA REGIONAL ASSESSMENT 11 BARENTS SEA
ANNEXES
87
Annex II
Detailed scoring tables
Weight
Weight
Environmental
Environmental
Environmental issues
Score
Weight %
averaged
Environmental issues
Score
Weight %
averaged
concern
concern
score
score
1. Modification of stream flow
0
-
Freshwater shortage
1
4. Microbiological
0
-
Pol ution
1
2. Pol ution of existing supplies
2
-
5. Eutrophication
0
-
3. Changes in the water table
0
-
6. Chemical
1
-
7. Suspended solids
0
-
Criteria for Economic impacts
Raw score
Score Weight %
8. Solid wastes
1
-
Size of economic or public sectors
Very small
Very large
1
-
9. Thermal
0
-
affected
0
1
2
3
Degree of impact (cost, output changes
Minimum
Severe
0
-
etc.)
0
1
2
3
10. Radionuclide
1
-
Occasion/Short
Continuous
Frequency/Duration
1
-
0
1
2
3
11. Spil s
1
-
Weight average score for Economic impacts
1
Criteria for Health impacts
Raw score
Score Weight %
Criteria for Economic impacts
Raw score
Score Weight %
Very small
Very large
Number of people affected
1
-
Size of economic or public sectors
Very small
Very large
0
1
2
3
2
-
affected
0
1
2
3
Minimum
Severe
Degree of severity
1
-
Degree of impact (cost, output changes
Minimum
Severe
0
1
2
3
1
-
etc.)
0
1
2
3
Occasion/Short
Continuous
Frequency/Duration
1
-
Occasion/Short
Continuous
0
1
2
3
Frequency/Duration
1
-
0
1
2
3
Weight average score for Health impacts
1
Weight average score for Economic impacts
2
Criteria for Other social and
Raw score
Score Weight %
community impacts
Criteria for Health impacts
Raw score
Score Weight %
Number and/or size of community
Very small
Very large
0
-
Very small
Very large
affected
0
1
2
3
Number of people affected
1
-
0
1
2
3
Minimum
Severe
Degree of severity
0
-
Minimum
Severe
0
1
2
3
Degree of severity
1
-
0
1
2
3
Occasion/Short
Continuous
Frequency/Duration
0
-
Occasion/Short
Continuous
0
1
2
3
Frequency/Duration
1
-
0
1
2
3
Weight average score for Other social and community impacts
0
Weight average score for Health impacts
1
Criteria for Other social and
Raw score
Score Weight %
community impacts
Number and/or size of community
Very small
Very large
0
-
affected
0
1
2
3
Minimum
Severe
Degree of severity
0
-
0
1
2
3
Occasion/Short
Continuous
Frequency/Duration
0
-
0
1
2
3
Weight average score for Other social and community impacts
0
86
GIWA REGIONAL ASSESSMENT 11 BARENTS SEA
ANNEXES
87
III: Habitat and community modification
IV: Unsustainable exploitation of fish and other
living resources
Weight
Environmental
Weight
Environmental issues
Score
Weight %
averaged
Environmental
concern
Environmental issues
Score
Weight %
averaged
score
concern
score
Habitat and community
12. Loss of ecosystems
1
-
1
modification
Unsustainable
14. Overexploitation
3
-
2
exploitation of fish
13.Modification of ecosystems or
15. Excessive by-catch and
ecotones, including community
1
-
1
-
discards
structure and/or species
composition
16. Destructive fishing practices
1
-
17. Decreased viability of stock
0
-
through pol ution and disease
Criteria for Economic impacts
Raw score
Score Weight %
18. Impact on biological and
2
-
Size of economic or public sectors
Very small
Very large
genetic diversity
1
-
affected
0
1
2
3
Degree of impact (cost, output changes
Minimum
Severe
0
-
etc.)
0
1
2
3
Criteria for Economic impacts
Raw score
Score Weight %
Occasion/Short
Continuous
Frequency/Duration
1
-
0
1
2
3
Size of economic or public sectors
Very small
Very large
2
-
Weight average score for Economic impacts
1
affected
0
1
2
3
Degree of impact (cost, output changes
Minimum
Severe
2
-
etc.)
0
1
2
3
Criteria for Health impacts
Raw score
Score Weight %
Occasion/Short
Continuous
Frequency/Duration
2
-
Very small
Very large
0
1
2
3
Number of people affected
0
-
0
1
2
3
Weight average score for Economic impacts
2
Minimum
Severe
Degree of severity
0
-
0
1
2
3
Criteria for Health impacts
Raw score
Score Weight %
Occasion/Short
Continuous
Frequency/Duration
0
-
0
1
2
3
Very small
Very large
Number of people affected
1
-
Weight average score for Health impacts
0
0
1
2
3
Minimum
Severe
Degree of severity
1
-
Criteria for Other social and
0
1
2
3
Raw score
Score Weight %
community impacts
Occasion/Short
Continuous
Frequency/Duration
1
-
Number and/or size of community
Very small
Very large
0
1
2
3
0
-
affected
0
1
2
3
Weight average score for Health impacts
1
Minimum
Severe
Degree of severity
1
-
0
1
2
3
Criteria for Other social and
Raw score
Score Weight %
Occasion/Short
Continuous
community impacts
Frequency/Duration
1
-
0
1
2
3
Number and/or size of community
Very small
Very large
2
-
Weight average score for Other social and community impacts
1
affected
0
1
2
3
Minimum
Severe
Degree of severity
2
-
0
1
2
3
Occasion/Short
Continuous
Frequency/Duration
2
-
0
1
2
3
Weight average score for Other social and community impacts
2
88
GIWA REGIONAL ASSESSMENT 11 BARENTS SEA
ANNEXES
89
V: Global change
Weight
Environmental
Environmental issues
Score
Weight %
averaged
concern
score
19. Changes in the hydrological
0
-
Global change
0
cycle
20. Sea level change
0
-
21. Increased UV-B radiation as a
0
-
result of ozone depletion
22. Changes in ocean CO 2
0
-
source/sink function
Criteria for Economic impacts
Raw score
Score Weight %
Size of economic or public sectors
Very small
Very large
0
-
affected
0
1
2
3
Degree of impact (cost, output changes
Minimum
Severe
0
-
etc.)
0
1
2
3
Occasion/Short
Continuous
Frequency/Duration
0
-
0
1
2
3
Weight average score for Economic impacts
0
Criteria for Health impacts
Raw score
Score Weight %
Very small
Very large
Number of people affected
0
-
0
1
2
3
Minimum
Severe
Degree of severity
0
-
0
1
2
3
Occasion/Short
Continuous
Frequency/Duration
0
-
0
1
2
3
Weight average score for Health impacts
0
Criteria for Other social and
Raw score
Score Weight %
community impacts
Number and/or size of community
Very small
Very large
0
-
affected
0
1
2
3
Minimum
Severe
Degree of severity
0
-
0
1
2
3
Occasion/Short
Continuous
Frequency/Duration
0
-
0
1
2
3
Weight average score for Other social and community impacts
0
Comparative environmental and socio-economic impacts of each GIWA concern
Types of impacts
Environmental score
Economic score
Human health score
Social and community score
Concern
Overall score
Priority
Present (a)
Future (b)
Present (c)
Future (d)
Present (e)
Future (f)
Present (g)
Future (h)
Freshwater shortage
1
1
1
1
1
1
0
0
1
4
Pol ution
1
2
2
2
1
2
0
0
2
2
Habitat and community
1
2
1
2
0
0
1
0
1
3
modification
Unsustainable exploitation of fish
2
2
2
2
0
0
2
1
2
1
and other living resources
Global change
0
1
0
0
0
0
0
0
0
5
88
GIWA REGIONAL ASSESSMENT 11 BARENTS SEA
ANNEXES
89
Annex III
Detailed assessment tables
Concern: Pollution under present conditions / Issue: Chemical pollution / Score given: 1
Environmental impact
Extent or area Duration and Reli-
Avail-
Explanation or justification how the indicator supports the
Format
Source
indicator
covered
frequency
ability ability
conclusion made in the Assessment
Volumes of discharges
Copper, nickel, chromium and lead are believed to be the main
High to
MMBI research, published data
of contaminants into the
Available
pol utants entering the Barents Sea from the atmosphere as a result
average
of the Ministry of Environmental
atmosphere in the Barents Sea
Tables,
The Barents Sea 1995-1999
in open
of the long-range atmospheric transport and from regional sources.
(small
Protection and Natural Resources
(tonnes/year); annual values of reports
region
annual y
publications
Persistent organic pol utants enter the region mainly by long-range
sample
of the Russian Federation,
wet fal outs of pol utants on the
in Russian
atmospheric transport; their concentrations are consistent with
size)
Roshydromet, scientific literature
Barents Sea surface (g/m2).
levels in other background areas1 of the world.
The prevailing pol utants are heavy metals (mainly copper, nickel
and manganese), and organic substances. It should be stressed that
Estuarine parts
Published data of the Ministry of
Levels of contaminants in the
Available
the Kola and Severnaya Dvina rivers are the sources of drinking water
of the Severnaya
Environmental Protection and
estuarine parts of the Severnaya Table,
1995-2001
in open
for the towns and settlements situated within this area, including
Dvina, Pechora,
High
Natural Resources of the Russian
Dvina, Pechora, Kola, Pechenga report
annual y
publications
the largest towns of the region; Arkhangelsk and Murmansk. For this
Kola, Pechenga
Federation, Roshydromet, scientific
rivers.
in Russian
reason, there is a shortage of high-quality fresh drinking water. At
rivers
literature
the same time the river run-off volumes are low, resulting in heavy
metal impacts in the near-shore zone only.
Available
MMBI Scientific Reports,
Levels of pol utants in the
1988-2000
in open
Roshydromet published data, data
Despite the Kola Peninsula's metal urgic, mining, smelting and other
water and bottom sediments in Report The Barents Sea intermittently Average publications of the Murmansk Administration of industries, water and bottom sediment pol ution is registered only
different areas of the Barents
investigations
in Russian and Hydrometeorological Service, Russian for the Kola Bay.
Sea.
English
and foreign scientific literature
Available
Despite the presence of regional sources of pol ution, concentrations
1995-2000
in open
MMBI Scientific Reports, Russian
of heavy metals in biota are less than MAC2. Concentrations of
Levels of pol utants in biota.
Report
The Barents Sea intermittent
Average publications
and foreign scientific literature
chlorinated hydrocarbons in fish and invertebrates are much lower
investigations
in Russian and
than the al owable limits.
English
Notes: 1 Background area = area located significantly far from emission sources. 2 MAC Maximum Allowable Concentration
Concern: Pollution under present conditions / Issue: Radionuclides / Score given: 1
Environmental impact
Extent or area Duration and Reli-
Avail-
Explanation or justification how the indicator supports the
Format
Source
indicator
covered
frequency
ability
ability
conclusion made in the Assessment
Artificial radionuclide fal out
Available
in the Russain Polar North (107
Tables,
The Barent Sea
1986-1993
in open
MMBI scientific reports,
A stable decrease of atmospheric fal out of artificial radionuclides
Bq/km2 per year) and surface
High
reports
region
periodical y
publications in monograph
is observed.
water of the Kola Bay (109 Bq
Russian
per year).
1961-1989
(strontium &
Available
Input of 90Sr, 137Cs and tritium
The Kola Bay
For the period 1981-1993 the input of tritium into the Kola Bay with
Tables,
cesium)
in open
MMBI scientific reports,
(109 Bq per year) into the Kola
and adjacent
High
river run-off decreased by 1.5 times. The input of 137Cs for 1965-1989
reports
1986-1993
publications in monograph
Bay with river run-off.
coastal area
decreased by 11 times and 90Sr for 1961-1989 by 1.2 times.
(tritium)
Russian
annual y
Concentrations of radionuclides
Discharges from the RTE ATOMFLOT in 1992 of 137Cs and 90Sr into the
Available
in liquid radioactive waste
The Kola Bay
Kola Bay with the river run-off were 2.1108 and 2.6107 Bq/year
Table,
1989-1994
in open
MMBI scientific reports,
discharged from RTE ATOMFLOT.
and adjacent
High
respectively. The annual discharge of these nuclides was the largest
reports
annual y
publications in monograph
Total inventory of discharges
coastal area
in 1992, the average year values for 1989-1994 were 1.6107 and
Russian
over time from RTE ATOMFLOT.
7.6107 Bq/year respectively.
Available
In the 1990s concentrations of 137 Cs, 90Sr and 239.240Pu in surface
Concentrations of artificial
in open
1990-2000
waters of the Barents Sea varied within the ranges 2-15, 1-7, and 4-8
radionuclides in Barents Sea
Table
The Barents Sea
High
publications
Monograph
periodical y
Bq/m3 correspondingly, which is consistent with background levels
water (Bq/m3).
in Russian and
of global radioactive fal out.
English
Available
Concentrations of artificial
in open
137Cs and 239, 240Pu concentrations in Barents Sea bottom sediments
radionuclides in bottom
1990-2000
MMBI scientific reports,
Reports
The Barents Sea
High
publications
clearly correlate with sediment type and are highest in clay silts
sediments of the Barents Sea
periodical y
monograph
in Russian and
deposited in shelf troughs.
(Bq/kg).
English
Available
Accumulation of artificial
in open
1990-2000
MMBI scientific reports,
In 1980-1990s the accumulative level of radionuclides in the Barents
radionuclides in marine biota
Reports
The Barents Sea
High
publications
periodical y
monograph
Sea biota was low, reflecting input from global fal out.
(Bq/kg).
in Russian and
English
90
GIWA REGIONAL ASSESSMENT 11 BARENTS SEA
ANNEXES
91
Concern: Pollution under present conditions / Issue: Oil spills / Score given: 1
Environmental impact
Extent or area Duration and Reli-
Avail-
Explanation or justification how the indicator supports the
Format
Source
indicator
covered
frequency
ability
ability
conclusion made in the Assessment
On average, the level of oil contamination is not high and does not
exceed MAC (0.05 mg/l). In the western areas the mean long-term
Oil hydrocarbon levels in the
1984-1993
concentration of oil products is 0.03 mg/l, and in the eastern areas
Report,
Available in open MMBI scientific research,
Barents Sea surface waters
annual y,
0.026 mg/l. The zone of the polar front is distinguished by a chain of
table,
The Barents Sea
High
publications in
Roshydromet published
(mg/l) and bottom sediments
since 1993
areas with an increased concentration, up to 0.05 mg/l. Local y mean
scheme
Russian
data, scientific literature
(mg/g).
Periodical y
annual concentration of oil hydrocarbons may reach 0.46-1.13 mg/l.
Oil hydrocarbon levels in bottom sediments varies within a wide range
(202-2 176 mg/g) and is on average 676 mg/g.
Oil hydrocarbon concentration
The Kola Bay,
1990-2000
Coastal waters, especial y the Kola Bay, are the most pol uted waters,
in surface waters (mg/l) and
Available in open
the coastal
annual y for
MMBI scientific research,
caused by activities of local sources, which discharge petroleum
bottom sediments (mg/g) of
Report,
publications
areas of the Kola Kola Bay,
High
Roshydromet published
products into the marine environment. The concentration of oil
the coastal and southeastern
schemes
in Russian and
Peninsula, the
episodical y for
data, scientific literature
hydrocarbons can reach three and more MAC. Oil hydrocarbon levels in
areas of the Barents Sea (the
English
Pechora Sea
other areas
bottom sediments of Kola Bay might reach 1 280 mg/g dw.
Pechora Sea).
The open sea
of the Barents
Available
PAH concentrations in bottom
Sea, the Kola
in open
MMBI scientific research,
PAH levels in bottom sediments in the central part of the Barents
Report,
1990-2000
sediments (ng/g) in different
Bay, the coastal
Average
publications
Roshydromet published
Sea average 110 ng/g, reaching their highest value of 10 812 ng/g in
schemes
Periodical y
areas of the Barents Sea.
area of the Kola
in Russian and
data, scientific literature
the Kola Bay area.
Peninsula, the
English
Pechora Sea
Concern: Pollution under future conditions / Issue: Chemical pollution / Score given: 1
Environmental impact
Extent or area Duration and Reli-
Avail-
Explanation or justification how the indicator supports the
Format
Source
indicator
covered
frequency
ability
ability
conclusion made in the Assessment
Survey/Review of the
On the basis of several years' monitoring data, there is nothing that
Air pol ution changes over
environment pol ution in
suggests an increase of the atmospheric pol ution over the Barents
the Barents Sea associated
The Barents Sea 1995-1999
Available in open
Table
High
the Russian Federation for
Sea water area from the Russian territory due to long-range and
with long-range atmospheric
drainage basin
annual y
publications
the year 2000. Roshydromet, regional transport of sulfur and nitrogen compounds, heavy metals,
transport.
Moscow, 2001.
or persistent organic pol utants.
Main regulations of
the Murmansk Region
development strategy for the
The presence of contaminants in
According to the plans for the development of the regions of the
period until 2015.
the Severnaya Dvina, Pechora,
Expert
Russian Federation included into the Barents Sea region, considerable
The Barents Sea
Available in open Main directions of the
Kola, Pechenga rivers, in the
assess-
Intermittent
Low
changes are not expected in the levels of heavy metals and persistent
drainage basin
publications
strategy of socio-economic
Kola Bay, the Barents and
ment
organic pol utants in the rivers flowing into the Barents Sea, or in
development of the
White Seas.
Barents Sea itself.
Northwestern Federal Region
of the Russian Federation for
the period until 2015.
Concern: Pollution under future conditions / Issue: Radionuclides / Score given: 1
Environmental impact
Extent or area Duration and Reli-
Avail-
Explanation or justification how the indicator supports the
Format
Source
indicator
covered
frequency
ability
ability
conclusion made in the Assessment
Self-purification of marine
Report
The Barents Sea 1986-2002
High
Available in open Monograph
High biological productivity together with thermohaline,
waters.
region
periodical y
publications
hydrodynamic and lithodynamic factors leads to self-purification of
in Russian and
the system so that cumulative impact from radionuclides on marine
English
ecosystems is negligible.
Concern: Pollution under future conditions / Issue: Oil spills / Score given: 1
Environmental impact
Extent or area Duration and Reli-
Avail-
Explanation or justification how the indicator supports the
Format
Source
indicator
covered
frequency
ability
ability
conclusion made in the Assessment
Barents Sea waters.
Report
The Barents Sea Increasing
High
Available in open MMBI scientific research,
With increasing oil and gas activities on the Barents Sea shelf, the
cases of
publications in
scientific literature
contamination of the waters of the Barents Sea will increase. The
accidents
Russian
degree of increase in contamination will depend on reliability of the
technologies used.
90
GIWA REGIONAL ASSESSMENT 11 BARENTS SEA
ANNEXES
91
Concern: Unsustainable exploitation of fish under present conditions / Issue: Overexploitation / Score given: 3
Explanation or justification how the indicator
Extent or area Duration and Reli-
Avail-
Environmental impact indicator
Format
Source
supports the conclusion made in the
covered
frequency
ability ability
Assessment
Reductions in quotas, catches and stocks
State Statistics, documents of the
Data, tables,
Stable reductions of catches of cod, haddock, capelin
of commercial y valuable fish for the last
Barents and
Data for more
Joint Norwegian- Russian Fisheries
diagrams,
High
Free
and other commercial y valuable fish during the last
30 years, vessel-quota, annual catch of
Norwegian Seas than 20 years
Commission, scientific prognoses,
graphs, report
30 years.
commercial fish in tonnes.
reports and publications
State Statistics, documents of the
Data, tables,
According to the experts' assessments, main
More than one species is exploited
Barents and
Data for more
Joint Norwegian- Russian Fisheries
diagrams,
High
Free
commercial species are overfished by approximately
beyond MSY or VAC.
Norwegian Seas than 20 years
Commission, scientific prognoses,
graphs, report
20%.
reports and publications
Concern: Unsustainable exploitation of fish under present conditions / Issue: Excessive by-catch and discards / Score given: 2
Duration
Environmental impact
Extent or area
Reli-
Avail-
Explanation or justification how the indicator supports the conclusion
Format
and
Source
indicator
covered
ability
ability
made in the Assessment
frequency
Data on the by-catch and discards are not adequately reflected in the official
30-60% of catches consist of by-
Explanatory
Data for more
Scientific reports and
The Barents Sea
Low
Free
statistics. They can be judged on the basis of experts' assessments and scientific
catch and discards into the sea.
text
than 20 years
publications
publications, indicating a wide prevalence of this phenomenon.
Concern: Unsustainable exploitation of fish under present conditions / Issue: Destructive fishing practices / Score given: 2
Environmental impact
Extent or area Duration and Reli-
Avail-
Explanation or justification how the indicator supports the
Format
Source
indicator
covered
frequency
ability ability
conclusion made in the Assessment
1-10 cases of sea bottom
Report
Barents Sea
Data for more
High
Free
State statistics, scientific prognoses, There is a stable decrease in catches of cod, haddock, capelin and other
trawling take place annual y.
than 20 years
reports and publications
commercial y valuable fish during the last 30 years. The by-catch of other
species, which are discarded into the sea, is possible.
Increased overcapacity of
Report,
Barents Sea
Data for more
High
Free
State statistics, scientific prognoses, The capacity of the fishing fleet exceeds TAC by a factor of 3-4. According
the fishing fleet significantly data, table
than 20 years
reports and publications
to the experts' assessments, the main commercial fisheries are overfished
exceeding TAC.
approximately by 20%.
Concern: Unsustainable exploitation of fish under future conditions / Issue: Overexploitation, Excessive by-catch and discards,
Destructive fishing practices / Score given: 2
Environmental impact
Extent or
Duration and Reli-
Avail-
Explanation or justification how the indicator supports the conclusion
Format
Source
indicator
area covered frequency
ability
ability
made in the Assessment
Decreased fish stocks and Report
Barents Sea
Till 2020
Low, due to scientific
Free
Long-term prognoses, The stocks and catches of commercial y valuable species will continue
quotas.
uncertainty and the lack
scientific reports and decreasing in the nearest years if considerable amendments to the quotas
of financial resources for
publications
management are not introduced and the methods of setting of TACs are not
monitoring
clarified, and/or political decisions on the fishers employment are not made.
Concern: Unsustainable exploitation of fish under present conditions / Socio-economic impacts
Extent or area
Duration or Reli-
Avail-
Explanation or justification how the indicator supports
Socio-economic indicator
Format
Source
covered
frequency
ability ability
the conclusion made in the Assessment
As a result of complex impact of natural and anthropogenic
Economic
Scientific reports
(overexploitation) factors, quotas for cod (the main fishery)
Text, data,
Northern fishery
More than
impacts
Reduced economic returns.
Average Free
and publications,
for Russia decreased by 50% in 2002, compared to 1997. The
table
basin of Russia
10 years
Score: 3
confidential sources
profit of fishing companies and earning of fishers decreased
correspondingly by 30-40%.
Russia fishing
Health
Loss of food sources (e.g.
industry in the
Scientific reports and
Average human consumption of marine products per person
impacts
sources of protein) for human or Report
Long-term
Low
Free
Barents and White
publications
decreased more than twice in 2001, compared to 1990.
Score: 1
animal consumption.
Sea fisheries
The reduction of quotas leads to a decrease in the number of
fishing vessels and the unemployment. From 1997 to 2001, the
number of fishers in the northern basin decreased from 30 000 to
Loss of employment/livelihood.
22 000. The employment in fishery decreased from 6-12 months
Other
per year to 2-6 months by the year 2001, compared to the early
social and
For more
State statistics,
Report data,
Northern fishery
1990s. The unemployment increased by 50%.
community
than
Average Free
scientific reports and
table
basin of Russia
impacts
Conflict between user groups
10 years
publications
Score: 2
for shared resources including
space.
The number of il egal bargains and conflicts has increased
because of increased competition for quotas.
Inter-generational equity issues
(access to resources).
92
GIWA REGIONAL ASSESSMENT 11 BARENTS SEA
ANNEXES
93
Concern: Unsustainable exploitation of fish under future conditions / Socio-economic impacts
Extent
Duration or Reli-
Avail-
Explanation or justification how the indicator supports the conclusion
Socio-economic indicator
Format
or area
Source
frequency
ability ability
made in the Assessment
covered
It is expected that some legislative measures and political decisions will be taken,
Confidential
Economic
Reduced economic returns and
intended to increase control and enforcement in the fisheries, struggle against
Barents
sources, scientific
impacts
potential new employment
Text
Till 2020
Low
Free
overexploitation, discards and by-catches, and decrease the unemployment in
Sea
reports and
Score: 2
possibilities.
the fishing industry. Nevertheless, the economic returns in the fisheries sector are
publications
expected to decrease.
Health
Loss of food sources (e.g. sources
Human consumption of marine products in Russia per person will not exceed
impacts
of protein) for human or animal
10-15 kg per year, while the recommended standard is 25 kg.
Score: 1
consumption.
There is an expected reduction of the fishery fleet capacity by a factor of 3. It will
inevitably decrease the number of fishers by half. It is expected that overfishing
Loss of employment/livelihood.
and discards will take place, which may increase the overall crisis in the fisheries
sector and the unemployment among fishers.
Other
Northern
social and
Conflict between user groups
fishery
Scientific reports,
community
for shared resources including
Prognoses
Till 2020
High
Free
basin of
publications
impacts
space.
Russia
Score: 2
It is expected that crisis in the fisheries will increase the level of conflict between
user groups.
Inter-generational equity issues
(access to resources).
Concern: Unsustainable exploitation of fish under future conditions / Issue: Overexploitation, Excessive by-catch and discards,
Destructive fishing practices (Finnmark, Norway)
Environmental
Extent or
Duration and Reli-
Avail-
Explanation or justification how the indicator supports the conclusion made
Format
Source
impact indicator
area covered frequency
ability
ability
in the Assessment
Joint Norwegian-Russian Fisheries Commission has agreed upon a decision-making
Status of fish
Medium- to
Text
Barents Sea
Low
Free
Report, official publication
procedure based on scientific recommendations, restricting the parties when setting
stocks and quotas.
long-term
TACs for the Barents Sea fisheries.
Concern: Unsustainable exploitation of fish under present conditions / Socio-economic impacts (Finnmark, Norway)
Explanation or justification how the indicator
Socio-economic
Duration or
Reli-
Avail-
Format
Extent or area covered
Source
supports the conclusion made in the
indicator
frequency
ability
ability
Assessment
Economic
Reduced economic
Text, data, Norwegian fishing industry in the
Reductions in fish stocks have led to decreased
impacts
Medium-term
High
Free
Scientific Reports
returns.
tables
Barents Sea fisheries
economic returns in the fishing industry.
Score: 3
Other social
Reductions in fish stocks and market competition have
Norwegian fish-processing
and community
Loss of employment/ Text, data,
Medium- to
led to a decrease in the number of fish-processing
industry and fleet in the Barents
High
Free
Scientific Reports
impacts
livelihood.
tables
long-term
plants and a substantial long-term reduction in the
Sea fisheries
Score: 2
number of fishing vessels and fishers.
Concern: Unsustainable exploitation of fish under future conditions / Socio-economic impacts (Finnmark, Norway)
Socio-economic
Extent or area Duration or
Reli-
Avail-
Explanation or justification how the indicator
Format
Source
indicator
covered
frequency
ability
ability
supports the conclusion made in the Assessment
There is an expected long-term reduction in the
Official publications, Norwegian
employment of the fishing industry. However, it is
Norwegian
Ministry of Oil and Energy,
Loss of employment.
Reports
Long-term
Moderate
Free
expected that increased aquaculture and the dril ing
Other
marine sector
Norwegian Ministry of Fisheries,
for gas in the Barents Sea may reduce the social and
social and
Finnmark County
community impacts of reduced fishing opportunities.
community
impacts
It is expected that a more diversified marine activity
Conflicts between
Official publications, Norwegian
Score: 1
in the Barents Sea that is, dril ing, fisheries and
user groups for shared
Reports and Norwegian
Ministry of Oil and Energy,
Medium-term
Moderate
Free
aquaculture may increase the level of conflict
resources, including
statements marine sector
Norwegian Ministry of Fisheries,
between user groups, within and between marine
space.
Finnmark County
sectors.
92
GIWA REGIONAL ASSESSMENT 11 BARENTS SEA
ANNEXES
93
Annex IV
Certification of fisheries to the
MSC Standard
In 1997, the international corporation Unilever in cooperation with WWF
established a certification programme for sustainable fisheries, known
as the Marine Stewardship Council (MSC). This became an independent
non-profit organisation in 1999. The mission of the MSC is the support
of the ecological y safe, social y profitable and economical y vigorous
fishery practices. Unilever is one of the largest producers of frozen fish
products selling them under its brands Iglo, Birds Eye, Gorton etc. MSC
is working in partnership with the well known auditor firms assessing
the candidates for the ecological logo. Those meeting the MSC
requirements obtain the ecological certificate. The certificate gives
products advantages on the ecological y sensitive market, increases
the trust for fishery companies from its potential partners and creditors,
creates a positive image, and in the end increases profit.
MSC assesses each fishery against five indicators: fisheries research,
quota system, regulatory tools, control systems, and long-term
management plan. The effect of fishing on marine ecosystems is also
taken into account. These data forms the rating of a fishing company. A
fishery that is deemed sustainable is encouraged to seek certification to
the MSC Standard. The main principle here is not to reveal the negative
features of this or that fishery, which are well known for many, but the
orientation on the best fishery practices and best-managed fisheries.
Good rating works for the company, its partners and creditors. It also
gives priorities in quotas al ocation, preferential terms for obtaining
credits and subsidies, increases ecological reputation of products
through mass media, which contributes to better realisation of products
at the world markets, etc.
Certification to the MSC Standard is a rather expensive process, and
not every fishing company can afford this. Stil , analysts do believe that
fisheries, especial y coastal ones, have a good potential to be certified
(Ozolin'sh & Spiridinov 2001).
94
GIWA REGIONAL ASSESSMENT 11 BARENTS SEA
ANNEXES
95
Annex V
Protection of the Arctic Marine Environment (PAME):
List of important water-related PAME addresses policy and non-emergency response measures
programmes and assessments
related to protection of the marine environment from land and
sea-based activities. PAME has responsibilities to take preventative
and other measures, directly or through competent international
Barents Region Environment Action Program, 1994
organisations, regarding marine pol ution in the Arctic, irrespective
Adopted in June 1994 by the Barents Environment Ministers at their First
of origin.
Barents Environment Council Meeting. Declarations of Barents Region
Sustainable Development Working Group (SDWG):
Environment Ministers have been made in 1994, 1995, 1997, and 1999.
Established by Arctic Ministers in 1998. The objective is to protect
and enhance the economies, culture and health of the inhabitants
Arctic Environmental Protection Strategy (AEPS), 1991
of the Arctic, in an environmental y sustainable manner.
Protect the Arctic ecosystems, including humans;
Provide for the protection, enhancement and restoration of
Arctic Climate Impact Assessment (ACIA)
environmental quality and sustainable utilisation of natural
An international project organised under the auspices of the Arctic
resources, including their use by local populations and indigenous
Council to evaluate and synthesise knowledge on climate variability,
peoples in the Arctic;
climate change, and increased ultraviolet radiation and their
Recognise and, to the extent possible, seek to accommodate the
consequences.
traditional and cultural needs, values and practises of indigenous
peoples as determined by themselves, related to the protection of
International Arctic Science Committee, IASC
the Arctic environment;
IASC is a non-governmental organisation to encourage and facilitate
Review regularly the state of the Arctic environment to identify,
cooperation in al aspects of Arctic research, in al countries engaged
reduce and, as a final goal, eliminate pollution.
in Arctic research and in all areas of the Arctic region. The IASC member
organisations are national science organisations covering al fields of
The five programmes established under the AEPS are:
Arctic research.
Arctic Monitoring and Assessment Programme (AMAP):
An international organisation established to implement
Arctic Environmental Impact Assessment (ARIA)
components of the AEPS. AMAP has responsibilities to monitor the
The purpose of the project is to develop Guidelines for EIA in the
levels of, and assess the effects of, anthropogenic pollutants in all
Arctic. A circumpolar ad hoc group, whose task was to evaluate a
compartments of the Arctic environment, including humans. AMAP
proposal for an electronic information system supporting arctic EIAs,
is now a programme group of the Arctic Council, and its current
has recommended that an electronic network on the Internet should
objective is "providing reliable and sufficient information on the
be established.
status of, and threats to, the Arctic environment, and providing
scientific advice on actions to be taken in order to support Arctic
Barents GIT, National Land Survey of Finland
governments in their efforts to take remedial and preventive
GIT means General Information of Geographic Information Technology
actions relating to contaminants".
within the Barents region. The overal objective of the project is to
Conservation of Arctic Flora and Fauna (CAFF):
"produce homogeneous geographic information that can be used
The Program for the Conservation of Arctic Flora and Fauna, under
for planning and decision-making concerning the environment, land
the AEPS, was established to address the special needs of Arctic
use, natural resources, industry, trade and tourism and transport in
species and their habitats in the rapidly developing Arctic region.
the Barents Region. It wil also be an important information source
CAFF has responsibilities to facilitate the exchange of information
for educational institutions at al levels and for al who require a
and coordination of research on species and habitats of Arctic flora
complete and comprehensive picture of and data about the Barents
and fauna.
Region. A further intermediate objective for the project is to create an
Emergency Prevention, Preparedness and Response (EPPR):
infrastructure for the storage and exchange of geographic information
Established as an expert forum to evaluate the adequacy of
in the Barents Region".
existing arrangements and to recommend the necessary system
of cooperation.
94
GIWA REGIONAL ASSESSMENT 11 BARENTS SEA
ANNEXES
95
Research
A global environmental assessment process, the GEO Process, that is
Barents Sea Impact Study (BASIS)
cross-sectoral and participatory. It incorporates regional views and
The Barents Sea Impact Study (BASIS) is a global change research project
perceptions, and builds consensus on priority issues and actions
developed under the auspices of the International Arctic Science
through dialogue among policy-makers and scientists at regional
Committee (IASC). After a planning phase of five years (1992-1996),
and global levels.
a research proposal was submitted in 1997 to the IV Framework
GEO outputs, in printed and electronic formats, including the GEO
Environment and Climate Programme of the European Commission.
Report series. This series makes periodic reviews of the state of the
This proposal was accepted and has received funding for an initial
world's environment, and provides guidance for decision-making
period of two years (1998-1999).
processes such as the formulation of environmental policies, action
planning and resource al ocation. Other outputs include technical
State of the environment
reports, a web-site and a publication for young people.
Barentswatch
"Barentswatch 1998" provides extensive and current information on the
GEF Projects in the region
state of the environment and natural resources of the Barents region.
UNEP-GEF-International Waters
Barentswatch 1998 was published by Svanhovd Environmental Centre
Support to the National Plan of Action in the Russian Federation for
in Norway in cooperation with the Norwegian Directorate for Nature
the Protection of the Arctic Marine Environment from Anthropogenic
Management, the Norwegian Polar Institute, and GRID-Arendal. The
Pollution. The project will focus on pre-investment studies of identified
publication is available in English, Russian and Norwegian.
priority hot spots with known significant transboundary consequences.
Additional activities wil include the necessary support in the
Arctic Monitoring and Assessment Programme (AMAP):
development of legal, institutional and economic measures.
State of the Environment Report
During its initial phase of operation (1991-1996), AMAP designed
UNEP-GEF-Biodiversity
and implemented a monitoring programme and conducted its first
An integrated ecosystem approach to enhance biodiversity conservation
assessment of the State of the Arctic Environment with respect to
and minimise habitat fragmentation in the Russian Arctic.
pol ution issues. A special group (the AMAP Assessment Steering Group)
was established to oversee the preparation of the AMAP Assessment,
Other actors and initiatives
which is based on input from several hundreds of scientific experts.
European Union and the Northern Dimension;
Two Assessment reports were produced to present the results of the
European Commission Report on the Northern Dimension,
AMAP assessment firstly to decision makers and the general public (the
November 1998;
SOAER; full text), and secondly to ful y document the scientific basis for
Conclusions of the Foreign Ministers Conference on the Northern
the assessment (the AAR). This first AMAP Assessment was presented
Dimension, November 1999.
in 1997.
INTERREG II
Major environmental challenges and environmental problems
EU programmes in support of development and border region
Summary of environmental problems and chal enges in the region,
cooperation in the Barents/Arctic area.
compiled by Finnish Ministry of Trade and Industry and Finnish Ministry
of Environment for the Barentsinfo database.
Tacis
The Tacis Programme is a European Union initiative to provide grant-
Progress Report on Barents Region Environmental Hot Spots
financed technical assistance to support the process of transition to
A report prepared 1998 by the Nordic Environment Finance Co-
market economies and democratic societies in the partner countries of
operation, NEFCO, as a summary of measures taken in the region since
Armenia, Azerbaijan, Belarus, Georgia, Kazakhstan, Kyrgyzstan, Moldova,
1995.
Mongolia, Russia, Tajikistan, Turkmenistan, Ukraine and Uzbekistan.
Priorities are greater concentration of the assistance to achieve
Global Environment Outlook 2000 State of the Environment:
maximum impact, and support for the objectives of the Partnership
Europe and Central Asia
and Cooperation Agreements (PCAs).
GEO is:
96
GIWA REGIONAL ASSESSMENT 11 BARENTS SEA
ANNEXES
97
EU and the Barents Region
Russian programmes and projects related to the
A document, available also in Russian, published on the EU Tacis
Barents Sea region
site about "the European Union and its neighbours in the North-
Water resources monitoring programme in the territory of the
East". Contains general information about the Barents Region;
Murmansk Region (2003)
relations between the EU and the Russian Federation and Norway,
The programme is carried out by Murmansk Region Natural
respectively; regional cooperation in the Barents region; the scope of
Resources Commission, Administration of the Dvina-Pechora water
EU involvement in the Barents region; and EU support in the Barents
basin, Murmansk Region Administration for Hydrometeorology, and
region through structural funds (Regional Development Fund, Social
Administration of the Murmansk Region. The objective of the program
Fund, and Agricultural Guarantee and Guidance Fund) and the Tacis
is annual observations of the quality of surface waters on 30 rivers and
programme.
10 water reservoirs of the Murmansk Region, as well as in the Kola Bay;
biotesting of water sources (Kola River, Pasvik River, sources of drinking
INTERREG IIIB Northern Periphery Programme
water in the Kola and Pechenga Districts).
The Interreg I IB Northern Periphery Programme consists of the
northern parts of Finland, Scotland, Sweden, Norway, the whole of
Assessment of Barents Sea fisheries contamination (1997-2004)
Iceland, Greenland and Faroe Islands. Northwest Russia is part of the
The regional programme is carried out by Murmansk Marine Biological
co-operation. The overal objective for Interreg is to prevent national
Institute, Polar Scientific Research Institute of Fisheries and Oceanography,
borders from constituting barriers to the balanced development and
and Murmansk Region Natural Resources Commission. The programme is
integration of the European territory. Interreg I IB concerns cooperation
aimed at obtaining systematic data on the current state and tendencies
within larger transnational areas. The transnational cooperation
of contamination of Barents Sea commercial fishes and invertebrates, and
between national, regional and local authorities aims to promote
give prognosis for the accumulation of contaminants.
a higher degree of territorial integration across large groupings of
European regions, with a view to achieving sustainable, harmonious
Federal programme "World Ocean", sub-programme
and balanced development in the community and better territorial
"Investigations of the World Ocean Nature", project "Complex
integration with candidate and other neighbouring countries.
Investigations of processes, characteristics and resources of
Russian Seas of the North-European Basin" (2003-2007)
Other actors
The project is carried out by Murmansk Marine Biological Institute,
Barents Secretariat
Russian State Hydrometeorological University, Institute of
The Secretariat is maintained by the three Norwegian provinces
Oceanography of the Russian Academy of Sciences, Institute of Arctic
Nordland, Troms and Finnmark. Its main tasks are to coordinate
and Antarctic Research, Al -Russian Research Institute of Oceanology,
national priorities and goals within the Barents cooperation; provide
Institute of Water Problems of the North, Zoological Institute of the
a resource centre in the handling of projects; conduct information
Russian Academy of Sciences, and State Oceanographic Institute.
activities and establish contacts to enhance the general knowledge
and understanding of the Barents region; and make regional activities
The purpose of the project is complex oceanographic, hydrochemical
known and accepted. See the Barents Programme, which is the
and biological investigations of the Barents, White and Baltic Seas aimed
Regional Council's programme for concretising how to achieve the
at sustainable exploitation of their marine resources, assessment of their
overall goals set up for the regional work and supporting the ongoing
assimilative potential and level of chemical pollution, conservation of
changes in the Russian part.
their biodiversity.
The Barents Sea - a Large Marine Ecosystem (LME)
Federal scientific and technical programme "Investigations
A Large Marine Ecosystem is a region of ocean space encompassing
and elaborations on the prior directions in the development
coastal areas from river basins and estuaries to the seaward boundary
of science and technologies for civil use", project "Scientific
of continental shelves and the seaward margins of coastal current
substantiation of the methodology for environmental impact
systems. It is a relatively large region characterised by distinct
assessment of marine oil and gas exploitation on the marine
bathymetry, hydrography, productivity, and trophical y dependent
environment of Arctic Seas" (2002-2004)
populations.
The project is carried out by Murmansk Marine Biological Institute
with the aim of developing the methodology for the ecological and
96
GIWA REGIONAL ASSESSMENT 11 BARENTS SEA
ANNEXES
97
geographic analysis and prognosis of the consequences of large
projects on marine oil and gas exploitation (Stockman, Prirazlomnoe
and other oil and gas deposits in the Barents Sea).
Programme of the Ministry of Economic Development and
Trade of the Russian Federation
Project "Meridian" (2002-2003)
The main task of the project, which is carried out by Murmansk Marine
Biological Institute, is the development of scenarios for the impact of
marine oil and gas exploitation on the ecosystems of the southern part
of the Barents Sea.
98
GIWA REGIONAL ASSESSMENT 11 BARENTS SEA
ANNEXES
99
Annex VI
List of conventions and
specific laws that affect water
use in the region
Kirkenes Declaration (1993).
Rovaniemi Declaration on the Protection of the Arctic Environment
(1991).
North-East Atlantic Fisheries Convention (1963).
Convention for the Conservation of Salmon in the North Atlantic
Ocean (1983).
Convention on Biological Diversity, Rio (1992).
OSPAR Convention (1992) Convention for the Protection of the
Marine Environment of the North-East Atlantic.
Berne Convention (1982). It is based on the principle that wild
fauna and flora constitute a natural heritage that plays a vital role
in maintaining biological balances. The Berne Convention requires
`each Contracting Party to strictly control the introduction of non-
native species'.
Bonn Convention (1983) on the Conservation of Migratory Species
of Wild Animals, aims to conserve terrestrial, marine and avian
migratory species throughout their range.
EU-Directives and specific laws
Birds Directive (1979) The Council Directive on Wild Birds (79/409/EEC)
concerns not only the protection of wild birds but also their habitats.
Directive on Genetical y Modified Organisms (GMOs) (1990)
Council Directive (90/220/EEC) on the `Deliberate Release into the
Environment of Genetical y Modified Organisms' (EC 1990).
Habitats Directive (1992). Aim of the Council Directive on the
Conservation of Natural Habitats and of Wild Fauna and Flora (92/
43/EEC) is to contribute towards ensuring biodiversity through the
conservation of natural and semi-natural habitats and of wild fauna
and flora in the Member States.
Natura 2000 is designed to establish a coherent European
ecological network of Sites of Community Importance (SCIs) in
order to maintain the distribution and abundance of threatened
species and habitats, both terrestrial and marine.
Water Framework Directive (2000) 2000/60/EC. A major policy
initiative that is currently undergoing a complex and demanding
implementation process via the development of a Common
Implementation Strategy under the auspices of Working Groups
with participants from Member States and the European
Commission.
EU Water Initiative, Johannesburg (2002).
98
GIWA REGIONAL ASSESSMENT 11 BARENTS SEA
ANNEXES
99
The Global International
Waters Assessment
This report presents the results of the Global International Waters
Adequately managing the world's aquatic resources for the benefit of
Assessment (GIWA) of the transboundary waters of the Barents Sea.
al is, for a variety of reasons, a very complex task. The liquid state of
This and the subsequent chapter offer a background that describes
the most of the world's water means that, without the construction
the impetus behind the establishment of GIWA, its objectives and
of reservoirs, dams and canals it is free to flow wherever the laws of
how the GIWA was implemented.
nature dictate. Water is, therefore, a vector transporting not only a
wide variety of valuable resources but also problems from one area
to another. The effluents emanating from environmental y destructive
activities in upstream drainage areas are propagated downstream
The need for a global
and can affect other areas considerable distances away. In the case of
international waters
transboundary river basins, such as the Nile, Amazon and Niger, the
assessment
impacts are transported across national borders and can be observed
in the numerous countries situated within their catchments. In the case
of large oceanic currents, the impacts can even be propagated between
Global y, people are becoming increasingly aware of the degradation of
continents (AMAP 1998). Therefore, the inextricable linkages within
the world's water bodies. Disasters from floods and droughts, frequently
and between both freshwater and marine environments dictates that
reported in the media, are considered to be linked with ongoing global
management of aquatic resources ought to be implemented through
climate change (IPCC 2001), accidents involving large ships pol ute public
a drainage basin approach.
beaches and threaten marine life and almost every commercial fish stock
is exploited beyond sustainable limits - it is estimated that the global
In addition, there is growing appreciation of the incongruence
stocks of large predatory fish have declined to less that 10% of pre-
between the transboundary nature of many aquatic resources and the
industrial fishing levels (Myers & Worm 2003). Further, more than 1 bil ion
traditional introspective national y focused approaches to managing
people worldwide lack access to safe drinking water and 2 bil ion people
those resources. Water, unlike laws and management plans, does not
lack proper sanitation which causes approximately 4 billion cases of
respect national borders and, as a consequence, if future management
diarrhoea each year and results in the death of 2.2 mil ion people, mostly
of water and aquatic resources is to be successful, then a shift in focus
children younger than five (WHO-UNICEF 2002). Moreover, freshwater
towards international cooperation and intergovernmental agreements
and marine habitats are destroyed by infrastructure developments,
is required (UN 1972). Furthermore, the complexity of managing the
dams, roads, ports and human settlements (Brinson & Malvárez 2002,
world's water resources is exacerbated by the dependence of a great
Kennish 2002). As a consequence, there is growing public concern
variety of domestic and industrial activities on those resources. As a
regarding the declining quality and quantity of the world's aquatic
consequence, cross-sectoral multidisciplinary approaches that integrate
resources because of human activities, which has resulted in mounting
environmental, socio-economic and development aspects into
pressure on governments and decision makers to institute new and
management must be adopted. Unfortunately however, the scientific
innovative policies to manage those resources in a sustainable way
information or capacity within each discipline is often not available or
ensuring their availability for future generations.
is inadequately translated for use by managers, decision makers and
GLOBAL INTERNATIONAL WATERS ASSESSMENT
i
policy developers. These inadequacies constitute a serious impediment
The Global Environment Facility (GEF)
to the implementation of urgently needed innovative policies.
The Global Environment Facility forges international co-operation and finances actions to address
six critical threats to the global environment: biodiversity loss, climate change, degradation of
international waters, ozone depletion, land degradation, and persistent organic pol utants (POPs).
Continual assessment of the prevailing and future threats to aquatic
The overal strategic thrust of GEF-funded international waters activities is to meet the incremental
ecosystems and their implications for human populations is essential if
costs of: (a) assisting groups of countries to better understand the environmental concerns of
their international waters and work col aboratively to address them; (b) building the capacity
governments and decision makers are going to be able to make strategic
of existing institutions to utilise a more comprehensive approach for addressing transboundary
policy and management decisions that promote the sustainable use of
water-related environmental concerns; and (c) implementing measures that address the priority
transboundary environmental concerns. The goal is to assist countries to utilise the full range of
those resources and respond to the growing concerns of the general
technical, economic, financial, regulatory, and institutional measures needed to operationalise
public. Although many assessments of aquatic resources are being
sustainable development strategies for international waters.
conducted by local, national, regional and international bodies, past
United Nations Environment Programme (UNEP)
assessments have often concentrated on specific themes, such as
United Nations Environment Programme, established in 1972, is the voice for the environment
biodiversity or persistent toxic substances, or have focused only on
within the United Nations system. The mission of UNEP is to provide leadership and encourage
partnership in caring for the environment by inspiring, informing, and enabling nations and
marine or freshwaters. A globally coherent, drainage basin based
peoples to improve their quality of life without compromising that of future generations.
assessment that embraces the inextricable links between transboundary
UNEP work encompasses:
freshwater and marine systems, and between environmental and
Assessing global, regional and national environmental conditions and trends;
Developing international and national environmental instruments;
societal issues, has never been conducted previously.
Strengthening institutions for the wise management of the environment;
Facilitating the transfer of knowledge and technology for sustainable development;
Encouraging new partnerships and mind-sets within civil society and the private sector.
International call for action
University of Kalmar
University of Kalmar hosts the GIWA Co-ordination Office and provides scientific advice and
administrative and technical assistance to GIWA. University of Kalmar is situated on the coast of
The need for a holistic assessment of transboundary waters in order to
the Baltic Sea. The city has a long tradition of higher education; teachers and marine officers have
been educated in Kalmar since the middle of the 19th century. Today, natural science is a priority
respond to growing public concerns and provide advice to governments
area which gives Kalmar a unique educational and research profile compared with other smal er
and decision makers regarding the management of aquatic resources
universities in Sweden. Of particular relevance for GIWA is the established research in aquatic and
environmental science. Issues linked to the concept of sustainable development are implemented
was recognised by several international bodies focusing on the global
by the research programme Natural Resources Management and Agenda 21 Research School.
environment. In particular, the Global Environment Facility (GEF)
Since its establishment GIWA has grown to become an integral part of University activities.
The GIWA Co-ordination office and GIWA Core team are located at the Kalmarsund Laboratory, the
observed that the International Waters (IW) component of the GEF
university centre for water-related research. Senior scientists appointed by the University are actively
suffered from the lack of a global assessment which made it difficult
involved in the GIWA peer-review and steering groups. As a result of the cooperation the University
can offer courses and seminars related to GIWA objectives and international water issues.
to prioritise international water projects, particularly considering
the inadequate understanding of the nature and root causes of
environmental problems. In 1996, at its fourth meeting in Nairobi, the
causes of degradation of the transboundary aquatic environment and
GEF Scientific and Technical Advisory Panel (STAP), noted that: "Lack of
options for addressing them. These processes led to the development
an International Waters Assessment comparable with that of the IPCC, the
of the Global International Waters Assessment (GIWA) that would be
Global Biodiversity Assessment, and the Stratospheric Ozone Assessment,
implemented by the United Nations Environment Programme (UNEP) in
was a unique and serious impediment to the implementation of the
conjunction with the University of Kalmar, Sweden, on behalf of the GEF.
International Waters Component of the GEF".
The GIWA was inaugurated in Kalmar in October 1999 by the Executive
Director of UNEP, Dr. Klaus Töpfer, and the late Swedish Minister of the
The urgent need for an assessment of the causes of environmental
Environment, Kjel Larsson. On this occasion Dr. Töpfer stated: "GIWA
degradation was also highlighted at the UN Special Session on
is the framework of UNEP´s global water assessment strategy and will
the Environment (UNGASS) in 1997, where commitments were
enable us to record and report on critical water resources for the planet for
made regarding the work of the UN Commission on Sustainable
consideration of sustainable development management practices as part of
Development (UNCSD) on freshwater in 1998 and seas in 1999. Also in
our responsibilities under Agenda 21 agreements of the Rio conference".
1997, two international Declarations, the Potomac Declaration: Towards
enhanced ocean security into the third mil ennium, and the Stockholm
The importance of the GIWA has been further underpinned by the UN
Statement on interaction of land activities, freshwater and enclosed
Mil ennium Development Goals adopted by the UN General Assembly
seas, specifical y emphasised the need for an investigation of the root
in 2000 and the Declaration from the World Summit on Sustainable
ii
REGIONAL ASSESSMENTS
GLOBAL INTERNATIONAL WATERS ASSESSMENT
iii
Development in 2002. The development goals aimed to halve the
International waters and transboundary issues
proportion of people without access to safe drinking water and basic
The term "international waters", as used for the purposes of the GEF Operational Strategy,
sanitation by the year 2015 (United Nations Millennium Declaration
includes the oceans, large marine ecosystems, enclosed or semi-enclosed seas and estuaries, as
wel as rivers, lakes, groundwater systems, and wetlands with transboundary drainage basins
2000). The WSSD also cal s for integrated management of land, water and
or common borders. The water-related ecosystems associated with these waters are considered
living resources (WSSD 2002) and, by 2010, the Reykjavik Declaration on
integral parts of the systems.
Responsible Fisheries in the Marine Ecosystem should be implemented
The term "transboundary issues" is used to describe the threats to the aquatic environment
linked to globalisation, international trade, demographic changes and technological advancement,
by al countries that are party to the declaration (FAO 2001).
threats that are additional to those created through transboundary movement of water. Single
country policies and actions are inadequate in order to cope with these chal enges and this makes
them transboundary in nature.
The international waters area includes numerous international conventions, treaties, and
agreements. The architecture of marine agreements is especial y complex, and a large number
The conceptual framework
of bilateral and multilateral agreements exist for transboundary freshwater basins. Related
conventions and agreements in other areas increase the complexity. These initiatives provide
and objectives
a new opportunity for cooperating nations to link many different programmes and instruments
into regional comprehensive approaches to address international waters.
Considering the general decline in the condition of the world's aquatic
the large-scale deforestation of mangroves for ponds (Primavera 1997).
resources and the international y recognised need for a global y
Within the GIWA, these "non-hydrological" factors constitute as large
coherent assessment of transboundary waters, the primary objectives
a transboundary influence as more traditional y recognised problems,
of the GIWA are:
such as the construction of dams that regulate the flow of water into
To provide a prioritising mechanism that al ows the GEF to focus
a neighbouring country, and are considered equal y important. In
their resources so that they are used in the most cost effective
addition, the GIWA recognises the importance of hydrological units that
manner to achieve significant environmental benefits, at national,
would not normal y be considered transboundary but exert a significant
regional and global levels; and
influence on transboundary waters, such as the Yangtze River in China
To highlight areas in which governments can develop and
which discharges into the East China Sea (Daoji & Daler 2004) and the
implement strategic policies to reduce environmental degradation
Volga River in Russia which is largely responsible for the condition of
and improve the management of aquatic resources.
the Caspian Sea (Barannik et al. 2004). Furthermore, the GIWA is a truly
regional assessment that has incorporated data from a wide range of
In order to meet these objectives and address some of the current
sources and included expert knowledge and information from a wide
inadequacies in international aquatic resources management, the GIWA
range of sectors and from each country in the region. Therefore, the
has incorporated four essential elements into its design:
transboundary concept adopted by the GIWA extends to include
A broad transboundary approach that generates a truly regional
impacts caused by globalisation, international trade, demographic
perspective through the incorporation of expertise and existing
changes and technological advances and recognises the need for
information from al nations in the region and the assessment of
international cooperation to address them.
all factors that influence the aquatic resources of the region;
A drainage basin approach integrating freshwater and marine
systems;
The organisational structure and
A multidisciplinary approach integrating environmental and socio-
economic information and expertise; and
implementation of the GIWA
A coherent assessment that enables global comparison of the
results.
The scale of the assessment
Initial y, the scope of the GIWA was confined to transboundary waters
The GIWA builds on previous assessments implemented within the GEF
in areas that included countries eligible to receive funds from the GEF.
International Waters portfolio but has developed and adopted a broader
However, it was recognised that a truly global perspective would only
definition of transboundary waters to include factors that influence the
be achieved if industrialised, GEF-ineligible regions of the world were
quality and quantity of global aquatic resources. For example, due to
also assessed. Financial resources to assess the GEF-eligible countries
globalisation and international trade, the market for penaeid shrimps
were obtained primarily from the GEF (68%), the Swedish International
has widened and the prices soared. This, in turn, has encouraged
Development Cooperation Agency (Sida) (18%), and the Finnish
entrepreneurs in South East Asia to expand aquaculture resulting in
Department for International Development Cooperation (FINNIDA)
ii
REGIONAL ASSESSMENTS
GLOBAL INTERNATIONAL WATERS ASSESSMENT
iii
1
15
11
16
14
12
28
10
13
25
17
29
9
18
19
30
23
22
8 6 7
31
20
24
26
35
33
2
34
27
5
21
50
32
51
36
37
41
52
4
49
53
43
65
55
3
48
54
42
56
46
62
47
40b
40a
57
62
45b
39
59
45a
58
60
64
44
61
38
63
66
1
Arctic
12
Norwegian Sea (LME)
24 Aral Sea
36 East-China Sea (LME)
46 Somali Coastal Current (LME)
58 North Australian Shelf (LME)
2
Gulf of Mexico (LME)
13
Faroe plateau
25 Gulf of Alaska (LME)
37
Hawaiian Archipelago (LME)
47
East African Rift Valley Lakes
59 Coral Sea Basin
3
Caribbean Sea (LME)
14
Iceland Shelf (LME)
26 California Current (LME)
38 Patagonian Shelf (LME)
48 Gulf of Aden
60 Great Barrier Reef (LME)
4
Caribbean Islands
15
East Greenland Shelf (LME)
27 Gulf of California (LME)
39 Brazil Current (LME)
49 Red Sea (LME)
61
Great Australian Bight
5
Southeast Shelf (LME)
16
West Greenland Shelf (LME)
28 East Bering Sea (LME)
40a Brazilian Northeast (LME)
50 The Gulf
62 Small Island States
6
Northeast Shelf (LME)
17
Baltic Sea (LME)
29 West Bering Sea (LME)
40b Amazon
51
Jordan
63 Tasman Sea
7
Scotian Shelf (LME)
18
North Sea (LME)
30 Sea of Okhotsk (LME)
41
Canary Current (LME)
52 Arabian Sea (LME)
64 Humboldt Current (LME)
8
Gulf of St Lawrence
19
Celtic-Biscay Shelf (LME)
31
Oyashio Current (LME)
42 Guinea Current (LME)
53 Bay of Bengal S.E.
65 Eastern Equatorial Pacific
9
Newfoundland Shelf (LME)
20 Iberian Coastal (LME)
32 Kuroshio Current (LME)
43 Lake Chad
54 South China Sea (LME)
66 Antarctic (LME)
10
Baffin Bay, Labrador Sea,
21
Mediterranean Sea (LME)
33 Sea of Japan/East Sea (LME)
44 Benguela Current (LME)
55 Mekong River
Canadian Archipelago
22 Black Sea (LME)
34 Yellow Sea (LME)
45a Agulhas Current (LME)
56 Sulu-Celebes Sea (LME)
11
Barents Sea (LME)
23 Caspian Sea
35 Bohai Sea
45b Indian Ocean Islands
57 Indonesian Seas (LME)
Figure 1
The 66 transboundary regions assessed within the GIWA project.
(10%). Other contributions were made by Kalmar Municipality, the
Considering the objectives of the GIWA and the elements incorporated
University of Kalmar and the Norwegian Government. The assessment of
into its design, a new methodology for the implementation of the
regions ineligible for GEF funds was conducted by various international
assessment was developed during the initial phase of the project. The
and national organisations as in-kind contributions to the GIWA.
methodology focuses on five major environmental concerns which
constitute the foundation of the GIWA assessment; Freshwater shortage,
In order to be consistent with the transboundary nature of many of the
Pol ution, Habitat and community modification, Overexploitation of fish
world's aquatic resources and the focus of the GIWA, the geographical
and other living resources, and Global change. The GIWA methodology
units being assessed have been designed according to the watersheds
is outlined in the fol owing chapter.
of discrete hydrographic systems rather than political borders (Figure 1).
The geographic units of the assessment were determined during the
The global network
preparatory phase of the project and resulted in the division of the
In each of the 66 regions, the assessment is conducted by a team of
world into 66 regions defined by the entire area of one or more
local experts that is headed by a Focal Point (Figure 2). The Focal Point
catchments areas that drains into a single designated marine system.
can be an individual, institution or organisation that has been selected
These marine systems often correspond to Large Marine Ecosystems
on the basis of their scientific reputation and experience implementing
(LMEs) (Sherman 1994, IOC 2002).
international assessment projects. The Focal Point is responsible
for assembling members of the team and ensuring that it has the
Large Marine Ecocsystems (LMEs)
necessary expertise and experience in a variety of environmental
Large Marine Ecosystems (LMEs) are regions of ocean space encompassing coastal areas from river
and socio-economic disciplines to successful y conduct the regional
basins and estuaries to the seaward boundaries of continental shelves and the outer margin of the
major current systems. They are relatively large regions on the order of 200 000 km2 or greater,
assessment. The selection of team members is one of the most critical
characterised by distinct: (1) bathymetry, (2) hydrography, (3) productivity, and (4) trophical y
elements for the success of GIWA and, in order to ensure that the
dependent populations.
The Large Marine Ecosystems strategy is a global effort for the assessment and management
most relevant information is incorporated into the assessment, team
of international coastal waters. It developed in direct response to a declaration at the 1992
members were selected from a wide variety of institutions such as
Rio Summit. As part of the strategy, the World Conservation Union (IUCN) and National Oceanic
and Atmospheric Administration (NOAA) have joined in an action program to assist developing
universities, research institutes, government agencies, and the private
countries in planning and implementing an ecosystem-based strategy that is focused on LMEs as
sector. In addition, in order to ensure that the assessment produces a
the principal assessment and management units for coastal ocean resources. The LME concept is
also adopted by GEF that recommends the use of LMEs and their contributing freshwater basins
truly regional perspective, the teams should include representatives
as the geographic area for integrating changes in sectoral economic activities.
from each country that shares the region.
iv
REGIONAL ASSESSMENTS
GLOBAL INTERNATIONAL WATERS ASSESSMENT
v
The GIWA is comprised of a logical sequence of four integrated
components. The first stage of the GIWA is cal ed Scaling and is a
process by which the geographic area examined in the assessment is
defined and al the transboundary waters within that area are identified.
Once the geographic scale of the assessment has been defined, the
assessment teams conduct a process known as Scoping in which the
magnitude of environmental and associated socio-economic impacts
of Freshwater shortage, Pol ution, Habitat and community modification,
Unsustainable exploitation of fish and other living resources, and Global
Figure 2
The organisation of the GIWA project.
change is assessed in order to identify and prioritise the concerns
that require the most urgent intervention. The assessment of these
predefined concerns incorporates the best available information and
In total, more than 1 000 experts have contributed to the implementation
the knowledge and experience of the multidisciplinary, multi-national
of the GIWA il ustrating that the GIWA is a participatory exercise that
assessment teams formed in each region. Once the priority concerns
relies on regional expertise. This participatory approach is essential
have been identified, the root causes of these concerns are identified
because it instils a sense of local ownership of the project, which
during the third component of the GIWA, Causal chain analysis. The root
ensures the credibility of the findings and moreover, it has created a
causes are determined through a sequential process that identifies, in
global network of experts and institutions that can col aborate and
turn, the most significant immediate causes fol owed by the economic
exchange experiences and expertise to help mitigate the continued
sectors that are primarily responsible for the immediate causes and
degradation of the world's aquatic resources.
final y, the societal root causes. At each stage in the Causal chain
analysis, the most significant contributors are identified through an
analysis of the best available information which is augmented by the
expertise of the assessment team. The final component of the GIWA is
GIWA Regional reports
the development of Policy options that focus on mitigating the impacts
of the root causes identified by the Causal chain analysis.
The GIWA was established in response to growing concern among the
general public regarding the quality of the world's aquatic resources
The results of the GIWA assessment in each region are reported in
and the recognition of governments and the international community
regional reports that are published by UNEP. These reports are designed
concerning the absence of a global y coherent international waters
to provide a brief physical and socio-economic description of the
assessment. However, because a holistic, region-by-region, assessment
most important features of the region against which the results of the
of the condition of the world's transboundary water resources had never
assessment can be cast. The remaining sections of the report present
been undertaken, a methodology guiding the implementation of such
the results of each stage of the assessment in an easily digestible form.
an assessment did not exist. Therefore, in order to implement the GIWA,
Each regional report is reviewed by at least two independent external
a new methodology that adopted a multidisciplinary, multi-sectoral,
reviewers in order to ensure the scientific validity and applicability of
multi-national approach was developed and is now available for the
each report. The 66 regional assessments of the GIWA will serve UNEP
implementation of future international assessments of aquatic resources.
as an essential complement to the UNEP Water Policy and Strategy and
UNEP's activities in the hydrosphere.
UNEP Water Policy and Strategy
The primary goals of the UNEP water policy and strategy are:
(a) Achieving greater global understanding of freshwater, coastal and marine environments by
conducting environmental assessments in priority areas;
Global International Waters Assessment
(b) Raising awareness of the importance and consequences of unsustainable water use;
(c) Supporting the efforts of Governments in the preparation and implementation of integrated
management of freshwater systems and their related coastal and marine environments;
(d) Providing support for the preparation of integrated management plans and programmes for
aquatic environmental hot spots, based on the assessment results;
(e) Promoting the application by stakeholders of precautionary, preventive and anticipatory
approaches.
iv
REGIONAL ASSESSMENTS
GLOBAL INTERNATIONAL WATERS ASSESSMENT
v
References:
AMAP (1998). Assessment Report: Arctic Pol ution Issues. Arctic
Monitoring and Assessment Programme (AMAP), Oslo, Norway.
Barannik, V., Borysova, O. and Stolberg, F. (2004). The Caspian Sea Region:
Environmental Change. Ambio, 33:45-51.
Brinson, M.M. and Malvárez, A.I. (2002). Temperate freshwater wetlands:
types, status, and threats. Environmental Conservation, 29:115-133.
Daoji, L. and Daler, D. (2004). Ocean Pol ution from Land-based Sources:
East China Sea, China. Ambio, 33:98-106.
FAO (2001). Reykjavik conference on responsible fisheries in the marine
ecosystem. Iceland, 1-4 October 2001.
IOC (2002). IOC-IUCN-NOAA Consultative Meeting on Large Marine
Ecosystems (LMEs). Fourth Session, 8-9 January 2002, Paris,
France.
IPCC (2001). Climate Change 2001: The Scientific Basis. Contribution
of Working Group I to the Third Assessment Report of the
Intergovernmental Panel on Climate Change. In: Houghton,
J.T., Ding, Y., Griggs, D.J., Noguer, M., van der Linden, P.J., Dai, X.,
Maskel , K. and Johnson, C.A. (eds). Cambridge University Press,
Cambridge, United Kingdom and New York, NY, USA.
Kennish, M.J. (2002). Environmental threats and environmental future of
estuaries. Environmental Conservation, 29:78-107.
Myers, R.A. and Worm, B. (2003). Rapid worldwide depletion of predatory
fish communities. Nature, 423:280-283.
Primavera, J.H. (1997) Socio-economic impacts of shrimp culture.
Aquaculture Research, 28:815-827.
Sherman, K. (1994). Sustainability, biomass yields, and health of coastal
ecosystems: an ecological perspective. Marine Ecology Progress
Series, 112:277-301.
United Nations conference on the human environment (1972). Report
available on-line at http://www.unep.org
United Nations Mil ennium Declaration (2000). The Mil ennium
Assembly of the United Nations, New York.
WHO-UNICEF (2002). Global Water Supply and Sanitation Assessment:
2000 Report.
WSSD (2002). World Summit on Sustainable Development.
Johannesburg Summit 2002. Key Outcomes of the Summit,
UN Department of Public Information, New York.
vi
REGIONAL ASSESSMENTS
The GIWA methodology
The specific objectives of the GIWA were to conduct a holistic and global y
The assessment integrates environmental and socio-economic data
comparable assessment of the world's transboundary aquatic resources
from each country in the region to determine the severity of the
that incorporated both environmental and socio-economic factors
impacts of each of the five concerns and their constituent issues on
and recognised the inextricable links between freshwater and marine
the entire region. The integration of this information was facilitated by
environments, in order to enable the GEF to focus their resources and to
implementing the assessment during two participatory workshops
provide guidance and advice to governments and decision makers. The
that typical y involved 10 to 15 environmental and socio-economic
coalition of al these elements into a single coherent methodology that
experts from each country in the region. During these workshops, the
produces an assessment that achieves each of these objectives had not
regional teams performed preliminary analyses based on the col ective
previously been done and posed a significant chal enge.
knowledge and experience of these local experts. The results of these
analyses were substantiated with the best available information to be
The integration of each of these elements into the GIWA methodology
presented in a regional report.
was achieved through an iterative process guided by a special y
Table 1
Pre-defined GIWA concerns and their constituent issues
convened Methods task team that was comprised of a number of
addressed within the assessment.
international assessment and water experts. Before the final version
of the methodology was adopted, preliminary versions underwent
Environmental issues
Major concerns
an extensive external peer review and were subjected to preliminary
1. Modification of stream flow
testing in selected regions. Advice obtained from the Methods task
2. Pol ution of existing supplies
I Freshwater shortage
team and other international experts and the lessons learnt from
3. Changes in the water table
preliminary testing were incorporated into the final version that was
4. Microbiological
5. Eutrophication
used to conduct each of the GIWA regional assessments.
6. Chemical
7. Suspended solids
II Pollution
8. Solid wastes
Considering the enormous differences between regions in terms of the
9. Thermal
10. Radionuclide
quality, quantity and availability of data, socio-economic setting and
11. Spil s
environmental conditions, the achievement of global comparability
12. Loss of ecosystems
required an innovative approach. This was facilitated by focusing
III Habitat and community
13. Modification of ecosystems or ecotones, including community
modification
the assessment on the impacts of five pre-defined concerns namely;
structure and/or species composition
Freshwater shortage, Pollution, Habitat and community modification,
14. Overexploitation
15. Excessive by-catch and discards
IV Unsustainable
Unsustainable exploitation of fish and other living resources and Global
16. Destructive fishing practices
exploitation of fish and
change, in transboundary waters. Considering the diverse range of
17. Decreased viability of stock through pol ution and disease
other living resources
18. Impact on biological and genetic diversity
elements encompassed by each concern, assessing the magnitude of
the impacts caused by these concerns was facilitated by evaluating the
19. Changes in hydrological cycle
20. Sea level change
V Global change
impacts of 22 specific issues that were grouped within these concerns
21. Increased uv-b radiation as a result of ozone depletion
22. Changes in ocean CO source/sink function
(see Table 1).
2
THE GIWA METHODOLOGY
vii


political boundaries but were instead, general y defi ned by a large but
discrete drainage basin that also included the coastal marine waters into
which the basin discharges. In many cases, the marine areas examined
during the assessment coincided with the Large Marine Ecosystems
(LMEs) defi ned by the US National Atmospheric and Oceanographic
Administration (NOAA). As a consequence, scaling should be a
relatively straight-forward task that involves the inspection of the
boundaries that were proposed for the region during the preparatory
phase of GIWA to ensure that they are appropriate and that there are
no important overlaps or gaps with neighbouring regions. When the
proposed boundaries were found to be inadequate, the boundaries of
the region were revised according to the recommendations of experts
from both within the region and from adjacent regions so as to ensure
that any changes did not result in the exclusion of areas from the GIWA.
Once the regional boundary was defi ned, regional teams identifi ed all
the transboundary elements of the aquatic environment within the
region and determined if these elements could be assessed as a single
Figure 1
Illustration of the relationship between the GIWA
coherent aquatic system or if there were two or more independent
approach and other projects implemented within the
GEF International Waters (IW) portfolio.
systems that should be assessed separately.
The GIWA is a logical contiguous process that defi nes the geographic
Scoping Assessing the GIWA concerns
region to be assessed, identifi es and prioritises particularly problems
Scoping is an assessment of the severity of environmental and socio-
based on the magnitude of their impacts on the environment and
economic impacts caused by each of the fi ve pre-defi ned GIWA concerns
human societies in the region, determines the root causes of those
and their constituent issues (Table 1). It is not designed to provide an
problems and, fi nal y, assesses various policy options that addresses
exhaustive review of water-related problems that exist within each region,
those root causes in order to reverse negative trends in the condition
but rather it is a mechanism to identify the most urgent problems in the
of the aquatic environment. These four steps, referred to as Scaling,
region and prioritise those for remedial actions. The priorities determined
Scoping, Causal chain analysis and Policy options analysis, are
by Scoping are therefore one of the main outputs of the GIWA project.
summarised below and are described in their entirety in two volumes:
GIWA Methodology Stage 1: Scaling and Scoping; and GIWA Methodology:
Focusing the assessment on pre-defi ned concerns and issues ensured
Detailed Assessment, Causal Chain Analysis and Policy Options Analysis.
the comparability of the results between diff erent regions. In addition, to
General y, the components of the GIWA methodology are aligned
ensure the long-term applicability of the options that are developed to
with the framework adopted by the GEF for Transboundary Diagnostic
mitigate these problems, Scoping not only assesses the current impacts
Analyses (TDAs) and Strategic Action Programmes (SAPs) (Figure 1) and
of these concerns and issues but also the probable future impacts
assume a broad spectrum of transboundary infl uences in addition to
according to the "most likely scenario" which considered demographic,
those associated with the physical movement of water across national
economic, technological and other relevant changes that wil potential y
borders.
infl uence the aquatic environment within the region by 2020.
Scaling Defining the geographic extent
The magnitude of the impacts caused by each issue on the
of the region
environment and socio-economic indicators was assessed over the
Scaling is the fi rst stage of the assessment and is the process by which
entire region using the best available information from a wide range of
the geographic scale of the assessment is defi ned. In order to facilitate
sources and the knowledge and experience of the each of the experts
the implementation of the GIWA, the globe was divided during the
comprising the regional team. In order to enhance the comparability
design phase of the project into 66 contiguous regions. Considering the
of the assessment between diff erent regions and remove biases
transboundary nature of many aquatic resources and the transboundary
in the assessment caused by diff erent perceptions of and ways to
focus of the GIWA, the boundaries of the regions did not comply with
communicate the severity of impacts caused by particular issues, the
viii
REGIONAL ASSESSMENTS
THE GIWA METHODOLOGY
ix
results were distil ed and reported as standardised scores according to
Table 2
Example of environmental impact assessment of
the fol owing four point scale:
Freshwater shortage.
Weight
0 = no known impact
Environmental
Environmental issues
Score
Weight %
averaged
concerns
1 = slight impact
score
2 = moderate impact
1. Modification of stream flow
1
20
Freshwater shortage
1.50
3 = severe impact
2. Pol ution of existing supplies
2
50
The attributes of each score for each issue were described by a detailed
3. Changes in the water table
1
30
set of pre-defined criteria that were used to guide experts in reporting
Table 3
Example of Health impacts assessment linked to one of
the results of the assessment. For example, the criterion for assigning
the GIWA concerns.
a score of 3 to the issue Loss of ecosystems or ecotones is: "Permanent
Criteria for Health impacts
Raw score
Score Weight %
destruction of at least one habitat is occurring such as to have reduced their
Very small
Very large
surface area by >30% during the last 2-3 decades". The full list of criteria is
Number of people affected
2
50
0
1
2
3
presented at the end of the chapter, Table 5a-e. Although the scoring
Minimum
Severe
Degree of severity
2
30
0
1
2
3
inevitably includes an arbitrary component, the use of predefined
Occasion/Short
Continuous
Frequency/Duration
2
20
criteria facilitates comparison of impacts on a global scale and also
0
1
2
3
Weight average score for Health impacts
2
encouraged consensus of opinion among experts.
The trade-off associated with assessing the impacts of each concern
After al 22 issues and associated socio-economic impacts have
and their constituent issues at the scale of the entire region is that spatial
been scored, weighted and averaged, the magnitude of likely future
resolution was sometimes low. Although the assessment provides a
changes in the environmental and socio-economic impacts of each
score indicating the severity of impacts of a particular issue or concern
of the five concerns on the entire region is assessed according to the
on the entire region, it does not mean that the entire region suffers
most likely scenario which describes the demographic, economic,
the impacts of that problem. For example, eutrophication could be
technological and other relevant changes that might influence the
identified as a severe problem in a region, but this does not imply that all
aquatic environment within the region by 2020.
waters in the region suffer from severe eutrophication. It simply means
that when the degree of eutrophication, the size of the area affected,
In order to prioritise among GIWA concerns within the region and
the socio-economic impacts and the number of people affected is
identify those that will be subjected to causal chain and policy options
considered, the magnitude of the overal impacts meets the criteria
analysis in the subsequent stages of the GIWA, the present and future
defining a severe problem and that a regional action should be initiated
scores of the environmental and socio-economic impacts of each
in order to mitigate the impacts of the problem.
concern are tabulated and an overall score calculated. In the example
presented in Table 4, the scoping assessment indicated that concern I I,
When each issue has been scored, it was weighted according to the relative
Habitat and community modification, was the priority concern in this
contribution it made to the overal environmental impacts of the concern
region. The outcome of this mathematic process was reconciled against
and a weighted average score for each of the five concerns was calculated
the knowledge of experts and the best available information in order
(Table 2). Of course, if each issue was deemed to make equal contributions,
to ensure the validity of the conclusion.
then the score describing the overal impacts of the concern was simply the
arithmetic mean of the scores al ocated to each issue within the concern.
In some cases however, this process and the subsequent participatory
In addition, the socio-economic impacts of each of the five major
discussion did not yield consensus among the regional experts
concerns were assessed for the entire region. The socio-economic
regarding the ranking of priorities. As a consequence, further analysis
impacts were grouped into three categories; Economic impacts,
was required. In such cases, expert teams continued by assessing the
Health impacts and Other social and community impacts (Table 3). For
relative importance of present and potential future impacts and assign
each category, an evaluation of the size, degree and frequency of the
weights to each. Afterwards, the teams assign weights indicating the
impact was performed and, once completed, a weighted average score
relative contribution made by environmental and socio-economic
describing the overal socio-economic impacts of each concern was
factors to the overal impacts of the concern. The weighted average
calculated in the same manner as the overall environmental score.
score for each concern is then recalculated taking into account
viii
REGIONAL ASSESSMENTS
THE GIWA METHODOLOGY
ix
Table 4
Example of comparative environmental and socio-economic impacts of each major concern, presently and likely in year 2020.
Types of impacts
Environmental score
Economic score
Human health score
Social and community score
Concern
Overall score
Present (a)
Future (b)
Present (c)
Future (d)
Present (e)
Future (f)
Present (g)
Future (h)
Freshwater shortage
1.3
2.3
2.7
2.8
2.6
3.0
1.8
2.2
2.3
Pol ution
1.5
2.0
2.0
2.3
1.8
2.3
2.0
2.3
2.0
Habitat and community
2.0
3.0
2.4
3.0
2.4
2.8
2.3
2.7
2.6
modification
Unsustainable exploitation of fish
1.8
2.2
2.0
2.1
2.0
2.1
2.4
2.5
2.1
and other living resources
Global change
0.8
1.0
1.5
1.7
1.5
1.5
1.0
1.0
1.2
the relative contributions of both present and future impacts and
should be regarded as a framework to guide the analysis, rather than
environmental and socio-economic factors. The outcome of these
as a set of detailed instructions. Secondly, in an ideal setting, a causal
additional analyses was subjected to further discussion to identify
chain would be produced by a multidisciplinary group of specialists
overall priorities for the region.
that would statistical y examine each successive cause and study its
links to the problem and to other causes. However, this approach (even
Final y, the assessment recognises that each of the five GIWA concerns
if feasible) would use far more resources and time than those available
are not discrete but often interact. For example, pollution can destroy
to GIWA1. For this reason, it has been necessary to develop a relatively
aquatic habitats that are essential for fish reproduction which, in turn,
simple and practical analytical model for gathering information to
can cause declines in fish stocks and subsequent overexploitation. Once
assemble meaningful causal chains.
teams have ranked each of the concerns and determined the priorities
for the region, the links between the concerns are highlighted in order
Conceptual model
to identify places where strategic interventions could be applied to
A causal chain is a series of statements that link the causes of a problem
yield the greatest benefits for the environment and human societies
with its effects. Recognising the great diversity of local settings and the
in the region.
resulting difficulty in developing broadly applicable policy strategies,
the GIWA CCA focuses on a particular system and then only on those
Causal chain analysis
issues that were prioritised during the scoping assessment. The
Causal Chain Analysis (CCA) traces the cause-effect pathways from the
starting point of a particular causal chain is one of the issues selected
socio-economic and environmental impacts back to their root causes.
during the Scaling and Scoping stages and its related environmental
The GIWA CCA aims to identify the most important causes of each
and socio-economic impacts. The next element in the GIWA chain is
concern prioritised during the scoping assessment in order to direct
the immediate cause; defined as the physical, biological or chemical
policy measures at the most appropriate target in order to prevent
variable that produces the GIWA issue. For example, for the issue of
further degradation of the regional aquatic environment.
eutrophication the immediate causes may be, inter alia:
Enhanced nutrient inputs;
Root causes are not always easy to identify because they are often
Increased recycling/mobilisation;
spatial y or temporal y separated from the actual problems they
Trapping of nutrients (e.g. in river impoundments);
cause. The GIWA CCA was developed to help identify and understand
Run-off and stormwaters
the root causes of environmental and socio-economic problems
in international waters and is conducted by identifying the human
Once the relevant immediate cause(s) for the particular system has
activities that cause the problem and then the factors that determine
(have) been identified, the sectors of human activity that contribute
the ways in which these activities are undertaken. However, because
most significantly to the immediate cause have to be determined.
there is no universal theory describing how root causes interact to
Assuming that the most important immediate cause in our example
create natural resource management problems and due to the great
had been increased nutrient concentrations, then it is logical that the
variation of local circumstances under which the methodology will
most likely sources of those nutrients would be the agricultural, urban
be applied, the GIWA CCA is not a rigidly structured assessment but
or industrial sectors. After identifying the sectors that are primarily
1 This does not mean that the methodology ignores statistical or quantitative studies; as has already been pointed out, the available evidence that justifies the assumption of causal links should
be provided in the assessment.
x
REGIONAL ASSESSMENTS
THE GIWA METHODOLOGY
xi
responsible for the immediate causes, the root causes acting on those
The policy options recommended by the GIWA are only contributions
sectors must be determined. For example, if agriculture was found to
to the larger policy process and, as such, the GIWA methodology
be primarily responsible for the increased nutrient concentrations, the
developed to test the performance of various options under the
root causes could potential y be:
different circumstances has been kept simple and broadly applicable.
Economic (e.g. subsidies to fertilisers and agricultural products);
Legal (e.g. inadequate regulation);
Global International Waters Assessment
Failures in governance (e.g. poor enforcement); or
Technology or knowledge related (e.g. lack of affordable substitutes
for fertilisers or lack of knowledge as to their application).
Once the most relevant root causes have been identified, an
explanation, which includes available data and information, of how
they are responsible for the primary environmental and socio-economic
problems in the region should be provided.
Policy option analysis
Despite considerable effort of many Governments and other
organisations to address transboundary water problems, the evidence
indicates that there is stil much to be done in this endeavour. An
important characteristic of GIWA's Policy Option Analysis (POA) is that
its recommendations are firmly based on a better understanding of
the root causes of the problems. Freshwater scarcity, water pol ution,
overexploitation of living resources and habitat destruction are very
complex phenomena. Policy options that are grounded on a better
understanding of these phenomena wil contribute to create more
effective societal responses to the extremely complex water related
transboundary problems. The core of POA in the assessment consists
of two tasks:
Construct policy options
Policy options are simply different courses of action, which are not
always mutual y exclusive, to solve or mitigate environmental and
socio-economic problems in the region. Although a multitude of
different policy options could be constructed to address each root
cause identified in the CCA, only those few policy options that have
the greatest likelihood of success were analysed in the GIWA.
Select and apply the criteria on which the policy options will be
evaluated
Although there are many criteria that could be used to evaluate any
policy option, GIWA focuses on:
Effectiveness (certainty of result)
Efficiency (maximisation of net benefits)
Equity (fairness of distributional impacts)
Practical criteria (political acceptability, implementation feasibility).
x
REGIONAL ASSESSMENTS
THE GIWA METHODOLOGY
xi
Table 5a: Scoring criteria for environmental impacts of Freshwater shortage
Issue
Score 0 = no known impact
Score 1 = slight impact
Score 2 = moderate impact
Score 3 = severe impact
Issue 1: Modification
No evidence of modification of stream
There is a measurably changing trend in
Significant downward or upward trend
Annual discharge of a river altered by more
of stream flow
flow.
annual river discharge at gauging stations
(more than 20% of the long term mean) in
than 50% of long term mean; or
"An increase or decrease
in a major river or tributary (basin >
annual discharges in a major river or tributary Loss of >50% of riparian or deltaic
in the discharge of
40 000 km2); or
draining a basin of >250 000 km2; or
wetlands over a period of not less than
streams and rivers
There is a measurable decrease in the area
Loss of >20% of flood plain or deltaic
40 years (through causes other than
as a result of human
of wetlands (other than as a consequence
wetlands through causes other than
conversion or artificial embankment); or
interventions on a local/
of conversion or embankment
conversion or artificial embankments; or
Significant increased siltation or erosion
regional scale (see Issue
construction); or
Significant loss of riparian vegetation (e.g.
due to changing in flow regime (other than
19 for flow alterations
There is a measurable change in the
trees, flood plain vegetation); or
normal fluctuations in flood plain rivers);
resulting from global
interannual mean salinity of estuaries or
Significant saline intrusion into previously
or
change) over the last 3-4
coastal lagoons and/or change in the mean
freshwater rivers or lagoons.
Loss of one or more anadromous or
decades."
position of estuarine salt wedge or mixing
catadromous fish species for reasons
zone; or
other than physical barriers to migration,
Change in the occurrence of exceptional
pol ution or overfishing.
discharges (e.g. due to upstream
damming.
Issue 2: Pollution of
No evidence of pol ution of surface and
Any monitored water in the region does
Water supplies does not meet WHO or
River draining more than 10% of the basin
existing supplies
ground waters.
not meet WHO or national drinking water
national drinking water standards in more
have suffered polysaprobic conditions, no
"Pol ution of surface
criteria, other than for natural reasons; or
than 30% of the region; or
longer support fish, or have suffered severe
and ground fresh waters
There have been reports of one or more
There are one or more reports of fish kil s
oxygen depletion
supplies as a result of
fish kil s in the system due to pol ution
due to pol ution in any river draining a
Severe pol ution of other sources of
point or diffuse sources"
within the past five years.
basin of >250 000 km2 .
freshwater (e.g. groundwater)
Issue 3: Changes in
No evidence that abstraction of water from Several wel s have been deepened because Clear evidence of declining base flow in
Aquifers are suffering salinisation over
the water table
aquifers exceeds natural replenishment.
of excessive aquifer draw-down; or
rivers in semi-arid areas; or
regional scale; or
"Changes in aquifers
Several springs have dried up; or
Loss of plant species in the past decade,
Perennial springs have dried up over
as a direct or indirect
Several wel s show some salinisation.
that depend on the presence of ground
regional y significant areas; or
consequence of human
water; or
Some aquifers have become exhausted
activity"
Wel s have been deepened over areas of
hundreds of km2;or
Salinisation over significant areas of the
region.
Table 5b: Scoring criteria for environmental impacts of Pollution
Issue
Score 0 = no known impact
Score 1 = slight impact
Score 2 = moderate impact
Score 3 = severe impact
Issue 4:
Normal incidence of bacterial related
There is minor increase in incidence of
Public health authorities aware of marked
There are large closure areas or very
Microbiological
gastroenteric disorders in fisheries product
bacterial related gastroenteric disorders
increase in the incidence of bacterial
restrictive advisories affecting the
pollution
consumers and no fisheries closures or
in fisheries product consumers but no
related gastroenteric disorders in fisheries
marketability of fisheries products; or
"The adverse effects of
advisories.
fisheries closures or advisories.
product consumers; or
There exists widespread public or tourist
microbial constituents of
There are limited area closures or
awareness of hazards resulting in
human sewage released
advisories reducing the exploitation or
major reductions in the exploitation or
to water bodies."
marketability of fisheries products.
marketability of fisheries products.
Issue 5:
No visible effects on the abundance and
Increased abundance of epiphytic algae; or
Increased filamentous algal production
High frequency (>1 event per year), or
Eutrophication
distributions of natural living resource
A statistical y significant trend in
resulting in algal mats; or
intensity, or large areas of periodic hypoxic
"Artificial y enhanced
distributions in the area; and
decreased water transparency associated
Medium frequency (up to once per year)
conditions, or high frequencies of fish and
primary productivity in
No increased frequency of hypoxia1 or
with algal production as compared with
of large-scale hypoxia and/or fish and
zoobenthos mortality events or harmful
receiving water basins
fish mortality events or harmful algal
long-term (>20 year) data sets; or
zoobenthos mortality events and/or
algal blooms; or
related to the increased
blooms associated with enhanced primary Measurable shal owing of the depth range
harmful algal blooms.
Significant changes in the littoral
availability or supply
production; and
of macrophytes.
community; or
of nutrients, including
No evidence of periodical y reduced
Presence of hydrogen sulphide in
cultural eutrophication
dissolved oxygen or fish and zoobenthos
historical y well oxygenated areas.
in lakes."
mortality; and
No evident abnormality in the frequency of
algal blooms.
xii
REGIONAL ASSESSMENTS
THE GIWA METHODOLOGY
xiii
Issue 6: Chemical
No known or historical levels of chemical
Some chemical contaminants are
Some chemical contaminants are above
Chemical contaminants are above
pollution
contaminants except background levels of
detectable but below threshold limits
threshold limits defined for the country or
threshold limits defined for the country or
"The adverse effects of
natural y occurring substances; and
defined for the country or region; or
region; or
region; and
chemical contaminants
No fisheries closures or advisories due to
Restricted area advisories regarding
Large area advisories by public health
Public health and public awareness of
released to standing or
chemical pol ution; and
chemical contamination of fisheries
authorities concerning fisheries product
fisheries contamination problems with
marine water bodies
No incidence of fisheries product tainting;
products.
contamination but without associated
associated reductions in the marketability
as a result of human
and
catch restrictions or closures; or
of such products either through the
activities. Chemical
No unusual fish mortality events.
If there is no available data use the fol owing High mortalities of aquatic species near
imposition of limited advisories or by area
contaminants are
criteria:
outfal s.
closures of fisheries; or
here defined as
If there is no available data use the fol owing Some use of pesticides in small areas; or
Large-scale mortalities of aquatic species.
compounds that are
criteria:
Presence of small sources of dioxins or
If there is no available data use the fol owing
toxic or persistent or
No use of pesticides; and
furans (e.g., small incineration plants or
criteria:
If there is no available data use the fol owing
bioaccumulating."
No sources of dioxins and furans; and
bleached kraft/pulp mil s using chlorine);
Large-scale use of pesticides in agriculture
criteria:
No regional use of PCBs; and
or
and forestry; or
Indications of health effects resulting
No bleached kraft pulp mil s using chlorine Some previous and existing use of PCBs
Presence of major sources of dioxins or
from use of pesticides; or
bleaching; and
and limited amounts of PCB-containing
furans such as large municipal or industrial Known emissions of dioxins or furans from
No use or sources of other contaminants.
wastes but not in amounts invoking local
incinerators or large bleached kraft pulp
incinerators or chlorine bleaching of pulp;
concerns; or
mil s; or
or
Presence of other contaminants.
Considerable quantities of waste PCBs in
Known contamination of the environment
the area with inadequate regulation or has
or foodstuffs by PCBs; or
invoked some public concerns; or
Known contamination of the environment
Presence of considerable quantities of
or foodstuffs by other contaminants.
other contaminants.
Issue 7: Suspended
No visible reduction in water transparency; Evidently increased or reduced turbidity
Markedly increased or reduced turbidity
Major changes in turbidity over wide or
solids
and
in streams and/or receiving riverine and
in small areas of streams and/or receiving
ecological y significant areas resulting
"The adverse effects of
No evidence of turbidity plumes or
marine environments but without major
riverine and marine environments; or
in markedly changed biodiversity or
modified rates of release
increased siltation; and
changes in associated sedimentation or
Extensive evidence of changes in
mortality in benthic species due to
of suspended particulate No evidence of progressive riverbank,
erosion rates, mortality or diversity of flora
sedimentation or erosion rates; or
excessive sedimentation with or without
matter to water bodies
beach, other coastal or deltaic erosion.
and fauna; or
Changes in benthic or pelagic biodiversity
concomitant changes in the nature of
resulting from human
Some evidence of changes in benthic or
in areas due to sediment blanketing or
deposited sediments (i.e., grain-size
activities"
pelagic biodiversity in some areas due
increased turbidity.
composition/redox); or
to sediment blanketing or increased
Major change in pelagic biodiversity or
turbidity.
mortality due to excessive turbidity.
Issue 8: Solid wastes
No noticeable interference with trawling
Some evidence of marine-derived litter on
Widespread litter on beaches giving rise to
Incidence of litter on beaches sufficient
"Adverse effects
activities; and
beaches; or
public concerns regarding the recreational
to deter the public from recreational
associated with the
No noticeable interference with the
Occasional recovery of solid wastes
use of beaches; or
activities; or
introduction of solid
recreational use of beaches due to litter;
through trawling activities; but
High frequencies of benthic litter recovery
Trawling activities untenable because of
waste materials into
and
Without noticeable interference with
and interference with trawling activities;
benthic litter and gear entanglement; or
water bodies or their
No reported entanglement of aquatic
trawling and recreational activities in
or
Widespread entanglement and/or
environs."
organisms with debris.
coastal areas.
Frequent reports of entanglement/
suffocation of aquatic species by litter.
suffocation of species by litter.
Issue 9: Thermal
No thermal discharges or evidence of
Presence of thermal discharges but
Presence of thermal discharges with large
Presence of thermal discharges with large
"The adverse effects
thermal effluent effects.
without noticeable effects beyond
mixing zones having reduced productivity
mixing zones with associated mortalities,
of the release of
the mixing zone and no significant
or altered biodiversity; or
substantial y reduced productivity or
aqueous effluents at
interference with migration of species.
Evidence of reduced migration of species
noticeable changes in biodiversity; or
temperatures exceeding
due to thermal plume.
Marked reduction in the migration of
ambient temperature
species due to thermal plumes.
in the receiving water
body."
Issue 10: Radionuclide No radionuclide discharges or nuclear
Minor releases or fal out of radionuclides
Minor releases or fal out of radionuclides
Substantial releases or fal out of
"The adverse effects of
activities in the region.
but with well regulated or wel -managed
under poorly regulated conditions that do
radionuclides resulting in excessive
the release of radioactive
conditions complying with the Basic Safety
not provide an adequate basis for public
exposures to humans or animals in relation
contaminants and
Standards.
health assurance or the protection of
to those recommended under the Basic
wastes into the aquatic
aquatic organisms but without situations
Safety Standards; or
environment from
or levels likely to warrant large scale
Some indication of situations or exposures
human activities."
intervention by a national or international
warranting intervention by a national or
authority.
international authority.
Issue 11: Spills
No evidence of present or previous spil s of
Some evidence of minor spil s of hazardous Evidence of widespread contamination
Widespread contamination by hazardous
"The adverse effects
hazardous material; or
materials in small areas with insignificant
by hazardous or aesthetical y displeasing
or aesthetical y displeasing materials
of accidental episodic
No evidence of increased aquatic or avian
smal -scale adverse effects one aquatic or
materials assumed to be from spil age
from frequent spil s resulting in major
releases of contaminants
species mortality due to spil s.
avian species.
(e.g. oil slicks) but with limited evidence of
interference with aquatic resource
and materials to the
widespread adverse effects on resources or
exploitation or coastal recreational
aquatic environment
amenities; or
amenities; or
as a result of human
Some evidence of aquatic or avian species
Significant mortality of aquatic or avian
activities."
mortality through increased presence of
species as evidenced by large numbers of
contaminated or poisoned carcasses on
contaminated carcasses on beaches.
beaches.
xii
REGIONAL ASSESSMENTS
THE GIWA METHODOLOGY
xiii
Table 5c: Scoring criteria for environmental impacts of Habitat and community modification
Issue
Score 0 = no known impact
Score 1 = slight impact
Score 2 = moderate impact
Score 3 = severe impact
Issue 12: Loss of ecosystems or
There is no evidence of loss of
There are indications of fragmentation Permanent destruction of at least one
Permanent destruction of at least one
ecotones
ecosystems or habitats.
of at least one of the habitats.
habitat is occurring such as to have
habitat is occurring such as to have
"The complete destruction of aquatic
reduced their surface area by up to 30
reduced their surface area by >30%
habitats. For the purpose of GIWA
% during the last 2-3 decades.
during the last 2-3 decades.
methodology, recent loss will be
measured as a loss of pre-defined
habitats over the last 2-3 decades."
Issue 13: Modification of
No evidence of change in species
Evidence of change in species
Evidence of change in species
Evidence of change in species
ecosystems or ecotones, including
complement due to species extinction
complement due to species extinction
complement due to species extinction
complement due to species extinction
community structure and/or species
or introduction; and
or introduction
or introduction; and
or introduction; and
composition
No changing in ecosystem function
Evidence of change in population
Evidence of change in population
"Modification of pre-defined habitats
and services.
structure or change in functional group
structure or change in functional group
in terms of extinction of native species,
composition or structure
composition or structure; and
occurrence of introduced species and
Evidence of change in ecosystem
changing in ecosystem function and
services2.
services over the last 2-3 decades."
2 Constanza, R. et al. (1997). The value of the world ecosystem services and natural capital, Nature 387:253-260.
Table 5d: Scoring criteria for environmental impacts of Unsustainable exploitation of fish and other
living resources
Issue
Score 0 = no known impact
Score 1 = slight impact
Score 2 = moderate impact
Score 3 = severe impact
Issue 14: Overexploitation
No harvesting exists catching fish
Commercial harvesting exists but there One stock is exploited beyond MSY
More than one stock is exploited
"The capture of fish, shel fish or marine
(with commercial gear for sale or
is no evidence of over-exploitation.
(maximum sustainable yield) or is
beyond MSY or is outside safe
invertebrates at a level that exceeds the
subsistence).
outside safe biological limits.
biological limits.
maximum sustainable yield of the stock."
Issue 15: Excessive by-catch and
Current harvesting practices show no
Up to 30% of the fisheries yield (by
30-60% of the fisheries yield consists
Over 60% of the fisheries yield is
discards
evidence of excessive by-catch and/or
weight) consists of by-catch and/or
of by-catch and/or discards.
by-catch and/or discards; or
"By-catch refers to the incidental capture
discards.
discards.
Noticeable incidence of capture of
of fish or other animals that are not the
endangered species.
target of the fisheries. Discards refers
to dead fish or other animals that are
returned to the sea."
Issue 16: Destructive fishing
No evidence of habitat destruction due Habitat destruction resulting in
Habitat destruction resulting in
Habitat destruction resulting in
practices
to fisheries practices.
changes in distribution of fish or
moderate reduction of stocks or
complete col apse of a stock or far
"Fishing practices that are deemed to
shel fish stocks; or
moderate changes of the environment;
reaching changes in the environment;
produce significant harm to marine,
Trawling of any one area of the seabed
or
or
lacustrine or coastal habitats and
is occurring less than once per year.
Trawling of any one area of the seabed
Trawling of any one area of the seabed
communities."
is occurring 1-10 times per year; or
is occurring more than 10 times per
Incidental use of explosives or poisons
year; or
for fishing.
Widespread use of explosives or
poisons for fishing.
Issue 17: Decreased viability of
No evidence of increased incidence of
Increased reports of diseases without
Declining populations of one or more
Col apse of stocks as a result of
stocks through contamination and
fish or shel fish diseases.
major impacts on the stock.
species as a result of diseases or
diseases or contamination.
disease
contamination.
"Contamination or diseases of feral (wild)
stocks of fish or invertebrates that are a
direct or indirect consequence of human
action."
Issue 18: Impact on biological and
No evidence of deliberate or accidental Alien species introduced intentional y
Measurable decline in the population
Extinction of native species or local
genetic diversity
introductions of alien species; and
or accidental y without major changes
of native species or local stocks as a
stocks as a result of introductions
"Changes in genetic and species diversity No evidence of deliberate or accidental
in the community structure; or
result of introductions (intentional or
(intentional or accidental); or
of aquatic environments resulting from
introductions of alien stocks; and
Alien stocks introduced intentional y
accidental); or
Major changes (>20%) in the genetic
the introduction of alien or genetical y
No evidence of deliberate or accidental
or accidental y without major changes Some changes in the genetic
composition of stocks (e.g. as a result
modified species as an intentional or
introductions of genetical y modified
in the community structure; or
composition of stocks (e.g. as a result
of escapes from aquaculture replacing
unintentional result of human activities
species.
Genetical y modified species
of escapes from aquaculture replacing
the wild stock).
including aquaculture and restocking."
introduced intentional y or
the wild stock).
accidental y without major changes in
the community structure.
xiv
REGIONAL ASSESSMENTS
THE GIWA METHODOLOGY
xv
Table 5e: Scoring criteria for environmental impacts of Global change
Issue
Score 0 = no known impact
Score 1 = slight impact
Score 2 = moderate impact
Score 3 = severe impact
Issue 19: Changes in hydrological
No evidence of changes in hydrological Change in hydrological cycles due
Significant trend in changing
Loss of an entire habitat through
cycle and ocean circulation
cycle and ocean/coastal current due to
to global change causing changes
terrestrial or sea ice cover (by
desiccation or submergence as a result
"Changes in the local/regional water
global change.
in the distribution and density of
comparison with a long-term time
of global change; or
balance and changes in ocean and coastal
riparian terrestrial or aquatic plants
series) without major downstream
Change in the tree or lichen lines; or
circulation or current regime over the
without influencing overall levels of
effects on river/ocean circulation or
Major impacts on habitats or
last 2-3 decades arising from the wider
productivity; or
biological diversity; or
biodiversity as the result of increasing
problem of global change including
Some evidence of changes in ocean
Extreme events such as flood and
frequency of extreme events; or
ENSO."
or coastal currents due to global
drought are increasing; or
Changing in ocean or coastal currents
change but without a strong effect on Aquatic productivity has been altered
or upwel ing regimes such that plant
ecosystem diversity or productivity.
as a result of global phenomena such
or animal populations are unable to
as ENSO events.
recover to their historical or stable
levels; or
Significant changes in thermohaline
circulation.
Issue 20: Sea level change
No evidence of sea level change.
Some evidences of sea level change
Changed pattern of coastal erosion due Major loss of coastal land areas due to
"Changes in the last 2-3 decades in the
without major loss of populations of
to sea level rise has became evident; or
sea-level change or sea-level induced
annual/seasonal mean sea level as a
organisms.
Increase in coastal flooding events
erosion; or
result of global change."
partly attributed to sea-level rise
Major loss of coastal or intertidal
or changing prevailing atmospheric
populations due to sea-level change or
forcing such as atmospheric pressure
sea level induced erosion.
or wind field (other than storm
surges).
Issue 21: Increased UV-B radiation as No evidence of increasing effects
Some measurable effects of UV/B
Aquatic community structure is
Measured/assessed effects of UV/B
a result of ozone depletion
of UV/B radiation on marine or
radiation on behavior or appearance of
measurably altered as a consequence
irradiation are leading to massive loss
"Increased UV-B flux as a result polar
freshwater organisms.
some aquatic species without affecting
of UV/B radiation; or
of aquatic communities or a significant
ozone depletion over the last 2-3
the viability of the population.
One or more aquatic populations are
change in biological diversity.
decades."
declining.
Issue 22: Changes in ocean CO
No measurable or assessed changes
Some reasonable suspicions that
Some evidences that the impacts
Evidences that the changes in
2
source/sink function
in CO source/sink function of aquatic
current global change is impacting the
of global change have altered the
source/sink function of the aquatic
2
"Changes in the capacity of aquatic
system.
aquatic system sufficiently to alter its
source/sink function for CO of aquatic
systems in the region are sufficient to
2
systems, ocean as well as freshwater, to
source/sink function for CO .
systems in the region by at least 10%.
cause measurable change in global CO
2
2
generate or absorb atmospheric CO as a
balance.
2
direct or indirect consequence of global
change over the last 2-3 decades."
xiv
REGIONAL ASSESSMENTS
THE GIWA METHODOLOGY
xv