
INTEGRATED MANAGEMENT OF LAND BASED ACTIVITIES
IN THE SÃO FRANCISCO RIVER BASIN PROJECT
GEF/ANA/OAS/UNEP
Activity 4.7 A Proposal for Complementation of the Hydrometeorologic
Network in the São Francisco River Basin
Executive Summary of the Final Report
DIAGNOSIS AND PROPOSAL FOR COMPLEMENTATION
OF THE HYDROMETEOROLOGIC NETWORK
IN THE SÃO FRANCISCO RIVER BASIN
ANA Agência Nacional de Águas
Brasília DF
INTEGRATED MANAGEMENT OF LAND BASED ACTIVITIES
IN THE SÃO FRANCISCO RIVER BASIN PROJECT
GEF/ANA/OAS/UNEP
Activity 4.7 A Proposal for Complementation of the Hydrometeorologic
Network in the São Francisco River Basin
Executive Summary of the Final Report
DIAGNOSIS AND PROPOSAL FOR COMPLEMENTATION
OF THE HYDROMETEOROLOGIC NETWORK
IN THE SÃO FRANCISCO RIVER BASIN
Coordination
Valdemar dos Santos Guimarães
Augusto Franco Malo da Silva Bragança
Superintendência de Informações Hidrológicas SIH/ANA
Agência Nacional de Águas ANA
Consultant
Christian André Haddad Govastki
Contract CPR/OEA no PO # 42841
February 2003
DIAGNOSIS AND PROPOSAL FOR COMPLEMENTATION OF
THE HYDROMETEOROLOGIC NETWORK IN THE
SÃO FRANCISCO RIVER BASIN
INTRODUCTION
This Activity, aimed at a diagnosis of the situation of the e São Francisco River Basin's
Hydrometeorologic Network, for proposing its complementation, was implemented in the context
of the GEF São Francisco Project, with support from the National Water Agency (ANA).
This Report is constituted by five chapters, as follows:
· Characterization of the Basin and Sub-Basins;
· Present situation of the Basin's hydrometeorologic network;
· Diagnosis of the hydrometeorologic network;
· Considerations about the existing network; and
· Definition of project's parameters.
For a proper management, project implementation and field research in water resources, it is
fundamental the knowledge about river and rainfall regimes, obtained through the collection and
interpretation of hydrologic data. The series of stations used for data collection is named
Hydrometeorologic Network.
The spatial coverture of the network must be ample and homogeneous, so that the collected
information can be representative of the Basin. Homogeneity, added to the increased quality of
the collected data, will be achieved with the correction of the existing distortions.
The existing hydrometeorologic data collection network in the São Francisco Basin is operated
by diverse institutions, with objectives not always identical, with emphasis to the INMET, that
focus on meteorological forecasts. ANEEL used to operate a network aimed at planning and
operation of the energetic system.
Water Resources Management is a strenuous task, given the conflicts and restrictions regarding
their use, consumptive use demands and inadequate water quality, resulting, in part, from
excessive water intakes and utilization of improper management techniques.
This Activity's objectives are:
· Surveying the existing network's situation;
· Defining parameters for elaboration of the diagnosis and for the project for
complementation of the network;
· Proposing the implantation of the basic Hydrometeorologic Network of the São
Francisco Basin, for obtaining the necessary data for the integrated management of its
water resources.
The guidelines adopted for planning the expansion of the network were:
i
· Compliance with recommendations of the OMM, ANA/SIH and DNAEE/ANEEL;
· Aiming at an adequate spatial distribution, avoiding duplicity of efforts in monitoring
the network;
· Implementing the basic network in successive stages, with an update of the surveys of
institutions and stations, as well as of the data and other critical information.
1.
CHARACTERIZATION OF THE SÃO FRANCISCO RIVER BASIN
1.1 PHYSIOGRAPHIC
CHARACTERIZATION
The São Francisco Basin covers part of the territories of the following States: Alagoas, Bahia,
Goiás, Minas Gerais, Pernambuco and Sergipe, besides the Federal District, being located
between the 7º00' e 21º00'S latitudes and the 35º00' e 47º40'W longitudes. The São Francisco
River originates in Minas Gerais and has its mouth in the Atlantic Ocean.
1.2
DIVISION BY GREAT REGIONS
Given its length and the different environments along its course, the Basin is divided into four
great distinct regions:
· Upper São Francisco from headwaters to Pirapora (111,254 km2 17.5% of the
Basin's area);
· Middle São Francisco from Pirapora to Remanso (338,091 km2- 53% of the area);
· Middle-Lower São Francisco - from Remanso to Paulo Afonso (154,871 km2 / 24.4%);
· Lower São Francisco from Paulo Afonso to its mouth (31,855 km2 / 5.1%).
Figure 1. Sub-division by Regions (PLANVASF,1989 and HIDROGEO,2000)
ii
The division into Sub-Basins used here is that defined by the partnership IBGE/DNAEE and
adopted by ANA and ANEEL.
Figure 2. São Francisco Sub-Basins according to ANA (HIDROGEO, 2000).
1.4 CLIMATE
With respect to climate, it is worth mentioning the great diversity, from a pluviometric point of
view, as a consequence of the Basin's location with reference to the distinct atmospheric
circulation systems. Given its extent, the Basin favors the occurrence of three predominant types
of climate: Humid tropical (in the internal highlands), semi-arid tropical (in the plains of the
Middle and Middle-Lower São Francisco) and the semi-humid tropical climates (in the coastal
zone).
1.5. VEGETATION
The predominant natural covertures in the Basin are the cerrado and the caatinga, also occurring
the tropical forests and dry forest, with less expression. The tropical forest has been almost
completely eradicated by agricultural uses and pasture.
1.6. SOILS
Soil occurrences in the Basin are greatly diversified, showing their multiple geological origins,
with sandy to silty textures, relatively poor, with low and medium natural fertility. In their great
majority, they are adequate for pasture, presenting restriction for agricultural uses, given the
scarcity of water.
iii
1.7. WATER RESOURCES
The São Francisco River has 36 major tributaries, 19 of them being perennial, with emphasis to
the Paraopeba, Velhas and Verde Grande Rivers, to the right margin, and the Paracatu, Urucuia,
Carinhanha, Corrente and Grande Rivers, to the left. Their drainage areas, with exception to the
Verde Grande River, are in the Polygon of Droughts and, even though representing 50% of the
total area, they are responsible for 85% of the total discharges in dry periods and 74% of the
maximum discharges.
This non-uniform distribution of surface water availability is created by a conjunction of
hydrologic, meteorologic and geologic factors, which are\also responsible for the periodic
droughts impacting great portions of the Basin.
A preliminary water balance indicates\that, in average, 84% of the precipitated volumes are lost
to evaporation and evapotranspiration, 11% flow through the water courses and 5% recharge the
aquifers.
1.8. THE USE OF THE WATER RESOURCES
The total water demand at the Basin represents 8% of the mean discharge, with the greatest
consumption in the Middle and Middle-Lower Regions, due to irrigation. Regarding power
generation, the hydroelectric potential of the São Francisco Basin is 26,320 MW, with an
installed capacity of 10,500MW.
Figure 3. Water demands in the São Francisco Basin (ANA, 2001)
2.
CURRENT SITUATION OF THE HYDROMETEOROLOGIC NETWORK
In the planning of the complementary network for the Basin, the following measures were taken,
viewing a better quality of the work:
iv
· Surveying the existing hydrometeorologic networks' operating agencies;
· Assessment of the existing network's situation;
· Evaluation of the planning for implementation, modernization and operation done by
those institutions; and
· Surveying the closed stations and their historical series, in order to make a correlation of
those values with the series recorded by the operating stations.
2.1. REGARDING THE SURVEY
Surveying the existing network is highly important for this Activity. There are two risks in
disregarding the survey: The first one is to find the work already obsolete by the time it is
concluded. The second is to incur in superposition of efforts in the collection of information
necessary for the management of the water resources in the Basin
The current network situation was evaluated at the SIH/ANA's Network Planning Sector, and
complemented by surveys at other involved institutions.
The survey considered:
· Institutions operating in the São Francisco Basin;
· Cadastration of all stations operated by those institutions;
· Location of the stations;
· Analysis of the information produced by them; and
· Elaboration of a document with all the information, data, location and pictures of the
stations.
It is important to highlight the importance of the efforts for identifying and equating the
partnerships, for the expansion and modernization of the hydrologic monitoring in Brazil.
There is a perspective that the hydrologic monitoring will receive a boost with the effective
implementation of the Basin Committees (State and Federal). That is because management
actions will be supported by mechanisms aimed at concession of water rights and at water
charging, which are dependent on a greater knowledge of water availability. Effective and good
quality monitoring will provide reliable information to support those actions.
2.2. ACCORDING TO THE DIAGNOSIS
The diagnosis presents an analysis of the Basin network's situation, contributing to the
optimization of the available resources, so that a greater área will be covered with the least cost,
in compliance with the orientations in the "Terms of Reference for Elaboration of the Diagnosis
and Planning of the National Hydrometeorologic Network".
v
2.3. ACCORDING TO PLANNING
The networks proposed by the different operators in the Basin were analyzed and a
complementary network was added to them, viewing the strengthenment of tthe hydrologic
monitoring. This will require gretaer interaction among ANA and those institutions.
It is true that some institutions did not acknowledge the new approach to the monitoring of water
resources, following the Law 9,433/97. They carry out the monitoring in an isolated way, making
almost impossible the access to the resulting information. This behavior deserves special
treatment, in order to make clear that management must be implemented in a participative way,
as defined in the Law.
In some regions, in the Basin, the situation is almost of abandonment, as it was detected that
coverture was nearly non-existent.
3.
DIAGNOSIS OF THE HYDROMETEOROLOGIC NETWORK
3.1 IDENTIFICATION OF INSTITUTIONS RESPONSIBLE FOR THE
HYDROMETEOROLOGIC STATIONS
The identification of the responsible institutions was necessary, in order to verify the consistency
of the operators and stations' directory, as well as to evaluate the need of update and, if possible,
to access the respective information banks. According to HIDRO, the Hydrologic Information
System's inventory, in September of 2002, there were 20 ainstitutions operating in the area under
study. This number is equivalent to 18.4% of the registered operators in Brazil. Part of those have
partnership contracts with ANA, operating the stations in the field and passing them to the
Agency. Even some of those without a partnership with ANA, pass the information to the
System, but not all of them do it.
Chart 1 presents ANA, SUDENE, DNOCS and EMATER as in charge of great part of the
pluviometric stations operating in the Basin. Chart 2 presents the most important operators of
fluviometric stations
Chart 1.
Institutions operating pluviometric stations (Sept./2002)
Institution Not
Operating
Operating total
ANA 159
247
406
DNOS
4
0
4
CODEVASF 149
1
150
INMET
18
48
66
SUDENE
53
327
380
CEMIG
9
48
57
FASE
1
0
1
RFFSA
4
0
4
vi
COPASA
0
0
0
DEPV
0
4
4
DNOCS
24
154
178
DAEE-MG
35
1
36
MMV
1
2
3
CAESB
0
2
2
CHESF
0
1
1
EMATER
2
51
53
OUTRAS
3
4
7
CPRH
0
0
0
CRA
0
0
0
RES.
396/98
1
6
7
Total 463
896
1.359
Source: HIDRO Hydrologic Information System (ANA, Sept. 2002)
Chart 2.
Institutions operating fluviometric stations (Sept./2002)
Institution Not
Operating
Operating total
ANA 234
183 417
DNOS 7
0
7
CODEVASF 149
1
150
INMET 0
0
0
SUDENE 3
0
3
CEMIG 32
3
35
FASE 0
0
0
RFFSA 0
0
0
COPASA 0
12
12
DEPV 0
0
0
DNOCS 16
6
22
DAEE-MG 0
0
0
MMV 0
0
0
CAESB 3
0
3
vii
CHESF 33
15
48
EMATER 0
0
0
OUTRAS 1
11
12
CPRH 0
1
1
CRA 0
36
36
RES.
396/98 13
41
54
Total 491
309
800
Source: HIDRO Hydrologic Information System (ANA, Sept. 2002)
3.2. STATIONS DISTRIBUTION WITHIN THE STATES
The distribution of the stations among the States, according to HIDRO, is shown in Chart 3:
Chart 3. Distribution of stations in the States and their operating conditions
AL BA DF GO MG PB PE SE Total
Pluviometric Stations
Not
operating 20 130 0 1 257 1 35 19 463
Operating
42 277 2 1 328 0 227 19 896
Total
62 407 2 2 585 1 262 38
1.359
Fluviometric Stations
Not
operating 16 143 4 0 278 0 39 11 491
Operating
7 100 0 0 160 0 39 3 309
Total
23 243 4 0 438 0 78 14 800
Global
Total
85 650 6 2 1,023 1 340 52 2,159
Source: HIDRO Hydrologic Information System (ANA, Sept. 2002)
* - Even though outside the São Francisco Basin, the State of Paraíba is oncluded in the HIDRO's registers.
From these information, one may deduce that:
viii
· The total number of hydrometeorologic stations is significant, nevertheless, spatial
distribution is not adequate;
· Most part of the stations is in the States of Minas Gerais and Bahia, with an almost
complete lack of information on the Federal District and Goiás. Even considering that
those have a small participation in the Basin, they have problems regarding water
resources management, given the intense use of the soil, by agriculture, and the boost in
urbanization;
· OMM's recommendations are observed, with respect to the density of stations in the
Basin (one fluviometric station per 2,059 km2 and one pluviometric per 710 km2;
· In addition to the drainage area, the location of the hydrometeorologic stations must
take into account several aspects, such as relief, climate, geology, geomorphology and
particular monitoring points, among others.
3.3. IDENTIFICATION OF THE PLUVIOMETRIC STATIONS
There are different information that can be collected by pluviometric stations. The types of
equipment are classified as follows:
· P Pluviometer
· r Recorder (pluvigraph)
· E Class A evaporation tank , in compliance with the Weather Bureau
· C Climatologic
· T Telemetric Operation.
Figure 4. Distribution of pluviometric stations, according to operating conditions
Chart 4.
Quantitative distribution of the types of pluviometric stations.
ix
Not Operating
Operating
Total
Value % Value %
P
357 77,1 682 76,1 1.039
PC
15 3,2 27 3,0 42
PCT 0 0,0
1 0,1
1
PE 1 0,2
0 0,0
1
Pr
74 16,0 117 13,1 191
PrC
1 0,2 10 1,1 11
PrCT 1 0,2 19 2,1 20
PrE 8 1,7
7 0,8
15
PrEC 1 0,2
8 0,9
9
PrECT
1 0,2
5 0,6
6
PrT
2 0,4 17 1,9 19
PT 0 0,0
2 0,2
2
Sem
Informação
2 0,4
1 0,1
3
Total
463 65,9%
896 34,1%
1.359
Source: HIDRO Hydrologic Information System (ANA, Sept. 2002)
Picture 1.
Example of PrEC type of pluviometric station
3.4. IDENTIFICATION OF FLUVIOMETRIC STATIONS
The types of information collected by fluviometric stations may be the following:
· R Recorder (limnigaph)
x
· D Water discharge measurement
· S Solid discharge measurement
· Q Parameters of water quality
· T Telemetric transmitter
· F Water level gauge.
Chart 5. Quantitative distribution of the types of fluviometric stations
Not Operating
Operating
Value
%
Value
%
Total
D 7
1,4
0
0,0
7
F 81
16,5
31
10,0
112
FD 234
47,7
108
35,0
342
FDQ 28
5,7 6
1,9 34
FDS 16
3,3 4
1,3 20
FDSQ 1 0,2 5
1,6
6
FDSQT 0 0,0 1
0,3
1
FDT 0
0,0
1
0,3 1
FQ 2
0,4
0
0,0 2
FR 2
0,4
1
0,3 3
FRD 62
12,6
57
18,4 119
FRDQ 3 0,6 2
0,6
5
FRDS 21 4,3 0
0,0 21
FRDSQ 1 0,2 21
6,8
22
FRDSQT 0 0,0
7 2,3
7
FRDST 0 0,0 3
1,0
3
FRDT 0 0,0 15
4,9 15
FRT 0
0,0
10
3,2 10
Q 1
0,2
37
12,0
38
SI 32
6,5
0
0,0 32
Total
491 61,4%
309 38,6%
800
Source: HIDRO Hydrologic Information System (ANA, Sept. 2002)
A complete review of all the registers on the fluviometric stations is necessary, in view of the
detected errors in the recorded information.
xi
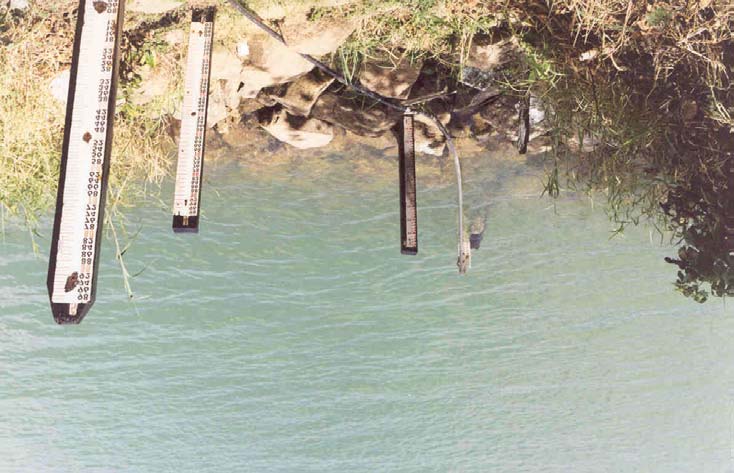
Figura 5. Distribution of the fluviometric stations, according to
their operating conditions
Measurements of water discharges must be made at all stations, to monitor the water levels, with
exception to those between which water accretion is insignificant, or those under the influence of
backwater caused by great rivers, oceans or tides.
Picture 2.
FRDSQT type of fluviometric station
3.5. CONTACT WITH INSTITUTIONS, IN SEARCH OF INFORMATION
To obtain the necessary information, the following institutions were contacted:
ANA, ANEEL/DNAEE/DNOS, CETEC, CEMIG, CODEVASF, COPASA, CPRM/Brasília,
CPRM/Belo Horizonte, CPRM/Salvador, IGAM, PROJETO ÁGUAS DE MINAS, SEMAD/MG,
SEMARH/DF and SRH/BA.
xii
3.6. ASSESSMENT AND CONSISTENCY OF THE INFORMATION
3.6.1 Notes regarding the Operators
The main network operators, representing 86.4% of the total of station in the Basin are:
13.6%
3.1%
4.3%
38.1%
· ANA (38.1%);
· SUDENE (17.7%);
· CODEVASF (13.9%);
9.3%
· DNOCS (9.3%);
13.9%
· CEMIG (4.3%); e
17.7%
ANA
SUDENE
CODEVASF
DNOCS
CEMIG
INMET
Demais
· INMET (3.1%).
Figure 6. Distribution of the stations in the São Francisco Basin (Sept./2002)
However, if only operating stations are considered, the participation is as follows:
11.5%
4.0%
4.2%
35.7%
· ANA (35.7%);
· SUDENE (27.1%);
· DNOCS (13.3%);
13.3%
· CEMIG (4.2%);
4.2%
· EMATER (4.2%);
27.1%
· INMET (4.0%).
ANA
SUDENE
EMATER
DNOCS
CEMIG
INMET
Demais
Figure 7. Participation of the operating stations in the São Francisco Basin
3.6.2. With respect to pluviometric stations
Of the 1,359 identified pluviometric stations, 896 (65.9%) are in operation and 463 (34.1%) are
not operating. This is a positive indicator, as a greater part of the existing stations is in operation.
As shown in Figures 8 and 9, six institutions are responsible for 91.1% of all the stations in the
Basin (92.2% if only the operating ones are considered).
xiii
8.9%
4.9%
29.9%
4.2%
· ANA (29.9%);
13.1%
· SUDENE
(28.0%);
· DNOCS (13.1%);
11.0%
· CODEVASF
28.0%
(11.0%);
· INMET (4.9%); e
· CEMIG (4.2%).
ANA
SUDENE
CODEVASF
DNOCS
CEMIG
INMET
Demais
Figure 8. Total of pluviometric stations in the Basin, by Operator.
:
5.4%
7.8%
27.6%
5.4%
· ANA (27.6%);
· SUDENE (36.5%);
· DNOCS (17.2%);
17.2%
· CODEVASF (0.1%);
0.1%
· INMET (5.4%); e
36.5%
· CEMIG (5.4%).
ANA
SUDENE
CODEVASF
DNOCS
CEMIG
INMET
Dema
Figure 9. Pluviometric stations in operation.
3.6.3. With respect to pluviometric stations
Of the 800 identified fluviometric stations, 309 (38.6%) are operating and 491 (61.4%) are not.
Thus, two thirds of the network is not operating.
Figure 10 presents the main fluviometric stations' Operators in the basin, responsible for 92.5%
of the existing stations. This percentage goes to 99.1% if only the operating ones are considered,
as shown in Figure 11. It is worth highlighting CODEVASF's situation, as it owns 18.8% of the
existing stations and only 0.3% of those in operation.
xiv
4.5%
7.4%
4.4%
6.0%
· ANA (52.1%);
· CODEVASF (18.8%);
52.1%
· Est. Res. 396/98 (6.8 %);
18.8%
· CHESF (6.0 %);
6.8%
· CRA (4.5 %); e
· CEMIG (4.4%).
ANA
RES. 396/98
CODEVASF
CHESF
CEMIG
CRA/BA
Demais
Figure 10. Total of fluviometric stations in the Basin, by Operator.
11.7%
0.9%
9.7%
·
4.9%
ANA (59.2%);
· CODEVASF (0.3%);
0.3%
· Est. Res. 396/98 (13.3%);
59.2%
13.3%
· CHESF (4.9%);
· CRA (11.7%);
· CEMIG (9.7%)
ANA
RES. 396/98
CODEVASF
CHESF
CEMIG
CRA/BA
Demais
Figura 11. Operating fluviometric stations, by Operator.
3.7. QUANTITATIVE ANALYSIS OF THE EXISTING NETWORK
For the quantitative analysis, the stations were classified by Sub-Basins, operating and non-
operating, in September of 2002. The charts ahead present a summary of the existing situation.
3.7.1. Global analysis of the pluviometric network
In Chart 6, all pluviometric stations in the basin, operating or not, are listed. Analysis of the
numbers reveals that distribution by Sub-Basins is not uniform, due to diverse issues, such as the
xv
criteria used for defining priority areas, topography of the Sub-Basins, area of coverture and
planning strategies, among other.
Chart 6.
Pluviometric stations per Sub-Basins (Sept. 2002)
Type SB 40 SB 41 SB 42 SB 43 SB 44 SB 45 SB 46 SB 47 SB 48 SB 49 Total
P 131 96 69 22 86 53 116 110 197 159 1.039
PC 7 10 3 4 4 1 - 1 4 8 42
PCT
- - - - 1 - - - - - 1
PE
- - - - - - - - 1 - 1
Pr 30 20 24 8 17 25 27 9 20 8 188
PrC
1 - 1 - 4 2 - - 3 3 14
PrCT
5 2 6 1 3 - - - 1 2 20
PrE
3 - 1 - 1 - 1 2 4 3 15
PrEC
6 - - - - - 3 - - - 9
PrECT
- 2 - - - 1 1 1 - 1 6
PrT
5 2 1 2 1 2 4 - 1 1 19
PT
- - 1 1 - - - - - - 2
SI 1 1 1 - - - - - - - 3
Total 189 133 107 38 117 84 152 123 231 185 1.359
Source: HIDRO Hydrologic Information System (ANA, Sept. 2002)
Chart 7 presents the operating pluviometric stations, independent of the operating institution. The
area covered by each station was based on this information.
xvi
Chart 7. Operating pluviometric stations per Sub-Basin (Sept. 2002)
Type
SB 40 SB 41 SB 42 SB 43 SB 44 SB 45 SB 46 SB 47 SB 48 SB 49 Total
P
63 35 35 15 56 35 76 79 174 114 682
PC 5 5 2 4 3 1 - - 1 6 27
PCT - - - - 1 - - - - - 1
PE - - - - - - - - - - 0
Pr
23 14 12 3 9 14 14 7 13 8 117
PrC 1 - 1 - 3 2 - - 3 - 10
PrCT 5 2 6 1 3 - - - 1 1 19
PrE 2 - - - 1 - 1 1 2 - 7
PrEC 6 - - - - - 2 - - - 8
PrECT
- 2 - - - 1 1 - - 1 5
PrT 3 2 1 2 1 2 4 - 1 1 17
PT - - 1 1 - - - - - - 2
ND 1 - - - - - - - - - 1
Total 109 60 58 26 77 55 98 87 195 131 896
Chart 8.
Area of coverture per pluviometric stations.
Sub-Basin Density Sub-Basin Density
40 450 45 1.292
41 678 46 1.149
42 1.074 47 1.069
43 1.143 48 383
44 711 49 363
Average
831
Source: HIDRO Hydrologic Information System (ANA, Sept. 2002)
The limit suggested by OMM (900 km2), as indicated in Figure 12, is the upper limit for the
minimum density of station in flat regions, tropical and temperate climate highlands, being a
reference for adequate density.
xvii
Figure 12. Comparison of coverture density and the total of operating stations per
Sub-Basin, according to OMM's recommendations.
Figure 12 emphasizes that Sub-Basins 42, 43, 45, 46 and 47 exceed the recommended limit, thus
suggesting the installation of additional monitoring stations.
Given the number of operating pluviometric stations (896) divided by the Basin's area (636,071
km2) a mean coverture density of 709.9 km2 per station is estimated. Even though meeting
OMM's recommendation, the coverture is heterogeneous, impairing the proper hydrologic
understanding of the Basin.
3.7.2. Evaluation of ANA's pluviometric network
Chart 9 presents the total of pluviometric stations in ANA's network, per Sub-Basin, in
September of 2002. It is evident that distribution is not uniform.
Chart 9.
Total of ANA's pluviometric stations, per Sub-Basin.
Type SB 40 SB 41 SB 42 SB 43 SB 44 SB 45 SB 46 SB 47 SB 48 SB 49 Total
P 76 72 25 9 26 13 21 12 18 15 287
Pr 20 15 13 3 6 12 13 5 4 2 93
PrE
- - 1 - - - - - - - 1
PrEC
6 - - - - - 1 - - - 7
PrT
1 1 1 2 1 2 4 - 1 1 14
PT
- - 1 1 - - - - - - 2
SI
1 1 - - - - - - - - 2
Total
104 89 41 15 33 27 39 17 23 18 406
xviii
Chart 10 covers only the operating stations. The displayed information was used to estimate the
area of coverture, per station and per Sub-Basin.
Chart 10.
ANA's operating pluviometric stations, per Sub-Basin.
Type SB 40 SB 41 SB 42 SB 43 SB 44 SB 45 SB 46 SB 47 SB 48 SB 49 Total
P 39 25 15 8 17 7 8 2 14 8 143
Pr 15 12 12 2 6 11 12 4 4 2 80
PrE
- - - - - - - - - - 0
PrEC
6 - - - - - 1 - - - 7
PrT
1 1 1 2 1 2 4 - 1 1 14
PT
- - 1 1 - - - - - - 2
SI
1 - - - - - - - - - 1
Total
62 38 29 13 24 20 25 6 19 11 247
Chart 11. Area of coverture per pluviometric station
Sub-Basin Density
Sub-Basin Density
40 790
45 3.553
41 1.071
46 4.506
42 2.147
47 15.500
43 2.286
48 3.934
44 2.281
49 4.326
Average
4.039
xix
Figure 13. Comparison of coverture density and the total of ANA's operating
stations, according to OMM's recommendations.
The OMM recommended limit (900 km2), used as acceptable in Figure 13, is a reference for
adequate density. The Figure shows that, with the exception of Sub-Basin 40, all the other fail to
meet the requirement, thus needing installation of additional monitoring stations. It is worth
emphasizing that, in the ideal situation, each station should represent a smaller parcel of the
Basin.
Dividing the number of operating pluviometric stations in the Basin (247) by the total drainage
area (636,071 km2) results in a global coverture density of 2,575 km2 per station, which is bellow
the recommended.
3.7.3. Spatial representation of the surveyed information
Several figures were prepared for a spatial representation of the diagnosis. Figure 14 represents
the ratio between the drainage area (in km2) and the number of operating pluviometric stations,
being useful as a support to guide the network planning, as regions where stations represent
greater areas must have higher priority.
Chart 12 presents the information used for preparing Figure 14, allowing the comparison of
the absolute values for each Sub-Basin.
xx
Chart 12. Number and operating conditions of pluviometric stations.
Sub-Basin
Operating and Closed
Operating
Operating (ANA)
40 259
450
790
41 306
678
1.071
42 582
1.074
2.147
43 782
1.143
2.286
44 468
711
2.281
45 846
1.292
3.553
46 741
1.149
4.506
47 756
1.069 15.500
48 324
383
3.934
49 257
363
4.326
Average 532
831
4.039
xxi
Figure 14. Ratio between area and number of operating stations in the Sub-Basin
xxii
Figure 15 presents the number and spatial distribution of the operating pluviometric stations in
the Sub-Basins of the São Francisco. Greater values indicate more stations (the used values are
included in Chart 13).
Figure 15. Operating pluviometric stations in the São Francisco Sub-Basins.
xxiii
Chart 13. Pluviometric stations: Operators and operating conditions.
Sub-Basin
Operating and Closed
Operating
Operating (ANA)
40 189
109
62
41 133
60
38
42 107
58
29
43 38
26
13
44 117
77
24
45 84
55
20
46 152
98
25
47
123 87 6
48 231
195
19
49 185
131
11
Total 1.359
896
247
xxiv
Figura 16. Monthly pluviometric data in the Sub-Basins' stations.
Figures 17 and 18 are a the spatial representation of Charts 14 and 15, providing a picture of the
current situation of the Agency's database. It allows an evaluation of the efficiency of each
xxv
pluviometric or fluviometric station in producing information. It provides a representation of the
total monthly data produced the stations in the Basin, available in the Hidro database.
Chart 14. Monthly pluviometric data, according to operating conditions.
Sub-Basin
Operating and closed stations
Operating stations
40 34.119
28.356
41 29.955
20.760
42 15.304
13.314
43 5.367
5.129
44 17.905
13.754
45 23.890
19.291
46 35.185
29.686
47 26.661
23.806
48 56.192
51.531
49 48.090
42.140
Total 292.668
247.767
xxvi
Figure 17. Total pluviometric stations operating with data
series in the São Francisco Basin.
xxvii
Chat 15. Total of pluviometric stations and operating conditions (Hidro's database).
Sub-Basin
Operating and closed stations
Operating stations
40 128 82
41 105 49
42 73 53
43 24 21
44 97 68
45 67 47
46 125 91
47 111 83
48 168 148
49 139 105
Total 1.037 747
xxviii
Figure 18. Operating pluviometric stations and estimated area of coverture.
xxix
3.7.4. Global analysis of the fluviometric network
Chat 16 lists all operating and non-operating fluviometric stations, by Sub-Basin, making evident
that distribution is not uniform. Chart 17 includes only the operating fluviometric stations, with
no distinction concerning the operators.
Chart 16. Total of fluviometric stations, per Sub-Basin.
Type
SB 40 SB 41 SB 42 SB 43 SB 44 SB 45 SB 46 SB 47 SB 48 SB 49 Total
D
1 - 3 - - - - - - 2 7
F
2 4 23 - 4 1 6 22 29 39 130
FD
98 77 12 8 15 22 39 22 15 16 324
FDQ 21 2 5 1 2 1 1 - 1 - 34
FDS 7 2 5 - - 1 2 2 - 1 20
FDSQ 2 2 1 - - 1 - - - - 6
FDSQT
- - - - - - 1 - - -
1
FDT - - - - - - 1 - - -
1
FQ - 2 - - - - - - - -
2
FR - - 1 - - 1 - - 1 -
3
FRD 14 7 20 5 7 16 23 8 12 7 119
FRDQ
4 - - 1 - - - - - -
5
FRDS 2 2 - 2 3 3 - - 2 5 19
FRDSQ
4 5 2 2 3 - 5 - 2 1 24
FRDSQT
- - 1 1 - 2 1 - 1 1 7
FRDST
3 - - - - - - - - - 3
FRDT 4 5 1 2 1 - - - - 2 15
FRT 3 - - - - - - 1 - 6 10
ND 7 6 7 2 3 2 - - 2 3 43
Q
- 1 - - - 8 8 11
6 4 27
Total 172 115 81 24 38 58 87 67 71 87 800
xxx
Chart 17. Total of operating fluviometric stations, per Sub-Basin.
Type
SB 40 SB 41 SB 42 SB 43 SB 44 SB 45 SB 46 SB 47 SB 48 SB 49 Total
D
- - - - - - - - - 0
F
- 1 20 - 1 - 1 5 12 9 49
FD 34 15 2 4 4 6 8 5 7 5 90
FDQ 6 - - - - - - - - - 6
FDS 1 - 3 - - - - - - 4
FDSQ
2 2 - - - 1 - - - - 5
FDSQT
- - - - - - 1 - - - 1
FDT - - - - - - 1 - - - 1
FQ - - - - - - - - - - 0
FR - - - - - - - - 1 - 1
FRD 8 3 9 1 2 10 12 2 6 4 57
FRDQ
2 - - - - - - - - - 2
FRDS
- - - - - - - - - - 0
FRDSQ
4 5 2 1 3 - 3 - 2 1 21
FRDSQT
- - 1 1 - 2 1 - 1 1 7
FRDST
3 - - - - - - - - - 3
FRDT 4 5 1 2 1 - - - - 2 15
FRT 3 - - - - - - 1 - 6 10
ND - - - - - - - - - - 0
Q
- - - - - 8 8 11
6 4 37
Total 67 31 38 9 11 27 35 24 35 32 309
Based on these data, the area covered by each station, as well as the average coverture for the
whole Basin, was estimated (Chart 18 and Figure 20).
xxxi
Chart 18. Sub-Basins' station density
Sub-Basin Density Sub-Basin Density
40
731
45
2.632
41
1.312
46
3.218
42
1.639
47
3.875
43
3.302
48
2.136
44
4.977
49
1.487
Final average
2.531
Figure 20. Comparison of coverture density and the total of operating stations,
per Sub-Basin, according to OMM's recommendations.
The upper limit suggested by OMM (2,500 km2), informed in Figure 20, is the greatest value for
normal minimum station density for flat regions, tropical and temperate climate highlands, even
though not all areas in the Basin fit in this condition, being a reference for adequate density. The
same Figure shows that Sub-Basins 43 to 47 do not comply with the limit.
The total of operating fluviometric stations (309) divided by the Basin's total area (636,071 km2)
results in a coverture density equivalent to 2,058 km2 per station, which complies with OMM's
recommendations.
3.7.5. Evaluation of ANA's fluviometric network
Chart 19 presents the total number of fluviometric stations in operation in ANA's network, per
Sub-Basin. Notice that distribution is not uniform.
xxxii
Chart 19. Number of fluviometric stations in operation, per Sub-Basin
Type
SB 40 SB 41 SB 42 SB 43 SB 44 SB 45 SB 46 SB 47 SB 48 SB 49 Total
F
- - - - - - 1 - 2 2 5
FD 21 13 16 4 4 4 7 3 7 2 81
FDSQ 2 2 - - - 1 - - - - 5
FDSQT
- - - - - - 1 - - - 1
FR - - - - - - - - 1 - 1
FRD 7 3 9 1 2 10 12 2 6 4 56
FRDSQ
4 5 2 1 3 - 3 - 2 1 21
FRDSQT
- - 1 1 - 2 1 - 1 1 7
FRDT 1 1 1 2 1 - - - - - 6
Total 35 24 29 9 10 17 25 5 19 10 183
Based on these data, the area of coverture per station was estimated and the mean values for each
Sub-Basin, as well as the average value for the entire Basin, are shown.
Chart 20. Density of fluviometric stations per Basin.
Sub-Basin Density Sub-Basin Density
40
1.400
45
4.180
41
1.695
46
4.506
42
2.147
47
18.600
43
3.302
48
3.934
44
5.475
49
4.758
Average 5.000
xxxiii
Figura 21. Comparison of coverture density and total of ANA's operating stations,
per Sub-Basin, according to OMM's recommendations.
The OMM suggested limit (2.500 km2), as shown in Figure 21, is the upper limit for the
minimum normal station density for tropical climate highland regions. Notice, in the Figure, that
Sub-Basins 43 to 49 do not comply with the recommendation, which suggests the installation of
additional monitoring stations.
Based on the number of operating stations (183), the coverture density is estimated as 3,473 km2,
in average, per fluviometric station, which represents a more effective coverture for the larger
areas in the Basin. Besides the lower density coverture, the spatial distribution is highly
heterogeneous and coverture almost non-existent in the smaller water courses.
3.7.6. Spatial representation of the collected information.
Figure 22 shows the ratios between Sub-Basin areas (in km2) and te number of operating
fluviomentric stations.
xxxiv
Figura 22. Ratios between Sub-Basin areas (in km²) and number of operating
fluviomentric stations.
xxxv
Chart 21. Area of coverture of the fluviometric stations, per operator, and operating
conditions.
Sub-Basin Operating and Closed
Operating
Operating (ANA)
40 285
731
1.400
41 354
1.312
1.695
42 769
1.639
2.147
43 1.238
3.302
3.302
44 1.441
4.977
5.475
45 1.225
2.632
4.180
46 1.295
3.218
4.506
47 1.388
3.875
18.600
48 1.053
2.136
3.934
49 547
1.487
4.758
Média 960
2.531
5.000
Figure 23 presents the spatial distribution of the operating fluviomentric stations. Greater values
indicate more stations in the area, serving as orientation for the network's operational planning,
as higher priority is to be given to regions with fewer stations.
xxxvi
Figure 23. Number of operating fluviometric stations in the Sub-Basins.
xxxvii
Chart 22. Fluviometric stations, per operator and operating conditions.
Sub-Basin Operating and Closed
Operating
Operating (ANA)
40 172
67
35
41 115
31
24
42 81
38
29
43 24
9
9
44 38
11
10
45 58
27
17
46 87
35
25
47 67
24
5
48 71
35
19
49 87
32
10
Total 800
309
183
Chart 23. Monthly fluviometric data and the total of stations in Hidro's database.
Operating and closed
Only those in operation
Sub-Basin
Datas Stations Datas Stations
40 26.008 98
13.061 34
41 15.144 51
9.944 23
42 9.456 35
8.829 29
43 3.532 15
2.629 9
44 4.233 14
3.153 8
45 7.833 23
5.534 14
46 9.150 28
8.534 21
47 1.403 9
934
4
48 4.031 14
3.995 13
49 2.964 8
2.834 7
Total 83.754 295
59.447 162
Chart 24. Total of operating stations in drainage areas inferior to 500 km2 and their
participation the total number of stations in the São Francisco Basin
All stations
Only ANA's stations
Sub-Basin
nr. of stations
% of the total
nr. of stations
% of the total
40
27 40,30 14 40,00
41
6 19,35 5 20,83
xxxviii
42
9 23,68 4 13,79
43
1 11,11 1 11,11
44
2 18,18 1 10,00
45
0 0,00 0 0,00
46
1 2,86 0 0,00
47
3 12,50 0 0,00
48
8 22,86 0 0,00
49
2 6,25 1 10,00
Média 59 15,71% 26 10,57%
Figure 24 presents the amount of monthly fluviometric data from stations in the São Francisco
Sub-Basins, stored in Hidro's databank. It is useful for evaluation of the network's efficiency and
for hydrologic investigations.
xxxix
Figure 24. Monthly fluviometric data from stations in the São Francisco Basin.
Figure 25 presents the number of operating fluviometric stations with drainage area inferior to
500 km2 divided by the total number of stations in the Basin.
xl
Figure 25. Number of stations with drainage area inferior to 500 km2, as a
percentage of the total number of stations in the Basin.
xli
3.8. QUALITATIVE ANALYSIS OF THE EXISTING NETWORK
Evaluation of the information being produced by the hydrometeorologic network used primarily
ANA's stations, in view of the difficulty in obtaining data from the other operators. The non-
willingness to make the information available impedes the assessment of the quality of the
information produced by those stations.
Chart 25. Comparison of information from pluviometric stations:
Stations w/ series
Average of data
Sub-Basin
Nr. of stations
Monthly data
of data
per station
40 189
128
34.119
267
41 133
105
29.955
285
42 107
73
15.304
210
43 38
24
5.367
224
44 117
97
17.905
185
45 84
67
23.890
357
46 152
125
35.185
281
47 123
111
29.961
270
48 231
168
56.192
334
49 185
139
48.090
346
Total 1.359
1.037
295.968
2.759
4. CONSIDERATIONS
REGARDING THE EXISTING NETWORK
4.1. REGARDING THE LOCATION OF THE STATIONS
Regarding distribution and efficiency of data production:
The spatial distribution of the stations deserves a more critical analysis. There are regions with a
high density of stations, including those that are part of flooding alert networks or belong to pilot
basins for hydrologic investigations. In the opposite situation, there are areas with a complete
lack of stations, including those without population or with difficult access.
The analysis of the produced data series can demonstrate the non-existence of data for some of
the stations indicated as in operation. While some stations have extremely short series, with
intercalated blank periods, others present series with more than 60 years of observations, with
few blanks.
The ideal distribution for a hydrometeorologic network takes into consideration the criteria
defined by ANA`s strategic planning, in compliance with OMM`s and DNAEE/ANEEL`s
recommendations.
xlii
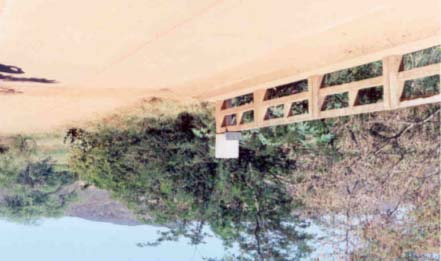
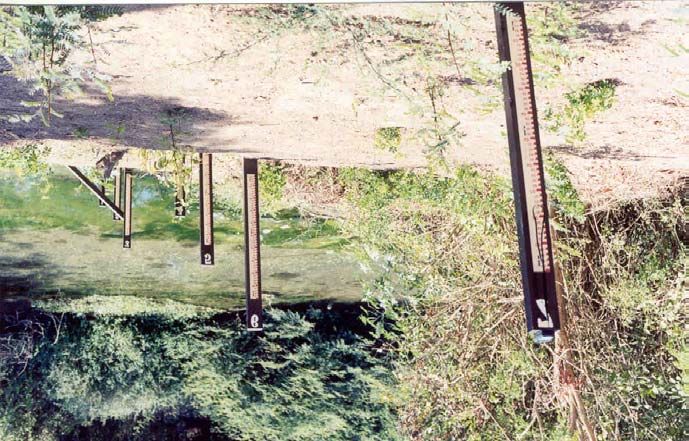
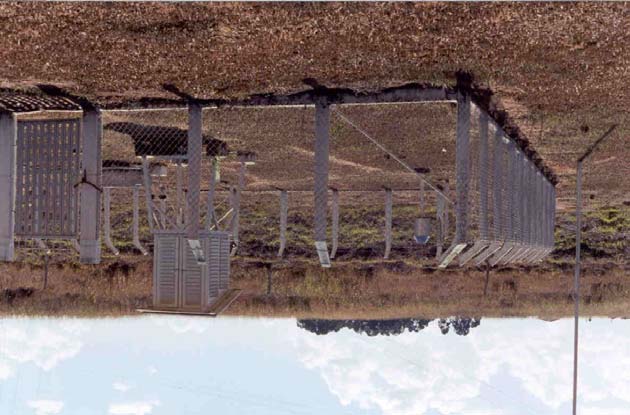
Regarding the location of the stations:
The installation of a hydrometeorologic station must take into consideration the following points:
· Given the equipment's purchase and maintenance costs, care must be taken with respect
to their preservation. The equipment are protected against calamities, but vandalism is a
permanent threat;
· The information provided by the equipment might save invaluable property and/or
human lives, in the case of effective flooding alerts;
· The installation of the equipment must be as discreet as possible, disguised into the
environment, so that the data recording, by sensors, will not suffer disturbances;
· The location must permit an easy access at any time, without obstacles or excessive
costs;
· Those responsible for the data collection must live close to the station, so that they will
exert a surveillance and prevent interruption of the observations due to calamities.
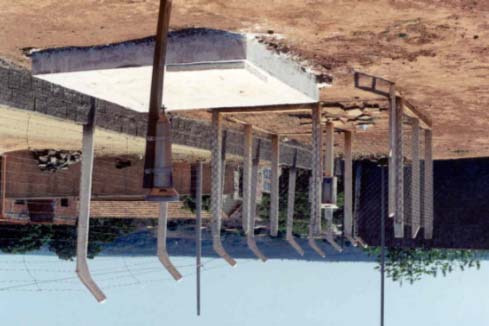
Picture 3. Improper location, in the bridge's guardrail, susceptible to vandalism.
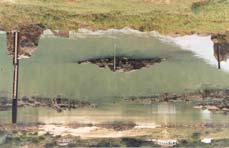
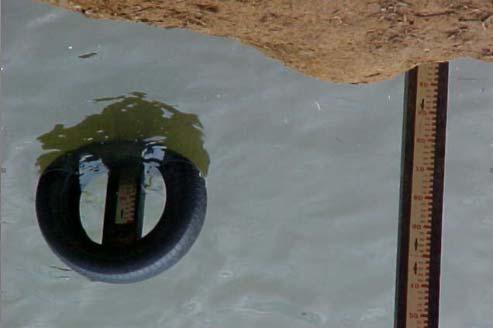
Picture 4. Measurement device being used as springboard.
xliii
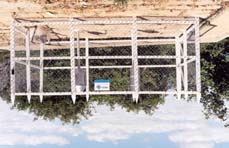
Picture5. Two pluviometric stations operating at the same site.
5.
DEFINITION OF PROJECT PARAMETERS
5.1. PLANNING THE HYDROMETEOROLOGIC NETWORK
The planning of the complementary network must comply with the orientations in the "Terms of
Reference for Elaboration of the Diagnosis and Planning of the National Hydrometeorologic
Network", prepared by ANA (April, 2002).
5.2. PROJECT PARAMETERS
5.2.1. Related to the pluviometric stations
The following criteria were adopted for locating the pluviometric stations in the Basin:
· Viewing the expansion of the database for studies on concentrated rainfalls, stations
were installed with an excess in coverture, in areas subject to orographic precipitations,
such as river headwaters, for example;
· Istallation of a conventional pluviometer in urban centers, or near them, where there
was no coverture;
· It was decided, jointly with ANA, that for each set of five conventional pluviometers a
recorder was to be instaled, preferably a data-logger type, equivalent to pluviographs,
for planning purposes;
· In hard to reach sites, the installation of telemetric and automatic stations is suggested,
given the high costs of the visists.
5.2.2. Related to the evaporimetric stations
· The density must be at least the triple of those recommended by OMM.
5.2.3. Aplicados às estações fluviometrics
The following criteria were adopted for locating the fluviometric stations in the Basin:
xliv
· Greater density of stations at river headwaters, as those regions are more subject to
orographic precipitations and susceptible to flood waves;
· Installing at least one fluviometric station upstream and one downstream from the
identified reservoirs, and at least three stations at headwaters, middle reach and mouth
of the main rivers;
· Installing data-logger kind of automatic recorders (equivalent to limnigraphs, for
planning purposes), in remote areas, without urban centers nearby;
· FD stations will be installed at the mouth of every main tributary of the São Francisco
River;
· Sediment catching stations (S) and stations for estimate of parameters of quality (Q)
willbe installed immediately downstream and upstream from the main identified
reservoirs.
5.2.4. Regarding the automatic eqipment
Installation of the automatic equipment must be a priority in two cases:
· In places with few inhabitants; and
· In places requiring real time updating of information, such as flood control alert
networks.
Viewing the guarantee of a minimum control of the sations fitting in the first case, it is suggested
the installation of a telemetric station (via satellite or SMS) for each group of five automatic
equipment.
5.3. PLANNING THE COMPLEMENTARY NETWORK
The planning of the network follows, necessarily, two lines:
· Improvement of the hyrometric data collection network, in general; and
· Structuring a regional system to provide information on water quality (including
groundwater).
The qualitative and quantitative monitoring networks must operate in na integrated and systemic
way, producing consistent information about a certain reality or particular situation, to allow na
adequate management of the regional water resources.
This regional information system must be linked to the respective State Councils and to
organisms involved in the water resources management, integrated to the National Water
Resources Information System.
The greater obstacle to this objective is related to non-hydrologic factors that, nevertheless, affect
the outcome, as a whole:
· Lack of funds for maintenance of the network and the equipment;
xlv
· Equipment failure, caused by internal (malfunction) and external (theft and vandalism,
among other) factors;
· Absences and inaccuracy of the observers;
· Lack of adequate places for installing the stations;
· Inadequate technology and field equipment for the job (discharge measurement in small
streams, for example).
5.4. SUGGESTED TYPES OF STATIONS FOR THE COMPLEMENTARY NETWORK
According to the surveys carried out in the Diagnosis stage, it is recommended that the choice of
the type of station to be installed be based on a smaller number of combinations:
· Pluviometric stations:
- P
Conventional pluviometric station;
- Pr
Pluviometric station with recorder;
- PrEC
Pluviometric station with recorder, evaporimetric tank and climatologic
equipment;
-PrECT
Pluviometric station with recorder, evaporimetric tank and climatologic
and telemetric equipment;
-PrT
Pluviometric station with recorder and telemetric equipment.
· Fluviomentric stations:
- FD
Station with water level and discharge gauge;
- FDSQ
Station with gauge for water level, measurement of liquid and solid
discharges and collection of water quality paramenters;
- FRDSQ
Station with water level gauge, recorder, liquid and solid discharge
measurements, and collection of quality parameters;
- FRDSQT Station with water level gauge, recorder, liquid and solid discharge
measurements, collection of quality parameters and telemetric
transmitter.
5.5. PRIORITY REGIONS FOR ACTIONS VIEWING THE EXPANSION OF THE
HYDROMETEOROLOGIC NETWORK
5.5.1. Floods and flooding areas
The following regions deserve priority for installation of the telemetric network for the
anticipated flood alert:
· Tributaries of the Upper São Francisco;
· Manga;
· Bom Jesus da Lapa;
· Montes Claros;
xlvi
· Divinópolis;
· Pirapora;
· Itaúna;
· Metropolitan Region of Belo Horizonte;
· Januária
· Paraopeba e Paracatu River Valleys.
5.5.2. Dry periods
The Basin suffers, periodically, the effect of long periods without rainfalls, particularly the
Middle and Middle-Lower São Francisco Sub-Basins. Droughts, like the one in 1976, imposed
considerable losses to the regional agricultural production, increasing rural exodus and
aggravating urban expansion, with riots and critical social crisis.
With respect to the restrictions, well-founded, many times, to the irrigation programs, it is
important to acknowledge that the water supply to support the agricultural production, even
though limited, is fundamental to allow the population to remain in the Semi-Arid.
5.5.3. Automatic stations network (data-logger and telemetric)
Regions 5.5.1 and 5.5.2 will be given priority in the installation of automatic hydrometeorologic
stations, to boost data collection. There are great population blanks to justify the installation of
automatic equipment, to subsidize strategic planning.
In other regions, the use of automatic stations will be to antecipate flood alerts and to mitigate the
impact of long dry spells that cause agricultural losses, increased rural exodus and aggravation in
urban growth rate.
5.5.4. Structure of the hydrometeorologic network
Installaton of the Basin's hydrometeorologic network will observe an order of previously
established priorities, financial resources availability criteria and human resources.
Considering urgency required for the hydrometeorologic information, to support investigations
viewing the adoption of measures aimed at a rational use of the water resources, the Minimum
Basic Network must be implemented in three steps:
· Priority Minimum Basic Network (PMBN), in the short range;
· Minimum Basic Network (MBN), on the medium range; and
· Ideal Basic Network (IBN), in the long range.
For distributing the allocation of funds throughout the Project's life, the network's
implementation should be in accordance with the time chart presented in Chart 26.
xlvii
Chart 26. Chronogram for installation of the stations defined in the planning
year 1
year 2
year 3
year 4
year 5
year 6
Semester 1o.
2o.
1o.
2o.
1o.
2o.
1o.
2o.
1o.
2o.
1o.
2o.
PMBN[1]
MBN[2]
IBN[3]
[1] Priority Minimum Basic Network; [2] Minimum Basic Network; and; [3] Ideal Basic Network.
5.6. NETWORK'S EXPANSION AND MODERNIZATION COSTS
Installation costs, per station, at an exchange rate of US$1 to R$3.50, are estimated based on
information provided by SIH/ANA's Network Planning Sector, in the following way:
Conventional station:
- Pluviometric: US$ 290
- Pluviographic: US$ 400
- Evaporimetric - Climatologic: US$ 5,350
- Fluviometric: US$ 200
- Fluviometric with conventional recorder (limnigraph): US$ 460
Automatic station:
- Pluviometer: US$ 1.200,00
- Fluviometric: US$ 1,630
Telemetric station:
- Pluviometric-Fluviometric: US$ 10,300
- Pluviometric-Fluviometric, with parameters of water quality: US$ 20,000
Annual costs, per station, were estimated from the regular operating costs of the National
Hydrometeorologic Network.
Conventional station:
- Pluviometric: US$ 1,150
- Pluviographic: US$ 1,725
- Evaporimetric Climatologic: US$ 1,925
- Fluviometric: US$ 1,350
- Fluviometric, with conventional recorder (limnigraph): US$ 1,600
xlviii
Automatic station:
- Pluviometric: US$ 1,200
- Fluviometric: US$ 1,800
Telemetric station:
- Pluviometric-Fluviometric: US$ 2,300
- Pluviometric-Fluviometric, with parameters of water quality: US$ 2,400.
It is suggested that 1,261 pluviometric stations be installed/modernized, in the Basin and
surrounding areas, in a maximum period of six years, as proposed in Chart 27. Modernization and
installation of the pluviometric stations should be according to the chronogram proposed in Chart
28.
Chart 27. Proposal for modernization and installation of pluviometric stations.
Type of station
Sub-Basin
Total
P Pr
Pr(DL)
PrEC
PrECT
PrT
40
31 34 15 3 3 7 93
41
41 20 20 4 1 5 91
42
79 19 55 4 0 2 159
43
23 9 34 3 0 1 70
44
40 9 42 3 0 0 94
45
39 9 114 3 3 4 172
46
71 9 159 5 0 1 245
47
72 5 82 5 1 2 167
48
43 13 37 2 1 0 96
49
31 19 17 3 2 2 74
Total
432 156 524 30 9 19 1.261
xlix
Chart 28. Suggested chronogram for installation / modernization of the pluviometric
stations defined in the planning.
Year 1
Year 2
Year 3
Year 4
Year 5
Year 6
Sub-Basin
30% 20% 20% 10% 10% 10%
40 28 19 19 09 09 09
41 27 18 18 09 09 09
42 48 32 32 16 16 16
43 21 14 14 07 07 07
44 28 19 19 09 09 09
45 52 34 34 17 17 17
46 74 49 49 25 25 25
47 50 33 33 17 17 17
48 29 19 19 10 10 10
49 22 15 15 07 07 07
Total
378 252 252 126 126 126
Implementation costs for the proposal regarding the pluviometric stations are presented in Chart
29. The operational costs, after full implementation of the proposal is shown in Chart 30.
Chart 29. Estimated installation costs (in US$) of the planned pluviometric stations.
Type of station
Sub-Basin
Total
P Pr
Pr(DL)
PrEC
PrECT
PrT
40 8.990 13.600 18.000 16.050 46.950 72.100 175.690
41 11.890 8.000 24.000 21.400 15.650 51.500 132.440
42
22.910
7.600
66.000
21.400 0 20.600
138.510
43 6.670
3.600
40.800
16.050 0 10.300
77.420
44 11.600
3.600 50.400 16.050 0
0 81.650
45 11.310 3.600 136.800 16.050 46.950 41.200 255.910
46
20.590
3.600
190.800
26.750 0 10.300
252.040
47 20.880 2.000 98.400 26.750 15.650 20.600 184.280
l
48 12.470
5.200 44.400 10.700 15.650 0 88.420
49 8.990 7.600 20.400 16.050 31.300 20.600 104.940
Total 136.300 58.400 690.000 187.250 172.150 247.200 1.491.30
Chart 30. Annual maintenance costs (US$) of the pluviometric stations, after full
implementation of the proposal (based on ANA's costs).
Type of station
Sub-Basin
P Pr
Pr(DL)
PrEC
PrECT
PrT
Total
40
35.650 58.650 18.000 5.775 12.675 16.100 146.850
41
47.150 34.500 24.000 7.700 4.225 11.500 129.075
42
90.850
32.775
66.000
7.700 0 4.600
201.925
43
26.450
15.525
40.800
5.775 0 2.300
90.850
44
46.000 15.525 50.400 5.775
0
0
117.700
45
44.850
15.525 136.800 5.775 12.675 9.200 224.825
46
81.650
15.525
190.800
9.625 0 2.300
299.900
47
82.800 8.625 98.400 9.625 4.225 4.600 208.275
48
49.450 22.425 44.400 3.850 4.225
0
124.350
49
35.650
32.775 20.400 5.775 8.450 4.600
107.650
Total
540.500
251.850 690.000 67.375 46.475 55.200
1.651.400
In a similar way, 671 fluviometric stations should be installed and/or modernized, in the basin, in
a maximum of six years, observing the proposal in Chart 31, and following the schedule proposed
in Chart 32.
li
Chart 31. Proposed distribution of the fluviometric stations to be installed and/or
modernized, in the Basin
Type of station
Sub-Basin
Total
FD FDSQ
FrD(DL)
FrDSQ
FrDSQT
FrDT
40 41 13 22 26 05 04
111
41 26 17 09 06 12 01
71
42 32 07 05 04 00 00
48
43 10 06 08 03 01 00
28
44 18 04 10 14 00 00
46
45 07 09 18 03 05 03
45
46 34 13 45 07 00 01
100
47 33 13 25 14 00 02 87
48 20 28 16 11 00 00 75
49 20 21 16 05 00 01 63
Total 241 131 174 93
23
12 674
Chart 32. Suggested installation/modernization schedule for installation/modernization of
the programmed fluviometric stations.
Year 1
Year 2
Year 3
Year 4
Year 5
Year 6
Percentual
30% 20% 20% 10% 10% 10%
40 23 15 15 08 08 08
41 16 11 11 05 05 05
42 14 10 10 05 05 05
43 08 06 06 03 03 03
44 14 09 09 05 05 05
45 14 09 09 05 05 05
46 30 20 20 10 10 10
47 26 17 17 09 09 09
48 23 15 15 08 08 08
49 19 13 13 06 06 06
Total
187 125 125 62 62 62
The installation/modernization costs are presented in Chart 33. Annual costs for operation of the
complementary fluviometric network, after completing the proposed installation, are shown in
Chart 34.
lii
Chart 33. Installation/modernization costs (US$) of the proposed stations.
Sub-
Type of station
Total
Basin
FD
FDSQ FrD(DL) FrDSQ FrDSQT FrDT
40 8.200 5.980 35.860 54.340 100.000 41.200 245.580
41 5.200 7.820 14.670 12.540 240.000 10.300 290.530
42 6.400 3.220 8.150 8.360 0
0 26.130
43 2.000 2.760 13.040 6.270 20.000 0 44.070
44 3.600 1.840 16.300
29.260 0
0 51.000
45 1.400 4.140 29.340 6.270 100.000 30.900
172.050
46 6.800
5.980
73.350
14.630 0 10.300
111.060
47 6.600
5.980
40.750
29.260 0 20.600
103.190
48 4.000 12.880 26.080 22.990
0
0 65.950
49 4.000
9.660
26.080
10.450 0 10.300
60.490
Total 48.200 60.260 283.620 194.370 460.000 123.600 1.170.050
Chart 34. Annual operation and maintenance costs (US$) after complete installation of
the proposed stations, based on ANA's costs.
Sub-
Type of station
Basin
FD FDSQ
FrD(DL)
FrDSQ
FrDSQT
FrDT Total
40 55.350 13.000 39.600 72.800 17.000 9.200 206.950
41 35.100 17.000 16.200 16.800 40.800 2.300 128.200
42 43.200 7.000 9.000 11.200 0
0 70.400
43 13.500 6.000 14.400 8.400 3.400
0 45.700
44 24.300 4.000 18.000 39.200 0
0 85.500
45 9.450 9.000 32.400 8.400 17.000 6.900 83.150
46 45.900 13.000 81.000 19.600
0
2.300 161.800
47 44.550 13.000 45.000 39.200
0
4.600 146.350
48 27.000 28.000 28.800 30.800
0
0 114.600
49 27.000 21.000 28.800 14.000
0
2.300 93.100
Total 325.350 131.000 313.200 260.400 78.200 27.600 1.135.750
liii
Chart 35. Total installation/modernization costs (US$) of the proposed
complementary network
Sub-Basin Fluviometric Pluviometric Total
40 245.580
175.690
421.270
41 290.530
132.440
422.970
42 26.130 138.510
164.640
43 44.070 77.420 121.490
44 51.000 81.650 132.650
45 172.050
255.910
427.960
46 111.060
252.040
363.100
47 103.190
184.280
287.470
48 65.950 88.420 154.370
49 60.490 104.940
165.430
Total 1.170.050 1.491.300 2.661.350
Chart 36. Annual operation and maintenance costs (US$) of the
proposed complementary network
Sub-Basin Fluviometric Pluviometric Total
40 206.950
146.850
353.800
41 128.200
129.075
257.275
42 70.400 201.925
272.325
43 45.700 90.850 136.550
44 85.500 117.700
203.200
45 83.150 224.825
307.975
46 161.800
299.900
461.700
47 146.350
208.275
354.625
48 114.600
124.350
238.950
49 93.100 107.650
200.750
Total 1.135.750 1.651.400 2.787.150
liv
6. CONCLUSIONS
Regarding the Institutions:
· During the surveys, it was verified that the number of institutions carrying out
hydrometeorologic monitoring in the Basin, exceeds the numbers in HIDRO's
cadastration. Thus, a review of the registers of hydrometeorologic stations in the Basin
is recommended.
· It is up to the Agency to proceed with the contacts with the several involved institutions,
viewing the consolidation of the monitoring network and the dissemination of the
information.
Regarding the stations:
· Even though the number of hydrometeorologic stations is significant, the spatial
distribution is inadequate and it is necessary the to relocate stations and install new
monitoring posts;
· OMM's recommendations are met, even though almost in the limit, considering the
Basin as a tropical climate highland region, with one fluviometric station per 2,058 km2
and a pluviometric one per 709.9 km2. However, the recommendation is not met in
regions with more irregular topography.
Regarding the pluviometric stations:
· Most part of the pluviometric stations is located in the States of Minas Gerais (36.6%),
Bahia (30.9%) and Pernambuco (25.3%). Only 7.1% of the stations are in the other
States;
· Most part of the operating fluviometric stations is in Minas Gerais (51.8%), Bahia
(32.4%) and Pernambuco (12.6%), with only 3.2% in the other States;
· Evaluation of the types of pluviometric stations reveals that of the 896 stations in
operation 682 (76.1%) have only pluviometer (simplest type of equipment), 183
(20.4%) have an attached recorder and for one of the stations there is no information on
the existing equipment;
· Analysis of Chart 37 indicates that Sub-Basins 42, 43, 45, 46 and 47 do not meet
OMM's recommendation concerning the minimum coverture density, being
recommended the expansion of their pluviometric networks. The situation is even more
critical if only ANA's network is considered.
lv
Chart 37. Station coverture density in the Sub-Basins
Sub-Basin Density Sub-Basin Density
40
450
45
1.292
41
678
46
1.149
42
1.074
47
1.069
43
1.143
48
383
44
711
49
363
Average 831
Regarding the climatologic stations:
· There are only 70 climatologic stations (7.8% of the total) in the area, for a mean
density of one station to 9,087 km2. The 20 operating evaporimetric stations (2.2% of
the total) result in a mean density of one station per 31,804 km2. Considering the Basin
as a Semi-Arid region, OMM's recommendation (one station to 30,000 km2) is met.
However, investigation of the actual evaporation losses in the Basin should be
intensified.
Regarding telemetric pluviometric stations:
· The density of telemetric pluviometric stations with transmitters is extremely low (one
station per 14,456 km2). Given the conflicts in water resources management, and aiming
at an expansion of the flood alert network, this density should be boosted immediately.
Regarding the fluviometric stations:
Considering the 309 stations in operation (38.6% of the total), it is noticed that:
· 37 stations (12,0%) do not record water stage;
· 79 stations (25.6%) do not measure discharges (aggravated by the fact that 37 of those
evaluate water quality parameters, producing compromised results);
· the only case in which is acceptable not measuring the discharges is when there is a
monitoring of water levels in nearby sections, for hydropower generation purposes. In
those cases, it is more appropriate measuring water discharges;
· 116 stations (37.5%) have recorders, operating in conjunction with the water level stick.
Regarding the collection of sediments and water quality parameters:
· There are 41 sediment collecting posts (13,3% of the total), which is significantly
bellow DNAEE/OMM's recommendations, which are 30% of the stations in arid
regions and 15% for non-arid or populated tropical areas;
lvi
· There are 79 points collecting water quality parameters, representing 25.6% of the
operating station. However, as previously mentioned, 37 of those stations have no
information on the incoming discharges, which impairs the analysis.
Regarding the telemetric fluviometric stations:
· There are only 37 fluviometric stations (12% of the total) with telemetric transmitters,
resulting in a low coverture density (one station per 17,191 km2).
Regarding the access to information in the data base:
· Considering the total information stored in the HIDRO's database, the stations in the
Basin (in operation or closed) have data series with an average of 24 years of record.
Regarding modernization and expansion costs:
· Considering existing limitations, implementation of the proposed complementary
hydrometeorologic network was distributed on a six year period, according to the
chronogram on Chart 38;
· Implementation costs of the stations tend to decrease with the stages of implementation,
due to the reduction both in the number of stations to be installed and in the price of the
automatic and telemetric equipment.
Chart 38. Consolidated installation/modernization chronogram for the planned
pluviometric/fluviometric stations in the basin
Year 1
Year 2
Year 3
Year 4
Year 5
Year 6
Percentage
30% 20% 20% 10% 10% 10%
40
51 34 34 17 17 17
41
44 29 29 15 15 15
42
62 41 41 21 21 21
43
29 20 20 10 10 10
44
42 28 28 14 14 14
45
65 43 43 22 22 22
46
104 69 69 35 35 35
47
76 51 51 25 25 25
48
51 34 34 17 17 17
49
41 27 27 14 14 14
Total
565 377 377 188 188 188
lvii
Chart 39. Installation/modernization costs (US$) of the complementary network
Sub-Basin Fluviometric Pluviometric Total
40 245.580
175.690
421.270
41 290.530
132.440
422.970
42 26.130 138.510
164.640
43 44.070 77.420 121.490
44 51.000 81.650 132.650
45 172.050
255.910
427.960
46 111.060
252.040
363.100
47 103.190
184.280
287.470
48 65.950 88.420 154.370
49 60.490 104.940
165.430
Total 1.170.050 1.491.300 2.661.350
· The stations' maintenance costs, on the other hand, tend to increase with the number of
installed stations and as a function of the equipment replacement, for reasons of
obsolescence, vandalism and harms due to diverse causes;
· The increase in network density will bring down the average operational costs for each
station, given the dilution of the operational costs of the hydrometeorologic network.
7. RECOMMENDATIONS
General recommendations:
· Re-cadastration of the institutions in charge of hydrologic monitoring in Brazil and their
station should be carried out, by ANA, giving priority to the São Francisco Basin;
· It is suggested a complete review of all registered information on the hydrometeorologic
stations in the Basin, in view of the errors encountered;
· The data inventory must be updated constantly, including the files, descriptive
documents and reports with pictures;
· The Agency must coordinate meetings with all those responsible for hydrometeorologic
networks in the Basin, viewing the consolidation of the established agreements;
· To increase support to the State and Municipal Governments, it is suggested a
awareness campaign on the importance of water courses preservation and of hydrology;
lviii
· Actions should be carried out to contribute to the planning and operation of the
hydrometeorologic networks, in a participative way, among the institutions operating in
the Basin, in order to reduce operational costs;
· There should be efforts for capacitating technical operational personnel (engineers,
technicians and support personnel, in the hydrometry field);
· It is suggested the adoption of the Otto-Basin river codes (in this case, the São Francisco
River would use only the code 74, instead of using 40001000, 41001000 up to
49001000).
Regarding the hydrometeorologic network:
· The station density must be increased so that all Sub-Basins will be in compliance with
the OMM's recommendations;
· The technical specification of the equipment must take into consideration regional
particularities, such as maximum allowable working temperature, for example;
· Structuring, in agreement with Technical Offices of Basin Committees and with
institutions operating in the Region, a program for dissemination of the
hydrometeorologic data;
· It is recommended contracting a technical team with expertise in data recovery,
consistency and dissemination, for treating the information partially lost with the
extinction ofSUDENE;
· 1,261 pluviometric stations must be installed in the Basin and adjacent areas, in a
maximum of six years, in accordance with the proposal in Chart 40;
Chart 40. Proposal of distribution of pluviometric stations in the Sub-Basin
Sub-
Type of station
Total
Basin
P Pr
Pr(DL)
PrEC
PrECT
PrT
40 31 34
15
3
3
7
93
41 41 20
20
4
1
5
91
42 79 19
55
4
0
2 159
43 23
9
34
3
0
1
70
44 40
9
42
3
0
0
94
45 39
9
114
3
3
4 172
46 71
9
159
5
0
1 245
47 72
5
82
5
1
2 167
48 43 13
37
2
1
0
96
49 31 19
17
3
2
2
74
Total 432
156
524
30
9
19
1.261
lix
Figure 26. Priority areas for actions viewing expansion of the
pluviometric network in the São Francisco.
lx
· 674 fluviometric stations must be installed in the basin, in a maximum of six years, in
compliance with the proposed distribution in Chart 41;
Chart 41. Proposed distribution of fluviometric stations in the Sub-Basins
Type of station
Sub-
Total
Basin
FD FDSQ
FrD(DL)
FrDSQ
FrDSQT
FrDT
40 41 13 22 26 5 4 111
41 26 17
9
6
12
1
71
42 32
7
5
4
0
0
48
43 10
6
8
3
1
0
28
44 18
4
10
14
0
0
46
45 7
9
18
3
5
3 45
46 34 13
45
7
0
1 100
47 33 13
25
14
0
2
87
48 20 28
16
11
0
0
75
49 20 21
16
5
0
1
63
Total 241
131
174
93
23
12
674
· fluviometric stations with water discharge capability must be installed in the points
where water quality parameters are collected. If there is a fluviometric station nearby, its
data may be transposed to the local post;
· it is suggested the expansion of the existing network for assessment of water quality
parameters, being recommended the installation of stations upstream and downstream
from urban centers;
· collection of quality and sediment metric parameters must be expanded upstream and
downstream from the main reservoirs;
· channels must be established to allow the sharing of information among the institutions
working with hydrologic monitoring in the Basin.
lxi
Regarding the expansion of the telemetric network:
· Considering the existing limitations, implementation of the proposed expansion of the
complementary hydrometeorologic network was distributed on a six year period;
· Installation costs of the stations tend to decrease along the implementation of the
proposal, given the reduction in the quantitatives and in the price of automatic and
telemetric equipment;
· The operational costs, on the other hand, tend to increase, as a function of the increased
number of operating station, and of the equipment replacement costs, due to
obsolescence, depredation and harms due to several causes.
Chart 42. Total installation/modernization cost (US$) of the complementary network
Sub-Basin Fluviometric Pluviometric
Total
40
245.580 175.690 421.270
41
290.530 132.440 422.970
42
26.130 138.510 164.640
43
44.070 77.420 121.490
44
51.000 81.650 132.650
45
172.050 255.910 427.960
46
111.060 252.040 363.100
47
103.190 184.280 287.470
48
65.950 88.420 154.370
49
60.490 104.940 165.430
Total
1.170.050 1.491.300 2.661.350
lxii