INTEGRATED MANAGEMENT OF LAND BASED ACTIVITIES
IN THE SÃO FRANCISCO RIVER BASIN PROJECT
GEF/ANA/OAS/UNEP
Activity 2.2.A Partnership for the Improvement
of the Ribeirão São Pedro Water Quality
Executive Summary of the Final Report
PARTNERSHIP FOR THE IMPROVEMENT OF THE
RIBEIRÃO SÃO PEDRO WATER QUALITY
CBH PARÁ
Comitê da Bacia Hidrográfica do Rio Pará
São Sebastião do Oeste MG
INTEGRATED MANAGEMENT OF LAND BASED ACTIVITIES
IN THE SÃO FRANCISCO RIVER BASIN PROJECT
GEF/ANA/OAS/UNEP
Activity 2.2.A Partnership for the Improvement of the
Ribeirão São Pedro Water Quality
Executive Summary of the Final Report
PARTNERSHIP FOR THE IMPROVEMENT OF THE
RIBEIRÃO SÃO PEDRO WATER QUALITY
Coordinator
Regina Greco
Comitê da Bacia Hidrográfica do Rio Pará - CBH Pará
Consultant
Joaquim Caetano de Aguirre Junior
Contrato CPR/OEA no 36064 - PO#47738
November 2002
PARTNERSHIP FOR THE IMPROVEMENT OF THE
RIBEIRÃO SÃO PEDRO WATER QUALITY
EXECUTIVE SUMMARY
INTRODUCTION
Expansion of private developments in small rural communities has led to a boost in water
demand for multiple purposes, putting a strong pressure not only in the availability but also on
the quality of the resource.
Water resources management and sustainable development practices, as well as the concern with
protection and preservation of natural resources, were matters which had not yet aroused the
interest of the communities. Most of the properties in the Microbasin of the Ribeirão São Pedro
were managed without consideration for environmental control practices. This is the common
situation in most of basins in the national territory.
Activity 2.2.A ("Partnership for the Improvement of the Ribeirão São Pedro Water Quality"),
part of the Public and Stakeholder Participation Component, of the "Integrated Management of
Land Based Activities in the São Francisco River Basin Project" (GEF/ANA/OAS/UNEP), was
created to deal with the situation. Its main objective was the implementation of an awareness
development and environmental education program, viewing the mobilization and orientation of
the Microbasin's community, so that it would actively participate in the sustainable development
processes, through the application of soil and water conservation practices.
1.
CHARACTERIZATION OF THE RIBEIRÃO SÃO PEDRO MICROBASIN
The Microbasin of the Ribeirão São Pedro, with 204 km² of drainage area, is totally inserted into
the Municipality of São Sebastião do Oeste, located in the Central-Western Region of the State of
Minas Gerais. The Municipality is at the 20º16`29" S Latitude 45º00`13" W Longitude,
belonging to the Western Mesoregion of the State and to the Microregion of Divinópolis. The
Municipal seat may be accessed by MG-050 (Figure 1).
1.1 PHYSIOGRAPHIC
ASPECTS
1.1.1 Climate and Pluviometry
According to the records obtained at São Sebastião do Oeste's Pluviometric Station (Chart 1), the
mean annual precipitation (1990-2001) is equal to 1,359 mm. The rainy season extends from
October through March, with mean monthly precipitations varying from 115.3 to 286.4 mm.
January presents the highest monthly precipitation depths.
i
Figure 1. Location and access to the Microbasin of the Ribeirão São Pedro-MG.
ii
Figure 2. Fluvial drainage network of the Microbasin of the Ribeirão São Pedro MG
iii
Chart 1. Mean precipitation depths in the Station of São Sebastião do Oeste (1990 2002)
Year
Monthly precipitation depths (mm)
Annual
total
Jan Feb Mar Abr Maio Jun Jul Aug Sep Oct Nov Dec
1990 90,1 143,6 132,4 70,2 33,4 0,6 28,2 61,2 64,3 41,2 203,7 170,8 1039,7
1991 460,6 106,5 157,8 129,9 23,4 0,0 2,3 0,0 100,4 149,1 119,9 245,3 1495,2
1992 510,0 275,1 82,9 60,0 59,5 0,0 0,0 18,4 97,4 221,3 159,7 315,8 1800,1
1993 142,7 190,1 54,4 51,7 13,3 73,1 0,0 2,6 94,2 125,4 76,0 198,0 1021,5
1994 347,3 0,0 191,6 45,0 74,4 24,7 0,0 0,0 5,5 112,7 77,2 244,5
1122,9
1995 223,4 242,8 179,3 23,8 53,7 0,8 0,0 0,0 52,5 161,6 217,0 302,1 1457,0
1996 97,4 139,7 154,5 90,6 48,5 14,0 0,0 28,3 51,6 63,9 325,2 199,6 1213,3
1997 492,0 202,1 104,3 79,8 39,9 45,3 6,4 0,0 103,2 152,0 218,9 176,2 1620,1
1998 283,0 153,9 118,6 37,3 100,5 3,5 0,0 67,5 10,8 150,1 174,9 151,7 1251,8
1999 176,2 233,2 193,1 87,6 20,8 23,4 0,0 0,0 24,3 75,8 302,8 308,6 1445,8
2000 441,8 236,6 242,1 16,5 0,0 5,2 5,0 9,8 47,0 57,6 268,0 254,9 1584,5
2001 172,0 66,4 221,2 1,1 59,5 0,0 3,3 34,5 45,8 72,5 288,3 287,4 1252,0
2002 202,9 258,9 85,9 16,5 21,5 27,9 28,5 . 25,5 18,3 .
.
.
Mean 286,4 165,8 152,7 57,8 43,9 15,9 7,8 18,5 58,1 115,3 202,6 237,9 1358,7
1.1.2 Hydrography
The Microbasin of the Ribeirão São Pedro is formed by the Espinho, Bambuí, da Gurita, Baldo,
São Pedro, Tira Chapéu, Furtados, Praia, Areia, Açudinho and Recanto creeks. Its first tributary
is the Tira Chapéu, whose headwaters are in the Three Bars Sierra, with an altitude of 914 m. To
the West, it finds its main tributary, the São Pedro Creek, by the seat of the Municipality. The
major part of the Basin corresponds to the Sub-Basin of the São Pedro, where the City of São
Sebastião do Oeste is located.
In order to assess water resources availability, simplified hydrologic investigations were carried
out, based on data from the Fluviometric Station 40,170,000, in Marilândia (at the bridge in BR-
494). The Station, installed in the Itapecerica River, upstream from its merging with the Boa
Vista creek, is operated by ANA. The study consisted of a simple evaluation of the river regime,
which provides indication of the seasonal behavior of flows through the Station and estimate of
the specific discharge. The latter represents the discharge per unit area and allows its
transposition to other sections of rivers in the Region.
Marilândia's Station was selected for being the closest one to the Microbasin of the Ribeirão São
Pedro, within its drainage area, so that it would minimize errors related to the transposition
technique. In this manner, it is expected that the estimated discharges at the points of interest will
be approximately equal to the actual values. It should be emphasized that its drainage Area
corresponds to 19.9% of the Area corresponding to the Station.
The historic series of mean monthly discharges (1967-2000 period), for the Station is presented in
Chart 2. It should be mentioned that those consist of raw data, as provided by the Agency in
charge (ANEEL). Those values were used in the estimates of the characteristic discharges
iv
(monthly minima, mean and maxima), as well as of the curve of permanence of the mean
monthly flows, from which the discharge with a 95% permanence was extracted.
Chart 2. Mean monthly discharges of the Itapecerica River (Station of Marilândia)
Year
Mean monthly discharges (m3/s) Characteristic
discharges
Jan Feb Mar Apr May Jun Jul Aug Sep Oct Nov Dec Min Mean Max
1967 53,5 37,9 36,0 26,7 15,7 12,1 9,8 7,9 6,2 6,9 17,1 23,6 6,2
21,1 53,5
1968 22,3 20,8 18,8 11,5 8,4 7,0 5,7 5,4 5,6 7,8 8,0 27,3 5,4 12,4 27,3
1969 27,5 18,5 13,2 10,2 7,7 7,1 5,4 4,4 3,6 10,8 30,2 32,4 3,6
14,2 32,4
1970 27,8 18,0 14,4 12,3 8,0 6,8 6,3 5,6 7,9 9,2 13,0 7,9 5,6 11,4 27,8
1971
1972
1973 27,9 31,4 23,1 20,4 13,2 9,8 7,9 6,2 4,7 7,9 15,1 21,3 4,7
15,7 31,4
1974 26,4 14,6 19,4 14,4 10,8 9,0 7,6 5,8 3,9 8,9 8,4 26,9 3,9
13,0 26,9
1975 28,1 18,0 11,6 10,1 8,4 6,2 6,9 4,7 3,7 5,4 24,8 22,3 3,7 12,5 28,1
1976 10,1 13,9 12,9 7,1 5,8 5,4 5,9 5,7 9,4 8,7 18,8 37,8 5,4 11,8 37,8
1977 25,0 19,9 14,0 13,7 8,0 6,3 5,2 4,5 6,1 4,6 15,4 20,3 4,5 11,9 25,0
1978 25,0 12,7 17,8 11,1 9,4 9,8 7,5 5,8 5,6 7,2 13,0 18,2 5,6 11,9 25,0
1979
1980 67,0 32,2 18,3 21,4 12,2 11,2 10,2 7,5 6,7 6,0 8,3 19,8 6,0
18,4 67,0
1981 28,9 16,4 15,0 9,6 7,9 8,0 6,5 5,8 5,0 9,8 21,6 25,9 5,0 13,4 28,9
1982 46,6 26,2 29,8 21,5 13,7 11,4 10,1 8,8 7,8 11,2 16,6 30,8 7,8
19,6 46,6
1983 60,3 53,4 35,8 39,8 24,3 34,8 19,1 14,7 17,3 26,2 42,5 59,3 14,7 35,6 60,3
1984 26,7 18,0 14,9 14,8 10,5 9,0 7,5 7,2 9,2 9,3 8,9 31,5 7,2
13,9 31,5
1985 69,1 42,9 42,5 23,1 16,1 13,0 11,2 9,9 9,8 9,2 11,0 18,4 9,2
23,0 69,1
1986 38,1 34,6 19,6 12,1 10,1 8,8 9,4 10,4 7,7 5,2 7,2 42,9 5,2 17,2 42,9
1987 35,0 24,4 16,8 19,7 11,6 9,6 8,4 6,7 8,7 7,1 8,9 31,4 6,7
15,7 35,0
1988 15,5 26,0 19,3 11,1 8,3 7,2 5,3 4,4 2,8 6,6 10,2 13,1 2,8 10,8 26,0
1989 20,7 22,8 25,2 10,9 8,2 7,5 6,2 5,7 4,5 4,9 11,3 23,9 4,5 12,7 25,2
1990 21,9 13,3 14,2 10,7 8,5 5,9 5,7 5,5 5,3 4,1 5,4 7,2 4,1 9,0 21,9
1991 39,8 26,2 16,8 19,7 10,3 7,9 5,8 4,7 4,3 10,9 5,4 12,0 4,3
13,7 39,8
1992 52,2 53,1 22,9 16,5 13,7 10,4 9,0 7,5 8,3 11,5 24,9 24,9 7,5
21,2 53,1
1993 21,6 23,7 17,4 14,3 9,5 10,5 6,6 6,0 5,6 6,5 7,4 10,3 5,6 11,6 23,7
v
year Jan Feb Mar Apr May Jun Jul Aug Sep Oct Nov Dec Min Mean Max
1994 39,7 11,5 19,3 10,7 11,9 8,1 6,8 5,3 4,1 4,3 4,1 12,6 4,1
11,6 39,7
1995 9,6 27,6 12,3 9,1 7,7 5,8 5,2 4,5 3,6 5,3 10,9 19,0 3,6 10,1 27,6
1996 21,1 10,6 11,0 7,5 6,0 4,5 3,3 3,3 4,1 3,3 26,1 18,1 3,3 9,9 26,1
1997 58,2 23,1 25,8 18,6 12,3 12,9 8,6 6,7 6,0 7,8 11,2 31,9 6,0
18,6 58,2
1998 25,7 21,3 12,6 10,2 9,1 8,7 6,2 5,8 4,4 5,9 10,7 17,0 4,4 11,5 25,7
1999 17,0 18,4 34,7 14,5 9,8 8,6 7,1 5,0 5,1 5,3 12,9 15,6 5,0 12,8 34,7
2000 34,3 34,2 33,4 18,6 12,5 10,1 7,8 6,8 8,4 5,0 12,2 23,7 5,0
17,2 34,3
Minimum 9,6 10,6 11,0 7,1 5,8 4,5 3,3 3,3 2,8 3,3 4,1 7,2 2,8
Mean
33,0 24,7 20,6 15,2 10,6 9,5 7,6 6,4 6,3 7,8 14,2 23,5
14,9
Maximum 69,1 53,4 42,5 39,8 24,3 34,8 19,1 14,7 17,3 26,2 42,5 59,3
69,1
Source: National Electric Energy Agency ANEEL
1.1.3 Vegetative
Cover
The cerrado is the vegetative cover in São Sebastião do Oeste, presenting a shrub and herbaceous
formation, with thick-barked trees with twisted branches and trunks, low and continuous,
including bushes and grasses (CETEC & IGA, 1993). It should be mentioned that the trees are
short and sparse. Vestiges of forests are found in the region, as isolated patches.
According to EMATER/MG, in 2002, 43 farmers had reforestation areas (1,800 ha) as economic
activities, covering 4.42% of the territory.
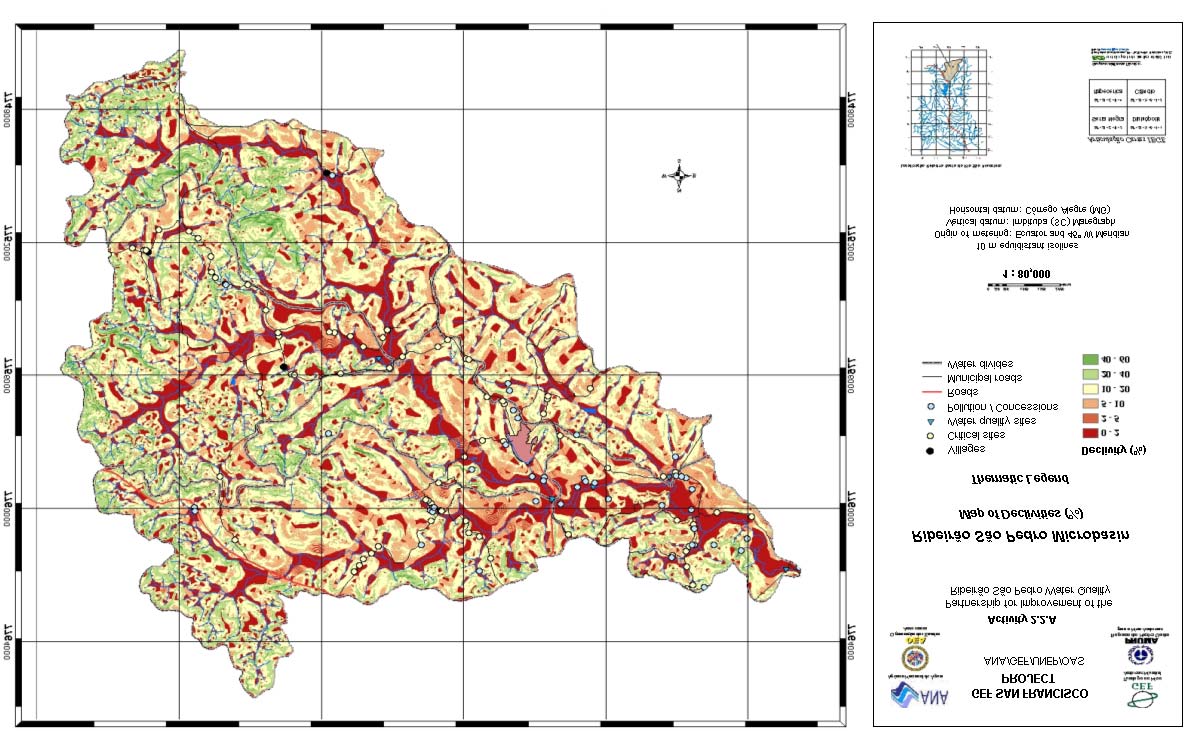
1.1.4 Geomorphology
The topography of São Sebastião do Oeste is flat in 4% of its total area, undulated in 25% and
mountainous in 71%. It has a maximum altitude of 1,027 m, at Sierra Negra, and minimum of
607 m, where the Boa Vista creek meets the Itapecerica River (see Figure 3).
1.1.5 2001
Population
The urban population is 1,624 inhabitants and the rural is 3,024, for a total of 4,648 people. In
1996, IBGE detected that there were 1,271 households in the Municipality, 346 of them in the
urban areas and 921 in the rural zone.
Employment options in the Municipality are all related to agroindustry, agriculture and livestock
raising, with few opportunities for those who want to specialize in different areas. For this reason,
all actions in this Activity were focused on agricultural aspects.
vi
v
iii
Figure 3. Declivities in the Microbasin of the Ribeirão São Pedro MG
vii
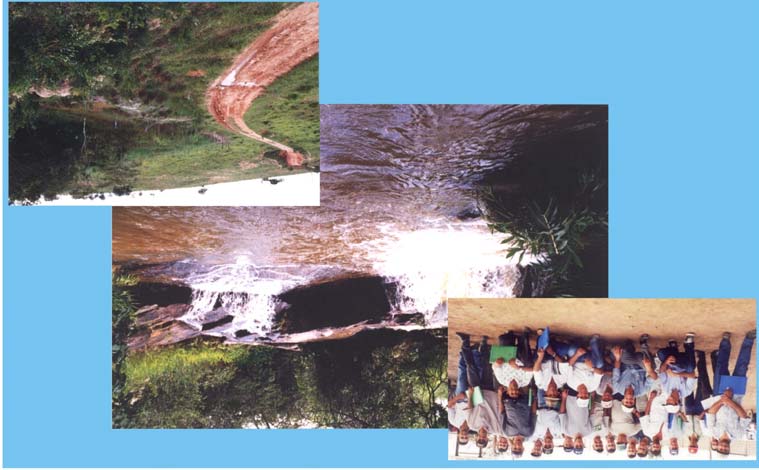
Picture 1. Panoramic view of the Microbasin.
1.1.6 Education
The Municipality of São Sebastião do Oeste has two educational structures in operation. The
school building has 13 classrooms, a laboratory, a library, a cafeteria, a room for the principal of
the State School and one for the principal of the Municipal School. In other words, both schools
operate in the same building, in three shifts, covering from elementary school to senior high-
school.
1.1.7 Productive
Activities
The major part of economically active population in São Sebastião do Oeste is working in
activities related to agriculture, livestock raising and forest exploitation. In 1991, around 72% of
the active population was involved in those sectors, whose growth was inferior to that of other
sectors in the 80's. Data from IBGE attests that the industrial sector has been presenting a
significant growth, even though agriculture and livestock raising still maintain the leadership.
Aiming at a more detailed understanding of the productive activities in the Microbasin of the
Ribeirão São Pedro, between April and June of 2000, a cadastration of all farmers was carried
out. The results are presented in Figure 4.
viii
Figure 4. Productive Activities and number of farmers at each activity.
Productive activities in the Microbasin include the following:
Hatchery:
· Avícola Grupal: production of 1,000,000 chicks/month;
Chicken farms:
· Granja Ouro Branco: 9 hangars, with 100 thousand chickens/hangar
· Granja Bela Vista: 7 hangars, with 100 thousand chickens/hangar
· Granja Beira Rio: 6 hangars, with 100 thousand chickens/hangar
· Granja da Líbia: 4 hangars, with 10 thousand chickens/hangar
· Granja Joaquim Teixeira: 2 hangars, with 60 thousand chickens/hangar
· Granja Sebastião Carvalho Teixeira: 4 hangars, with 75 thousand chickens/
· Granja Ricardo Magalhães: 2 hangars, with 75 thousand chickens/hangar
· Granja Dorival: 4 hangars, with 100 thousand chickens/hangar
Pig farms:
· Granja Ouro Branco: 10 matrices and 40 youngs
· Granja Ricardo Magalhães: 300 matrices and 900 youngs
· Granja Antônio Francisco: 200 country pigs
Slaughterhouse:
· AVIVAR(poultry slaughterhouse): supply of 45,000 birds/day
· Líbia Baeta (closed)
ix
Beef cattle:
· Number of heads of cattle: 6,760
Milk cattle:
· Number of heads of cattle: 8,600
· Milk production: 40,000 liters
Agricultural production:
· Coffee beans: 50 ha 600 processed sacks per year
· Sugar cane: 475 ha 23,750 tons/year
· Beans: 290 ha 130 ton/year
· Horticulturea: 51 ha
· Manioc: 15 ha 150 ton/year
· Corn: 1.150 ha 4.129 ton/year
Production of animal feed:
· Chiken Feed Granja Bela Vista: production of 100 to 120 ton/day
· Chiken Feed Granja Ouro Branco: production of 10 to 16 ton/day
Manufacturing of drinks and food (referent to several small producers):
· Alcoholic beverages: 21,000 l/year
· Brown sugar blocks: 2 ton/year
· Manioc flour: 27 tons/year
· Manioc powder: 10 ton/year
· Cheese: 45,000 kg/year
1.1.8 Sanitation
Garbage collection and disposal is done by the Municipal Prefecture. Today, the urban garbage is
being disposed in a site close to town, in the drainage basin of the Praia creek. There already
exists a project for the construction of a sanitary filling and a garbage recycling unit, which will
attend the entire urban area and the main rural communities. Garbage pick-up occurs twice a
week in the urban sectors, not reaching the 900 kg/week. It is also done weekly in the rural
communities, with support from the Municipal Health Council.
x
Chart 3. Health and sanitation in the rural area, after 2002 (until 7/24/2002)
Water treatment
Garbage destination
Electric
Area
cesspit
(domestic filter)
(burnt / burried)
energy
Area 1: Teixeira
97,30 %
97.30 %
98.65 %
97.30 %
(72 households)
Area 2: Carmos
74.58 %
90.68 %
95.76 %
97.46 %
(88 households)
Area 3: Bambuí
85.37 %
87.80 %
82.93 %
100 %
(35 households)
59.38 %
Area 4 :Água Limpa
100 %
100 %
(39.06% with
98.44 %
(64 households)
sewers)
Area 5: Guarita
98.28 %
82.76 %
98.28 %
96.55 %
(57 households)
Area 6: Alves
100 %
98.55 %
100 %
97.10 %
(69 households)
Area 7: Sierra Negra
79.20 %
89.60 %
92.00 %
97.60 %
(99 households)
Area 8: Castro/Pires
84.40 %
84.40 %
93.58 %
97.25 %
(92 households)
Area 9: Marimbondo
91.89 %
78.38 %
89.19 %
97.30 %
(34 households)
Area 10: Seat
99.59%
1.77% *
4.38% **
99.09%
Source: Municipal Health Secretariat, in 7/24 / 2002
Note: * 98.23% w/ public garbage collection; **95.62% w/sewer network.
2.
SOURCES OF WATER POLLUTION IN THE MICROBASIN
2.1 WATER
USES
The predominant uses for the water in São Sebastião do Oeste are domestic and industrial supply,
irrigation, animal consumption and recreation. Effluent from sewer system and wastes from
agricultural activities and small agroindustries are discharged into the rivers.
2.2 POINT SOURCES OF POLLUTION
The point sources of pollution in the Microbasin are represented by São Sebastião do Oeste's
sewer systems and effluents from a slaughterhouse, poultry farms, small distilleries and starch
factories. Those sources are characterized by the production of effluents containing fecal and
organic matter, as well as of solids and nutrients with low toxic content.
xi
With respect to the sanitation, the São Sebastião do Oeste´s collection network discharges the
effluents into the São Pedro creek. Flow in the sewers, considering that all the population is
served by the system, and assuming a return coefficient of 80%, is estimated at 286 l/s.
Another important point source of pollution is a poultry slaughterhouse. According to the project
of the effluents treatment plant, of the Environmental Control Plan (part of the development's
environmental permit process), this unit produces 1,377 m3 of effluents per day, which
corresponds to 16 l/s, with a biochemical oxygen demand of 1,400 mg/l.
The livestock's water consumption is totally compatible with availability of the resource in the
Microbasin (Chart 4), as it corresponds to 8.4 l/s, which is equivalent to 1.5% of the minimum
mean monthly discharge produced at the entire Basin (558 l/s). On the other hand, the potential
loads are high, what might impose severe pressures on the water resources. Nevertheless, the
residuals are recycled.
Chart 4. Water consumption rates and pollutant emission factors, by type of livestock.
Animal Mean
weight
Consumption
Humid
total N
total P
(kg/head)
(l/head.day)
excrements (g/kg.day)
(g/kg.day)
(g/kg.day)
Poultry
2.5 0.22 62 0.74
0.26
Swine
175 14 74
0.51
0.19
Milk cattle
550 100 84 0.23
0.15
Beef cattle
550 50 66
0.32
0.08
Note: Weight of chicks and pig's youngs were assumed as 0.1 and 30 kg, respectively.
Source: Adapted from Krenkel & Novotny (1986)
2.3
NONPOINT SOURCES OF POLLUTION
The nonpoint sources of pollution are the horticulture, the agriculture, the livestock raising, the
erosive processes and the drainage of rainfalls in the municipal roads crossing the Region.
With respect to water resources, the pollutants are produced by surface runoff washing the land
(woods, plantations and pastures, among other), carrying out sediments, organic matter, fecal
contaminants and agrochemicals. Those sources are directly related to soil conservation and
management practices.
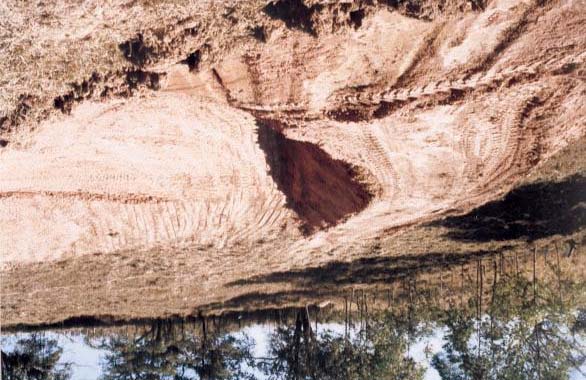
Through studies carried out by Activity 2.2.A, the main sources of erosion in the Microbasin
were identified, and verified that those are favored by the topography.
Surveys confirmed that the main soil and water conservation problems in the Region were the
following:
· Using inadequate road maintenance and conservation techniques, limited to scraping the
soil with bulldozers, allowing accumulation of material in the margins. This material is
carried off by runoff to pastures or planted areas, causing erosion and transportation of
sediments into streams and springs.
xii
· Lack of structures to mitigate the impacts of heavy rainfalls on the rural properties,
streams and springs.
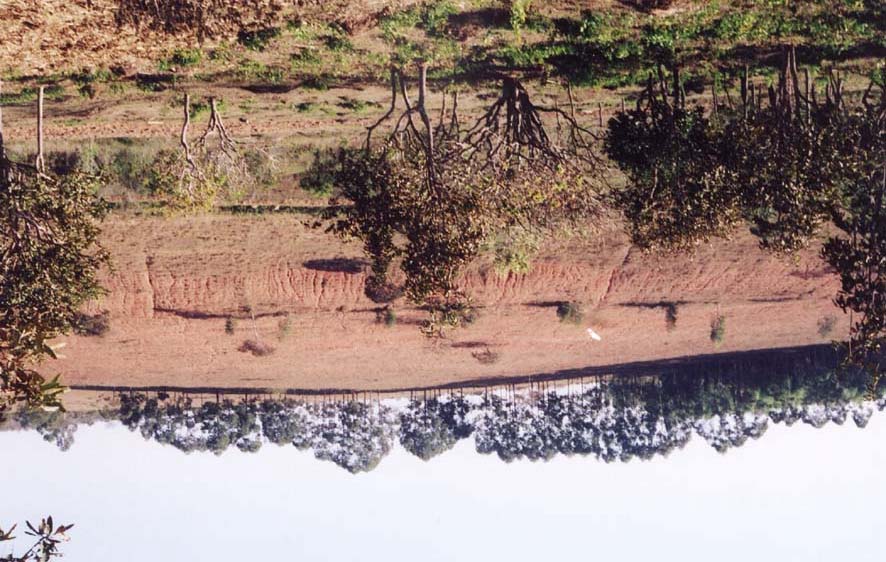
· Using improper soil preparation techniques, plowing downhill. This reduces costs, but
leads to sediment deposition in the roads, streams and springs. It has been verified the
nonexistence of a systematic orientation to equipment operators and farmers, concerning
soil and water conservation principles.
· Total lack of knowledge, by rural landowners, of the soil retention techniques with the
use of contours in pastures in hilly topographies.
Picture 2. Erosion caused by downhill plowing.
The main objective of Activity 2.2.A is precisely approaching this situation, through the
implementation of an awareness program, the mobilization and orientation of farmers, bulldozer
operators, supervisors and vicinal road maintenance workers, on soil and water conservation
practices. This initiative aims at the adoption of corrective measures, to reduce runoff velocity
and augment infiltration, thus reducing erosion.
Among those measures are the construction of terraces in the hilly terrains, restoration of
municipal roads, correcting declivities and drainage systems, besides implementing lateral outlets
and retention pits (micro-dams, Picture 3).
A study was carried out in the Community of Marimbondo, by technicians of the Divinópolis
Agriculture and Livestock raising Cooperative, verified that in a plantation where proper soil and
water conservation techniques were not used there was a removal of 28 tons of sediments, per
hectare.
The importance of the micro-dams is attested by the volume of sediments taken off them in the
cleaning process, executed two years after their construction. In the 30 cleaned pits, a total of 593
m3 of sediments was removed, corresponding to an approximated average of 20 m3 (10 m3 per
xiii
year), per unit. In the micro-dam in road SWO-451, by the mouth of the Ribeirão São Pedro, 94
m3 were removed, fact related to large scale erosion.
Picture 3. Empty micro-dam).
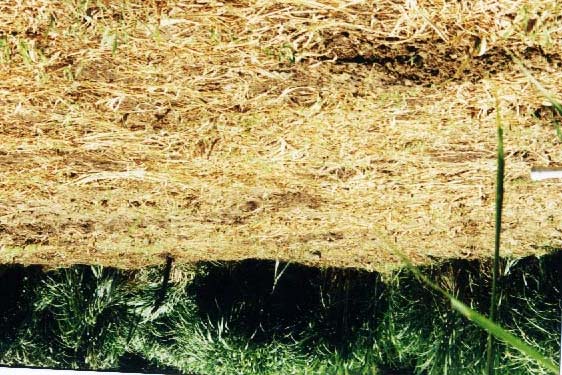
Still regarding nonpoint sources of pollution, the impacts of the beef and milk cattle raising
activities, carried out in an extensive regime, are worth mentioning. Certain equilibrium is
achieved between the produced and the decomposed amounts of organic matter.
However, when proper attention is not given to cattle and pasture management, grazing and trail
formation might induce erosion processes, with the direct access of the animals to the water
courses. This will accelerate erosion of the margins and contribute to water contamination by
feces. The corrals are to be objective of special care, with the removal of manure, which might be
used as fertilizer in planted areas.
3.
WATER QUALITY PANORAMA
3.1
EXTENT OF WATER QUALITY'S CHARACTERIZATION
The studies for the characterization of the Microbasin of the Ribeirão São Pedro were based upon
primary information, obtained in two field sampling campaigns. They also considered secondary
data, from the "Water of Minas" Project, of the Environmental System of the State of Minas
Gerais.
The campaigns were carried out on the 10th of April of 2000 and 3rd of April of 2002, under
similar climatic conditions, with precipitation depths inferior to 20 mm, in both cases. However,
precipitation in the first quarter of 2002 was greater than that in 2000 (920.5 and 547.7 mm,
respectively).
xiv
Both campaigns were scheduled in a way to get pictures of the situation at the beginning and at
the end of the Subproject, to identify possible improvements in water quality, due to
implementation of its control actions. However, in order to achieve such objective, particularly in
the case of corrective practices of soil management, it would be necessary a survey during the
entire hydrologic year, for at least four years.
Picture 4. Pasture with manure.
The sampling network defined for characterizing the water quality in the Microbasin consisted of
seven collection points in the creek and in its tributaries.
Chart 5. Network of water sampling points
Point
UTM Coordinates
Description
code
X Y
PAP01
Bamboo creek, near its confluence with the São Pedro
0495902
7754656
creek
F
Bald creek, near the confluence with the São Pedro creek
0495599
7755566
F
São Pedro creek, just downstream from the City of São
0500516 7759715
Sebastião do Oeste
F
Ribeirão São Pedro, just upstream from the confluence
0500478 7759837
with the São Pedro creek
F
Ribeirão São Pedro, downstream from the confluence with
0501661 7759274
the São Pedro creek and AVIVAR enterprise
F
Praia creek, near the confluence with the São Pedro creek
0503786
7759064
F
Ribeirão São Pedro, near its mouth in the Itapecerica river
0507904
7761813
xv
3.2. WATER QUALITY IN THE MICROBASIN
According to information from the "Water of Minas" Project, apparently the water resources of
the Basin are a little mineralized, at headwaters, with a considerable increase in suspended solids
and organic/inorganic constituents, along its course. Additionally, they are subject to sanitary
compromise, given the pressure exerted by infrastructure and economic activities.
It is worth emphasizing that in Charts 6 and 7, as only two campaigns were carried out, with a
two year lag, the characterization must be considered as a primary approximation of the
prevailing situation in the Microbasin.
Turbidity and total solids content were low. Nevertheless, it was possible to identify a different
situation, with greater levels in the Praia creek (PAP06), as well as in the Ribeirão São Pedro,
after the confluence with the São Pedro (PAP05) and the Praia (PAP07) creeks. This reflects the
negative influence of discharging into the rivers untreated sanitary sewers, from the City of São
Sebastião do Oeste, as well as those from industrial, livestock and swine raising activities. The
latter occurs specially in the area of the Praia creek.
The water of the Bambui creek (PAP01) presented the lowest contents of suspended solids. As
shown in Figure 5, establishing a correlation with the greater incidence of riparian woods in this
creek, a greater conservation of the water resources is verified, with reference to the transport of
solids. In all other points, with exception of the PAP05, the values are not high.
Figure 5. Water sampling collection points in the Microbasin.
Comparing the results of the two samplings shows that there was an improvement, in terms of
carriage of solids into the streams, even though there was a reduction in the total of
precipitations. The construction of the micro-dams, for sediment retention in the vicinal roads,
also contributed for that improvement.
xvi
Chart 6. Results of Physical, Chemical and Bacteriological analysis at Bambui creek
(PAP01), Baldo creek (PAP02) and São Pedro creek (PAP03).
Variable Unit
Legal standard
Sampling Point
Class
1 Class
2 PAP01 PAP01 PAP02 PAP02 PAP03 PAP03
Category
Class 1 Class 1 Class 1 Class 1 Class 2 Class 2
Collection date
-
10/04/00 03/04/02 10/04/00 03/04/02 10/04/00 03/04/02
Hour
-
08:50 08:33 09:20 08:08 10:00 09:20
Air temperature
°C
23,00
17,00
23,00
18,00
21,00
19,00
Water temperature
°C
19,00
18,00
20,00
18,00
19,00
19,00
Turbidity
UNT
40
100
14,00
15,00
14,00
pH
-
6 to 9
6 to 9
6,80
7,30
6,50
Electric
conductivity
µS/cm
35,00
43,00
33,00
Total solids
mg/l
32,00
69,00
67,00
Suspended solids
mg/l
< 2,00
5,00
10,00
6,00
8,00
14,00
Total dissolved
solids
mg/l
500
500
27,00
63,00
53,00
Total hardness
mg/l CaCO3
20,00 14,00 14,00 25,00 18,00 16,00
Total Phosphate
mg/l P
0,025
0,025
< 0,020 0,020 < 0,020 < 0,020 < 0,020 < 0,020
Total N
mg/l N
0,36
0,09
0,43
Amoniacal N
mg/l N
0,36
0,09
0,09
0,10
0,43
0,13
Nitric N
mg/l N
10
10
< 2,00
0,59
< 2,00
0,39
< 2,00
< 0,20
Nítrous N
mg/l
N 1
1
<0,002 <0,002 <0,002
Non-ionizable
Ammonia
mg/l NH3
0,02
0,02
< 0,001
< 0,001
< 0,001
OD
mg/l O2
6
5
6,40
6,30
6,30
% saturation OD
%
72,2
71,0
72,6
BDO5,20ºC
mg/l O2
3
5
2,40
2,00
1,00
2,60
2,60
2,10
DOQ
mg/l O2
9,00
< 5,00
< 5,00
6,60
9,00
5,50
Oil and slush
mg/l
absent
absent
0,40
0,00
0,60
0,00
0,00
0,00
Total Coliforms
NMP/100ml
1000 5000
12030 12990 >
24190
Escherichia coli
NMP/100ml
10
450
210
197
> 24190 12000
Fecal
Estreptococos
NMP/100ml
1000
2400
3600
xvii
Chart 7. Results of Physical, Chemical and Bacteriological analysis at Ribeirão São Pedro
(PAP04 and PAP07), São Pedro creek (PAP05) and Praia creek (PAP06).
Variable Unit
standard Sampling
Point
Class
2 PAP04 PAP04 PAP05 PAP05 PAP06 PAP06 PAP07 PAP07
Category
Class 2 Class 2 Class 2 Class 2 Class 2 Class 2 Class 2 Class 2
Collection date
-
10/04/0 03/04/0 10/04/0 03/05/0 10/04/0 03/04/0 10/04/0 03/04/0
0
2
0
2
0
2
0
2
Hour
-
10:35 09:45 12:00 10:10 11:15 10:35 11:30 11:20
Air temperature
°C
22,00 21,00 25,00 23,00 23,00 23,00 24,00 23,00
Water
°C
21,00 19,00 21,00 19,00 21,00 19,00 21,00 19,00
temperature
Turbidity
UNT
100
14,00
14,00
25,00
12,00
pH
-
6 to 9
6,80
6,90
7,00
6,80
Electric
µS/cm
28,00
41,00
20,00
32,00
conductivity
Total solids
mg/l
76,00
114,00
100,00
86,00
Suspended
mg/l
23,00
8,00
45,00
22,00
17,00 17,00 25,00 < 2,00
solids
Total dissolved
mg/l
500
68,00
92,00
83,00
84,00
solids
Total hardness
mg/l
13,00 15,00 28,00 21,00 15,00 9,00 21,00 21,00
CaCO3
Total Phosphate mg/l P
0,025
< 0,020 < 0,020 < 0,020 0,290 < 0,020 < 0,020 < 0,020 < 0,020
Total N
mg/l N
0,16
0,49
0,05
0,24
Amoniacal N
mg/l N
0,16
0,09
0,49
0,20
0,05
0,23
0,24
0,09
Nitric N
mg/l N
10
< 2,00
0,28
< 2,00
0,23
< 2,00
0,38
< 2,00
0,33
Nítrous N
mg/l
N 1
<0,002 <0,002 <0,002 <0,002
Non-ionizable
mg/l NH3
0,02
< 0,001
< 0,001
< 0,001
< 0,001
Ammonia
OD
mg/l O2
5
6,40
5,10
5,80
5,90
% saturation
%
73,8
58,7
66,5
67,6
OD
BDO5,20ºC
mg/l O2
5
3,10
1,20
5,50
4,50
0,90
1,20
1,00
1,50
DOQ
mg/l O2
5,00
< 5,00 42,00 10,30 54,00 < 5,00 < 5,00 < 5,00
Oil and slush
mg/l
absent
1,20
0,00
6,00
0,00
0,80
0,00
0,00
0,00
Total Coliforms NMP/100
5000 17330 >
24190 4030 >24190
ml
Escherichia coli NMP/100
480 > 24000 > 24190 > 24000
70
350
2590 > 24000
ml
Fecal
NMP/100
4500
14000
1200
4400
Estreptococos
ml
xviii
The low availability of phosphate is noticeable, with contents usually inferior to 0.020 mg/l.
Exception is made for the Ribeirão São Pedro, where a value of 0.29mg/l was verified, just
downstream from the mouth of the São Pedro creek, in the 2002 campaign. This value is 11 times
greater than legal limit and might result in eutrophication problems.
Figure 6. Evolution of load of suspended solids.
Records of the biochemical demand of oxygen (BDO) indicate waters with little organic matter
content, with exception to those of the Ribeirão São Pedro, at the site above mentioned. The BDO
recorded values were 4.5 and 5.5 mg/l, respectively, in 2000 and 2002. The legal limit for class 2
is 5 mg/l. With respect to the chemical demand of oxygen (CDO), the greatest concentrations
were found in the Praia creek, at PAP05 and PAP06 (42 and 54 mg/l, respectively), in April of
2000.
The records confirm that BDO in the Ribeirão São Pedro are results of the discharge of São
Sebastião do Oeste`s sewage and effluents from an industrial poultry slaughterhouse into its
waters.
3.3 CONSOLIDATION OF THE STUDY ON WATER QUALITY
In 2000, the recorded values of suspended solids were in the range of 2 to 45 mg/l, what should
be an indicator of improvement in water quality, in spite of the lower precipitation in the second
period.
The water at the Microbasin of the Ribeirão São Pedro's headwaters are relatively poor in terms
of dissolved salts (total dissolved solids varying from 27 to 68 mg/l), mild, in terms of hardness
(14 to 25 mg/l of CACO3) and free of organic matter (BDO less than 2.6 mg/l). In the water's
course, especially after São Sebastião do Oeste, it is verified an increase in the content of organic
matter, in suspended solids and in dissolved salts, due to the discharge of sewage and industrial
effluents. This raises some of the indicators to values near or a little above the limits for the class
of the water. The dissolved oxygen, itself, suffers substantial depletion in the river (PAP05),
staying, at times, to a 58% level of saturation. (5.1 mg/l).
xix
The survey attested the importance of protecting the vegetative cover for the water quality, as the
Bambui creek Basin (PAP01), with a greater incidence of riparian woods, presented more
favorable characteristics.
Conclusions were based in only two sampling campaigns, what compromises the evaluation of
the impacts of corrective actions implemented by Activity 2.2.A. These effects could only be
assessed base don more frequent samples (monthly for some parameters) and spread over a
minimum period of four years, covering periods with distinct climatic conditions.
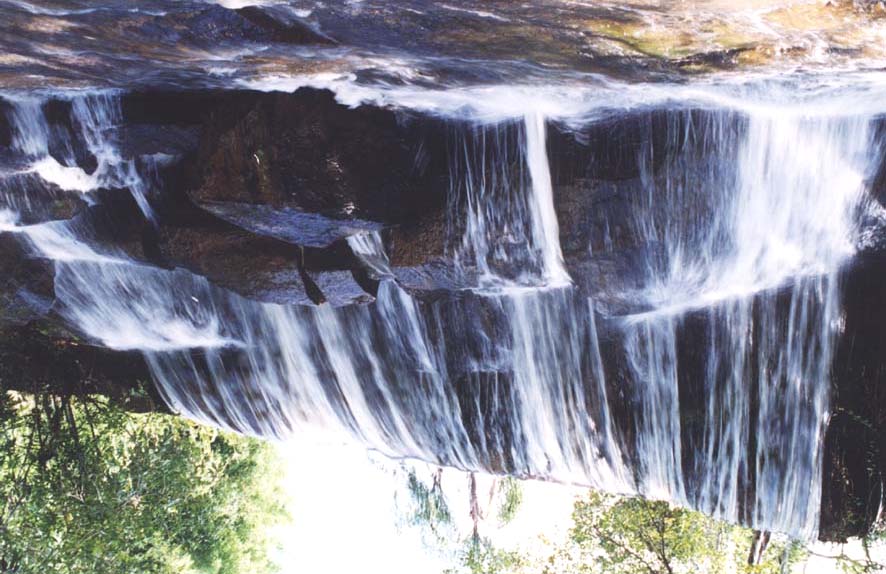
Picture 5. Sightseeing point Guarita Falls (Baldo creek).
To bypass this problem, an estimate of water quality in the Microbasin of the Ribeirão São Pedro
after discharges of sewage and effluents from the slaughterhouse was made. This estimate
confirmed that the river has cleansing capacity for receiving the Municipality's raw sewage, in
terms of organic loads, even for low flow conditions (BDO less than 2.4 mg/l).
However, this discharge compromises downstream use of the water, in view of fecal
contamination, keeping the coliform count always above the 1,700 coli per 100 ml. It also
showed that the slaughterhouse can release its treated effluents with 93% efficiency in the
removal of the BDO. Otherwise, BDO contents will be much superior to the values admitted to
the class 2 category.
The set studies and surveys necessary to meet the demands regarding the implementation of the
actions requires a better technical capacitation of the CBH-Para, providing experts in water
resources.
xx
4.
MITIGATION AND SOIL AND WATER CONTROL PRACTICES
4.1. SOIL MANAGEMENT AND MITIGATING ACTIONS IN AGROINDUSTRY
With the implementation of Activity 2.2.A, there were lectures and workshops, introducing a new
perception of how to use the soil, with a concern regarding the soil water relation.
Figure 7. Classification of water courses in the Microbasin of the Ribeirão São Pedro.
The boost in the use of the soil requires in special attention to prevent erosion and transport of
solids into the rivers, measures that only began to be observed after the discussions started. A
new environmental minded vision was assimilated by the farmers, contributing to the beginning
of changes in behavior, with respect to the environment.
xxi
For better soil conservation, there are alternatives for road maintenance, with catchment of run
off, increasing its infiltration in the soil, for recharge of groundwater resources.
In this direction, with Project's funds, 290 micro-dams and 85 km of contours (terraces) were
built, in addition to the revitalization of 241.5 km of Municipal roads, with the drainage of the
runoff.
4.2 MUNICIPAL GOVERNMENT PARTICIPATION
O envolvimento do Poder Público Municipal, através do Prefeito Municipal e funcionários da
Prefeitura, foram de fundamental importância para o processo de continuidade, execução,
manutenção das ações e atividades implantadas The participation of the Municipal Government,
as a counterpart, in the implementation of the works of the Activity is presented in Chart 8.
4.3 SOIL CONSERVATION IN THE DEMONSTRATION UNITS
4.3.1 Implementation
Strategies
The Demonstration Units (DU) are provided for presenting one or more innovative agricultural
practices, in visible places, to allow an easy observation by all during their implementation,
permitting the evaluation of their execution. Among other, techniques regarding the proper
preparation of the soil, liming, planting on terraces, fertilizing (at planting time and during crop
development) and selection of the most productive seeds. In addition to that, applicability of the
proposed practices are discussed and compared.
Chart 8. Municipal Public Participation (Feb.2000/Sep.2002)
Counterpart
Value in R$
Value in US$
Duration/
amount
Support personnel
8,600.00
3,072.00
3 employees
Vehicle maintenance
2,000.00
715.00
Payment of communication's and event
7,420.00
2,650.00
promotion services
Payment of rooms for meetings and workshops
5,390.00
1,925.00
Gasoline
4,400.00
1,573.00
3.000 liters
Office Material
1,540.00
500.00
32 months
Bulldozer rental
23,030.00
8,225.00
490 hours
Tractor rental
1,800.00
643.00
360 hours
Fuel for tractor
933.00
334.00
940 liters
Tractor driver
2,880.00
1,029.00
360 hours
Xerox machine rental and maintenance
2,100.00
700.00
32 months
TOTAL
60,093.00
21,366.00
Source: Agreement with the Prefecture of São Sebastião do Oeste / MG CBH-Pará. Exchange rate: US$ 1.00 = R$ 2.80
xxii
The selected properties to be used as Demonstration Units must be available at all times for visits
by interested farmers and the owner must be familiar with the techniques, to provide information
on what was implemented. To identify the properties, the following criteria were used:
· Being representative of the activities developed in the Region.
· A visit was paid to each of the interested owners, to discuss the objectives and costs of
the work, and assess their willingness to participate in the Project.
· The farmers should be in a good standing in front of the others, besides being influent.
· The owners should have enough funds for implementing the conservation practices.
4.3.2 Consolidation of Results
The implementation of the Demonstration Units introduced new techniques to the farmers,
promoting comparisons with the little productive methods used previously.
Changing man's behavior is a slow and difficult process. Acknowledging this will experiment a
self-evaluation by the farmers, promoting discussions and contributing to decisions which might
be decisive in the implementation of new works. The adopted methodology is compatible with
the rural extension activities that allow the farmers to decide about matters of their interest.
Many farmers did not know about the importance of contours, what resulted in loss of part of the
soil, at every planting season, besides the degradation of their properties.
5.
COMMUNITY MOBILIZATION AND PARTICIPATION
5.1
MOBILIZATION AND STRATEGIES FOR PARTICIPATION
Mobilization was started with the identification public municipal and state employees working in
areas related to the works developed by Activity 2.2.A (Item 9).
In October of 1999, there was a preparation meeting with the participation of agricultural
technicians owning land in São Sebastião do Oeste, or living nearby, the Region's Manager, the
local technician, retired employees from EMATER-MG, technicians of the Agriculture and
Livestock Raising Cooperative of Divinópolis, the Board of Directors of the Rural Syndicate,
employees of the Prefecture and of the COPASA, CODEMA's Directors and the Board of
Directors of the Rural Development Municipal Council (CMDR).
The following stage of the mobilization occurred in February of 2000, at rural communities
previously selected for the Project's activities: Teixeira (including farmers from Mendonça),
Guarita (with the participation of farmers from Barreiro), Café dos Motoristas, Marimbondo,
Castro Pires and in the Seat of the Municipality.
xxiii
Picture 6. Adjustment techniques for agricultural equipment.
The approach used for mobilization of farmers and residents in the rural areas was the same for
all communities. They began with talks with community leaders in each location, with the
President of the Rural Community Council, with the Church Ministers, with the Mayor, with
municipal politicians, with school janitors, the priest and the milkman, among others. At the end,
all those opinion builders were visited, so that implementation of the main activities and each
one's participation was discussed.
A strategy was adopted for handing out invitations for the farmers, to participate in the launching
of Activity 2.2.A, as well as in courses, lectures and future workshops. Banners were prepared in
cardboards, with relevant information on the events (date, time and place, along with motivating
words for the farmers' involvement). The banners were posted at Community Centers' doors, in
bars, in the Church, at health posts and other places busy with passing people.
With this kind of strategy, The Activity and the Coordinators esteemed the local technicians,
leaders and politicians, all of the already known and trusted by the farmers. In all the meetings, it
was verified whether there were new leaders or other persons to be invited.
5.2 FORMATION OF INSTRUCTORS AND MULTIPLIERS
The instructors' trainings have multidisciplinary, as this is a common issue related to their
personal life and to all the community. It covered one of the most critical problems in the school,
which was cleaning the patio and common areas: Garbage, in other words. The process views
building awareness in the young citizens, encouraging them to protect their Municipalities'
ecosystem.
To them, the garbage issue consisted of picking up "something" and discarding of it somewhere.
They would not understand the importance of an appropriate place for the garbage, the school's
xxiv
containers being just one more item of the building. At that moment, this behavior was
understandable, considering the total lack of knowledge about environmental preservation. Only
after being taught about the three R's (recycling, reuse and reduction) and about the use of
selected garbage containers, for recycling, there was a change in perception.
5.2.1 Preparatory Meetings with the Instructors
Bringing up a citizen aware of the global environment is the responsibility of every educational
system concerned with the search for solutions for current and future problems. This goal is
focused on environmental education.
5.2.2 Introductory
Meetings
At all communities, the first meeting was aimed at a presentation of the work to be implemented
by Activity 2.2.A.
Changes in behavior and attitudes are achieved through technical presentations and courses, as
done by the Activity. Assimilation of the presented issues varied from community to community.
Only after the Meeting for Presentation of the Activity, at each of the rural communities, and a
full understanding of the expected roles of each one, the lectures, actions and courses about
conservation were begun.
5.2.3. The 36 Courses and Lectures.
Throughout the 12 meetings for preparation of the technical courses, the themes of the six
courses to be carried out each of the rural communities were chosen. As the population did not
know what a watershed was, an introductory course, with a lot of visual material, was prepared,
aiming at a practical and easy memorization of the content. Most part of the farmers is illiterate.
The selected themes were:
1. Watershed.
2. Soil Conservation.
3. Environmental Control.
4. Solid Residues.
5. Soil and Water Conservation.
6. Agricultural Mechanization.
xxv
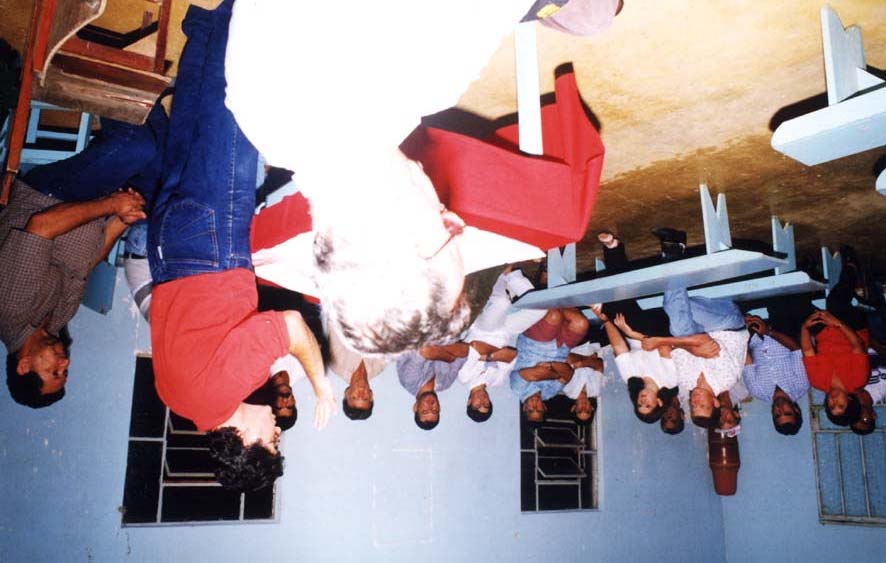
Picture 7. Meeting for Presentation of the Activity, in the Community of Teixeira.
A banner with the Project's Activities Calendar was distributed to all rural properties, so that the
schedule of the courses, lectures, workshops and field days could be seen in every kitchen.
The Schedule Banner was the greatest promoter of the Activity's actions, being also useful to
encourage the community to participate in the events. Being pasted to the walls of every kitchen
in the Microbasin, the visitors, attracted to the bright colors, would ask what the banner was
about, thus receiving information on the events.
5.2.4 The Field Days
The Field Days consisted of practical activities with a group of farmers, in matters related to their
immediate needs. This assured the interest in participating in the exercise.
This practice contributed to tractor drivers and farmer's increase in productivity, through a better
capacitation in tuning up the tractors for the planting and improved skills for collecting soil
samples, giving them the opportunity to have those samples analyzed and the soils properly
corrected with calcarium. The correct application of calcarium was object of other Field Day, as
just it is not enough just to apply the product, but to do it properly, for a greater efficiency.
5.2.5 The 2000 Workshops
Workshops are an effective way to transfer technologies. Dealing with farmers, most of them
born and raised in the rural zone, with few opportunities to learn new techniques for routine
activities, such as planting, harvesting and caring for the soil and water, makes these workshops
xxvi
more important. All they know are techniques passed from father to son, which they learned by
doing the work.
The Environment Workshop was programmed jointly by the body of directors of the two public
schools (the state and the municipal), the Rural Development Municipal Council, the Secretary of
Education of the Municipality, employees of local institutions, CODEMA`s members and the
Coordination of Activity 2.2.A.
The second Soil Conservation Workshop occurred successfully, from the 2nd through the 4th of
August of 2000, with support from the Agriculture and Livestock Raising Cooperative of
Divinópolis, from EMATER`s Regional Office, from TRIAMA (tractor's dealer), from farmers,
from chicken farmers and from the Project's consultant. The agricultural equipment used in the
event were lent by the Rural Development Municipal Council (PRONAF`s tractors and
implements), by the Transluxo Farm, by a farmer and by TRIAMA.
5.2.6 Partnership and Integration Meetings
Mobilization of farmers, agro industrial entrepreneurs and community leaderships involved in the
Activity, viewing the integrated implementation of production, processing and trade aims at the
maximization of benefits.
The mobilization initiatives, consisting of partnerships among the actors (owners of corn
producing farms, animal feed manufacturers and aviculture entrepreneurs), encourages the
integration of participants with common interests, viewing a reduction in their costs of
production.
5.2.7 The 2002 Workshops
In 2002, the Workshops occurred in a climate of expectation, as corn harvesting in the
Demonstration Unit of Teixeira exceeded the expected. The event took place in the lobby of the
Teixeira`s Church, on the 14th of May of 2002, at 300 PM, with the title of "Evaluation of Corn
Production in the demonstration Unit of Teixeira". Technicians of PEDOGEO and EMATER,
along with the Project's consultant, prepared the agenda for the meeting and mobilized the
community for the event.
Everyone visited the production field and had the opportunity to make comparisons, in terms of
productivity and financing, of the two technologies. Results surpassed the expectations, with a
production of seven tons per hectare, when the average productivity in the region is only two.
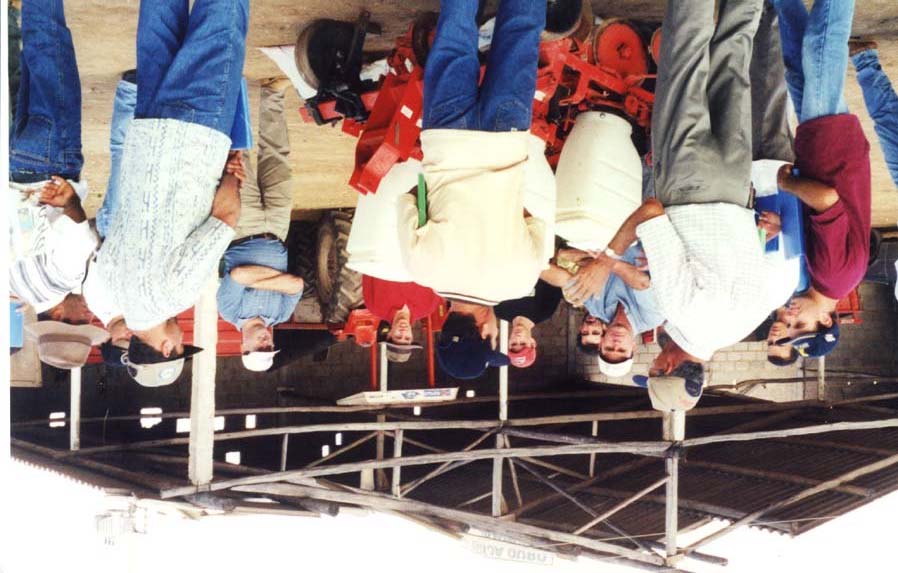
The Soil and Water Conservation, Agriculture and Environment Workshop was implemented in
partnership with the Agriculture in Livestock Raising Cooperative of Divinópolis, EMATER,
technicians of the Agronomists' Association, PEDOGEO, Prefecture of São Sebastião do Oeste
and Activity 2.2.A's personnel. It took place in Divinópolis' Cooperative, on the 17th of June of
2002. The Workshop, with participation of technicians from neighbor Municipalities, advertised
broadly the environmental actions of under way in the Microbasin of the Ribeirão São Pedro, by
the Activity.
xxvii
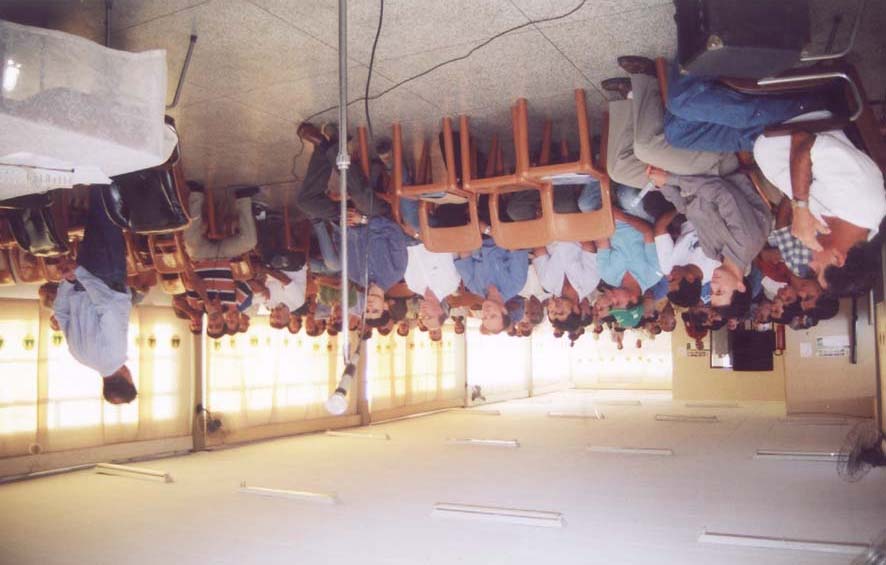
Picture 8. Soil and Water Conservation Workshop, at the
Cooperative, in Divinópolis.
The covered topics were "Direct Planting Techniques" and "Agriculture and the Environment"
(by PEDOGEO's technicians), as well as comments by the Cooperative's President, by the Vice-
Mayor of São Sebastião do Oeste and by the Project's consultant.
5.2.8 The Twelve Meetings with Students, with Focus on "GARBAGE"
The meetings with students occurred at the Magalhães Pinto State High-School and at the
Deputado Jaime Martins Municipal School, in classrooms. The activities were carried out
between August and November of 2000, during school hours, for elementary school through
senior high-school. There were 12 meetings, at the following dates: June 30th, August 10th and
24th, September 4th, 18th and 21st, October 2nd and 16th and November 6th, 20th, 22nd and
23rd.
According to the fourth meeting for training, actions to be implemented would be related to the
three R's: Paper recycling (molding sheets), glass (making of), plastic and metal. Participation in
the activities and work dynamics, for each of the classes, was left to the decision of the teacher,
with supervision of the consultant.
6. CONCLUSIONS
CHARACTERIZATION OF THE MICROBASIN OF THE RIBEIRÃO SÃO PEDRO
· The cadastration of the farmers indicated a predominance of activities related to
agriculture and livestock raising, corn plantations, subsistence swine raising and sugar-
cane plantations. The main surface water users in the Microbasin are the Ouro Branco
xxviii
Aviculture and the AVIVAR slaughterhouse, as well as irrigation users. Municipal urban
supply is made with groundwater.
· The great majority of the urban population is served by a water supply system operated
by COPASA-MG, state agency responsible for water supply and sanitation systems in
the state of Minas Gerais. Daily per capta consumption is 190 liters per inhabitant. The
sewers system, consisting only of a collection network and interceptors, serves only
95.62% of the population. Garbage pick up and disposal serves the urban area and rural
communities and there is already a project for construction of a garbage recycling unit.
SOURCES OF WATER POLLUTION IN THE MICROBASIN
The point sources of pollution are represented by the sanitary sewers of São Sebastião do Oeste
and by effluents of the AVIVAR slaughterhouse, as well as from swine and chicken farms, small
distilleries and starch factories. The non-point sources are associated to agriculture, livestock
raising activities, erosive processes and runoff from vicinal roads in the region.
Source Points of Pollution
· São Sebastião do Oeste`s sanitary sewers are disposed in the S'ao Pedro creek, 500 m
from its confluence with the Ribeirão São Pedro. Its flow of 286 l/s has a mean BDO
concentration of 220 mg/l and 1.3x10⁶ coliforms/100 ml.
· The slaughterhouse produces 1,377 m3/day of effluents, with a 1,400 mg/l BDO. The
current treatment system is obsolete and a new unit, that according to project will
maintain effluents at 53 mg/l (BDO).
· Water consumption by livestock, equivalent to 8.4 l/s, is compatible with the Basin's
availability, representing 1.5% of the mean monthly flows (558 l/s). On the other hand,
the polluting loads produced by these activities are substantial and would exert strong
impacts on the water resources, if those were not renewed.
· Distilleries and starch factories also have a great polluting potential. However, they are
small and have been using simple environment control methods, introduced by Activity
2.2.A, that minimize the impacts. The animal feed factories in the Region, with
exception of the grease production in the slaughterhouse, do not present immediate risks
for the environment.
Nonpoint Sources of Pollution
· The non-point sources in the Microbasin are represented by green vegetable parcels,
agriculture, livestock raising, erosive processes and surface drainage of municipal roads,
all directly related to soil management and conservation practices.
· Local soil and topographic conditions contribute to erosive processes, such as those
identified at Baldo creek, in the Community of Guarita.
xxix
· The most critical soil and water conservation problems in the Microbasin are the use of
improper road maintenance and conservation techniques, lack of structures to mitigate
the impact of heavy rainfalls, the insufficient qualification of those in charge of the
conservation measures and the systematic clearing of natural woods.
· 91 critical points, in need of urgent attention, were identified in the municipal roads and
received the necessary repairs.
PERSPECTIVES OF WATER QUALITY
· The two campaigns (2000 and 2002) made evident the drop in the load of suspended
solids in the Microbasin's water courses, which could be an indicative of improvement
of water quality, after intervention of Activity 2.2.A. However, a drop in precipitation
was also verified, which results in less erosion and sediment transportation. Thus, the
reduction in solids content could be the result of lower surface runoff as much as the
retention of sediments in the micro-dams and contours.
· At headwaters, the rivers in the Microbasin are free of organic matter, whose
concentration starts to build up after São Sebastião do Oeste. This fact is related to the
disposal of sanitary sewers and industrial effluents, in a way that some quality indicators
approach the limits for the class of the water.
· Bacteriological indicators attest the accentuated sanitary compromise of the Ribeirão
São Pedro, downstream from São Sebastião do Oeste, with Escherichia Coli counting
superior to 24000 NMP/100 ml.
· The greatest impact on the Ribeirão's water quality is due to disposals of the AVIVAR
slaughterhouse, licensed by the COPAM. The liquid effluents' treatment system will
permit a substantial improvement in the current situation.
· The survey on water quality emphasized the importance of the protection provided by
vegetation on water quality, in the sub-basins with greater incidence of riparian woods.
· The conclusion presented here were based in only two surveys (2000 and 2002), which
does not constitute an adequate statistical base for the study. A longer series of data with
greater frequency would be recommendable. To bypass this handicap, a simulation of
the disposal of sewage from São Sebastião do Oeste and effluents from the
slaughterhouse in the Ribeirão was run. The simulation determined the river's
depurative capacity for receiving the raw sewage, in terms of organic matters, even
considering the minimal flows (BDO lower than 2.4 mg/l). However, this disposal
compromises the downstream use of the water, due to contamination by fecal coliforms.
· The set of studies and actions needed for improving water quality in the Microbasin
requires a better technical qualification of the CBH-Pará, in terms of water resources.
xxx
MITIGATING AND SOIL-WATER CONTROL PRACTICES
Soil Management and Mitigating Actions in the Agroindustry
· Activity 2.2.A introduced, by means of lectures, courses, workshops, field days and
demonstration units, a new vision of soil use, which was reason for many debates among
the farmers.
· The Activity built 290 micro-dams and 85 km of contours, besides promoting the
restoration of 241.5 km of vicinal roads and cleaning and maintenance of the dams.
· The importance of the micro-dams may be assessed by the volume of sediments
removed from them, after two years of their construction. A total of 593 m3 of sediments
was removed from 30 dams, what corresponded to an average of 20 m3 per unit. From
only one of them, 94 m3 of material were removed, indicating the proximity of a great
source of erosion, which should deserve attention.
Participation of the Municipal Government
· The participation of the Municipal Public Power, both for the financial support (R$
60,093.00 = US$21,366.00) and for the involvement of its employees, was fundamental
for the Project, as well as for the continuity and spreading of the soil conservation
actions.
· Support to the Acitivity's personnel, by the Prefecture, and participation of São
Sebastião do Oeste's Rural Development Municipal Council, of the Rural Community
Council and of the farmers were determinant factors for the success of the initiative.
Implementation Strategies
· Demonstration Units were a form of promoting innovative agricultural technologies in
the region. Carried out in visible places, to encourage the observation of their
implementation and the comparison with the less productive traditional practices, they
contributed to consolidate their assimilation by the community.
· The lack of financial resources by the farmers, for implementing the practices, attests the
need for consideration in the new projects for provision of credit for carrying out all the
scheduled stages.
Demonstration Unit 1
· The work done for the production of corn made clear that with the use of new
technologies greater productivities are to be expected (where two tons were produced by
hectare, productivity went up to 7 tons/ha, raising family income).
xxxi
Consolidation of Results
· Changing human behavior is a slow and difficult process, which may effectively succeed
only with the involvement and commitment of the community.
· Activity 2.2.A succeeded in impregnating an innovatory spirit in the communities,
combining all forces towards the achievement of common objectives.
COMMUNITY MOBILIZATION AND PARTICIPATION
Mobilization and Participation Strategies
· In the first stage, state and municipal public employees with interest in the Project's
activities were identified. The main actions to be executed were discussed, along with
the subjects of the courses, lectures, workshops and field days, as well as the respective
schedules. It was agreed that it a greater involvement of the Municipality's schools and
participation of the students would be necessary.
· In the mobilization process, it is fundamental the participation of all segments of the
society. The first group was formed by representatives of EMATER/MG, of the
Divinópolis' Agriculture and Livestock Raising Cooperative, of the Rural Workers
Syndicate, of the Prefecture, of COPASA, CODEMA and of the Rural Development
Municipal Council.
· For mobilizing the farmers and the rural communities, it is important to begin the
contacts with community leaders, Church ministers, politicians, school janitors, nurses,
the priest, the milk-man, besides the Mayor himself, viewing a dissemination of the
work to be done.
· The importance of each one's involvement was emphasized and made clear that success
was upon the participation of all participants. After developing an expectation, the
Project was launched in a meeting vastly advertised.
· Activity 2.2.A promoted the integration of persons in each community, the creation of
new associations and the strengthening of existing ones. During implementation of the
activities, the Rural Development Municipal Council was created, as well as the Rural
Community Councils of Teixeira and Castro/Pires, in addition to the strengthening of the
Guarita's.
Formation of Instructors and Multipliers
· One of the fronts for disseminating the process of society's awareness building towards
the preservation of the Municipality's ecosystem was the school, where the teachers
picked the "Garbage" theme to work with the students. At all, there were 4 preparatory
meetings, 8 teachers' trainings and 12 meetings with the students. The woks achieved
the objectives, promoting students' involvement in activities related to the garbage
reduction, reuse and recycling, building a conscience on the topic.
xxxii
The 36 Courses and Lectures
· As environmental events, Activity 2.2.A put up the Launching Meeting, 6 Presentation
Meetings in rural communities, 36 courses/lectures, 6 in each one of the communities,
12 field days, 4 Workshops (two in 2000 and two in 2002), besides 6 Partnership and
Integration Meetings.
Partnership and Integration Meetings
· Partnerships were also encouraged, so that farmers could jointly purchase agricultural
implements, request soil analyses and raise chicken. By associating to acquire milk
cooling tanks for the group, dairy producers were able to sell their milk with substantial
gains. Previously, sales price by individual producers was R$0.21 (US$0.07), per liter,
what went up to R$0.43 (US$0.15) per liter, for the group sales. Similarly, in the
purchases of calcarium the cost dropped from R$15.00 (US$5.00) to R$7.80 (US$3.00),
per ton.
FINAL SUMMARY
· The mobilization achieved with the works and the involvement/interest of the rural
community for the implemented activities are aspects that attest the success of the
activity 2.2.A, always focused on Public Participation, Sustainability and
Replicability.
· Public participation was the basic principle used in the work, aiming at the
improvement of environmental quality. It has been shown that the success of this
participation depends on the definition and implementation of a mobilization strategy for
the community, public agencies, community leaders and for the diverse segments of the
society, at all stages of the work.
· The strategy must involve conscience development and dissemination of the knowledge,
through workshops, technical lectures, course for instructors and students and field
work. Its practical application must be emphasized with the establishment of
demonstration units. Cadastration of rural properties and of the respective uses of soil
and water must be carried out in a way that the results are also made public.
· Regarding the strategy, it was also important the promotion of partnerships among
farmers (associative actions), which led to economic profits, social integration and
execution of environmental conservation actions.
· The Sustainability of Activity 2.2.A may be measured by achieved results, the
involvement and interest of the community in the implemented actions. The participants
became aware that the sustainable use of soil and water is each one's responsibility, not
only of the Government. The farmers assimilated information and started to adopt
xxxiii
conservation practices in their properties, sure to be protecting their land and obtaining
gains in productivity.
· The participants could verify in the field the improvements achieved and started to
spread the results, bringing out the interest of neighbor communities. In view of this, the
latter have been requesting assistance for the implementation of similar projects in their
microbasins. If this weren't enough, COPASA-MG itself was interested in the
implemented work and intends to sign a contract with the CBH-Pará, for developing
studies alike in two other microbasins. This fact attests the multiplying effect of well
succeeded activities which will contribute to improvement of water quality in the São
Francisco River Basin.
· The positive results of Activity 2.2.A show the efficacy of this kind of action in
microbasins, where integration among society segments is more efficient than in great
areas, where direct contact with all the involved community is more difficult. It is an
educational and awareness development process that requires active participation of the
whole community, with the display of the efficacy of the implemented actions. This is
the Project's replication model for other Regions.
· It consists of a simple methodology, applicable to any region, depending basically on the
team's capacity to do the work and build up the interest in the expected objectives.
Emphasis should be put in the initial appealing issues, such as water availability, in
adequate quantity and quality to meet the demands, productivity boost and maintenance
of vicinal roads, to allow traffic and transportation of the production.
· It should be emphasized that effectively developing an environmental awareness in the
population requires a medium term work. Results from implemented actions will not be
noticeable before a certain period, what requires the continuity of the activities and of
the farmers' support, for implementation of the actions in their properties. As many do
not have funds for this, it is important to maintain the technical and financial support, for
that purpose.
· Implementation of the Law 9,433/97 and of its instruments, besides the support for the
creation of new Basin Committees, have inspired the community's involvement in the
water resources issues. In the rural zone, this concern is reflected in the availability of
water, with satisfactory quantity and quality to attend the multiple uses. In many cases,
that worry is related to how the instruments of the National Water Resources Policy
regarding water rights and billing will be implemented. For the small users, it is
particularly important the definition of what is considered insignificant use.
· Given the growing pressure put on the operating Basin Committees', as it is the case
with the CBH-Pará, it is important that these questions are taken into account, in a
technical way, in the studies and surveys. For this reason, this matter should be included
in the proposed objectives of the Works.
xxxiv
7. RECOMMMENDATIONS
7.1 GENERAL
RECOMMENDATION
Activity 2.2.A is presented as an embryo from which positives results have already accrued, but
with a sustainability yet to be consolidated. This consolidation must be accomplished both in the
Ribeirão São Pedro Microbasin, with the continuity of the works, and in the adjacent basins, with
the replication of the actions. Among those that already expressed such interest are the
Empanturrado River (Municipality of Carmo do Cajurú) and two sections of the Lambari River
(in the Municipalities of Pedra do Indaiá and Santo Antonio do Monte).
Thus, the proposal for continuity is presented in a 4-module Project, one for each Microbasin in
the four Municipalities shown in Figure 8. Clearly, with the experience acquired in Activity
2.2.A, new techniques and methods were added, viewing a more effective detailing of the topics
to be covered, as recommended in previous reports.
It is the case, for example, of the cadastration of rural properties, which should cover more details
regarding the quantification of the areas used for agricultural or livestock raising purposes, as
well as the different uses of the water, in quantity and quality, indicating the seasonal variations.
Figure 8. Sites referred to in the recommendations (Municipalities of Carmo do Cajuru,
Pedra do Indaiá, Santo Antonio do Monte and São Sebastião do Oeste).
xxxv
7.2 SPECIFIC
RECOMMENDATIONS
MODULE 1: To be implemented in the Empanturrado River Basin, in Carmo do Cajuru, with
estimated 142.4 km² drainage area, in 24 months, at a total cost of US$319,000.
This module includes activities which will be carried out in other modules.
Chart 9. Recommended actions for Module 1
Product Actions
US$
1.
Economic, social and environmental diagnosis of the Microbasin.
3,000.00
2.
Cadastration of users / survey of water demands / concession of water
rights 20,000.00
3.
Implementing two Demonstration Units in Rational Use of Water:
One in the nursery of native species (annual production capacity 300
thousand seedlings) and other in green vegetables production area.
The first one will benefit the other modules as well.
11,000.00
4.
Implementing two Demonstration Units in Soil Conservation and
Management, in productive areas, with techniques focused on the
rational use of water.
4,000.00
5.
Executing 20 technical courses/lectures, in the four Communities,
covering the following topics:
· The Basin and Sustainable Development;
· Soil Conservation Practices;
· Soil and Water Management aimed at Sustainable
development;
· Appropriate Use of Agrochemicals;
· Alternate Incomes for Family Agriculture.
8,000.00
6.
Carrying out a hydrometeorological investigation in the Empanturrado
River Basin, determining its climatological, pluviometric and
fluviometric characteristics.
20,000.00
7.
Carrying on an Environment Workshop, at the municipality's seat.
2,000.00
8.
Putting on three workshops for the presentation and evaluation of the
results from Demonstration Units, from the survey on the water
demands and of the concession of rights.
6,000.00
9.
Buying a tractor and implements for making terraces and applying
techniques of soil and water conservation (common for the four
modules). 46,000.00
10.
Building a nursery of native species, with technical assistance of the
IEF, with production capacity for 300 thousand seedlings (for the four
modules). 4,000.00
xxxvi
11.
Carrying on six presentation meetings to discuss the actions to be
implemented and to mobilize the rural communities.
2,500.00
12.
Creating a georeferenced databank (ArcView), containing information
on dams, barriers, reservoirs, lagoons, catchments, associated
agricultural activities and other water uses, promoting the respective
mapping. 7,000.00
13.
Promoting a Launching Meeting for the Project.
1,500.00
14.
Fencing and protecting 50 springs in the Microbasin.
7,000.00
15.
Contracting a water quality expert as consultant.
10,000.00
16.
Restoring 250 km of municipal roads, promoting their conservation
with the construction of micro-dams, contours (terraces) and side
structures. 35,000.00
17.
Building 200 micro-dams, in 110 critical sites, and constructing 50 km
of contours (terraces).
19,000.00
18.
Contracting three trainees, for field surveys, and one agriculture
technician, for the seedling production nursery.
14,000.00
19.
Reclamation of 80 degraded areas in the Microbasin, through the
planting of native species around springs, hill crests and permanent
protection areas.
9,500.00
20.
Contracting an agriculture technician for working in the nursery.
3,500.00
21.
Carrying on six partnership and integration meetings, viewing the
sustainability of the agricultural production.
6,000.00
22.
Contracting a consultant to coordinate the Project.
36,000.00
23.
Characterizing the condition and evolution of water quality in
microbasin, through the implementation of a sampling network,
composed of 12 points distributed in the main water courses.
44,000.00
TOTAL 319,000.00
xxxvii
MÓDULO 2: To be implemented in the Upper Lambari River, in the Communities of Paivas,
Sapecado, Olhos D`Água and Barreiro, in the Municipality of Pedra do Indaiá,
with an estimated 76 km2 area, to be executed in 24 months, at a total cost of US$
241,000.00.
Chart 10.
Recommended Actions for Module 2
Product Actions
US$
1.
Economic, social and environmental diagnosis of the Microbasin.
3,000.00
2.
Cadastration of users / survey of water demands / concession of water
rights 20,000.00
3.
Implementing two Demonstration Units in Rational Use of Water:
One in the nursery of native species (annual production capacity 300
thousand seedlings) and other in green vegetables production area.
The first one will benefit the other modules as well.
4.
Implementing two Demonstration Units in Soil Conservation and
Management, in productive areas, with techniques focused on the
rational use of water.
15,000.00
5.
Executing 20 technical courses/lectures, in the four Communities,
covering the following topics:
· The Basin and Sustainable Development;
· Soil Conservation Practices;
· Soil and Water Management aimed at Sustainable
development;
· Appropriate Use of Agrochemicals;
· Alternate Incomes for Family Agriculture.
10,500.00
6.
Carrying out a hydrometeorological investigation in the Lambari
River Basin, determining its climatological, pluviometric and
fluviometric characteristics.
20,000.00
7.
Carrying on two practical trainings in operation of agricultural
implements, in an Environment Workshop, at the Municipality's seat.
4,000.00
8.
Putting on three workshops for the presentation and evaluation of the
results from Demonstration Units, from the survey on the water
demands and of the concession of rights.
4,000.00
9.
Buying a tractor and implements for making terraces and applying
techniques of soil and water conservation (common for the four
modules).
10.
Building a nursery of native species, with technical assistance of the
IEF, with production capacity for 300 thousand seedlings (for the four
modules).
xxxviii
11.
Carrying on three presentation meetings to discuss the actions to be
implemented and to mobilize the rural communities.
1,200.00
12.
Creating a georeferenced databank (ArcView), containing
information on dams, barriers, reservoirs, lagoons, catchments,
associated agricultural activities and other water uses, promoting the
respective mapping.
3,000.00
13.
Promoting a Launching Meeting for the Project.
1,500.00
14.
Fencing and protecting 50 springs in the Microbasin.
12,000.00
15.
Contracting a water quality expert as consultant.
10,000.00
16.
Restoring 50 km of municipal roads, promoting their conservation
with the construction of micro-dams, contours (terraces) and side
structures, with technical assistance.
14,800.00
17.
Constructing and maintaining 370 micro-dams (at 110 critical sites)
and building 65 km of contours (terraces).
30,000.00
18.
Contracting three trainees, for field surveys.
10,500.00
19.
Reclamation of 30 degraded areas in the Microbasin, through the
planting of native species around springs, hill crests and permanent
protection areas.
4,500.00
20.
Contracting an agriculture technician for working in the nursery.
21.
Carrying on six partnership and integration meetings, viewing the
sustainability of the agricultural production.
6,000.00
22.
Contracting a consultant to coordinate the Project.
36,000.00
23.
Characterizing the condition and evolution of water quality in
microbasin, through the implementation of a sampling network,
composed of 12 points distributed in its main streams
44,000.00
24.
Promoting partnership meetings.
10,000.00
TOTAL 260,000.00
xxxix
MÓDULO 3: To be implemented in reaches of the Lambari River, in the tributaries for Public
Water Supply at the Upper Guandu Creek and at the Middle Lambari, in the
Batatal Region (Municipality of Santo Antonio do Monte), with an estimated 107
km² drainage area, for execution in 24 months, at a total cost of US$ 206,500.00.
Chart 11.
Recommended Actions for Module 3.
Product Actions
US$
1.
Economic, social and environmental diagnosis of the Microbasin.
5,000.00
2.
Cadastration of users / survey of water demands / concession of water
rights. 25,000.00
3.
Implementing a Demonstration Unit in Rational Use of Water, in a
green vegetables production area.
5,500.00
4.
Implementing two Demonstration Units in Soil Conservation and
Management, in productive areas, with techniques focused on the
rational use of water.
8,000.00
5.
Executing 20 technical courses/lectures, in the four Communities,
covering the following topics:
· The Basin and Sustainable Development;
· Soil Conservation Practices;
· Soil and Water Management aimed at Sustainable
development;
· Appropriate Use of Agrochemicals;
· Alternate Incomes for Family Agriculture.
8,000.00
6.
Carrying out a hydrometeorological investigation in the Lambari
River Basin, determining its climatological, pluviometric and
fluviometric characteristics.
20,000.00
7.
Carrying on an Environment Workshop, at the Municipality's seat.
2,000.00
8.
Putting on two workshops for the presentation and evaluation of the
results from Demonstration Units, from the survey on the water
demands and of the concession of rights.
4,000.00
9.
Buying a tractor and implements for making terraces and applying
techniques of soil and water conservation (common for the four
modules).
10.
Building a nursery of native species, with technical assistance of the
IEF, with production capacity for 300 thousand seedlings (for the four
modules).
11.
Carrying on three presentation meetings to discuss the actions to be
implemented and to mobilize the rural communities.
1,600.00
xl
12.
Creating a georeferenced databank (ArcView), containing
information on dams, barriers, reservoirs, lagoons, catchments,
associated agricultural activities and other water uses, promoting the
respective mapping.
3,000.00
13.
Promoting a Launching Meeting for the Project.
1,500.00
14.
Fencing and protecting 20 springs in the Microbasin.
2,800.00
15.
Contracting a water quality expert as consultant.
10,000.00
16.
Restoring 50 km of municipal roads, promoting their conservation
with the construction of micro-dams, contours and side structures,
with the proper technical assistance.
13,000.00
17.
Constructing and maintaining 150 micro-dams, in 110 critical points,
and building 30 km of contours.
13,000.00
18.
Contracting three trainees, for field surveys, and one agriculture
technician, for the seedlings` nursery.
7,500.00
19.
Reclamation of 30 degraded areas in the Microbasin, through the
planting of native species around springs, hill crests and permanent
protection areas.
3,600.00
20.
Contracting an agriculture technician for working in the nursery.
21.
Carrying on three partnership and integration meetings, viewing the
sustainability of the agricultural production.
3,000.00
22.
Contracting a consultant to coordinate the Project.
36,000.00
23.
Characterizing the condition and evolution of water quality in
microbasin, through the implementation of a sampling network,
composed of 12 points distributed in its main water courses.
34,000.00
TOTAL 206,500.00
xli
MODULE 4: To be implemented in the microbasin of the Ribeirão São Pedro, in São
Sebastião do Oeste, in a 204 km² area, in a 24 month period, at a total cost of
US$ 220,500.00.
Chart 12.
Recommended Actions for Module 4.
Product Actions
US$
1.
Economic, social and environmental diagnosis of the Microbasin.
3,000.00
2.
Cadastration of users / survey of water demands / concession of water
rights. 10,000.00
3.
Implementing a Demonstration Unit in Rational Use of Water, in a
green vegetables production area.
5,500.00
4.
Implementing two Demonstration Units in Soil Conservation and
Management, in productive areas, with techniques focused on the
rational use of water.
8,000.00
5.
Executing 20 technical courses/lectures, in the four Communities,
covering the following topics:
· The Basin and Sustainable Development;
· Soil Conservation Practices;
· Soil and Water Management aimed at Sustainable
development;
· Appropriate Use of Agrochemicals;
· Alternate Incomes for Family Agriculture.
8,000.00
6.
Carrying out a hydrometeorological investigation in the Ribeirão São
Pedro Microbasin, determining its climatological, pluviometric and
fluviometric characteristics.
20,000.00
7.
Carrying on two Environment Workshops, at the Municipality's seat.
4,000.00
8.
Putting on two workshops for the presentation and evaluation of the
results from Demonstration Units, from the survey on the water
demands and of the concession of rights.
4,000.00
9.
Buying a tractor and implements for making terraces and applying
techniques of soil and water conservation (common for the four
modules).
10.
Building a nursery of native species, with technical assistance of the
IEF, with production capacity for 300 thousand seedlings (for the four
modules).
11.
Carrying on six presentation meetings to discuss the actions to be
implemented and to mobilize the rural communities.
3,000.00
12.
Creating a georeferenced databank (ArcView), containing 7,000.00
xlii
information on dams, barriers, reservoirs, lagoons, catchments,
associated agricultural activities and other water uses, promoting the
respective mapping.
13.
Promoting a Launching Meeting for the Project.
1,500.00
14.
Fencing and protecting 50 springs in the Ribeirão São Pedro
Microbasin. 7,000.00
15.
Contracting a water quality expert as consultant.
10,000.00
16.
Constructing and maintaining 490 micro-dams, in 200 critical points,
and building 135 km of contours.
35,500.00
17.
Contracting three trainees, for field surveys, and an agriculture
technician, for the seedlings` nursery.
7,500.00
18.
Reclamation of 50 degraded areas in the Microbasin, through the
planting of native species around springs, hill crests and permanent
protection areas.
9,500.00
19.
Contracting an agriculture technician for working in the nursery.
20.
Carrying on six partnership and integration meetings, viewing the
sustainability of the agricultural production.
6,000.00
21.
Contracting a consultant to coordinate the Project.
36,000.00
22.
Characterizing the condition and evolution of water quality in
microbasin, through the implementation of a sampling network of 12
points distributed along the main streams.
35,000.00
TOTAL 220,500.00
xliii