

INTEGRATED MANAGEMENT OF LANDBASED ACTIVITIES
IN THE S√O FRANCISCO BASIN PROJECT
ANA/GEF/UNEP/OAS
Subproject 4.3 - Quantification and Assesment of the Efficiency of Water
Usage by Agriculture in the S„o Francisco River Basin
Executive Summary of the Final Report
QUANTIFICATION AND ASSESSMENT OF THE
EFFICIENCY OF WATER USAGE BY AGRICULTURE IN
THE S√O FRANCISCO RIVER BASIN
UNIVERSIDADE FEDERAL DE VI«OSA
Departamento de Engenharia AgrÌcola
ViÁosa ≠ MG
INTEGRATED MANAGEMENT OF LANDBASED
ACTIVITIES IN THE S√O FRANCISCO BASIN PROJECT
ANA/GEF/UNEP/OAS
Subproject 4.3 - Quantification and Assesment of the Efficiency of Water
Usage by Agriculture in the S„o Francisco River Basin
Executive Summary of the Final Report
QUANTIFICATION AND ASSESSMENT OF THE
EFFICIENCY OF WATER USAGE BY AGRICULTURE IN
THE S√O FRANCISCO RIVER BASIN
Technical Coordination
Coordenador: M·rcio Mota Ramos
Coordenador Adjunto: Fernando Falco Pruski
Suely de F·tima Ramos Silveira - UFV
Demetrius David da Silva - UFV
Lineu Neiva Rodrigues ≠ OEA
Consultants
Wallisson da Silva Freitas
SÈrgio Oswaldo de Carvalho Avellar
Alessandro de Freitas Teixeira
Gessionei da Silva Santana
Rafael de Almeida Ribeiro
Nori Paulo Griebeler
January 2003
QUANTIFICATION AND ASSESSMENT OF THE EFFICIENCY
OF WATER USAGE BY AGRICULTURE IN THE
S√O FRANCISCO RIVER BASIN
EXECUTIVE SUMMARY
INTRODUCTION
In the elaboration of the "Integrated Management of Land Based Activities in the S„o Francisco
River Basin Project - GEF/ANA/OAS/UNEP, also known as the GEF S„o Francisco Project,
irrigation was identified as responsible for the consumption of approximately 70% of the water
diverted from the S„o Francisco, which could be affecting the availability of the resource.
Even though the irrigated area in the Basin is still small, corresponding to less than 10% of the
irrigable area, they are concentrated in regional poles. Besides this, there are evidences that
irrigated agriculture in the Basin presents a really low efficiency. These facts led to the inclusion
of Activity 4.3 (Quantification and Assessment of the Efficiency of Water Usage by Agriculture
in the S„o Francisco River Basin) in the S„o Francisco Project.
The Activity was implemented with donation funds provided by the Global Environmental
Facility ≠ GEF and was implemented by the United Nations Programme for the Environment ≠
UNEP. The international executive agency was the General Secretariat of the Organization of
American States ≠ OAS and the original national executor was the Water Resource Secretariat of
the Ministry of the Environment ≠ SRH / MMA, until May of 2001, when the responsibility was
transferred to the National Water Agency ≠ ANA.
The Federal University of ViÁosa (UFV), through its Agricultural Engineering Department, was
responsible for the coordination of the Activity, whose objectives were quantifying the
availability of water in the Basin, characterizing the use of water by agriculture and assessing
irrigation efficiency. The fulfilling of these objectives will provide subsidies for the optimization
of the use of the water resources and, consequently, augmentation of the availability.
Thus, the work is subdivided into chapters corresponding to a description of the Basin's general
characteristics, to an analysis of its hydrologic regime and to the use of water by irrigation.
1. GENERAL CHARACTERISTICS OF THE S√O FRANCISCO BASIN
The S„o Francisco Basin (Figure 1) is located between the 7∫ and 21∫ S latitudes and the 35∫ and
47∫40' W longitudes, spreading over the States of Minas Gerais, Bahia, Goi·s, Pernambuco,
Sergipe and Alagoas, besides the federal District. From its origin, in the Sierra da Canastra, to its
mouth in the Atlantic Ocean, the River travels around 2,700 km, draining a 639,219 km2 area, in
which there are 503 Municipalities, with a 1999 population of 15,545,866 inhabitants
(CODEVASF, 2002b).
The Basin is traditionally divided into four sub regions: the Upper S„o Francisco (from its origin
to the City of Pirapora); the Middle S„o Francisco (from Pirapora to the City of Remanso); the
i
Middle-Lower S„o Francisco (from Remanso to Paulo Afonso) and the Lower S„o Francisco
(from there to its mouth).
Figure 1. S„o Francisco Basin (from http://www.sfrancisco.bio.br/mapbacia.htm)
ii
In the mouth of the River, the long term mean discharge is presented in the literature with values
varying from 2,850 (ANA, 2002b) to 3,360 m3/s (ANA, 2002a; ANEEL, 2002a). The tributaries
with permanent flows originate, predominantly, in the cerrados of Minas Gerais (Upper and
Middle S„o Francisco) and in the Western part of Bahia, thanks to the higher precipitation depths
in the Region and to the great permeability and thickness of the local soils. Around 85% of the
water in the River is originated in the cerrados and 72% comes from the State of Minas Gerais.
Water demands for the various uses in the basin are around 224 m≥/s. From this total, 28 m≥/s
(12.5%) are for urban supply, 160 m≥/s (71.4%) for irrigation, 7 m≥/s (3.1%) for animal
consumption and 29 m≥/s (13%) for industrial purposes (ANA, 2002b).
The S„o Francisco, with annual potential water storage of 64.4 billion m3 (2,042 m3/s), is
responsible for 69% of the total surface reserves and 73% of the firm availability in Northeastern
Brazil. The surface storage capacity in the Northeast is 85.1 billion, with 50.9 billion stored
within the Basin, in the reservoirs of Sobradinho (34.1 billion), Itaparica (11.8 billion), XingÛ
(3.8 billion) and MoxotÛ (1.2 billion). TrÍs Marias, outside of the Northeast, but within the S„o
Francisco Basin, stores additional 19.3 billion m3 (CODEVASF, 2002b).
Until the end of 2000, the Company for the Development of the S„o Francisco and ParnaÌba
Rivers (CODEVASF) had already built 270 dams with a total storage capacity of 1.4 billion m3.
According to the Brazilian Hydroelectric Power Information System, of the Brazilian
Hydropower Systems and Electrical Plants Planning Coordination Group, the S„o Francisco
Basin has a potential power generation in the order of 26,346 MW. Until November of 1997,
9,290 MW were already installed and operating, what persists until now. At the time, plants with
1,000 MW capacity were under construction.
The S„o Francisco Basin, with 64 million hectares, has 25.6 million hectares (40%) of
agriculturable land. In the Upper and Middle S„o Francisco, where rainfalls are more abundant
and regular, rainfed agriculture predominates. In the Middle-Lower, the activity is limited, as the
area rests on the Semi-Arid Region. The downstream part of the Middle is also within the semi-
Arid, being subject to the same restrictions (Vale do S„o Francisco, 2002c). Of the agriculturable
land, 3 million hectares are irrigable, but only 300.000 hectares (10%) are presently being
irrigated (Vale do S„o Francisco, 2002b).
According to Lima and Miranda (2001), from 1970 to 1990, irrigated area in the S„o Francisco
presented a 286% growth, which corresponds to 8,620 ha/year, while the economic development
growth was 266%. Only in the 1980-1990 period, irrigated area in the Basin reached 61%.
Governmental involvement in the S„o Francisco Basin is significant, being represented mostly by
CODEVASF, whose basic mission is to promote regional development, through irrigated
agriculture. The major part of the Basin presents ideal climatic conditions for irrigation,
combining elevated temperatures and sunlight with relatively low humidity. Nevertheless, water
deficit is high, given the small amount of precipitation and irregular distribution of rainfalls.
The Region has a great diversity of climates, going from humid, in the Southern and Western
parts, to semi-arid, in the Juazeiro/Petrolina area. Annual mean precipitation depths vary from
400 to 1,600 mm.
iii
From 1970 to 2000, irrigated areas in the Semi-Arid underwent significant changes, particularly
with respect to the used crops. Irrigation projects in the Basin, both public and private, still lack
adequate planning and, even after their implementation, they have not been subject to a proper
management.
The water resources sustainability indexes estimated by studies under way area cause of concern,
with respect to the availability of water for multiple uses. Some areas, such as Northern Minas
Gerais, Rio Verde Grande Basin and the Salitre River Basin, in the State of Bahia, are already
considered critical, regarding the demand/availability ratio.
According to CODEVASF (2002c), in 1994, the multipurpose demands in the Basin were 9.1
billion cubic meters: 6.4 billion (70.3%) corresponding to ecologic demand (non-consumptive)
and 2.7 billion (29.7%) to consumptive uses.
Even though the S„o Francisco Basin has presented a significant growth in agricultural activities,
the results were not immediate for the regional economy. That was due to a decentralized
commercialization of the products, still with inadequate quality and standards, and to the lack of
air transportation to allow the conveyance to the distribution and consumption centers.
Today, regional centers such as Juazeiro-Petrolina, Pirapora, Jana˙ba-JaÌba, and Barreiras, have
stood out both in the production and commercialization of their products, and the installation of
agroindustries has resulted in added value to the products, in the own Region. Some of these
centers are more noticeable in the Basin, due to their geographical location, existing
infrastructure and also by their level of production.
Chart 1 presents water demands in the S„o Francisco Basin and indicates that irrigation is
responsible for 74.1% of the consumptive use.
The present development of the S„o Francisco Basin is, in part, due to the implementation of
public and private irrigation projects, which changed and continue to change the regional
economy. This change, however, occurred in a relatively short period, for approximately 20
years, which was not enough to allow immediate learning and adoption of adequate irrigation
management techniques, nor of preventive and corrective maintenance of the equipment.
Chart 1. Water demands in the S„o Francisco Basin, by type and use, in 1994.
Water demands in the Basin
Type of use
Annual demand (106 m3)
% of total demand
% of use
Non-consumptive use
6.4
70.3
100.0
Ecological purposes
6.4
70.3
100.0
Consumptive use
2.7
29.7
100.0
Irrigation
2.0
22.0
74.1
Urban supply
0.3
3.3
11.1
Agroindustrial uses
0.1
1.1
3.7
Livestock raising
0.2
2.2
7.4
Industrial uses
0.1
1.1
3.7
Use in rural areas
0.0
0.0
0.0
Total
9.1
100.0
-
[source: ¡ridas (2002)]
iv
Inefficient and inadequate irrigation implies in waste of water and energy, finite resources scarcer
by the day, what points to the importance of assessing the efficiency of practices adopted in the
Basin.
2.
EVALUATION OF THE HYDROLOGIC REGIME IN THE BASIN
In the evaluation of the hydrologic regime in the S„o Francisco Basin, consisted data from 336
pluviometric stations and 283 fluviometric stations, belonging to the hydrometeorologic network
of the Brazilian National Water Agency (ANA) and National Electrical Energy Agency
(ANEEL), were analyzed. All information was obtained from the Superintendence of Studies and
Hydrologic Information da ANEEL.
The criteria used for selecting the stations included a 10-year minimum non-interrupted operating
time . The 1950-1999 period was used as basis for the study. In this manner, 178 pluviometric
and 77 fluviometric stations were effectively used for the investigation.
The evaluation was carried out in the following stages:
∑ Filling gaps and extending the series.
∑ Estimates of mean precipitation depths in the contributing drainage area for each
fluviometric station.
∑ Estimates of the 7-day minimum flows.
∑ Estimate of maximum annual flows.
∑ Estimate of the discharge coefficient (ratio between volume of water flowing through
the considered section and total precipitated volume).
∑ Obtaining the flow-duration curve.
∑ Estimates of the absolute and relative variations and the significance of the variation in
the hydrologic variables during the considered period.
Given the volume of estimates necessary for the investigation, an specific software was
developed to help in the analysis. The software was divided into three modules: Flow,
Precipitation and Flow versus Precipitation.
2.1 SPATIAL VARIABILITY OF THE MAIN HYDROLOGIC VARIABLES
CONSIDERED
Figure 2 shows a map of isohyets for mean annual precipitations in the 1950-1999 period. It is
noticed that precipitation at headwaters reaches values higher than 1,700 mm, with decreasing
values towards the River's mouth, until the proximity of border of the Middle-Lower and the
Lower S„o Francisco. From there on, there is an evident increase in precipitation depths.
The minimal precipitation in the basin occurs in the Middle-Lower S„o Francisco, where annual
means are lower than 450 mm. Mean annual precipitations vary from 1,000 to 1,750 mm in the
Upper S„o Francisco, from 550 to 1,750 in the Middle, from 400 to 550 in the Middle-Lower and
from 400 to 1,300 in the Lower.
v
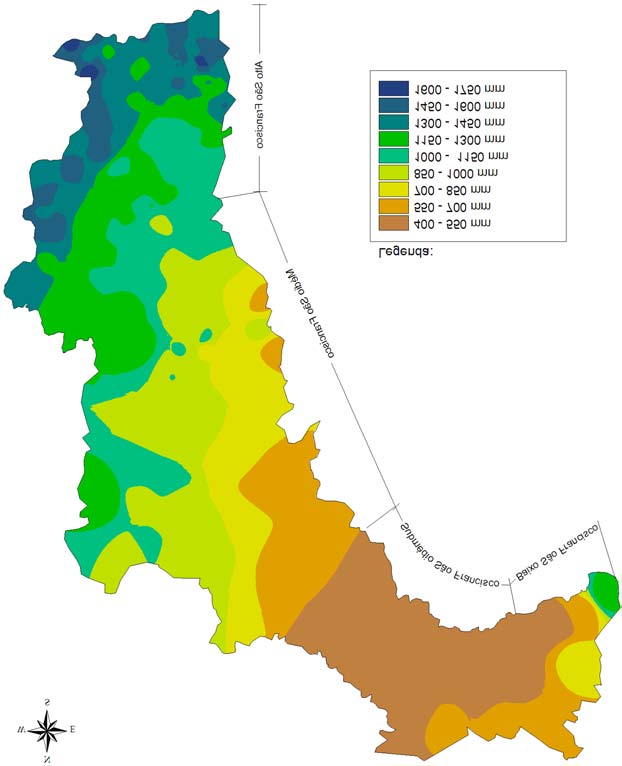
Figure 2. Mean annual precipitation (isohyets) in the S„o Francisco Basin.
Figure 3 presents the distribution of the mean long-duration flows in River, emphasizing that
flows in the main course are less than 1,000 m≥/s in the Upper S„o Francisco, between 1,000 and
2,700 in the Middle and between 2,000 and 2,700 in the Middle-Lower and Lower stretches. The
mean long-duration flows at all stations in the S„o Francisco tributaries are less than 1.000 m3/s.
Chart 2 presents, for the 77 fluviometric stations under analysis, the mean precipitation depths
and the long-duration mean specific discharges. Mean precipitation varies from 1,506 mm (Porto
do Passarinho) to 847 mm (Boca da Caatinga). There is also great variation in long-duration
mean specific discharges with values ranging from 28.19 l/s/km2, in Vargem Bonita, to 1.07
l/s/km2, in Boca da Caatinga.
With respect to stations located at tributaries of the S„o Francisco, lower mean precipitations
depths and specific discharges were verified in Sub-Basins closer to headwaters, compared to
those closer to the mouth of the River. Sub-Basin 40 presents a mean precipitation of 1,386 mm
and an specific discharge of 17.25 l/s/km2, compared to 1,040 mm and 5.52 l/s/km2, respectively,
in Sub-Basin 46. The only exception to this rule is Sub-Basin 44.
vi
Figure 3. Distribution of long-duration discharges in the S„o Francisco Basin.
Chart 2. Drainage area, mean precipitation and mean long-duration specific discharge, for
the 77 stations under analysis (1950-1999).
ANEEL Sub-
Drainage area Mean Precipitation
Mean long-duration specific
Station
code
Basin
(km2)
(mm)
discharge (l/s/km2)
Station sub-basin
Station sub-basin
Vargem Bonita
40025000
299
1,420
28.19
TapiraÌ 40060000
543
1,430
22,23
Carmo do Cajuru
40150000
2,402
1,387
15.67
Jaguaruna 40300000 1,545
1,367
12.85
Velho da Taipa
40330000
7,350
1,399
13.42
EstaÁ„o ¡lvaro da
Silveira 40400000
1,803
1,422
14.13
S„o Br·s do SacuÌ-
40
1,386
17.25
Montante
40549998 446
1,362
16.93
Entre Rios de Minas
40680000
469
1,367
18.53
Belo Vale
40710000
2,690
1,362
17.79
Alberto Flores
40740000
3,945
1,355
15.34
Ponte Nova do Paraopeba 40800001
5,680
1,357
14.65
Ponte da Taquara
40850000
8,720
1,358
14.40
Barra do Funchal
40930000
881 1,428
20.16
vii
Iguatama *
40050000
4,846
1,415
22.61
Ponte do Chumbo*
40070000
9,255
1,365
18.86
40
1,388
18,63
Porto das Andorinhas*
40100000
13,087
1,384
16.37
Porto da Barra *
40102000
14,370 1,386
16.66
Major Porto
41050000
1,396
1,482
13.66
Porto do Passarinho
41075001
4,330
1,506
15.62
Ponte Raul Soares
41340000
4,780
1,347
16.06
Pirapama 41600000 7,838
1,319
13.12
41
1,345
14.00
Ponte do LicÌnio
41650000
10,980
1,292
11.89
Presidente Juscelino
41780000
3,912
1,333
18.47
Santo HipÛlito
41818000 16,528
1,277
12.21
V·rzea da Palma 41990000
25,940 1,206
10.93
Pirapora-Barreiro *
41135000
41
61,980
1,349
1,349
13.68
13.68
Porto AlianÁa
42090000
4,374
1,034
Santa Rosa
42395000
12,880
1,336
42
1,236
Porto da Extrema
42690001
29,060
1,279
Porto Alegre
42980000
40,300 1,293
Montante Barra do
JequitaÌ *
42030000 90,
42
990
1,305
1,288
12.03 11.64
Cachoeira da Manteiga *
42210000
107,250 1,271
11.24
Arinos 43430000
11,710
1,295
12.26
Vila Urucuia
43670000
18,600
1,266
11.33
Fazenda ConceiÁ„o
43675000
43
2,200
1,162
1,236
14.40
11.83
Santo In·cio
43880000
23,765
1,227
10.77
Barra do Escuro
43980000
24,658 1,228
10.37
S„o Rom„o *
43200000
43
154,100
1,271
1,271
10.62
10.62
Usina do Pandeiros
44250000
3,812
1,168
6.54
44
1,008
3.81
Boca da Caatinga
44950000
30,474 847
1.07
S„o Francisco *
44200000
182,537
1,262
11.04
Pedras de Maria da Cruz * 44290002
44
191,063
1,250
1,250
10.71
10.54
Manga *
44500000
202,400 1,237
9.88
S„o GonÁalo
45131000
6,186
1,229
11.20
Fazenda Porto Alegre
45170000
5,730
1,151
10.94
Lagoa das Pedras
45210000
12,120
1,181
11.00
Capit‚nea 45220000 2,196
1,140
6.12
JuvenÌlia 45260000
15,600 1,148
9.54
Correntina 45590000
45
4,075
1,008
1,121
7.91 9.17
Mocambo 45740000 8,130
958
5.37
Arrojado 45770000
5,278
1,110
10.90
Gatos 45840000
6,867
1,182
11.67
ColÙnia do Formoso
45880000
8,695
1,182
Santa Maria da VitÛria
45910000
29,570 1,044
7.04
Carinhanha *
45298000
251,209
1,179
8.87
45
1,165
8.29
Bom Jesus da Lapa *
45480000
273,750 1,150
7.70
Derocal 46455000
6,231
1,103
7.83
Fazenda Coqueiro
46490000
4,300
1,055
1.21
Fazenda RedenÁ„o
46543000
5,400
1,103
8.89
Barreiras 46550000
18,560
956
5.70
Nova Vida
46590000
7,155
1,038
6.60
S„o Sebasti„o
46610000
46
32,586
1,081
1,040
5.51
5.52
Tagu· 46650000
35,564
1,081
5.02
Fazenda Macambira 46675000
39,256
1,065
4.47
Formosa do Rio Preto
46790000
14,210
952
6.52
Ibipetuba 46830000
18,200
983
4.99
Boqueir„o 46902000 68,540 1,018
3.97
Paratinga *
46105000
318,028
1,123
7.29
Ibotirama *
46150000
325,200
1,115
7.39
46
1,098
6.97
Morpar· *
46360000
348,074
1,086
7.12
Barra *
46998000
433,280 1,068
6.09
Pil„o Arcado *
47302000
47
443,100
1,044
1,044
5.90
5.90
Juazeiro *
48020000
510,800
984
4.94
Sta Maria da Boa Vista *
48290000
48
530,000
966
964
4.80
4.74
IbÛ *
48590000
568,600 943
4.49
P„o de AÁ˙car *
49370000
608,900
907
4.34
49
905
4.28
Traip˙ *
49660000
622,600 903
4.22
(*) Stations in the main course of the S„o Francisco River
viii
To allow an easier interpretation of the hydrometeorological data, the classification of basins
proposed by ANEEL was adopted. The S„o Francisco Basin (Basin 4) was divided into 10 Sub-
Basins (numbers 40 to 49).
A look in the above chart confirms a reduction in flows in spite of larger contribution areas, for
the stations closer the mouth of the River. Iguatama, the first station in the S„o Francisco, with a
4,846 km2 drainage ·rea, presents a specific discharge of 22.61 l/s/km2, the greatest among those
located in the main course, while the last station, Traip˙, with a 622,600 km2 drainage area,
presents the lowest values (4.22 l/s/km2).
Figure 4 displays a map with the distribution of mean values of maximum discharges, for the
1950-1999 period. It is noticeable that maximum flows are inferior to 4,000 m≥/s in the main
course of the Upper S„o Francisco, between 4,000 and 7,800 m≥/s in the Middle and Middle-
Lower sectors and between 7,000 and 7,800 m≥/s in the Lower reach.
The reduction in maximum discharges for the stations in Juazeiro, Santa Maria da Boa Vista and
IbÛ, compared to stations located upstream from them, is caused by the river regulation imposed
by Sobradinho Reservoir, with a 34.1 billion m≥ storage capacity.
The distribution of the mean 7-day low flows (Figure 5) indicates that the minimum discharges,
in general, are increasing along the River. The mean values recorded in the main course are
inferior to 500 m≥/s in the Upper S„o Francisco, between 500 and 1,700 m≥/s in the Middle, and
between 1,000 and 1,700 m≥/s in the Middle-Lower and Lower reaches. Analysis of the
distribution of discharges associated with a 95% of permanence shows a behavior similar to the
verified for the 7-day low flows.
The greatest runoff coefficients (ratio between drained and precipitated volumes) were verified in
pluviometric stations with smaller drainage areas and higher precipitation depths. The runoff
coefficients varied from 0.3 to 0.5 in the stations located in the Upper S„o Francisco, from 0.1 to
0.3 in the Middle section and from 0.1 to 0.2 in the Middle-Lower and Lower stretches,
emphasizing the importance of headwaters areas to the perpetuity of the S„o Francisco.
2.2. TEMPORAL VARIABILITY OF THE MAIN HYDROLOGIC VARIABLES
Figures 6 and 7 present maps of precipitation and mean annual flows, respectively, in the S„o
Francisco Basin, in the 1950-1999 period.
In the Upper S„o Francisco, an increase in mean annual precipitation with time is noticed, in the
drainage areas corresponding to the studied fluviometric stations. This increase in precipitation
implies in an augmentation of mean annual discharges. The maximum flow also presents a
growth in the period of analysis, except for the Pirapora-Barreiro station, the only one
downstream from the TrÍs Marias Power Plant, in the Upper S„o Francisco, therefore under the
regulating impact resulting from the construction of the dam.
The minima7-day low flows increased with time for all the stations in the main course of the
Upper S„o Francisco (Sub-Basins 40 and 41), a trend also verified for the discharges associated
with a 95% of permanence. This behavior is consequence of the augmentation of the mean annual
precipitation, which also implied in a greater runoff coefficient.
ix
x
.
Figure 4. Distribution of maxima discharges
Figure 5. Distribution of minima 7-day low flows.
x
(a)
(b)
N
W E
S
SB 48
#
S
IBO
#
SAN TA
AR IA
O A
IST A
SB
#
M
DA B V
49
$
#
S
#
S
$
$
#
$
JUA ZE IRO
PC D)
$
PAO
E
R
(
#
#
S
#
S
D
AC UC A
#
#
S
TRA IPU
#
PILA O ARCADO
SB 47
#
S
#
S IBIPETUBA
#
BAR RA
#
FOR MO SA
IO
#
R ET O
C D)
#
S
#
S
DO R
B OQUEIRAO
#
P (P
FAZ END A
AC AMB IRA
#
MOR PA RA
TAG UA
#
M
NOV A
ID A-M ONT AN TE #
S
#
S
#
#
FAZ END A
V
#
ED EN CAO
#
S #
S #
S
SA
#
S
O
E BA STIAO
IBO TIR AMA
# #
#
#
S BARREIRAS
#
S
R
S
#
#
#
S
#
S
DER OC AL
FAZ END A
Q UE IRO
PAR ATI NG A
#
MOC AMB O
COR RE NTINA
C O
#
S
SB
SAN TA
AR IA
A
BOM ESUS APA
I TOR IA
#
#
S #
S
#
46
#
J
D A L
80
0
80
160
240 Km
ARR O JAD O
M
D
#
#
S
#
V
#
#
S
G
AT OS
#
COL ON IA
O
O RMO SO
FAZ END A
OR TO
#
S #
S
#
S
LAG OA
A S
JUV EN ILIA
D
ED
PCD F
R AS
L EG RE
)
SB 45
SAO
ONC
P
AL O
D
P
#
#
#
A
#
#
CAR INH AN HA
(
#
S #
S #
S
#
Leg
xi
CAP ITA NE A
enda:
G
BOC A
A
A TIN GA
#
S #
S #
S
# #
MAN GA #
S
#
S D CA
SB 44
#
S
USINA
A ND EIR OS
S B Hi d rog raf ia
SB 3
Sub- bac ias s eg undo
da A N EE L
#
PED RA S
ARI A
RU
4
Z
#
#
c las s ifi c aÁ „o
SAN TO NA CIO
Es
DO P
#
taÁ ıes
es tudadas
#
S
SAO
R AN C
D E
IS C M
O
D A C
ARINO S
S
#
#
S
#
$
#
VILA
RUC UIA
I
S
BAR RA
O
Us inas hi d f luv iom Èt ric as
rel Ètri c as
S CU RO
#
F
#
#
FAZ END A
ON CE ICA O
#
S
#
S
U
#S #S
D E
#
#
SAO
MA O
PC D)
E sc al a de c ores
C
#
CAC HO EIR A
A
AN TEIGA
#
S
POR TO
X TR EMA
#S
RO
(
#
S
POR TO
EGR E
D
M
#
MON TAN TE
A RR A
O
UIT AI
P os iti v a
N eg ati v a
#
#
POR TO
LIAN CA
SAN TA
A
#
S
#
S
DA E
AL
B
D
JEQ
ROS
A
#
#
0 -
#
0 9,9
#
S
#
S
PIR APO RA -BA RR EIR O
#
S
#
10 9, 9
10 -
SB 42
19, 9
VAR ZEA
A
ALM A
- 19, 9
-
D
P
SAN TO
P OL ITO
POR TO
S ARINH O
#
S
$
20
2 0 29, 9
SB
HI
#
41
- 29, 9
#
30
3 0 - 3
9, 9
DO PAS
PON TE
O ICIN IO
#
S #
S
PRE SID EN TE U SCELIN O
- 39, 9
-
#
4
4 0
0
49,
MAJOR
RT O
# #
S #
S
9
#
D
P
L
O RTO
S
AND OR INH AS
OR TO
PIR APA MA
J
-
- 49, 9
49,9
4 0 -
>
PO
#
A
50
>
#
S
VEL HO
A
P
D A DA
IP A
#
#
S
#
PON TE
A
QU ARA
PrecipitaÁ„o (mm)
50
#
S
BARR
BAR RA
U NC HAL
#S
#
#
PO N TE
UM BO
#
S
D
PON TE
UL
OA RE S
#
S
TA
D
TA
#
#
S
DO F
RA
S
TAP IRA I
DO CH
#
#
S
#
S #
#
S #
# #
S
PON TE
VA
O
A RA OPE BA
EST ACA O
LV ARO
#S
JAG UA RU NA
#
#
ILV EIR A
#
S
A
ALB NOERTO DL P
O RES
#
#
#
#
S
BEL O
ALE
VAR GE M
N ITA
DA S
F
#
S
CAR MO
#
#
S
O
IGU ATA MA
#
U RU
V
SB 40 #
S #
S
SAO
R AS
O
U AC UI- MO NTA NTE
# #
S
BO
D
CA J
ENT RE
O S
E
IN AS
#
B
D
S
RI
D M
Figure 6. Variation of absolute (a) and relative (b) mean annual precipitation, in the S„o Francisco Basin (1950-1999)
xi
(a)
(b)
xii
Figure 7. Variation of the absolute (a) and relative (b) mean annual discharges in the S„o Francisco River and in its
tributaries, in the 1950-1999 period.
xii
In Pirapora-Barreiro (border of Sub-Basins 41 and 42), the increase in the minima 7-day low
flows with a 95% permanence was more significant than in other areas, given the regulating
effect of the construction of the TrÍs Marias dam.
In the Middle S„o Francisco (Sub-Basins 42 to 46), there is a trend for lowering the mean annual
precipitation with time, in the drainage areas of the fluviometric stations studied in the Basin. All
these variations are of little significance, every one of them inferior to 30%.
However, discharges in the main course of the Middle S„o Francisco have a tendency to behave
in the opposite way, as both the mean annual discharge, maxima and minima flows, as well as the
flow with 95% permanence, have increased with time, which is representative of the great
complexity of the hydrologic processes in the Basin.
A possible explanation for such behavior is the verified increment in precipitation in the January,
a month already characterized as one with high incidence of rainfalls. Obviously, the additional
precipitation is responsible for the augmented maxima flows.
The growth of the minimum discharge and of the discharge associated with the 95% permanence,
however, is probably due to the regulating effect of the reservoirs built in the Upper S„o
Francisco and tributaries, as is the case of the TrÍs Marias.
In the Middle-Lower (Sub-Basins 46 to 48), there was an evident trend of increase in mean
annual precipitation, in the areas under analysis. However, the mean and maxima discharges, as
well as runoff coefficient, presented reduction with time, while the minima 7-day flows and the
flow associated with 95% permanence increased with time.
The variation trends of flows in the Middle-Lower and Lower reaches may be explained by the
construction of several hydro-power plants (Sobradinho, Itaparica/Luiz Gonzaga, MoxotÛ, Paulo
Afonso and XingÛ).
The tendency for reduction in mean flows and in runoff coefficients are also directly related to
hike in evaporation losses, resulting from the construction of reservoirs. The increase in diverted
flows from the S„o Francisco, to meet the expressive growth of production activities verified in
the Region, has also contributed to the condition.
In the stations of Santa Maria da Boa Vista (482900000) and IbÛ (48590000), located
immediately downstream from the Sobradinho Power plant, the minima 7-day flows and the
flows with 95% permanence was distinct from that of other stations in the same reach. This is due
to the fact that only the period posterior the construction of the dam was used in the analysis of
those stations (1979 a 1999).
Figure 8 presents, for the station of Boca da Caatinga (44950000), the variation in mean
precipitation, mean flows, maxima and minima 7-day flows, for the 1970 to 1994 period. The
station, located in the Verde Grande River (Middle S„o Francisco), has a 30,474 km≤ drainage
area, with a mean precipitation of 847 mm and mean long-duration specific discharge of 1.07
l/s/km≤.
Analysis of the outcomes indicates a little reduction in precipitation, with time, which contributes
to the little decrease verified in the mean annual flows and runoff coefficients.
xiii
1600
Mean Prec. = -1,3195 (year) + 3462,4
)
)
/s
m
3
m
1400
m
ip (
ge (
ec
120
1200
c
har
Mean discharhe = -0,1074 (year) + 245,48
Mean pr
1000
100
Mean dis
800
80
600
60
400
200
40
0
20
1950
1955
1960
1965
1970
1975
1980
1985
1990
1995
2000
Time (year)
Mean annual precip
Adjusted equation
0
(a)
1950
1955
1960
1965
1970
1975
1980
1985
1990
1995
2000
Time (year)
Mean annual discharge
Adjusted equation
xiv
(c)
)
900
/s3 8
m
800
ge (
Maximum discharge = 4,0068 (year) - 7701,3
Maximum discharge = -0,1232 (year) + 246,77
7
c
har
700
dis 6
u
m
i
m
600
)
/s
Max 5
3 m
500
ge (
4
400
c
har
dis
3
u
m
300
i
m
2
Max
200
1
100
0
0
1950
1955
1960
1965
1970
1975
1980
1985
1990
1995
2000
1950
1955
1960
1965
1970
1975
1980
1985
1990
1995
2000
Time (year)
Time (year)
Maximum abbual discharge Adjusted equation
7-day maximum discharfge
Figure 8. Mean annual precipitations (a), mean annual flows (b), maxima annual flows (c) and mÌnima 7-day low-flows (d), in the
station at Boca da Caatinga (1970-74).
xiv
The maxima annual flows present an increment of 4.01 m3/s/year, which results from the
increases verified in the mean precipitation depths in January. As noticed in the analysis of the
outcomes, the significance associated with variations in mean precipitations, mean flows and
maxima flows, with time, were inferior to 53%, which confirms their little significance.
The same cannot be stated with respect to minimum 7-day flow, which registered a decrease of
0.12 m3/s/year (Rel = 72.7%; Sign = 95.7%), and to flows associated with a 75% or greater
permanence, for which we have Rel greater than 50% and Sign greater than 90%.
The high relative variance and high significance obtained for the minima 7-day low flows and
flows associated with longer permanencies point to a clear impact in the discharge of the Verde
Grande River, in the dry months.
Other things worth mentioning, for Boca da Caatinga, are the fact that this station presents the
lowest mean annual precipitation (847 mm) and the smallest runoff coefficient estimated for the
period of analysis.
Figure 9 shows the variation in mean precipitation, mean flow, maximum flow and 7-day flows,
for Juazeiro (48020000), for 1950 through 1999. The periods of 1950-1973 and 1979-1999,
corresponding to periods before and after the filling of the Sobradinho Reservoir, are evaluated
individually.
The station in Juazeiro is located at the limit of Sub-Basins 47 and 48, being immediately
downstream from the Reservoir. This station registered three successive years (1979-81) with
annual precipitations above the usual, which was repeated in the years of 1983-85. After 1994,
precipitations were bellow average, and high rates of reduction were noticed, from 1979 to 1999.
The behavior of the precipitation was decisive also in terms of flows, which presented a similar
conduct.
Chart 3 presents the mean annual and monthly flows for the stations of Ibotirama (46150000) and
Juazeiro (48020000), for the 1950-1973 and 1979-1999 periods. For Juazeiro, the analysis was
made for both the historic data and the series obtained by filling gaps with data from Bom Jesus
da Lapa (45480000) and Ibotirama.
As it becomes evident in Chart 3, there was a clear difference between the mean annual flows
obtained for Juazeiro, using historic data for 1979-1999 (2,584 m≥/s) and values estimated using
series filled with data from the stations in Bom Jesus da Lapa (2,916 m≥/s) and in Ibotirama
(2,950 m≥/s). Both alternatives are listed in the Chart.
These values correspond to a reduction of 350 m≥/s in the actual discharge, compared to
estimated values, indicating a change in the regime of flow in the S„o Francisco, downstream
from Juazeiro, after 1979.
The actual mean flow for Ibotirama, with a 325,200 km≤ drainage area, of 2,644 m3/s, is superior
to the 2,584 m3/s for Juazeiro, whose drainage area is 510,800 km2. This fact emphasizes the
impact of the construction of Sobradinho and of the activities in this part of the Basin, standing
out the boom of irrigation, on the regime of flows in the Basin. Even with the increase of 185,600
km≤ (57.1 %) in the drainage area, it is noticed a reduction equivalent to 60m3/s in the mean
discharge.
xv
5000
1600 Mean Precipitation (mm)
4500
1400
4000
1200
) 3500
/s
3 m
1000
3000
ge (
c
har
800
2500
2000
600
Mean dis
1500
400
1000
200
Mean prec. = 1,1626 (Ano) - 1320,4
Mean prec. = -10,413 (Ano) + 21713
500
Mean discharge = 1,6470 (year) - 702,9206
Mean discharge = -105,0465 (year) + 211526,0506
0
0
1950
1955
1960
1965
1970
1975
1980
1985
1990
1995
2000
1950
1955
1960
1965
1970
1975
1980
1985
1990
1995
2000
Time (year)
Time (year)
Mean annual precip (1950-1973)
Mean annual precip (1979-1999)
Mean annual discharge (1950-1973)
Mean annual discharge (1979-1999)
Adjusted equation:
Adjusted equation:
Adjusted equation
EquaÁ„o ajustada
xvi
)
/s3
m
a
(
16000
Ì
nim
Maximum discharge = -14,3052 (year) + 34160,8506
Maximum discharge = -312,3104 (year) + 626846,8411
2500
14000
„o m
Vaz
12000
)
/s
2000
3
m
10000
ge (
c
har
8000
1500
dis
u
m
6000
i
m
1000
Max
4000
2000
500
Maximum discharge = 18,9858 (year) - 36238,1419
0
Minimum discharge = -31,6826 (year) + 64643,5884
1950
1955
1960
1965
1970
1975
1980
1985
1990
1995
2000
0
Time (year)
1950
1955
1960
1965
1970
1975
1980
1985
1990
1995
2000
Maximum annual discharge (1950-1973)
Maximum annual discharge (1979-1999)
Time (year)
Adjusted equation
Adjusted equation
7-day minimum discharge (1950-1973)
7-day minimum discharge (1979-1999)
Adjusted equation
Figure 9. Mean annual precipitations (a), mean annual flows (b), maxima annual flows (c) and minima 7-day low-flows (d), in the
station at Juazeiro (1950-73 and 1979-99).
xvi
Chart 3. Mean and monthly flows (m3/s) in the stations of Bom Jesus da Lapa, Ibotirama
and Juazeiro (1950-1973 and 1979-1999).
Station
Period Annual(1)
Jan Feb Mar Abr Mai Jun Jul Ago Set Out Nov
Dez
194
357
358
328
269
137
104
164
299
Bom Jesus da
1950 - 1973
1
6
7
7
1
8
1
883 747 680 877 3
4
Lapa (BJL)
236
427
429
371
279
176
144
130
119
115
129
199
321
1979 - 1999
2
9
5
6
0
5
2
3
4
8
0
5
9
223
376
390
371
308
165
130
116
102
121
190
319
1950 - 1973
2
9
4
3
6
8
9
3
0 935 7
2
7
Ibotirama (Ibo)
264
452
482
433
315
203
167
150
138
134
149
217
339
1979 - 1999
4
4
3
9
1
4
1
9
9
9
3
5
1
253
405
443
416
385
222
159
138
123
110
122
187
333
Juazeiro:
1950 - 1973
2
4
7
6
9
2
9
9
9
1
4
7
4
historic data
258
321
370
385
323
234
201
195
198
204
203
215
253
1979 - 1999
4
1
0
8
7
9
4
3
5
2
4
5
5
Juazeiro:
291
453
488
439
396
295
210
183
165
152
154
217
352
1979 - 1999
data from BJL
6
5
6
7
8
2
2
5
6
9
3
5
9
Juazeiro:
295
441
567
501
396
258
192
168
154
144
149
217
364
1979 - 1999
data from Ibo
0
7
8
9
9
6
9
6
0
1
2
0
3
-
-
-
[filled and
12,
41,
32,
14,
22,
25,
16,
25,
24,
39,
Juazeiro:
hist.] (%)
8
2
1
0
6
7
4,4 -6,1 6
1
1 0,9 2
(BJL / Hist)
132
118
-
-
-
-
1979 a 1999
333
539 731 603 88
20 994
4
6
119
329
513
490
-
-
-
-
[filled and
14,
37,
53,
30,
22,
10,
13,
22,
29,
26,
43,
Juazeiro:
hist.] (%)
2
6
4
1
6
1 -4,2 7
4
4
6 0,7 7
(Ibo / Hist)
120
197
116
-
-
-
-
110
1979 a 1999
367
732 237 -84
15
6
7
1
267
445
600
541
7
(1) Value corresponding to the ponderated average of monthly flows, considering the number of days in month.
Analysis of the changes in mean monthly discharges permits the observation of the regulating
effect of the reservoir, as in the months of December through February the difference between
actual flows and those estimated considering the behavioral trends of historic flows prior to 1973
is greater than 990 m≥/s. This fact shows the impact of the reservoir in flood control, which
resulted in reduction of the maxima flows in downstream reaches.
In the dry season, the mean monthly discharges estimated with data from other stations are
inferior to those verified in the River. Discharges estimated based on the expansion of shorter
series were lower than the observed, in the months of June through October.
Those differences reached 600 m3/s, with the minimum monthly mean in the historic series equal
to 1,953 m3/s, in July. The lowest values in the series with filled data were 1,441 m3/s, using data
from Ibotirama, and 1,529 m3/s, with data from Bom Jesus da Lapa, in September. This shows
the shift of the month of occurrence of the lowest flow downstream from Juazeiro, which went
from September, prior to 1979, to July, after 1979.
Figure 10 presents a schematic summary of the mean discharges in the S„o Francisco River and
in its tributaries, for the 1950-1999 period.
xvii
R
R
io
io
ndas
P
C
r
o
io da Estiva
#
e
r
t
r
uar·
#
R
o
e
R
nt
io de O
i
io ItaquarÌ
#
io G
o
in
#
R
a
R
I
#
#
nd
R
#
io de Janeiro
R
#
#
a
io
#
R
i
A
·
R
r
i
r
#
o
oja
#
reto
R
#
d
A
R
R
o
R #
b
i
#
o
i
i
io P
a
io
R
Co
o
o
#
R
17,76
e
U
x
C
Ri
G
#
t
i
·
o
67,61
È
R
#
r
o
a
Fo
ra
i
u
r
r
o
c
P
in
m
n #
#
#
a
#
#
o
d
P
uia
24,92
n
h
so
e
a
d
a
R
#
r
e
n
a
#
i
#
r
i
# h
#
o
c
o
a
a
148,82
C
t
s
o
272,43
#
Itaparica
xviii
˙
255,71
r
# re
#
208,26
n
109,58
t
#
2524,24
239,41
846,32
2046,80
e
2478,15
Sobradinho
2627,59
Rio S„o Francisco
#
#
#
#
#
$
#
#
#
#
#
#
#
#
#
#
#
#
#
#
$
#
#
# $$$
$
#
#
TrÍs Marias
1637,14
Rio S„o Francisco
XingÛ
125,59
2640,71
1095,05
2015,51
2228,73
25,47
#
283,43
#
Complexo de
MoxotÛ
32,55
#
#
R
Paulo Afonso
io
Rio Lamb„o
# 98,61
V
#
elhas
e
#
rd
araopeba
rande
e P
#
io das V
e
ar·
io P
R
R
qu
erde G
e
io P
#
#
#
n
R
#
io V
o
R
#
#
#
#
#
Figure 10. Schematic distribution of the mean discharges (m≥/s) in the S„o Francisco River and tributaries (1950-1999.
xviii
The increase in water availability in the dry season corresponds to a great benefit, with respect to
the multiple uses, as it assures a supply in drought periods. This fact highlights a very important
issue regarding the water resources management, not only with respect to the assessment of the
available quantity, but also to the variation of this quantity with time.
In this manner, neglecting the impact of other water uses in the Region, it might be said that 350
m≥/s were necessary to assure a supply in the dry season. This fact raised the minima mean
monthly discharge of 1,441 m≥/s to 1,953 m≥/s and reduced the projected maxima mean monthly
discharges (4,886 m3/s, obtained with data from Bom Jesus da Lapa, and 5,678 m3/s, with data
from Ibotirama) to 3,858 m3/s.
For the station of Traip˙, located by the mouth of the S„o Francisco, with a 622,600 km≤ drainage
area, the mean monthly discharges were verified to be of 2,659 m≥/s (in the 1950-1999 period),
2,698 m≥/s (in 1950-1973) and 2,608 m3/s (1979-1999).
Comparing these discharges with those obtained in Ibotirama (325,200 km2 of drainage area), for
the 1979-1999 period, it is noticeable the little contribution of the Ibotirama-Itraip˙ stretch to the
flow augmentation and to the impacts of local activities. Even with a significant increase in
drainage area (297,400 km2), discharges fall from 2,664 m3/s (Ibotirama) to 2,608 m3/s (Traip˙),
a reduction of 56m3/s. It is a decrease of 2.1%, in spite of the increase of 91.5% in drainage area.
In the period of analysis, besides the construction and filling of many reservoirs, what contributed
to an expressive hike in evaporation losses, there was a great increase in the diversion of water,
not only in consequence of populational growth, but mainly in view of the expansion of irrigated
agriculture.
Comparing the mean discharges in Traip˙ with those mentioned in the literature for the S„o
Francisco River, which includes values from 2,850 to 3,360 m≥/s, makes clear that, from 1950 to
1999, the mean long duration flow was 2,659 m≥/s, with a value of 2,698 m≥/s for the 1950-1973
period and 2,608m3/s for 1979-1999.
The mean flow falls to 2,025 m≥/s, if only the last 13 years of the series are considered (1987-
1999). In this period, mean annual precipitation was 881 mm. Consideration of the 1979-1986
period, however, results in a mean flow of 3,411 m≥/s, for a mean precipitation of 981 mm. This
brings out the changes in the hydrologic variables considered in the study, both with time and
with space, along the Basin.
3.
WATER USE FOR IRRIGATION IN THE BASIN
3.1 IRRIGATION SCENARIO IN BRAZIL
Brazil has the second largest irrigable area in the World: 55 million hectares, 30 million of which
in floodplains and 25 million in uplands. However, as it may be seen in Chart 4, in spite of the
utilization of a large area for agriculture, only a small portion is dedicated to irrigation This fact
places the Country in a modest rank in the World, with only 1% of irrigated area (Ministry of
Agriculture, Livestock and Supply, 2002).
xix
Chart 4. Land Occupancy in Brazil*
I. Areas with economic activities
106 ha
. seasonal crops(1) 38.5
. resting fields
4.0
. permanent crops
7.5
. planted pastures
99.7
. natural pastures
78.0
. artificial forests
5.4
. irrigated areas
3.0
Sub total
236.1
II. Areas with no economic activities
. rain forests (all kind of reserves)
365.0
. Indian reservations(2) (approved, reserve or under identification process
outside the rain forests)
101.8
. urban centers, lakes, roads and rivers(3) 30.0
. unoccupied lands(4) 6.1
. unused productive lands / other uses or not uses not specified
112.0
Sub total
614.9
Total 851.0
Source: IBGE ≠ Agricultural and Livestock Census, 1996.
(*) Chart from the book "The Ways of Brazilian Agriculture", Santo, Benedito Rosa EspÌrito (2001).
(1) CONAB ≠ Production estimates- 2000/2001
(2) IBAMA
(3) EMBRAPA ≠ Estimates
(4) INCRA ≠ Summary of Activities, 1985-94
3.2 IRRIGATION SCENARIO IN THE S√O FRANCISCO BASIN
The presence of the government in the S„o Francisco Basin was expressive, represented by the
Company for the Development of the S„o Francisco and of the ParnaÌba Basins (CODEVASF),
whose primary mission is to promote irrigation in its area of influence. The Region presents ideal
conditions for irrigation, in spite of the pronounced water deficit, due to the irregular and
insufficient rainfall precipitations.
Of the total irrigable area in the S„o Francisco, only 300,000 ha are actually under irrigation,
which represents only 10% of the potential, 74,000 ha of those corresponding to public projects
(Vale do S„o Francisco, 2002b). For the past 30 years, irrigated areas in the Semi-Arid have been
object of significant changes, especially with respect to the crops used (today including soybean,
grapes and coffee, among other).
Chart 5 shows the distribution of the soil use potential in the States of the S„o Francisco Basin.
xx
Chart 5. Distribution of irrigable soils (ha) with access to surface water resources in the
S„o Francisco Basin.
State
Irrigation Soil Classes
2
3
4
Total
Minas Gerais
178,000
2,389,700
5,500
2,573,200
Bahia 552,200 4,310,200 -
4,862,400
Pernambuco - 453,500 -
453,500
Sergipe -
65,000 -
65,000
Alagoas -
133,700 12,200 145,900
Total
730,200
7,352,100
17,700
8,100,000
Source: PLANVASF (The State of Goi·s and the federal District were not considered in the survey)
3.3 ESTIMATES (BASED ON SECONDARY DATA) OF WATER USE BY
IRRIGATION AGRICULTURAL ACTIVITIES.
In order to assess the amount of water used for irrigation purposes, governmental and private
institutions were identified and contacted, to investigate the following:
∑ type of existing data;
∑ quality of data; and
∑ period of records.
In the first contact, institutions with updated and apparently reliable databases were selected, for
collecting and reproducing the information. An extensive bibliographical survey of Master's and
PhD's dissertations, technical reports and papers was also carried out, to form an information
basis. These information were organized by subject and, in some cases, maps and graphs were
prepared.
Figure 11a illustrates the spatial distribution of irrigated areas in the S„o Francisco Basin. The
data used for the figure was obtained from the Water Management Institute of Minas Gerais
(IGAM), from the Director Plan of the Water Resources of the S„o Francisco Tributaries' Basins
in the State of Minas Gerais (PDRH), from the Secretary of Water Resources of the State of
Bahia (SRH/BA) and from thesis and dissertations presented at the Federal University of ViÁosa.
It may be seen, in Figure 11b, that irrigation with center pivot systems is distributed along the
entire Basin, with greater concentration in the Northern (JaÌba, Jana˙ba, Janu·ria and Manga) and
Northwestern parts (UnaÌ, BonfinÛpolis de Minas and Paracatu), in Minas Gerais, and in Western
Bahia (Barreiras, S„o DesidÈrio and LuÌs Eduardo Magalh„es).
Irrigation with conventional sprinkler systems is concentrated in the Municipalities of JaÌba,
Itacarambi and Manga, in Minas Gerais, and in the Sub-Basin of the Corrente River, in Bom
Jesus da Lapa and S„o FÈlix do Coribe, in the State of Bahia. Micro-sprinkler irrigation is
xxi
scattered all over the Basin, mainly in irrigated fruitculture areas. There is a small number of
areas under trickle irrigation.
Figure11. Spatial distribution of irrigated areas (a) and the main irrigation methods (b)
used in the S„o Francisco Basin.
Chart 6 presents indicators of the relation between discharge and irrigated areas, for each
irrigation method in the States of minas Gerais and Bahia, according to data from the PDRH and
from the inventory of water rights granted by SRH/BA, respectively.
The greatest water consumption by irrigation in the State of Minas Gerais were observed in
surface irrigation methods, while trickle and hose methods presented the smallest consumptions.
In Bahia, the greatest discharge and irrigated area ratios were obtained for center pivots and
conventional sprinklers, and the lowest ratios were for localized irrigation, which presented
values inferior to 1 l/s/ha.
3.4
IRRIGATION WATER USE EFFICIENCY IN SPECIFIC AREAS IN THE BASIN
The number of irrigation projects evaluated in each region was determined by observation of the
different methods, irrigated crops, types of water supply (river or well) and technological level of
the farmer.
Chart 6. Discharge/irrigated area ratios for different irrigation methods, in the States of
Minas Gerais and Bahia
xxii
(discharge) / (irrigated area) (l/s/ha)
Irrigation method
Minas Gerais
Bahia
Furrow irrigation
1.67
-
Flood irrigation
2.05
-
Conventional sprinkler
1.22
0.84
Center pivot
1.07
0.90
Self-propelled systems
0.84
-
Micro-sprinkler / under tree
1.20
0.55
Trickle irrigation
0.83
0.66
Hose irrigation
0.80
-
Perforated tape
-
0.79
Evaluations were carried out in the three States with the larger parcel in the S„o Francisco Basin:
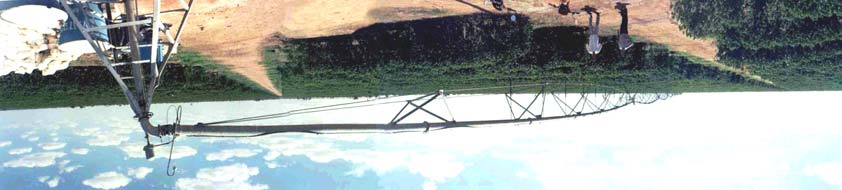
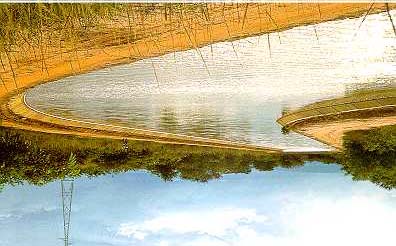
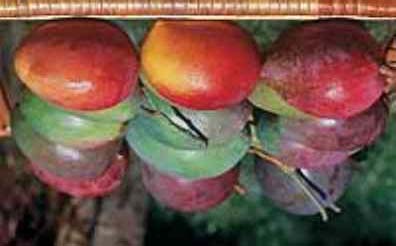
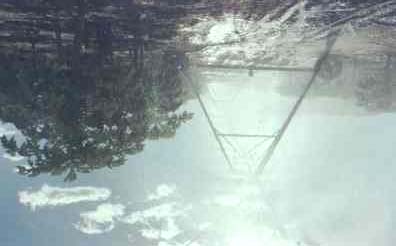
Bahia, Minas Gerais and Pernambuco. As shown in Figure 12, 55 projects were evaluated, with
the following systems: trickle (8), micro-sprinkler (25), conventional sprinkler (13), water cannon
(1) and center pivot (8). These systems may be seen on pictures 1 through 4, respectively.
For evaluation of performance of the irrigation systems, the traditional methodologies were
adopted for each of them:
∑ uniformity distribution coefficient (UDC), for localized irrigation;
∑ Christiansen uniformity coefficient (CUC), for sprinkler systems;
∑ coefficient representing the drift (due to wind effect) and evaporation losses, for
sprinkler systems;
∑ application efficiency regarding the average of the 25% lowest water applications (Eq),
for localized irrigation;
∑ application efficient regarding the 50% lowest applications (Eh), for sprinkler systems;
∑ irrigation adequacy indicator (actual and design values) of the 25% lowest applications,
for sprinkler and localized irrigation.
The UDC60% (bellow which uniformity was considered inadequate for localized irrigation), the
UDC90% (above which uniformity was excellent) and other values of UDC obtained in the
evaluations of the localized irrigation systems are presented in Figure 13. The average value of
the UDCs 79.1%, inferior to the excellence mark (90%).
Of the 33 localized systems evaluated, only four (12.1%) presented UDC bellow 60%. Of those,
two presented values very close to 60%, indicating that small improvements obtainable with
corrective maintenance would be enough to raise their uniformity.
xxiii
Figure 12. Spatial distribution of the evaluated irrigation systems in the S„o Francisco
Basin, with emphasis on each of the distinct Regions
xxiv
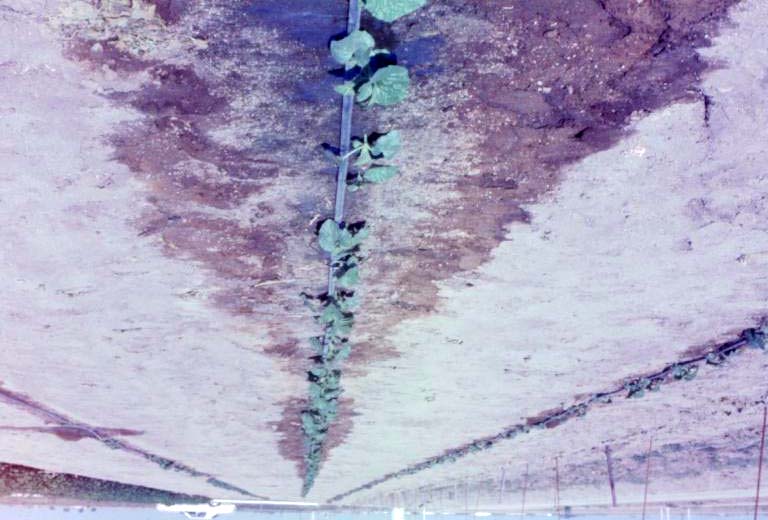
Picture 1. Partial view of irrigated melon: Trickle irrigation, with one lateral
for each row of plants.
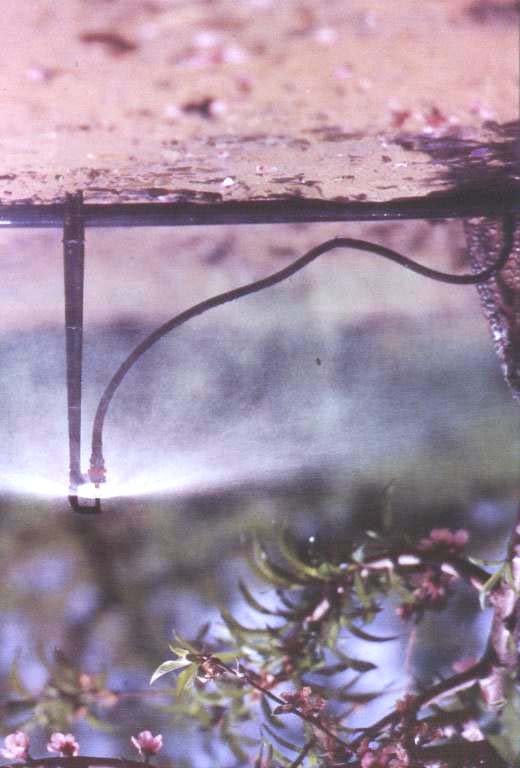
Picture 2. Irrigated peaches (micro-sprinkler).
xxv
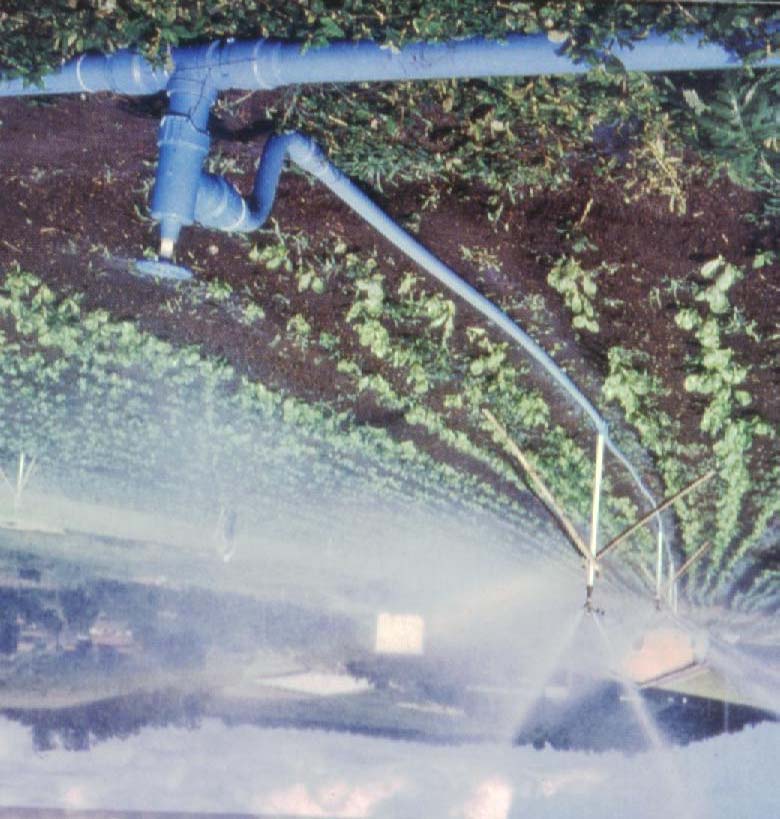
Picture 3. Partial view of a lettuce plantation irrigated by a conventional
sprinkler system, showing the main line and the hydraulic valve, in the
first plan, the lateral with the sprinklers in stand-pipes are shown.
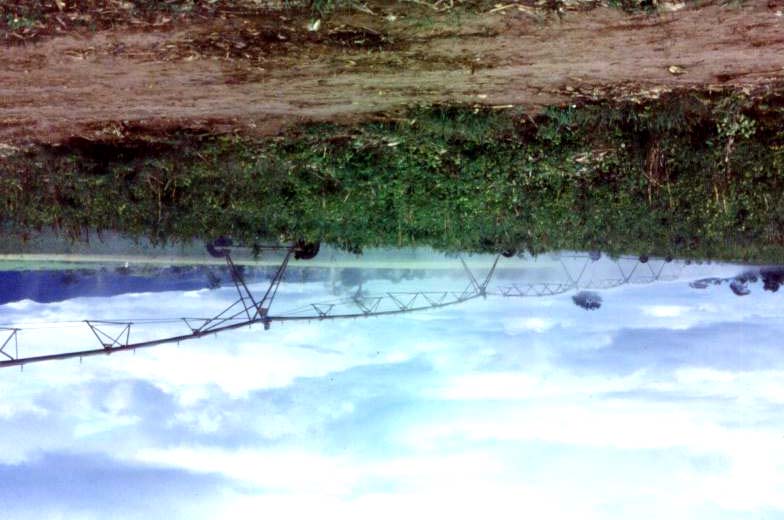
Picture 4. Partial view of a center pivot system.
xxvi
The other two systems, UDC values much bellow the recommended value, because of plugging
of the emitters, a clear indication of poor preventive and corrective maintenance of the systems.
Still in Figure 13, it is noticed that 10 of the evaluated systems (30.3%) presented a UDC above
the excellence mark, indicating they were properly designed and are well operated.
Results of the evaluations of sprinkler irrigation, including systems with inadequate uniformity
(CUC bellow 75%) and with excellent uniformity (CUC above 85%), in addition to the average
coefficient, are presented in Figure 14.
Figure 13. Uniformity distribution coefficient (UDC) values for the evaluated localized
irrigation systems.
Figure 14. Christiansen Uniformity Coefficient (CUC) for sprinkler systems.
xxvii
It is noticed in Figure 14 that the average value for the CUC was 78.6%, greater than the mark for
inadequate uniformity, but still lower than the excellence limit. Of the 22 evaluated projects, five
systems (22.7%) presented values inferior to the recommended minimum (CUC75%) and seven of
them (31.8%) were above the excellence limit (CUC85%).
Only two systems presented CUC values much bellow the recommended minimum, in view of
the great variance in sprinkler operating pressures, of the excessive spacing between laterals and
between sprinklers, and also due to the great Wind velocity during the tests.
Losses due to evaporation or drift in sprinkler irrigation projects were, in average, around 10.9%
(Figure 15), and were verified to be greater in conventional sprinkler than in center pivot systems.
This is confirmed by the average values for the parameter: 12.6% for sprinklers against 8% for
center pivots.
Figure 15. Evaporation and drift losses in sprinkler and center pivot systems,
and average values
The application efficiency values obtained for the two evaluated localized irrigation systems,
with respect to the 25% smallest application depths (Eq), as well as the indicative line of their
mean value and of the one considered excellent (85%) are presented in Figure 16.
The values ranged from 3.8 through 97.7%, with an average of 79.1%, which falls bellow the
mark of excellence for localized irrigation. This value indicates that for each 100 liters used in the
irrigation, 79.1 are actually consumed by the crop, everything else being lost to seepage,
evaporation or deep percolation.
xxviii
Figure 16. Application efficiency in localized irrigation, regarding the 25% lowest
application depths (Eq). Mean and optimal values are indicated.
The application efficiency in sprinkler irrigation, regarding the 50% lowest application depths
(Eh), as well as an indicator of the average value and of the one considered excellent (80%), are
presented in Figure 17. The values were in the range of 41.1 to 86.2%, with an average of 70.3%,
which is bellow the value considered excellent for sprinkler irrigation.
Figure 17. Application efficiency in sprinkler irrigation (Eh), regarding the 50% smallest
application depths. Indicators of the average and excellence values are included.
xxix
It may be seen in Figures 16 and 17 that, in average, application efficiency in localized irrigation
was superior to that of sprinkler systems, given that evaporation and drift losses were
considerably higher in the latter and practicably nonexistent in the first. Other determinant factors
were the spacing between laterals and between sprinklers, in the sprinkler systems.
The adequacy indices, the actual vale and the one used for the project, for localized and for
sprinkler irrigation, are presented in Figures 18 and 19. Consideration of those indices are
necessary, as application efficiency can be high in irrigation under deficit condition, masking the
analysis. The actual adequacy index indicates whether the irrigation was excessive or less than
required. A value greater than one indicates excess, one represents ideal application and less than
one indicates a insufficient irrigation.
Analysis of Figure 18 induces that in 27 cases (81.8%) the average of the 25% smallest
application (L25%) was less than the required depth, point to insufficient irrigation. In two cases
(6%), L25% was equal to the required amount, indicating adequate irrigation, and in four cases
(12%), it was greater, corresponding to irrigation in excess.
Figure 18. Actual and design adequacy indices for localized irrigation.
In 19 cases (57.6%), actual adequacy indices were verified to be inferior to the design value,
resulting in greater deficit than expected in project, as irrigations were made after the expected
dates. Only in two cases (6%), irrigation was made on schedule. On the other hand, in 12 cases
(36.4%), irrigation was made before the established dates, resulting in lower deficits than
expected in Project.
Analyzing Figure 19, observing the actual adequacy index for sprinkler irrigation, it may be
stated that, in general (77.3% of the cases), the average of the 25% smallest applications were
inferior to the required depth, indicating an insufficient irrigation. In three cases (13.6%), they
xxx
matched the required amount and in two cases (9.1%) they were greater, implying in excessive
irrigation.
Figure 19. Actual and design adequacy indices for sprinkler irrigation.
Irrigation management, based in technical criteria, allows the identification of the moment to start
the applications and the definition of the right amount of water to meet the crops requirement.
This minimizes energy consumption and maximizes efficiency in the use of the water,
maintaining the soil water content in favorable conditions.
A preliminary assessment of irrigation management was made by comparing the water depth
applied by the farmer during a routine irrigation with the actual water deficit in the soil.
Afterwards, the actual deficit was compared to that foreseen in the project. It was established that
the ideal situation would be for the matching of the two deficits.
With data from the soil and the applied water depth, it was possible to make a diagnosis of the
irrigations. Figure 20 shows the mean application depths, in blue, and the depth required raising
the soil water content to field capacity (hachured white).
When the mean application depth is greater than necessary, there water in excess and,
consequently, deep percolation losses, equal to the difference between them, represented by the
yellow bar. On the other hand, if the required amount is less than the applied, there is a water
deficit equal to their difference, after the irrigation stops. The actual deficit is represented with
the Brown color. When application matches the requirements, there are neither percolation losses
nor water deficits in the soil.
It is noticed in the figure that of the 33 evaluations in micro-sprinkler and trickle systems, in 20
of them (60.6%) the application was less than the necessary, characterizing an insufficient
irrigation. In 13 of the evaluations (39.4%), there was excessive irrigation, resulting in an average
xxxi
percolation loss of 5.5 mm. The mean deficit in the irrigation was 24.6 mm and the maximum
value was 89.7 mm.
xxxii
Figure 20. Required and applied depths, deep percolation losses and actual water deficit in the
soil, in localized irrigation.
It may be seen in Figure 21, with respect to the actual and project deficits in localized irrigation,
that 15 (45.5%) of the evaluated systems presented, in average, an actual deficit 15.9 mm greater
than project deficit, indicating that irrigation were made after the recommended time.
Figure 21. Actual and projected soil water deficits in localized irrigation systems.
xxxii
In seven (21%) of the evaluated systems, the dÈficit in soil water content was equal to the
estimated in the Project, indicating that irrigation was made in the right moment. However, the
applied depths were greater than the recommended in six of the projects and inferior in one of
them. Still in the Figure, it is possible to see that in 11 units (33.3% of the total), the actual deficit
was inferior to the estimated previously, showing that irrigation was made before the proper time.
It is evident in Figure 22 that in 15 (68.1%) of the 22 evaluations in sprinkler systems the
application depth was less than the required, characterizing a insufficient irrigation, with an
average deficit of 18.6 mm. In two of the evaluations, the right water depth was applied, while in
22.7% of the projects water was in excess, with a surplus depth of 8mm.
xxxiv
Figure 22. Applied and required water depths, deep percolation losses and actual soil water
content deficit in sprinkler irrigation.
Of the evaluations carried out in sprinkler irrigation systems, it was observed that in four of them
(68.2%) the actual deficit was, in average, 8.2 mm greater than the value of Project. In seven of
them (31.8%), the deficit was inferior, indicating that irrigation occurred before the proper time
(Figure 23).
3.5 WATER SAVINGS POTENTIAL
The percentages of water savings, with respect to total water applied in each one of the evaluated
projects are presented in Charts 7 and 8, for localized and sprinkler systems, respectively. It is
noticed that there is an average of 63.9% potential for water savings in first system, against a
43.1% in the latter.
xxxiii
Figura23. Actual and design deficits of soil water contents in sprinkler irrigation.
Chart 7. Mean application depth (Lmapplied), irrigation requirement (LN) and annual water
savings potential (PEA) for localized irrigation systems.
Micro-sprinkler Trickle
Lm
Lm
Evaluation number
applied
L
applied
L
(mm)
N
(mm)
N
PEA
(mm)
(mm)
(%)
4 49.0
43.8
- - 10.6
17 4.7
0 - - 100.0
27 3.7
0.7
- - 81.1
34 9.5
6.4
- - 32.6
35 15.9
14.2
- 10.7
45 -
-
2.9
1.5
48.3
46 -
-
74.1
57
23.1
50 6.2
0 - - 100.0
51 3.5
0 - - 100.0
52 8.9
0 - - 100.0
53 8.5
6.4
- - 24.7
54 -
-
7.7
0
100.0
55 -
-
6.7
0
100.0
Mean 63.9
*Evaluations with application in excess.
xxxiv
Chart 8. Mean application depths (Lmapplied), irrigation requirement (LN) and annual water
savings potential (PEA), for sprinkler systems.
Evaluation number
Lmapplied (mm)
LN (mm) PEA (%)
10 21.8
16.2 25.7
13 6.6
6.4 3.0
14 12.2
3.4 72.1
21 18.2
2.0 89.0
23 29.8
16.6 44.3
37 15.9
12.0 24.5
mean
43.1
*Evaluations with application in excess.
Figure 24 shows the mean water savings potential for each irrigation system. It is noticed that
trickle systems present a greater potential (8.2 mm), followed by conventional sprinkler (8.0 mm)
and by micro-sprinklers (4.3 mm).
Figure 24. Mean water savings potential (mm) for each irrigation system.
3.6 TRANSPORTATION OF IRRIGATION PRODUCTS
Collection of qualitative and quantitative data regarding the planted area, production and
internal/external commercialization of the products was carried out with field surveys, semi-
structured interviews with farmers, technicians, extension workers and directors of farmers
associations in the selected locations (Pirapora, JaÌba e Jana˙ba, in Minas Gerais, Barreiras and
Juazeiro, in Bahia, and Petrolina, in Pernambuco).
Defined the centers of agricultural production, efforts were focused on establishing the
conveyance of the products to consumer markets within and off the S„o Francisco Basin and
estimate the transportation flux to the respective markets. Production from selected crops and the
total production in the irrigation districts in 2001 are presented in Chart 9.
xxxv
Chart 9. Production at CODEVASF's irrigation projects, in selected locations (2001).
Location
Main culture
production (kg)
Total production (kg)
Pirapora Uva
4,370,645
5,095,606
Jana˙ba Banana
56,734,294
57,220,814
JaÌba Banana
40,168,520
44,365,469
Barreiras CafÈ
13,301,940
-
Juazeiro Manga
37,515,770
1,091,973,100
Petrolina Manga
79,394,530
268,629,270
Source: Production Reports (CODEVASF, 2001).
In Northern Minas Gerais (Pirapora, Jana˙ba and JaÌba) banana is noticeably the predominant
culture, followed by grape. Banana is sold mainly at CEASA, in the Cities of Rio de Janeiro, S„o
Paulo and Belo Horizonte, that assimilate 42.16%, 19.45% and 17.77% of the production,
respectively. The grape produced in the Region is due mostly to the CEASA in Belo Horizonte
(78.54%, in 2001).
In the Petrolina/Juazeiro pole, mango is the predominant culture, destined for the external market
(82% in 2001). Part of the grape is also for export (37.9%), while coffee production in Barreiras
is destined for Northern Minas Gerais, viewing its industrialization and commercialization in the
domestic and external markets.
The consolidated data for all the selected municipalities lead to the conclusion that 80% of the
production is destined to consumer markets off the S„o Francisco Basin (Figure 25).
Figure 25. Percentual distribution of the destination of the production in the S„o Francisco.
Impoundment of water for agriculture, aiming the irrigation of cultures whose products will be
sold to consumers outside of the Basin, reduces the availability of the water resources which
could be used for different purposes, such as domestic supply, industrial, aquiculture and
livestock raising. As irrigation expands, it is necessary to augment the supply to the irrigated
crops.
xxxvi
4. GENERAL
CONCLUSIONS
4.1 ANALYSIS OF THE HYDROLOGIC REGIME IN THE BASIN
Mean annual precipitation vary from 1,000 to 1,750 mm in the Upper S„o Francisco, from 550 to
1,750 mm in the Middle reach, from 400 to 550 mm in the Middle-Lower and from 400 to 1,300
in the Lower.
The mean long-duration discharges verified in the main course of the Upper S„o Francisco are
inferior to 1,000 m≥/s, from 1,000 to 2,700 m≥/s in the Middle and from 2,000 to 2,700 in the
Middle-Lower and Lower stretches. For all tributaries, these discharges are inferior to 1.000 m≥/s.
The mean long-duration specific discharges decrease along the S„o Francisco, towards the mouth
of the river. The maximum value is 22.61 l/s/km≤, recorded in Iguatama, and the minimum is 4.22
l/s/km≤, observed in Traip˙.
The mean value of the maxima annual discharges, for 1950-1999, in the main course of the
Upper S„o Francisco is inferior to 4,000 m≥/s, between 4,000 and 7,800 m≥/s in the Middle and
Middle-Lower and from 7,000 to 7,800 in the Lower reach
The mean minimum discharge with 7-day duration, for 1950-1999, in the Upper stretch is inferior
to 500 m3/s, varies from 500 to 1,700 m≥/s in the Middle, and from 1,000 to 1,700 in the Middle-
Lower and Lower. In the tributaries, in general, this mean value was inferior to 100 m3/s,
exceeding this mark in only six station, never reaching the 200 m3/s.
Runoff coefficient in the stations in the Upper River is in the ) 0.3 to 0.5 range, from 0.1 to 0.3
for the stations in the Middle and 0.1 to 0.2 in the Middle-Lower and Lower S„o Francisco.
The mean discharges associated with a 95% permanence, for the 1950 to 1999 period, are inferior
to 500 m≥/s in the Upper stretch, varying from 500 to 1,700 in the Middle and from 1,000 to
1,700 in the Middle-Lower and Lower sections.
In the Upper S„o Francisco, for the 1950-1999 period, there is an evident tendency for increase in
the mean annual precipitation and runoff coefficients, as well as in the mean, maximum and
minimum discharges. In the Middle S„o Francisco, there is a tendency for reduction of the mean
annual precipitation and increase in runoff coefficients, as well as of the mean, maximum and
minimum discharges, with time. In the Middle-Lower and Lower reaches, the trend is for
increase in mean annual precipitation and in minimum discharge, with a reduction of mean and
maximum discharges, and of the runoff coefficient, with time.
The high significance of the temporal variation of the minimum 7-day discharges and of the
discharges associated to the longest permanencies, for the station of Boca da Caatinga, indicate
an obvious change in the flow conditions of the Verde Grande River and of its tributaries. This is
noticed in the driest months, imposed by the significant growth in irrigated agriculture in the
region.
The difference between the mean long duration flows observed in the station of Juazeiro, after
1979 (beginning of operation of the Sobradinho Reservoir), and the discharges estimated by
extending the historic data series from the stations of Ibotirama and Bom Jesus da Lapa is in the
xxxvii
order of 350 m≥/s. After Sobradinho the reservoir operation began, it was noticed a significant
decrease in the maxima monthly discharges (over 1,000 m≥/s) and of the minima monthly
discharges (above 500 m≥/s).
The mean long duration flows in Traip˙, close to the mouth of the S„o Francisco, with a drainage
area of 622,600 km≤, is equivalent to 2,608 m≥/s, for the 1979-1999 period. This discharge is
inferior to the values recorded in Ibotirama, with a 325,200 km≤ drainage area, which is 2,664
m≥/s. This emphasizes the little contribution of the Ibotirama-Traip˙ stretch for the augmentation
of the discharges and the expressive impact of the activities in this area, during the period of
analysis,
4.2 WATER USE BY IRRIGATION IN THE BASIN
Secondary data for the S„o Francisco Basin are scattered in several state and federal institutions.
Irrigation represents the majority of the water rights concessions in the States of Minas Gerais
(76%) and Bahia (93.9%).
In 20 (60.6%) of the 33 evaluations carried out in properties using micro-sprinkler and trickle
systems, application depth was less than the required, characterizing deficit irrigations. In only 13
of the (39.4%), there application in excess, resulting in deep percolation losses. The average loss
to deep percolation was 5.5 mm, with a maximum value of 17.1 mm, while the average deficit
was 24.6 mm, with a maximum of 89.7 mm.
The deficit in soil water content, in the evaluations of areas with localized irrigation, was greater
than the value of Project, for 45.5% of the evaluated properties. The found values exceeded, in
average, in 15.9 mm the Project value, with a maximum difference of 36 mm. In seven of the
evaluated units, there was a match in the actual and project deficits, characterizing an irrigation
made at the right moment. In eleven farms (33.3%), the actual deficit was inferior to the
maximum allowable value, indicating that irrigation was applied before the recommended time.
In 15 (68.1%) of the 22 evaluations in sprinkler irrigation (conventional sprinkler, water canon
and center pivot) the applied depth was less than the required application, characterizing
insufficient irrigation. In average, it was observed a deficit of 18.6 mm after irrigation in the
sprinkler systems, with a maximum value of 39.6 mm. In two of the evaluations, the application
matched the requirements, indicating a proper irrigation. In other five cases (22.7%), irrigation in
excess was verified (8mm in average).
The actual deficit was greater than the value of project in 15 (68.2%) of the evaluated properties,
with an average difference of 8.2 mm, and a maximum value of 28.7 mm between them. In seven
cases (31.8%) the actual deficit was inferior to the value of project, indicating a precocious
irrigation.
The mean uniformity distribution coefficient (UDC) was 79.1%, inferior to the mark of
excellence (UDC90%). Of the 33 evaluations, only four (12.1%) presented UDC inferior to the
mark of inadequacy for the system (UDC60%). In 10 systems (30.3%), the coefficient were above
the UDC90%.
xxxviii
The mean Christiansen uniformity coefficient (CUC) was 78.6%, above the value considered
inadequate (CUC75%), but inferior to the considered excellent (CUC85%). In only five of the
evaluations (22.7%), values observed were found to be bellow the inadequate. In seven cases
(31.8%), the CUC were above the excellence mark.
Water application uniformity was, in general, found to be greater in localized irrigation than in
sprinkler systems. Evaporation and drift losses were, in average, 10% greater in conventional
sprinkler systems (12.6%) than those in center pivots (8%).
Application efficiency regarding the 25% smallest application depths (Eq) varied from 3.8 to
97.7%, with an average value of 79.1% (slightly bellow the 85% mark, considered excellent for
localized irrigation). The efficiency regarding the 50% smallest applications (Eh) varied from
86.2 to 41.1%, with an average of 71.5%, bellow the 80% considered excellent for sprinkler
systems.
In 27 of the evaluations (81.8%) in properties with localized systems, the actual index of
adequacy regarding the 25% smallest application depths was less than one, indicating insufficient
irrigation. In two cases it was equal to one (adequate irrigation) and in four cases it was greater
than one (excessive irrigation). In 19 evaluations (57.6%), the actual index was smaller than the
value of project, indicating that irrigation occurred after the right time. In two cases (6%), the
index was equal to one, attesting application at the proper moment, and in other 12 (36.4%), the
actual index was greater than the project value, indicating that irrigation was made before the
scheduled time.
In 77.3% of the evaluations in sprinkler systems, the actual index of adequacy regarding the 25%
smallest applications was inferior to one, indicating irrigation with deficit. In three cases it was
equal to one (adequate irrigation) and two cases greater than one (excessive irrigation). In 15
properties (68.2%), the actual index was inferior to the project index, indicating a late irrigation.
In two cases (9.1%), the indices matched, indicating irrigation on schedule, and in five (22.7%)
the actual index was greater, confirming an irrigation before the time.
If the proper irrigation management were adopted, 63.9% of the water applied in localized
irrigation systems and 43.1% of the applied in sprinkler systems could have been saved.
The Paracatu River, tributary of the S„o Francisco, has a 45,600 km≤ drainage area. It covers
Municipalities in Northwestern Minas Gerais and Eastern Goi·s, besides the Federal District.
Historically, these areas correspond to old occupancies, being mining and livestock raising the
activities for the beginning of the settlement (ANA, 2002).
Its productive basis is supported by the agriculture and livestock raising sector, main provider of
jobs and income. Agriculture is predominantly composed of seasonal cultures. Nevertheless, the
implementation of governmental plans and programs focused in this sector, in the end of the 70's
and throughout the 80's, notably the PLANOROESTE, has been contributing to boost agriculture
in the Basin, particularly irrigated agriculture. (ANA, 2002).
As to the current use of the water resources, the shares of surface and groundwater in the
Paracatu Basin has the following characteristics (Ferreira e Euclydes, 1998):
xxxix
∑ The greater exploitation centers are concentrated in the Municipalities of Paracatu and
UnaÌ;
∑ the distribution of the use of groundwater shows that 68% of the total used volume is for
public purposes, 20% for livestock consumption 9.6% for domestic use and 1.6% for
agriculture;
∑ the water supply systems account for 55% of the total exploitation of groundwater;
∑ the use of surface water for industrial purposes is still very limited, while the use for
irrigation is already resulting in conflicts in some regions.
The Verde Grande Rio Basin covers an approximate area of 31,000 km2, with 87% in the
territory of Minas Gerais and 13% in the State of Bahia (SEAPA, 1999). This Basin is
responsible for a significant part of the changes verified in Northern Minas' the productive basis,
where the two most important poles of economic development, Montes Claros e Jana˙ba, are
located (Ferreira e Euclydes, 2002).
As established in the Federal Constitution, the Verde Grande River Basin is constituted of water
courses belonging to the Union (such as the Verde Grande and the Verde Pequeno Rivers) and by
rivers belonging to the States of Minas Gerais and Bahia. This demonstrates the complexity of
the management of the water resources in the Basin, which is aggravated by the existence of
many institutions with diverse, and sometimes identical, attributions (Ferreira e Euclydes, 2002).
The use of the water resources in the Verde Grande River Basin presents the following
characteristics (SEAPA/RURALMINAS/TECNOSOLO/ EPTISA, 1999):
∑ Approximately 8% is used in agriculture, with 0.65% corresponding to irrigated
agriculture (20,000 ha);
∑ The greatest water deficits are verified in the Gorutuba River Basin and in the Middle
Verde Grande River, upstream from the City of JaÌba.
∑ The irrigation water demand (398.16 hm≥/year) is the best indicator of the limits of
water availability in the Basin, both for its amount and for being an activity spread in
the entire Basin. It is responsible for 88% of the total demand in the region, not
considering the maintenance of a minimum residual flow. By considering it, the above
percentual would be reduced to 84%.
5. RECOMMENDATIONS
The developed work allowed the gathering of general information, which permit a global view of
the hydrologic regime, of the use of water by irrigation and of the destination of the agricultural
products accruing from this use. However, the fact that the investigation covered the entire Basin
made it difficult to obtain detailed information on the several factors impacting the noticed
behaviors.
xl
Based on the outcomes of this investigation, measures might be taken towards a more detailed
analysis, in smaller sub-basins, such as the Verde Grande and Paracatu River Basins. This type of
study will permit, given the smaller geographical area to be covered in the analysis, a more
thorough approach to the diverse factors affecting the availability of water and to the forms of
controlling them, to assure the optimized use of the resource.
It is also important, for optimizing the use of the water and for a proper management, the creation
of a unified database where inconsistencies, such as those verified with respect to the irrigated
area, for example, may be adjusted.
Taking into consideration that:
∑ The social and economic development in the S„o Francisco Basin is resultant, in gret
part, from the implementation of the irrigation projects, which changed and continue
changing the regional economy;
∑ this change occurred in a relatively short period, impairing the adoption and learning of
proper irrigation management techniques, as well as the preventive and corrective
maintenance of the equipment; and
∑ inefficient and inadequate irrigation implies in waste of water and energy, finite
resources which are scarcer at each day.
It is important to implement measures to increase water use efficiency in the basin, especially in
the agricultural sector.
In view of the great importance of the Paracatu and of the Verde Grande Rivers in the S„o
Francisco Basin, there is the intention to adopt them as pilot-basins, for the development of
actions aimed at improving the water use efficiency in these Basins, particularly in the
agricultural sector. It is an effort to produce information and knowledge which could be a basis
for actions in other Basins. Therefore, it is recommended that future works in these Basins
contemplate the following objectives:
∑ Updating of water users database;
∑ analysis of hydrologic regime, with evaluation of the spatial and temporal variations of
precipitation and discharges, since 1970;
∑ carrying out surveys of soil uses and evolution of irrigated areas, since 1970;
∑ quantifying irrigation efficiency in the basins;
∑ evaluating the impacts of anthropic actions in the Basin on the hydrologic regime;
∑ developing models for the integrated analysis of the impacts of multiple water users on
the availability of the resource; and
∑ develop and implement a training and capacitation program of irrigators.
xli