

INTEGRATED MANAGEMENT OF LAND BASED ACTIVITIES
IN THE SÃO FRANCISCO RIVER BASIN PROJECT
ANA/GEF/UNEP/OAS
Activity 3.2 - Conjunctive Use of Surface and Groundwater
in the Femeas River Sub-Basin
Executive Summary of the Final Report
CONJUNCTIVE USE OF SURFACE AND GROUNDWATER
IN THE FEMEAS RIVER SUB-BASIN
Salvador/Bahia
INTEGRATED MANAGEMENT OF LAND BASED ACTIVITIES
IN THE SÃO FRANCISCO RIVER BASIN PROJECT
ANA/GEF/UNEP/OAS
Activity 3.2 - Conjunctive Use of Surface and Groundwater
in the Femeas River Sub-Basin
Executive Summary
CONJUNCTIVE USE OF SURFACE AND GROUNDWATER
IN THE FEMEAS RIVER SUB-BASIN
Coordinator
Kátia Rejane Freitas do Nascimento
Superintendência de Recursos Hídricos - Bahia
Participants
Antonio Olivar Lima de Lima
Claudia Margaret Batista Vieira
Emanuel Ubiratan Barros
Ferdinando Yoshio Agapito Urasaki
Hans Dieter Max Schuster
Heráclio Alves de Araújo
Fernando Genz
José Pompeu dos Santos
Jairo Everton Moreira
João Ilton Ribeiro de Oliveira
Lúcia Maria Tenório de Carvalho
Paulo Henrique Prates Maia
Rosane Ferreira de Aquino
Zoltan Romero Cavalcante Rodrigues
January 2003
CONJUNCTIVE USE OF SURFACE AND GROUNDWATER
IN THE FEMEAS RIVER SUB-BASIN
EXECUTIVE SUMMARY
INTRODUCTION
In 1988, processes regarding the concession of rights to the use of water were initiated in the Rio
das Femeas Sub-Basin, in Western Bahia. Today, some of the water sources have been used up to
their maximum legally exploitable limits, extinguishing the possibility of additional concession
by the SRH (Superintendence of Water Resources). From this point on, some farmers have been
using the groundwater resources, drilling deep wells with great discharges (in the order of 500
m3/h), for center-pivot irrigation.
However, the lack of studies to determine the aquifer's hydrodynamic parameters, its real
exploitation capacity, recharge areas and pumped volumes, as well as the relation between
ground and surface waters.
In this context, the Rio das Femeas Sub-Basin was selected as the pilot-area for Activity 3.2, part
of the Integrated Management of Land Based Activities in the San Francisco River Basin Project
(GEF/ANA/OAS/UNEP). The Activity is aimed at the definition of criteria for concession of
water rights, based on the conjunctive use of surface and ground water, in the area of study. The
actions implemented, from March 2001 to October 2002, viewed the following specific
objectives:
· Identifying hydrogeological characteristics of the Sub-Basin's aquifers;
· Identifying hydrologic characteristics of the mains water bodies;
· Determining hydrodynamic parameters for using in the simulation models;
· Investigating the relation between surface and ground waters;
· Defining criteria for concession of water rights and management of the groundwater.
The planning and work were based on a cartographic map in a 1:100,000 scale, where the
locations for drilling the wells, pumping tests and water table depth were defined, for estimating
the hydrodynamic parameters and identifying the hydrogeological characteristics of the aquifer.
Planning and implementation of the hydrometric network, based on water availability studies,
allow the monitoring of the Sub-Basin's surface water resources, providing data on precipitation,
stages and river flows. The hydrologic year was considered as going from August 2001 to August
2002.
At this stage, hydrodynamic models were applied to the aquifer. Integration of the
hydrogeological and hydrodynamic studies shows the relations between surface and groundwater.
Understanding the factors controlling the surface and groundwater hydrology in the Sub-Basin
was useful for defining the criteria for concession of water rights.
i
1. PHYSIOGRAHICAL
CHARACTERIZATION
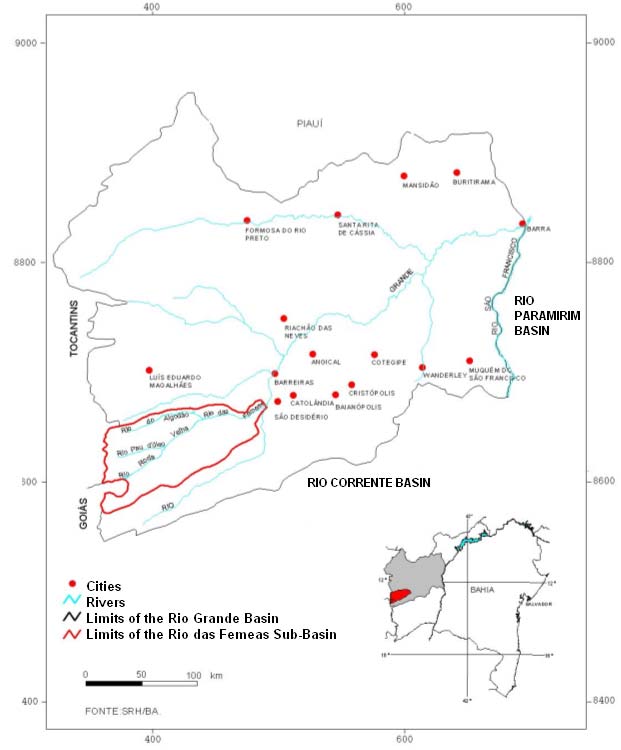
The Rio das Femeas Sub-Basin is inserted in the Rio Grande Basin, in the Western part of the
State, a tributary to the left margin of the Middle São Francisco. It is located between parallels
11°15' S and 13°30' S and meridians 43°45' W and 46°30'W, spread over a 6,300 km²,
representing 42% of the Municipality of São Desidério.
Figure 1. Location of the Rio das Femeas Sub-Basin.
ii
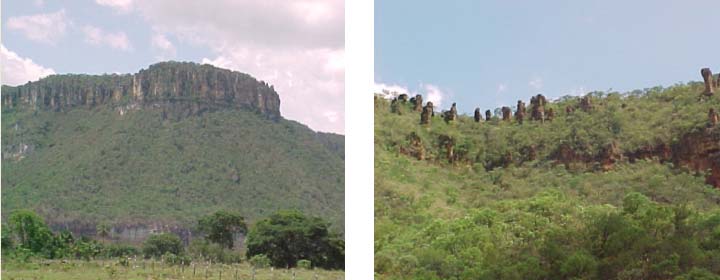
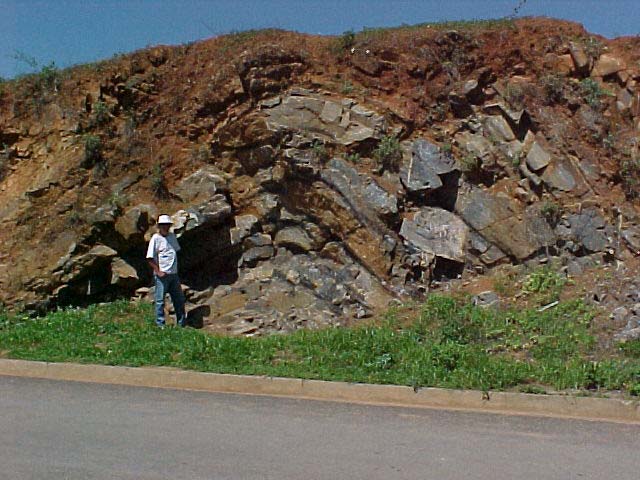
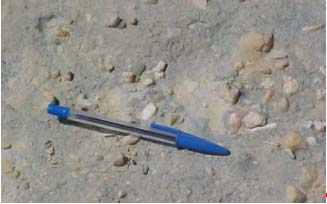
In terms of geomorphology, the Sub-Basin is characterized by an extensive plateau, the
"Chapadão do Gerais", with altitudes varying from 600 to 1,000 m. The most remarkable
scenery in the western part of the region is the Serra Geral de Goiás (Picture 1), represented by a
200 to 300 m rock wall. It presents tower type morphology, characteristic of mountain crests,
where the fine sandstone, turned into silicate (Picture 2), resists to bad weather and inhibits the
erosion processes.
Picture 1. View of the Serra Geral de Goíás.
Picture 2. Tower morphology, typical of
the Serra Geral de Goiás.
The area under study is characterized by mildly inclined planes, molded on sandstones of the
Urucuia Formation. The relief is found in altimetric levels between 500 and 900 m, with the
highest sectors in the eastern border, forming the water divide for the São Francisco and
Tocantins Rivers Basins. The cerrado is the prevailing vegetation and latosols are the
predominant soils.
The meteorological conditions in the Region determine the flowing type of climates: Humid
(B1wA'), a week defined dry season in the winter, with rainfalls in the spring and summer;
humid to sub-humid (C2wA'), with moderate water excess in the winter (EP>1,140 mm).
The precipitation regime includes the range of 900 to 1,200 mm isohyets, with annual
evaporation rates around 1,580 mm. Rainfall season goes from October to April, when 94% of
the total precipitation occurs. The other months are practically dry. River flow is perennial,
maintained in the dry station by exudation of the Urucuia Aquifer. Mean annual temperature is
23.2ºC. Mean monthly humidity varies from 45 to 79%.
2.
CATOGRPHIC PROCESSING AND SATELLITE IMAGES
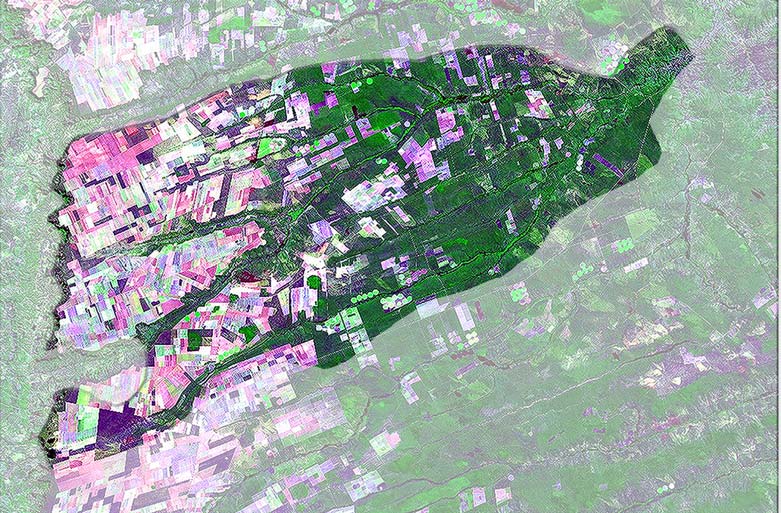
For elaboration of the cartographic map, the pictures in the sheets of the Systematic Survey in the
1:100,000 scale, in which the semi-automatic vectorization was applied. The orbit-point 220/69
scene, of the Landsat Satellite, was used, with the insertion of boundaries and plotting of tubular
iii
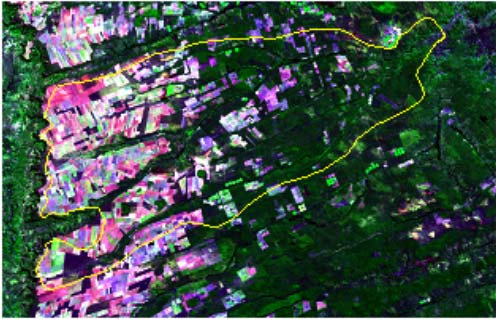
wells and pluviometric/fluviometris stations, as well as other relevant information for the area of
study (see Figure 2).
Figure 2. Satellite image from the Rio das Femeas Sub-Basin.
3. HIDROLOGICAL
CHARACTERIZATION
3.1. WATER RESOURCES MONITORING
Monitoring of water resources is an important tool of the National Water Resources Policy
(Federal Law 9,433/97, of the 8th of January, 1997). Aiming at the characterization of the
hydrological regime and to support the definition of criteria for concession of water rights, the
monitoring network of the Rio da Femeas Sub-Basin was installed, complementing the one
operating in adjacent area, operated by ANA.
3.2. MONITORING NETWORK
The Rio das Femeas Sub-Basin's monitoring network makes use of data from pluviometric.
Fluviometric and evaporimetric stations. The Activity installed six fluviometric stations (see
Chart 1), three pluviometric stations and one evaporimetric (see Chart2), both shown in Picture 3.
iv
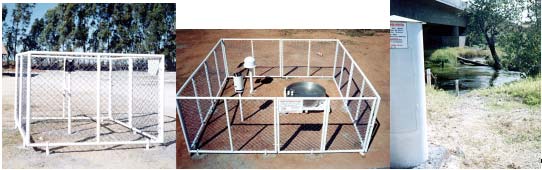
Picture 3. Hydrometric network equipment.
3.3. HYDROLOGIC BEHAVIOR
3.3.1. General Hydrology of the Rio das Femeas Sub-Basin
Fluviometric and pluviometric data were analyzed for the hydrologic year from September to
August.
Chart 1. Fluviometric stations installed in the Rio das Femeas Sub-Basin.
Coordinates [UTM]
N. Station
Rio
Area [km2]* Type
East North
F1 BR-020
Mosquito
River
399185
8597072
376
FD
F2 Mosquito
Mosquito
River
407620
8597020
415
FRD
F3 Estivas
Rio
Estivas
478252
8619244
2,04
FRD
F4 Fazenda São João
Rio das Femeas
403514
8619360
281
FRD
F5 Fazenda Soya
Pratinha River
433107
8594252
103
FRD
F6 Femeas Grande
Rio das Femeas
472657
8621176
4,78
FRD
Legend: FRD Fluviographic station with discharge measurement; * Area marked in maps in a 1:100.000 scale.
Chart 2. Pluviometric and evaporimetric stations installed in the Rio das Femeas Sub-
Basin.
Coordinates [UTM]
N. Station
Type
East North
P1 Fazenda
Rio
Brilhante
420942
8584738
PR
P2 Fazenda
Buritis
450971
8602356
PR
P3 Fazenda
Palotina
371369
8601906
PR
P4
Roda Velha de Cima
397688
8588880
ER
Legend: PR- Pluviographic station; ER - Evaporimetric Station.
v
Charts 3 and 4 present the data of fluviometric and pluviometric station operated by ANA, in the
Basin and surroundings.
Chart 3. ANA operated fluviometric stations.
Coordinates [UTM]
Area
N. Station Code
River
Start
Type
East North [km2]
FA1 Roda Velha de Baixo 46420000 Roda Velha
408822
8595864
895
12/2001 FD
FA2 Derocal
46455000 Das Femeas
486714
8628028
6.300
01/1977 FRD
Legend: FRD Fluviographic station with discharge measurement; FD Fluviometric station with discharge measurement
Chart 4. ANA operated pluviometric stations
Coordinates [UTM]
Altitude
N. Station Code
Municipality
Start
Type
East North [m]
PA1 Derocal 01245005 São
Desidério 487047
8627905
502
06/1972 P
Fazenda
PA2
01245014 Barreiras
411465 8659415
725
07/1984 P
Joha
Roda
PA3
01245015 São
Desidério 397086 8588770
761
07/1984 P
Velha
Aurora do
Aurora do
PA4
01246001
347055 8594012 700 10/1973
P
North
Tocantins
Fazenda
PA5
01346007 Correntina
384954 8526076
824
06/1981 P
Prainha
Legend: P - Pluviometric Station.
3.3.2. Pluviometric Characterization
In terms of annual precipitation, the gradient increases from mouth to headwaters, in the Sub-
Basin. Distribution of mean monthly precipitations is practically the same for all stations.
Rainfall season is well defined, spreading from October to April, being almost null in June, July
and August (see Figure 3). In the medium part of the Sub-Basin, there may be significant rainfalls
in February and March.
3.3.3. Fluviometric Characterization
The Derocal Station is located practically at the Rio das Femeas mouth, before the confluence
with the Rio Grande, turning possible a global view of the Sub-Basin's fluviometry and the
analysis of the hydrologic behavior in the past 22 years.
The mean annual flow of the Rio das Femeas is 52.17 m³/s. The maximum and minimum
recorded daily flows were 214 m³/s and 29.9 m³/s, respectively. It was noticed that minima
vi
annual flows have the same behavior as the mean flows and, given the significative values (>50%
of the mean). they represent the potential contribution from the groundwater.
Figure 3. Distribution of the mean monthly precipitations along the year.
3.3.4. Rainfall and Monthly Flows
Analysis of flow responses to monthly precipitations shows the lack of correspondence between
the two, and the time lag between the maximum precipitation and the maximum flow. Some
additional considerations must be made for the Sub-Basin:
· Field capacity must be fulfilled with the first rains.
· In the analysis of the daily flows, it was verified that the lag time between rainfall and
flow augments from headwaters (2 days)to the mouth (10 days).
· The data are compounded according to the monthly calendar and it might happen that an
event nay be divided into two, with different characteristics.
· The groundwater divide does not coincide with the topographic one, at headwaters.
· The spatial distribution of the means might not be well represented by the weighting of
the Thiessen Method.
It must be considered that the system presents a lagging confirmed by the daily data, which also
affects runoff response. The greatest precipitation in the hydrologic year, in most sub-basins,
occurred in November, without implying in the peak flow. It is possible that precipitation was
still fulfilling the field capacity.
In the hydrogeological study, the groundwater potentiometric level map indicates that the
groundwater divide is approximately 30 km before the topographic divide, where the river's
drainage network is formed. Thus, part of the precipitation and of the groundwater flow at
vii
headwaters must run towards the State of Tocantins. Therefore an erratic water divide is
expected, in terms of water table elevation, varying the areal contribution to rivers in the basin.
3.3.5. Relation between Physical Factors and Flow
Based in the previous analysis, other physical factors were chosen for establishing a relation with
the flow, besides the variation as function of drainage area. For the latter, it is confirmed the
augmentation of mean flow proportionally to the drainage area. On the other hand, specific flow
presented two opposite trends.
For analysis of river length, values were picked from the topographic chart in a 1:100,000 scale.
In the case of the river carving, considered as the degree of dive of the river canal into the
aquifer, the altitude of the fluviometric station was estimated in the topographic chart and the
potentiometric level obtained in the hydrogeological study (Chart 5).
Chart 5. Area, river length, altitude, potentiometric level and river carving.
Altitude
Station
Area (km²)
River lenght (km)
Altitude (m) Potentiometric level (m)
Carving (m)
São João
281
39
755+
756
1*
BR-020 376
26
753
771
18
Mosquito 415
36
735
764
29
Soya 103
22
745+
746+
1*
Estivas 2204
138
644
650
6
F. Grande
4078
110
650
655+
5
46420000 895
39
725
764
39
46455000 6300
118
635
-
1*
Note: + estimated value; * adopted as minimum value, in view of non-existence of data.
Regarding the degree of carving of the fluvial canal, the potentiometric data was obtained in two
occasions: July of 2001 (most part of the total measurements) and June of 2002, in almost the
same hydrological conditions. The minimum flow in June of 2002 was used for comparison with
the carving.
It was noticed that at headwaters (higher altitudes) the discharge increases almost proportionally
to the carving, while in the lower reaches the flow is inversely proportional to the decrease in
altitude.
Stations with greater carvings, representing more reliable data, pointed to a specific production of
discharge at an approximate rate of 0.19 m³/s/m. Therefore, it is assumed that the topographical
contours of the Sub-Basin (or of the river bed) with reference to the aquifer directly affects the
river discharges.
viii
3.3.6. Characterization Hydrologic Period
The characterization of the hydrologic period tried to associate the outcomes of the study to the
system's climatic conditions (humid, medium or dry), within a longer perspective.
Monthly precipitation in the period were inferior to the historic mean, except for the months of
October and November of 2001. Rainfall distribution along the year remained the same, even
though the maximum was anticipated from December to November. Total precipitation in the
monitoring year was equivalent to 1,044.1 mm, inferior to the historic mean. As the minimum
precipitation was inferior to the mean, the monitoring period was considered as intermediary,
between dry and medium.
Figure 4, showing annual rainfall and discharges, emphasizes that the system's response depends
on precipitations occurred in the anterior years. It also confirms the general reduction trend for
the discharges.
Figure 4. Annual rainfall and discharges in the Sub-Basin (1978 - 2001)
Comparing the different results, regarding the ranking of precipitation and discharges within the
historic data, it is noticed that discharge was more affected. This might be a consequence of the
several years with bellow the average precipitations, in the second half of the 90's, and also due
to the water intake for irrigation.
ix
3.4. CHARACTERISC DISCHARGES
The maxima, mean and minima river flows provide subsidies for project development,
monitoring, preservation/restoration of water resources and adjustments to civil work.
3.4.1. Maxima, mean and minima flows
The flows of interest must express the characteristics of the system, at least for a complete
hydrologic cycle. Characteristic discharges can be determined for monthly or yearly time
intervals.
It is verified that, almost always, variation of the monthly minima is related to monthly flow (July
to September), within normality, as aquifer contribution is more significative to these discharges.
As for the monthly maxima (November to March), behavior is different, as precipitation is more
important to surface runoff, with emphasis to intensity.
In the larger drainage areas, in view of the greater lag time for the runoff, there is a delay in the
hydrologic response. The annual characteristic discharges are presented in Chat 6.
Chart 6. Characteristic Discharges in the Rio das Femeas Sub-Basin.
F4-Fazenda
F1-
F2-
F5-
F3-
F6-Femeas Roda Velha Whole
São João
BR-020
Mosquito Fazenda Estivas Grande
46420000 Basin
Soya
46455000
Mean 0.825
4.17 6.12
0.189 12.12
28.51 7.90
42.10
Maxima
1.144
6.15 10.97 0.225 19.15
50.25 12.35 65.36
Minima
0.749
3.61 5.07
0.124 9.68 22.04 6.60
29.34
Med/min
1.10
1.15 1.21 1.52 1.25
1.29 1.20 1.43
Max/min
1.53
1.71 2.16 1.81 1.98
2.28 1.87 2.23
Chart 5 also presented the factors of proportion between mean and minimum and between
maximum and minimum discharges. The first factor represents the contribution of baseflows and
the second highlights the amplitude of discharge variations. As climate, relief and soil type are
practically the same for the entire drainage area, the proportion factors have equal magnitudes.
There is a greater variation in the maximum to minimum discharges relations as consequence of
the fluviometric behavior.
In the stations with higher sensibility, proportion factors are greater than 2. The chart shows that
the mean discharge is superior to the minimum in 10 to 43% of the cases (except for the value
from Fazenda Soya), indicating a strong contribution of the groundwater flow.
Regarding the complete data series of the "Whole Basin" station, it is worth mentioning that
minimum flow in 2002 (29.34 m³/s) is inferior to the minimum recorded for the whole period
(29.9 m³/s). This results from the occurrence of a drier year (even though the minimum flow is
not the minimum in the history see item 3.3.6), aggravated by intakes for irrigation.
x
3.4.2. Curve of Permanence
The curve of permanence evaluates the frequency of occurrence of discharges in a given section
of the river. It associates the river discharge with its permanence, for a time in which flows are
equal or greater than the specified value. In Figure 5, the values of the curve of permanence for
each station were divided by the mean annual flow, allowing the visualization of the behavior of
discharges, in a same scale. Those are adimensional curves of permanence.
Figure 5. Adimensional curves of permanence (Rio das Femeas).
Setting the 50% permanence as the analysis divide, it is noticed that, for the longer flow
permanencies, the curves for all stations are practically superposed. The exception goes to the F4-
Fazenda São João and F5-Fazenda Soya stations, which had problems in defining the rule-curves
and the data came out with poor quality.
On the other hand, for the shorter permanencies, divergences occurred only for values under 5%,
with emphasis for the Mosquito, Estivas and Femeas Grande stations, which have a more
susceptible hydrological behavior. Again, the F4-Fazenda São João and F5-Fazenda Soya stations
did not present this tendency.
3.5. WATER BALANCE
In the Rio das Femeas Sub-Basin, the water balance (Chart 7) was estimated for the
September/2001 to August/2002 monitoring period, considering the entire drainage basin.
Considering the balance for 2002 and the findings by Pimentel et al (2000), it is verified that
groundwater contribution to river discharges is superior to 90%, characterizing its domain over
the production of flows in the Sub-Basin.
xi
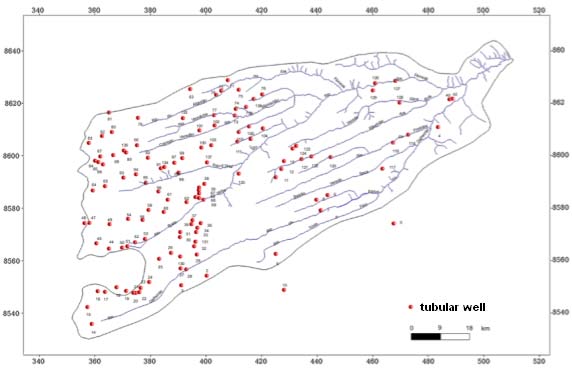
Chart 7. Simplified water balance for the Rio das Femeas Sub-Basin.
Area
P
Q
I + ET
I+ET
C
minGW
Mean GW
(km²)
(mm)
(mm)
(mm)
(%)
(%)
(mm)
(%)
(mm)
(%)
F4-Fazenda São João
281
1231,1 92,6
1138,6
92,5
7,5
84,1
90,8
87,2
94
F1-BR-020 376
1235,5
344,9
890,6
72,1 27,9 302,7 87,8 330,3 96
F2-Mosquito 415
1236,7
458,9
777,8
62,9
37,1
377,1
82,2
412,3
90
F5-Fazenda Soya
103
1018,0 57,1
960,9
94,4
5,6
38,0
66,6
55,6
97
F3-Estivas 2204
990,5
171,2
819,3
82,7
17,3
138,5
80,9
156,8
92
F6-Femeas Grande
4078 1080,6 217,8
862,8
79,8
20,2
170,4
78,3
200,8
92
Roda Velha-46420000
895
1246,7 274,8
971,9
78,0
22,0
232,6
84,6
253,4
92
Toda Bacia-46455000
6300 1044,1 207,7
836,4
80,1
19,9
135,4
65,2
200,8
97
P = precipitation in the period; Q = river flow; I = Infiltration; ET = Evapotranspiration; minGW = minimum groundwater
flow; Runoff= VE minGW; C = runoff coefficient = Q/P.
4. HYDROGEOLOGICAL CHARACTERIZATION
4.1. WELL CADASTRATION
Figure 6 shows the 139 registered wells. The survey detected that only three wells have a
concession to the use of water, the remaining are used only for domestic purposes, with
discharges that do not require a concession.
Figure 6. Location of tubular wells in the Rio das Femeas Sub-Basin.
xii
4.2. GEOLOGICAL RECONNAISSANCE
The area under study is inserted in the western sector of the São Francisco craton, in the northern
part of the basin. The most important geological unity is the Urucuia Group, subdivided in the
Posse and Serra das Araras Formations (Campos, 1996). There are also emergences of the
Bambui Group and of Quaternary alluvial sediments (Figures 7 and 8).
· Bambuí Group / São Desidério Formation
This formation is composed by dark gray to black calcium. At the entrance of the City of São
Desidério, these litologies are folded, with NW vergence (Picture 4).
Picture 4. Folds in the São Desidério Formation (calcium).
Figure 7. Geological Map of the Femeas Sub-Basin.
xiii
· Urucuia Group
This sedimentary package covers almost the entire Rio das Femeas Sub-Basin, augmenting
thickness from East to West and from South to North. It achieves thicknesses of hundreds of
meters, laying discordantly on the Bambuí Group's calcium. It is composed by cretaceous
continental sediments, of fluvial, alluvial, lake and Aeolian origin. Analysis of the tubular wells'
profiles and their correlation with field geological surveys revealed that the upper layers of the
Urucuia Group, with thicknesses varying from 80 to 150 m, is silicified, what disguises the
sandstones' physical attributes.
Figure 8. Geological Profile of the Region.
The Posse Formation is formed by fine to medium sized Aeolian sandstones, with rounded to
sub-rounded quartz grains and great port crossed stratifications, with a classical geometry of dune
migration (Picture 5). Secondarily, there are occurrences of clay lenses and conglomeratic beds,
composed by pebbles and blocks of fine sandstone, immersed in clayey sand matrix.
xiv
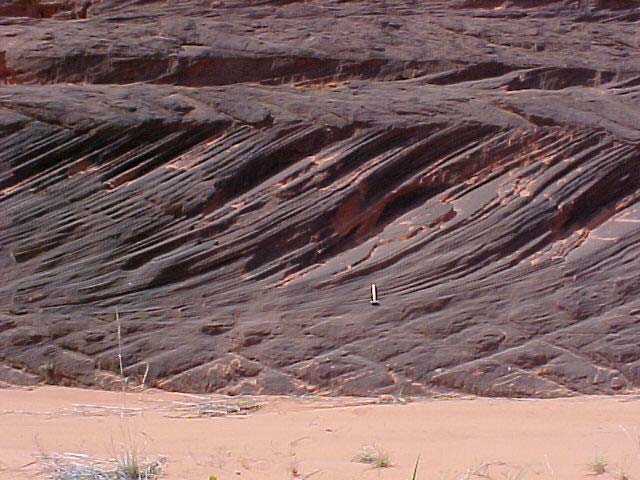
Picture 5. Paleodunes of the Urucuia Group, in the road to Taguatinga (TO).
The Serra das Araras Formation, resting above the sediments of the Posse Formation, makes
evident the changes from a deserted to a humid environment, with predominance of fluvial
deposits on the floodplains. It is characterized by yellowish and reddish white sandstones, clays
and intercalated conglomerates (see Picture 6).
Picture 6. Fluvial Conglomerates in the Serra das Araras Formation.
· Alluvial Covertures
The alluvial sediments are distributed filling the main drainage channels, spread over the
floodplains. They consist mainly of sands, gravels and clays, of dark gray and light gray colors,
resulting from recent fluvial re-processing of detritic material.
xv

·
Tertiary Tectonics
It corresponds to the tectonics occurring throughout the Sub-Basin, determining the observed
rivers' rectangular pattern of drainage, with associated faults and fractures, with predominant
N5--70E direction (see Figure 9). The situation is well represented in the Bambuí Group, due to
a probable reactivation of faults in this Group, in the Tertiary.
4.3. GEOPHYSICAL SOUNDING
Among the techniques for geophysical sounding, the electrical methods are commonly used, due
to the possibility of being used in several areas, such as hydrology, mining, geology, geotechnics
and environmental. Adoption of these methods allow the investigation of important parameters,
regarding the conjunctive use of surface and groundwater, such as lithology distribution in the
underground, saturated levels, water salinity and depth to the bottom of the aquifer.
Obtaining data with electrical geophysics in the Rio das Femeas Sub-Basin was accomplished in
two stages, in a total of 80 electrical soundings (electrical resistivity and induced polarization,
with placement of Schlumberger type of electrodes). Figure 7 shows the sounding works.
Picture 7. Collecting data with geophysical methods.
For all soundings, graphs were plotted (apparent resistivity versus AB/2 spacing), in order to
guarantee the precision of the measurements, as it would allow the immediate detection and
correction of any abnormality. All the VES's (vertical electrical soundings) presented reliable
data and, invariably, indicated sloping terminals, with a regional substratum much more
conductive under the sandy layers.
xvi
Based on the layout of the water table or in the distribution of saturated levels in the aquifer
(Figure 10), it was verified that the flow is approximately uniform and, for most of the areas, it
runs from West to East. It was verified the occurrence of some closed contours, which can be
associated to the current groundwater exploitation in the Sub-Basin. The zone near the border of
the Sierra presents static levels with depths over 200 m, where the water movement is inverted
from eastern bound to westerns bound.
Figure 9. Sub-Basin's drainage network and diagram of faults and
fractures of the Bambuí Group.
SE-42
200 m
8640000
190 m
SE-44
180 m
SE-43
SE-32
SE-41
170 m
SE-45
SE-48
SE-78
SE-55
160 m
SE-79
SE-54
SE-04SE-03
8620000
SE-31 SE-80
SE
S-0
E 5
-57
SE-58
150 m
SE-73
SE-59
SE-60
SE-06
SE-30
SE-72
SE-56
140 m
SE-70
SE-07
SE-77
SE-12
SE-29
SE-49
130 m
SE-76
SE-69SE-71
SE-13
SE-75
SE-14
SE-50
SE-28
120 m
SE-38
SE-74
SE-15
SE-68
8600000
SE-16
SE-67
SE-17
SE-51
SE-40
SE-18
110 m
SE-27
SE-19
SE-20
SE-52
SE-39
SE-53
100 m
SE-23
SE-22
SE-11
SE-61
90 m
SE-10
SE-64
SE-62
SE-09
80 m
SE-08
SE-63
8580000
SE-02
SE-01
70 m
SE-25
SE-26
60 m
SE-24
50 m
SE-46
40 m
SE-21
SE-47
SE-66
8560000
30 m
20 m
SE-65
10 m
0 m
8540000
360000
380000
400000
420000
440000
460000
480000
Figure 10. Water table elevation obtained through geo-electrical soundings (red symbols
are the sounding centers and the blue lines the hydrography).
xvii
The variation in the topography of the aquifer's bottom is shown in Figure 11, which indicates a
narrowing in the groundwater reservoir, from a 400 m thickness in the western border of the
plateau to less than 100m in the eastern edge.
SE-42
8640000
440 m
SE-44
420 m
SE-43
SE-32
SE-41
400 m
SE-45
SE-48
SE-78
SE-55
SE-79
380 m
SE-54
SE-04SE-03
SE-31 SE-80
SE-05
SE-57
SE-58
SE-73
SE-59
360 m
SE-60
SE-06
SE-30
SE-72
SE-56
SE-70
SE-07
340 m
SE-77
SE-12
SE-29
SE-49
SE-76
SE-69SE-71
SE-13
320 m
SE-75
SE-14
SE-50
SE-28
SE-38
SE-74
SE-15
SE-68
300 m
SE-16
SE-67
SE-17
SE-51
SE-40
SE-18
SE-27
SE-19
280 m
SE-20
SE-52
SE-39
SE-53
SE-23
SE-22
260 m
8590000
SE-11
SE-61
SE-10
SE-64
SE-62
240 m
SE-09
SE-08
SE-63
SE-02
220 m
SE-01
SE-25
SE-26
200 m
SE-24
180 m
SE-46
SE-21
160 m
SE-47
SE-66
140 m
120 m
SE-65
100 m
80 m
8540000
360000
380000
400000
420000
440000
460000
480000
Figure 11. Topography of the aquifer's base.
4.4. DETERMINING HYDRODYNAMIC PARAMETERS
The results of the hydrogeological studies were based on the aquifer tests data (pumping test),
from existing wells in the Rio das Femeas and Rio dos Cachorros Sub-Basins. The adjacent
basins are both inserted in the geological/hydrogeological context of the Urucuia Aquifer,
presenting similar hydrodynamic behaviors.
Comparing with the results obtained by the SRH team, at the Campinas, Santo Antônio and
Edilio Polleto Farms, showed approximate values for transmissivity (1,394 m2/day and 1,403
m2/day, respectively) and storage coefficient (1.85x10⁴ and 2.05x10⁴, respectively), as the
aquifer's elastic responses.
Using the Newman Model (1075) and data from Fazenda Campinas (90 m deep well) and
Fazenda Santo Antônio, the effective porosities were estimated as 1.25x10² and 1.43x10⁻²,
respectively. These values are characteristics of a non-confined aquifer with delayed drainage,
within the Urucuia block, as inferred from geological observations. The siliceous cementation,
post deposition, obstructed part of the primary porosity of the top sediments, conferring the
granular aquifer these semi-free characteristics.
Values in Chart 8 reveal a remarkable uniformity, if compared to transmissivity results obtained
at Emilio Polleto (wells P4 and P5), Campinas and Santo Antônio Farms. In the latter, however,
xviii
the hydraulic conductivity, estimated with the thickness inferred by the geophysics, reveals a
value significantly higher than in the other two.
Being true a 50 m aquifer thickness, an important faciologic variation would be confirmed for the
area, probably with coarse sandy sediments, with high uniformity and roundedness.
Chart 8. Summary of hydrdynamic parameters inn the Urucuia Aquifer
Well
T(m2/day)
K (m2/h)
Ss Sy Method Sub-Basin
Edilio Poletto P4
1.973
0.303
-
-
Jacob
Rio do Cachorro
Íris Basso
2.956
0.439
-
-
Jacob
Rio do Cachorro
Edilio Poletto P4 P- P3 0
1.397
0.360
2.6x10 4
-
Jacob
Rio do Cachorro
Edilio Poletto P4 P P3 0
1.728
0.468
-
-
Jacob
Rio do Cachorro
Edilio Poletto P4 P P3 0 1.411 0.390 1.5x10
4
-
Jacob
Rio do Cachorro
Edilio Poletto P4 P P4 0
1.137
0.316
-
-
Jacob
Rio do Cachorro
Fazenda Campinas P250 0 1.321 0.243 7.5x10
4
-
Neumann
Rio das Femeas
P
1.542
0.284
-
-
Jacob
Rio das Femeas
P90 0 1.467
0.247
3x10
4 1.25x10
2 Neumann
Rio das Femeas
Fazenda Santo Antônio
1.506
1.580
5.9x10⁻⁴
1.43x10⁻²
Neumann
Rio das Femeas
P pumped // O - Observed
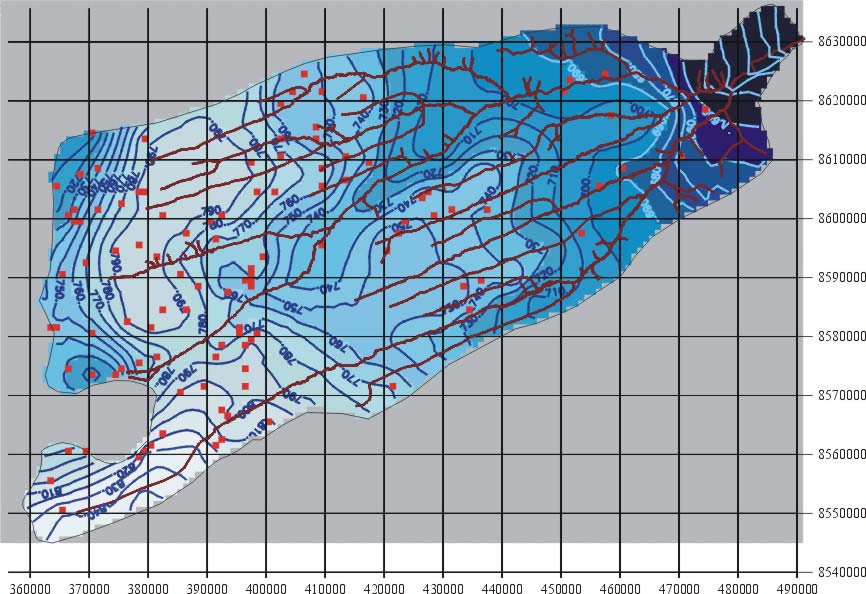
Elaboration of the map of water table elevations showed, regarding the spatial distribution of the
equipotential lines, two important aspects: (i) The rivers depend, basically, on the Urucuia
Aquifer (the base flows correspond to the volume of water returned by the aquifer); and (ii) there
is a segmentation of the aquifer, by a groundwater divide, in the North-South direction, dividing
the underground flow towards East, to the Femeas Sub-Basin, and towards West, to the Tocantins
River basin (see Figure 12).
Besides this divide, all the other are parallel to the surface water divides in the secondary Basins.
On the other hand, it is noticed that and steeper to the West, with values varying from 10-4 and
10-3 to 10-2, respectively.
This feature is surely associated to the differences in transmissivity, and might be due to variation
in aquifer saturated thickness or to the variation in hydraulic conductivity, or even to both of
those.
xix
Figure 12. Potentiometric map of the Urucuia Aquifer (Rio das Femeas Sub-Basin).
As the Urucuia Aquifer is limited by the sediments of the Bambuí Group, to the East, and with
the Crystalline Complex, already in the Mosquito River Basin, to the West, the formulation of the
hydraulic model must consider those two boundary conditions. Physical boundaries are always
preferred to the artificial hydraulic boundaries, as they affect permanently the aquifer's
groundwater flow pattern (Kresic, 1997).
4.5. WATER QUALITY
4.5.1. Methodology
The work considered 98 points, including deep tubular wells, cisterns and rivers, monitored in
two campaigns (May of 2001 and June of 2002). Each field campaign included analyses and
water quality soundings (Horiba U-10 and ECOKIT). For analysis of physical and chemical
parameters and of pesticides, samples were collected in especial flasks (Picture 8), packed in
foam boxes with ice and sent immediately to the laboratory, in intervals inferior to 24 ours.
xx
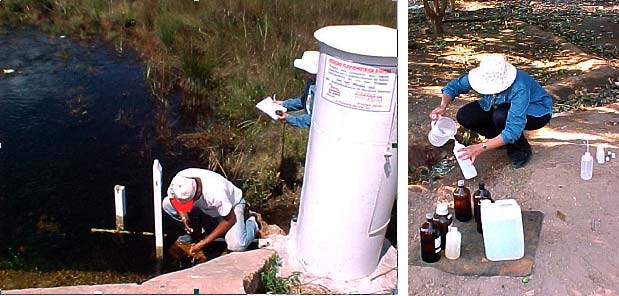
Picture 8. Coleta de amostras para análise em
4.5.2. Results and Discussions
The mean value of the errors in the analysis were estimated as 36.48 and 48.75, for 2001 and
2002,respectively. This indicates that the local waters are little mineralized, meaning that they
have low ion concentrations in their chemical composition.
The pH varied from 4.01 to 7.68, with a 5.48 average, characterizing waters as acid to little
neutral. According to CONAMA's Resolution 020/86, this value is bellow those defined for
classes 1, 2, 3 and 4. The spatial variation of pH, determined during the campaign of May/2001,
is shown in Figure 13.
Results for the analysis of organoclorate and organophosphorate pesticides detected values
bellow defined limits, indicating that even with agricultural activities that use those, water quality
has not been compromised yet.
The predominant ions in natural waters are Ca++, Mg++, Na++, Cl-, SO 2-
-
3 and HCO3 . The existing
sodium content in the water limits its use for agriculture. According to the WHO, the maximum
recommended sodium content in the water is 200mg/L (Fenzl, 1986). In the Rio das Femeas Sub-
Basin, mean sodium concentration was found to be 0.03 mg Na+/L.
In the 2001 and 2002 campaigns, no salinity was detected in the water samples, neither in surface
nor in groundwater. This characterizes a low salt concentration water, which might be used for
irrigation, without risks of soil salinization. A mean hardness of 15.3 mg CaCO3 /L was verified
in the 2001 campaign. In 2002, it was found a mean value of 3.35 mg CaCO3 /L, with a
maximum of 25.40 mg CaCO3 /L; indicating mild waters for the Basin.
The mean concentration of total dissolved solids (TDS) were 48.39 and 28.60 mg/L, for the 2001
and 2002 campaigns, respectively. Those values are characteristic of water suitable for both
xxi
human (maximum of 500 mg/L) and animal consumption (maximum 2,500 mg/L), and for
agriculture.
Figure 13. Spatial variation of the pH in the Femeas Sub-Basin (May/2001).
5. MATHEMATICAL MODELLING
A model aims at the hydrodynamic evaluation of surface and groundwater. The mathematical
modeling of the groundwater flow, based on information on water levels in wells, precipitation
and pumping tests, provides indicators that allow characterization of the hydrologic behavior
under critical situations, such as droughts and over-exploitation.
5.1. GENERAL EQUATIONS AND NUMERICAL METHODS
Today, only computational mathematical models are used in the complex analyses of aquifer
behaviors viewing studies related to water resources management. These models, employing
partial differential equations for the groundwater flow, help systematizing field information and
identifying areas requiring additional data.
xxii
5.2. CONCEPTUAL MODEL FOR THE FEMEAS SUB-BASIN
5.2.1. Model Schematization and Discretization
This work used the PMWIN model (Chiang & Kinzelbach, 1993 and 2001), a commercial
version of the MODFLOW (Mcdonald & Harbaugh, 1988), based on the Finite Differences
Method.
The external boundaries were assumed as no-flow boundaries, except for the western part, in
which a flow dependent on the water head was used. Only one Dirichlet type cell was used at the
Femeas' mouth. The internal boundaries, assumed as flow dependent on the water head, provided
the required conditions for simulation of perennial rivers. Drain cells were used for simulation of
the ephemeral rivers.
5.2.2. Field data analysis
Elaboration of the numerical model required activities to gather basic information, such as data
for the initial stationary model. From this field data, it was possible to plot maps indispensable to
begin the modeling (Figure 14).
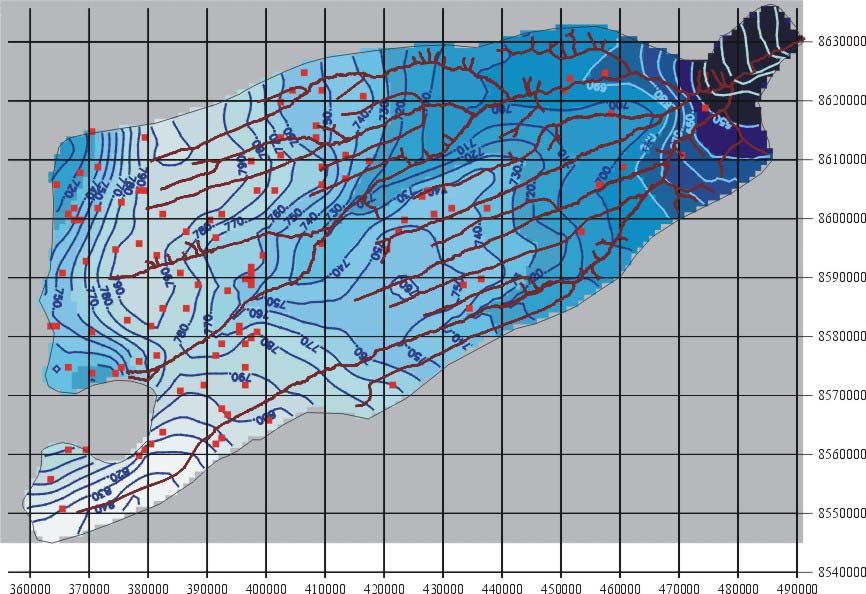
Figure 14. Potentiometric map of the Rio das Femeas Sub-Basin (10 m spaced isolines).
xxiii
The initial model, including the hydrogeological information, such as Sub-Basin's top and
bottom, along with the boundary conditions, was initially run using a homogeneous value of
hydraulic conductivity (k=6/day, obtained in tests at the Fazenda Campinas). An aquifer recharge
value of 6.85x10⁻⁴ m/day, equivalent to a mean annual recharge of 250 mm/year (Pimentel et al.,
1999) was adopted.
5.2.3. Calibration Methods
In order to calibrate the model, several simulations under critical conditions (droughts and floods)
are run. Extreme anthropic actions are also simulated, including excesive pumping rates, which
cause significant drawdowns in the aquifer, especially around wells, and propagation of
interferences with surface reservoirs.
Both in stationary and transitory (variable duration, from hours to years) regimes, it is necessary
to calibrate the hydrodynamic parameters, to allow the precise representation of the Basin, under
extreme conditions. For that, numerous trials are run, until a similarity between estimated and
observed hydraulic heads is achieved.
5.2.4. Stationary Model: Outcomes, Discussion and Verification
The potentiometric map (Figure 14), elaborated based on water levels measured in August of
2001, emphasizes a groundwater divide on the 380,000 m(UTM) longitude and shows that the
aquifer is smaller than the surface drainage basin.
The fact explains the occurrence of several springs at the foothills, in the western boundary of the
Sub-Basin (State limit between Bahia and Goias). Electrical soundings also confirm a significant
aquifer depth increment, from the 380,000 m up to the 360,000 m longitudes.
The satisfactorily calibrated model, with respect to both hydraulic conductivity and recharge,
permitted the elaboration of a potentiometric map (Figure 15) which reflects the main observed
characteristics. Those characteristics refer to water levels measured in 129 wells (Figure 16),
irregularly distributed in the modelled area.
5.2.5. Non-stationary Model: Outcomes, Discussion and Prediction
To apply the non-stationary or transitory model, it was necessary to make changes in the
stationary model. The worst case is the situation associated with log dry periods, without the
seasonal recharge, which shows a continuous decrease in hydraulic heads in all wells, with
emphasis in those in upstream sectors.
5.2.6. Assessment of Water Resources
Considring the aquifer storages, under the viewpoint of supplying water to meet the demands,
two different technical terms are used: potentiality and availability. Potentiality is defined as the
total volume of groundwater accumulated in the saturated zone, denominated total aquifer
reserve. Availability means the volume of water that can be exploited without risks of
extinguishing the aquifer, receiving several definitions, according to distinct safety levels.
The perennial water resources in the aquifer correspond to the groundwater located in the
saturated zone, bellow the level of seasonal oscillation of the potentiometric surface of the free
aquifer. Aquifer volumes were calculated based on the potentiometric maps. The knowledge of
xxiv
the volumes in the saturated and non-saturated zones, it was possible to determine the total and
regulatory reserves.
Figure 15. Potentiometric map estimated after completing calibration (10 m spaced
isolines).
The potentiality of the Rio das Femeas Sub-Basin, corresponding to its total reserves, was
estimated from the the volume of aquifer in the saturated zone, multiplied by the sandstone's
effective porosity (10%), resulting in a volume of 2.61x10¹¹ m3. Considering this value, the water
volume under pressure is almost neglectible (less than 1%).
The availability (regulatory reserves) was estimated by multiplying the discharge rate by the Sub-
Basin's area, resulting in 1.57x10⁹ m3 (0,6% of the potentiality). From this water balance, it is
deduced that only 10% of the availability is currently used in a regime of excessive irrigation.
5.2.7. Discussing the Numerical Modelling
The objective of the numerical modeling of the Rio das Femeas Sub-Basin was to understand the
interaction between surface and groundwater reserves, in order to recommend criteria for the
concession of water rights, in a way to prevent compromising the environment.
xxv
To acomplish this objective, existing field data, such as water table elevations e results of
electrical vertical soundings (2001/2002), were analyzed.
Multiplying the volume of the saturated zone by the storage coefficient estimated in the pumping
tests, the volume of water stored in the Sub-Basin (total reserve) was estimated. The map of the
non-saturated zone provided information on the zoning of recharge areas for the model, in view
of the variable thickness of this zone. The potentiometric map was the basis for calibrating the
model.
A stationary simulation, with the wells in operation, allowed the elaboration of a residual map of
the propagation of capture zones, contributing to the identification of direction and extension of
interferences among the wells. This information is important for evaluating the location and
intensity of interferences among surface and groundwater reservoirs, with reference to pumping
discharge and duration.
The non-stationary simulation, for one year, was based on a generic model, with high pumping
rates in all the registered wells, considering two different seasons. The reserves were estimated
based on the outcomes of the model.
6. PROPOSAL OF CRITERIA FOR CONCESSION OF WATER RIGHTS
6.1. CONCESSION OF SURFACE WATER RIGHTS
The diverse water uses may create conflicts among users and environmental impacts. Therefore,
managing the water resources is fundamental, to allow compatibility between current and future
uses. At this point, the instrument of concession appears as necessary, as it allows the legal
assurance of a water allocation scheme among different users.
6.1.1. Federal
Legislation
The Federal Constitution (1988) defines the water as a public good. Groundwater is a property of
the States, except in the Territories or areas in the Union's domain.
The Law 9,433/97 established the National Water Resources Policy and defined the Concession
of Water Rights. It consists of an administrative act, through which the conceding Public Power
(Union, States or Federal District) grants to the receiver the right to use the water, for a specified
period, in compliance with the conditions defined in the respective act.
Law 9.984/2000 created the National Water Agency (ANA), giving it the power to issue
concessions of water rights in the domain of the Union, The States and the Federal Distric have
their own agencies with constitutional powers to issue water rights in their domains.
6.1.2. The State of Bahia
The Constitution of the State of Bahia (10/05/1989) dedicates a Chapter specifically to water
resources (Title VI, Chapter V Water Resources and Minerals Policy). In its Article 198, it
states that the Policy views the rational use of those resources.
The State Law 6,812/95 created the Superintendence of Water Rsources (SRH) whose objective
is the development and implementation of projects, public policies, measures and providences
xxvi
regarding the discipline, use and management of the water resources, including the concession of
rights, as a management instrument.
6.1.3. History of concessions in the Rio das Femeas Sub-Basin
The first concession in the Rio das Femeas Sub-Basin was granted supported by a governmental
decree (November/1988) and the second in May of 1989. Most of the concessions were granted
in 1990 through 1992. The construction of the Upper femeas Power Plant resulted in conflicts
among the different water uses (Genz e Ribeiro, 1998).
Viewing minimization of those conflicts, after discussion between the management agent and the
users, discharge limitations for concessions in the Rio das Femeas were defined as 11.5 and 12
m³/s, upstream and downstream from the Power Plant, respectively.
6.1.4. Analysis of the granted discharges, according to the State and to the Union
Analyses of the concessions, both in Federal and State levels, follow the principles established in
a common legislation, as is the case of the Water Code and of Law 9,433/97, but diverging with
respect to the criteria for defining reference flows.
The minimum reference flow is that characterized by a condition of water insufficiency in the
reserve. Based on this condition, water allocation is established, in a way that when the situation
of water deficit occurs, all users with water rights are able to maintain, to some extent, their
operations.
The reference flow for the analysis of concessions by ANA varies from one State to the other, as
legislation does not define a unique value for federal rivers. According to Silva (2002), as the
federal rivers receive state tributaries subject to different concession criteria, ANA adopts the the
criteria of the most restrictive State. In the case of the San Francisco River, in which the Femeas
Sub-Basin is inserted, the reference flow is the Q95% , and as much of 80% of that may be granted
out.
Finally, the concession for intakes in rivers of the Femeas Sub-Basin complies withnthe
hydrological criteria related with surface waters. As previously mentioned, river flow is
controlled by the groundwater.
6. 2.
CONCESSION OF GROUNDWATER RIGHTS
The development of groundwater management processes must be faced sequentially in three
main stages:
1) Reconnaissance, involving the geological and geophysical investigations, as well as field
information.
2) Evaluation, when hydrogeological parameters and aquifer production capacity are
assessed.
3) Management, when the concession criteria and sustainable development strategies are
defined, based on the conjuntive use of the surface and groundwater reources.
xxvii
It is necessary to evaluate the balance between the benefits from exploiting the aquifer and the
adverse impacts. Under these conditions, the maximum pumpage allowed by the administrator
must not exceed the limits beyond which the drawdowns will affect other reserves in the Sub-
Basin. One of the primary objectives is the definition of the maximum exploitable discharge
without risks to the environment.
6.2.1. Criteria for Concession of Groundwater Rights
The studies implemented allowed the determination of the aquifer's hydrodynamic parameters.
Transmissivity was found in the order of 2x10⁻² m2/s, The storage coefficient in the order of
3.7x10⁻⁴ and effective porosity equivalent to 1.4x10⁻².
Those are characteristics of a non-confined aquifer, of the Neumann type, with a complex delay
in "drawdown versus time" relation. They point to long radii of influence, imposing interferences
among the wells and surface water courses.
In fact, as the storage coefficient is in the order of 10-4, the wells' radius of influence in the first
hours of pumping is very long, being able to extend for several kilometers. In this case, the
minimum area of influence for a well, to operate safely in a 12-hour/day regime is a circle of
approximately 20 km2. Observing these parameters, around 175 wells could be drilled in the
Basin, which represents a possible limitation criteria for concessions in the region.
However, the expansion of the drawdown cone does not consider the pumping rates at each well.
In this manner, a well with a discharge of 3.7 m3/h, operating 12 hours a day, would receive the
same treatment given to a well pumping 1,000 m3/h, operating in a similar regime. Therefore, if
this criteria were adopted, the maximum groundwater discharge that could be granted in the Sub-
Basin would vary between 0.08 and 24.0 m3/s, representing a huge difference (300 times) in
granted concessions.
In view of that, estimating the maximum exploitable volumes, without risks of compromising the
aquifer, become of critical importance. Usually, for groundwater, it is assumed the use of its
annual recharge plus 0.2% of the perennial reserves. This corresponds to a commitment of 10%
of the perennial reserves in a 10-year period. Under such conditions, water table elevation in the
aquifer keeps going deeper progressively, along the ears.
Evidently, the great aquifers throughout the world have been suffering progressive drawdowns
along years of utilization. This procedure is unacceptable for the Urucuia Aquifer, as it is an
aquifer whose exudation maintains the river flows. Any significant aquifer drawdown will
compromise the surface reserves, which are completely dependent upon its discharges, for
maintenance of the flows in the dry seasons.
A good example is presented in the hydrogeology report, which affirm that wells located 500 m
from a river's margin, with a 300m3/h discharge, withdraw about 252 m3/h of that river's
baseflows. This conclusion is supported by Glover's formula
q
y
1
2
2
=1 -
e-u du
.
, where
Q
0
xxviii
q1 = river depletion in the period
y = r/4 t;
r = distance from well to river
Q = flow from well to river
= T/Sy;
T = transmissivity
Sy = effective porosity
u = r2Sy/4Tt; and
t = duration of pumping
The expression may be used for setting limits to groundwater exploitation. However, being a
general formula, it does not consider anisotropic and heterogeneous behavior of such a long
aquifer, with respect to the hydrodynamic parameters (T, Ss and Sy). Besides, it does not take
into account the regional topography (hydrologic studies have demonstrated that it is essential to
the river/aquifer relation).
Thus, for estimating the maximum pumping discharge, without compromising the surface
reserves, it is necessary a continuous monitoring of drawdowns and recoveries of the aquifer,
with a piezometric network. This monitoring must be maintained for at least two years, to permit
calibration of the mathematical model.
A calibrated model allows simulations taking into account the topography and the variations in
the aquifer's hydrodynamic parameters. Additionally, it makes possible the prediction of local
and regional changes in discharges and water table elevations in the aquifer, permitting
reasonably precise estimates of limits for the concession of groundwater rights at each point
within the Sub-Basin.
To allow the obtention of those results, the first procedure is to determine the possible lowerings
of the water table. Studies carried out by the SRH in the Rio dos Cachorros Sub-Basin indicate
that a generalized drawdown is already occurring. Among the attitudes to be taken, the following
should be emphasized:
· Immediate installation of a piezometric network, to monitor, permanently, the
oscillation of water table elevation in the aquifer (suggested the installation of 60
piezometers in existing wells).
· A topographic survey with sub-metric precision, along river channels and wells. This
survey, in conjunction with the piezometric network, wil permit the measurement, with
reasonable accuracy, of the negative influence of each existing or proposed well, on the
rivers' baseflows.
· Executing additional tests for determining the aquifer's hydrodynamic parameters,
contributing to the regionalization of the findings.
· Executing new soundings for determining aquifer thickness and compleenting geolgical
information, as well as to confirm the existence of confined aquifers, bellow the known
layers.
· The managing institution must define the basic procedures for new drillings pumping
tests, minimum spacing between wells and surface reservoirs, water table elevation
monitoring equipment, etc.). The Decree 6,296/97 already establishes that, in he case of
drawdowns in an aquifer, the water use may be rationed.
xxix
These measures must be implemented wit precision, as there is the risk of compromising
sustainability in the Region, considering that if drawdowns inferior to one meter are continuously
maintained, it might compromise the surface reserves. Utilization of the latter has been restricted
by the Governmental Decree 7,566/99, in view of the already occurring conflicts in the Sub-
Basin.
However, the Decree does not cover groundwater, leaving the door open for unrestricted use. As
the studies carried out by this Activity demonstrated that the surface reserves are dependent on
the groundwater resources, use of the latter may compromise the already made negotiations
regarding resolution of conflicts.
In a region where the use of the water must be subjected to permanent control, the lack of
knowledge on the evolution and exploitation of the aquifer might bring critical consequences,
from a political, economic and social standpoint.
The installation, operation and maintenance of a piezometric network are justified, as existence of
a pilot basin allows the regionalization of the findings, bringing benefits to all the western part of
Bahia. Under such conditions, concession of water rights will be scientifically supported.
7. CONCLUSIONS
Geoprocessing
· Numerical modelling of the area, with use of the GeoTerrain sofware, presented positive
outcomes, allowing the elaboration of the Cartographic Base on a 1:100,000 scale, with
10-meter spaced contour lines and altimetric precision inferior to 5 m.
Hydrologic studies
· Analyzing the discharge responses to precipitation, it was noticed the lack of
correspondence between them and a delay in resulting runoff. This phenomena is
observed in 50% of the recorded years, and increases from headwaters (2 to 4 days)
towards the mouth (around 10 days).
· It was also noticed that response of annual flows depends on precipitation occurred in
previous years. In 1978 and 1979, for example, precipitation decreased while river
flows incresed.
· Even though dry and rainy season are well defined, the strong effect of the regulation
imposed by the groundwater flows smoothes the seasonal flow differences. It is noticed
that minimum annual flows have the same behavior as the mean flows, reflecting the
potentiality of the groundwater contribution (around 31 m3/s), approximately that
estimated by the mathematical model (32.63 m3/s).
Hydrogeological studies
· Given the aquifer's influence, the rivers with greater discharges are not those with larger
drainage area or greater lenght, but those carved deeper into the aquifer. It is estimated a
specific production in the order of 0.2 m³/s, per meter into the aquifer.
xxx
· It is clear that the aquifer acts as a river regulation reservoir, assuring the maintenance
of flows throughout the dry periods.
· The potentiometric map shows that the groundwater divide is located about 20 km from
the topographic divide, approximately where the river drainage network is formed. Thus
part of the precipitation and of the percolated water runs towards the State of Tocantins.
It is anticipated a changing water divide,as function of water table elevation or aquifer
drawdown, altering the areal contribution to river flows in the Sub-Basin.
· The Urucuia Aquifer is a non-confined type, with delayed drainage, compatible with the
model proposed by Stretsolva/Neumann. The storage coefficient (in the order of 10-4)
corresponds only to the aquifer's elastic response in the first pumping time interval. The
effective porosity estimated in tests at the Fazenda Campinas (Sy = 1.5x10⁻²) and
Fazenda Santo Antônio (Sy = 1.43x10⁻²) are more realistic. A value of 1. m2/s was
assumed as the mean transmissivity.
· The groundwater flow network divides the Sub-Basin into two distinct sections. There
is a groundwater divide in the North-South direction, from which occur hydraulic
gradients in the order of 10-3 to 10-4, towards East. Westbound, these gradients are in the
order of 10-3 to 10-2.
· The executed geophysical soundings indicated, invariably, the presence of a more
conductive regional substratum under the sandy layers. Based on this finding, a
preliminary map of the aquifer bottom's relief was prepared, showing a narrowing in
aquifer thickness, from 400 m in the western border to 100 m in the eastern part. This
substratum was preliminarily defined by two soundings as a thick clayey layer (15 to 60
m thick), separating two layers of saturated sandstones.
· It was also verified that the groundwater flow's direction is approximately uniform and,
for most of the area, it runs from West to East, with some closed contours that might be
due to current groundwater exploitation in the Sub-Basin. At headwaters, near the Serra
Geral de Goiás, the static level exceeds the 200 m depth, and water movement turns in
the opposite direction (East to West), flowing towards the Tocantins River basin
Geological and Geophysical studies
· The system of fractures, associated to tectonic movements, induced a characteristic of
double porosity in the Urucuia Aquifer. The secondary porosity, resulting from the
existing fractures, is more evident in the upper third portion of the middle reach, where
the sedimentary package presents degrees of silicification. The primary inter-granular
porosity predominates in the lower two thirds of the Basin.
Mathematical modelling
· The mathematical modelling of the Urucuia Aquifer indicated a direct hydraulic
interference of the pumping wells on the several rivers in the Sub-Basin, mostly due to
the high transmissivity ( 1,500 m2/dia).A preliminary evaluation of the river/aquifer
relation indicated that a 300 m3/h pumped outflow from a well 500 m away from a river
will reduce its discharge in around 260 m3/h.
xxxi
· The radii of influence of the wells, given the characteristics of Neumann non-confined
aquifer types, presents an elastic response in the first hours of pumping (storage
coefficient in the order of 10-4). Under these conditions, the radius of influence might
reach from 1,000 m (Fazenda Santo Antônio) to 2,300 m (Fazenda Campinas), in the
first 12 hours of pumping. It should be noted that the well's radius of influence alone
does not allow estimates of the continuous lowering of water table elevation, resulting
from years of exploitation.
Water Rights Concession and Management
· Given the particularities of the Sub-Basin's river/aquifer system, procedures for
concession of surface water rights cannot be treated only with hydrologic criteria, nor
the standard criteria for groundwater exploitation can be applied.
· Even though concession for intakes from rivers in the Sub-Basin adopt hydrological
criteria related to surface water and, as shown in this work, river discharge is controlled
by groundwater, assessment of reference flows, by the SRH (Santana et al, 2000), was
based on the local potentiality, in compliance with the aquifer's discharge
characteristics.
· In spite of the great potentiality of the aquifer (transmissivity around 1,500 m2/day,
effective porosity of 1.5x10⁻² and saturated thickness that might exceed the 300 m),
great part of that potential is already indirectly being used, as the Urucuia guarantees the
river flows, in the dry season.
8. RECOMMENDATIONS
Concession and Management
· Calibration of mahematical models require very accurate observation data. Differences
less than 1.0 m, between te actual topographic elevation and the estimated one, result in
ambiguous hydrodynamic parameters, producing unreliable models. Thus, it is
important determining topographic elevations with altimetric errors under 0.4 m, for the
main drainage channels and wells. Installation of a piezometric network, for monitoring
permanently oscillation of groundwater levels, and updating well cadastration every 6
months, will contribute to determining, with a fair accuracy, the negative influence of
the each well in the rivers baseflows. Estimated costs for this action wil be around US$
130,000.00.
· As there is a clear lack of meteorological information about the Rio das Femeas Sub-
Basin, and this insufficiency produces errors in agriculture and environment
management, it is necessary to install an automated meteorological network, composed
of Data Collection Platforms (DCP).
The collected data will be transferred in real time, by the national satellite
ARGOS/SCD, to help in the weather forecasts in Region and to support analyses of soil
water content. These information will be made available at the SRH's webpage. Nine
xxxii
DCPs will be installed, to allow the total coverture of Western Bahia. These activities
will cost approximately US$ 250,000.
· It is necessary to maintain the current studies until the final calibration of the model.
The cost of contracting consultants will be around US$ 36,000.
Hidrogeology
· Additional aquifer testing should be done at Fazenda Campinas and Fazenda Polleto,
among other to be selected, for an accurate estimate of the efferctive porosity. These
tests will involve costs (electrical energy and pump installation) around US$ 3,000.
· New drillings will be necessary to determine aquifer thickness, to complement
geological information, and to confirm the existence of a confined aquifer bellow the
currently known and exploited layers, with the use of geophysical profiling. These
works will cost around US$ 130,000.
· In order to formulate the hydraulic model, it will be convenient to determine, at least for
the Eastern extreme of the Sub-Basin, the physical boundaries. To the West, it is
recommendable to investigate up to the interface with the Mosquito River Basin. This
will require a new gephysical campaign, in the western part of the basin, wich will
demand a cost of US$ 10,000.
· It is necessary to implement a dating, in view of the apparently young waters, as
indicated by the low content of dissolved salts. This dating will permit a precise
determination of the effects of the aquifer's reservoir, indicating how long the rainfall
water remains in the aquifer, before feeding the rivers. The involved costs will be in the
order of US$ 5,000.
Hidrology
· Aiming at the improvement of the monitoring of surface water resources, it is
recommended the installation of three additional pluviometric stations, as well as the re-
location of the fluviometric stations at the BR-020 and Femeas Grande. One of the
pluviometric stations is meant to replace the Station 01245005, the other two to cover
the headwaters of the Rio Estivas and the Sub-Basins of the Mosquitão and Femeas.
The fluviometric station at the BR-020 must be moved to a place in the Upper Estivas,
while the equipment from the Femeas Grande Station will be placed by the Rio dos
Bois' mouth. Equipment acquisition and installation costs will be around US$ 20.000.
· It is recommendable to carry out additional discharge measurements, in a regular way,
especially during flood periods, to contribute to the review of rule-curves established
under precarious conditions, improving quality of flow data. This service will
correspond to a US$ 60,000 cost, in a 2-year period.
· A detailed hydrologic investigation is to be implemented, based on the existing data, to
determine the relation of the discharges with local physical factors, allowing
transposition of data to places where they do not exist. This activity will require analysis
and consistence of the data collected in the new monitoring period, resulting in a US$
13,000 cost.
xxxiii
Water Quality
· New campaigns are to be implemented, for detecting pesticides and agro-chemicals in
surface and groundwater, to confirm the risks of contaminating the population. These
analysys and campaigns will have a cost of US$ 36,000.
Recommendations Regarding Management
· Management of groundwater resources faces a series of difficulties due to the lack of a
piezometric network. These conditions are equivalent to managing surface waters
without a hydrometric network. Therefore, to allow an effective management, it is
necessary to plan for the installation of that type of network, starting with the
cadastration of existing wells, as some of those will be useful in to monitor the aquifer
with low costs.
· Defining norms and/or resolutions to make the users aware of basic procedures to be
adopted for drilling of new wells. The simple obligation to install guide-tubes for
monitoring water level in the wells would represent a great progress in aquifer
management. It is also recommendable the definition of technical norms for pumping
tests, well profiling and installation of piezometers, essential for cadastration in the
managing agency.
· As aquifers are not always restricted to the boundaries of the river basins, sometimes
going beyond State borders, groundwater, as established in the Federal Constitution, is a
domain of the State and, hardly, will be administered by Basin Committees. In this case,
it is suggested to consider institutions able to visualize and arbitrate problems among
different basins, such as State management offices or the State Councils. Furthermore,
the subject must be jointly discussed by all the interested parties.
· The main recommendation accruing from the study is the need for the integrated
management of the water resources, taking into account the demonstrated hydraulic
connection between the aquifer and the rivers.
A summary of the presented recommendations and their associated costs are presented in Chart 9:
xxxiv
Chart 9. Consolidation of Proposals
Recommendations Expected
costs US$
Submetric topography of Basin
30.000
Installation of piezometric network (60 wells)
100.000
Installation f 9 DCPs
250.000
Continuing studies (Consulting services)
36.000
New pumping tests
3.000
Drilling new wells and making geophysical profiles
130.000
Geophysical campaigns
10.000
Dating groundwater
5.000
Installation of 3 pluviometric and 2 fluviometric stations,
besides relocating 2 fluviometric ones.
20.000
Dscharge measurement campaigns
60.000
Hydrologic studies / transposition of information
13.000
Water quality analysis
36.000
Total 693.000
xxxv