
INTEGRATED MANAGEMENT OF LAND BASED ACTIVITIES
IN THE SĂO FRANCISCO RIVER BASIN PROJECT
ANA/GEF/UNEP/OAS
Activity 2.1 - Determination of Land Use in The Lower
Săo Francisco River Basin
Executive Summary of the Final Report
DETERMINATION OF LAND USE IN THE LOWER
SĂO FRANCISCO RIVER BASIN
Companhia de Desenvolvimento dos Vales do Săo Francisco e do Parnaíba
Brasília - DF
INTEGRATED MANAGEMENT OF LAND BASED ACTIVITIES
IN THE SĂO FRANCISCO RIVER BASIN PROJECT
ANA/GEF/UNEP/OAS
Activity 2.1 - Determination of Land Use in The Lower
Săo Francisco River Basin
Executive Summary of the Final Report
DETERMINATION OF LAND USE IN THE LOWER
SĂO FRANCISCO RIVER BASIN
Coordinator
Rui Alcides de Carvalho Junqueira
Companhia de Desenvolvimento dos Vales do Săo Francisco e do Parnaíba - CODEVASF
Consultants
Jurema Barbeitos Ribeiro
Albano Henrique de Araújo
Ricardo Lívio Santos Marques
Ileana Saraiva de Alencar Mota
January 2002
DETERMINATION OF LAND USE IN THE LOWER
SĂO FRANCISCO RIVER BASIN
EXECUTIVE SUMMARY
INTRODUCTION
The "Integrated Management of Land Based Activities in the San Francisco River Basin Project -
GEF/ANA/OAS/UNEP, aims at the promotion of the sustainable development of the Basin and
of its coastal zone, based on the implementation of an integrated management approach, defined
by a Strategic Actions Program SAP.
The Project, comprised of 28 Activities, includes research and implementation of pilot projects,
focusing on four basic components:
a) River Basin and Costal Zone Environmental Analysis;
b) Public and Stakeholder Participation;
c) Organizational Structure Development;
d) Watershed Management Program Formulation;
The objective of the Activity 2.1 (Determination
of Land Use in the Lower San Francisco River
Basin), inserted into component b, above, was
the mapping of the different classes of the land
use, associated to the existing vegetative cover.
The work was accomplished by a team of 4
consultants, in a 7-month period (June 2001
through January 2002), under the technical
coordination of CODEVASF (Company for the
Development of the San Francisco and Parnaíba
Rivers).
The San Francisco Basin is divided into four
sub-regions: the Upper, which covers the portion
from the river's source to the City of Pirapora, in
the State of Minas Gerais (MG); the Middle,
running from Pirapora to the City of Remanso, in
the State of Bahia (BA); the Middle-Lower, from
Remanso to the City of Paulo Afonso Dam, both
in Bahia; and the Lower, which runs from Paulo
Afonso to the river's mouth at the Atlantic
Figure 1. Subregions of the San
Ocean, in the border of the States of Alagoas
Francisco river Basin.
(AL) and Sergipe (SE). These subdivisions are
shown in Figure 1.
i
The Lower San Francisco, object of this thematic land use mapping, covers a total area of 30,377
square kilometers, amounts to 5% of the San Francisco Basin, corresponding to the smallest of
the four sub-regions of the Basin.
1. PHYSICAL CHARACTERISTICS OF THE LOWER SAN FRANCISCO
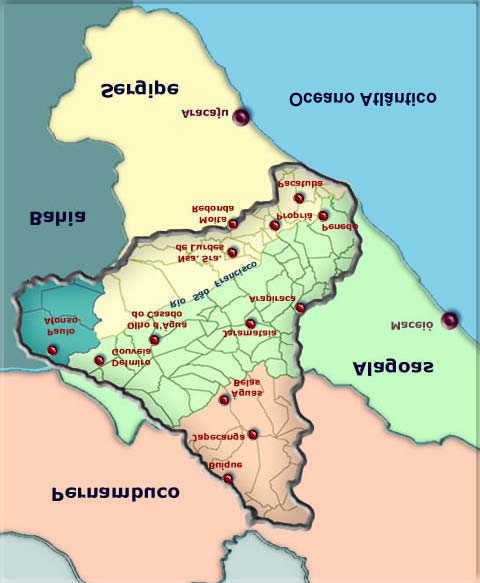
1.1 LOCATION
The Lower San Francisco region is located between the 7ş and 11ş S latitudes and between 36ş
and 39ş W longitudes, representing the eastern portion of the Basin. It covers a 30,377 square
kilometers area, spreading over the States of Bahia (BA), Pernambuco (PE), Alagoas (AL) and
Sergipe (SE), as shown in Figure 2.
Figure 2. Location of the Lower San Francisco Subregion.
ii
1.2 CLIMATE
According to the Thornthwaite's classification, the area presents three different climate types,
from east to west:
· Moist sub-humid, with a moderate water deficiency in Winter (June through August),
megathermal; and with a moderate water deficiency in Summer (December through
February), mesothermal;
· Dry sub-humid, with moderate water surplus in the Summer, megathermal; and
· Semi-arid, with no water surplus, megathermal.
The pluviometric behavior, regarding the distribution of the rainfalls, can be characterized by the
occurrence of a rainy season, in the months from May through July, and a spatially variable dry
period. The dry period varies from a 4-month period in the coastal region, increasing towards the
country-side, until the occurrence 7-month dry period, in the semi-arid region. Mean annual
rainfall precipitation in the littoral is around 1.300 mm and as it approaches the boundaries of the
Middle-Lower sub-region, this value drops to around 600 mm.
1.3 HYDROGRAPHY
The lower course of the San Francisco river is located between the City of Paulo Afonso and the
river's mouth, running a total of 265 kilometers, from West to East. The San Francisco is one of
the few perennial rivers within the Project zone, and is used for various different economic and
social purposes. Among these uses we may emphasize water supply for urban populations
(including the City of Aracaju, Capital of the State of Sergipe), recipient of domestic effluents,
irrigation water supply for short cycled crops, fish-farming, ecotourism, navigation and power
generation by Hydroelectric Power Plant of Xingó, of the San Francisco's Hydroelectric
Company (CHESF).
Among its tributaries, emphasis must be given to the Capiá, the Ipanema and the Traipu, from the
left bank, located in the State of Alagoas, and the Santo Antonio and Aterro streams, from the
right bank, in the State of Sergipe, near the river's mouth.
The mean natural flow in the San Francisco River, at the hydrometric station at the Town of Păo
de Açúcar (AL), is 2,847 mł/s. At the station in Traipu (AL), the mean flow is 2,980 mł/s. The
reservoirs built in the main course of the Middle-Lower San Francisco regulate a flow of about
2,100 mł/s.
1.4 GEOLOGY
According to the tectonic segmentation of the South-American plate into structural provinces, the
Lower San Francisco is completely inserted in the Borborema Province, being characterized by
the existence of metamorphic rocks arising from shocks of tectonic plates verified during the
Brasiliano Cycle. Later on it was augmented with the addition of material pushed by a series of
thrusts, common in the post-orogenic processes.
iii
Besides the addition of sediments, there occurred magmatic intrusions during the Jurassic and
Cretaceous Periods. By the end of the geological structure formation process, in the Tertiary and
Quaternary Periods, sedimentary deposits were accumulated in restricted regions.
The obvious occurrence of thrust regimes preceding the Brasiliano event indicate different
periods of crustal amalgamation, forming a heterogeneous continental lithosphere (Jardins de Sá
et al., 1992).
1.5 GEOMORPHOLOGY
The geomorphology of the Lower San Francisco may be characterized by the occurrence, from
west to east, of three morpho-structural domains, subdivided into three geomorphologic units.
The first domain is referred to as Sedimentary Deposits and runs along the banks of the San
Francisco River and the coastlines of the States of Sergipe and Alagoas. It is represented by
plains and plateaus formed by predominantly unconsolidated sediments. The existing features
reflect accumulation of deposited of sediments in the marine, fluvial, fluvial-marine and colluvial
environments.
The second morpho-structural domain is called the Remaining Root Folding and is located in the
central portion of the Lower San Francisco, roughly between the Cities of Porto da Folha and
Propriá. This domain is characterized by the sequential perpendicular alignment of ridges and
valleys, resulting from the differential dissection and from the wearing of folded structures, as
well as from occasional exposures of its substratum.
The Removable Massifs domain covers the major portion of the Lower San Francisco, extending
from Porto da Folha to Paulo Afonso. It is typified by forms resulting from the erosion of arch-
shaped blocks dislocated by tectonic reactivations. It is worth emphasizing the occurrence of
inselbergs, ridges and gullies in rock-joint zones. Flat topographies are found in regions protected
from the draw back determined by fluvial erosion.
1.6 SOILS
According to the pedology, two distinct regions are identified in the Lower San Francisco, from
west to east. In the first region, located between the Cities of Paulo Afonso (BA) and Propriá
(SE), there are three different predominant types of soil, distributed in vast ranges: lithic-soils,
solodic planosols and non-calcic brown soils. The second zone begins downstream from the City
of Propriá and extends to the mouth of the San Francisco, being characterized by a greater
diversity of soil types, even though covering smaller areas. Marine quartzose sands, quartzose
sands, indiscriminate mangrove swamp soils, podzolic soils, podzols, latosols, alluvial soils and
gleisols are among the soil types in this area.
1.7 VEGETATIVE
COVER
The Lower San Francisco original vegetative cover is represented by extensive areas of caatingas
(thorn forest), which is a kind of xerophytic vegetation, resistant to water deficits. This vegetation
iv
is adapted to the adverse conditions determined by the low rainfall precipitation in the semi-arid
region.
There are two physiognomic variations of this type of vegetation in the area under study: the
dense arboreal caatinga and the sparse arboreal caatinga. The first type is structurally
characterized by a dense arboreal stratum, with species that grow up 8 to 10 meters high; a
stratum formed by thorny perennial bushes; and, finally, a seasonal herbaceous stratum. The
second type presents a sparse woody cover of low height, leaving exposed the underlying
stratum. This type of caatinga may be found in natural conditions in areas with exceptionally dry
climate and predominating lithic soils.
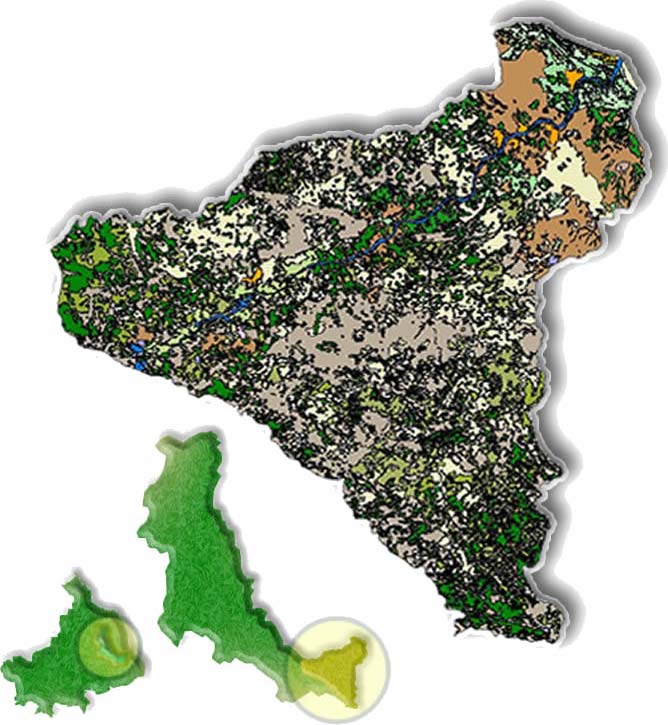
Close to the coastal zone, pioneer formations cover recent sedimentary deposits, which are
unstable and without the aging to become edaphic. There are two types of environments along the
coast of Alagoas and Sergipe: the restinga (an area of scrubby vegetation typical of sandy marine
barrier islands) and mangrove swamps. The distribution of these vegetation types is presented in
Figure 3.
Figure 3. Original vegetative cover of the Lower San Francisco river Basin
v
2. SOCIOECONOMIC
CHARACTERISTICS
2.1 MUNICIPAL DIVISION AND DEMOGRAPHY
According to the 2000 Demographic Census (IBGE), the resident population in the municipalities
of the Lower San Francisco amounted to 1,807,718 inhabitants, representing a 12% growth over
the year of 1991. It corresponds to a demographic density of 59 inhabitants per square kilometer.
About 51% of this population lives in rural areas and the remainder in urban centers. This
distribution contradicts the typical Brazilian situation, where the urban population is
predominant.
Table 1 shows the contributions of each State to the area and population of the Lower San
Francisco Region. This table shows that Bahia, among all the covered States, has the smallest
contribution (2,962 km2), representing only 0.5% of its total area, which is 567.295 km2. The
population in this area is 69,970 inhabitants (4% of the population in the Subregion), which
represents the smallest demographic density of the Region (23.6 inhabitants per square
kilometer). This is due to the fact that the portion of Bahia inserted in the area is the Northern
part of the State, where there are great ranges of protected natural vegetation, such as the Raso da
Catarina, with exceptionally low levels of populational activity.
Chart 1. Area, population and number of Municipalities, by State, in the Lower San
Francisco.
Nş of
Area
% Area
Population
Demographic Density
States
Municipalities
(km2)
(inhabitants)
(inhabitants/km2)
Alagoas 50
12,798
42,27
1.075.845 84,1
Pernambuco 16 7,475
24,70 341.026
45,6
Sergipe 28
7,043
23,25
320.877 45,6
Bahia 6
2,962
9,78
69.970
23,6
Total 100
30.278
100,00
1.807.718
59,7
The State of Alagoas, on the other hand, contributes with the largest area in the Lower San
Francisco (12.798 km2), which represents about 46% of the total area of the State (27,933 km2).
The population of 1,075,845 inhabitants (59% of the total population of the Lower San
Francisco) corresponds to the highest demographic density (84.1 inhabitants/km2).
The State of Pernambuco shows the second largest area with 7,475 km2, which represents about
7% of the total area of the State (98,938 km2). There are 341,026 inhabitants (19% of the
population in the mapped area), equivalent to a density of 45.6 inhabitants/km2.
Sergipe participates with an area of 7,043 km2, which corresponds to 32% of the total State area
(22,050 km2). The 320,877 inhabitants (18% of the population in the area) embraced by the
vi
project), corresponding, coincidentally, to the same demographic density of Pernambuco (45.6
inhabitants/km2).
The distribution of the Municipalities in the Lower San Francisco Region, showing the most
important county seats, is seen in Figure 4.
Figure 4. Municipal division of the Lower San Francisco, with main County seats
vii
2.2 TRANSPORTATION
The existing transportation infrastructure is inadequate to meet the demands in the region,
particularly in the rural areas.
The road network is of low quality and lacks proper maintenance. The existing railroad networks
require essential interconnections to allow a better development of the sector in the Northeastern
Region. River transportation is underutilized, basically due to the lack of investment by both the
private and public sectors, as well as on account of poor navigation conditions, given the
sediment deposition processes.
2.3 HEALTH
The health conditions in this area of the San Francisco Basin is highly precarious, there existing a
shortage of hospitals and health posts. The Region has only 48 hospitals, poorly distributed to
serve the population as a whole.
The most frequently occurring illnesses, especially among low-income people, are infectious
diseases, parasites and conditions related to malnutrition.
2.4 WATER SUPPLY AND BASIC SANITATION
With respect to basic sanitation, the situation in the Lower San Francisco is similar to what is
seen in many other areas in the Country, with still unsatisfactory sewerage.
Water supply in the area reaches about 75% of the population. However, it should be stated that
these numbers are not homogeneous throughout the Region, as in some of the Municipalities the
supply is provided to only 40% of the population. Another issue that must be further discussed is
the water quality. Most of the Municipalities have no water treatment or sewage facilities.
2.5 EDUCATION
The education sector is seriously compromised, with respect to the quality of instruction, basic
schools infrastructure, and the lack of vocational training courses in the Region.
The situation is aggravated when it comes to elementary education, in terms of the number and
qualification of the teachers serving the neediest communities. In many cases, these teachers have
not yet reached even Junior high-school themselves.
Schools in the region are not only scarce but mostly restricted to urban areas.
viii
2.6. ELECTRIFICATION
The energy sector in the Lower San Francisco relies on the following primary energy sources:
hydropower, fuelwood, sugarcane and imported products, such as petroleum and coal. The
production of secondary energy is diversified, and there are several charcoal kilns and alcohol
distilleries, such as the ones in Jacaré dos Homens (SE) and Penedo (AL).
The Xingó Hydroelectric Power Plant is located in the Lower San Francisco, owned by the San
Francisco Hydroelectric Company (CHESF) and has a generating capacity of some 3,000
megawatts. Great part of the produced energy is exported to the great urban centers of the
Northeastern Region.
2.7 AGRARIAN
STRUCTURE
The landowning distribution in the region shows a great concentration of small and medium-sized
properties. In the States of Alagoas and Sergipe, more than 50% of establishments are smaller
than five hectares, especially in the semi-arid areas. Most of the economic activities carried out
there (dry-land farming and extensive livestock) use technologies which are not fit to the size of
the property and impair their economic sustainability. In places with more favorable climate
conditions and greater soil availability, such as in the Upper San Francisco Region, there are
properties 10 times larger than those in the Lower San Francisco.
2.8. PRODUCTIVE
ACTIVITIES
Dry-land farming and irrigated agriculture (sugarcane, beans, corn, manioc, cotton, sisal, banana,
pineapple, tobacco, green vegetables and coffee beans) predominate among the productive
activities found in the Lower San Francisco Region.
Semi-intensive fish farming in association with medium-scale livestock and with agriculture has
also produced good results. CODEVASF has encouraged this type of activity in the irrigated
projects located in floodplains in the States of Alagoas and Sergipe.
With respect to industry, the distinction goes to the Arapiraca and Mata Grande areas, more
particularly to the Municipalities of Igreja Nova, Coruripe, Junqueiro and Penedo, which are
responsible for a great share of the regional production of sugar cane and alcohol.
2.9. TOURISM
The region has several centers of interest to tourists, such as CODEVASF's irrigation projects,
where crops, fruits, flowers, fish and fine wine are produced. In Canindé do Săo Francisco (SE),
visitors can navigate through the canyons of the San Francisco, as far as Lake Xingó. At Poço
Redondo, one will find the Sacred Art Museum, considered one of the three best museums in the
Country, as well as curiosities about the life of Lampiăo.
ix
In the western part of the area there, there is the Lake Xingó and the canyon, in Piranhas. The
Town of Penedo, in Alagoas, is a historical center of the Region. The touristic area extends to the
mouth of the San Francisco River, at Peba's Beach, where the Pontal do Coruripe is located.
3. MATERIAL USED FOR THE WORK
3.1 TOPOGRAPHIC
MAPS
A total of 22 topographic maps were used, covering the entire area of the Lower San Francisco.
These maps were made by the Geographic Survey Division of the Army and the Brazilian
Institute of Geography and Statistics (IBGE), at a 1:100,000 scale.
Information on the transportation network systems, about the hydrography and the datum points,
as well as the entire nomenclature associated with those items, were extracted from digital
topographic maps. These maps, as well as that of the power-line network and the boundaries of
the Otto's watersheds, were provided by CODEVASF. Additionally, the 1977 IBGE's database
on the Municipalities was used.
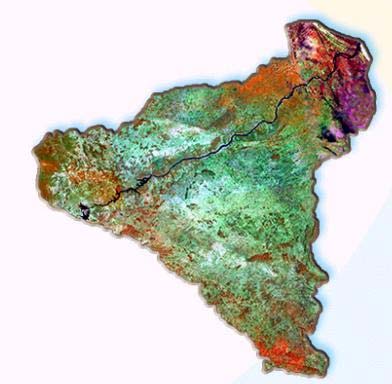
3.2. SATELLITE AND RADAR IMAGES
Bands 3, 4 and 5 of the Landsat Satellite, in RGB/453 composition, were used for this work. To
allow the total coverage of the area, it was necessary to use five scenes of the following
orbit/points: 214/67, 215/66, 215/67, 216/66, 216/67.
The intense nebulosity verified by the mouth of the San Francisco River severely limits the use of
satellite images for mapping purposes. The clouds block the electromagnetic energy used in the
optical system, compromising the analysis of information on the underlying areas. In such cases,
the use of orbital radar imaging offers a feasible solution to the problem, as radar signals are not
blocked by cloudiness. To cover the cloudy areas, the investigation was made with radar images
of the Radarsat System, for the 10ş15' S latitude and 36ş30" W longitude. The images had
acquisition date of 04/28/2000, being processed in 10/22/2001, with reference to the module
Wide1 (W1) and with path image plus processing level.
It should be noted that the maps created in this project use as reference the images' acquisition
dates corresponding to the December 1999 through May 2000 period. Therefore, it must be
understood that, even tough the work was done in 2001, all the generated information refers to
the first half of 2000.
4. METHODOLOGY
4.1 DEFINITION OF CARTOGRAPHIC PARAMETERS
The cartographic parameters are the same used in the mapping of the Upper San Francisco
(CODEVASF, 1996) and Middle-Lower Regions of the San Francisco (GEF San Francisco
Project, 2000), to assure a standard for the entire Basin. Therefore, the UTM (Universal
Transverse Mercator) projection, the Córrego Alegre Horizontal Datum, the Vertical datum from
x
the marigraph at Imbituba (SC) and the 1924 international ellipsoid reference were used. The
work maintains the 1: 100,000 scale and a minimum mapped dimension greater than 0.1 km2.
4.2 LEGEND
The legend also includes the main items appearing in the map of the Middle-Lower San
Francisco Region, to cover the bordering area of these two sectors (Lower and Middle-Lower).
So, many items of the previous map were maintained and, given the particularities of the area,
several other classes were added, as shown in Figure 5.
Figure 5. Patterns used for the soil covertures and land use classes.
4.2.1 Dense caatinga
It is characterized by grouped vegetation with dense timber, testifying the low index of human
intervention in the primary vegetative coverture of the region. It has varying density, but always
very high, being distinguished by little or no visibility of the soil under the trees.
4.2.2 Open caatinga
Its main characteristic is the spacing of the shrubs, with clearings among them that may be
occupied by cactus and grasses which will remain during the rainy season. It occurs
predominantly in shallow and hard rocky soils. It has smaller density than that of the Dense
Caatinga.
4.2.3 Atlantic Forest
The Basin presents different types of forest formations, varying from dry inland vegetation to
humid areas close to until humid areas on the coastal zone. Its main characteristic is a greater
density of the wood and of the arboreal coverage. Here, the forests are located closer to the coast,
where the climate and the hydrologic regime allow the establishment of denser vegetation.
xi
4.2.4 Riparian vegetation
Riparian vegetation grows in the areas along ephemeral and permanent streams and rivers. This
vegetation can also be associated with the small seasonally irrigated areas that rely on the water
stored in the alluvium of the ephemeral streams or in surface reservoirs built in their dry courses.
4.2.5 Herbaceous Covertures
This small sized vegetation, predominantly grass, is associated with humid areas and must be
found in the depletion areas of surface reservoirs and ephemeral rivers or in naturally
waterlogged soils. When near to the coast, this vegetation may be associated to restinga
(sandbanks) and mangrove.
4.2.6 Mangrove
Terrain located next to the coast and subject to flooding by the tides. It has typical vegetation,
being characterized by the presence of aerial roots. In the area under study, Mangrove occurs near
the mouth of the San Francisco river.
4.2.7 Restinga
The Restinga is characterized by deposits of sand sediments, forming banks parallel to the coast,
usually creating several small ponds. It is worth mentioning the seasonal occurrence of
waterlogged areas. These characteristic sandbanks are also located close to the beach, by the
mouth of the River.
4.2.8 Nude soils
Areas with nude soils with a high incidence of rocks, which makes them unproductive,
preventing the growth of vegetation. These conditions are not resultant of deforestation or land
preparation for use.
4.2.9 Rocky Outcropping
Areas where rock substratum is exposed and the soil surface is completely deprived of
vegetation.
4.2.10 Degraded Dense Caatinga
It corresponds to the caatinga where woody species predominate and a reduction of plant
concentration has been noticed, as a result of anthropic actions.
4.2.11 Degraded Open Caatinga
It presents degradation mostly due to the extraction of wood for the production of charcoal or for
making stakes. There is a predominance of isolated shrubs, with the occurrence of exposed soil.
4.2.12 Degraded Atlantic Forest
It corresponds to a degraded equivalent of the original Atlantic Forest. The degradation has
varied forms, going from removal of spots of the vegetation to an almost total mischaracterization
of the original coverture.
xii
4.2.13 Deforested Areas
It corresponds to areas which have been cleared, next to or surrounded by areas of primary
vegetation. In most cases, their woody material is extracted for fuelwood or for making fences.
The deforested areas are used for pasture, with strong predominance of the buffel grass, or for
rainfed agriculture.
4.2.14 Areas Prepared for Future Use
Portions where the original vegetable coverage was removed, leaving area ready for a future use.
It differentiates from the resting soils (in rotation regimes) for not having a defined previous use,
both of them not in current use.
4.2.15 Pastures
Areas allocated for extensive livestock raising (goat, sheep, cattle and horse). Given the
differences in soil and climate, there is great diversity in the area, types of grasses and coverture
density, among the planted areas.
4.2.16 Farming Areas
Areas used for agricultural production, eventually under irrigation. In the Lower San Francisco
Region, there are plantations of corn, sugar-cane, manioc, tobacco and beans.
4.2.17 Coconut Groves
Areas with coconut plantations, mostly located near to the littoral, in the States of Alagoas and
Sergipe.
4.2.18 Irrigated Areas
Irrigation districts created by CODEVASF, CHESF or in private or public properties, where a
technically supported and well oriented agriculture is carried out.
4.2.19 Diversified Uses
Areas divided into small adjacent lots with a diversification of activities and uses (native
vegetation, farming, small-sized deforestations, pastures and soils not being used). Given their
size, it is impossible to individualize them in the 1:100,000 scale used in the produced maps. This
area indicates intense human intervention, through the diversified use of the land, which modified
the original vegetation.
4.2.20 Urban Areas
Most important Municipal seats, towns and villages of the Region.
4.2.21 Clouds and Cloud Shaded Areas
Areas with considerable cloud coverage, by the time the satellite passed over, making impossible
the precise identification of the targets on the images.
4.2.22 Dry riverbeds
It corresponds to the alluvial areas along the dry riverbeds with intermittent fluvial regime. These
alluvia allow large underground flows, by the time of the intense rainfalls in the region.
xiii
4.2.23 Water Bodies
Lakes, lagoons, dams and perennial rivers, whenever their water surface present mappable
dimensions.
4.2.24. Beach Sands
It corresponds to the beach areas by the mouth of San Francisco River. In the Region, these areas
are 50 to 200 meters wide and are, usually, intercalated with restinga and mangroves.
4.3 VALIDATION AND ADJUSTMENT OF THE CARTOGRAPHIC BASE
The cartographic material, consisting of the 22 topographic sheets or maps in digital format,
provided by CODEVASF, contained a few flaws.
The following actions were necessary to correct some of these items: homogenizing the density
of the hydrographic networks in different maps and editing the hydrographic information, in
order to resolve the problem of lack of continuity in the lines representing watercourses.
4.4 PROCESSING AND CLASSIFYING THE SATELLITE AND RADAR IMAGES
4.4.1 The Landsat System (ETM)
The Landsat images used were subjected to processes specifically developed for multispectral
optical sensors.
During the preprocessing, we applied geometric correction techniques to adjust the images'
georeferencing. The image processing phase is intended to enhance the contrast between the
different targets so as to increase the capacity to separate them. The linear contrast highlighting
technique, available with the Envi software, was used.
A further stage in the process of preparing images for interpretation is combining the original
bands in colored compositions. In this process, the six available bands can be combined, three by
three.
The automatic classification of multispectral images assigns an identifier to each image pixel,
associating it to a specific target. The different types of surface coverage are digitally represented
in the images, by their reflectance, which is equivalent to the numeric values of each pixel in the
multiple bands.
The Maximum Likelihood Supervised Classification Methodology was adopted. This supervised
classification approach allows interactivity between the interpreter and the classification
algorithm. The user identifies some of the pixels belonging to the desired classes and lets the
computer find and classify the other pixels belonging to those classes, based on a pre-established
statistical rule.
4.4.2 The Radarsat System
The orbital images produced by the Radarsat System are considerably different of those produced
by the Landsat, mainly in the type of assessed data and in the form they are obtained. The Radar
sensors, such as the Radarsat, operate the energy transmitted in microwave frequency, with
wavelengths much greater than those observed them by the human eye. The sensor operates in a
xiv
discrete microwave frequency, called C band (5.3 GHz or 5.6 cm wavelength), which generates
only one band.
Being an active sensor, the Radarsat synthetic aperture radar system (SAR) transmits an energy
pulse to the surface. The SAR system then measures the quantity of energy returning to the
satellite, after the pulse has interacted with the ground. The Radarsat transmits the horizontally
polarized energy and measures the energy that return with the same orientation. The variations
occurring in the signal of measured return are the result of variations in rugosity of the surface, in
the topography and in dielectric properties, bound mostly to the humidity content.
For the reducing the speckle noise of the Radarsat images, it was chosen to use the Frost adaptive
filter. The removal of the speckle noise is the most important step for improving the
interpretability of the images, since this noise degenerates substantially their quality. It is
practically impossible interpreting the images in their original state.
The geometric correction of a radar image is primordial, since the acquisition geometry is by
lateral viewing. The radar system surveys the surface according to an inclined straight line,
measured between antenna and the target (slant range). The projection of this line in the
horizontal plan corresponds to the distance between target and the nadir point of the antenna
(ground range).
The images Radarsat are already slant corrected for ground range. For the present work, the radar
images were co-referenced with the topographic 1:100,000 maps, viewing its adequacy to the
established cartographic projections system. The georeferencing was made with the Envi 3.4
software.
4.5 INTERPRETING AND PROCESSING LANDSAT AND RADARSAT IMAGES
Initially, the polygons resulting from the image classification phase were processed, using as a
tool the software of the Geographic Information System GIS (ArcView, version 3.2).
The radar images were only visually interpreted, as the current classification algorithms do not
produce satisfactory results for land use analyses.
4.6 FIELD WORK STAGES
To allow a correlation between the visualized targets in the images and the actual situation on the
ground, field verification was carried out in two stages.
4.6.1 First Field Verification
In the first field trip, occurred between the 23rd and the 27th of July of 2001, four surveys were
conducted covering much of the area under analysis. Since the objective of this first trip was a
preliminary assessment of the area, points with previously questioned interpretations and which
could be reached by the main roads were chosen. A car was provided by CODEVASF.
4.6.2 Second Field Verification
The second field trip, in the period of the 16th trough the 20th of September of 2001, was made in
a helicopter, provided by CHESF. Three flights were made over the area and, given the
xv
advantages offered by the helicopter, such as greater speed and the possibility of moving in
straight lines between points of interest, it was possible to cover the whole area with problems
and doubts.
5. PROJECT
OUTCOMES
5.1 THEMATIC
MAPPING
After completing all the stages described in the methodology, the thematic maps referent to each
of the topographic maps were made.
5.1.1 Map 1367 Sertania SC-24-X-B-I
The original vegetative cover (Dense Caatinga) predominates over other mapped classes, with 54
% of the area in the sheet. This class is found primarily in regions with steep relief, such as the
Sierras da Santa, Tatu and Carrapateira. The class of Diversified Uses spreads over 42% of the
area, being the second in size, followed by the Degraded Dense Caatinga. Usually, areas with
vegetative cover, either original or influenced by anthropic actions, predominate over those
strongly impacted by the man, which are generally used for livestock and farming activities.
5.1.2 Map 1368 Pesqueira SC-24-Y-F-I
The Diversified Uses class predominates, with 46% of the mapped area. The second class in
terms of geographic occupation is the Dense Caatinga, covering 38% of the total area. The
original and Degraded Dense Caatingas, representing the original vegetative cover, together,
account for 51%, being located primarily on the slopes of the Ororoba and Gaviăo Sierras. The
other classes add up to only 3% of the total area, and do not constitute a significant territorial
representation.
5.1.3 Map 1444 Poço da cruz - SC-24-X-A-IV
This sheet reveals the strong influence of man in the transformation of the natural landscape, with
over 75% of the mapped area occupied by the Diversified Uses class. The Dense Caatinga covers
23% of the land, but, contrary to the previous sheets, where it was spread over vast continuous
areas, in this case it is broken into small and discontinuous patches.
5.1.4 Map 1445 Buique SC-24-X-B-IV
Following the same trend of the previous map, areas impacted by anthropic actions predominate,
represented by Diversified Uses (36%) and Areas Prepared for Future Uses classes (20%),
claiming together 56% of the mapped area. The original vegetation covers nearly 30%t of the
sheet, with the original and the Degraded Dense Caatinga appearing predominantly in
discontinuous patches. This high degree of fragmentation in the vegetation reflects strong human
interference with the natural environment.
5.1.5 Map 1446 Venturosa SC-24-Y-F-III
The same trend observed in the previous maps is repeated here, with the areas impacted by man
prevailing over the natural areas. The Pastures, Diversified Uses and Prepared for Future Use
xvi
classes amount to 52% of the total area. It is worth mentioning the increment, in terms of area
devoted to livestock (17%). This activity is carried out in large farms characterized by the
existence of ponds, used for the herd's consumption, and by the presence of a few trees to
provide shelter for them.
The Dense Caatinga, original and Degraded, and the Open Caatinga, representing the original
vegetative cover, amount to 45% of the area, with 20% corresponding to the Degraded Dense
Caatinga. Despite the reduced density of this class, as a result of human activity, we can still
notice its natural physiognomic characteristics. Unlike the previous sheet, large areas are
identified as preserved caatinga, located mainly in its Eastern-Central portion and in the vicinity
of the mountain ranges. Although not widely distributed, riparian or ciliary vegetation is found
along the Cordeiro river, which crosses the map diagonally, in a NE-SW direction.
5.1.6 Map 1519 Salgado do melăo SC-24-X-C-I
As the portion of this map included in the Lower San Francisco Subregion is very small (1 km2),
only one class was mapped (Dense Caatinga) for the entire area (100%).
5.1.7 Map 1520 Paulo Afonso SC-24-X-C-II
Nearly 44% of the area is covered with the caatinga, in its two different physiognomic forms:
dense and Open Caatinga. However, the Dense Caatinga has been suffering a more intense
degradation than the Open Caatinga. The Degraded Dense Caatinga, with a slightly different
physiognomic form, occupies 17% of the area versus only 0.3% for the Degraded Open Caatinga.
The Open Caatinga is found along the rims of the canyon of the San Francisco, where the rocky
soil does not favor the growth of taller and denser vegetation. Farming and livestock activities
together account for 8% of the total area. There are two remarkable facts: a significant increase,
compared to the previous sheets, in the water bodies class, thanks to the San Francisco river, and
to the occurrence of irrigated areas.
5.1.8 Map 1521 Delmiro Gouveia SC-24-X-C-III
The Dense Caatinga has been preserved in locations of steep relief, such as the Sierras of Agua
Branca, Sabonete, Bois, Retiro, among other, representing 18% of the mapped area on this sheet.
Ciliary vegetation appears to be well preserved along a 15-kilometer stretch of the Capiá River.
But in other places, it is present only in short, fragmented and discontinuous patches. Together,
the Diversified Use and the Areas Prepared for Future Uses Areas classes account for 61% of the
total area, distributed all over the sheet. Farming activities are confined to the vicinity of the
Towns of Delmiro Gouveia and Olho d'Água do Casado, amounting to 5% of the mapped area.
Livestock raising is represented by large patches, located in the Northern-Central part of the
sheet, covering about 5% of the area.
5.1.9 Map 1522 Santana do Ipanema SC-24-X-D-I
A great homogeneity is verified in the sheet, due to the dominance of the Diversified Uses class,
which occupies, by itself, 50% of the area. The Farming Areas, the Diversified Uses and the
Prepared for Future Use classes, together, cover 80% of the represented area, under a heavy
anthropic influence and, consequently, presenting a modified natural environment. Livestock
xvii
raising is a common, activity in the territory, occupying 12% of the area, predominantly in its
Northern-Central portion. The original vegetative cover has been substantially degraded, to an
extent that of the 19% remaining area (original and Degraded Dense Caatinga), only 7% consists
of preserved caatinga. Following the same pattern found in the other sheets, it is located in hills
and mountainous areas.
5.1.10 Map 1523 Bom Conselho SC-X-D-II
In this sheet, there is a predominance of the Pasture, Diversified Uses and Prepared for Future
Use classes, accounting together for 72% of the total area. Areas used for grazing occupy
extensive tracts in the vicinity of the Cities of Minador do Negăo and Cacimbinhas, located in the
Northern-Central portion of the map. The remaining vegetative cover, represented by the Dense
Caatinga and the Degraded Dense Caatinga, covers 25% of the surface, 18% of that total
corresponding to Degraded Dense Caatinga. Besides presenting a lesser territorial expression, the
Dense Caatinga is also more fragmented and the highest concentrations of this vegetation are to
be found in the Northern portion of the map.
5.1.11 Map 1594 Canché SC-24-X-C-IV
Natural vegetative cover occupies 92% of the map's surface, and 57% of that refers to the
original Dense Caatinga, represented by large polygons found in the Northern and Southern parts
of the sheet.
5.1.12 Map 1595 Santa Brígida SC-24-X-C-V
The caatinga covers about 55% of the mapped surface in the sheet, 31% corresponding to
unaltered original vegetation and 23% to degraded areas. The Dense Caatinga is represented by
larger and continuous patches in the Western portion of the map. Farming and livestock raising
are relatively constrained, occupying only 2% of the total area. Diversified Uses and Prepared for
Future Use classes account for 42% of the area, and are scattered throughout the sheet.
5.1.13 Map 1596 Piranhas SC-24-X-C-IV
There are occurrences of both physiognomic forms of Caatinga (Dense and Open), as well as of
variations resulting from degradation. There is equilibrium between the areas occupied by these
two different types of caatinga, with 13% of the map area represented by Dense Caatinga and
12% by Open Caatinga. In terms of spatial distribution, the Open Caatinga occurs along the San
Francisco river, given the existence of rocky soils, while the Dense Caatingas is randomly
distributed throughout the remaining area. Small fragments of the Atlantic Forest are found in the
Southeastern portion of the map, representing 0.5% of the total map surface. The Diversified
Uses and Prepared for Future Use classes, together, account for 59% of the Region, distributed in
wide patches across the map. The California Irrigation Project is located in near the City of
Canindé do San Francisco, covering 2,430 hectares of the State of Sergipe.
5.1.14 Map 1597 Păo de Açúcar SC-X-D-IV
The Caatinga covers 20% of the total surface, 4% of this area presenting degraded vegetation.
The Atlantic Forest spreads itself along a narrow range located at the Southern edge of the map,
occupying 12% of the sheet. In the San Francisco river's stretch between the Ipanema River and
xviii
the City of Traipu, the Atlantic Forest was removed, for using the land for agricultural. The
Diversified Uses and Prepared for Future Use classes cover 47% of the surface, predominantly in
the caatinga area.
5.1.15 Map 1598 Arapiraca SC-24-X-D-V
It is worth emphasizing the great territorial extension occupied by farming activities and pasture,
which correspond to 30% of the total area. The first of them predominates in the vicinity of the
City of Arapiraca. During the field survey it was found that found tobacco, corn, manioc and
sugar-cane were the predominant crops. The Diversified Uses and Prepared for Future Use
classes are distributed in large patches all over the sheet, accounting for 51% of the map. The
Dense Caatinga, spread over 5% of the sheet, appears well fragmented in the Northern portion
and covering the Almécegas, Margarida, Porteira and Salobro Sierras, all of them in the Western
end of the map. The Atlantic Forest occupies the Southwestern sector, covering 9% of it, which
does not represent a vast region. And 4% of that area consists of degraded forest.
5.1.16 Map 1599 Săo Miguel dos Campos SC-24-X-D-VI
A strong homogeneity is verified in the sheet, in view of the vast geographic extent occupied by
the Farming class, which covers 50% of the total area. The second most common, covering 29%
of the area, is the Prepared for Future Use class. The Atlantic Forest occupies 17% of the map,
with 10% of it with areas where the vegetation has been altered by man.
5.1.17 Map 1665 Carira SC-24-Z-A-III
It is evident that there is a greater incidence of areas impacted by anthropic actions, compared to
natural areas, with the Diversified Uses and Prepared for Future Use classes covering a total of
56% of the sheet. The sectors with caatinga type of vegetation occupy, together, 35% of the map,
with 21% of Degraded Dense Caatinga. There are fragmented areas, identified as Dense Caatinga
and Degraded Dense Caatinga, located primarily in the Western sectors and in the vicinity of the
Sierra Negra. Areas of Atlantic Forest are located in the Northeast end of the map, spatially
presented in the form of discontinuous polygons, occupying 1% of the mapped area.
5.1.18 Map 1666 Cracho Cardoso SC-24-Z-B-I
Areas impacted by man, again, prevail over natural areas, with the Diversified Uses and Prepared
for Future Use classes accounting for about 67% of the sheet. Livestock raising (Pasture class) is
pursued in three large stretches, which represent 5% of the area. Regarding the vegetative cover,
the absence of the Caatinga shows that this sheet lies entirely within the domain of Atlantic
Forest vegetation, which covers 27% of the map. This class is distributed in discontinuous
patches across the map, reflecting the high degree of fragmentation of the vegetation, as a result
of heavy human interference with the natural environment.
5.1.19 Map 1667 Propriá SC-24-Z-B-II
The occurrence of Irrigated Areas, answering for 5% of the mapped area, is the main
characteristic of this sheet. CODEVASF controls four irrigation projects within this area: Várzea
de Boacica, located in the State of Alagoas, between the Towns of Propriá and Penedo; Propriá,
situated in the State of Sergipe near the City with the same name; Cotingüiba/Pindoba, which is
xix
downstream of the City of Propriá, in the State of Sergipe; and Betume, downstream of the City
of Neópolis, also in the State of Sergipe.
Another remarkable aspect is the significant increase in the area occupied Farming, which covers
38% of the total map, sitting on long stretches along the margins of the San Francisco river. The
Diversified Uses and Prepared for Future Use classes account for 24% of the map, while the
Atlantic Forest covers about 17%.
5.1.20 Map 1668 Piaçabuçu SC-24-Z-B-II
It is noticed the appearance of Mangrove and Restinga vegetation, associated with the certain
environmental conditions found in coastal zones. The Mangrove swamps are located close to the
beaches, especially in the State of Sergipe, occupying less than 1% of the sheet. The Restinga
(sand banks) occurs further inland, but still reflects the influence of the marine environment. In
the region of the Lower San Francisco, the Restinga exists in waterlogged areas with sandy soils.
This type of vegetation covers 15% of the total mapped area. The Atlantic Forest, which occupies
20% of the map, is losing ground to sugarcane plantations.
5.1.21 Map 1733 Japaraçu SC-24-Z-B-V
It is noticed that Restinga is the most common natural look in the mapped area, accounting for
29% of the sheet. The next most representative class in terms of area is Farming, which is spread
over 27% of the map. The occurrence of Coconut Groves, with 16% of the area, and Herbaceous
Coverture, with about 13%, are also relevant and peculiar.
5.1.22 Map 1734 Cabeço SC-24-Z-B-VI
This sheet, in a very limited area, is predominantly occupied by Mangrove, which covers the
estuarine areas of the watercourses and represents for 63% of the map. Next in line, come the
Beach, with 17%, and the Water Bodies, with 11%.
5.2 INTEGRATED
MAPPING
Since the objective of thematic mapping is to present a diagnosis of the area, all the individual
sheets were integrated into a consolidated map, showing all classes of soil use, exactly as they
were mapped in the separate sheets.
The compounded map for Lower San Francisco Subregion, product of the consolidation of
individual maps, is presented in the Figure 6 (all the information on the classes of soil use is
shown in Chart 2). As seen in the figure, most of the area is used for agriculture and livestock
raising, either separately or jointly (Diversified Uses Class). Farming is clearly predominant in
the regions closer to the mouth of the San Francisco river, where the rainfall regime allows the
growing of longer-cycled crops, such as sugarcane.
Another noteworthy fact is that, with the exception of the Western extreme of the area, classes
with the original vegetation, either preserved or degraded, are always found in small parcels with
irregular outlines, representing unaltered patches among areas subject to anthropic use. Although
such a pattern is predictable, in view of the maintenance of legal protection areas in rural
xx
properties, its spatial distribution is not as homogeneous as one might expect, indicating that most
landowners do not maintain legal reserves.
Notice that the margins of the San Francisco represent the only area with a slightly higher
preservation index, besides the three corners of the triangle-shaped area. In the remainder of the
area, the anthropization index is quite high, becoming evident that classes representing original
vegetative cover always appear as sparse patches.
Figure 6. Consolidated thematic map of the Lower San Francisco Subregion.
The most-preserved area is located in the Western end of the map, as it approaches the area
locally known as Raso da Catarina. The portions closer to the mouth of river are also better
preserved, in comparison to the central areas.
However, the most notable aspect is the absolute predominance of anthropized areas. Since much
of this region is under the influence of semiarid climate, this is a fact of great relevance, as it
indicates a higher-than-expected degree of land occupancy and use.
With the help of Figure 7, it can be noticed that the Diversified Uses and Prepared for Future use
classes, representing anthropized areas, together, account for about 48% of the total mapped area.
Among the natural covertures, the Dense Caatinga predominates, occupying 13% of the total
area, which can be enlarged to more than 22%, if compounded with the area with the Degraded
xxi
Dense Caatinga. The Farming and the Pasture classes also occupy a significant portion, even
though the former predominates only in areas near the littoral.
To complement the diagnosis of the area, a second assemblage of the individual sheets was made,
re-grouping the areas according to the following types: Preserved Natural Cover, Degraded
Natural Cover, Anthropized Areas and Other. This arrangement is shown in Figure 8, followed
by the description of each one of the categories.
xxii
Chart 2. Areas occupied by Classes of Soil Use in the Lower San Francisco Subregion
Class
Area (km2)
% of total Area
Preserved Natural Cover
Dense Caatinga
3,980.7
13.10
Atlantic Forest
1,434.5
4.72
Open Caatinga
578.5
1.90
Restingas (Sand Banks)
340.5
1.12
Riparian vegetation
132.3
0.45
Herbaceous Coverture
75.4
0.25
Rocky Outcropping
62.1
0.20
Mangrove 39.7
0.13
Nude Soil
12.3
0.04
Subtotal 6,655.0 21.91
Degraded Natural Cover
Degraded Dense Caatinga
2,833.6
9.33
Degraded Atlantic Forest
304.8
1.00
Degraded Open Caatinga
76.6
0.25
Subtotal 3,215.0
10.58
Areas impacted by anthropic actions
Diversified Uses
8,160.9
26.86
Prepared for Future Use
6,288.6
20.70
Farming 2,785.8
9.17
Pasture 1,967.3
6.48
Coconut Groves
402.9
1.33
Irrigation 169.3
0.56
Urban Áreas
110.8
0.36
Deforested Áreas
100.8
0.33
Subtotal 19,986.4
65.79
Others
Water Bodies
403.8
1.33
Beach Sand
65.4
0.22
Clouds and Cloud Shaded Areas
30.3
0.10
Dry Riverbeds
21.2
0.07
Subtotal
520.7
1.72
Total 30,377.1 100.00
xxiii
Figure 7. Percentual distribution of Classes of Soil Use in the Lower San Francisco
Figure 8. Regrouping of the mapped classes by category for the Lower San Francisco
xxiv
5.2.1 Preserved Natural Covertures
The Preserved natural coverture is represented by seven classes of plant cover Dense Caatinga,
Open Caatinga, Atlantic Forest, Riparian vegetation and Herbaceous Coverture - and by the Nude
Soils and Rocky Outcropping classes, which represent the natural state of the land but have no
vegetation.
5.2.2 Degraded Natural Covertures
The Degraded natural cover is represented by three classes with the degraded equivalent of the
three main types of plant cover found in the Region: Degraded Dense Caatinga, Degraded Open
Caatinga and Degraded Atlantic Forest.
5.2.3 Anthropized Areas
Anthropized areas are represented by eight classes, corresponding to the areas that suffered direct
anthropic intervention: Deforested Areas, Prepared for Future Use, Pasture, Farming, Coconut
Groves, Irrigation Projects, Diversified Uses and Urban Areas.
The Deforested Areas class represents the environmental degradation, in the strict sense, covering
as little as 0.3% of the total area. The other classes represent forms of land occupancy for
diversified purposes, with a predominance of the Diversified Uses, which is characterized by a
combination of Farming and Livestock Raising in small parcels.
5.2.4 Others
This category includes the classes that, given their particularities, would not fit in any of the
previous categories, and could not constitute a new category, by themselves: Clouds and Cloud
Shaded Areas, Dry Riverbeds, Water Bodies and Beach Sand.
5.3 PRODUCTS
The accruing products are presented in two formats: analogical maps and digital files. The
analogical product consists of 22 maps, in a 1:100,000 scale, plotted in A0 paper size with a
layout similar to that used for the mapping of the Middle-Lower San Francisco Basin. Notice that
of the 22 mapped sheets, the eight focused on the border of the Middle-Lower and the Lower San
Francisco Subregions had their limits adjusted by conciliating their interpretations.
This analogical product consisted of PostScript files (*.ps extensions), which can be plotted in
inkjet plotters. If faster print outs are desired, it is possible to use the files in the TIFF format
(*.tif extension), obtained from the electronic digitalization of the printed maps, in 300 dpi
resolution, in color.
The digital maps are saved in the Shape format (*.shp extension), for vectorial information, in the
Envi Image format (*.img extension), for storing the images, and in ArcView 3.2 project files
(*.apr extension), which consolidate all the layers of information used on of the mapping.
xxv
Presented as additional products, Appendices 1, 2 and 3 contain, respectively, the Thematic
Mapping by Sheet, in a 1:100,000 scale, the Characterization of the Mapped Classes and the
Field Report and Photographic Inventory.
All the digital files referring to this document and to its appendices were recorded in a CD-ROM,
which has become an attachment to the Final Report of the Activity.
6. CONCLUSIONS
The percentual distribution of the soil use categories throughout the Lower San Francisco, shown
in Figure 9, summarizes the outcome of the thematic mapping of the Subregion. It indicates that
more than 65% of the area is covered by Anthropized Areas. Considering that areas with
degraded natural vegetation also represent the impact of anthropization, this percentual would
exceed the 76% of the area.
Figure 9. Percentual distribution of soil use categories in the Lower San Francisco
However, the predominating classes in the Anthropized Areas category (65.79%) are, most of
them, associated with the land use and not necessarily with environmental degradation. This fact
gives a different scenario, with about 33% of the total area covered by vegetative cover in its
natural state, or with some degree of degradation. Less than 2% corresponds to Deforested Areas,
which could be classified as environmental degradation in the strict sense. All the remaining area
is devoted to farming and livestock raising operations.
Thus the Lower San Francisco Subregion may be characterized as an intensely anthropized area,
but with a low level of environmental degradation. On the other hand, the environmental impacts
xxvi
of excessive land clearing, associated with the semiarid climate, must be taken into account as the
exposed soils might reach a high index of disaggregation, resulting in the susceptibility to erosion
processes.
7. RECOMMENDATIONS
7.1 CHANGES IN METHODOLOGY
As part of the experience acquired during the work, it was verified that some items could be
optimized in a stage of the Project, which may be extending the mapping to other areas of the
Basin, or updating the just elaborated maps.
7.1.1 Simplifying the Legend
A few simplifications can be made in the legend, since not all classes had a sufficiently
representative area which justified its inclusion. Of a total of 24 classes, seven are responsible for
more than 90% of the area. The 17 remaining classes represent only 9.6% of the area.
Obviously, some of these classes with low representability in terms of area have a great relevance
in the mapping context. Thus, some classes could be lumped together (Coconut Groves, for
example, can be added to the Farming class). Another example would be Diversified Uses and
the Prepared for Future Use classes, which could be combined into an "Agricultural Activities
and Livestock Raising" class . The Nude Soil class, which presented the smallest extension, could
be combined, forming the "Rocky Outcroppings Associated with Exposed Soil" class.
7.1.2 Changes in the Geometric Adjustment Methodology
The use of digital maps provided by CODEVASF for geometric adjustment of the satellite
images (georeferencing) presented a series of problems associated with the quality of the
digitalization of the sheets.
In order to prevent problems alike in the future, it is suggested the use of we suggest using maps
of the Geographic Survey Division of the Army and of the Brazilian Institute of Geography and
Statistics (IBGE), which, after scanned and georeferenced, could be used as basis for correcting
the satellite images.
7.1.3 Using Aster Satellite Images
Images from the ASTER satellite, which was recently launched by NASA, offer superior spatial
and spectral resolution, compared to those of the Landsat 7. The images analyzed for the present
work showed great potential for the land use mapping.
A further advantage is that the ASTER images can be obtained directly from NASA, via the
Internet, being delivered within a few hours of the order (if available in their database). On the
other hand, Landsat 7 images take several days to be processed and mailed on CD. In some cases,
this may delay the beginning of the job.
xxvii
7.2 Thematic Mapping of the Middle and of the Upper San Francisco.
Figure 10, which presents the current stage of the San Francisco Basin Subregions' mapping,
shows that most of the area is still to be mapped or already needs updating.
Figure 10. Situation of the land use thematic mapping of the San Francisco Basin.
Thematic mapping of land use in the Middle-Lower and Lower San Francisco Subregions, object
of Activity 2.1, of the GEF San Francisco Project, has proved to be an extremely useful tool for
preparing a sustainable development policy for the Region. The data obtained can be used for a
detailed and a localized assessment of the area, identifying potentials, land use trend, agrarian
structure and degree of environmental degradation, among other parameters.
Therefore, it is recommended an extension of thematic mapping to the entire Basin, using remote
orbital sensing, for covering the Middle and updating the Upper San Francisco. The mapping of
the latter done by CODEVASF, in 1996, and, posteriorly, recovered and edited by the GEF San
xxviii
Francisco Project. In this manner, a thematic map, based on the same methodology, would be
available for the entire Region.
7.3 THEMATIC MAPS DEVELOPMENT AND UPDATING TIMETABLE
As verified in the Upper, Middle-Lower and Lower San Francisco Subregions, there exists a high
degree of anthropization. Even though degradation itself is not quite severe, the level of impact
calls for a regular and permanent supervision of the area, in view of the tenuous separation line
between anthropized and degraded areas.
Based on this fact and on the anthropization indices assessed for the mapped areas, which vary
between 30% and 75%, a map updating timetable was prepared (Figure 11). This timetable
established 3-year periods as basis for the new mappings. It is strongly recommend the
maintenance of the used methodology, to allow a comparative assessment of the products. This
way, the material could also be used for multi-temporal analyses, extremely useful and
conclusive with regard to evaluating degradation and changes in land use patterns.
Figure 11.
Land use mapping timetable for the San Francisco Basin
xxix
7.4 MAPPING OF THE MIDDLE SAN FRANCISCO SUBREGION
This work must be carried out by a team of seven consultants with expertise in digital
cartography, remote sensing, remote sensing, photo-interpretation, geoprocessing and Geographic
Information Systems, contracted exclusively for this job. The duration will be of 12 months, at a
total cost of US$346,040. The project foresees a CODEVASF´s counterpart equivalent to
US$250,000. Cost details are shown in Chart 3.
Chart 3. Mapping costs for the Middle San Francisco Subregion.
Discrimination US$
Personnel:
7 consultants (@2,500/month x 12 months)
210,000
Travels:
12 (twelve) airplane tickets
6,000
80 (eighty) daily allowances
5,040
Subtotal:
221,040
Material:
Office Material
15,000
Subtotal:
15,000
Other Expenses:
Maintenance costs
20,000
Satellite images
30,000
Helicopter rental
60,000
Subtotal:
110,000
Total:
346,040
CODEVASF's counterpart
250,000
Global Total:
596,040
7.5 UPDATING FOR THE UPPER SAN FRANCISCO SUBREGION
The updating project for the Upper San Francisco should be conducted by a team of six
consultants, who, as in the preceding work, should be specialists in digital cartography, remote
sensing, photo-interpretation, geoprocessing and Geographic Information Systems. The duration
will be of 10 months, and the total cost US$272,410. In this project, CODEVASF will contribute
with the amount of US$200,000. Cost details can be seen in the chart 4.
These recommendations for the Middle and Upper San Francisco Basins could be taken into
account in the preparation of the Strategic Actions Program (ASP), which will be developed
xxx
based on subsidies provided by the recommendations of the several Activities of the GEF San
Francisco Project.
Chart 4.
Costs for updating the Upper San Francisco map
Discrimination US$
Personnel:
6 consultants (@2,500/month x 10 months)
150,000
Travels:
10 (ten) airplane tickets
5,000
70 (seventy) daily allowances
4,410
Subtotal:
159,410
Material:
Office Material
13,000
Subtotal:
13,000
Other Expenses:
Maintenance costs
15,000
Satellite images
25,000
Helicopter rental
60,000
Subtotal:
100,000
Total:
272,410
CODEVASF's counterpart
200,000
Global Total:
472,410
xxxi