
INTEGRATED MANAGEMENT OF LAND BASED ACTIVITIES
IN THE SÃO FRANCISCO RIVER BASIN PROJECT
GEF/ANA/OAS/UNEP
Activity 2.1 Thematic Land Use Mapping of the Middle-Lower São Francisco Basin
Executive Summary of the Final Report
DETERMINATION OF LAND USE IN THE MIDDLE-
LOWER SÃO FRANCISCO RIVER BASIN
Companhia de Desenvolvimento dos Vales do São Francisco e do Parnaíba
Brasília - DF
INTEGRATED MANAGEMENT OF LAND BASED ACTIVITIES
IN THE SÃO FRANCISCO RIVER BASIN PROJECT
GEF/ANA/OAS/UNEP
Activity 2.1 Thematic Land Use Mapping of the Middle-Lower
São Francisco Basin
Executive Summary of the Final Report
DETERMINATION OF LAND USE IN THE MIDDLE-
LOWER SÃO FRANCISCO RIVER BASIN
Coordinator
Rui Alcides de Carvalho Junqueira
Companhia de Desenvolvimento dos Vales do São Francisco e do Parnaíba - CODEVASF
Consultants
Carlos Alcebíades Barros Cavalcanti
Francisco Javier Fernandez Fawaz
Ileana Saraiva de Alencar Mota
Verner Riebold
December 2000
DETERMINATION OF LAND USE IN THE MIDDLE-LOWER
SÃO FRANCISCO RIVER BASIN
EXECUTIVE SUMMARY
INTRODUCTION
The Middle-Lower São Francisco extends itself from the City of Remanso to the City of Paulo
Afonso, both in the State of Bahia. Land Use mapping in the Region was associated to several
physical variables, such as topography, pedology, irrigation land classes, soil agricultural
aptitudes, hydrologic regime of the São Francisco River and tributaries, demand and consumption
of water, by sub-basin, etc.
The crossing of these variables produces essential information for the rational planning of
political, technical and administrative actions viewing the sustainable development of the São
Francisco River Basin, through the elaboration of the Integrated Management Plan of the São
Francisco River Basin.
1.
CHARACTERISTICS OF THE AREA
The Middle-Lower São Francisco Region is located between the 7º e 11º30´ South Parallels and
the 37º e 43º West Meridians, occupying 126,770 km2 , which corresponds to around 19.8% of
the São Francisco Basin. It covers 86 Municipalities, in the States of Alagoas, Bahia and
Pernambuco.
According to the 2000 Demographic Census, 31% of the population in the Brazilian Northeastern
Region live in urban centers. This is about the same proportion found in the Middle-Lower
Region. Summation of urban and rural population in the Municipalities within the area is
2.431.000 inhabitants.
The Municipalities of Petrolina, in Pernambuco, and Juazeiro, in Bahia, are the most expressive
development poles in the Middle-Lower São Francisco. CODEVASF built, until December of
2000, irrigation public districts, covering 49,000 ha, aiming at the development of a new
agricultural technology in the region, proving to the private sector that irrigation and agro-
industry were highly profitable economic activities. Today, those are the most remarkable
activities in the Region, being responsible for improvements in the regional population's life
quality in the past years.
The Middle-Lower has significant water resources potential. Power generation, guaranteed by a
complex of reservoirs and power plants built in the Region, by CHESF, was a determinant factor
in the economic development of the Northeast, providing the basic conditions for the energy
infrastructure, for consolidating irrigated agriculture and the agro-industry.
i
Proper administration and optimization of governmental and private investments, already made
or programmed for the Region, are essential conditions for consolidation and maintenance of the
Middle-Lower São Francisco as the most important development pole in the Northeastern Semi-
Arid.
2. CURRENT SITUATION OF THE LAND USE MAPPING IN THE MIDDLE-LOWER
SÃO FRANCISCO
CODEVASF has already mapped land use in the São Francisco River Basin located within Minas
Gerais, producing 84 sheets, in a 1:100,000 scale. Activity 2.1 is an extension of the work started
by the Company, consisting in the mapping of the Middle-Lower Region, with additional 62
sheets, in the same scale.
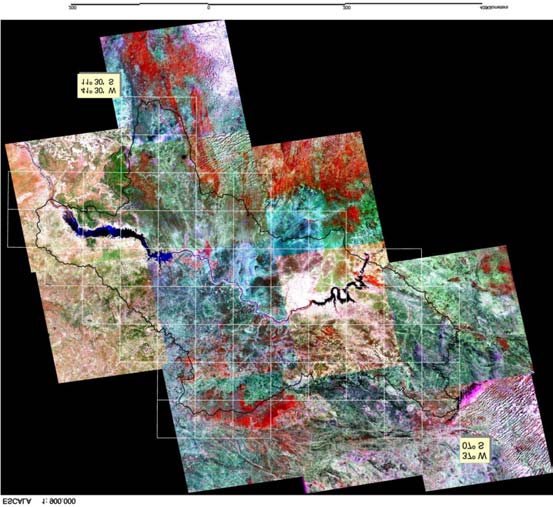
Both Works follow the same methodology. However, the satellite images used for the Middle-
Lower Region, according the list of orbits/points of the Landsat satellite shown in Figure 3, are
more recent than those used by CODEVASF, from the 1994-1996 period.
3. METHODOLOGY
The work was carried out according to the following stages:
· Definition of cartographic parameters;
· Bibliographical survey;
· Review and adjustments in the cartographic base; and
· Preparation of the thematic maps.
3.1 DEFINITION OF CARTOGRAPHIC PARAMETERS
The adopted projection system was the Universal Transverse Mercator projection, the Córrego
Alegre Horizontal Datum, the vertical datum from the marigraph at Imbituba (SC) and the 1924
international ellipsoid reference. The minimum dimension for the mapped polygons, representing
the different classes of land use, according to the legenda, was 10 ha.
3.2. BIBLIOGRAPHICAL
SURVEYS
Surveys were carried out gathering information on the predominant economic activities and on
the different physiognomic forms of vegetative covers in the Region. The works of the State
Secretary of Water Resources of Pernambuco, entitled State Water Resources Plan of 1994, and a
document prepared in 1995 by CODEVASF`s Planning Directory, entitled "Brigida River Basin
A Proposal for Sustainable Development", were consulted.
3.3. REVIEW AND ADJUSTMENTS TO THE CARTOGRAPHIC BASE
As a cartographical support to the land use mapping of the Middle-Lower São Francisco,
,CODEVASF provided 62 digital topographic sheets, obtained by digitalization of analogical
sheets published by the Army's Directory of Geographic Services and by the Brazilian Institute
of Geography and Statistics (IBGE), in a 1:100,000 scale. This material turned out to be of non-
homogeneous quality, requiring additional work not specified in the Terms of Reference, such as
the adjustment of vectorial elements of the hydrographic network and updating of the main and
secondary road systems, base don the digitalization of the Landsat images.
3.4. PREPARATION OF THE THEMATIC MAPS
Advanced remote sensing, digital cartography and geographic information system techniques
widely adopted for elaboration of thematic land use maps base don satellite images were used.
In this case, the following remote sensing products were used: 12 scenes the Landsat 5 and 7
satellites, bands 3, 4 and 5, combined in R/4, G/5, B/3, 30 m spatial resolution, nine of them
obtained in 1999 and remaining three in 1994, 1997 and 1998 (all of them prior to the drought
periods in the Region). The supervised classification method was adopted, and the image
processing software was the Envi, version 3.2.
4. MAPPING
LEGENDA
Defining the legenda required different stages and was concluded only after field verification and
correlation, during two trips made by the consultants, in March and September of 2000.
The chosen legenda represents the set of different land use classes and vegetative covers best fit
to the actual soil occupation conditions in the Region. It is supported by field investigations by
land or by helicopter. The objective was to select a set of classes which was more compatible
with information collected in the field than with the results of a digital classification. Even
though supervised, the latter emphasized distinct areas of spectral responses which would not
necessarily correspond to distinct classes of land use.
Viewing easier searches and analyses in a computer environment, each class of land use or
vegetative cover was associated to a numeric attribute designated by the term "class" or
"gridcode", correlated to their respective descriptive texts, as folllows:
Class
Vegetative Cover
area (km2) %of the Middle-
Lower Region
1
Dense Caatinga
20,195.22
15.93
2
Dense degraded Caatinga
28,175.22
22.23
3
Open Caatinga
20,549.29
16.21
4
Open degraded Caatinga
19,175.24
15.13
5
Herbaceous coverture
210.74
0.17
22
Atlantic Forest fragments (highland swamps)
139.52
0.11
Land use and other covers
6
Riparian vegetation associated with small 1,074.55 0.85
irrigation
7
Deforested áreas
1,256.97
0.99
8
Pasture 242.30
0.19
9
Agriculture 1,359.57
1.07
10
Diversified agriculture, associated with native 25,683.59 20.26
vegetation, small scale deforestation, resting soils
(rotation regime) and pasture
11
Irrigated áreas
1,461.75
1.15
12
Rock emergences
116.60
0.09
13
Rock emergence associated with native vegetation
263.04 0.21
and or nude soils
14
Water bodies
3,756.73
2.96
15
Mining áreas
18.74
0.01
16
Nude soils
173.03
0.14
17
Urban areas
498.83
0.39
18
Clouds and cloud shaded areas
340.19
0.27
19
Low productivity irrigated areas, associated to
1,167.13 0.92
poor soil management
20
Areas subjected to water level fluctuations
646.31 0.51
(margins of reservoirs)
21
Dry riverbeds
266.31
0.21
Total
126,770.93
100.00
5.
DEMONSTRATIVE SIG PROJECT
Viewing the presentation of an embryo of an spatial consulting system, regarding the information
produced by Activity 2.1, a digital product was created to allow the analysis of data relating them
to the administrative divisions and to the hydrographic units defined by the Otto Pfafstetter
Method, the "ottobasins".
The presented product consists of a demonstrative Project of a GIS, in apr format (ArcView),
obtained by the fusion of graphics and alphanumeric databanks related to land use, ottobasins and
political-administrative division themes.
This demonstrative project was developed in an ArcView 3.2a environment, combining the 62
sheets in 1:100,000 scale, into a sole digital file in shape format, formed by a total of 30,126
polygons. The system allows spatial analysis among different classes of land use and of their
location within the ottobasins and State/Munnicipal units.
Law 9,433/97, of January 8th, 1997, which instituted the National Water Resources Policy,
defined the Basin as the territorial unit for implementation of the Policy and of the National
Water Resources Management System.
Therefore, the water resources plans must be elaborated for the basins, in the State and in the
Country, which turns mandatory the definition of a classification and codification system for the
basins in Brazil. With this purpose, it is expected the implementation of a georeferenced, spatial
and tabulated digital base of codified basins, according to the Otto Pfafstetter Method. This
technique, known as ottobasins, is based on the topology of the network and in the drainage area,
and has been adopted by the Secretary of Water Resources of the Ministry of the Environment.
To illustrate how practical the developed system is, the following examples are presented:
5.1 EXAMPLE
1
Prepares a chart of statistical associated data, showing the total irrigated area in the
Municipalities of Petrolina, in Pernambuco, and Juazeiro, in Bahia.
5.2 EXEMPLE
2
Shows the results of consultation on the area occupied with the class 10 land use (diversified
agriculture, associated with native vegetation, small scale deforestation, resting soils and pasture),
in the Terra Nova creek Basin, in Pernambuco.
5.3 EXEMPLE
3
Refines the outcomes of Example 2, separating the area with class 10 in the Terra Nova creek
Basin located in the Municipality of Salgueiro, in Pernambuco.
6.
PRESENTATION OF RESULTS
The results of the land use mapping in the Middle-Lower São Francisco are available in
analogical and digital formats. The analogical products consist of LaserJet plotted hardcopies of
all sheets in the thematic mapping object of Activity 2.1. The digital files are contained in a CD-
ROM (shp, prt and apr ArcView formats) related to the implemented work.
8. CONCLUSIONS
The Middle-Lower São Francisco Region is spread over a 126,770 km2 territory, on the States of
Alagoas, Bahia and Pernambuco. Approximately 69.5% of that area (88,094 km2) is covered by
caatinga in different stages of preservation. It should be noticed that 32% of the mapped area
(40,744 km2) is occupied by dense and open caatinga, corresponding to sectors not yet altered by
man's actions or with interventions so small that were not detected in the satellite images.
The degraded dense and degraded open caatinga occupy 37.3% (47,350 km2) of the total area.
The activities contributing the most for the degradation are coal and fence post productions.
Around 2,568,000 ha (25,683.59 km2 ), equivalent to 20% of the Middle-Lower São Francisco,
constitute the class identified as gridcode 10, characterized as areas under continuous changes,
mostly due to anthropic factors. This class includes distinct groups of land use and vegetative
covers, forming mosaics of small dimensions, occupied by subsistence agriculture, fragments of
native vegetation, deforested areas, prepared and/or resting soils and pasture. Given the difficulty
of cartographically representing individually each one of those occurrences, due to limitations in
the used scale (1:100,000), they were grouped in a same class.
Irrigated areas, identified as gridcode 11, cover 146,000 ha, corresponding to 11.5% of the total.
Public irrigation districts and private properties of all sizes, and in different technological stages,
regarding irrigated agriculture, are all included here.
Desertification on the Middle-Lower São Francisco was object of an specific study, contracted
with Professor Carlos Hiroto Saito, of the University of Brasília, simultaneously with the land
use mapping. In spite of the great expectation regarding the process, no areas affected by the
phenomenon were identified (at least none was visible in the adopted scale).
10. RECOMMENDATIONS
It is recommended that the land use and soil occupation mappings mãe for the Upper and and
Middle Lower São Francisco be extended to the remaining physiographic areas (Middle and
Lower Regions), in order to support the Integrated Management of Land Based Activities in the
São Francisco River Basin Project.
A proposal was presented (Appendix 3) focused on the mapping of land use and soil occupation
in the lower São Francisco, in a 5-month period, at a cost of US$71,700, from the GEF, and
US$200,000, as a counterpart of the Federal Government. The work will be carried out by a tem
similar to the one involved in that of the Middle-Lower São Francisco, under CODEVASF's
orientation.
For a better evaluation of the spatial changes occurring in the Middle-Lower São Francisco, it is
recommended a periodic land use mapping, which will allow the efficient monitoring of the area.
Through multi-temporal analyses, realized with images of the same orbit/point, for different
dates, it is possible to detect trends and growth vectors for variables such as deforestation, urban
and agricultural areas, anthropic activities, etc. It is the consultants' opinion that the mappings
should be repeated at 5 to 10 years intervals.
Another recommendation refers to the consolidation of the results obtained by the 27 Activities
constituting the GEF São Francisco Project, in a computational environment, with the access
capability made possible by the technology of the Geographic Information System (GIS).
Geographic information are increasingly a more important component in the great decision
making process, both in the public sector and in the private initiative. The quality of this
information represents the basic integrating element among the distinct components of a GIS.
In the case of the Middle-Lower São Francisco, the cartographic material used, provided by
CODVASF, presents some technical flaws, already mentioned throughout this Report. They must
be corrected, to avoid compromising the georeferencing of the collected or produced information.
With this purpose, it is suggested a careful review of the digitalization of the mapping sheets (in
1:100,000 scale), covering the São Francisco River Basin.