

INTEGRATED MANAGEMENT OF LAND BASED ACTIVITIES
IN THE SÃO FRANCISCO RIVER BASIN PROJECT
GEF/ANA/OAS/UNEP
Activity 1.4 - Development of a Water Quality Monitoring
System in the Middle-Lower São Francisco Basin
Executive Summary
DEVELOPMENT OF A WATER QUALITY MONITORING
SYSTEM FOR THE MIDDLE-LOWER SÃO FRANCISCO
BASIN: ENVIRONMENT SUSTAINABILITY INDEX FOR
WATER USAGE (ISA_Water)
Jaguariúna-SP
INTEGRATED MANAGEMENT OF LAND BASED ACTIVITIES
IN THE SÃO FRANCISCO RIVER BASIN PROJECT
GEF/ANA/OAS/UNEP
Activity 1.4 - Development of a Water Quality Monitoring
System in the Middle-Lower São Francisco Basin
Executive Summary
DEVELOPMENT OF A WATER QUALITY MONITORING
SYSTEM FOR THE MIDDLE-LOWER SÃO FRANCISCO
BASIN: ENVIRONMENT SUSTAINABILITY INDEX FOR
WATER USAGE (ISA_Water)
Coordinator
Aderaldo de Souza Silva
Embrapa Meio Ambiente
Consultants
Anderson Soares Pereira
Ana Maria Ramos de La Cruz
Cláudio César de Almeida Buschinelli
Daniela Martins Mariuzzo
Ênio Farias de França e Silva
Francisco de Assis Nunes da Silva
Izilda Aparecida Rodrigues
José Maria Gascó
Luiz Carlos Hermes
Luiza Teixeira de Lima Brito
Marcos César Ferreira
Maria Inês Martins Ferreira
Osmar Abílio de Carvalho Júnior
Renato Fontes Guimarães
Roberto Affonso Marino
Ronalton Evandro Machado
Zacarias Lourenço Vaz Ribeiro Filho
December 2002
DEVELOPMENT OF A WATER QUALITY MONITORING SYSTEM
FOR THE MIDDLE-LOWER SÃO FRANCISCO BASIN: ENVIRONMENT
SUSTAINABILITY INDEX FOR WATER USAGE (ISA_Water)
EXECUTIVE SUMMARY
INTRODUCTION
The Integrated Management of Land Based Activities in the São Francisco River Basin Project,
the GEF São Francisco Project, coordinated several studies aimed at the development of an
Integrated Management Program for the Basin. The contribution provided by Activity 1.4
("Development of a Water Quality Monitoring System for the Middle-Lower São Francisco
Basin"), consisted of a pioneer methodology focused on the creation of an "Environment
Sustainability Index for Water Usage", the ISA_Water.
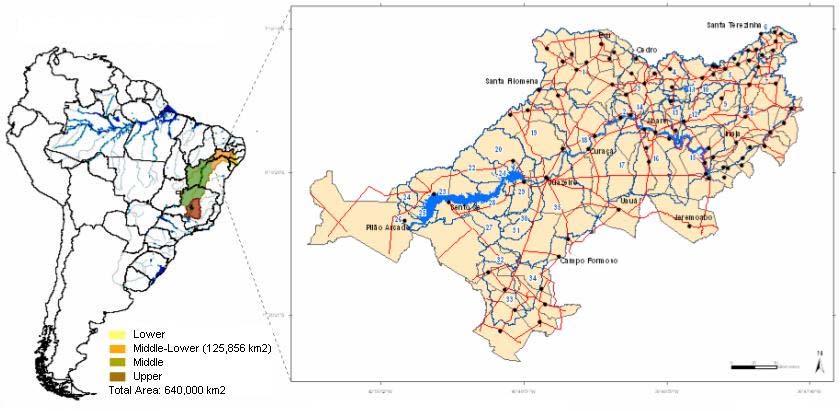
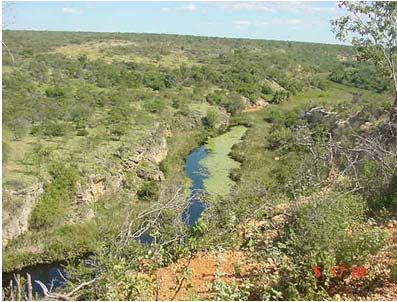
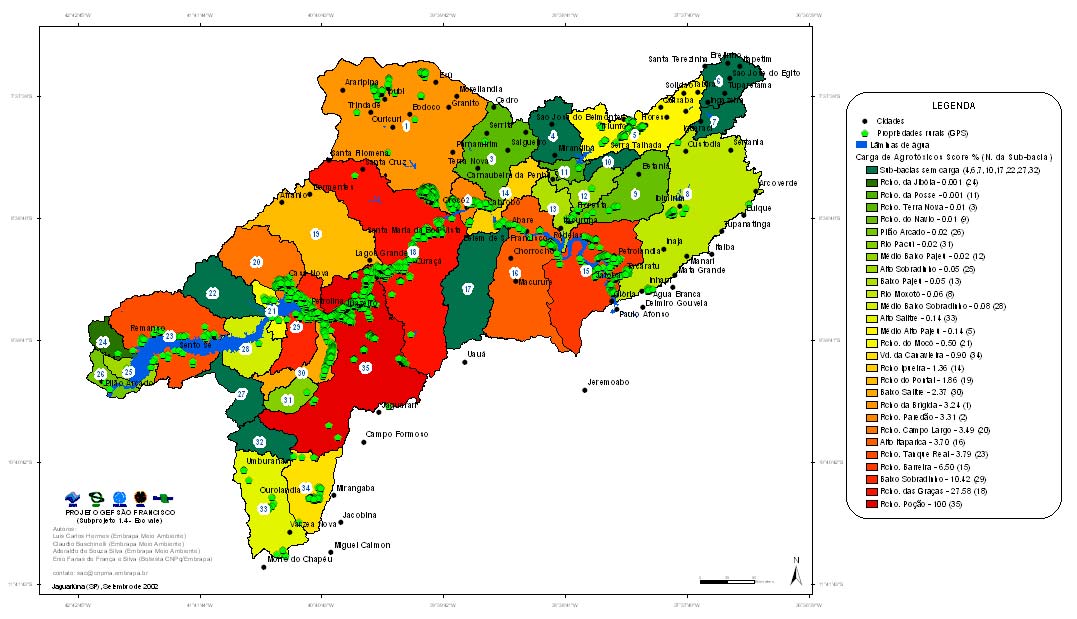
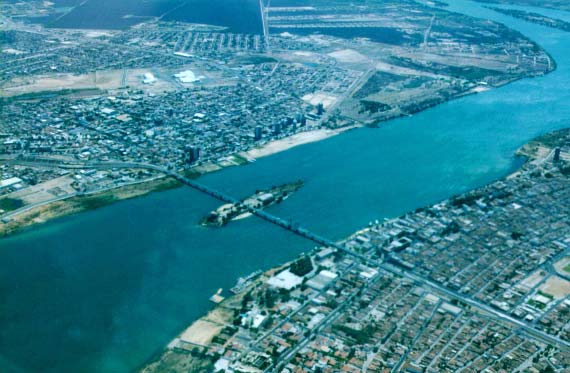
The selection of the Middle-Lower São Francisco (Figure 1) occurred because of the
environmental impacts of the agro-industrial complex located there, of the significative disposal
of domestic wastes, by the riverine communities (around 2.5 million inhabitants) and also due to
the need to implement an environmental quality program, to support agriculture.
The environmental sustainability of water usage is here defined as a measure of the mechanisms
for water resources quality management, monitoring and control, based on the sustainable
development concept. It measures the average situation of a geographical unit of reference, in
three basic dimensions (ecologic, economic and social), integrating them at the end, in order to
assess, in qualitative and quantitative terms, the indices' performance. This will support political
decisions aimed at the Region's sustainable development.
The ISA_Water, involving economic, social and ecological dimensions, had financial support
from the Global Environment Facility (GEF), through the São Francisco Project
(ANA/GEF/PNUMA/OEA), along with support from the Brazilian Enterprise of Agriculture and
Livestock Research (EMBRAPA) and from the Company for the Development of the São
Francisco and Parnaíba River Valleys, and Agriculture Departments of the Prefectures in the area
under study.
2.
METHODOLOGIC PROPOSAL FOR THE SUSTAINABLE USE OF THE WATER
2.1. CONCEPTUAL BASE
i

Figure 1. Location of area under study, in the Middle-Lower São Francisco.
The present work made use of the sustainable development concept made famous in 1987 by the
World Commission for the Environment, adopting the definitions used by the working team of
the Brazil-Germany Technical Cooperation Agreement ((ABC/BMZ).
The study considered in an integrated manner the social, economic and ecologic profiles, in the
assessment of the water bodies. Each profile was characterized by great themes, built based on
information obtained in the field, during four years, and on secondary data provided by the
Brazilian Institute of Geography and Statistics (IBGE).
The environmental index obtained at the end consisted of an actual qualitative and quantitative
description of some of the components selected in each one of the mentioned profiles, taken as
indicators.
2.2. METHODOLOGICAL CONSIDERATIONS
The present proposal for sustainable use of the water adopts a new approach for water resources
management, with focus on two main topics. The first one suggests the incorporation of
environmental management concept, supported by the ISSO 14,001 norm. The second shifts the
focus on the multipurpose water usage to a regional sustainability dimension, by Basin, creating
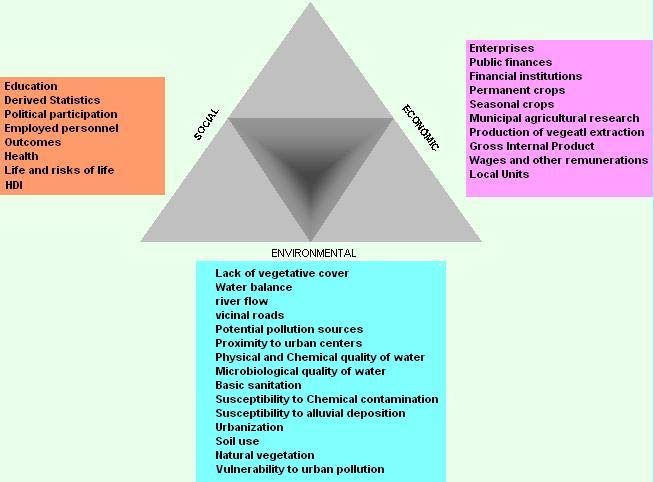
sustainability indicators. The integration of the three profiles (social, economic and ecologic) for
the creation of the indicators is shown, schematically, in Figure 2.
ii
Figure 2. Schematic model of the integration of the social, economic and ecologic profiles,
aiming at the environmental sustainability of the water usage.
2.2.1. Ecologic profile
The ecologic profile of the sustainable development indicators evaluates the environmental
degradation imposed by men in their use of the natural resources. It also focuses on the objectives
of the environment's preservation and conservation, considered as essential for the benefit of
future generations. Environment protection, as the new target of environmental management, is
difficult to be operationally conceived, given the complexity of the ecosystems. It is also difficult
to identify ecologic indicators to measure the environment's health.
The ecologic profile was built with the use of an integrated analysis of 16 indicators: Lack of
vegetative cover, water balance, river runoff, vicinal roads, pollution sources, evaluation of
environmental impact on springs proximity to urban centers, water's physical, chemical and
microbiological quality, basic sanitation, susceptibility to chemical contamination, agrochemical
loads from irrigated agriculture and degradation of water resources (see Figure 3). Most of the
information collected in loco viewing the construction of the ecologic profile, were
georeferenced.
These primary data were collected in the field, with physical, chemical and microbiological
analysis of the water, using inventory forms prepared for the Municipalities of the Middle-Lower
São Francisco. The secondary data were provided by IBGE and other institutions.
2.2.2. Economic Profile
The economic profile reflects the differences among the Sub-Basins, with respect to their
regional economic structure. On the other hand, according to the IBGE, this profile's analysis
iii
incorporates the objectives of production processes efficiency and the changes in consumption
structure, both oriented towards sustainable production, on the long run.
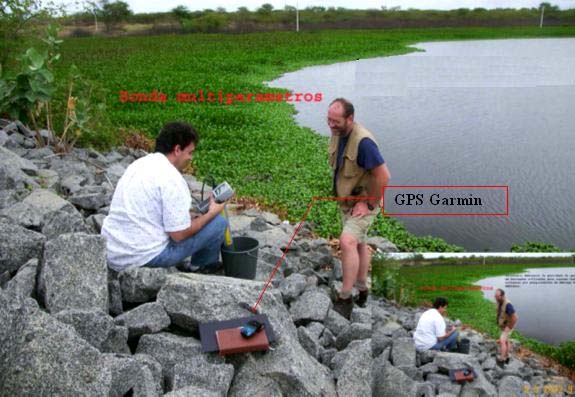
Picture 1. Water quality inventory (irrigation and human consumption).
The different aspects of the environmental sustainability's economic profile were summarized in
10 indicators: Enterprises, public finances, financial institutions, permanent crops, seasonal crops,
Municipal agricultural research, vegetal extraction production, gross internal product, wages and
other remunerations and local Units (Figure 3). These indicators reflect the consumption and
demand of material resources and the use natural resources, by local economic activities.
2.2.3. Social Profile
The Region's social profile presents characteristics of the Sanfranciscan community, exposing its
aspirations, the basic services, the commitment to quality of life and the social justice, covering
themes such as population, equity, health, education, housing and safety. The main indicators
were: Education, derived statistics, political participation, employed personnel, outcomes, health,
life and risks of life (see Figure 3).
iv
The eight included indicators aimed at a presenting a summary of the social situation, of the
income distribution and of the population's life conditions in the 35 Sub-Basins in the 73
respective Municipalities of the Middle-Lower São Francisco.
Figure 3. Relation among the profiles and indicators used in the multivariate analyses for
creation of the Environmental Sustainability Index for Water Usage.
2.3. MULTIVARIATE
ANALYSIS
For applying the statistical methods, matrices were built, with columns containing the diverse
variables corresponding to each profile's indicators (Figure 3). The lines were referent to the 35
Sub-Basins and 73 Municipalities. As the variables' units were not compatible, standardization
was required, which produced new data matrices (zi), according to Bouroche and Saporta (1980)
and Andrade (1989), obtained from the following equation:
v
-
x
- x
z
i
x
=
, where
i
si
-
x
x
i = value of variable "i";
i = mean value of the variable "i" and si = variable's standard
deviation.
2.3.1. Factorial Analysis
Factorial analysis is a multivariate analysis statistic method whose basic objective is to build a set
of variables "Fi", from the linear transformation of the initial variables Xi, called "factors" or
independent "main components" (orthogonal), according to the following mathematical model
(Andrade, 1989):
X
= a F + a F +...+ a F + e
i
i1 1
i2
2
ik
k
i
Each one of the "k" variables is linearly described in terms of the "k" non-correlated components
(Fi). The "aik" are the factorial loads composing the linear combination. The Fi are calculated in a
way that the first Factor (F1) explains the greatest parcel of the total variation in the variables
(Xi); the second Factor (F2) explains the second greatest parcel, and so on.
The factorial loads express the correlation coefficients among the variables and their respective
factors. The final communality, obtained from the summation of the squares of the factorial loads
(aik), represents the proportion of variation of each variable involved in the defined Factors.
For each Factor, the most representative variables are those with the highest factorial loads (they
must always be greater than 0.30). Factorial loads with a negative sign represent the variable's
negative influence (Bouroche e Saporta, 1980; Andrade, 1989).
2.3.2. Cluster Analysis
The Cluster Analysis involves interactive techniques and algorithms, whose objective is to
classify "objects" into groups, according to their degree of similarity. In this study, "objects" are
the indicators selected for each of the studied profiles.
Usually, to assess the degree of similarity among "objects", units of distance are used. The
Euclidian distance [d(a,b)] is the most used in cluster studies, being Xa and Xb the variables. The
distance might be expressed by:
1/ 2
2
p (X
- X
)
i(a)
i(b)
d
=
a b
( , )
j 1
=
p
In these analyses, the Statistic Analysis System (SAS package) was used. But, instead of using
the method of the Main Component Analysis, the Factorial method (Rotation Varimax Method)
was adopted, as these emphasize more which variables are more associated to a given Factor.
vi
In the Cluster Analysis, the Ward Method, which maximizes the inertia among the diverse groups
and considers, initially, each observation as a class, was used. To decide which pair of classes
will form a greater class, the greater inertia among the classes is looked for. The grouping will be
considered as optimal when the maximum distance or heterogeneity among classes is found.
2.4. FACTORS AFFECTING WATER QUALITY AND INDICATORS
The indicators described in this document reflect the social, economic and ecologic situations and
particularities of each Sub-Basin in the Middle-Lower São Francisco. The characterization of the
Sub-Basins looked for the direct relations among indicators and anthropic factors, as presented in
Figure 4. The figure shows the interaction of anthropic and natural components of water quality.
Figure 4. Factors affecting water quality and their indicators.
3. INFORMATION
PROCESSING
SYSTEM
The primary and secondary data bases, regarding each of the evaluated profiles, had distinct
origins. Processing of the social and economic profile was made on secondary data, provided by
IBGE. The primary data, generated by the Activity itself, were essential for the creation of the
ecologic indicators, as well as for adjustments in the profile's analyses. The inventory composing
thesebases were:
vii
Ṗ Environmental quality and water sources inventory, according to the ISO 14,001 norm.
Ṗ Pollution sources inventory.
Ṗ Social and environmental inventory.
Ṗ Tubular wells and users inventory.
Ṗ Surface water sources and user inventory.
Ṗ Phyto-ecologic inventory.
Ṗ Monitoring of physical, chemical and microbiological quality of surface and groundwaters,
with multi-parameter soundings and kits for quickly determining the presence of total and
fecal coliforms, in the field.
The databases related to each dimension were homogenized for a proper crossing and integration
with the used cartographic plans. A technique for satellite image geoprocessing was used, for the
entire Region (125,000 km2), in the search for indices of regional extent and for validation and
extrapolation of the results to other Sub-Basins.
For processing the Water Usage Sustainability Index, a unique database was created, by
integrating the three previously mentioned bases. Even though information of Municipal extent
was used, it was possible to extrapolate the results to a regional level. The digitally formatted
information were integrated, processed and analyzed, taking the Municipality as the study unit, as
this is the smallest geographical unit with official information available, by IBGE.
Based on the assumption that water quality is function of the factors affecting its properties
(Figure 4), the multivariate analysis was used to process all indicators, in order to define the
analytical structure for each of them, as well as the indices associated to their spatial variability.
For the GIS processing, different softwares were used, such as the ArcView3.2 and ArcMap 8.2,
for spatialization, editing and graphical output of the results. The IdrisiWin 2.0 was used for
digital processing of the satellite images, as well as of vector and raster bases. The processing of
the distinct data sources and their posterior integration in an environment of Geographic
Information System (GIS) is illustrated in Figure 5.
4.
BUILDING THE WATER USAGE ENVIRONMENTAL SUSTAINABILITY INDEX
The classification of the sub-basins by discriminatory analysis was fundamental for plotting the
thematic maps of the social, economic and ecologic profiles' indicators, besides constructing the
Environmental Sustainability Index (ISA_WATER). The latter integrates the three profiles. This
approach allowed the survey and crossing of information which had not yet been jointly
analyzed, thus providing the water resources managers with a better understanding of the
problems, permitting recommendation of proper solutions.
viii
Figure 5. Methodological scheme of information processing.
4.1. ECOLOGIC PROFILE
Prior to the construction of the ecologic profile several indices were determined, based on field
data. These indices are presented ahead.
4.1.1. Vegetative cover index (ICV_SAT)
The vegetative cover index is derived from the vegetation index (IV), a parameter used for
estimating the green biomass density in the Earth's surface, through digital processing of satellite
images. It is a useful index for assessing the basin's capacity to delay surface runoff, to retain
sediments and to minimize impacts of laminar erosion. It is also important for the survey of
remaining forests and other vegetative formations in the Sub-Basin. The Middle-Lower São
Francisco presents really low IV values, a characteristic of semi-arid zones (Picture 2).
The original mean IV values in the Sub-Basins were ordered between zero and one and,
posteriorly, subjected to statistical analyses, for generating the Vegetative cover index
(ICV_SAT). Afterwards, they were grouped into four classes of values: Elevated (blue color),
high (green), regular (yellow) and low (red).
ix
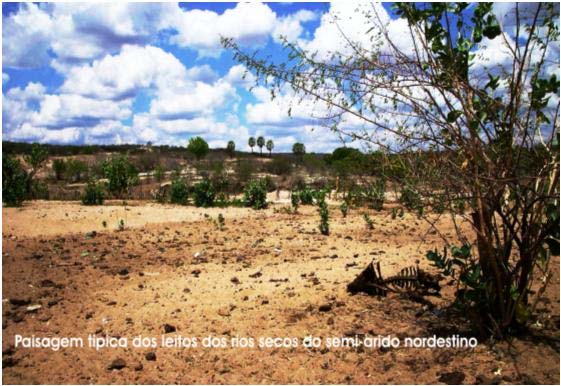
Picture 2. Typical landscape of dry riverbeds in the Northeastern Semi-Arid.
Figure 6 shows a great variation in vegetative cover, in the region. The highest values of
ICV_SAT occur in two distinct sectors: In the extreme Southeast and in the extreme
Southwestern part of the Middle-Lower São Francisco. Probably, they share transition zones with
other biomes or are influenced by more humid air, coming from South and Southeast.
Figure 6. Vegetative cover index (ICV-SAT) in the Middle-Lower São Francisco.
x
In the extreme Southeastern portion, there is a compact group of sub-basins with elevated
ICV_SAT (blue color). The group of sub-basins with high ICV_SAT (green) is more fragmented
than the previous class and are located at the boundaries of the Middle-Lower, showing some
dependence on the relief.
The areas with regular indices (yellow areas), present a tendency for aggregation, concentrating
predominantly in the central part of the Middle-Lower. In the other extreme in the evaluation
scale, there is only one Sub-Basin with a low ICV_SAT.
4.1.2. Potential Soil Degradation Index (IDS_SAT)
The regionalization of the Sub-Basins, for zoning purposes, is usually made based on groups of
spatial variables, indicators of susceptibility to impacts on the physical environment, particularly
the water resources.
For composing the IDS_SAT, a set of variables affecting the potentiality of the erosive processes
was used. The Relief Index reflects the capacity of the Sub-Basin to remove soils from the slopes.
However, it does not consider the network's efficiency to transport the scoured particles.
Analysis of erodibility of a basin must include elements that allow an association between the
potential energy of the slopes and drainage density.
A new index was derived from the Erodibility Potential Index (IEP), relating the Relief Index
(IRL) to the River Runoff Index (IEF):
IEP
=
100*IEF*IRL
This led to the Potential Soil Degradation Index (IDS_SAT), whose distribution is shown in
Figure 7. The blue and green colors predominate in the map, representing the Sub-Basins low and
regular degradation potentials, respectively. The Sub-Basins with regular and low values are far
less representative The Relief Index shows the areas with susceptibility to start fast runoff
processes in their slopes.
Complementing the information in Figure 7, hypsometric maps were elaborated for the Sub-
Basins with high, medium and low Relief Indices and Erodibility Indices. These maps were
obtained from interpolation of contour lines in 1:100,000 cartographic charts. Later, these maps
were converted into altitude digital models and represented according to altimetric categories.
4.1.3. Urban Density Index (IDU_SAT)
The Middle-Lower Region differs, demographically, from other areas in the San Francisco Basin.
The urban occurrence is not a critical factor, as the rural profile predominates in the area. The
Urbanization Index (IUB) is defined as the ratio between urbanized area (Aub) and the Sub-
Basin's surface (Ab), expressed as a percentage:
IUB
=
(Aub/Ab).
100
The Urban Density Index (IDU_SAT) is obtained by statistically processing of the IUB,
reflecting the predominance of Sub-Basin's with low (in blue) and regular (green) urban density
values, as shown in Figure 8
xi
Figure 7. Potential Soil Degradation Index (IDS_SAT) in the Middle-Lower São Francisco.
Figure 8. Urban Density Index (IDU_SAT) in the Middle-Lower São Francisco.
xii
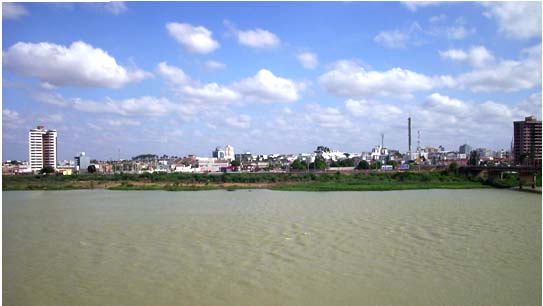
Areas with high values of IDU_SAT (yellow), even considering highly urbanized centers, such as
Petrolina e Juazeiro (Picture 3), are diluted in the great area of the Basin.
Picture 3. View of Petrolina (PE), at the left margin of the São Francisco
The IDU is extremely important in the assessment of vulnerability to environmental impacts, at a
Sub-Basin scale, as it incorporates the potential for generating critical organic and mineral
pollutants. This index might reveal the Sub-Basin's liability to contribute to changes in the floods
regime, with impact on the consumption of water.
Giving climatic restrictions, either due to the low input of water in the hydrologic system or to
the quick discharges (aggravated by evaporation agents, such as solar radiation, winds, low soil
infiltration capacity), the low values of IDU_SAT in Sub-Basin might lead to impacts of great
magnitude. This is due to the fragility of the Sub-Basins located in transition zones, between
tropical areas and the Brazilian Semi-Arid.
4.1.4. Potential Environmental Degradation Index (IDA_SAT)
Integration of the previous indices (ICV_SAT, IDS_SAT e IDU_SAT) estimated for the 35 Sub-
Basins, the Potential Environmental Degradation Index (IDA_SAT) is determined. It is useful for
diagnosing conditions which might contribute to changes in quality of the surface waters in the
Middle-Lower São Francisco. Location of classified areas is shown in Figure 9.
xiii


ICV_SAT IDS_SAT
IDU_SAT
Figure 9. Potential Environmental Degradation Index, in the Middle-Lower São Francisco.
After statistical processing, the Sub-Basins were classified into four categories of IDA_SAT:
Low, regular, high and elevated. Represented by the colors blue, gree, yellow and red,
respectively. These categories should be used as environmental management and monitoring
units, in a global context of the Middle-Lower São Francisco.
ZONE I LOW RISK: Actions in the long run.
This unit represents the greatest part of the area, covering 88,000 km2 (71% of the Middle-Lower
Region), giving the map a blueish predominance. It includes 19 Sub-Basins, located mainly in the
Northwestern and Southeastern portions. For this zone, preventive measures on the long run are
recommended, viewing the reconstitution and preservation of the vegetative cover, normalization
of the rural occupancy of the steeper slopes and water quality monitoring programs.
It is a suitable zone for implementation of preservation units (Environmental Protection Areas),
associated to environmental education programs.
xiv
ZONE II REGULAR RISK: Medium to long range measures.
With lesser geographical expression, spread over 9, 230 km2 (7% of the territory), this unit covers
eight Sub-Basins (green areas in the map). The same recommendations for the previous Zone
apply here. However, it is necessary greater control in the environmental management, given the
relative vulnerability of the area.
ZONE III HIGH RISK: Medium range measures.
This unit, the second in geographical importance, occupying 25, 016 km2 (20% of the region), is
shown in yellow, in the map. The seven Sub-Basins in this category are divided into three distinct
sub-zones, represented by the compact stains. The largest of them includes the Sub-Basins of the
Riacho Pontão (35) and the Lower Salitre (30), in the Southwestern sector.
In the area containing the other two sub-zones, the concentration of small towns might present a
greater degradation potential and conflicts related to the use of existing natural resources. It is
recommendable, implementing on these areas, on the medium range, mitigating measures for the
impacts which might represent risks to water quality. Those measures might be domestic
effluents treatment plants, reconstitution of riparian vegetation, erosion control actions and
environmental education programs.
Being a transition area, between low and high risk zones, this unit behaves as plug zone,
preventing that the Sub-Basins located in Zone I suffer the impacts of those Sub-Basins in more
critical conditions, as a result of urban expansion or inappropriate occupancy of slopes.
ZONE IV ELEVATED RISK: Actions on the short run.
This unit is formed by only one Sub-Basin, the Lower Sobradinho (29), covering a little over
2,500 km2 (2% of the total territory). However, being in the initial part of the Middle-Lower,
downstream from the greatest urban concentration in the Region, places it in an strategic site for
the downstream communities.
It is recommended for this high environmental degradation risk zone the adoption of urgent
public policies, viewing the correction of urbanization impacts, soil erosion, intensive soil
occupancy and disposal of effluents in water reserves, among other measures.
It is also necessary, urgently, the implementation of water quality monitoring systems and the
adoption of public health and sanitation policies, in addition to environmental education
programs, These measures might be implemented in a global territory management context,
involving the several actors and partners, including international organisms, NGO's and federal
agencies in the areas of health, environment and housing.
4.1.5. Surface Water Usage's Environmental Quality Index (IQU_ASUP)
The water in the environment is in constant movement. The mass transportation processes occur
in the atmosphere, in the Earth and Oceans. During the hydrologic cycle, the water quality is
xv
altered. The main analytical tool for assessing surface and groundwater quality in the Middle-
Lower São Francisco was the multi-parameter probe, with specific sensors (see Chart 1).
Chart 1. Parameter assessment with multi-parameter soundings.
Total
specific
Dissolved
Temperat.
dissolved
Salinity.
Depth pH
conductivity
oxygen
solids
Unit
oC uS/cm g/L g/L mg/L m
Potential
Ion
A
Ammonia Chloride Nitrate Turbidity
Redox
Ammonia
Chlorophyll
Unit mV mg/L mg/L mg/L mg/L NTU ug/L
The map in Figure 10 shows the georeferenced locations of the 2,136 sampling points used in the
inventory of surface and groundwater quality. The surface reserves are divided into two main
groups. The first, located in the channel of the São Francisco River (50 samples indicated by the
green circles) and the second formed by tributaries and reservoirs (103 points marked by the blue
circles). The groundwater samples (1,983 points) are represented by the orange triangles.
Figure 10. Georeferenced sampling points: Pollution sources and Inventory of Water
Sources in the Middle-Lower São Francisco.
xvi
For all these points, the parameters listed in Chart 1 were determined. In places where the
analyses indicated the probable presence of organic or industrial loads, bacteriological (purple
squares) and heavy metals (red pentagons) monitoring was applied. The sources of pollution
registered by the Activity are marked with yellow diamonds.
It is evident in the map that the territory was properly covered by the sampling points, with a
greater concentration of sample collections in places with high consumption /exploitation.
Within the universe of surface water quality data, the Factor 1 (main factor), determined by
rotational analysis, combines the electrical conductivity, total dissolved solids, salinity, chloride
and ion ammonia parameters. The Factor 2 combines the ammonia, pH, temperature and
dissolved oxygen. At last, the Factor 3 combines turbidity, "A" chlorophyll and nitrate.
Figure 11 presents the contents of dissolved salts in the sampled surface waters. These contents
are higher away from the River's channel, reflecting a characteristic of water bodies in semi-arid
regions. The values were more accentuated near the drainage areas of irrigated perimeters along
the San Francisco River.
Figure 11. Surface water quality (Total Dissolved Solids TDS) in the Middle-Lower region.
xvii
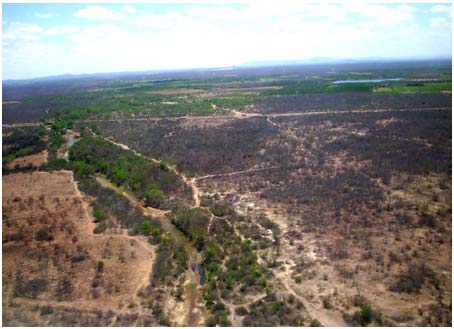
Figure 12 shows with greater details the Riacho Vitória Micro-Basin, which drains one of the
largest irrigation perimeters around Petrolina. This area has irrigation canals conveying water to
the production parcels (Picture 4).In these canals, salt concentration was approximately the same
found near the intake site at Sobradinho Reservoir (0.04 g/l de TDS). The areas are under direct
influence of the properties and where water management is not in harmony with the production
system, presenting high salinity (exceeding the 5.0 g/l, in some places).
#
S
#
#
S
S
#
#
S
#
S
#
S
#
S #
#
S
S
#
S
#
S#
#
S
#
S
S
#
#
#
S
S
#
#
S
S
#
S
#
S
#
S
#
S
#
S#
#
S
S
#
#
S
S
#
S
#
S
#
S
#
S
#
S
#
S
#
S#S # #
S S
#
S
#
S
#
S
#
S
#
S
S
Figure 12. Irrigated perimeter in the Riacho Vitória Micro-Basin (Petrolina-PE).
Picture 4. Riacho Vitória, with the irrigated area and the São Francisco in the background
Use of this water, under inadequate management, leads to a progressive salinization of the soils,
especially in view of drainage problems in the rainy season. At that time, these waters are carried
to the São Francisco, affecting the quality of the water for domestic consumption and for the
existing ichthyofauna and flora.
xviii
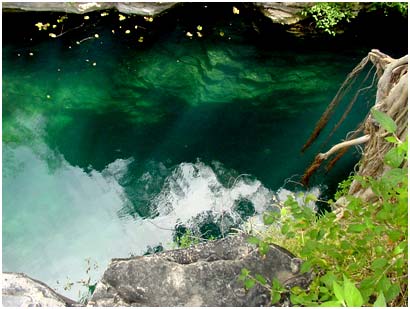
Picture 5. Water springs in the Salitre River Sub-Basin (Ourolândia-BA).
The Salitre River drains a 13,468Km2 area, in the Southwestern part of the Middle-Lower São
Francisco. There is, in the basin, a predominance of rocks of the Bambui Group and of the
Diamantina Plateau, followed by calcareous rocks and spots with Jacobina, Cabrobó and Salitre
rocks, in the extreme North. Large caverns and sink points, where the rivers disappear, re-
appearing further downstream, are common in the region.
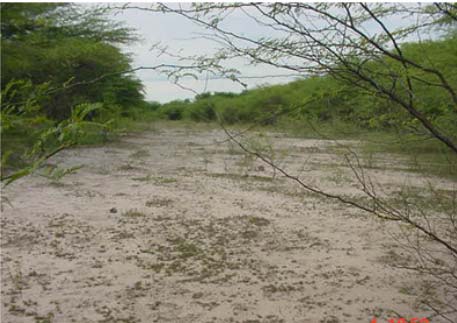
Picture 6. Salitre River's dry bedstream.
Picture 7. Regulated reach of the Salitre.
The region presents many conflicts related to water rights. Where the river re-appears, the water
is dammed, for the benefit of the landowner alone. Downstream communities have to rely on
ponded waters, provided the rains. In other places, check structures are used to raise the water
level to allow pumping for irrigated areas. It is a common situation at the Junco and Campo dos
Cavalos areas, in the transition zone, from the Salitre Sub-Basin to the Riacho Poção.
xix
The main sources of pressure in the Sub-Basin are agriculture and mining. Sanitation problems
are more common in the Districts, as the seats are usually off the basin. This is what happens at
the Lower Salitre, where the water is eventually pumped from the São Francisco River. In the
Upper Salitre, there is a greater diversity of water sources, with variation in their salt contents.
Risks of soil salinization were estimated by the amount of dissolved salts in the water or by the
electrical conductivity of irrigation water. To prevent salinization risks, these contents should not
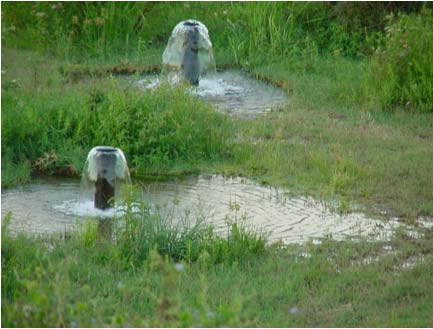
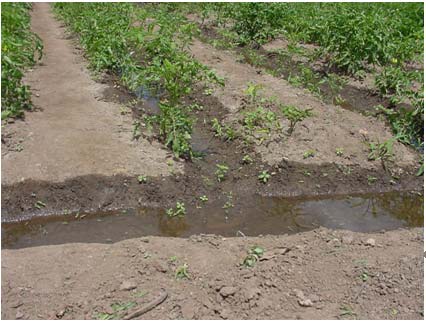
exceed 0.48 g/l of dissolved salts (equivalent to 0.70 d S m-1). The results proved that dissolved
salts contents, in the rainy season, varied from 0.23g/l, in a gushing well (Picture 8), to 1.87g/l, in
a lake upstream from an irrigated area. The irrigation water, at the parcels' entrance, presented a
salt concentration of 1.06g/l, dropping to 1.03g/l, at the parcels' end. As the water goes from one
parcel to the next, there are high soil salinization risks (Picture 9).
The Northern part of the Sub-Basin is a gypsum production region, where the great atmospheric
dissipation of gypsum powder contributes to a greater content of salts in the surface waters. In the
Southeastern part, there is a tendency for improvement in this condition, with only a few places
exceeding the 0.175g/l.
Picture 8. Gushing well (Cattinga do Moura).
Picture 9. Irrigated area in Caatinga do Moura.
There are significant variations in salt concentration also in the San Francisco River channel. In
1,365 analyses, from the Western part to the Southeastern extreme, the average value was 0.042
g/l. The minima values wee distributed within the River channel, with the most significative ones
found in the margins.
In the Western end, concentrations of 0.70 g/l were found. In the central part, downstream from
Juazeiro/Petrolina, values were 0.20 and 0.12 g/l, stabilizing after Lagoa Grande. To the East,
downstream from Abaré, there was a new hike in these values, reaching 0.105 g/l. From the
Itaparica Reservoir up to Paulo Afonso, in the Southeastern extreme, these values remained in a
level above the average.
xx
It was noticed that for some points the greater slat concentration occur simultaneously with lower
contents of Dissolved Oxygen, indicating the incoming of organic matter, discharged by
Petrolina, Juazeiro and Abaré.
Evaluations of total and fecal coliforms were carried out in 125 points, especially in the central
part of the Sub-Basin, in Petrolina and Juazeiro. Of those samples, 33.6% indicated the presence
of total coliforms and 20.8% of fecal coliforms. The difficulty in accessing remote areas impeded
a greater number of analyses, given the need to deliver immediately the samples to the laboratory,
in Recife.
Recently, an analysis technique using lyophilized tape was developed, allowing a quantitative
evaluation, without need of a specialized laboratory. This permits the evaluation of the entire
Region, which might alter the final results of qualitative distribution of the Sub-Basins (vide
Figure 13).
In the River channel, pH values were between 6.95 and 8.90, with a 7.95 average, and no
significative variations. Constant variations in pH indicate a disequilibrium in ionic charges
which might impact the proposed use for the water. In agriculture, where the water is stored in
tanks for dilution of agro-chemicals, specially organophosphorate pesticides, pH values greater
than 8.0 promote the hydrolysis of the molecules, with loss of application efficiency and
unnecessary costs for the farmer.
Figure 13. Surface water quality (pH) in the Middle-Lower do São Francisco.
xxi
For pisciculture, high pH and temperature values contribute to the transformation of the ion
ammonia (NH+4) to total ammonia, which in low concentrations is lethal to fish. This fact
explains the occurrence of fish spawn mortality, in fish nurseries in the region.
In the Middle-Lower region, after the Sobradinho Reservoir, distinct pH values were observed in
the river's right and left margins. At the left margin (Pernambuco's side), the values were always
above 8.5. In the right margin (Bahia's side), values varied between 7.70 and 8.0. This trend was
observed until upstream from the Bebedouro Irrigation Project, in Petrolina.
Variations in pH were also detected in water bodies away from the river channel. Being isolated
points, subject to droughts, these variations may reflect the geological characteristics of the
region. In other cases, specially in newly constructed dams, where there still exists an intense
production of green matter, the values were greater than 9.0. In some points, in the Upper Salitre,
values were bellow 5.0, with the waters presenting a characteristic color (Picture 10), due to the
presence of acids, resulting from the decomposition of organic matter.
Picture 10. Characteristic color of the water in the Upper Salitre
Analysis of the surface waters, according to a spatial distribution criterion, showed significative
differences, with respect to the grouped factors (see Figure 14). In the figure, the blue, green,
yellow and red colors stand for the elevated, high, regular and low water quality. Of the 73
Municipalities, present good quality water, 28.77% are marked green and 15% are in more
critical areas. Petrolina, Araripina and Macurure are in the red zone.
The figure shows the sites where the analyses were made. In the irrigation drained areas, red is
the predominant color, indicating that these areas require costly treatment to become proper for
human consumption. It would be necessary disinfection and filtration, in addition to salt removal.
xxii
Figure 14. Surface Water Usage's Environmental Quality Index (IQU-SUP)
A lower salt concentration is verified in the yellow points. However, other factors contribute to
the high cost of treatment, specially in remote areas, with needy population. In the green points,
treatment may be simplified, being boiling and chlorinating the most recommended, reinforced
by filtration.
4.1.5. Groundwater Usage's Environmental Quality Index (IQU_ASUB)
Groundwater reserves are formed by percolated waters from atmospheric origin. Its composition
depends on natural factors (geological, topographical, meteorological, hydrological, biological
and drainage network). It varies, during the year, in both discharge and water level.
In the Semi-Arid regions, most of the water stored in aquifers is brackish (between 0.5 and 30
grams of dissolved salts, per liter). Water quality distribution in the Middle-Lower São Francisco
is shown in Figure 15.
Assessment of groundwater quality was done with multi-parameter probes. The multivariate
analysis indicated salinity and total dissolved solids as the most important variables in
groundwater characterization. The Cluster Analysis classified the groundwaters according to four
conditions: High quality (blue), representative of 24.65% of the Municipalities in the Region.
Salinity in these waters varied from 0.14 to 0.42 g/l, which classifies them as fresh waters, by
CONAMA's resolution. In a broad sense, "fresh-water" is associated with continental waters,
such as rivers and lakes, with less than ).5 g/l of dissolved salts.
xxiii
Figure 15. Groundwater Usage's Environmental Quality Index ( IQU-SUB).
All other areas in the Middle-Lower were classified as brackish, with low salt concentration. In
the figure, the green color indicates a high quality, the yellow a regular quality and the red a low
quality, with concentration above 2.0 g/l. The distribution of areas according to their dissolved
salt contents produces a chart with useful information, regarding improvement of water quality
for domestic purposes.
Figure 15 also presents the distribution of wells, classified according to their dissolved salt
contents and ranked by the possibility of installing desalinizers. These equipment improve water
quality, considering a 50% efficiency in salt removal.
4.1.6.Irrigated Fruitculture's Agrotoxic Load Index (ICA_FRUT)
Contamination may occur as a result of diffuse and point sources. There is not a clear distinction
between them as a diffuse source in a regional scale might be interpreted as a great number of
point sources.
A clear example is the use of agrotoxics in irrigated fruitculture. It may be considered as a diffuse
source, when the entire Basin is under analysis. But it will be a point source, when evaluating an
irrigated parcel. The difference is that the point source might be removed, treated or controlled.
As diffuse sources are a combination of several point sources, its control requires treating each
point source, individually, or adoption of integrated measures to reduce its impacts.
xxiv
The great point sources of water pollution are effluents disposals (domestic, industrial and from
activities such as livestock raising). Agricultural activities, with agro-chemical applications, are
considered as diffuse sources. The atmospheric deposition of pollutants is also cause of diffuse
pollution of the water.
Figure 16 presents the spatial distribution of the Agrotoxic Load Index (ICA_FRUT), resulting
from applications in irrigated fruitculture. The index was composed in accordance with the
degree of toxicity of the used products and applied dose, for the main crops in the region.
Figure 16. Irrigated Fruitculture Agrotoxic Load Index (ICA_FRUT).
A database was formed with information collected in 403 properties with irrigated fruitculture,
for the potentially contaminant products, considering frequency and amount of application. Thus
a partial load of agrotoxics was determined for the main crops (grape, mango, coconut, banana
and guava). Additionally, the toxicity of the products were taken into account, with the formula:
CPD = QDA * FAD * IT , where
CPD = partial load of agrotoxics (g ha-1);
QDA = amount of active ingredient of the applied agrotoxic (g ha-1);
FA = frequency of application; and
xxv
IT = product's s toxicity index (non-dimensional).
The Total Agrotoxic Load (CTD) was determined for each Sub-Basin, considering the
summation of the partial loads in the predominating cultures and the cultivated area for each of
them. The corresponding areas were obtained at the CODEVASF's inventory of irrigated
fruitculture. The Irrigated Fruit culture's Agrotoxic Load Index (ICA_FRUT) was estimated as
the contribution of each Sub-Basin to the Total Agrotoxic Load in the Middle-Lower São
Francisco (see Figure 16).
The green pentagons represent the rural properties that were georeferenced and inventoried by
CODEVASF. It is noticeable the great number of irrigated properties along the River and its
tributaries.
The Sub-Basins with the greatest agrotoxic loads are those of Riacho Poção (35), Graças (18) and
Lower Sobradinho (29), which form a compact reddish stain around Petrolina and Juazeiro. The
fact might impact negatively the water quality, aggravating water usage conflicts, in a near future.
In the other extreme of the scale, there are the areas without irrigated properties.
4.1.7. Water Deficit Index (IDE_BHID)
The climate in the Basin varies from humid, moderately tropical, at the Southern highlands, to
semi-arid, in the Middle and Middle-Lower Regions, and to humid semi-arid in the Lower São
Francisco.
In the Middle-Lower, irrigated fruitculture predominates, side by side with a high-risk, unstable
and low productivity rainfed agriculture. The Region presents a low and irregular pluviosity
(around 750 mm/year), concentrated in a 3 to 5-month period. There are dry periods, with the
precipitation dropping to 400 mm/year.
Temperatures are elevated, with high evapotranspiration rates (around 2,900 mm/year), rendering
a negative water balance, in part of the year. Mean relative humidity is around 60%. There is a
severe insolation (2,800 hours/year), with maximum luminosity in October.
The predominantly shallow and little permeable soils are originated from crystalline rocks,
subject to erosion and with reasonable natural fertility. The caatinga is the predominant
vegetation, covering about 100,000 km2.
The analysis of the hydrologic balance in the Region shows that the most significative variables,
in a crescent order, were potential evapotranspiration (May and September), precipitation (July
and November), mean air temperature (March) and actual evapotranspiration (April). The
maximum water deficit occurs in December.
Figure 17 presents the Water Deficit (IDE_BHID) for the 35 Sub-Basins, obtained through the
cluster analysis. In the map, the blue color was used for places with low IDE_BHID, green for
those with regular values, yellow for the high and red for elevated indices. It is noticeable the
predominance of the red color.
xxvi
Figure 17. Water Deficit Index (IDE_BHID) in the Middle-Lower São Francisco.
4.1.8. Water Sources Environmental Quality Index (IQA_Source)
The State environmental legislation in Pernambuco and Bahia was analyzed, viewing a
comparison of environmental impacts in their diverse Municipalities and a verification whether
they are being enforced.
The analysis showed that, regarding public services (sanitary sewers and final disposal of solid
residues), none of them are fully complying with the current environmental laws. The same
occurs with respect to industrial activities. Therefore, it can be said that nor public nor private
institutions in the Basin are observing the environmental legislation norms (ISO 14001).
The distribution of the Water Sources Environmental Quality Index (IQA_Source) throughout the
Basin's Municipalities is presented in Figure 18.
Ṗ Analysis of potentially polluting loads
Based on information provided by official institutions, the roll of existing establishments in the
Basin was analyzed and inputted into a environmental diagnosis matrix, classified according to
parameters adopted in the CETESB's methodology.
xxvii
Figure 18. Water Sources Environmental Quality Index, according to the ISO 14,001.
The data distribution showed that 89.2% of the Municipalities present polluting loads in the 3.7 to
20 interval, with 40% of them presenting value around 10.2. Its is noticed that only two
Municipalities presented elevated indices.
Ṗ Survey of environmental impacts of rural establishments
The environmental impacts caused by the rural establishments in the basin were surveyed in the
field (1,161 water sources) and in the Irrigated Fruitculture Inventory (CODEVASF). For each
source, the adequacy to the ISO 14,001 norm was tested. Being an innovative procedure, an
integrated analysis of the water sources and potential pollution sources was carried out, for all the
studied Municipalities (Picture 11).
It was verified that 87.8% of the registered sources are in the rural area, which allowed a profile
analysis of the properties (31.96% of the sources) and of rural residences (55.81%). The
multivariate analysis of the data permitted developing the region's ecological profile (Figure 19).
The classification of the water sources assigned a zero value to those sources with low
susceptibility to environmental impacts and a value one to inadequate sources. Most of the
analyzed sources were classified with values between 0.57 and 0.76.
xxviii
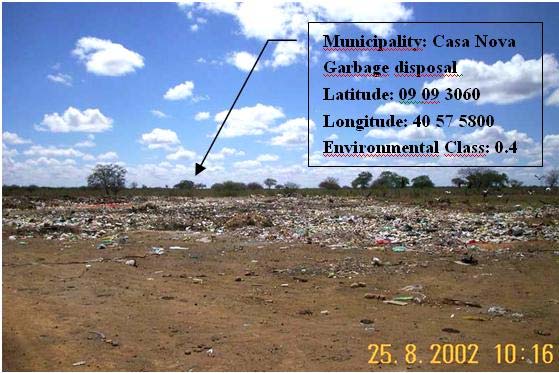
Picture 11. Environmental evaluation of the garbage disposal, in Casa Nova (BA).
Total
Count of Pontuação
250
200
150
100
50
0
0,00 0,05 0,14 0,24 0,29 0,33 0,38 0,43 0,48 0,52 0,57 0,62 0,67 0,71 0,76 0,81 0,86 0,90 0,95 1,00
Pontuação
Figure 19. Distribution of water sources, according to the ISSO 14, 001.
The main results of the environmental evaluation of the water and pollution sources, according to
recommendations of the ISSO 14,001 norm, are as follows:
Water Sources -
Ṗ 87.8% of the registered sources are in rural areas;
Ṗ In those rural establishments, 51.1% of the garbage is disposed directly in the
environment, 33.4% being burned;
xxix
Ṗ Sanitary and hydraulic effluents (66.8% and 77%, respectively) are disposed directly in
open environments;
Ṗ 53.8% of rural establishments and residences do not use treated water;
Ṗ 82.1% of the establishments use some kind of chemical products;
Ṗ 69.7% of the sicknesses are associated to fever, cold and dengue, followed by 19.1%
which are associated to vomiting and diarrhea;
Ṗ In 56.2% of the properties, there are burnings or emission of gases;
Ṗ 89.2% of the surveyed establishments are not served by garbage pick up service.
Potential pollution sources -
Ṗ None of the industrial establishments has environmental operating permits (Picture 12);
Picture 12. Fábrica de gesso no Municipality de Araripina (PE).
Ṗ None of the visited enterprises has any type of environmental certification or has
required one;
Ṗ 48.3% of the disposed effluents are composed by water and organic matter , followed by
24.1% composed by water and chemical products (phosphates, nitrates, carbonates,
etc.);
Ṗ The estimated daily volume of effluents varies from 1.0 to 50.0 m3, corresponding to
81.4% of the total;
xxx
Ṗ These effluents are disposed directly in open environments: 42.1% in open conduits and
14.5% in closed conduits;
Ṗ 97.2% of the visited enterprises do not treat their effluents, before disposing them in the
environment;
Ṗ 70.3% of the visited institutions do not filter the gases emitted to the atmosphere;
Ṗ 51.7% of the catalogued potential pollution sources disposed their garbage directly in
the environment and 46.2% of them uses the public pick up service;
Ṗ Regarding the hazardous solid residues, 51.7% of the enterprises dispose of this material
directly into the environment; 42.8% use the public services, which are not appropriate
for toxic residues. Both are due to the public garbage deposit.
4.2. ECOLOGICAL PROFILE INDEX (IP_ECOL)
The ecological profile of the of the Middle-Lower São Francisco was determined based on 16
indicators, characterized by 100 variables. Through factorial analysis, these variables were
grouped into four great groups, or Factors, as follows;
Factor 1 - Residues disposal, classifying 21 Municipalities, with 4.3% of the total factorial
load.
Factor 2 - Land ownership concentration, classifying 5 Municipalities, with 22.0% of the
total factorial load.
Factor 3 - Water deficit, classifying 42 Municipalities, with 21.7% of the total factorial
load.
Factor 4 - Mining activities, with 5 Municipalities classified, with 15.0% of the total
factorial load.
The cumulative factorial load of the four factors amounted to 45.83.
These information permitted the elaboration of the Ecological Profile Index (IP_ECOL), which
reflects the use of natural resources and the environmental degradation, both related to anthropic
activities (agriculture, livestock raising, commerce, distribution and public services).
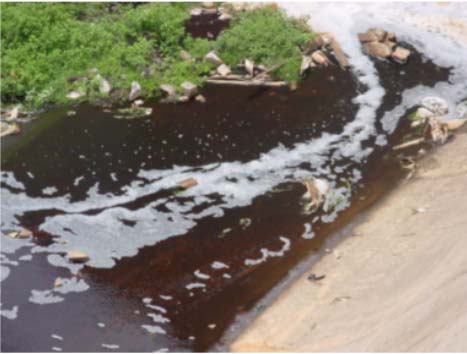
Effluent disposal in the water bodies (Picture 13), by activities of the primary and secondary
production sectors and of the public services, was considered the main obstacle to the sustainable
use of the water in the Middle-Lower São Francisco (Chart 2 e Figure 20).
xxxi
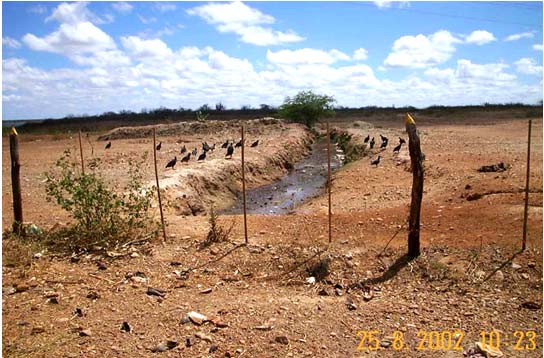
Picture 13. Conveyance of residues from a slaughterhouse in Casa Nova(PE).
The classification of the Municipalities, according to the ecological profile, was based in the
cluster analysis of the main variables considered in their ecological characterization. Chart 2
presents the distinct levels of the Ecological Profile Indices (IP_ECOL), represented by colors:
blue (elevated values), green (high), yellow (regular) and red (low indices).
Chart 2. Ranking of the 73 Municipalities in the Middle-Lower São Francisco, according to
the Ecological Profile Index (IP_ECOL).
Order Municipality UF
Sub-Basin Zone
East North
Cluster
Rate
IP_ECOL
1 Floresta
PE 12
24L 547427.965 9049182.088
1
0.017 0.0002
2 Abaré
BA 16
24L 487433.391 9036032.391
2
0.050 0.0005
3 Afogados da Ingazeira
PE
5
24M
650027.496
9142969.099
2
0.083 0.0008
4 Arcoverde
PE
8
24L 714236.625 9068821.395
2
0.116 0.0012
5
Brejinho
PE 6 24M
689145.529
9187220.828 2
0.150 0.0015
6 Cabrobó
PE
2
24L 465843.029 9058807.295
2
0.183 0.0018
7
Calumbi
PE 5 24M
593647.197
9122047.34 2
0.216 0.0022
8
Carnaiba
PE 5 24M
632945.666 9137000.5 2
0.250 0.0025
9 Carnaubeira
da
Penha
PE 12
24L 528070.177 9080369.975
2
0.283 0.0028
10
Cedro
PE 3 24M
473617.817
9146426.509 2
0.316 0.0032
11 Chorrochó
BA
16
24L 489365.774 9007349.564
2
0.349 0.0035
xxxii
Order Municipality UF
Sub-Basin Zone
East North
Cluster
Rate
IP_ECOL
12
Flores
PE 5 24M
612987.96
9130112.015 2
0.383 0.0038
13 Gloria
BA
15
24L 581802.372 8967647.77
2
0.416 0.0042
14
Granito
PE 1 24M
432171.454
9146999.225 2
0.449 0.0045
15
Ingazeira
PE 6 24M
669850.01
9151164.975 2
0.482 0.0048
16
Ipubi
PE 1 24M
373240.504 9153972.5 2
0.516 0.0052
17 Itacuruba
PE
13
24L 534792.968 9035251.918
2
0.549 0.0055
18
Itapetim
PE 6 24M
699714.319
9183984.009 2
0.582 0.0058
19 Jatobá
PE
15
24L 580281.786 8984789.025
2
0.616 0.0062
20 Lagoa
Grande
PE
19
24L 360143.742 9005204.178
2
0.649 0.0065
21 Macurure
BA
16
24L 493643.744 8986590.101
2
0.682 0.0068
22 Manari
PE
8
24L 650755.509 9008820.156
2
0.715 0.0072
23 Mata
Grande
BA
8
24L 639273.508 8991874.268
2
0.749 0.0075
24 Mirandiba
PE
4
24L 529767.308 9102356.883
2
0.782 0.0078
25
Moreilandia
PE 1 24M
439174.387
9156436.713 2
0.815 0.0082
26 Orocó
PE
2
24L 448972.427 9054460.236
2
0.848 0.0085
27 Pariconha
BA
8
24L 609284.48 8977009.707
2
0.882 0.0088
28 Petrolandia
PE
15
24L 585762.618 9007321.15
2
0.915 0.0091
29
Quixaba
PE 5 24M
626967.392
9146415.924 2
0.948 0.0095
30 Rodelas
BA
16
24L 525618.431 9022175.988
2
0.982 0.0098
31 Santa Cruz da Baixa Verde
PE
5
24M
593368.102
9135407.665
2
1.015 0.0101
32 Santa
Filomena
PE
18
24L 321975.764 9097342.685
2
1.048 0.0105
33
Santa
Terezinha
PE 6 24M
667727.579
9184164.836 2
1.081 0.0108
34 São Jose do Egito
PE
6
24M
690378.058
9172899.613
2
1.115 0.0111
35 Sertania
PE
8
24L 691212.222 9107119.016
2
1.148 0.0115
36 Sobradinho
BA
23
24L 299775.029 8954250.643
2
1.181 0.0118
37
Solidão
PE 5 24M
648670.503
9159622.021 2
1.214 0.0121
38
Tabira
PE 5 24M
661086.874
9160626.188 2
1.248 0.0125
39 Tacaratu
PE
8
24L 593455.796 8993359.94
2
1.281 0.0128
40 Terra
Nova
PE
3
24L 458598.039 9090248.012
2
1.314 0.0131
41
Trindade
PE 1 24M
360161.389
9141772.222 2
1.348 0.0135
42
Triunfo
PE 5 24M
598999.469
9133461.111 2
1.381 0.0138
xxxiii
Order Municipality UF
Sub-Basin Zone
East North
Cluster
Rate
IP_ECOL
43
Tuparetama
PE 6 24M
686247.265
9159275.23 2
1.414 0.0141
44 Umburanas
BA
33
24L 245524.683 8812565.453
2
1.447 0.0145
45
Verdejante
PE 3 24M
503083.778
9123893.653 2
1.481 0.0148
46 Juazeiro
BA
35
24L 335414.557 8959243.741
3
1.531 0.0153
47
Ouricuri
PE 1 24M
380720.926
9128499.227 3
1.580 0.0158
48 Santa Maria da Boa Vista
PE
18
24L
409170.06
9026260.446
3
1.630 0.0163
49 Sento
Se
BA
23
24L 183376.658 8921299.613
3
1.680 0.0168
50
Serra
Talhada
PE 5 24M
577287.661
9116488.522 3
1.730 0.0173
51 Afrânio
PE
19
24L 279253.518 9058156.845
4
1.797 0.0180
52
Araripina
PE 1 24M
334660.809
9162240.036 4
1.863 0.0186
53 Belém de S. Francisco
PE
16
24L
503718.801
9032318.198
4
1.930 0.0193
54 Betânia
PE
9
24L 606327.722 9085163.479
4
1.996 0.0200
55
Bodocó
PE 1 24M
396191.058
9140053.987 4
2.063 0.0206
56 Casa
Nova
BA
20
24L 283394.363 8986611.581
4
2.129 0.0213
57 Curaca
BA
18
24L 399993.191 9006059.965
4
2.196 0.0220
58 Custodia
PE
8
24L 649477.066 9105741.351
4
2.263 0.0226
59 Dormentes
PE
19
24L 304973.882 9065779.156
4
2.329 0.0233
60
Exu
PE 1 24M
420063.929
9169552.647 4
2.396 0.0240
61 Ibimirim
PE
8
24L 644107.319 9055658.828
4
2.462 0.0246
62
Iguaraci
PE 7 24M
663659.429
9133584.884 4
2.529 0.0253
63 Inaja
PE
8
24L 629275.846 9015775.16
4
2.595 0.0260
64 Ourolandia
BA
33
24L 272329.521 8786479.793
4
2.662 0.0266
65 Parnamirim
PE
1
24L 436241.897 9105607.428
4
2.728 0.0273
66 Petrolina
PE
35
24L 335164.333 8960686.583
4
2.795 0.0279
67 Pilão
Arcado
BA
26
23L 773566.25
8893175.64
4
2.861 0.0286
68 Remanso
BA
23
23L 820346.875 8935013.707
4
2.928 0.0293
69 Salgueiro
PE
3
24L 486831.155 9107462.602
4
2.995 0.0299
70 Santa
Cruz
PE
18
24L 352949.525 9088885.729
4
3.061 0.0306
71 São Jose do Belmonte
PE
4
24M
526448.349
9130979.874
4
3.128 0.0313
72
Serrita
PE 3 24M
467354.766
9123022.291 4
3.194 0.0319
73 Várzea
Nova
BA
33
24L 287964.03 8754684.387
4
3.261 0.0326
xxxiv
Figure 20. Ecological Profile Index for the Municipalities of the Middle-Lower São
Francisco.
An elevated Ecological Profile Index (IP_ECOL), in blue color, was attributed only to Floresta,
that is characterized by an elevated Vegetative Cover Index, low urban concentration and high
Water Quality Index. Forty four Municipalities where classified with a high IP_ECOL (green
color) and 23 with a low index (red).
The ecological reasons for the non-sustainable use of the water in the Middle-Lower São
Francisco were statically defined as:
Ṗ Pollutants load in the water, due to industrial and commercial activities and to the
quality of the public services (sanitary sewers and slaughterhouse's disposals in open
environments).
Ṗ Application of agrotoxics and disposal of their packaging in the rural areas.
Ṗ Land ownership distribution
Ṗ Disequilibrium in the Region's hydrologic balance.
xxxv
Ṗ Mining adverse impacts.
Ṗ Production of chemical residues by agriculture's and domestic uses.
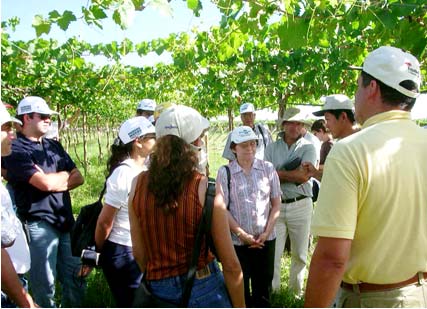
Picture 14. The use of agricultural Best Practices is fundamental for the reduction of
adverse environmental impacts. The Integrated Production System (irrigated
fruitculture), under implementation in the Region deserves mention.
4.3.
ECONOMIC PROFILE INDEX (IP_ECON)
The economic profile of the Middle-Lower São Francisco was created from 229 variables,
grouped in tem indicators. These variables were grouped with the use of factorial analysis,
resulting in four groups, or Factors, as follows:
Factor 1 - Public expenditures with infrastructure (56.1% of the total factorial load). The
variables to identify the Municipalities, in this Factor, are characterized by the
responses to investments in health and sanitation, the capacity to collect
municipal taxes, capacity to obtain loans, well structured agricultural production
system and an efficacious income collection structure.
Factor 2 - Irrigated agriculture (26.8% of the load). The main variables are related to the
cultures, especially Bahia coconut, passion fruit, mango and sugar-cane.
Factor 3 - Other seasonal cultures (9.4% of the load). Again, the Municipalities are
identified by seasonal or temporary crops, represented by beans, corn and
cassava (subsistence agriculture).
xxxvi
Factor 4 - Rainfed agriculture (7.6% of the total factorial load). Variables representing the
seasonal cultures of onion and rice. This last group, even though including areas
with irrigated agriculture, maintains a significative portion occupied by rainfed
agriculture.
The total factorial load ( Final Communality Estimates) is equivalent to 151.16.
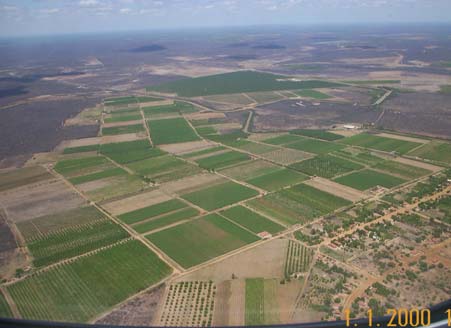
Picture 15. Petrolina/Juazeiro, a
Picture 16. Área de irrigação no Middle-
development Pole in the São Francisco.
Lower São Francisco
Based in these results and in the cluster analysis of the variables which best represent the
economic conditions of the Municipality, the Economic Profile Index (IP_ECON) was composed.
Four qualification attributes were considered: Elevated (blue color), high (green), regular
(yellow) and low (red). As shown in Chart 3 and Figure 21, the indices highlight the significative
economic divergences among the Municipalities.
Chart 3. Ranking of the 73 Municipalities, according to the Economic Profile Index.
Order Municipality UF
Basin Zone
East
North cluster
rate
IP_ECON
1 Petrolina
PE 35 24L 335164.333 8960686.583
1
0.01 0.0001
2 Juazeiro
BA 35 24L 335414.557 8959243.741
2
0.03 0.0003
3 Araripina
PE 1 24M
334660.809 9162240.036
3
0.06 0.0006
4 Arcoverde
PE 8 24L 714236.625 9068821.395
3
0.09 0.0009
5 Casa
Nova
BA 20 24L 283394.363 8986611.581
3
0.12 0.0012
6 Petrolandia
PE 15 24L 585762.618 9007321.15
3
0.15 0.0015
7 Salgueiro
PE 3 24L 486831.155 9107462.602
3
0.18 0.0018
8 Santa Maria da Boa Vista
PE
18
24L
409170.06
9026260.446
3
0.21 0.0021
x xxvii
9 Sao Jose do Egito
PE
6
24M
690378.058
9172899.613
3
0.24 0.0024
10 Serra
Talhada
PE 5 24M
577287.661 9116488.522
3
0.27 0.0027
11 Abare
BA 16 24L 487433.391 9036032.391
4
0.31 0.0031
12 Afogados da Ingazeira
PE
5
24M
650027.496
9142969.099
4
0.35 0.0035
13 Afranio
PE 19 24L 279253.518 9058156.845
4
0.39 0.0039
14 Belem do S. Francisco
PE
16
24L
503718.801
9032318.198
4
0.43 0.0043
15 Betania
PE 9 24L 606327.722 9085163.479
4
0.47 0.0047
16 Bodoco
PE 1 24M
396191.058 9140053.987
4
0.52 0.0052
17 Brejinho
PE 6 24M
689145.529 9187220.828
4
0.56 0.0056
18 Cabrobo
PE 2 24L 465843.029 9058807.295
4
0.60 0.0060
19 Calumbi
PE 5 24M
593647.197
9122047.34
4
0.64 0.0064
20 Carnaiba
PE 5 24M
632945.666
9137000.5
4
0.68 0.0068
21 Carnaubeira
da
Penha
PE 12 24L 528070.177 9080369.975
4
0.72 0.0072
22 Cedro
PE 3 24M
473617.817 9146426.509
4
0.76 0.0076
23 Chorrocho
BA 16 24L 489365.774 9007349.564
4
0.80 0.0080
24 Curaca
BA 18 24L 399993.191 9006059.965
4
0.84 0.0084
25 Custodia
PE 8 24L 649477.066 9105741.351
4
0.88 0.0088
26 Dormentes
PE 19 24L 304973.882 9065779.156
4
0.92 0.0092
27 Exu
PE 1 24M
420063.929 9169552.647
4
0.96 0.0096
28 Flores
PE 5 24M
612987.96
9130112.015
4
1.00 0.0100
29 Floresta
PE 12 24L 547427.965 9049182.088
4
1.04 0.0104
30 Gloria
BA 15 24L 581802.372
8967647.77
4
1.08 0.0108
31 Granito
PE 1 24M
432171.454 9146999.225
4
1.12 0.0112
32 Ibimirim
PE 8 24L 644107.319 9055658.828
4
1.16 0.0116
33 Iguaraci
PE 7 24M
663659.429 9133584.884
4
1.20 0.0120
34 Inaja
PE 8 24L 629275.846
9015775.16
4
1.24 0.0124
35 Ingazeira
PE 6 24M
669850.01
9151164.975
4
1.28 0.0128
36 Ipubi
PE 1 24M
373240.504
9153972.5
4
1.32 0.0132
37 Itacuruba
PE 13 24L 534792.968 9035251.918
4
1.36 0.0136
38 Itapetim
PE 6 24M
699714.319 9183984.009
4
1.40 0.0140
39 Jatoba
PE 15 24L 580281.786 8984789.025
4
1.44 0.0144
40 Lagoa
Grande
PE 19 24L 360143.742 9005204.178
4
1.48 0.0148
xxxviii
41 Macurure
BA 16 24L 493643.744 8986590.101
4
1.53 0.0153
42 Manari
PE 8 24L 650755.509 9008820.156
4
1.57 0.0157
43 Mata
Grande
BA 8 24L 639273.508 8991874.268
4
1.61 0.0161
44 Mirandiba
PE 4 24L 529767.308 9102356.883
4
1.65 0.0165
45 Moreilandia
PE 1 24M
439174.387 9156436.713
4
1.69 0.0169
46 Oroco
PE 2 24L 448972.427 9054460.236
4
1.73 0.0173
47 Ouricuri
PE 1 24M
380720.926 9128499.227
4
1.77 0.0177
48 Ourolandia
BA 33 24L 272329.521 8786479.793
4
1.81 0.0181
49 Pariconha
BA 0 24L 609284.48
8977009.707
4
1.85 0.0185
50 Parnamirim
PE 1 24L 436241.897 9105607.428
4
1.89 0.0189
51 Pilao
Acardo
BA 26 23L 773566.25
8893175.64
4
1.93 0.0193
52 Quixaba
PE 5 24M
626967.392 9146415.924
4
1.97 0.0197
53 Remanso
BA 23 23L 820346.875 8935013.707
4
2.01 0.0201
54 Rodelas
BA 16 24L 525618.431 9022175.988
4
2.05 0.0205
55 Santa
Cruz
PE 18 24L 352949.525 9088885.729
4
2.09 0.0209
56 Santa Cruz da Baixa Verde PE
5
24M
593368.102
9135407.665
4
2.13 0.0213
57 Santa
Filomena
PE 18 24L 321975.764 9097342.685
4
2.17 0.0217
58 Santa
Teresinha
PE 6 24M
667727.579 9184164.836
4
2.21 0.0221
59 Sao Jose do Belmonte
PE
4
24M
526448.349
9130979.874
4
2.25 0.0225
60 Sento
Se
BA 23 24L 183376.658 8921299.613
4
2.29 0.0229
61 Serrita
PE 3 24M
467354.766 9123022.291
4
2.33 0.0233
62 Sertania
PE 8 24L 691212.222 9107119.016
4
2.37 0.0237
63 Sobradinho
BA 23 24L 299775.029 8954250.643
4
2.41 0.0241
xxxix
64 Solidao
PE 5 24M
648670.503 9159622.021
4
2.45 0.0245
65 Tabira
PE 5 24M
661086.874 9160626.188
4
2.49 0.0249
66 Tacaratu
PE 8 24L 593455.796
8993359.94
4
2.54 0.0254
67 Terra
Nova
PE 3 24L 458598.039 9090248.012
4
2.58 0.0258
68 Trindade
PE 1 24M
360161.389 9141772.222
4
2.62 0.0262
69 Triunfo
PE 5 24M
598999.469 9133461.111
4
2.66 0.0266
70 Tuparetama
PE 6 24M
686247.265
9159275.23
4
2.70 0.0270
71 Umburanas
BA 33 24L 245524.683 8812565.453
4
2.74 0.0274
72 Varzea
Nova
BA 33 24L 287964.03
8754684.387
4
2.78 0.0278
73 Verdejante
PE 3 24M
503083.778 9123893.653
4
2.82 0.0282
Figure 21. Economic Profile Index (IP_ECON) in the Middle-Lower São Francisco.
xl
4.4. SOCIAL PROFILE INDEX (IP_SOCI)
Social components are incorporated in the definition of objectives of development and
environmental preservation. This is specially true in Countries with great social problems and
needing alternative management methods for environmentally compromised areas (when there is
a possibility of using those areas for economic activities).
This approach raises several questions, considering the restrictions for exploiting the
environment. The environmental dimension establishes new directives for promoting the
economic development, linking it to the social variable. Based in this concept, and reaffirming
,the importance of the social component in the water usage sustainability, the performance of the
social profile of the Middle-Lower São Francisco becomes part of the context.
This profile was constituted by 8 indicators, characterized by 209 variables, taken from data
provided by the IBGE. With the use of factorial analysis, the variables were classified in four
great Factors, with a final factorial load (Final Communality Estimates) of 151.16488:
Factor 1 - Health attendance, with 35.4% of the total factorial load.
Factor 2 - Educational system, with 33.7% of the total load.
Factor 3 - Basic services, with 23.7%.
Factor 4 - Job offer, with 7.1% of the total factorial load.
This allowed the definition, through cluster analysis, of the Social Profile Index (IP_SOCI) of the
Middle-Lower São Francisco. Again, the colors are used to represent ranges of indices:
Blue=elevated; green=high; yellow=regular and red=low (see Chart 2 and Figure 22).
An elevated IP_SOCI occurred only in Petrolina, and a high value was found only in Juazeiro. It
might be inferred from this analysis that satisfaction of the basic needs of the population,
considering a regional extent, is highly uneven, reflecting the social problems of the Northeastern
Semi-Arid, with respect to education and health.
Chart 4. Ranking of the 73 Municipalities, according to the Social Profile Index.
Order
Municipality UF
Basin Zone
East North
CLUSTER
Rate
IP_SOC
1 Petrolina
PE 35 24L 335164.333 8960686.583
1
0.01 0.0001
2 Juazeiro
BA 35 24L 335414.557 8959243.741
2
0.03 0.0003
3 Araripina
PE 1 24M 334660.809 9162240.036
3
0.06 0.0006
4 Arcoverde
PE 8 24L 714236.625 9068821.395
3
0.09 0.0009
xli
5 Casa
Nova
BA 20 24L 283394.363 8986611.581
3
0.12 0.0012
6 Ouricuri
PE 1 24M 380720.926 9128499.227
3
0.15 0.0015
7 Salgueiro
PE 3 24L 486831.155 9107462.602
3
0.18 0.0018
8 Serra
Talhada
PE 5 24M 577287.661 9116488.522
3
0.21 0.0021
9 Abare
BA 16 24L 487433.391 9036032.391
4
0.25 0.0025
10 Afogados da Ingazeira
PE
5
24M
650027.496
9142969.099
4
0.29 0.0029
11 Afranio
PE 19 24L 279253.518 9058156.845
4
0.33 0.0033
12 Belem de S. Francisco
PE
16
24L
503718.801
9032318.198
4
0.37 0.0037
13 Betania
PE 9 24L 606327.722 9085163.479
4
0.41 0.0041
14 Bodoco
PE 1 24M 396191.058 9140053.987
4
0.45 0.0045
15 Brejinho
PE 6 24M 689145.529 9187220.828
4
0.49 0.0049
16 Cabrobo
PE 2 24L 465843.029 9058807.295
4
0.53 0.0053
17 Calumbi
PE 5 24M 593647.197 9122047.34
4
0.57 0.0057
18 Carnaiba
PE 5 24M 632945.666
9137000.5
4
0.61 0.0061
19 Carnaubeira
da
Penha
PE 12 24L 528070.177 9080369.975
4
0.65 0.0065
20 Cedro
PE 3 24M 473617.817 9146426.509
4
0.69 0.0069
21 Chorrocho
BA 16 24L 489365.774 9007349.564
4
0.73 0.0073
22 Curaca
BA 18 24L 399993.191 9006059.965
4
0.77 0.0077
23 Custodia
PE 8 24L 649477.066 9105741.351
4
0.81 0.0081
24 Dormentes
PE 19 24L 304973.882 9065779.156
4
0.85 0.0085
25 Exu
PE 1 24M 420063.929 9169552.647
4
0.89 0.0089
26 Flores
PE 5 24M 612987.96 9130112.015
4
0.93 0.0093
27 Floresta
PE 12 24L 547427.965 9049182.088
4
0.97 0.0097
28 Gloria
BA 15 24L 581802.372 8967647.77
4
1.01 0.0101
29 Granito
PE 1 24M 432171.454 9146999.225
4
1.05 0.0105
30 Ibimirim
PE 8 24L 644107.319 9055658.828
4
1.09 0.0109
31 Iguaraci
PE 7 24M 663659.429 9133584.884
4
1.13 0.0113
32 Inaja
PE 8 24L 629275.846 9015775.16
4
1.17 0.0117
33 Ingazeira
PE 6 24M 669850.01 9151164.975
4
1.21 0.0121
xlii
34 Ipubi
PE 1 24M 373240.504
9153972.5
4
1.25 0.0125
35 Itacuruba
PE 13 24L 534792.968 9035251.918
4
1.29 0.0129
36 Itapetim
PE 6 24M 699714.319 9183984.009
4
1.33 0.0133
37 Jatoba
PE 15 24L 580281.786 8984789.025
4
1.37 0.0137
38 Lagoa
Grande
PE 19 24L 360143.742 9005204.178
4
1.41 0.0141
39 Macurure
BA 16 24L 493643.744 8986590.101
4
1.45 0.0145
40 Manari
PE 8 24L 650755.509 9008820.156
4
1.49 0.0149
41 Mata
Grande
BA 8 24L 639273.508 8991874.268
4
1.53 0.0153
42 Mirandiba
PE 4 24L 529767.308 9102356.883
4
1.57 0.0157
43 Moreilandia
PE 1 24M 439174.387 9156436.713
4
1.61 0.0161
44 Oroco
PE 2 24L 448972.427 9054460.236
4
1.65 0.0165
45 Ourolandia
BA 33 24L 272329.521 8786479.793
4
1.68 0.0168
46 Pariconha
BA 8 24L 609284.48 8977009.707
4
1.72 0.0172
47 Parnamirim
PE 1 24L 436241.897 9105607.428
4
1.76 0.0176
48 Petrolandia
PE 15 24L 585762.618 9007321.15
4
1.80 0.0180
49 Pilao
Arcado
BA 26 23L 773566.25
8893175.64
4
1.84 0.0184
50 Quixaba
PE 5 24M 626967.392 9146415.924
4
1.88 0.0188
51 Remanso
BA 23 23L 820346.875 8935013.707
4
1.92 0.0192
52 Rodelas
BA 16 24L 525618.431 9022175.988
4
1.96 0.0196
53 Santa
Cruz
PE 18 24L 352949.525 9088885.729
4
2.00 0.0200
54 Santa Cruz da Baixa Verde
PE
5
24M
593368.102
9135407.665
4
2.04 0.0204
55 Santa
Filomena
PE 18 24L 321975.764 9097342.685
4
2.08 0.0208
56 Santa Maria da Boa Vista
PE
18
24L
409170.06
9026260.446
4
2.12 0.0212
57 Santa
Terezinha
PE 6 24M 667727.579 9184164.836
4
2.16 0.0216
58 Sao Jose do Belmonte
PE
4
24M
526448.349
9130979.874
4
2.20 0.0220
59 Sao Jose do Egito
PE
6
24M
690378.058
9172899.613
4
2.24 0.0224
60 Sento
Se
BA 23 24L 183376.658 8921299.613
4
2.28 0.0228
61 Serrita
PE 3 24M 467354.766 9123022.291
4
2.32 0.0232
62 Sertania
PE 8 24L 691212.222 9107119.016
4
2.36 0.0236
xliii
63 Sobradinho
BA 29 24L 299775.029 8954250.643
4
2.40 0.0240
64 Solidao
PE 5 24M 648670.503 9159622.021
4
2.44 0.0244
65 Tabira
PE 5 24M 661086.874 9160626.188
4
2.48 0.0248
66 Tacaratu
PE 8 24L 593455.796 8993359.94
4
2.52 0.0252
67 Terra
Nova
PE 3 24L 458598.039 9090248.012
4
2.56 0.0256
68 Trindade
PE 1 24M 360161.389 9141772.222
4
2.60 0.0260
69 Triunfo
PE 5 24M 598999.469 9133461.111
4
2.64 0.0264
70 Tuparetama
PE 6 24M 686247.265 9159275.23
4
2.68 0.0268
71 Umburanas
BA 33 24L 245524.683 8812565.453
4
2.72 0.0272
72 Varzea
Nova
BA 33 24L 287964.03 8754684.387
4
2.76 0.0276
73 Verdejante
PE 3 24M 503083.778 9123893.653
4
2.80 0.0280
Figure 22. Social Profile Index (IP_SOCI) in the Middle-Lower São Francisco.
xliv
5.
WARER USAGE ENVIRONMENTAL SUSTAINABILITY
The Chart 5 presents the classification of the 10 most significative variables and their repective
indicators, regarding the sustainable water usage in the Middle-Lower São Francisco.
They were obtained with the stepwise method, expressing the results of the integrated
matrix, with the 571 variables, belonging to the social, ecological and economic
profiles.
Chart 5. Classification of the 10 most significative variables and their indicators, regarding
the sustainabity of the water usage in the Middle-Lower São Francisco
Analysis of Variance
Sum of
Mean
Source
DF
squares
Square
Valor F
Pr > F
Model
10 5503.70024
550.37002
69.34
<.0001
Error
61 484.17476
7.93729
Corrected Total
71 5987.87500
Standard
Variable
Parameter
error
Tipo II SS
Valor F
Pr > F
Indicador - Intercept
11.45262 0.97920
1085.77509 136.79
<.0001
Public Finances (income)
-0.00030946 0.00009641 81.77883
10.30 0.0021
Pub.Finances (Expenditures- Agriculture)
0.00001273 0.00000172 435.69635
54.89 <.0001
Municipal livestock research (Mules)
0.00401 0.00128 77.64008
9.78 0.0027
Municipal livestock research (sheep)
0.00011906 0.00001514 491.03358
61.86 <.0001
Pollution sources (marble)
-19.08844 4.73769
128.84850 16.23 0.0002
Surface water quality (TDS)
102.95891 13.31321 474.71657
59.81 <.0001
Surface water quality (Salinity)
-107.60370 16.58553 334.09339
42.09 <.0001
Water balance (Deficit in July)
-8.82763 0.89873
765.77651 96.48
<.0001
Education (public elementary school)
-0.35317 0.10872 83.76408 10.55 0.0019
Health (Saúde (deaths -women)
-0.18476 0.02886
325.41485 41.00
<.0001
5.1. WATER USAGE ENVIRONMENTAL SUSTAINABILITY INDEX (ISA_WATER)
The sustainable development of the water usage in the Middle-Lower São Francisco is a process
under construction, whose quantification and qualification might be expressed in terms of four
xlv
new Factors. The concept of sustainability, in terms of the ISA_WATER, was developed in order
to allow the classification of Sub-Basins, Municipalities, water quality, environmental quality of
its sources (ISSO 14,001) and sources of pollution.
Determination of this index requires complex calculations in multidimensional environment. For
applying factorial analysis, a correlation matrix was formed, involving the three databases,
corresponding to the three profiles (social, ecological and economic). The final matrix of the
ISA_WATER contains 571 variables, distributed according to the factorial analysis. Those
variables are distributed in four groups, denominated Factors:
Factor 1 - Dynamics of urban pollution and water use (331 associated variables,
corresponding to 60.4% of the total factorial load).
Factor 2 - Irrigated agriculture (72 variables / 21% of the load).
Factor 3 - Family agriculture and livestock raising (97 variables / 11.0% of the load).
Factor 4 - Life quality and alimentary safety (71 variables / 7.6% of the total load).
The ISA_WATER, obtained in function of the integrated analysis of the social, ecological and
economic indicators, is presented in Chart 6 and Figure 23.
Chart 6. Ranking of the73 Municipalities, according to the Water Usage Sustainability
Index (ISA_WATER), in the Middle-Lower São Francisco.
Sub-
Order Municipality UF
Basin Zone
East
North Cluster Rate
ISA_WATER
1 Abare
BA 16
24L
487433.39
9036032.39
1
0.04
0.00036
2
Afogados da Ingazeira
PE
5
24M
650027.50
9142969.10
1
0.07
0.00072
3 Afranio
PE 19
24L
279253.52
9058156.85
1
0.11
0.00109
4
Belem de S. Francisco
PE
16
24L
503718.80
9032318.20
1
0.14
0.00145
5 Betania
PE
9
24L
606327.72
9085163.48
1
0.18
0.00181
6 Bodoco
PE
1
24M
396191.06
9140053.99
1
0.22
0.00217
7 Brejinho
PE
6
24M
689145.53
9187220.83
1
0.25
0.00254
8 Cabrobo
PE
2
24L
465843.03
9058807.30
1
0.29
0.00290
9 Calumbi
PE
5
24M
593647.20
9122047.34
1
0.33
0.00326
10 Carnaiba
PE
5
24M
632945.67
9137000.50
1
0.36
0.00362
11 Carnaubeira
da
Penha
PE
12
24L
528070.18
9080369.98
1
0.40
0.00399
12 Cedro
PE
3
24M
473617.82
9146426.51
1
0.43
0.00435
xlvi
13 Chorrocho
BA
16
24L
489365.77
9007349.56
1
0.47
0.00471
14 Curaca
BA
18
24L
399993.19
9006059.97
1
0.51
0.00507
15 Custodia
PE
8
24L
649477.07
9105741.35
1
0.54
0.00543
16 Dormentes
PE
19
24L
304973.88
9065779.16
1
0.58
0.00580
17 Exu
PE
1
24M
420063.93
9169552.65
1
0.62
0.00616
18 Flores
PE
5
24M
612987.96
9130112.02
1
0.65
0.00652
19 Floresta
PE
12
24L
547427.97
9049182.09
1
0.69
0.00688
20 Gloria
BA
15
24L
581802.37
8967647.77
1
0.72
0.00725
21 Granito
PE
1
24M
432171.45
9146999.23
1
0.76
0.00761
22 Ibimirim
PE
8
24L
644107.32
9055658.83
1
0.80
0.00797
23 Iguaraci
PE
7
24M
663659.43
9133584.88
1
0.83
0.00833
24 Inaja
PE
8
24L
629275.85
9015775.16
1
0.87
0.00870
25 Ingazeira
PE
6
24M
669850.01
9151164.98
1
0.91
0.00906
26 Ipubi
PE
1
24M
373240.50
9153972.50
1
0.94
0.00942
27 Itacuruba
PE
13
24L
534792.97
9035251.92
1
0.98
0.00978
28 Itapetim
PE
6
24M
699714.32
9183984.01
1
1.01
0.01014
29 Jatoba
PE
15
24L
580281.79
8984789.03
1
1.05
0.01051
30 Lagoa
Grande
PE
19
24L
360143.74
9005204.18
1
1.09
0.01087
31 Macurure
BA
16
24L
493643.74
8986590.10
1
1.12
0.01123
32 Manari
PE
8
24L
650755.51
9008820.16
1
1.16
0.01159
33 Mata
Grande
BA
8
24L
639273.51
8991874.27
1
1.20
0.01196
34 Mirandiba
PE
4
24L
529767.31
9102356.88
1
1.23
0.01232
35 Moreilandia
PE
1
24M
439174.39
9156436.71
1
1.27
0.01268
36 Oroce
PE
2
24L
448972.43
9054460.24
1
1.30
0.01304
37 Ouricuri
PE
1
24M
380720.93
9128499.23
1
1.34
0.01341
38 Ourolandia
BA
33
24L
272329.52
8786479.79
1
1.38
0.01377
39 Pariconha
BA
8
24L
609284.48
8977009.71
1
1.41
0.01413
40 Parnamirim
PE
1
24L
436241.90
9105607.43
1
1.45
0.01449
41 Pilao
Arcado
BA
26
23L
773566.25
8893175.64
1
1.49
0.01486
42 Quixaba
PE
5
24M
626967.39
9146415.92
1
1.52
0.01522
43 Remanso
BA
23
23L
820346.88
8935013.71
1
1.56
0.01558
44 Rodelas
BA
16
24L
525618.43
9022175.99
1
1.59
0.01594
xlvii
45 Santa
Cruz
PE
18
24L
352949.53
9088885.73
1
1.63
0.01630
46
Santa Cruz da Baixa Verde
PE
5
24M
593368.10
9135407.67
1
1.67
0.01667
47 Santa
Filomena
PE
18
24L
321975.76
9097342.69
1
1.70
0.01703
48 Santa
Terezinha
PE
6
24M
667727.58
9184164.84
1
1.74
0.01739
49
Sao Jose do Belmonte
PE
4
24M
526448.35
9130979.87
1
1.78
0.01775
50 Sento
Se
BA
23
24L
183376.66
8921299.61
1
1.81
0.01812
51 Serrita
PE
3
24M
467354.77
9123022.29
1
1.85
0.01848
52 Sertania
PE
8
24L
691212.22
9107119.02
1
1.88
0.01884
53 Sobradinho
BA
23
24L
299775.03
8954250.64
1
1.92
0.01920
54 Solidao
PE
5
24M
648670.50
9159622.02
1
1.96
0.01957
55 Tabira
PE
5
24M
661086.87
9160626.19
1
1.99
0.01993
56 Tacaratu
PE
8
24L
593455.80
8993359.94
1
2.03
0.02029
57 Terra
Nova
PE
3
24L
458598.04
9090248.01
1
2.07
0.02065
58 Trindade
PE
1
24M
360161.39
9141772.22
1
2.10
0.02101
59 Triunfo
PE
5
24M
598999.47
9133461.11
1
2.14
0.02138
60 Tuparetama
PE
6
24M
686247.27
9159275.23
1
2.17
0.02174
61 Umburanas
BA
33
24L
245524.68
8812565.45
1
2.21
0.02210
62 Varzea
Nova
BA
33
24L
287964.03
8754684.39
1
2.25
0.02246
63 Verdejante
PE
3
24M
503083.78
9123893.65
1
2.28
0.02283
64 Araripina
PE
1
24M
334660.81
9162240.04
2
2.36
0.02355
65 Arcoverde
PE
8
24L
714236.63
9068821.40
2
2.43
0.02428
66 Casa
Nova
BA
20
24L
283394.36
8986611.58
2
2.50
0.02500
67 Petrolandia
PE
15
24L
585762.62
9007321.15
2
2.57
0.02572
68 Salgueiro
PE
3
24L
486831.16
9107462.60
2
2.64
0.02645
69
Santa Maria da Boa Vista
PE
18
24L
409170.06
9026260.45
2
2.72
0.02717
70
Sao Jose do Egito
PE
6
24M
690378.06
9172899.61
2
2.79
0.02790
71 Serra
Talhada
PE
5
24M
577287.66
9116488.52
2
2.86
0.02862
72 Juazeiro
BA
35
24L
335414.56
8959243.74
3
2.97
0.02971
73 Petrolina
PE
35
24L
335164.33
8960686.58
4
3.12
0.03116
xlviii
Figure 23. Comparative map of Water Usage Environmental Sustainability Indices.
The cluster analysis determined an elevated ISA_WATER in 63 Municipalities (blue) and a high
index in eight (green). A regular value (yellow) was found only in Juazeiro, and a low value only
for Petrolina. In general, the ISA_WATER reflected a good to elevated condition to most of the
Municipalities, which, from the point of view of the social and economic profiles, appeared to be
really problematic.
As a resulto f this characterization, it was observed a significant increase in demand, as well as
changes in the surface waters, due to agro-industrial and urban activities, for around 700 km,
along the River. Even though it is evident the degradation in water quality, the impact of those
activities might be mitigated, with the adoption of management practices and with the application
of the corresponding legislation.
This analysis might come up with possible causes of the non-sustainability of the water usage.
Among these causes, there are:
Ṗ Poor regional health and educational systems (IP_SOCI);
Ṗ Low level of investments in basic services (IP_ECON);
xlix
Ṗ Significant pollutants loads, in view of industrial/commercial activities, insufficient
public services, indiscriminate use of agrotoxics and disposal of their packagings in the
rural environment (IP_ECOL);
Ṗ Environmental impacts of inadequate disposal of effluents (ISA_WATER).
It may be said that the great advantage of the ISA_WATER is its utility for assessment of public
policies and environment management practices. It provides support to the water resources
management, contributing to the identification of priority areas for monitoring and/or
intervention. In a smaller scale, it may be used as a model for preparation of the municipal
Agendas 21. This requires the utilization of the multivariate matrix of the causal analysis, whose
outcomes present the causes and mitigating measures for each of the identified problems.
5.2. CAUSAL ANALYSIS' MULTIVARIATE MATRIX
One of the innovations in the creation of the causal analysis matrix for water usage problems,
based on the social, economic and ecological profiles, was the inclusion of factorial analysis in
the process. It is an statistical procedure of multivariate analysis, whose objectives include the
classification of the Sub-Basins, with respect to specific indices related to the above mentioned
profiles.
Each analysis associated with a profile (social, economic, ecological and sustainable water
usage) produced four Factors. The first Factors in each profile produced the Primary Technical
Causes in the Causal Analysis Matrix (CAM). Each of those Factors generated its respective
load, as presented in Charts 7, 8 and 9).
Chart 7. Causal Analysis' Multivariate Matrix, according to the results of the summary
of the social, economic and ecological profiles, with respect to the environmental
sustainability of the water usage.
NON-SUSTAINABLE USE OF THE WATER
Profiles
Causes
Factor 1 Health Service: the poor attendance was the main cause,
with occurrence of significant number of diseases and fetal and infant
deaths.
Factor 2 Deficitary Educacional System: Lack of teachers and
SOCIAL
schools, etc.
Factor 3 Insufficient Basic Services: poor servicing, specially for
the rural population.
Factor 4 Few Job Offers: Low level of employment in the region.
Fundamental Causes Limited access to education and health:
l
Lack of job opportunities and deficitary public services.
Factor 1 Public expenditures in infrastructure: Low level of
investments in basic services (health and sanitation) and in production
infrastructure.
Factor 2 Low technology irrigated agriculture: Irrigated
agriculture not using best practices.
Factor 3 Rainfed agriculture: Subsistence agriculture (corn, beans
ECONOMIC
and cassava), using low technology.
Factor 4 Other seasonal crops: Economic instability due to the
exploitation of crops with seasonal financial returns (onion and
irrigated rice).
Fundamental Causes- Low public investments in the basic
infrastructure: Aggravated by the inadequate agricultural and agro-
industrial production systems.
Factor 1 Disposal of residues: Total pollutants load in the water,
due to the industrial/commercial activities, to the public services and to
the application of agrotoxics and disposal of their packagings.
Factor 2 Land ownership concentration: Total occupied area,
followed by the prejudice against landowners as producers.
Factor 3 Water deficit: Hydrologic balance in some Municipalities,
ECOLOGICAL after July.
Factor 4 Mining activities: Production of chemical residues, by
mining activities.
Fundamental causes Disposal of Pollutants: The disposal of
chemical pollutants in the water bodies, by production activities and by
the public services, is considered the main reason for water
contamination.
Factor 1 Dynamics of Urban Pollution and Inadequate Use of the
Water: Inadequate destination of the effluents and solid residues
(domestic, industrial and agricultural), along with population
concentration in urban areas.
Water use
Factor 2 Irrigated Agriculture's Environmental Management:
environmental
Given the diversity and complexity of the agro-business, involving
sustainability
fruits for export, with environmental quality and alimentary safety.
(ISA_WATER)
Factor 3 Family agriculture and Livestock Raising: Lack of a
program with alternative technologies for getting along with the
droughts.
Factor 4 Life Quality and Alimentary Safety: Low Human
li
Development Index (HDI), in most Municipalities of the Middle-Lower
São Francisco.
Fundamental causes Water Pollution: Water usage vulnerability, in
view of the inadequate disposal of urban and rural residues, produced
by the productive activities and by the territory's occupancy.
Chart 8. Proposed strategic actions, based on the fundamental causes determined by the
Causal Analysis and on ANA's policies.
FUNDAMENTAL
ACTIONS
Interface Causes /
CAUSES
ANA's policies
Access to education
A Public policies focused on the basic
and health is
services (health, education and
restricted to a low
sanitation)
part of the
population.
B Incorporating environmental
IV.1. Depollution of
education in the curricula of all levels
sources
of education
IV.2. Soil and water
Revitalization/conservation.
IV.5. Rational use.
Use of public funds
A Articulated budget management
II.1. Basin Committees
for improving basic
program, by Basin.
infrastructure
B Diagnosis of the Municipalities'
IV.1. Depollution of
basic infrastructure, for preparing
sources
request of funds, from financing
IV.2. Soil and water
institutions.
Revitalization/conservation.
Inadequacy of the
C Articulation with the community,
IV. Incentive programs
agricultural and
encouraging it to participate in actions
agro-industrial
aimed at the sustainability of the use of
production systems
water.
in use
D Introducing the normalization of
IV. Incentive programs
agricultural practices and product
certification.
E Spreading out the benefits of
IV. Incentive programs
quality certification, among rural
producers.
lii
F Implementing the SGA in the local IV. Incentive programs
agro-industries.
G Training and capacitating rural and IV. Incentive programs
agro-industrial producers.
H Financing of research of clean
IV. Incentive programs
technologies.
Disposal of
A Homogenization of the
III.6. Integrated inspection
pollutants in water
environmental legislation.
bodies
B Directory of users, including
III.1. Users directory
economic activities impacting the water III.2. Concession of rights
resources; Database with water and
potential pollution sources, viewing the III.5. Information systems
monitoring of water usage.
C Implementing environmental
III.4. Water Resource Plan
management instruments, through
official programs in industries, rural
establishments and basic sanitation
facilities.
D- Strengthening the supervising
III.6. Integrated inspection
agencies and community programs.
E- Announcement of results and
III.5. Information system
discussing them with the community
and institutions.
F Expanding the irrigation program.
III.4. Water Resources Plan
A Institutionalizing the sustainable
II. Institutional Instruments
Vulnerability of the
population, to the use development of the municipal
of water with
administration.
compromised quality B Environmental management of the III.1. Users directory
Basin, using instruments of the Water
III.2. Concession of rights
Resources Development Plan: Directory
of users, concession and charging for
III.4. Water Resources Plan
water rights, water resources
information systems, urban macro-
drainage, re-use of water.
liii
C Building recycling plants for
IV.1. Depollution of
processing solid residues.
sources
IV.2. Soil and water
Revitalization/conservation.
IV.5. Rational use
D Monitoring sustainable
III.5. Information system
development indices.
Chart 9. Causal Analysis matrix, according to the social, economic and ecological profiles
and to sustainable development in the Middle-Lower São Francisco.
PROJECTS'S OUTCOMES
TECHNICAL PROPOSALS FOR
THE SÃO FRANCISCO BASIN (PGI)
1) Evaluation of
a) Georeferenced Inventory of environmental quality
environmental impacts on - Inventory of water bodies and water users;
the multipurpose water, in - Inventory of pollution sources;
view of the agro-
- Inventory of the physical, chemical and microbiological
industrial/commercial
quality of surface and groundwaters;
activities and of the public - Social-environmental inventory of agricultural, livestock,
services
industrial, commercial and basic sanitation (sewer treatment
and slaughterhouse disposal) facilities, using the ISSO 14,001
norm.
2) Documented evaluation
- Building the basin's social and economic profiles, based on
of water quality
the development of sustainability indicators.
3) Building a Geographical b) Elaboration of thematic digital maps of water usage
Information System (GIS), sustainability
based on natural indicators - Social profile index;
of water quality.
- Economic profile index
- Ecological Profile Index;
- Water Usage Sustainability Index (ISA_WATER).
4) Documented structure
c) Elaboration of technical brochures on the sustainable
for mitigation and control use of water
of critical pollutants.
- Preparing booklets covering environmental practices and
community participation in the conservation and inspection of
the waters (to be introduced in the elementary and high-
schools).
5) Pilot scheme for on-line
d) Installing automated warning stations in priority Sub-
monitoring of "Quality of
Basins
Multipurpose Waters".
- Installing warning stations in critical sites of Sub-Basins with
high degradation indices.
liv
6) Social, economic and
e) Proposal for the rational use of the water, in a regional
environmental indicators
scale
for the Region.
- Innovative technologies (Best Agricultural Practices)
7) Training and
f) Developing a monitoring program for the sustainable use
involvement of the
of the water
community.
- Forming "Water Agents" (voluntary individuals of the
community), on environmental education techniques, social
mobilization and conservation of the water;
- Spreading out the Water Resources Environmental
Management, regarding the use of best practices and municipal
public services.
8) Recommendations for the g) Developing a Program for Diffusion of Rational Uses of
Strategic Actions Plan
Water
(SAP)
- Putting out courses about monitoring water quality, involving
elementary and high-school students. Organizing workshops in
the community, promoting the participation in actions aimed at
the sustainability of water usage, passing on the experiences,
reclamation of degraded areas/water sources and inspection.
The construction of the Water Usage Sustainability Index was done by integrating information of
the three profiles. The factorial analysis of the index produced other four Factors, which
contributed to the construction of the Causal Analysis Matrix, for the problems identified by the
Activity 1.4. As the matrix was built with the use of multivariate analysis, it was denominated
"Multivariate Causal Analysis Matrix" (MCAM).
The importance of this approach is that it allows the identification of the actual causes of the
environmental problems, to be used in the elaboration of the Basin's Integrated Management
Program.
5.3. COVALIDATION OF THE ISA_WATER
Covalidation of the ISA_WATER was achieved in rural and urban communities, between 1998
and 2002, supported by the implementation a Strategic Actions Program, viewing the monitoring
of the water, taking into account the concept of sustainable development and the Law of Life
(Law 9,605/88 and Decree 3,179/99). It also included comparisons with the Human Development
Index (HDI).
5.3.1. Human Development Index (HDI)
The HDI is a measure of man's development, covering three basic dimwensions:
a)
A long and healthy life, estimated by life expectancy at the time of birth;
lv
b)
knowledge, measured by the education level; and
c)
Condign condition of life, measured by the GNP per capta.
It is estimated with the use of indicators of life expectancy at the time of birth, in years, level of
adults (older than 15) literacy, school attendance and GNP per capta. This information permits
determining the life expectancy, education index and the GNP index. These three index are
combined into the Human Development Index (HDI).
Chart 10 presents the ranked HDI for the 73 Municipalities in the Middle-Lower São Francisco,
for the 1998 -2002 period (values illustrated in Figure 24).
Chart 10. Human Development Index (HDI): Ranking of the 73 Municipalities in the
Middle-Lower São Francisco (1998-2002)
Obs Municipality UF
Basin
Zone
East North
IDH
CLUSTER
5 Arcoverde
PE
8 24L
714236.63 9068821.40
0.51
1
30 Itacuruba
PE
13 24L
534792.97 9035251.92
0.57
1
33 Juazeiro
BA
35 24L
335414.56 8959243.74
0.53
1
45 Petrolandia
PE
15 24L
585762.62 9007321.15
0.53
1
46 Petrolina
PE
35 24L
335164.33 8960686.58
0.60
1
51 Salgueiro
PE
3 24L
486831.16 9107462.60
0.54
1
1 Abaré
BA
16 24L
487433.39 9036032.39
0.48
2
2 Afogados da Ingazeira
PE
5 24M
650027.50
9142969.10
0.45
2
6 Belém de S. Francisco
PE
16 24L
503718.80
9032318.20
0.47
2
10 Cabrobó
PE
2 24L
465843.03 9058807.30
0.46
2
14 Casa
Nova
BA
20 24L
283394.36 8986611.58
0.48
2
17 Curaca
BA
18 24L
399993.19 9006059.97
0.49
2
22 Floresta
PE
12 24L
547427.97 9049182.09
0.46
2
32 Jatobá
PE
15 24L
580281.79 8984789.03
0.44
2
36 Manari
PE
8 24L
650755.51 9008820.16
0.43
2
38 Mirandiba
PE
4 24L
529767.31 9102356.88
0.43
2
40 Orocó
PE
2 24L
448972.43 9054460.24
0.44
2
44 Parnamirim
PE
1 24L
436241.90 9105607.43
0.43
2
48 Quixaba
PE
5 24M
626967.39 9146415.92
0.49
2
50 Rodelas
BA
16 24L
525618.43 9022175.99
0.48
2
55 Santa Maria da Boa Vista
PE
18 24L
409170.06
9026260.45
0.45
2
58 São José do Egito
PE
6 24M
690378.06
9172899.61
0.47
2
60 Serra
Talhada
PE
5 24M
577287.66 9116488.52
0.50
2
62 Sertania
PE
8 24L
691212.22 9107119.02
0.44
2
lvi
67 Terra
Nova
PE
3 24L
458598.04 9090248.01
0.48
2
69 Triunfo
PE
5 24M
598999.47 9133461.11
0.43
2
71 Umburanas
BA
33 24L
245524.68 8812565.45
0.44
2
73 Verdejante
PE
3 24M
503083.78 9123893.65
0.42
2
3 Afrânio
PE
19 24L
279253.52 9058156.85
0.38
3
4 Araripina
PE
1 24M
334660.81 9162240.04
0.39
3
8 Bodocó
PE
1 24M
396191.06 9140053.99
0.36
3
9 Brejinho
PE
6 24M
689145.53 9187220.83
0.36
3
12 Carnaíba
PE
5 24M
632945.67 9137000.50
0.38
3
15 Cedro
PE
3 24M
473617.82 9146426.51
0.41
3
16 Chorrochó
BA
16 24L
489365.77 9007349.56
0.38
3
18 Custodia
PE
8 24L
649477.07 9105741.35
0.38
3
19 Dormentes
PE
19 24L
304973.88 9065779.16
0.37
3
20 Exu
PE
1 24M
420063.93 9169552.65
0.38
3
21 Flores
PE
5 24M
612987.96 9130112.02
0.38
3
24 Granito
PE
1 24M
432171.45 9146999.23
0.40
3
26 Iguaraci
PE
7 24M
663659.43 9133584.88
0.39
3
28 Ingazeira
PE
6 24M
669850.01 9151164.98
0.40
3
29 Ipubi
PE
1 24M
373240.50 9153972.50
0.36
3
31 Itapetim
PE
6 24M
699714.32 9183984.01
0.40
3
34 Lagoa
Grande
PE
19 24L
360143.74 9005204.18
0.38
3
39 Moreilandia
PE
1 24M
439174.39 9156436.71
0.36
3
41 Ouricuri
PE
1 24M
380720.93 9128499.23
0.37
3
42 Ourolandia
BA
33 24L
272329.52 8786479.79
0.37
3
43 Pariconha
AL
8 24L
609284.48 8977009.71
0.40
3
53 Santa C. da Baixa Verde
PE
5 24M
593368.10
9135407.67
0.39
3
54 Santa
Filomena
PE
18 24L
321975.76 9097342.69
0.39
3
56 Santa
Terezinha
PE
6 24M
667727.58 9184164.84
0.38
3
57 São José do Belmonte
PE
4 24M
526448.35
9130979.87
0.39
3
61 Serrita
PE
3 24M
467354.77 9123022.29
0.39
3
lvii
63 Sobradinho
BA
29 24L
299775.03 8954250.64
0.37
3
64 Solidão
PE
5 24M
648670.50 9159622.02
0.38
3
65 Tabira
PE
5 24M
661086.87 9160626.19
0.42
3
66 Tacaratu
PE
8 24L
593455.80 8993359.94
0.42
3
68 Trindade
PE
1 24M
360161.39 9141772.22
0.41
3
72 Várzea
Nova
BA
33 24L
287964.03 8754684.39
0.40
3
7 Betania
PE
9 24L
606327.72 9085163.48
0.34
4
11 Calumbi
PE
5 24M
593647.20 9122047.34
0.35
4
13 Carnaubeira
da
Penha
PE
12 24L
528070.18 9080369.98
0.32
4
23 Gloria
BA
15 24L
581802.37 8967647.77
0.33
4
25 Ibimirim
PE
8 24L
644107.32 9055658.83
0.34
4
27 Inajá
PE
8 24L
629275.85 9015775.16
0.31
4
35 Macurure
BA
16 24L
493643.74 8986590.10
0.28
4
37 Mata
Grande
AL
8 24L
639273.51 8991874.27
0.35
4
47 Pilão
Arcado
BA
26 23L
773566.25 8893175.64
0.33
4
49 Remanso
BA
23 23L
820346.88 8935013.71
0.35
4
52 Santa
Cruz
PE
18 24L
352949.53 9088885.73
0.31
4
59 Sento
Se
BA
23 24L
183376.66 8921299.61
0.31
4
70 Tuparetama
PE
6 24M
686247.27 9159275.23
0.31
4
5.3.2. HDI Versus ISA_WATER, a comparative study
Considering that the HDI is commonly used in the Country as an indicator of life quality, a
comparative analysis between the two indices, in a regional extent, was carried out. In a first
stage, the 35 Sub-Basins were classified, according to the HDI. Then, the result was compared to
the ISA_WATER index (Figure 24).
It is noticed that the HDI privileged those Municipalities with greater averages of the three basic
human development dimensions in detriment of the ecological dimension. In other words, those
Municipalities with a high HDI will not necessarily attain a water usage sustainable development
in the long run. That is because most of them, in order to succeed, had to penalize the
environment.
Based on the previous considerations, it might be said that most of the Municipalities with
elevated HDI would also present elevated ISA_WATER indices, which is not true, as the first
does not incorporate the ecological profile. Thus, it is the conclusion that the HDI is not an
adequate environmental sustainability indicator for the Brazilian Semi-Arid. For this reason, the
ISA_WATER methodology was developed.
lviii
Figure 24. ISA_WATER versus HDI in the Middle-Lower
São Francisco: A comparative map.
lix
6.
MONITORING THE SUSTAINABLE USE OF THE WATER
6.1. BASIC STUDIES
For many years, water quality has been seen as a set of chemical, physical-chemical, physical,
microbiological and hydro-geological parameters, which classify it according to a Water Quality
Index. Even though useful, this index is limited, evaluating positive and negative changes already
occurred in the water.
Results from data from the thousands of water bodies which have been monitored throughout the
years show that these resources are in an advanced stage of pollution. This proves that just
monitoring the resources is not enough for its preservation. Then, the need to review the water
quality concepts came up, with the proposition of new approaches to the problem, viewing the
environmental sustainability. Thus, a pioneer methodology is proposed for water quality
monitoring, using the new concept of Water Usage Environmental Sustainability (ISA_WATER),
which may be applied to any of the São Francisco Sub-Basins.
6.2. SELECTING AND TRAINING VOLUNTEER WATER AGENTS (VWA)
During this wok, there was a concern with passing these methods and processes to the diverse
communities in the Region, in an attempt to maximize the people's perceptions of the place they
live in. Understanding of the "how the place we live in works" principle leads to thinking about a
healthier man/environment relationship. A way of better understanding this process is to
implement basin diagnosis.
The complete water quality diagnosis consists in adequately monitoring the basins' physical,
chemical and biological components, associating them to the natural and anthropic factors
determinant of possible changes in the water bodies.
The São Francisco Basin's monitoring network is noticeably more expressive in the Upper Basin.
in the Middle-Lower, most part of the river channel is dammed and almost all of the tributaries
are ephemeral rivers. In spite of being the main development factor, serving the riverine
population, the River has few water quality monitoring stations (see Figure 25).
The isolation of the diverse sources of water, in the drought periods, confers unique
characteristics to each of them, leading to critical restrictions on quality and quantity of water.
Other situation occurs only a few hundred meters from the River, where access to the water is
made through dams, cisterns, water-holes and wells (Amazon, tubular and open wells). See
Pictures 17 to 20.
Those areas, away from the river, are inhabited by great part of the rural population, without
assistance, living side by side with endemic diseases, such as Chagas' disease, leishmaniosis,
intestinal parasitosis and skin infections, among other. In those places, the eventual evaluations of
water bodies are usually focused on salinity.
lx
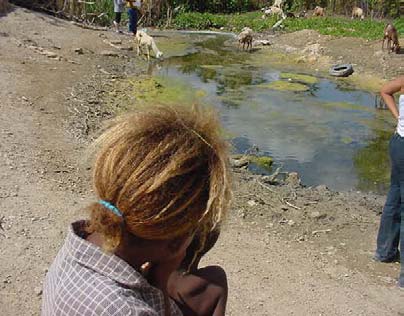
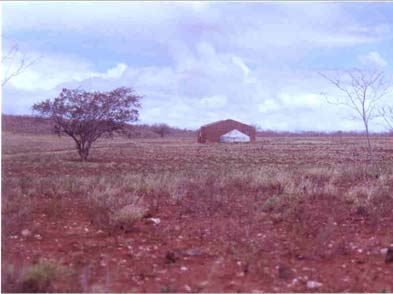
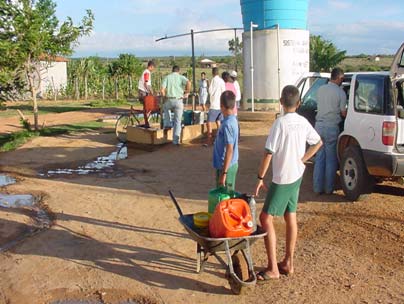
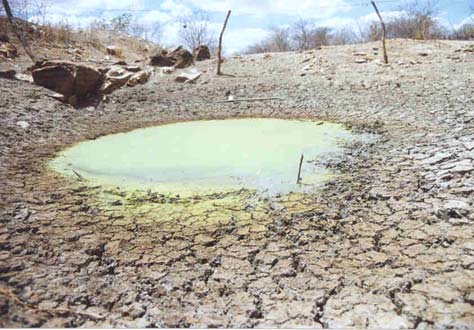
Figure 25. Location of water quality monitoring station in Brazil (SIH/ANEEL, 1999).
Picture 17. Water confinement in the
Picture 18. Water storage in cisterns.
Salitre River.
Picture 19. Community well.
Picture 20. Well during drought.
lxi
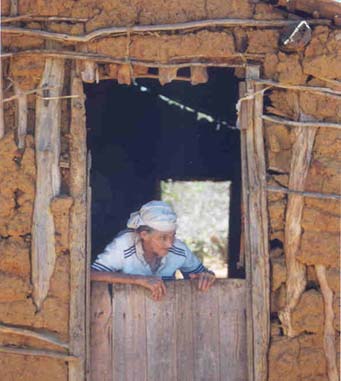
Picture 21. Typical house in the countryside.
This region has little resources and great problems. For this reason, it was decided for using
simple water quality monitoring tools, with the direct participation of the communities, in the
efforts to assess the basic conditions in place usually neglected.
Inspired by the conviction that everyone can contribute to improving the water resources, it was
devised a better way to work, allowing people from the community (schools and common
individuals, not only professional experts) to take part, voluntarily, in a monitoring program.
It is understood that the structure might function as a pyramid, whose base is constituted by local
communities. Next, in upward direction, the regional institutions, the diverse experts in the
different organizations and, finally, in the top, the federal institutions. This hypothetical pyramid
must work as a type of elevator, in continuous movement, producing a flux of information related
to the solution of problems. To reach this interactivity and communicability among the diverse
involved segments is the vital point for implementing the proposed actions.
The Water Agents formation program make use of the elementary and junior-high schools, an
extremely important partnership, because they are the responsible for people's formation. This is
the ideal instance for succeeding in changing peoples' way of seeing the environment and to
improve the way they live in it. The teachers' participation in the courses for water agents result
in great gains in building a network of environmental monitors (see Pictures 22 to 25).
6.2.1. Treinamento de Agentes Voluntários para Cadastramento de corpos de água
In vast and peculiar regions, such as the Middle-Lower São Francisco, finding water sources for
cadastration and analysis is not an easy task. To bypass this problem in each of the studied
lxii
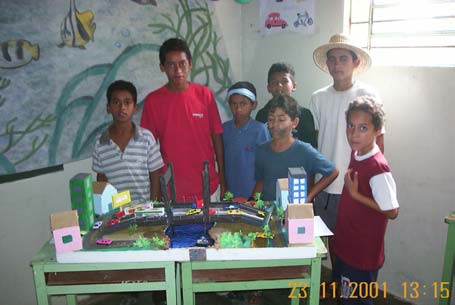
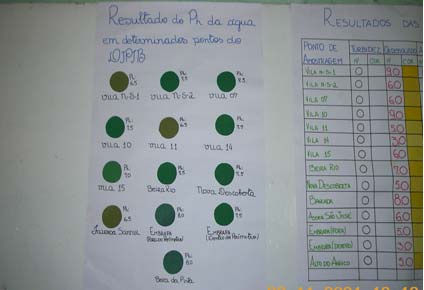
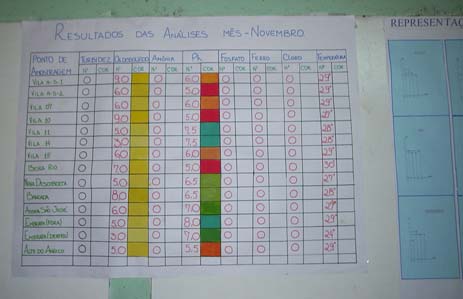
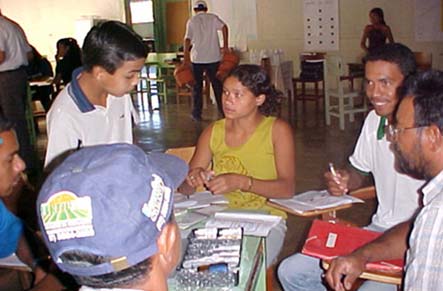
Municipalities contacts were made with the Prefectures, viewing the indication of persons with
knowledge of the areas. The selected persons would receive specific instructions about the filling
of forms, viewing the register of surface and groundwater sources, in addition to training on the
use of the Global Positioning System -GPS (see Picture 26).
Picture 22. Elementary school students.
Picture 23. Results from pH analysis.
Picture 24. Results from water analysis at
Picture 25. Students passing the
Antônio Nunes dos Santos. School, in
methodology to students from other
Petrolina (PE).
schools.
6.2.2. Training Voluntary Water Agents (VWA) for water quality monitoring
Selection of target public is usually made by the Municipalities' departments. Preference is given
to health agents, teachers and students of local schools, rural extension technicians, and
technicians from public institutions and NGO's known to be involved in the implementation of
official water resources policies. See Pictures 26 and 27.
The "Course for Voluntary Water Agents for Water Quality Monitoring" starts after the selection
of the Agents, within the Community. The course covers the following technical and practical
topics:
lxiii
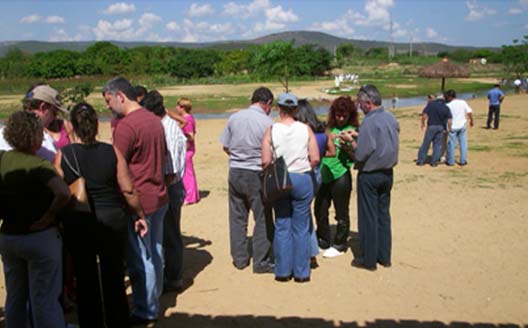
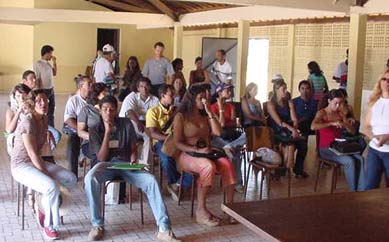
a) Basic concepts on basin environmental diagnoses;
b) tracking down pollution sources;
c) use of Ecokits and mobile laboratories for determining water quality;
d) automated and multiparameter soundings;
e) sampling procedures, filling analytical report forms; and
f) understanding the environmental meaning of the estimated parameters.
Picture 26. Field class about the use of
Picture 27. Training course for Voluntary
GPS by Voluntary Water Agents.
Water, from the Community.
The environmental agent's basic tool is the Ecokit, which determines the water quality, based in
the following parameters: temperature, pH, dissolved oxygen, ODB, total hardness, turbidity,
iron, phosphate, chlorite, chlorine, ammonia and total and fecal coliforms. This tool allows the
trained individuals to monitor the water quality in the area they live. The results permit
discussions about the potable water, the need for quality control and spring preservation.
The Ecokit (Figure 28) is composed by flasks, reagents, glasses and other items required for
physical-chemical analyses. It includes a booklet with instructions on its use and interpretation of
results. With low cost, it permits a great capillarity and utilization for data collection, contributing
to a high frequency of analyses. This way, the methodology becomes an important auxiliary
assessment and monitoring tool, widely accepted by the diverse segments involved in the Agents
Formation Program.
Microbiological analyses and evaluation of benthonic communities are also implemented, to
support the results. Slime, agriculture's surface runoff, urban waste and domestic sewers are
usually discharged into water bodies, especially rivers. The associated pathogens are a hazard to
the users. Fecal contamination is used as an indication of occurrence of organic pollutants
produced by the man (Chapman & Kimstach, 1997).
lxiv
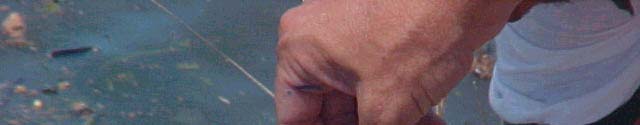
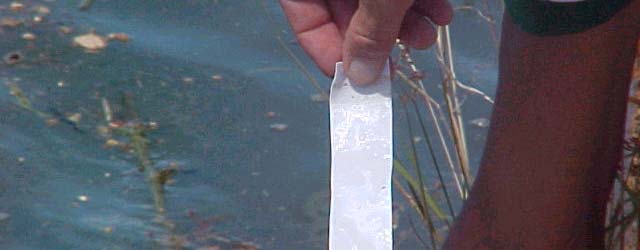

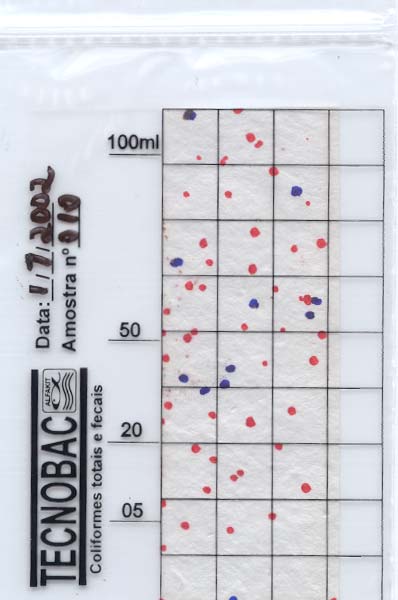

Picture 28. Ecokit® for physical-chemical water analyses.
The group of bacteria denominated coliform include gram-negative aerobic bacilli, not spore
formers, that, when incubated at 350C, ferment the lactose, producing CO2, within 48 hours.
These coliforms (Escherichia, Citrobacter, Klebsiella and Enterobacter) can be found in pastures
and in submerged soils and plants, being denominated total coliforms. The fecal coliforms are
those coming specifically from the intestinal tract.
Methods for detection of fecal coliforms, such as the microbiological kits (Picture 29), were
developed using the presence of indicative organisms, such as the intestinal bacteria Escherichia
coli, which occurs only in human feces or in those of warm blooded animals (Chapman &
Kimstach, 1997).
Picture 29. Total and fecal coliform analysis with the microbiological kit.
lxv
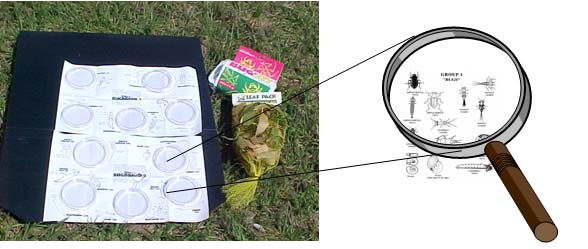
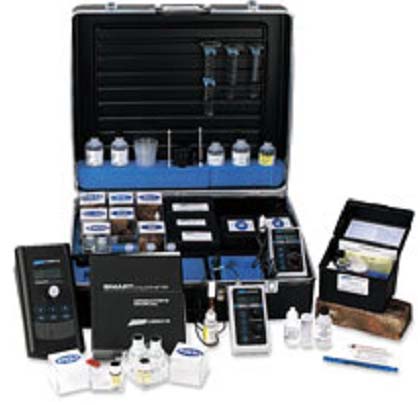
Benthonic macroinvertebrates are biological communities present in many ecosystems, reflecting
their integrity regarding their structural, chemical, physical and biological characteristics. It is
important to make available, to the water agents, simple methods for quantifying the
macroinvertebrates belonging to indicative groups, sensitive to the different stressor agents. This
will allow the physical, chemical and bacteriological analysis and diagnosis of the water.
Picture 30. Material for evaluating the benthonic macroinvertebrates (Bug Kit - LaMotte
Company,Chestertown- Maryland, USA).
Mobile Laboratories
The "Smart Water" portable laboratories (Picture 31) allow the determination of 24 water quality
related variables, in field conditions, in order to detect polluted points and make in loco
environment studies.
Picture 31. "Smart Water" Portable laboratory.
lxvi
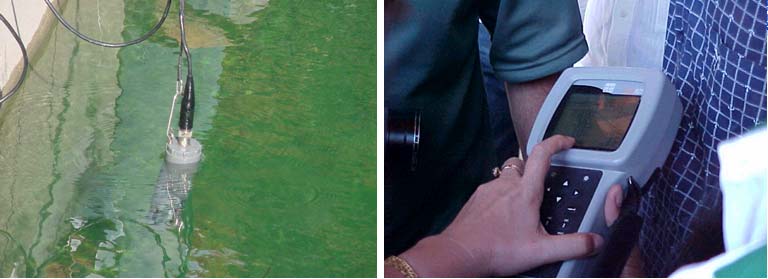
Through colorimetric analyses, 15 physical-chemical variables (including ammonia, chlorine,
bromide, iodine, chromites, fluoride, iron, nitrate, nitrite, phosphor, silica, sulphate and turbidity),
can be precisely determined. Other six might be determined by title analysis (alkalinity, carbon
dioxide, chlorite, salinity, dissolved oxygen and hardness.
The Laboratory also includes a conductivimeter and a pHmeter. capable of measuring the
electrical conductivity, total dissolved solids and hydrogenioc concentration (pH). These are
considered regional laboratories and must be handled by technical-specialized personnel. They
are to be used in areas where other instruments detected some problem of greater magnitude and
need more precise analyses.
Multiparameter probes
Devices for measuring water quality (Picture 32) use many attached probes, for measuring
different parameters simultaneously. They are precise instruments and might be used in a fixed
mode or be carried on the field, by the monitors. They have great data storage capacity and allow
the transmission of the results, by telemetry. When in fixed mode, they might be connected to
data transmission systems, allowing real time monitoring in continuous mode (Picture 33).
Picture 32. Multiparameter probe.
Picture 33. Data collector of the
multiparameter probe.
lxvii
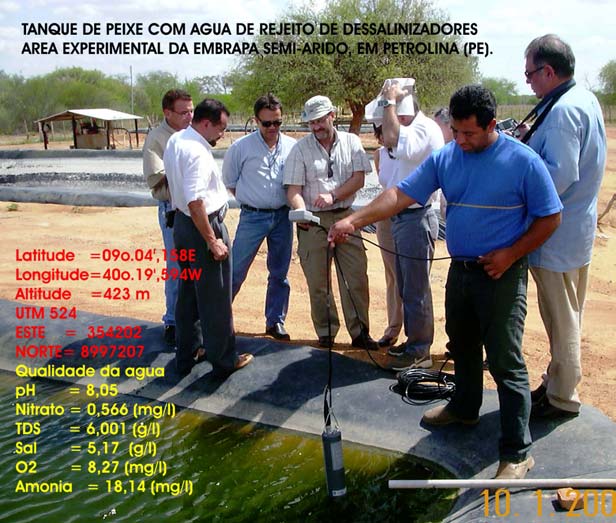
Picture 34. Water quality analysis with the multiparameter probe.
BA001.DAT
(
S 23.4260
23.4334
23.4408
23.4482
23.4556
23.4630
emp
nd(u / 1259.90
1260.16
1260.42
1260.68
1260.94
1261.20
o S(g 0.8180
0.8186
0.8192
0.8198
0.8204
0.8210
D
m
0.6280
0.6286
0.6292
0.6298
0.6304
0.6310
i
nity(
1
onc( .0020
4.80
4.92
5.04
5.16
5.28
5.40
1.0036
1.0052
C
1.0068
pth( 1.0084
e 1.0100
8.100
8.122
8.144
8.166
8.188
8.210
pH
(
m
N 125.0
127.2
129.4
131.6
133.8
136.0
RP
ium 0.420
0.440
0.460
0.480
0.500
0.520
N n
nia m 0.0320
0.0330
0.0340
0.0350
0.0360
0.0370
o
(
m 820.0
826.2
832.4
838.6
844.8
851.0
r
ide(
N
te ( 0.750
0.782
0.814
0.846
0.878
0.910
a
l 1.40
1.56
1.72
1.88
2.04
2.20
idity
phyl 3.20
3.38
3.56
3.74
3.92
4.10
o
06/09/2002
06/09/2002
06/09/2002
06/09/2002
06/09/2002
06/09/2002
DateTime(M/D/Y)
Data/tempo Temp
Sp
Cond
TDS
Salinity
DO
Depth pH ORP
Ammonium
Ammonia N
Chloride
Nitrate N Turbidity Chlorophyl
Conc
N
M/D/Y C
uS/cm
g/L
ppt
mg/L
m
mV
mg/L
mg/L
mg/L
mg/L
NTU
ug/L
06/09/2002
09:05:03
23.43
1260.0
0.819
0.63
4.87
1.009
8.11
126 0.51 0.03 822.70
0.89 2.1 3.4
06/09/2002
09:05:13
23.44
1260.0
0.819
0.63
4.96
1.004
8.18
130 0.46 0.03 825.10
0.81 1.5 3.5
06/09/2002
09:05:23
23.44
1260.0
0.819
0.63
4.94
1.006
8.18
131 0.45 0.03 835.40
0.81 1.5 3.5
Figure 26. Results from the multiparameter probe, presented by the EcoWatch software.
l xviii
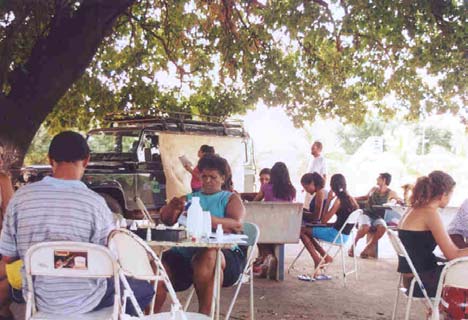
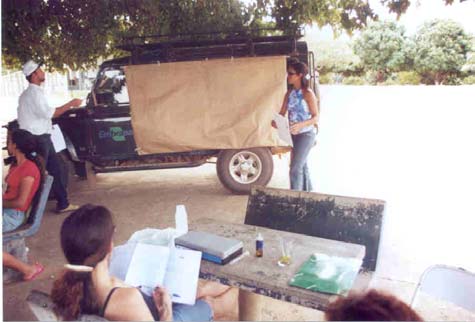
After completing all stages, each group presented its considerations about the course, evaluating
its positive and negative aspects. The benefits the work will bring to the Region, the obstacles
that may be found and what each individual, considering each one's limitations, can do to
contribute to the implementation, development and maintenance of the Program were discussed
in group.
Picture 35. Presentation and discussion
Picture 36. Course evaluation and
of results.
definition of Action Plan.
6.2.3. Proposal of support to the monitoring of the sustainable water usage
Ṗ Recommended sampling points for the official monitoring of surface waters
Applying the ISA_WATER methodology made possible the selection of critical áreas for the
systematic monitoring of surface waters quality, by the official Environmental Control Agencies.
Foe the surface waters, there are two monitoring frequencies, depending on the hydrologic
regime. The first one refers to the São Francisco River channel, that might be verified monthly or
every two weeks, in view of the frequent changes in water quality parameters, as detected in this
study. In this case, eight critical areas were identified, as indicated by the red circles, in Figure
27. The second refers to the tributaries and reservoirs in the Region, which might be verified
every two or three months. For this case, 16 critical areas were selected, as identified by the green
circles, in Figure 27.
Ṗ Recommended sampling points for the official monitoring of groundwaters
A similar procedure permitted the selection of critical areas for groundwater resources control. In
this case, the hydrologic regime is much more stable, and there is no need for a monitoring
frequency inferior to 6 months. 23 critical areas were identified, as represented by the orange
circles, in Figure 28.
lxix
Figure 27. Surface waters monitoring points (ISA_WATER methodology).
Figure 28. Surface waters monitoring points (ISA_WATER methodology).
lxx


6.3.
CAPILARITY: BUILDING THE NETWORK
The recommendation of monitoring points complements the building of the water agents
(monitors) network. The activities of the water agents was consolidated with the installation of a
minimum infrastructure in each of the Basin Committee's support centers. This infrastructure was
constituted by Ecokits (mobile laboratories that do up to 62 water analysis, including heavy
metals) and a multimedia computer with high-speed Internet.
These equipment will be located. preferably, at the Basin Committee's technical office.
This way, a tem of agents from a certain area will be able to integrate with agents from
other areas, to exchange experiences, through the Environmental Information System
(EcoSiam), developed by EMBRAPA-Environment.
The schematic model presented in Figure 29 gives an idea of the network's capillarity.
Base
Núcleos
Monit or
Fontes de água
Figure 29. A schematic model of a monitoring network.
The school is the center to where the information on water quality, collected by the agents
(students), in their neighborhood, converge The water samples are collected by the student, who
makes some tests in loco, and additional ones under the supervision of the person in charge of the
lxxi
center (a teacher). The material is used in the school, in sciences fairs, meetings of parents and
teachers and as class material.
The responsible for the center sends the monitoring results, via Internet or in any other way, to
the one responsible for area, who forwards them to EMBRAPA-Environment and to ANA, to
feed the EcoSiam's environmental database. The information flux includes feedback,
contributing to the identification of critical areas in a short time, allowing faster mitigating
measures.
Figure 30 presents the spatial distribution of the interconnected centers and the constitution of the
network (forming a regional base), with the respective sampling points.
Figure 30. Inventory centers and estimate of the number of centers and agents demanded
by the 35 Sub-Basins in the Middle-Lower São Francisco.
lxxii
6.4.
BASES E MONITORES FORMADOS NA REGIÃO
In the Middle-Lower São Francisco, activities were concentrated in five bases, located in
Juazeiro, Curaçá and Campo Formoso, in the State of Bahia, and in Petrolina and in the
Bebedouro Irrigation District, in the State of Pernambuco. $6 monitoring centers (grassroots)
were created and approximately 321 agents trained.
BASE CENTERS
AGENTS
CURAÇÁ 5
63
PETROLINA 6
71
BEBEDOURO 5
44
JUAZEIRO-I 25
106
CAMPO FORMOSO
5
37
TOTAL 46
321
For all the formed groups, the main target was to pass the technology on to other groups of
people, in order to reach the greater possible number of water sources in each Region. This will
allow a more precise diagnosis, with more efficient and suitable responses.
6.4.1 Water Usage Environmental Information System (Siam_Water)
The SIAM (Environmental Information System for Water Users Warning) is under construction
and will consist of an information system based on an Internet communication protocol.
Technical information from hydro-edafoclimatic stations and from electronic field collectors will
be made available in it.
Through this service, users will be informed of activities related to the sustainable use of the
water and about the most suitable technical indicators for their production systems (daily
hydrologic balance, environmental quality, soil and water management, weather forecasts and
general information).
7. CONCLUSIONS
Ecological Profile Index (IP_ECOL)
l xxiii
Ṗ The use of geoprocessing techniques allowed the crossing and processing of 517
variables anf the plotting of thematic maps with respect to each index.
Ṗ Water pollution, in general, was associated to anthropic actions.
Ṗ The vegetative cover index (ICV_SAT) revealed a great variation in vegetative cover
across the Middle-Lower São Francisco, emphasizing the extreme Southeast and the
extreme Southwest as the most vegetated.
Ṗ The Lower Sobradinho Sub-Basin presents high susceptibility to erosion, while the
Riacho Bazuá and the Riacho Morin Sub-Basins present regular values for the soil
environmental degradation index (IDS_SAT).
Ṗ The Middle-Upper Pajeú and the Poção Sub-Basins are among those with high urban
density indices (IDU_SAT).
Ṗ In large urbanized areas, such as Petrolina and Juazeiro, the IDU_SAT is, in a certain
way, diluted, given the magnitude of the Sub-Basin.
Ṗ Increase in urban concentration promotes an increase in water quality degradation, in
view of the disposal of pollutant loads (urban and industrial sewers).
Ṗ Irrigated areas with inappropriate ,management were the great sources of alteration in
water resources quality.
Ṗ Water quality evaluation supports administration and management actions viewing the
reduction of salinity and increase in productivity.
Ṗ In the Upper Salitre Region, in the rainy season, the dissolved salts content varied from
0.23 g/l, in a gushing well, to 1.87 g/l, in a lake downstream from an irrigated area.
Ṗ 24.65% of the Municipalities in the Middle-Lower São Francisco presented
groundwater with dissolved salt contents between 0.14 and 0.42 g/l, being classified as
fresh water. The other Municipalities presented a brackish water.
Ṗ The Sub-Basins with the greater loads of agrotoxics (Riacho Poção, Riacho das Graças
and Lower Sobradinho) are located in the surroundings of the greatest urban
concentration in the Region (Petrolina e Juazeiro).
Ṗ 54.1% of the Middle-Lower São Francisco Sub-Basin presents a high water deficit
index.
Ṗ The Water Sources Environmental Quality Index (IQA_Source) indicated that 81.4% of
the total volume of daily effluents disposed of by the registered potential pollution
sources are between 1 and 50 m3.
lxxiv
Ṗ 51.7% of the registered potential pollution sources disposes of the garbage directly in
the environment and 46.2% of them use the public collection service.
Ṗ 48.3% of the effluents discharged by the industries in the region contain water and
organic matter, followed by 24.1% containing water and chemical products (phosphates,
nitrates and carbonates), with 97.2% of them thrown directly in the environment.
Ṗ The final destination of sanitary sewers and of washing water (66.8% and 77%,
respectively) are discharged directly into open environments.
Economic Profile Index (IP_ECON)
Ṗ Only Petrolina presented an elevated IP_SOCI and only Juazeiro presented a high
index, while 89% of the other Municipalities presented low social conditions.
Social Profile Index (IP_SOCI)
Ṗ 97.8% of the Municipalities presented low IP_ECON, in view of the lack of basic
production and education infrastructure.
Water Usage Environmental Sustainability Index (ISA_WATER)
Ṗ The ISA_WATER allows the complete evaluation of a system composed by ecological,
social and economic profiles, inter-relating them and determining the degree of
sustainability of the water resources.
Ṗ Through the ISA_WATER, it was verified that 78% of the Municipalities of the
Middle-Lower São Francisco demand restrictive and mitigating measures in the short
run, while 11% of them require monitoring on the short run. For the others, it is
recommended an environmental education program.
Ṗ The ISA_WATER made evident a significant increase in the demand and the alteration
in the surface waters, due to agro-industrial and urban activities along the São
Francisco, in a 700 km stretch, from Pilão Arcado to Paulo Afonso.
Ṗ The ISA_WATER also highlighted the possible reason for the non-sustainable use of
the water.
Water usage sustainable monitoring
Ṗ The monitoring methodology developed based on the ISA_WATER allows the
environmental impacts corrective/mitigating actions to be taken at the time they are
detected.
Ṗ The courses for training water agents capacitated 400 individuals, who started to work
in their communities, viewing the protection of the available water.
lxxv
Ṗ The knowledge gained during the courses and the low cost tool for water quality
analysis (the Ecokit) were essential for the monitoring of the water resources.
Ṗ The use of multiparameter probes allowed the fast cadastration of large areas and faster
decisions for solving the identified problems.
Ṗ Of the 73 Municipalities in the Region, 56.16% presented good quality water, 28.77%
regular quality and 15% (Petrolina, Araripina and Macurure) one with bad quality.
Ṗ Of the 125 qualitative analysis for coliforms, in Petrolina and Juazeiro, 33.6% presented
total coliforms and 20.8% fecal coliforms.
8. RECOMMENDATIONS
8.1. GENERAL RECOMMENDATIONS
Ṗ It is recommendable to implement preventive and corrective measures againd salinity
and sodicity (soil correction, leaching and drainage, soil management, adequate
fertilizers use and identification of high levels of nitrate in the water sources).
Ṗ Project development in partnership with local institutions, for reclamation of salinized
areas.
Ṗ Development of alternative and low cost groundwater desalinization projects.
Ṗ Strengthening actions supporting small producers, particularly those using groundwater
for irrigation.
8.2. PROPOSAL FOR CONTINUATION OF ACTIVITY 1.4
OBJECTIVES
General Objectives:
Ṗ
Investigating the relation between the proliferation of noxious algi and their physical-
chemical characteristics, with emphasis on the iron and manganese dynamics of the
sources of domestic water supplies, in the Pajeú River Basin. This is aimed at proposals
for improving water quality. The measures must include adoption of selective water
intakes and means of controlling the occurrence of algi, specially in places without
alternative sources.
Ṗ
Aim at the replicability of the actions in other sub-basins in the São Francisco.
lxxvi
Specific Objectives:
Ṗ
Monitoring and evaluating physical-chemical parameters (chlorites, iron, manganese,
temperature, color, turbidity, pH, salinity, conductivity, dissolved oxygen, ammoniac
nitrogen, ortophosphate, total phosphor, nitrite, nitrate and silica).
Ṗ
Monitoring and evaluating parameters that charcterize the biologic community (A
chlorophyll and algi).
Ṗ
Identifying sources of nutrients.
Ṗ
Correlating quantitative and qualitative water parameters.
Ṗ
Establishing correlations among the changes in water quality and the activities carried
out in the Basin.
Ṗ
Establishing the difference between the dynamics of reservoirs free from incoming
polluting loads and those subject to polluting loads.
Ṗ
Assessing the influence of the physical-chemical and environmental characteristics in
the proliferation of the noxious algi found in the water bodies.
Ṗ
Implementing a participative water quality environmental monitoring system in the
Pajeú River Basin.
BUDGET (US$ 1,00)
SPECIFICATION
YEAR I
YEAR II
TOTAL
Consultants 53,400.00
55,400.00
108,800.00
Travels 20,889.00
20,889.00
41,778.00
Sub-total 74,289
76,289
150,578
Consumption materials
2,780.00
2,500.00
5,280.00
Permanent Material
56,438.00
61,800.00
118,238.00
Contingencies 1,466.00
1,500.00
2,966.00
Sub-total 60,684
65,800
126,484
Global Total
277,062.00
lxxvii