


INTEGRATED MANAGEMENT OF LAND BASED ACTIVITIES
IN THE SÃO FRANCISCO RIVER BASIN PROJECT
GEF/ANA/OAS/UNEP
Activity 1.1B Estuary Nutrient Load Determination and Assessment of
the Use of Artificial Floods on its Control
Executive Summary of the Final Report
NUTRIENT LOAD DETERMINATION IN THE ESTUARINE
ZONE OF THE SÃO FRANCISCO RIVER
Universidade Federal de Alagoas
Maceió - AL
INTEGRATED MANAGEMENT OF LAND BASED ACTIVITIES
IN THE SÃO FRANCISCO RIVER BASIN PROJECT
GEF/ANA/OAS/UNEP
Activity 1.1B Estuary Nutrient Load Determination and Assessment of
the Use of Artificial Floods on its Control
Executive Summary of the Final Report
NUTRIENT LOAD DETERMINATION IN THE ESTUARINE
ZONE OF THE SÃO FRANCISCO RIVER
Coordinator
Paulo Ricardo Petter Medeiros
Department of Geography and Environment
Consultants
Bastiaan Knoppers
Geórgenes Hilário Cavalcante Segundo
João Antônio Lorenzzetti
Rivaldo Couto dos Santos Júnior
Silvana Quintella Cavalcanti Calheiros
April 2003
NUTRIENT LOAD DETERMINATION IN THE ESTUARINE
ZONE OF THE SÃO FRANCISCO RIVER
EXECUTIVE SUMMARY
INTRODUCTION
Activity 1.1.B (Estuary Nutrient Load Determination and Assessment of the Use of Artificial
Floods on its Control) is part of Component I (Environmental Assessment of the Basin) of the
Integrated Management of Land Based Activities in the São Francisco River Basin Project
(GEF/ANA/OAS/UNEP), aimed at the sustainable development of the Basin. Its objective is the
identification and quantification of the degree with which the inland activities and river
regulation impacted the hydrology, the water quality (especially with respect to sediment and
nutrient transportation), fishing and the aquatic environment, in the whole system and in the
estuarine zone, in particular.
The São Francisco River has an extension of 2,700 km, and it headwaters is located in the Serra
da Canastra (MG). It crosses a long depression encrusted between the Atlantic Plateau and the
highlands of the Central Brazil, following a North-South orientation until the City of Barra, and
then turning towards the Northeast, until it reaches Cabrobó, when it inflects towards the
Southeast, flowing into the Atlantic Ocean.
Activity 1.1.B focused on the area between Propriá (SE) and Porto Real do Colégio (AL), at the
road-railway bridge, until the river's mouth in the Atlantic Ocean (Figure 1). Nutrient
concentration and physical and chemical parameters of the water were measured at the bridge, as
well as in the estuarine and adjacent coastal zone, zone to provide an estimate of nutrient load.
The Activity's objective is the characterization of the current nutrient load in the São Francisco
River, as well as it seasonal variation. The specific objectives include the following:
· Identifying the importance of the São Francisco River to the nutrient enrichment of the
adjacent coastal environment.
· Modeling the river's behavior and its effects on nutrient transportation, in the present
and future conditions.
This report is divided into six chapters covering from the characterization of the area under study,
interference of dams and flow regimes to the importance of the River to the nutrient enrichment
of the coastal zone.
1.
CHARACTERIZATION OF THE ESTUARINE ZONE
1.1. THE LIMNIC ENVIRONMENT
1.1.1. Hydrology and climate: Available flows and precipitations
i
In the São Francisco's estuarine zone, according to studies in the 1944-1988, a mean annual
precipitation of 1200 mm was estimated. The study emphasizes the great irregularities of the
annual rainfalls, with respect to the mean values of the years in the period. The highest annual
precipitation was verified in 1964 (2,339.8 mm) and the lowest one in 1973 (481.7 mm).
Figure 1. Location of the area under study.
According to Köppen's classification, the region's climate is warm and humid tropical, with a dry
season in the spring and summer, and a rainy season in the fall and winter, with rainfalls from
April to July, and temperatures from 17 to 28° C (Souza e Lima, 2000).
Figure 2 shows the variation in mean monthly flows at the City of Pão de Açúcar, for the period
of January of 1943 to February of 2002. It is noticed the occurrence periods with high flows,
followed by reductions in discharge. Gradually, it is noticed a decrease in the amplitude between
the maxima and minima peak flows. In 1948, the minimum flow was 1,395 m3/s, at the end of the
year, which was augmented to 12,967 m3/s, in the beginning of 1949. In 1994, the minimum
recorded flow was 2,029 m3/s and the maximum 3,009 m3/s, showing a drastic fall in the
amplitude, due to river regulation by the constructed dams.
ii
Figure 2. Variation in mean monthly flows at Pão de Açúcar (Jan.1943-Feb.2002).
Big floods, such as the ones in 1949, 1979 e 1992 probably will not be recorded again in the
Lower São Francisco Region, in view of the new operational policies of the National System's
Operator (ONS), which will determine an accumulation in the reservoirs, to assure the regulated
flow in the periods of low precipitations in the Basin.
1.1.2. Soil Use and Demography
A considerable part of the region is being used for agriculture and livestock rising. Agriculture
predominates in areas closer to the mouth of the River, where rainfall regime allows crops with
longer cycles, such as sugar-cane.
"Diversified Uses" and "Areas Prepared for Agriculture" classes, which represent anthropized
areas, together, amount to 48% of the whole Region. Among the natural covers, there is a
predominance of Open Caatinga, with occupation of 13% of the area (over 22% if the area
corresponding to the degraded dense caatinga is included). Agriculture and livestock rising also
present a significant percentage, in areas close to the coast.
1.1.3. Geology, soils and geomorphology
The Coastal Plains, with altitudes lower than 100 m, and the plateaus um the Barreiras Group,
with altitudes varying from 100 to 200 m, outstand in the Geology of the Lower São Francisco.
There are two types of vegetation predominating: The caatinga, in the highest sectors, and woods,
in the coastal region. The most important cities are Jeremoabo, in Bahia; Pesqueira and Bom
Conselho, in Pernambuco; Propriá and Nossa Senhora da Glória, in Sergipe; and Arapiraca and
Penedo, in Alagoas.
iii
The sedimentary part is essentially formed by the Tertiary (Barreiras Formation), by the
Quaternary (alluvia and dunes) and a little of the Cretaceous. The Barreiras Formation constitutes
the greater part of the sediments in the Southern sector of the region, forming plateaus that are
usually worked out by erosion. Composed of sandstones and sandy-clay sediments, sometimes
sandy or with pebbles, it presents greater thickness in the Southern part, which decreases towards
the South.
The Southern boundary, in contact with the Quaternary, forms a visible barrier in the landscape.
The Northern boundary, in contact with the Cretaceous or with the crystalline basement, is less
evident, especially in the Arapiraca area, where the plateaus of the Barreiras Formation and the
hills of the crystalline basement are undulated. In the areas covered by the valleys, near the
Northern boundary, the crystalline emergences are in considerable number.
Latosols and red yellow podzols predominate in the soils found in this formation. The Quaternary
forms the alluvia of the São Francisco, Perucaba and Piauí Rivers, as well as the mildly undulated
sand deposits of maritime origin (recent and old stationary dunes) or plains, of fluvial-maritime
origin, found near the Ocean.
The main soil types found in these formations are the diverse alluvial soils, quartzose sands and
podzols. The Cretaceous forms two small basins: The first one is located around Japoatã
(bounded by the Cities of Ladeira, Gravatá, Espinheiro, Visgueiro, Malhada dos Bois, Própria,
São Miguel and Pindoba). The second is located South of Igreja Nova, extending to Tabuleiro,
forming a long depression. The deposits are of diversified nature (sandstones, clays, sandy clays,
etc.), belonging to the Cretaceous Inferior.
In the geomorphology of the region under study, the dominant mountains around Santana do
Ipanema have noticeable elevations, reaching 800 m high, and descents in the order of 400 m. In
the whole, they form a solid block of homogeneous migmatites and granitoid rocks. Between
Girau do Poinciano and Traipú, quartzite crests emerge in the topography, reaching 200 m.
The crystalline plains have greater extensions in the Northwestern part of the region, being found
in the surroundings of Delmiro Gouveia. They present a very uniform undulated relief, marked
by hills with mild slopes and wide valleys, with elevation around 200 m.
The plateaus, composed by sediments of the Barreiras Group, are found between Penedo and
Arapiraca, being characterized by flat top elevations and scarped borders, diving mildly towards
the coast and the main rivers.
The fluvial-maritime and alluvial plains occur along the São Francisco River, from Penedo to the
Ocean. It presents a monotonous landscape, almost without noticeable unevenness, formed by
recent alluvial or Aeolian sediments and beaches.
1.2. ADJACENT ESTUARINE AND OCEANIC REGIONS
1.2.1. Estuarine Compartment
Estuaries are formed at the mouth of rivers, in the region bounded by the Ocean and the land. Its
form and extension are constantly being altered by erosion and sediment deposition, caused by
iv
the drastic impacts of the sea level oscillation (Dyer, 1997). The estuarine ecosystems may be
defined in various forms.
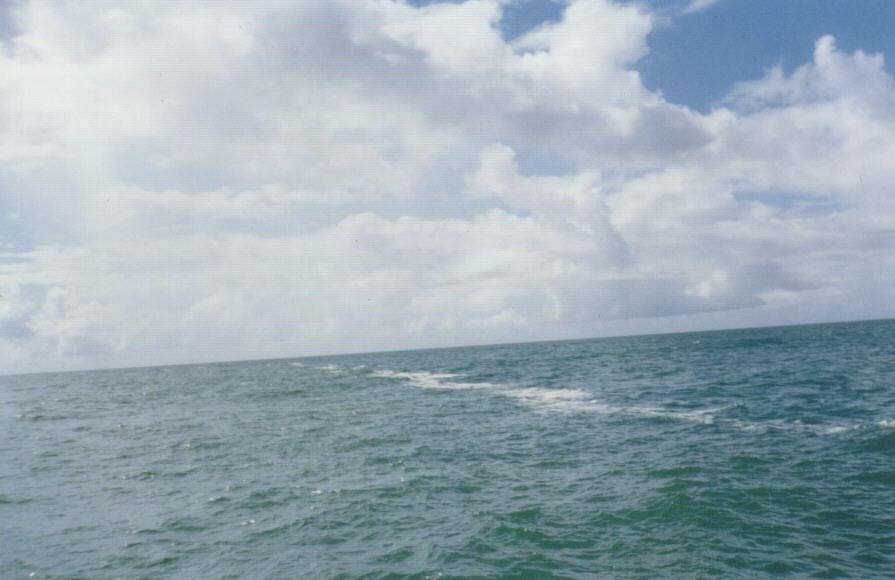
The most used and modified definition is that by Cameron & Pritchard (1963): "The estuary is a
semi-closed coastal water body with a free connection with the open ocean, where there is a
dilution of the maritime water in the fresh water produced by the continental drainage".
Picture 1. View of the estuarine compartment in the São Francisco River mouth.
1.2.2. Adjacent Coastal Compartment
The width of the Continental Platform in the adjacent coastal Region of the São Francisco varies
from 20 to 40 km, with gradients varying from 1:100 to 1:7,000. The margin of the Continental
Platform is located at a depth of 30 to 50 m. Sedimentation to the Northeast is constituted
essentially by carbonates, with predominance of fragments of calcareous algae (Halimeda sp.).
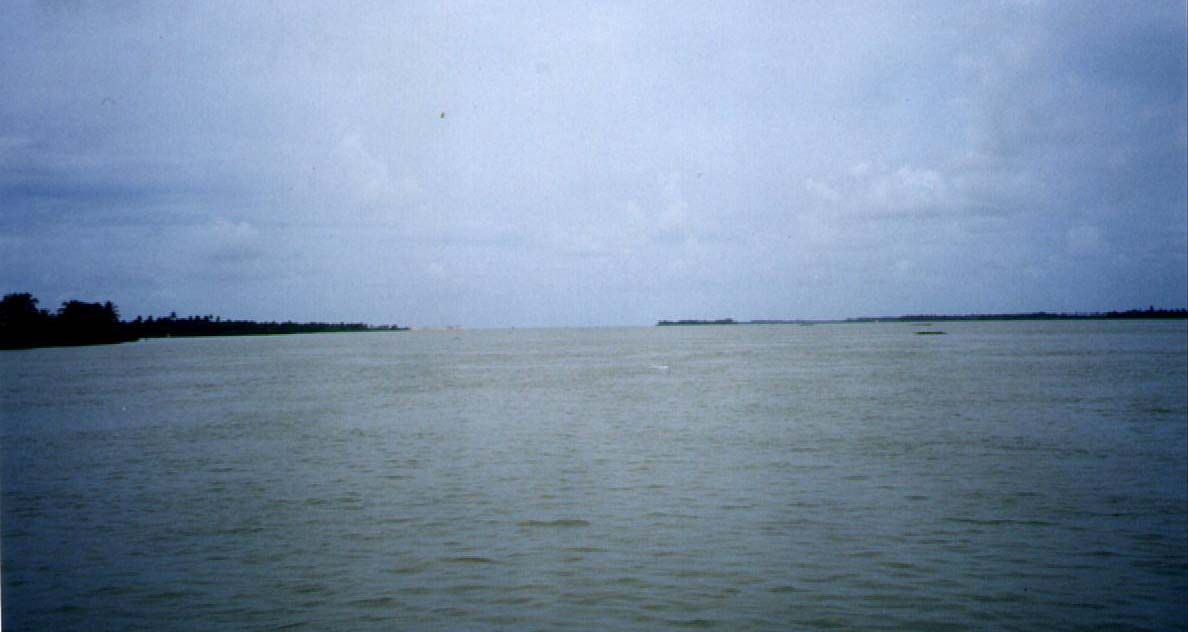
The coastal zone (Picture 2) is characterized by mesotides (during sizigia tides reach 2.6 m). The
São Francisco estuary presents semi-diurnal tides, two at the low tide and two at high tide, every
2 hours.
The waves' regime is one of high energy, with heights varying from 1.0 to 1.5 m (Dominguez,
1996). The wave pattern is determined by the winds, which depend on the movements of high
pressure centers. In Northeastern Brazil, NE and E-SE waves predominate throughout the year,
with the E waves achieving greater importance in the periods of January through May and
September through November. In the winter months, waves also occur in the South quadrant.
The Brazilian Current and the Northern Brazil Current are the main surface currents in the
Brazilian Continental Margin (Stramma, 1991 and Dominguez, 2000). They are originated the
South Equatorial Current, at 5° to 6° S latitudes, flowing towards South, with 50 to 70 cm/s.
v
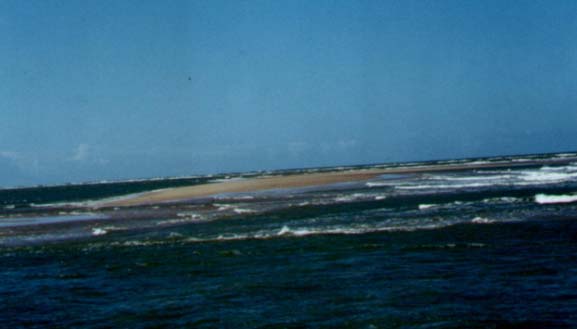
Picture 2. View of the Coastal Compartment of the São Francisco River.
2.
IMPACT OF DAMS IN THE RIVER, ESTUARY AND COASTAL ZONE
2.1. TYPES OF INTERFERENCE
Rivers convey material resulting from continental erosion, into estuaries and oceans. According
to Vörösmarty et al. (1997), sediment transportation from continents to oceans is a basic
characteristic of our planet's geology and biochemistry. Nevertheless, attempts to estimate the
magnitude of this global transportation is still an issue under discussion.
In addition to sediments, rivers transport important biogenic elements, such as nitrogen, phosphor
and silicates, both in organic and inorganic forms. Under natural conditions, rivers are basic
sources of those elements, to the Ocean.
The discussion over the impact of dams is of international (Loicz, 1994; Vorosmarty et al., 1994;
Hay, 1998; WCD, 2000) and national interest (Tundisi et al., 1998). Those structures impose
physical, chemical and biological changes in the water and in the deposited sediments, affecting
bio-geochemical processes in the rivers, estuaries and coastal ecosystems, in many ways. The
estuary metabolism and species migration patterns are examples of that. Other effect associated
with the construction of dams is the significant changes in the natural regimes of flows.
With respect to impacts of construction of dams, the Nile, the Ganges and the Danube Rivers
became known by the great losses in fishery resources, reduction in the primary fishing
productivity, decrease in nutrient loads, destabilization/erosion of the coastal line and saline
water intrusion in their deltas (Degens & Spitzy, 1983; Halim 1991; Sinha et al. 1996; Humborg
et al. 1997).
In the Volga's delta and in the Caspian Sea, it was noticeable the reduction in primary
productivity, increase in salinity and decrease in fish catches. In the Don River and Azov Sea,
there was increment in salinity and reduction in the native species' catches (Rosemberg et al.
1997).
vi
2.2. IMPLICATIONS OF DAMS IN THE SÃO FRANCISCO RIVER: FLOWS,
SUSPENDED MATTER AND CHEMICAL CHARACTERISTICS
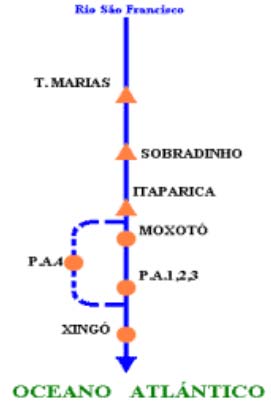
The sequential dams built in the São Francisco River (Figure 3) imposed significant changes in
the river's original conditions, such as flows and suspended matter.
Figure 3. Location of the large dams in the São Francisco River.
The disturbances created by the impact of the dams were neglected, in the scientific, social
economical and political level. In 2000, the GEF São Francisco Project was initiated, becoming a
pioneer in the consideration of those impacts.
The São Francisco River has a number of hydropower plants associated to its dams (Chart 1).
The impact of those plants on the conveyance of water and sediments to the Coast has not yet
been determined, but the data on the chart shows some tendencies.
Chart 1. Hydropower plants in the São Francisco River.
Hydropower plants
Year of operation Storage capacity (km3) River
reach
Três Marias
1962
19.00
Upper
Sobradinho 1980
34.00
Middle
Itaparica 1988
10.80
Middle
Moxotó (Apolônio Sales)
1977
1.20
Middle
Paulo Afonso (I aIV)
1954-1979
0.15
Middle
Xingó 1994
3.80
Lower
vii

3.
SAMPLING AND MEASUREMENT PROCEDURES
3.1. CONSIDERATIONS REGARDING SAMPLING FREQUENCY
Measurement of physical, chemical and biological parameters and collection of water samples
were made on a monthly basis, at the road-railway bridge between Propriá (SE) and Porto Real
do Colégio (AL), from November 2000 to March 2002, viewing the estimates of the nutrient
load.
Picture 3. Road-railway bridge between Propriá (SE) and Porto Real do Colégio (AL).
Measurements and sample collection in the adjacent estuarine and coastal zones were made in the
winter (June-September) and in the summer (June-September), in addition to two extra
collections.
3.2. SAMPLING METHODOLOGY AND IN LOCO MEASUREMENTS
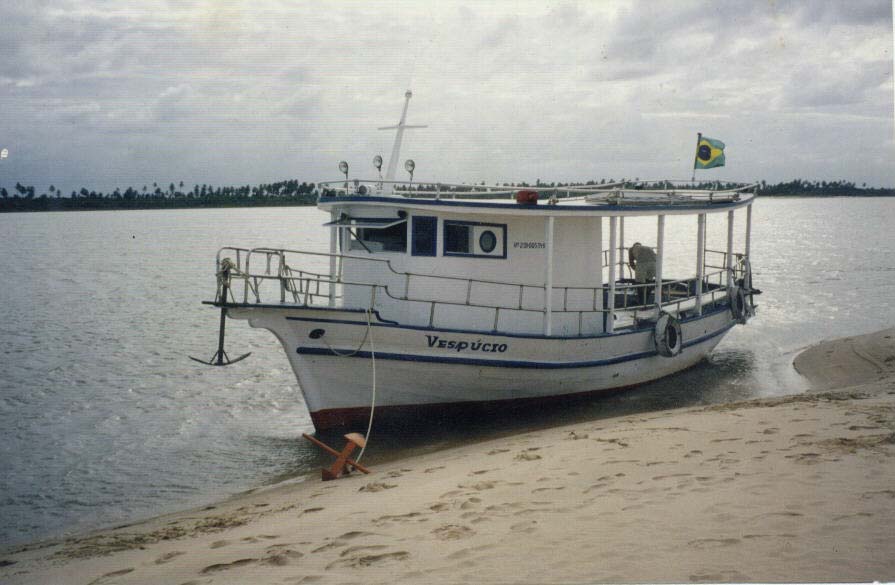
Water samples were collected with the use of a small fishing boat (Picture 4), in the River, as
well as in the estuarine and adjacent coastal zones.
Picture 4. Boat used for sample collection in the River and in the Ocean.
viii
Parameters measured in loco
The collected samples were analyzed in the Hydrochemical Laboratory of the Ocean and Natural
Sciences Integrated Laboratory, of the Federal University of Alagoas. The following parameters
were measured in loco:
Temperature
Using a WTW LF 193conductivimeter.
Salinity
With a WTW LF 193 conductivimeter and a YSI 6600 multi-
parametric probe
Electrical conductivity
With a WTW LF 193 conductivimeter and a YSI 6600 multi-
parametric probe
pH
With a WTW LF 193 pHmeter and a YSI 6600 multi-
parametric probe
Water transparency
Using a Secchi disk
Geographical coordinates All collection points were georeferenced, using a Garmin model
75 GPS.
3.3. SAMPLE STORAGE AND PRESERVATION PROCEDURES
Water samples for dissolved oxygen analysis were stored in DBO bottles, being fixed on the spot,
in accordance with Strickland & Parsons (1972). The samples nutrient content and suspended
matter were refrigerated for transporting to the LABMAR/UFAL's Hydrochemical Laboratory.
3.4. CHEMICAL PARAMETERS AND METHODOLOGY OF ANALYSIS
The measured parameters were:
· Ammonia
· Nitrite
· Nitrate
· Phosphate
· Total phosphor
· Silicate
· "a" Chlorophyll
· Dissolved oxygen
· Suspended matter
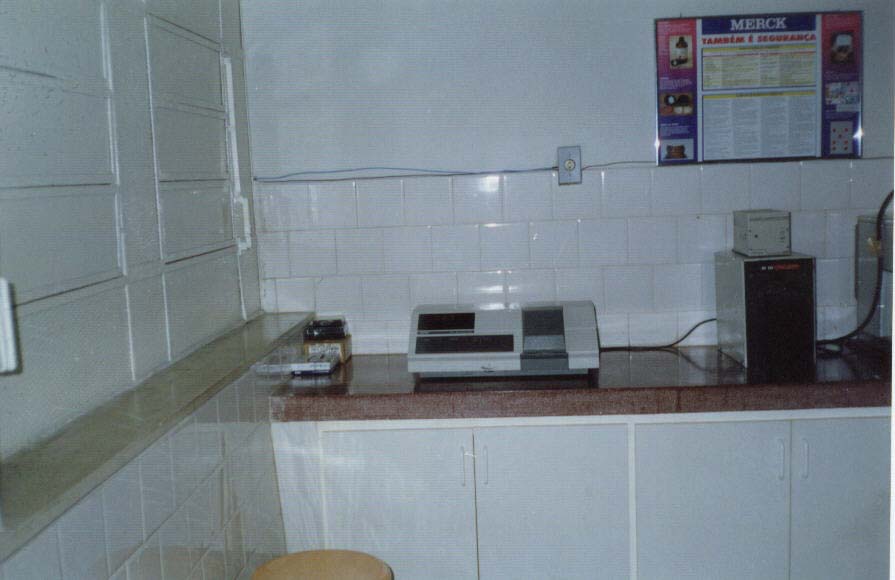
With the exception of the suspended matter (weighting) and dissolved oxygen (titulation), all
other parameters were measured with an UVI spectrophotometer (JENWAY, 6100 model).
3.5. ELECTRICAL
CONDUCTIVITY
Electrical conductivity is used for indicating the water capability of carrying electrical currents.
The concentration of electrolytes determines the capacity of carrying the electric currents through
dissociated ions (Schäfer, 1985). Thus, an increase in electrolytes decreases the resistance of the
aquatic solution to the flow of electrons, boosting its electrical conductivity
3.6. TRANSPARENCY
ix
From an optics viewpoint, water transparency may be considered the opposite of turbidity, being
defined as water's capacity to disperse radiation (Esteves, 1998). Assesment of transparency is
made in a simple way, with the use of a white 20 to 30 cm diameter disk (Secchi disk).
Picture 5. The UVI spectrophotometer.
3.7. pH
The pH is used for determining the concentration of hydrogen's ions, represented by the negative
base-10 logarithm of the ion concentration. In natural waters, the pH varies from 6 to 9.
3.8. NITROGEN
Nitrogen is one of the most important elements in the metabolism of aquatic systems, due to its
participation in the formation of proteins, one of the basic components of the biomass. a basic.
When in low concentration, it might be a limiting factor in the primary production of the aquatic
ecosystems (Esteves, 1998).
3.9. AMMONIA AND ITS DISSOCIATED FORM
Usually, it is presented in its dissociated form, in the dependence of the pH, under the ionic form
(NH +
+
4 ). Ammonia (NH3), along with its dissociated form (NH4 ), represents the primary stage of
oxidation of nitrogened organic matter. It is the preferred form of nitrogen assimilation by the
phytoplankton, as there is no need for reduction, as occurs with the nitrate.
3.10. NITRITE
The nitrite (NO -
2 ) has an important role in the oxidation of the ammonia. In the general balance
of the dissociated nitrogened compositions, due to their chemical instability, are usually found in
low concentrations, especially in oxygenated environments.
3.11. NITRATE
x
Nitrate (NO -
3 ) represents the last stage of oxidation of the nitrogen by nitrate , being also its most
chemically stable form and is considered the only thermodynamically stable stage of oxidation of
the nitrogen in the presence of oxygen (Grasshoff, 1983). Its concentration depends on the
availability of dissolved oxygen, as the micro-organism that oxidize nitrite by nitrate are aerobic.
The nitrate, along with the ammonia, are used as nutrient by the phytoplankton. In some aquatic
ecosystems, nitrate might be a limiting factor.
3.12. PHOSPHOR
According to Esteves (1998), the importance of the phosphor to biologic systems has been known
for a long time, given its participation in the primary processes of live beings' metabolism, such
as energy storage and cell membrane structuration.
3.13. P-ORTHOPHOSPHATE
It represents the main form of phosphate assimilated by the phytoplankton, and its measurement
is relevant to limnological studies. The ortophosphate ion (PO -3
4 ) may be present in H3PO4,
H
-
-2
-3
2PO4 or HPO4 forms, or in the ionic form itself (PO4 ). The presence and predominance of the
chemical types of these phosphate ions are a function of the aquatic environment's pH.
3.14 TOTAL
PHOSPHOR
(TOTAL-P)
The total phosphor, as the name implies, is the summation all forms of phosphor found in the
aquatic environment, corresponding to:
· Particulated inorganic phosphor (mineral and adsorbed to inorganic aggregates).
· Particulated inorganic phosphor (adsorbed to organic aggregates and that in the
composition of organisms).
· Total dissolved phosphor (orthophosphate, organic colloids and polyphosphates).
3.15. DISSOLVED SILICATE (SiO -4
4 )
According to Esteves (1998), the silica (SiO2) in the aquatic environment is originated from the
decomposition of aluminum silicate minerals (feldspat, for example), which are more
predominant in sedimentary rocks than in the magmatic ones. In the water, the silica might be in
three different forms:
· Soluble, in the form of ion SiO4-4;
· Colloidal silica; and
· Particulated silica, incorporated to the phytoplankton (biogenic silica, or SiO2) or to the
organic debris, in the form of quartz and silicate minerals in suspension, or even
adsorbed to organic and inorganic compounds.
3.16. "A" CHLOROPHILL
xi
Chlorophyll is a green pigment found in most colored plants, to support photosynthesis. It is also
found in the cytoplasm of the blueish-green algae and in the chloroplast of cells in superior
plants.
3.17. Suspended matter
It corresponds to the suspended particulated material in the water, due to the energy of the latter.
The water sample is passed through a pre-weighted filter, which is washed to remove the
hygroscopic salts (in the case of sea water), then dried up and re-weighted.
4. BEHAVIOR OF RIVER FLOWS AND THEIR IMPACT ON SEDIMENT AND
NUTRIENT TRANSPORTATION
4.1. MEASUREMENT
DATA
4.1.1. Measurement
sites
Measurements were made in the section at the bridge between Propriá (SE) and Porto Real do
Colégio (AL), in the São Francisco's estuary and adjacent Oceanic Region.
4.1.2. Precipitation and River Flows in the Period of Investigations.
The control exerted by the dams on the fluvial regime is evident, especially regarding the
reduction on the peaks of flows and in the amplitude between maxima and minima discharges, in
the period of study and in the historic series. During the Project's life, the variations in discharge
had different behaviors, as functions of the rainfall regime.
Analysis of Figure 4 shows that in 1999 the mean discharge was around 1,780 m3/s, which is
bellow the usual flow (2,200 m3/s). By the end of that year, discharge presented a slightly
increase,. Which was maintained during the year 2000, reaching values above the 2,200 m3/s.
Figure 4. Variation in mean monthly flows (Jan. 1999 Fe. 2002).
This reduction in fluvial regime is presented in Figure 5, where the decrease in rainfall
precipitation is verified, in São Romão (2001), beginning in June, with values bellow the average
for the Region.
xii
Figure 5. Mean monthly precipitations in São Romão (1999, 2000 and 2001).
4.1.3. Monthly variation in inorganic nutrients
The results ahead are mean values for water samples collected in the São Francisco River, at the
bridge between Propriá (SE) and Porto Real do Colégio (AL).
· Ammonia
Figure 6 shows the ammonia's variation with time, in the period of the study (around 1to 4
µmol/l). Even though there wasn't a clear pattern of change, three tendencies of increase in
concentration were verified in that period.
Figure 6. Variation in ammonia in the São Francisco (Bridge between
Propriá - Porto Real do Colégio).
· Nitrite
Figure 7 shows the variation in nitrite, in the period (0.03 1 to 0.9 µmol/l).
xiii
Figure 7. Behavior of the nitrite in the São Francisco at the bridge
between Propriá (SE) and Porto Real do Colégio (AL).
4.1.4. Temporal variation in suspended matter
Figure 8 presents the suspended matter's concentration (3 to 14 mg/l), with two tendencies to
increase.
Figure 8. Distribution of the variation of suspended matter in the São Francisco
4.1.5. Temporal variation of the "a" chlorophyll
Figure 9 presents the chlorophyll concentration (0.6 to 3,5 µg/l), also with clear concentration
increase tendencies.
xiv
Figure 9. Distribution of chlorophyll in the São Francisco, at the sampling section.
4.1.6. Temporal variation of the temperature
Figure 10 shows the variation in temperature, following the annual changes in air temperature.
Figure 10. Distribution of the temperature in the sampling section.
4.1.7. Temporal variation in pH values
Figure 11 shows the pH values in the period of study, with slight variation, from 7 to 8. There is
not a clear pattern of variation.
xv
Figure 11. pH distribution.
4.1.8. Temporal variation of the dissolved oxygen
Figure 12 shows the amounts of dissolved oxygen, varying from 6 mg/l (80 % of saturation) to
7.5 mg/l (94 %). It is noticed a tendency of oxygen reduction, by the end of 2001.
Figure 12. Distribution of dissolved oxygen.
4.1.9. Temporal variation of the electrical conductivity
Figure 13 shows that electrical conductivity varied from 70 to 140 µS/cm, presenting two
tendencies for increase, during the period of study.
4.1.10. Nutrient load
The load of nutrients and suspended matter was measures at the road-railway bridge between
Propriá (SE) and Porto Real do Colégio (AL) It was noticed there a central canal occupying
approximately half of the transversal section's area. A second and smaller canal is located in
sector III (vide Figure 14).
xvi
Figure 13. Variations in electrical conductivity.
4.1.11. Calibration and estimate of river flows
The stationary monitoring station locate at the bridge presents 19 reaches, a long one (VG) and
18 short ones (VP), whose sections were analyzed regarding flow area and velocity. Four of those
presented similar behavior, especially regarding compatibility and distribution of the sampling
points used in the campaign carried out from September 2000 to march 2002.
Figure 14. Transversal section of Propriá's stationary monitoring
station, in March 24 of 2002, showing the four sectors.
Samples were collected systematically in those four sectors. During the energy crisis (09/2001-
01/202), samples were not collected in the reaches 13 to 18, due to the low river stage. Sector IV
remained blocked by sedimentation.
xvii
4.1.12. Instantaneous Flow Model
Estimates of conveyance of material in a given river section involves two primary steps,
expressed by the following equation:
Fm = Cm x Q
Where Fm is the flow of material in the concentration (Cm) and Q the discharge. Usually the
magnitude of the different concentrations may be considered inferior to that of differences in
discharges, both along a transversal section and seasonally. In this manner, it might be assumed
that most of the involved errors and uncertainties will be propagated in the estimates of
transportation of material is related to estimates of river discharge.
4.1.13. Estimates of instantaneous Flows
The estimates of instantaneous flows used the above formula and the results were presented in
daily basis. Given the apparent lack of relation with the discharges, the flow of material are
presented by date of collection, in an attempt to better understand the processes of variation if
flows. The latter probably involve the power plants' reservoir operation dynamics, the bio-
geochemical processes resulting from the different operational levels in the reservoirs, the
magnitude of the seasonality induced by the energy crisis and the daily variations of discharges
from the Xingó Power Plant.
4.1.14. Comparison of Discharges
The differences observed between flows at Xingó and at the Propriá station (Figures 15, 16 and
17) reveal that there are no significant differences on a monthly scale. However, when observing
daily values, those differences become significative, given the spatial and temporal lags between
the stations and the great variability in the hourly controlled discharges from Xingó.
So, in the modeling of material transportation, it is necessary to use the flows from the Propriá
station. This is the first step in the development of transportation models in monthly and annual
scales. Nevertheless, the hourly releases through Xingó's turbines serves to identify one of the
main sources of uncertainty in the transportation modeling: The extreme variability in daily flows
in the São Francisco River, which may be as high as 25%.
A better view of the uncertainties in the use of flow data from Propriá is presented in Figures 15
and 16 (hourly releases from Xingó, flows at Propriá and the calibration point, in the months of
April and June of 2000).
However, a certain seasonal and inter-annual variability still remains, motivated by the cycles of
energy demands, in the seasonal, weekly and hourly scales, as indicated in Figure 17. The figure
compare turbined flows from Xingo with river discharges at Própria fluviometric station, from
January 1999 through February 2002, indicating a mean difference of 3.7 ± 3,0 %. In the case of
lack of data from Própria, one may, within this margin of error, use the mean monthly turbined
flows at Xingó, for estimating the load of material there.
xviii
Figure 15. Releases from Xingó, flows at the Propriá and on calibration day (April 2000).
Figure 16. Releases from Xingó, flows at the Propriá and on calibration day (June 2000).
2500
Comparação entre Xingó e Propriá
2000
)
/s31500
m
Xingó -CHESF
Propriá-ANEEL
z
ã
o (
1000
Va
500
Crise de energia
elétrica
0
0
1
00
0
0
00
00
0
0
0
0
0
01
0
1
01
01
1
0
1
0
1
v
/
0
0
/
00
v
/
0
1
/
01
jan/
fe
jul/00
jul/01
mar
abr/
mai/00
jun/
ago/
s
e
t/0
o
u
t/0
nov/
dez/
jan/
fe
mar
abr/
mai/01
jun/
ago/
s
e
t/0
o
u
t/0
nov/
dez/
Figure 17. Mean monthly flows in Propriá and at Xingó Power Plant.
xix
4.1.15. Estimates of monthly loads
The monthly flows and the mean value for the sampling period, obtained by interpolation of the
instantaneous flows, are presented in Figures 18 and 19, for the silicate, nitrate, ammonia,
phosphate and total phosphor flows. The behavior of the suspended matter flows reflected the
operation of the Xingo Power Plant in the stages prior to the energy crisis, during the crisis and
during reservoir recovery (see Figure 18).
Figure 18. Mean monthly flows and the mean for the period of study, for suspended matter
(obtained by the method of extrapolation).
In the stage preceding the energy crisis, the flows of suspended matter presented an increasing
behavior, with a maximum in April of 2001, given the greater discharges for the national power
supply. After May of the same year, when the reservoirs started to present critical levels, the
energy crisis occurred, creating a new stage of low flows and discharges, until the end of the
year.
In the recovery period (January through March of 2002), the flow of suspended matter augmented
to levels above those of the pre-crisis period, probably due to the reduction in the time of
permanence of the water in the reservoir, to the increased flow, in relation to the lower volumes
during the crisis and also to the erosion of the river bed downstream from the power plant.
The flows of silicate (Figure 19) presented a behavior similar to that of the suspended matter. The
maximum silicate flows during the pre-crisis stage was observed in December of 2000, with
approximately 64,000 ton/month. The flows are decreasing until May of 2001 (about 22,500
ton/month). After November 2001 (61,500 ton/month), the silicate flows augment abruptly,
reaching a maximum of 71,000 ton/month, in March 2002.
Clearly, the silicate flows are influenced not only by the power plants' reservoirs operation and
levels, but also, and probably in a stronger way, by the process of weathering and reservoir
cycles. Usually, the reservoirs act as sink points for the silicate, due to the primary production of
silicate consuming phytoplanktonic organisms, the diatomaceous (Ittekkot et al., 2001).
xx
However, the decrease in supply of silicate due to weathering, caused by the lower precipitations
in the pre-crisis and crisis periods, by the physical and chemical changes motivated by the
variation in the time of permanence of the water and of the material, as well as by the exposure of
the sediments to the spillways, impairs a precise interpretation of this nutrient's behavior.
Figure 19. Mean flows and the mean for the period of study, for silicate.
Deeper investigation of this nutrient's behavior into the reservoirs, as well as a balance between
its assimilation and dissolution, are required for its better understanding.
The flow of the main dissolved nitrogened forms (nitrate and ammonia Figures 20 and 21)
reveals a significant reduction in the magnitude of the summation of those forms, after May of
2001. That is probably due to the flow reduction in the pre-crisis period. Other noticeable aspect
in the flow of nitrogened forms is the reversal of the predominance of nitrate flows (pre-crisis) to
ammonia flows (crisis and recovery periods).
Figure 20. Mean flows and the mean for the period of study, for nitrate (in tons of nitrogen
per month)
xxi
Figure 21. Mean flows and the mean for the period of study, for ammonia (in tons of
nitrogen per month)
This reversal occurs in a more evident way in the months of October through December of 2001,
during the low flows imposed by the energy crisis, being justified by the modification of the bio-
geochemical processes in the reservoirs. Those processes include an increase in the time of
permanence, the decomposition of organic matter and re-mineralization. Other factors, such as
the increase in contribution of material, by aquiculture and by domestic sewers, downstream from
the Xingo Power Plant, must be taken into account. Similarly, those processes might be
responsible for the drastic increase in the flow of forms of phosphor, after October 2001 (Figures
22 e 23).
Figure 22. Mean flows and the mean for the period of study, for phosphate (in tons of
phosphor per month)
4.1.16. Flow behavior with respect to concentration.
The relations concentration versus discharge might provide an indication of the behavior of the
material in the different sampling stages. However, those relations must be impaired, as in the
xxii
present study. The existence of several dams imposed different flow management procedures.
Therefore, no relation was detected between the measured parameters and the discharges, during
the utilization of linear and log-linear correlation models.
Figure 23. Mean flows and the mean for the period of study, for total phosphor (in tons of
phosphor per month)
4.1.17. Comparison of Models
Model outcomes were analyzed with respect to the use of data from September 2000 through
March 2002 () and for the energy crisis period, from April 2001 through March 2002 (1), to
test the best adjustments of the correlations between discharges and flows of material, in view of
the influence of the variability imposed by the crisis. Chart 2 describes the comparisons, based on
the following definitions:
· Summation of all data (): Represents the summation of all the instantaneous flows,
for each parameter, from September 2000 through March 2002,.
· Summation of data ():Represents the summation of all the instantaneous flows, for
each parameter, only for the energy crisis period (09/2000-03/2002).
· Percent differences between observed and estimated summation values (Difference
%1): Represent the difference between the sum of the number of observed data
(instantaneous flows) and the number of data obtained with the correlation models (re-
transformed or direct log), for each parameter. Those differences are indication of the
adjustments in the correlation models, in longer time scales (annual or longer).
· Mean percent differences between observed and estimated values (Difference %2):
Represents the average of the differences between the observed value in each campaign
and the value estimated by the correlation model (re-transformed or direct log), for each
parameter. Those differences are indication of the adjustments in the correlation models,
in shorter time scales (monthly or daily).
xxiii
Comparison of the summation of the analyzed data, for each parameter, in the use of the direct
correlation model, presents smaller percent differences (0 to 4.7 % - Difference %1, in Chart 2),
than the obtained with the re-transformed log correlation (0 to 7.8% - Difference %1). This was
verified in the data analysis for both periods.
In a general way, the re-transformed log correlation model obtained better results for the
differences (between 9 e 460 % - Difference %2) than the direct correlation (9.9 to 570 %).
Nevertheless, the differences in each case were extremely high, indicating the little adjustment of
the curves to the observed data. The best results for the differences between estimated and
observed values (Difference %2), were obtained in the adjustments for the crisis period. Those
differences came out greater in the analysis of the summation data (Difference %1).
Chart 2. Comparison between the summation of the raw data (observed) and the
correlations (estimated) for suspended matter (SM), silicate, phosphate and
nitrate, corrected by the smearing estimator.
Estimated
Data (n)
tons
Re-transformed log correlation
Direct correlation
tons
Dif
%1
Dif %2 tons
Dif
%1
Dif %2
SM
12306
12340
+ 0,3
+ 24,8
12329
+ 0,2
+ 26,2
Si04
24733
24765
+ 0,1
+ 12,9
24753
+ 0,1
+ 13,4
NO -3
115
120
+ 4,2
+ 550
116
+ 0,8
570
PO -3
4
30,4
30,1
- 0,8
+ 255
30,4
0,0
+ 280
SM
9205
9283
+ 0,8
+ 14,4
9219
+ 0,2
+ 13,8
Si04
15907
15970
+ 0,4
+ 9,0
15938
+ 0,2
+ 9,9
1
NO -
3
71,5
66,0
- 7,8
+ 460
71,9
+ 0,4
+ 415
PO -3
4
28,4
26,4
- 7,2
+ 230
29,8
+ 4,7
+ 200
= Summation of all data (n= 18, except for SM with n= 17)
1 = Summation of data just during the energy crisis period (n= 13, except for SM with n= 12)
Dif %1 = Percent differences between the observed and estimated summation values
Dif %2 = mean percent difference of the observed and estimated data (negative values indicate that estimates
were lower than observed data)
The equations obtained for the crisis period were applied to all the periods of the study, in an
attempt to evaluate the behavior of the correlation model with data not perfectly adjusted to it.
This strategy revealed that the re-transformed log model tends to be more robust when using data
that are not adjustable to the discharge - flow of material relation described by the model. It
xxiv
suggests that the model is more appropriate to forecasts, with a greater series of data. It is not
recommended for use with a restricted number of data, as in this study.
5. IMPORTANCE OF THE SÃO FRANCISCO RIVER TO NUTRIENT AND
SEDIMENT ENRICHMENT OF THE OCEANIC ENVIRONMENT
5.1. SATELLITE IMAGES OF THE SÃO FRANCISCO'S MOUTH AND ADJACENT
COASTAL ZONE.
Satellite images were obtained, with the objective of helping in the evaluation of the influence of
the São Francisco River, in terms of contribution with sediments to the adjacent coastal zone.
Initially, an attempt was made to obtain images taken in the same dates of the collection of
samples in the Ocean. Unfortunately, they were not available, because of excessive cloud
coverture at the time the saatellite passed by. However, they were obtained for approximate dates,
with descriptions of the respective ocean conditions (tides, surface winds, etc.).
5.2. LANDSAT DIGITAL IMAGES PROCESSING TO SUPPORT THE STUDY OF
SUSPENDED SEDIMENTS
5.2.1. The LANDSAT System and the suspended sediment detection algorithm
The LANDSAT satellites present a series started in July 1972, with the launching of the first
satellite, the ERTS (Earth Resources Technology Satellite). They were designed primarily for
collecting multispectral orbital data from agricultural, Forest, geological and oceanic targets. The
spatial and spectral resolutions and the re-visiting time were optimized for terrestrian targets.
Specially for oceanic scenes, where the dynamics involve shorter temporal scales (from few
hours to days), the 18 to 16 days re-visiting time does not represent ideal conditions. Each
LANDSAT image corresponds to a185 km x 185 km on Earth. The orbit's inclination angle is
around 99º, with relation to the Equator. Due to this inclination, the orbital plan presents a
precession synchronized with the Earth's movement around the Sun, along the year. Orbital
altitude varied from 917 km, for the first LANDSAT, to 705 km for the LANDSAT 4, 5 and 7.
Considering the sediment load in the river plumes, the strong vertical stratification is another
complicating factor. The turbid upper layer might be relatively shallow and abruptly separated
from the lower layer of clear oceanic water. In other cases, if the water velocity is too low, the
sediment particles will be progressively precipitating.
In such cases, the turbid layer might be maintained bellow the surface layer. When the turbid
layer is above the clear water, the sediment concentration estimated by the TM-2 band algorithm
might be lower than the actual value, as it is contained in a greater layer, including the clear
water. Given that light penetration in the 660 m strata is smaller, under equal conditions, the TM-
3 band algorithm might provide a more realistic concentration for the turbid layer (Tassan, 1997).
The Activity's Coordination proposes an analysis of the ratio of the estimated sediment
concentrations for the two bands, in order to decide each one should be used. Thus, if S3/S2 > 1
xxv
(turbid water bellow the surface layer), the TM-3 band algorithm should be used. Otherwise, the
TM-2 band should be preferred.
5.2.2. LANDSAT's digital images processing for estimating sediment concentration
The following Figures 24, 25, 26 e 27 present LANDSAT images obtained in the closest dates to
the sample collection dates (10/02, 17/06 and 19/09, in 2001, and 26/01/2002). In all the figures,
the lines on the water are the 10, 20, 50 e 200 m isobathymetric lines.
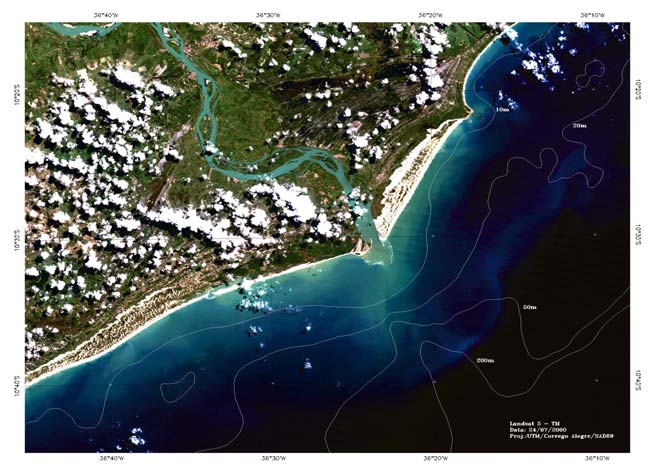
Figure 24. LANDSAT TM image sub-scene, orbital point 214/67 (São Francisco River
mouth). Date: 07/24/2000, at 12:06:40 GMT. RGB color composition (TM 3,2,1).
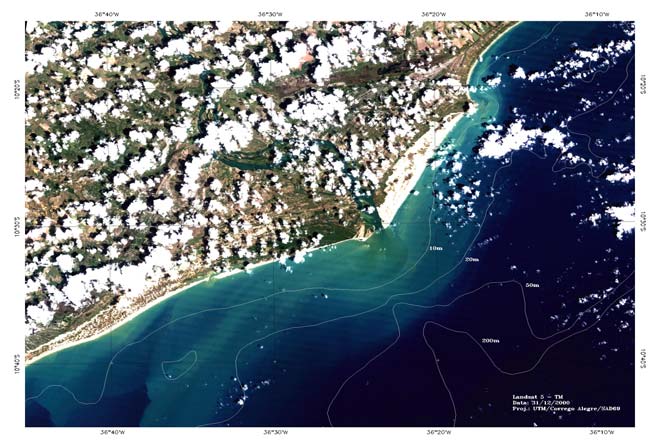
Figure 25. LANDSAT TM image sub-scene, orbital point 214/67 (São Francisco River
mouth). Date: 12;/31/2000, at 12:09:16 GMT. RGB color composition (TM 3,2,1).
xxvi
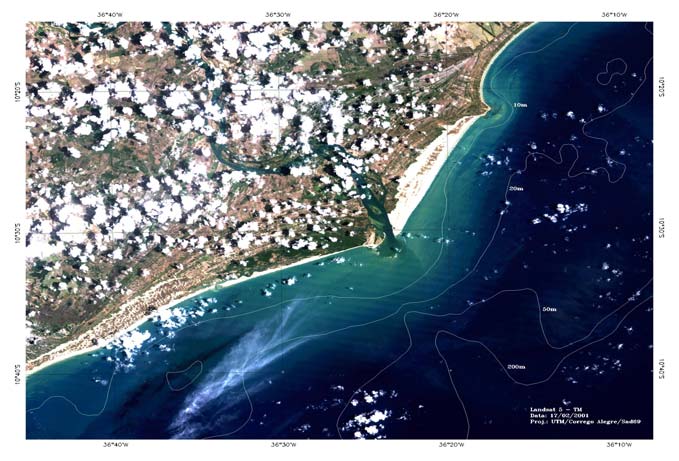
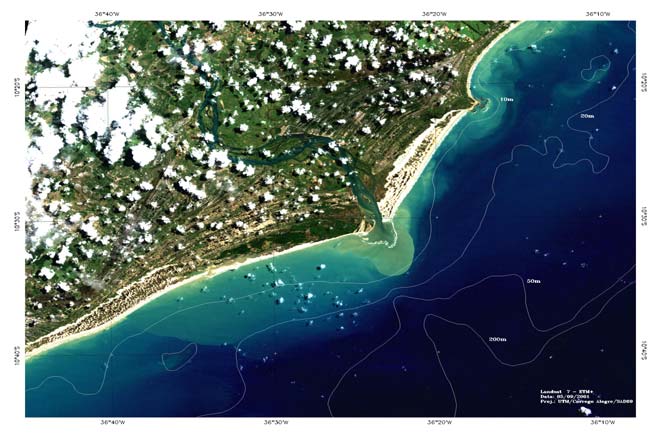
Figure 26. LANDSAT TM image sub-scene, orbital point 214/67 (São Francisco River
mouth). Date: 02/17/2001, at 12:09:36 GMT. RGB color composition (TM 3,2,1).
Figure 27. LANDSAT TM image sub-scene, orbital point 214/67 (São Francisco River
mouth). Date: 09/05/2001, at 12:18:09 GMT. RGB color composition (TM 3,2,1).
5.2.3. Converting reflectance into suspended sediments
Analysis of the image obtained in 12/31/2000 (Figure 28) allows visualizing of the concentration
of suspended matter in the river's mouth, in view of the small transported load. In Figure 29, it is
evident the significant concentration of suspended matter in the River, after the high tides.
xxvii
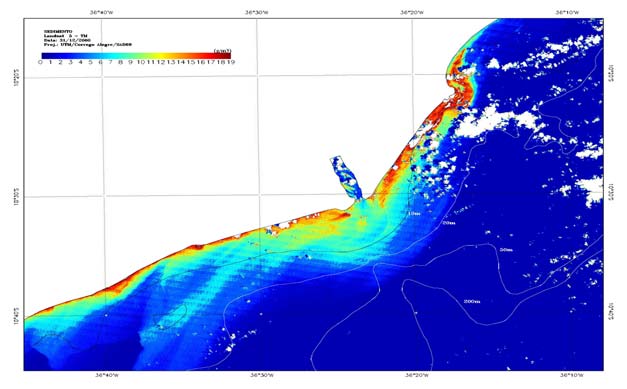
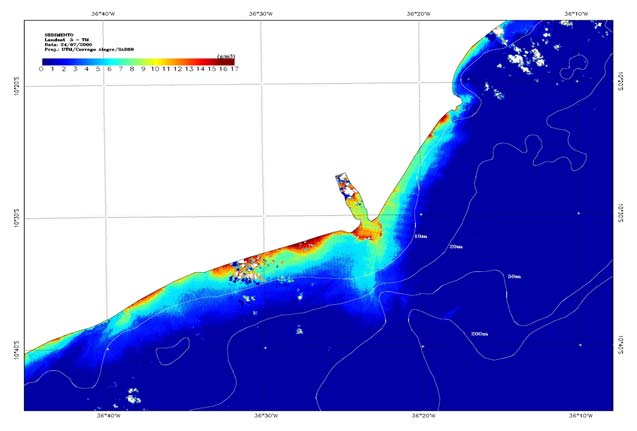
Figure 28. Concentration of suspended sediments in the sea (g m-3), obtained
from Landsat TM2 data, in 12/31/2000.
Figure 29. Concentration of suspended sediments in the sea (g m-3), obtained
from Landsat TM2 data, in 07/24/2000.
5.2.4. Assessment of the logarithmic algorithm
The assessment of the two logarithmic algorithms proposed by Tassan (1987) was made by
comparing, for three dates, the means and Standard deviations of the suspended sediments
concentration, with values from several boxes chosen from the processed images, from the same
sampled areas in the field. It is important to emphasize that these comparisons are not absolute, as
dates of sample collection differ, by a few days, from that of the images.
xxviii
The results shown in the previous charts indicate that the mean and standard deviation values
estimated from the satellite images, using the logarithmic model, are compatible with the
observed values. These outcomes lead to the supposition hat the data obtained by satellite might
be used for extrapolating data from field measurements, for all the regions adjacent to the São
Francisco River mouth.
5.3. SPATIAL AND TEMPORAL DISTRIBUTION OF THE PHYSICAL, CHEMICAL
AND BIOLOGICAL PARAMETERS AT THE COASTAL REGION
5.3.1. Elaboration of the base map, selection of collection dates and georeferencing of
collection points.
The georeferenced points and the variables to be spatialized correspond to collections made on
February 10th, June 17th, August 22nd and September 19th of 2001 and Juanuary 26th of 2002.
The UTM (Universal Transversa Mercator) transformation process used linear interpolations of
coefficients tabulated by the FIBGE (1995).
The mapping was transposed to overlays and digitalized, producing TIF files (gray shades, 8-bit,
non-compacted), with 75 dpi resolution (maps in a 1:100,000 scale). With these specifications,
they were inputed in the SAGA (Geo-Environmental Systems Analysis), the GIS adopted for the
present work, for posterior editing and georeferencing. It is important to state that prior to the
digitalization, compatibilization procedures were applied (such as attributing UTM coordinates to
the location points and verification of the data), viewing the consistency of the data (Carvalho
Filho, 1995; Carvalho Filho & ABDO, 1999).
The adopted system (AGA, version 4.04), developed by the Geoprocessing Laboratory, of the
Geography Department of the Universidade Fedearl do Rio de Janeiro, operates in DOS and
Windows environments, with capture and storage structures in raster format. It is composed of
three basic modules: Assembly, Vectorial Tracer and Environmental analysis (only the first two
were used in the present work).
5.3.2. Mapa base e plotagem dos pontos de coleta
The georeferencing was limited by the kilometric coordinates (UTM) in the module presented in
the bottom left corner (8822000 N e 764000 E) and top right corner (8852000 N e 788000 E),
assuring the insertion of the other digital charts (nitrate, silicon, chlorophyll, suspended matter
and salinity) in the international UTM network. Thus, a 600x480 (288,000 pixels) matrix was
defined.
After selecting the collection dates, the sampling points were plotted in the base map of São
Francisco River mouth, for spatially distributing the results, afterwards.
5.3.3. Spatially distributing the results
After preparing the Base Map and georeferencing the collection points, lines connecting points
with equal contents of nitrate, salinity, silicon, chlorophyll and suspended matter were drawn.
The results for some of the variables, in selected sample collections, are presented ahead, for
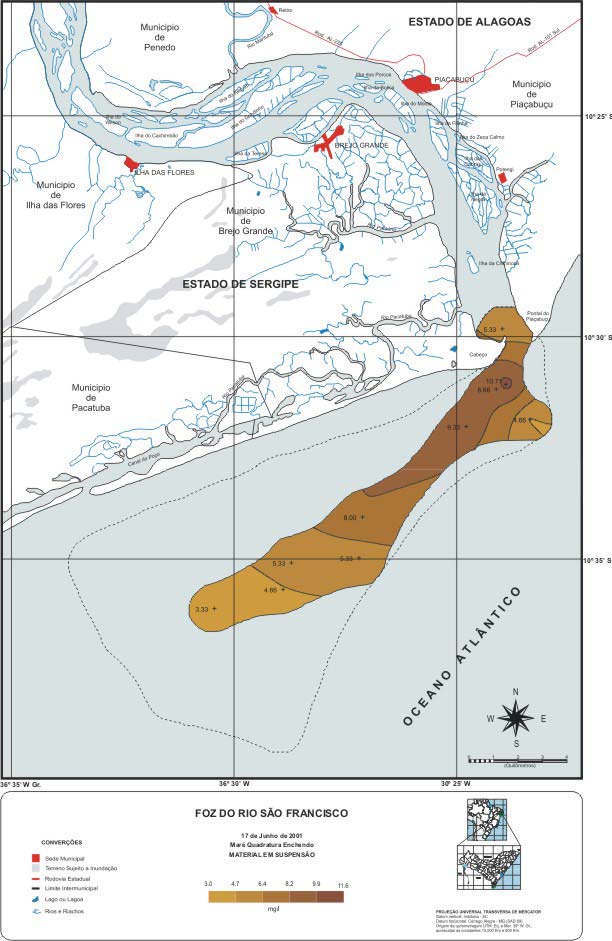
suspended matter, nitrate and chlorophyll.
xxix
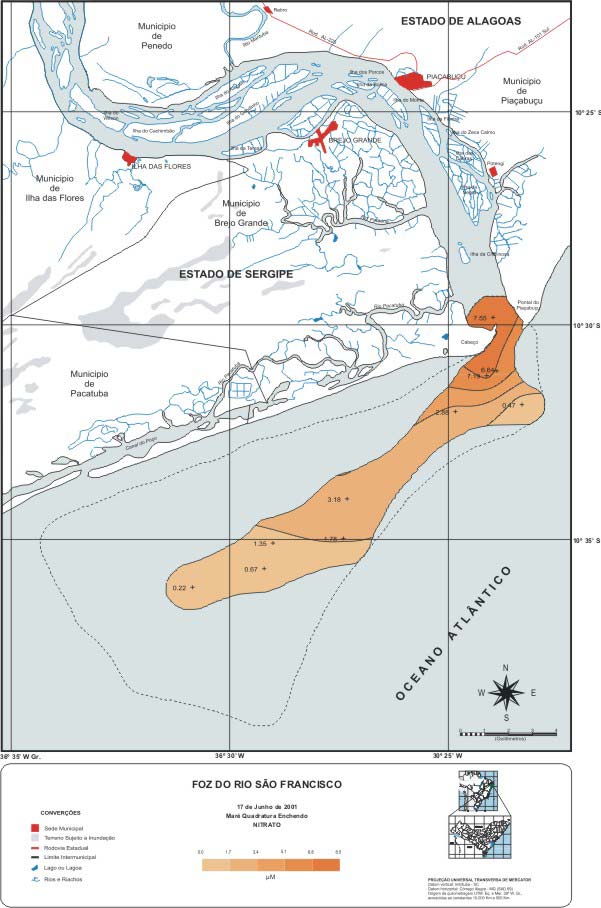
· Nitrate
Figure 30 allows visualization of the quick dilution of the nitrate after the river discharge into the
Ocean. Nitrate concentration at River's mouth was around 7.55 µM. In less than 20 km, it fell to
1.35 µM.
Figure 30. Nitrate distribution in the mouth of the São Francisco, on 06/17/2001.
xxx
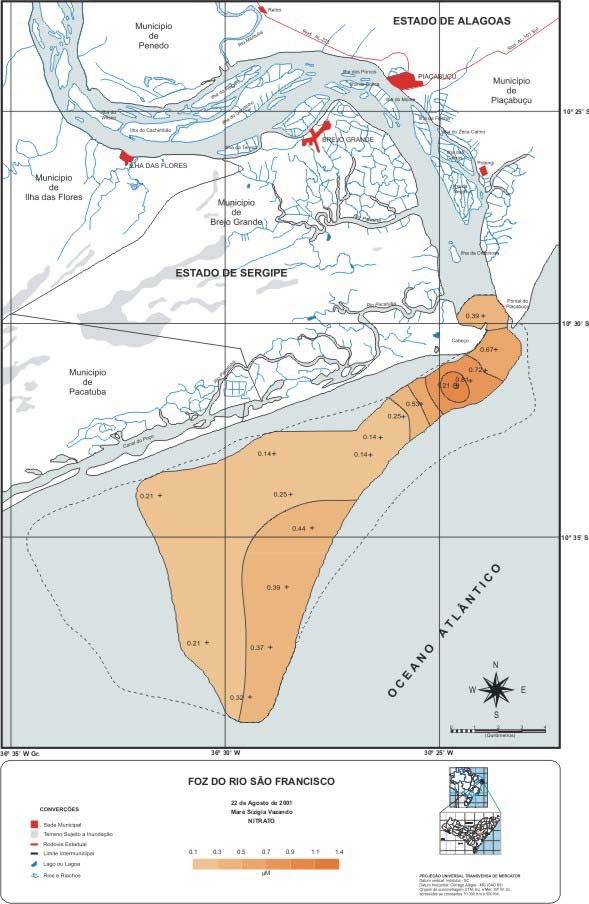
Figure 31. Distribution of the nitrate in the River's mouth, on 08/22/ 2001.
· Chlorophyll
In Figure 32, concentration of chlorophyll, near the River's mouth, is between 0.67 and 0.72 µM,
dropping drastically in around 20 km.
xxxi
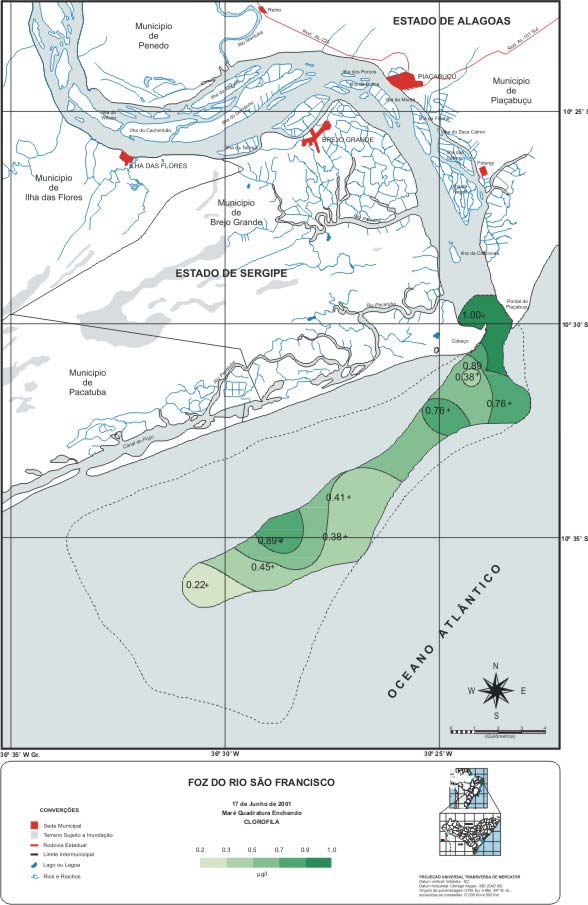
Figure 32. Distribution of chlorophyll in the River's mouth, on 06/17/ 2001.
Figure 33 shows the lower concentration of chlorophyll in the River's mouth and its reduction as
it gets away from it (probably caused by re-suspension processes and by the shortage of
nutrients).
xxxii
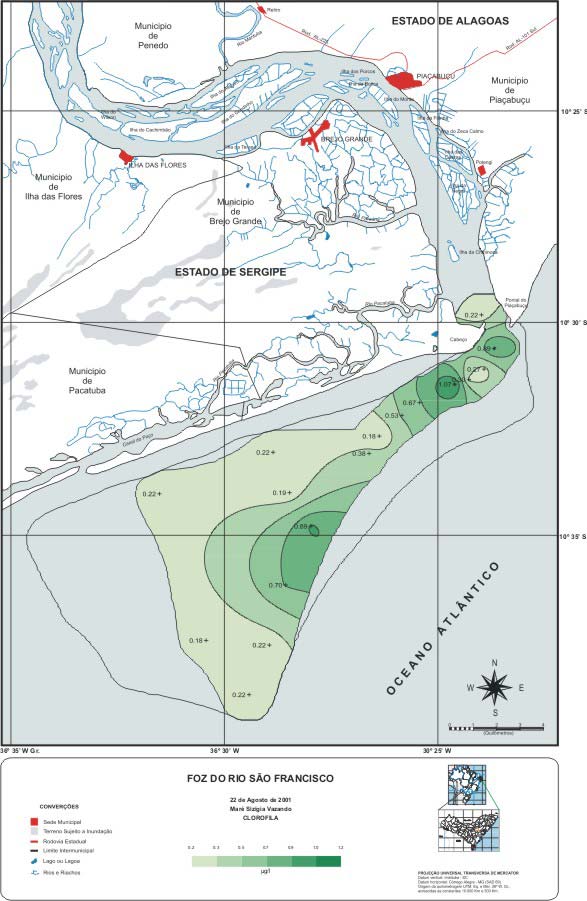
Figure 33. Distribution of chlorophyll in the River's mouth, on 08/22/01.
· Suspended matter
In Figures 34 and 35, it is noticeable the low concentration of suspended matter in the River's
mouth (around 5.5 mg/l). Immediately after it, there is an increase in concentration, up to 10.71
xxxiii
mg/l. This increase is due to action of the waves and tide currents, which promote the re-
suspension of the bottom sediments. These results match the interpretation of the satellite images,
which indicated a lower concentration of suspended matter in the River, in comparison with the
estuarine region.
Figure 34. Distribution of the suspended matter in the River's mouth, on 06/17/2001.
xxxiv
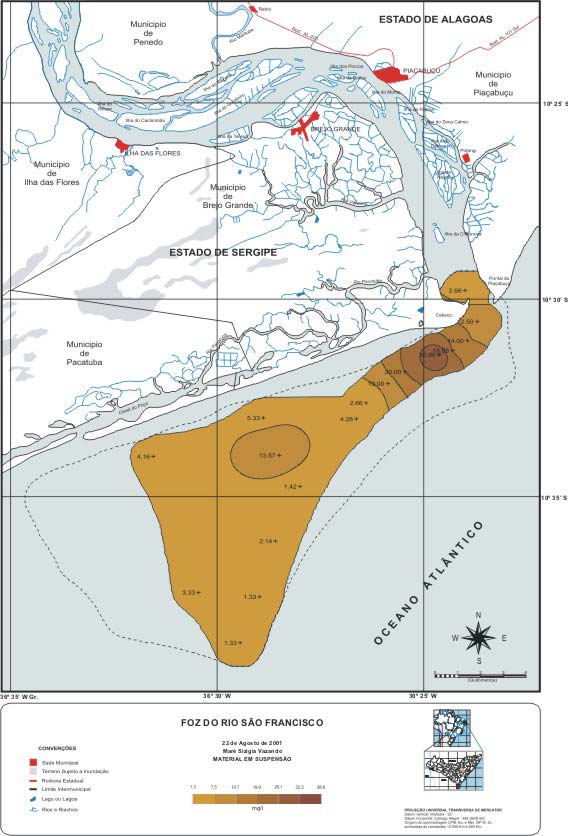
Figure 35. Distribution of the suspended matter, on 08/22/2001.
5.4. APPLYING THE MIXTURE MODEL TO THE ESTUARY
In the case of the São Francisco River, with regulated flow and retention of material at Xingó
Power Plant's reservoir, close to the coast, the boundary conditions for applying the mixture
model were altered, in comparison to the standards of several rivers in the Eastern Coast. The
current conditions reflect, mostly, the smaller differences in the content of material in the fluvial
xxxv
and maritime sources and smaller shifting dynamics and extension of the estuarine mixture zone.
Additionally, monitoring was made during an atypical period, in view of the energy crisis, which
determined different behaviors, regarding flow and discharges of suspended matter and nutrients.
5.4.1. Analyzed Sampling Campaigns
Mostly, the Stationary Monitoring Station (P1), located in the inner part of the River's mouth,
presented low salinity in the surface, during the receding tides (S=0 to 5) and higher salinity
during the rising tides (S=5 to 20). The collection point at the bridge, by the City of Piaçabuçu,
12 km from the mouth, presented, at all occasions, zero salinity. Under sizigia tides' conditions,
during the energy crisis, displacement of the estuarine mixture zone occurred in the first 10 km
from the Ocean.
5.4.2. Boundary conditions of the material from fluvial and maritime sources
Comparison of the sources reveals conditions of extremely low contents for most of the
parameters of fluvial source (Propriá's Fluviometric Station) and at the mouth (Stationary Station
-P1). The content of suspended matter, at the stationary station, oscillate from 5 to 10 mg/l, from
0.5 to 2 µg/l for the "a" chlorophyll, from 2 to 10 mmol/m3 for nitrogened dissolved inorganic
nutrients and from 0.05 a 0.5 mmol/m3 for the phosphor. Silicate was the exception, presenting
extremely high content in the river water (Si04-Si = 200 to 650 mmol/m3). All those parameters
had their content augmented during the final stages of recovery from the energy crisis (topic 6.5).
During the four sampling campaigns, concentrations in the maritime water did not vary, with the
exception of the silicate (Si04-Si = 5 to 20 mmol/m3) of the nitrate (NO3-N = 0.1 to 2 mmol/m3),
in the June of 2001 and August of 2002 collections, within the same platform of the river source.
According to the parameters' contents in the maritime water and to the analysis of the ratio
between temperature and salinity in the water, there was no fertilization of nutrients originated
from local resurgence.
5.4.3. Suspended matter
The suspended matter in the estuarine/plume mixture zone in the São Francisco presented a non-
conservative behavior, with gains of matter in the fluvial and maritime sources, in the four
campaigns (vide figure 37). The June and August of 2001 and the February of 2002 campaigns
presented identical behaviors campaigns, in 2001, as indicated by the convex curve, in
comparison with the ideal dilution line. The greatest increment in suspended matter along the
mixture zone occurred from S=10 to 25, located in the first 10 km from the river's mouth. An
exception to the unimodal pattern was registered during the September of 2001 campaign,
characterized by two matter gaining sectors (S=2 to 10 and S=26 to 35).
Based on the temperature versus salinity graph (Figure 37), for all the grouped samples, it was
possible to identify the presence of the tropical water mass. It consists of warm and saline water
on the surface of the Tropical South Atlantic, brought by the South-Equatorial Current,
transported South, by the Brazilian Current. It is characterized by temperatures above 20ºC and
salinity over 36. It is an oligotrophic oceanic current, indicating the high potential of those edge
currents for diluting coastal matter. Knoppers et al (1999) consider it as one of the reasons for the
low suspended matter content and the low productivity in Eastern Brazil.
xxxvi
Figure 36. Mixture diagrams: Salinity versus suspended matter (SM), in the four
campaigns in the estuarine mixture zone.
Figure 37. Grouped data temperature and salinity (Medeiros, 2003).
xxxvii
5.4.4. "A" Chlorophyll
The contents estimated in the four campaigns along the estuary gradient and into the Ocean
varied from 0.2 to 2.0 µgCl.a/l, indicating a low phytoplanktonic biomass and oligotrophic
conditions in the Region. The total phosphor content, which was analyzed but not presented in
this section, confirms the oligotrophic condition of the coastal waters.
During the campaigns, the "a" chlorophyll presented a non-conservative behavior, with a loss
(concave curve) relative to the ideal dilution theoretical line (IDTL), in the June and August of
2001 and in the February of 2002 collections.
A loss in "a" chlorophyll relative to the IDTL indicate a limitation in the primary productivity in
the estuarine mixture zone, being caused by numerous physical, chemical and biological factors.
The September of 2002 collection revealed a gain in "a" chlorophyll in the 2<S<10 and
26<S<35.5. The bi-modal curve indicates more favorable conditions, concerning availability of
light and nutrients, among other. This fact must have boosted the primary phytoplanktonic
productivity, close to the mouth and at the limit of the coastal plume and the oceanic waters.
5.4.5. Silicate
Of all the registered inorganic nutrients, only the silicate presented a conservative behavior. Even
though it presented the greatest load of all, this load is quickly diluted by the oligotrophic oceanic
waters. This mass of water is brought by a ramification of the Brazilian Current and is efficient in
diluting the load of nutrient.
5.4.6. Nitrate, Phosphate and the N:P Ratio
The other nutrients (nitrate, ammonia and phosphor) presented a non-conservative behavior,
meaning loss or incorporation of as a result of chemical, physical or biological processes.
Analysis of the nitrate isolines, shown on concentration maps, indicates a fast reduction in
concentrations, relative to the mouth pf the São Francisco River.
5.4.7. Intrusion of the Saline Tongue
Regarding the intrusion of the saline tongue, the results shown in Figure 38 indicate that the
greatest intrusion occurred in 06/17/2002, getting close to Piaçabuçu (15 km from the Ocean),
even though with a small salinity (0.1). This intrusion was associated with a rising tide and a low
river discharge. In the other collections, penetration of the saline tongue never exceeded the 10
km past the stationary station (considered the zero mark, located in the mouth).
5.4.8. TS Diagram (temperature versus salinity)
In order to identify the different masses of water in the area under investigation, temperature and
salinity results from the sampling collections were grouped in a TS diagram. From its analysis, it
is possible to detect the presence of coastal waters and surface tropical waters.
6. THE INFLUENCE OF THE SÃO Francisco RIVER IN THE COASTAL REGION
The period covered by this work does not include a complete hydrologic year with a "normal"
mean annual discharge, in the years after operation of the Xingó Power Plant. However, the
xxxviii
drastic increase in suspended matter content (silicate and phosphate), between October of 2001
and March of 2002, in the recovery stage, compensated for the impoverishment during the most
critical times of the energy crisis. The total annual load of suspended matter and silicate, from
September/2001 to August/2002, for example, was 252, 807 tons, for the first, and 451,874 tons
for the second. For the April/2001 March/2002 cycle, the annual loads were 277,479 tons and
483, 355 tons, respectively.
Figure 38. Intrusão da cunha salina na superfície e fundo do Estuário do São Francisco.
The loads and contents in the São Francisco River, considered a medium to large river, is inferior
to that of several rivers in the Eastern Brazil Coast, relatively to their drainage areas (Souza,
2002).
Milliman (1975) estimated the mean values for suspended matter in the São Francisco around the
70 mg/l, with an annual load of 6.9 million tons. Santos (1993) estimated, for the 1984/85
hydrologic year, mean values equivalent to 2.7 mg/l and annual load of 2.1 million tons (Chart 3).
Mean values 4.74 mg/l were determined in this work, for the November/200-October/2001
hydrologic year. The load of suspended matter for that year was estimated around 0.228 million
tons, also bellow the historic values. Comparison with Milliman's for 1970, they are 24 times
smaller. When compared to the 1984/85 year, they are seven times smaller.
xxxix
Chart 3. Comparison of verified data (collected) with historic series.
Current work
Santos (1984-85)
Milliman (1970)
Variable
(Nov.2000 Oct.2001)
tons
tons
tons
Silicate
448 x 103 650
x
103 -
Dissolved nitrogen
3.98 x 10³
69.6 x 10³ -
Dissolved phosphor
0.23 x 10³ - -
Total phosphor
1.16 x 10³ - -
Suspended matter
0.228 x 10⁶
0.21 x 10⁶
6.9 x 10⁶
With reference to the São Francisco River's mouth and adjacent coastal region, the four available
images show that, in general, greater concentrations of suspended sediments are found in a
continuous strip close to the coast and in waters with depths smaller than 10 m.
The presence of great sediment concentrations in regions far from the river's mouth, such as the
ones observed in the December/2000 and September/2001 images, suggests that they are not
related to river discharge, but might be related to a re-suspension of bottom sediments. The latter
process might be caused by the turbulence resulting from winds and tides, in the shallow zones
close to the coast.
The diagram of nutrient mixture versus salinity confirms the results of the spatial distribution, the
fast dilution of the nutrient load by oceanic waters. This is verified even with a relatively big load
of nutrients, a in the case of the silicate, which suffers severe dilution from the mouth up to 20
km in the Southern direction.
7.
CONCLUSIONS
· The monthly flows of water, suspended matter and nutrients permitted the characterization of
three stages of transport, along the period of study. An initial stage, with flows characterizing
its regime after the operation of Xingó's power plant, a second stage induced by the energy
crisis, with remarkable reduction in discharges, and the final stage, the recovery. The impact
of operation during the energy crisis was evident, on the chemical characteristics of the São
Francisco River.
· Considering the magnitude of its drainage Basin, the São Francisco presented small loads of
suspended matter and nutrients. The only exception was the silicate, compatible with that of
similar rivers. Chart 33 presents a comparison with the Paraíba do Sul River, whose drainage
Basin is significantly inferior (less than 10%, in area), with greater specific discharge (load /
drainage area), for all the analyzed parameters.
xl
Chart 33. Monthly means of analyzed parameters, obtained by the
extrapolation method. Comparison with monthly means
from the Paraíba do Sul River.
São Francisco Paraíba do Sul
Parameter
(634,000 km²)
(55,000 km²)
ton/month
Suspended matter
21,850
46,695
Silicate 41,012
Nitrate 198
811
Ammonia 104
46
Phosphate 49
15
Total phosphor
201
102
· The São Francisco River has suffered a considerable reduction, along the time, in its
concentration and total load of suspended matter and inorganic dissolved nutrients (Chart 34).
Chart 34. Comparação dos dados encontrados com os dados pretéritos disponíveis
Current work
Santos (1984-85)
Milliman
Variable
(Nov.2000 Oct.2001)
(1970)
tons
tons
tons
Silicate 448
x
106
650 x 103 -
Dissolved Nitrogen
3.8 x 10³
69.0 x 10³ -
Dissolved phosphor
0.3 x 10³ -
-
Total phosphor
1.6 x 10³ -
-
Suspended matter
0.228 x 10⁶
0.21 x 10⁶
6.9 x 10⁶
· The suspended matter presented a gain along the estuarine mixture zone. This behavior
resulted from the re-suspension process and erosion of bottom material, in the coastal zone,
caused by the waves and tide regime. Analysis of the available images show the greater
concentrations of suspended sediments are usually found in sectors close to the coast, in
shallow waters (depth smaller than 10 m). With exception of the September/2001 image, the
xli
pattern of sediments observed in the region is diffuse, not in form of plume, with a noticeable
sediment front. It is worth emphasizing the low concentrations in the River, by its mouth.
· Except for the silicate, which presented a conservative behavior with regard to the ideal
dilution theoretical line, all other parameters presented, in most occasions, a non-conservative
behavior.
· The suspended matter and nutrient impoverished nature was reflected in the degree of fertility
in the Lower São Francisco, in the estuary and in the waters of the Continental Platform. Low
productivity oligotrophic conditions were verified in those compartments. However, in the
estuarine zone, oligotrophy is also promoted by the efficient dilution of the river water by the
oligotrophic oceanic currents.
8. RECOMMENDATIONS
· Proposed Action: Assessment of aquiculture as a mechanism of changes in the water
quality in the São Francisco River and estuarine zone.
· Proponent: Universidade Federal de Alagoas UFAL.
· Participating Institutions: UFAL/IMA(GERCO)/IBAMA/CODEVASF.
· Antecedents:
The here proposed Project consists in an extension of the chemical investigations carried
out by Activity 1.1.B, with the continuation of some procedures, such as assessment of
loads, and the introduction of new ones.
Aquiculture, especially pisciculture, is in fast expansion in the Lower San Francisco,
presenting itself as a subsistence activity for fishing communities, in view of the decline
in fishery productivity. It also appears as an economic activity suitable for exploitation
on industrial level, in large scale.
Despite presenting a series of positive social and economic factors, aquiculture may
impose significative changes in water quality. According to Macintosh & Phillips (1992
a), intensification of aquiculture may, in addition to increasing organic matter and
nutrient content in the environment, promote the occurrence of other residuals that may
affect water quality, such as chemicals and antibiotics. Thus, it may polute the
environment.
· Justification:
The São Francisco River, upstream from Xingó, presents low nutrients concentration.
Aquiculture could augment nutrients load and concentration, contributing for the
enrichment of the adjacent coastal zone, augmenting its fertility. However, an excessive
increase in nutrients could result in an eutrophication process, changing the River's state
from oligotrophic to eutrophic. Results obtained in this study may be transposed to other
parts of the Basin, or to other river basins.
· Objectives:
xlii
· Determining the impact of aquiculture, in temporal and spatial terms, on the water
quality in the San Francisco River and estuarine region.
· Determining the current levels and ratio of phosphor enrichment in the sediments
in areas of pisciculture.
· Providing support to State and Federal environmental organisms, viewing the
classification and environmental zoning of aquiculture activities.
· Continuing with the assessment of nutrient and suspended matter loads in the San
Francisco River and estuarine zone.
· Carrying out additional investigation on the phytoplankton and zooplankton.
· Project duration and implementation: The Project, with a 2-year duration, will be
implemented by a team of consultants, technicians and UFAL professors.
· Budget:
Costs Total
(US$)
Donor Institution
40.000
UFAL's counterpart
80.000
Total: 120.000
xliii