E1288
v 6
Public Disclosure Authorized
Regional Environmental
Assessment (REA)
for
Public Disclosure Authorized
Manila Third Sewerage Project
February 11, 2005
(Revised Draft)
Public Disclosure Authorized
Public Disclosure Authorized
Manila Water Company, Inc.
Manila, Philippines
Regional Environmental Assessment
1
Introduction.......................................................................................... 1-1
1.1 Background ................................................................................................. 1-1
1.2 Environment ................................................................................................ 1-1
1.3 Public Health ............................................................................................... 1-2
1.4 Fisheries and Ecosystems........................................................................... 1-2
1.5 Tourism ....................................................................................................... 1-2
1.6 Economic Impacts ....................................................................................... 1-3
1.7 Moving Forward........................................................................................... 1-3
2
Background to the Regional Environmental Assessment ............... 2-1
2.1 Objectives of the REA ................................................................................. 2-1
2.1.1 Steps in the Conduct of a REA............................................................. 2-1
2.2 Scope of the REA........................................................................................ 2-2
2.2.1 Wastewater Management Component ................................................. 2-2
2.2.2 Sludge and Septage Management ....................................................... 2-3
2.3 Regional Planning Integration ..................................................................... 2-4
3
Overview of the Adopted Region ....................................................... 3-1
3.1 Regional Sub-Basins................................................................................... 3-1
3.2 Topography ................................................................................................. 3-2
3.3 Vulnerability to Flooding .............................................................................. 3-2
3.4 Land Use..................................................................................................... 3-3
3.5 Regional Flow Regimes............................................................................... 3-3
3.5.1 Wet and Dry Season Flow Variation..................................................... 3-3
3.5.2 Tidal Influence on Laguna Lake ........................................................... 3-4
3.6 Groundwater ............................................................................................... 3-4
3.6.1 Confined Aquifers................................................................................. 3-4
3.6.2 Unconfined Aquifers............................................................................. 3-5
3.7 Sources of Water Pollution.......................................................................... 3-5
3.7.1 BOD5.................................................................................................... 3-5
3.7.2 Suspended Solids ................................................................................ 3-6
3.7.3 Pathogens and Indicators..................................................................... 3-7
3.7.4 Nutrients............................................................................................... 3-7
3.7.5 Persistent Pollutants............................................................................. 3-8
3.7.6 Solid Waste.......................................................................................... 3-8
3.8 Population ................................................................................................... 3-8
4
Baseline Conditions ............................................................................ 4-1
4.1 Terrestrial Environment ............................................................................... 4-1
4.1.1 Terrestrial Flora.................................................................................... 4-1
4.1.2 Terrestrial Fauna.................................................................................. 4-3
4.1.3 Air Quality............................................................................................. 4-3
4.1.4 Noise.................................................................................................... 4-3
4.2 Water Quality .............................................................................................. 4-3
4.2.1 Background.......................................................................................... 4-4
4.2.2 Existing Monitoring Programs............................................................... 4-4
4.3 Review of Water Quality Monitoring Datasets ............................................. 4-6
4.3.1 Possible Testing Anomalies ................................................................. 4-7
4.3.2 Possible Data Anomalies...................................................................... 4-7
4.4 Interpretation of Water Quality Data............................................................ 4-8
4.4.1 Seasonality and Correlation ................................................................. 4-8
4.4.2 Sampling Frequency ............................................................................ 4-8
4.4.3 Sampling Time and Tidal State ............................................................ 4-8
4.4.4 River Flow Data.................................................................................... 4-9
4.4.5 Replication ........................................................................................... 4-9
4.5 Summary of Water Quality Data.................................................................. 4-9
4.5.1 Overview .............................................................................................. 4-9
Draft
i
9:41 AM 02/09/05
Regional Environmental Assessment
4.5.2 Utility as a Baseline .............................................................................. 4-9
4.6 Aquatic Ecology......................................................................................... 4-10
4.6.1 Plankton ............................................................................................. 4-10
4.6.2 Soft-Bottom Benthos .......................................................................... 4-10
4.6.3 Fisheries, Types of Aquatic Life and Other Uses................................ 4-12
4.7 Socio-Economics....................................................................................... 4-13
4.7.1 Population, Density, and Land Area ................................................... 4-13
4.7.2 Income ............................................................................................... 4-13
4.7.3 Health................................................................................................. 4-15
4.7.4 Economy ............................................................................................ 4-16
5
Existing Water, Sewerage and Septage Management Facilities ..... 5-1
5.1 Water Supply............................................................................................... 5-1
5.2 Sewerage .................................................................................................... 5-1
5.2.1 Other Systems ..................................................................................... 5-5
5.2.2 Private Sewerage System in the MWCI Concession Area.................... 5-5
5.3 Sanitation Facilities ..................................................................................... 5-6
5.4 Regional Issues in Relation to Sewage Management.................................. 5-7
5.5 Historical Infrastructure Investment Pattern................................................. 5-8
6
Policy and Institutional Framework ................................................... 6-1
6.1 Overview ..................................................................................................... 6-1
6.2 Land Use Planning and Zoning ................................................................... 6-1
6.3 Sewerage and Sanitation ............................................................................ 6-2
6.3.1 Sanitation Code.................................................................................... 6-3
6.3.2 Clean Water Act ................................................................................... 6-3
6.3.3 Other Legislation .................................................................................. 6-4
6.4 Mandates in Sewerage Management .......................................................... 6-4
6.5 Institutional Recommendations.................................................................... 6-5
6.5.1 Relative Priority of Wastewater Services.............................................. 6-5
6.5.2 Connection to Public Sewerage Systems ............................................. 6-6
6.5.3 Project Financing ................................................................................. 6-6
6.5.4 Low Willingness to Pay and the Lack of Sanctions............................... 6-7
6.5.5 Monitoring of Compliance to Existing Laws .......................................... 6-7
6.5.6 MTSP Impacts on Existing Private Septage Haulers ............................ 6-8
6.5.7 IEC on Health Impacts of Wastewater.................................................. 6-8
6.6 Summary..................................................................................................... 6-9
7
Generic Wastewater Management Alternatives ................................ 7-1
7.1 Background ................................................................................................. 7-1
7.1.1 Total Wastewater Management Schemes............................................ 7-1
7.1.2 Supplementary Wastewater Management Strategies........................... 7-1
7.2 Disposal to Water........................................................................................ 7-1
7.2.1 Discharge to Freshwater or Lakes........................................................ 7-1
7.2.2 Discharge Treated Effluent to Estuaries............................................... 7-2
7.2.3 Piped Ocean Discharge ....................................................................... 7-3
7.3 Application to Land Options......................................................................... 7-3
7.3.1 Irrigate Lahar Affected Areas ............................................................... 7-3
7.3.2 Hinterland Irrigation .............................................................................. 7-4
7.4 Recycling Options ....................................................................................... 7-4
7.4.1 Indirect Potable Reuse ......................................................................... 7-4
7.4.2 Direct Potable Reuse ........................................................................... 7-4
7.5 Supplementary Options ............................................................................... 7-4
7.5.1 Dual Reticulation .................................................................................. 7-5
7.5.2 Irrigate Parks and Sports Fields with Treated Effluent.......................... 7-5
7.5.3 Industrial Re-use .................................................................................. 7-5
7.5.4 Special Uses and Commercial.............................................................. 7-6
Draft
ii
9:41 AM 02/09/05
Regional Environmental Assessment
7.5.5 Ground Water Recharge ...................................................................... 7-6
7.6 On-Site Systems ......................................................................................... 7-6
7.6.1 Treatment Upgrades ............................................................................ 7-6
7.6.2 On-Site Disposal................................................................................... 7-7
7.7 Collection System Options ........................................................................... 7-8
7.7.1 Common Effluent Drainage Systems.................................................... 7-8
7.7.2 Modified Common Effluent Drainage ..................................................... 7-8
7.7.3 Conventional versus Combined Sewers ................................................ 7-9
7.7.4 Reticulation Summary ........................................................................... 7-9
7.8 Waste Minimisation Options ........................................................................ 7-9
7.9 Flood Flow Manipulation............................................................................ 7-10
7.10 No Project Option ................................................................................. 7-10
7.11 Comparison of Options .......................................................................... 7-11
8
MTSP Framework ................................................................................ 8-1
8.1 Introduction ................................................................................................. 8-1
8.2 Background Summary................................................................................. 8-3
8.3 Concessionaire Sewerage and Sanitation Obligations ................................ 8-3
8.3.1 JICA Master Plan Study ....................................................................... 8-5
8.3.2 MWCI First Wastewater Strategy Plan, 2000 ....................................... 8-5
8.4 Experience from Ongoing Projects.............................................................. 8-6
8.4.1 MSSP Community Sanitation Project (MCSP)...................................... 8-6
8.4.2 MSSP-4................................................................................................ 8-6
8.4.3 Pateros Sewer System ......................................................................... 8-6
8.5 Specific Implementation Difficulties ............................................................. 8-6
8.5.1 Land Availability and Cost .................................................................... 8-7
8.5.2 Community and Traffic Disruptions ...................................................... 8-7
8.5.3 Enforcing Sewerage Connections ........................................................ 8-7
8.5.4 Tariffs................................................................................................... 8-7
8.5.5 External Factors ................................................................................... 8-8
8.6 Rate Rebasing ............................................................................................ 8-8
8.7 Project Development ................................................................................... 8-9
8.7.1 Land Availability ................................................................................. 8-10
8.7.2 Applicable Concepts........................................................................... 8-10
8.7.3 Social Acceptability ............................................................................ 8-10
8.8 Selection Criteria and Methodology........................................................... 8-10
8.8.1 Availability and Land Criteria .............................................................. 8-10
8.8.2 Catchment Area Selection.................................................................. 8-11
8.8.3 Health/Environmental Impact ............................................................. 8-11
8.8.4 Financial and Economic Considerations............................................. 8-11
8.9 Overview of the Manila Third Sewerage Project ....................................... 8-12
Draft
iii
9:41 AM 02/09/05
Regional Environmental Assessment
9
MTSP Integration into Other Regional Projects................................ 9-1
9.1 Existing Projects.......................................................................................... 9-1
9.1.1 Manila Second Sewerage Project (MSSP) ........................................... 9-1
9.1.2 Pasig River Rehabilitation Project Sanitation Component ................. 9-1
9.2 MWCI Master Plan ...................................................................................... 9-2
9.2.1 Reasons for Selection of Alternatives................................................... 9-2
9.2.2 Description of Variations Between Alternatives .................................... 9-3
9.2.3 Comparisons Between Specific Alternatives ........................................ 9-3
9.2.4 Summary of Alternatives Evaluation..................................................... 9-4
10 The Project Components .................................................................. 10-1
10.1 Component 1: Taguig Sewerage System................................................10-1
10.1.1
Options Background ........................................................................10-1
10.1.2
Component Summary......................................................................10-1
10.2 Component 2: Riverbanks Sewage Treatment Plants.............................10-3
10.2.1
Options Background ........................................................................10-3
10.2.2
Component Summary......................................................................10-4
10.3 Component 3: Septage Treatment Plants...............................................10-4
10.3.1
Options Background ........................................................................10-4
10.3.2
Component Summary......................................................................10-5
10.4 Component 4: Low Income Sewerage System .......................................10-6
10.4.1
Options Background ........................................................................10-6
10.4.2
Component Summary......................................................................10-7
10.5 Component 5: Quezon City Marikina Sewerage System......................10-8
10.5.1
Options Background ........................................................................10-8
10.5.2
Component Summary......................................................................10-8
10.6 Component 6: Upgrade of Existing Sanitation System............................10-9
10.6.1
Options Background ........................................................................10-9
10.6.2
Component Summary....................................................................10-10
10.7 Sludge/Septage Re-use........................................................................10-10
10.7.1
Options Background ......................................................................10-10
10.7.2
Septage Characteristics.................................................................10-11
10.7.3
Sludge Characteristics...................................................................10-12
10.7.4
MTSP Septage/Sludge Quantities and Sources.............................10-13
10.8 MTSP Summary and Issues .................................................................10-15
11 Public Consultation ........................................................................... 11-1
11.1 Introduction.............................................................................................11-1
11.2 First Level Consultations.........................................................................11-1
11.2.1
Scoping Workshop ..........................................................................11-1
11.2.2
Focused Group Discussions ............................................................11-2
11.3 Second Level Consultations....................................................................11-3
11.4 Public Consultation .................................................................................11-4
11.4.1
Scoping Workshop ..........................................................................11-4
11.4.2
Focused Group Discussions (FGDs) ...............................................11-4
11.4.3
Summary of Public Consultation ......................................................11-8
12 Cumulative Impact Assessment....................................................... 12-1
12.1 Introduction.............................................................................................12-1
12.1.1
No Project Options...........................................................................12-1
12.1.2
MTSP Option ...................................................................................12-1
12.2 General Benefits.....................................................................................12-2
12.2.1
Water Quality Improvement .............................................................12-2
12.2.2
Better Health....................................................................................12-2
12.2.3
Greater Tourism ..............................................................................12-2
12.2.4
Greater Fishery Production..............................................................12-2
12.2.5
Property Values ...............................................................................12-2
DRAFT
iv
9:42 AM 02/09/05
Regional Environmental Assessment
12.2.6
General Aesthetic improvements .....................................................12-3
12.2.7
Improved Institutional Implementation .............................................12-3
12.2.8
Septage/Sludge Management .........................................................12-3
12.3 MTSP General Impacts...........................................................................12-3
12.4 Flow-on Affects.......................................................................................12-4
12.5 Typical Impacts.......................................................................................12-4
12.5.1
Noise ...............................................................................................12-4
12.5.2
Air Pollution .....................................................................................12-5
12.5.3
Water Pollution ................................................................................12-5
12.5.4
Aesthetics ........................................................................................12-5
12.5.5
Flora and Fauna ..............................................................................12-5
12.6 Economic Analysis..................................................................................12-6
12.6.1
Introduction......................................................................................12-6
12.6.2
Project Economic Cost ....................................................................12-6
12.6.3
Health Benefits ................................................................................12-6
12.6.4
Determination of Environmental Benefit...........................................12-7
12.6.5
Water Quality Improvement .............................................................12-7
12.6.6
Consumer Surplus ...........................................................................12-7
12.6.7
Septage/Sludge Application to Land ................................................12-7
12.6.8
Environmental fee and sewerage charges .......................................12-8
12.6.9
Summary of Economic Benefits.......................................................12-8
13 Regional Environmental Management System ............................... 13-1
13.1 Introduction.............................................................................................13-1
13.2 Institutional Aspects................................................................................13-1
13.2.1
Relative Priority of Wastewater Services .........................................13-2
13.2.2
Connection to Public Sewerage Systems ........................................13-3
13.2.3
Project Financing .............................................................................13-3
13.2.4
Low Willingness to Pay and the Lack of Sanctions ..........................13-3
13.2.5
Monitoring of Compliance to Existing Laws......................................13-4
13.2.6
MTSP Impacts on Existing Private Septage Haulers .......................13-4
13.2.7
IEC on Health Impacts of Wastewater .............................................13-5
13.3 Project Specific Enhancement/ Mitigation Strategies ..............................13-5
13.4 Air Sector Enhancement/ Mitigation Strategies.......................................13-5
13.5 Water Enhancement/ Mitigation Strategies.............................................13-6
13.6 Monitoring Strategies..............................................................................13-6
13.6.1
Environmental Monitoring Plan ........................................................13-6
13.6.2
Air/Noise Monitoring ........................................................................13-7
13.6.3
Effluent and Water Quality Monitoring Strategy ...............................13-7
13.6.4
Groundwater Monitoring ..................................................................13-8
13.6.5
Surface Water Ambient Monitoring ..................................................13-8
13.6.6
Socio-Economic Monitoring .............................................................13-8
13.6.7
Financial Guarantee Mechanisms....................................................13-9
13.7 REMS Summary .....................................................................................13-9
13.7.1
Components ....................................................................................13-9
13.7.2
Costs ...............................................................................................13-9
13.8 Background to Water Quality and Ecosystem Monitoring .....................13-14
13.8.1
Background ...................................................................................13-14
13.8.2
Monitoring Program Aims ..............................................................13-14
13.8.3
Level of Acceptable Change ..........................................................13-14
13.8.4
Statistical Level Of Confidence ......................................................13-14
13.8.5
Adopted Values for Base Monitoring Program ...............................13-15
13.8.6
Water Quality and Ecosystem Pilot Monitoring Program................13-15
13.8.7
Types of Monitoring Program.........................................................13-15
13.8.8
Data Review - Power Analysis .......................................................13-16
DRAFT
v
9:42 AM 02/09/05
Regional Environmental Assessment
13.8.9
Geographical Extent of Survey ......................................................13-17
13.8.10 Sampling Frequency......................................................................13-17
13.8.11 Ambient Water Quality Data Quality Assurance.............................13-17
13.8.12 Control Sites or River System ........................................................13-18
13.9 Recommended Water Quality and Ecological Monitoring Program.......13-18
13.9.1
Water Quality and Ecological Monitoring Priorities.........................13-18
13.9.2
Water Quality and Ecological Pilot Program Year one ................13-19
13.9.3
Statistical Review...........................................................................13-20
13.9.4
Water Quality Pilot Program If required to extend beyond Year 113-
21
13.9.5
Water Quality and Ecological Base Monitoring Program................13-22
13.9.6
Criteria Review ..............................................................................13-23
13.9.7
Costs .............................................................................................13-24
13.9.8
Community Water Quality Monitoring Programs ............................13-24
14 Conclusions and Recommendations............................................... 14-1
14.1 Conclusions ............................................................................................14-1
14.2 Recommendations..................................................................................14-6
Appendix A - Baseline Data.......................................................................A-1
A.1
Physical Environment .............................................................................. A-1
A.1.2 Topography.......................................................................................... A-1
A.1.3 Geology and Natural Hazards .............................................................. A-1
A.1.3 Soils ................................................................................................... A-12
A.1.4 Land Use............................................................................................ A-13
A.1.5 Hydrology........................................................................................... A-17
A.1.7 Meteorology and Ambient Air Quality ................................................. A-31
A.1.8 Noise Level ........................................................................................ A-39
A.2
BIOLOGICAL ENVIRONMENT.............................................................. A-42
A.2.1 Terrestrial Ecology ............................................................................. A-42
A.2.2 Aquatic Ecology ................................................................................. A-46
A.3
Socio Economic and Cultural Environment ............................................ A-53
Appendix B Monitoring Sites and Programs .......................................B-1
Appendix C Monitoring Data Graphs and Tables.................................C-1
Appendix D Institutional Framework Details ........................................D-1
D.1
Role of National Agencies in Sewerage Management ............................. D-1
D.1.2 Department of Health ........................................................................... D-1
D.1.3 Department of Environment and Natural Resources ............................ D-2
D.1.4 Department of Public Works and Highways ......................................... D-2
D.1.5 Metropolitan Waterworks and Sewerage System ................................. D-3
D.1.6 The Manila Water Company, Inc. and its Service Area ........................ D-4
D.1.7 Metro Manila Development Authority.................................................... D-5
D.1.8 Laguna Lake Development Authority.................................................... D-6
D.2
Role of Local Government Units (LGU) in Sewerage Management ......... D-7
D.3
Role of the Private Sector ...................................................................... D-10
D.4
National Sewerage Management Policies.............................................. D-13
D.4.1 Sanitation Code of the Philippines...................................................... D-13
D.4.2 Implementing Rules and Regulations (IRR) of the Code on Sanitation.......
........................................................................................................... D-14
D.4.3 The Local Government Code ............................................................. D-15
D.4.4 Provincial Water Utilities Act of 1973.................................................. D-16
D.4.5 The Plumbing Law and the National Plumbing Code of the Philippines......
........................................................................................................... D-16
D.4.6 Complementary Laws......................................................................... D-17
D.4.7 The Clean Water Act.......................................................................... D-18
Appendix E Community Consultation Record......................................E-1
DRAFT
vi
9:42 AM 02/09/05
Regional Environmental Assessment
Executive Summary
Metro Manila lies at the western part of the Philippine archipelago. It is the largest
among 16 regions of the country. It has a total land area of 636 square kilometres
and, as of year 2000, is home to 9.9 million people. Some other estimates suggest
the population is closer to 12 million people. It is composed of 17 cities and 5
municipalities subdivided into 1,692 barangays. Metro Manila is bounded by the
province of Bulacan in the north, the province of Rizal in the east, Manila Bay in the
west and Laguna Lake, and Cavite and Laguna in the south. The Pasig River
traverses through a significant area of the metropolis. It drains towards the Laguna
Lake in the south or the Manila Bay in the west, depending on base flow and tidal
state.
While the city has a sound economy, it faces a multitude of problems. Among its
pressing concerns are housing, employment, health, solid waste and wastewater
management, traffic, air and water pollution. The national and local governments
develop and implement programs to address these issues. However, bureaucracy
and politics often make it difficult to successfully implement programs as they are
conceived.
Presently, less than 8% of the Metro Manila population is served by sewerage
systems. These systems are localized in Makati, Quezon City and the Central
Manila area. Some 85% of the population relies on individual septic tanks, most of
which are improperly designed and ill maintained. The sullage usually flows directly
out of the IST into local drains. There is insufficient land to incorporate sullage
soakage trenches. At the moment, there is no facility for proper septage treatment
and disposal. The remainder of the population resorts to pits and latrines while a
significant number has no access to even basic sanitation facilities.
The two main rivers in the metropolis Marikina River and Pasig River, have been
pronounced biologically dead. The Pasig River, once renowned for its pristine
waters and aquatic resources, is now one of the world's most polluted river systems
with dissolved oxygen levels in the central reaches dropping to near zero for most of
the year. Faecal coliform levels exceed standards of the Department of Environment
and Natural Resources (DENR) and international standards by several orders of
magnitude.
The World Bank publication "Philippines Environment Monitor 2003" provides data
on sources of illness for 5 years up to year 2000. The data notes that 31% of all
illnesses are water related, or nearly 5 million of the reported illnesses were water
borne in the previous 5 year period throughout the country. These are due to a
mixture of non-potable standard water supply being ingested and contact with
polluted water in open drains.
The cost of these and other impacts or benefits can be determined by economic
assessment as follows:
Ř avoidable health costs due to losses in direct income and medical expenses for
both in and out patients are estimated at 3.3 billion pesos a year.
Ř the Philippine economy loses 17 billion pesos annually due to degradation of the
marine fishery environment.
Ř tourism losses are exceeding 47 billion pesos in 2004.
Draft
1
9:41 AM 02/09/05
Regional Environmental Assessment
This clearly demonstrates that the present socio-environmental status of pollution
has major negative economic impacts, to the extent of some P67 billion a year.
Given that the most polluted region of the country is the NCR, it may be expected
that a significant portion of the economic losses would impact upon the NCR.
To further increase the need for some interventions, the region's population is
increasing rapidly, and this will result in increasing pollution load, unless interventions
are initiated.
Specifically the population within the MWCI concession area (East zone) is predicted
to increase from 5.3 million persons in 2004 to 8.2 million in 2021. There are no
indications that the population growth will subside even after this period of sustained
growth.
As a result, the Manila Third Sewerage Project (MTSP) is being proposed by Manila
Water Company Inc. (MWCI) in response to a range of these forcing functions, such
as socio-environmental pressures and Concession Agreements specifying the
sewerage and sanitation targets required under the concession. The MWCI has the
concession for the eastern half on Metro Manila, and Maynilad Water (MWSI) the
western concession.
Because the MWCI concession area is only part of the Metro Manila area, a
Regional Environmental Assessment (REA) has been prepared to assess if the
investment proposed integrates with the MWCI/ MWSI overall investment strategy
and environmental management plans. The REA also facilities a strategic
assessment of the options available. The REA has been structured to;
Ř develop the REA details,
Ř lead into an options review,
Ř refine the options into a coordinated project (the MTSP),
Ř consider the institutional issues,
Ř assess the impacts, both negative and positive, of the adopted project, and
Ř develop an appropriate EMS and recommend institutional improvements.
The need for a REA is that the proposed project can have significant environmental
benefits and impacts that need to be addressed at the regional level. Although these
projects' impacts can be addressed through project-specific environmental
assessments, the REA will enable the Land Bank of the Philippines (LBP) as the
drawer of the loan, and the funding agency (World Bank) to assess the cumulative
and interactive impacts of these project components. This larger-scale appreciation
will allow the LBP and the World Bank to better evaluate the MTSP as an investment
and compare this with other alternatives.
In terms of baseline conditions, the key issue for which is there are large datasets
are water quality and ecosystems. The water quality data has been reviewed and
statistically analysed.
The data also demonstrates high levels of inter-annual variability. This means that
the present dataset cannot be used for trend interpretations based on just using one
years data. For example, the BOD levels at some sites decreased significantly from
1998 to 1999, but the previous 5 years show a very different trend. This indicates
that any formal trend conclusions should only be made if at least 5 years data is
reviewed. This also means that any proposed monitoring program must be run for a
number of years before making statistical interpretations of the possible trends.
Draft
2
9:41 AM 02/09/05
Regional Environmental Assessment
The overall conclusion is that the existing monitoring programs have some utility but
are insufficient to be able to detect trends in water quality and ecosystem recovery at
a suitable level of confidence for the adopted level of acceptable change in the
future. Therefore a more comprehensive monitoring program is still required to
statistically determine present water quality conditions, and allow valid comparisons
with future monitoring to assess improvements or otherwise. This presented in the
Regional Environmental Management System.
Of the approximately 2.1 million households in the Region, representing 14% of the
country's total (2000), over 51% have their own faucet or community water supply,
which is almost double the national rate of 28%. If adding "own" and "shared
community" facilities, over 75% of the population of the Region have access to piped
treated water. However, less than 8% of the Region is sewered according to the
1996 Master Plan. This imbalance requires addressing to overcome the resulting
environmental impacts
Only some 30% of sewage generated in the region undergoes some form of
treatment. The rest is either directly discharged in drainage canals (combined
sewers), or simply have no sewers to convey untreated wastewater and it flows in
road table-drains or other common drains.
Further, the ADB (2000) estimated that in the Pasig River basin alone there are one
million Individual Septic Tanks (ISTs) of which only 15% are regularly de-sludged. It
is fair to assume that the majority of the rest are full of sludge. Inappropriately
maintained septic tanks provide no effective detention time and are therefore unable
to capture suspended solids leading to elevated levels of biochemical oxygen
demand, suspended solids, and faecal coliform in the sullage discharges.
The assessment of the policy, legal, and administrative framework of the sanitation
and sewerage management system in Metro Manila yields several issues which
need to be addressed. This portion of the review carries with it the key management
and policy concerns which have been identified and lists some recommended
actions.
Firstly, there is no umbrella agency trying to limit population growth in the Region,
either by imposing restrictions on rural migration into the Region or in terms of
generic and sustained family planning campaigns. Therefore substantially
increasing populations within the Region are a given.
The basic land use planning (CLUPs) and zoning controls (ZOs) are also not
effective. Therefore an approach of planning controls cannot be used to guide
development nor even control the location of ongoing development.
The existing wastewater, environment and health management legislation is too
complex, overlapping and unclear not just in terms of basic laws, but also in terms of
the devolution status. A number of obligations have been devolved from one agency
to another and eventually to the LGU in some cases, but without a clear mandate or
operational guidelines.
A series of recommendations have been made on how to improve some of these
issues. However it is critical that an action plan be developed to make these
changes, and this will require political commitment, community pressure following on
Draft
3
9:41 AM 02/09/05
Regional Environmental Assessment
from extensive environmental and health education, and of course funding and
adoption of a time-bound program for implementation.
Therefore, it was recommended that the present strategy on wastewater
development must take the pragmatic approach where clusters of
cities/municipalities will coalesce to plan, agree on and implement wastewater
projects for the protection of the health and environment of the areas under their
jurisdiction ("river basin approach"). Projects may not be designed on a per location
basis but would cover expansive catchment areas. Innovative solutions, such as
combined systems for highly urbanized cities should be seriously considered. Only
with this approach can the objectives of protecting the water environment be
achieved at the right economies of scale.
As a result, a range of generic wastewater collection and management options have
been reviewed.
It was confirmed that onsite treatment and disposal or reuse is unsustainable
because of small lot sizes and use of groundwater as a water supply. Similarly the
higher technology options of indirect and direct potable reuse are unaffordable at the
present time. Effluent irrigation was also dismissed because of cost reasons.
Given the very small percentage of sewerage coverage in Metro Manila, and the high
population density, the usual strategy in these circumstances would be to sewer all
of the Region as soon as possible. This would be practical in less densely
developed urban areas, but only where;
Ř a large sinking fund has historically been established to fund the large capital
expenditure required,
Ř the infrastructure can be installed with community support and forbearance
Ř the population will connect to the sewer system, and
Ř the households will consistently pay the tariff for wastewater management.
However in this case, the present low percentage of sewerage coverage in the
Eastern Concession Zone, together with the required capital and operating cost
requirements, and social issues such as lack of community support and household
affordability, precludes adoption of an immediate global sewerage and treatment
strategy. Some less densely populated areas in the Zone can be sewered and have
the wastewater directed to new sewage treatment plants in these catchments, but
this will only account for a small portion of the Zone's customers.
Therefore, in the medium term at least, ISTs will be part of the east zone's
wastewater management systems into the future. Septic systems only work
efficiently when the tanks are regularly desludged. This prevents excessive solids
carrying over with the sullage. These solids carry large quantities of pathogens
(disease causing organisms), have high organic loads and can cause downstream
pipework blockages. A priority must therefore be to maintain the operation of these
septic tanks to minimise both health and environmental impacts.
To improve septic tank efficiency, a fleet of tankers is required to allow desludging of
tanks approximately every 5 years. There are some other individual operators
providing a tank desludging service, but this is only upon request, and usually only
when tanks are completely blocked up with solids. There is no programmed
maintenance of the septic tanks that will minimize the present environmental
impacts.
Draft
4
9:41 AM 02/09/05
Regional Environmental Assessment
Once a fleet of collection vehicles is established, there will be a need for septage
treatment and/or disposal facilities. The present independent tanker operators are
most likely dumping their septage illegally, as no permits have been issued by the
DENR for a disposal facility in the Region. A network of septage treatment plants is
therefore required. The resulting dewatered or dried septage/sludge will then require
disposal either at an approved landfill or land applied. In addition, opportunities for
productive reuse of the septage/septage are available, such as applying the
organically rich septage/sludge to poor agricultural soils, especially the lahar affected
areas to the North of the Region.
Locally, sullage is usually simply discharged into stormwater drains. Some of these
are open drains, which allows physical contact by the community with the untreated
wastewater, and attendant health risks. Usually it is the children involved in this
contact and they represent some of the most susceptible members of the community
to such disease risks. This health risk is exacerbated if the septic tank has not been
maintained and biological solids are carrying over.
Morbidity data are presented elsewhere in this report indicating significant water
borne disease events are not uncommon in Manila. A further priority is therefore to
limit the contact possibilities between sullage and the community. This will require
some drainage repairs and covering of other drains.
The present sanitation system generally has septic tanks without the requisite
soakage tranches or evapotranspiration beds. Therefore the sullage (the ongoing
liquid outflow from septic tanks) is discharged to a stormwater drainage system
rather than disposed of on site or directed to a dedicated sewer. In most countries, a
septic system is environmentally sustainable only when there is sufficient land
associated with the system to allow either infiltration into the soil or
evapotranspiration of sullage. That is, there should be no uncontrolled liquid
discharge off the site into drainage systems to pollute the environment. There is no
opportunity locally to provide soakage trenches or evapotranspiration beds because
of a lack of land space in almost every existing site.
These septic tanks can serve either individual dwellings or commercial
establishments, or be a community-based tank system. One priority is therefore to
convert some of the community septic tanks into sewage treatment plants.
Even if the septic tanks are appropriately maintained, the sullage eventually reaches
local watercourses such as the Pasig River. These water bodies are highly polluted
as a result, and the pollution takes many forms, but especially;
Ř organics (which deplete the oxygen in the watercourse so higher aquatic life
forms cannot survive), and
Ř pathogens (disease causing organisms which concentrate in biological solids).
Therefore a program is required to either;
Ř sewer these areas and direct the sullage to a sewage treatment plant (or convey
raw sewage to a treatment plant if the septic tank is removed), or
Ř provide an interception system to collect the sullage and other wastewater from
the stormwater drains, and divert the dry weather flows to a sewage treatment
plant
Dedicated sewerage systems are expensive to install, cause disturbance to
roadways and access paths, and may not be used unless the community agrees to
connect to the sewer. Finally, the householders must be willing to continue to pay
Draft
5
9:41 AM 02/09/05
Regional Environmental Assessment
their tariffs to fund the operation of the sewerage system. Local experience
indicates that many of these items will not occur.
A second alternative is to install drainage modifications within catchments to divert
dry weather flows in stormwater drains and esteros into purpose-built sewage
treatment plants. This then limits the dry weather discharge of sullage into the local
major watercourses. This may apply for both small drainage systems and also larger
drains associated with flood control networks. These are termed combined sewers
and are now allowed under the revised Concession Agreement (CA), but were not
allowed under the original CA. Most environmental impact occurs in the dry season
when there is little diluting flow in the local water bodies, so treating the dry weather
flows of sewage/sullage is still very beneficial environmentally.
Septage/sludges from the septage treatment plants and also the sewage treatment
plants as well as some raw septage will require disposal. The ocean dumping trials
were curtailed and so a new disposal option is required. Appropriate application of
these sludges to poor agricultural soils would improve the soil organic content, water
holding capacity, general fertility and increase the Cation Exchange Capacity.
Suitable environmental studies would be required to demonstrate the sustainability of
such applications supported by management plans for ongoing applications.
In addition to the physical and financial aspects of the sewerage and sanitation
improvements, the up-grades will only be sustainable if the community is educated
about the benefits, and importantly, the requisite need to fund these benefits.
Therefore a project component providing an Information and Education Campaign is
a high priority.
The overall MTSP being proposed has four proposed components:
Ř Sewerage System and Treatment - Involved the expansion of sewer network and
treatment plants at strategic locations within the East-concession area
Ř Septage Management large scale septic tank de-sludging program on the
western section of the service area, namely: Mandaluyong, part of Makati and
Quezon City, Pasig, San Juan, Taguig, Marikina, and Pateros
Ř Technical Assistance will cater to the need for information and education on the
good practices, infrastructure, and benefits from proper sewage management
However this REA predominantly deals with the first two components of the MTSP;
sewerage systems and treatment, and septage management. These two
components will be implemented through six projects listed below:
(1)
Taguig Sewerage System
This project is in line with the flood control project of the Department of Public Works
and Highways (DPWH) covering Taguig, Pateros and parts of Rizal. The DPWH will
construct four (4) drainage/flood retention ponds adjacent to the Laguna de Bay.
The proposed sewerage project will involve the development of the retention ponds
as part of a wastewater treatment system to treat the sewage before discharge to
Laguna de Bay during the dry season.
(2)
Riverbanks Sewage Treatment Plants
This project will involve the construction of at least three (3) underground STPs
along the riverbanks of Pasig River, located in Makati, Mandaluyong, and Pasig.
Draft
6
9:41 AM 02/09/05
Regional Environmental Assessment
Sewage will be intercepted and collected from existing drainage lines in these areas
for treatment before discharge to Pasig River. If necessary, rehabilitation of the
drainage outfalls and lines will be included in the project.
(3)
Septage Treatment Plants
This project is essential in providing sanitation services, septage treatment and
proper septage/sludge disposal. An initial plan is to construct SPTPs in the southern
and northern portion of the East Zone.
(4)
Sanitation for Low-Income Communities
This project will involve the construction of Communal Septic Tanks or STPs, as
appropriate, and shallow, small-diameter sewer lines to serve low-income
communities in the East Zone which have inadequate sanitation facilities.
(5)
Quezon City-Marikina Sewerage System
This project will utilize portions of the legal easement for Marikina River. Main
drainage collector pipes which collect combined sewage and drainage from
communities in Quezon City and Marikina will be connected to a STP to be
constructed to treat the dry weather drainage/sewage flow.
(6)
Upgrade of Existing Sanitation Systems
This project will involve the upgrade of existing Communal Septic Tanks (CSTs) in
Quezon City to STPs. This will ensure compliance with environmental standards for
wastewater effluent.
As part of all six components, a supporting Sludge/Septage Disposal and Reuse
program is proposed. In summary, the adopted system involves the trucking of
various sludges and septage solids wastes to the lahar-affected area some 60 km to
the north, as follows;
Ř Liquid sludge (biosolids) from the biological treatment process at sewage
treatment plants for the proposed MTSP, and also those plants under MSSP,
located at Pabahay Village, Valle Verde, Karangalan Village, general MTSP
plants (Road 5, Anonas Street, QC Barangays, Camp Atienza, Taguig,
Manggahan, Capitolyo, Ilaya, Poblacion in Pasig City, Labansan, Tapayan and
Hagonoy) giving a volume of 194 m3/day of liquid sludge. This is essentially a
liquid at 2 or 3 percent solids, and will be tankered to the septage treatment
plants for dewatering. Dewatered sludge will be 25% solids and is sufficiently dry
to shovel and treat as a solid, even though still very wet.
Ř Dewatered primary sludges from the primary treatment plants at the Taguig
ponds will yield another 48 m3/day. These will not be stabilised and could
possibly be odorous. In a traditional sewage treatment plant, the primary sludges
contain highly active organic material such as gross solids. These sludges are
very odorous. With the Taguig primary treatment plants, the inflow is sullage not
raw sewage, so gross solids and other highly organic materials will not be
present. It is expected that a large fraction of the primary sludge will be
inorganics resulting from street runoff and catchment erosion entering the
combined sewer flows. Therefore it is appropriate to operate the primary
Draft
7
9:41 AM 02/09/05
Regional Environmental Assessment
treatment facilities as proposed, and monitor the biological activity of the primary
sludge to assess if additional treatment is required such as lime stabilisation.
Ř Dewatered secondary (biological) sludges from the MSSP and MTSP STPs
totalling 127 m3/day. This sludge will be about 25% solids, and is sufficiently dry
to shovel and treat as a solid, even though still very wet. It is not stabilised and
as such can only be used under certain restrictions, such as burial within 8 hours
and not for certain food crops, such as those consumed raw unless there is
certain period between sludge application and harvesting the food.
Ř Dewatered unstabilised septage/sludge volume of 177 m3/day from the two
MTSP SPTPs, at 25% dry weight. This dewatered septage/sludge is actually a
mixture of the raw solids entering the SPTP which are settled and then
dewatered, and the biological secondary sludge from the liquid treatment plant
for the liquor following on from the septage solids removal. The septage/sludge
is therefore a mixture of septage solids and biosolids or biological sludge. It is
not going to be stabilised, but there will be some chemicals added to assist in the
dewatering process. These will be at very small doses, just sufficient to ensure
that the dewatering targets are achieved. The chemicals will be standard
polyelectrolytes used globally for such processes.
Ř Dewatered stabilised septage/sludge volume of 90 m3/day from the PRRC
SPTP at Antipolo, at 25% dry weight. This dewatered septage/sludge is also a
mixture of the raw solids entering the SPTP which are settled and then
dewatered, and the biological secondary sludge from the liquid treatment plant
for the liquor following on from the solids removal. The septage/sludge is
therefore a mixture of septage solids and biosolids or secondary sludge. It is
going to be stabilised by lime addition, at high dose rates of up to 0.5 kilograms
of lime per kilogram of solids. The lime increases the pH and also increases the
temperature to inactivate the pathogens. The resulting septage sludge will meet
the Class A requirements of the US EPA and as such is acceptable for almost
unrestricted reuse applications. The PRRC is investigating possible sludge
reuse locations on farms close to Antipolo, but the backstop will be blending the
PRRC material with the other sludges to transport to the Pampanga areas.
Ř Dried biological sludges (biosolids) amounting to approximately 5 m3/day
from the existing Magallanes STPs. These sludges have been dried on sludge
drying beds and can be even drier than the 25% dewatered solids achieved
mechanically. They are stabilised by virtue of the open exposure over a longer
term of weeks to months.
The total sludge volume to be managed locally every day is therefore 194 m3/day of
liquid sludge to be transported from the STPs to the SPTPs for dewatering. This is a
local transport issue only.
The septage/sludge quantity to be transported to the Pampanga region is
approximately 450 m3/day. Because it is a solid, the only option is trucking not
pumping. The septage/sludges will be combined apart from the PRRC
septage/sludge and dried sludges which are stabilised.
A comprehensive public consultation program has been undertaken.
A key issue to note is that only three families require resettlement in the entire MTSP
project. MWCI already has a standard resettlement framework, and a specific
resettlement action plan will be developed for the 3 families prior to resettlement
being required. The very small number of resettlement involved is a direct result of
the component sites being selected which minimise social dislocation. This number
may change if the mooted San Mateo SPTP site is adopted instead of the Payatas
Draft
8
9:41 AM 02/09/05
Regional Environmental Assessment
SPTP site. However negotiations are underway to assess the various
responsibilities for resettling the 11 families informally settling on the San Mateo site.
Consultation has been completed on all components with the exception of the two
sites for SPTP component. Consultation with the adjacent property owners and
residents for the proposed Payatas Septage Treatment is to be conducted after
agreement has been reached with the property owner on the sale of the land. This
may now not proceed if the site is abandoned in favour of the San Mateo SPTP site.
In the case of the FTI site, discussion has been had with the Management of the
Complex (FTI) on the use of a portion near the existing treatment facility of the
complex. Consultation is not deemed necessary in the case of the FTI site.
The key issues were typical for a wastewater management strategy relating to costs,
odour, lack of knowledge of the environmental and health impacts of poor sanitation
or sewerage, traffic impacts and disruption during construction, flooding impacts or
benefits and so on.
In assessing the cumulative impacts, the No Project option has been considered. In
this option, there would be no interventions in the present state of sanitation,
sewerage and wastewater management. However the present socio-environmental
conditions in the Region are already very poor, with demonstrated economic
impacts.
The population in the east zone Concession Area is predicted to increase from 5.3
million persons to 8.2 million in 2021. This 60% increase without any improvements
in the standard of sanitation, sewerage and wastewater management will result in
even greater socio-environmental impacts. The impact quantum cannot be predicted
but it would safe to project that, for example, the presently limited periods of
adequate DO in the major river systems would be even further reduced, perhaps
even eliminated. The ecological implications are that the present intermittent
biological activity and higher life forms residing or transitting through these
waterways would cease almost entirely.
The health impacts of greater population and population density can only exacerbate
the present health impacts in terms of water borne diseases and associated
environmental costs.
The No Project option cannot reasonably be considered any further as an option,
based on these expected consequences.
By comparison, the MTSP will have net benefits on the Region. Overall benefits
include the following;
Ř reducing the pollution of key Metro Manila waterways
Ř reducing the health hazards associated with human exposure to sewage by drain
covering and effluent disinfection
Ř improved property values along watercourses
Ř improved aesthetics as the water quality improves
Ř improved fish catches
Ř improved tourism
Ř improved soil condition and crop yields in lahar affected areas
Ř providing design and implementation feedback on the combined sewer systems
efficacy and the STP/SPTP designs, in effect a pilot scheme for the many
innovations proposed under MTSP
Draft
9
9:41 AM 02/09/05
Regional Environmental Assessment
Ř cessation of uncontrolled dumping of septage from privately owned and operated
tankers
Ř provides a viable alternative to sea dumping of septage/sludge
Ř cessation of the hauling of liquid septage to the lahar affected areas north of the
Region. It is environmentally and financially unsustainable to be hauling so much
water in the non-dewatered septage such a distance and with the attendant
environmental risks associated with accidents and attendant spillages of the
liquid septage
Ř improved institutional implementation of sanitation and sewerage services,
including more clearly defined roles and responsibilities and enforcement, and
Ř elevating the commitment and political will required to improving sanitation,
sewerage and wastewater treatment in the minds of politicians, government
agencies, NGOs, civil society and the general public.
As always there will be some short term localised construction impacts such noise,
dust and traffic interruptions, but these are short term and are very minor compared
with the longer-term benefits.
Essentially the Present Value of economic benefits over the life of MTSP until 2025
is estimated to be P2.7 billion, with Health Benefits and Environment Benefits each
providing some P1.2 billion of this total.
A Regional Environmental Management System has been prepared for the MTSP.
The actual management and monitoring required for the REMS is as follows;
Ř Primary ambient water quality and ecological monitoring. This is by far the
biggest component and is described in Attachment 4.
Ř Review and economic interpretation of secondary data on health, fisheries,
property valuation, etc. The actual monitoring is to be done by others as part of
their ongoing charter
Ř Driving the institutional structural and implementation changes required
There are no site-specific monitoring or management plans as these items are
presented in the EIS as component specific requirements, not Regional.
The pilot water quality and ecological monitoring study would cost approximately
P2.5M if undertaken by an agency such as DENR, and the ongoing baseline would
cost about P0.75M a year. This cost includes an allowance for hiring staff on a
monthly basis but not for a profit component if undertaken by a private consultant or
organisation.
The cost of the institutional management components is as follows;
Ř Relative Priority of Wastewater Services
- IEC costing P5M
Ř Connection to Public Sewerage Systems
- no direct cost
Ř Project Financing
- TA grant of P10M
Ř Low Willingness to Pay and the Lack of Sanctions
- no direct cost
Ř Monitoring of Compliance to Existing Laws
- Institutional study P10M
Ř MTSP Impacts on Existing Private Septage Haulers
- GEF funded
Ř IEC on Health Impacts of Wastewater
- IEC costing P5M
Draft
10
9:41 AM 02/09/05
Regional Environmental Assessment
1 Introduction
1.1 Background
Metro Manila lies at the western part of the Philippine archipelago. It is the largest
among 16 regions of the country. It has a total land area of 636 square kilometres
and, as of year 2000, is home to 9.9 million people. Some other estimates suggest
the population is closer to 12 million people. It is composed of 17 cities and 5
municipalities subdivided into 1,692 barangays. Metro Manila is bounded by the
province of Bulacan in the north, the province of Rizal in the east, Manila Bay in the
west and Laguna Lake, and Cavite and Laguna in the south. The Pasig River
traverses through a significant area of the metropolis. It drains towards the Laguna
Lake in the south or the Manila Bay in the west, depending on base flow and tidal
state.
As the capital of the Philippines, Metro Manila is the centre of commerce, science,
technology and political governance. The city's economy is primarily commercial with
commercial establishments or services taking up 63% of the market. Industries
make up 37% of the local economy.
While the city has a sound economy, it faces a multitude of problems. Among its
pressing concerns are housing, employment, health, solid waste and wastewater
management, traffic, air and water pollution. The national and local governments
develop and implement programs to address these issues. However, bureaucracy
and politics often make it difficult to successfully implement programs as they are
conceived.
1.2 Environment
Presently, less than 8% of the Metro Manila population is served by sewerage
systems. These systems are localized in Makati, Quezon City and the Central
Manila area. Some 85% of the population relies on individual septic tanks, most of
which are improperly designed and ill maintained. The sullage usually flows directly
out of the IST into local drains. There is insufficient land to incorporate sullage
soakage trenches. At the moment, there is no facility for proper septage treatment
and disposal. The remainder of the population resorts to pits and latrines while a
significant number has no access to even basic sanitation facilities. (Feasibility Study
for the Manila Third Sewerage Project Final Report by Nippon Jogesuido Sekkei
Co., Ltd in association with CEST, INC. and Mott MacDonald Co., Ltd, 2004).
By contrast, of the approximately 2.1 million households in Metro Manila, over 51%
have their own faucet or community water supply, which is almost double the
national rate of 28%. If considering "shared community" facilities, over 75% of the
population of the Region have access to piped treated water. (NJS, 2004)
The two main rivers in the metropolis Marikina River and Pasig River, have been
pronounced biologically dead. The Pasig River, once renowned for its pristine
waters and aquatic resources, is now one of the world's most polluted river systems
with dissolved oxygen levels dropping to near zero for most of the year. Faecal
coliform levels exceed standards of the Department of Environment and Natural
Resources (DENR) and international standards by several orders of magnitude.
Findings of the DANIDA study confirm domestic wastewater as the primary source of
water pollution. (Pasig River BOD Load Assessment and Water Quality Projections
Draft
1-1
9:41 AM 02/09/05
Regional Environmental Assessment
Report, funded by DANIDA, by Carl Bro International, Danish Hydraulic Institute and
Institute for the Water Environment, 1999) According to the DENR, 75% of the
pollution loading into the Pasig River comes from domestic wastewater. Industrial
and commercial effluent contributes only 25% to the pollution of the Pasig River.
Given the amount of pollution contributed by domestic wastewater, the state of the
water resources in Metro Manila can be directly correlated to the dearth of
functioning sanitation systems and low sewerage coverage.
1.3 Public Health
The World Bank publication "Philippines Environment Monitor 2003" provides data
on sources of illness for 5 years up to year 2000. The data notes that 31% of all
illnesses are water related, or nearly 5million of the reported illnesses were water
borne in the previous 5 year period throughout the country. These are due to a
mixture of non-potable standard water supply being ingested and contact with
polluted water in open drains.
When combining the 1995 and 2000 data, it is obvious that water pollution is
resulting in major morbidity issues in the community. Given that the most polluted
waterways and densest population areas are within the National Capital Region
(NCR), then any improvements to water quality or isolation of the community from
polluted water by drain covering will have social and health benefits.
It is likely that the water borne disease impacts have been under-estimated in any
case. The most common waterborne disease is caused by the Norwalk Type A
virus. This usually results in a 24 hour GI infection (Diarrhoea). This morbidity is
often confused with minor food poisoning so the water borne health data is probably
understated, because it is interpreted as being derived from non-water related
sources. This would then underestimate the potential benefits of improving sewage
management by either installing sewerage systems or drain improvements, and
improving water quality and treated effluent disinfection.
1.4 Fisheries and Ecosystems
The paucity of commercial fish in the main rivers within the NCR is a direct result of
the level of pollution in these waterways. Most of the year there is insufficient
oxygen within the waterways to support anything but the coarsest fish species. In
the wet season, there is substantial diluting runoff which improves the river water
quality to such an extent that some fish can survive. The fish are not breeding in
commercial quantities in the river, but are just motile species moving from the
cleaner upper reaches of the Marikina River and Laguna Lake towards Manila Bay.
Residents living along the Pasig and Marikina Rivers catch some of these fish. The
health impacts of eating these fish has not been established by specific
epidemiological studies, but may be expected to have some chronic impacts given
the presence of persistent chemicals within the river systems.
1.5 Tourism
Tourists are obviously not attracted to polluted environments. This has the result of
reduced capital inflow, reduced income receipts, reduced job opportunities and other
negative impacts.
Draft
1-2
9:41 AM 02/09/05
Regional Environmental Assessment
1.6 Economic Impacts
The cost of these and other impacts or benefits can be determined by economic
assessment, and are taken from the World Bank Environment Monitor, 2003.
For example, avoidable health costs due to losses in direct income and medical
expenses for both in and out patients are estimated at 3.3 billion pesos a year.
Similarly the Philippine economy loses 17 billion pesos annually due to degradation
of the marine fishery environment.
Tourism losses are exceeding 47 billion pesos in 2004.
This clearly demonstrates that the present socio-environmental status of pollution
has major negative economic impacts, to the extent of some P67 billion a year.
Given that the most polluted region of the country is the NCR, it may be expected
that a significant portion of the economic losses would impact upon the NCR.
1.7 Moving Forward
The Manila Third Sewerage Project (MTSP) is being proposed by Manila Water
Company Inc. (MWCI) in response to a range of these forcing functions, such as
socio-environmental pressures and Concession Agreements specifying the
sewerage and sanitation targets required under the concession. The MWCI has the
concession for the eastern half on Metro Manila, and Maynilad Water (MWSI) the
western concession.
Because the MWCI concession area (the eastern part of Metro Manila) is only part
of the Metro Manila area, a Regional Environmental Assessment (REA) has been
prepared to assess if the investment proposed integrates with the MWCI/ MWSI
overall investment strategy and environmental management plans. The REA also
facilities a strategic assessment of the options available.
The above impacts clearly demonstrate that there is a raft of problems with the local
NCR environment, largely due to the paucity of wastewater management systems.
Prior to committing to a specific strategy to improve the problems, a Regional
Environmental Assessment (REA) has been requested by the World Bank.
Based on this,the REA has been structured to include;
Ř develop the REA details,
Ř lead into an options review,
Ř refine the options into a coordinated project (the MTSP),
Ř consider the institutional issues,
Ř assess the impacts, both negative and positive, of the adopted project, and
Ř develop an appropriate EMS and recommend institutional improvements.
Draft
1-3
9:41 AM 02/09/05
Regional Environmental Assessment
2 Background to the Regional Environmental Assessment
A Regional Environmental Assessment or REA is a socio-environmental assessment
whose main objective is to enhance the environmental sustainability of investment
strategies, programs and projects in a given region by influencing their design early
in the planning stage. This enhancement is accomplished by identifying
environmental opportunities and constraints early in the regional development
planning stage and ensuring these aspects are considered in the decision making.
The extent of the Region has to be sensibly linked to the area of interest, the local
hydro-dynamics, political boundaries and land development boundaries. The
selection of the adopted Region is developed below.
2.1 Objectives of the REA
The need to conduct a REA is that the proposed project can have significant
environmental benefits and impacts that need to be addressed at the regional level.
The REA also allows the impacts of other projects in the Region to be assessed.
Although these projects' impacts can be addressed through project-specific
environmental assessments, the REA will enable the Land Bank of the Philippines
(LBP) as the drawer of the loan, and the funding agency (World Bank) to assess the
cumulative and interactive impacts of these project components. This larger-scale
appreciation will allow the LBP and the World Bank to better evaluate the MTSP as
an investment and compare this with other alternatives. Other potential benefits of
the REA, based on its application in other countries include:
Ř Provide a baseline overview on the regional sewerage management conditions
where traditional impact assessment and environmental monitoring can be
instituted
Ř Assist stakeholders develop long-term development plans that recognize and
avoid aspects that are potentially harmful to the environment
In summary, the need for the REA is based on the following:
Ř The Bank has and continues to support sewage management investment
programs and projects in the Metro Manila area, and it recognizes that these
interventions pose both on- and off-site interrelated environmental problems and
benefits, and
Ř These environmental impacts are regional in scale and a regional assessment is
needed in addition to the site and project component specific assessments.
The value of the REA in this case is enhanced since the LBP and the MWCI are still
in the feasibility study stage of the Manila Third Sewerage Project (MTSP).
2.1.1 Steps in the Conduct of a REA
This assessment was guided by the World Bank Environmental Assessment
Sourcebook Update on Regional Environmental Assessment, Number 15, June 1996
(WB Operational Directive 4.01). Figure 2-1 illustrates the process undertaken:
Draft
2-1
9:41 AM 02/09/05
Regional Environmental Assessment
Figure 2 - 1. REA Process Undertaken
Definition of the Philippine National
Capital Region as the study area and
Sewerage and Sanitation as the focus
Overview of the Region and
Environmental Baseline of The MTSP
Project sites
Description of the Development
Alternatives
· 1996 JICA Master Plan MWCI
Concession Area Components
· MTSP Component Project
Cumulative Impact Assessment on
· Total BOD reduction
· Water quality impact
· Cost effectiveness
· Health
Regional Environmental
Management System
2.2 Scope of the REA
2.2.1 Wastewater Management
There are many options for defining the REA region. It can be defined based on;
Ř water catchments,
Ř sewer or drainage catchments,
Ř administrative boundaries, or
Ř geo-political constraints
A common option is to define the Region along the boundaries of the major river
basins to capture the dynamics and complexities of sewerage and septage
management, in terms of impact upon local receiving waters. However, for the case
of Metro Manila, the water bodies of most interest are contained within the National
Capital Region, and impacts are going to be almost exclusively downstream given
the local hydrodynamics.
Municipalities well outside the zone of influence of the project were not considered
appropriate, such as the upper tributary areas of the Marikina River. These areas
are beyond the tidal limit of the main watercourses such as the Pasig River and
therefore will not be affected by any developments or improvements further
downstream.
Draft
2-2
9:41 AM 02/09/05
Regional Environmental Assessment
The other dimension would be to Include Manila Bay in the region. However the
beneficial water quality and health impacts expected due to implementing the MTSP
will not be of such a magnitude so as to be able to positively correlate these
improvements with any changes in Manila Bay. The causal relationships could not
be established with any statistical confidence with the proposed improvements
upstream.
For this REA, the Philippine National Capital Region (NCR) has been adopted as the
Region. The Region's spatial boundaries are defined as the cities and towns within
the political boundaries of Metro Manila being drained by the following:
Ř Pasig-Marikina River,
Ř Malabon-Tullahan River, and
Ř Paranaque-Zapote Rivers which flow into Manila Bay and Laguna Lake.
This region is more commonly called the National Capital Region or NCR. The study
area is composed of 13 cities (Mandaluyong, Manila, Marikina, Pasig, Kalookan, Las
Pinas, Makati, Malabon, Muntinlupa, Paranaque, Pasay, Quezon, Valenzuela) and
four municipalities (Navotas, Pateros, San Juan, and Taguig).
This boundary also sensibly interfaces with the regional institutions eg Pasig River
Rehabilitation Commission (PRRC), MMDA, MWSS, LLDA/DENR, MWCI and
MWSI, and as such simplifies the management aspects for the REA.
The PRRC presently has an overview role as a "regional" coordinator for
environmental and development issues within the Pasig River basin, which includes
the Laguna Lake and major catchments such as Marikina and San Juan Rivers. The
Commission does not have any executive powers, but has been tasked to coordinate
the various River rehabilitation programs. As such, the PRRC has developed
various Action Plans, such as water quality monitoring and implementing
environmental user fees, for implementation by the line agencies such as DENR. As
such, the PRRC could be compared a typical river basin committee/commission in
many international situations. This further confirms that the Region for the REA
needs to extend beyond that of the MWCI concession area for consistency of project
implementation.
The Region to be adopted will therefore be the NCR, based on;
Ř Major river systems
Ř Hydrodynamics in these river systems, particularly the tidal limits
Ř Political and land development boundaries extending beyond the MWCI
concession area, and
Ř Institutional factors, such as the coverage of MWSS and DENR regions.
Therefore, the REA will concern itself with studying the impacts of development
alternatives on sewerage and septage management within the NCR boundaries, and
developing a suitable environmental management strategy to support this strategy.
2.2.2 Sludge and Septage Management
Some components of the MTSP involve the development of Septage Treatment
Plants (SPTP) and Sewage Treatment Plants (STP). These facilities generate
septage solids and sludges respectively, which have to be managed as part of the
MTSP. Both private contractors and MWCI tankers haul the septage.
Draft
2-3
9:41 AM 02/09/05
Regional Environmental Assessment
Previously, untreated septage collected by the Concessionaire was disposed off
under ocean dumping agreements.
At present some septage is being transported to the lahar affected areas north of the
NCR, and to extensive agricultural areas including Pampanga, Tarlac and adjacent
provinces. A series of pilot trials are ongoing for liquid septage land application, to
rejuvenate deep lahar soils and on sugarcane plots to improve yields and reduce the
need for artificial fertilisers. The biosolids and septage application sites are over 80
kilometres north of the REA Region, and in a predominantly rural area. The area is
only lightly developed as it is a rural enclave.
The benefits and potential impacts of these activities, in relation to septage/sludge
land application, will be addressed in this REA. Any impacts or benefits will be
monitored as part of the EMP for the MTSP.
However these septage/sludge application activities are peripheral to the main MTSP
components and as such, the REA Region will only be defined as the NCR. There
will not be any significant infrastructure development outside the NCR in these lahar
and extensive agricultural areas.
The septage disposal location/s used by the private contractors is unknown at
present, as there are no approved disposal locations or septage treatment plants
available to the private contractors at present. Following commissioning of the
SPTPs, the private contractors will use these facilities as well as the MWCI tankers.
2.3 Regional Planning Integration
Regional planning in this region is somewhat disjointed with various agencies having
roles at a number of institutional levels. Therefore the REA will have to develop its
own regional approach to ensure sustainability. For example, the MWSS is presently
considering developing a new Water, Sewerage and Sanitation Master Plan for the
region. This could impact upon the present project coincidentally.
Similarly, the Western Concessionaire has developed a master plan which is now in
abeyance. The western concessionaire is not operating in full compliance with the
Concession Agreement and the future of the developments in the western area are
uncertain. This means that the REA is even more important as it needs to address
the possible issues associated with the western part of the Region as well as the
eastern zone where the MTSP will be located.
Therefore the approach to integration with other regional plans can only be to review
them and ensure that there are no major developmental or institutional conflicts into
the future.
Draft
2-4
9:41 AM 02/09/05
Regional Environmental Assessment
3 Overview of the Adopted Region
This section presents the key parameters and issues that describe the Region.
The Region's spatial boundaries are defined as the cities and towns within the
political boundaries of Metro Manila being drained by the Pasig-Marikina River, the
Malabon-Tullahan River and the Paranaque-Zapote Rivers which flow into Manila
Bay and Laguna Lake. This region is more commonly called the National Capital
Region or NCR. The study area is composed of 13 cities (Mandaluyong, Manila,
Marikina, Pasig, Kalookan, Las Pinas, Makati, Malabon, Muntinlupa, Paranaque,
Pasay, Quezon, Valenzuela) and four municipalities (Navotas, Pateros, San Juan,
and Taguig).
3.1 Regional Sub-Basins
The NCR region is dissected by numerous rivers and streams that finally empty
either to the Laguna Lake or Manila Bay. There are six major water bodies and
basins in and downstream of the region; The Laguna Lake, Marikina-Pasig,
Meycauayan, Manila Bay, San Juan and Tullahan River. Key issues associated with
these are discussed below
The Malabon-Tullahan River system is in the West concession region, but is the
most polluted river system in the Philippines. The pollution is estimated to be about
58 percent domestic waste (both liquid and solid waste) and 42 percent from
industrial waste. There are about 1,000 industries along the riverbanks and about
11,000 squatter families within its watershed. This is a good example that any socio-
environmental developments within the East zone cannot be assessed in isolation of
considering the regional context.
The Pasig River Basin (9,000 km2) and the Pampanga River Basin (3,900 km2) make
up more than 75% of the watershed of Manila Bay. The Pampanga River
contributes approximately 49% of the net freshwater influx into Manila Bay, while the
Pasig River contributes about 21%. The other river systems make up 26% of the
freshwater source and the remaining 4% comes from precipitation onto the bay. The
Bay is therefore the ultimate recipient of domestic and industrial waste discharges,
agricultural runoff and oil spills.
The Pasig River System is a complex of network of waterways the includes Marikina,
San Juan, Esteros, and canals, which have the following characteristics:
Ř It is the main outlet of the Laguna Lake with a total surface area of 850 km2 and
a drainage area of 2,750 km2. Waters coming from the Laguna Lake meanders
through 27 kilometres of relatively flat coastal and highly urbanized plains of
Metro Manila
Ř There are over 300 industrial firms along the banks of the Pasig River system,
about one-half have been found to be polluting the water in varying degrees.
River pollution is further aggravated by oil spills, from about 300 gasoline
stations, several oil depots, and barges, tanks and boats docking in the area.
Ř Marikina River, with its headwaters in the Sierra Madre mountains, joins the
Pasig River 19 kilometres upstream of Manila Bay with an estimated catchment
at the junction of 515 km2
Ř San Juan River which drains most parts of Quezon City and San Juan, unites
with the Pasig River about 9 kilometres upstream has a catchment area of about
Draft
3-1
9:41 AM 02/09/05
Regional Environmental Assessment
86 km2. The San Juan River is the most polluted major water body in the Pasig
River system
Ř The Pasig River is tidal, and the freshwater baseflow varies substantially
according to season. High flows of as much as 275 m3/sec usually occur
between the rainy season of June to October, while low flows of about 12 m3/s
occur between April and May. Even smaller baseflows are possible during which
periods the water quality deteriorates even further. Also during the low flow
season, the Pasig River reverses its flow direction caused by the high tides at
Manila Bay and polluted waters can return into Laguna Lake.
The Pasig River catchment area is the most densely populated area in the region.
The River system is classified as Class C under AO 34, which means that it should
be maintained suitable for propagation of fish, aquatic resources, recreational use for
non-contact recreation, and industrial water supply. For many years, this standard
has not been met. During the dry season for example, the river is effectively devoid
of oxygen, while the total coliform count exceeds the local standards by several
thousand times.
With respect to Laguna Lake, the increase in direct discharges of domestic and
industrial wastes, and agricultural runoff, plus pollution carried in by tributary rivers,
has degraded the water quality over the years. In the last 20 years, the watershed
area of the lake has become one of the most heavily urbanized and industrialized
areas in the region.
Most of the pollutants in the Region eventually end up in Manila Bay.
3.2 Topography
The region is generally flat, with 67.5% of its territory having level to nearly level
slope, while 24.5% of the total land area has a slope between 3-8%.
3.3 Vulnerability to Flooding
Many areas within the region are vulnerable to flooding. This vulnerability is a result
of a combination of several factors which include its location within the tropical
monsoon region, being a flood plain of generally low elevation, intensive urbanization
which increases runoff intensity, and inadequate drainage.
About 20% of the more than 20 typhoons frequenting the country each year pass
though the Region. Associated heavy downpour during typhoons inundate about 20
percent of the region particularly in the eastern, south-eastern, and southern parts,
particularly those areas bounded by the Laguna Lake which includes Taguig and
Muntinlupa. There is a positive correlation between the extent of flood prone areas
and the cities and municipalities with larger proportions of low-income residents.
The following has aggravated flooding:
Ř Ground level subsidence due to over extraction of ground water
Ř Rapid increase in population, particularly the informal housing sector, which finds
refuge along the river banks, canals, esteros, and waterways This blocks access
of maintenance personnel and equipment, accelerates accretion in waterways
which reduces the conveyance capacity.
Ř Disposal of solid wastes to waterways, estimated at 25% of the total solid waste
generation of 8,000 tons per day in the Region which clog drainage canals,
poses health risk, and increase the likelihood of flooding
Draft
3-2
9:41 AM 02/09/05
Regional Environmental Assessment
As early as 1952, a Master Plan for the Drainage in the Manila Area had been
prepared. But it was only after the severe floods of 1972 that major flood mitigation
measures were undertaken. These resulted in the establishment and operation of
seven pumping stations, and the construction of two floodgates and four drainage
mains between 1974 and 1978. By 1980, construction of the 10-kilometer
Manggahan Floodway was initiated, linking Marikina River to Laguna Lake to use the
latter as temporary flood storage and ensuring the controlled release of floodwaters
through the Napindan Hydraulic Control Structure.
In summary, the majority of the Region is low lying and floods frequently.
3.4 Land Use
About 70 % of the total land area of the Region is built-up, followed by open land
which accounts for 15% of the territory. Most of the open lands are located in
Valenzuela, South Caloocan, Taguig, and Paranaque. The remaining grassland and
woodland orchard areas are found in Taguig and Muntinlupa, respectively. See
Figure 4-2 for details.
This indicates that the Non-Point Source (NPS) pollution caused by runoff from
agricultural lands will not be a critical factor in determining the pollution improvement
strategy. Point source discharges from the Individual Septic Tanks and urban NPS
pollution should be the focus of the improvements.
3.5 Regional Flow Regimes
3.5.1 Wet and Dry Season Flow Variation
Of specific relevance is the hydrology of the Region, as the wet/day season
variations have major impacts on local water quality and ecosystems. The Regional
water systems are effectively bi-phasic, with very poor water quality and ecosystem
diversity in the dry season but with marginally better ecological conditions in the wet
seasons.
This is because the variation in freshwater base flow is critical in determining water
quality in tidal systems such as the main watercourses in the Region. Advection, or
water movement due to the freshwater base flow, is far more effective in moving
pollutants out if the rivers than tidal mixing/dispersion in the tidal reaches. The ability
of advective forces to move pollutants out of the Region is many tens of times
greater than longitudinal tidal mixing and dispersion due to tidal mixing activity alone.
The main (lowest) hydrology measuring station on the Marikina River indicates flows
approaching zero in the driest years (0.8 m3/s in January 1990), but with a typical
dry-weather low flow of approximately 10 m3/s. The 80 percentile guaranteed flow
(instantaneous) is only 0.8 m3/s. The peak flow was recorded at 1,358 m3/s in
September 1989.
The DANIDA report (1999) notes that the average river flow is approximately 200
m3/s over a full year, with wet season flows consistently approaching 600 m3/s.
Therefore any pollution or health management strategy must take account of the
wide variation in water quality and health risks on a seasonal basis.
Draft
3-3
9:41 AM 02/09/05
Regional Environmental Assessment
3.5.2 Tidal Influence on Laguna Lake
In the later part of dry seasons when advecting (fresh water) flows are minimal, the
tidal influence on higher tides is sufficient to generate flow reversal in the Pasig River
estuary. This means that the polluted water within the lower reaches of the river is
carried back up the estuary to the Pasig River and Taguig Rivers. Depending upon
the flood control gates at Napindan, flow reversal can occur into Laguna Lake.
This is actually encouraged at present as the salinity in the estuarine water facilitates
coagulation of the turbidity in Laguna Lake. The additional water clarity as well as
the nutrients in the river water then causes algal blooms. This is not desirable from a
water quality viewpoint, but the algal bloom is encouraged as supplementary fish
food for the fish farming activities within the lake. In terms of protecting water quality
in Laguna Lake, this should not be allowed to occur. If the water quality or ecology
of the Lake is permanently altered by this management intervention to cause algal
blooms, then the water quality of the Pasig River will also suffer. Water from the
Lake presently is of much higher quality than the Pasig River and drains into the
Pasig River for the majority of the year.
3.6 Groundwater
The groundwater system of Metro-Manila consists of alluvial sediments (found in
coastal areas of Manila Bay, Laguna Lake and Marikina Valley) and pyroclastic
sedimentary formations underlying most of the remaining areas of the region. The
aquifer system covers about 1400 to 1800 sq km. In general, the region's aquifer
system consists of an upper water table aquifer of up to 30-m depth and the lower
artesian (pressurized) aquifer of more than 500-m thickness. Semi-confining layers
separate these two strata with thickness of up to 45 m.
A simpler way of classifying the aquifer system is to divide it into confined and
unconfined formations, as the dynamics of water abstraction and leakage
(movement of water) between the two formations influence the way water
contaminants can enter the systems.
3.6.1 Confined Aquifers
The main productive aquifers of Metro-Manila are the pressurized, confined aquifers
found underneath the region's north to south axis. Specifically, these are located
beneath the Guadalupe and the Antipolo Plateaus. The main system, formed by the
Guadalupe formation, covers some 470 square km. It is also believed to extend
beneath the bed of Laguna Lake. Groundwater is stored and transmitted in this
main aquifer by openings and fractures in the tuffaceous formation. The aquifer is
under pressure (thus the term artesian). It is separated from the overlying material
by a semi-permeable layer, called an aquitard, whose thickness varies from 15 to 45
m. The aquitard helps prevent rapid movement of contaminated water into the
confined aquifer from the upper formations.
In some parts of Metro-Manila where drawdowns of more than 50 m have been
caused by overpumping, the main aquifer has been converted to a water table
aquifer (i.e, the aquifer is no longer pressurized). In losing its pressurized condition,
the aquifer has become more vulnerable to contamination from downward leakage of
polluted water. This drawdown confirms that groundwater is a major water source.
Draft
3-4
9:41 AM 02/09/05
Regional Environmental Assessment
3.6.2 Unconfined Aquifers
Above the confined aquifers are water-bearing formations that are not in pressurized
condition. They are also called water table aquifers or shallow aquifers. This
groundwater occurs in a non-pressurized state. Alluvial sediments derived from
erosion of the Guadalupe formation provide the medium or material for the region's
water table aquifers.
Such alluvial sediments occur in three areas within the region: the Manila Bay deltaic
plain, the Marikina Valley, and the alluvial deposits found at both the periphery and
bottom of Laguna Lake. The alluvial sediments occur as irregular lenses varying in
thickness from about 50 m along the Manila Bay shore to about 100 m near and
underneath Laguna Lake.
The hydrogeological and water supply data confirms that protecting the groundwater
resource is critical. This means that pollutants should not be allowed to
unnecessarily enter the local water table and possibly leach into the confined aquifer
at depth. Given this background, and the size of the population of the Region, the
usual option of requiring leach fields for sullage flowing from the ISTs would be
inappropriate. Leach fields or infiltration trenches are appropriate where;
Ř the population density is low,
Ř the soil type is a heavy loam,
Ř the water table is at depth, and
Ř the groundwater is not heavily used for a water supply.
This is not the case in the Region. Therefore any strategy could not recommend
retrofitting leach fields to the more than one million ISTs in Metro Manila, even if
there was sufficient land for this disposal option.
Based on these data, the sullage should therefore be conveyed for treatment and
not encouraged to infiltrate into the soil profile.
3.7 Sources of Water Pollution
Water pollution and the attendant ecological causes may be assessed based on a
variety of parameters. The most common of concern in highly polluted waters are
measures of oxygen demanding substances, such as BOD5 and COD. Secondly are
suspended solid materials which limit light penetration, cause sedimentation and
smothering of the benthic organisms, and abrade fish gills.
Other groups include nutrients, oils, heavy metals such mercury and persistent
chemicals, such as pesticides.
3.7.1 BOD5
There have been many estimates of water pollution sources in the National Capital
Region. In 1995, the Environment and Natural Resources Accounting Project of the
DENR estimated that the services and households sectors are the major contributor
of Biochemical Oxygen Demand (BOD5) to the region's surface waters accounting
for 99% of the total BOD5 load. Domestic wastewater contributes over 70% of the
total BOD5 in the Region.
Draft
3-5
9:41 AM 02/09/05
Regional Environmental Assessment
Table 3 - 1.
Estimated BOD5 Loads in NCR 1992 (DENR,1995)
Sector
BOD5 (Tonnes)
Services
745,784
60.55%
Households
479,774
38.95%
Coco Oil Milling
2295
0.19%
Beer Production
2259
0.18%
Pulp and Paper Milling
915
0.07%
Leather Production
495
0.04%
Desiccated Coconut
132
0.01%
Bakery Products
52
0.00%
Wood and Wood
15
0.00%
Products
Rice and Corn Milling
8
0.00%
TOTAL
1,231,729
100.00%
A more recent WB Report (2003) identified the domestic sources as the principal
contributor, accounting for 99% of the volume of wastewater, and 58% of the BOD
load generated in the National Capital Region. The region itself accounts for 14.8%
of the total BOD generation, 42% of the total industrial BOD generation, and 17.6%
of the total BOD domestic generation of the country.
There is some difference between the various estimates of the impact of domestic
wastewater load contributions. For example, one of the most comprehensive BOD
load studies was undertaken by DANIDA and completed in 1999. It concluded for
the Pasig River catchment that the domestic wastewater accounted for 61% of the
BOD load in 1995 and that this would increase to 85% in 2015.
Regardless of which estimate is adopted, all indicate that domestic wastewater is the
major contributor of BOD to the local watercourses, and that this proportion will
increase over time unless appropriate interventions are instituted. This increase is
due to;
Ř an ongoing reduction in industrial loads, due to better discharge licence policing,
cleaner production and a reduction in industrial activity in the Region, and
Ř an increasing population resulting in increasing domestic wastewater loads in the
Region.
3.7.2 Suspended Solids
For other parameters such as Suspended Solids, urban runoff dominates with 80%
of the load attributed to this source and secondly beer production.
Draft
3-6
9:41 AM 02/09/05
Regional Environmental Assessment
Table 3 - 2.
Estimated Suspended Solid Load in NCR 1992 (DENR,1995)
Sector
SS Load
% Share
Urban Runoff
45,614
80.5%
Beer Production
5,792
10.2%
Coconut Oil Milling
3,402
6.0%
Pulp and Paper Milling
1,089
1.9%
Leather Production
767
1.4%
Rice and Corn Milling
12
0.0%
Wood and Wood
8
0.0%
Products
TOTAL
56,684
100.0%
The monitoring of urban drains for this and other projects confirms that the
Suspended Solids levels are low from domestic sources. Suspended Solids is a
critical parameter as it smothers any benthic organisms (bottom dwelling life) and
also abrades the gills of fish. Finally it reduces the clarity of the water which reduces
primary productivity in the waterway as light penetration is reduced, and also there is
reduced aesthetic attraction with turbid waters.
3.7.3 Pathogens and Indicators
Other key parameters are health related, such as E.coli bacteria or Faecal Coliforms.
These are indicator species that have been statistically correlated to water borne
disease risk. These indicators, as well as the pathogens that they mimic, are
primarily sourced from human waste. There are other warm blooded mammals that
can yield these indicators but more detailed analysis of ratios of Faecal Coliforms to
Faecal Streptococci, and other specific methods, can refine the source.
In any case, it is well documented that the elevated pathogen and indicator counts in
the Region's waterways are predominantly sourced from untreated and non-
disinfected human waste products. As the population further increases, the
concentration of these indicators and the pathogens themselves will increase unless
the wastewater is treated and disinfected.
The disease risk is also compounded by the general morbidity of the population. As
infected individuals release waste which is not treated, the possibility of epidemics is
heightened. A circle of increased community morbidity results in higher pathogen
counts in untreated wastewater, which increases the disease risk to other
unprotected members of the community.
3.7.4 Nutrients
Nitrogen and phosphorus are two main components of domestic wastewater,
including sullage flowing from ISTs. Nutrients act as fertilisers on the land,
encouraging plant growth. They do the same in the water environment, and are
essential to balanced primary productivity. However when present in excessive
levels they can result in excessive algal growth which may manifest itself as simple
algal blooms, blue-green algal blooms in the estuary or red tide events in the Bay. In
any case, the excessive algal content imbalances the aquatic ecosystem, and can
result in toxins entering the food chain.
Draft
3-7
9:41 AM 02/09/05
Regional Environmental Assessment
There is no real data collated for nutrient loads into the local waterways. This is not
critical when the Dissolved Oxygen levels are so low that life is essentially eliminated
from waterways. However as the DO levels improve, there will be a need to manage
nutrient levels to prevent uncontrolled algal blooms in Regional rivers and Lakes, and
escalated red tide events in Manila Bay.
3.7.5 Persistent Pollutants
This category includes pesticides, weedicides and other organics such as solvents,
oils and grease and aromatics. Inorganics would include heavy metals such as
cadmium and copper, and asbestos.
Industrial processes and non-point source runoff are the most common source of
these chemicals. In the Region, there is relatively little agriculture and so this would
only be minor source. The industrial facilities would be the main source of these
persistent pollutants.
The European Union (1997) estimated these pollutants are being introduced into the
river systems in the Region at over 80,000 tons per year.
3.7.6 Solid Waste
Solid waste is also a pollution source. Only 6,000 tonnes of solid waste generated in
the Region is collected out of the 8,000 tonnes produced daily. The 2,000 tonne
difference is illegally dumped, burnt or thrown into drains or esteros. (ADB, The
Garbage Book Solid Waste Management in Metro Manila, ADB, 2004). The solid
waste is then flushed into the local watercourses in wet weather. In terms of BOD
and SS, solid waste is only a minor contributor however. The main issue is the
stable residuals such as plastics in the solid waste that ;
Ř block drains escalating the possibility of flooding,
Ř enter the local waterways causing visual pollution, and
Ř become a health risk for larger marine species, which can choke or strangle on
these plastics.
3.8 Population
The region's population is increasing rapidly, and this will result in increasing
pollution load, unless interventions are initiated.
Specifically the population within the MWCI concession area (East zone) is predicted
to increase from 5.3 million persons in 2004 to 8.2 million in 2021. There are no
indications that the population growth will subside even after this period of sustained
growth.
The increase is due to a mixture of rural population drift into the city, as well as
overall population growth in the country. With respect to population drift, there are
no real provisions to prevent this population drift in terms of land use planning and
development controls restricting land development for housing. There is some
limited NGO support for general family planning initiatives, but these efforts are
generally ineffective on any measurable scale to date.
Draft
3-8
9:41 AM 02/09/05
Regional Environmental Assessment
4 Baseline Conditions
The baseline details are presented in full in Appendix A Baseline Data. All baseline
figures are also contained in this appendix. The Appendix includes some esoteric items
such as detailed topography that do not have a direct impact on the proposed
development but are included for the purposes of completeness.
4.1 Terrestrial Environment
Civil works in the NCR under the MTSP will specifically be undertaken in the cities of
Quezon, Mandaluyong, Makati, Pasig, Marikina and the town of Taguig. As a highly
urbanized region, the landscape or terrestrial environment consists mainly of dense
human settlement areas, industrial sites, financial and commercial establishments and a
network of roads and bridges.
The vegetation cover is restricted to man-made settings (memorial and home gardens,
city parks, trees and ornamental lining and hedging streets) and a few remaining open
areas (both private and government properties). These include natural successional and
disturbed habitats, and patches of cultivated lands, which are rapidly being reduced in
area due to population and urbanization pressures. In a decade or so, most of the
privately owned natural areas will be transformed into housing, commercial and industrial
sites.
The government lands may soon be taken over by the region's homeless families unless
programs are formulated to prevent such an eventuality.
4.1.1 Terrestrial Flora
The key conclusion from the terrestrial surveys is that none of the proposed STP sites
contain any rare or endangered plant species.
At the Taguig Sewerage System, the vegetation cover of the floodplains adjacent to the
pumping stations and retention ponds are dominated by grasses, herbs and sedges in
association with a few shrubs that characterize open, waste and generally damp
habitats. A majority of the herbaceous growth forms belong to the Gramineae,
Leguminosae and Compositae Families. Their ecological importance rests mainly in their
role as primary producers in the ecosystem and as soil cover to prevent erosion. The
herbaceous cover may also provide habitats for insects and other small field fauna. At
the Tapayan pump station, the flood plains are currently cultivated for rice culture.
According to some long-time residents in the communities along the Hagonoy and
Taguig Rivers, they used to plant vegetable crops in the floodplains during the summer
months before the DPWH Flood Control Program in the area was implemented.
All three catchments located alongside the Pasig River, situated in the cities of Pasig
(Barangay Pineda), Mandaluyong (Barangka Ilaya) and Makati (Barangay Poblacion) are
densely populated with very little and limited open space. The proposed site for the
construction of a STP for Barangay Pineda is devoid of any vegetation cover except for
a few weeds at the edge of the riverbank. These include: Cenchrus echinatus, Chloris
barbata, Eleusine indica (Gramineae), Cyperus difformis, Cyperus distans (Cyperaceae),
Centrosema pubesceus (Leguminosae) and Alternanthera sessiles (Amaranthaceae).
Within the proposed STP site in Barangka Ilaya is a mini-riverside sitting park bounded
by a few (4) young Polyalthia longifolia (Annonaceae) trees and an Ixora chinensis
Draft
4-1
9:41 AM 02/09/05
Regional Environmental Assessment
(Rubiaceae) or santan hedge with some Bougainvillea spectabilis (Nyctaginaceae)
plants. At the edges of this mini-park are a few weeds. The lift station will be
constructed in a concrete space adjacent to an existing basketball court. The site is
devoid of any vegetation.
The site of the proposed STP for Barangay Poblacion in Makati City is a narrow strip of
open space between J.P. Rizal St. and the riverbank. Standing within this strip are two
Cocos nucifera (Palmae) and two Acacia auriculiformis (Leguminosae) trees. On the
ground layer which is hard and sandy are a few stunted Ricinus communis
(Euphorbiaceae) seedlings and weeds.
The site selected for the establishment of the Septage Treatment Plant (SPTP) facility to
service the northern sub-area was to be located near the Payatas open dumpsite in
Quezon City. The Payatas site is basically open grassland dominated by extensive
stands of cogon (Imperata cylindrical) and talahib (Saccharum spontaneum) in
association with ruderal herbs (characteristic of open wastelands). The area does not
have threatened or endangered plant species. The new site in San Mateo has not been
formally assessed as yet but is a completely disturbed site with only regrowth present on
the site, and is surrounded by pig farms and metal works. A detailed EIA will be
completed as required.
For the southern sub-area, the selected site for the SPTP is a vacant lot of about a
thousand square meters within the Food Terminal, Inc. (FTI) Complex in Taguig, Metro
Manila. The area is essentially an open wasteland, with a few large trees along the
edges and a stand of ipil-ipil shrubs at its entrance. The area does not contain any
endangered or threatened plant species. Only a few small white and yellow butterflies
were observed to be fluttering over the Amaranthus stand.
The proposed STP site in the Manggahan Floodway East Bank area is an open
wasteland. Most of the 66 herbaceous species recorded in the actual site for the STP
and adjacent areas are the very common grasses, herbs and vines that usually colonize
open areas. The presence of a few species providing edible fruits (Cucurbita and
Momordica), roots (Manihot and Colocasia) indicates that nearby residents may be using
the area to grow these and perhaps other plants during the year.
The STP site at Signal Village (Ipil-Ipil Street) covers an open area within a densely
populated community beside the creek. Because of the sparse vegetation and the size
of the area, a ground inventory of the extant plants was conducted across the proposed
STP. The list does not include any threatened or endangered plant species.
The CST 33 at East Avenue, to be upgraded into a mini regional STP, sits underneath a
small woodland area within the (National Ecology Centre) compound of the Forest
Management Bureau along East Ave. Most of the trees are mature and since they were
planted close to one another, they are quite tall with high canopies. A majority of these
are Swietenia (mahogany) and Bauhinia species. One mature fig tree is worthy of
retention. The site where the trees are growing above the CST had no vegetation cover
or undergrowth because apparently this was being used as a mini-sitting park.
Around CST 20 at Road 5, Project 6 are ornamental shrubs and small trees which
include golden shower, buenavista, bougainvillea, papaya and neem tree. The other
trees in the list are growing in adjacent or neighbouring houses behind concrete fences,
which will not be affected by the project.
Draft
4-2
9:41 AM 02/09/05
Regional Environmental Assessment
In summary, none of the proposed development sites contain any rare or endangered
plant species.
4.1.2 Terrestrial Fauna
There is no wildlife fauna in the project area. The animals present in the area are mostly
domesticated species of dogs, cats, fowls, birds, etc. Water buffaloes were observed in
the Laguna lake area (Taguig Sewerage System). The bird population in the area is not
significant except for those that habitats the lake and rice field areas at Taguig and
Taytay.
It is expected that there are no rare, threatened or endangered species of animals in the
project area due to its urban setting.
4.1.3 Air Quality
Air quality is generally poor throughout the Region, depending upon wind, rain and
atmospheric stability class. This applies to suspended particles, odour and haze/clarity.
For example, based on the EMB/DENR air monitoring results from 2003, the mean
monthly TSP levels are approximately twice the local standard of 90 ug/Nm3.
The development will have no measurable impact, either positive or negative, upon
Regional air quality. All treatment plants will either be enclosed or located underground.
Therefore more details on air quality is unimportant for the REA.
4.1.4 Noise
Noise studies were undertaken. The proposed developments are within a megalopolis
and the noise readings simply reflect the noisy background.
Results were a minimum of 3 dB(A) above the DENR standards, and as much as 30
dB(A) at some sites.
4.2 Water Quality
The main watercourses of interest to the REA are the Pasig Marikina system including
the San Juan River, as well as Laguna Lake. However an overview of other water
quality monitoring data for other water systems in the Region indicated the same general
water quality status. Very poor water quality in the middle reaches of the estuaries, with
marginally better water quality closer to the better water quality in Manila Bay and any
freshwater inflows from catchments above the higher density urban areas.
The ongoing DENR monitoring results for the Region were supplemented by some
specific monitoring for the MTSP.
The project specific water quality monitoring results included in Appendix A need to be
put in context. It was only one sampling run and was generally concentrated on the
immediate receiving water (discharge tributaries) not the main receiving water bodies,
namely the Pasig River and Laguna Lake. Therefore the project water quality data more
reflects the quality of the effluent to be treated rather than the water quality of the main
receiving water. Each site was only sampled once, mainly in November and December,
Draft
4-3
9:41 AM 02/09/05
Regional Environmental Assessment
which is outside the main wet season. Hence most local flows in smaller tributaries
would be dominated by wastewater rather than stormwater runoff.
Therefore there is a need to review other longer-term datasets to supplement the
specific baseline survey undertaken for this REA
4.2.1 Background
The dry/wet season change substantially impacts on water quality in the Pasig River and
Marikina Rivers, and to a lesser extent Laguna Lake. Traditionally Non Point Source
(due to stormwater runoff) impacts usually deteriorate the water quality. This because
catchment pollutants pollute the NPS which are mobilised by the stormwater runoff,
resulting in additional pollutant loads on the receiving water. This results in poorer water
quality until the runoff flows or is tidally flushed out of the receiving water system.
In this Region, the opposite applies. The runoff waters are still contaminated by
catchment pollutants, but the runoff quality is far superior to the dry weather flow quality
of the Region's Rivers and main lower tributaries. As a result there are two very
different water quality states in the Region. The dry weather (poor) water quality
scenario and the wet weather (improved water quality) scenario define the two states.
As a result, any water quality monitoring data must be calibrated against the river flow at
the time of sampling.
The first few millimetres of rain is usually the most polluted as it flushes out the
pollutants resident in depressions and ponds, or as a dry residue within the catchment.
Therefore in protracted wet weather, the runoff quality improves over time.
4.2.2 Existing Monitoring Programs
DENR is the main department with programs being implemented by EMB Central, EMB
NCR and LLDA.
The location of the monitoring sites used by these three agencies is presented in
Appendix B Water Quality Monitoring Sites and Programs.
EMB Central
This group has undertaken most monitoring over the last decade. A summary of their
recent monitoring is presented in Appendix B Water Quality Monitoring Sites and
Programs.
The monitoring locations are shown in the following figure, along with the sites of EMB,
NCR and LLDA.
The current program is as follows, on an every second month basis:
Ř On-site measurement - DO, Temp, salinity, conductivity, pH, secchi depth, water
depth
Ř Laboratory Analysis - BOD, NH4-N, NO2-N, NO3-N, PO4-P
Earlier monitoring was more frequent, and included Heavy Metals in sediments plus in
water. A number of diurnal sampling programs were also undertaken at selected
stations for in-situ parameters to assist with model calibration.
Draft
4-4
9:41 AM 02/09/05
Regional Environmental Assessment
The monitoring was initiated by DANIDA in 1990, to assist calibrating their model, but
these funds were phased out in 1999. EMB Central is continuing with the monitoring at
a reduced frequency using internal funds.
The aim of the on going monitoring is to provide data to support policy decisions on the
Pasig River and as input to the 5 yearly Philippines Environmental Quality Report.
The data is reviewed by basic ANOVA techniques and trends estimated.
EMB NCR
EMB NCR monitors monthly at 12 sites as shown in the figure. Many of the sites are
identical or close to the Central sites.
The parameters are shown in Appendix B Water Quality Monitoring Sites and
Programs. The parameters include the usual in-situ and basic laboratory parameters,
similar to the EMB Central program.
The data is given to Central for review as part of the policy formulation and also used by
NCR in the role of assessing the trends in water quality as a result of the NCR anti-
pollution effectiveness. This trend analysis is done superficially based on a rudimentary
review. It is doubtful whether this type of monitoring program could reliably detect a
change in water quality due solely to the anti-pollution efforts of NCR as most of the
pollutant load is due to domestic wastewater, not industrial effluents.
The only time that this general monitoring could detect such a change would be if the
industry or industrial group had a specific contaminant unique to the industry that could
be isolated during the data interpretation. This does not seem to be the case.
The policies developed by Central using this data are work-shopped with NCR and
agreed at Director level. However Central has the lead in developing the policies based
on the data.
LLDA
LLDA monitors four stations in the Pasig River during the wet season on a monthly
basis. An additional five stations are monitored during the dry season, more frequently
than monthly usually. In all, 17 parameters are analyzed, and they are enumerated by
wet chemistry back in the laboratory. Little use is made of in-situ probes and meters.
The parameters are shown in Appendix B Water Quality Monitoring Sites and
Programs.
LLDA also monitors a number of stations within the Lake proper.
The main purpose of the monitoring is to understand the quality of water likely to be
introduced into the lake during tidal flows during the dry summer periods. The summer
monitoring aims to follow the salinity recovery back up the estuary.
Bureau of Fisheries and Aquatic Resources (BFAR)
Fisheries Department produced a working document for the Pasig River rehabilitation
project in April 1991. It was only a literature review of studies done in the 1980s and
some in the early part of 1990s. There was no data on catch tonnage or ease of
catching, since fish presence was primarily due to migration from Laguna Lake to Manila
Draft
4-5
9:41 AM 02/09/05
Regional Environmental Assessment
Bay via Pasig River, rather than local breeding within the River itself. This migration is
anecdotally reported to have started to decline as early as the 1930s. The Department
is now concentrating monitoring efforts on seven lakes throughout the Philippines and
has no programs planned for the Pasig River.
The BFAR does not conduct any water quality monitoring activity in the Region.
Monitoring of fish quality, particularly following "red tide" occurrence, is concentrated in
Manila Bay.
DPWH
DPWH's monitoring activities on the Pasig River is brought about by the dredging
activities of the Project Management Office - Flood Control of the DPWH.
Parameters monitored on the water quality surveys are turbidity and suspended solids,
using a portable test meter. Volume of silt is also measured but there are no heavy
metal analyses. Samples are taken on a weekly basis. Analysis is done using a field
testing kit owned by the project contractor.
Monitoring stations are as follows:
Ř Dredging area (between Jones Bridge to the mouth of the river)
Ř Upstream 100 meters away from the dredging area towards Jones Bridge
Ř Upstream 300 meters away from the dredging area towards Jones Bridge
Ř Downstream 300 meters away from the dredging area going to the mouth of the river
Ř Downstream 600 meters away from the dredging area going to the mouth of the river
The water quality monitoring activity is a condition of the Environmental Compliance
Certificate (ECC) which was issued for the dredging works by the DENR-NCR last
August 2001. The monitoring activities will terminate after the dredging activity, hence,
is not part of a regular program.
The DPWH said that the contractor submits the results of the tests to the DENR, but the
NCR-EIA Division has not received DPWH's monitoring report as at November 2001.
Coastguard
The monitoring is events based relating to oil spills.
MWSS, MWSI and MWCI
No regular monitoring program for ambient water quality is undertaken on an ongoing
basis. Some project-specific short term baseline studies have been completed.
Department of Health
No ambient monitoring program is undertaken, but some discharge monitoring is
ongoing.
4.3 Review of Water Quality Monitoring Datasets
A number of reports have been reviewed, such as the Pasig River Rehabilitation Project
Feasibility Study 1991. These data indicated that the heavy metals levels in sediments
were all below Dutch B (Investigation Threshold) levels for potentially contaminated
sites. The metals levels in water were also below the AO34 criteria.
Draft
4-6
9:41 AM 02/09/05
Regional Environmental Assessment
There is ongoing debate about the relevance of these criteria but they still provide a
basis for the first cut consideration of exotics in sediments. The actual bioavailability and
mobility of these metals requires detailed site specific studies to investigate the drivers
such as pH, carbonate content, organic content and complexing agencies within the
sediments. This would involve significant efforts to refine the data specifically for the
Pasig River and cannot really be justified at this stage given the gross contamination
already present in the water column.
This indicates that heavy metal levels in the river sediments are not critical.
With the DENR data sets, the data had a very large number of extreme outliers. These
outliers markedly reduce the utility of the data set, and some of the possible causes are
listed below. Preventing the inclusion of obviously incorrect data is a fundamental issue
that will have to be addressed in future monitoring programs.
4.3.1 Possible Testing Anomalies
The COD test uses dichromate in boiling sulphuric acid making a very strong oxidant.
So strong in fact that it oxidizes chloride to chlorine. The COD test adds mercury salts to
precipitate the chloride as mercury chloride and remove the chloride from the solution.
The standard method for COD adds sufficient mercury to complex up chloride
concentrations in water samples containing up to a few hundred milligrams per litre of
chloride. To do CODs on marine or other saline waters, more mercury salt must be
added. It is usually necessary to experiment by adding mercury salt and repeating the
COD till the results become independent of the increasing mercury additions. The
problem is referenced in the Standard Methods. If only the standard amount of mercury
is added then erroneous readings will result in saline samples.
Discussion with various analysts suggested that the COD procedure may not have
always been followed precisely for any high saline samples.
Similarly, BOD is determined by diluting a sample over a suitable range, and then adding
a biological seed to start consuming the oxygen in the diluted water sample.
A problem can occur if the dilutions are low and the water sample is saline. This salinity
may not allow the seed to acclimate sufficiently quickly, thereby reducing the seed's
biological activity and an artificially low BOD result is obtained.
The analysts were aware of the problem but could not be definitive as to whether there
was always sufficient dilution to ensure good seed acclimation.
Based on these, there may be some doubt over the validity of some COD and BOD
results during the critical summer period when water salinities are higher within the
estuary.
4.3.2 Possible Data Anomalies
An inspection of the existing datasets and review of field techniques suggest that there
may be other sources of data errors, such as.
Ř The DO data for the Bottom and Surface locations at some sites appears to have
been reversed occasionally. For example, the May 24,2000 survey results for Jones
Draft
4-7
9:41 AM 02/09/05
Regional Environmental Assessment
Bridge has the DO at the Bottom site recorded as 6.3mg/L and the Surface DO at
the same site recorded as 1.8mg/L. This would be most unusual as the surface DO
levels are usually much higher than the bottom results, unless there is a very
significant salt wedge effect.
Ř The June 24, 2000 results for Lambigan Bridge indicate high D.O. levels associated
with high ammonia and low Nitrate and Phosphate levels. This is unusual as the
high DO levels would usually allow the ammonia to rapidly oxidise to nitrate.
These apparent anomalies demonstrate that both field and laboratory results must be
reviewed before the data is entered into the main data set. The data may in fact be
correct, but the anomalies should be investigated as part of a regular QA procedure.
Such data irregularities restricted the statistical interpretation of the existing data set as
there are simply too many extreme outliers.
4.4 Interpretation of Water Quality Data
Of the datasets available, the DENR (EMB Central) data is the most comprehensive and
was the only set reviewed in detail. Based on inspection of the other data sets, the
comments relating the Central monitoring data would equally apply to the NCR and
LLDA data.
The plots and tables of selected Central data are presented in Appendix C
Monitoring Data Graphs and Tables. Only DO and BOD were reviewed as these were
the largest data sets available. The results of the review are presented below.
4.4.1 Seasonality and Correlation
There is obvious seasonality in the data, and therefore the data will have to be broken
into seasonal subsets prior to any detailed trend analysis in future.
There is a valid negative correlation between BOD and DO as would be expected.
4.4.2 Sampling Frequency
The datasets are based on monthly sampling. The data indicates that this frequency
should be adequate to allow inter-year trend analysis, once replication is introduced.
4.4.3 Sampling Time and Tidal State
Data is presently collected at the same time of the day without correlation to the tidal
state.
This is acceptable if the data is used primarily as model input, as the model takes
account of tidal state when interpreting the data. However general ecological and water
quality data should not have to be interpreted in such a way as this adds another
variability factor to the data set. In future all data should be collected at the same tidal
state, usually high water. This is done by starting the survey at the estuary mouth at
high water slack and then following high tide up the estuary. This will limit the tidal state
as another factor in data variability.
If additional diurnal data is required for the model, then a special survey should be
undertaken.
Draft
4-8
9:41 AM 02/09/05
Regional Environmental Assessment
4.4.4 River Flow Data
The data is clearly seasonal, primarily due to wet weather flows of some 200 cubic
meters per second reducing to only a few percent of this in the dry season.
Therefore the river flow must be obtained from DPWH and input as one parameter in the
consolidated dataset. The flow data may not be obtained at the same time but can be
added to the consolidated data set later.
Incorporating the flow data into the trend analysis will be essential for the future
quantitative statistical reviews.
4.4.5 Replication
The present datasets do not contain replicate samples. Replicate samples are where a
number of samples for the same parameter are taken a few minutes apart at the same
site or quickly after one another at a number of locations within a short distance of the
nominal monitoring location. This applies to both collecting samples and in-situ
recording of results in real time.
When the data is reviewed statistically, the amount of within site variability is
enumerated in terms of a reduced ability to detect the adopted level of acceptable
change at the specified level of confidence.
4.5 Summary of Water Quality Data
4.5.1 Overview
The water quality data presented in Appendix A was obtained specifically for this REA
but more reflects the wastewater strengths than the ambient conditions. This is because
the sampling locations were very close to the discharge locations and were sometimes
located in small drains that had minimal diluting flows. These drain flows are going to be
intercepted in some cases for diversion into STPs, so the monitoring results may not
always be appropriate for future comparisons. Only undertaking one survey also means
that the data cannot be used for future comparisons with any statistically significant level
of confidence.
The DENR data confirms that the majority of the Region has very polluted water in the
dry season, with the key parameter, namely DO, approaching zero. This precludes any
effective ecosystem development apart from opportunistic algal blooms and motile fish
species. The water quality is generally better in the upper freshwater reaches and
Laguna Lake, and the mouth of the watercourses where the better water in Manila Bay
improves the water quality. The poorest water quality is in the lower estuaries.
In the wet season, the catchment runoff dilutes the polluted water in the estuaries and
esteros, and water quality improves. However the DO levels still do not consistently
achieve the criteria of 5mg/L.
4.5.2 Utility as a Baseline
The dataset had to be manipulated to such an extent that a quantitative statistical review
of the Level of Confidence for predicting trends is inappropriate.
Draft
4-9
9:41 AM 02/09/05
Regional Environmental Assessment
The basis for this conclusion is that only grossly obvious data errors can and have been
retrospectively deleted from the data set. It is very likely there will be a significant
number of data points which are in error are still within the data set, so undertaking
quantitative statistics would be inappropriate on what is expected to be a fundamentally
flawed data set.
The data also demonstrates high levels of inter-annual variability. This means that the
present dataset cannot be used for trend interpretations based on just using one years
data. For example, the BOD levels at Site 6 decreased significantly from 1998 to 1999,
but the previous 5 years show a very different trend. This indicates that any formal trend
conclusions should only be made if at least 5 years data is reviewed. This also means
that any proposed monitoring program must be run for a number of years before making
statistical interpretations of the possible trends.
The overall conclusion is that the existing monitoring programs have some utility but are
insufficient to be able to detect trends in water quality and ecosystem recovery at a
suitable level of confidence for the adopted level of acceptable change in the future.
Therefore a more comprehensive monitoring program is still required to statistically
determine present water quality conditions, and allow valid comparisons with future
monitoring to assess improvements or otherwise.
4.6 Aquatic Ecology
An Aquatic Ecology Survey was undertaken for this REA to determine the present
ecological state of the river systems and other water bodies which may be affected by
the proposed sewage treatment plants (STPs), and the upgrading of existing communal
septic tanks (CST) to sewage treatment plants. Samples were collected from near the
locations of the proposed developments. The locations and a full description of the
survey is provided in Appendix
4.6.1 Plankton
The phytoplankton communities of all areas studied were characterized by a scarcity of
diatoms and were generally dominated by the abundance of blue-green algae, primarily
Polycystis (the most numerous) that are considered to be characteristic of eutrophic
("nutrient-rich") water body. This is a condition that represents one of the more serious
and extensive forms of water pollution. The present findings are identical with the
generalized conclusion that in eutrophic water or those with high pH, blue-green algae
are more abundant and in clear waters of neutral pH diatoms are the more abundant.
The animal plankton communities studied were dominated by ciliate Paramecium and
phytoflagellate Euglena (most common micro-zooplankton organisms although not
present in all sampling stations) that form a part of the food supply for minute aquatic
animals. The presence of these protozoans in the plankton samples indicates that the
freshwater bodies surveyed are very rich in decaying vegetation and/or organic matter.
The plankton therefore indicates very polluted, especially eutrophic, waters in the
Region.
4.6.2 Soft-Bottom Benthos
The nature of the waterway bed (the substratum) is the most important factor influencing
the distribution of benthic organisms. Many other factors such as DO levels above the
Draft
4-10
9:41 AM 02/09/05
Regional Environmental Assessment
bed, light intensity, nutrients, water movements, stability of the substrata and water
depth also affect the distribution and biological diversity of the benthos.
In Quezon City, no study on benthos was done due to the hard bottom conditions of the
sampling sites. Similarly, hard bottom was observed in all the outfall stations along Pasig
River. Thus, sampling for benthos in these stations was also not possible.
However, only 2 major taxonomic groups, namely, oligochaeta and insecta (diptera),
represented the soft-bottom benthic communities along the upstream and downstream
areas of the Pasig River. The observed presence of this benthic organism at these two
stations would be partly due to the kind of sediment, namely sandy-muddy with gravel.
The colour of these bottom sediments in Pasig River was black with a smell of hydrogen
sulphide, consistent with the highly polluted nature of the water column above. The
benthos of the areas surveyed in Pasig River was relatively poor. The highly polluted
bottom substratum, due to the accumulation of large amount of waste materials, does
not afford an environment suitable for soft-bottom benthic organisms.
The bottom in Marikina River was characterized by muddy with sand and debris type of
sediment while at the outfall was muddy with debris. The colors of these bottom
sediment types were black. The only soft-bottom benthic fauna that were observed in
these stations were polychaeta (solely represented by nereid Namalycastis sp.),
oligochaeta and insecta (solely represented by dipteran larva Chironomus sp.).
All the samples taken from the upstream areas in Taguig were characterized by the total
absence of benthic organisms, except in the Taguig River upstream where only a
nematode was present. The type of substrates at these stations consisted of mud full of
debris. These sediments probably enabled the benthos dwellers to thrive. Tapayan
River upstream was not sampled because of the nature of its bottom which is full of solid
wastes.
The soft-bottom benthic communities in the downstream area can be characterized as
an oligochaete population. The type of substrates at these stations consisted of mud
with debris. Available information based on monthly monitoring surveys conducted in
Laguna Lake showed that oligochaetes in Laguna Lake were represented by
Limnodrilus, Branchriura and Naididae. Among the midges or chironomid larvae
population, only Chironomus sp., was present in the samples but only in one location at
Labasan River downstream.
In Pinagsama Village Creek, collection of sediment samples was not attempted because
the water body was full of floating solid wastes dumped in the area. On the other hand,
several attempts failed to collect bottom sediment samples during the survey in East
Manggahan Floodway (Taytay). It was observed that the bottom of the floodway was full
of submerged solid wastes such as plastic, rubber, clothes, rice sacks, cans, bottles, etc.
Thus, no benthos samples were taken at this station for soft-bottom benthos analysis.
In summary, the benthos is poor in the Region, with only moderate species diversity and
counts recorded in the better ecosystems of Laguna Lake. This correlates well with the
water quality data for these watercourses.
Draft
4-11
9:41 AM 02/09/05
Regional Environmental Assessment
4.6.3 Fisheries, Types of Aquatic Life and Other Uses
No fishing activity of any type occurs in the water bodies surveyed in Quezon City.
However, in the process of conducting plankton study at Station 3 (East Avenue),
researchers observed numerous small fishes, probably gambuasia or mosquito fish
(locally known as kataba).
Of the kinds of fishes present in Pasig River, janitor fish (scientifically known as
Hypostomus plecostomus) is apparently the most abundant. The other fish stocks
reportedly present in Pasig River include Tilapia (Oreochromis sp.), Manila catfish or
kanduli (Arius manilensis), Common carp or karpa (Cyprinus carpio), Goby or biya
(Glossogobius guirus), Snakehead or dalag (Ophicephalus striatus), Gourami or gurami
(Trichogaster sp.). Common crustaceans include shrimps or hipon and crabs or talangka
(Orapsus sp.).
These aquatic resources are pollution-tolerant species flushed down from Laguna Lake
or Marikina River. Therefore it is critical to note that these are motile species, and are
only transient in the more polluted reaches of the main waterways in the Region.
Fishing with the use of pole and line or kawil was observed in the Pasig River almost
everyday. Along the riverbanks of Barangay Pineda alone, there are about 30 fishers
operating. The fish caught are not just only for recreation but also for local consumption.
Another form of fishing is the use of fish net or lambat. The gear is operated only in
November and December mainly to catch shrimps or hipon. Fishing with the use of cast
net or dala on board a small non-motorized banca was also observed below the
Guadalupe Bridge.
Janitor fish is also the most common and abundant aquatic life found in all parts of the
Marikina River. Their presence in the area is much more abundant and widespread than
those observed in Pasig River. The Marikina River system supports sustenance fishing.
However, the river ecosystem and the harvestable fish community which is supported,
are highly dependent upon seasonal rainfall. Such fisheries, therefore, are only
produced mainly for family consumption.
The important fishes caught in the river were Tilapia (Oreochromis sp.), Bighead carp
(Aristichthys nobilis), Goby or biya (Glossogobius guirus), Snakehead or dalag
(Ophicephalus striatus), Native catfish or hito (Arias macrocephalus) and Gourami or
gurami (Trichogaster sp.). Kangkong is being grown on both sides of the Marikina River.
The harvest of kangkong is sold in public markets all over Metro Manila.
In the upstream areas of Taguig, fishing is practically non-existent. It was observed
during the survey that Taguig River system is mainly used for boating (navigational)
purposes, such as the transport of local farmers/fishers and the agriculture/fishery
products.
Fishing and gathering of other aquatic products are extremely heavy along the shore
areas of Taguig River systems in Laguna Lake. The commercially important fishes
caught in the lake were Tilapia (Oreochromis sp.), Silvery therapon or ayungin
(Therapon plumbeus), Manila catfish or kanduli (Arius manilensis), Goby or biya
(Glossogobious guirus), Bighead carp or bighead (Aristichthys nobilis), Milkfish or
bangus (Chanos chanos), Snakehead or dalag (Ophiocephalus striatus), Common carp
or karpa (Cyprinus carpio), Gouramy or gurami (Trichogaster sp.) Catfish or hito (Clarias
sp.) and Lacustrine goby or dulong (Mirogobius lacustris).
Draft
4-12
9:41 AM 02/09/05
Regional Environmental Assessment
Generally, the quality of fish obtained in the lake is quite poor due to the small size of the
fish caught. The lake's estimated annual fishery production varies. Fish production
declined from 82,881 in 1963 to 20,398 mt in 1980. Snail production decreased from
153,880 to 66,132 mt in the same period.
Fish pens and fish cages are also placed along the shores of the project site. Laguna
Lake Development Authority (LLDA) regulates the construction of the fish pens and fish
cages in the lake. The revised Fishery Zoning and Management Plan (ZOMAP) allotted
10,000 hectares of fish pens and 5,000 hectares for fish cages.
There used to be 13 kinds of aquatic plant life in the Laguna Lake; now, only two--the
kangkong and the water lily--are left. Growing of kangkong was observed in Labasan
River downstream. A total of about 5 kangkong gatherers were noted in the area during
the survey.
Fish habitation is non-existent in Pinagsama Village Creek. Likewise, no aquatic plant
life was observed in the area during the survey.
Janitor fish was also present at the East Manggahan Floodway. Fishing for recreation
and/or for local consumption by some local residents was reported to exist in the area.
Hook-and-line or kawil is the most common fishing gear used to catch Tilapia
(Oreochromis sp.), Bighead carp (Aristichthys nobilis), Snakehead or dalag
(Ophicephalus striatus), Native catfish or hito (Arias macrocephalus) and Gourami or
gurami (Trichogaster sp.) and Climbing perch or martiniko (Anabas testudineus). Shrimp
or hipon also enter the catches of the sustenance fishers in the area. Kangkong was
also observed along the floodway and is used as food by some local residents.
The fish data confirms what the water quality and benthos data indicates, namely that
the ecosystem improves from the lower Pasig River, to Upper Pasig River, to Marikina
River and to Laguna Lake. However, none of the areas could possibly be considered to
be in good ecological condition.
4.7 Socio-Economics
4.7.1 Population, Density, and Land Area
The NCR is the hub of political, economic, and institutional activities of the country. The
Region accounts for 13% of the country's total population. Between 1990-2000, the
region's population increased from 5.9 million to 9.9 million persons. (National Statistics
Office, 2002). The cities of Manila and Quezon, with populations of 1.5 million and 2.1
million, account for 16% and 22% of the Region's year 2000 population. In contrast, the
Municipality of Pateros is the least populated local government unit (LGU) with 57,407 or
about 0.6% of the region's population. The City of Manila is the most densely populated
LGU with 63,290 persons for each square kilometre, and this is followed by
Mandaluyong and Navotas with 29,976 and 25,772 persons per square kilometre
respectively.
4.7.2 Income
Data from the 1991, 1994, 1997, and 2000 censuses reveal that the region supports
about 14% of the total number of households in the country and continues to enjoy
higher than average income and savings, albeit in a decreasing trend.
Draft
4-13
9:41 AM 02/09/05
Regional Environmental Assessment
The NCR Household average income increased from PhP65,186 to PhP303,304 a year.
However, compared to the country's average income, it decreased from 112% to 108%
higher than the national average. The faster increase in the cost of living in the region
was more evident in the annual average family savings, which was 146% higher in 1991,
and in 2000 this was down to 115% higher than the nation's average.
Table 4 1. Average Annual Income and Expenditure. 1991, 1994, 1997, 2000
Region
Average
Average
Total Number
Income
Expenditure
Savings
of
(Pesos)
(Pesos)
(Pesos)
Families
1991
Philippines
11,975,441
65,186
51,991
13,195
NCR National Capital
1,644,390
138,256
105,731
32,525
Region
% of or higher than
13.7%
112%
103%
146%
Philippines
1994
Philippines
12,754,944
83,161
67,661
15,500
NCR National Capital
1,765,644
173,599
138,427
35,172
Region
% higher than Philippines
13.8%
109%
105%
127%
1997
Philippines
14,192,462
123,168
99,537
23,631
NCR National Capital
1,991,987
270,993
217,840
53,153
Region
% higher than Philippines
120%
119%
125%
2000
Philippines
15,269,655
144,039
118,002
26,037
NCR National Capital
2,188,675
300,304
244,240
56,064
Region
% higher than Philippines
14.33%
108%
107%
115%
The poverty incidence or the proportion of families (or population) with per capita income
less than the per capita poverty threshold to the total number of families (population) in
the Region is still much lower than the nation average, but also is deteriorating. From
1997 to 2000, the poverty incidence in the country decreased by 0.3%. By contrast, the
poverty incidence in the region increased by 0.9%. While in other regions of the country
it decreased by 5.1%. In terms of incidence of poor population, the region and the
country increased at almost the same rate of 1% during the same period.
Draft
4-14
9:41 AM 02/09/05
Regional Environmental Assessment
Table 4 -2.
Incidence of Poverty. 1997-2000
Area/Region
Year
1997
2000
Philippines
28.1
28.4
NCR
4.8
5.7
Other Regions
35.0
29.9
This indicates that households in the NCR should have the funds to pay for additional
tariffs associated with improved services sanitation or sewerage charges.
4.7.3 Health
As the nation's capital, the Region has the best health care services in the country with
12% of the nation's private and 8% of government hospitals. This is reflected in the
citizen's vital statistics. The live birth rate was 31% higher than the nation's average in
2000. Infant, child, and maternal mortalities are also lower by 35%, 63%, and 42%,
respectively.
Table 4 - 3.
Vital Health and Nutrition - 1995 and 2000
Item
Philippines
NCR
1995
2000
1995
2000
Live Birth Rate
24.1
23.4
33.1
30.6
Death Rate
4.8
4.9
5.8
5.7
Infant Mortality (Infant under one year of
49
32
age per 1,000 live births)
Child Mortality (Children 1-4 of age per
19
7
1,000 live births)
Under 5 Mortality (Children under age 5
67
39
Per 1,000 live births)
Maternal Mortality (Death of women from
180
119
Pregnancy-related causes per 1,000 live
births)
No. of Hospitals
1,700
1,712
168
179
Government
589
623
42
49
Private
1,111
1,089
126
130
The Table below presents the leading water and sanitation related diseases in the region
in 1995. Of the total 270,000 cases, pneumonia and diarrhoea accounts for 79% of the
total. These two diseases inflict 1,184 and 1,094 cases per 100,000 population.
Draft
4-15
9:41 AM 02/09/05
Regional Environmental Assessment
Table 4 - 4.
Leading Water and Sanitation Related Diseases (1995)
Causes
Reported
Rate per 100,000
Cases
population
Pneumonia
110,348
1,184
Diarrhoea
101,947
1,094
Tuberculosis
32,546
349
Influenza
18,378
197
Dengue Fever
5,884
63
TOTAL
269,103
The World Bank publication "Philippines Environment Monitor 2003" provides more data
on sources of illness for the 5 years up to year 2000. The data indicates that 31% of all
illness is water related, or nearly 5million of the reported illnesses were water borne in
the 5-year period throughout the country.
When combining the 1995 and 2000 datasets, it is obvious that water pollution is
resulting in major morbidity within the community. Given that the most polluted
waterways and densest population areas are within the NCR, then any improvements to
water quality or isolation of the community from polluted water by drain covering will
have great economic and social benefits.
Further, it is likely that the water borne disease impacts have been under-estimated.
The virus that causes the most common waterborne disease is the Norwalk Type A.
This virus results in a 24 hour GI infection (Diarrhoea) that is morbidity is often confused
with minor food poisoning. Therefore the water borne health data is often understated,
or is interpreted as being derived from non-water related sources. This would then
underestimate the potential benefits of improving sewage management by either
installing sewerage systems or drain improvements, improving water quality and
disinfecting the treated effluent.
4.7.4 Economy
The Region continues to dominate the gross regional domestic product and gross value-
added numbers, accounting for 35.2% and 43% of the nation's total respectively.
This is reflected in the higher household incomes in the NCR compared with the
Philippines overall.
Draft
4-16
9:41 AM 02/09/05
Regional Environmental Assessment
5 Existing Water, Sewerage and Septage Management Facilities
5.1 Water Supply
Of the approximately 2.1 million households in the Region, representing 14% of the country's
total (2000), over 51% have their own faucet or community water supply, which is almost double
the national rate of 28%. If adding "own" and "shared community" facilities, over 75% of the
population of the Region have access to piped treated water.
Table 5 -1.
Main Source of Water Supply for Drinking and/or Cooking. Philippines and
NCR. 2000
Own Use
Shared
Region
Total
Faucet,
Faucet,
Own Use
Shared
Tubed/Piped
Spring,
Bottled
Number of Community
Community
Tubed/Piped Tubed/Piped Shallow
Dug Well Lake, River, Peddler Water
Others
Households Water System Water System Deep Well
Deep Well
Well
Rain, etc.
Philippines
15,278,808
4,177,722
2,950,891
1,389,768
2,406,228
1,098,552 1,209,319
1,350,735 348,636 55,226 291,731
NCR National
Capital Region
2,132,989
1,083,072
518,091
84,776
206,709
13,057
13,049
3,629 135,205 27,603
47,798
% of Philippines
14%
26%
18%
6%
9%
1%
1%
0%
39%
50%
16%
In terms of quality and availability, the water table has dropped over 50 metres in parts of the
Region. This means that groundwater quality will deteriorate as the saline waters intrude from
the ocean, and polluted surface water has a better chance of percolating into the depressurised
artesian aquifers. This means that additional stress will be put on other water resources, such
as surface water resources.
This has a flow-on effect as the spare run-of-river flows may now have to be stored or diverted,
and will not be available to dilute the polluted waters in the main river systems as at present.
This will be further exacerbated as there is expected to be a water supply deficit in the region by
2025.
5.2 Sewerage
Less than 8% of the Region is sewered according to the 1996 Master Plan.
Only some 30% of sewage generated in the region undergoes some form of treatment. The rest
is either directly discharged in drainage canals (combined sewers), or simply have no sewers to
convey untreated wastewater and it flows in road table-drains or other common drains.
Draft
5-1
9:41 AM 02/09/05
Regional Environmental Assessment
Area
Description
Hectares
% of
Total
With Treatment
Collection and Treatment (Ayala)
650
1%
Collection and Outfall
2,453
5%
(Central System)
Separate Systems (Quezon City)
1,300
3%
Community Septic Tank
Tondo, Dagat-Dagatan Systems
1,002
2%
Private Systems
10,317
20%
(Individual Septic Tanks)
Sub-Total (With Treatment)
15,722
30%
No Treatment
Combined Sewers (No Septic 3,730
7%
Tank)
Unsewerable
1,425
3%
Non-sewered
30,832
60%
Sub-Total (No Treatment)
35,987
70%
TOTAL
51,709
100%
Source: 1996 Master Plan
There are four main sewerage systems in the region:
Ř the Central System,
Ř the Ayala System,
Ř the Dagat-Dagatan System, and
Ř the Quezon City Separate System.
Details are presented in the Table below.
Draft
5-2
9:41 AM 02/09/05
Regional Environmental Assessment
Table 5 - 2.
Sewerage Systems in the Region as of 1995
Central System
Ayala System
Dagat-Dagatan System
Quezon City
Separate System
Location
City of Manila
Ayala, Makati
Part of the City of Manila, Quezon City
Navotas, Malabon, Caloocan
City
Catchment
2617 hectares [68% of Manila]
600 hectares [of 1,000 has. 333 hectares
41 separate communal
Area
[85,000 households/690,000 pers.]
area]
[50,000 persons, but the system covering 1,300
Residential: 24,000 persons
system can serve up to has.
Commercial: 85,000 persons
104,000 persons]
[23,295 hhs./190,000
pers.]
Description
No treatment
Activated Sludge Method
Aerated Lagoon Method
Influent Data
Flow: 299 L/cap/day x Population
Flow: 183 L/cap/day x Flow: 138 L/cap/day x Unknown/Not
= 206,016 m3/day (1994)
Population
Population
measured
BOD-100 COD-298 SS-48 DO- = 20,490 m3/day = 6,894 m3/day (1994)
0.54 DS-2036 E.coli-4.1E+8
(1994)
BOD-62 COD-217 SS-78
BOD-196 COD-346 SS-75
DO-0.00
DS-414
E.coli-
2.3E+8
Sewer Pipe
305-km long mostly of vitrified clay; 73-km sanitary sewer pipe; 18-km sewer length
114-km total sewer
200 to 1800 mm in diameter
200 to 1050 mm in diameter
length
Transfer Has 7 lift stations, each having 3-5 Gravity flow to the treatment
Mode
submersible pumps; and 1 Tondo plant
Pumping Station (total max. capacity
of 5m3/s)
Discharge
Discharge point is 3.5 km off Manila Creeks
Bay
Effluent Data
Negligible treatment
Efficiency is low and Aeration may be insufficient 41 separate communal
ineffective due to but relatively good effluent treatment facilities,
deteriorated facilities.
quality.
most of which are
BOD-72 COD-168 SS-44
BOD-9 COD-109 SS-19
septic tanks
Status
Under MWSS since 1979. Now with Turned over to MWSS in Operation turned over to Now with Manila Water.
Maynilad Water
1991. Now with Manila MWSS. Now with Maynilad
Draft
5-3
9:41 AM 02/09/05
Regional Environmental Assessment
Water.
Water
Problems
Social: >500,000 squatters occupy Technical: Clogging of sewer Social: Only one out of two Technical:
Some
Encountered
30% of Manila; >20,000 households pipes due to illegally modules is in operations due facilities became
within the service area are not connected drainage pipes.
to the unwillingness of inaccessible due to
connected. Households refuse to pay
households to connect to the blockades of illegal
for connection and the monthly
sanitary pipes.
buildings. Desludging
wastewater tariff.
Technical:
Sewer pipe is not regularly
Technical: Since constructed in 1907,
defects.
undertaken due to lack
no repair was done; old outfall was
of appropriate
abandoned.
equipment.
Past Plans
METROSS-I implemented since 1982
System upgrade as a
component of the MSSP.
Results
Under METROSS-I, large-scale repair
and expansion completed in 1990.
Still, many system defects remain
unchecked. In 1995, system
operation and management were
reviewed, under the MSSP.
Draft
5-4
9:41 AM 02/09/05
Regional Environmental Assessment
The operation of the sewerage facilities is hindered by social problems that include
the incidence of informal settlements, the high number of households that are not
connected to the sewer lines, and the refusal of many to pay for the monthly
wastewater tariff. Among some of the technical issues include deteriorated
facilities, poor maintenance, sewer pipe defects, inaccessibility due to blockades of
illegal buildings, and lack of desludging equipment. Many of these issues are
proposed to be addressed by the MTSP.
5.2.1 Other Systems
The MWSS also inherited other sewerage systems associated with the completed NHA
housing projects. This includes the following:
Ř Karangalan Sewerage System Cainta, Rizal
Ř Martin de Porres Sewerage System Cubao, Quezon City
Ř Tangos Sewerage System Tangos, Navotas
Ř Capri Sewerage System Novaliches, Quezon City
Ř Maricaban Sewerage System Pasay City
Ř Maharlika Village Sewerage System Taguig
Ř Leveriza Sewerage System Manila
Ř Juan Luna Sewerage System Manila
Ř Bagong-Nayon Sewerage System Antipolo, Rizal
In addition to the above systems, the 1979 Sewerage Master Plan indicated that
some subdivisions and military facilities have and manage their own separate
sewerage systems, although these are very small compared with the population of
the Region.
5.2.2 Private Sewerage System in the MWCI Concession Area
Although the Region experienced no coordinated expansion of the sewerage system
since the MWSS privatization in 1997, anecdotal evidence indicate that the private
sector has slowly but systematically expanded the sewerage system as part of
residential subdivision amenities or to comply with Building and Plumbing Codes. In
the MWCI concession area alone, 631 hectares were sewered by the private sector.
The following table provides an inventory of these private sewer system.
MWCI Service Area
Area (ha.)
Remarks
Pasig Business Area*
124.8
Mostly HVDCC and NHA housing projects
in Manggahan and Ugong. Also included
is the Greenwood Executive Village of
Sta. Lucia Realty
Cubao Business Area
133.6
UP Compound, NHA Project 6, San Martin
de Porres, and the MWSS Compound
Taguig/Pateros Business
70.9
BCDA Western Bicutan and NHA
Area
Maharlika Village
Makati Business Area
226.3
Global City, Fort Bonifacio
San Juan/Mandaluyong
75.8
Mandaluyong, Flexihomes and BLISS
Business Area
Projects, ADB Sewage Treatment Plant,
and SM Megamall
TOTAL
631.4
*
Does not include Greenwood Executive Village, Chilems Residential Estate, De la
Rosa Subdivision, Dividend Homes Extension, Eastridge Heights Subdivision, First
Aikka Dev. Inc., Marivic Village and Meadowood Executive Village.
Draft 5-5 9:41 AM 02/09/05
Regional Environmental Assessment
5.3 Sanitation Facilities
In areas where the public sewerage system is not available, the provision of
Individual Septic Tanks (IST) are mandatory as a sanitary facility in keeping with the
provisions of PD 856 or the `Sanitation Code of the Philippines' and the `National
Building Code of the Philippines'. The Sanitation Code also regulates the materials
of construction, installation, and sizing of septic tanks.
The ADB (2000) estimated that in the Pasig River basin alone there are 1 million
ISTs of which only 15% are regularly de-sludged. It is fair to assume that the
majority of the rest are full of sludge. Inappropriately maintained septic tanks
provide no effective detention time and are therefore unable to capture suspended
solids leading to elevated levels of biochemical oxygen demand, suspended solids,
and faecal coliform in the sullage discharges.
The prevailing practice in septic tank construction is a rectangular-two compartment
tank able to reduce BOD, COD, suspended, and settleable solids by approximately
58%, 65%, 70%, and 79%, respectively. According to an ADB feasibility study,
gross septic tank volume (including leaching pit) is estimated 6m3 while the effective
septage volume is 1.8m3. With an assumption of 32L/capita/year of septage solids
production, the ADB study calculated a desirable desludging period of every 6.9
years.
Of the total number of septic tanks that are desludged by private contractors, it is
dubious the collected private septage will also not end up discharged to drainage
and natural bodies of water since no contractor has a septage treatment facility.
The present drainage system is practically a "combined sewer system" because the
septic tank usually receives wastewater from flush toilet and kitchen activities, while
the remaining sources from shower water and laundry goes directly into the drainage
system. In the typical septic tank design, a subsurface absorption field (leach field)
is usually omitted due to space and financial constraints. This is another reason why
septic tank overflow leads directly to the drainage facility.
The MWSS has attempted on its own, and now through its concessionaires, to
address the sanitation issue by implementing several projects and this include:
Ř a desludging program was operated under the METROSS-I project and an inter-
agency project `The Navotas-Malabon-Tullahan-Tenejeros (NMTT) River Revival
Program', the results were not satisfactory due to economic and institutional
constraints. One problem was the difficulty in finding septage disposal sites and
securing an ECC from the EMB.
Ř MSSP de-sludging of septic tanks and, on a trial basis, ocean dumping of the
collected septage until 2003, and the rehabilitation and upgrading of the Ayala
Sewerage System. From May 2001 to June 2002, collected septage from 5,000
septic tanks were disposed into the sea. This practice was abruptly discontinued
due to strong opposition from local government, and non-governmental
organizations.
Ř The concession agreement required the Manila Water Company, Inc. (MWCI) in
the east and Maynilad Water Services Inc. (MWSI) in the west to meet the
following water supply, sanitation, and sewerage services:
Draft 5-6 9:41 AM 02/09/05
Regional Environmental Assessment
Table 5 - 3.
MWSS 1997 Concession Agreement (% Coverage)
Total
2001
2006
2011
2016
2021
Area
Targets
West
East
West
East
West
East
West
East
West
East
Water
87.4
77.1
97.1
94.1
97.4
94.1
97.7
94.1
98.4
94.6
Supply
Sanitation
43.0
38.0
46.0
32.0
43.0
27.0
39.0
24.0
27.0
19.0
Sewerage
16
3.0
20.0
16.0
21.0
51.0
31.0
52.0
66.0
55.0
Source: ADB (2002)
Since 2002, the MWCI has conducted pilot testing of applying collected septage on
lahar-laden areas in Pampanga, at an average rate of 160 m3/day at present and is
increasing. The MWCI commitment to MWSS is to cart 200 m3/day.
In addition, the Pasig River Environmental Management and Rehabilitation Sector
Development Program is also addressing the septage management requirement of
an estimated 185,000 households. The catchment for the service area is within the
MWCI Concession Agreement area. The Pasig River Rehabilitation Commission is
currently in the process of procuring 36 vacuum trucks for septic tank management
and will construct a septage treatment plant in Antipolo to handle collected septage.
5.4 Regional Issues in Relation to Sewage Management
There have been numerous studies and policy papers that analyzed the problems of
sewage management in the National Capital Region. Some of the key studies
findings are presented in the succeeding discussions, but the key issues are
presented below.
Table 5 - 4.
Major Issues in Relation to Sewage Management in the Region
Social
Legal/Political
Technical
Financial
- Informal settlers
- Design of septic tanks
- deteriorated facilities
- urban sanitation is
- Households are
not strictly enforced
- sewer pipe defects
usually integrated with
satisfied with simple
under the Building
- inaccessibility of sewer
water supply and
septic tank system
Code
lines, drains, and
sanitation services are
- Low understanding of
- Difficulty of finding
waterways due to
not popular to
the health risk of
septage disposal site
blockades of illegal
politicians and always
disposing of
and securing an ECC
buildings
lose out in competition
inadequately treated
- Conflicting land use
- lack of de-sludging
for funding
septage and sullage
policies
equipment
- urban households are
(septic tank effluent)
- Conflicting and hard to
- failure to operate the
unwilling to pay when
- Households not
implement laws for
NHCS based on agreed
there seems to be
connected to sewer
water, sanitation and
rule to control polluted
nothing wrong with
lines
sewerage, with many
waters flowing back to
their private septic
- Refusal to connect and
missing institutional
Laguna Lake
tanks
pay monthly sewerage
links, such as DoH for
- lack of space, legal tenure
- high cost of a city-
tariffs
sanitation standards,
to construct septic tanks
wide sewer system
- Community opposition
DENR for effluent
and most also lacks the
to road pavement
standards, and the
water to flush wastes
disturbance during pipe
LGU for building
installation
approvals and
- Low understanding of
inspections. DoH has
environmental impacts
the mandate but there
is uncertainty as to
who is responsible for
enforcement, what
penalties to apply and
how to apply them
Draft 5-7 9:41 AM 02/09/05
Regional Environmental Assessment
5.5 Historical Infrastructure Investment Pattern
The World Bank (2000) determined that the ratio of annual average investment in
water supply compared with Sewerage and Sanitation (combined) was 97% to 3%
respectively. This confirms the anecdotal evidence that;
Ř there is insufficient political support for sewerage and sanitation at political levels
such as Congress for sewerage/sanitation funding
Ř there is little support at LGU level for traditional sewerage installation works that
will necessarily interfere with local commerce and traffic for a period,
Ř the environment is not really a priority for most of the Region's population,
Ř it is very difficult to even get the householders to connect to the sewer, even
though it is explicitly required in the local statutes and penalties can be applied,
and
Ř it is very difficult for the concessionaires to collect tariffs for the sewerage
service.
Draft 5-8 9:41 AM 02/09/05
Regional Environmental Assessment
6 Policy and Institutional Framework
6.1 Overview
The framework of direct interest relates to water pollution management and the
attendant sewerage and sanitation elements. In addition, the higher order issue is
managing land use planning and development, together with the associated zoning
ordinances. The planning issue is longer-term and more complex than the basic
infrastructure institutional management.
With the passage of the "Philippine Clean Water Act of 2004", there are now three
(3) national agencies that have direct involvement in sewerage management:
Department of Health (DOH) and Department of Environment and Natural
Resources (DENR) and the Department of Public Works and Highways (DPWH).
The Clean Water Act will have an effect in the management of water quality in the
sewerage service area if the NCR is designated a water quality management area.
A governing board composed of representatives of LGU, national government
agencies, NGO, water utility sector and business sector will formulate strategies to
coordinate policies to implement the Clean Water Act. Even if the sewerage service
areas in Metro Manila are designated as a distinct management area, the governing
board is not expected to make drastic changes in the existing plans because these
are based on firm legal and technical grounds. The Clean Water Act maintains the
status quo for areas under the LLDA.
However, the designation of areas may affect the policy strata that has been
promulgated before this REA and will be promulgated because of this REA. While it
is expected that this REA will be respected by any Board convened under the Clean
Water Act, the water quality management area would most probably include such
areas outside of the REA designated areas which "have similar hydrological,
hydrogeological, meteorological or geographic conditions which affect the
physicochemical, biological and bacteriological reactions and diffusions of pollutants
in the water bodies." The water quality management area and the attendant plan
would then most probably include areas within the drainage basins of the rivers in
the area.
6.2 Land Use Planning and Zoning
With respect to planning, the implementation of the revised Local Government Code
(LGC) in 1991 triggered a process of political and administrative decentralization that
has brought major changes to the governance structure of the Philippines. The LGC
devolved powers and responsibilities from the central government to Local
Government Units (LGUs), allowing them to operate with far greater autonomy.
Moreover, the municipalities are given the mandate to discharge the functions and
responsibilities of national agencies and offices devolved to them. In the NCR, the
MMDA has a coordinating role for inter-LGU planning but the final power still
effectively resided with the individual LGU. Therefore the preparation and
implementation of Consolidated Land Use Plans and Zoning Ordinances is
essentially a LGU responsibility.
The effectiveness of the CLUP and ZO controls are somewhat limited in reality, as
demonstrated by illegal settlers occupying the available STP sites since 1997.
Therefore the actual ability of LGUs to direct longer term planning to better manage
the local environment has not been clearly demonstrated to date. This is in terms of
Draft 6-1 9:41 AM 02/09/05
Regional Environmental Assessment
trying to limit developments on sites that do not have adequate sanitation or
sewerage services, or provision therefor. Similarly the sensible development of
industrial precincts and hazardous waste generating activities away from major
watercourses cannot be relied upon.
A revision has now been completed of the CLUP and Zoning Ordinances, and was
approved by the HLURB Board in September. The revision includes powers to
address the present land use guidelines, to better manage development in the
catchment. PRRC has coordinated meetings with the various City Planning and
Development Coordinators and elected officials. There are no apparent
contradictions with the proposed MTSP components, but will have to await the
publication of the revised CLUP/ZO's.
The Pasig River Rehabilitation Commission has been attempting to influence CLUP
and ZO activities in an environmentally sensitive manner, but the PRRC is a
Commission and does not have executive powers. The MMDA coordinating role has
not been overt to date in environmental issues, and has focused more on flooding
and traffic in terms of planning and management issues.
A Memo of Agreement on Regulations and Programs for water quality improvement
of the Pasig River was signed between DOH, DENR, PCG, MWSS, HLURB, LLDA
and MMDA in August 2003. A series of implementation activities is now
programmed, for example, a workshop was held in October 2004 on Action Plan
preparation for MWSS/SI/CI for sewerage rollout.
In summary, the planning and ordinance aspects have been sensibly devolved to the
implementation level within the various LGUs. However the planning successes to
date have been limited, and are somewhat thwarted by the legislated rights of
informal settlers and the fact that the LGUs in the Region are already substantially
developed. The only positive planning or ordinance changes likely to limit water
pollution will be as part of urban renewal programs, to date these have been mainly
driven by the PRRC in recent times.
Therefore planning activities are unlikely to yield substantial improvements in water
quality issues in the short to medium term.
6.3 Sewerage and Sanitation
This partial planning and land use vacuum means that environmental management
will have to be more direct, in terms of direct control over sewerage and sanitation
issues in this case.
Water pollution control has become one of the constituent duties of the Philippine
State in its promotion of general welfare, a rising standard of living, and an improved
quality of life for all. This is enunciated in several acts and administrative and
executive issuances which implement the water pollution policy of government.
Among these are the Clean Water Act, the Sanitation Code, the Water Code, the
Environment Code, and several Executive orders.
The Local Government Code mandates local governments, either singly or together
with other political units and private entities, to deliver services to their constituents.
It also emphasizes the importance of establishing a mechanism for dialogue and
consensus building between national and local governments, private business, and
civil society. Except where special agencies have been established by law to take
Draft 6-2 9:41 AM 02/09/05
Regional Environmental Assessment
over this role, the Local Government Units are thus primarily responsible for the
provision of water supply, sewerage and sanitation services within their jurisdictions,
The detailed legislation descriptions and selected excerpts are provided in Appendix
D Institutional Framework.
6.3.1 Sanitation Code
However of primary importance is the Sanitation Code of the Philippines
(Presidential Decree-PD 856) decrees the use and design of septic tanks for typical
households. It also mandates that households must connect to an existing sewer
system if located within 60 metres of the sewer. PD 856 gave the DOH the powers to
enforce the law on mandatory sewer connections. However this has been partly
devolved to the LGUs, and a disconnect remains with respect to enforcing
connection to sewer and also applying penalties for refusing to disconnect. There is
no legal provision to disconnect the water supply to a dwelling if the occupier refuses
to connect to sewer. The alternative is a lengthy legal process that must be brought
against the offenders. It cannot be part of a class action against offenders.
6.3.2 Clean Water Act
Equally important is the new Clean Water Act. The CWA supports the efficient use
of water, long-term resource protection, river-basin management, safe drinking water
development and proper handling and rehabilitation of toxic and contaminated
groundwater. The new law provides for a comprehensive water management
program to protect the country's water bodies from land-based sources of pollution
such as industries, mining, agricultural operations, and community or household
activities. It aims for the provision of the necessary infrastructure input for economic
development as well as the protection and preservation of the Philippine water
environment.
The bill also aims to strengthen government efforts and coordination with non-
governmental organizations toward the formulation of a water resource data and
information network that would play a vital role in addressing the current water
issues.
Provisions of the CWA that have direct impacts on sewerage infrastructures and
operation include:
Ř creation of a National Sewerage and Septage Management Program (NSSMP)
(Sec. 7)
Ř domestic sewage collection, treatment and disposal (Sec. 8)
Ř wastewater permitting and charge system (Sec. 13, 14)
Ř rewards and incentives (Sec. 25, 26)
Ř penalties and sanctions (Sec. 28,29)
A review of the CWA at a multi-partite workshop in November 2004 indicated the
following specific gaps:
Ř The Act is unclear on the responsibilities of agencies with regards to the creation
of an NSSMP within a very narrow timeframe of 12 months. Major responsibilities
were assigned to the DPWH and the LGUs. While the DPWH has extensive
experience in infrastructure, its current technical and manpower capacity is
deemed insufficient for the tasks given the agency. This is also true for the LGUs
Draft 6-3 9:41 AM 02/09/05
Regional Environmental Assessment
who, at the same time, have varying degrees of limitations in terms of land and
financing.
Ř The Act is weak on mandates which should have defined the agency(cies)
directly responsible for providing wastewater infrastructures.
Ř The Act does not clearly define the mechanisms on how funding may be made
available for the required infrastructure.
Ř There appears to be a bias for the case of Metro Manila and a lack of particular
attention to other areas.
Ř The Act states that prohibited acts will be sanctioned, however, the nature/details
of the sanctions are vague and not completely laid out. The mechanism for some
sanctions is beyond the scope of the CWA and will have to be addressed by
other promulgation.
Overall, the CWA contains loopholes that will continue to make implementation
difficult. To achieve its objectives, the Act has to look beyond the specifics towards
holistic, long-term development and impacts.
6.3.3 Other Legislation
By virtue of the Local Government Code, each city or municipality is responsible for
providing water, sewerage and sanitation services. The LWUA can administer the
provision of water supply to the provinces; sanitation services are secondary.
Although the LWUA may carry out the duties of the LGU in terms of providing water
services, the engineering department of each LGU could prescribe the appropriate
sanitation facility of any residential, commercial or industrial development as it
approves electrical and plumbing layouts.
Similarly, the DENR may impose the installation of appropriate sanitation facilities as
a condition in any Environmental Compliance Certificate (ECC) it releases. The
DENR also monitors the discharges to water bodies. It has the authority to penalize
non-compliance to effluent quality standards. This authority has been given to a
subsidiary agency, the LLDA, in the case of the LLDA catchment. The LLDA and
equivalent head agency section, the EMB, have historically promulgated different
mechanisms for dealing with non-compliance of dischargers.
The case of Metro Manila is unique. For the metropolis, the Metropolitan Waterworks
and Sewerage System (MWSS) is responsible for providing water supply, sewerage
and sanitation services. These obligations were transferred to two private
concessionaires, namely Manila Water Company, Inc. (MWCI) for the East Zone,
and Maynilad Water Services Inc. (MWSI) for the West Zone, when the MWSS was
privatized in 1997.
In summary, there is still confusion at the implementation phase as to the agency
responsible for providing sewerage and sanitation services in the Region. The Local
Government Units (LGUs), Local Water Utilities Administration (LWUA), Department
of Health (DOH), DENR, Laguna Lake Development Authority (LLDA), Metropolitan
Manila Development Authority (MMDA) and the MWSS and its concessionaires all
have authority or obligation to perform components of these services.
6.4 Mandates in Sewerage Management
In order to more clearly depict the Philippine and Metro Manila situation, it is best to
divide the water pollution control sub-sector into four functions that are relatively
distinct and that require specific expertise:
Draft 6-4 9:41 AM 02/09/05
Regional Environmental Assessment
Ř Water quality management of water resources such as rivers, lakes and
wetlands. This involves setting of operational quality standards for the receiving
water as well as for the waste discharged, and integrated planning in order to
achieve water quality levels that allow appropriate water use.
Ř Regulation of general quality standards for health, water and the environment.
Regulation and setting of standards for industrial sewage treatment and
stimulation of waste minimization and pollution prevention instead of conventional
"end-of-pipe" approaches.
Ř Organization, construction, and management of on-site sanitation in urban,
rural and peri-urban areas.
Ř Collection and off-site treatment of domestic sewage, including its planning,
construction and management.
The first two functions listed above are of a regulatory nature and performed by a
number of agencies in the Philippine Government. Such institutions include the
DENR, the DOH, and the MWSS.
The last two functions are more executory, which proves more difficult to achieve.
Not only are such programs in cities capital intensive, the wastewater infrastructure
is difficult and expensive to operate and maintain. On-site sanitation, on the other
hand, comprises a set of distinct activities. Some of the work is carried out by
house-owners that have to invest in the construction of septic tanks. The
maintenance, mainly desludging and disposal and treatment of the sludge, is usually
carried out by private contractors. Thus, the executory role of the last two functions is
fulfilled mainly by private corporations and entities, which service mostly customers
which can afford the high fees. It becomes the duty of government, therefore, to
insure that such services are available for the benefit of the majority of the
population. In this case, the local governments in collaboration with the MWSS and
utility corporations have to take the lead.
6.5 Institutional Recommendations
6.5.1 Relative Priority of Wastewater Services
The basic principle governing the regulatory environment in the Philippines on water
services is that water is owned by the state and the government has the sole power
to determine its development and distribution. Hence several agencies and utility
organizations and corporations have been tasked with specific roles in providing
water in the country such as water districts, the local government units in special
cases, and private corporations. However, this principle does not apply to sewerage
and wastewater.
Sewerage development is much less organized than water supply and sanitation
because of limited investments to date in sewerage. This imbalance exists for good
reasons, and this includes the high cost of constructing sewer networks, poor
technical capacity, and low demand or willingness-to-pay for sanitation services and
compared to water supply. Among the government water utility firms, only MWSS
has clear mandate for the construction, operation, and maintenance of sanitary
sewers and sewage treatment facilities for its service area, as water districts deal
only with water supply. The DPWH constructs and maintains storm sewers and
drains in Metro Manila.
The Local Water Utilities Administration through its Water Districts is given the
authority to develop water supply and wastewater disposal systems outside Metro
Draft 6-5 9:41 AM 02/09/05
Regional Environmental Assessment
Manila, but the past experience have shown these districts are more interested in
developing water supply- to date almost 200 districts exists without any provision for
sanitation services. By default, the LGUs have take responsibility for the construction
and maintenance of such facilities, albeit with their internal revenue allotments are
not sufficient to provide these facilities.
Private concessionaires in the former MWSS service areas have taken over MWSS
mandates in the provision of wastewater services. Most government departments
and agencies are concerned with planning, regulations, and other macro-level
activities in the wastewater sector.
Action
The sewerage sand wastewater management systems will only be developed once
there is community and political support for proper funding of these systems. An IEC
is essential to refocus the community and political opinions that water supply is by far
the most important issue in the water management cycle.
A campaign is required to alert the community to the health and economic benefits of
improved wastewater management. A champion must be identified in a senior
government position to bring the IEC aims forward. The aim will be to make
wastewater management a key political issue and thence become an election issue.
This will be very difficult unfortunately with the numerous demands on capital in the
Philippines.
However this is the only sustainable path, otherwise the best efforts of those charged
with implementing the wastewater management systems will fail in the long term.
6.5.2 Connection to Public Sewerage Systems
The Plumbing Law and the National Plumbing Code are very clear. Except in cases
when it may prove oppressive or excessively burdensome to those without sufficient
means, all buildings should be connected with available sewers. This has not been
done nor its execution been regulated by the proper agencies concerning sewage
infrastructure. More so, the power of water districts to disconnect services to
buildings that refuse to connect with existing sewer lines should likewise be given to
other entities which build and operate such sewer systems, such as those in Metro
Manila. This will give the provisions in the Plumbing Law and the Plumbing Code
more power, facilitating universal connection with available sewage lines.
Action. The Concessionaires must be given power to disconnect water supply to
those users who refuse to connect to sewers, and also for those who then fail to pay
for this sewerage service. This is not available at present.
6.5.3 Project Financing
It costs approximately five times to amount to develop sewerage and sanitation
facilities than water supply for the same number of households, yet on the National
level the annual investment on sewerage is 3% of the total investments in the water
supply and sanitation sector. Although there are several sources of financing
available to fund sewerage and sanitation projects, most of these are relatively new
to the local government units as well as government agencies and corporations and
will need focused technical assistance to maximize their application. These sources
include:
Ř Privatization.
Ř Internal revenue allotment.
Draft 6-6 9:41 AM 02/09/05
Regional Environmental Assessment
Ř Special levies
Ř Development fees
Ř Surplus funds
Ř Sewerage surcharges
Ř Property tax
Ř Credit
Ř Private sector finance (e.g. contributions)
Ř Water quality management fund
Action. A technical assistance grant is required to advise on how to better use the
various funding options listed above.
6.5.4 Low Willingness to Pay and the Lack of Sanctions
Several studies have pointed out the low willingness to pay of households for better
sewerage and sanitation service, and has been recently estimated at
PhP30/month/capita or PhP5,700 per capita. At this rate it will take 16 years to
recover capital investments in sewerage and sanitation. It may be argued that the
low willingness to pay could be addressed by cross-subsidies, or mandating the
connection to sewers by households with a threat of sanction for non-compliance
removes the assumption that households have a choice as implied by the
proponents of willingness-to-pay scheme.
The existing laws do not provide sanctions for households not connecting to sewers.
Although the Sanitation Code promotes the establishment and connection to sewers
and sanitation facilities, there is no threat of sanction for non-compliance. Similarly is
the Clean Water Act, which requires LGUs to earmarked an area to locate treatment
plants, non-connection is still an option for households to take.
Action. The Concessionaires must be given power to disconnect water supply to
those users who refuse to connect to sewers, and also for those who then fail to pay
for this sewerage service. This is not available at present.
6.5.5 Monitoring of Compliance to Existing Laws
As the population of Metro Manila rises and congestion increases, environmental problems
related to sewerage and sanitation are likely to become worse. The Sanitation Code
provides broad regulation against most improper sanitation practices, including the
discharge of untreated septic tank effluent and untreated sewage to water bodies.
Unfortunately, there is little monitoring or enforcement of these regulations and the
agencies responsible have few powers or incentives to follow-up wrongdoers.
The reality is that most households, businesses and local authorities in the Philippines are
in breach of the national sanitation code. Industrial consumers can be monitored by the
DENR but the sheer number of these industries from small partnerships to larger
conglomerates necessitate that only the larger companies are dealt with.
For the individual households, the mandate in the Sanitation Code and in the Clean Water
Act clearly states that DOH approval is needed prior to the discharge of untreated effluent
of septic tanks and/or sewage treatment plants to bodies of water. Again the staffing
requirements would preclude any effective enforcement of this provision in the millions of
households in Metro Manila. By virtue of the Local Government Code, it should be the local
governments themselves that should pass ordinances regarding their sanitary facilities and
should provide manpower to enforce such ordinances. Examples of these are the following:
Ř
Baguio City ordinance No. 098-95 compels buildings within the service area to be
connected to the sewer network
Draft 6-7 9:41 AM 02/09/05
Regional Environmental Assessment
Ř
Baguio City ordinance that payment of sewerage fees is a condition for issuance of
annual business permits to commercial properties with sewer connections
Ř
Vigan City ordinance that all new buildings must construct their own on-site sanitation
facilities as a condition for issuance of the building permit (to prevent further
overloading of the sewerage system)
Ř
Zamboanga City water district will disconnect the water supply of any consumer that
does not pay their sewerage fees (which are included in the water bill)
Within the cities and municipalities a more comprehensive study of the various ordinances
and issuances in relation to their policies which affect the sector should be initiated. Again,
however, the prohibitive costs of employing a centralized sanitation service for Metro Manila
becomes the issue. Until treatment plants and combined systems becomes cheap enough to
build and to operate, the user fees shall be above what ordinary consumers are be willing to
pay. The indiscriminate discharge of sewerage, septic tank and toilet effluent is likely to
continue until either public sentiments change, or stronger regulation and
enforcement is introduced.
Action. The only solution is to undertake a study involving all the agencies to
demonstrate that continuing as at present is simply not an option. This study will
also demonstrate and delineate the responsibilities and the obligations of the various
agencies and determine a funding and resourcing plan to ensure enforcement
activities do result.
6.5.6 MTSP Impacts on Existing Private Septage Haulers
The MTSP intends to de-sludge an estimated 115,000 individual septic tanks
annually by year 2025. Supported by cheaper loans and government approval to
dispose collected septage on lahar areas may be construed as unfair competition
between the MWCI and private haulers. These desludging contractors have provided
limited but necessary services for decades due to the limitation in MWSS capability,
and have made investments particularly in haulage trucks. Although not a single
operator has been granted a permit by the DENR to operate a septage treatment
plant, the MWCI should foster a cooperative partnership with these contractors
rather than compete with them.
The MWCI and the DENR should craft guidelines and accreditation schemes that will
allow these contractors to operate within the MWCI concession area particularly on
densely populated, space-congested areas in the concession which will be difficult to
access by the larger MWCI tankers . Collected septage can be disposed in the lahar
areas, and later on will be required to be treated in the MWCI septage treatment
plants.
Action. The proposed GEF study for the Region will address the institutional issues
of the private operators. It is acknowledged that only approximately 80% of the ISTs
can be desludged by the MWCI fleet for various reasons. Therefore the remaining
20% will be available to the private contractors for desludging services.
6.5.7 IEC on Health Impacts of Wastewater
The limited understanding of households on the health impacts of the existing septic
tanks that are inadequately managed has generated multiple problems like low
willingness-to-pay for improvement in facilities and services, and willingness-to-
connect even if sewer systems are already available. The strong bias of politicians
to support expansion in water supply without corresponding sewerage and sanitation
Draft 6-8 9:41 AM 02/09/05
Regional Environmental Assessment
facilities has resulted to dismal public investments on the latter, a problem that can
be addressed by properly informing these policy makers.
In year 2000 alone, according to the DOH, 871,446 cases of diarrhoea were
recorded with an estimated economic losses based on medical expenses and cost of
hospitalization reached PhP1 billion. The World Health Organization contends that
the single most effective intervention to address diarrhoea is the provision of a
sewerage system.
Action. The DOH should transform and expand its activities from simply monitoring
water-borne related diseases to conducting active promotion on the need to have
adequate sewerage and sanitation facilities.
6.6 Summary
The assessment of the policy, legal, and administrative framework of the sewerage
management system in Metro Manila yields several issues which need to be
addressed. This portion of the review carries it with it the key management and
policy concerns which have been identified and lists some recommended actions.
Firstly, there is no umbrella agency trying to limit population growth in the Region,
either by imposing restrictions on rural migration into the Region or nationally in
terms of population control for the nation. Therefore substantially increasing
populations within the Region are a given.
The basic land use planning (CLUPs) and zoning controls (ZOs) are also not
effective. Therefor an approach of planning controls cannot be used to guide
development nor even control the location of ongoing development.
The existing wastewater, environment and health management legislation is too
complex, overlapping and unclear not just in terms of basic laws, but also in terms of
the devolution status. A number of obligations have been devolved from one agency
to another and eventually to the LGU in some cases, but without a clear mandate or
operational guidelines.
A series if recommendations have been made on how to improve some of these
issues. However it is critical that an action plan be developed to make these
changes, and this will require political commitment, community pressure following on
from extensive environmental and health education, and of course funding and
adoption of a time-bound program for implementation.
Therefore, it is recommended that the present strategy on wastewater development
must take the pragmatic approach where clusters of cities/municipalities will
coalesce to plan, agree on and implement wastewater projects for the protection of
the health and environment of the areas under their jurisdiction ("river basin
approach"). Projects may not be designed on a per location basis but would cover
expansive catchment areas. Innovative solutions, such as combined systems for
highly urbanized cities should be seriously considered. Only with this approach can
the objectives of protecting the water environment be achieved at the right
economies of scale.
Draft 6-9 9:41 AM 02/09/05
Regional Environmental Assessment
7 Generic Wastewater Management Alternatives
7.1 Background
This section presents alternatives in response to the demonstrated socio-ecological
shortcomings on a number of levels in the Region. This section does not address
the options associated with the MTSP components, but rather are the generic
strategic options for unsewered catchments such as the Region under review.
Options on a strategic level would include the following examples:
Ř The No Project option
Ř Different options for waste minimisation or waste avoidance
Ř Wastewater collection options
Ř Wastewater reuse or disposal options
Ř Partial or supplementary schemes for wastewater management
The options may be grouped as follows;
7.1.1 Total Wastewater Management Schemes
These schemes are capable of managing the total wastewater flow in the Region;
Disposal to Water:
Ř Fresh Water Streams or Lakes
Ř Estuarine Discharges
Ř Ocean Outfalls
Application to Land
Ř Hinterland Irrigation
Ř Northern Irrigation (Lahar areas)
Recycling Options
Ř Indirect Potable Reuse
Ř Direct Potable Reuse
7.1.2 Supplementary Wastewater Management Strategies
These schemes will only ever be capable of managing a portion of the total
wastewater flow. A number of these may be used in conjunction to increase the
portion of the total wastewater flow that is then managed;
Ř Dual Reticulation
Ř Irrigation of Parks, Gardens and Sporting fields
Ř Industrial Reuse
Ř On-site Systems
7.2 Disposal to Water
Discharging effluent to water generally requires adequate treatment standards to
reduce the environmental impact on receiving waters to meet Class C standards.
7.2.1 Discharge to Freshwater or Lakes
The only possibility in the Region would be discharging to Laguna Lake.
DRAFT
7-1
9:41 AM 02/09/05
Regional Environmental Assessment
Laguna Lake has only limited mixing with the local river systems such as the Pasig
River, so any discharge of treated effluent will remain resident in the Bay for a
protracted period. Given the relatively high clarity of water in the Lake, the shallow
depth and low interchange with the Pasig River, the probability of excessive algal
blooms is very high. The Lake is already experiencing algal blooms in the dry
season when nutrient rich waster in the Pasig River in tidally introduced into the
Lake.
Therefore major effluent discharges into the Lake should be discouraged. A very
high standard of treatment would be required to sufficiently reduce the nutrient
content of the treated effluent to avoid eutrophication in this Lake. This would be
prohibitively costly.
7.2.2 Discharge Treated Effluent to Estuaries
To discharge into estuaries the effluent will need to be treated to reduce BOD loads
initially, with a view to improving dissolved oxygen levels in the rivers. Later it will
most likely be necessary to remove nutrients, preferably by biological processes
alone.
The preferred location of outfalls and required effluent standards can only be
determined following extensive water quality monitoring and modelling of the estuary
in a normal environment, or based on available locations for a treatment plant.
If a centralised scheme is adopted with only a few large STPs discharging into the
local estuaries, then more attention must be paid to discharge standards to
overcome problems within the immediate vicinity of the discharge.
For a dispersed STP system, the quality is less critical as the load remains small at
any point discharge location.
The potential environmental benefits are reduction in BOD loads and a related
increase in Dissolved Oxygen. If the effluent is disinfected, then the health aspects
are also improved.
The health implications of the collection system are addressed specifically
elsewhere.
The DANIDA (1999) modelling indicated that even secondary treated effluent being
discharged to the Pasig River will still not achieve Class C standards at all times.
However the Class C standard is very onerous for a river flowing through a
megalopolis like the Region under assessment. For example, a more appropriate
set of criteria would use percent saturation for dissolved oxygen measurement,
rather than absolute values in terms of mg/L. Absolute DO levels are lower in such
warm waters as in the Region because of the lower oxygen saturation in warmer
waters. So the DANIDA modelling is technically correct but the target criteria (Class
C) or water quality objectives are considered too onerous.
Therefore this is a suitable strategy only for the interim to allow a phased in
approach to sewering the Region, if Class C is to be adopted as is.
However, if a more pragmatic set of water quality criteria is adopted, then longer
term estuarine discharges will remain acceptable, especially if nutrient removal
capability is retrofitted in the future.
DRAFT
7-2
9:41 AM 02/09/05
Regional Environmental Assessment
7.2.3 Piped Ocean Discharge
Under this option, the outfall locations would need to be investigated to ensure
effective disbursement of effluent and minimising impacts on the benthic ecosystem
and water column outside the mixing zone.
There is no obvious deep ocean drop-off close to Metro Manila which would allow an
ocean outfall to safely convey screened but otherwise untreated sewage for
disposal. Therefore wastewater would have to be treated prior to discharge.
Nutrient reduction treatment would also be preferred for outfall discharges given the
red tide events already happening in Manila Bay.
This option could be considered as a second stage to having estuarine based STPs,
by having their discharges diverted out of the estuaries and then piped to Manila
Bay. This may be required if water quality or ecosystem monitoring subsequently
determined that this was necessary to protect the estuary.
This system has similar environmental, ecological, health and economic benefits as
the estuarine discharge option. However the cost of an ocean outfall is large and
generally is not provided as a first stage for discharging into embayments such as
Manila Bay.
7.3 Application to Land Options
7.3.1 Irrigate Lahar Affected Areas
This involves irrigating a large forested, pasture or sugar cane area with treated
effluent. Secondary treated effluent would be the minimum required. The treatment
plants could be located within the Region or on less costly land along the pipeline
route top the irrigation area.
Advanced treatment to reduce nutrients may be required to limit nutrients leaching
into the ground water and consequently into water bodies, and also limit receiving
water impacts during releases from balancing / wet weather storages.
The irrigation area required would be extremely large so supplementary continuous
discharges to water may also be required. Based on a conservative 10ML/ha/yr
application rate, and area of nearly 100,000 hectares would be required for the
irrigation area, exclusive of balancing storage space requirements.
Sugarcane would be the best crop for the coastal flats and lahar areas. Some areas
in the lahar region already have irrigation systems and so the proponent would not
have to fund the full irrigation scheme costs.
The costs for developing the irrigation areas where irrigation systems are not already
installed by farmers, internal reticulation and the 80 km delivery main would be
prohibitive while a discharge of treated effluent to a local estuary was suitable.
However there is an increasing trend to reuse treated effluent, and it is economically
justifiable where high value crops are irrigated.
Irrigation could be retained as a backup in case of ecological damage caused by the
discharge of treated effluent to the Region's estuaries.
DRAFT
7-3
9:41 AM 02/09/05
Regional Environmental Assessment
7.3.2 Hinterland Irrigation
The climate and topography to the east of Antipolo is not conducive to broad acre
irrigation schemes in any case.
This option would involve extensive pipelines and multiple pump stations. The static
pumping head alone would be at least 200m. To irrigate effluent to the East of the
range surrounding the Region, nutrient reduction treatment would also be required in
addition to secondary treatment to minimise environmental impacts of overflows from
the storage lagoons in the upper catchment areas where there is little diluting flow.
A site would have to be selected which had extensive areas of land already under
irrigated crop which required large irrigant applications to justify the scheme. This is
because there is not the same broad acre crops on flat topography such as is found
in the lahar area.
The obvious capital costs would rule out this scheme, as the proponent would have
to fund the development of the entire irrigation area.
7.4 Recycling Options
7.4.1 Indirect Potable Reuse
Indirect potable reuse involves recharging raw water supply dams with effluent. It
would be possible to safely discharge into Laguna Lake or Mesa Dam if advanced
treatment were adopted. This includes chemical dosing, filtration, ozonation,
biologically activated carbon and final disinfection. The additional treatment facilities
would be located at the sewage treatment plant sites or closer to the dams or lakes.
This process would provide an adequately treated effluent for indirect potable reuse
in terms of guarding against health risk from pathogens and toxins. It can also stall
the need for more water supply dams.
This is used internationally but has very high capital costs and requires very good
standards of operation and maintenance to protect the health of the community. The
capital costs would make this prohibitively expensive initially, but could be retrofitted
later if desired.
7.4.2 Direct Potable Reuse
Following the general process stream described for indirect potable reuse, a reverse
osmosis or similar fine filtration unit could be installed. This would allow the effluent
to be returned directly to the treated water supply reservoirs.
Direct potable reuse has the advantage of stalling the need for additional water
treatment plants and raw water storages.
It is used in very dry areas such as parts of Southern Africa but is too complex for
Manila at this time. It could be retrofitted in the future however if desired, if the local
waterways become too polluted from the treated effluent discharges.
7.5 Supplementary Options
Supplementary schemes are those schemes which will reuse a portion of the total
volume of sewage effluent. They are therefore used in conjunction with one of the
`Total' options outlined above or a number of other supplementary options.
DRAFT
7-4
9:41 AM 02/09/05
Regional Environmental Assessment
7.5.1 Dual Reticulation
This is a method of providing non-potable water (highly treated wastewater) to a
large number of residential customers. The non-potable water can be used for
garden irrigation, toilet flushing and so on.
It requires the construction of an advanced wastewater treatment plant, and a
distribution network dedicated exclusively to supplying non potable water with a
service connection at each individual home to supply the non potable water. This
network of pipes would be parallel to but separated from the potable distribution
system.
Dual reticulation to private residences will only ever be a supplementary reuse
scheme. It is unlikely to result in more than 10 to 20% of the total sewage flow being
reused in this manner.
It requires greenfield sites to be affordable, and therefore will not be appropriate for
the majority of the Region.
7.5.2 Irrigate Parks and Sports Fields with Treated Effluent
Urban irrigation refers to the irrigation of areas used for recreational or aesthetic
purposes such as sporting ovals, public reserves and parks and median strips. The
main crop in these situations is usually some form of turf species or landscaping.
Irrigating the parks and sports fields is a secondary opportunity. The reliance on this
form of effluent reuse would require very large balancing storages, extensive
reticulation in the parks and sports fields and a high level of operation and
maintenance to ensure the system both operated effectively and provides irrigation
at an optimal amount. That is, not too much resulting in waterlogging of soil and
runoff and insufficient water resulting in plant stress or die off.
For irrigation of parks and sporting fields, secondary treated disinfected effluent
would be adequate provided that the public is excluded from the area during
irrigation. This is often achieved by irrigating at night, and ensuring that effluent
does not pond.
The areas available in the Region would be minimal and could only ever offer a small
opportunity for effluent management.
7.5.3 Industrial Re-use
Use of treated effluent for industrial purposes has been practised on a worldwide
basis for many years. Many heavy industries use large volumes of potable water for
cooling, quenching, dust control, washdown and other processes which do not
require potable quality water. These industries are the prime targets for potential
water reuse.
Industries using large volumes of potable water tend to use this water at a
continuous steady rate with little seasonal or diurnal variation in demand.
Treated effluent is ideal for steady flow application because the flow is not
dependent upon the weather and will not diminish during rainfall periods thereby
requiring alternative methods of effluent disposal.
DRAFT
7-5
9:41 AM 02/09/05
Regional Environmental Assessment
However, the potential industrial reuse market within the study area is limited since
heavy industrial activity is limited.
The present trend in light to medium industry is to recycle effluent and reuse in-
house. This avoids the penalty of waste charges for ongoing discharge of 'used'
effluent.
A major study in Sydney concluded that less than 7% of Sydney Water Board's
effluents could be reused by industry, even if treated to secondary standard.
There would not be sufficient heavy industry to use a major portion of the effluent
generated, but may be a suitable supplementary use worthy of investigation once the
STP is operating.
7.5.4 Special Uses and Commercial
This market covers water used in both public and private institutions - such as
educational centres, airports, hospitals, shopping centres etc. Many of these
customers use water for industrial type processes such as cooling, boiler feed or
landscape irrigation. Because of the intensive patronage of these venues the
predominant use is usually internal amenities such as toilet flushing.
The high cost of retrofitting plumbing restricts this application to greenfield sites, in
line with dual reticulation restrictions. Therefore the applicability in the Region is
minimal.
7.5.5 Ground Water Recharge
Groundwater recharge is a method of replenishing the groundwater aquifers by
injection or surface percolation of treated wastewater into a groundwater basin. This
represents a traditional historical method of reclaiming large amounts of wastewater.
Properly treated wastewater can be used to replenish groundwater basins by
percolating through the upper soil strata into the water-bearing zone.
This migration of the water through the soil adds an additional treatment process
which polishes the wastewater and causes it to lose its identity. Subsequent
pumping of the groundwater can provide water of potable quality, unrecognisable as
treatment plant effluent.
However the local soils are generally unsuitable because of either high water tables,
low permeability or both, in addition to the heavy use of groundwater by households
in the Region.
7.6 On-Site Systems
7.6.1 Treatment Upgrades
A range of improved treatment systems is now available to supersede or supplement
the conventional Individual Septic Tank. These include aerobic sand filters, effluent
filter units, and two-stage septic tanks. Aerated wastewater treatment systems have
application in some circumstances, although passive systems remain the preferred
option where appropriate.
The techniques which are available to respond to the limitations outlined above can
also be viewed as opportunities for upgrading and retaining on-site treatment and
DRAFT
7-6
9:41 AM 02/09/05
Regional Environmental Assessment
disposal systems for long-term servicing of established settlements. These indeed
may prove fully cost effective, and at the same time achieve appropriate levels of
public health and environmental management effectiveness. Given the number of
ISTs in the region, this could be an attractive option.
The conventional IST can be improved by the addition of simple measures such as
clip-on gas baffles to the outlet tee and an upflow rock filter. These simple additions
will provide further control of potential solids carryover. Proprietary brand effluent filter
units can also be added to a septic tank to control solids carryover and also reduce the
biochemical oxygen demand.
Two stage septic tank configurations of standard precast tank units are becoming
increasingly utilised internationally as a means of achieving more reliable effluent
quality. The first-stage tank baffles hydraulic surge from household discharges and
captures the bulk of the sludge and scum; the second stage provides a quieter settling
environment for fine sludge particles carried over from the first stage, and thus protects
the disposal field from solids accumulation. This provides for more reliable long-term
operation of the disposal area, if one exists.
Aerated wastewater treatment systems provide primary and secondary treatment using
aerated bacterial growths to remove organic waste from the flow and convert this to a
settleable biological sludge. The treatment processes mimic those in conventional
wastewater treatment plants. The addition of chlorine controls faecal bacteria thus
rendering the effluent suitable for surface irrigation, although subsurface irrigation is
recommended to minimise public health risk. The main problems with such small
mechanised treatment units is performance reliability and maintenance requirements.
The biological treatment process is relatively sensitive to the fluctuating hydraulic and
organic loadings from single dwellings.
Aerobic sand filters following a septic tank provide an alternative secondary treatment
methodology. Sand filters are becoming popular because of their generally excellent
performance, reliability and relatively low operational cost. Primary treated effluent is
evenly dosed over a bed of sand and purification is achieved as effluent filters through
the sand. The purified effluent may be collected and irrigated under lawns and
landscaped areas.
For enhanced removal of nitrogen, septic tanks with integral trickling filters containing
highly porous plastic elements have been developed. This system is followed by a
sand filter to further purify the effluent.
The above demonstrates that there are a number of options to improve the treatment
efficiency of ISTs. However even with improved treatment as per the above
alternatives, there remains a need to dispose of or reuse the effluent.
7.6.2 On-Site Disposal
An IST can only be considered as a dedicated household system if the sullage can
be sustainably disposed off or reused on the household site.
The area required for a leach pit or absorption trench is highly dependant upon the
soil type, number of residents living in the house, depth to water table and so on. As
a minimum an allotment size of 1500 square metres would be required, but for
regional sustainability, lot sizes of 2500 or 3000 square metres are commonly
required internationally in rural residential developments.
DRAFT
7-7
9:41 AM 02/09/05
Regional Environmental Assessment
If an household sewage treatment plant with effluent irrigation is used to replace the
IST, then even larger areas are often required.
The allotment size in the Region for almost all households is well below 1500 square
metres, which is the absolute minimum required for stable leach fields.
In any case, given the reliance of the Region's disadvantaged population on shallow
bores, there would be a large health risk issue with contamination of the upper water
table by sullage. This is the case at present, so a large social health issue would
remain.
Based on the above, there is no real opportunity for on-site disposal of either IST or
household STP effluent in the Region. Wastewater must be collected from the
households and conveyed to an offsite location for treatment and effluent disposal or
reuse. Therefore there is little point in treating wastewater on-site using higher
technology, individual household treatment plants.
7.7 Collection System Options
Because on-site disposal of sullage is impractical, sullage must be collected from
each household and conveyed to a treatment plant.
7.7.1 Common Effluent Drainage Systems
Common effluent drainage (CED) schemes can be either a full gravity system or a fully
pumped system, or a combination of both. Effluent is collected from the outlet of
existing ISTs for conveyance to off-site treatment. Retention of the septic tank on each
property may require replacement of substandard tanks during construction, which
offsets to some extent the potential economics of such a servicing approach.
Furthermore, factoring in the costs of regular desludging of septic tanks can mean that
when operation and maintenance costs are capitalised, the scheme costs for CED may
not in some cases give significant cost advantages over reticulated sewerage.
7.7.2 Modified Common Effluent Drainage
This sewerage servicing approach is based on the "variable grade sewer" system
developed in the USA during the 1980's. Septic tank effluent can be collected by 30-
mm diameter on-property lines for discharge to 50-mm diameter public sewer lines.
The 50-mm lines can be laid by continuous trenching machines at constant depth
following the natural topography, thus reducing construction costs. Main sewer lines
can flow uphill as required, as long as properties in the vicinity of uphill sections are
located above the hydraulic grade-line.
The main problem experienced has been with longer term pipe blockages. Solids
carried over from poorly performing ISTs have blocked small-bore pipes. Given that
these schemes also have a reduced number of manholes, then pipe clearing is difficult
and involved exposing long pipe lengths leading to significant disruption of the
community.
The CED and modified CED schemes are not being installed very much internationally
because the whole of life costs are high due to extensive maintenance costs, making
conventional sewerage competitive.
DRAFT
7-8
9:41 AM 02/09/05
Regional Environmental Assessment
7.7.3 Conventional versus Combined Sewers
Conventional sewers are simply a system of pipes and conduits that separate
stormwater from sewage/sullage/wastewater. This is a more expensive option than
allowing one set of pipes to convey the combination of stormwater and wastewater,
but has improved environmental benefits as the two different flows can be managed
separately.
However there are many combined sewer systems internationally that function
adequately. There are obviously pollution incidents during wet weather when the
sewage flows are diluted and have to bypass, either partially or totally, the treatment
plants provided to handle the dry weather flows. In non-critical receiving water
environments, this deterioration in treatment efficiency can be accepted as a trade-
off against the additional cost of providing two separate pipe systems.
A counter-balancing argument for combined systems is that drainage systems are
often installed in urban areas at the time of development, while sewers are not
installed contemporaneously. The retrofitting of separate sewers in moderate
density urban areas is possible, but at significant financial cost and some external
economic costs, such as business disturbance.
The retrofitting of separate sewers in highly urbanised areas is also possible, but at
significantly greater financial cost and with other socio-economic costs. These
external economic costs again include loss of business for the nearby commercial
activities, but of course there are a larger number being affected. Further in the
highly urbanised environment, the traffic implications are significant. In Manila, there
is not a simple grid of public access streets that allows ready rerouting of traffic for
example.
7.7.4 Reticulation Summary
Based on the above, there is little merit in trying to reduce reticulation pipe sizes
using CED schemes. Conventional sized pipe-work is more appropriate.
Regarding septic tanks, if it is easier to connect into the household plumbing system
downstream of the IST then that is acceptable provided that sufficiently large bore
sewers or combined drains are still used.
In some cases, a combined sewer/drain approach can be used to minimise
disruption and also cost, provided that the health issues of residents possibly
contacting the sullage are addressed. This is provided that the receiving waters are
not overly sensitive to intermittent loads associated with some portion of the wet
weather flows of combined stormwater and wastewater necessarily bypassing the
treatment flow.
7.8 Waste Minimization Options
These are non-structural options that are partial schemes only and should be viewed
as a supplement to some other full option, such as conventional sewerage.
An Information and Education Campaign would be required to minimise the
wastewater volume and strength generated. Wastewater volume is directly related
to water efficiency within the household. This does not have a great impact on the
receiving water environment as the waste pollutants are simply less diluted. The
reduced water use has other external benefits such as less demand on water supply
infrastructure.
DRAFT
7-9
9:41 AM 02/09/05
Regional Environmental Assessment
Reduced waste mass can only be achieved by minimising food scraps being washed
into the wastewater flow, or flow diversion due to system such as grey water reuse or
composting toilets.
7.9 Flood Flow Manipulation
In addition to conventional sewerage and waste management systems, there are
other options within the Region to achieve improved water quality and ecological
conditions.
For example, a portion of the flood flows in the Marikina River is diverted into Laguna
Lake via the Manggahan Floodway to reduce flood impacts on developments along
the lower reaches of the Pasig River. Usually the impounded floodwaters are then
fully released once the flood has receded.
One alternative raised by DANIDA (1999) is to increase this quantum of floodwater
diverted into Laguna Lake. The impounded floodwater would then not be released
immediately once the flood had passed, but retained for slow release during the dry
season. This then allows a more substantial fresh water baseflow to be sustained in
the Pasig River system, and therefore a marked improvement in water quality status
and ecosystem diversity would be achieved.
However, there are conflicting land use problems with the option. Presently there is
substantial farming around the perimeter of the Laguna Lake in the dry season,
which would be impacted if using the lake more extensively as a controlled flood-
release basin. The peripheral area farmers have already presented their case to the
LLDA noting that the extended period of water retention and associated inundation
will prevent the planting of their crops. There will not be sufficient growing time if the
Lake is used for the additional retention of flood flows for water quality management
via controlled releases, as opposed to solely for flood retention purposes as at
present.
The DANIDA modelling report (1999) notes that this is probably the best way of
providing a significant improvement in Regional water quality in the critical dry
season. However until the social farming issues are overcome, this option will not be
possible.
7.10 No Project Option
This is a fundamental option that provides the base case against which other options
may be compared.
The present state of the local water environment, with the exception of Laguna Lake,
is parlous. The Pasig River for example has protracted periods of near zero
Dissolved Oxygen, especially in the dry summer months. The better results are
upstream of the confluence with the Laguna Lake outflow and for the stations within
Manila Bay. The middle reaches exhibit very poor water quality.
The water quality data has been reviewed statistically (PRRC Water Quality
Monitoring Action Plan, 2002) and there are apparent trends of improvement, but
at such a low level of statistical confidence that the data cannot be used for trend
analysis. There are many extreme outliers in the data which suggests that some
results are incorrect. This could be due to many factors such as:
Ř inaccurate or poor equipment calibration
DRAFT
7-10
9:41 AM 02/09/05
Regional Environmental Assessment
Ř field or laboratory equipment faults
Ř reporting or recording errors, such as transcription errors
Ř sampling errors, such as disturbing the sediment when taking water samples or
readings, and
Ř general data QA issues.
Further, there is no explicit allowance in the data for tidal state at the time of
collection or river flow. The river flow varies greatly from wet to dry season and the
water quality is directly related to river flow diluting the pollutants. Also there is no
replication of samples, thereby further reducing data utility for trend analysis.
In conclusion the water quality data sets are extensive but cannot be used for valid
statistical comparisons. However the data clearly shows that for many months, the
middle reaches of the main watercourses are capable of supporting only the lowest
forms of aquatic life, and not a viable ecosystem including a commercial fish
population.
Adopting the No Project option would exacerbate this already grossly stressed
ecosystem. Additional pollutant loads due to increasing populations would further
extend the period during which the main watercourses are not supporting a stable
ecosystem. Specifically the population within the MWCI concession area (East
zone) is predicted to increase from 5.3 million persons in 2004 to 8.2 million in 2021.
There are no indications that the population growth will subside even after this
period.
Laguna Lake presently has fair water quality, but is becoming more stressed. The
frequency of occurrences of algal blooms is increasing, as are the apparent trends in
nutrient levels and primary productivity. Siltation is also accelerating.
Noted elsewhere is the present state of population morbidity, with over 30% due to
water borne diseases. Additional sullage and wastewater will be generated over
time as both the population increases and more people obtain access to reticulated
water and therefore install sanitation facilities.
This combination of increasing population and additional water supplies being
provided will increase the pollution load and the attendant environmental damage,
morbidity, aesthetic degradation and roll up into elevated economic dis-benefits.
In summary, allowing increasing pollutant loads to continue unchecked is
unacceptable on many socio-environmental fronts. The No Project option cannot be
supported in reality.
7.11 Comparison of Options
The general conclusions on strategic alternatives are that:
Ř There are options for reducing the volume and strength of wastewater requiring
treatment and disposal from households in the Region. Waste minimisation and
partial effluent reuse schemes on site are possible, but will never use a large
portion of the total wastewater load. Such schemes may be used locally as
appropriate but will never be a complete scheme option.
Ř There is no sustainable options for complete on-site disposal, so wastewater
either from the ISTs or raw sewage has to be taken off-site
Ř STPs located along the estuary are acceptable provided that the plants can be
retrofitted for a higher treatment standard in the future if required, or they can be
DRAFT
7-11
9:41 AM 02/09/05
Regional Environmental Assessment
converted to pump stations serving a much larger catchment to pump sewage to
a smaller number of larger capacity STPs if required.
Ř The cost of reusing the total effluent volume is too high at present to be a viable
alternative.
Ř Partial reuse or supplementary schemes may be considered such as park and
sports field irrigation, but this will only use a small fraction of the total effluent
flow.
Ř These larger STPs that may be required in the future may be located closer to
the Bay or an effluent reuse site
Ř Flood flow manipulation by diverting greater volumes of floodwater into Laguna
Lake would be effective in improving water quality in the critical dry season, but
there are presently a number of blocking political and social factors to overcome
prior to implementing this scheme
Ř The No Project option is unacceptable as the present ecological and economic
impacts are too high at present, and the Regional population continues to
increase rapidly.
The key options are summarised below.
Option
Cost/
Remarks
Household
Waste
No cost, as only an education
Only will reduce the flow and load , but a total
Minimisation
issue
wastewater collection and treatment scheme is
still required.
Improved on-
In the order of USD4,000/HH
Improved on-site treatment will still not allow on-
site treatment
for an aerobic household STP
site disposal and a sewerage system and
treatment plant is still required.
On-site disposal
USD2,000/HH for an irrigation
Most households do not have sufficient vacant
scheme to dispose of treated
land area for an engineered infiltration scheme or
effluent
effluent irrigation scheme, including the wet
weather balancing storage required. A sewerage
system and treatment plant is still required.
Dual reticulation
USD4,500/HH for centralised
Will only allow a relatively small fraction (say 30%)
with high quality
tertiary treatment and dual
of the total wastewater flow to be reused and avoid
effluent
reticulation for treated effluent
discharge to the local watercourses. This is more
returned to the
return
a pollution prevention supplement than a complete
household for
waste management system
non-potable
reuse
Effluent
USD 2,500/HH. This is the
This is only an environmental addition to minimise
irrigation
cost over and above the cost
water quality impacts of discharging the treated
of sewerage and full
effluent. A sewerage system and treatment plant is
treatment, and applies only to
still required
the irrigation scheme
Indirect potable
USD 1,500/HH. This is the
This is only an environmental addition to minimise
reuse
cost over and above the cost
water quality impacts of discharging the treated
of sewerage and full
effluent. A sewerage system and treatment plant is
treatment, and applies only to
still required
the supplementary tertiary
treatment required
Direct potable
USD 2,500/HH. This is the
This is only an environmental addition to minimise
reuse
cost over and above the cost
water quality impacts of discharging the treated
of sewerage and full
effluent. A sewerage system and treatment plant is
treatment, and applies only to
still required
the supplementary quaternary
treatment required
No Project
No direct cost, but large
The present socio-economic impacts are
Option
economic costs
demonstrably large, and will increase as the
population and unhindered development continue
in the Region
DRAFT
7-12
9:41 AM 02/09/05
Regional Environmental Assessment
The collection mechanism is not critical to the overall wastewater management
strategy, apart from affordability and implementability. It is not critical if separate
sewers or combined sewers are used from an environmental perspective, provided
that the health risk issues of the open drains in some locations are addressed. This
section has investigated CED sewerage scheme options, and they offer no real long-
term benefit over conventional or combined sewer sewerage systems.
DRAFT
7-13
9:41 AM 02/09/05
Regional Environmental Assessment
8 MTSP Framework
8.1 Introduction
As described above, the present situation is resulting in environmental, ecological,
health, fishery and tourism impacts, with major attendant economic losses. The
present situation cannot be allowed to continue, and therefore requires improvement.
Given the very small percentage of sewerage coverage in Metro Manila, and the high
population density, the usual strategy in these circumstances would be to sewer all
of the Region as soon as possible. This would be practical in less densely
developed urban areas, but only where;
Ř a large sinking fund has historically been established to fund the large capital
expenditure required,
Ř the infrastructure can be installed with community support and forbearance
Ř the population will connect to the sewer system, and
Ř the householders will consistntly pay the tariff for wastewater management.
However in this case, the present low percentage of sewerage in the Zone, together
with the required capital and operating cost requirements, and social issues such as
lack of community support and household affordability, precludes adoption of an
immediate global sewerage and treatment strategy. Some less densely populated
areas in the zone can be sewered and have the wastewater directed to new sewage
treatment plants in these catchments, but this will only account for a small portion of
the zone's customers.
Therefore, in the medium term at least, ISTs will be part of the east zone's
wastewater management systems into the future. Septic systems only work
efficiently when the tanks are regularly desludged. This prevents excessive solids
carrying over with the sullage. These solids carry large quantities of pathogens
(disease causing organisms), have high organic loads and can cause downstream
pipework blockages. A priority must therefore be to maintain the operation of these
septic tanks to minimise both health and environmental impacts.
Septic tanks in the concession areas are desludged very infrequently at present.
This reduces the efficiency of the septic tanks as noted above and has attendant
environmental and health impacts.
To improve septic tank efficiency, a fleet of tankers is required to allow desludging of
tanks approximately every 5 years. There are some other individual operators
providing a tank desludging service, but this is only upon request, and usually only
when tanks are completely blocked up with solids. There is no programmed
maintenance of the septic tanks that will minimise the present environmental
impacts.
Once a fleet of collection vehicles is established, there will be a need for septage
treatment and/or disposal facilities. The present independent tanker operators are
most likely dumping their septage illegally for example. A network of septage
treatment plants is therefore required as a minimum. The resulting sludge will then
require disposal either at an approved landfill or land applied. In addition,
opportunities for productive reuse of the raw septage are available, such as applying
the organically rich septage to poor agricultural soils, especially the lahar affected
areas to the North of the Region.
DRAFT
8-1
9:41 AM 02/09/05
Regional Environmental Assessment
Locally, sullage is usually simply discharged into stormwater drains. Some of these
are open drains, which allows physical contact by the community with the untreated
wastewater, with attendant health risks. Usually it is the children involved in this
contact and they represent some of the most susceptible members of the community
to such disease risks. This health risk is exacerbated if the septic tank has not been
maintained and biological solids are carrying over.
Morbidity data are presented elsewhere in this report indicating significant water
borne disease events are not uncommon in Manila. A further priority is therefore to
limit the contact possibilities between sullage and the community. This will require
some drainage repairs and covering of other drains.
The present sanitation system generally has septic tanks without the requisite
soakage tranches or evapotranspiration beds. Therefore the sullage (the ongoing
liquid outflow from septic tanks) is discharged to a stormwater drainage system
rather than disposed of on site or directed to a dedicated sewer. In most countries, a
septic system is environmentally sustainable only when there is sufficient land
associated with the system to allow either infiltration into the soil or
evapotranspiration of sullage. That is, there is no uncontrolled liquid discharge off
the site into drainage systems to pollute the environment. There is no opportunity
locally to provide soakage trenches or evapotranspiration beds because of a lack of
land space in almost every existing site.
These septic tanks can serve either individual dwellings or commercial
establishments, or be a community-based tank system. One priority is therefore to
convert some of the community septic tanks into sewage treatment plants.
Even if the septic tanks are appropriately maintained, the sullage eventually reaches
local watercourses such as the Pasig River. These water bodies are highly polluted
as a result, and the pollution takes many forms, but especially;
Ř organics (which deplete the oxygen in the watercourse so higher aquatic life
forms cannot survive), and
Ř pathogens (disease causing organisms which concentrate in biological solids).
Therefore a program is required to either;
Ř sewer these areas and direct the sullage to a sewage treatment plant (or convey
raw sewage to a treatment plant if the septic tank is removed), or
Ř provide an interception system to collect the sullage and other wastewater from
the stormwater drains, and divert the dry weather flows to a sewage treatment
plant
Dedicated sewerage systems are expensive to install, cause disturbance to
roadways and access paths, and may not be used unless the community agrees to
connect to the sewer. Finally, the householders must be willing to continue to pay
their tariffs to fund the operation of the sewerage system. Local experience
indicates that many of these items will not occur.
A second alternative is to install drainage modifications within catchments to divert
dry weather flows in stormwater drains and esteros into purpose-built sewage
treatment plants. This then limits the dry weather discharge of sullage into the local
major watercourses. This may apply for both small drainage systems and also larger
drains associated with flood control networks. Most environmental impact occurs in
DRAFT
8-2
9:41 AM 02/09/05
Regional Environmental Assessment
the dry season when there is little diluting flow in the local water bodies, so treating
the dry weather flows of sewage/sullage is still very beneficial environmentally.
Sludges from the septage treatment plants and also the sewage treatment plants as
well as some raw septage will require disposal. The ocean dumping trials were
curtailed and so a new disposal option is required. Appropriate application of these
sludges to poor agricultural soils would improve the soil organic content, water
holding capacity, general fertility and increase the Cation Exchange Capacity.
Suitable environmental studies would be required to demonstrate the sustainability of
such applications supported by management plans for ongoing applications.
In addition to the physical and financial aspects of the sewerage and sanitation
improvements, the up-grades will only be sustainable if the community is educated
about the benefits, and importantly, the requisite need to fund these benefits.
Therefore a project component providing an Information and Education Campaign is
a high priority.
8.2 Background Summary
The present sewerage and sanitation system in Manila has a number of
shortcomings as noted above. In response to these, the Manila Water Company,
Inc. (MWCI) continues to roll out a large range of improvements in water, sewerage
and sanitation services and associated infrastructure, as part of their Concession
Agreement with the MWSS. MWCI holds the concession for the eastern part of
Metro Manila.
These deficiencies are to be addressed in part by the proposed project, namely the
Manila Third Sewerage Project for the eastern zone. The historical planning and
justification that lead to the decision to pursue MTSP are provided later in this
document.
Some components are funded by the World Bank, and as such, the financial, social
and environmental issues have to be addressed to WB standards. The WB has
requested that a Regional Environmental Assessment be undertaken for the present
project. Intended to meet or exceed their sewerage and sanitation commitments as
part of the concession agreement, the MTSP aims to:
Ř improve sewerage and sanitation
Ř reduce environmental pollution, and
Ř lessen health hazards from wastewater in the East Zone concession area.
MWCI is fully committed to ensuring that the socio-environmental impacts and
benefits are fully assessed, in support of the WB requirements.
8.3 Concessionaire Sewerage and Sanitation Obligations
When the MWCI took over the MWSS operations for the East Zone in August 1997,
the sewerage and sanitation programs of MWSS were limited. The areas with
sewerage service represented less than 5% of the total MWSS service area. These
are the areas served by the Central Collection System, the Dagat-Dagatan system,
the Magallanes System, and isolated systems in Quezon City. The majority of the
MWSS service area is served by individual septic tanks.
DRAFT
8-3
9:41 AM 02/09/05
Regional Environmental Assessment
Table 8 - 1. Sewerage and Sanitation Facilities in the MWSS Service Area, 1997
System Name
Area Served
Sewer
Characteristics
MWSS Service
Operator
Length
(km)
Central Sewerage
Manila City
304.9
Outfall to Manila
O&M for network,
MWSI
System
Bay
pumping stations
and outfall
Magallanes
Makati
72.8
Treatment Plant
O&M for
MWCI
Sewerage System
treatment plant
and network
Dagat Dagatan
Caloocan,
18
Treatment
O&M for
MWSI
Sewerage System
Malabon,
lagoons
treatment plant;
Manila,
O&M for part of
Navotas
network
Quezon City
Quezon City
123.7
Communal
O&M, desludging
MWCI
separate systems
septic tanks
Individual septic
MWSS
-
Private septic
Desludging (for
MWSI and
tanks
Service Area
tanks
water customers)
MWCI
NHA Systems (for
MWSS
not
Communal
None
MWSI and
Zonal improvement
Service Area
specified
septic tanks
MWCI
projects)
In terms of sanitation service, MWSS provided desludging services, albeit on a very
limited basis. The main constraint in the desludging program was the availability of
septic tank emptying /desludging tucks and sludge disposal sites acceptable to the
DENR. Since September 1995, the only disposal site formerly used by MWSS (near
Marilao, Bulacan) became unavailable and the desludging work cannot be continued.
MWSS equipment has also exceeded its working life with the desludging units only
partly operational due to frequent breakdowns and lack of spare parts.
In the 25-year Concession Agreements (CA), the concessionaires were given
performance targets for the delivery of water supply, sewerage and sanitation
services. The CA specified the following original sewerage targets for MWCI.
Table 8- 2 1997 Sewerage Targets East Concession Area
Sewerage
2001
2006
2011
2016
2021
(%Coverage)
Mandaluyong
0%
0%
100%
100%
100%
Makati (Part)
22%
52%
100%
100%
100%
Quezon (Part)
0%
0%
83%
87%
98%
Pasig
0%
41%
68%
68%
68%
San Juan
0%
0%
100%
100%
100%
Pateros
0%
60%
100%
100%
99%
Taguig
0%
52%
75%
84%
100%
MWCI then evaluated the feasibility of the JICA Master Plan Study done in 1996. It
also commissioned the services of an engineering consultant to assess and
determine technical options to meet the 1997 sewerage targets.
Below is a review of the masterplans prepared for the expansion of the sewerage
system of Metro Manila and the East Zone in particular.
DRAFT
8-4
9:41 AM 02/09/05
Regional Environmental Assessment
8.3.1 JICA Master Plan Study
In 1996, the Japan International Cooperation Agency (JICA) completed a Master
Plan Study that reviewed and analyzed the problems of MWSS (high NRW, delay in
expansion, lack of groundwater supply, delay of water source augmentation, delayed
progress of the sewerage system, shortage of necessary staff, among others). The
JICA Master Plan is a comprehensive guideline to meet specific targets. It is based
on the policies of utilizing existing facilities, partnership with private sectors or BOT
and the balanced and cooperative development of water supply, sewerage and
sanitation services.
In the area of wastewater, it envisioned 30% sewer coverage by 2015. Facilities
were planned so that effluent quality was set at 30 mg/L Biochemical Oxygen
Demand (BOD). Sanitation services were supposed to be delivered, with a regular
frequency of desludging of individual septic tanks every 5-10 years.
The JICA study proposed to provide wastewater services for domestic and
commercial developments. Focus was on septage management with ocean
dumping as the interim means of septage disposal until 2015. Septage treatment
plants (SPTP) were outlined for construction in and out of Metro Manila from 2008-
2015. Installation of communal septic tanks was also recommended.
The sewerage plan favored a phased approach using the principle of combined
systems with emphasis on low construction cost. As to the treatment system, low
construction/maintenance treatment methods were recommended. Medium-scale
inland treatment systems (10 STPs with capacities of 48-515 MLD) were endorsed
considering the availability of potential STP sites as well as its flexibility and
investment savings. JICA demarcated a total of 50,692 hectares for off-site
treatment and designated these as sewerage framework plan areas.
The completion of the JICA Master Plan was closely followed by the privatization of
the MWSS in August 1997. The action plans it proposed and the framework it
suggested were not realized since new sewerage targets were set for each
concession area through the Concession Agreement. The CA essentially divided the
MWSS service area into two distinct and independent areas, each with its own water,
sewer and sanitation service requirements. Planning for expansion of the services in
each area was devolved to each concessionaire.
8.3.2 MWCI First Wastewater Strategy Plan, 2000
In the original MWSS-MWCI CA, MWCI was obliged to provide sewer services from
less than 5% in 1997 to 55% of the East Zone by the end of the concession in 2022.
The CA envisioned an increase in sanitation services, followed by a decreasing trend
as sewerage services were expanded.
In order to formulate a plan to meet the original sewerage and sanitation targets,
MWCI engaged a consultant to devise a methodical, systematic approach to ensure
that the contractual targets of the CA can be achieved. This study was concluded in
January 2000.
The Plan identified a long-term strategy of a decentralized approach with a provision
of many small/medium treatment works in Quezon City, Pasig, Makati and
Mandaluyong. Isolated areas will be dealt with by using small package plants.
Sewer routes will normally be under highways and almost all streets will contain a
sewer line. Combined sewer systems were also contemplated for dense areas where
DRAFT
8-5
9:41 AM 02/09/05
Regional Environmental Assessment
land for STPs was not available. The concept of septage and wastewater co-
treatment was also presented for STPs with capacities greater than 10 MLD.
The Plan also identified major issues that need to be resolved for project
implementation. The biggest issue was the need to secure a total area of 50
hectares for the STPs.
Finally, implementing the Centralised Plan would result in a PhP10 increase of the
water tariff in the 2003 rate rebasing, which is simply unaffordable for the
community.
Therefore it was essential to reassess alternatives to the JICA masterplan which was
the basis of the original CA targets set in 1997. A review of the other ongoing
projects in the Region was therefor required.
8.4 Experience from Ongoing Projects
8.4.1 MSSP Community Sanitation Project (MCSP)
The MCSP originally involved the construction of twenty-seven (27) on-site STPs.
The present facilities in the communities are unable to meet the DENR effluent
quality standards and directly contribute to the pollution of inland rivers and
waterways.
During project conceptualization, the communities were properly consulted and
provided project details. Memoranda of Agreement (MOA) were executed for
easements on the lots for the STPs as well as sewer charging. However, even with
consultation imminent, six out of twenty-one projects were cancelled. At the time
when construction was about to commence, the communities reneged on the MOAs
due to the issue of sewer charging.
8.4.2 MSSP-4
One of MWSI's commitments under MSSP is the installation of about 10,000 new
sewer service connections, the cost of which would be chargeable to the loan.
Within the period of October 5, 2001 to present, MWSI was able to implement 1000
stub-outs for connections only. Again, sewer charges coupled with absence of
direct benefits are the people's main contention for not connecting.
8.4.3 Pateros Sewer System
In 2001, MWCI proposed to install a separate sewer system for the municipality of
Pateros and portions of Taguig. The majority of its population belong to the low-
middle income classes.
The proposal was in connection with the original CA sewer targets. The proposal
was rejected by the LGU due to non-availability of land, possible traffic disruptions
and issues on capacity to pay. The LGU instead suggested that MWCI focus on the
improvement and provision of low-cost sanitation services for pocket areas in the
municipality which has little or no access to sanitation facilities.
8.5 Specific Implementation Difficulties
In past sewerage studies and project implementation, four major factors have
consistently been identified as inhibiting the implementation of sewerage and
sanitation projects, especially centralised schemes. These are:
DRAFT
8-6
9:41 AM 02/09/05
Regional Environmental Assessment
Ř lack of available and affordable land,
Ř disruption during construction,
Ř tariff affordability and willingness-to-pay, and
Ř problems in encouraging sewer connections.
8.5.1 Land Availability and Cost
The availability of land for centralised STPs is the primary limiting factor to
implementing a traditional centralised scheme. The parcels of land previously
identified for sewerage purposes are now occupied and/or developed or otherwise
allocated for specific purposes, such as occupied by both informal settlers and
recent government housing projects, such as NHA developments. Therefore the
critical land areas required for large STPs is now unavailable in the short to medium
term for a centralised scheme.
Depending upon the exact location, the cost for land acquisition could take up as
much as 40% of the total project cost. The current average population density of
15,617 persons/square kilometre in Metro Manila reinforces land as a limiting factor
in any project.
Therefore the land availability is a primary factor both in terms of actually locating
and gaining access to large tracts of lands, and then the associated financial
implications of purchasing such large blocks for such a low value use.
8.5.2 Community and Traffic Disruptions
If land for STPs were available, disruption in terms of social and economic practices
is still a major concern with centralised schemes. From experience, a water service
connection is forthcoming only 2 weeks after payment of a connection fee. This
timetable includes permits processing and civil works on minor roads.
The civil works required to install centralized sewerage networks would involve the
excavation of both major and minor thoroughfares. Traffic impacts, disruption and
permit processing for large sewerage systems could result in years of
implementation and disruption. Prior experience has indicates that the LGUs will
simply not support such lengthy disruptions
8.5.3 Enforcing Sewerage Connections
Landholders located with 60 metres of a sewer are legally obliged to connect onto
that sewer. However many households simply refuse to connect.
The institutional system does not allow MWCI to force them to connect even though
the legislation so requires. Similarly, MWCI cannot disconnect their water as an
incentive to connect or pay for the sewerage service once connected.
8.5.4 Tariffs
Another challenge will set in once a sewer system is operational. By law,
households/establishments connected to a sewer system are required to pay a
sewer charge equivalent to 50% of the basic water tariff. Even with these charges,
the cost for water and sewerage amounts to less than 5% of an average household's
monthly income.
The investment cost for projects will be recovered through the tariff as provided for in
the CA. The effective tariff, in addition to the sewer charge, will however be at
DRAFT
8-7
9:41 AM 02/09/05
Regional Environmental Assessment
socially unacceptable level. Collection of fees for sewer connection will also present
problems.
8.5.5 External Factors
External changes have also influenced the evolution of the MTSP strategy, such as
the following:
Ř Tondo outfall is now not being extended
Ř Forced cessation of sea dumping of septage, even after the barge loading
terminals were constructed. This DENR approved dumping was essentially
stopped by NGO and LGU pressure, rather than demonstrated environmental
impacts
The most direct beneficiary of sewerage projects is the environment, with community
health a less appreciated benefit. Unlike water supply projects from which
immediate benefits are felt directly by consumers, the advantages of sewerage and
sanitation projects to the populace are unseen and indirect. Hence, convincing
people to connect with corresponding additional sewer charges is difficult. This has
been the common experience of both MWCI & MWSI in implementing sewerage
projects.
This also applies to the proposed implementation of extensive land application of the
dewatered and dried septage/sludge into the lahar affected areas to the north of the
Region. This is positive benefit with improved soil properties resulting and higher
crop yields, compared with the potential environmental impacts of ongoing sea
dumping.
Communities have been organised to participate in the planning and design stages
to ensure that the project cost is both within their ability-to-pay and willingness-to-
pay. Initial successes adopting the decentralized approach have been demonstrated
in the following projects:
Ř Cabanatuan City Storm Drainage Project
Ř Palawan Province Barangay Sanitation Project
These strategy changes demonstrate MWCI's commitment to reflecting social
expectations and wants.
8.6 Rate Rebasing
Based on the socially unacceptably high charges and other factors listed above, a
revised approach to the CA Targets had to be developed. In summary, based on the
difficulties discussed above, MWCI found it prudent to implement a decentralized
approach towards providing sewerage and sanitation services. The JICA Masterplan
hinted at this approach while the First Wastewater Strategy plan made
decentralization its framework.
Considering the difficulties associated with implementing large centralised sewer
systems, MWCI presented an alternative decentralized approach in its 2003 rate
rebasing submission. The new sewerage targets are as follows.
DRAFT
8-8
9:41 AM 02/09/05
Regional Environmental Assessment
Table 8 - 4. Revised Sewer and Sanitation Targets (2003)
Sewerage
2001
2006
2011
2016
2021
(%Coverage)
(Actual)
Mandaluyong
0%
0.5%
4%
10%
15%
Makati (Part)
22%
40%
38%
28%
23%
Quezon (Part)
0%
13%
20%
16%
17%
Pasig
0%
9%
10%
12%
14%
San Juan
0%
0%
0%
18%
41%
Taguig
0%
5%
25%
26%
20%
Sanitation
2006
2011
2016
2021
(%Coverage)
Quezon City
87%
80%
84%
83%
Marikina
100%
100%
100%
100%
Pasig
91%
90%
88%
86%
Angono
100%
100%
100%
100%
Antipolo
100%
100%
100%
100%
Binangonan
0%
0%
100%
100%
Cainta
100%
100%
100%
100%
Cardona
0%
0%
100%
100%
San Mateo
100%
100%
100%
100%
Taytay
100%
100%
100%
100%
Teresa
0%
0%
100%
100%
Another major change in the 2003 rate rebasing was the acceptance of combined
sewers. The original CA only allowed separate sewer and drainage systems. This
change has resulted in a fundamental change in approach to wastewater
management in the east zone.
8.7 Project Development
The project adopts an incremental decentralized approach to improving sewerage
and sanitation services. This approach recognizes that a traditional conventional
sewerage network leading to a small number of centralised STPs cannot be
completed immediately, mainly due to land limitations and the associated high cost,
and the social impacts. The incremental decentralized approach adapts
conventional sewerage and sanitation projects based on the communities' population
distribution, existing infrastructure and the willingness to have and importantly fund
the system.
In line with the objective of MSSP to assist MWSS in the development of follow-up
sewerage projects, MWSS and MWCI proposed the Manila Third Sewerage Project
(MTSP) for World Bank funding. The MTSP is a follow-up to the MSSP and has the
ultimate objective of improving sewerage and sanitation conditions in the East Zone
concession area.
Conceptualization of the MTSP components took into account the limitations and
lessons learned from implementing past projects on sewerage and sanitation. Such
limitations and lessons ruled the selection of the project area and the nature of the
project to be executed.
DRAFT
8-9
9:41 AM 02/09/05
Regional Environmental Assessment
8.7.1 Land Availability
Recognizing land as a major limitation in project implementation, MWSS and MWCI
closely investigated land availability in the areas where the MWSS set new sewerage
targets. The elected representatives of the LGUs, as administrators of cities and
municipalities, played a large role in identifying possible sites for sewerage facilities.
Possible linkages with existing and future projects of different agencies such as the
National Housing Authority, the Department of Public Works and Highways, the
LLDA and the PRRP were also explored.
8.7.2 Applicable Concepts
The two previous master plans pointed to the use of combined sewerage systems as
the means to expand sewer coverage at the least cost and minimum disruption. This
was heavily considered in conceptualizing the MTSP.
Programs to address the sanitation requirements of low-income groups and the
portion of the population that has no access to basic sanitation facilities were also
explored.
8.7.3 Social Acceptability
Technical and financially feasible projects do not get implemented if they are socially
unacceptable. Hence, social indicators will be obtained prior to implementation of
projects conceived for MTSP.
8.8 Selection Criteria and Methodology
The following describes in detail how the components of MTSP were finalized.
8.8.1 Availability and Land Criteria
Both sewage and septage treatment plants require land that is preferably located far
from residential communities to avoid nuisance that may be caused by the plant's
odour or noise emissions. This criteria should be considered without prejudice to the
requirement of accessibility to tankers, for septage treatment plants. Distance and
accessibility has to be weighed against cost for transport or pumping of septage and
wastewater, respectively.
The ideal site for either SPTPs or STPs should be close to main drainage channels
or receiving water bodies. It should also be free from informal settlers. It should not
be the subject of any pending legal case on ownership or jurisdiction.
Precluding the above criteria, the availability of land for STPs dictates project area
selection. Aerial photographs of Metro Manila, the latest of which was taken in 1996,
provides an overview of the city's landscape. These indicate that vacant tracts with
sizes ranging from 1 to 5 hectares are concentrated in Taguig.
An investigation of the present status of the identified vacant spaces reveal that the
parcels have now been developed into commercial or industrial complexes. Some
have been encroached upon by informal settlers or developed into housing projects
by the LGU or the National Housing Authority (NHA).
In view of these developments, the MWSS-MWCI Project Development Team
consulted with the administration of each LGU in the East Zone to determine projects
and locations that could be relevant to the improvement of sewerage and sanitation
services. From these consultations, MWSS-MWCI learned of the DPWH Flood
DRAFT
8-10
9:41 AM 02/09/05
Regional Environmental Assessment
Control Project in Taguig and the EPA component of the PRRP. Part of PRRP's
activities is the conversion of the EPAs into riverparks. The management of the
riverparks, from pre- to post-construction phase is in the hands of the LGUs.
The proponents also made consultations with agencies tasked to develop housing
projects (NHA, Bases Conversion Development Authority, Housing and Urban
Development Coordinating Council, Home Guaranty Corporation) to determine the
required water and wastewater services for their existing and planned projects. This
opened up the concept of sewerage projects for low- to middle-income communities
assisted by the housing agencies. In this case, the housing authorities are willing to
allocate land for sewerage purposes.
8.8.2 Catchment Area Selection
The types of sewage collection networks that will be installed through MTSP will be
site specific. Combined sewer systems are proposed for highly built-up or densely
populated areas where major or minor excavations will be socially and economically
unacceptable. Separate sewer systems are planned for relatively undeveloped low-
to middle-income areas where health impacts from sewerage or drainage projects
are at a premium.
The scope of the catchment area of each MTSP component is influenced by the size
of available land for STP/SPTP, topography and the layout and status of existing
drainage channels.
A survey of the drainage outfalls along the stretches of the Pasig River and the
Marikina River was conducted by the MWSS-MWCI Project Team in 2001 and 2004,
respectively. This was plotted and superimposed on a map showing previously
identified vacant, feasible STP locations. The survey showed that some main
drainage outfalls are near the intended PRRP riverparks which are possible locations
of underground STPs. An in-depth analysis of the drainage systems leading to the
main drainage outfalls assisted in delineating the boundaries for the Riverbanks STP
component.
Allowable treatment capacity per a given land area also delimits a catchment area.
This, along with consideration of disruptions due to major excavation, is a significant
factor in determining the catchment areas for each of the communal septic tanks
considered for upgrade in the Upgrade of Existing Sanitation Systems component.
The catchment area for the Taguig Sewerage System is largely influenced by the
scope of the DPWH Flood Control Project whose major consideration are the river
channels, existing drainage systems and the seasonal variation in elevations of the
Laguna Lake.
8.8.3 Health/Environmental Impact
MTSP was initially formulated to arrest direct discharges of untreated wastewater to
water bodies. Hence, an immediate response was the survey of drainage outfalls to
the Pasig and Marikina Rivers. However, the results of a survey conducted late
2003 on some MTSP project areas show that designing the components should
consider prioritizing human benefits over environmental benefits, in some cases.
8.8.4 Financial and Economic Considerations
MTSP affected communities are in the low- to middle-income brackets. The impact
of the sewer charges which the sewered communities will pay once the STPs
DRAFT
8-11
9:41 AM 02/09/05
Regional Environmental Assessment
operate is considered in finalizing the list of project components especially for the
Sanitation for Low-Income Communities component. The list has been narrowed
down to two from more than twenty communities originally considered in lieu of
issues on willingness and capacity to pay for water and sewer charges.
8.9 Overview of the Manila Third Sewerage Project
The Manila Third Sewerage Project (MTSP) is a follow-up to the Manila Second
Sewerage Project (MSSP) which focused on the provision of a septage management
program and the rehabilitation and upgrading of existing sewerage systems in
Metropolitan Manila. Similar to MSSP, the objectives of the MTSP are to:
Ř improve sewerage and sanitation services,
Ř reduce environmental pollution, and
Ř lessen health hazards from wastewater in the East Zone concession area.
The MTSP addresses the sewerage and sanitation sector holistically, addressing the
infrastructure requirements, information and education campaign on their
importance, and the enhancement of the MWCI's organizational capability to perform
their water supply, sewerage and sanitation functions.
The overall MTSP has four proposed components:
Ř Sewerage System and Treatment - Involved the expansion of sewer network and
treatment plants at strategic locations within the East-concession area
Ř Septage Management large scale septic tank de-sludging program on the
western section of the service area, namely: Mandaluyong, part of Makati and
Quezon City, Pasig, San Juan, Taguig, Marikina, and Pateros
Ř Technical Assistance will cater to the need for information and education on the
good practices, infrastructure, and benefits from proper sewage management
However this REA predominantly deals with the first two components of the MTSP;
sewerage systems and treatment, and septage management. These two
components will be implemented through six projects listed below:
Ř Taguig Sewerage System;
Ř Riverbanks Sewage Treatment Plants;
Ř Septage Treatment Plants;
Ř Sanitation for Low Income Communities;
Ř Quezon City - Marikina Sewerage System; and
Ř Upgrade of Existing Sanitation System
As part of all six components, a supporting Sludge/Septage disposal and reuse
program is proposed.
DRAFT
8-12
9:41 AM 02/09/05
Regional Environmental Assessment
9 MTSP Integration into Other Regional Projects
9.1 Existing Projects
9.1.1 Manila Second Sewerage Project (MSSP)
In 1980, the World Bank financed the Manila Sewerage and Sanitation Project along with
the Asian Development Bank. The start of the project coincided with the onset of
economic difficulties in the Philippines so that some components were not completed and
others failed to have the anticipated impact.
In 1996, with the improved economic situation in the Philippines, the World Bank
resumed its assistance to the MWSS for the improvement of the general environmental
conditions in Metro Manila. The US$57 million Manila Second Sewerage Project (MSSP)
was finalized in June 1996.
The MSSP has the ultimate objectives of:
Ř reducing the pollution of Metro Manila waterways and Manila Bay,
Ř reducing the health hazards associated with human exposure to sewage in Metro
Manila, and
Ř establishing a gradual low-cost improvement of sewerage services in Metro Manila by
expanding MWSS' septage management program. The MSSP focuses on the
provision of a septage management program and a rehabilitation/upgrading of
existing sewerage systems.
Notable project components include the construction of package STPs.
These components relate directly to the proposed MTSP components.
9.1.2 Pasig River Rehabilitation Project Sanitation Component
The Sanitation Component of the Pasig River Rehabilitation Project (PRRP) is part of a
US$175 million ADB policy and investment loan aimed at promoting policy reforms and
physical improvements to enhance the water quality of the Pasig River, its tributaries and
esteros, to Class C (define) standards by 2014.
Project components include:
Ř establishment and development of 10-meter wide environmental preservation areas
(EPA) along the riverbanks,
Ř upgrade of infrastructure and the provision of municipal services and facilities in
urban renewal areas (URA) adjacent to the EPAs,
Ř elimination of illegal dumping of municipal solid waste into the river system and
Ř the Sanitation Component.
The Sanitation Component will involve the provision of septic tank maintenance services
through the procurement of thirty-six (36) vacuum tankers and the construction of a 600-
m3 septage treatment plant (SPTP) to reduce the volume of untreated sewage being
discharged into the Pasig River.
With this project, approximately 37,000 septic tanks will be emptied annually. This
amounts to a reduction in BOD loading of 16 tons per day.
The SPTP is expected to operate in 2006. Bidding for the vacuum tankers is ongoing.
The SPTP will serve the eastern areas of the East Zone.
DRAFT
9-1
9:42 AM 02/09/05
Regional Environmental Assessment
These projects are both supporting the theme of improving sanitation and decentralised
STP systems, as per the proposed MTSP strategy.
9.2 MWCI Master Plan
It is important that the proposed MTSP integrates sensibly into the Master Plan.
The Master Plan investigates the development of sewerage (combined and/or separate)
for 11 catchments in the East zone. The catchments were defined based on existing
drainage systems and hydraulics. There will be a mix of combined sewers where
appropriate, leading into separate trunk sewers where required.
Catchments may be grouped to achieve improved economies of scale. Each catchment
will eventually have an STP treating the catchment flows for discharge.
The present MTSP satisfies the revised Concession Agreement targets for sewerage
coverage, but the Master Plan looks at the ultimate scheme, and thereby demonstrates
that the MTSP integrates sensibly into this longer term overall strategy.
If the ecological and water quality improvements are not achieved ultimately, then the 11
STPs can be partially phased out and converted to pump stations delivering the
catchment wastewater to a smaller number of STPs. These larger STPs would produce
a higher quality effluent, such as nutrient removal plants, to ensure compliance with the
appropriate AO and water quality criteria of the rime.
A total of five sewerage alternatives were developed, three for separate sewerage
systems and two for combined sewerage systems. These alternatives are listed below:
1) Alternative 1
1977 Concession Agreement Target Service Levels and
Implementation Schedule (Separate Sewerage Systems in Eleven Catchment Areas)
2) Alternative 2
1977 Concession Agreement Target Service Levels with Extended
Implementation Schedule (Separate Sewerage Systems in Eleven Catchment Areas)
3) Alternative 3
1997 Concession Agreement Target Service Levels with Extended
Implementation Schedule (Separate Sewerage Systems in Seven Catchment Areas)
4) Alternative 4
1997 Concession Agreement Service Area with Extended
Implementation Schedule (Combined Sewerage Systems in Eleven Catchment
Areas)
5) Alternative 5
1997 Concession Areement Service Area with Extended
Implementation Schedule (Combined Sewerage Systems in Seven Catchment
Areas)
9.2.1 Reasons for Selection of Alternatives
The five alternatives were selected to allow comparisons of different systems to assess
the effect of variations on cost, tariff impact/affordability, technical constraints and
benefits. The comparisons that can be made include:
1) extended implementation schedule and deferred capital investments, to reduce the
NPV and tariff impact.
2) comparison of implementation of separate sewerage systems versus combined
sewerage systems, to reduce the NPV, tariff impact and technical constraints.
DRAFT
9-2
9:42 AM 02/09/05
Regional Environmental Assessment
3) reduced number of STPs by joining adjacent catchment areas in cases where STP
sites are located relatively close together, sewage can be transferred from one
catchment area to another relatively easily, limited space is available for construction
of an STP, or the cost of land is relatively high; to reduce the NPV, tariff impact and
technical constraints.
9.2.2 Description of Variations Between Alternatives
The first alternative is based on the system requirements and implementation schedule to
meet the 1997 Concession Agreement service targets, utilizing eleven catchment areas
with separate sewer systems and eleven STPs.
The second alternative is the same system as that for the first alternative, but with an
extended implementation schedule that allows completion of construction to occur in
2025, whereas the implementation schedule has most of the construction completed by
2015 and all of the construction completed by 2020 with the exception of the final house
connections.
In the third alternative, the number of catchment areas is reduced from eleven to seven
with separate sewer systems and seven STPs. In this alternative two adjacent catchment
areas were joined together, with the sewage from one catchment area transferred to an
adjacent catchment area. QC East was joined with QC North, QC South was joined with
QC Central, and Makati was joined with Taguig West because the STP sites for these
adjacent catchment areas are located relatively closely together, or the sewage could be
easily transferred from one catchment area to the other. Pasig South was combined with
Pasig North, mainly because of the relatively high cost of the system that would serve
Pasig North, due mainly to the high cost of land and low population density in Pasig
North. The implementation schedule for the third alternative allows for completion of
construction to occur in 2025.
The fourth alternative is based on the system requirements for combined sewerage
systems covering the same service area as the first three alternatives, utilizing eleven
catchments areas and eleven STPs. The implementation schedule for the fourth
alternative allows for completion of construction to occur in 2025.
The fifth alternative is similar to the third alternative in that the number of catchment
areas and STPs are reduced from eleven to seven. However, the fifth alternative utilizes
combined sewers, rather than separate sewers that are utilized in the third alternative.
The implementation schedule for the fifth alternative also allows for completion of
construction to occur in 2025.
9.2.3 Comparisons Between Specific Alternatives
To evaluate the effects of differences between the alternatives on cost, tariff
impact/affordability, technical constraints and benefits; comparisons can be made
between specific alternatives. The comparisons between specific alternatives are listed
below:
1) Alternatives 1 and 2 allow comparison of same separate sewerage systems (11
separate sewer systems, 11 STPs) with an extended implementation schedule.
2) Alternatives 2 and 4 allow comparison of separate and combined sewerage systems
(11 separate or combined sewer systems, 11 STPs).
3) Alternatives 3 and 5 allow comparison of separate and combined sewerage systems
(7 separate or combined sewer systems, 7 STPs).
DRAFT
9-3
9:42 AM 02/09/05
Regional Environmental Assessment
4) Alternatives 2 and 3 allow comparison of reduced number of STPs for separate
sewerage systems (11 separate sewer systems, 11 STPs; versus 7 separate sewer
systems, 7 STPs).
5) Alternatives 4 and 5 allow comparison of reduced number of STPs for combined
sewerage systems (11 combined sewer systems, 11 STPs; versus 7 combined
sewer systems, 7 STPs).
9.2.4 Summary of Alternatives Evaluation
The five alternatives were evaluated by identification of technical issues and constraints;
and by comparing the relative costs, implementability and benefits that would be realized
by implementation. In addition, integration of the proposed MTSP components into the
expanded sewerage system was considered. The economic and financial viability of the
alternatives were analyzed. A summary of the comparison of alternatives and the results
of the analysis of financial and economic viability of the alternatives is presented below.
The water quality in the major rivers will be the same regardless of whether separate
sewer systems or combined sewer systems are developed. Separate sewers will
significantly improve the water quality in creeks and drains, while combined sewers will
provide little improvement in the creeks and drains.
Water quality projections show that if either the combined or separate sewerage systems
are implemented in the area covered by all 11 catchment areas, BODs in Marikina River
and Pasig River will be in the 10-20 mg/L range, more than the Class C target of 10
mg/L, but still less than the projected 20-30 mg/L BOD in parts of Pasig River if no
interventions are made. The San Juan River will remain more polluted than the two
aforementioned rivers, as the projected BOD is in the range 20-30 mg/L.
It is noted however that the water quality model assumes no sewerage interventions in
the west concession area, part of which drains to the San Juan River basin. It is also
better than the projected 40-50 mg/L BOD in a no intervention scenario.
The following conclusions are based on the comparative evaluation of the five sewerage
system alternatives:
Ř Combined sewer systems can be implemented for a significantly lower capital cost
than separate sewer systems, due to elimination of laterals and house connections.
Ř Combined sewer systems are relatively easier to implement than separate sewer
systems, due to elimination of laterals and house connections.
Ř Combined sewer systems can be constructed in a shorter time period than separate
sewer systems, due to elimination of laterals and house connections.
Ř Combined sewer systems would, during construction, reduce traffic congestion,
business financial losses, air pollution and unnecessary fuel consumption due to
idling in traffic; compared to separate sewer systems.
Ř The required tariff increment for combined sewer systems is less than half that for
separate sewer systems.
Ř Improvements in water quality in the major rivers would be the same with either
combined or separate sewer systems.
DRAFT
9-4
9:42 AM 02/09/05
Regional Environmental Assessment
Table 9.1 Comparison of Alternatives
Service Targets
Alternative 1
Alternative 2
Alternative 3
Alternative 4
Alternative 5
Projected 2025 Sewerage
3,238,096
3,210,672
3,210,672
3,238,096
3,238,096
Service Population
Projected 2025 Sanitation
(Septage Collection &
4,436,402
4,436,402
4,436,402
7,642,597
7,642,597
Treatment) Service Population
Projected 2025 Volume of
1,050,077
1,050,077
1,050,077
1,110,897
1,110,897
Sewage Collection, in m3/day
Projected 2025 Volume of
1,800
1,800
1,800
3,095
3095
Septage Collection, in m3/day
Additional Investment
Requirements
Investment Requirements
80,812
80,812
77,985
29,448
29,089
(Ps million)
Required New STPs
11
11
7
11
7
EIRR (Ps million)
- 0.83 %
- 2.05 %
- 1.78 %
9.97 %
11.79 %
EIRR
(21,531)
(9,807)
(8,420)
(1,265)
(726)
Tariff Impact (Ps/m3)
15.64
9.77
9.16
4.32
4.06
DRAFT
9-5
9:42 AM 02/09/05
Regional Environmental Assessment
Ř The calculated Economic Internal Rate of Return (EIRR) values for combined
sewer alternatives range from 10 12%, while those for separate sewer
systems are negative; indicating that separate sewer systems are not
economically viable.
Ř Implementation of separate sewer systems is not feasible; due to the high tariff
impact which is considered to be unaffordable and the unacceptable disruption
of traffic and potential for construction delays, given the large quantities of
sewers (approximately 2,100 km of sewers) that would be required.
Ř Sewer systems in catchment areas can be implemented for a significantly lower
capital cost than sewer systems in eleven catchment areas, due to elimination of
four STPs.
Ř Sewer systems in seven catchment areas would be relatively easier to
implement and would reduce land availability constraint, compared to sewer
systems in eleven catchment areas.
Ř The required tariff increment for sewer systems in seven catchment areas is less
than that for sewer systems in eleven catchment areas.
Ř The sewer systems in seven catchment areas or eleven catchment areas can be
implemented independently in sequential phases.
Ř Alternative 5 with combined sewers in seven catchment areas has the lowest
NPV, the lowest tariff impact, the highest EIRR, and is the relatively easiest
alternative to implement.
Ř The EIRR for Alternative 5 is 11.79%, which is slightly less than the 15% social
discount rate adopted by NEDA.
Ř The incremental tariff increase for Alternative 5 for implementation in 2008,
considering costs expressed in 2004 prices, is estimated to be 4.06 Ps/m3. With
this increment the all-inclusive tariff would be increased from 18.85 Ps/m3 to
24.17 Ps/m3, including cost recovery for MTSP components and the Master Plan
facilities. This represents a 28% in the tariff.
Ř With the tariff increase to 24.17 Ps/m3, the average monthly water bill would be
Ps 725.25/month, which is an increase of approximately Ps 160/month.
Ř With the increased tariff, the average monthly water bill would represent
approximately 2.5% of the average monthly income for the NCR and 3.82% of
the median monthly income for the NCR. These percentages are less than the
maximum of 5% of the average monthly income that is used to determine
affordability.
Ř Following careful consideration of the alternatives, as well as the technical and
financial constraints, Alternative 5 is the most feasible alternative.
This indicates that the proposed MTSP will sensibly integrate with the recommended
Master Plan strategy, and can be considered as the first phase of implementing this
master plan into the future.
DRAFT
9-6
9:42 AM 02/09/05
Regional Environmental Assessment
10 The Project Components
The following section describes the project development plans of the MTSP. Project
details were taken from the Feasibility Study Report of the Manila Third Sewerage
Project (March, 2004) prepared by Nipon Jogesuido Sekkei Co. Lts (NJS) in
association with CEST Inc. of the Philippines and Mott Macdonald Ltd of the United
Kingdom (UK).
Figure 10.1 shows the location of the six components.
10.1 Component 1:
Taguig Sewerage System
10.1.1 Options Background
Taguig is a low- to middle-income municipality with an area of 47.88 km2 and a
population of about 467,000 as of 2000. It is traversed by 4 creeks that lead to the
Laguna de Bay on the municipality's southeastern boundary. The municipality's
general topography slopes towards the lake. Available parcels of land are also
concentrated near the lakeshore. Designs for sewerage projects draws on these
characteristics.
Taguig experiences floods lasting for at least three months when the Laguna de Bay
swells during rainy season. In 1988, the Department of Public Works and Highways
with the assistance of JICA conducted a study for the control of flooding in the
municipality and nearby affected areas. The study led to the proposed Laguna
Lakeshore Dike Project which consists of the construction of four (4) drainage/flood
retention ponds adjacent to the Laguna de Bay and an 10 kilometre earth dike.
Floodwater will be retained and then continuously pumped out of the ponds during
heavy storm events. The feasibility study involved a scheme where the ponds may
be used for wastewater treatment during dry season.
Originally, this component considered using the ponds as oxidation ponds for six
months of the year. Off line STPs were intended in 2014 to coincide with increased
development in the area. This option involves risks on sludge accumulation,
compliance to effluent quality standards and major dependencies on the operation of
the pumping stations and floodgates. The feasibility study for this component also
evaluated combined and separate sewer systems for the service area. A combined
system with drainage upgrading evolved as the more feasible option.
To reduce the risks associated with the use of the ponds as on line treatment, off line
primary treatment and the use of the ponds for polishing was explored. Although this
option would entail acquisition of significant tracts of land, an in-depth analysis of
technical and financial factors shows this to be the more practicable alternative to
realize the benefits intended by this component.
10.1.2 Component Summary
This component is designed to reduce the organic load currently discharged to
Laguna Lake from the Hagonoy, Taguig, Labasan, and Tapayan Rivers that drain
the Taguig and Taytay Municipalities. The reduction of pollution will be achieved
through regional treatment facilities constructed within the flood retention ponds
serving each of the four drainage basins.
DRAFT
10-1
9:42 AM 02/09/05
Regional Environmental Assessment
The Taguig Sewerage System component involves the development of four (4)
drainage/flood retention ponds being constructed by the Department of Public Works
and Highways (DPWH) into Sewage Treatment Plants that will treat combined
sewerage before discharging into the Laguna Lake.
The population in the catchments will increase from 198,000 now to 420,000 by
2015, and 730,000 by 2025.
DPWH supports to the use of the ponds for sewage treatment, provided that the
pond operation remains the responsibility of the DPWH tasked with flood control (to
be transferred to the Metro Manila Development Authority in the future). The
maintenance of the pond water level and the timing of the opening of the floodgates
will be DPWH authority and not by MWCI. Operation and maintenance of the
sewage treatment equipment would be the responsibility of the MWCI, subject to the
over-riding instructions of the DPWH on the need to revert the use of the ponds for
flood control.
This arrangement implies that during the wet season the ponds cannot be efficiently
used for sewage treatment because they will need to be emptied to contain future
runoff during storm events. The operational decision will be made by the DPWH
when sewage treatment will cease and when it can recommence.
To safeguard both parties, it is an essential to develop and agree on an operating
procedure that will establish each party's responsibilities, identify potential problems
and risks, and develop solutions or strategies. This will be initiated by the MWCI.
Issues such as retaining a set volume of water/sewage within the ponds when
lowered for flood purposes will allow the requisite bacterial and algal population
seeds to more rapidly repopulate the ponds when operating as STP ponds again.
The retention ponds will be operated as single stage stabilization ponds (facultative)
with no compartmentalization or deepening of the original flood retention basins.
The proposed facility will remove on average 75% of the organic load present in the
feed wastewater at the time of commissioning, dropping to 60% to 73% in 2015. For
the four systems, this would amount to about 2,822 t BOD/y in 2015, over a period
of about six months during the dry period when the system operates as a treatment
plant. The reduced treatment efficiency in the wet season is not critical as there are
high diluting and advecting flows in the main receiving water bodies such as Laguna
Lake and the Pasig River in the wet season.
It is proposed to include a primary treatment stage for the combined flows prior to
entering the lagoon system. The primary treatment plants will consist of grit removal
prior to a convention primary treatment or settling tank. Following the primary
settling tank, effluent will flow into the flood lagoons for passive treatment. The
lagoon effluent will then be disinfected with liquid chlorine prior to release into the
inflow channel leading to Laguna Lake. The chlorine may not be required to meet
the specified Coliform levels at all times, and the dosage rate will be minimised to
limit the formation of Trihalomethanes from the reaction of chlorine on the algae that
will form in the treatment lagoons.
Because of the forced intermittent operation and the low solids content of the
incoming combined flow, no permanent measures are considered necessary to deal
with the possibility of sludge build-up in the lagoons. Monitoring of the treatment
efficiency in the initial years will validate these conditions.
DRAFT
10-2
9:42 AM 02/09/05
Regional Environmental Assessment
Community surveys conducted under previous projects indicated that the major
complaint of the residents was related to blocked drains. This issue resurfaced
during the public consultations. Converting the street drains to a combined
sewerage system by covering open drains and replacing those that needed repairs
would reduce the risk of contact with sewage and would improve the local
environment.
It is acknowledged that this concept may not consistently achieve the required
effluent standard in later years, but it can be argued that in any case intermittent
treatment of wastewater from a population that is expected to grow from 197,000 in
year 2000 to some 732,000 people by the end of the planning period is not a valid
solution. Alternative option of continuous year-round treatment should be seriously
considered from year 2015 onwards, preferably in conjunction with the stand-alone
treatment facilities planned to serve the new developments behind the lakeshore
dike. The opportunity should then also be taken to improve the drainage system by
intercepting the sewage before it enters the rivers and creeks along the base of the
hill, thereby reducing the infiltration.
10.2 Component 2:
Riverbanks Sewage Treatment Plants
10.2.1 Options Background
The base case scenario for massive sewer coverage in the East Zone looks at
separate sewer systems as the mode for expansion. Huge costs and the constraints
previously discussed discourages implementation of networks of separate sewers
and directs attention to the development of combined systems, taking advantage of
existing drainage networks.
In Metro Manila, jurisdiction over drainage systems varies depending on size,
location and ownership, if installed as sponsored projects. There is no master
drainage layout plan that catalogues the existing drainage systems. Physical
inspection is the only way to determine catchment boundaries and volumes. Hence,
the project proponents undertook intensive surveys on land and via river systems to
identify drainage outfalls of significant flows, determine catchment boundaries and
relate available land to the location of major outfalls.
Finally, this component was packaged to involve the construction of three (3)
underground STPs along the riverbanks of Pasig River, located in Makati,
Mandaluyong, and Pasig. Sewage will be intercepted and collected from existing
drainage lines in these areas for treatment before discharge to Pasig River.
Rehabilitation and upgrade of the drainage outfalls and lines will be included in the
project.
The original coverage area of this component spans an area of 0.296 km2. Through
time and with the goals of cost efficiency and maximizing coverage, the proponents
have expanded the coverage area to 1.81 km2.
Recent developments and major changes involve the Makati (Poblacion) system for
which the STP will no longer be co-located beneath an existing park. The Poblacion
system will involve the construction of a STP over a portion of the flood retention
pond of the Metropolitan Manila Development Authority (MMDA) adjacent to the
Pasig River. This, along with flows from the original catchment of the Poblacion
system which will be pumped to pond, will be treated at the elevated STP before
discharge to the Pasig River.
DRAFT
10-3
9:42 AM 02/09/05
Regional Environmental Assessment
10.2.2 Component Summary
The Riverbanks Sewage Treatment Plants (STPs) component will establish three
STPs in Pasig City, Makati City and Mandaluyong City to intercept combined
wastewater and storm water in existing drainage outlets and treat the collected
combined flow in underground sewage treatment plants prior to discharge to the
Pasig River. The Makati City STP (Poblacion STP) will now be located within a
DPWH flood control pond and constructed as an elevated facility. The total
population served will be some 30,700 persons in 2025.
Virtually all the collection drains in the three catchments are covered. So there will
be only limited health benefit in this component associated with disinfecting the
treated effluent which presently enters the Pasig River with elevated coliform counts.
A series of interception sewers will be constructed to collect the flow in the various
existing drains prior to entering the Pasig River. The interception sewer will then
convey the combined flow from the drains into the three STPs.
If open space is ultimately determined to be too limited at any of the treatment
facilities, the STPs will be constructed underground, beneath local recreation areas
currently occupied by basketball courts and sitting-out areas alongside the riverbank.
The proposed treatment process at all three (3) sites is based on the Sequencing
Batch Reactor (SBR) process. The process includes the following process stages,
excluding the usual pumping and lift stations:
Ř screening and grit removal,
Ř flow balancing,
Ř SBR reactor tanks,
Ř disinfection contact tanks and
Ř sludge thickening.
These STPs are projected to reduce the BOD load discharged to the (Pasig) river by
a combined total of about 440 t/y.
Since space is restricted at all riverbank STP sites, biological sludge will not be
dewatered on site unless adjacent private properties can be acquired. Therefore it
will be necessary to remove the biological sludge by vacuum tanker. The access
roads are narrow in these locations except the Makati Poblacion site, and will be
cumbersome for large vacuum tanker to approach the STP sites. A small-capacity
tanker (5 m3) would be needed to service the Pasig and Mandaluyong sites but will
have to make a total of six visits a day. The Makati Poblacion site has good access
and a 10 cubic metre tank can easily access the site. Final dewatering of the sludge
can be done at the proposed southern Septage Treatment Plant in Taguig before
transporting to lahar-affected areas in Pampanga.
10.3 Component 3:
Septage Treatment Plants
10.3.1 Options Background
This project is essential in providing sanitation services and proper septage disposal.
In 2002, MWCI proposed the construction of the following SPTPs to serve areas on
Rizal on the assumption that the SPTP under the ADB-assisted Pasig River
Rehabilitation Project (PRRP) will be located in Taguig to serve majority of Metro
Manila.
Table 10- 4. Originally Planned SPTPs
DRAFT
10-4
9:42 AM 02/09/05
Regional Environmental Assessment
Location
Service Area
San Mateo, Rizal
Quezon City, San Mateo, Marikina and Rodriguez
Taytay, Rizal
Taytay, Cainta, Antipolo and Teresa
Binangonan, Rizal
Angono, Binangonan, Cardona, Morong, and Baras
This proposal was rendered useless when it was agreed that the PRRP STP be
located in Antipolo to serve Rizal and portions of Metro Manila. Metro Manila's
demand for sanitation services was projected to grow from 1019 m3/day in 2006 to
1400 m3/day in 2021. This dictated the need for STP(s) to augment the PRRP STP
treatment capacity. Location, in terms of cost and strategic operation, directed the
eventual plan to construct two STPs with capacities of 586 m3/day and 815 m3/day in
Payatas, Quezon City (North STP) and FTI Complex in Taguig (South STP),
respectively. A recent change to the land availability at the Payatas site has meant
an alternative site in San Mateo is now the subject of negotiation.
The North STP will be located mixed-use area of piggeries, metal works and
residential developments; the South STP will be located in a mixed-use industrial
complex.
10.3.2 Component Summary
The objective of this component is to collect and treat septage from household septic
tanks in the more westerly parts of the East Concession Zone which includes:
Mandaluyong, part of Makati, part of Quezon City, Pasig, San Juan, Taguig,
Marikina, and Pateros. Septage will be collected and transported using vacuum or
desludging tankers. In order to optimize haulage distances, more than one Septage
Treatment Plant (SPTP) will be developed.
Using the year 2025 population projections in the service area and assuming that
about 80% of the 783,000 Individual Septic Tanks will be desludged at an average
volume of 6 m3 per IST, it is estimated that 1,681 m3/day of septage will be collected
and require treatment. The SPTP sites are at Payatas in Quezon City (North) and
the Industrial Area of the Food Terminal Inc. (FTI) Complex in Taguig (South). Land
requirements for the North and South SPTPs are 7,000 m2 and 10,000 m2
respectively.
The Payatas SPTP in Quezon City will serve the northern sub-area, covering the
cities of Quezon and Marikina, and the town of San Juan. The capacity is 586 m3 /
day.
The SPTP at the FTI Complex will serve both the central and south sub-areas,
covering the cities of Pasig, Mandaluyong, and Makati, and the towns of Pateros and
Taguig. The capacity is 814 m3 / day.
The eastern cities will be serviced by the PRRC SPTP at Antipolo.
The disposal options for stabilized and dewatered septage will dictate the level of
treatment required at the septage treatment plant. The disposal options are:
Ř reclamation of non-productive lahar-affected areas presently fallow,
Ř disposal to solid waste (garbage) controlled dumps and landfills, and
DRAFT
10-5
9:42 AM 02/09/05
Regional Environmental Assessment
Ř agricultural use as a soil conditioner/fertilizer for active agricultural land
The third option is different from the first two options in that the discharge standards
are more severe (the septage will be applied to land currently used for farming) and
some degree of septage stabilization will be necessary before disposal. Therefore
the SPTPs will be designed on the basis of the first two disposal options, since both
disposal pathways are readily available. There is a demonstrated demand for
reclamation of the lahar areas and since additional septage stabilization is not
required, there will be savings in septage treatment costs. If at some future time the
demand for dewatered septage as an agricultural land conditioner increase, lime
stabilization facilities could easily be provided within the septage treatment plants.
The treatment capacity of the proposed SPTPs account for the capacities of two
SPTPs currently being developed in Metro Manila the 250 m3/day capacity plant in
Dagat-Dagatan being implemented by Maynilad Water Services Inc. (MWSI) under
the Manila Second Sewerage Project (MSSP) and the 600 m3/day pilot septage
treatment plant being tendered by PRRC.
The SPTPs will have the following components:
Ř Screening and degritting
Ř Septage storage
Ř Dewatering system
- Screw press equipment
- Coagulant conditioning tank
- Coagulant dosing/mixing equipment
- Filtrate return pumps
Ř Filtrate Treatment Plant
Substantial environmental and health benefits (health benefits alone of about PhP
34.5 million a year) will accrue as a result of the following:
Ř a reduction in the frequency of overflowing septic tanks
Ř reduced health risk to the community from contact with sullage in any open
drains, as the sullage will present a lower health risk when discharging from
regularly desludged ISTs,
Ř the elimination of the indiscriminate dumping of raw septage by private
contractors, and
Ř the pollution load on the environment will be reduced by about 2378 t BOD/y.
10.4 Component 4:
Low Income Sewerage System
10.4.1 Options Background
This component originally involved the construction of Communal Septic Tanks or
WwTPs, as appropriate, and shallow, small-diameter sewer lines to serve some 24
low-income communities in the East Zone which have inadequate sanitation
facilities.
The list has been narrowed down to two (Pinagsama, Taguig and East Bank, Taytay)
reflecting local issues on willingness and capacity to pay for water and sewer
charges. STPs will be constructed for these communities using combined systems
with drainage upgrading. The feasibility of separate sewer systems was also
considered and found impractical and expensive.
DRAFT
10-6
9:42 AM 02/09/05
Regional Environmental Assessment
10.4.2 Component Summary
This component aims to improve the inadequate sanitation facilities in low-income
communities through the provision of shallow, small-diameter sewers and communal
septic tanks (CST). The low-income communities identified for the upgrade of
sanitation facilities include a cluster of communities in Taguig bordering the heavily
polluted Pinagsama Creek and the Manggahan Floodway East Bank community
The Taguig low-income scheme is planned for five contiguous communities
alongside the Pinagsama Creek, which is heavily polluted with sewage. These
communities are the Pinagsama Village Phases 1, 2A, 2B, and the AFP/PNP Village
Phase 2, all located in Barangay Western Bicutan, and parts of Signal Village,
Barangay Signal. With a population of 41,554 and an area of 67.8 hectares, the
average population density can be classed as medium to high at 613 persons/ha.
The projected 2025 population is about 46,000 persons.
The older Pinagsama Village Phase 1 catchment is drained by line open channels
constructed along sides of the streets, whereas the other more recent developments
are served predominantly by buried concrete pipes. As such, the street drains of the
Pinagsama Village Phase 1 needs upgrading and it is estimated that about 7.5 km
open drain needs new concrete covers.
Treatment will be provided in an SBR facility to be constructed on National Housing
Authority land, the sewage being intercepted from the existing outfalls to the creek
and pumped to the plant site. Because the site is sufficiently large, the STP will
include sludge dewatering. Otherwise the process is the same as described for the
Riverbank STPs. The treatment plant will require 2,000 m2.
The operation of the facility will remove from 464 t/y BOD on commissioning in year
2008, to 565 t/y BOD in 2015, and to 648 t/y BOD in 2025.
The Manggahan Floodway East Bank low-income area lies along a narrow strip of
land, 120 to 150 meters wide, bordering the East Bank Road. It consists of seven
National Housing Authority (NHA) communities, namely: PFCI, Kabisig, San
Francisco, Anak-Pawis, Exodus, Samagta/Dimagta and Genesis. With a population
of almost 55,000, the communities cover an area that stretches some 4.5 kilometres
from the boundary of Pasig City and Cainta in the north to Bangiad Road in the
south. The land slopes down towards an unnamed creek at the back that runs
parallel to the communities before discharging into Laguna Lake. Wastewater from
the area flow through street drains that discharge to this creek.
This Component also includes the following drainage rehabilitation works:
Ř Provision of new covers
41,320 m
Ř Relining and covering existing drains
11,640 m
Ř Construction of new street drains
7,760 m
The scheme will then intercept the flows by means of sewer and lift stations
alongside the creek and treat the wastewater in an oxidation ditch facility to be
located on vacant land on the east bank of the creek at the downstream end close to
Laguna Lake. The STP will include sludge dewatering because of sufficient land
availability. The land requirement for the STP is 2,500 m2 for the combined
sewerage option.
The STP will include the following elements:
Ř Screening and grit removal,
DRAFT
10-7
9:42 AM 02/09/05
Regional Environmental Assessment
Ř Oxidation ditch format biological reactors
Ř Secondary clarifiers (no primary clarifier is required)
Ř Disinfection
Ř Sludge thickening and dewatering
The operation of the facility will remove 1073 t/y BOD on commissioning in year
2008, 1307 t/y BOD in 2015, and 1499 t/y BOD in 2025, from the design population
of 60,270 persons.
In addition there are substantial health benefits to be achieved by isolating the
community from sullage presently flowing in open drains.
10.5 Component 5:
Quezon City Marikina Sewerage System
10.5.1 Options Background
The development of this component used the same principles as the Riverbanks
STPs component.
This component will utilize portions of the legal easement for Marikina River. Main
drainage collector pipes which collect combined sewage and drainage from
communities in Quezon City and Marikina will be connected to a STP to be
constructed to treat the dry weather drainage/sewage flow.
Initially this component considered serving only the Sitio Olandes and Blue Ridge
communities. The coverage area of this component has also been improved over
time.
10.5.2 Component Summary
This component is located on the west bank of the Marikina River and covers
sections of Quezon City and Marikina City. The total catchment area under this
component comprises five distinct drainage basins with an aggregate area of 132.3
hectares. The catchment slopes towards the Marikina River in the east from
Katipunan Avenue, the elevation falling from about 49 m to 10 m above mean sea
level.
The south Camp Atienza catchment covers an area of 28.5 ha and comprises parts
of St. Ignatius, Blue Ridge A and Blue Ridge B subdivisions, part of Barangay Libis
and Camp Atienza. The central catchment area covers 23.9 ha that includes the
major part of Barangays Blueridge A and B while the north influence area comprises
part of Barangays Blueridge A and B and part of Cinco Hermanos Subdivision within
Barangay Industrial Valley, Marikina City.
The Industrial Valley catchment comprises the Industrial Valley, Don Juan and Monte
Vista subdivisions in Marikina City and the Alta Vista subdivision in Quezon City and
covers a total area of 60.2 ha. The area is located east of the Camp Atienza and
Sitio Olandes catchments, bounded on the north by the C-5 Highway and on the east
by the Marcos Highway.
The Sitio Olandes low-income community within Barangay Industrial Valley in
Marikina City is bounded by the Marikina River to the east, the Quezon City
boundary to the south and west, and the intersection of Marikina Diversion Road and
A. Bonifacio Avenue to the north.
DRAFT
10-8
9:42 AM 02/09/05
Regional Environmental Assessment
Dry weather sewage flows will be intercepted from the existing combined sullage and
stormwater drains by means of interceptor sewers adjacent to the river bank. The
existing outfalls from the Camp Atienza catchment discharging to the Marikina River
will be intercepted and conveyed to the STP through force mains parallel to the river.
Sewage from the Industrial Valley will be pumped by means of a low lift station into
the head of a 710-m long interceptor sewer which will also collect the dry weather
flows from the four existing outfalls currently discharging sewage from Sitio Olandes
direct to the Marikina River.
The proposed STP will be located in a grassed area between Sitio Olandes and the
Marikina River. The total STP site area is about 3,280 m2.
The recommended treatment process is the Sequencing Batch Reactor (SBR),
which can be configured to fit the available area at the site. The process includes the
following process stages, excluding the usual pumping and lift stations:
Ř screening and grit removal,
Ř flow balancing,
Ř SBR reactor tanks,
Ř disinfection contact tanks,
Ř sludge thickening and
Ř sludge dewatering
The STP may possibly be covered for aesthetic reasons but not constructed
underground. The STP will be designed for an average dry weather flow of 10,358
m3/day. The STP is estimated to remove 407 t/y of BOD on commissioning in 2007,
increasing to 498 t/y BOD in 2015, and to 630 t/y in 2025.
10.6 Component 6:
Upgrade of Existing Sanitation System
10.6.1 Options Background
Quezon City has the biggest land area among the cities and municipalities in Metro
Manila. Aside from the cities of Manila and Makati, parts of Quezon City has existing
sewerage systems consisting of sewer lines connected to communal septic tanks
(CST). These 30 septic tanks were constructed in the 1950's and turned over to
MWSS for operation and maintenance. These facilities do not meet regulatory
standards on effluent quality.
The original intent of this component was to upgrade the CSTs to STPs. Ten of the
30 CSTs are already being upgraded under the MSSP. This will ensure compliance
with environmental standards for wastewater effluent.
Only five CSTs were originally identified for upgrading under MTSP in view of
accessibility and ownership issues. Some of the lots on which the CSTs are located
are occupied by informal settlers or are now privately owned owing to circumstances
beyond MWSS control.
As a result of the discussions with the World Bank representatives and technical
experts, this component has been improved and will now adopt a regional scheme
where a number of CSTs will be linked and directed to one WwTP. Additional sewer
lines is planned for installation in areas that could be connected to the existing sewer
networks. From 5 CSTs, this component will now include treatment for the
wastewater from 7 CSTs and adjacent areas corresponding to an increase in service
area from 3.12 km2 to 3.89 km2.
DRAFT
10-9
9:42 AM 02/09/05
Regional Environmental Assessment
10.6.2 Component Summary
The aim of this component is to upgrade existing Communal Septic Tanks (CST) in
Quezon City to sewage treatment plants (STP) designed to meet the National
effluent standards. Seven sewerage schemes served by CSTs have been identified
for upgrading, namely Rimas (CST-14), Anonas (CST-15), Road 5 (CST-20), Scout
Santiago (CST-24), Matiwasay (CST-31), Mapagmahal (CST-32) and East Avenue
(CST-33). In addition to these CSTs, an unsewered area in East and West Kamias
with a resident population of about 73,851 is also included in the component
coverage.
The evaluation of individual CST sites indicates that there are serious limitations on
land availability in some locations. This constraint negates the possibility of
constructing an SBR facility without securing additional land, such as by relocating
squatters and by demolishing informal dwellings. In order to avoid this difficulty, the
approach is as follows;
Ř construct one treatment facility at Road 5
Ř group the flows from Rimas, Anonas, Mapagmahal, and East Avenue in a mini-
regional facility at East Avenue
Ř transfer the sewage from Scout Santiago and Matiwasay CST to treatment
schemes to be constructed under MSSP at Heroes' Hill in Barangay Santa Cruz
and University of the Philippines (UP) Campus, respectively.
It is proposed to use the SBR process with on-site sludge dewatering at East Avenue
where land is not a constraint. Approximately 3,000 m2 land area is needed for this
scheme. The STP at Road 5 will require about 412 m2, and will be underground.
Because of space limitations, thickened sludge will be transported from the Road 5
STP to the nearest SPTP for dewatering.
The East Avenue (with Anonas) will remove 731 t/y BOD for a serviced population of
50,105 in 2025. The stand-alone STP at Road 5 will remove 156 t/y BOD for a
serviced population of 10,714 in 2025. The STPs in Heroes' Hill and UP may be
expanded to accommodate the additional flows.
10.7 Sludge/Septage Re-use
All six components will generate either dewatered septage or biological sludge, or
both. A variety of options for managing this by-product are discussed below.
These are described more fully in the Biosolids Management Strategy Options
Study by GHD, 2004 and the Environmental Assessment for Sludge/Septage Use as
Soil Conditioner for Sugar Cane Growth in Lahar-Laden Areas by EDCOP, Lichel
Technologies and ISSI in 2004.
10.7.1 Options Background
There are a number of possible alternatives to this scheme, and which have been
investigated as follows:
Ř Sea Disposal Option. Sea dumping of septage has been cancelled based on
objections by NGOs and LGUs principally citing environmental grounds. It is
considered that this disposal option will most likely not be adopted again in the
future.
Ř Septage/Sludge Transport Option. An alternative to the transport of untreated
and non-dewatered septage by tankers would be to pump the septage to the
DRAFT
10-10
9:42 AM 02/09/05
Regional Environmental Assessment
lahar areas through a high-pressure pipeline. The length of the pipeline would be
about 80 km with a diameter of 200 mm. A receiving/pump station would have to
be constructed at the start of the pipeline, including provision for septage
storage, screening and degritting equipment. Along the pipeline route, several
booster pump stations would be required at approximately 10-km intervals. At the
end of the pipeline, a loading facility would transfer the septage to tankers, which
in turn would transport the septage to the lahar areas. The revised MTSP now
incorporates dewatering of all sludges and septage solids, so pumping is no
longer an option.
Ř Septage/Sludge Treatment Option. As an alternative to the disposal of untreated
septage, it could be stabilised and transported to the lahar areas by truck. The
stabilising of septage prior to final disposal would also open up other alternatives,
such as more opportunities for application onto agricultural areas as a soil
conditioner as the liming process will inactive most pathogens. The PRRC SPTP
does incorporate stabilisation so this plant can be monitored to determine if
stabilisation will be adopted for all sludges and septage solids in the future.
However there is a demonstrated sustainable reuse opportunity for the
unstabilised sludge/septage on extensive agricultural areas and the lahar areas.
10.7.2 Septage Characteristics
Septage, in 40 CFR Part 501 of the Environmental Protection Agency (EPA) of the
United States, is defined as the liquid or solid material pumped from a septic tank,
cesspool, or similar domestic sewage treatment system, or a holding tank, when the
system is cleaned or maintained. Septage consists of liquid and solid materials and
is normally characterized by large quantities of grit and grease, a highly offensive
odor, great capacity to foam upon agitation, poor settling and dewatering
characteristics, and high solids and organic content. The chemical characteristics of
septage can vary from place to place and will depend on cooking and water use
habits; tank size and design; climatic conditions; pumping frequency; and the use of
tributary appliances such as garbage grinders, water softeners, and washing
machines, etc.
The physical, chemical and bacteriological characteristics of septage in Metro Manila
have been reported by the following:
Ř Montgomery, 1991;
Ř University of the Philippines National Engineering Center (UP-NEC), 1998;
Ř MWCI, 1998-99
Ř Sinclair Knight Merz (Phils.) PREMRSDP - PIA, 2002;
From results of the laboratory analysis it was found that in general, the pH of the
sludge is about neutral. The COD to BOD ratio in domestic wastewater typically
ranges from 1.8 to 2.2. A COD to BOD ratio of from 4 to 9 indicates the presence of
a significant non-biodegradable/inorganic component. This is apparent in the UP-
NEC samples. The sludge samples were stable based from the fairly low ratio of
total volatile solids to total solids (48-76%). This means that odour-forming potential
is greatly reduced, as there is less biologically active material in the septage to
generate the biochemical reactions necessary to liberate odours.
The range of concentration of heavy metals in the septage samples is shown below.
The UP-NEC (1998) study on these data indicated that the probability of phytotoxicity
and potential hazards posed on humans and animals is low.
DRAFT
10-11
9:42 AM 02/09/05
Regional Environmental Assessment
Table 10 2. Metal Concentrations in Metro Manila Septage (UP-NEC, 1998)
Parameter
Unit
Range of Values
Pb
mg/Kg
3.15 7.05
Zn
mg/Kg
102.32 103.22
Cu
mg/Kg
1.57 7.82
Cd
mg/Kg
0.0 0.51
Cr
mg/Kg
0.76 0.79
10.7.3 Sludge Characteristics
Sewage sludge, in 40 CFR Part 503 of the EPA, is defined as solid, semi-solid, or
liquid residue generated during the treatment of domestic sewage in a treatment
works. Sewage sludge includes, but is not limited to, domestic septage, scum, and
solids removed during primary, secondary, or advanced wastewater treatment
processes. The definition of sewage sludge also includes a material derived from
sewage sludge (i.e., sewage sludge whose quality is changed either through further
treatment or through mixing with other materials).
Samples of local sludges have been analysed for the usual suite of parameters. The
only elevated levels were for Cu and Zn, but these are within permissible limits of the
EPA standards for sewage sludge.
Review of completed experiments and studies
Experiments at the Sugar Regulatory Administration (SRA) Farm at Floridablanca,
Florida as well as on-farm trials on the use of septage/sludge as soil conditioner
started in 2000. The experiments, financed by MWCI, involved either the use
septage/sludge as soil conditioner alone or as a major component in the production
of compost. The compost also included sugar mill wastes, namely bagasse and filter
cake. Results of the studies showed that:
Ř Raw septage has practically lower nutrient content and zero organic matter
compared to sewage sludge which has several folds higher nutrient content.
Ř The yield of plant cane (TC/ha) was significantly higher in the plots that were
applied with sewage sludge in the absence of inorganic nitrogen over the
unfertilized untreated control.
Ř After two croppings in the same field, the soil pH was only slightly improved,
available P & K was increased but organic matter remained low.
Ř Mean plant height, number of tillers, millable stalk production and sugar yield,
regardless of inorganic nitrogen application, were significantly improved with
application of sewage sludge in some studies.
The application of raw septage to poor quality agricultural land, such as sugar cane
farms, or to fallow lahar areas to allow future farming is a sound approach
environmentally, and from a sustainability viewpoint. Otherwise the nutrient and soil
conditioning benefits of these materials will be lost in a sanitary landfill or a controlled
dump. Ongoing studies are required to quantify the sustainable application rates
such as protection of the local groundwater table from nutrients and heavy metals.
The application rate for nutrients has been determined based on the nutrient uptake
requirements of the crop.
DRAFT
10-12
9:42 AM 02/09/05
Regional Environmental Assessment
One of the present benefits with liquid septage is the water application in these dry
areas. This will be reduced when dewatered septage/sludge is applied. However
the application of the septage/sludge will increase the moisture retention capabilities
of the soil which will allow more rainwater to be retained in the crop root zone in the
future.
Application of stabilised sludges may not be as immediately beneficial if lime has
been used as this often forms attachment sites for the nutrients, thereby limiting the
short-term bioavailability of the nutrients. This is beneficial in some aspects as the
nutrients then are released slowly in better coordination with the crop requirements.
The other benefit is that heavy metals are also very strongly bound to the lime and
therefore will be much less likely to percolate into the groundwater. The PRRC
Antipolo SPTP is the only facility that will be using lime to provide an "A Class"
sludge that can be reused with very few restrictions.
With both septage and sludge, the ease of movement of the heavy metals decreases
over time as more attachment sites are formed in the lahar soil. These attachment
or bonding sites will be in the form of increased Cation Exchange Capacity, organics
and carbonates, and eventually more stable iron sesquioxides. Provided that the
application rates are managed initially then the retention capacity of the augmented
soil will increase without excessive metals migration.
In addition, the soil permeability will decrease as the pores in the sandy lahar are
filled with organics. This further reduces metal and organics mobility.
The exact environmental impact cannot be quantified as per the STP or SPTP
components. The benefits are more generic in terms of increased crop yields,
facilitating productive reuse of MTSP by-products and improved agricultural potential
on presently fallow lahar areas.
The stabilised sludges can be used closer to developed areas from health risk
perspective, and can also be applied to food crops with few restrictions. The other
unstabilised sludges will still be reused productively on less sensitive crops such as
sugar cane which is processed before consumption. Also the unstabilised sludges
will require additional management such as covering within 6 hours in accordance
with the USEPA requirements.
The primary areas will be the lahar area application and the extensive agricultural
areas, especially those supporting sugar cane crops. The two areas will be
managed to allow for ongoing sludge disposal in all stages of cropping cycles and
weather conditions. For example, during the crop-growing phase of sugar cane,
sludge cannot be applied. Therefore the sludge will be applied to the lahar areas
during this period for example.
In the longer term, there will be a program of investigating technologies to provide
stabilised sludge and also application to intensive agricultural areas which require a
higher quality sludge ion terms of stabilisation.
10.7.4 MTSP Septage/Sludge Quantities and Sources
This component offers septage/sludge generated from its eastern concession zone
in Metro Manila to farmers in a beneficial form for the lahar covered agricultural and
fallow areas in Pampanga and Tarlac provinces.
DRAFT
10-13
9:42 AM 02/09/05
Regional Environmental Assessment
The sites are located in the Central Luzon provinces of Pampanga and Tarlac, about
60 kilometres north of Metro Manila. The application sites, presently totalling 15, are
within two cities and four municipalities of the provinces. Seven of the 15 sites have
been identified as future potential sites for sludge/septage application while the
remaining eight are already being utilized since 2002. Among the six
municipalities/cities involved in the project, the town of Concepcion, Tarlac covered
the largest area (300 hectares) capable for accepting sludge/septage of the 800 ha
presently being trialed, with a further 350 ha already identified.
The lahar-affected areas are very extensive and the current investigations have
focused on those areas which are closest to Manila to minimise transport costs.
There is demonstrated demand as local farmers are very receptive to the soil
conditioning and fertiliser benefits of the sludge/septage. There is ample land
available for the application of the septage/sludge to be sustainable.
A range of management procedures are being developed in relation to siting
septage/sludge application areas, separations from water well (potable) and
agriculture wells (commercial water use), application rates, and will be incorporated
into a detailed EMP.
In the longer term, other treatment and disposal/reuse options will be developed over
the medium term, such as composting with other agricultural and domestic wastes to
allow reuse within the Region and avoid the need for long transport hauls to the lahar
and extensive agricultural lands in the north.
In summary, the adopted system involves the trucking of various sludges and
septage wastes to the Pamapanga area as follows;
Ř Liquid sludge (biosolids) from the biological treatment process at sewage
treatment plants for the proposed MTSP, and also those plants under MSSP,
located at Pabahay Village, Valle Verde, Karangalan Village, general MTSP
plants (Road 5, Anonas Street, QC Barangays, Camp Atienza, Taguig,
Manggahan, Capitolyo, Ilaya, Poblacion in Pasig City, Labansan, Tapayan and
Hagonoy) giving a volume of 194 m3/day of liquid sludge. This is essentially a
liquid at 2 or 3 percent solids, and will be tankered to the septage treatment
plants for dewatering. Dewatered sludge will be 25% solids and is sufficiently dry
to shovel and treat as a solid, even though still very wet.
Ř Dewatered primary sludges from the primary treatment plants at the Taguig
ponds will yield another 48 m3/day. These will not be stabilised and could
possibly be odorous. In a traditional sewage treatment plant, the primary sludges
contain highly active organic material such as gross solids. These sludges are
very odorous. With the Taguig primary treatment plants, the inflow is sullage not
raw sewage, so gross solids and other highly organic materials will not be
present. It is expected that a large fraction of the primary sludge will be
inorganics resulting from street runoff and catchment erosion entering the
combined sewer flows. Therefore it is appropriate to operate the primary
treatment facilities as proposed, and monitor the biological activity of the primary
sludge to assess if additional treatment is required such as lime stabilisation.
Ř Dewatered secondary (biological) sludges from the MSSP and MTSP STPs
totalling 127 m3/day. This sludge will be about 25% solids, and is sufficiently dry
to shovel and treat as a solid, even though still very wet. It is not stabilised and
as such can only be used under certain restrictions, such as burial within 8 hours
DRAFT
10-14
9:42 AM 02/09/05
Regional Environmental Assessment
and not for certain food crops, such as those consumed raw unless there is
certain period between sludge application and harvesting the food.
Ř Dewatered unstabilised septage/sludge volume of 177 m3/day from the two
MTSP SPTPs, at 25% dry weight. This dewatered septage/sludge is actually a
mixture of the raw solids entering the SPTP which are settled and then
dewatered, and the biological secondary sludge from the liquid treatment plant
for the liquor following on from the septage solids removal. The septage/sludge
is therefore a mixture of septage solids and biosolids or biological sludge. It is
not going to be stabilised, but there will be some chemicals added to assist in the
dewatering process. These will be at very small doses, just sufficient to ensure
that the dewatering targets are achieved. The chemicals will be standard
polyelectrolytes used globally for such processes.
Ř Dewatered stabilised septage/sludge volume of 90 m3/day from the PRRC
SPTP at Antipolo, at 25% dry weight. This dewatered septage/sludge is also a
mixture of the raw solids entering the SPTP which are settled and then
dewatered, and the biological secondary sludge from the liquid treatment plant
for the liquor following on from the solids removal. The septage/sludge is
therefore a mixture of septage solids and biosolids or secondary sludge. It is
going to be stabilised by lime addition, at high dose rates of up to 0.5 kilograms
of lime per kilogram of solids. The lime increases the pH and also increases the
temperature to inactivate the pathogens. The resulting septage sludge will meet
the Class A requirements of the US EPA and as such is acceptable for almost
unrestricted reuse applications. The PRRC is investigating possible sludge
reuse locations on farms close to Antipolo, but the backstop will be blending the
PRRC material with the other sludges to transport to the Pampanga areas.
Ř Dried biological sludges (biosolids) amounting to approximately 5 m3/day
from the existing Magallanes STPs. These sludges have been dried on sludge
drying beds and can be even drier than the 25% dewatered solids achieved
mechanically. They are stabilised by virtue of the open exposure over a longer
term of weeks to months.
The total sludge volume to be managed locally every day is therefore 194 m3/day of
liquid sludge to be transported from the STPs to the SPTPs for dewatering. This is a
local transport issue only.
The septage/sludge quantity to be transported to the Pampanga region is
approximately 450 m3/day. Because it is a solid, the only option is trucking not
pumping. The various septage/sludge sources will be combined, apart from the
PRRC septage/sludge and dried sludges which are stabilised.
If each truck carries 10 cubic metres, this means that there will be an additional 45
return trip per day on the North Luzon Expressway. This is less than 0.1% of the
present daily traffic counts and therefore insignificant.
None of the sludge is really dry in the normal sense apart from the 5 cubic metres a
day of so of material from the drying beds, and this will be mixed with other
dewatered sludges, so transport will not be a dust issue.
10.8 MTSP Summary and Issues
MTSP has six project components, as well as a sludge/septage management part,
which are summarized below. The target number of beneficiaries per year,
indicative BOD reductions and associated CAPEX are indicated together with the
service area involved:
DRAFT
10-15
9:42 AM 02/09/05
Regional Environmental Assessment
Table 10 - 3. MTSP Summary
Component Project
Target Number of
Target BOD5 Load
Estimated
Service Area
Beneficiaries/year
Reduction
Capital Cost
(TPY)
(Million)
1.Taguig Sewerage
420,000
2,811
172.68
Hagonoy, Taguig, Labasan,
System
(2015)
(2015)
Tapayan
2.Riverbanks Sewage
22,300
440
203.4
Capitolyo (Pasig City, Ilaya
Treatment Plants
(2025)
(Mandaluyong City),
Poblacion (Makati City)
3.Septage Treatment
526,680
10,534
2,181.7
Mandaluyong, Makati,
Plants
(2025)
Quezon, Pasig, San Juan,
Taguig, Marikina, Pateros
4.Low Income
106,185
2,147
352.42
Manggahan Floodway East
Sewerage System
(2025)
Bank Road, Taguig
Community
5.Quezon City-
43,285
498
233.85
West Bank of Marikina River
Marikina Sewerage
(2025)
System
6.Upgrade of Existing
49,755
887
370.12
Quezon City
Sanitation Systems
Sludge/Septage Use
-
Notional as the
113.5
Payatas, Taguig, PRRC
as Soil Conditioner
material would
Sewage Treatment Plants,
for Sugar Cane
otherwise be treated
Magallanes, Pabahay
Growth in Lahar
if liquid phase, or
Village, Valle Verde,
Laden Areas
landfilled if in solid
Karangalan Village, MSSP,
phase
MTSP, Wastewater
Treatment Plants
The total BOD reduction per year in 2015 is 17,300tpy.
Complete details on each of the components are provided in the above mentioned
Feasibility Study Report and Addendum.
All sewage treatment plants proposed in the MTSP, as well as the decision to use
combined sewers in many locations, may be considered as pilot-projects and should
not be construed as the final and complete treatment facilities that the MWCI will
establish in their concession area. This are still large facilities in their own right but
will provide valuable real-world data on issues such as;
Ř Connection success rates
Ř Community acceptance of tariffs
Ř STP process suitability and flexibility, including upgradeability to any future higher
effluent standards such as nutrient removal
Ř Effectiveness of combined sewer systems
The limitation of available areas to construct the STPs principally dictated the
number, sizes, and capacities of these STPs. However, other factors influence the
project mix that includes:
Ř adoption of combined sewerage system where such designs were appropriate
Ř demonstrated social acceptability, based on the consultations conducted by the
MWCI
Ř presence of similar or complementing projects like the DPWH Flood Control
Project which will provide dual role of treatment ponds during dry season,
environmental preservation areas of the Pasig River Rehabilitation Project to
serve as potential treatment plant sites,
Ř capital and operations costs of STPs.
DRAFT
10-16
9:42 AM 02/09/05
Regional Environmental Assessment
Through these pilot STPs and use of combined sewers, valuable lessons will be
distilled by MWCI to be used on other sites. It will be critical to monitor how the
MTSP STPs perform and modify the rollout of future stages based on the
performance of MTSP elements.
These projects will attain the MTSP objectives by:
Ř Upgrading existing treatment facilities in sewered areas (Component 6)
Ř Providing secondary treatment facilities for specific catchments currently served
by combined sewerage systems or CSTs (Components 1, 2, and 5)
Ř Improving sanitation conditions (generally) in low-income areas (Components 4
and 7)
Ř Providing treatment facilities for the septage from individual property septic tanks
or ISTs (Component 3)
Figure 10-1 is a vicinity map showing the proposed MTSP project components.
DRAFT
10-17
9:42 AM 02/09/05
Regional Environmental Assessment
11 Public Consultation
11.1 Introduction
A comprehensive public consultation program has been undertaken. The full report is in the
Environmental Impact Statement (EIS) document written for the purpose of obtaining an
Environmental Compliance Certificate from the Department of Environment and Natural
Resources.
The key meetings and attendees are listed in Appendix E - Public Consultation Status.
A key issue to note are that only three families require resettlement in the entire MTSP project.
MWCI already has a standard resettlement framework, and a specific resettlement action plan
will be developed for the 3 families prior to resettlement being required. The very small number
of resettlement involved is a direct result of the component sites being selected which minimise
social dislocation.
Consultation has been completed on all components with the exception of the two sites for
SPTP component. Consultation with the adjacent property owners and residents for the
proposed Payatas Septage Treatment is to be conducted after agreement has been reached
with the property owner on the sale of the land. In the case of the FTI site, discussion has been
had with the Management of the Complex (FTI) on the use of a portion near the existing
treatment facility of the complex. Consultation is not deemed necessary in the case of the FTI
site.
The key issues were typical for a wastewater management strategy relating to costs, odour, lack
of knowledge of the environmental and health impacts of poor sanitation or sewerage, traffic
impacts and disruption during construction, flooding impacts or benefits and so on.
11.2 First Level Consultations
First level consultations with community representatives were performed in two ways: scoping
workshop, and focused group discussions
11.2.1 Scoping Workshop
Pre-Scoping Workshop Activities
Based on the project information given in the initial draft of the MTSP Feasibility Study (FS),
pre-scoping activities were undertaken which involved the following:
Ř identification through site visit of the impact barangay communities and its representatives
for familiarization of the sociocultural environment. Seventeen (17) barangays were
identified within the MTSP coverage areas; and
Ř distribution of Invitation Letters for the Scoping Workshop including a brief project
description to barangay representatives and officials of the different community
organization.
DRAFT
11-1
9:42 AM 02/09/05
Regional Environmental Assessment
Scoping Workshop Proper
The scoping workshop was held on November 15, 2003. The workshop started with the
presentation and clarification of the workshop objectives, as follows:
Ř present and understand the components and scope of MTSP;
Ř present and appreciate the Environment Impact Assessment (EIA) Process under the
Philippine Environmental Impact Statement (EIS) System;
Ř consult the affected barangays regarding issues and concerns about the project; and
Ř recommend measures to be undertaken during project implementation
The discussion of the EIA process included the scope of each project activity. Likewise, the
environmental baseline data gathering was emphasized pointing out that this shall be the basis
for recommending activities and processes that will mitigate the negative impact of the project
vis-ŕ-vis enhance the positive effects of the project. The participants were made to understand
that this project is a tripartite undertaking between the barangay (LGU) where the proposed
project will be constructed, the MWCI as the project proponent, and the Department of
Environment and Natural Resources (DENR) as the concerned government agency.
MWCI presented and discussed the MTSP Project according to the following topics:
Ř Background of Wastewater
Ř Sanitation in Metro Manila
Ř Existing Sanitation and Sewerage Facilities in Metro Manila
Ř Completed and Ongoing Sewerage and Sanitation Projects
Ř The MTSP
Ř Issues Confronting the MTSP
After the MTSP presentation, an open forum followed to allow the participants to ask questions
and clarify aspects of the presentation that were not clear to them.
11.2.2 Focused Group Discussions
The Bank's review of the FS in February 2004 recommended the expansion of MTSP coverage
to make the service areas more contiguous. This expansion resulted in the addition of fourteen
(14) barangays in the service coverage and thereby necessitated the inclusion of these
barangays in the consultative process. In addition to the new barangays, there was also a need
to consult barangay representatives that were not able to participate in the scoping workshop
held last November 2003.
Courtesy visits of the consultants to the barangay offices were done from April 12 to 14, 2004.
The visits aimed to meet barangay officials, to inform them of the proposed project, and to ask
for a formal discussion with the barangay council to present the project.
The Focused Group Discussions (FGDs) with barangay officials were conducted from April 15
to 26, 2004 at the barangay offices. The discussions of the meeting included an overseer of the
situation of sewerage systems in the area and the presentation of the MSTP concept and its
components. Group discussion ensued after the presentation where queries, issues and
concerns in relation to the sewerage system, proposals and recommendations for the
improvement of the sewerage system were gathered.
DRAFT
11-2
9:42 AM 02/09/05
Regional Environmental Assessment
11.3 Second Level Consultations
In accordance with the Bank's requirement, Second Level Consultations were held from June
15 23, 2004. Twelve (12) public consultations were conducted among the concerned
barangays and communities. Table 12-1 shows the schedule and venues of the consultations.
Table 11 - 1. Schedule and Venues of the Second Level Consultations
Date
Time
Venue
Barangay / Community Invited
15 June
Covered Court, Barangay
Barangay Signal and Western
8:00 11:00 AM
2004
Signal, Taguig
Bicutan
16 June
Villa Salud, Lower Bicutan,
Barangay Calzada, Wawa, Hagonoy,
1:00 4:00 PM
2004
Taguig
and Ibayo Tipas
17 June
Barangay Hall, Blue Ridge B,
Barangay Blue Ridge B, Blue Ridge
9:00 11:30 AM
2004
Libis, Quezon City
A, and St. Ignatius
Headquarters Special
18 June
8:30 11:00 AM
Barangay Force, Barangay
Barangay Pineda and Capitolyo
2004
Pineda, Pasig City
Barangay Poblacion ( Makati City)
Poblacion Sports Complex,
1:30 4:00 PM
Barangay Barangka Ilaya, Itaas,
Makati City
Ibaba (Mandaluyong City)
Olandes Health Center, Sitio
19 June
Olandes, Barangay Industrial
Sitio Olandes, Barangay IVC, and
9:00 11:00 AM
2004
Village Complex (IVC),
Monte Vista Subdivision
Marikina City
Fishport Training Center,
2:00 5:00 PM
Taguig National High School
Barangay San Juan, Taytay, Rizal
Annex, Taytay Rizal
21 June
Daycare Center, Barangay
Barangay East Kamias and West
8:30 11:00 AM
2004
East Kamias, Quezon City
Kamias
Barangay Hall, Barangay
Barangay Laging Handa, Sacred
1:00 4:00 PM
Laging Handa, Quezon City
Heart, and South Triangle
22 June
Covered Court, Barangay
Barangay 2A, 2B, 2C, 3A, 3B, and
1:30 4:00 PM
2004
Quirino 2A, Quezon City
Duyan-Duyan
23 June
Barangay Hall, Barangay
9:00 11:00 AM
Barangay Central and Old Capitol
2004
Central, Quezon City
Covered Court, Barangay
2:00 4:00 PM
Barangay Project 6
Project 6, Quezon City
The consultations were participated by barangay/community officials and residents as well as
representatives from government and non-government organizations. On hand to facilitate the
consultations were the consultants led by its community relations specialist, Mr. Rolando
Soncuya. Representatives from the MWSS and the MWCI also participated in the consultations
while a representative from the Environmental Management Bureau (EMB) of the DENR
observed the proceedings. The format of consultations is as follows:
Ř Introduction of participants and purpose of the consultation;
Ř Presentation of the Philippine EIS System;
Ř Presentation of the MTSP including background of present sanitation conditions;
Ř Presentation of project plans;
Ř Presentation of the highlights and results of the EA; and
Ř Open Forum
DRAFT
11-3
9:42 AM 02/09/05
Regional Environmental Assessment
The Philippine EIS System and the MTSP concept were previously presented during the first
level consultations. However, these presentations were purposely repeated in the program for
the benefit of new participants and those who were not able to participate during the first level
consultations.
The project details refer to the proposed plans and layouts of specific project component in
relation to the concerned communities. This includes the location and size of the proposed
development, nature of construction, and coverage area.
After the project plans were explained, the consultants presented the highlights of the EA study
as follows:
Ř baseline environmental conditions with emphasis to water and wastewater quality and the
survey results regarding the perception of the communities about the proposed project;
Ř major environmental impacts (adverse and beneficial) and proposed mitigations; and
Ř the Environmental Management Plan
The EA presentation was followed by an open forum where the concerned community was
allowed to voice out their queries, issues and opinions. Responses to their queries were
addressed either by the MWCI or by the consultants.
11.4 Public Consultation
11.4.1 Scoping Workshop
Table 12-2 summarizes the issues, concerns and recommendations gathered from the
workshop participants classified into socioeconomic, biophysical and infrastructural aspects.
Some of the issues may not be valid; nevertheless, they are perceptions of the participants that
need responses.
11.4.2 Focused Group Discussions (FGDs)
Similar sentiments were raised during the FGDs. The issues and concerns identified and the
recommendations suggested by participants during the FGDs are given in Table 12-2.
For the MTSP to succeed in its implementation and operation, several recommendations were
forwarded such as the conduct of a series of public consultations to orient the community
residents about the projects. This can be done through general assembly of community
residents and organizations. To add force and effect to the project, barangay resolutions can
be issued and disseminated to the community residents. Some community organizations can
be mobilized relative to some activities that the project requires. To further convince or
persuade the community residents, the proposed sewerage fee with detailed computation can
be presented to the public for scrutiny and discussion. However, a caution was expressed that
any new and increase in sewerage fees must be fully justified.
DRAFT
11-4
9:42 AM 02/09/05
Regional Environmental Assessment
Table 11-2.
Summary of Issues, Concerns and Recommendations from the Scoping Workshop
Environmental
MTSP Component
Issues / Concerns
Suggested / Recommendations
Proposed Activities
Aspect
Riverbanks Sewage
Socio-economic
Greater project participation of
Action planning must involve barangay.
Public consultations
Treatment Plants
barangay constituents
Educational program, cleanliness, Educate the people of proper sewage disposal Information, Education
Sanitation for Low-
health, unemployment
and its negative effect if sewage disposal is not and Communication
Income Communities
done properly
Program
Prioritize residents in the hiring of workers
Upgrade of Existing
during the project implementation.
Sanitation System
Give full information of the advantages
Full information of the MTSP and the results of
Public consultations
of MTSP
the environmental assessment will be
presented to the communities.
Cooperation from all agencies involved Adherence to the vision of the project
Coordination with
in the project
concerned agencies
Biophysical
Air and water pollution
Strict implementation of the environmental
Environmental monitoring
laws.
program
Clogging of drainage causes flooding
Rehabilitation of drainage.
Included in the MWCI
services; quick response
through area managers
Unpleasant odor during the STP
STPs should have odor control device.
Environmental monitoring
operation
program
Presence of informal settlers along Proper construction of septic tanks.
Coordination with
creeks cause severe polluted due to
concerned agencies to
rampant disposal of waste.
ensure proper
construction of septic
tanks;
Installation of a sewer line along the banks that
Included in the MWCI
will collect sewage from the households along
services; quick response
creeks.
through area managers
DRAFT
11-5
9:42 AM 02/09/05
Regional Environmental Assessment
Environmental
MTSP Component
Issues / Concerns
Suggested / Recommendations
Proposed Activities
Aspect
Infrastructure
Some of the barangays are composed
Construct communal septic tanks
To be considered in
of middle-class, low-income families or
Government should provide housing projects future MWCI projects;
depressed population. Middle class
for informal settlers.
Coordination/consultation
homes have septic tanks, while those
Government subsidy for the payment of sewer
with concerned
houses along the creek flush their
fees.
government agencies
waste directly to the creek, thus,
polluting the environment.
No separate sewerage system; only
Prioritize the construction of sewer lines.
To be included as part of
drainage canal is available and is also
the construction
used as a sewer line
contractors program;
coordination with
concerned LGUs
Sewer lines do not function. Sewer
Rehabilitation of sewer lines
Included in the MWCI
comes out of the manholes.
There must be full implementation of the services; quick response
Building Code. There must be structural plan through area managers
and scope of work that will protect the
properties of the barangay.
Households with their own septic tanks must
not be made to pay sewerage fees.
Some projects of other government
Strict adherence of contractors to the
Monitoring of project
agencies / private organization, after
conditions in implementing the project.
activities
completion of construction works do not
restore the site.
Graft and corruption
Barangay should not accept any gift or bribe
Transparency with
with regards to the Project.
concerned communities
DRAFT
11-6
9:42 AM 02/09/05
Regional Environmental Assessment
Table 11-3.
Summary of Issues, Concerns and Recommendations Raised
During the FGDs.
ISSUES AND CONCERNS
RECOMMENDATIONS
Sewerage System
Absence of sewer lines or no functional
Prioritize the construction of sewer lines along the
sewer lines; only drainage canal
street.
available but also used as sewer line
Regular desludging of septic tanks
Overflowing of wastewater from septic tanks
Rehabilitation or upgrade of sewer lines
Clogged sewer lines; sewage comes out of the
manhole; backflows were observed in some sewer
lines.
Strict implementation of sanitation and building code;
sanitation inspection needed.
Some households direct wastewater to the river;
Households along the creek must be connected to the
Sewer lines used as toilets and septic tanks in
sewer lines.
blighted areas.
Information, education and communication program
on proper sanitation and waste management
Lack of complete knowledge about sewerage
condition; indiscriminate dumping of garbage in
drainage system.
Project Implementation
Some projects take considerable time to complete;
Projects should be completed on time to avoid
there are instances that construction sites are not
prolonged inconvenience
properly restored.
Contractors should fully adhere to project conditions;
strict monitoring should be performed to ensure that
projects are done according to plans.
Government and private entities should sit together
Lack or absence of coordination among government
and discuss project plans.
agencies (DPWH, MMDA) and private utility providers
(MWCI, Meralco, PLDT)
Traffic re-routing during construction of sewer lines;
Traffic disturbance during roadworks/excavations.
mobilization of community or barangay residents as
traffic control officers
Sewerage Charge
High sewerage fees
Affordable sewerage fees and commendable services.
Payment of sewerage fees but without corresponding
Transparency in computation of sewerage fees
improvement of sewerage services
Information on cost-benefit feature of the project
Households with their own septic tanks must not be
made to pay Sewerage Fees
Justification of increased sewerage fees; consultation
with affected communities before any additional or
new sewerage fee is implemented.
DRAFT
11-7
9:42 AM 02/09/05
Regional Environmental Assessment
11.4.3 Summary of Public Consultation
Results of the perception surveys conducted on November 2003 and April 2004
indicated a low project awareness of about 32%. The public consultations, which
included the presentation of the key project activities and the results of the EIA
greatly increased the community knowledge regarding sanitation, sewerage
treatment, environmental impacts and project benefits.
The consultations also validated and updated the results of the EA. One of the
major issues raised during the meetings was regarding sewerage fee. The
communities felt that the present sewerage tariff equivalent to 50% of the basic
water charge is excessive. This issue was even emphasized by communities that
are covered by existing sewerage system. They felt that the sewerage fee they pay
are not commensurate with the services they received. The existing systems, which
were constructed during the 1950s, now experience clogs, leaks and backflows and
should be rehabilitated or replaced entirely by new systems.
Overall, the response of the communities regarding the project is favorable. They
realize the value of the benefits the project would offer to their health and to the
environment. Should the project materializes, there should be continuing dialogues
with the stakeholders so that they are promptly informed of the project
developments. This approach will promote transparency and sincerity on the part of
the proponent.
Table 11-4 summarizes the issues and questions raised and the corresponding
responses during the public consultations.
Table 11-4.
Issues and Responses Raised during Public Consultations
Issues / Questions/ Comments
Responses / Recommendations
Sewerage and Sanitation
Some of the drainage systems are not Project includes drainage construction and
functioning (clogged) or even missing. This rehabilitation
causes local flooding.
It is suggested that barangay officials and
constituents start cleaning their waterways
Flooding due to poor drainage system
Part of the project includes
improvement/rehabilitation of drainage system
which could reduce flooding in the area
Additional services
MWCI offers free desludging if scheduled;
emergency desludging is also offered at a
reasonable cost.
Use of Individual Septic Tanks (ISTs)
MWCI emphasized that with the combined
sewerage system, the residents will continue to
use their ISTs as primary treatment. MWCI
provides free desludging of ISTs if scheduled.
Responsibility of MWCI in terms of sewer lines
MWCI is responsible for sewer lines from their
system to the property lines of the households.
Lines inside the properties are the responsibility
of the homeowners
Clogged sewer lines
MWCI have the technology to pinpoint defective
sewer lines (Close Circuit Television) and
declogged blocked sewers
What about those who do not want to connect Under the Sanitation Code and the recently
DRAFT
11-8
9:42 AM 02/09/05
Regional Environmental Assessment
Issues / Questions/ Comments
Responses / Recommendations
to the sewerage system?
passed clean water act, households are
required to connect to the sewerage system if
the system is available.
Some of the sewer lines are in very poor New sewer lines will entail huge cost; MWCI
conditions because of age and new have the technology to pinpoint defective sewer
developments in the area. It is suggested to lines and declogged blocked sewers
construct new sewer lines altogether.
Illegal water connections is one of the causes MWCI is coordinating with local officials to
of water contamination
pinpoint illegal connections.
Project Coverage and Operation
Closing of floodgates by the operation of the DPWH will construct mooring stations along the
treatment plants during dry season will remove lakeshore for fishermen boats and access roads
direct access of fisherfolk to the lake
that will allow them to bring their supplies and
harvests to and from the lake.
Responsibilities of DPWH and MWCI. This will This will be agreed upon in a Memorandum of
enable residents to pinpoint which party will be agreement between the parties involved
responsible if ever adverse effects are
produced by the project
Project coverage; other communities wanted The ultimate plan of MWCI is to cover the entire
their areas to be included in the proposed area with sewerage system. At the moment,
project:
MWCI has to prioritize areas for development
· Why is Nepa Q-Mart not included in Project coverage is limited due to financial and
the coverage; the market generates technical constraints (land availability,
solid and liquid wastes
topography, etc)
· The rest of Barangay Laging Handa, Other areas not covered by the proposed
Sacred Heart and Barangay Signal
project will be considered in future projects;
Areas not covered by the sanitation system will
still be entitled to other MWCI services such as
regular desludging of individual septic tanks.
Project Details
Technical aspects will be finalized in the
detailed engineering stage. Full disclosure of
the details will be made in future consultations
Traffic during construction and operation Proper scheduling of trips (trips to be conducted
(desludging of STPs, SPTPs)
during lull hours); coordination with concerned
officials;
Available parking space within the facility for
desludging
Health and safety
MWCI to require contractors to implement
Contractors Construction Program that will
include health and safety procedures.
Monitoring will be perform to ensure all health
and safety measures are observed
Bad odor from STP
STP will be below ground and equipped with
odor detector and suppressant
Noise from STP
Pumps/aerators will be powered by electricity
which produce minimal noise; STP is located at
safe distance from the community
Monitoring will be conducted to ensure that all
mitigations are in place
DRAFT
11-9
9:42 AM 02/09/05
Regional Environmental Assessment
Issues / Questions/ Comments
Responses / Recommendations
Smoke emissions from STP
STP will be run by electricity that will not
produce any air emissions; back-up generator
may produce emissions but this will be
maintained properly to minimize emissions.
Disposal of sludge
Thickened sludge will be collected by vacuum
trucks and will be transferred to another facility
for dewatering (possibly at the proposed
Septage Treatment Plant at FTI Complex,
Taguig)
Treated water
This will conform to DENR Standards and can
be use for watering plants, or even firewater.
This cannot be use for domestic and potable
needs.
Project monitoring
A representative from the community will be
included in the monitoring team
Project Funding and Duration
Where will the funding come?
MWSS will secure loan from World Bank;
MWCI will be responsible for the payment of
When will the project be implemented?
loan
If the loan is approved, implementation will start
early 2006.
How much is the loan?
Approximately US 100 million
Part of the loan should be used to improve
water services in some of the barangays (Blue
Ridge, St. Ignatius) which do not receive
continuous water supply, before providing
sewerage system
Project Implementation
Previous projects were not implemented MWCI has a social responsibility to their
properly
customers. It will ensure that the projects will
be implemented properly and promptly so as not
to create additional disturbances to communities
Participation of residents in the project This will be through the monitoring team to
implementation
ensure that the project meets all DENR-ECC
conditions.
There should be coordination with other Ideally, that should be the case but project
agencies in planning of construction activities
implementation depends on availability of
financial resources
Environmental charge. MWCI has been MCWI through its Technical Business Area
collecting environmental charge of 10%; Managers would continuously informed
part of which goes to desludging. Why customers of the free scheduled desludging
are the residents informed only now that activities.
MWCI has been providing free
desludging?
Sewerage Charge
What are the water and sewerage charges
Basic water charge, CERA, foreign currency
adjustment, environmental charge (10% of
basic water charge), VAT
Existing sewerage charge will be 50% of basic
DRAFT
11-10
9:42 AM 02/09/05
Regional Environmental Assessment
Issues / Questions/ Comments
Responses / Recommendations
water charge
Areas with existing sewerage system will no
longer pay additional sewerage charge
Basis for sewer fees. Why pay additional 50% In the FS, the cost for the combined system is
of basic charge if the residents will have no much economical than the separate system.
separate sewer lines
The separate sewerage system with its high
cost offers marginal benefits compared with
combined sewerage system
Why should I be made to pay if residents in MWCI should look into the possibility of
other areas without sewer lines would also charging all its customers sewer fees.
benefit from the project
Government assistance. Sanitation is a basic
responsibility of the government, why charge the
residents? Fifty percent of the basic water
charge is excessive.
Transparency in computation of sewerage Public hearings will be conducted before any
charges
charge may be levied on the residents
Participants at Blueridge lauded the aims of the Will present more detailed information in the
project. However, they expressed reservations succeeding consultations
on the additional charges that will b levied once
the project operates.
They requested additional detailed information
including financial analysis of the project.
Project Benefits
Health benefits
Reduce risk of direct contact with untreated
sewage
The EMB representative suggested that project
show health benefits in terms of saved medical
costs so that residents will appreciate the more
health benefits
Environmental benefits
Reduce pollution loading to water bodies
Dislocation of Residents
Displacement of families
Except for CST at Road 5, Project 6, sewage
will be intercepted before reaching the CSTs. In
this way, displacement of families occupying the
CSTs will be avoided
Eviction; the CST at Barangay Old Capitolyo is The CST will not be upgraded; inflows to the
occupied by dwellers and the Barangay Health CST will be intercepted and will be diverted to
Center
the UP STP. Thus, no dislocation of residents
will occur.
Possible displacement of dwellers near the If it cannot be avoided, resettlement will have to
CST at Road 5 during the upgrading
be implemented based on legal framework
covering resettlement and policies of
government and implementing agencies
DRAFT
11-11
9:42 AM 02/09/05
Regional Environmental Assessment
12 Cumulative Impact Assessment
12.1 Introduction
12.1.1 No Project Options
Under this option, there would be no interventions in the present state of sanitation,
sewerage and wastewater management. The present socio-environmental conditions in the
Region are very poor, with demonstrated economic impacts as discussed in Section 5
Baseline Conditions.
The population in the east zone Concession Area is predicted to increase from 5.3 million
persons to 8.2 million in 2021. This 60% increase without any improvements in the standard
of sanitation, sewerage and wastewater management will result in even greater socio-
environmental impacts. The impact quantum cannot be predicted but it would safe to project
that, for example, the presently limited periods of adequate DO in the major river systems
would be even further reduced, perhaps even eliminated.
The health impacts of greater population and population density can only exacerbate the
present health impacts in terms of water borne diseases and associated environmental
costs.
The No Project option cannot really be considered an option.
12.1.2 MTSP Option
The MTSP will have net benefits on the Region.
Overall benefits include the following;
Ř reducing the pollution of key Metro Manila waterways
Ř reducing the health hazards associated with human exposure to sewage by drain
covering and effluent disinfection
Ř improved property values along watercourses
Ř improved aesthetics as the water quality improves
Ř improved fish catches
Ř improved tourism
Ř improved soil condition and crop yields in lahar affected areas
Ř providing design and implementation feedback on the combined sewer systems efficacy
and the STP/SPTP designs, in effect a pilot scheme for the many innovations proposed
under MTSP
Ř cessation of uncontrolled dumping of septage from privately owned and operated
tankers
Ř provides a viable alternative to sea dumping of septage/sludge
Ř cessation of the hauling of liquid septage to the lahar affected areas north of the Region.
It is environmentally and financially unsustainable to be hauling so much water in the
non-dewatered septage such a distance and with the attendant environmental risks
associated with accidents and attendant spillages of the liquid septage
Ř improved institutional implementation of sanitation and sewerage services, including
more clearly defined roles and responsibilities and enforcement, and
DRAFT
12-1
9:42 AM 02/09/05
Regional Environmental Assessment
Ř elevating the commitment and political will required to improving sanitation, sewerage
and wastewater treatment in the minds of politicians, government agencies, NGOs, civil
society and the general public.
As always there will be some short term localised construction impacts such noise, dust and
traffic interruptions, but these are short term and are very minor compared with the longer-
term benefits.
12.2 General Benefits
Just because the regional water quality improvements may not be quantifiable does not
negate the benefits of the MTSP. It is the first step in a major program to provide sewerage
for the Region eventually, and will provide good on-the-ground feedback to refine
subsequent designs for the ongoing infrastructure roll-out program.
The MTSP will also provide educational opportunities and demonstration projects allowing
the general public to see the benefits of improved sanitation and sewerage. This will make
subsequent stages socially easier to implement.
Some specific examples are listed below.
12.2.1 Water Quality Improvement
Some of these benefits will be difficult to measure explicitly immediately, such as improved
Dissolved Oxygen levels and reduced Coliform levels in Regional watercourses. This is
because the watercourses are so polluted at present that it will require the subsequent
implementation of additional stages beyond MTSP to provide consistently measurable water
quality improvements. However the MTSP will start the recovery of some the watercourses
from the almost biologically dead status of present times.
12.2.2 Better Health
There will be health improvements due to drain improvements and treated
effluent/disinfection. These benefits will outweigh any minor risks associated with versus
potential aerosols from aeration equipment at the treatment plants.
12.2.3 Greater Tourism
Improved tourist visitations will result from the improved regional environmental
improvements.
12.2.4 Greater Fishery Production
Extending the period of measurable DO in the main river systems will increase ecosystem
stability. This will improve fish stocks and mobility from the cleaner upper waters of the
Marakina and Laguna Lake system to connect with the Manila Bay ecosystems.
12.2.5 Property Values
Improved water quality and aesthetics will lead to greater use of riverbank property which
will result in greater property valuations. This will lead to greater taxation revenues for the
LGUs with positive flow-on affects, and also possibly trigger some localised urban renewal.
The taxation increases can then be used to fund further sanitation/sewerage improvements.
DRAFT
12-2
9:42 AM 02/09/05
Regional Environmental Assessment
12.2.6 General Aesthetic improvements
There will be reduced odour from the presently open and damaged drains.
Ultimately, there will be improved aesthetic appreciation from the resulting water quality
improvement in major waterways
12.2.7 Improved Institutional Implementation
As noted in the section on Policy and Institutional Issues, a number of key recommendations
have been made on how to improve sanitation and sewerage services in the Region.
This will provide benefits beyond the scope of the MTSP areas of influence.
12.2.8 Septage/Sludge Management
The land application of the dewatered/dried material will have major impacts on the unfertile
lahar affected soils north of the Region. There will general soil conditioning, such as organic
content, moisture retention capability and ability to retain nutrients (CEC amongst other
measures). More directly there will be crop yield improvements and/or the ability to reduce
the application rate of artificial fertilisers. The field trials referenced in the Lahar
Environmental Study (2004, attached to the EIS) noted that mean plant height, number of
tillers, millable stalk production and sugar yield, regardless of inorganic nitrogen application,
were significantly improved with application of sewage sludge and septage.
12.3 MTSP General Impacts
In a traditional REA, the component impacts are determined individually firstly. The second
step is to then combine the impacts from the scheme components
As noted previously, the MTSP component projects are all relatively small in a regional
context. For example, the individual projects are all discharging into polluted water where
the Dissolved Oxygen levels are often at the level of detection, about 0.5mg/L. This means
that there is a need for major reductions in BOD load before the improvements would be
manifest as measurably higher DO levels.
The direct water quality impacts from all components will reduce the regional BOD load by
17,300tpy. The present Regional BOD load has been variously reported as 330,000tpy by
the World Bank (2003), and 359,00tpy as the adopted load in the DANIDA 1999 modelling
study for 2015. The percentage reduction in BOD due to MTSP is therefore expected to be
in the order of 5%. This also is too small a reduction to be reliably detected regionally.
However this improvement scenario must be compared with the ongoing deterioration that
would occur over the next decade as the Regional population increased, if no project was to
be initiated.
The DANIDA (1999) modelling determined that a 85% to 90% reduction in regional BOD
load would be required before DO levels of more than 1 mg/L would be regularly achieved in
the Pasig system. This is the lowest possible DO level to allow some ecosystem stability to
be achieved. Therefore the expected reductions in BOD from the MTSP will not result in a
proportional improvement in DO.
Therefore the water quality impacts and benefits must be considered qualitatively and
collectively.
DRAFT
12-3
9:42 AM 02/09/05
Regional Environmental Assessment
An EMP is included in the EIA document which addresses how the MTSP components will
be monitored, especially for septage/sludge land application as there a number of
environmental unknowns with this activity.
12.4 Flow-on Affects
There are numerous beneficial flow-on affects from implementing the MTSP, with the
definition of flow-on affect derived from World Bank, 2003.
One discrete benefit is the increased crop yields resulting from septage/sludge applications
on the lahar-affected soils and extensive agricultural areas.
Similarly, integration with the PRRC Environmental Preservation Areas or linear parks along
the Pasig River demonstrates the mutual benefits of the two projects, such as:
Ř The STPs require substantial land areas that have proven very difficult to obtain for
reasons of site development and therefore elevated cost. By incorporating the STP
development plan into the EPA construction the plants can be constructed underground.
This has the benefits of reduced visual aesthetic impact, reduced vandalism and
pilferage of equipment and also reduced odour emissions and any aerosol drift from the
mixed liquor aeration systems and attendant potential health impacts
Ř The STPs will improve the local water quality contiguous to the park developments. This
applies to the local drains whose dry weather flows will be intercepted for treatment, and
to a lesser extent, to the Pasig River itself. The main beneficial impact on the River will
be that any solid waste (garbage) will also be trapped by the dry-weather flow-diversion
system in the drain. The improved water quality will encourage greater passive
recreation such as aesthetic appreciation from the linear park areas and other river front
areas in the short term.
Ř In the longer term as the MTSP matures and other sewerage and sanitation programs
follow, then the water quality will improve further and allow greater aesthetic appreciation
and a return to river based transport. River based transport would be a great benefit to
road based traffic congestion in Metro Manila. This will also encourage greater emphasis
on illegal dumping of solid waste which presently prevents much river transport due to
floating garbage blocking motor cooling inlets and wrapping around propellers.
Improving water quality and associated great public access to the local watercourses will
have these and other synergistic benefits.
12.5 Typical Impacts
The typical impacts associated with the component infrastructure will include the following
issues. These are discussed for individual components in the EIA in detail, and summarised
below. In general, the proposed components will have minimal environmental impact.
12.5.1 Noise
The construction noise will not be regionally cumulative as the sites are well apart and will
not be constructed at the same time in any case. Impacts will be minimal and covered by
adopting suitable working hours, having functioning silencers on equipment and so on.
Operational noise will also be minimal. The SPTPs and STPs will have aeration systems but
these noise sources are small, as any compressors will be in a sound proofed room, or
floating aerators are not noisy in any case. Most treatment plants will either be covered or
fully underground, which further reduces the potential noise impacts.
DRAFT
12-4
9:42 AM 02/09/05
Regional Environmental Assessment
12.5.2 Air Pollution
Construction dust would be managed by the usual wetting down of dry construction
materials.
Air pollution during the operational phase would only odour or aerosols transmission. Odour
will be minimal as the treatment plants with either be covered or located underground, and
are treating less volatile sullage, not traditional raw sewage. The Regional septage quality
has been monitored, and determined to have minimal volatile organics so the SPTPs will not
suffer odour problems.
There may be some dust from land application of septage/sludge but this is typical of normal
agricultural activity, such as simply plowing-in the unstabilised material.
12.5.3 Water Pollution
The STPs and PSTPs will actually reduce water pollution by reducing the organic load in the
Region and allowing the effluent to be disinfected. The later reduces the pathogen counts in
local waterways.
The collection, treatment removal of septage for productive reuse reduces the amount
presently being pumped and then illegally dumped by private desludging contractors. The
new institutional arrangements also mean that the private operators will be allowed to
continue operating, but by using the proposed SPTPs and not to dump illegally into Regional
waterways.
The land application of septage/sludge has the potential to cause contaminated runoff and
also groundwater pollution. Surface water contamination will be minimal as most
septage/sludge is unstabilised and therefore has to be buried within 6 hours of placement. It
is not to be placed in wet weather according to the USEPA guidelines but this is impractical
locally. There will be some unavoidable washoff in wet weather but vehicle access
difficulties will prevent sludge/septage applications in very wet weather. In these periods,
the sludge/septage will have to be stockpiled for later application in drier weather.
Groundwater contamination is also possible. However a monitoring program (EMP) has
been prepared as part of the EIA which addresses this aspect. Essentially the groundwater
will be monitored in local water wells and in purpose0built sampling bores to assess any
impacts. If the groundwater is contaminated, then sludge/septage applications will be
curtailed or application rates reduced to ensure that groundwater integrity is not violated for
the local users.
12.5.4 Aesthetics
Most treatment plants will be covered or underground, causing only little aesthetic impact.
12.5.5 Flora and Fauna
There is no rare or threatened fauna or flora at the sites to be developed for MTSP. The
large fig trees will be retained at the East Avenue Site if at all possible.
DRAFT
12-5
9:42 AM 02/09/05
Regional Environmental Assessment
12.6 Economic Analysis
12.6.1 Introduction
This economics subsection is essentially taken from the Master Plan, 2004. The economic
analysis for the Manila Third Sewerage Project was undertaken in accordance with National
Economic Development Authority (NEDA) guidelines, which stipulate that an overall cost-
benefit analysis of the total project be carried out, comprising individual economic analyses
of each of the project components as presented in the previous sections. The analysis
compares the calculated economic internal rate of return (EIRR) for the project to the
economic opportunity cost of capital (EOCC), which is assumed to be 12% in accordance
with the guidelines, and also calculates the net present value (NPV) of the project.
A risk analysis comprising additional sensitivity scenarios over and above the standard
sensitivity tests has also been undertaken. This analysis considers changes to the
assumptions on unit health benefits, environmental benefits and the potential economic
benefit from the reuse of sludge in lieu of urea and inorganic fertilizer, resulting to cost
savings to farmers in the lahar area (Estanislau et al). This agricultural benefit has been
applied to a percentage of the incremental volume of dewatered sludge resulting from the
septage treatment component.
12.6.2 Project Economic Cost
The financial costs for the overall project have been converted to economic costs to reflect
the true cost and value to the economy of goods and services after adjustment for the
effects of government intervention and distortions in the market structure through shadow
pricing of the project inputs. In estimating the economic costs, some items in the financial
costs have been excluded while others that are not part of the financial costs have been
included. Items such as taxes and duties, VAT of 10%, price contingencies and
depreciation, for example, have been excluded.
Costs have been broken down into tradable and non-tradable elements that reflect the
foreign exchange and local currency components, respectively. The tradable components
have been valued at their border price equivalent and then re-valued to the domestic price
level by multiplying by the shadow exchange rate factor of 1.2. Non-tradable components
have been valued at their supply price using the conversion factors set out below. All costs
are based on constant 2004 prices.
12.6.3 Health Benefits
Health benefit is taken as the value of improvement of public health due to improved
drainage systems. The opportunity for the public to come into direct contact with sewage
contaminated runoff is lessened, if not totally eliminated, in the MTSP components. As
discussed in Section 4 of the Feasibility Study (April 2004), this can amount to about
Ph300,000 per 1,000 population per year. This is applicable to those components with
drainage upgrading namely: (1) Taguig Sewerage System and Sanitation for Low-Income
Communities, (2) Quezon City - Marikina Sewerage System and (3) Manggahan East Bank
Sanitation for Low-Income Communities.
An increase in unit health benefit of Ps 300,000/1000 population to Ps 400,000/1000
population as a result of improving wastewater collection systems is also appropriate. The
increase is based on the benefit range of Ps 300,000 to Ps 1 million/1000 population of
combined approaches discussed in detail in Section 4. The figure of Ps 400,000/1000
DRAFT
12-6
9:42 AM 02/09/05
Regional Environmental Assessment
population is still within the lower limit considering that the sanitation facilities in the sub-
project areas are not grossly inadequate.
Another health benefit that can be considered is the reduced risk of people coming into
contact with untreated sewage from overflowing tanks. It is estimated to correspond to an
annual health benefit of Ph150,000 per 1,000 population per year. In the case of the
septage treatment component and in the provision of separate sewerage over and above
the upgrading of existing drainage (combined sewerage) system, the health benefit of Ps
150,000/1000 population is increased to Ps 200,000/1,000 population.
12.6.4 Determination of Environmental Benefit
Environmental benefit is taken as the gradual improvement in the receiving environment that
will occur as a result of the provision of sewage treatment and sewerage upgrading,
particularly the reduction of visual pollution in the early years. It shall be equated to the 50%
sewerage charge as a surrogate for the actual monetary value that might be placed on the
environmental improvement in the community.
12.6.5 Water Quality Improvement
The MTSP will reduce the total BOD load discharged to the water environment in the NCR
by some 17,300 tpy in year 2015. The reduction will be of the order of 5% of the total BOD
being discharged.
No economic benefit has been allocated to this BOD reduction on the grounds that the
resulting improvement in receiving water quality, although being a step in the right direction,
is too small to produce a benefit that is measurable in monetary terms.
The option of equating the benefit of BOD reduction to the cost of removing the BOD (in
terms of electricity use for example) has not been adopted since this is not considered to be
a relevant measure of environmental quality improvement.
12.6.6 Consumer Surplus
Consumer surplus is determined on the basis of the willingness of households to pay for
improved sanitation and wastewater management services which will result in a reduction in
the BOD load discharged to the environment. The willingness to pay for the services has
been assumed to be equivalent to the 10% sanitation charge levied by MWCI plus the 50%
sewerage fee as a surrogate for the actual monetary value that might be placed by the
community on the environmental improvement. The environmental charge is estimated to be
Ps 10.5 million in 2006, increasing to Ps 310.0 million in 2015 and then increasing further to
Ps 360.6 million in 2025. The sewerage fee is calculated to be Ps 52.7 million in 2006,
increasing to Ps 302.5 million in 2015, reaching Ps 555.6 million in 2025. Although the 10%
sanitation charge has been taken for all project components, it has been reduced to 5% for
Taguig Sewerage Option 1 (and Option 3 up to year 2014) on the grounds that the
treatment facilities will only operate during the dry season. In a similar manner only half the
sewerage fee has been allocated to the Taguig Sewerage component, and no sewerage fee
has been applied to the Septage Treatment Plant component since this is essentially
represents an improved septic tank desludging operation and not sewage treatment.
12.6.7 Septage/Sludge Application to Land
Dewatered septage (and dewatered sewage sludge) will be applied on lahar-affected soils in
Pampanga in order to take advantage of the organic and nutrient content of the
septage/sludge in reclaiming agricultural land. The studies referred to earlier have shown
DRAFT
12-7
9:42 AM 02/09/05
Regional Environmental Assessment
that because of its high concentrations of essential elements and organic matter, as well the
presence of micronutrients and the low levels of heavy metals, the use of domestic sewage
derived sludge is an excellent material for increasing the cultivation potential of agricultural
land in the Philippines. The regeneration of the land will result in an increase in land value.
An area of about 65 ha will be treated each year with an estimated annual benefit of Ps 5.5
million as a result of the increase in land value.
Cost savings to farmers in terms of a reduction in the use of urea and inorganic fertilizer as
a result of the use of dewatered septage and sludge to fertilize existing land under
production. At present, sludge is applied in the lahar area at an average rate of up to 160 m3
per day, which it is assumed has already positively benefited the lahar area.
Under the MTSP, the total volume of dewatered septage/sludge hauled to the lahar areas
would amount to about 450 m3 a day in 2015. The benefit of using this septage/sludge in
lieu of urea and inorganic fertilizer can be computed on the basis of the incremental volume
of sludge resulting from the project. The cost savings is taken as the difference in the cost
of inorganic fertilizer use at 2004 prices at Ps 10/kg less the estimated application cost of
sludge.
The actual nutrient content of this septage/sludge combination cannot be determined as yet
as the STP and SPTP facilities have not been constructed. However the field trials with
some of the separate components confirms significant agronomic and yield benefits. The
economic quantification will have top await the actual application of the combined product
and associated monitoring.
12.6.8 Environmental fee and sewerage charges
There is also an increase in unit environmental benefits measured in terms of the
environmental fee and sewerage charges. Values used in the evaluation model of Ps 1.37/
m3 water use and Ps 6.86/ m3 respectively, to increased amounts of Ps 1.39/ m3 and Ps
6.96/ m3 to include the FCDA (foreign currency differential adjustment) of Ps 0.19/ m3.
12.6.9 Summary of Economic Benefits
Table 13.1 sets out the overall MTSP economic benefits. Essentially the Present Value of
economic benefits over the life of MTSP until 2025 is estimated to be P2.7 billion, with
Health Benefits and Environment Benefits each providing some P1.2 billion of this total.
DRAFT
12-8
9:42 AM 02/09/05
Regional Environmental Assessment
Overall Economic Analysis (in thousand pesos)
Sensitivity Analysis
Year
Capital
O&M
Total
Health
Environmental
Lahar
Total
Net Benefits
10%
10%
Combined
Cost
Cost
Cost
Benefits
Benefits
Reclamation
Benefits
Base Case
Increase in
Decrease in
Case
Cost
Benefits
2004
-
-
-
-
-
-
-
-
2005
392,025
- 392,025
0
-
-
- (392,025)
(392,025)
(431,228)
(431,228)
2006
1,445,485 57,510 1,502,995
34,500
5,500
(1,462,995)
(1,466,995)
-
40,000
(1,613,294)
(1,617,294)
2007
1,467,180 118,370 1,585,550
132,485
5,500
(1,252,301)
(1,285,626)
149,268
287,253
(1,410,856)
(1,444,181)
2008
22,643
145,070
157,544
5,500
182,790
147,739
167,713
170,204
333,249
166,018
130,968
2009
22,643
147,725 170,369
166,306
5,500
197,388
160,612
178,696
350,503
180,351
143,575
2010
64,193 150,391 214,585
175,068
5,500
170,426
131,925
187,188
367,756
148,967
110,466
2011
41,550
154,646
183,830
5,500
206,069
165,842
196,196
195,680
385,010
186,449
146,223
2012
69,200
162,376 231,576
192,592
5,500
187,942
145,990
204,172
402,264
164,785
122,833
2013
41,550 166,816 208,366
201,354
5,500
228,407 207,570 184,729
212,664
419,518
163,893
2014
41,550 171,285 212,835
210,116
5,500
237,236
192,229
221,156
436,772
215,953
170,946
2015
41,550
175,769
218,878
5,500
249,622 227,890 202,928
217,319
225,693
450,071
181,196
2016
3,270
179,353 182,623
227,628
5,500
282,926 252,808
233,814
466,941
301,189
234,545
2017
375,440 182,971
236,377
5,500
(57,730)
(107,798)
558,411
241,934
483,811
(113,571)
(163,639)
2018
41,550 186,610 228,160
245,126
5,500
289,392 266,576 237,637
250,055
500,681
214,821
2019
3,270
190,252 193,522
253,876
5,500
324,030 304,677 272,275
258,176
517,552
252,922
2020
41,550
184,732 226,282
262,625
5,500
308,139
254,697
266,296
534,422
285,511
232,069
DRAFT
12-9
9:42 AM 02/09/05
Regional Environmental Assessment
Sensitivity Analysis
Year
Capital
O&M
Total
Health
Environmental
Lahar
Total
Net Benefits
10%
10%
Combined
Cost
Cost
Cost
Benefits
Benefits
Reclamation
Benefits
Base Case
Increase in
Decrease in
Case
Cost
Benefits
2021
41,550
188,320 229,870
271,375
5,500
321,422 298,435 266,292
274,417
551,292
243,305
2022
61,200 191,929 253,129
280,124
5,500
315,032 289,720 258,216
282,538
568,162
232,903
2023
49,550
195,560
288,873
5,500
339,922
281,418
245,110
290,658
585,032
315,411
256,907
2024
41,550 199,214 240,764
297,623
5,500
337,062 300,948
298,779
601,902
361,138
276,872
2025
41,550
193,707 235,257
297,817
5,500
378,878 355,353 317,465
310,819
614,136
293,939
PV
1,107,004 3,812,545
2,824,149
1,189,001
1,221,830
36,680
2,741,213
EIRR
3.5%
1.6%
1.4%
-0.6%
NPV
(1,261,023)
(1,516,175)
(1,642,277)
(1,897,429)
DRAFT
12-10
9:42 AM 02/09/05
Regional Environmental Assessment
13 Regional Environmental Management System
13.1 Introduction
This section presents recommended strategies to strengthen environmental
management within the area. The strategies include: (a) measures to ensure that
positive environmental impacts of proposed projects are adequately enhanced; (b)
measures to ensure that negative impacts are adequately mitigated; (c) general
guidelines for short-term and long-term ambient monitoring; and (c) a plan for
institutional strengthening.
The REMS is not supposed to monitor the individual MTSP components, as that is
covered in the EMP and EMoP presented in the EIS document. The REMS is just to
assess the general Regional response to implementing the MTSP overall. Therefore
the REMS focuses on regional ambient monitoring not component specific
monitoring.
Based on the feasibility studies for each component, the MTSP in general can
reduce the total BOD load to the natural waters by as much as 17,300 tpy (2015).
This only represents approximately 5% of the total regional BOD load. It is therefore
unjustified to expect the MTSP to demonstrate substantial improvements in
environmental quality alone. Such small changes in load would be too small to
model sensibly in the DANIDA water quality model developed for the Region, and
particularly the Pasig River and tributary systems. In any case, a statistically valid
monitoring program is still required to provide a valid baseline dataset, and facilitate
a trend analysis over time as the PTSP components are implemented. The basis for
such a program is described below.
However, there are other areas for improvement resulting from the MTSP
component mix. These issues include health, general aesthetics, tourism, fishery
improvements and propery value escalation.
However the key factor is that the MTSP interventions are a significant and
appropriate first step in the sewerage and sanitation strategy for the Region, and
should be implemented as soon as possible.
13.2 Institutional Aspects
The institutional changes are critical to the success of the MTSP and other regional
socio-environmental improvements.
These can be developed as below, based on the provisions of the CWA as shown in
the table below;
DRAFT
13-1
9:42 AM 02/09/05
Regional Environmental Assessment
Table 13-1 - Summary of the Proposed Clean Water Act of 2002
PROVISION
LEAD OFFICE AND OTHER
STAKEHOLDERS
National Water Quality Status Report
Lead: DENR
Others: NWRB, PCG and other appropriate agencies &
entities
Integrated Water Quality Improvement Framework
Lead: DENR
Others: LGUs, concerned government agencies
Water Quality Management Area Action Plan
Lead: DENR Regional Offices
Others: NWRB, member LGUs, civil society, other
concerned stakeholder sectors
Local Government Unit Water Quality
Lead: LGUs in consultation with concerned stakeholder
Compliance Scheme
Water Quality Management Area
Lead: DENR
Others: NWRB in consultation with key stakeholders
Management of Non-attainment Areas
Lead: DENR
Others: NWRB , DOH, DAO, Governing Board, other
concerned agencies, private sector, LGUs
National Groundwater Vulnerability Mapping
Lead: DENR - MGB
Water Pollution Management Practices and Technologies
Lead: DOST
Others: DENR, other concerned agencies or organizations
Guidelines for Test Procedures
Lead: DENR
Others: DOST, DOH, and other concerned agencies
Water Quality Monitoring and Surveillance
Lead: DENR with multi-sectoral group
National Sewerage and Septage Management Program
Lead: DENR
Others: DOH, LWUA, NWRB, MWSS, other concerned
agencies
Domestic Sewage Collection, Treatment and Disposal
Lead: LGUs and/or agency vested to provide water supply
and sewerage facilities, concessionaires
Others: DENR, DOH, DPWH, other concerned agencies
National Water Quality Management Fund
Lead: DENR
Others: DOST and PCG
Area Water Quality Management Fund
Lead: Water Quality Management Board in each water
quality management area
Water Quality and Effluent Standards and Regulations
Lead: DENR
Others: DOH, DA, private sectors, other government
agencies
Water Pollution Permits and Charges
Lead: DENR
Others: Project Proponents, other government agencies,
LGUs
Institutional Mechanism
Lead: DENR
Others: LGUs (ENRO), Governing Board, concerned
stakeholders, NWRB, PAB, LLDA, PCG,
DA, MWSS, LWUA, BFAR, DOH
Incentives and Rewards (Rewards, Incentives Scheme)
Civil Liability/Penal Provisions
Lead: PAB Lead: DENR, affected persons, Courts
Actions (Administrative, Citizen's Suit, Legal Actions
Against Public Participation and Enforcement of this Act,
Lien Upon Personal and Immovable Properties
13.2.1 Relative Priority of Wastewater Services
The basic principle governing the regulatory environment in the Philippines on water
services is that water is owned by the state and the government has the sole power
to determine its development and distribution. Hence several agencies and utility
organizations and corporations have been tasked with specific roles in providing
water in the country such as water districts, the local government units in special
cases, and private corporations. However, this principle does not apply to sewerage
and wastewater.
Action. The sewerage sand wastewater management systems will only be
developed once there is community and political support for proper funding of these
DRAFT
13-2
9:42 AM 02/09/05
Regional Environmental Assessment
systems. An IEC is essential to refocus the community and political opinions that
water supply is by far the most important issue in the water management cycle.
A campaign is required to alert the community to the health and economic benefits of
improved wastewater management. A champion must be identified in a senior
government position to bring the IEC aims forward. The aim will be to make
wastewater management a key political issue and thence become an election issue.
This will be very difficult unfortunately with the numerous demands on capital in the
Philippines.
However this is the only sustainable path, otherwise the best efforts of those charged
with implementing the wastewater management systems will fail in the long term.
13.2.2 Connection to Public Sewerage Systems
The Plumbing Law and the National Plumbing Code are very clear. Except in cases
when it may prove oppressive or excessively burdensome to those without sufficient
means, all buildings should be connected with available sewers. This has not been
done nor its execution been regulated by the proper agencies concerning sewage
infrastructure. More so, the power of water districts to disconnect services to
buildings that refuse to connect with existing sewer lines should likewise be given to
other entities which build and operate such sewer systems, such as those in Metro
Manila. This will give the provisions in the Plumbing Law and the Plumbing Code
more power, facilitating universal connection with available sewage lines.
Action. The Concessionaires must be given power to disconnect water supply to
those users who refuse to connect to sewers, and also for those who then fail to pay
for this sewerage service. This is not available at present.
13.2.3 Project Financing
It costs approximately five times to amount to develop sewerage and sanitation
facilities than water supply for the same number of households, yet on the National
level the annual investment on sewerage is 3% of the total investments in the water
supply and sanitation sector. Although there are several sources of financing
available to fund sewerage and sanitation projects, most of these are relatively new
to the local government units as well as government agencies and corporations and
will need focused technical assistance to maximize their application.
Action. A technical assistance grant is required to advise on how to better use the
various funding options listed above.
13.2.4 Low Willingness to Pay and the Lack of Sanctions
Several studies have pointed out the low willingness to pay of households for better
sewerage and sanitation service, and has been recently estimated at
PhP30/month/capita or PhP5,700 per capita. At this rate it will take 16 years to
recover capital investments in sewerage and sanitation. It may be argued that the
low willingness to pay could be addressed by cross-subsidies, or mandating the
connection to sewers by households with a threat of sanction for non-compliance
removes the assumption that households have a choice as implied by the
proponents of willingness-to-pay scheme.
The existing laws do not provide sanctions for households not connecting to sewers.
Although the Sanitation Code promotes the establishment and connection to sewers
DRAFT
13-3
9:42 AM 02/09/05
Regional Environmental Assessment
and sanitation facilities, there is no threat of sanction for non-compliance. Similarly is
the Clean Water Act, which requires LGUs to earmarked an area to locate treatment
plants, non-connection is still an option for households to take.
Action. The Concessionaires must be given power to disconnect water supply to
those users who refuse to connect to sewers, and also for those who then fail to pay
for this sewerage service. This is not available at present.
13.2.5 Monitoring of Compliance to Existing Laws
As the population of Metro Manila rises and congestion increases, environmental problems
related to sewerage and sanitation are likely to become worse. The Sanitation Code
provides broad regulation against most improper sanitation practices, including the
discharge of untreated septic tank effluent and untreated sewage to water bodies.
Unfortunately, there is little monitoring or enforcement of these regulations and the
agencies responsible have few powers or incentives to follow-up wrongdoers.
The reality is that most households, businesses and local authorities in the Philippines are
in breach of the national sanitation code. Industrial consumers can be monitored by the
DENR but the sheer number of these industries from small partnerships to larger
conglomerates necessitate that only the larger companies are dealt with.
For the individual households, the mandate in the Sanitation Code and in the Clean Water
Act clearly states that DOH approval is needed prior to the discharge of untreated effluent
of septic tanks and/or sewage treatment plants to bodies of water.
Within the cities and municipalities a more comprehensive study of the various ordinances
and issuances in relation to their policies which affect the sector should be initiated. Again,
however, the prohibitive costs of employing a centralized sanitation service for Metro Manila
becomes the issue. Until treatment plants and combined systems becomes cheap enough to
build and to operate, the user fees shall be above what ordinary consumers are be willing to
pay. The indiscriminate discharge of sewerage, septic tank and toilet effluent is likely to
continue until either public sentiments change, or stronger regulation and
enforcement is introduced.
Action. The only solution is to undertake a study involving all the agencies to
demonstrate that continuing as at present is simply not an option. This study will
also demonstrate and delineate the responsibilities and the obligations of the various
agencies and determine a funding and resourcing plan to ensure enforcement
activities do result.
13.2.6 MTSP Impacts on Existing Private Septage Haulers
The MTSP intends to de-sludge an estimated 115,000 individual septic tanks
annually by year 2025. Supported by cheaper loans and government approval to
dispose collected septage on lahar areas may be construed as unfair competition
between the MWCI and private haulers. These desludging contractors have provided
limited but necessary services for decades due to the limitation in MWSS capability,
and have made investments particularly in haulage trucks. Although not a single
operator has been granted a permit by the DENR to operate a septage treatment
plant, the MWCI should foster a cooperative partnership with these contractors
rather than compete with them.
DRAFT
13-4
9:42 AM 02/09/05
Regional Environmental Assessment
The MWCI and the DENR should craft guidelines and accreditation schemes that will
allow these contractors to operate within the MWCI concession area particularly on
densely populated, space-congested areas in the concession which will be difficult to
access by the larger MWCI tankers . Collected septage can be disposed in the lahar
areas, and later on will be required to be treated in the MWCI septage treatment
plants.
Action. The proposed GEF study for the Region will address the institutional issues
of the private operators. It is acknowledged that only approximately 80% of the ISTs
can be desludged by the MWCI fleet for various reasons. Therefore the remaining
20% will utilise the private contractors' desludging services.
13.2.7 IEC on Health Impacts of Wastewater
The limited understanding of households on the health impacts of the existing septic
tanks that are inadequately managed has generated multiple problems like low
willingness-to-pay for improvement in facilities and services, and willingness-to-
connect even if sewer systems are already available. The strong bias of politicians
to support expansion in water supply without corresponding sewerage and sanitation
facilities has resulted to dismal public investments on the latter, a problem that can
be addressed by properly informing these policy makers.
In year 2000 alone, according to the DOH, 871,446 cases of diarrhoea were
recorded with an estimated economic losses based on medical expenses and cost of
hospitalization reached PhP1 billion. The World Health Organization contends that
the single most effective intervention to address diarrhoea is the provision of a
sewerage system.
Action. The DOH should transform and expand its activities from simply monitoring
water-borne related diseases to conducting active promotion on the need to have
adequate sewerage and sanitation facilities.
13.3 Project Specific Enhancement/ Mitigation Strategies
Enhancement/mitigation plans provide detailed activities aimed at eliminating,
reducing or controlling the adverse environmental impacts of proposed projects and
detail the proposed measures to enhance the positive impacts.
These are all project specific and are included in the EMP and EMoP in the EIS.
They do not relate to regional management.
13.4 Air Sector Enhancement/ Mitigation Strategies
Most areas in Metro Manila have ambient concentrations that exceed the allowable
limits set by the DENR.
Septage collection is not likely to produce impact on air quality. The odor that may be
produced during the collection process will only be temporary and for a short period
and considered insignificant. The projected suspended solids and nitrogen oxides
considering the baseline conditions will be insignificant.
Strategies recommended to address these problems are the following:
DRAFT
13-5
9:42 AM 02/09/05
Regional Environmental Assessment
Ř Implementation of Construction Contractor's Program (Attachment 1)
enumerating contractor's commitment to environmental management during
project construction.
Ř The reduction of risk to the human population can come not only by reducing
emissions but by establishing residential areas away from risk zones.
13.5 Water Enhancement/ Mitigation Strategies
Based on results of sampling, most of the Regional surface water bodies are heavily
polluted. Since septage collection is made by specific vacuum tankers, spillage
during collection is not likely to occur. Spillage of some septage from the suction
hose when dipped into the septic tank is negligible, and will not cause negative
environmental impacts on a regional basis. About 50 vacuum trucks per day for
septage collection will travel to the septage treatment plant but will result to
negligible impact to the environment in terms of NOx and COx. However, on some
areas pollution load from domestic and industrial sources still have to be properly
managed.
Enhancement/mitigating strategies for water management are the following:
Ř Install embankments to minimize if not prevent soil erosion. Attachment 2
presents the Septage Management Plan that project proponents may use
Ř Establish vegetated buffer zones should surround areas of high risks of runoff to
allow infiltration and to trap suspended particles.
Ř During construction to minimize if not prevent noise, temporary soundproof
structures may be installed around the work area and schedule the use of large
machines that produce noise during daytime.
Ř Employ best management practices such as spill prevention, require vacuum
cars to be used be equipped with special cleaning devices, proper materials
handling to be incorporated in the orientation given to contractors emphasizing
safe driving and training drivers and car personnel on how to address accidental
spills of septage. Attachment 3 presents the Contingency Response Plan for
project proponents.
Ř Establish monitoring program and team that will periodically monitor surface
water quality as specified in the Environmental Monitoring Plan.
Residential areas located next to industrial facilities pose serious threat to public
health and safety. LGUs should issue policies on zoning classification, development
guidelines and identify roles and accountability of local officials and industries.
13.6 Monitoring Strategies
13.6.1 Environmental Monitoring Plan
An integral part of environmental protection is the continuous monitoring of the
conditions of the receiving environment to determine if any changes, either beneficial
or negative, are occurring as a result of the project. Since the effects on living
receptors are received mainly through the surface water, air, and surrounding soil,
environmental monitoring principally requires quantitative measurements of the
amount of pollutants present in these environmental media.
Project specific monitoring measures for the MTSP include:
DRAFT
13-6
9:42 AM 02/09/05
Regional Environmental Assessment
Component 1:
Ř Preparation and implementation of operating procedures for MWCI and MMDA
on the conjunctive use of the drainage and flood control retention ponds
Ř Sludge build-up monitoring and reporting procedure
Component 2:
Ř Sludge hauling procedures (including monitoring) considering that there will be
no on-site dewatering facility and risk of spillage of collected septage is high
Septage/Sludge Management :
Ř Groundwater and surface water quality monitoring to be undertaken on a regular
basis by the MWCI
Ř human health and vegetation monitoring
The environmental monitoring plan presented in Table 13-2 provides general
guidelines for long-term environmental monitoring to ensure adequate
implementation of the regional program or projects and evaluate progress. The plan
should detail the monitoring activities to be undertaken during the different phases of
the project, the parameters to be monitored, with a description of the sampling
stations, frequency of monitoring, analysis procedures, and applicable standards as
presented below:
13.6.2 Air/Noise Monitoring
The impact of the MTSP components on air/noise during both construction and
operation is immeasurable on a regional basis. Therefore no monitoring is required.
Again, site specific monitoring is covered in the EIS.
13.6.3 Effluent and Water Quality Monitoring Strategy
Construction Phase
During construction, impact on the water occurs mainly through runoff, leaks and
accidental spillage. REMS monitoring will only focus on the general condition of the
ambient waters that may be affected by the construction.
Because Suspended Solids is one of the recommended monitoring parameters,
these construction impacts will be monitored on a regional and ambient basis by
default. The impacts are expected to be immeasurable on a regional scale.
Again, this site specific monitoring is covered in the EIS.
Operation Phase
· Sludge/Septage Monitoring
Sludge and septage produced from each treatment plant shall be tested for heavy
metals. Samples have to be taken at least once a week at septic tanks.
During operations, all wastewater from the Sewage and Septage Treatment Plants
will be monitored before discharge. Discharge points such as a settling pond are also
DRAFT
13-7
9:42 AM 02/09/05
Regional Environmental Assessment
known at this stage. The operating condition of the outfall discharge system is
designed to be inspected and maintained regularly.
Again, this site specific monitoring is covered in the EIS and is not part of REMS.
13.6.4 Groundwater Monitoring
This aims to observe the short- and long-term impacts on the groundwater. Wells for
sampling will be identified and monitored. The main purpose is to prevent adverse
impacts to the water supply of the community. This program shall be carried out at
least once every quarter by MWCI.
The parameters to be monitored are presented in the EmoP in the EIS as the lahar-
affected areas are outside the defined Region for this REA.
13.6.5 Surface Water Ambient Monitoring
This is the key aspect of the REMS and is addressed at the end of this section in
Attachment 4
As background, the present water quality and ecological monitoring data for the main
river systems in the Region has been reviewed, and demonstrated to have low
statistical validity. Therefore any future monitoring program must be modified to aim
for a valid data set. Otherwise there will not be any statistically valid data for trend
analysis, that is, a scientifically valid comparison of data to demonstrate a statistically
significant trend in improving water quality and ecosystems.
Without this statistically valid data set, there is no way to determine the direct
environmental benefits of the MTSP.
13.6.6 Socio-Economic Monitoring
Health Issues.
The remediation of drains which are combined sewers in terms of covers or sealing
will reduce community morbidity. Determining the community health improvements
on a quantitative basis would require a major epidemiological survey. The causal
link between covering and repairing combined sewers and health improvements
would be very difficult, unless there is a specific waterborne disease outbreak.
Therefore the health improvements will have to be determined qualitatively through
the community health centres, LGU staff and DoH. No specific monitoring is
required for the REA, just interpretation of the data already being collated by others
on an ongoing basis.
Tourism
The Department of Tourism, as per their mandate will monitor any increase in
tourism activities in the Region. Again it will be difficult to quantify any causal link
between improved ecological status in the Region and tourism numbers and
expenditure. However it is well known that polluted environments discourage
tourism and any regional ecological improvements will result in tourism increases.
The DoT is charged with monitoring the tourism impacts of such improvements.
DRAFT
13-8
9:42 AM 02/09/05
Regional Environmental Assessment
No specific monitoring is required for the REA, just interpretation of the data already
being collated by others on an ongoing basis.
Fishery Production
The Bureau of Fisheries and Aquatic Resources is responsible for monitoring the
commercial fish yields in the Region. Any improvements in water quality will result in
improved fish yields and the attendant economic improvements.
No specific monitoring is required for the REA, just interpretation of the data already
being collated by others on an ongoing basis.
Property Values
The LGUs will assess the improved property values as part of their tax collection and
rating system. These details will allow a comparison with the previous property
values prior to the MTSP improvements.
No specific monitoring is required for the REA, just interpretation of the data already
being collated by others on an ongoing basis.
13.6.7 Financial Guarantee Mechanisms
As part of the environmental management strategy, project proponents shall put up
financial guarantee mechanisms to finance the needs to conduct monitoring,
emergency response, clean-up or rehabilitation of areas that may be damaged
during the actual project implementation.
No specific monitoring is required for the REA, just interpretation of the data already
being collated by others on an ongoing basis.
Again this is covered in the EIS.
13.7 REMS Summary
13.7.1 Components
The actual management and monitoring required for the REMS is as follows;
· Primary ambient water quality and ecological monitoring. This is by far the
biggest component and is described in Attachment 4.
· Review and economic interpretation of secondary data on health, fisheries,
property valuation, etc. The actual monitoring is to be done by others as
part of their ongoing charter
· Driving the institutional structural and implementation changes required
There is no site-specific monitoring or management plans as these are presented in
the EIS as component-specific requirements, not Regional.
13.7.2 Costs
The pilot water quality and ecological monitoring study would cost approximately
P2.5M if undertaken by an agency such as DENR, and the ongoing baseline would
cost about P0.75M a year. This cost includes an allowance for hiring staff on a
monthly basis but not for a profit component if undertaken by a private consultant or
organisation.
DRAFT
13-9
9:42 AM 02/09/05
Regional Environmental Assessment
The cost of the institutional management components is as follows;
Ř Relative Priority of Wastewater Services
- IEC costing P5M
Ř Connection to Public Sewerage Systems
- no direct cost
Ř Project Financing
- TA grant of P10M
Ř Low Willingness to Pay and the Lack of Sanctions
- no direct cost
Ř Monitoring of Compliance to Existing Laws
- Institutional study P10M
Ř MTSP Impacts on Existing Private Septage Haulers
- GEF funded
Ř IEC on Health Impacts of Wastewater
- IEC costing P5M
DRAFT
13-10
9:42 AM 02/09/05
Regional Environmental Assessment
Attachment 1
Construction Contractor's Program
The management of the MTSP commits to environmental enhancement and
incorporates environmental policies particularly on health and safety aspects into the
management practices of the project. A memorandum of agreement between the
proponent and its contractor will be executed indicating the contractor's commitment
in mitigating the negative impacts during the construction. The agreement will
clearly define the different responsibilities but are not limited to the following:
Provision of construction markers and signages. During the construction phase
when earth-moving activities are undertaken, markers aimed at warning people
against going into or near the construction site should be installed. The markers
should prevent accidents caused by moving machines and altered terrain.
Disposal of construction spoils. Unused materials should be disposed off in a
designated area where there is no chance of being carried away by surface
runoff either into the low-lying areas of the project site or into the drainage
system.
Daily watering of all exposed areas. The contractor should sprinkle all exposed
areas as deemed necessary to minimize fugitive dust
Covering of hauling trucks. During construction, all trucks hauling gravel, sand
and other loose materials must be covered with tarpaulin or canvas to prevent
accidental spills or dust dispersion during transport.
Proper waste disposal in workers campsite. The contractor will be responsible
for the safe and regular disposal of all solid and liquid wastes at the temporary
workers camp site.
Implementation of erosion control measures. The contractor should initiate
erosion control measures before major earthmoving begins.
Adherence to company guidelines. The contractor should strictly follow the
company guidelines during the construction period. Project proponent should
conduct an orientation and discussed the environmental and safety policy of the
company.
Demobilization. Upon the completion of the project, the contractor will take care
of the disposal of all debris and waste materials into a designated area The
contractor should ensure that the temporary campsite be restored to its original
environmental condition.
Ensure all machineries are in good running condition. Well-maintained engines
produce lesser fumes and emissions. Machines that generate excessive noise
should be fitted with silencers.
Construction workers should be equipped with proper clothing and protective
devices (hard hats, steel-toe shoes, hand gloves, etc.)
DRAFT
13-11
9:42 AM 02/09/05
Regional Environmental Assessment
Attachment 2
SEPTAGE MANAGEMENT PLAN
MWCI in the implementation of each project component shall adopt a septage
management program to prevent, if not, minimize the environment impacts
associated with the collection and disposal of septage. The septage management
program at least, includes the following health and safety practices and measures:
The design of the collection vehicles should conform to approved specifications
(including that required by the RA 6969 for the transport permit) that would eliminate
spills and odor emissions during the collection and transport of septage.
Any spills resulting from the removal of septage from septic tanks must be cleaned
immediately with clean water and disinfectant.
Collection vehicles should be checked periodically for any leaks. The engine should
be maintained regularly to ensure perfect running conditions. Well-kept engines will
have efficient fuel consumption, lesser fume emissions and will last its life span.
Major breakdowns while on the road can also be prevented through proper
maintenance.
Collection workers of garbage should be provided with Personal Protective
Equipment (PPEs).
Proper scheduling of trips to and from the treatment plant should be implemented to
avoid traffic congestion. Access roads to the treatment plant should accommodate
the collection vehicles.
Water from the septage dewatering equipment will be treated in aerated lagoons and
stabilization ponds. The effluent wastewater from the stabilization ponds will meet
the standards set by the DENR. The sludge produced from the dewatering process
will be disposed to the lahar-covered areas as soil conditioner or to an identified
landfill.
DRAFT
13-12
9:42 AM 02/09/05
Regional Environmental Assessment
Attachment 3
CONTINGENCY RESPONSE PLAN
A Contingency Plan shall be established by the proponent in order to define what
actions are to be made in preventing the occurrence of accidents or what emergency
procedure are to be followed in case accidents, fire and natural hazards occur. The
most common risks associated with the operation of the treatment plant are as
follows:
Ř Injury during machine operation
Ř Fire
Ř Falling
Ř Exposure to pathogens
A contingency plan such as, but not limited to the following shall be considered:
Ř Provision of emergency shower/wash station
Ř Availability of certified emergency personnel
Ř Working emergency policies/procedures
The proponent through its vision shall subscribe to an active program of pursuing a
healthy, safe and environment-friendly operation.
Company guidelines on health and safety will be made clear to contractors and all
employees during construction and operations. An orientation briefing for contractors
may be implemented.
DRAFT
13-13
9:42 AM 02/09/05
Regional Environmental Assessment
Attachment 4
Water Quality and Ecosystem Monitoring
13.8 Background to Water Quality and Ecosystem Monitoring
13.8.1 Background
The present water quality and ecological monitoring data for the main river systems
has been demonstrated to have low statistical validity. Therefore any future
monitoring program must be modified to aim for a valid data set. Otherwise there
will not be any statistically valid data for trend analysis, that is, a scientifically valid
comparison of data to demonstrate a statistically significant trend in improving water
quality and ecosystems.
Without this statistically valid data set, there is no way to determine the direct
environmental benefits of the MTSP.
13.8.2 Monitoring Program Aims
There are two critical questions that must then be addressed when establishing a
new water quality or ecological monitoring program, as follows.
Ř what level of acceptable change will the water quality managers be willing to
adopt for each parameter
Ř what level of confidence do the managers want for the monitoring program
results to be capable of detecting the adopted level of change
13.8.3 Level of Acceptable Change
The first question is what level of change will the water quality managers be willing to
accept. This means that if the results of the most recent survey are compared with
the historical data for a water body, what percentage change will the water quality
managers be willing to accept? Traditionally an acceptable level of change is often
20%. For example, this can be either a 20% decrease in Dissolved Oxygen or a
20% increase in primary productivity.
This is a significant level of change for some parameters such as total nitrogen but is
a very conservative level of change for other parameters such as salinity. For
example, a 10% increase in total nitrogen can have major ecological impacts on
coral reef systems in terms of elevated algal activity smothering and possibly
destroying the coral reef. However a 50% change in salinity will have little impact on
estuarine motile species, which are adapted to change in salinity associated with
tidal events and also run off events. Therefore each parameter may have different
Levels of Acceptable Change. The LOAC may be regularly revised as a better
understanding of the ecological sensitivities to various parameters is derived.
13.8.4 Statistical Level Of Confidence
The second question is what level of confidence does the system managers wish to
have in the data set that it can detect the adopted level of change.
DRAFT
13-14
9:42 AM 02/09/05
Regional Environmental Assessment
In a perfect system, the aim would be for 100% confidence but this is statistically
impossible given the natural variation of water and ecological systems. A more
common level of confidence is 80% for large data sets and as low as 60% for
smaller data sets or pilot monitoring programs. The LOC may also be regularly
revised as a better understanding of the ecological sensitivities to various
parameters is derived.
13.8.5 Adopted Values for Base Monitoring Program
A typical default setting for new monitoring programs would be 20% LOAC and 60%
for LOC.
The monitoring program must therefore be reviewed at least annually to see if it
achieves these statistical targets.
Once the program is well established, then the LOAC's for individual parameters
may be varied as well as the LOC requirements. This fine-tuning is inappropriate at
this stage however.
13.8.6 Water Quality and Ecosystem Pilot Monitoring Program
A pilot-monitoring program will be required to determine issues such as:
System variability. If the selected site has too much variability to allow a
reasonable level of statistical confidence to be derived without excessive
sampling costs, then this is a trigger to try a different site or monitoring
procedure, such as a long-term bioassay rather than individual grab samples.
Most representative sites. It may be better to concentrate on specific highly
sensitivity areas rather than allocate precious monitoring resources to less critical
reaches of the Pasig River system. The sections of similar water and ecosystem
integrity may be represented by only one or two sampling locations that will
provide a long-term trend data on the entire reach. If this site indicates that a
water quality or ecosystem change is occurring in this reach, then more intensive
sampling would be implemented.
Once the pilot monitoring program has run for some months, then the data should be
statistically reviewed and the full monitoring program finalised and implemented.
Results from the full monitoring program must also be reviewed regularly to allow the
data set validity to be enumerated and allow any fine tuning of the program overall.
There will be a need for some pilot replication work in this case, as the present data
does not contain replication to assess within site variability and duplication of
sampling sites.
13.8.7 Types of Monitoring Program
Allocation of sampling effort, duration of sampling techniques and types of analysis
will be affected by the type of study desired, as described below.
Ř Reconnaissance - to identify what issues are of concern in a particular area or
the scope or extent of existing problems or to collect sufficient data to allow the
design of further studies; generally diverse in the indicators chosen and
intensive in sampling frequency; serves to elucidate local processes, which
helps in interpretation of subsequent results. This is considered appropriate
DRAFT
13-15
9:42 AM 02/09/05
Regional Environmental Assessment
just for determining replication requirements and the possibility of
reducing the number of sampling sites, as a pilot program.
Ř Impact studies - to determine a particular land use had adversely affected
water quality. Impacts may be inferred from changes over time, from change
over space (upstream versus downstream) or from a combination of both. This
is the type of survey that assesses if the MTSP actions are reducing the
impact of specific pollution sources.
Ř Short-term operational study - to examine the effect of a particular accidental
release or other specific problem. Indicators set specifically according to the
nature of the problems and sites may move with pollutants, particularly if
tracking a slug release downstream. May lead to long term monitoring if impacts
are suspected.
Ř Compliance Study - to ensure that emissions meet license requirements.
Indicators chosen to reflect license or permit requirements. This is another
type of survey that MWCI or the RO of MWSS will implement
Ř Long Term/ Trend Study - to detect trends over time. Techniques must be
consistent or overlapping, calibration study must be done if techniques are to be
changed. This should be the fundamental basis of the base survey.
13.8.8 Data Review - Power Analysis
After the first 12 months of the Pilot program, the data must be reviewed. This also
applies to all monitoring programs, which must be reviewed statistically at least each
year to:
Ř Assess whether the Level of Acceptable Change (LOAC) and Level of
Confidence (LOC) aims are being achieved
Ř Assess whether some sites are redundant
Ř Assess whether replication levels need adjustment
Ř Assess whether some criteria need revision as the knowledge base on the river
and the ecological responses improves over time
A series of statistical reviews could firstly be undertaken on the data sets available.
It is common if accessing a lot of data sets to use a notched box analysis firstly then
a more detailed analysis for any datasets that looked promising.
One possible detailed method is a power analysis. "Power analysis" is the term used
to describe statistics that examine monitoring program efficiency rather than the
actual findings of a program. While not being a new field of statistics, power analysis
has only come into common use in the last few years. Most environmental managers
have not encountered it, many texts do not address it adequately and most computer
analysis packages do not offer power analysis as standard features.
Given the large levels of effort and resources now committed to this water quality-
monitoring program, it is imperative that power analysis and/or other complementary
statistical reviews are regularly implemented.
DRAFT
13-16
9:42 AM 02/09/05
Regional Environmental Assessment
13.8.9 Geographical Extent of Survey
Patterns of land use practice, environmental gradients and catchment properties
varying over larger geographic areas will necessitate changes to sample collection
and study design.
At its simplest, characterization of gross water quality in a particular catchment would
be best accomplished by a single monitoring station located at a downstream site in
the catchment/s. If the monitoring program aims to detect impacts to water quality,
then it is appropriate to replicate these sites according to the desired degree of
spatial change to be detected. If pollutant sources within the catchment were
suspected, then it would be appropriate to establish multiple sites upstream and
downstream of suspected efficient discharge point. Location of these sites would
depend upon the confluence points of various tributaries as well as mixing processes
likely to occur in the water column downstream of discharge points.
With a large number of identified and unknown emission sites into the river, then
sampling sites should be located at the control locations, namely;
Ř upstream control/s
Ř downstream control
Ř near confluences of major tributaries
Based on this, the DENR Central's nine sites represent a sensible starting grid for
the pilot program.
Pilot (reconnaissance) data on water quality at these sites over a representative
period (could be as much as several years in the case of these seasonally varying
parameters) allow validation of site selection, and level of replication required. Sites
are tested for similarities and removed if they result in unnecessary duplication.
Further sites should be added in areas not well represented.
13.8.10
Sampling Frequency
The frequency must be planned to enable detection of anticipated periodically in the
environment. Cyclical changes should be sampled at least twice (if maxima and
minima are known) in every cycle. Occasional or unpredictable discharges may
need to be sampled regularly or continuously if they are to be detected.
Based on this, monthly sampling would be appropriate for the key parameters for
long-term trend analysis.
Quarterly sampling (2 in dry season, 2 in wet season) for selected parameters, such
as toxins and TPH (initially) in sediments.
The saline recovery in the estuary will require more intensive monitoring but this may
be best accomplished by LLDA or the use of in-situ probes which are semi-
permanently installed and connected to data loggers.
13.8.11
Ambient Water Quality Data Quality Assurance
Appropriate systems must be put in place to ensure that data is subject to analysis to
ensure validity, prior to incorporating the field and laboratory results into the main
database.
This would include issues such as;
DRAFT
13-17
9:42 AM 02/09/05
Regional Environmental Assessment
1) regular calibration of field and laboratory equipment,
2) training of field staff,
3) field and laboratory note-taking procedures,
4) transcription error minimization,
5) data entry validation,
6) laboratory accreditation
7) use of split, blank and spiked samples, and
8) ongoing exploratory statistical tests of the raw data.
13.8.12
Control Sites or River System
Measures of change are typically made against control sites and in order to detect
change selection of control sites is critical. In one sense, the samples collected in
the pilot study and used to determine the optimum number of samples at each
station, can also form the "before" samples. These are the benchmarks against
which we wish to measure change, either for the better or worse, over subsequent
sampling periods.
However, as natural variations in many parameters also have some impact upon the
parameters that are being used as indicators, then the ideal study design includes
before and after controls on the system of interest, and a similar suite of control
stations on another similar system.
The ideal control system is one which is similar in all respects to the Pasig River and
tributaries such as Laguna Lake, San Juan River, etc, but in a much healthier state,
allowing comparisons with a healthy system.
On the other hand, if such a system cannot be found, then one as equally degraded
as the Pasig can be used to determine whether the Pasig improves, deteriorates, or
remains the same in terms of the adopted parameters.
The proposed program will work in situations where there are no controls but that
is to detect impact. The aim in this program is to detect impact, and then monitor to
detect change.
Therefore consideration should be given to selecting a comparison or control river
(either relatively pristine or equally heavily polluted as the Pasig River), but this will
be contingent upon budgetary constraints. Once the pilot program data is analysed,
it may be possible to reduce the number of sites being monitored within the Region
and allocate some of the funds saved to monitoring a control river system. The use
of the Marakina site for a control is a possibility but the decision will have to await the
results of the pilot monitoring program.
13.9 Recommended Water Quality and Ecological Monitoring Program
13.9.1 Water Quality and Ecological Monitoring Priorities
The fundable extent of the monitoring program is obviously finite. However the
recommendations below are for a program that will provide a good understanding of
the water quality and ecology of the Pasig River and tributary systems. Funding
limitations may mean that some elements of the recommended program have to be
stalled, but the priority elements are identified below. However, when the budget is
developed, it should be recognised that there will be substantial savings resulting
DRAFT
13-18
9:42 AM 02/09/05
Regional Environmental Assessment
from the aggregation of the three present programs. These savings will allow the
basic requirements of the following program recommendations to be implemented,
such as gathering the in-situ data and funding laboratory tests for the water column
samples.
If additional funding is available, then the additional work recommended, especially
for the pilot monitoring program, should be implemented. The pilot program will not
only provide essential data to focus the ongoing base monitoring program, but also
allows some ecological and health risk aspects to be identified prior to the full
implementation of the MTSP programs. In other words, the pilot program will also
supply essential baseline data for parameters that will only require reassessment
every 5 years or so. Survey components relating to sediments, macro-biota and
possibly benthos studies may come under this category.
The parameters are listed in order of reducing priority as follows;
Ř In-situs
Ř Laboratory tests - water column
Ř Laboratory tests sediments
Ř Benthos
Ř Macro-biota
There may be a need to reduce the nutrient data gathering (Laboratory tests - water
column) and possibly other parameters for the ongoing monitoring program but the
full suite as recommended should be undertaken for the pilot program.
Once the river exhibits general water quality improvement, then the ecological or
bioassay parameters should commence, such as primary productivity and nutrient
limitation tests.
There is also a recommendation for a control river to be monitored as well, which will
allow the global ecological drivers to be identified and partitioned from the changes
due to DENR management efforts on the Region. The parallel monitoring of a
control river is desirable, but the implementation of such a control program will
clearly be sensitive to budget limitations.
13.9.2 Water Quality and Ecological Pilot Program Year one
13.9.2.1 In-Situs
Ř Adopt the 9 DENR Central sites
Ř Monthly sampling
Ř Three (3) replicates of all in-situ tests
Ř In-situs to be done at 0.5m from the top and bottom in the water column, except
Secchi Disc;
- Depth
- Temp
- DO % sat'n
- Conductivity/salinity
- pH
- ORP/Redox
- Turbidity
- Secchi Disc
DRAFT
13-19
9:42 AM 02/09/05
Regional Environmental Assessment
13.9.2.2 Laboratory Tests Water Column
Ř Quarterly 2 in wet season, 2 in dry season
Ř 3 replicates
Ř 5 sites only (1,4,6,7,8)
Ř Total N, Total P, DIN, DIP , CHL-a
Ř TSS,
Ř Faecal Coliforms
13.9.2.3 Laboratory Tests Sediments
Ř Quarterly 2 in wet season, 2 in dry season
Ř 3 replicates
Ř 5 sites only (1,4,6,7,8)
Ř TPH
Ř HMs (Cd, Cr, Cu, Ni, Pb, Zn, Hg)
Ř Organochlorine pesticides
Ř Organophosphate pesticides
13.9.2.4 Benthos
Ř Sampling: twice per year.
Ř Two locations one in lower estuary, one in upper estuary. Actual sites will
depend upon the substrate at the time of sampling.
Ř At each location two stations
Ř At each station 10 replicates. Each replicate is a 0.010m Van Veen grab, sieved
through 1mm mesh, and all fauna is identified to family level.
If a control river is adopted, the for the Control River
Ř Sampling: twice per year.
Ř Two locations one in lower estuary, one in upper estuary.
Ř At each location two stations
Ř At each station 10 replicates
Each replicate is a 0.010m Van Veen grab, sieved through 1mm mesh, and all fauna
is identified to family level.
13.9.2.5 Macro-Biota
Ř Quarterly 2 in wet season, 2 in dry season
Ř 5 sites only (1,4,6,7,8)
Ř Fish and Bivalve - tissue analysis for pathogens and toxins
13.9.3 Statistical Review
Ř Undertake Power Analysis and/or other tests as appropriate to assess
- Replication requirements
- Site redundancy or relocation if data is still too variable
- LOC achieved for the adopted LOAC
Ř Modify program, and assess if further Pilot program work is required
Ř Assess if a control site/river is required.
DRAFT
13-20
9:42 AM 02/09/05
Regional Environmental Assessment
13.9.4 Water Quality Pilot Program If required to extend beyond Year 1
13.9.4.1 In-Situs
Ř Adopt the number of sites based on the statistical review
Ř Monthly sampling, unless the statistical review recommends otherwise
Ř Replicates as per statistical review
Ř In-situs to be done at top and bottom in the water column, except Secchi Disc;
- Depth
- Temp
- DO % sat'n
- Conductivity/salinity
- pH
- ORP/Redox
- Turbidity
- Secchi Disc
13.9.4.2 Laboratory Tests Water Column
Ř All are subject to the results of the statistical review
Ř Quarterly 2 in wet season, 2 in dry season
Ř 3 replicates
Ř 5 sites only (1,4,6,7,8)
Ř Total N, Total P, DIN, DIP , CHL-a
13.9.4.3 Laboratory Tests Sediments
Ř All are subject to the results of the statistical review and comparison with agreed
criteria, such as the Dutch B Investigation Thresholds for Contaminated Sites.
Most likely that these test can be discontinued and repeated in say 5 years
Ř Quarterly 2 in wet season, 2 in dry season
Ř 3 replicates
Ř 5 sites only (1,4,6,7,8)
Ř TPH
Ř HMs (Cd, Cr, Cu, Ni, Pb, Zn, Hg)
Ř Organochlorine pesticides
Ř Organophosphate pesticides
13.9.4.4 Benthos
Ř All are subject to the results of the statistical review. Most likely that these tests
can be discontinued and repeated in say 5 years
Ř Parameters as per the pilot program
13.9.4.5 Macro-Biota
Ř All are subject to the results of the statistical review. Most likely that these tests
can be discontinued and repeated in say 5 years
Ř Quarterly 2 in wet season, 2 in dry season
Ř 5 sites only (1,4,6,7,8)
Ř Fish and Bivalve - tissue analysis for pathogens and toxins
DRAFT
13-21
9:42 AM 02/09/05
Regional Environmental Assessment
13.9.4.6 Statistical Review
Ř Undertake Power Analysis and/or other tests as appropriate to assess
- Replication requirements
- Site redundancy or replacement/amendment
- LOC achieved for the adopted LOAC
Ř Modify program, and assess if further Pilot program work is required or Base
program can commence
Ř Reassess the need for a control river system.
13.9.5 Water Quality and Ecological Base Monitoring Program
13.9.5.1 In-Situs
Ř Adopt the number of sites based on the previous statistical review
Ř Monthly sampling, unless the statistical review recommends otherwise
Ř Number of Replicates as per statistical review
Ř In-situs to be done at the top and bottom in the water column, except Secchi
Disc;
- Depth
- Temp
- DO % sat'n
- Conductivity/salinity
- pH
- ORP/Redox
- Turbidity
- Secchi Disc
13.9.5.2 Laboratory Tests Water Column
Ř All recommendations are nominal and are subject to modification following
review of the results of the statistical review
Ř Quarterly 2 in wet season, 2 in dry season
Ř 3 replicates
Ř 5 sites only (1,4,6,7,8)
Ř Total N, Total P, DIN, DIP , CHL-a
Ř Start quarterly bioassay work on Primary Productivity, nutrient limitation and
perhaps Nitrogen profiling once the ecosystem is exhibiting recovery signs.
13.9.5.3 Laboratory Tests Sediments
Ř All are subject to the results of the statistical review. Most likely that these tests
can be discontinued and repeated say every 5 years
Ř Quarterly 2 in wet season, 2 in dry season
Ř 3 replicates
Ř 5 sites only (1,4,6,7,8)
Ř TPH
Ř HMs (Cd, Cr, Cu, Ni, Pb, Zn, Hg)
Ř Organochlorine pesticides
Ř Organophosphate pesticides
DRAFT
13-22
9:42 AM 02/09/05
Regional Environmental Assessment
13.9.5.4 Benthos
Ř All are subject to the results of the statistical review, including the number of
replicates. Most likely that these test can be discontinued and repeated say
every 5 years
Ř Sampling: twice per year.
Ř Two locations one in lower estuary, one in upper estuary. Actual sites will
depend upon the substrate at the time of sampling.
Ř At each location two stations
Ř At each station 10 replicates. Each replicate is a 0.010m Van Veen grab, sieved
through 1mm mesh, and all fauna is identified to family level.
If a control river is adopted, the for the Control River
Ř Sampling: twice per year.
Ř Two locations one in lower estuary, one in upper estuary.
Ř At each location two stations
Ř At each station 10 replicates. Each replicate is a 0.010m Van Veen grab, sieved
through 1mm mesh, and all fauna is identified to family level.
13.9.5.5 Macro-Biota
Ř All are subject to the results of the statistical review. Most likely that these tests
can be discontinued and repeated say every 5 years
Ř Quarterly 2 in wet season, 2 in dry season
Ř 5 sites only (1,4,6,7,8)
Ř Fish and Bivalve - tissue analysis for pathogens and toxins
13.9.5.6 Data Review and Additional Surveys
Ř Undertake Power Analysis and/or other tests as appropriate at least annually to
assess
- Replication requirements
- Site redundancy or relocation/amendment
- LOC for adopted LOAC
- Need for additional or different parameters, such as bioassays or more
complete benthos surveys to species levels. This will require specialist input
and support from a number of sources such as commercial laboratories,
other DENR labs and possibly universities or museums.
Ř Modify program, and assess if either a Pilot or Operational Monitoring program
is required. Options may include;
- diurnal in-situ program for modelling reasons
- salinity recovery along the estuary, using moored in-situ meters
Ř Reassess the need for a control river or site
13.9.6 Criteria Review
As part of the data review, the various parameters would be examined to assess
whether the adopted criteria required adjustment.
For example, the adopted Nitrogen levels may allow a level of primary productivity
that is ecologically unsustainable. Part of the annual review must involve not only
statistics but also inter-criteria comparisons to detect if any criteria require
amendment. This is a common outcome of ongoing monitoring programs where
DRAFT
13-23
9:42 AM 02/09/05
Regional Environmental Assessment
locally specific criteria are developed over time to reflect local ecological conditions
rather than generic criteria adopted for a region or even a country.
This review may also extend to adding new criteria such as quantitative primary
productivity levels or setting criteria for heavy metals in river sediment.
13.9.7 Costs
The pilot study would cost approximately P2.5M if undertaken by a non-profit agency
such as DENR, and the ongoing baseline would cost about P0.75 a year.
13.9.8 Community Water Quality Monitoring Programs
Once sufficient base data has been obtained and a clear improvement in regional
ecological status has been confirmed, it may be appropriate to introduce monitoring
programs into the curricula of schools and colleges.
This is common internationally, with a theme of "Adopt a Section of a River".
Students would use school equipment to record basic parameters, generally just in-
situ parameters. The data cannot be QA/QC verified, so it should not be used for
trend analysis but can be afforded qualitative importance. The DENR would arrange
to meet the classes and collect the data, discuss what it means and how it correlates
with the main monitoring results or the data from neighbouring schools. The main
aim is community support for the DENR ideals rather than quantitative data
collection.
However as the quality improves further, some bioassay work can be completed by
community groups such as sea grass depth range if the seagrass meadows actually
return.
DRAFT
13-24
9:42 AM 02/09/05
Regional Environmental Assessment
14 Conclusions and Recommendations
14.1 Conclusions
Presently, less than 8% of the Metro Manila population is served by sewerage
systems. These systems are localized in Makati, Quezon City and the Central
Manila area. Some 85% of the population relies on individual septic tanks, most of
which are improperly designed and ill maintained. The sullage usually flows directly
out of the IST into local drains. There is insufficient land to incorporate sullage
soakage trenches. At the moment, there is no facility for proper septage treatment
and disposal. The remainder of the population resorts to pits and latrines while a
significant number has no access to even basic sanitation facilities.
The two main rivers in the metropolis Marikina River and Pasig River, have been
pronounced biologically dead. The Pasig River, once renowned for its pristine
waters and aquatic resources, is now one of the world's most polluted river systems
with dissolved oxygen levels in the central reaches dropping to near zero for most of
the year. Faecal coliform levels exceed standards of the Department of Environment
and Natural Resources (DENR) and international standards by several orders of
magnitude.
This demonstrates that the present socio-environmental status of pollution has major
negative economic impacts, to the extent of some P67 billion a year. Given that the
most polluted region of the country is the NCR, it may be expected that a significant
portion of the economic losses would impact upon the NCR.
To further increase the need for some interventions, the region's population is
increasing rapidly, and this will result in increasing pollution load, unless interventions
are initiated.
As a result, the Manila Third Sewerage Project (MTSP) is being proposed by Manila
Water Company Inc. (MWCI) in response to a range of these forcing functions, such
as socio-environmental pressures and Concessionaire Agreements specifying the
sewerage and sanitation targets required under the concession. The MWCI has the
concession for the eastern half on Metro Manila, and Maynilad Water (MWSI) the
western concession.
Because the MWCI concession area is only part of the Metro Manila area, a
Regional Environmental Assessment (REA) has been prepared to assess if the
investment proposed integrates with the MWCI/ MWSI overall investment strategy
and environmental management plans. The REA also facilities a strategic
assessment of the options available. The REA has been structured to;
Ř develop the REA details,
Ř lead into an options review,
Ř refine the options into a coordinated project (the MTSP),
Ř consider the institutional issues,
Ř assess the impacts, both negative and positive, of the adopted project, and
Ř develop an appropriate EMS and recommend institutional improvements.
DRAFT
14-1
9:42 AM 02/09/05
Regional Environmental Assessment
In terms of baseline conditions, the key issue for which is there are large datasets
are water quality and ecosystems. The water quality data has been reviewed and
statistically analysed.
The data also demonstrates high levels of inter-annual variability. This means that
the present dataset cannot be used for trend interpretations based on just using one
years data. This also means that any proposed monitoring program must be run for
a number of years before making statistical interpretations of the possible trends.
The overall conclusion is that the existing monitoring programs have some utility but
are insufficient to be able to detect trends in water quality and ecosystem recovery at
a suitable level of confidence for the adopted level of acceptable change in the
future. Therefore a more comprehensive monitoring program is still required to
statistically determine present water quality conditions, and allow valid comparisons
with future monitoring to assess improvements or otherwise. This presented in the
Regional Environmental Management System.
The assessment of the policy, legal, and administrative framework of the sanitation
and sewerage management system in Metro Manila yields several issues which
need to be addressed.
The existing wastewater, environment and health management legislation is too
complex, overlapping and unclear not just in terms of basic laws, but also in terms of
the devolution status. A number of obligations have been devolved from one agency
to another and eventually to the LGU in some cases, but without a clear mandate or
operational guidelines.
A range of generic wastewater collection and management options have been
reviewed. It was confirmed that onsite treatment and disposal or reuse is
unsustainable because of small lot sizes and use of groundwater as a water supply.
Similarly the higher technology options of indirect and direct potable reuse are
unaffordable at the present time. Effluent irrigation was also dismissed because of
cost reasons.
Given the very small percentage of sewerage coverage in Metro Manila, and the high
population density, the usual strategy in these circumstances would be to sewer all
of the Region as soon as possible. This would be practical in less densely
developed urban areas, but only where;
Ř a large sinking fund has historically been established to fund the large capital
expenditure required,
Ř the infrastructure can be installed with community support and forbearance
Ř the population will connect to the sewer system, and
Ř the householders will consistntly pay the tariff for wastewater management.
However in this case, the present low percentage of sewerage coverage in the Zone,
together with the required capital and operating cost requirements, and social issues
such as lack of community support and household affordability, precludes adoption
of an immediate global sewerage and treatment strategy. Some less densely
populated areas in the zone can be sewered and have the wastewater directed to
new sewage treatment plants in these catchments, but this will only account for a
small portion of the zone's customers.
Therefore, in the medium term at least, ISTs will be part of the east zone's
wastewater management systems into the future. Septic systems only work
DRAFT
14-2
9:42 AM 02/09/05
Regional Environmental Assessment
efficiently when the tanks are regularly desludged. This prevents excessive solids
carrying over with the sullage. These solids carry large quantities of pathogens
(disease causing organisms), have high organic loads and can cause downstream
pipework blockages. A priority must therefore be to maintain the operation of these
septic tanks to minimise both health and environmental impacts.
Once a fleet of collection vehicles is established, there will be a need for septage
treatment and/or disposal facilities. The present independent tanker operators are
most likely dumping their septage illegally for example. A network of septage
treatment plants is therefore required as a minimum. The resulting sludge will then
require disposal either at an approved landfill or land applied. In addition,
opportunities for productive reuse of the raw septage are available, such as applying
the organically rich septage to poor agricultural soils, especially the lahar affected
areas to the North of the Region.
Locally, sullage is usually simply discharged into stormwater drains. Some of these
are open drains, which allows physical contact by the community with the untreated
wastewater, with attendant health risks. Usually it is the children involved in this
contact and they represent some of the most susceptible members of the community
to such disease risks. This health risk is exacerbated if the septic tank has not been
maintained and biological solids are carrying over.
Morbidity data are presented elsewhere in this report indicating significant water
borne disease events are not uncommon in Manila. A further priority is therefore to
limit the contact possibilities between sullage and the community. This will require
some drainage repairs and covering of other drains.
The present sanitation system generally has septic tanks without the requisite
soakage tranches or evapotranspiration beds. Therefore the sullage (the ongoing
liquid outflow from septic tanks) is discharged to a stormwater drainage system
rather than disposed of on site or directed to a dedicated sewer. In most countries, a
septic system is environmentally sustainable only when there is sufficient land
associated with the system to allow either infiltration into the soil or
evapotranspiration of sullage. That is, there is no uncontrolled liquid discharge off
the site into drainage systems to pollute the environment. There is no opportunity
locally to provide soakage trenches or evapotranspiration beds because of a lack of
land space in almost every existing site.
Therefore a program is required to either;
Ř sewer these areas and direct the sullage to a sewage treatment plant (or convey
raw sewage to a treatment plant if the septic tank is removed), or
Ř provide an interception system to collect the sullage and other wastewater from
the stormwater drains, and divert the dry weather flows to a sewage treatment
plant
Dedicated sewerage systems are expensive to install, cause disturbance to
roadways and access paths, and may not be used unless the community agrees to
connect to the sewer. Finally, the householders must be willing to continue to pay
their tariffs to fund the operation of the sewerage system. Local experience
indicates that many of these items will not occur.
A second alternative is to install drainage modifications within catchments to divert
dry weather flows in stormwater drains and esteros into purpose-built sewage
treatment plants. This then limits the dry weather discharge of sullage into the local
DRAFT
14-3
9:42 AM 02/09/05
Regional Environmental Assessment
major watercourses. This may apply for both small drainage systems and also larger
drains associated with flood control networks. These are termed combined sewers
and are now allowed under the revised Concession Agreement, but were not allowed
under the original CA. Most environmental impact occurs in the dry season when
there is little diluting flow in the local water bodies, so treating the dry weather flows
of sewage/sullage is still very beneficial environmentally.
Sludges from the septage treatment plants and also the sewage treatment plants as
well as some raw septage will require disposal. The ocean dumping trials were
curtailed and so a new disposal option is required. Appropriate application of these
sludges to poor agricultural soils would improve the soil organic content, water
holding capacity, general fertility and increase the Cation Exchange Capacity.
Suitable environmental studies would be required to demonstrate the sustainability of
such applications supported by management plans for ongoing applications.
In addition to the physical and financial aspects of the sewerage and sanitation
improvements, the up-grades will only be sustainable if the community is educated
about the benefits, and importantly, the requisite need to fund these benefits.
Therefore a project component providing an Information and Education Campaign is
a high priority.
The overall MTSP being proposed has four proposed components:
Ř Sewerage System and Treatment - Involved the expansion of sewer network and
treatment plants at strategic locations within the East-concession area
Ř Septage Management large scale septic tank de-sludging program on the
western section of the service area, namely: Mandaluyong, part of Makati and
Quezon City, Pasig, San Juan, Taguig, Marikina, and Pateros
Ř Technical Assistance will cater to the need for information and education on the
good practices, infrastructure, and benefits from proper sewage management
However this REA predominantly deals with the first two components of the MTSP;
sewerage systems and treatment, and septage management. These two
components will be implemented through six projects listed below:
1) Taguig Sewerage System
2) Riverbanks Sewage Treatment Plants
3) Septage Treatment Plants
4) Sanitation for Low-Income Communities
5) Quezon City-Marikina Sewerage System
6) Upgrade of Existing Sanitation Systems
As part of all six components, a supporting Sludge/Septage disposal and reuse
program is proposed. In summary, the adopted system involves the trucking of
various sludges and septage wastes to the lahar-affected area some 60 km to the
north, as follows;
Ř Liquid sludge from the biological treatment process at treatment plants giving a
volume of 194 m3/day of liquid sludge. This is essentially a liquid at 2 or 3
percent solids.
Ř Dewatered primary sludges from the primary treatment plants at the Taguig
ponds will yield another 48 m3/day.
Ř Dewatered secondary (biological) sludges from the MSSP and MTSP STPs
totalling 127 m3/day.
DRAFT
14-4
9:42 AM 02/09/05
Regional Environmental Assessment
Ř Dewatered unstabilised septage sludge volume of 177 m3/day from the two
MTSP SPTPs, at 25% dry weight.
Ř Dewatered stabilised septage sludge volume of 90 m3/day from the PRRC
SPTP at Antipolo, at 25% dry weight. It is going to be stabilised by lime addition,
at high dose rates of up to 0.5 kilograms of lime per kilogram of solids.
Ř Dried biological sludges amounting to approximately 5 m3/day from the
existing Magallanes STPs.
The total sludge volume to be managed locally every day is therefore 194 m3/day of
liquid sludge to be transported from the STPs to the SPTPs for dewatering. This is a
local transport issue only.
The sludge quantity to be transported to the Pampanga region is approximately 450
m3/day. Because it is a solid, the only option is trucking not pumping. The sludges
will be combined apart from the PRRC sludge and dried sludges which are
stabilised.
A comprehensive public consultation program has been undertaken.
A key issue to note are that only three families require resettlement in the entire
MTSP project. MWCI already has a standard resettlement framework, and a specific
resettlement action plan will be developed for the 3 families prior to resettlement
being required. The very small number of resettlement involved is a direct result of
the component sites being selected which minimise social dislocation.
Consultation has been completed on all components with the exception of the two
sites for SPTP component. Consultation with the adjacent property owners and
residents for the proposed San Mateo Septage Treatment Plant is to be conducted
after agreement has been reached with the property owner on the sale of the land.
In the case of the FTI site, discussion has been had with the Management of the
Complex (FTI) on the use of a portion near the existing treatment facility of the
complex. Consultation is not deemed necessary in the case of the FTI site.
The key issues were typical for a wastewater management strategy relating to costs,
odour, lack of knowledge of the environmental and health impacts of poor sanitation
or sewerage, traffic impacts and disruption during construction, flooding impacts or
benefits and so on.
In assessing the cumulative impacts, the No Project options has been considered. In
this option, there would be no interventions in the present state of sanitation,
sewerage and wastewater management. The present socio-environmental
conditions in the Region are very poor, with demonstrated economic impacts.
The population in the east zone Concession Area is predicted to increase from 5.3
million persons to 8.2 million in 2021. This 60% increase without any improvements
in the standard of sanitation, sewerage and wastewater management will result in
even greater socio-environmental impacts. The impact quantum cannot be predicted
but it would safe to project that, for example, the presently limited periods of
adequate DO in the major river systems would be even further reduced, perhaps
even eliminated.
The health impacts of greater population and population density can only exacerbate
the present health impacts in terms of water borne diseases and associated
environmental costs.
DRAFT
14-5
9:42 AM 02/09/05
Regional Environmental Assessment
The No Project option cannot really be considered as an option, as the present
parlous state of local waterways and associated health and social-economic impacts
are already onerous and will deteriorate even further with the likely 60% population
increase in the Region over the next 16 years.
The MTSP will have net benefits on the Region. Overall benefits include the
following;
Ř reducing the pollution of key Metro Manila waterways
Ř reducing the health hazards associated with human exposure to sewage by drain
covering and effluent disinfection
Ř improved property values along watercourses
Ř improved aesthetics as the water quality improves
Ř improved fish catches
Ř improved tourism
Ř improved soil condition and crop yields in lahar affected areas
Ř providing design and implementation feedback on the combined sewer systems
efficacy and the STP/SPTP designs, in effect a pilot scheme for the many
innovations proposed under MTSP
Ř cessation of uncontrolled dumping of septage from privately owned and operated
tankers
Ř provides a viable alternative to sea dumping of septage/sludge
Ř cessation of the hauling of liquid septage to the lahar affected areas north of the
Region. It is environmentally and financially unsustainable to be hauling so much
water in the non-dewatered septage such a distance and with the attendant
environmental risks associated with accidents and attendant spillages of the
liquid septage
Ř improved institutional implementation of sanitation and sewerage services,
including more clearly defined roles and responsibilities and enforcement, and
Ř elevating the commitment and political will required to improving sanitation,
sewerage and wastewater treatment in the minds of politicians, government
agencies, NGOs, civil society and the general public.
As always there will be some short term localised construction impacts such noise,
dust and traffic interruptions, but these are short term and are very minor compared
with the longer-term benefits.
Essentially the Present Value of economic benefits over the life of MTSP until 2025
is estimated to be P2.7 billion, with Health Benefits and Environment Benefits each
providing some P1.2 billion of this total.
The East Concession Area Master Plan Update (NJS, 2004) has recommended a
strategy of combined sewers and dispersed treatment plants. The MTSP integrates
sensibly with this approach and could be considered as pilot for the implementation
of the Master Plan.
14.2 Recommendations
The key recommendation is that the MTSP components be supported
The second recommendation relates to implementing the Regional Environmental
Management System (REMS) and the institutional components. A REMS has been
prepared for the MTSP. The recommended management and monitoring required for
the REMS is as follows;
DRAFT
14-6
9:42 AM 02/09/05
Regional Environmental Assessment
Ř Primary ambient water quality and ecological monitoring. This is by far the
biggest component and is described in Attachment 4.
Ř Review and economic interpretation of secondary data on health, fisheries,
property valuation, etc. The actual monitoring is to be done by others as part of
their ongoing charter
Ř Driving the institutional structural and implementation changes required
There are no site-specific monitoring or management plans as these items are
presented in the EIS as component specific requirements, not Regional.
The pilot water quality and ecological monitoring study would cost approximately
P2.5M if undertaken by an agency such as DENR, and the ongoing baseline would
cost about P0.75M a year. This cost includes an allowance for hiring staff on a
monthly basis but not for a profit component if undertaken by a private consultant or
organisation.
The cost of the institutional management components is as follows, and should be
funded;
Ř Relative Priority of Wastewater Services
- IEC costing P5M
Ř Connection to Public Sewerage Systems
- no direct cost
Ř Project Financing
- TA grant of P10M
Ř Low Willingness to Pay and the Lack of Sanctions
- no direct cost
Ř Monitoring of Compliance to Existing Laws
- Institutional study P10M
Ř MTSP Impacts on Existing Private Septage Haulers
- GEF funded
Ř IEC on Health Impacts of Wastewater
- IEC costing P5M
DRAFT
14-7
9:42 AM 02/09/05
Regional Environmental Assessment
Appendix A - Baseline Data
This section presents the results of the baseline studies conducted from October to
December 2003 on the physical, biological and socio-economic environmental
conditions of the Manila Water Company, Inc. concession area (from hereon is called
the PROJECT AREA) where the projects enumerated in section __ will be
implemented.
This baseline environmental environmental condition will allow the identification of
environmental issues that can be addressed by the MTSP and serve as the platform
where individual and cumulative impacts will be evaluated.
This section is divided into three sub-sections: i) physical, ii) biological, and the iii)
socio economic condictions that currently exist in the project area.
A.1
Physical Environment
A.1.2 Topography
Figure 6-1 shows the general topography of the area based on 1:50,000 scale
NAMRIA Map. The topography at the project area is generally flat with slopes from <
1% to 3%. Elevation ranges from 5 to 10 meters above mean sea level (masl) along
the Marikina Valley towards Taguig area including Cainta and Taytay and from 10 to
50 masl on the western Guadalupe Plateau (Quezon City, Pasig City, Mandaluyong
City, Makati City). The proposed Northern Septage Treatment Plant at Payatas,
Quezon City lies at about 80 masl.
A.1.3 Geology and Natural Hazards
Geological information was taken from published and unpublished reports including
maps by individuals, government and academic institutions. These are the Mines and
Geosciences Bureau (MGB), the Philippine Institute of Volcanology and Seismology
(PHIVOLCS), and the Department of Public Works and Highways (DPWH) -
Manggahan Floodway Project Office. Topographic maps of scale 1:50,000 from the
National Mapping and Research Information Agency (NAMRIA) were used as base
maps.
DRAFT
A - 1
9:42 AM 02/09/05


14°40'
SAN JUAN RIVER
MARIKINA RIVER
14°35'
PASIG RIVER
MANGGAHAN FLOODWAY
CAINTA RIVER
TAGUIG RIVER
NORTH
1
0
1
2
3 Km.
Graphical Scale
14°30'
121°00'00"
121°05'00"
Legend:
REA Boundary -
Source: NAMRIA
FIGURE NO.
FIGURE TITLE:
The Associated Firm:
EDCOP
6-1
Topographic and Drainage Map of the Project
Lichel Technologies, Inc. and
ISSI
Regional Environmental Assessment
Table 6-1 presents the underlying stratigraphic unit for each project component based
on the location of the treatment facility. Descriptions of the stratigraphic units are
discussed in the following section.
Table 6 - 1.
Stratigraphic Unit Underlying the MTSP Project Components
Project Component
Location
Underlying Stratigraphy
Taguig Sewerage System
Taguig Metro Manila
Quaternary Alluvium
Taytay, Rizal
Cainta, Rizal
Riverbanks Sewerage Treatment
Pasig City
Guadalupe Formation
Plants
Mandaluyong City
Makati City
Septage Treatment Plants
FTI, Taguig, Metro Manila
Guadalupe Formation
Payatas, Quezon City
Low Income Sewerage System
East Manggahan Floodway,
Quaternary Alluvium
Taytay and Cainta, Rizal
Pinagsama Village, Taguig, Metro
Manila
Quezon City Marikina
Marikina City
Quaternary Alluvium
Sewerage System
Upgrade of Existing Sanitation
Quezon City
Guadalupe Formation
Structure
Stratigraphy
Figure 6-2 is the Geological Map of Manila and Quezon City Quadrangle (BMG, 1983).
The following describes the stratigraphic units of the project area:
Guadalupe Formation
The name Guadalupe was used by Smith (in Gonzales et al) to denote the tuff
sequence typically exposed along Pasig River in Guadalupe, Metro Manila. Alvir
(1929) in describing the same tuff sequence in the Angat-Novaliches region referred to
the section as Guadalupe Tuff Formation. Teves and Gonzales (1950) in their work in
the Balara area, Quezon City, included in their Guadalupe Formation, two members:
the lower Alat Conglomerate and the upper Diliman Tuff. The Diliman Tuff is
composed of an almost flat-lying sequence of vitric tuffs and welded volcanic breccias
with subordinate amounts of tuffaceous, fine- to medium-grained sandstone. The
Guadalupe Formation is of Pleistocene Age.
The Guadalupe Formation is exposed in Quezon City, Mandaluyong City, Pasig City
and Makati City (partly). This pyroclastic rock consists of boulders of volcanic rocks
whose interstices are filled up with fine volcanic ash. Thin layers of tuffaceous
sandstone or sandy tuff provide the only reservoir of groundwater.
The Mines and Geosciences Bureau (MGB) (1977) classified this unit as having local
and less productive aquifers with well yields mostly about 2 liters per second (lps) but
as high as 20 lps in some sites. This unit has very low to moderate permeability.
DRAFT
A - 3
9:42 AM 02/09/05
Regional Environmental Assessment
Quaternary Alluvium
The Quaternary Alluvium covers the broad flood plain of the Marikina and Pasig rivers.
It consists of silts, sands and unconsolidated or poorly consolidated or unsorted
pebbles, cobbles, and small boulders. The thickness of the alluvial deposits vary from
15 meters or more in Marikina, to 30-40 meters in Pasig, and to more than 130 meters
farther south (Gervacio, 1968).
Recent Alluvium is deposited along the Marikina Valley at Marikina City, Pasig City, the
municipalities of Taguig and Pateros, and the municipalities of Taytay and Cainta,
Rizal. MGB (1997) classified these unit as having fairly extensive and productive
Aquifer with average annual potential recharge of 0.3 to 0.8 meter; greater near
influent rivers; with known production well yields mostly about 20 lps but as high as 60
lps in some sites. This unit has moderate to high permeability.
Geologic Structure
The prominent geologic structure in the project area is the Valley Fault System (VFS),
which consist of the West Valley Fault (WVF) and the East Valley Fault (EVF). The
VFS is a northeast trending graben structure that bounds the Marikina Valley. The
whole valley is a downthrown block displaced by movements along the West and East
Valley Faults.
Natural Hazards
As a consequence of the country's geographic and geologic location, it is prone to
natural hazards which have to be considered and integrated in on-going and future
development plans. On the basis of geomorphic and geologic study, the project area
is susceptible to seismic and hydrologic hazards.
Seismic Hazards
The hazards directly associated with earthquakes at the project area consist of intense
ground shaking, liquefaction, and liquefaction-induced lateral spreading.
Intense Ground Shaking
In general, the intensity of ground shaking is magnitude-dependent, and gradually
decreases with distance from the source. Difference in ground conditions, however,
may cause deviations from this expected norm, particularly in areas underlain by
recent alluvium.
It has been established that seismic waves are amplified by thicker, poorly
consolidated sediments that translate into greater amount of shaking. Previous
studies and data obtained from borings show that the thickest accumulations of these
fine sediments, exceeding 20 m. and reaching up to 100 m. or more in places,
coincide with the depositional zones of the Pasig River delta plain and the Marikina
alluvial plain. These are particularly true along the coastal areas of Manila, adjacent to
the confluence of the Marikina and Pasig rivers, and the areas north and west of
Laguna de Bay. Thick accumulations of alluvial sediments were also noted along the
present course of the Pasig and Marikina Rivers (PHIVOLCS, 1993).
DRAFT
A - 4
9:42 AM 02/09/05
Regional Environmental Assessment
Of the known major tectonic structures in the region, the nearest earthquake generator
to the project area is the West Valley Fault (see Geologic Map, Figure 6-2). A
paleoseismic study (Nelson and others, 2000) suggests that the fault is capable of
generating earthquakes with magnitudes greater than Ms 6.
Applying the classification scheme of Fukushima and Tanaka (1990), ground condition
at the project area approximate that of soft soils for areas underlain by alluvial deposits
(Quaternary Alluvium), and medium soils for areas underlain by pyroclastics
(Guadalupe Formation).
DRAFT
A - 5
9:42 AM 02/09/05
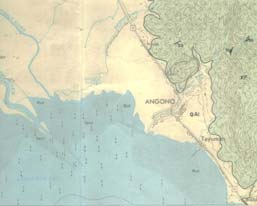
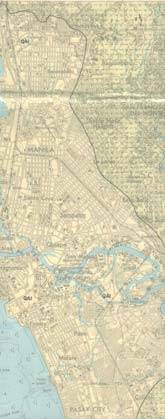
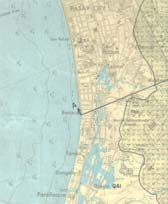
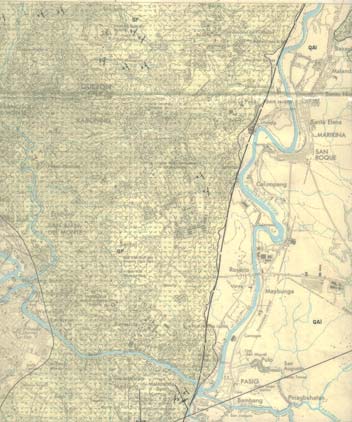
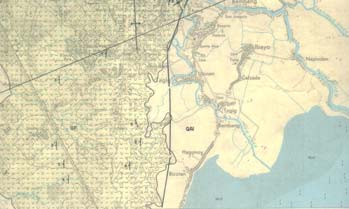
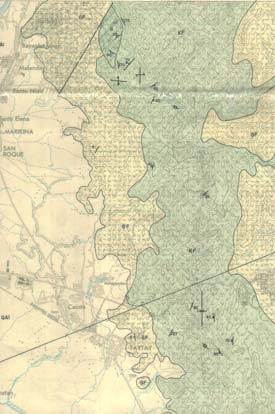
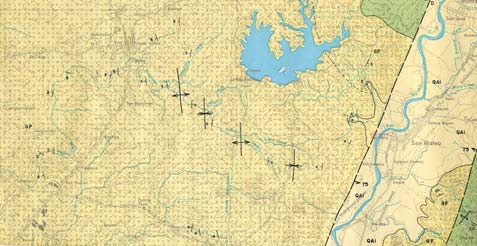
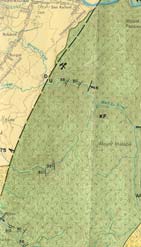
GF
LT
Qal
Quaternary Alluvium. Detrital deposits
KF
Qal
mostly silt, sand and gravel. (Recent)
EAST VALLEY FAU
Guadalupe Formation. Thin to medium bedded,
GF
fine grained vitric tuff and welded volcanic breccia
with subordinate tuffaceous fine to medium grained
sandstone. (Pliestocene)
Kinabuan Formation. Mainly altered spillitic
LT
KF
KF
basalt flows with intercalatd highly indurated
sandstone, shale and chert beds. (Cretaceous)
GF
ST VALLEY FAU
WE
GF
Qal
Qal
Qal
Qal
KF
Legend:
Taguig Sewerage System
GF
Riverbanks STPs
Septage Treatment Plant
Low Income Sewerage System
Camp Atienza Sitio Olanday
Upgrade of Existing Sanitation System
Source: Bureau of Mines and Geo-Sciences, Geologic Map of Manila and Quezon City Quadrangle
FIGURE NO.
FIGURE TITLE:
The Associated Firm:
EDCOP
Geologic Map of the MTSP Area
6-2
Lichel Technologies, Inc.
ISSI
Regional Environmental Assessment
Regional probabilistic estimate of ground shaking intensities were calculated by
Thenhaus and others (1994) based on a hypothetical earthquake with Ms 8.2 and with
10 percent probability of exceedance in 50 years. For any of the possible earthquake
sources in the region, the estimated peak horizontal ground acceleration amplitude
ranges for 0.39g (medium soils) to 0.60g (medium) where g is the acceleration due to
gravity (Figures 6-3 and 6-4).
Liquefaction of Soils
Torres and others (1990) cited at least three sedimentary environments favorable for
liquefaction to take place. These are (1) deltaic, (2) alluvial plain, and (3) sandspit
environment. These conclusions were derived from historical records of liquefaction
including the 1990 earthquake wherein liquefaction occurred in Metro Manila aside
from that in Dagupan City. In all historical cases, the main determinants that influence
an area's susceptibility to liquefaction are mainly (1) grain size, (2) depth of water
table, and (3) thickness of the deposit. It was found that in all cases, the soils were
composed mainly of fine to coarse sand with some clay component. Where the clay
content of the soil was in significant amounts, this was found to inhibit liquefaction.
Similarly, the studies revealed that the critical depth of the water table at which
liquefaction may reach the surface is 2-3 meters in areas where the saturated sand
layer were 2-10 meters thick. Hence, from these data and together with historical and
geological data, a generalized liquefaction hazard map for the Philippines was
generated. Figure 6-5 presents the potential liquefaction-prone areas in Luzon.
In view of the above, the area may possibly experience any one or combinations of the
following liquefaction-related hazards in the event of an earthquake with magnitude
greater than 5.
a) Flow slides or large translational or rotational site failures mobilized by existing
static stresses.
b) Limited lateral spreads of the order of a few centimeters triggered and sustained
by the earthquake ground shaking.
c) Ground settlement and surface manifestation of underlying liquefaction, such as
sand boils.
Liquefaction-induced Lateral Spreading
Liquefaction-induced lateral spreading is defined as the finite, lateral displacement of
gently sloping ground as a result of pore pressure built-up or liquefaction in a shallow
underlying deposit during an earthquake (Raunch, 1997).
As described by Bartlett and Youd (1992), liquefaction-induced lateral spreading
occurs on mild slopes of 0.3 to 5% underlain by loose sands and shallow water table.
Such soil deposits are prone to pore pressure generation, softening, and liquefaction
during large earthquakes. If liquefaction occurs, the unsaturated overburden soil can
slide as intact blocks over the lower, liquefied deposit.
Hydrologic Hazard
One of the most serious problems in the project area is frequent flooding which is
usually brought about by overbanking of rivers and drainage channels, and low
DRAFT
A - 7
9:42 AM 02/09/05
Regional Environmental Assessment
elevation of coastal areas compared to high water level of Manila Bay and the Laguna
Lake specifically during rainfall events. Although adequately sized drainage canals
and culverts will be constructed to receive surface runoff, these channels might be
ineffective against floods, which cover a vast area. This, however, does not solve the
persistent flooding that requires a much broader approach. The following discussions
relating to flood control will cover the entire lower Marikina Valley.
DRAFT
A - 8
9:42 AM 02/09/05
Regional Environmental Assessment
Figure 6 - 3. Peak Ground Acceleration for Medium Soil
DRAFT
A - 9
9:42 AM 02/09/05
Regional Environmental Assessment
Figure 6 - 4. Peak Ground Acceleration for Soft Soil
DRAFT
A - 10
9:42 AM 02/09/05
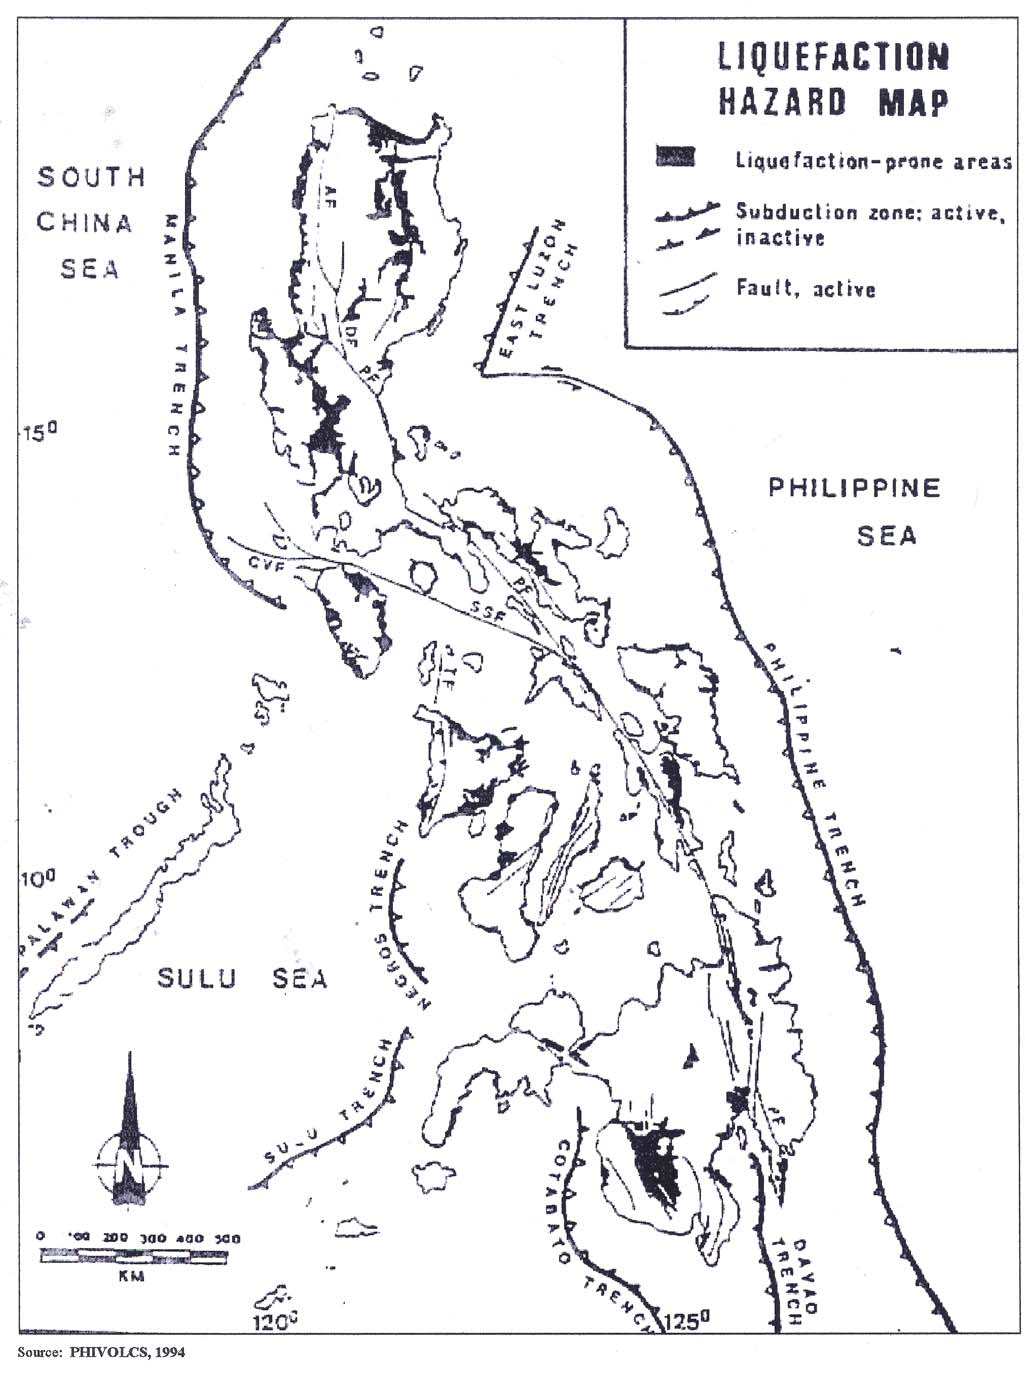
Project Site
FIGURE NO. FIGURE TITLE:
The Associated Firm: EDCOP
6-5
Liquefaction-prone areas in the Philippines
Lichel Technologies, Inc. and
ISSI
Regional Environmental Assessment
The existing flood control systems in the lower Marikina Valley consist of the
Manggahan Floodway and the Napindan River Spillway and Floodway Systems. The
Manggahan Floodway is designed to divert floodwaters from the Marikina River to
Laguna de Bay. The Napindan River on the other hand controls flow of water from
Laguna de Bay, which serves as a large detention basin, to Manila Bay. There are
instances, however, that water level in Manila Bay is higher than that in Laguna Lake
causing backflow if the floodgates are kept open. In cases like this, coupled with
extreme rainfall event, the floodwater in Napindan Channel is not readily discharged
to Manila Bay causing inundation of some 39 square kilometers of area around the
Manggahan Floodway and Napindan Channel.
Long period of inundation brought about by high water level of Laguna Lake could
bring destructive damages to properties. For the past four (4) years, the more
developed eastern and western sides of Manggahan Floodway are incurring serious
damages from floodwaters.
A.1.3 Soils
Soil Classification
The National Water Resources Council (NWRC, 1983) classified soils according to
origin, profile, texture, relief, and drainage characteristics. Table 6-2 describes the
major groups of soils that are present.
Table 6 - 2.
Major Groups of soils in the Project Area (NWRC, 1983)
Class
Description
A
Soils under this class were developed from recent alluvial
deposits. They have medium to coarse texture from A down to C
horizon. The relief is generally level or nearly so. Drainage
condition is good to partly excessive. Permeability is very rapid to
moderately rapid
B
Soils under this class were developed from older alluvial fans or
terraces having fine to very fine texture. It is generally flat with
whole plains in a zero (0) to three (3) per cent slope which favors
very easily external drainage. Internal drainage is poor and
permeability is very slow.
C
Soils under this class belong to older terraces or upland areas
developed from products of volcanic ejecta. The soils developed
are loose, very friable, sandy loam to sand. Permeability is very
rapid. They occur in flat to rolling relief.
Figure 6-6 shows the distribution of the major group of soils in the project
area.
Erosion
Figure 6-7 is a map showing the soil erosion susceptibility at the project area. The
elevated areas (Quezon City, Mandaluyong City, Makati City) have experienced
DRAFT
A - 12
9:42 AM 02/09/05
Regional Environmental Assessment
sheet erosion while the Marikina floodplain areas (Marikina valley, Taguig, Cainta,
Taytay) are not susceptible to erosion.
A.1.4 Land Use
Except for the Labasan Retention Pond and the East Manggahan Low-income
Communities, which are located in Taytay and Cainta, Rizal, all other project
components are located within the National Capital Region (NCR). The NCR is a
built-up area of residential, commercial and industrial districts. Although the
southern Taguig bay area were the Taguig Sewerage System is located (including
some parts of Taytay) still has open spaces devoted to agricultural use, the area will
be a residential area in the future.
DRAFT
A - 13
9:42 AM 02/09/05
Regional Environmental Assessment
Figure 6 - 6. Soil Classification Map of the Project Area
DRAFT
A - 14
9:42 AM 02/09/05
Regional Environmental Assessment
Figure 6 - 7. Erosion Map of the Project Area
DRAFT
A - 15
9:42 AM 02/09/05
Regional Environmental Assessment
Table 6-3 presents the existing land use of the MTSP components. The Quezon
City Comprehensive Land Use Plan (QCCLUP) 2000 is shown in Figure 6-8.
Table 6 - 3.
Existing Land Use of the Project Components
Project
Project Sub-
Existing Project
Location
Remarks
Component
Component
Site Land Use
Taguig Sewerage Hagonoy
Brgy. Hagonoy,
Agricultural,
General
System
Taguig
shoreland
residential area
based on the
Taguig
Comprehensive
Land Use Plan,
2003
Taguig (Wawa)
Brgy. Wawa,
Agricultural,
General
Taguig
shoreland
residential area
based on the
Taguig
Comprehensive
Land Use Plan,
2003
Tapayan
Brgy. Calzada,
Agricultural,
General
Taguig
shoreland
residential area
based on the
Taguig
Comprehensive
Land Use Plan,
2003
Labasan
Bryg. San Juan,
Agricultural,
General
Taytay
shoreland
residential area
based on the
Taguig
Comprehensive
Land Use Plan,
2003
Riverbanks
Barangay
Mandaluyong City
Open Space, mini
Consistent with
Sewage Treatment Barangka Ilaya
park
the Makati CLUP
Plant
2000
Barangay
Makati city
Commercial/Mixed
Consistent with
Poblacion
Use
the 2000 Makati
City Land Use
Map
Barangay
Pasig City
Residential
Consistent with
Capitolyo and
the Proposed
Pineda
Land Use Map
(2002)
Septage Treatment Food Terminal
Taguig
Industrial
General
Plant
Complex
residential area
based on the
Taguig
Comprehensive
Land Use Plan,
2003
Payatas
Quezon City
Open space,
Consistent with
grassland
the Quezon City
2003
DRAFT
A - 16
9:42 AM 02/09/05
Regional Environmental Assessment
Project
Project Sub-
Existing Project
Location
Remarks
Component
Component
Site Land Use
Sanitation of Low- Sitio Olandes
Brgy. Industrial
Residential
Consistent with
income
Valley, Marikina
the Marikina City
Communities
City
Comprehensive
Land Use Plan,
2000
East Manggahan
Taytay and Cainta
Residential
Consistent with
Floodway
the Land Use Map
of Cainta, 2000;
Land Use Map of
Taytay, 1987
Taguig
Brgy. Signal,
Residential
Taguig
Quezon City - Blue Ridge, St. Quezon City
Residential; Military Consistent with
Marikina Sewerage Ignatius, Camp
Reservation (Camp the Quezon City
System
Atienza
Atienza)
Comprehensive
Land Use Plan
(QCCLUP), 2000
Upgrade of Existing Anonas
Quezon City
Residential
Consistent with
CSTs
the (QCCLUP),
2000
Road 5, Project Quezon City
Residential
Consistent with
6
the (QCCLUP),
2000
Scout Santiago
Quezon City
Commercial
Consistent with
the (QCCLUP),
2000
Mapagmahal
Quezon City
Residential
Consistent with
the (QCCLUP),
2000
East Avenue
Quezon City
Institutional
Consistent with
the (QCCLUP),
2000
A.1.5 Hydrology
Secondary information was used in describing surface and groundwater regimes.
The information consists of published and unpublished reports including maps and
figures from government and water agencies, and private consultants. Government
agencies include the Bureau of Research and Standards (BRS) and the National
Water Resources Board (NWRB) formerly known as the NWRC. Topographic maps
of scale 1:50,000 from the NAMRIA were used as drainage map.
Surface Hydrology
PasigLaguna Bay River Basin
The project area is within the Pasig-Laguna Bay River Basin. The Pasig-Laguna Bay
River Basin is located in the northern portion of the Water Resources Region 4
between coordinates 14° 10' and 14° 55' north latitude and 120° 50' and 121° 50'
east longitude (NWRC, 1976). The basin has an area of 4,678 square kilometers
(km2) and uniquely drains three distinct sub-basins, namely the Marikina River basin,
the Laguna Lake basin, and the urban watershed basin, which includes the cities of
DRAFT
A - 17
9:42 AM 02/09/05
Regional Environmental Assessment
Manila, Pasay, Caloocan, Quezon, Makati, Mandaluyong, Pasig and Parańaque and
the municipalities of San Juan, Taguig and Pateros.
Surface Drainage
The Pasig River, which flows east to west through central Manila, is about 17
kilometers (km) in length from the confluence of the Marikina and Napindan channel
to Manila Bay. The river has a fairly direct course towards the Bay, except for its
double meander in the Santa Ana-Punta area. One of the main tributaries of the
Pasig River is the San Juan River where it enters the main river about 6 km
upstream of the mouth at the lower meander. The Pasig River discharge depends
upon the elevation of the water surface at the Pasig-Napindan junction, the lake
stage of Laguna Lake, the tide elevation in Manila Bay, and the discharge from San
Juan River. The Pasig River reverses its flow at certain periods of high tide in the
Manila Bay and low water stage of Laguna Lake during the dry season. During high
tide conditions and high flows from the San Juan River, a backwater effect slows
down the flow of the Pasig River and causes overbanking.
DRAFT
A - 18
9:42 AM 02/09/05
QUEZON CITY
PROPOSED AMENDED
CO
COMPRE
REHE
HENS
NSIVE LAND USE MAP
N
Meters
1000
0
1000
2000
3000
4000
LEGEND
GEND :
RESIDENTIAL
SOCIALIZED HOUSING
COMMERCIAL
SPECIAL DEVELOPMENT
INDUSTRIAL
INSTITUTIONAL
UTILITY
PARKS/RECREATION
CEMETERY
FIGURE NO. FIGURE TITLE:
The Associated Firm: EDCOP
Quezon City Comprehensive Land Use Plan, 2000
6-8
Lichel Technologies, Inc. and
ISSI
Regional Environmental Assessment
The Marikina River, a main tributary of the Pasig River, originates from the western
side of the Sierra Madre Cordillera some 35 km northeast of Metro Manila. The river
emerges from the foothills of the mountain range at the town of Rodriguez (formerly
Montalban) and flows southward through the Marikina Valley until it joins the Pasig
River.
The Laguna Lake, sometimes referred to as Laguna de Bay, is the largest inland
body of water in the Philippines. Located immediately inland from Metro Manila, the
lake has a surface area of some 90,000 hectares (ha) when it is at its average
highest elevation of 12.5 m, and around 76,000 ha when it is at its average lowest
elevation of 10.5 m (LLDA). It serves as a natural detention reservoir for discharges
from the surrounding tributary streams (Pila-Santa Cruz, San Juan, San Cristobal,
Pagsanjan and Romero-Sta. Maria Rivers). The lake's only outlet is via the
Napindan channel and Pasig River.
The hydrology of the lake has a natural stage regime which in the dry season results
in a minimum lake elevation of about 10.5 m. controlled by mean level in Manila
Bay. At the end of the dry season, the lake level may drop below the level of high
tide in Manila Bay, resulting in the intrusion of seawater up the Pasig River. With this
diurnal reversal, the highly polluted waters of the Pasig river system are carried in
the lake. The tidal influx is also the primary cause of elevated salinity in the lake
during this part of the year (LLDA).
During the wet season, precipitation results in an annual mean high water elevation
of 12.5m. and a peak elevation which may reach as high as 14.6m for a 100-year
recurrence interval. During extremely wet years, widespread flood damage occurs
along the lakeshores because the land is relatively flat for several kilometers inland
in most areas. Also during this period, the Marikina River floods the Pasig River and
overflows into the Laguna de Bay via the Napindan Channel because the Marikina
River can generate floodflows of about 200 m3/s to 4000 m3/s, and because the
Pasig River bank full channel capacity varies from as little as 50 m3 to about 750
m3/s. Depending upon the tide and local inflow, the Marikina River causes flooding
only in and around Metropolitan Manila. The major bodies of water in the project
region are also shown in Figure 6-9.
Streamflow Data
As early as the 1950's, the Department of Public Works and Highways (DPWH)
started streamflow observations on ten (10) gauging stations at Pasig River and
Marikina River. To date, only four stations are operational and are maintained by the
BRS. Only one gauging station remains operational along Pasig River. This station
is located at Guadalupe, Makati City. For Marikina River, streamflow observations
are located at Sto. Nińo and San Jose, Marikina City and at Wawa, Rodriguez, Rizal.
Table 6-4 presents the historical data of the mean gage height of Pasig River at
Barangka Ilaya, Mandaluyong City. Discharge characteristics for Pasig River were
not determined since the river is influenced by tidal fluctuations. For the period 1988
to 2003, the highest gage height of Pasig River recorded at the Barangka Ilaya
Station was 13.06 m recorded on 08 November 1988, while the lowest gage height
was at 10.17 m recorded on 23 February 1990.
DRAFT
A - 20
9:42 AM 02/09/05
Regional Environmental Assessment
Table 6 - 4.
Monthly Mean Gage Height (in meters) of Pasig River at
Barangka Ilaya Station, Mandaluyong City
Year
Jan
Feb
Mar
Apr
May
Jun
Jul
Aug
Sep
Oct
Nov
Dec
1988
11.89
11.73
11.58
11.52
11.49
11.80
11.48
11.35
11.21
-
12.58
11.96
1989
11.36
10.96
10.97
10.90
10.96
11.17
-
-
-
-
-
-
1990
10.60
10.59
10.57
10.58
10.59
10.94
11.13
11.28
11.59
11.20
11.64
11.62
1991
10.54
10.59
10.81
11.41
11.67
11.69
11.52
11.67
11.68
11.74
11.71
11.73
1992
11.77
11.78
11.72
11.41
11.65
11.71
11.59
11.59
11.22
11.53
11.70
11.47
1993
11.10
11.32
11.38
11.47
11.59
11.61
11.61
11.69
11.67
11.66
11.70
11.68
1994
11.26
11.07
11.05
11.48
11.57
11.59
12.46
11.69
12.08
11.64
11.66
11.63
1995
-
11.78
11.51
11.67
11.58
11.65
11.73
11.83
11.83
12.10
12.48
12.33
1996
11.43
11.00
11.32
11.35
11.36
-
11.68
11.69
11.78
11.69
11.47
11.62
1997
11.51
11.67
11.55
11.65
11.67
11.63
11.58
11.65
11.65
11.55
11.30
11.30
Source: Bureau of Research and Standards
Elevation of zero gage = 11.00 m below mean sea level
Drainage area = 3,807 km2
Table 6-5 shows the mean monthly discharge of Marikina River at Barangay Tanong
Station, Marikina City for the period 01 September 1988 to 31 December 1992. The
highest peak discharge recorded during the period occurred on 09 September 1989
at 1,358.06 m3/sec or a gage height of 17.40 m. The lowest discharge during the
period occurred on 28 April 1992 at 9.36 m3/sec or a gage height of 10.16 m.
Average discharge for the period was 79.025 m3/sec.
Table 6 - 5.
Monthly Mean Discharge (Q) in (cubic meters per second) of
Marikina River at Barangay Tanong Station, Marikina City
Year
Jan
Feb
Mar
Apr
May
Jun
Jul
Aug
Sep
Oct
Nov
Dec
1988
-
-
-
-
-
-
-
-
35.90
248.48
399.51
162.50
1989
21.16
6.84
5.63
2.58
11.61
20.57
103.68
229.96
190.58
104.15
51.50
9.25
1990
0.856
0.876
1.05
0.281
4.53
130.01
85.50
298.28
306.05
129.26
138.18
96.76
1991
74.69
34.55
10.27
12.29
10.25
24.95
66.05
168.88
178.90
104.80
45.09
66.34
1992
73.80
33.65
10.13
9.83
10.09
18.84
51.60
132.42
192.93
129.36
76.97
66.97
Source: Bureau of Research and Standards
Notes:
Elevation of zero gage = 10.00 m below Mean Lower Low Water (MLLW); MLLW datum is 0.47 meter
below Mean Sea Level (mbMSL)
Drainage area = 499 km2
Flow Duration Analysis
Flow duration curve for Marikina River at Sto. Nińo, Marikina City (NWRC, 1983) is
shown in Figure 6-9. Dependable flow at 80% of the time is about 0.80 m3/sec.
Groundwater Hydrology
Hydrogeologic Units and Characteristics
The hydrogeological units and its characteristics in the project area correspond to
the stratigraphic units discussed under the Geology Section (Section 5.1.2.1).
DRAFT
A - 21
9:42 AM 02/09/05
MARIKINA RIVER (1958-71-72-76)
STO. NINO MARIKINA RIZAL
D.A. = 499 SQ.KM.
Source: National Water Resources Council, Framework Plan (1983)
FIGURE NO. FIGURE TITLE:
The Associated Firm:
EDCOP
6-9
Flow Duration Curve of Marikina River
Lichel Technologies, Inc. and
ISSI
Regional Environmental Assessment
A.1.6 Water Quality
Sampling Stations
Water samples were collected from 33 stations within the Project area namely:
Ř Stations (1a1, 1a2, 1b1, 1b2, 1c1, 1c2, 1d1, and 1d2) at the Taguig Sewerage
System component located along Hagonoy creek, Taguig River, Labasan River
and Tapayan River adjacent to Laguna de Bay;
Ř Stations (2a1, 2a2, 2a3, 2b1, 2b2, 2b3, 2c1, 2c2, 2c3, 2c4) at the Riverbanks
Sewage Treatment Plants along the riverbanks of Pasig River, located in Makati,
Mandaluyong and Pasig;
Ř Station (3a) at the proposed north sector Septage Treatment Plant at the FTI
Complex, Taguig, Rizal
Ř Stations (4a, 4b, 4c) for the Low-Income Sewerage System, located in
Pinagsama Village and Signal Village (Taguig) and Manggahan Floodway East
Bank Community (Taytay);
Ř Stations (5a, 5b, 5c) in the proposed Existing Sanitation Systems in Quezon
City.
Stations (6a1, 6a2, 6b, 6c, 6d1, 6d2, 6e, 6f) for the Quezon City Marikina
Sewerage System along the riverbank of Marikina River;
The description, location and coordinates of the sampling stations are given in Table
6-6 and are shown in Figure 6-10.
Gullies at the proposed Payatas Septage Treatment Plant were dry during the visit;
hence, no water samples were taken.
The Taguig Sewerage System has four catchment areas. The Hagonoy River with
an upstream sampling site (1a1) 10 m away from the entrance gate of the DPWH
floodgate and a downstream site (1a2), 150 m away from the DPWH floodgate, in
the Laguna Lake. The Taguig River had two sampling sites: upstream (1b1) 100 m
away from the DPWH floodgate and downstream (1b2) 50 m off the mouth of Taguig
River in Laguna Lake. Labasan River on the other hand had two sampling sites, one
upstream (1c1), 150 m away from DPWH floodgate and downstream (1c2) 150 m
away from DPWH floodgate, in Laguna Lake. Tapayan River also had two sampling
sites, one upstream (1d1) below the Ilog Tapayan bridge and downstream (1d2) off
the mouth of Tapayan River in Laguna Lake.
At the proposed Riverbanks Sewage Treatment Plants, the Poblacion catchment in
Makati City near J.P. Rizal had sample collections in the upstream (2a1), outfall
(2a2) and downstream (2a3). The Ilaya catchment in Mandaluyong City on the other
hand had three sampling sites namely: upstream (2b1), outfall (2b2) and
downstream (2b3). The Capitolyo catchment in Pasig City (Pineda) had two outfall
samples (2c1 and 2c2), one upstream (2c3) and one downstream (2c4).
Only one sampling station (3a) was identified and is located at the proposed North
Septage Treatment Plant, FTI Complex, Taguig. Water sample, originating from the
FTI Complex, was collected from the concrete box culvert that discharges into a
creek some 75 m downslope of the existing FTI Sewage Treatment Plant.
DRAFT
A - 23
9:42 AM 02/09/05
Regional Environmental Assessment
The low-income community areas comprise of three sampling sites: two sites along
the Pinagsama Creek and one at the East Manggahan Floodway. The sampling
stations along Pinagsama Creek are located at Signal Village (4a) and at the
downstream portion at Pinagsama Village below a bridge (4b). The sampling station
at the Manggahan Floodway East Bank community (4c) is located at the southern,
downstream end of a creek near the proposed STP at Genesis community.
DRAFT
A - 24
9:42 AM 02/09/05
Regional Environmental Assessment
The Marikina River as a project area near Camp Atienza comprises Sitio Olandes
within the Barangay Industrial Valley had three sites namely: upstream (5a), outfall
(5b) and downstream (5c).
At the existing sanitation systems in Quezon City, Road 5 (Project 6) had collections
in the upstream of Culiat Creek (6a1) and outfall of the CTS (6a2) as 1OF. The
second site in this project area is Scout Santiago where water samples came from
the inlet (6b); East Avenue site was in the creek within the Forest Management
Bureau (6c); and Anonas corner Tindalao Street in the upstream of Bahay Buwaya
Creek (6d1) and the outlet of the outfall of the CST (6d2). Additional sampling
stations were selected at the outfalls of CSTs located at Rimas Street, Barangay
Quirino 2A (6e) and Matiwasay Street, Barangay Old Capitol (6f).
Table 6 - 6.
Water Quality Sampling Station Location and Coordinates.
Station
Coordinates
Project
Project
Sampling
Number / Date
Location
Area
Component
Area
Lat. N
Long. E
Sampled
Taguig
Taguig
Hagonoy
1a1
Upstream (10m away
Sewerage
Creek
09 Dec 2003
from the gate of
14o30'53"
121o04'15"
System
DPWH Flood Control
Project)
1a2
Downstream (Laguna
14o30'16"
121o04'30"
09 Dec 2003
de Bay)
Taguig River
1b1
Upstream (100 m
09 Dec 2003
away from DPWH
14o31'19"
121o04'45"
floodgate)
1b2
Downstream (50 m off
09 Dec 2003
the mouth of Taguig
14o30'39"
121o05'13"
River, Laguna de
Bay)
Labasan
1c1
Upstream (150 m
River
09 Dec 2003
away from DPWH
14o31'55"
121o05'29"
floodgate)
1c2
Downstream (150 m
06 Dec 2003
away from DPWH
14o31'47"
121o05'35"
floodgate, Laguna de
Bay)
Tapayan
1d1
Upstream (below the
River
06 Dec 2003
Ilog Tapayan bridge,
14o32'41"
121o06'48"
Brgy. San Juan,
Taytay)
1d2
Downstream (off the
06 Dec 2003
mouth of Tapayan
14o31'47"
121o05'35"
River, Laguna de
Bay)
Pasig River
Riverbanks
J.P. Rizal
2a1
14° 34'
121° 01'
Upstream
Sewage
Street, Brgy.
14 Nov 2003
06.3"
58.2"
Treatment
Poblacion,
2a2
Creek/Outfall
14o34'6.7"
121o01'56"
Plant
Makati City
14 Nov 2003
(near the
Rockwell
2a3
121o01'54.
Downstream
14o34'7.7"
Center)
14 Nov 2003
4"
Barangay
2b1
Upstream (below the
14o34'11.5"
121o02'40"
Ilaya,
14 Nov 2003
bridge)
Pasig River
Mandaluyon
2b2
121o02'38.
Outfall
14o34'11.9"
g City,
14 Nov 2003
5"
(below
Guadalupe
2b3
121o02'36.
Bridge at
Downstream
14o34'12.1"
14 Nov 2003
2"
EDSA)
San Andres,
2c1
Outfall
14o34'0.7"
121o03'18"
Barangay
14 Nov 2003
Pineda,
2c2
121o03'34.
Pasig
Creek / Outfall
14o33'53.3"
14 Nov 2003
5"
DRAFT
A - 26
9:42 AM 02/09/05
Regional Environmental Assessment
Station
Coordinates
Project
Project
Sampling
Number / Date
Location
Area
Component
Area
Lat. N
Long. E
Sampled
2c3
Upstream
14o33'46"
121o03'43"
14 Nov 2003
2c4
Downstream
14o34'3.7"
121o03'09"
14 Nov 2003
Taguig
Septage
Signal
3a
Outfall of drainage
121o02'57.
Treatment
Village
27 Apr 2004
from FTI Complex
14o30'28.8"
2"
Plant
Taguig
Low Income
Pinagsama
4b
Pinagsama Creek
Sewerage
Village
09 Dec 2003
(below the bridge)
14o31'40"
121o03'23"
System
Signal
4a
Pinagsama Creek
121o03'15.
14o31'0.4"
Village
26 Apr 2004
(upstream)
4"
Marikina
Quezon City
Marikina
5a
Upstream of Outfall at
121o04'51.
14o37'33"
River
Marikina
River (at
15 Nov 2003
Marikina River
5"
Sewerage
Sitio
5b
Outfall at Sitio
121o04'37.
System
Olandes)
15 Nov 2003
Olandes
14o37'6.5"
4"
5c
Downstream of
121o04'37.
15 Nov 2003
Outfall at Marikina
14o36'58"
7"
River
Quezon City
Upgrade of
Road 5,
6a1
Upstream (below the
14° 39'
121° 02'
Existing
Project 6
15 Nov 2003
bridge)
59.9"
13"
Sanitation
Systems
6a2
121o02'14.
Outfall
14o40'0.5"
15 Nov 2003
9"
Quezon
6b
Upstream
Avenue cor.
15 Nov 2003
14° 38'
121° 01'
Scout
21.5"
35.7"
Santiago St.
East Avenue
6c
Along the creek
cor. Matalino
15 Nov 2003
Street
14° 38'
121° 02'
(across Phil.
47.6"
45.6"
Heart
Center)
Anonas cor.
6d1
14° 37'
121° 03'
Upstream
Tindalo
15 Nov 2003
51.2"
39.4"
Street (near
6d2
121o03'40.
the bridge)
Outfall
14o37'50.9"
15 Nov 2003
2"
Rimas St.
6e
121o03'22.
(Barangay
Outfall
14o37'47.5"
27 Apr 2004
1"
Quirino 2A)
Matiwasay
St.
6f
Outfall
14o39'12.2"
121o03'16"
(Barangay
27 Apr 2004
Old Capitol)
Taytay
Low Income
East
4c
Along creek at the
Sewerage
Manggahan
06 Dec 2003
south end of the
14o32'47"
121o07'26"
System
Floodway
coverage area
Sampling Methods and Analyses
The following parameters were measured: Temperature (T), pH. Dissolved Oxygen
(DO), Biochemical Oxygen Demand (BOD), Total Suspended Solids (TSS), Total
Dissolved Solids (TDS), Total Phosphate (P tot), Phosphate (P), Oil and Grease (O
& G) and Coliform (Total and Fecal). Heavy metals in the form of Arsenic (As),
Chromium (Cr), Cadmium (Cd), Mercury (Hg) and Lead (Pb) are measured.
Pesticides in the form of organochlorides and organophosphates and PCB
(PolyChlorinated Biphenyls) were also measured in selected sampling stations
Acid washed containers were used to collect water for the above analyses from the
identified 29 sampling sites. Collected water was placed in an ice chest with a
DRAFT
A - 27
9:42 AM 02/09/05
Regional Environmental Assessment
temperature of 40 C and brought to the laboratory for analysis. Table 6-7 shows the
protocol used for the analysis of each parameter.
Table 6 - 7.
Water Quality Method of Analysis
Parameter
Method of Analysis
Total Dissolved Solids
Gravimetry
Total Suspended Solids
Gravimetry
Phosphorus as Phosphate
Colorimetry- Ascorbic Acid
Total Phosphorus as P
Colorimetry- Ascorbic Acid
Oil and grease
Gravimetry-Pe. Ether Extraction
pH
Glass Electrode
Temperature
Direct Measurement
Biochemical Oxygen Demand Azide Modification
(BOD5)
Dissolved Oxygen as O2
Titrimetry
Organophosphorus Pesticides
EPA Method 8141
Organochlorine Pesticides
EPA Method 8081A
PCBs
EPA Method 8082
Arsenic
Colorimetry SDDC
Chromium, Cadmium, Lead
Flame AAS
Mercury
AAS Cold Vapor
Fecal Coliform
APHA 9221E
Total Coliform
APHA - 9221B
Results of Analyses
The temperature range measured from the sampling sites in this Project area from
upstream and downstream was 23.13° C measured at the Riverbanks STP at J. P.
Rizal, Makati City to 30.6° C at the Signal Village in Quezon City and Hagonoy Creek
of 270C. The average temperature of the 33 sampling stations is 24.80C. The pH
values ranged from 6.28 at the downstream of the Hagonoy Creek at Laguna Lake
(1a1) to 8.56 measured at the Rimas CST outfall in Barangay Quirino 2A, Quezon
City (6e). The 6.28 pH value is below the pH range for DENR Class C inland fresh
water standard. All other pH values are within the DENR Class C water and effluent
standards.
Surprisingly, BOD levels at Pasig River except for the upstream station (2c3) and
outfall (2c4) at Barangay Pineda (2c3) are within the BOD DENR Class C water (10
mg/I) and effluent (50 mg/l) standards. The rest of the sampling stations have BOD
values exceeding the required DENR Class C water and effluent standards. The
outfall at the Rimas CST (6e) with the highest BOD value of 512 mg/l was ten times
the allowable Class C effluent standard.
TSS in the downstream of Taguig River at Laguna Lake (1b2) had the lowest
concentration measured at 2 mg/l while the highest TSS concentration at 2,250 mg/l
DRAFT
A - 28
9:42 AM 02/09/05
Regional Environmental Assessment
was taken from the outfall of the Road 5 CST (6a1) at Project 6, Quezon City. This
TSS concentration xceeded the DENR Class C effluent standard of 70 mg/l. The
TSS levels at the FTI outfall (3a) at 98 mg/l and at Sitio Olandes outfall (5b) at 106
mg/l also exceeded the effluent standard. TDS on ranged from 110 to 1,140 mg/l.
The highest value was noted in the low-income communities. The lowest TDS value
was observed in the upstream of Labasan River (1c1).
Arsenic, Chromium, Cadmium, Mercury and Lead were analyzed in all the sampling
stations. Arsenic levels were within the DENR Class C water (0.05 mg/l) standards
except in East Avenue, Quezon City (0.055 mg/l). As levels in outfalls showed they
are within the DENR effluent standard of 0.2 mg/L Chromium levels at Hagonoy
downstream (0.06 mg/l) and Pinagsama Village (0.08 mg/l) exceeded DENR Class C
water standard of 0.05 mg/l. Mercury in almost all sampling stations were within the
permissible DENR water standard of 0.002 mg/l except at Hagonoy downstream
(0.07 mg/l). Lead concentrations along Pasig River at Barangka Ilaya, Mandaluyong
City (0.47 mg/l), Barangay Pineda, Pasig City (0.3 to 0.45 mg/l), and Signal Village
(0.24 mg/l) exceeded DENR Class C water (0.05 mg/l) and effluent (0.3 mg/l)
standards. Lead concentration at Rimas CST outfall was measured at 0.51 mg/l.
Cadmium levels in all stations conformed to both DENR water and effluent
standards.
Oil and grease in almost all stations exceeded the DENR standards of 2.0 mg/l for
Class C water and 5.0 mg/l for effluent except at Taguig (1b) and Labasan (1c)
areas. The highest oil and grease level at 69 mg/l was measured at Tapayan River
upstream (1d1).
Total Phosphorus on sampled sites ranged from < 1 mg/l to as high as 2,900 mg/l in
the outfall of Road 5 CST at Project 6, Quezon City. Lower values (< 30 mg/l) were
noted at the Taguig Laguna Lake areas (stations 1a to 1d). Phosphate ranged
from 6 mg/l to 118 mg/l where higher values were also noted in the outfall compared
to the upstream and downstream stations.
Organochloride pesticides and Organophosphorous pesticides were also analyzed
but were below detection levels in samples from Pasig River upstream (Pineda),
Mandaluyong outfall and Ilaya downstream. PCB levels were also analyzed in
selected areas but were not detected.
As expected, total coliform counts on all sampling stations exceeded DENR Class C
water (5,000 MPN/100ml) and effluent (10,000 MPN/100ml) standards. Total
coliform counts were as high as 16,000,000 MPN/100ml.
Results of the analyses for water and effluent (outfall) are summarized in Table 6-8.
DRAFT
A - 29
9:42 AM 02/09/05
QUEZON CITY
PROPOSED AMENDED
CO
COMPRE
REHE
HENS
NSIVE LAND USE MAP
N
Meters
1000
0
1000
2000
3000
4000
LEGEND
GEND :
RESIDENTIAL
SOCIALIZED HOUSING
COMMERCIAL
SPECIAL DEVELOPMENT
INDUSTRIAL
INSTITUTIONAL
UTILITY
PARKS/RECREATION
CEMETERY
FIGURE NO. FIGURE TITLE:
The Associated Firm: EDCOP
Quezon City Comprehensive Land Use Plan, 2000
6-8
Lichel Technologies, Inc. and
ISSI
Regional Environmental Assessment
A.1.7 Meteorology and Ambient Air Quality
Meteorology
Meteorology is the science that deals with the earth's atmosphere and its phenomena;
specifically that of weather and climate and its effects on the earth's surface, oceans,
and life in general. In Metro Manila, the meteorological stations established by the
Philippine Atmospheric, Geophysical and Astronomical Services Administration
(PAGASA) are located in the Science Garden in Diliman, Quezon City, Port Area in
Manila and at the Ninoy Aquino International Airport (NAIA), Pasay City. These three
stations are situated at the central, western, and southern part of the Metro Manila
(Table 6-9). The composite meteorological data from these stations represents the
expected weather and climate condition of the National Capital Region (NCR) all
throughout the year. This will also cover the description of the meteorological condition
in the Taytay and Cainta areas where several components of the MTSP are situated.
The following subsections present the climate, ambient temperature, humidity, rainfall,
and wind profile of the each of the aforesaid stations as based on the 34-year
climatological normals and extremes data (1961-1995) of PAGASA.
Table 6 - 9.
Three Metro Manila Meteorological Stations Considered in this
Study
No.
Station
Coordinates
Elevation
430
Science Garden
N 14° 39'
43 meters
Quezon City
E 121° 03'
425
Port Area, Manila
N 14° 35'
16 meters
E 120° 59'
429
NAIA Terminal
N 14° 31'
21 meters
Pasay City
E 121° 01'
Climate
The climate of the Philippines is tropical and maritime. It is characterized by relatively
high temperature, high humidity and abundant rainfall. It is similar in many respects to
the climate of the countries of Central America. Temperature, humidity, and rainfall,
which are discussed hereunder, are the most important elements of the country's
weather and climate. The climate map of the Philippines is presented in (Figure 6-11).
Metro Manila belongs to Type I of the Modified Coronas classification of Philippine
climate. It is characterized by the existence of two pronounced seasons, dry from
November to April and wet during the rest of the year. The months of May and
November are considered the transition months.
Rainfall
Rainfall is the most important climatic element in the Philippines. Rainfall distribution
throughout the country varies from one region to another, depending upon the
direction of the moisture-bearing winds and the location of the mountain systems.
The mean annual rainfall of the Philippines varies from 965 to 4,064 millimeters
annually. In Metro Manila, the annual average rainfall is 2,128.8 mm with an annual
DRAFT
A - 31
9:42 AM 02/09/05
Regional Environmental Assessment
average of 133 rainy days (Table 6-10). The dry months are from December to May
while the rainy months are from June to November. The wettest months are July to
September. August is the peak of the rainy season with an average of 22 rainy days
per month. The highest daily rainfall as of 1995 is 472.4 mm which was recorded at the
NAIA station in July 20, 1972 (See Annex 2 of EIS Volume 2).
DRAFT
A - 32
9:42 AM 02/09/05
PROJECT SITE
SOURCE: PAGASA
FIGURE NO. FIGURE TITLE:
The Associated Firm:
EDCOP
6-11
Climate Map of the Philippines
Lichel Technologies, Inc.
ISSI
Regional Environmental Assessment
Table 6 - 10. Climatological Normals for Metro Manila Derived from the
Composite Meteorological Data from the Science Garden, NAIA Terminal and
Port Area Stations of PAGASA, 1961-1995
Temperature, °C
Rel.
Wind
Rainfall
No of
VP
Month
Hum.
(mm)
rainy days
Speed,
Max
Min
Mean
(mbs)
(%)
Dir.
M/s
January
14.5
3
30.3
21.3
25.7
24.0
74
NE
3
February
5.3
2
31.0
21.5
26.3
23.5
69
NE, E, SE
3
March
10.8
2
32.6
22.8
27.7
24.5
66
SE
3
April
19.4
3
34.2
24.2
29.2
26.2
65
SE
3
May
125.3
9
34.0
25.1
29.6
28.7
70
SE
3
June
292.7
17
32.4
24.8
28.6
30.0
78
SW
3
July
416.1
21
31.2
24.4
27.8
29.8
81
SW
3
August
464.9
22
30.7
24.2
27.5
29.9
83
SW
3
September
354.9
20
30.9
24.2
27.6
29.9
83
SW
2
October
240.8
16
31.0
23.8
27.4
28.8
80
N, E, W
2
November
131.0
11
30.8
23.1
26.9
27.2
78
N, E, NE
2
December
53.2
7
30.1
22.1
26.1
25.4
77
NE
3
Annual
2128.8
133
31.6
23.5
27.5
27.3
75
SW
3
Temperature
Based on the average of all weather stations in the Philippines, excluding Baguio, the
mean annual temperature is 26.6o C. The coolest months fall in January with a mean
temperature of 25.5o C while the warmest month occurs in May with a mean
temperature of 28.3o C. Latitude is an insignificant factor in the variation of
temperature while altitude shows greater contrast in temperature.
Using the composite data in Table 5-10, the average mean annual temperature in
Metro Manila is 27.5 °C while the average annual maximum and minimum
temperatures recorded for the day are 31.6 °C and 23.5 °C, respectively. The warmest
month is May with an average mean monthly temperature of 29.6 °C while the coolest
is January at 25.7 °C.
The warmest and coldest temperature was recorded at the Port Area station with 38.6
°C observed on May 17, 1915 and 14.5 °C recorded on January 11, 1914 (see Annex2
of EIS Volume 2).
Relative Humidity
Humidity refers to the moisture content of the atmosphere. Due to high temperature
and the surrounding bodies of water, the Philippines has a high relative humidity. The
average monthly relative humidity varies between 71 percent in March and 85 percent
in September. The combination of warm temperature and high relative and absolute
humidities give rise to high sensible temperature throughout the archipelago. It is
especially uncomfortable during March to May, when temperature and humidity attain
their maximum levels. Relative humidity (RH) is expressed as percentage of water vapor
in air.
In Metro Manila, the mean monthly relative humidity varies from a low of 65 percent in
April to a high of 83 percent in August and September. The annual average relative
humidity is 75 percent with August and September as the most humid months of the
year with an average RH of 83 percent while April is the least humid with RH of 65
percent.
DRAFT
A - 34
9:42 AM 02/09/05
Regional Environmental Assessment
Prevailing Wind
Metro Manila is exposed to both monsoons. The mountainous terrain modifies the
Northeast monsoon into an easterly direction and the Southwest Monsoon is deflected
to a westerly direction. The annual average wind speed is 3 meters per second (mps)
with mean monthly values varying from 2 to 3 mps. Average monthly wind speed of 3
mps occurs in December to August while minimum wind speed prevails in September
to November.
The strongest wind that occurred in Metro Manila was recorded at both NAIA and Port
Area stations in November 19, 1970 (see Annex 2 of EIS Volume 2). Its speed was
56 mps from the W (NAIA as reference).
Tropical Cyclone Frequency
The Philippines, in general, is located in one of the most tropical cyclone-prone regions
of the world. About 20 tropical cyclones of varying intensities affect the country every
year. Metro Manila is located in a zone where the probability of typhoon passage is 2
to 3 cyclones every five years. The frequency distribution map of tropical cyclones in
the Philippines is shown in Figure 6-12.
Ambient Air Quality
Sampling Stations
Seventeen sampling stations listed in Table 6-11 and presented in Figure 6-13 were
considered in this study. These stations were mostly situated in the east zone of Metro
Manila. Except for the Taytay and Taguig stations, these are regular monitoring
stations of the Environmental Management Bureau (EMB). Monthly monitoring is being
conducted by the EMB personnel at these stations to monitor levels of dust
particulates in the area. Majority of the sampling stations are located in commercial
and institutional areas.
Table 6 - 11. Location of the Metro Manila Air Quality Sampling Stations
Station No.
Location
A1
Congressional Avenue, Project 8, Quezon City
A2
BFD Compound East Avenue, Quezon City
A3
NPO Compound EDSA, Quezon City
A4
Ateneo University Katipunan Road, Diliman, Quezon City
A5
Gumamela St. Viejo, Makati City
A6
EDSA, Guadalupe, Makati City
A7
LLDA Compound, Pasig City
A8
Mandaluyong City Hall, Mandaluyong City
A9
EDSA Shrine, Mandaluyong
A10
City Hall F.B. Harrison St., Pasay City
A11
MRT South Station, Pasay City
A12
Department of Health, San Lazaro Rizal Avenue, Manila
A13
EDSA, MCU Caloocan City
A14
Valenzuela Municipal Hall, Valenzuela
DRAFT
A - 35
9:42 AM 02/09/05
Regional Environmental Assessment
A15
Las Pińas
A16
Blk 15, Lot 1, Anak Pawis, Manggahan East Bank Floodway, Taytay, Rizal
A17
Zone 5, Brgy. Outpost Pinagsama Village, Phase I&II Extension, Taguig
DRAFT
A - 36
9:42 AM 02/09/05
PROJECT SITE
SOURCE: PAGASA
FIGURE NO. FIGURE TITLE:
The Associated Firm:
EDCOP
6-12
Tropical Cyclone Map of the Philippines
Lichel Technologies, Inc. and
ISSI
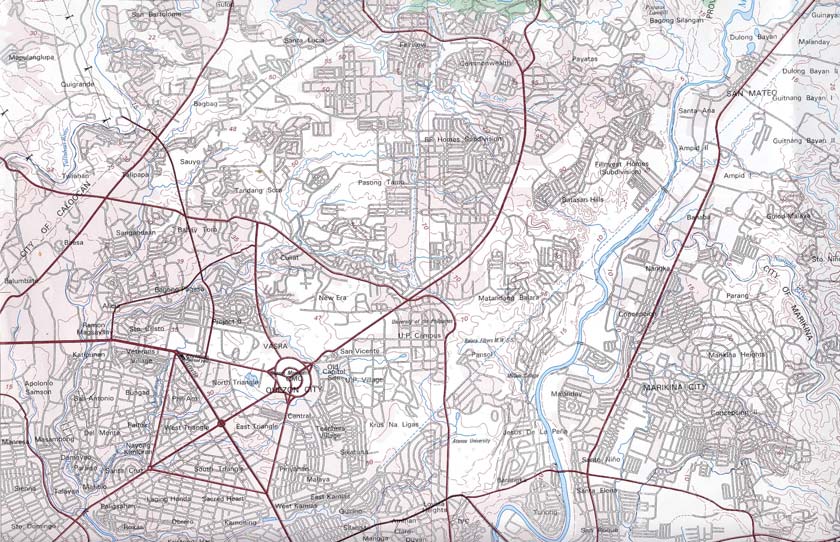
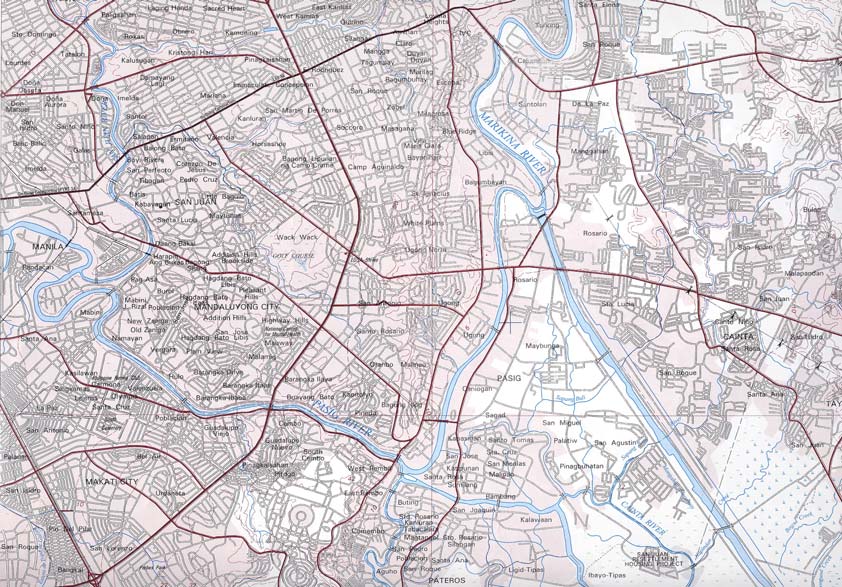
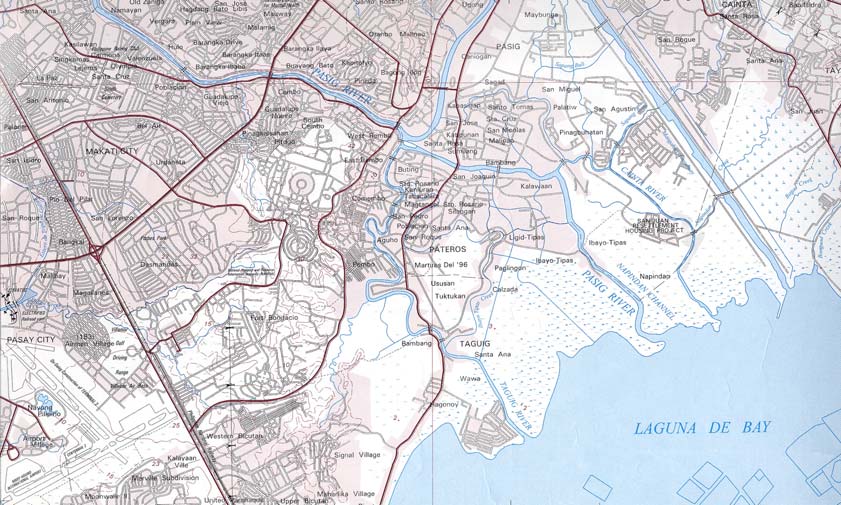
14°40'
A1
N5
N7
A4
N6
N8
N9
N10
A9
14°35'
A8
N12
N11
N13
A6
A5
N4
N3 N14
N2
N1
A16
A17
NORTH
1
0
1
2
3 Km.
Graphical Scale
14°30'
121°00'00"
121°05'00"
Legend:
REA Boundary -
Source: NAMRIA
FIGURE NO.
FIGURE TITLE:
The Associated Firm:
EDCOP
6-13
Ambient Air and Noise Level Sampling Stations
Lichel Technologies, Inc. and
ISSI
Regional Environmental Assessment
Methodology
Latest results of monthly monitoring conducted by EMB in the Metro Manila area was
gathered and examined to become part of this study. Twenty-four hour sampling was
conducted by the EMB personnel at stations (A1 to A15) to determine concentration of
Total Suspended particulates (TSP) in Metro Manila. Additional monitoring stations
were established in the Taytay and Taguig areas where some components of the
Manila Third Sewerage Project (MTSP) will be implemented. Two one-hour sampling
of TSP (morning and afternoon) were conducted at these two stations (A16 and A17).
The method employed for sampling TSP is the high volume-gravimetric method using
the Staplex High Volume Sampler. Air is drawn through a moisture free glass-fiber
filter paper and desiccated for 24 hours after sampling. The concentration of TSP in
ambient air is calculated by the total particulates collected divided by the total normal
volume of air sampled.
A.1.8 Noise Level
Sampling Station
To characterize the noise level quality in Metro Manila, fifteen stations located in
different areas in Metro Manila are considered in this study. These stations are
situated in areas where the major components of the MTSP will be implemented. The
description, geographical coordinates and locations of these stations are presented in
Table 6-13 and in Figure 6-14.
Methodology
The noise levels at the 17 aforementioned sampling stations are measured using the
Extech Digital Sound Level Meter. It is in accordance with the provision of the National
Pollution Control Commission's (NPCC) Memorandum Circular 002, Series of 1980,
which sets the median of seven maximum readings to be compared to the standard
and the sampling procedure outlined by Wilson (1989). A total of fifty readings were
recorded per station wherein the median of the seven maximum-recorded noise levels
gives the noise level for comparison to the standard.
Results and Discussion
Results and Discussion
The premier metropolis of the Philippines, The need to characterize air quality within
the project component sites is to assess if the attributable impacts during construction
will deteriorate quality beyond the ambient standards. Metro Manila, is still saddled
with air quality problems. While there had been gains, due to the passing of the Clean
Air Act which gave way to the prohibition of utilizing leaded gasoline for vehicles, signs
of air quality deterioration are still apparent. The highest average TSP level recorded
was in the Congressional Ave. (380 ug/Nm3) during the September 2003 sampling
(Table 6-12). Based on the mean TSP concentration of the 17 stations, Valenzuela
emerged to have the highest average TSP concentration (255.54 ug/Nm3). The
detected level of TSP could probably be partly attributed to the growing number of
diesel-fueled vehicles and industries.
DRAFT
A - 39
9:42 AM 02/09/05
Regional Environmental Assessment
Table 6 - 12. Recorded Total Suspended Particulates Concentration in Selected Areas in Metro Manila (ug/Nm3)
Septembe
Station
No.
Station
January February March April
May June July August
October November December
r
Average
A1
Congressional
303.20
261.00 251.75 193.60 180.00 151.40 217.75 276.20
380.00 264.25
282.67
266.33 252.35
A2
East Ave.
207.50
201.20 231.00 185.80 213.80 169.00 151.60 150.00
169.80 171.56
190.40
217.00 188.22
A3
EDSA, QC
157.00
146.60 186.00 178.00 164.60 137.25 170.25 154.50
193.50 199.25
122.00
103.33 159.36
A4
Ateneo
94.5
87.67 64.00 89.00 66.50 81.00 80.25
121.00
80.25
85.50
84.97
A5
Makati City
217.2
230.00 221.00 219.00 223.00 173.00 140.75 134.67
266.00
202.74
A6
EDSA, Guadalupe
163.00
163.00
A7
Pasig
91.20
84.40 114.00 145.40 147.75 85.00 87.40 76.80
45.00 144.33
99.75
113.00 102.84
A8
Mandaluyong
171.00 198.60 173.60 121.33 125.50 114.60 115.60
103.40 163.40
115.50
140.25
A9
EDSA Shrine,
Mandaluyong
243.67
243.67
A10
Pasay
168.00
282.67 149.00 133.50 276.00 264.50 253.00
95.00 180.00
130.67
176.00 191.67
A11
MRT South Sta.,
Pasay
222.33
222.33
A12
Manila
221.33
158.00 186.67
240.50 115.00 197.25
118.50 227.00
177.75
164.50 180.65
A13
EDSA, MCU
240.00
240.00
A14
Valenzuela
264.80
307.40 306.40 300.50 267.40
188.40 236.40
279.33
177.80
227.00 255.54
A15
L.P.
23.00 34.67 51.67
26.00
51.00
37.27
A16*
Taytay
56.75
56.75
A17*
Taguig
118.05 118.05
Annual
Average
191.64
204.70 193.21 177.04 192.34 131.02 148.79 141.79
166.68 180.11
164.28
152.75 167.04
Source: Monthly Monitoring by the Environmental Management Bureau
* - Ambient Monitoring Conducted by Berkman Systems, Inc.
DRAFT
A - 40
9:42 AM 02/09/05
Regional Environmental Assessment
The mean monthly 24-hour TSP monitoring results for Metro Manila for 2003 are
presented in Figure 6-14. Metro Manila has an annual average TSP level of 167.04
ug/Nm3. This is outside the National Ambient Air Quality Guideline (NAAQG) of 90
ug/Nm3. The month of February appeared to have the highest TSP level of 204.70
ug/Nm3. If compared with NAAQG for 24-hour monitoring (230 ug/Nm3), all months
of 2003 appeared to have a normal level of TSP concentration.
250.00
DENR Std
for 24-hour
sampling
200.00
=230 ug/Ncm
150.00
100.00
50.00
TSP Concentration (in ug/Ncm)
0.00
Jan
Feb
Mar
Apr
May
Jun
Jul
Aug
Sep
Oct
Nov
Dec
Months of 2003
Figure 6 - 14. Graphical Presentation of the TSP Concentration Level in Metro
Manila, 2003
Metro Manila is known to be the busiest area in the Philippines. This statement
proved to be true considering the results of the recently conducted noise level
monitoring in selected areas in Metro Manila (Table 6-13). The monitoring was
conducted on December 03 and 22, 2003 at daytime period, 10:35am to 4:10pm.
Results of monitoring revealed that all stations failed to meet the DENR standard of
55 decibel (dBA) for residential areas and 65 dBA for commercial areas. These
exceedances could be attributed to the volume of vehicles passing along the
monitoring stations. Other sources of noise in the area were the Metro Rail Transit
Line 3 (for stations near EDSA), tricycles, street vendors, and other human activities
(for stations in residential areas), which significantly contributed to the detected noise
levels. The station in Tindalo corner Anonas St. (N9) recorded the highest noise level
reading with 86.5 dBA while residential community in San Juan, Taytay (N2)
appeared to be the most tranquil station during the monitoring period.
DRAFT
A - 41
9:42 AM 02/09/05
Regional Environmental Assessment
Table 6 - 13. Recorded Daytime Noise Levels in Selected Areas in Metro
Manila (dBA)
Noise
DENR
No.
Date
Time
Location
Coordinates
Level
Standard
N1 December 03, 2003 10:35am Tapayan Bridge
N 14° 32' 46.7"
78.4
65
Manggahan
E 121° 06' 55.7"
N2 December 03, 2003 10:50am San Juan
N 14° 32' 46.9"
57.1
55
Taytay, Rizal
E 121° 07' 26.4"
11:15am Kabisig Community, Brgy.
N 14° 34' 30.5"
N3 December 03, 2003
79.6
55
San Andres, Cainta, Rizal
E 121° 06' 14.3"
N4 December 03, 2003 11:30am Manggahan East Bank Road N 14° 34' 38.4"
76
65
Boundary of Pasig-Cainta
E 121° 06' 02.3"
N5 December 03, 2003 1:20pm
Road 3, Project 6
N 14° 39' 59.9"
82.4
65
Quezon City
E 121° 02' 13"
N6
Sunshine Blvd. Commercial
N 14° 38' 21.5"
December 03, 2003 1:45pm
Center, Sct. Santiago
E 121° 01' 35.7"
74.2
65
East Triangle, Q.C.
Inside National Ecology
N7
Center
N 14° 38' 47.6"
December 03, 2003 2:00pm
Across Heart Center
E 121° 02' 45.6"
68.2
65
Matalino St. East Avenue,
QC
N8
Mapagmahal St. corner
N 14° 38' 02.8"
December 03, 2003 2:10pm
Matatag St. Brgy. Pińahan,
77.1
55
QC
E 121° 02' 47.1"
N9 December 03, 2003 2:30pm
Tindalo corner Anonas St.
N 14° 37' 51.2"
86.5
55
E 121° 03' 39.4"
N10 December 03, 2003 3:05pm
Olandes and Camp Atienza
N 14° 37' 11.4"
81.1
65
Riverbank
E 121° 04' 36.7"
N11 December 03, 2003 3:40pm
Brgy. Capitolyo
N 14° 34' 04.5"
68.3
55
E 121° 03' 13.3"
N12
Brgy. Barangka Ilaya
December 03, 2003 4:00pm
Ilaya Mini Park,
76.4
65
Mandaluyong
N13 December 03, 2003 4:10pm
Brgy. Poblacion, J.P. Rizal
N 14° 34' 06.3"
80
65
Makati City
E 121° 01' 58.2"
N14
10:31am Anak Pawis, East Bank
N 14° 33' 40"
December 22, 2003
Manggahan Floodway,
75
55
3:16pm
Taytay
E 121° 06' 44.5"
N15 December 22, 2003 12:15pm Pinagsama Village
N 14° 31' 28.5"
73
55
3:17pm
Phase I&II, Taguig
E 121° 03' 15.2"
A.2
BIOLOGICAL ENVIRONMENT
A.2.1 Terrestrial Ecology
Regional Setting
All but one of the MTSP project components are situated within the Metropolitan
Manila Area, administratively referred to as the National Capital Region (NCR). The
East Manggahan Floodway community located in Cainta and Taytay municipalities in
Rizal Province border the southwest portion of the NCR. Civil works in the NCR
DRAFT
A - 42
9:42 AM 02/09/05
Regional Environmental Assessment
under the MTSP will specifically be undertaken in the cities of Quezon,
Mandaluyong, Makati, Pasig, Marikina and the town of Taguig. As a highly
urbanized region, the landscape or terrestrial environment consists mainly of dense
human settlement areas, industrial sites, financial and commercial establishments
and a network of roads and bridges a concrete jungle, so to speak. The vegetation
cover is constricted to man-made settings (memorial and home gardens, city parks,
trees and ornamental lining and hedging streets) and a few remaining open areas
(both private and government properties) that include natural successional and
disturbed habitats and patches of cultivated lands which are rapidly being reduced in
hectarage due to population and urbanization pressures. In a decade or so, most of
the privately owned natural areas will be transformed into housing, commercial and
industrial sites. The government lands may soon be taken over by the region's
homeless families unless programs are formulated to prevent such an eventuality. It
is, however, enlightening to note that the University of the Philippines already has a
plan to develop a part of its Diliman (Quezon City) idle land into a botanical garden
which will house exotic and rare tropical plant species. The garden will partly serve
the needs of Metropolitan Manila residents for the enjoyment and appreciation of
natural green sceneries.
Terrestrial Flora
At the Taguig Sewerage System, the vegetation cover of the floodplains adjacent to
the pumping stations and retention ponds are dominated by grasses, herbs and
sedges in association with a few shrubs that characterize open, waste and generally
damp habitats. A majority of the herbaceous growth forms belong to the Gramineae,
Leguminosae and Compositae Families. Their ecological importance rests mainly in
their role as primary producers in the ecosystem and as soil cover to prevent
erosion. The herbaceous cover may also provide habitats for insects and other small
field fauna. At the Tapayan pump station, the flood plains are currently cultivated for
rice culture. According to some long-time residents in the communities along the
Hagonoy and Taguig Rivers, they used to plant vegetable crops in the floodplains
during the summer months before the DPWH Flood Control Program in the area was
implemented.
All three catchments located alongside the Pasig River, situated in the cities of Pasig
(Barangay Pineda), Mandaluyong (Barangka Ilaya) and Makati (Barangay Poblacion)
are densely populated with very little and limited open space. The proposed site for
the construction of a STP for Barangay Pineda is devoid of any vegetation cover
except for a few weeds at the edge of the riverbank. These include: Cenchrus
echinatus, Chloris barbata, Eleusine indica (Gramineae), Cyperus difformis, Cyperus
distans (Cyperaceae), Centrosema pubesceus (Leguminosae) and Alternanthera
sessiles (Amaranthaceae).
Within the proposed STP site in Barangka Ilaya is a mini-riverside sitting park
bounded by a few (4) young Polyalthia longifolia (Annonaceae) trees and an Ixora
chinensis (Rubiaceae) or santan hedge with some Bougainvillea spectabilis
(Nyctaginaceae) plants. At the edges of this mini-park are a few weeds:
Alternanthera sessilis (Amaranthaceae), Malvastrum coromandelinum and Sida
Acuta (Malvaceae), Mimosa pudica (Leguminosae), Eleusine indica, Axonopus
compresus, Cenchrus echinatus, Chloris barbata (Graminae). The lift station will be
constructed in a concrete space adjacent to an existing basketball court. The site is
devoid of any vegetation.
DRAFT
A - 43
9:42 AM 02/09/05
Regional Environmental Assessment
The site of the proposed STP for Barangay Poblacion in Makati City is a narrow strip
of open space between J.P. Rizal St. and the riverbank. Standing within this strip are
two Cocos nucifera (Palmae) and two Acacia auriculiformis (Leguminosae) trees.
On the ground layer which is hard and sandy are a few stunted Ricinus communis
(Euphorbiaceae) seedlings and tufts of the following cosmopolitan weeds: Chloris
barbata, Cynodon dactylon and Eleusine indica (Gramineae), Cyperus rotundus and
Fimbristylis barbata (Cyperaceae), Mollugo oppositifolia (Aizoaceae) and Malachra
capitata (Malvaceae).
The site selected for the establishment of the Septage Treatment Plant (SPTP)
facility to service the northern sub-area is located near the Payatas open dumpsite in
Quezon City. The Payatas site is basically an open grassland dominated by
extensive stands of cogon (Imperata cylindrical) and talahib (Saccharum
spontaneum) in association with ruderal herbs (characteristic of open wastelands).
Within the site is a narrow dry creek lined with a few trees and shrubs. Patches of
burned areas with newly sprouted cogon and talahib blades were noted during the
survey. The area does not have threatened or endangered plant species.
For the southern sub-area, the selected site for the SPTP is a vacant lot of about a
thousand square meters within the Food Terminal, Inc. (FTI) Complex in Taguig,
Metro Manila. The area is essentially an open wasteland, with a few large trees
along the edges and a stand of ipil-ipil shrubs at its entrance. An aggregate of 47
species under 20 Families was recorded during the survey of the FTI site (Table __).
Occupying the central portion of the lot is a dense stand of Amaranthus spinosus
and A. viridis together with herbaceous legumes Crotolaria verrucosa and
Centrosema pubesceus. At the fringes of the stand are herbs that are usually
present in open wastelands. These herbaceous species serve mainly as ground
cover to minimize erosion and as producers of organic matter in the habitat. At the
edge of this proposed site are four large and tall Enterolobium saman trees and at
the entrance is a dense strip of Leucaena leucocephala and Ricinus communis
shrubs. The presence of eggplant, kamote, ampalaya, kamoteng kahoy and papaya
plants may indicate that there is some planting activity in the area. The area does
not contain any endangered or threatened plant species. Only a few small white and
yellow butterflies were observed to be fluttering over the Amaranthus stand.
The proposed STP site in the Manggahan Floodway East Bank area is an open
wasteland. An aggregate of 77 species under 29 Families was recorded. Most of
the eight tree species in the list were sighted at the backyards of the densely
populated communities along the opposite bank of the man-made creek. These were
mostly fruit-bearing trees. Most of the 66 herbaceous species recorded in the actual
site for the STP and adjacent areas are the very common grasses, herbs and vines
that usually colonize open areas. A majority of these are grasses (Gramiveae) and
composites (Compositae). Their ecological importance is mainly attributed to their
roles as ground cover to prevent soil erosion and food as well as habitat for insects
and other small field fauna. The presence of a few species providing edible fruits
(Cucurbita and Momordica), roots (Manihot and Colocasia) indicates that nearby
residents may be using the area to grow these and perhaps other plants during the
year.
The STP site at Signal Village (Ipil-Ipil street) covers an open area within a densely
populated community beside the creek. Because of the sparse vegetation and the
size of the area, a ground inventory of the extant plants was conducted across the
proposed STP. Beside the creek and fronting a residential house is a hedge of a few
Moringa (malunggay), young ipil-ipil and mango trees, a stunted santol sapling and a
DRAFT
A - 44
9:42 AM 02/09/05
Regional Environmental Assessment
patch ofkamote plants. Adjacent to the basketball court are two patches of stunted
bamboo thicket, bananas, ornamental Ipomoeas and sugar cane plants. The vacant
lot vegetation cover includes a tall and six young katuray trees, ipil-ipil, cassava,
banana, and ornamental Ipomoea plants hedging an open waste place covered with
composite, grass and leguminous weeds. There are fifty-seven (57) plant species
belonging to twenty-five (25) Families present in the area. Most of the trees are
cultivated for their fruits. Except for the few species cultivated as vegetables sources,
the herbs in the floristic list are characteristics colonizers of open waste places and
serve as producers (through photosynthesis) in the ecosystem and as ground cover
to minimize soil erosion. Incidentally, the list does not include any threatened or
endangered plant species.
Scattered along the Marikina riverbanks are cultivated plots planted with vegetable
crops such as the common beans Phaseolus vulgaris, Phaseolus radiatus and Vigna
sesquipedalis, tomato (Lycopersicum esculentum), peanut (Arachis hypogea), and
pechay (Brassica juncea). According to the caretaker or planter, corn (Zea mays) is
usually grown during the summer. Aside from the cultivated plants, 70 species
belonging to 20 Families were recorded. A majority of these are herbaceous species
under Families Compositae, Cyperaceae, Graminae and Leguminosae and are
usually found in open waste places. The few trees lining the road cut are relatively
young and small since this thoroughfare was constructed only a few years ago.
The CST 33 at East Avenue, to be upgraded into a mini regional STP, sits
underneath a small woodland area within the (National Ecology Center) compound of
the Forest Management Bureau along East Ave. Most of the trees are mature and
since they were planted close to one another, they are quite tall with high canopies.
A majority of these are Swietenia (mahogany) and Bauhinia species. Adjacent to this
wooded area is a narrow strip of an open wasteland beside the concrete fence of the
Minting Plant of the Bangko Sentral ng Pilipinas. An aggregate of 81 species
belonging to 37 Families was observed. The site where the trees are growing above
the CST had no vegetation cover or undergrowth because apparently this was being
used as a mini-sitting park. Hence, the herbaceous plants in the list were
encountered in the strip of open waste area beside the boundary of the Bangko
Sentral ng Pilipinas (Central Bank) minting plant. These herbs, grasses and sedges
serve as a cover to minimize soil erosion and mainly as primary producers in this
open habitat.
Around CST 20 at Road 5, Project 6 are ornamental shrubs and small trees which
include golden shower, buenavista, bougainvillea, papaya and neem tree. The other
trees in the list are growing in adjacent or neighboring houses behind concrete
fences, which will not be affected by the project.
All the proposed STP sites do not contain any rare or endangered plant species.
The list of plant species for each project component can be found in Annex 3 of the
EIS (Volume2).
Terrestrial Fauna
There are no wildlife fauna in the project area. The animals present in the area are
mostly domesticated species of dogs, cats, fowls, birds, etc. Water buffaloes were
observed in the Laguna lake area (Taguig Sewerage System). The bird population
in the area is not significant except for those that habitates the lake and rice field
areas at Taguig and Taytay. It is expected that there are no rare, threatened or
endangered species of animals in the project area due to its urban setting.
DRAFT
A - 45
9:42 AM 02/09/05
Regional Environmental Assessment
A.2.2 Aquatic Ecology
The main goal of the Aquatic Ecology Survey is to determine the present
environmental state of the river systems and other water bodies which may be
affected by the proposed sewage treatment plants (STPs), and the upgrading of
existing communal septic tanks (CST) to sewage treatment plants. This report aims
to present the results of sampling effort:
Ř to analyze and interpret the plankton and soft-bottom benthic communities of the
river systems and other water bodies;
Ř to obtain information on the freshwater fishes and other aquatic life; and
Ř to determine the other uses of the aquatic systems.
Sampling Methods and Analyses
Sampling Stations
Plankton and soft-bottom benthos samples from 29 sampling stations within the 5
project areas were collected on 14 - 15 November and 6 and 9 December 2003
distributed as follows: 6 stations at the proposed STPs in Quezon City; 10 stations
at the proposed STPs on the riverbanks of Pasig River, located in Makati,
Mandaluyong and Pasig; 3 stations at the proposed STP along the riverbank of
Marikina River, located near Camp Atienza; 8 stations at the proposed Taguig STPs
project, located along Hagonoy Creek, Taguig River, Labasan River and Tapayan
River, adjacent to the Laguna de Bay; and 2 stations at the proposed construction of
CST for low-income communities located in Pinagsama Village (Taguig) and East
Manggahan Floodway (Taytay).
Since the sampling program was conducted simultaneously with the water quality
sampling, the station locations are the same as shown in Figure 6-10. The
approximate depth, types of bottom sediment and coordinates of each sampling
station are indicated in Table 6-14.
Table 6 - 14. Sampling Station Location, Approximate Depth and Types of
Substrate.
Approx
Types
Project
Sampling
Station
Location
Depth
of Bottom Sediment
Area
Area
Number
(m)
(Color)
Taguig
Hagonoy Creek
1a1
Upstream (10m away
>0.5
Muddy
(Taguig
from the gate of
full of debris
09 Dec
Sewerage
DPWH Flood Control
(black)
2003
Project)
System)
1a2
Downstream (Laguna
0.5
Sandy-muddy with
09 Dec
de Bay)
debris (black)
2003
Taguig River
1b1
Upstream (100 m
0.5
Muddy full of debris
09 Dec
away from DPWH
(black)
2003
floodgate)
DRAFT
A - 46
9:42 AM 02/09/05
Regional Environmental Assessment
Approx
Types
Project
Sampling
Station
Location
Depth
of Bottom Sediment
Area
Area
Number
(m)
(Color)
1b2
Downstream (50 m
0.5
Sandy-muddy
09 Dec
off the mouth of
with debris
2003
Taguig River, Laguna
(black)
de Bay)
Labasan River
1c1
Upstream (150 m
>0.5
Muddy (brown)
09 Dec
away from DPWH
2003
floodgate)
1c2
Downstream (150 m
0.5
Sandy-muddy with
06 Dec
away from DPWH
debris
2003
floodgate, Laguna de
(black)
Bay)
Tapayan River
1d1
Upstream (below the
> 0.5
Bottom full of solid
06 Dec
Ilog Tapayan bridge,
wastes
2003
Brgy. San Juan,
(black)
Taytay)
1d2
Downstream (off the
0.5
Muddy
06 Dec
mouth of Tapayan
(black)
2003
River, Laguna de
Bay)
Pasig River
Makati, J.P. Rizal Street
2a1
Upstream
1.0
Sandy-muddy with
(Riverbank
(near the bridge)
gravel (black)
14 Nov
STPs)
2003
2a2
Creek/Outfall
0.5
Hard bottom
14 Nov
2003
2a3
Downstream
1.0
Hard bottom
14 Nov
2003
Mandaluyong,
2b1
Upstream (below the
>0.5
Sandy-muddy with
Barangka Ibaba,
14 Nov
bridge)
debris (black)
Guadalupe Bridge
2003
2b2
Outfall
>0.5
Hard bottom
14 Nov
2003
2b3
Downstream
0.5
Sandy-muddy with
14 Nov
gravel (black)
2003
San Andres, Barangay
2c1
Outfall
>0.5
Hard bottom
Pineda, Pasig
14 Nov
2003
2c2
Creek/Outfall
>0.5
Hard bottom
14 Nov
2003
2c3
Upstream
0.5
Muddy with debris
14 Nov
(black)
2003
2c4
Downstream
0.5
Sandy gravelly (black)
14 Nov
2003
Taguig
Pinagsama Village (low
4b
Below the bridge
0.5
Creek full of floating
income communities)
09 Dec
solid wastes
2003
(black)
Marikina
Near Camp Atienza
5a
Upstream
0.5
Muddy with sand &
River
15 Nov
debris (black)
(Quezon City
2003
Marikina
5b
Outfall
1.0
Muddy with debris
STP)
15 Nov
(black)
2003
DRAFT
A - 47
9:42 AM 02/09/05
Regional Environmental Assessment
Approx
Types
Project
Sampling
Station
Location
Depth
of Bottom Sediment
Area
Area
Number
(m)
(Color)
5c
Downstream (along
0.5
Muddy with sand &
Camp Atienza)
debris (black)
15 Nov
2003
Quezon City
Road 5, Project 6
6a1
Upstream
0.5
Hard bottom
(Upgrade of
(below the bridge)
15 Nov
CSTs)
2003
6a2
Outfall
0.5
Hard bottom
15 Nov
2003
Quezon Avenue cor.
6b
Upstream
<0.5
Hard bottom
Scout Santiago
15 Nov
2003
East Avenue cor.
6c
Along the creek
<0.5
Hard bottom
Matalino Street (across
15 Nov
Phil. Heart Center)
2003
Anonas cor. Tindalo
6d1
Upstream
0.5
Hard bottom
Street (near the bridge)
15 Nov
2003
6d2
Outfall
0.5
Hard bottom
15 Nov
2003
Taytay (Low
East Manggahan
4c
Along the floodway
Bottom full of solid
Income STP)
Floodway (low income
06 Dec
0.5
wastes
communities)
2003
(black)
Plankton
Duplicate 1-liter water samples were collected at each station for phytoplankton and
zooplankton analyses. Plankton samples were preserved in 10% formalin while in
the field. The samples were made to stand undisturbed for one week to allow
organisms to settle at the bottom of the container. The supernatant liquid was
siphoned off and an aliquot was taken as subsample of the plankton catches for
analysis.
All samples were, at first, examined microscopically to determine the identity of the
components represented and were, later, counted for organisms. For analysis,
phytoplankton and zooplankton were grouped according to the following major
components:
The phytoplankton
Ř Cyanophyceae (blue-green algae)
Ř Chorophyceae (green algae)
Ř Bacillariophyceae (diatoms)
The zooplankton
Ř Ciliates
Ř Phytoflagellates
Ř Rotifers
Ř Cladocerans
Ř Copepods
DRAFT
A - 48
9:42 AM 02/09/05
Regional Environmental Assessment
The samples in aliquot were then examined and counted using the usual Sedgwick-
Rafter cell (1 ml in capacity and 20mm x 50mm x 1 mm in dimensions), and the total
numbers of organisms were determined. The counts of individuals in each
phytoplankton and zooplankton groups of the sample were transformed to a number
of cells (no. cells/L) or individual organisms per liter of water (no. of indv/L).
Soft-Bottom Benthos
Duplicate soft-bottom benthos samples were taken from selected stations using the
Ekman bottom grab. The bottom sediments were placed on the labeled plastic bags,
stained with Rose Bengal and fixed in 10% formalin solution.
In the laboratory, samples were sieved into a 0.5-mm wire mesh and washed with
tap water to get rid of excess formalin. A stereozoom microscope was used to sort
and identify benthos specimens. Identified organisms were placed in vials containing
70% alcohol and classified to family level if possible. Sorted specimens were
counted to calculate their density, expressed in number of individuals per square
meter (no. of indv/m2).
Fisheries, Types of Aquatic Life and Other Uses
Field observations and informal interviews with local residents, particularly the
guides, boat operators and local barangay officials, and persons who were
encountered during the survey at each sampling site were conducted to obtain
current information on the local fishery conditions, types of aquatic life, and other
beneficial uses of the aquatic habitats.
Summary of Results and Discussion
The results and discussion on the aquatic survey are summarized below. Details of
the aquatic survey for each component including tables are given in the EIS (See
Annex 11).
Plankton
The phytoplankton communities of all areas studied were characterized by a scarcity
of diatoms and were generally dominated by the abundance of blue-green algae,
primarily Polycystis (the most numerous) that are considered to be characteristic of
eutrophic ("nutrient-rich") water body. This is probably caused by cultural
eutrophication, which is most frequently caused by the fertilization of water with
nutrients in sewage that contains detergents, human wastes, and animal wastes a
condition that represents one of the more serious and extensive forms of water
pollution besetting mankind today (Owen, 1975). This contrasts with oligotrophic
("nutrient-poor") water body, which is unproductive because of the restricted
availability of nutrients. The present findings are identical with the generalized
conclusion that in eutrophicated water or those with high pH blue-green algae are
more abundant and in clear waters of neutral pH diatoms are the more abundant
(Welcomme, 1985). We may therefore assume that the phytoplankton condition of
the river systems and other water bodies surveyed is of the so-called eutrophic
plankton type because the blue-green algae are the more abundant.
The animal plankton communities studied were dominated by ciliate Paramecium
and phytoflagellate Euglena (most common micro-zooplankton organisms although
DRAFT
A - 49
9:42 AM 02/09/05
Regional Environmental Assessment
not present in all sampling stations) that form a part of the food supply for minute
aquatic animals. The presence of these protozoans in the plankton samples
indicates that the freshwater bodies surveyed are very rich in decaying vegetation
and/or organic matter.
Soft-Bottom Benthos
The substratum is the most important factor influencing the distribution of benthic
organisms. Therefore, hard and soft bottoms characterize the benthic communities
in the water bodies surveyed. Many other factors such as, light intensity, nutrients,
water movements, stability of the substrata and water depth also affect the
distribution and biological diversity of the benthos.
In Quezon City, no study on benthos was done due to the hard bottom conditions of
the sampling sites. Similarly, hard bottom was observed in all the outfall stations
along Pasig River. Thus, sampling for benthos in these stations was also not
possible. However, only 2 major taxonomic groups, namely, oligochaeta and insecta
(diptera), represented the soft-bottom benthic communities along the upstream and
downstream areas of the Pasig River. Oligochaeta was the most dominant. The
dipteran larva or chironomid larva [Chironomus sp. (Family Chironomidae)] was
recorded from only 2 locations along J.P. Rizal upstream and Barangay Pineda
downstream. The observed presence of this benthic organism at these two stations
was may be partly due to the kind of sediment with sandy-muddy with gravel. On the
other hand, the type of substrates of all the other sampling stations consisted of
either sandy-muddy with debris, muddy with debris or sandy gravelly. The color of
these bottom sediments in Pasig River was black with a smell of hydrogen sulphide.
The benthos of the areas surveyed in Pasig River was relatively poor. The highly
polluted bottom substratum, due to the accumulation of large amount of waste
materials, does not afford an environment suitable for soft-bottom benthic
organisms. Further, this area has unstable mud bottoms and heavy siltation, which is
not a normal environment and is probably even detrimental for infaunal organisms.
The bottom in Marikina River was characterized by muddy with sand and debris type
of sediment while at the outfall was muddy with debris. The colors of these bottom
sediment types were black. The only soft-bottom benthic fauna that were observed in
these stations were polychaeta (solely represented by nereid Namalycastis sp.),
oligochaeta and insecta (solely represented by dipteran larva Chironomus sp.). The
polychaete Namalycastis sp. was absent in the outfall area but common along the
riverbanks particularly in the downstream area. At this particular area of the river
system kangkong is being propagated. Submersed vegetation, where present, also
acts as a center of concentration for benthic invertebrates (Welcomme, 1983).
All the samples taken from the upstream areas in Taguig were characterized by the
total absence of benthic organisms, except in the Taguig River upstream where only
a nematode was present. The type of substrates at these stations was consisted of
mud full of debris. These sediments probably enabled the benthos dwellers to thrive.
Tapayan River upstream was not sampled because of the nature of its bottom which
is full of solid wastes.
Benthos is one of the important links in the food chain of the fishes in Laguna de
Bay. This group of organisms plays a very important role in the overall productivity of
the area. The soft-bottom benthic communities in the downstream area (off the
rivermouths in Laguna de Bay) can be characterized as an oligochaete population.
The type of substrates at these stations was consisted of mud with debris. Available
DRAFT
A - 50
9:42 AM 02/09/05
Regional Environmental Assessment
information based on monthly monitoring surveys conducted in Laguna de Bay
showed that oligochaetes in Laguna de Bay were represented by Limnodrilus,
Branchriura and Naididae (LLDA-DENR, 1998). Among the midges or chironomid
larvae population, only Chironomus sp., was present in the samples but only in one
location at Labasan River downstream.
In Pinagsama Village Creek, soft-bottom benthos study was never attempted to
collect sediment samples because the water body was full of floating solid wastes
dumped on the area. The field survey indicates that the creek needs most attention
for solid waste collection. On the other hand, several attempts failed to collect bottom
sediment samples during the survey in East Manggahan Floodway (Taytay). It was
observed that the bottom of the floodway was full of submerged solid wastes such as
plastic, rubber, clothes, rice sacks, cans, bottles, etc. Thus, no benthos samples
were taken at this station for soft-bottom benthos analysis.
Fisheries, Types of Aquatic Life and Other Uses
No fishing activity of any type occurs in the water bodies surveyed in Quezon City.
However, in the process of conducting plankton study at Station 3 (East Avenue),
researchers have observed numerous small fishes, probably gambuasia or mosquito
fish (locally known as kataba). The gambusias Gambusia affinis or Poecilia formosa
(Family Pocfillidae) are used to exterminate mosquito larvae in lakes, ponds, and
streams. Gambusia feed on other small fish as well as on mosquito larvae. The
presence of this small fish in this station suggests that this fish is also common in all
other stations surveyed.
Of the kinds of fishes present in Pasig River, janitor fish (scientifically known as
Hypostomus plecostomus) is apparently the most abundant. The other fish stocks
reportedly present in Pasig River include Tilapia (Oreochromis sp.), Manila catfish or
kanduli (Arius manilensis), Common carp or karpa (Cyprinus carpio), Goby or biya
(Glossogobius guirus), Snakehead or dalag (Ophicephalus striatus), Gourami or
gurami (Trichogaster sp.). Common crustaceans include shrimps or hipon and crabs
or talangka (Orapsus sp.). These aquatic resources are pollution-tolerant species
flush down from Laguna de Bay or Marikina River.
Fishing with the use of pole and line or kawil was observed in the Pasig River almost
everyday, one in the morning usually starts at 6 am and also one in the afternoon
usually starts at 3 pm. Along the riverbanks of Barangay Pineda alone, there are
about 30 fishers operating. The fish caught are not just only for recreation but also
for local consumption. Another form of fishing is the use of fish net or lambat. The
gear is operated only in November and December mainly to catch shrimps or hipon.
Fishing with the use of cast net or dala on board a small non-motorized banca was
also observed below the Guadalupe bridge. Experimental fishing was conducted
during the survey using a simple scoop net in the outfall area at Barangay Pineda.
The catch included mostly juvenile Tilapia and some Janitor fish.
Janitor fish is also the most common and abundant aquatic life found in all parts of
the Marikina River. Their presence in the area is much more abundant and
widespread than those observed in Pasig River. The river system support
sustenance fishing. However, the river ecosystem and the harvestable fish
community which is supported, are dependent upon seasonal rainfall. Such fisheries,
therefore, are only produced mainly for family consumption. The important fishes
caught in the river were Tilapia (Oreochromis sp.), Bighead carp (Aristichthys
nobilis), Goby or biya (Glossogobius guirus), Snakehead or dalag (Ophicephalus
DRAFT
A - 51
9:42 AM 02/09/05
Regional Environmental Assessment
striatus), Native catfish or hito (Arias macrocephalus) and Gourami or gurami
(Trichogaster sp.). Kangkong is being grown on both sides of the Marikina River. The
harvest of kangkong is sold in public markets all over Metro Manila. Local residents
use the river for human transport, from the side of Camp Atienza to the community
located across the river, using non-motorized boat. Some local folks also use the
river for the collection of recycable plastic materials.
In the upstream areas of Taguig, fishing is practically non-existent. It was observed
during the survey that Taguig River system is mainly used for boating (navigational)
purposes, such as the transport of local farmers/fishers and the agriculture/fishery
products.
Fishing and gathering of other aquatic products are extremely heavy along the shore
areas of Taguig River systems in Laguna de Bay. Fishing operation take place
round the clock. The fishing gears operating in the area are the gill nets (pante), fish
corral (baklad), motorized push nets (suro), longline (kitang), enclosing net (takibo or
dayakos/pukot), and fish traps (skylab, roborat, and bukatot) (Nasino, 1994). The
major gears used for catching shrimps in the lake are motorized push nets (suro),
manual push nets (sakag), shrimp pot (bubo), and shrimp brush shelter (bunbon)
(Mercene and Nasino, 1991).
The commercially important fishes caught in the lake were Tilapia (Oreochromis sp.),
Silvery therapon or ayungin (Therapon plumbeus), Manila catfish or kanduli (Arius
manilensis), Goby or biya (Glossogobious guirus), Bighead carp or bighead
(Aristichthys nobilis), Milkfish or bangus (Chanos chanos), Snakehead or dalag
(Ophiocephalus striatus), Common carp or karpa (Cyprinus carpio), Gouramy or
gurami (Trichogaster sp.) Catfish or hito (Clarias sp.) and Lacustrine goby or dulong
(Mirogobius lacustris).
There are eight endemic fish species in the lake (Mercene, 1990). These are Goby
or biya (Glossogobious guirus), Silvery therapon or ayungin (Therapon plumbeus),
Snakehead or dalag (Ophiocephalus striatus), Ornate sleeper (Ophiocara aporos),
Lacustrine goby or dulong (Mirogobius lacustris), Climbing perch or martiniko
(Anabas testudineus), Native catfish or hito (Arias macrocephalus), and Manila
catfish or kanduli (Arius manilensis).
Generally, the quality of fish obtained in the lake is quite poor due to the small size of
the fish caught (Delmendo, 1977). The lake's estimated annual fishery production
varies. Fish production declined from 82,881 in 1963 to 20,398 mt in 1980. Snail
production decreased from 153,880 to 66,132 mt in the same period (Mercene,
1986). Aggregate annual fish production (1978-1980) yielded 25,678.14 mt caught
by four major gears such as gill net, fish corral, motorized push nets and long line
(Mercene, 1987). Actual survey of all snail (melanid) dredgers in 1982 reported to
have an average catch of 364 kg per day. The annual production was estimated at
64,154 mt (Mercene, 1987). The aggregate annual production of goby
(Glossogobius guirus) and dulong (Mirogobius lacustris) in the period 1989-1990 was
1,139,190 mt and 206 mt, respectively (Mercene and Nasino, 1991). The aggregate
shrimp production based on landed catch in the period 1987- 1988 was 12,066 mt
(Mercene and Nasino, 1991). Goby production had increased from 612.4 mt (1989)
to 1,167.4 mt (1990) (Mercene and Nasino, 1994). The total annual production of the
commercially important fishes from February 1994- January 1995 was 4,384 mt
(Nasino, 1995).
DRAFT
A - 52
9:42 AM 02/09/05
Regional Environmental Assessment
Fish pens and fish cages are also placed along the shores of the project site.
Laguna Lake Development Authority (LLDA) regulates the construction of the fish
pens and fish cages in the lake. The revised Fishery Zoning and Management Plan
(ZOMAP) allotted 10,000 hectares of fish pens and 5,000 hectares for fish cages.
The total hectarage is based on the carrying capacity of the lake. The zoning for fish
pen and fish cage areas is subdivided into seven clusters or zones covering and
fronting lakeshore communities. Among the fish species being cultured include
Milkfish, Tilapia and Bighead carp. The present fishery industry of the Laguna de
Bay can be divided into 2 sectors: fish capture and fish culture (fish pens and fish
cages). Fish capture operations in the area is mainly for sustenance purposes rather
than for commercial endeavors (Delmendo, 1977).
There used to be 13 kinds of aquatic plant life in the Laguna de Bay; now, only two--
the kangkong and the water lily--are left (PRRP-RRS, undated). Growing of
kangkong was observed in Labasan River downstream. A total of about 5 kangkong
gatherers were noted in the area during the survey.
Fish habitation is non-existent in Pinagsama Village Creek. Likewise, no aquatic
plant life was observed in the area during the survey.
Janitor fish was also present at the East Manggahan Floodway. Fishing for
recreation and/or for local consumption by some local residents was reported to exist
in the area. Hook-and-line or kawil is the most common fishing gear used to catch
Tilapia (Oreochromis sp.), Bighead carp (Aristichthys nobilis), Snakehead or dalag
(Ophicephalus striatus), Native catfish or hito (Arias macrocephalus) and Gourami or
gurami (Trichogaster sp.) and Climbing perch or martiniko (Anabas testudineus).
Shrimp or hipon also enter the catches of the sustenance fishers in the area.
Kangkong was also observed along the floodway and is used as food by some local
residents.
A.3
Socio Economic and Cultural Environment
14.2.1.1.1
To characterize the socio-economic and cultural environment of the project area, the
study team utilize secondary statistical information and strengthened by the use of
survey. The survey sed a 60-item questionnaire covering 12 areas: respondent's
profile and Demographic profile, Migration/ settlement history, Perception, Housing
and Utilities, Household Income and Employment, Household Expenditures and
Assets, Community, Environmental Situation, Health Situation, Sanitation,
Assessment of willingness to pay for improved sewerage/sanitation/septage
treatment system. A copy of the questionnaire is presented in Annex 5.
Results and Discussion
Demography
Totaling 485 respondents, majority (53.3%) are females while only 46.7% are male.
Four hundred one or 82.76% were born in Luzon. About seventy-five percent (75%)
of the respondents are in between the productive ages of 30 34. Many of them
(62.3%) have had college education. Almost all (83.33%) are married having more
female children than males. Almost all are Catholic by religion.
DRAFT
A - 53
9:42 AM 02/09/05
Regional Environmental Assessment
Migration and Settlement
Many (37.16%) have stayed in their respective barangays from 1 to 20 years, almost
half of them (49.4%) had stayed in another barangay before.
Perception
Two hundred thirty-eight or 49.17% have knowledge about the project, knowing it
from the enumerators, barangay officials and neighbors. More than half (65.1%) are
in favor of the project, reasoning that it will reduce flooding, improve the cleanliness
of the environment and improve the sewerage system. They recommend that prior to
project implementation information, education and communication campaign should
be done to fully inform and prepare the people.
Housing Utilities
Four hundred twenty-seven or 88% have G.I. sheets for roof; most (79.17%) have
cement for wall. Three hundred seventy-four (71.77%) own their houses while only
74.96% own their lots with a great majority are in the husband's name. The size of
their lots per square ranges from 15 to 500 square meters.
Three hundred eighty-five or 79.33% use LPG for cooking and almost all use
electricity for lighting. Electric bill usually range from Ph 400.00 to Ph 2,000.00.
Almost half (56.37%) has water sealed toilets.
Community
They cited pollution, garbage disposal, floods, robbery, criminal acts, traffic, drugs,
poor drainage, overpopulation and no jobs as problems of their community. They
recommend that the barangay officials and communities should be active in
responding to community problems. Likewise, Barangay San Juan, Taytay request
MWSS to give them water connection. They suggested a job placement agency
should be established, livelihood program emplaced and strict implementation of the
law.
Environment
They perceived the environment to have degraded because of the congestion
created by overpopulation, indiscriminate disposal of garbage, abuse of the
environment, illegal logging, neglect of barangay officials, building of new buildings
and no discipline of the residents as the culprits for the degradation of their
environment.
They suggest that to bring back the beauty of the environment proper waste
management, planting of trees, pollution controls and etc. should be implemented.
They emphasize that the barangay officials should impose the law with the
cooperation of the residents as solutions to the problem
Health Situation
In the last year 57.42% of the respondents indicated that someone in their family got
sick. The sickness mentioned is flu, diarrhea, UTI asthma, colds, fever, and dengue.
DRAFT
A - 54
9:42 AM 02/09/05
Regional Environmental Assessment
Of those who got sick 27.25 % went to private clinics or hospitals for medical
attention.
Sources of Information
The common source of information they usually access from are T.V., radio and
newspaper respectively.
Household or Family Income
The National Statistics Office prepared a "2000 Family Income and Expenditures
Survey". This report presents information on family income and expenditures for
regions and selected urban areas in the Philippines. Taguig was one of the selected
municipalities covered in the 2000 survey. Tanay, Rizal was classified under Region
IV. The information collected provides one indication of the ability of the households
to pay for the services of the proposed sanitation and sewerage project.
Table 6-15 shows average and median annual incomes for Taguig, Tanay, Rizal,
Makati City, Mandaluyong City, Pasig City, Marikina City, and Taytay compared with
other regions in the Philippines for 2000. Compared to other municipalities in the
country, Taguig and Tanay, Rizal have more high-income families. The average
income of households in both locations is lower than the NCR average, though. The
same is true for the median income.
Compared to other cities in the Philippines, Makati City has a very high concentration
of higher income families. The average income of households in Makati City and
Pasig City is over the national average as well as the NCR average. The median
income of the NCR is way above that of the Philippine data.
Marikina City has a high concentration of low-income families as compared to other
cities in the Philippines. The average income of households in Marikina City and
Taytay is below the NCR average.
Table 6 - 15. Average and Median Annual Income in Stations Compared with
Other Areas in the Philippines
Family Income in Stations as
Average
Median
Median as
a Percent of Other Regions
Area
Family
Family
Average
Average
Median
Income
Income*
%
Income
Income
Taguig
230,719
193,092
84
100
100
Tanay, Rizal
246,286
193,092
78
100
100
Makati City
534,058
193,092
34
100
100
Mandaluyong City
275,361
193,092
70
100
100
Pasig City
317,105
193,092
61
100
100
Marikina City
234,820
193,092
82
100
100
Taytay
317,105
193,092
61
100
100
All Philippines
144,039
88,782
62
166
217
NCR
300,304
193,092
64
79
100
Source: National Statistics Office, Family Income and Expenditures Survey
Only data per region is available
Family Income Expenditures for Water
The NSO 2000 survey of family expenditures for water was the primary source of
information of this section. This section estimated the historical and current ability to
DRAFT
A - 55
9:42 AM 02/09/05
Regional Environmental Assessment
pay for water, for the purpose of estimating future ability and willingness to pay for
water and wastewater services.
The NSO Survey showed that in the year 2000, the average annual expenditures for
water in the Taguig and Tanay, Rizal was PhP 2,504 and PhP 2,064, respectively.
The same survey revealed that fuel, light and water comprised 6.3 % of the family
expenditures. Most previous studies have worked on this aggregate figure and
assumed that water rates represent approximately one-third of the total.
On the average families living in other areas of the Philippines reported earning less
income but paying more for water than did the average family in Taguig and Tanay,
Rizal in 2000. These communities spent a higher proportion of their income for
water: 1.27 % in Taguig and 0.84 % in Tanay, Rizal as compared to the NCR
(0.52%). However, the national average is higher at 1.34 %. This is due to the high
average annual income received by households in Taguig, Tanay and in the NCR.
Water consumption is not responsive to income changes (Table 6-16).
Table 6 - 16. Comparison of Average Annual Family Income and Expenditures
for Water, 2000
Annual
Percent of Income
Average Family Living
Average Annual
Expenditure for
Spent of Water
in
Income (P)
Water (P)
(%)
Taguig
230,719
2,504
1.09
Tanay, Rizal
246,286
2,064
0.84
Riverbank Communities
375,508
2,504
0.67
Low Income
275,962
2,504
0.91
Communities
NCR
300,304
2,504
0.83
All Philippine Families
144,039
1,936
1.34
Source: NSO Family Income and Expenditure Survey, 2000.
The NSO Survey showed that in the year 2000, the average annual expenditures for
water in the cities of Makati, Mandaluyong and Pasig was PhP 2,504. The same
survey revealed that fuel, light and water comprised 6.3 % of the family
expenditures. Most previous studies have worked on this aggregate figure and
assumed that water rates represent approximately one-third of the total.
On the average families living in other areas of the Philippines reported earning less
income but paying more for water than did the average family in Riverbank
Communities in 2000. Riverbanks communities spent a higher proportion of their
income for water (1.27 %) as compared to the NCR (0.52%). This is due to the high
average annual income received by households in the NCR. Water consumption is
not responsive to income changes. The national average is higher at 1.34 % (Table
6-16).
DRAFT
A - 56
9:42 AM 02/09/05
Regional Environmental Assessment
Appendix B Monitoring Sites and Programs
Description of EMB Central Monitoring Stations
Station No. 1 Bonifacio Bridge, Marikina
This station is located under Bonifacio bridge which is situated upstream of Marikina River.
This station will represent the quality of water at the upstream section of Pasig River.
Substrate is sandy-gravelly.
Station No. 2 Vargas Bridge, Pasig City
This station is located below Vargas Bridge situated downstream of Marikina River. This
station will provide information on immediate change of water quality in comparison with
Station 1. General bottom characteristics are muddy, sandy and clayish.
Station No. 3 Laguna de bay
This station is located about 1.5 2.0 kilometres lakeward from the mouth of Pasig
River. This station will represent the quality of water from the Laguna Lake as it
enters the Pasig River. Substrate are sandy and muddy.
Station 4 Bambang Bridge, Pasig City
This station is located below Bambang Bridge. This station will provide information
on the immediate change in water quality in comparison with Station 3. Bottom
characteristics are sandy, gravelly, and rocky with empty shells of tulya.
Station 5 Guadalupe Bridge, Makati City
This station is below Guadalupe Bridge and will represent conditions that altered the
water quality from the condition in Station 4. The substrate is sandy-gravelly and
rocky.
Station 6 Lambingan Bridge, Sta. Ana, Manila
The station is below Lambingan Bridge. Results of analysis will indicate further
addition to the deterioration of the river water as it meanders from Station 5. The
substrate is sandy-muddy-gravelly.
Station No. 7 Sanchez Bridge, boundary of Mandaluyong City and Sta. Mesa
Manila
The station is downstream of the San Juan River. The quality of water represents the
load and condition of the sub-basin of this river. Substrate is silty.
Station No. 8 Jones Bridge, Manila
The station landmark is Jones bridge, Binondo, Manila and is downstream of Pasig
River, henceforth, will provide the quality and quantity of discharge from Pasig River
to Manila Bay. Bottom characteristic is sandy/muddy.
Station No. 9 Manila Bay
DRAFT
B - 1
9:42 AM 02/09/05
Regional Environmental Assessment
The station is about 1km from the downstream mouth of Pasig River and the Manila
International Container Port Terminal. It represents the Manila Bay waters as
influenced by Pasig River discharge. Substratum is muddy and sandy.
EMB NCR Monitoring Sites Pasig River
Within the Pasig River, the EMB-NCR has twelve monitoring stations, as follows:
Station No. 1 Delpan, Manila
This station is located approximately 1.5 km near the mouth of the Manila Bay.
Basically, water at this section is highly influenced by the Manila Bay. The area is
characterized by shipping ports, commercial establishments and residential houses.
Station No. 2 - Jones Bridge, Manila
This station coincides with Station No. 8 of the EMB monitoring station and is less
than 1 kilometre from the Delpan Station. The vicinity is characterized as
commercial and institutional establishments where the "Chinatown" is situated. The
area is also heavily populated.
Station No. 3 - Palanca Bridge, Manila
This station is located approximately less than 1 km. from the Jones Bridge station.
The section of the river does not greatly differ from the situation at further
downstream at Jones Bridge since the land use in the vicinity is also a mixture of
residential-commercial and institutional. The Malacanang Palace is just about 200
meters upstream from the bridge.
Station No. 4 Ayala Bridge, Manila
The Ayala Bridge is less than 1 km. from the Palanca Bridge. The condition in the
area is considerably similar to that of Palanca Bridge. There are also some industrial
plants which operate in the area.
Station No. 5 - Nagtahan Bridge, Manila
The Nagtahan Bridge station is approximately 1 km from the Ayala Bridge station.
There is no immediate change in the water quality in comparison with Station 4.
Station No. 6 - Beata
Station No. 7 - Lambingan
This station coincides with Station No. 6 of EMB.
Station No. 8 - Guadalupe Bridge, Makati City
The station corresponds to Station 5 of the EMB.
Station No. 9 West Rembo, Makati
DRAFT
B - 2
9:42 AM 02/09/05
Regional Environmental Assessment
Station No. 10 Bambang, Makati
The station is considered as Station 4 of EMB.
Station No. 11 Buting
The area is highly populated and is characterized by a number of industrial
establishments.
Station No. 12 Kalawaan
Upstream station towards the Laguna Lake.
EMB NCR Monitoring Sites Other
The EMB-NCR also monitors six stations at the San Juan River and five stations at
the Marikina River. Along the San Juan River, the Sanchez Bridge Station which is
located less than 1 km from the junction of the Pasig River coincides with EMB
Station No. 7. Meanwhile, at the Marikina River, Bonifacio Bridge and Vargas Bridge
are monitoring stations No. 1 and No. 2 of the EMB Central for Pasig River,
respectively.
LLDA Monitoring Sites
Being a tributary river of the Laguna Lake, the LLDA monitors the Pasig River in four
regular monitoring stations on a monthly basis. There are five additional stations
which are being monitored during the months (April to July) to monitor impact of
Pasig River backflow into the Laguna Lake.
Monitoring Stations;
The four regular monitoring stations are:
Station 1 Del Pan Bridge
Station 2 Nagtahan Bridge
Station 3 Guadalupe Bridge
Station 4 Near Napindan Channel from the mouth of Marikina River
The five additions stations being monitored during summer are:
1. Napindan Channel (along Pasig River)
2. Bambang Bridge
3. Checkpoint
4. Lighthouse
5. Mouth of Laguna Lake
Within the Laguna Lake, the LLDA has four primary productivity stations and seven
fish disease monitoring stations.
DRAFT
B - 3
9:42 AM 02/09/05
Regional Environmental Assessment
Water Quality Monitoring Activity in Pasig River
Year
Frequency
Parameters Monitored
1990 Weekly
On-site measurement
1992
DO, Temp, salinity, conductivity, pH,
secchi depth, water depth
Twice a month
Laboratory Analysis
BOD, NH4-N, NO2-N, NO3-N, PO4-P
Once a month
Bacteriological analysis (Total Coliform)
24-hr period
DO, salinity, temperature, pH, secchi depth
once during the dry and 5 at stations 1,3,4,6 and 8
times during wet season
Quarterly
On-site measurement
DO, Temp, salinity, conductivity, pH,
secchi depth, water depth
Laboratory Analysis
BOD, NH4-N, NO2-N, NO3-N, PO4-P
Heavy metals ( Cd, Cr, Cu, Ni, Pb, Zn, Hg
) at stations 1,3,4,5,9 in water and
sediments
Sediment and benthos
1993 Once a month
On-site measurement
1998
DO, Temp, salinity, conductivity, pH,
secchi depth, water depth
Laboratory Analysis
BOD, NH4-N, NO2-N, NO3-N, PO4-P
Quarterly (water)
On-site measurement
DO, Temp, salinity, conductivity, pH,
secchi depth, water depth
Laboratory Analysis
BOD, NH4-N, NO2-N, NO3-N, PO4-P
Heavy metals (Cu, Zn) at stations 1,3,4,5,6
and 9 at two depths
1999 Every other month
On-site measurement
present
DO, Temp, salinity, conductivity, pH,
secchi depth, water depth
Laboratory Analysis
BOD, NH4-N, NO2-N, NO3-N, PO4-P
DRAFT
B - 4
9:42 AM 02/09/05

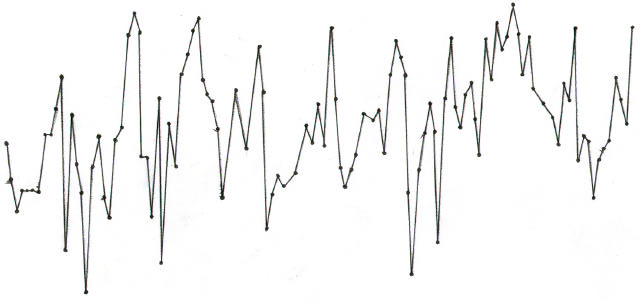
Regional Environmental Assessment
Appendix C Monitoring Data Graphs and Tables
Station 1 Dissolved Oxygen (mg/l)
10.0
9.0
8.0
7.0
6.0
5.0
4.0
Dissolved Oxygen (mg/l)
3.0
2.0
1.0
0.0
Jan-90 May-90Sep-90 Jan-91 May-91Sep-91 Jan-92 May-92Sep-92 Jan-93 May-93Sep-93 Jan-94 May-94Sep-94 Jan-95 May-95Sep-95 Jan-96 May-96Sep-96 Jan-97 May-97Sep-97 Jan-98 May-98Sep-98 Jan-99 May-99Sep-99 Jan-00
Date
DRAFT
C - 1
9:42 AM 02/09/05

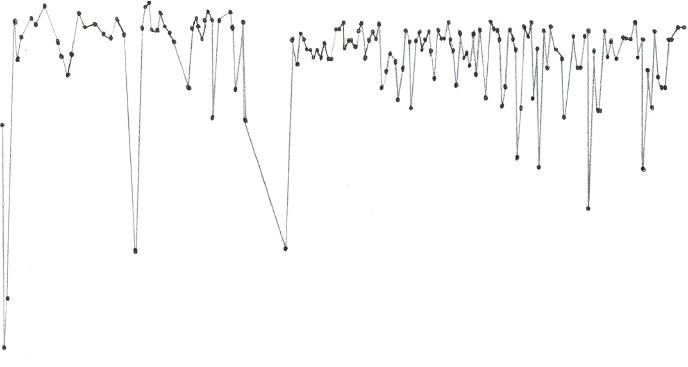

Regional Environmental Assessment
Station 1 Biological Oxygen Demand (mg/l)
41
36
31
26
21
16
Biological Oxygen Demand (mg/l)
11
6
1
Date
DRAFT
C - 2
9:42 AM 02/09/05
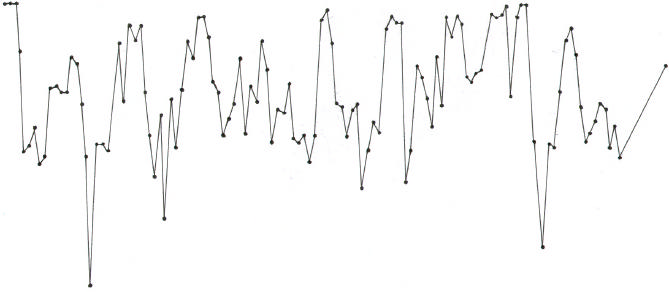
Regional Environmental Assessment
Station 5 Dissolved Oxygen (mg/l)
12.0
10.0
8.0
6.0
Dissolved Oxygen (mg/l)
4.0
2.0
0.0
Apr-90Aug-90Dec-90 Apr-91Aug-91Dec-91 Apr-92Aug-92Dec-92 Apr-93Aug-93Dec-93 Apr-94Aug-94Dec-94 Apr-95Aug-95Dec-95 Apr-96Aug-96Dec-96 Apr-97Aug-97Dec-97 Apr-98Aug-98Dec-98 Apr-99Aug-99Dec-99 Apr-00Aug-00Dec-00
Date
DRAFT
C - 3
9:42 AM 02/09/05

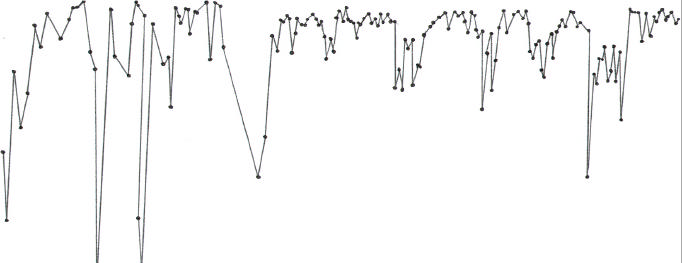

Regional Environmental Assessment
Station 5 Biological Oxygen Demand (mg/l)
81
71
61
51
41
31
Biological Oxygen Demand (mg/l)
21
11
1
Date
DRAFT
C - 4
9:42 AM 02/09/05

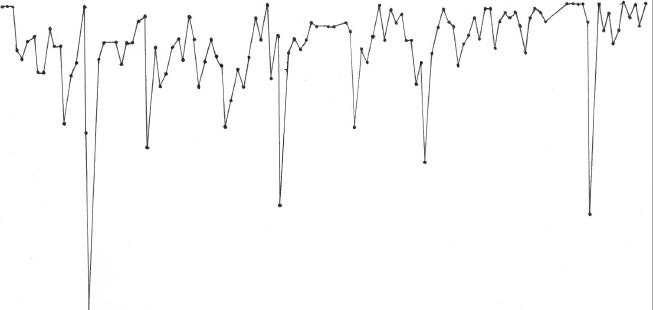
Regional Environmental Assessment
Station 7 Dissolved Oxygen (mg/l)
8.0
7.0
6.0
5.0
4.0
3.0
Dissolved Oxygen (mg/l)
2.0
1.0
0.0
Apr-90Aug-90Dec-90 Apr-91Aug-91Dec-91 Apr-92Aug-92Dec-92 Apr-93Aug-93Dec-93 Apr-94Aug-94Dec-94 Apr-95Aug-95Dec-95 Apr-96Aug-96Dec-96 Apr-97Aug-97Dec-97 Apr-98Aug-98Dec-98 Apr-99Aug-99Dec-99 Apr-00Aug-00Dec-00
Date
DRAFT
C - 5
9:42 AM 02/09/05

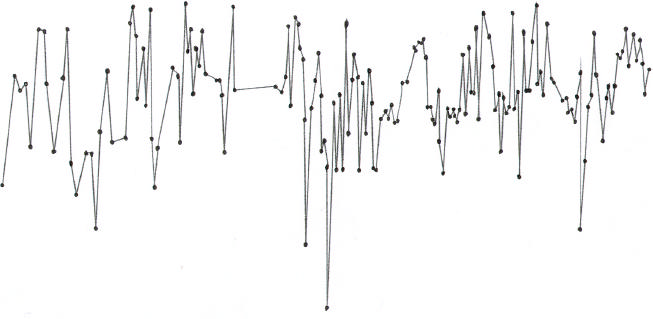
Regional Environmental Assessment
Station 7 Biological Oxygen Demand (mg/l)
141
121
101
81
61
Biological Oxygen Demand (mg/l)
41
21
1
Date
DRAFT
C - 6
9:42 AM 02/09/05
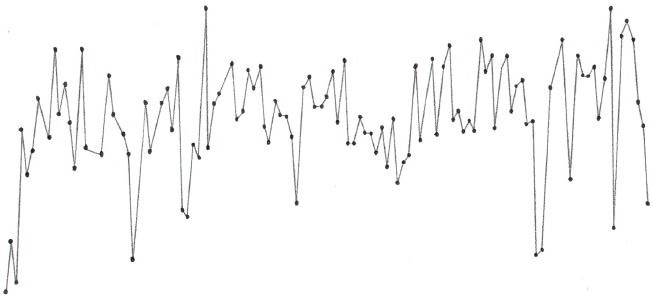
Regional Environmental Assessment
Station 9 Dissolved Oxygen (mg/l)
12.0
10.0
8.0
6.0
Dissolved Oxygen (mg/l)
4.0
2.0
0.0
Apr-90 Aug-90 Dec-90 Apr-91 Aug-91 Dec-91 Apr-92 Aug-92 Dec-92 Apr-93 Aug-93 Dec-93 Apr-94 Aug-94 Dec-94 Apr-95 Aug-95 Dec-95 Apr-96 Aug-96 Dec-96 Apr-97 Aug-97 Dec-97 Apr-98 Aug-98 Dec-98 Apr-99 Aug-99 Dec-99
Date
DRAFT
C - 7
9:42 AM 02/09/05
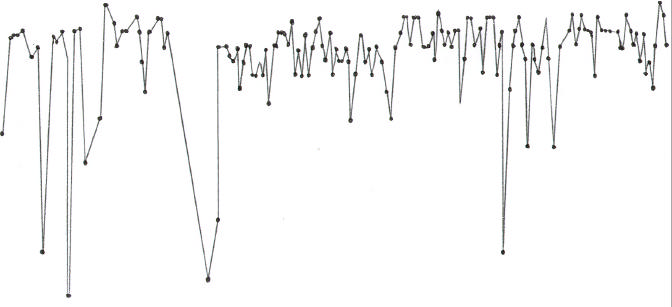

Regional Environmental Assessment
Station 9 Biological Oxygen Demand (mg/l)
26
21
16
11
Biological Oxygen Demand (mg/l)
6
1
Date
DRAFT
C - 8
9:42 AM 02/09/05
Regional Environmental Assessment
Appendix D Institutional Framework Details
D.1
Role of National Agencies in Sewerage Management
D.1.2 Department of Health
The law that gives mandate to the primary agency to protect citizens' health is
Executive Order No. 119 (Reorganizing the Ministry of Health, Its Attached Agencies
and For Other Purposes) issued in 1987, and states.
....shall be primarily responsible for the formulation, planning,
implementation and coordination in the field of health. The
primary function ... is the promotion, protection,
preservation or restoration of the health of the people
through the provision and delivery of health services and
through the regulation and encouragement of providers of
health goods and services (Section 3)
This mandate is consistent with the functions that the Sanitation Code of the
Philippines assigns to the DOH. Among the functions listed in Section 3, three have
direct bearing to sewerage management. These functions are the following:
Ř undertake the promotion and preservation of the health of the people and raise
the health standards of individuals and communities;
Ř develop, administer and coordinate various health activities and services which
shall include public health; and
Ř assist local health services and programs to assure the people of better health
services
The duty of the DOH to set the requirements for sewerage facilities and enforce
compliance is derived from these functions. The DOH unit in charged to perform this
duty is found in its structure as defined in Executive Order No. 119. Part of its
structure is the Office of Public Health Services. It is involved in policy formulation,
standard setting, program development and program monitoring of disease control
and service delivery programs implemented by field offices. Under such office is the
Environmental Health Service. It is the unit that covers sanitation services including
sewerage management. Its tasks are stated as follows:
.....formulate plans, policies, programs, standards and techniques
relative to environmental health and sanitation; provide
consultative, training and advisory services to implementing
agencies; and conduct studies and research related to
environmental health (Section 11).
Like all national departments, the DOH operates in the field through its Regional
Health Offices. It carries out its mandate through its field operations aimed at
providing efficient and effective health and medical services. One aspect of its field
operation is to ensure compliance with sanitation standards specified in Sanitation
Code of the Philippines.
DRAFT
D - 1
9:42 AM 02/09/05
Regional Environmental Assessment
D.1.3 Department of Environment and Natural Resources
The DENR presently operates under Executive Order 192 promulgated in 1987. This
law consolidates some 24 agencies with functions that either wholly or partly cover
environmental management. Its mandate is stated below:
.... the primary government agency responsible for the
conservation, management, development and proper use of
the country's environment and natural resources... as well
as licensing and regulation of all natural resources (Section
4).
Although it is the primary environmental management agency of the government, it
still shares with the other government units some functions. This can be seen in the
management of water resources. The DOH and the National Water Resources
Council (NWRC) among others perform functions aimed at protecting the country's
water resources. Within the DENR, the responsibility to protect the environment
against all forms of pollution largely falls on the Environmental Management Bureau
(EMB). The Bureau has three functions directly relevant to sewerage. In Section 16
of Executive Order No 192, these functions are expressed as follows:
Ř recommend possible legislations, policies and programs for environmental
management and pollution control;
Ř formulate environmental quality standards for water; and
Ř formulate rules and regulations for the proper disposition of toxic and hazardous
substances.
The management of sewerage must comply with the standards as well as rules and
regulations that the Bureau enforces. Among the standards that must be maintained
are contained in DENR Administrative Order No 34 (Revised Water Usage and
Classification Water Quality Criteria) and DENR Administrative Order 35 (Revised
Effluent Regulations of 1990). These national standards can be modified for local
areas by declaring a Water Quality Management Area and then adopting modified
criteria to better suit local conditions. This has been recommended by the Pasig
River Rehabilitation Commission but is now somewhat superseded by the
promulgation of the Clean Waters Act.
The extent the DENR perform its functions in ensuring that sewerage management
will not undermine environmental quality largely rests on the capability of the regional
offices.
In summary, the DOH regulates the management of sewage before and during its
treatment, and the DENR regulates its disposal to ensure that it does not adversely
affect environmental quality.
D.1.4 Department of Public Works and Highways
Section 7 of the "Philippine Clean Water Act of 2004" states that:
"The Department of Public Works and Highways (DPWH), through
its relevant attached agencies, in coordination with the
Department of Environment and Natural Resources, local
government units (LGUs) and other concerned agencies,
shall as soon as possible, but in no case exceeding a period
of twelve (12) months from the effectivity of this Act, prepare
a national program on sewerage and septage management
in connection with Section 8 hereof.
DRAFT
D - 2
9:42 AM 02/09/05
Regional Environmental Assessment
The program is to include a priority listing of sewerage, septage and combined
sewerage-septage projects for LGUs based on population density and growth,
degradation of water resources, topography, geology, vegetation, programs/projects
for the rehabilitation of existing facilities and such other factors that the Secretary
may deem relevant to the protection of water quality. On the basis of such national
listing, the national government may allot, on an annual basis, funds for the
construction and rehabilitation of required facilities.
Section 8 of the same Act states that:
"Within five (5) years following the effectivity of this Act, the agency
vested to provide water supply and sewerage facilities
and/or concessionaires in Metro Manila and other highly
urbanized cities (HUCs) as defined in Republic Act No.
7160, in coordination with LGUs, shall be required to
connect the existing sewage line found in all subdivisions,
condominiums, commercial centers, hotels, sports and
recreational facilities, hospitals, market places, public
buildings, industrial complex and other similar
establishments including households to available sewerage
system: Provided, That the said connection shall be subject
to sewerage service charge/fees in accordance with existing
laws, rules or regulations unless the sources had already
utilized their own sewerage system.
In areas not considered as HUCs, the DPWH in coordination with the DOH and other
concerned agencies, shall employ septage or combined sewerage-septage
management system.
. . . ., the DOH, in coordination with other government agencies,
shall formulate guidelines and standards for the collection,
treatment and disposal including guidelines for the
establishment and operation of centralized sewage
treatment system".
Section 22 of the Act provides that DPWH through its attached agencies such as the
MWSS, LWUA, and including other urban water utilities for the provision of sewerage
and sanitation facilities and the efficient and safe collection, treatment and disposal
of sewage within their area of jurisdiction.
Similar requirements have been included in many other pieces of local legislation,
such as RA9003 Ecological Solid Waste Management Act, requiring government
departments to prepare various comprehensive plans. Sadly these plans are rarely
prepared in the designated timeframe and in many cases, never done at all.
Therefore the status quo on sewerage and sanitation institutional management is
likely to remain in place.
D.1.5 Metropolitan Waterworks and Sewerage System
MWSS is a subordinate agency reporting to the DPWH.
MWSS presently operates under its Republic Act 6234 promulgated in 1971. The act
dissolves its predecessor, the National Waterworks and Sewerage Authority
(NAWASA) and creates the MWSS in its place. The mandate of MWSS is as follows:
The proper operation and maintenance of waterworks systems to
ensure an uninterrupted and adequate supply and
distribution of potable water .....and proper operation and
maintenance of sewerage systems are essential public
services because they are vital to public health and safety.
DRAFT
D - 3
9:42 AM 02/09/05
Regional Environmental Assessment
The MWSS is the principal agency responsible for the provision of sewerage and
sanitation services in the Region. It can directly provide sewerage services or assist
other providers that may be a private or public entity. It means that it may share the
provision of sewerage services to other providers. In the case of subdivisions, the
MWSS has to regulate the operation of their sewerage system. The MWSS can also
issue rules and regulations for protection of water supply lines and sanitary sewers,
the preservation of and protection of water and sewerage service as soon as
established and for proper procedures in applying for approval of and connection to
water and sewerage services.
D.1.6 The Manila Water Company, Inc. and its Service Area
The responsibility of providing water supply, sewerage and sanitation services in
Metro Manila was directed to MWSS since its promulgation in 1971. However,
MWSS was inadequate to provide efficient service to the populace of Metro Manila.
By international standards, MWSS had too many personnel relative to the number of
customers, too little investment in maintenance works and facilities, too much non-
revenue-water, inefficient technology and operating procedures and unreliable
services. Its record in sewerage management is described as having only provided
only a rudimentary collection system to less than 10% of the area of control at best.
To address the demand for improved water services, the Philippine government
opted to transfer MWSS' water-related services to the private sector. It was
anticipated that improvement would be achieved without need for capital
expenditure.
Thus, in August 1997, the Ayala-led Manila Water Company took over the East Zone
of Metro Manila from the government-owned Metropolitan Waterworks and
Sewerage System through a 25-year Concession Agreement (CA), while the Lopez-
led Maynilad Water Services took over the West Zone.
The agreement provides a set of concessionaires' obligations, which includes the
following:
Ř To supply sewerage services to all customers in the service area who have
existing sewerage connections for domestic sewage and industrial effluents
compatible with available treatment processes;
Ř To meet the coverage target percentages of the total population in a target
municipality connected to the concessionaire's water system as per schedule set
in the agreement;
Ř To respond as soon as reasonably practicable to a request for a connection to a
public sewer from the owner or occupant of premises located in the service area;
Ř To comply with all national and local environmental laws and standards relating
to treated wastewater in the service area and in accordance with the schedule of
compliance provided by the Regulatory Office;
Ř To offer septic and sanitation cleaning services in the service area, and to meet
the coverage target percentages of the total population in the target municipality.
The East Zone is home to about 5 million people comprising a 1,400 square
kilometer area that covers 24 cities and municipalities in Metro Manila and Rizal.
These include Mandaluyong, Marikina, Pasig, Pateros, San Juan, Taguig, Makati
and parts of Quezon City and Manila. The towns of Angono, Antipolo, Baras,
Binangonan, Cainta, Cardona, Jala-Jala, Morong, Pililla, Rodriguez and San Mateo
in the province of Rizal are also part of the East Zone.
DRAFT
D - 4
9:42 AM 02/09/05
Regional Environmental Assessment
When MWCI took over the MWSS operations in 1997, sewerage and sanitation
programs of MWSS were limited. Existing sewerage facilities in the East Zone are
the Magallanes Treatment Plant in Makati, communal septic tanks in Quezon City
and individual septic tanks in all the concession areas. These facilities need
improvement and/or desludging.
Originally, the performance target for sewerage in the East Concession area was the
following:
Sewerage Targets East Concession Area (1997)
Sewerage (%
2001
2006
2011
2016
2021
Coverage)
(%)
(%)
(%)
(%)
(%)
Mandaluyong
0
0
100
100
100
Makati (part)
22
52
100
100
100
Quezon (part)
0
0
83
87
98
Pasig
0
41
68
68
68
San Juan
0
0
100
100
100
Pateros
0
60
100
100
100
Taguig
0
52
75
84
100
Review of the JICA Master Plan Study (1996) and the conduct of the First
Wastewater Strategy Plan (2000) concluded that implementing the plan would result
in a PhP10 increase of the water tariff in the 2003 rate rebasing. An additional
problem foreseen is the willingness-to-pay by the populace for sewer connection
and/or sewer charge, and the difficulty in installing and implementing large
centralized sewer systems. MWCI presented instead an alternative decentralized
approach in its 2003 rate rebasing submission. The new targets are as follows:
Revised Sewer Coverage Targets East Concession Area (2001)
Sewerage
2001
2006
2011
2016
2021
(% Coverage)
(%)
(%)
(%)
(%)
(%)
Mandaluyong
0
0.5
4
10
15
Makati (part)
22
40
38
28
23
Quezon (part)
0
13
20
16
17
Pasig
0
9
10
12
14
San Juan
0
0
0
18
41
Taguig
0
5
25
26
20
In line with the objective of the MSSP to assist MWSS in the development of follow-
up sewerage projects, MWSS and MWCI proposed the Manila Third Sewerage
Project (MTSP) for World Bank funding.
D.1.7 Metro Manila Development Authority
The MMDA evolved from the Metro Manila Commission that was created in 1975. Its
present operation derived its mandate from Republic Act 7924 promulgated in 1995.
The MMDA performs planning, monitoring and coordinative functions at the
metropolitan level among the LGUs constituting its area of jurisdiction. It provides
services that are considered more efficiently delivered at the metropolitan rather than
local government level. The delivery at the metropolitan scale is more efficient
because the impact of the services transcends the political boundaries of the
component LGU and entails huge expenditures. Its mandate covers the following
services:
Ř Transportation and traffic;
DRAFT
D - 5
9:42 AM 02/09/05
Regional Environmental Assessment
Ř Solid waste disposal and management,
Ř Flood control and sewerage management.
Ř Urban renewal, zoning land use planning and shelter services;
Ř Health and sanitation;
Ř Urban protection, pollution control and public safety.
Although sewerage management as well as sanitation is within its ambit authority,
the role of MMDA is confined more on macro planning rather than project
implementation. In this manner its functions do not overlap with those of the MWSS.
The MMDA is, for instance, involved in the formulation of the National Capital
Region- Medium Term Development Plan and the Philippine National Urban
Sewerage and Sanitation Strategy Plan. The formulation of a metropolitan-wide plan
is part of its coordination function.
Metro Manila Council manages MMDA. It is a policy-making body composed of
mayors of all cities and municipalities within the metropolis, President of Metro
Manila Vice-Mayor Leagues and President of Metro Manila Councilors Leagues. The
President of the Philippines appoints the chairman of MMDA who also heads the
council. The chairman has a cabinet rank. The financial support of the operation of
MMDA is from its share of Internal Revenue Allotment, national subsidy, 5 percent
contribution from LGU and fines and fees.
D.1.8 Laguna Lake Development Authority
The LLDA was created in 1966 under Republic Act No. 4850. It was initially a quasi-
government agency with regulatory and proprietary functions. Presidential Decree
813 (1975) and Executive Order 927 (1983) strengthen its power by including
environmental protection and jurisdiction on surface water of the lake. Its present
overarching mandate is as follows:
Provide and accelerate the development and balanced growth of
Laguna Lake area and the surrounding provinces, cities and
towns.... within the context of the national and regional
plans and policies for social and economic development and
to carry out the development the development of the Laguna
Lake region with adequate provisions for environmental
management and ....the prevention of undue ecological
disturbances, deterioration and pollution (Section 1).
Under Presidential Decree 813 (Amending Certain Sections of RA 4850 known as
the Laguna lake Development Authority of 1966), its functions are defined. The
functions are mainly macro planning, program implementation and permitting. Some
of its functions are stated in various sections as follows:
Ř To make a comprehensive survey and ... draft a comprehensive and detailed
plan designed to conserve and utilize optimally the resources within the
region particularly Laguna Lake;
Ř To pass upon and approve and disapprove all plans, programs and projects
proposed by local government offices within the region, public corporation
and private persons or enterprises where such plans, programs and or
projects are related to those of the authority for the development of the
region;
Ř To plan, program and undertake infrastructure projects such as rivers, flood
or tidal control works, waste water and sewerage works when so required
within the context of its development plans and programs.
DRAFT
D - 6
9:42 AM 02/09/05
Regional Environmental Assessment
Ř To collect annual fees as provided ... for the use of the lake water and its
tributaries for all beneficial purposes including recreation, municipal,
industrial, agricultural, fisheries, navigational and waste disposal purposes.
The LLDA shares with the MMDA the same functions in the sense that both agencies
are involve in macro planning. On the part of the LLDA, its planning function is
applicable only in the lake region. But in areas that are part of the lake region and
the Metro Manila, the two agencies have to coordinate their plans. The LLDA can
also plan and undertake infrastructure projects on wastewater and sewerage works.
However, it can only do so when its development plans and programs requires. The
main function of providing sewerage facilities still firmly rests with the MWSS.
Executive Order No. 149 (1993) put the LLDA under the administrative supervision of
DENR. Its function to make a comprehensive survey of the lake region and approve
all plans, programs and projects duplicates the monitoring and permitting functions of
the DENR National Capital Regional Office. The duplication is removed by restricting
the performance of such functions by the DENR National Capital Regional Office to
areas outside the lake region.
D.2
Role of Local Government Units (LGU) in Sewerage Management
As all other services, those that pursue the right of the people to health and healthy
environment are better catered at the lowest possible level of government because
its operation is closest to the recipients. At such level, the access of the recipients to
the services is easier and the services can be more responsive to their requirements.
This is one rationale behind local autonomy provided in the Philippine Constitution
that aims to make the LGU self-sufficient in service provision. Toward such end, the
Local Government Code (Republic Act No 7160) has been promulgated. The code
articulates the commitment to make the LGU a capable service provider in the
following manner:
As stated above, one provision that put this principle in concrete terms is on
environmental management in general and sewerage management in particular. The
municipal and city governments gain the responsibility to manage sanitation facilities
including those of sewerage. The code sets the scope of the municipal or city
government's responsibility over these facilities in the following section:
Local government units shall ... exercise powers and discharge
such other functions and responsibilities as are necessary,
appropriate or incidental to efficient and effective provision
of basic services and facilities enumerated herein. Such
basic services and facilities include but not limited to the
following:
... environmental management system and services or facilities
related to general hygiene and sanitation..
Infrastructure facilities intended to service the needs of the
residents of the municipality and which are funded out of
municipal funds including but not limited to ...water supply
systems ... drainage and sewerage...(Section 17)
The provision of sewerage services is a task given to the municipal and city
government together with the other services. One of these services is water supply
provision. There is no provision in the code that these two types of services have to
be jointly provided. But they are interrelated because the provision of one requires
the need for the other. Sewerage is an automatic result of water use.
DRAFT
D - 7
9:42 AM 02/09/05
Regional Environmental Assessment
The responsibility over sewerage management is under the five offices of the
municipal and city government: Municipal or City Environment and Natural
Resources Officer, Municipal or City Administrator, Municipal or City Engineer,
Municipal or City Health Officer and Municipal Planning and Development
Coordinator The Municipal or City Environment and Natural Resources Officer is the
main arm in delivering services on environment and natural resources. However, the
creation of this position is optional and in his absence, the Municipal or City
Administrator may take the task. Part of his mandate is to implement programs and
projects on management and administration. The Municipal or City Engineer will be
involved in the construction and maintenance of the physical facility.
The Municipal or City Health Officer will make and implement the guidelines in
consistent the national laws since public health is within its mandate. These include
the standards, rules and regulations expressed in the Sanitation Code of the
Philippines and its Implementing Rules and Regulations. The role of the Municipal or
City Planning and Development Coordinator will be in planning as well as monitoring
and evaluation of the implementation of sewerage facilities. The Municipal or City
Development Council will have a part in developing the plan. Its will appraise and
prioritize the project and conduct coordination activities in the implementation.
Mandates of Offices of the Municipal and City Government in Sewerage
Management and Their Legal Basis
Office
Mandate
Legal Basis
Municipal of Formulate measures for consideration of the Republic Act 7160
City
Sanggunian and provide technical assistance and Section 484
Environment
support the mayor in carrying out measures to ensure
and natural the delivery of basic services and provision of
Resources
adequate facilities on environment and natural
Officer
resources services.. be in the forefront of the delivery
of services on environment and natural resources
Municipal or Develop plans and strategies and upon approval of Republic Act 7160
City
the mayor implement the same particularly those on Section 480
Administrator
management and administration-related programs
and projects
Municipal or Takes charge of the office on health services, Republic Act 7160
City Health supervise the personnel and staff of said office, (Section 478b1)
Office
formulate program implementation guidelines and
rules and regulations for the operation of the said
office for the approval of the mayor.... assist him in
the efficient, effective and economical implementation
of a health services program geared to
implementation of health related projects and
activities .. execute and enforce all laws, ordinances
and regulations relating to public health
Municipal or Administer, coordinate, supervise and control the Republic Act 7160
City Engineer's construction, maintenance, improvement and repair of (Section 477)
Office
roads, bridges and other engineering designs,
feasibility studies and project management.
Municipal or Formulate integrated development plans and policies Republic Act 7160
City Planning for consideration of the LDC; Conduct continuing (Section 476)
and
studies, researches and training programs necessary
Development
to evolve plans and programs; Integrate and
Office
coordinate all sectoral plans and studies undertaken
by the different functional groups or agencies; Monitor
and evaluate the implementation of the different
development programs and projects and activities
Municipal or Formulate socio-economic development plans and Republic Act 7160
DRAFT
D - 8
9:42 AM 02/09/05
Regional Environmental Assessment
Office
Mandate
Legal Basis
City
programs; Appraise and prioritize socio-economic (Section 109)
Development
programs and projects; Coordinate, monitor and
Council
evaluate the implementation of programs and projects
Private Sector
Participate in the delivery of basic services
Republic Act 7160
(Section 2)
The Department of Interior and Local Government (DILG) will assist the municipality
and city in sewerage management. Part of its mandate as expressed in Executive
Order No 262 (Reorganizing the Department Interior and Local Government) is
establish programs and projects to strengthen the administrative, technical and fiscal
capabilities of LGU. The leading role of the DILG in assisting the LGU on
infrastructure projects is affirmed in NEDA Board Resolution No. 6 Series of 1996.
The resolution states that the DILG will provide the LGU assistance in the
implementation of devolved infrastructure programs and projects in institution and
capacity building.
If the municipality or city will opt not to provide the sewerage services on it own, it
can create and operate an economic enterprise to do it. The code grants the LGU
corporate power (Section 22). Included in the power is the exercise of its proprietary
functions where the LGU can engage in the business of providing sewerage services
through an enterprise. This is the second option for the municipality or city to fulfill its
mandate to provide sewerage services. A well-managed enterprise can earn for the
municipality or city additional revenues. The Philippine BOT Law (R.A. 6957, as
amended by R.A. 7718) and the Local Government Code of 1991 (R.A. 7160)
provide the legal basis for Local Government Units to enter into PSP/BOT contracts
and/or joint venture agreements with the private sector.
The third option is to lease by ordinance the operation of the sewerage facilities to a
private sector group as provided in Section 17j of the code. Under the same
corporate powers of the municipality or city can exercise the fourth option. It will
transfer the management of water utility including sewerage management to a Water
District. A Water District is a non-profit, quasi-public, independently administered
enterprise. It is created to operate water supply and distribution systems and to
provide wastewater collection, treatment and disposal facilities. It is clear that the
mandate of the Water District is to manage both water and sewerage provision.
A water district has a geographic jurisdiction in terms of service area but it is not
considered part of political subdivision. Under the law (Presidential Decree No. 198),
it has all the powers and privileges of a corporation. But the water district relies much
on the LGU for smooth operation. For instance, the LGU must assist the Water
District in enforcing its rules and regulations since it has no coercive power of the
government. The LGU has also the right to appoint the members of the board of the
Water District. The Water District can obtain financial, technical and management
assistance from the Local Water Utilities Administration (LWUA). It is a government
corporation created to develop and promote local water utilities.
The DENR and DOH affirms the role of the municipalities and cities in sewerage
management. In DENR Administrative Order No. 30 Series of 1992 (Guidelines for
the Transfer and Implementation of DENR Functions Devolved to the Local
Government Units), the DENR delineates the functions it retains and those devolved
to the LGU. It accedes that environmental management systems and services
related to general hygiene and sanitation such as sewage belongs to the LGU. For
its part, the DOH requires the LGU to provide and maintain a satisfactory system of
drainage in all inhabited areas where wastewater could empty. This requirement is in
DRAFT
D - 9
9:42 AM 02/09/05
Regional Environmental Assessment
of Implementing Rules and Regulations of Sewage Collection and Disposal, Excreta
Disposal and Drainage (Chapter 17) of the Code on Sanitation of the Philippines.
D.3
Role of the Private Sector
The constitutional provision recognizing the indispensable role of the private sector in
service provision is translated into laws that encourage its participation. The private
sector certainly is one option in sewerage management in Metro Manila. The laws
that give incentives to the private sector investments include the following: Executive
Order No 226 (Omnibus Investment Code of 1987; Republic Act No 7042 (Foreign
Investment Act of 1991) and Republic Act No 7718 (Build-Operate-Transfer Law). A
study on water supply and sewerage privatization (Price Waterhouse, 1996) offer the
following advantages if water-related services are privatized through BOT or
concession:
Ř Management and staff will be allowed to operate using private sector
practices and procedures;
Ř The most advance and economic technologies can be imported through a
strategic partner skilled in the management and operation of large water
utilities;
Ř Management and staff would have the opportunity for improved working
conditions and compensation through increased efficiency in operations and
participation in skills-enhancement; and
Ř The provision of investment capital by the private sector will relieve the
government from the burden of borrowing funds on public account.
The study uses the MWSS being a government owned and controlled corporation
(GOCC) as an argument for the transfer of water-related services to the private
sector. By international standards, MWSS had too many personnel relative to the
number of customers, too little investment in maintenance works and facilities, too
much non-revenue-water, too inefficient technology and operating procedures and
too unreliable services. Its record in sewerage management is even less rosy being
described as having only rudimentary collection system at best.
But the enabling law of MWSS has enough legal powers to privatize its water-related
services. Two laws further strengthen such power. Executive Order No 286 (6
December 1995) directs the reorganization of MWSS to prepare for eventual
privatization where feasible. Executive Order No 311 (30 march 1996) opens the any
or all segments of MWSS operation to private sector participation. The options for
such participation are enumerated as follows:
Ř Franchising, concession, management or other arrangement;
Ř Privatization;
Contracts for projects to be implemented under build-operate-transfer (BOT) or other
related scheme for the financing, construction, repair, rehabilitation, improvement
and operation of water facilities and projects related to consumers.
The MWSS select the grant of concession where the private concessionaire is
responsible for the operation and maintenance of assets and investment. The
ownership of assets remains with MWSS and the rights to their use including those
acquired during the concession period will revert to the MWSS at the end of the
concession agreement. The concession is granted to Manila Water Company
DRAFT
D - 10
9:42 AM 02/09/05
Regional Environmental Assessment
(MWCI) for the west zone of the service area and Maynilad Water Services Inc.
(MWSI) for the east zone. The MWCI is composed of Ayala Corporation, United
Utilities and Bechel while MWSI is a partnership of Benpres Holding Corporation and
Suez Lyonnaise de Eaux. The agreement signed on 21 February 1997 provides for a
25-year concession period unless earlier terminated. It was considered the world's
largest water privatization at that time.
The provisions of the agreement contain a set of concessionaires' obligations.
Included in these obligations are on sewerage management. These obligations are
as follows:
Ř To supply sewerage services to all customers in the service area who have
existing sewerage connections for domestic sewage and industrial effluents
compatible with available treatment processes;
Ř To meet the coverage target percentages of the total population in a target
municipality connected to the concessionaire's water system as per schedule
set in the agreement;
Ř To respond as soon as reasonably practicable to a request for a connection
to a public sewer from the owner or occupant of premises located in the
service area;
Ř To comply with all national and local environmental laws and standards
relating to treated wastewater in the service area and in accordance with the
schedule of compliance provided by the Regulatory Office;
Ř To offer septic and sanitation cleaning services in the service area, and to
meet the coverage target percentages of the total population in the target
municipality
The target for sewerage and sanitation coverage varies between the two zones. The
East Zone must have already covered a total of 41% of the population who are
connected to the concessionaire's water system by 2001 (Table 3-7). This
percentage will rise to 74% in 2021. In the East Zone, the target is a total coverage
of 59% of the population who are connected to the concessionaire's water system by
2001. The target will be 82% by 2021.
Sewer Coverage and Sanitation Targets Set in the MWSS Concession
Agreement with MWCI and MWSI.
Zone
2001
2006
2011
2016
2021
East
Sewer
3%
16%
51%
52%
55%
Sanitation
38%
32%
27%
24%
19%
Total
41%
48%
78%
76%
74%
West
Sewer
16%
20%
21%
31%
65%
Sanitation
43%
46%
43%
39%
27%
Total
59%
66%
64%
70%
82%
However by 2001 or four years since the concession took effect, the sewer coverage
in the West Zone is only 14% of 2% lower than the target. No data are available for
the sanitation coverage in the West Zone. In the East Zone, no data are available for
DRAFT
D - 11
9:42 AM 02/09/05
Regional Environmental Assessment
sewer and sanitation coverage. Neither are there data available that will indicate the
compliance of the concessionaires to its obligations in the agreement on sewerage
management. Due to the absence of data, the performance of the concessionaires in
particular and private sector participation in sewerage provision in general cannot be
fairly assessed. But some have observed that their performance in sewerage
provision is severely wanting.
The absence of data speaks of the capability of the Regulatory Office (RO). This
office is created in response to the demand to protect the interest of the government
and the consumers by regulating the operation of the concessionaires. Because of
the time required to legislate its establishment, it was fast-tracked by providing for its
creation in the Concession Agreement. The MWSS Board was to organize the RO
within its agency. Among the functions given to the RO that are directly relevant to
sewerage management are as follows:
Ř monitoring of the awarded concession agreements;
Ř reviewing and monitoring of water supply and sewerage rates;
Ř monitoring contracts between the concessionaires and customers for the
provision of water and sewerage services;
Ř monitoring and enforcing standards of service to customers and any agreed
improvement in these standards or extensions in the coverage customers for
the provision of water and sewerage services;
Ř arranging for the regular, independent technical and financial audit of the
activities of the concessionaires and the public dissemination of such
information; and
Ř monitoring the reported audited condition of water and sewerage service
infrastructure assets and enforcement of the Concession Agreement with
respect to these.
Some observers note that the main constraints behind the failure of the RO to
dutifully perform these functions are result of the weakness of its legal identity. First,
being a creation of a contract between the government and private sector, it does not
have legal personality of a government agency that is created by law. The absence
of such personality deprives it the power to make independent decision and enforce
it. Second, its decisions are subject to the approval of the MWSS Board making it an
extension of the board rather than an independent arbiter. Third, the concessionaires
finance its operation making it a dependent. Because of these constraints, it cannot
perform the role of a regulator as envisioned by those who saw the need for its
creation.
Apart from legal aspects, the RO has organizational constraints that hinder it to
perform its functions well. It apparently still has to organize the standards and the
systems to monitor and measure the performance of the concessionaires against the
standards. It has to train its personnel in interpreting the standards and operating the
systems. It has to provide the logistical support appropriate to the systems. The RO
has to invest on these organizational requirements because it has no experience to
lean on and it is the country's first venture into regulation of water services
concessionaires. The experience of the other countries (e.g., Sydney Water
Corporation) in similar situation shows that private sector participation in water
services provision does not automatically result to efficiency. It needs a strong
regulatory office to ensure that it can strike a good balance between public and
corporate interests.
DRAFT
D - 12
9:42 AM 02/09/05
Regional Environmental Assessment
D.4
National Sewerage Management Policies
While Metro Manila constitutes only a small part of the Philippines, about 636 square
kilometres of the archipelago's 300,000, it is within a urban agglomeration containing
a large percentage of the population of the country. Moreover, within this tiny area is
the seat of government, where the laws and policies regarding wastewater and
sewerage are promulgated. Metro Manila has the most advanced urban sanitation
system in the Philippines, yet only 4% of households have access to sewerage. In
part, this is because many non-poor households have invested in private facilities
(usually toilets connected to septic tanks), but the low sewerage coverage is also a
reflection of a prolonged lack of activity or investment in the sanitation sector. The
pattern in Manila is mirrored in the rest of the country. It is best therefore to look at
the national sewerage management policies before concentrating on specific laws
and issuances governing Metro Manila
D.4.1 Sanitation Code of the Philippines
The national policies on sewerage management are mainly articulated in the
Sanitation Code of the Philippines (Presidential Decree No 856). Promulgated in
23 December 1975, the code sets the required activities in managing sewerage and
corresponding systems. The details of some of the activities are provided in the
Implementing Rules and Regulations (IRR) of Sewage Collection and Disposal,
Excreta Disposal and Drainage (Chapter 17) of the Code on Sanitation of the
Philippines. The IRR was promulgated in 21 December 1995. It was formulated in
the light of the implementation of the Local Government Code (Republic Act No
7160) where the function of providing sewerage facilities is handed over to the
municipal and city governments. Nonetheless, the operation of sewerage facilities
has still to comply with national standards. In addition to those in the Sanitation Code
of the Philippines and the IRR, standards set in other laws must be also complied.
Two of these laws are the National Building Code (Presidential Decree 1096) and
Water Code of the Philippines (Presidential Decree 1067).
The national policies aimed at protecting the right to health and healthy environment
are partly expressed in the Sanitation Code of the Philippines. One aspect of
sanitation dealt with in the code is sewerage management. The code bestows upon
the DOH the responsibility to ensure that sewerage is managed in compliance to
certain standards. Section 72 of the code obliged sewerage system operators to
obtain the approval of the DOH Secretary or his duly authorized representative on
the following matters:
Ř location of any sewerage disposal system in relation to water supply;
Ř plans, design data and specification of a new or existing sewerage system or
sewerage treatment plant;
Ř discharge of untreated effluent of sewage treatment plants to bodies of water;
and
Ř methods of disposal of sludge from treatment plants.
The approval needed gives the DOH control over all the critical stages of
development and operation of sewerage facilities: site selection, planning and waste
disposal. The code further set the requirements for the operation of all sewerage
system. The DOH will oversee compliance to these requirements. The requirements
stated in Sections 73 and 74 calls on all operators of private and public sewerage
systems to do the following:
Ř provide laboratory facilities for control tests and other examination needed;
DRAFT
D - 13
9:42 AM 02/09/05
Regional Environmental Assessment
Ř forward to the local health authority operating data, control tests and other
records and information as maybe required;
Ř inform the local health authority in case of breakdown or improper functioning
of the sewage treatment works;
Ř provide treatment of all sewerage entering the treatment plant;
Ř connect all houses covered by the system to the sewer in areas where a
sewage system is available;
Ř ensure that outfalls discharging effluents from treatment plant shall be carried
to the channel of the stream or to deep water where the outlet is discharged;
Ř discharge storm water to a storm sewer and sanitary sewerage to a
sewerage system carrying sanitary sewage only although this will not prevent
the installation of combined system; and
Ř provide properly designed grease traps for sewers from restaurants or other
establishments where the sewage carries a large amount of grease.
Two requirements will enable the DOH to closely monitor the operation of the
sewerage facilities. One is the forwarding to the local health authority operating data,
control tests and other records and information as maybe required. Another is
informing the local health authority in case of breakdown or improper functioning of
the sewage treatment works. Nonetheless, included in the responsibility of the DOH
is to see to it that sewerage operators comply with all of the other requirements.
The disposal of wastewater through the sewerage system is required not only from
households but also from industrial establishments. Section 45d of the code requires
all industrial establishments to dispose their sewage by means of a municipal or city
sewage system when ever possible. The code specifies the methods of disposal if no
municipal or city sewerage exists.
D.4.2 Implementing Rules and Regulations (IRR) of the Code on Sanitation
The code gives the DOH Secretary the power to promulgate the rules and
regulations to better implement its provisions. It is in the exercise of this power that it
came up with the Implementing Rules and Regulations (IRR) of Sewage Collection
and Disposal, Excreta Disposal and Drainage (Chapter 17) of the Code on Sanitation
of the Philippines. While the IRR reiterates the requirements for the operation of the
sewerage facilities, it adds specifications to some requirements (Table 2-1).
First, the code requires that the operator must connect all houses covered by the
system to the sewer in areas where a sewage system is available. The IRR clarifies
that this requirement entails that the sewage plant must have the capability of
treating the flow of sewage discharged by the community in the area. Second, the
code has two requirements for discharge of effluents. One is the approval of DOH to
discharge untreated effluent of sewage treatment plants to bodies of water. Another
is to ensure that outfalls discharging effluents from treatment plant shall be carried to
the channel of the stream or to deep water where the outlet is discharged. But the
IRR further requires that effluent from treatment plants should meet the DENR
standards.
DRAFT
D - 14
9:42 AM 02/09/05
Regional Environmental Assessment
Table D - 1.
Requirements for the Operation of Sewage Treatment Plants*
The sewage plant shall be capable of treating the flow of sewage discharged by
the community in the area;
The type of sewage treatment plant shall be approved by the secretary or his duly
authorized representative and the effluent from such treatment plants shall meet the
standards formulated by the DENR;
The sewage treatment plant shall provide laboratory facilities for control tests and other
examination needed;
Operating data, control tests and such other records as may be required shall be
forwarded to the local health authority.
The local health authority shall be informed in case of breakdown or improper
functioning of the treatment works;
Where sewage treatment is provided, no sewage shall be allowed to by-pass the plant;
The sewage treatment plant shall be managed by a registered Sanitary Engineer.
*According to Section 5.2.2 of Implementing Rules and Regulations of Sewage Collection and
Disposal, Excreta Disposal and Drainage (Chapter 17) of the Code on Sanitation of the Philippines.
The IRR further emphasizes the necessary function of the treatment plant in
protecting the environments by requiring that no sewage shall be allowed to by-pass
the plant where it is available. It also explicitly provides that a registered sanitary
engineer should manage the sewage treatment plant. This provision guarantees that
trained professionals run the treatment plant. The Sanitary Engineering Law
(Republic Act No 1364) provides that only persons who pass the technical
examination and granted a certificate of registration by the Board of Examiners can
practice as a sanitary engineer. Among the activities included in such practice are
the following:
"Sanitary surveys, reports, design, direction, management,
consultation and investigation of ..... sewer systems,
sewerage treatment plants... sewage disposal tanks and
other structures for public health and welfare (Section 2)"
The requirement for a sanitary engineer to manage the plant tightens the
government supervision over its operation. An act of omission or commission can
cost not only the operating license of the plant but also the manager. The license of
the sanitary engineer to practice can be suspended or revoked.
D.4.3 The Local Government Code
Traditionally, water supply development and distribution is a national government-
controlled function. In 1991, the implementation of the revised Local Government
Code (LGC) triggered a process of political and administrative decentralization that
has brought major changes to the governance structure of the Philippines. The LGC
devolved powers and responsibilities from the central government to Local
Government Units (LGUs), allowing them to operate with far greater autonomy.
Section 17 of the LGC also allocates primary responsibility for guiding, financing, and
managing water supply and sanitation development to the local governments, thus
placing them at the center of the water supply and sanitation development process.
Moreover, the municipalities are given the mandate to discharge the functions and
responsibilities of national agencies and offices devolved to them, specifically that of
[developing]
DRAFT
D - 15
9:42 AM 02/09/05
Regional Environmental Assessment
"Infrastructure facilities intended primarily to service the needs of the
residents of the municipality and which are funded out of municipal
funds including but not limited to, municipal roads and bridges; school
buildings and other facilities for public elementary and secondary schools;
clinics, health centers and other health facilities necessary to carry out health
services; communal irrigation, small water impounding projects and other
similar projects; fish ports; artesian wells, spring development, rainwater
collectors and water supply systems; seawalls, dikes, drainage and
sewerage, and flood control; traffic signals and road signs; and similar
facilities;"
The LGC mandates local governments, either singly or together with other political
units and private entities, to deliver services to their constituents. It also emphasizes
the importance of establishing a mechanism for dialogue and consensus-building
between national and local governments, private business, and civil society. Except
where special agencies have been established by law to take over this role, the Local
Government Units are thus primarily responsible for the provision of water supply,
sewerage and sanitation services within their jurisdictions.
D.4.4 Provincial Water Utilities Act of 1973
Section 28 Chapter VII of Presidential Decree No 198 allots water districts the power
to "construct, operate and furnish facilities and service, within or without the district,
for the collection, treatment and disposal of sewerage, waste, and storm water" The
same section allows the water district the following powers:
Ř
Require all buildings used by human beings to be connected to the sewer
system within such reasonable time as may be prescribed by the district,
provided that the property upon which such building to be connected stands
is located within 35 meters of an existing main of the district's sewer system,
upon provision of a sewer system in any area.
Ř
Declare the further maintenance or use of cesspools, septic tanks, or other
local means of sewerage disposal in such area to be a public nuisance
Ř
Deprive said property owner of any and all services provided by the district,
which sanction may be co-extensive with the period during which the
property owner persists in refusing to connect with the district's sewer
system
Thus, one of the powers conferred upon the Water District by its organic act is the
power to require building owners to connect with the water district's sewer system
with the consequence of the deprivation of water supply and other services until it
connects with the aforementioned sewer system. Although very few cases have
been recorded in which the water district has exercised this power, it is a very potent
right nonetheless, since the water district has likewise the power to declare local
sewerage disposal means as a public nuisance. In essence, the water district can
compel all buildings inside and outside its district to connect with sewer lines it has
provided as long as these sewer lines are 35 meters away from the said building.
D.4.5 The Plumbing Law and the National Plumbing Code of the Philippines
The Plumbing Law, Republic Act 1378, was promulgated on June 18, 1955 and was
written primarily to regulate the Trade of Master Plumbers in the Philippines. Section
3 and 4 of the aforementioned Republic Act created a Board of Examiners for Master
Plumbers, which had, among its responsibilities, "the recommendation to the
DRAFT
D - 16
9:42 AM 02/09/05
Regional Environmental Assessment
President the adoption of rules and regulations as may be deemed proper for the
maintenance of good ethics and standards in the trade". The Revised National
Plumbing Code of the Philippines was thus signed and approved by
President Estrada in 1999.
Section 5 of the Plumbing Law contained a number of basic principles which were to
be followed in the practice of master plumbing and in the writing of the plumbing
code except in cases when it may prove oppressive or excessively burdensome to
those without sufficient means and to such buildings, structures, or constructions
valued at five thousand pesos or less. Among its principles, the following are key in
sewerage management:
e) Every building having plumbing fixtures installed and intended for human
habitation, occupancy, or use on premises abutting on a street, alley, or
easement in which there is a public sewer shall have a connection with the
sewer
q) If water closets or other plumbing fixtures are installed in buildings where
there is no sewer within a reasonable distance, suitable provision shall be
made for disposing of the building sewage by some accepted method of
sewage treatment and disposal.
v) Sewage or other waste from a plumbing system which may be deleterious
to surface or subsurface waters shall not be discharged into the ground or
into any water way unless it has been first rendered innocuous through
subjection to some acceptable form of treatment
The Revised National Plumbing Code of the Philippines section on House Drains and
House Sewers requires sewer connection. the pertinent provisions are:
1201.1 Every building in which plumbing are installed and every premises
have drainage piping thereon, shall have a connection to a public or private
excreta sewerage system except as provided in 1201.2 and 1201.4
1201.2 When no public sewer intended to serve any lot or premises is
available in any thoroughfare or right-of-way abutting such lot within the
premises, drainage piping from any building shall be connected to an
approved private sewage disposal system
1201.4 The public sewer may be considered as not being available when
such public sewer or any exterior drainage facility connected thereto is more
than 61 meters from any proposed building or exterior drainage facility on any
lot or premises thereat.
1201.5 No permit shall be issued for the installation, alteration, or repair of
any private sewage disposal system or part thereof for any lot which can
connect with an existing public sewer fronting the lot
1201.6 On every lot or premises hereafter connected to public sewer, all
plumbing and drainage system or parts thereof on such lot or premises shall
be connected with such a public sewer
What mainly this discussion explains is that, except in cases when it may prove
oppressive or excessively burdensome to those without sufficient means, all building
should connect with available public sewage systems, available meaning within 61
meters from the building or drainage facility.
D.4.6 Complementary Laws
Other laws complement and even reinforce the requirements stated in the code. For
instance, the National Building Code (Presidential Decree No.1096) provides for the
way buildings must dispose their wastewater. The provision is stated below:
DRAFT
D - 17
9:42 AM 02/09/05
Regional Environmental Assessment
.... sanitary sewage from buildings and neutralized or pretreated
industrial waste water should be discharge directly into the
nearest street sanitary sewer main of existing municipal or
city sanitary sewerage in accordance with the criteria set by
the Code on Sanitation and National Pollution and Control
Commission (Section 903)
The Water Code of the Philippines (Presidential Decree 1067) similarly provides for
any activities that may contaminate water sources. It requires the permission of
National Pollution Control Commission (NPCC) for such activities that will in turn
require the measures so that the water quality standards can be maintained. The
provision is expressed as follows:
No person shall, without permission from the National Pollution
Control Commission build any works that may produce ... or
perform any act which may result in the introduction of
sewage .. into any source of water supply.
Water pollution is the impairment of the quality of water beyond a
certain standard. The standard may vary according to the
use of the water and shall be set by the National Pollution
Control Commission (Article 75).
DENR Administrative Order No. 34 series of 1990, specifically Section 69 provides
for the minimum criteria for surface waters. Table 2-2 provides the water quality
criteria (Class C) that shall be met by the domestic discharges to Pasig River, the
Laguna Lake and the Manila Bay. The effluent standards for domestic discharges
are provided for in Table 2-3 (Class C) of DENR Administrative Order No. 35, series
of 1990 also known as the Revised Effluent Regulations of 1990.
D.4.7 The Clean Water Act
What the Clean Water Act provides for is the integration of the management and
control of wastewater and water quality policies that were previously fragmented
among the different laws mentioned above. One of its central policies is "to formulate
a holistic national program of water quality management that recognizes that water
quality management issues cannot be separated from concerns about water sources
and ecological protection, water supply, public health and quality of life" and "to
provide for a comprehensive management program for water pollution focusing on
pollution prevention" Realizing that water pollution occurs within spatial scales where
the interplay of uses and ecological processes play a part in the degradation or
preservation of water supplies, the Clean Water Act separates the country into water
quality management areas which "have similar hydrological, hydrogeological,
meteorological or geographic conditions which affect the physicochemical, biological
and bacteriological reactions and diffusions of pollutants in the water bodies, or
otherwise share common interest or face similar development programs, prospects,
or problems"
In respect of the devolution of the authority of national government agencies to the
Local Government Units provided for in the Local Government Code, the
management of such water quality management areas would include representatives
from the relevant national agencies mentioned above, the LGUs, water districts,
NGOs and the business sector. Hence, the management of water pollution evolves
from a fragmented, multi-agency approach to a joint management effort where the
roles of each group is delineated. These are discussed below.
The salient features of the recently passed Republic Act No. 9275, otherwise known
as the "Philippine Clean Water Act of 2004, are the following:
DRAFT
D - 18
9:42 AM 02/09/05
Regional Environmental Assessment
Ř The DENR together with the NWRB shall designate water quality management areas and
chair the governing board that shall be set up to formulate strategies to coordinate
policies necessary for the implementation of water quality policies and monitor
compliance with the action plan
Ř The DENR, in coordination with the NWRB, the Department of Health, the Department of
Agriculture, the governing board and other government agencies shall take such
measures as may be necessary to upgrade the quality of water in non-attainment areas
Ř The DPWH through MWSS in coordination with the DENR, LGUs and other concerned
agencies shall within a period of 12 months from its effectivity, prepare a national
program on sewerage and septage management that shall include priority listing of
sewerage, septage and combined sewerage-septage project for LGUs. On the basis of
such listing, the national government may allot on an annual basis funds for the
construction and rehabilitation of required facilities (Section 7);
Ř Within 5 years from the effectivity of the Act, the agency vested to provide water supply
and sewerage facilities and/or concessionaires in Metro Manila and other highly
urbanized cities in coordination with LGUs shall be required to connect the existing
sewage line found in all subdivisions, condominiums, commercial centers, hotels, sports
and recreational facilities, hospitals, market places, public buildings, industrials complex
and other similar establishments including households to available sewerage system. It
was further provided that said connection shall be subject to sewerage charges/fees in
accordance with existing laws or regulations (Section 8);
Ř The DOH in coordination with other government agencies shall formulate guidelines and
standards for the collection, treatment and disposal of sewage including guidelines for the
establishment and operation of centralized sewage treatment system (Section 8)
Ř DPWH through its attached agencies such as MWSS and LWUA and including other
urban water utilities shall be responsible for the provision of sewerage and sanitation
facilities and the efficient and safe collection, treatment and disposal of sewage within
their area of jurisdiction.
Ř DOST, in coordination with the DENR and other concerned agencies, shall prepare a
program for the evaluation, verification, development and public dissemination of pollution
prevention and cleaner production technologies
Ř Department of Education (DepEd), Commission on Higher Education (CHED),
Department of the Interior and Local Government (DILG) and Philippine Information
Agency (PIA) shall assist and coordinate with the DENR in the preparation and
implementation of a comprehensive and continuing public education and information
program.
Ř DA, shall coordinate with the DENR, in the formulation of guidelines for the re-use of
wastewater for irrigation and other agricultural uses and for the prevention, control and
abatement of pollution from agricultural and aquaculture activities
Ř LGUs shall share the responsibility in the management and improvement of water quality
within their territorial jurisdictions and shall, prepare a compliance scheme in accordance
thereof, subject to review and approval of the governing board. The Environment and
Natural Resources Office (ENRO) of each LGU shall have the following powers and
functions:
Ř Monitoring of water quality;
Ř Emergency response;
Ř Compliance with the framework of the Water Quality Management Action Plan;
Ř To take active participation in all efforts concerning water quality protection and
rehabilitation; and
Ř To coordinate with other government agencies and civil society and the concerned
sectors in the implementation of measures to prevent and control water pollution:
DRAFT
D - 19
9:42 AM 02/09/05
Regional Environmental Assessment
In essence, the Clean Water Act concretizes the tasks of each department provided
for in the previous laws and institutionalizes the creation of management boards that
will insure that separate jurisdictions come together to formulate a comprehensive
and responsive plan to manage water within their management areas.
DRAFT
D - 20
9:42 AM 02/09/05
Regional Environmental Assessment
Clean Water Act
Draft/Proposed IRR
SEC. 7. National Sewerage and Septage Management Program. The Rule 7. National Sewerage and Septage Management Program. The
DPWH, through its relevant attached agencies, in coordination with the DENR shall cooperate with the DPWH in complying with Sec. 7 of the
DENR, LGUs and other concerned agencies, shall, as soon as possible, Clean Water Act, contributing specific environmental criteria and data
but in no case exceeding a period of 12 months from the effectivity of this for the prioritization of sewerage and septage projects. It shall
Act, prepare a national program on sewerage and septage management likewise, draw up options for LGUs such as constructed wetlands,
in connection with Section 8 hereof.
project, building or residence-based gray and black water recycling
Such program shall include a priority listing of sewerage, septage and systems and other innovative means to reduce sewerage and
combined sewerage-septage projects for LGUs based on population septage as a complement to other sewerage infrastructure which
density and growth, degradation of water resources, topography, DPWH may prescribe. For effluents that go through existing
geology, vegetation, programs/projects for the rehabilitation of existing sewerage treatment systems, the DENR may impose either
facilities and such other factors that the Secretary may deem relevant tot pretreatment standards for existing sources (PSES) and/or
he protection of water quality. On the basis of such national listing, the Pretreatment Standards for New Sources (PSNS).
national government may allot on an annual basis, funds for the Rule 7.2. Involvement of Other Agencies. In compliance with the
construction and rehabilitation of required facilities.
requirements of Section 7 of this Act, the DOH, MWSS, LWUA, DILG,
Each LGU shall appropriate the necessary land, including the required DepEd, CHED, PIA and other concerned agencies shall assist the
rights-of way/road access to the land for the construction of the sewage DPWH and DENR on the formulation and implementation of the
and/or septage treatment facilities.
National Sewerage and Septage Management Program.
Each LGU may raise funds to subsidize necessary expenses for the Rule 7.3 Content of the National Sewerage and Septage Management
operation and maintenance of sewerage treatment or septage facility Program. The NSSMP shall be a framework plan which will be
servicing their area of jurisdiction through local property taxes and formulated to address various national issues on water quality and
enforcement of a service fee system.
management focusing on, among others, objectives, strategies,
targets, institutional mechanism, technology implementation
programming, monitoring and evaluation and other key national
concerns.
SEC. 8. Domestic Sewage Collection, Treatment and Disposal. Within Rule 8. Actions against non-connection to available sewerage system.
5 years following the effectivity of this Act, the agency vested to provide The DENR shall withhold permits or refuse issuance of ECC for
water supply and sewerage facilities and/or concessionaires in Metro expansion for establishments that fail to connect their sewage lines to
Manila and other highly urbanized cities (HUCs) as defined in Republic available sewerage system as required herein. Also, the DENR shall
Act # 7160, in coordination with LGUs, shall be required to connect the request water districts and other appropriate agencies, in writing, to
existing sewage line found in all subdivisions, condominiums, sanction persons who refuse connection of sewage lines to available
commercial centers, hotels, sports and recreational facilities, hospitals, sewerage systems.
DRAFT
D - 24
9:42 AM 02/09/05
Regional Environmental Assessment
Clean Water Act
Draft/Proposed IRR
market places, public buildings, industrial complex and other similar Rule 8.2 Role of MWSS and Water Concessionaires in Metro Manila.
establishments including households to available sewerage system: In the case of MM and other MWSS franchise areas being serviced
Provided that the said connection shall be subject to sewerage services by the water concessionaires, sewerage facilities and main sewage
charge/fees in accordance with existing laws, rules or regulations unless lines shall be provided by the water concessionaires in coordination
the sources had already utilized their own sewerage system: Provided, with the LGUs. Prior to connection to the main sewage line,
further, that all sources of sewage and septage shall comply with the secondary line should already be in place coming from pre-treatment
requirements herein.
facilities or directly from sources. The secondary lines shall be the
In areas not considered as HUCs, the DPWH in coordination with the responsibility of the developer or operator of all the
DENR, DOH and other concerned agencies, shall employ septage or subdivisions,condominium, commercial centers, hotels, sports and
combined sewerage-septage management system.
recreational facilities, hospitals, market places, public buildings,
For the purpose of this section, the DOH, in coordination with other industrial complex and other similar establishment including
government agencies, shall formulate guidelines and standards for the households.
collection, treatment and disposal of sewage including guidelines for the Rule 8.3 Role of Water Supply Utilities. In the case of HUCs and
establishment and operation of centralized sewage treatment system.
LGUs where water districts, Water corporations and LGU water works
have already been constituted and operational the water supply utility
provider shall be responsible for the sewerage facilities and the main
lines. Pursuant to Rule 7.2 of this IRR, the secondary lines shall be
the responsibility of the developer or operator of the establishment,
including the household.
DRAFT
D - 25
9:42 AM 02/09/05
Regional Environmental Assessment
Appendix E Community Consultation Record
Status of the Consultation Activities Conducted for the MTSP
Components
Consultation activities
Stakeholders consulted
Overall
a. public consultation workshop (Nov
Representatives from:
2003)
Brgy. San Juan, Taytay
Brgy. Western Bicutan, Taguig
Brgy. Calzada, Taguig
Brgy. Ilaya Barangka, Mandaluyong City
Brgy. Industrial Valley, Marikina City
Brgy. Quirino 3b, QC
Brgy. Claro, QC
b. perception survey (Nov 2003)
85 residents from:
Blue Ridge A, Blue Ridge B, Sta. Ignatius, Olandes,
Industrial Valley and Loyola Heights (Marikina/QC)
140 residents from:
Wawa, Hagonoy, Calzada, San Juan, Napindan and
Bay Breeze (Taguig)
c. project briefing with Local Ces (June
Mayors and LGU executive reps of Makati, Pasig, QC,
2003, October 2004)
Marikina, Taytay, Taguig and Cainta
d. project presentation with the LGU
Mandaluyong, Pasig, Quezon City and Marikina
councils
Component 1: Riverbanks WwTP
a. focused group discussion (Brgy.
Brgy. Leaders from brgy. Ilaya, Mandaluyong City
Ilaya, Mandaluyong City, April 2004)
b. focused group discussion (Brgy.
Brgy. Leaders from brgy. Barangka Itaas
Barangka Itaas, Mandaluyong City,
April 2004)
c. focused group discussion (Brgy.
Brgy. Leaders from brgy Barangka Ibaba
Barangka Ibaba, Mandaluyong City,
April 2004)
d. focused group discussion (Brgy.
Brgy. Leaders from brgy Barangka Ilaya
Barangka Ilaya, Mandaluyong City,
April 2004)
e. focused group discussion (Brgy.
Brgy. Leaders from brgy Poblacion, Makati City
Poblacion, Makati City, April 2004)
f. public consultation for EA validation
Brgy. Leaders and residents of brgys. Capitolyo and
(HQ, Sp Brgy. Force, Brgy. Pineda,
Pineda
Pasig City, June 2004)
g. public consultation for EA validation
Brgy. Leaders and residents of Brgys. Poblacion (Makati
(Sports Complex, Brgy. Poblacion,
City) and Ilaya, Barangka Itaas, Barangka Ibaba
Makati City, June 2004)
(Mandaluyong City)
Component 2: Marikina WwTP
Phase 1
a. workshop (Sitio Olandes, Brgy. IVC,
Brgy. Leaders of Brgy. Industrial Valley, Marikina City
April 2004)
b. focused group discussion (Industrial
Representatives from the Homeowners associations
Valley, Monte Vista Subdivisions, April
2004)
DRAFT
E - 1
9:42 AM 02/09/05
Regional Environmental Assessment
Consultation activities
Stakeholders consulted
c. focused group discussion (Brgy.
Representatives from the Homeowners associations
Loyola Heights, Don Juan and Alta
Vista Subdivisions, QC, April 2004)
d. public consultation for EA validation
Brgy. Leaders and residents of Brgy. Sta. Ignatius Blue
(Brgy. Hall, Blue Ridge, QC, June
Ridge, QC
2004)
e. public consultation for EA validation
Brgy. Leaders and residents of Brgy IVC including those
(Brgy. Health Center, Brgy. IVC,
from Olandes, Cinco Hermanos, Industrial Valley
Marikina City)
Subdivision and Monte Alta Subdivision
Component 3: Septage Treatment
No information provied
Plants
Component 4: Taguig Sewer
System
a. focused group discussion (Brgy.
Brgy. Leaders and residents of Brgy. Tipas, Ibayo,
Tipas Ibayo, Taguig, Dec 2003)
Taguig)
b. focused group discussion (Bay
Brgy. Leaders and residents of Brgy. Tipas, Ibayo,
Breeze Subd., Taguig, Dec 2003)
Taguig)
c. public consultation for EA validation
Home owners association, Villa Salud (Taguig)
(Villa Salud, Lower Bicutan, Taguig,
June 2004)
Component 5: Upgrade of Existing
Sanitation Systems
a. workshop (Brgy. Claro, QC, April
Brgy Leaders from Brgy. Claro (Quirino 3b, QC)
2004)
b. workshop (Brgy. Central, QC, April
Brgy. Leaders from Brgy. Central, QC)
2004)
c. focused group discussion (Brgy.
Brgy. Leaders from Brgy. Quirino 2a, QC.
Quirino 2a, QC, April 2004)
d. focused group discussion (Brgy.
Brgy. Leaders from Brgy. Quirino 2b, QC
Quirino 2b, QC, April 2004)
e. focused group discussion (Brgy.
Brgy. Leaders from Brgy. Quirino 2c, QC
Quirino 2c, QC, April 2004)
f. focused group discussion (Brgy.
Brgy. Leaders from Brgy. Quirino 3a, QC
Quirino 3Ş, QC, April 2004)
g. focused group discussion (Brgy.
Brgy. Leaders from Brgy. Quirino 3a, QC
East Kamias, QC, April 2004)
h. focused group discussion (Brgy.
Brgy. Leaders from Brgy. West Kamias, QC
West Kamias, QC, April 204)
i. focused group discussion (Brgy. Old
Brgy. Leaders from Brgy. Old Capitol Site, QC
Capitol Site, QC, April 2004)
j. public consultation for EA validation
Brgy. Leaders and residents from East and West
(Yakap Day Care Ctr., East Kamias,
Kamias (QC)
QC, June 2004)
k. public consultation for EA validation
Brgy. Leaders and residents of South Triangle, Sacred
(Brgy. Hall, Laging Handa, QC, June
Heart and Laging Handa (QC)
2004)
l. public consultation for EA validation
Brgy. Leaders and residents of Brgys 2-A, 2-A, 2-C, 3-
(Covered Court, Brgy. Quirino 2A, QC,
A, 3-B and Duyan-duyan, QC
June 2004)
m. public consultation for EA validation
Brgy. Leaders and residents of Brgys. Central, Old
(Brgy. Hall, Brgy. Central, QC, June
Capitolyo and UP Village, QC
2004)
Component 6: Sanitation for Low-
DRAFT
E - 2
9:42 AM 02/09/05
Regional Environmental Assessment
Consultation activities
Stakeholders consulted
income Communities
a. focused group discussion (Brgy.
Brgy. Leaders of Brgy. Signal Village, Taguig
Signal Village, Taguig, April 2004)
b. public consultation for EA
Brgy. Leaders and residents from Brgys Signal Village
validation(Covered Court, Signal
and Western Bicutan (Taguig)
Village, Taguig, June 2004)
c. public consultation for EA validation
Brgy. Leaders and residents from Pawis, Exodus,
(Fishport Trng Ctr, Brgy. San Juan,
Diimagta/Sumagta, Genesis (of Brgy. San Juan)
Taytay, Rizal)
Component 7: Septage Disposal in
Lahar Areas
a. individual visits/orientation to brgy.
Brgy Leaders from:
Officials (March 2004)
Brgys. Panipuan, Malino and Baliti (San Fernando)
Brgy. Mining (Angeles)
Brgys. Ganduz, Eden, Suclaban, Culubasa, Akli,
San Jose Malino and Panipuan (Mexico)
Brgy. Carmencita (Floridablanca)
a. perception survey (covering
239 households from Angeles City , Floridablanca,
settlement clusters adjacent to
Mexico, and San Fernando
proposed project areas, April-May
2004)
b. consultations
Farmers and farm lot owners, LGUs (brgy. And
(Greenfields Tennis and Country Club,
municipal level), Sugar Regulatory Agency, NGOs
San Fernando, Pampanga, June 15,
(Pagkain ng Bayan Foundation and Porac Federation of
2004)
Cooperatives)
(LAREC, Floridablanca, Pampanga,
June 22, 2004)
Note: Consultation with the adjacent property owners and residents for the proposed Payatas
Septage Treatment is to be conducted after agreement has been reached with the property
owner on the sale of the land. In the case of the FTI site, discussion has been made with the
Management of the Complex (FTI) on the use of a portion near the existing treatment facility of
the complex. Consultation is not deemed necessary in the case of the FTI site.
DRAFT
E - 3
9:42 AM 02/09/05