E1288
v 4
Public Disclosure Authorized
Environmental Impact Statement
(EIS)
for
Manila Third Sewerage Project
Public Disclosure Authorized
Volume 4: Annex on Septage/Sludge Disposal in
Lahar Area
February 11, 2005
Public Disclosure Authorized
(Revised Draft)
Public Disclosure Authorized
Manila Water Company, Inc.
Manila, Philippines


ENVIRONMENTAL ASSESSMENT
FOR SLUDGE/SEPTAGE-USE AS SOIL
CONDITIONER FOR SUGAR CANE
GROWTH IN LAHAR-LADEN AREAS
Prepared by:
Prepared for:
7th Floor, CLMC Building, 259-269
EDSA, Greenhills, Mandaluyong City
Since 1955
in association with
Metropolitan Waterworks and Sewerage System (MWSS)
Ground Floor, MWSS Bldg., Katipunan Road, Balara, Quezon City
Lichel Technologies, Inc.
Unit 1910 Antel Global Corporate Center
#3 Dońa Julia Vargas Avenue
Ortigas Center, Pasig City
and
MAIN REPORT
Rm. 1021, 10/F Cityland Shaw Tower
St. Francis Street cor. Shaw Blvd., Mandaluyong City
TABLE OF CONTENTS
CONTENTS
PAGE
VOLUME 1 MAIN REPORT
EXECUTIVE SUMMARY
ES1 BACKGROUND..................................................................................................................................................I
ES-2 PROJECT
DESCRIPTION..................................................................................................................................I
ES-3
ENVIRONMENTAL BASELINE CONDITIONS .........................................................................................IV
ES-4
SEPTAGE AND SLUDGE CHARACTERISTICS ........................................................................................VI
ES-5
RESEARCH FINDINGS ON USE OF SEPTAGE/SLUDGE AS SOIL CONDITIONER ...........................IX
ES-6
ASSESSMENT OF ENVIRONMENTAL IMPACTS AND MITIGATION.................................................. X
ES-7
ENVIRONMENTAL MANAGEMENT PLAN .............................................................................................XII
ES-8 FINDINGS
AND
RECOMMENDATIONS .................................................................................................XXI
1.
INTRODUCTION...............................................................................................................................................1-1
1.1
GENERAL...................................................................................................................................................... 1-1
1.2
PROJECT OBJECTIVES................................................................................................................................... 1-2
1.3
STUDY APPROACH ....................................................................................................................................... 1-2
1.4
METHODOLOGY ........................................................................................................................................... 1-2
1.4.1
Review of On-going and Completed Experiments and Studies on Reviving the Lahar-laden Soil ......1-2
1.4.2
Baseline Characterization......................................................................................................................1-3
1.4.3
Impact Identification, Prediction and Assessment ................................................................................1-3
1.4.4
Formulation of Environmental Management and Environmental Monitoring Plans .......................... 1-4
2.
PROJECT DESCRIPTION............................................................................................................................... 2-1
2.1
THE PROJECT............................................................................................................................................. 2-1
2.2
PROJECT LOCATION ..................................................................................................................................... 2-1
2.2
PROJECT DETAILS ........................................................................................................................................ 2-2
2.2.1
Sources of Biosolids ............................................................................................................................... 2-2
2.2.2
Characteristics of Septage and Sludge .................................................................................................. 2-3
3.
ENVIRONMENTAL BASELINE CONDITION............................................................................................3-1
3.1
INTRODUCTION ............................................................................................................................................ 3-1
3.2
PHYSICAL ENVIRONMENT............................................................................................................................ 3-1
3.2.1
Geology...................................................................................................................................................3-1
3.2.2
Natural Hazards .....................................................................................................................................3-3
3.2.3
Pedology .................................................................................................................................................3-4
3.2.4
Meteorology............................................................................................................................................3-5
3.2.5
Air Quality and Noise Level...................................................................................................................3-7
3.2.6
Hydrogeology .........................................................................................................................................3-7
3.2.7
Surface Water Hydrology.......................................................................................................................3-9
3.2.8
Water and Sediment Quality Surveys...................................................................................................3-12
3.3
BIOLOGICAL ENVIRONMENT......................................................................................................................3-16
3.3.1
Aquatic Ecology Survey .......................................................................................................................3-16
3.3.2
Terrestrial Ecology ..............................................................................................................................3-19
3.4
SOCIO-ECONOMIC ENVIRONMENT.............................................................................................................3-20
3.4.1
Socio-Economic Setting .......................................................................................................................3-20
3.4.2
Household Survey.................................................................................................................................3-22
3.5
SOCIAL BASELINE ASSESSMENT .....................................................................................................3-27
3.5.1
First Level Consultation.......................................................................................................................3-28
3.5.2
Second Level Consultation...................................................................................................................3-28
3.6
PUBLIC HEALTH.........................................................................................................................................3-28
3.6.1
General Health Condition in the Project Areas ..................................................................................3-28
4.
ENVIRONMENTAL IMPACT ASSESSMENT AND MITIGATION........................................................ 4-1
4.1
PHYSICAL ENVIRONMENT............................................................................................................................ 4-1
4.1.1
Natural Hazards ..................................................................................................................................... 4-1
4.1.2
Erosion and Surface Soil Runoff............................................................................................................ 4-2
Manila Third Sewerage Project (MTSP)
i
TABLE OF CONTENTS
4.1.3
Surface and Groundwater Contamination............................................................................................. 4-2
4.1.4
Land Contamination............................................................................................................................... 4-3
4.1.5
Odor Generation .................................................................................................................................... 4-5
4.1.6
Noise Generation.................................................................................................................................... 4-5
4.1.7
Dust Generation ..................................................................................................................................... 4-6
4.1.8
Traffic Impacts ....................................................................................................................................... 4-6
4.2
BIOLOGICAL ENVIRONMENTAL ................................................................................................................... 4-6
4.2.1
Aquatic Ecology ..................................................................................................................................... 4-6
4.2.2
Terrestrial Ecology ................................................................................................................................ 4-6
4.2.3
Impacts on Agriculture........................................................................................................................... 4-7
4.3
SOCIO-CULTURAL AND ECONOMIC ENVIRONMENT .................................................................................... 4-8
4.3.1
Population .............................................................................................................................................. 4-8
4.3.2
Income and Employment ........................................................................................................................ 4-8
4.3.3
Housing Characteristics and Social Services........................................................................................ 4-9
4.3.4
Education................................................................................................................................................ 4-9
4.3.5
Culture and Lifestyle .............................................................................................................................. 4-9
4.4
ARCHEOLOGICAL/ANTHROPOLOGICAL/HISTORICAL SITES ........................................................................ 4-9
4.5
PUBLIC HEALTH........................................................................................................................................... 4-9
4.6
ENVIRONMENTAL HEALTH IMPACT ASSESSMENT (EHIA) .......................................................................4-10
4.6.1
Incidence Potential Rate ......................................................................................................................4-10
4.6.2
Health Consequence Rating.................................................................................................................4-10
4.7
SUITABILITY OF APPLICATION SITES .........................................................................................................4-11
5.
ENVIRONMENTAL MANAGEMENT PLAN ..............................................................................................5-1
5.1
NATURAL HAZARDS .................................................................................................................................... 5-1
5.2
EROSION AND SURFACE SOIL RUNOFF........................................................................................................ 5-1
5.3
SURFACE AND GROUNDWATER CONTAMINATION ...................................................................................... 5-1
5.4
LAND RECLAMATION OR REHABILITATION................................................................................................. 5-2
5.5
ODOR GENERATION ..................................................................................................................................... 5-3
5.6
NOISE GENERATION..................................................................................................................................... 5-3
5.7
DUST GENERATION...................................................................................................................................... 5-3
5.8
TRAFFIC IMPACTS .................................................................................................................................. 5-3
5.9
BIOLOGICAL ENVIRONMENT........................................................................................................................ 5-3
5.10
COMMUNITY HEALTH HAZARDS ................................................................................................................. 5-3
5.11
SOCIO-ECONOMICS ...................................................................................................................................... 5-4
5.11.1
Information and Education ...............................................................................................................5-4
5.11.2
Occupational Health and Safety .......................................................................................................5-5
5.11.3
Risk Reduction Measures of Health Hazards ...................................................................................5-5
5.11.4
Protection of Personnel from Physical Hazards ..............................................................................5-5
5.11.5
Safety of Workers...............................................................................................................................5-6
5.11.6
Health of the Workers........................................................................................................................5-6
5.11.7
Public Health.....................................................................................................................................5-6
5.11.8
Biological Hazards............................................................................................................................5-7
5.12
ARCHAEOLOGICAL FINDINGS ...................................................................................................................... 5-7
5.13
PROJECT ALTERNATIVES ...........................................................................................................................5-12
5.13.1
Project Sites.....................................................................................................................................5-12
5.13.2
Septage Disposal Option.................................................................................................................5-12
5.13.3
Septage Transport Option ...............................................................................................................5-13
5.13.4
Septage Treatment Option...............................................................................................................5-13
6.
FINDINGS AND RECOMMENDATIONS..................................................................................................... 6-1
Manila Third Sewerage Project (MTSP)
ii
TABLE OF CONTENTS
List of Tables
TABLE ES - 1. LOCATION AND APPROXIMATE LAND AREA OF SLUDGE/SEPTAGE APPLICATION IN THE LAHAR-
AFFECTED AREAS ................................................................................................................................ IV
TABLE ES - 2. PHYSICAL AND CHEMICAL ANALYSES OF SEPTAGE IN METRO MANILA (IN MEAN VALUES) ...........VII
TABLE ES - 3. METAL CONCENTRATION OF SEPTAGE IN METRO MANILA (IN MEAN VALUES) ............................. VIII
TABLE ES - 4. METAL CONCENTRATIONS IN METRO MANILA SEPTAGE (UP-NEC, 1998) .................................... VIII
TABLE ES - 5. RESULTS OF LABORATORY ANALYSIS OF SLUDGE (BSWM).............................................................. IX
TABLE ES - 6. IMPACT DESCRIPTION AND IMPACT MITIGATION AND ENHANCEMENT ............................................... X
TABLE ES - 7. MAJOR IMPACTS, MITIGATION/ENHANCEMENT MEASURES AND ENVIRONMENTAL
MANAGEMENT PLAN......................................................................................................................... XIII
TABLE ES - 8. ENVIRONMENTAL MONITORING PLAN........................................................................................... XVIII
List of Figures
FIGURE ES - 1.
PROJECT LOCATION ...................................................................................................... III
VOLUME 2 TABLES, FIGURES AND ANNEXES
LIST OF TABLES
LIST OF FIGURES
LIST OF ANNEXES
Manila Third Sewerage Project (MTSP)
iii
TABLE OF CONTENTS
Metropolitan Waterworks and Sewerage System
CONTENTS
PAGE
EXECUTIVE SUMMARY
ES1 BACKGROUND ............................................................................................................................................2
ES-2 DEFINITION
OF
SEPTAGE AND SLUDGE ............................................................................................2
ES-3 PROJECT DESCRIPTION ..........................................................................................................................3
ES-5
RESEARCH FINDINGS ON THE USE OF SEPTAGE/SLUDGE AS SOIL CONDITIONER............5
ES-6
ASSESSMENT OF ENVIRONMENTAL IMPACTS AND MITIGATION............................................6
ES-7 ENVIRONMENTAL
MANAGEMENT
PLAN ..........................................................................................8
ES-8 CONCLUSIONS ..........................................................................................................................................19
FIGURE ES - 1.
PROJECT LOCATION ....................................................................................................................4
Manila Third Sewerage Project (MTSP)
i
EXECUTIVE SUMMARY
Metropolitan Waterworks and Sewerage System
ES1 BACKGROUND
The operation of MWCI wastewater treatment and septage collection facilities will generate about 450
m3/day of biosolids requiring disposal/reuse. Biosolids are the organic sludge produced from physical and
biological treatment of wastewater, which include treated septage, secondary sludge, and
processed/stabilized sludge. The application of biosolids to revive the productivity of lahar-laden soil in
Central Luzon is the proposed mode to manage the biosolids generated from the existing and proposed
sanitation services and sewerage systems of MWCI. These include the Magallanes Wastewater Treatment
Plant (WWTP) which produces dried sludge from drying beds, the Manila Second Sewerage Project
(MSSP) and the Manila Third Sewerage Project (MTSP) facilities which will produce liquid and
dewatered sludge using filter press, the Pasig River Rehabilitation Commission (PRRC) Septage
Treatment Plant (STP) which will produce dewatered and stabilized cakes using a combination of screw
press and lime stabilization, and the MTSP STPs which will produce dewatered cakes using screw presses.
Septage and liquid sludge produced from the MSSP communal septic tanks, MSSP WWTPs and MTSP
WWTPs and existing bio-contact activated sludge WWTPs will be treated in one of the proposed SPTPs
within the MWCI service area. All septage pumped out from individual septic tanks will also be brought
to the STPs before disposal.
This study evaluates existing practices on sludge and septage application in the lahar areas with the goals
of assessing viability, sustainability and development of Environmental Management Plan and
Environmental Monitoring Plan as a guide for future related activities.
INTRODUCTION
The eruption of Mt. Pinatubo in 1991 rendered masses of previously agricultural land unproductive
because of varying extents of lahar deposition. Since 1991, research investigations have been conducted to
revive the productivity of the once fertile areas of Pampanga and Tarlac for the plantation of sugarcane
and other crops. MWCI in coordination with the Sugar Regulatory Authority (SRA) conducted several
studies on the use of septage/sludge from Metro Manila as soil conditioner to sugarcane plantations in
lahar-affected agricultural lands with promising results.
The application of septage/sludge as soil conditioner to the lahar-affected sugarcane plantations in
Pampanga greatly enhanced the sugar productivity. However, these materials contain microorganisms and
substances that may be harmful to the environment. MWCI commissioned the consortium of Engineering
Development Corporation of the Philippines (EDCOP), Lichel Technologies Inc. (LTI) and Inter-Structure
Systems Inc. (ISSI) to assess the environmental impacts associated with the use of septage/sludge as soil
conditioner and recommend mitigating measures that will address or minimize the negative impacts.
The conduct of the Environmental Assessment focused on the following:
1. Identification of all significant environmental impacts and issues of the project relative to the
project location;
2. Description of the existing natural resources and environmental quality conditions and trends;
3. Resolution of all significant environmental impacts within the scope of the EA; and
4. Formulation of economically feasible environmental management and monitoring plans.
ES-2 DEFINITION OF SEPTAGE AND SLUDGE
Septage
Septage refers to the wastewater which has undergone anaerobic treatment in septic tanks. At present,
septage is pumped out or desludged by MWCI at a rate of 200 cubic meters per day and all of this is
Manila Third Sewerage Project (MTSP)
2
EXECUTIVE SUMMARY
Metropolitan Waterworks and Sewerage System
hauled to the lahar project sites in Pampanga and Tarlac. Once the PRRC STP becomes operational,
MWCI shall cease direct septage applications.
The septage characteristics are shown in Tables 2-5, 2-6 and 2-7 of Volume II.
From the results of the laboratory analysis it was found that in general, the pH is about neutral. The COD
to BOD ratio in domestic wastewater typically ranges from 1.8 to 2.2. The sludge samples were stable
based from the fairly low ratio of total volatile solids to total solids (48-76%).
Septage analyzed at the Bureau of Soil and Water Management (BSWM) in January 2003 recorded metal
concentrations of 25.08 mg/L Fe, 1.22 mg/L Cu, 4.89 mg/L Zn, 0.0043 mg/L Hg and trace for Mn.
The results of the Metro Manila septage analysis in the UP-NEC study (1998) were found not to contain
significant quantities of heavy metals. The study report indicated that the probability of phytotoxicity and
potential hazards posed on humans and animals is low.
There are several risks involved in the application of septage to the sites, namely, pathogen and vector
exposure to the hauling contractors, farmers and nearby residents, contamination of surface and ground
water and soil contamination from heavy metals.
Sludge
Sewage sludge, in 40 CFR Part 503 of the Environmental Protection Agency (EPA), is defined as solid,
semi-solid or liquid residue during the treatment of domestic sewage in a treatment works. Further
treatment process or mixing with other materials will convert the primary sludge into secondary sludge.
The MSSP, PRRC and MTSP WWTPs and STPs will generate approximately 450 cubic meters per day
of dewatered sludge, which will be transported to the lahar project sites.
Table 2-8 of Volume II shows the results of laboratory analysis of sludge undertaken by the Bureau of
Soils and Water Management (BSWM).
The risks involved in the application of dried sludge to the lahar sites are similar to that of septage
although at a lesser degree due to the sludge's additional treatment/stabilization, mixture with other
chemicals and dewatering/drying processes.
ES-3 PROJECT DESCRIPTION
Sources and Application Sites. The Sludge/Septage Use as Soil Conditioner for Sugarcane Growth in
Lahar-affected Areas is a project of MWCI. MWCI supplies septage/sludge from its eastern concession
zone in Metro Manila to farmers in the lahar-affected Provinces of Pampanga and Tarlac. The east zone
covers approximately 1,400 sq km in area. MWCI's service area covers in part or in whole, 24 cities and
municipalities in Metro Manila including: Mandaluyong, Marikina, Pasig, Pateros, San Juan, Taguig,
Makati, , Quezon City, Manila, Rodriguez, San Mateo, Cainta, Taytay, Angono, Binangonan, Cardona,
Tanay, Antipolo , Baras, Teresa, Morong, Pililia and Jala-jala.
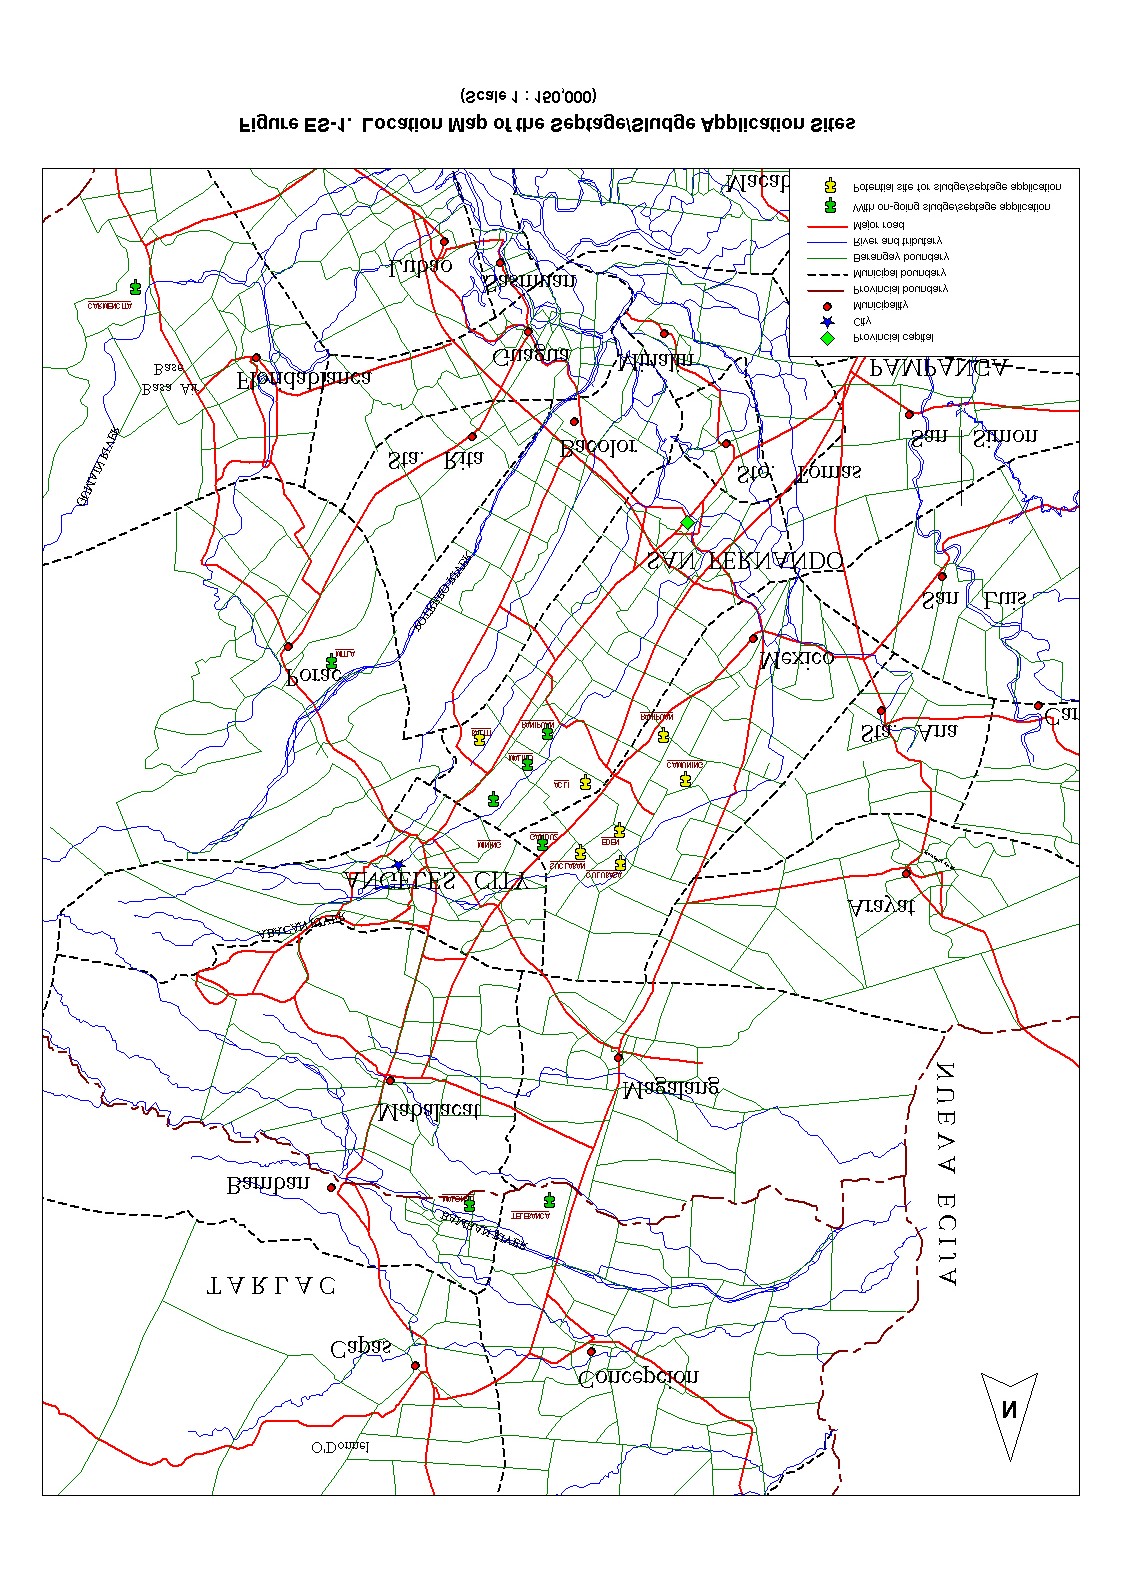
The project involves application of sludge/septage in the provinces of Pampanga and Tarlac, located about
60 kilometers north of Metro Manila (Figure ES-1). The application sites, totaling 15, are within two
cities (San Fernando and Angeles, Pampanga) and four municipalities (Porac, Mexico, Floridablanca of
Pampanga and Concepcion, Tarlac). Seven (Baliti in San Fernando, Eden, Suclaban, Culubasa, Acli,
Camuning and Panipuan in Mexico, all of Pampanga) of the 15 sites have been identified as potential sites
Manila Third Sewerage Project (MTSP)
3
EXECUTIVE SUMMARY
Metropolitan Waterworks and Sewerage System
for sludge/septage application while the remaining eight (Pampanga: San Jose Mitla in Porac, Panipuan
and Malino in San Fernando, Mining in Angeles, Ganduz in Mexico, Carmencita in Floridablanca; Tarlac:
Telebanca and Malonzo in Concepcion) are already being utilized for the said purpose since year 2002.
Among the six municipalities/cities involved in the project, the town of Concepcion, Tarlac covered the
largest area (600 hectares) capable for accepting sludge/septage.
The eight existing sites were selected based on lahar depth, depth of groundwater and distance to water the
nearest community and water body. Table 2-3 of Volume II shows the sites' location, approximate area
covered and area applied with septage. This table also shows that out of the evaluated potential area of
1,440 hectares, only 385 hectares have been applied with septage so far.
Allocation of septage is programmed on a rotation basis as tankers come in. Frequency of application is
dictated by weather and planting schedule. There is significant demand from farmers for the application of
septage to their land in view of its water content and proven efficacy in increasing cane tonnage/yield.
Figure ES - 1. Project Location
Manila Third Sewerage Project (MTSP)
4
EXECUTIVE SUMMARY
Metropolitan Waterworks and Sewerage System
ES-5 RESEARCH FINDINGS ON THE USE OF SEPTAGE/SLUDGE AS SOIL
CONDITIONER
Research on the use of septage/sludge to enhance the productivity of lahar-affected soil was started by
MWCI in 1999. The results of these experiments and studies were used in assessing the impacts of the
proposed sludge/septage as soil conditioner. The data gathered were incorporated in the environmental
baseline assessment. The Consultant also conducted research on other related experiments, on-going and
those already conducted and correlated the results to the impact assessment of the project.
The University of the Philippines' National Engineering Center has also conducted a study on the
suitability and effectiveness of septage application as a way of rehabilitating soils in the areas of Central
Luzon that had been affected by lahar deposits. The study took samples of septage from different locations
within Metro Manila. Each sample was taken from a site where there was on-going de-sludging operation.
Septage characterization was used to obtain a baseline data on the physical and chemical characteristics,
and constituents of the sludge prior to application on lahar-affected lands to be reclaimed.
Findings from MCWI-sponsored Studies. In 1999, MWCI in coordination with the different agencies such
as the SRA conducted several studies on the use of sludge as soil conditioner to sugar cane plantations to
enhance the productivity of lahar-deposited soil. Liquid and dried sludge from the Study showed that
sludge can reduce dependence on commercial fertilizers by acting as soil conditioner. The Fertilizer and
Pesticide Authority (FPA) has given MWCI a license for the manufacturing and distribution of sludge as
soil conditioner
Results from the experiment conducted in Floridablanca, Pampanga in 2000 using liquid sludge to
enhance the growth and yields of sugar cane as well as the residual effects on the succeeding ratoon crop,
indicated that liquid sludge is a potential indigenous fertilizer material and soil conditioner for sugar cane.
Profit greatly increased when sewage sludge applied into sugar cane fields were supplemented with
chemical fertilizers, such as urea. Liquid sewage sludge, as soil conditioner, can reduce the inorganic
fertilizer requirements of sugar cane especially at a combination of 90 kg of urea and 80 to 120 m3 of
sludge per hectare of sugar cane. Initial data and results were used to obtain a temporary registration to
use liquid sludge as soil conditioner from FPA (Annex ES-1)
After two cropping in the same experimental field, the soil pH was only slightly improved, available P &
K was increased but organic matter remained low. The results suggest that nitrogen is not the only
element that should be applied in a lahar-laden soil to improve the yield of sugar cane. It is therefore,
important that other elements be made available. Mean plant height, number of tillers, millable stalk
production and sugar yield, regardless of inorganic nitrogen application, were significantly improved with
application of sewage sludge. In ratoon cane, the parameters e.g. diameter of millable stalks, weight of
millable stalks/plot, cane tonnage (ton cane/ha) and sugar yield have been significantly improved through
addition of sewage sludge
Analysis for heavy metals in the soil after harvest showed that at all levels of sewage application, the
concentration of arsenic, cadmium, chromium, lead, mercury and selenium were at acceptable levels
except for arsenic and chromium which increased after the application of sewage sludge.
On raw septage, results of the MCWI-sponsored studies showed that raw septage has low nutrient content
and practically zero organic matter compared to sewage sludge which is several times higher in nutrient
content. The combined bagasse-mudpress-sewage sludge compost was found to have thousand-fold more
Manila Third Sewerage Project (MTSP)
5
EXECUTIVE SUMMARY
Metropolitan Waterworks and Sewerage System
nutrients and organic matter, nevertheless, inorganic nitrogen was added to supplement the deficiency for
the essential macro-elements. The effect of the composted sludge and bagasse was demonstrated
significantly on tonnage, sugar yield and sugar content of the plant cane. The yield of plant cane (TC/ha)
was significantly higher in the plots that were applied with sewage sludge in the absence of inorganic
nitrogen over the unfertilized untreated control.
The use of septage/sludge as soil conditioner provides benefits to farmers in terms of increase in income as
livelihood opportunities increased and savings in the use of soil conditioner from reduced dependence on
inorganic fertilizers. With the findings and results of the studies conducted as well as those of the
Environmental Assessment on the Use of Septage/Sludge as Soil Conditioner in Lahar-Laden Areas, it is
recommended that the septage/sludge produced from the different facilities of Metro Manila be used as
soil conditioner. The negative impacts such as the potential presence of metals like cadmium and lead
although the concentrations are well below the USEPA pollutant limits can be mitigated or controlled.
Findings from the UP-NEC Studies. There were significant improvements in the physical and chemical
properties of the lahar after septage was applied to it. The water holding capacity and the organic matter of
the lahar was found to have improved from the averages of 22.4 and 0.01 to 40.8 and 1.62, respectively.
The sodium and the calcium contents were also increased to a satisfactory level including phosphorous.
The potassium level (average of 5.48 ppm) was still low for most plants even after the sludge application.
Cation exchange capacity (CEC) also increased from 1.8 to 3 16 meq/100 mg soil in the Pampanga lahar
and from 2.0 to 3.2 13.8 meq/100 mg soil for the Tarlac lahar. There was an increase in Nitrogen and
Phosphorous content. Organic matter and organic carbon also increased. The textural class improved from
sand to either sandy loam or loamy sand. The pH of septage amended soil/lahar mixtures remained greater
than 6.5 which is a good indication that any trace of heavy metals present in the soil/lahar mixtures would
be immobilized.
Overall, the key physico-chemical findings from the experiments conducted by UP-NEC showed:
· Increase in organic matter, organic carbon, phosporous, nitrogen and potassium content
· Improved textural class from sand to sandy loam or loamy sand
· Increased Cation Exchange Capacity (CEC) from 1.8 to 3 16 meq/100 g of soil for the
Pampanga lahar, and from 2.0 to 3.2 13.8 meq/100 g soil for the Tarlac lahar. The increase in
CEC means that the allowable limit of heavy metals in the faecal sludge is also increased since
CEC is used as an index of the metal retention capacity of soils. The higher the CEC, the higher
amount of heavy metals that may be accommodated by the soil.
· Increased water holding capacity from 22.6% to 26.2 % for the Pampanga lahar and from 22.3%
to 28.6% for the Tarlac lahar.
ES-6 ASSESSMENT OF ENVIRONMENTAL IMPACTS AND MITIGATION
The table below shows the summary of the major impacts of the project and the corresponding mitigating
and enhancement measures to prevent or minimize such impacts.
.
Impact Description and Impact Mitigation and Enhancement
Impact Description
Mitigation & Enhancement
· Geologic hazards resulting
· Dikes and river walls are in place to prevent lahar/floods from
from lahar and flooding
overspilling the banks
· Erosion and surface soil runoff
· Temporary barriers and trenches should be constructed around the
Manila Third Sewerage Project (MTSP)
6
EXECUTIVE SUMMARY
Metropolitan Waterworks and Sewerage System
Impact Description
Mitigation & Enhancement
mounds of materials to abate the spread of spoils through surface
runoff
·
· Changes in land use of some
· Farmers shifted to aquaculture as a result of the low productivity
lahar areas
of lahar.
· Contamination of surface and
· Application sites should not sit on former river or waterway
groundwater with heavy metals · Buffer zones to be established near water bodies
from sludge
· Monitoring of surface and groundwater quality
· Fugitive dust from the
· Water sprinkling of the area should be done to reduce the
movement of vehicles
occurrence of fugitive dust
· Monitoring on ambient air quality
· Noise and air emissions from
· Trucks should be directed to move cautiously while passing
the movement of trucks going
through the road to prevent dust emission
to and out of the project site
· Trucks should be required to pass the smoke emission test.
· Monitoring on ambient air quality and noise
· Odor affecting residential
· A 20-meter buffer zone from the property line will be provided.
establishments that will be
The buffer zone shall be planted with trees.
passed by transporting trucks.
· Transport trucks to be sealed.
· Odor in the application of
septage
· Soil contamination by heavy
· Regular monitoring of soil (heavy metals contents)
metals
· Improvement of soil condition · Regular monitoring of soil quality
and fertility
· Application of liquid
None
sewage/septage provide
moisture to the sugarcane plants
during the summer months
· Sewage sludge + bagasse &
· Set up demo trials for other farmers to emulate
mill ash provides additional
nutrients for plant growth and
increase tonnage and sugar
yield
· Traffic congestion
· Arrival of trucks should be coordinated with the MWCI and
property owner.
· Delivery trucks should be required to post visible identification
and signages for easy recognition.
· Deterioration of road condition
· Maintenance and repairs of access roads.
due to regular movement of
· Cleaning of road brought about by movement of trucks.
trucks
· Health hazard due to accidental · Provide measures to protect community health.
spills and air/noise nuisance
· Community Health Hazards
· Measures include security fencing, posting of no trespassing or no
· Pathogen Exposure
entry signs, building of buffer zone around the project site and
· Vector Exposure
regular maintenance of trucks.
· Site restriction for at least 30 days after application
· Grazing not allowed within 30 days after application.
· Food crops not allowed within 14 months after application.
· Septage injected below the land surface.
· Untreated septage pumped directly into truck tanks and hauled to
non-public contract site.
· Increased employment
· Peripheral work opportunities as a result of increase in
opportunities
productivity
· Increased income
Manila Third Sewerage Project (MTSP)
7
EXECUTIVE SUMMARY
Metropolitan Waterworks and Sewerage System
Impact Description
Mitigation & Enhancement
· Higher educational attainment
level
· In case of accidental
· The project management must make an effort to preserve a
archeological findings
potential archaeological site by reporting it immediately to the
National Museum.
ES-7 ENVIRONMENTAL
MANAGEMENT
PLAN
The table below shows the Environmental Management Plan which summarizes the major impacts of the
project and its corresponding mitigating measures to address such impacts such as erosion and surface soil
runoff, flooding of the nearby areas, change in land use of the area; surface and groundwater
contamination; and dust emissions from the movement of vehicles, among others.
.
Also included in the Plan are costs to implement such measures, responsible agencies to implement the
measures and guarantees that these measures shall be implemented.
An Environmental Monitoring Program is also presented in the next table.
Manila Third Sewerage Project (MTSP)
8
EXECUTIVE SUMMARY
Metropolitan Waterworks and Sewerage System
Environmental Management Plan
Potential Socio-
Proposed Mitigation Measures
Institutional
Cost
Timing
Environmental Impacts
Responsibilities
Estimates
Possible contamination of
Select and manage the sites for septage/sludge disposal in
Wastewater Department of
0
Prior to application of
surface or ground waters, and
accordance with the following specific criteria:
MWCI
any septage/ sludge
direct and indirect health risks.
and throughout
1) Unstabilized sludge/septage may not be applied in areas
operations
frequented by the public, unless the sludge/septage was
properly treated by lime stabilization.
2) Stabilized septage/sludge can be left on the surface of
the soil, unless applied to soil without any vegetative
cover in which case it must be incorporated into the soil
within 8 hours of application.
3) Septage/sludge shall not be applied to land covered with
rainwater runoff flows or inundated with floodwater at any
time. At such times, the septage/sludge must either be
stored at the STP/SPTP, applied to higher land
elsewhere in the disposal area or stored at an identified
area for later application.
4) Areas used for pasture may not be grazed for 30 days
following application of any septage/sludge.
5) Vegetation or crops for animal feeding may not be
harvested for 30 days following application of septage.
6) Vegetables and fruits which are consumed raw, or
tobacco, shall not be grown on land to which unstabilized
septage/sludge have been applied.
7) The application rate of septage/sludge shall be limited to
the lesser of (a) 400 kilos of nitrogen to each hectare in
any 12 month period, or (b) the nitrogen agronomic
uptake requirements of the crop.
8) Sludge/septage may not be land applied within (a) 50
meters of any Class A water body, (b) 10 meters for
other classes of water, (c) 10 meters of any shallow non-
potable water supply wells, and (d) 30 meters for any
potable water supply well. No buffer is required around
irrigation waters that are located entirely on the land
Manila Third Sewerage Project (MTSP)
9
EXECUTIVE SUMMARY
Metropolitan Waterworks and Sewerage System
Potential Socio-
Proposed Mitigation Measures
Institutional
Cost
Timing
Environmental Impacts
Responsibilities
Estimates
application site.
9) At the time of septage/sludge application, a minimum of
600 millimeters of unsaturated soil above the ground
water table must be present.
10) Unstabilized septage/sludge applied during rain events
must be immediately incorporated into the soil, rather
than waiting up to 8 hours.
11) The slope of the land application area may not be more
than eight percent.
12) Land used for septage/sludge application may not
contain any hole or channel (such as subsurface
fractures, solution cavities, sink holes, or excavated core
holes) which would allow the septage/sludge to
contaminate the groundwater, unless the septage/sludge
is not applied within a 30 meter distance from such
geologic formations or features.
13) Septage/sludge may not be applied within 30 meters of
any dwelling located outside the property boundary. A 10
meter buffer applies to any dwellings located within the
individual landholding or within the property boundary or
any drainage ditches.
14) Site selection must account for any archeological
artifacts
Monitoring of Water Quality:
P100,000/yr
15) Select suitable existing water wells in the location of the
proposed disposal area that can be used for groundwater
quality monitoring. Wells should be suitably sealed form
surface water inflow or other sources of contamination.
This applies to both the extensive agricultural lands and
the lahar areas.
16) The wells must source their groundwater from the same
hydrogeological formation as the groundwater under the
proposed disposal area. Select one well located
hydrogeologically upstream of the disposal area and two
Manila Third Sewerage Project (MTSP)
10
EXECUTIVE SUMMARY
Metropolitan Waterworks and Sewerage System
Potential Socio-
Proposed Mitigation Measures
Institutional
Cost
Timing
Environmental Impacts
Responsibilities
Estimates
wells downstream of the main disposal areas.
17) If wells cannot be located that satisfy the
hydrogeological, location and operational requirements,
then purpose-built sampling wells must be installed.
These should be equipped with a sealed collar and
lockable caps to prevent tampering. They must be slotted
to the same depth as the groundwater resource most
likely to be used locally as a water supply resource either
now or in the future.
No disposal area for
Septage/sludge shall only be applied during the fallow or
Hauling contractors,
P50,000/yr
Prior to application of
inappropriate periods of the
planting seasons when the septage/sludge can be
Wastewater Department of
any septage/sludge
cropping cycle
incorporated into the soil within 8 hours, if unstabilized.
MWCI
and throughout
Septage/sludge will have to applied to lahar soils without
operations
crops or stored in an appropriate stockpile area.
-
The stockpile area/s must be protected against the entry
of stormwater runoff by constructing bunds around
upslope perimeter of the stockpile area.
-
The area must not be flood-prone
-
The area must have all weather access roads
-
The site should have a separate stockpiling for small
quantity of stabilized sludge. This stabilized
sludge/septage shall be applied as a temporary cover
material to the main stockpile which will contain a mixture
of stabilized and unstabilized septage/sludge. This
stabilized layer will limit odor emissions and also
pathogen washoff and erosion.
-
If the stockpile is going to be remain in place for more
than 30 days, it should be covered with a 300 millimeter
thick layer of soil to limit water infiltration, odor migration
and also rodent access.
-
Areas with existing vegetative cover are preferred as this
reduces the likelihood of runoff and provides an uptake
pathway for the nitrogen and other nutrients
Health risks for workers involved 1) Undertake proper training and education of truck drivers, Hauling
contractors, P50,000/yr
Prior to application of
Manila Third Sewerage Project (MTSP)
11
EXECUTIVE SUMMARY
Metropolitan Waterworks and Sewerage System
Potential Socio-
Proposed Mitigation Measures
Institutional
Cost
Timing
Environmental Impacts
Responsibilities
Estimates
in septage/sludge handling,
operators of applicator equipment and other personnel
Wastewater Department of
any septage/sludge
transport, and disposal
involved in septage/sludge handling, transport and
MWCI
and throughout
disposal on the potential health issues
operations
2) Use of suitable PPE, such as gloves, coveralls and masks
Health risks for farm workers
Undertake proper training and education on the potential
Local farmers/landholders,
P50,000/yr
Prior to application of
health issues
Hauling contractors,
any septage/sludge
Wastewater Department of
and throughout
MWCI
operations
Complaints from surrounding
1) Preference to be given to remote locations
Local farmers/landholders,
P50,000/yr
Prior to application of
residents due to lack of
2) Preference to be given to disposal sites closest to major
Hauling contractors,
any septage/sludge
awareness on the proposed
and/or sealed roads to minimize haulage disturbances,
Wastewater Department of
and throughout
activities, possible health
such as dust and noise, to rural communities located along MWCI
operations
impacts, dust and other
haulage routes
inconveniences.
3) Provide public notices to inform/update residents of the
period of septage/sludge disposal, and the management
procedures and interventions proposed.
Spillage of septage/sludge in the 1) As much as possible, haul only dewatered or dried
Hauling contractors,
0
Prior to application of
event of vehicle accidents
septage/sludge
Wastewater Department of
any septage/sludge
2) Implement a scheme of contacting and then diverting
MWCI
and throughout
empty return vehicles to collect and re-haul any spillages
operations
resulting from a vehicle accident. For wet spillage on
roads, implement methods to absorb spilled material like
use of saw dust. Make this a part of the private hauling
company's contract.
Excess septage/sludge
1) Review and update the site allocation program for the
Wastewater Department of
0
Prior to application of
stockpiles awaiting disposal
septage/sludge applications
MWCI, Landholders/farmers,
any septage/sludge
2) Focus on maximizing applications to the extensive
Hauling contractors
and throughout
agricultural areas such as the sugar cane farms in fallow
operations
periods and/or during the planting season
3) Prepare the receiving area in the lahar areas (for use
during the sugar cane growing season or protracted wet
weather )well ahead of the cessation of the planting
season
Septage/sludge application
1) Keep comprehensive records of septage/sludge
Wastewater Department of
Contingency Prior to application of
resulting in surface or ground
application details and data such as:
MWCI, Hauling contractors only
any septage/sludge
Manila Third Sewerage Project (MTSP)
12
EXECUTIVE SUMMARY
Metropolitan Waterworks and Sewerage System
Potential Socio-
Proposed Mitigation Measures
Institutional
Cost
Timing
Environmental Impacts
Responsibilities
Estimates
water pollution or soil
-
Location of application, including the area involved
and throughout
contamination as determined
-
Date of application
operations
by the monitoring program
- Amount
applied
-
Source of septage/sludge
-
Crop status/part of planting cycle at time of
application
-
Time of incorporation into the soil
-
Weather at time of application
As necessary
2) Maintain records of environmental monitoring and any
environmental reports for a period of at least 5 years.
3) Prepare and maintain a database of monitoring data
results.
4) Increase the intensity and extent of monitoring to confirm
the apparent elevation of results
5) Delineate the size of the area with contaminated
surface/ground water or soil
6) Review septage/sludge application rates
7) Accelerate the covering of septage/sludge with soil
8) Use flatter areas for septage/sludge application
9) Increase the testing required on the septage/sludge for
the pollutants exceeding the adopted water quality
criteria. For example, if the pollutant of concern is lead,
then increase the lead testing frequency to better
determine the lead source and manage the pollutant at
source.
10) Incorporate runoff collection impoundments below the
application areas to trap any septage/sludge in the runoff
11) Increase the separation distance requirements between
application areas and surface water systems
Septage/sludge applications
1) Increase the intensity and extent of monitoring to confirm Wastewater Department of
Contingency As necessary
resulting in crop contamination
the apparent increase in results
MWCI, Hauling contractors, only
as determined by the monitoring 2) Delineate the size of the area with contaminated crops
Landholders/farmers
program
3) Review the sludge application rates for the crop, and
decrease as appropriate based on the monitoring
program results and parameters of concern.
Manila Third Sewerage Project (MTSP)
13
EXECUTIVE SUMMARY
Metropolitan Waterworks and Sewerage System
Potential Socio-
Proposed Mitigation Measures
Institutional
Cost
Timing
Environmental Impacts
Responsibilities
Estimates
4) Determine if the pollutant can be isolated, removed or
reduced in the septage/sludge
5) Determine the source of the contaminated
septage/sludge and only apply to the fallow lahar areas
until the contaminants can be reduced to suitable levels
Excessive odor migrating offsite 1) Increase the depth of incorporation of the septage/sludge Wastewater Department of
0 As
necessary
into the soil profile
MWCI, Hauling contractors,
2) Incorporate the septage/sludge into the soil more quickly landholders/farmers
Negative impact on community
1) Determine the nature of the health impact
Wastewater Department of
Contingency As necessary
health
2) Conduct a qualitative epidemiological study to determine MWCI
only
if the septage/sludge application is the actual source of
the morbidity
3) Determine the exposure pathway involved and apply
appropriate interventions to intercept this pathway
4) Ensure that public access is being limited as required
5) Consider only using stabilized septage/sludge in this
area
Negative health impacts on site 1) Determine the nature of the health impact
Wastewater Department of
Contingency As necessary
workers
2) Conduct a qualitative epidemiological study to determine MWCI, Hauling contractors, only
if the septage/sludge application is the actual source of
landholders/farmers
the morbidity
3) Determine the exposure pathway involved and apply
appropriate interventions to intercept this pathway
4) Improve training for staff to better understand the health
risks of septage/sludge, and the need for appropriate
health protection
5) Provide better safety equipment as required, such as
PPE upgrades
6) Consider only using stabilized septage/sludge in this
area
Excessive vermin reported
1) Increase the depth of incorporation into the soil profile
Wastewater Department of
Contingency As necessary
2) Incorporate the septage/sludge into the soil more quickly MWCI, Hauling contractors, only
3) Only apply the stabilized sludge in the area if vermin
landholders/farmers
complaints continue
Damage to truck access/exit
1) Cooperate with local government on road maintenance MWCI
Contingency As
necessary
Manila Third Sewerage Project (MTSP)
14
EXECUTIVE SUMMARY
Metropolitan Waterworks and Sewerage System
Potential Socio-
Proposed Mitigation Measures
Institutional
Cost
Timing
Environmental Impacts
Responsibilities
Estimates
roads program
only
2) Seek alternative access roads designed to handle loaded
trucks
3) Seek alternate disposal areas if alternate access roads
cannot be located
4) Reduce vehicle weight as a last resort
Environmental Monitoring Plan
Location
Parameters to be Monitored
Measurements (1) Frequency
Responsibility
Cost
(2)
Estimates
Downstream of
Turbidity of stormwater runoff
Visual only
Every major rain event
Wastewater
0
selected disposal
Department of
and stockpile sites
MWCI
Downstream of
Suspended Solids in stormwater
Filtration
Every major rain event, but only if
Wastewater
P1,500 / site
selected disposal
runoff
the visual monitoring for turbidity
Department of
per event
and stockpile sites
consistently indicates that
MWCI
excessive suspended solids are
washed off from the site, or if
complaints continue after
implementing all the actions listed
in the EMP
Manila Third Sewerage Project (MTSP)
15
EXECUTIVE SUMMARY
Metropolitan Waterworks and Sewerage System
Location
Parameters to be Monitored
Measurements (1) Frequency
Responsibility
Cost
(2)
Estimates
Soil at selected
Analyze two samples from each soil Standard soil scientific Annual, but starting at least one
Wastewater
P50,000/site/yr
disposal and control profile type: one within the
methods acceptable
year after the first septage/sludge
Department of
sites
septage/sludge disposal areas and
to the Department of
application
MWCI
a control site remote from the
Agriculture
disposal area for the following
parameters:
·
Textural analysis
·
PH
·
Sodium Adsorption Ratio (1:5
soil/water mix)
·
Calcium/Magnesium Ratio (1:5
soil/water mix)
·
Exchangeable Cations
·
Total Cations
·
Specific Conductance or electrical
conductivity
·
Total Manganese
·
Total Nitrogen
·
Phosphorus (extractable)
·
Potassium (available)
·
Potassium (extractable)
·
Total Calcium (exchangeable)
·
Total Chloride
·
Total Magnesium (exchangeable)
·
Total Sodium (exchangeable)
·
Heavy Metals scan
Crops at selected
Analyse two plant tissues: one
Standard agronomic
Annual, but starting at least one
Wastewater
P7,500 / site/yr
disposal and control within the septage/sludge disposal
methods acceptable
year after the first septage/sludge
Department of
sites
areas and a control site remote from to the Department of
application
MWCI
the disposal area for presence of
Agriculture and DENR
pathogens
Manila Third Sewerage Project (MTSP)
16
EXECUTIVE SUMMARY
Metropolitan Waterworks and Sewerage System
Location
Parameters to be Monitored
Measurements (1) Frequency
Responsibility
Cost
(2)
Estimates
Groundwater from
1) Select two sampling wells
DAO 34/35
Quarterly, but if elevated levels are Wastewater
P25,000 / site
upstream and
downstream of the disposal
detected then more frequent tests
Department of
per event
downstream of
and/or stockpile areas in each
will be required. Sampling
MWCI
selected disposal
soil profile
frequency will be adjusted based
and stockpile sites
2) Select one sampling wells
on monitoring results.
upstream of the disposal and/or
stockpile areas to act as a
control
Test samples for the following water
quality characteristics:
·
Total nitrogen (as N)
·
Nitrate nitrogen (as N)
·
Nitrite nitrogen (as N)
·
Total Kjeldahl nitrogen (as N)
·
Ammonia nitrogen (as N)
·
Total phosphorus (as P)
·
Chloride
·
Electrical conductivity or total
dissolved solids
·
PH
·
Total coliforms (cfu)
·
Faecal coliforms
·
Heavy Metals
Manila Third Sewerage Project (MTSP)
17
EXECUTIVE SUMMARY
Metropolitan Waterworks and Sewerage System
Location
Parameters to be Monitored
Measurements (1) Frequency
Responsibility
Cost
(2)
Estimates
Surface water from Select one sampling location
DAO 34/35
Quarterly, but if elevated levels are Wastewater
P25,000 / site
upstream and
downstream of the disposal and/or
detected then more frequent tests
Department of
per event
downstream of
stockpile areas in each soil profile
will be required. Sampling
MWCI
selected disposal
Select one sampling location
frequency will be adjusted based
and stockpile sites
upstream of the disposal and/or
on monitoring results
stockpile areas to act as a control
Test samples for the ff. water quality
characteristics:
-
Total nitrogen (as N)
-
Nitrate nitrogen (as N)
-
Nitrite nitrogen (as N)
-
Total Kjeldahl nitrogen (as
N)
-
Ammonia nitrogen (as N)
-
Total phosphorus (as P)
- Chloride
-
Electrical conductivity or
total dissolved solids
- PH
- BOD
- SS
- DO
-
Total coliforms (cfu)
- Faecal
coliforms
- Heavy
Metals
(1) The methodology for testing is per the relevant specifications listed/described in the DENR Administrative Orders 34/35. If the relevant methodology is not specified
therein, then the relevant methodology from the latest revision of "Standard methods for the Examination of Water and Wastewater" by the USA Water Environment
Federation will be adopted.
Manila Third Sewerage Project (MTSP)
18
EXECUTIVE SUMMARY
Metropolitan Waterworks and Sewerage System
ES-8 CONCLUSIONS
General conclusions on the study are as follows:
1. Sludge and septage can be used as soil conditioner, reclaim lahar-laden areas and enhance sugar
productivity. MWCI has already obtained registration from the Fertilizer and Pesticides Authority
(FPA).
2. The use of sludge and septage as soil conditioner for sugarcane growth is beneficial to the farmers
in terms of savings on fertilizer cost.
3. This project is sustainable since the sugarcane farms in the lahar-laden areas of Pampanga and
Tarlac spans a vast areas. The farmers are very insistent on their request to the hauling contractor
for sludge and septage.
4. Additional studies must be conducted on the use of biosolids as soil conditioner or fertilizer.
5. There is a need to formulate criteria and standards for biosolids management.
6. The recommended EMP and EMoP have to be strictly implemented for ongoing and future,
related activities.
7. Dewatering will reduce hauling costs. However the degree of dewatering has to be established
taking into consideration that septage, in raw form, is beneficial in that it increases the moisture
content of lahar-laden soil.
8. Pipeline transport of biosolids, as previously suggested is not economically feasible.
Manila Third Sewerage Project (MTSP)
19
Introduction
CONTENTS
PAGE
1.
INTRODUCTION...............................................................................................................................................1-1
1.1
GENERAL......................................................................................................................................................1-1
1.2
PROJECT OBJECTIVES...................................................................................................................................1-2
1.3
STUDY APPROACH .......................................................................................................................................1-2
1.4
METHODOLOGY ...........................................................................................................................................1-2
1.4.1
Review of On-going and Completed Experiments and Studies on Reviving the Lahar-laden Soil ......1-2
1.4.2
Baseline Characterization......................................................................................................................1-3
1.4.3
Impact Identification, Prediction and Assessment ................................................................................1-3
1.4.4
Formulation of Environmental Management and Environmental Monitoring Plans ..........................1-4
i
Manila Third Sewerage Project (MTSP)
Introduction
1. INTRODUCTION
1.1
GENERAL
In Metro Manila, the inadequacy of collection and treatment of sewage has contributed to the rapid
degradation of most of the metropolitan's rivers and creeks. Past studies have shown that the pollution of
the waterways of Metro Manila is mainly caused by domestic wastewater. It is estimated that around 70%
of the pollution load to waterways and rivers in Metro Manila come from domestic wastewater discharges.
Only 3% of the population in Metro Manila is connected to the sewerage facility. Around 85% have septic
tanks, most of which were constructed without adequate leaching fields and are rarely properly maintained
or desludged.
As a response to this worsening problem, the Metropolitan Waterworks and Sewerage System (MWSS)
through its concessionaires, MWCI and the Maynilad Water Services Inc. (MWSI) sought the assistance
of World Bank to finance the Manila Second Sewerage Project (MSSP). The MSSP was aimed to
improve the sanitation condition of Metro Manila by constructing sewage and septage treatment plants to
treat domestic sewage and by providing new or upgrading old sewerage lines. When the MSSP was
nearing completion, MWCI proposed the Manila Third Sewerage Project (MTSP) for World Bank
funding. The MTSP is a follow-up to the MSSP to further improve the sanitation conditions in the east
concession zone.
The MTSP has been formulated by MWCI to expand domestic wastewater management through seven
sub-projects. These project components are intended to upgrade existing treatment facilities in sewered
areas, provide secondary treatment facilities for catchment currently served by combined sewerage
systems, improve sanitation conditions in low-income areas, and provide treatment facilities for the
septage from individual septic tanks (ISTs) located in the concession area. With the programmed
wastewater treatment plants and septage collection initiatives under the MTSP, there is expected an
increase in biosolids generation.
The existing and proposed sanitation services and sewer infrastructure of MWCI which include the
Magallanes Wastewater Treatment Plant (WWTP) producing dried sludge from drying beds, the MSSP
and the MTSP facilities producing liquid sludge and dewatered sludge using filter press, PRRC Septage
Treatment Plant (STP) producing dewatered and stabilized cakes using a combination of screw press and
lime stabilization, and the MTSP STPs ptoducing dewatered cakes using screw presses. Septage and liquid
sludge produced from the MSSP communal septic tanks, MSSP WWTPs and MTSP WWTPs and existing
bio-contact activated sludge WWTPs will be treated in one of the proposed STPs within the MWCI's
service area. All septage pumped out from individual septic tanks will be brought to the STPs before
disposal.
The operation of MWCI of wastewater treatment and septage collection facilities will generate about 450
m3/day of biosolids1 requiring treatment and disposal/reuse. Biosolids are the organic sludge produced
from physical and biological treatment of wastewater and include treated septage, secondary sludge, and
processed/stabilized sludge.
One of the environmental impacts attendant with the implementation of the MTSP pertains to
septage/sludge management. To address septage/sludge management issues, MWCI through the Sugar
Regulatory Authority (SRA) conducted several studies on the use of septage/sludge as soil conditioner to
sugar plantations in lahar laden agricultural lands with promising results.
The eruption of Mt. Pinatubo on June 1991 recorded that the volcanic dust flown into the atmosphere
reduced world temperature by 0.5şC,. lahars filled-up and clogged major rivers and creeks, and produced
extensive flooding and deposition that buried several municipalities of Pampanga, Tarlac and Zambales.
The lahars affected the health of the people, quality of life, education, employment, and limited the growth
1-1
Manila Third Sewerage Project (MTSP)
Introduction
of economy and development in the affected areas. In 1999 alone, lahar flowsdamaged homes of more
than 100,000 families, destroyed roads and bridges, fishponds and crops in Pampanga that amounted to
over PhP 600 million and to date, the effects of the eruption continues. Massive lahar flow and ash fall
also affected fertile agricultural lands used to be largely devoted to sugarcane growing. Research
investigations have been conducted on what could be done to revive the productivity of the once fertile
areas for sugar cane and other crops
Results of previous and ongoing experiments indicate that the use of septage/sludge as soil conditioner
greatly enhanced the sugar productivity in lahar laden areas. However, septage/sludge may contain
microorganisms and substances that can be harmful to the environment. To assess the environmental
impacts associated with the use of septage/sludge as soil conditioners through application to lahar-laden
soil, MWCI commissioned the consortium of Engineering Development Corporation of the Philippines
(EDCOP), Lichel Technologies Inc.(ISSI) and Inter-Structure Systems Inc.(ISSI).
1.2
PROJECT OBJECTIVES
The general objective of the study is to assess the environmental and social impacts of initiatives to revive
lahar-laden areas using septage and develop appropriate environmental management and monitoring plans
for future, related activities.
1.3
STUDY APPROACH
This study entitled Environmental Assessment (EA) for the Sludge/Septage Use as Soil Conditioner for
Sugar Can Growth in Lahar-Laden Areas conforms to the guidelines of the World Bank and the
Department of Environment and Natural Resources (DENR) Administrative Order No. 37 series of 1996
(DAO 96-37). The EA focuses on the following:
1. Identification of all significant environmental impacts and issues with the project relative to the
project location;
2. Description of the existing natural resources and environmental quality conditions and trends;
3. Resolution of all significant environmental impacts within the scope of the EA; and
4. Formulation of an economically feasible environmental management and monitoring plans.
1.4
METHODOLOGY
1.4.1 Review of On-going and Completed Experiments and Studies on Reviving the Lahar-laden
Soil
Research on the use of septage/sludge to enhance the productivity of lahar-deposited soil was started by
MWCI in 1999. The results of these experiments and studies were used in assessing the impacts of the
proposed sludge/septage as soil conditioner to the host environment and its immediate vicinity. The data
gathered were incorporated in the environmental baseline assessment. The Consultant also conducted
research on other related experiments, on-going and those already conducted and correlated the results to
the impact assessment of the project.
Experiments at the Sugar Regulatory Administration (SRA) Farm at Floridablanca, as well as on-farm
trials on the use of septage/sludge as soil conditioner started in 2000. The experiments, financed by
MWCI, involved either the use of septage/sludge as soil conditioner alone or as a major component in the
production of compost from sugar mill wastes bagasse and filter cake. Table 1- 1 of Volume II presents
the studies conducted in relation to septage/sludge application in lahar soils.
1-2
Manila Third Sewerage Project (MTSP)
Introduction
Results of the studies showed that:
· Raw septage has practically lower nutrient content and zero organic matter compared to sewage
sludge which has several folds higher nutrient content.
· The combined bagasse-mudpress-sewage sludge compost has thousand fold more nutrients and
organic matter, nevertheless, inorganic nitrogen was added at to supplement the deficiency for the
essential macro-elements. The effect of the composted sludge and bagasse was demonstrated
significantly on tonnage, sugar yield and sugar content of the plant cane (Study 3).
· The yield of plant cane (TC/ha) was significantly higher in the plots that were applied with sewage
sludge in the absence of inorganic nitrogen over the unfertilized untreated control.
· Plant cane requires higher input of compost or inorganic nitrogen than the ratoon cane to attain a high
yield.
· Ratoon cane was more responsive to inorganic fertilizer application and even to the treatment that
consisted of inorganic fertilizer and compost but this may be because of some residual effect of the
previous crop (Study 3).
· After two cropping in the same field, the soil pH was only slightly improved, available P & K was
increased but organic matter remained low. The results suggest that nitrogen is not the only element
that should be applied in a lahar-laden soil to improve the yield of sugar cane. It is therefore, important
that other elements be made available.
· In Study 4, mean plant height, number of tillers, millable stalk production and sugar yield, regardless
of inorganic nitrogen application, were significantly improved with application of sewage sludge. In
ratoon cane, the parameters e.g. diameter of millable stalks, weight of millable stalks/plot, cane
tonnage (ton cane/ha) and sugar yield have been significantly improved through addition of sewage
sludge
· Analysis for heavy metals in the soil after harvest showed that at all levels of sewage application, the
concentration of arsenic, cadmium, chromium, lead, mercury and selenium were except for arsenic
and chromium that increased after the application of sewage sludge in Study 2.
1.4.2 Baseline Characterization
Eco-profiling is a focused evaluation of the environmental quality of an area. It establishes an
environmental baseline condition, evaluates he impact of the development, and provides basis to identify
environmental strategies and monitoring needs to tract the effectiveness of the strategies. The
environmental baseline characterizations, which use both primary and secondary information, and the
methodology employed for each study module are summarized in Table 1- 2 of Volume II. The
discussion on the methodology of each study module is provided as Annex 1 of Volume II.
1.4.3 Impact Identification, Prediction and Assessment
Based on the collected information and described as baseline conditions of the environment, the impacts
of the project were identified, predicted and assessed. Assessment covered the various physical, biological
and socio-economic impacts of the project. Beneficial as well as adverse impacts of the project were
considered. Corresponding mitigating measures were recommended to address the negative impacts.
Environmental Health Impact Assessment (EHIA)
An Environmental Health Impact Assessment (EHIA) was executed to determine the health impact of risk
factors associated with the sludge disposal project. An environmental risk assessment that includes four
1-3
Manila Third Sewerage Project (MTSP)
Introduction
essential steps was executed. The steps in the preparation of an environmental health assessment include
the following:
Step 1 baseline health status
Step 2 hazard assessment
Step 3 risk assessment, and
Step 4 risk management planning
· Detailed discussion of the steps in the conduct of risk assessment is given as Annex 2 of Volume II.
Based on this integration, the various hazard events that may occur were ranked and the highest ranking,
indicating the highest risk, require the most urgent and important action for risk reduction.
Risk management also includes determination of way in which the risks can be reduced, either by reducing
the occurrence or character of the hazards, by reducing the exposure of the populations at risk, or by
improving the accident-recovery capability of the populations at risk. Finally, recommendation on the
control measures must be undertaken to prevent or minimize environmental health impact to communities
and workers.
1.4.4 Formulation of Environmental Management and Environmental Monitoring Plans
From the identified and predicted impacts, the Environmental Management (EMP) and the Environmental
Monitoring Plans (EMoP) were prepared. The EMP identified activities that are to enhance the positive
impacts and mitigate/alleviate the negative impacts of the project. The EMP include the work programs,
budget estimates, schedules, staffing and training requirements, and other necessary support services to
implement the mitigating measures.
The Environmental Monitoring Plan was prepared to ensure compliance with environmental standards and
include parameters to be monitored, sampling stations, frequency, cost and identification of
responsibilities. These EMoP was prepared with active participation of the proponent.
1-4
Manila Third Sewerage Project (MTSP)
Project Description
CONTENTS
PAGE
2.
PROJECT DESCRIPTION............................................................................................................................2-1
2.1
THE PROJECT .........................................................................................................................................2-1
2.2
PROJECT LOCATION ..................................................................................................................................2-1
2.2
PROJECT DETAILS .....................................................................................................................................2-2
i
Manila Third Sewerage Project (MTSP)
Project Description
2. PROJECT DESCRIPTION
2.1 THE PROJECT
The Project, Sludge/Septage Use as Soil Conditioner for Sugar Cane Growth in Lahar-Laden Areas,
is a project of the MWCI which offers septage/sludge generated from its eastern concession zone in Metro
Manila, for application in lahar-covered agricultural areas in Pampanga and Tarlac provinces.
The east concession area controlled by MWCI covers approximately 1,400 sq km in area (MWCI's
service area covers in part or in whole, 24 cities and municipalities in Metro Manila including:
Mandaluyong, Marikina, Binangonan, Cainta, Pasig, Montalban, Pateros, Cardona, San Juan, Jala-Jala,
Taguig, Morong, parts of Makati, Pililia, parts of Quezon City, Rodriguez, Parts of Manila, San Mateo,
Angono, Tanay, Antipolo, Taytay, Baras, and Teresa).
Based on the NSO population growth rates and data and information provided by MWCI and GHD the
forecasted population levels in the concession area are 5,290,000 for 2004; 5,590,000 for 2006; 6,380,000
for 2011; 7,340,000 for 2016; and 8,160,000 for 2021. The following are considered in the population
coverages used :
1) MWCI coverage in Makati City is 87% of the total land area
2) MWCI coverage in Quezon City is 41% of the total land area
3) MWCI coverage in Manila is 13% of the total land area
It is assumed that the population within the service area not connected to the MWCI sewerage
infrastructure has individual septic tanks collecting wastewater and providing primary treatment before
discharge to receiving bodies of water without the periodic desludging services.
The 1996 data from the SKM Septage Feasibility Study Report estimated the number of septic tanks in
Metro Manila to be over one million (1,000,000). The MWCI sewerage and sanitation coverage targets
(in % of total population in area) are presented in Tables 2-1 and 2-2.
2.2 PROJECT LOCATION
The project covers parts of the Central Luzon provinces of Pampanga and Tarlac, located about 60
kilometers north of Metro Manila (Figure ES-1). Among the six municipalities/cities involved in the
project, the town of Concepcion, Tarlac covered the largest area (300 hectares) capable for accepting
sludge/septage. Table 2-3 presents the land area and period of sludge/septage application. Figures 2-1, 2-
2, 2-3 and 2-4 show the locations of the application sites. The application sites evaluated, totaling 15, are
within two cities and four municipalities of the provinces of Pampanga and Tarlac. Seven of the 15 sites
have been identified as potential sites for sludge/septage application while the remaining eight are already
being utilized for the said purpose since year 2002. The sites were evaluated based on a set of guidelines
for site selection that includes depth of lahar/ashfall deposits, depth to groundwater, distance to nearest
water body, distance to nearest well, and distance to nearest house/community.
The total land area deposited with lahar in Central Luzon is 120,000 hectares. On-going septage/sludge
application involves 1070 has; sites evaluated for further activities cover 370 hectares. Out of the sites
evaluated, only 11 sites or 1,220 hectares sufficiently met the criteria on site selection. MWCI has to
explore more sites from the total lahar-covered areas for future activities. This is in consideration of the
total 450 m3/day to be generated from all sewerage and sanitation facilities by year 2010. Selection of sites
must also take into consideration optimum application rate which was found to be 120 m3/ha for septage.
2-1
Manila Third Sewerage Project (MTSP)
Project Description
Generally, the on-going and potential application sites are agricultural lands devoted to sugarcane. Some
of the application sites are adjacent to rice fields or vegetable farms. The application sites can be reached
either through concrete or all-weather barangay roads and through bulldozed feeder roads within the sites.
(Figure 2-5).
The barangay roads, especially at San Fernando, Angeles and Mexico are lined with houses, some of
which are adjacent to the application sites. Drainage system in the area is basically dendritic or
"branching" pattern which is typical of a flat terrain. Creeks surrounding the application sites flow either
perennially or intermittently and discharge into San Fernando River and Abacan River.
At Barangay San Jose Mitla, Porac, Pampanga, the application site is within the Monoport Traders Inc.
and is accessible through Barangay Mitla road, thence along feeder roads. The nearest settlement at
Barangay Mitla is about one kilometer south of the application site.
The application site at Barangay Carmencita, Floridablanca is about three kilometers south of the Basa Air
Base along the Floridablanca Dinalupihan alternate road. The application site is along the west bank of
Gumain River in an area which is planted to sugar cane. An elevated main access road, which serves as
an earth dike, separates the application site from the community on the west.
The Tarlac application sites at Barangay Telebanca, Concepcion and Malonzo, Bamban is a vast sugar
cane field of about 1,000 hectares. Only eight (8) resettlement homes were observed and is located along
the main access road that borders the northern side of the application sites. The main access road runs
parallel with the Bamban River dike.
The general characteristics of application sites is summarized and shown in Table 2-4.
2.2 PROJECT DETAILS
Sources of Biosolids
Liquid sludge from the biological treatment process at sewage treatment plants for the proposed
MTSP, and also those plants under MSSP, located at Pabahay Village, Valle Verde, Karangalan
Village, general MTSP plants (Road 5, Anonas Street, QC Barangays, Camp Atienza, Taguig,
Manggahan, Capitolyo, Ilaya, Poblacion in Pasig City, Labansan, Tapayan and Hagonoy) giving a
volume of 194 m3/day of liquid sludge. This is essentially a liquid at 2 or 3 percent solids, and will be
tankered to the septage treatment plants for dewatering. Dewatered sludge will be 25% solids and is
sufficiently dry to shovel and treat as a solid, even though still very wet.
Dewatered primary sludges from the primary treatment plants at the Taguig ponds will yield another
48 m3/day. These will not be stabilised and could possibly be odorous. In a traditional sewage
treatment plant, the primary sludges contain highly active organic material such as gross solids. These
sludges are very odorous. With the Taguig primary treatment plants, the inflow is sullage not raw
sewage, so gross solids and other highly organic materials will not be present. It is expected that a
large fraction of the primary sludge will be inorganics resulting from street runoff and catchment
erosion entering the combined sewer flows. Therefore it is appropriate to operate the primary
treatment facilities as proposed, and monitor the biological activity of the primary sludge to assess if
additional treatment is required such as lime stabilisation.
Dewatered secondary (biological) sludges from the MSSP and MTSP STPs totalling 127 m3/day.
This sludge will be about 25% solids, and is sufficiently dry to shovel and treat as a solid, even though
still very wet. It is not stabilised and as such can only be used under certain restrictions, such as burial
within 6 hours and not for certain food crops, such as those consumed raw unless there is certain
period between sludge application and harvesting the food.
Dewatered unstabilised septage volume of 177 m3/day from the two MTSP SPTPs, at 25% dry
weight. This dewatered septage is actually a mixture of the raw solids entering the SPTP which are
2-2
Manila Third Sewerage Project (MTSP)
Project Description
settled and then dewatered, and the biological secondary sludge from the liquid treatment plant for the
liquor following on from the solids removal. The septage sludge is therefore a mixture of septage
solids and biosolids or sludge. It is not going to be stabilised, but there will be some chemicals added
to assist in the dewatering process. These will be at very small doses, just sufficient to ensure that the
dewatering targets are achieved. The chemicals will be standard polyelectrolytes used globally for
such processes.
Dewatered stabilised septage volume of 90 m3/day from the PRRC SPTP at Antipolo, at 25% dry
weight. This dewatered septage is also a mixture of the raw solids entering the SPTP which are
settled and then dewatered, and the biological secondary sludge from the liquid treatment plant for the
liquor following on from the solids removal. The septage sludge is therefore a mixture of septage
solids and biosolids or secondary sludge. It is going to be stabilised by lime addition, at high dose
rates of up to 0.5 kilograms of lime per kilogram of solids. The lime increases the pH and also
increases the temperature to inactivate the pathogens. The resulting septage sludge will meet the
Class A requirements of the US EPA and as such is acceptable for almost unrestricted reuse
applications. The PRRC is investigating possible sludge reuse locations on farms close to Antipolo,
but the backstop will be blending the PRRC material with the other sludges to transport to the
Pampanga areas.
Dried biological sludges amounting to approximately 5 m3/day from the existing Magallanes STPs.
These sludges have been dried on sludge drying beds and can be even drier than the 25% dewatered
solids achieved mechanically. They are stabilised by virtue of the open exposure over a longer term
of weeks to months.
The total sludge volume to be managed locally every day is therefore 194 m3/day of liquid sludge to be
transported from the STPs to the SPTPs for dewatering. This is a local transport issue only.
The sludge quantity to be transported to the Pampanga region is approximately 450 m3/day. Because it is
a solid, the only option is trucking not pumping. The sludges will be combined apart from the PRRC
sludge and dried sludges which are stabilised.
Sludge Characteristics
Sewage sludge, in 40 CFR Part 503 of the EPA, is defined as solid, semi-solid, or liquid residue generated
during the treatment of domestic sewage in a treatment works. Sewage sludge includes, but is not limited
to, domestic septage, scum, and solids removed during primary, secondary, or advanced wastewater
treatment processes. The definition of sewage sludge also includes a material derived from sewage sludge
(i.e., sewage sludge whose quality is changed either through further treatment or through mixing with
other materials). The physico-chemical and metal concentrations of sludge are shown in Table 2.8.
Concentrations for Cu and Zn are within permissible limits of the EPA standards for sewage sludge.
Method of Application
MWCI is currently disposing wet septage to lahar fields in Tarlac and Pampanga as land rehabilitation and
broad acre agricultural reuse options. The lahar application is being done in collaboration with the Sugar
Regulatory Administration (SRA) and is on a trial basis to assess the effect of liquid septage application
on the growth and yield of sugar cane. Lahar deposits on the Tarlac application area are reportedly from 3
to 6 meters and fields were not previously used for agricultural purposes, i.e. prior to the Mt. Pinatubo
eruption. Lahar deposit at Mitla, Porac is from 10 to 15 meters thick while at Carmencita, Floridablanca,
lahar deposit thickness is estimated from 1 3 meters. The San Fernando Angeles - Mexico, Pampanga
application sites are agricultural lands. Except for Barangay Calubasa, Mexico which is covered with one-
meter thick lahar deposit presumably from the spill of Abacan River, the other application sites are
blanketed with 1-2 inches ashfall deposits.
2-3
Manila Third Sewerage Project (MTSP)
Project Description
It is understood that majority of the lahar fields being applied with septage are owned or leased by the
septage-hauling contractor although farmers have openly expressed their willingness to avail of the
septage due to its water content and proven efficacy. Application rate is in the order of 200m3 of septage
per hectare over a 2-month period during the early part of the planting season. This gives an average
septage application of 20 mm over the 2-month period. Septage is applied via:
· Hoses and allowed to flow through furrows between planted sugarcane.
· Direct spray application using transportable tanks on areas not yet planted with sugarcane.
The farmers turn the soil over upon completion of the septage application for areas yet to be planted with
sugarcane, however this was not observed during the site visit. Areas already planted with sugarcane
however were observed to have dried septage solids on the ground surface.
Allocation of septage is programmed on a rotation basis as trucks come in. However, in most instances
other farmers not currently being supplied with septage, specially the barangay captains and those with
and land along the access route to the application area, request that the haulers apply septage to their land
as well. The septage hauling contractors are not charging any fees to farmers who request the septage.
2-4
Manila Third Sewerage Project (MTSP)
Environmental Baseline Condition
3. ENVIRONMENTAL BASELINE CONDITION
3.1 INTRODUCTION
This section presents the environmental baseline condition within and around the project areas. The
objective of this baseline study is to describe and characterize the current condition of the environment in
the project sites prior to full project operation. As mentioned in the preceeding section, the project sites are
situated in the lahar-laden areas of Pampanga and Tarlac provinces involving six municipalities and 15
barangays.
The discussion on baseline environment mainly focused on three essential components, namely: the
physical environment, biological environment, and socio-economic environment. The physical
environment comprises the geology, pedology, hydrology, meteorology, and air and water quality sub-
components. The biological environment presents the aquatic ecology and terrestrial ecology portion
while the socio-economic environment part highlights the profile of Pampanga and Tarlac provinces and
the concerned cities/municipalities, results of the household survey and public consultations, and the
current health situation of the community in the project sites.
3.2 PHYSICAL ENVIRONMENT
3.2.1 Geology
Regional Setting
Tectonics and Siesmicity
The Project, which is located in the Luzon Island, Philippines is a geologically active region (Figure 3 -
1). The following are the major tectonic elements in the Luzon island.
· Manila Trench - represents the morphologic expression of the subduction of the oceanic crust of the
South China Sea under the Luzon Arc (Aurelio, 2000). Onshore, the tectonic structure depicts a linear
alignment of volcanic landforms that lies sub-parallel to the trench.
· Philippine Trench most seismically active generator in the Philippines. It serves as the boundary
between the west Philippine Sea Plate and the eastern portion of the Archipelago.
· Philippine Fault Zone (PFZ) 1,300-km fault zone extending from Lingayen Gulf in Pangasinan,
north Luzon to the offshore Pujada Peninsula in the southeastern Mindanao. The July 1990
earthquake was caused by the sudden movement of the north trending splay of the PFZ the Digdig
Fault. Increased solfataric activity in August 1990 (PHIVOLCS, 1990), possibly in response to this
earthquake was the first indication for a reawaking of Mount Pinatubo after about 500 years of
dormancy.
The distribution of historical earthquakes with magnitudes of greater than Ms 5.5 and covering the period
from 1973 to June 2003 (NEIC, 2003) within 200-km radius of Angeles City is shown in Figure 3-2.
Events tend to cluster in the offshore region along Verde Island Passage between the southwest coast of
Batangas and Mindoro Island. Moderate to deep (>150 km) foci seismic events with a predominant thrust
focal mechanism solution indicate active convergence along the southern extension of the Manila Trench
system. In contrast, shallow seismic events (< 70 km) appear to have originated from the movements of
regional faults (e.g. Mindoro Fault, Lubang Fault) and their minor splays. Shallow seismic events also
appear to have originated along the Philippine Fault System. Foremost of these seismic events that
occurred recently along the Philippine Fault is the July 16, 1990 earthquake that registered a magnitude of
Ms 7.8.
3-1
Manila Third Sewerage Project (MTSP)
Environmental Baseline Condition
Physiography and Stratigraphy
The Project region lies on the western portion of the Luzon Central Plain. The Luzon Central Plain, with
an area of about 11,000 square kilometers is the largest in the country. It is about 150 kilometers long and
an average breadth of 60 kilometers. The alluvial plain consists of broad, coalescing alluvial fans having
low gradients that ranged from 0.02 m/m at fan heads approximately 200 meters above sea level (masl) to
less than 0.0002 m/m along distal alluvial plains (Pierson et al, 1992). It is bounded on the north by
Luzon Central Cordillera, on the east by Sierra Madre, on the west by Zambales Range and on the south
by the Southwest Luzon Uplands (BMG, 1982). At the center of the plain prominently stands Mt. Arayat
(1030 m), a lone volcanic peak. Agno River drains the northern part of the plain and empties into
Lingayen Gulf while Pampanga and Angat rivers drain the southern part and discharge into Pampanga
Bay. In the Zambales Range rises Mount Pinatubo, made famous because of its enormous 1991 eruption.
The general stratigraphy at the Mount Pinatubo and the western portion of the Luzon Central Plain are,
from oldest to youngest (Bureau of Mines and Geosciences, 1982)
·
Zambales Ophiolite Complex. The Zambales Ophiolite Complex are ultramafic and mafic rocks
consisting of peridotites, gabbro, basalt, diabase dike, chert-spilite; and pelagic and hemipelagic
sediments. These sediments which belong to the Aksitero Formation is considered Early Eocene
·
Pre-Pinatubo sedimentary and volcanic rocks. Consisting mostly of the Tarlac Formation, this
unit composed of interbedded sequence of calcareous, tuffaceous sandy shale, sandstone and
lenticular pebble conglomerate. It is dated Late Miocene to Pliocene age.
·
Neogene intrusives. The intrusives consist of granodiorite and diorite porphyry
·
Ancestral satellite vent deposits. These are andesite and dacite domes and plugs,
contemporaneous with deposits of ancestral Pinatubo (Pleistocene Age). These include Mount
Negron dome, Mount Cuadrado dome, the Mataba dome and adjoining Bituin plug, and the
Tapungho plug (Delfin, 1984).
·
Deposits of Ancestral Pinatubo. Andesitic and dacitic pyroclastic flow and lahar deposits, and
lava flows of Pleistocene Age.
·
Volcanic rocks of Modern Pinatubo. Consists mainly of dacitic pyroclastic flow and lahar
deposits from late Pleistocene to Present.
Figure 3 - 3 is a generalized geological map covering the Mount Pinatubo and surrounding areas.
Local Setting
The geology at the Project sites consists of Quaternary alluvial deposits overlain by the Lahar deposits
from the 1991 eruption of Mount Pinatubo.
Quaternary alluvial deposits consist of alternating clay, silt, sand, clayey and silty sands, gravels and
conglomerates. The deposits are reworked suggesting to the rise and fall of the sea level during its
deposition. The full thickness of these deposits is unknown. A lithologic log from a well at Sta. Ana,
Pampanga, which is located in the central part of the alluvial basin, indicated alluvial deposit thickness of
more than 400 meters. The thickness of the alluvial deposits is expected to thin out near the margins of
the basin.
3-2
Manila Third Sewerage Project (MTSP)
Environmental Baseline Condition
Lahar deposits are complex materials (Arguden et al, 1990) composed of various admixtures of sediments
with a wide variety of grain sizes. Pierson and Scott (1985) classified lahar deposit facies either debris-
flow deposits or hyperconcentrated streamflow deposits (Figure 3 - 4). Debris-flow contains sediments
usually exceeding 60 percent by volume. Debris-flow deposits commonly are poorly sorted and have
broad distributions of grain size. The mean grain size of the non-gravel fraction commonly ranges from
about 1 mm to more than 4 mm (very coarse sand to pebbles). Hyperconcentrated streamflows have
sediment concentrations that range between 20 and 60 percent by volume. The resulting deposits
commonly are massive to slightly laminated and have a narrower distribution of grain sizes; the mean
grain size commonly ranges from about 0.25 mm to 0.5 mm (medium to coarse sand). PHIVOLCS
examined gravel and sand sized lahar material as porphyritic biotite-hornblende, quartz, latite pumice.
There are no studies to determine the actual thickness of lahar deposits at the project sites. Farmers at the
project site in Barangay Mitla, Porac, Pampanga estimated the lahar deposit to be 15 meters (50 feet)
thick. A borehole (BH-2) drilled by the BRS (2002) near a buried church at Barangay Mancatian
encountered lahar deposits up to a depth of 10.5 meters (34.5 feet). At Barangay Telebanca, Concepcion,
Tarlac, the lahar deposit is estimated between 4.5 to 9 meters (15 to 30 feet) thick. Hand-pumped wells at
Barangay Carmencita, Floridablanca penerated lahar deposits to a depth of more than 6 meters (20 feet).
3.2.2 Natural Hazards
The project area is susceptible to seismic, volcanic and hydrologic hazards
Seismic Hazards
The hazard directly associated with earthquakes at the Project area is intense ground shaking and ground
rupture. In general, the intensity of ground shaking is magnitude-dependent, and gradually decreases with
distance from the source. Difference in ground conditions, however, may cause deviations from this
expected norm, particularly in areas underlain by recent alluvium.
Ground Acceleration
The Project area is underlain by thick Quaternary alluvial deposits and recent lahar deposits. Under this
condition, the ground conditions approximate that of soft soils based on the classification scheme
developed by Fukushima and Tanaka (1990). Thenhaus and others (1994) calculated regional probabilistic
estimate of ground shaking intensities based on a hypothetical earthquake with Ms 8.2 and with 10 percent
probability of exceedance in 50 years. For any of the possible earthquake sources in the region, the
estimated peak horizontal ground acceleration amplitude is 0.61g where g is the acceleration due to
gravity (Figure 3 -5).
Ground Rupture
Ground rupture breaking and movement along an active fault trace could result to horizontal and/or
vertical shifting of the ground. Damage can be severe for structures built within a narrow zone of active
fault traces. For the July 1990 Luzon earthquake (Ms 7.8), the deformation zone was within 5 meters from
the surface rupture (Daligdig and Besana, 1993).
Volcanic Hazards
The eruption of Mount Pinatubo in June 1991 produced large-scale destruction on its east and west flanks.
Eruption-related hazards are ether direct or indirect in nature. In the project area, hazards produced
directly by volcanic activity include airfall tephra and pyroclastic flows while indirect hazards are lahars
and floods.
3-3
Environmental Baseline Condition
Airfall Tephra
Figure 3 6 is an isopach map of airfall tephra during the 12-15 June 1991 eruptions of Mount Pinatubo.
Airfall tephra occurred as pumice rich coarse (400 microns) to very fine (50 to 70 microns) ash that was
deposited in a west-southwest direction indicating the effect of typhoon Yunya that influenced the region
from 14 15 June 2001.
Lahar
Lahar, an Indonesian term, is simply defined as volcanic mudflows. It is a flowing mixture of volcanic
debris and water. A lahar is an event and not a deposit, which is commonly identified. Surrounding Mount
Pinatubo, lahars were caused primarily by remobilization of unstable pyroclastic flow deposits (Umbal et
al, 1991). Lahar filled up major drainage systems of the Mount Pinatubo. This raises riverbeds and caused
overbank spill, which became widespread and catastrophic. Figure 3 -7 is a map showing the areas
covered by lahar deposits from 1991 to 1995.
Hydrologic Hazard
Flooding
The Central Luzon Plain is susceptible to flooding, even before the eruption of Mount Pinatubo.
Torrential rains brought by storm "Diding" and typhoon "Yunya" during the 14 15 eruptions produced
five modes of flooding activity (Javelosa, 1994): in-channel, interchannel, overbank spill, sheetflood and
deltaic flood. In-channel and overbank spills, which were concurrent with lahar, were the most destructive
flooding activity. Interchannel and sheet floods occurred in areas where enormous ashfall tephra clogged
remnants of distributary channels and depressions. Near Pampanga Bay, fine laharic debris chocked river
mouths and tidal inlets producing deltaic floods.
3.2.3 Pedology
The lahar deposits of Mount Pinatubo affected most of the sugar cane fields in Pampanga and Tarlac.
Lahar deposits are predominantly sand (75%) with subordinate silt (18%) and only 3% clay. It has a pH
of 4.50 (Table 1-12 in Annex 3). Organic matter content is very low (0.10%) and a total nitrogen content
of 0.004%. The phosphorus and potassium contents are 4.3 ppm (Olsen P) and 0.012 me/100g K,
respectively. Because of the low nutrient status and low cation exchange capacity (CEC) of only 0.427
me/100g, lahar is considered an inert medium for plant growth and lahar-laden fields have stayed untilled
for crop growing. However, several plant species have gradually colonized the areas through the years
thus adding organic matter to the fields. For example, after more than 10 years the original Angeles fine
sand in Floridablanca, Pampanga, is now characterized by the researchers of LAREC to have pH 5.6,
organic matter of 1.5%, 61 ppm P and 134 ppm exahngeable K (Table 1-9 Annex 3 of Volume II).
The "soil" in the lahar-laden sugarcane fields in Floridablanca and elsewhere in the province are still
predominantly sandy loam. At present, the areas that have been applied by septage and which are planted
to sugar cane are found to provide adequate nourishment to both plant canes and ratoon canes as suggested
by the green and healthy-looking plants even at the height of the summer months. Application of
septage/sludge on the lahar-laden fields had slightly improved the pH, organic matter content and the
essential elements such as P and K (Annex 4 of Volume II).
3-4
Environmental Baseline Condition
Septage/sludge contain detectable concentration of lead and cadmium as well as other metals, however the
lahar-laden soil which were dumped with sewage suggest levels that are below the limit of 5 ppm set by
DENR. Even the soil samples that have not been applied with septage/sludge suggest the presence of lead.
The analysis of soil and sugar cane tissues collected from the treated field sites showed that the
incorporation of sugar mill wastes e.g. bagasse and mudpress, did not only improve growth and yield of
sugar cane but also retained the low levels of metal uptake by the plants. Independent studies by the
project leader and some students on uptake of heavy metals have also shown that the addition of compost
to the soil with heavy metals tend to minimize uptake by forest species and leafy vegetable such as
pechay.
The lahar soil has been found to be able to support sugarcane growth during the summer months especially
when septage is applied. Other broad leaf species that are relatives of economic food crops have also
started to grow in the lahar-laden fields implying the already suitable environment for crop growing in the
areas. In the septage-applied areas, which were not yet planted, seedlings of water melon, tomato and
musk melons are found. These seedlings are inherent in septage. From the soil conditions and the
vegetation that were observed to colonize and grow in the septage-treated lahar fields, it can be surmised
that the particular treated soil is already fit for planting agricultural crops.
Lahar Physical and Chemical Properties
Physical Properties
The location and approximate coordinates of the sampling stations are given in Table 3-1 of Volume II
and Figure 3-8. These sampling stations were identified from sites already applied with septage.
Field infiltration tests conducted at the four sites revealed infiltration rates ranging from 11 centimeters per
hour (cm/hr) measured at Panipuan, San Fernando, Pampanga to 92 cm/hr determined at Carmencita,
Floridablanca, Pampanga. The USDA classified these infiltration rates as moderate to very rapid.
Laboratory analysis of undisturbed soil core samples indicated hydraulic conductivity values that vary
from 1.1 x 10⁻³ to 4.0 x 10⁻² centimeters per second (cm/sec). These values are considered by USDA as
fast to very fast. Table 3-2 of Volume II shows the infiltration rate and hydraulic conductivity of lahar
soils at the project sites.
Chemical Properties
Results of the laboratory analysis for eight soil samples collected in March 2004 suggested the presence of
two heavy metals, cadmium and lead (Volume II Table 3 - 3).
Additional laboratory analyses for the chemical properties of lahar soils at the project sites are shown in
Table 3 4 of Volume II. The lahar soils at Telebanca, Panipuan and Carmencita are acidic (pH<6.6),
whereas the lahar soil from Mitla is alkaline (> 7.4). Cation Exchange Capacities (CEC), except for soil
samples at Carmencita (0-10 cm) and at Mitla (below 20 cm), are low at <29 meq/100g (FAO-UNDP).
This indicates low fertility status of soil.
3.2.4 Meteorology
The meteorological condition of the project sites is described in the following sections using
climatological data obtained from observations at the Philippine Atmospheric, Geophysical and
Astronomical Services Administration (PAGASA) at Cabanatuan, Nueva Ecija station. Rainfall data
however, were derived from PAGASA stations in Sta. Rita, Porac, Bacolor, and San Fernando, Pampanga.
These stations were considered with due consideration to its proximity to the project sites and availability
of data. Table 3 5 of Volume II shows the approximate distance of these stations relative to the project
sites.
3-5
Environmental Baseline Condition
Climate
The climate of Pampanga and Tarlac belongs to Type 1 of the modified Coronas Classification of
Philippine Climates as presented in Figure 3 - 9. This type is characterized by two pronounced seasons,
dry from November to April and wet during the rest of the year.
Rainfall Characteristics
Monthly and Annual Rainfall
Precipitation events were recorded by gages of specific locations. The raingage network provided a
measure of the time distribution of gross precipitation. The resulting data permitted the determination of
the frequency and character of precipitation events in the vicinity of the project sites. Point-precipitation
data were gathered in the province of Pampanga particularly those located at the same climatic condition.
The monthly and annual rainfall values in millimeters (mm) of four rainfall stations are presented in Table
3-6 of Volume II.
The mean annual rainfall at the project sites is between 2,000 2,100 mm (Table 3 7 of Volume II).
August is the rainiest month with a mean monthly rainfall of 466.6 mm while the driest month is February
with mean monthly rainfall of 5.3 mm. The amount of rainfall normally subsides during the month of
November with an average number of 8 rainy days. Beginning the month of May, however, the amount of
rainfall increases substantially which normally last until October.
Rainfall Intensity Duration Frequency Data
Rainfall extreme value in terms of intensity, duration and frequency is one of the most important
hydrometeorological information required in the feasibility study, planning and design of hydrological and
related projects. The problem of sedimentation and silting in rivers, irrigation canals and of dams is due to
erosion. Since rainfall is a major causative factor in the erosion of soil, the effective control and
management of erosion ought to take a serious consideration of rainfall intensity, frequency and duration.
The rainfall-intensity-duration-frequency data of a rainfall station can only be obtained if it has an
automatic recorder that would record for short duration (5 minutes, 10 minutes, 15 minutes, etc.).
There are four (4) rainfall stations previously operated and maintained by PAGASA that are located in the
provinces of Pampanga and Tarlac. These are in Cansinala, Apalit; Sta. Cruz, Porac; and San Agustin,
Pampanga and Hacienda Luisita, San Miguel, Tarlac. The extreme rainfall value of each rainfall values
with specified duration were fitted with Gumbel Type I distribution. Extreme values and their
corresponding probabilities in terms of the frequency of their recurrences and occurrences are shown in
Tables 3-8 to 3-11 of Volume II.
Temperature
Temperatures in Pampanga and Tarlac are typical of lowland locations in many parts of the country. The
warmest months are April and May with mean temperature of 29.0°C and 29.5°C, respectively. January is
the coolest month with mean temperature of 25.7°C. Mean annual temperature is 27.5°C.
Wind
Two dominant wind regimes are visible: a northeasterly trend from October to February and a southerly
trend from June to September. Southeasterly winds were also observed during months of March to April.
The mean annual wind speed is 2 meters per second (m/s). Average monthly winds are strongest in the
3-6
Environmental Baseline Condition
month of December at 3 m/s and stable for the rest of the months at 1 to 2 m/s. Winds from the northeast
are generally stronger than those from other directions.
Typhoon Frequency
The frequency of typhoon passage within 50 km from the project site is relatively low. Based on
unpublished studies of PAGASA, this frequency is estimated to have 5 typhoon passages every 3 years.
The typhoon frequency map is shown in Figure 3 - 10.
3.2.5 Air Quality and Noise Level
Air Quality
The observed TSP concentrations sampled at these stations are tabulated in Table 3 12 of Volume II.
The concentrations of the pollutants were compared with the National Ambient Air Quality Standards
(NAAQS) for source specific air pollutants for one-hour monitoring. This is in accordance with DENR
Administrative Order 2000-81, the Implementing Rules and Regulations for RA 8749 (Philippine Clean
Air Act of 1999). The three highest TSP concentrations recorded during the monitoring period are 533.1
ug/Ncm at station A16, 450.5 ug/Ncm at station A8, and 415.9 ug/Ncm at station A1. The average TSP
concentrations measured in Floridablanca, Mexico and Angeles City, Pampanga are well within the
prescribed limit of 300 g/Ncm. However, the measured average TSP concentration in Porac and San
Fernando, Pampanga, and Concepcion, Tarlac slightly exceeded the standard. This exceedance can be
attributed to the nature of the lahar materials present in all sampling stations. Sampling was conducted
during dry period which significantly contributed to the excessive movement of lahar particles in the
project areas.
Noise Level
The results of the daytime noise level monitoring area also shown in Table 3 12 of Volume II. The
highest average noise level recorded was 69.5 dBA at Mexico, Pampanga station, followed by 66.5 dBA at
Angeles station; 65.5 dBA at Porac station; 63.5 dBA at Floridablanca station; 59.5 dBA at San Fernando
station; and 56.0 dBA at Concepcion, Tarlac station. When compared with NPCC daytime noise level
standard (Table 3 12 of Volume II) for residential areas, all stations fail to meet the 55 dBA noise level
standard. When compared with the 65 dBA limit for commercial areas, the Floridablanca, San Fernando
and Concepcion, Tarlac stations complied with the standard. The other three stations (Porac, Mexico, and
Angeles) slightly exceeded the 65 dBA limit. Among the major contributors of noise in the locality that
were noted during the monitoring period were the passing vehicles, blowing of wind, and sounds created
by domestic animals and insects.
The environmental quality standards for noise in general areas are presented in Table 3 13 of Volume
III.
3.2.6 Hydrogeology
The project sites, which are located in the Central Luzon provinces of Pampanga and Tarlac, exhibit
similar hydrogeological conditions. Prior to the Mount Pinatubo eruption and subsequently the lahar
events, the hydrogeological condition at the project sites is characterized by shallow (<30 m) alluvial
deposit aquifers with varying yields form 2 liters per second (lps) to more than 20 lps. Groundwater
movement is entirely intergranular. The major lahars that occurred shortly after the Mount Pinatubo
eruption in June 1991 until 1995 deposited pyroclastic materials of more than 10 meters in some areas
(e.g. Barangay Mancatian, Porac, Pampanga). Information gathered during the well inventory near the
project sites revealed that despite the presence of the younger lahar deposits, groundwater abstraction is
3-7
Environmental Baseline Condition
still confined in the older alluvial deposits. Lahar deposits, which are predominantly sand-sized
sediments, have moderate to high hydraulic conductivities that allows groundwater movement with
relative ease. Although geotechnical boreholes indicated saturated conditions exist in lahar soils,
groundwater yields in this formation could still be limited due to its limited extent.
Hydrogeologic Units
The major hydrogeological units in the project area coincide with the Quaternary Alluvial Deposits and
the Lahar Deposits. These units are described under Section 3.2.1.2 - Geology.
Groundwater Occurrence
Groundwater in the project area occurs in interstices of the alluvial and lahar deposits. A borehole (BH-1)
drilled by BRS (2002) at Barangay Cabangbangan, Bacolor, Pampanga indicated saturated condition in
lahar deposits 2 meters below ground surface (mbgs). In BRS BH-2, saturated condition was logged at the
base of the lahar deposit 10.5 mbgs.
Groundwater movement through these media is largely intergranular. The National Water Resources
Council (NWRC) rapid assessment of water supply of Pampanga and Tarlac provinces in 1982 classified
the project areas as shallow well areas. These areas have well depths that are within 20 meters (Figure 3 -
11 and 3-12). Average static water levels range from 1.8 mbgs in Concepcion, Tarlac to 11 mbgs in
Angeles City (NWRC, 1982).
Aquifer Properties
The Quaternary Alluvial Deposits constitute the main aquifer in the project region. The full thickness of
this aquifer is unknown. At Sta.Ana, Pampanga, the alluvial deposit persists to a depth of 400 meters.
In 1981, NWRC conducted groundwater resources investigations in the provinces of Pampanga and
Tarlac. Using the geo-resistivity method correlated with well logs, NWRC were able to determine the
different subsurface horizons and classified these as either good of poor aquifers. Good aquifers were
interpreted as having measured resistivity values between 20 to 250 ohm-meter. It composed of 70%
gravel and sand and 30% clay. Good aquifer horizons from 2 to more than 200 mbgs were interpreted
from resistivity sounding stations in Floridablanca, Porac and Angeles City in Pampanga and in
Concepcion, Tarlac. These areas are located on the western side of the plain. Poor aquifers, on the other
hand, have lower resistivity values from 10 to 20 ohm-meter. This aquifer consists of 70% clay and 30%
gravel and sand. Poor aquifers were interpreted from resistivity sounding points in the eastern side of
Pampanga at Mexico, Candaba, San Simon, San Luis and Magalang. At Tarlac, low resistivity values were
measured in San Clemente and Mayantoc. Due to the complex mode of deposition of materials, high
yielding wells are also likely to abound in poor aquifer areas. Impermeable clay formations may occur
only as numerous lenses which do not completely affect the permeability of the aquifer. Saline affected
aquifers were encountered in Lubao, Guagua, Bacolor, Macabebe, Minalin, Masantol and Sexmoan.
Well Inventory
A well inventory was conducted in the Project sites from 23 - 24 March and 24-25 September 2004.
However, very limited well data were collected. Four (4) irrigation wells, one of which was dry, were
surveyed at the application site in Barangay Mitla, Porac. Interviews with farmers revealed that the wells
were constructed starting year 2002. The wells vary from 24 to 45 meters (80 to 150 feet) deep. Air lift
test conducted on one of the wells yielded 6.5 liters per second (lps). Shallow hand-pump wells were
observed at the project site in Barangay Carmencita, Floridablanca. One of the wells is 6 meters (20 feet)
deep and is use for domestic purposes. At Barangay Panipuan, San Fernando, Pampanga, a hand-pump
well, about 7.5 meters (25 feet) deep was inspected at the residence of the Barangay chairman. The
shallow well, about 30 years old is use for domestic purpose. A motor-driven well 18 meters (60 feet)
3-8
Environmental Baseline Condition
irrigates a rice and vegetable field of the Barangay Chairmain. Constructed in May 2004, the well
discharges 15 lps. At Barangay Telebanca, Concepcion, Tarlac, a hand-pump well was located about 500
meters from the project site. The well is about 30.5 meters (100 feet) deep and is also use for domestic
needs. Table 3-14 the location, coordinates, type, and reported depth of inventoried wells. Figure 3-13
shows the location and photographs of the inventoried wells in relation to the application sites at San
Fernando Angeles Mexico area. The locations and photographs of wells at Porac and Floridablanca,
Pampanga and at Concepcion, Tarlac are shown in Figures 2-2 to 2-4.
Table 3 -15 is a water well data summary of project areas taken from the NWRC Rapid Assessment of
Water Supply Sources (1982).
3.2.7 Surface Water Hydrology
The project sites located in Telabanca, Concepcion, Tarlac is within the Pampanga River basin.
Specifically, it is near the Sacobia-Bamban River, which is one of the tributaries that drains to the
Pampanga River.
The application sites in Pampanga are situated in two (2) river basins namely; Caulaman and Guagua. The
application site at Mitla, Porac, Pampanga is within the Pasig-Potrero basin and near the Porac River.
Porac and Pasig-Potrero rivers are tributaries of Guagua River. The site in Floridablanca is located in
barangay Carmencita and is situated between Gumain and Caulaman rivers. Gumain River is one of the
tributaries of Guagua River while Caulaman River flows directly to Pampanga bay. The remaining sites
are situated in various barangays of the municipalities of San Fernando, Mexico and Angeles City. The
sites at Mining, Angeles City, and Suclaban, Culubasa and Malino, Mexico, are on the right side of
Abacan River (facing downstream) while the remaining are near the small creeks and rivulets located
within the three (3) municipalities. Abacan River and these creeks discharge its waters into Guagua River.
Mean Monthly Streamflow
The identified application sites of the septage/sludge are located within three (3) major river basins; the
Caulaman river, Guagua river and Pampanga river, one of the principal river basins of the country. Within
these three (3) river basins are six (6) rivers namely: Porac, Caulaman, Gumain, Pasig-Potrero, Sacobia-
Bamabn and Abacan. The Sacobia-Bamban River at 130 sq.km is the largest drainage basin in the study
area. The location of the pre-lahar streamflow measurement stations and period of record of the six (6)
rivers is presented in Table 3 16 of Volume II.
The mean monthly flows of gaged rivers are based on years of records as shown in Table 3 17 of
Volume II. High mean monthly flows occur from July to September with the highest mean in August
computed at Gumain River (24.64 m3/sec).
As mentioned earlier, Abacan and Sacobia-Bamban rivers have no historical streamflow records. A basin-
factor ratio method was used to estimate the mean monthly flow of the aforementioned rivers. The Abacan
river was correlated with Porac River while Sacobia - Bamban River was estimated using the data from
Parua River at San Nicolas, Bamban, Tarlac to determine their mean monthly flow. The higest mean
monthly flow computed for Abacan River is 5.7 m3/sec (August) and is 12.75 m3/sec (October) for
Sacobia-Bamban River. The results of the basin-factor ratio method for the two rivers are shown in Table
3 18 of Volume II.
It must be emphasized that the hydrological behavioral characteristics including the hydraulic and
geomorphic behavior of the above-mentioned rivers (both gaged and ungaged) before the Mt. Pinatubo
eruption is entirely different from the pre-eruption scenario. It has been observed that most if not all gaged
rivers were abandoned sometime in 1970 and some were re-established in different locations sometime in
1985 but was again abandoned in early 1990. The reason is probably due to instability of the gaging
3-9
Environmental Baseline Condition
station, uncontrolled cross- sections, frequent washed out of staff gages, which would result to unreliable
rating curve (stage-discharge relationship).
Streamflow Measurements
As previously mentioned, some monitoring stations were relocated and re-established in different
locations within the three (3) river basins. This is probably due to the difficulty of establishing a reliable
rating curve from the original locations. For Porac River, the gaging station was re- established in two (2)
locations, one (1) in Nasudeco, Floridablanca and the other in Poblacion Porac, Pampanga sometime in
early 2003 while for Pasig-Potrero, it was moved to Mancatian, Porac sometime in 1994. A gaging station
was also established at San Francisco, Concepcion, Tarlac sometime in late 1993 but was recommended
for abandonment in late 1994 due to abnormal hydrological behaviour. The eruption of Mt. Pinatubo
sometime in June 1991 has a big influence in the hydrological behaviour of river systems in Tarlac,
Pampanga and Zambales provinces. Due to the eruption, pyroclastic materials or lahar materials were
deposited at the slope of Mt. Pinatubo were detached and transported by floodwaters whenever heavy
rainfall occurs or during inclement weather condition to low-lying areas and river channels. Rivers were
heavily silted in a very short period of time reducing its capacity to accommodate big floods. Some rivers
changed its course while some rivers/creeks were pirated and discharged its waters to another river
system.
Actual discharge measurements were conducted on the newly established and re-established gaging
stations of different river systems. The higest daily streamflow was measured at Pasig-Potrero River (river
section area = 28.125 m3/sec) on 25 September 1994. The summaries of discharge measurements at Porac
River, Sacobia-Bamban River and Paisg-Potrero River are shown in Volume II Tables 3 19 to 3 - 22.
Flood Peak and Volume
For any flood estimation problem, it is necessary to specify the return period or the probability of flood
being considered. In practice, it is often useful to construct a curve relating the size of the flood to its
probability of occurrence. Such curve is called a flood frequency curve.
A point-flood frequency analysis was performed for gaged rivers near the application sites. The historical
annual flood peak series were used in the analysis. On the other hand a Regional Flood Frequency
analysis was used to come-up with a flood frequency curve for ungaged rivers. The historical peak flow
data was fitted to a known probability distribution function using Gumbel's Extremal Distribution. The
annual peak flow series of rivers within the Project area shown in Table 3 - 23 of Volume II were
subjected to flood frequency analysis to determine the magnitude of flood at various recurrence interval.
The results of the analyses are summarized in Table 3 24 of Volume II and are graphically shown in
Annex 5.
A Regional Flood Frequency analysis was used to determine the flood magnitude at various return periods
of ungaged rivers, namely, the Sacobia-Bamban and Abacan rivers. The method involves the following
procedure:
· Estimation of Mean Annual Flood (MAF)
· Estimation of flood values with corresponding return periods
The MAF is determined by pooling all the annual flood series of gaged rivers within the Water Resources
Region No. 3 (Central Luzon) taking into consideration the homogeneity of the data observed, climate
type, response to the climatologic and hydrologic inputs and size of the drainage areas. The results are
given in Table 3-25 of Volume II and are also graphically shown in Annex 5.
3-10
Environmental Baseline Condition
Water Balance Analysis
The application sites fall under the Type I modified Coronas climate type classification. This climate type
has two (2) pronounced seasons; dry from November to April and wet from May to October.
The annual rainfall at the application site is about 2,034.25 millimeters. This was obtained using the mean
value of the four (4) rainfall stations in the province of Pampanga. The mean monthly rainfall estimated at
the application sites is given in Table 3-26 of Volume II.
The monthly and annual evapotranspiration data at Pampanga Agricultural College Agro-Met Station will
be used in the water balance analysis since there is no significant variation on the location and topography
and considering also its proximity from the sites to the Agro-met stations. The value of evapotranspiration
is 1,709.00. The monthly evatranspiration data of the project site is presented in Table 3-27 of Volume II.
The mean monthly flow of rivers near the application sites were converted into runoff depth in millimeters
to be consistent with the units of rainfall, evapotranspiration and infiltration rate and is shown in Table 3-
28 of Volume II. The enclosed value was subjected by the baseflow assumed to be 37.30 mm, will
increase during rainy, and will gradually decrease at the on set at dry season.
In the absence at actual data on infiltration rate it is assumed that between 5-15% at the rainfall will
infiltrate the lahar soils considering that it has a porosity at 35% and the materials are unconsolidated and
has a nearly level topography. The infiltration rate will however vary depending on the climatic and
meteorologic condition especially during wet season. Based on this assumption the monthly infiltration
rate is shown in Table 3 29 of Volume II.
The general equation of water balance will take the form:
I O = 4S
where:
I
input (rainfall)
O
output (runoff, evatranspiration, infiltration)
4S change
in
storage
The results of the water balance analysis would indicate that in most of the months of the year, there is a
deficit of water supply especially during the dry months. This would also show that during dry months
infiltration rate decreases while evapotranspiration increases. This could be attributed to the rate of
moisture content depletion from the river basins where the application sites are located under specified
meteorological conditions, which is roughly proportional to the amount in storage. In other words, the
moisture will decrease logarithmically with time during periods of no precipitation.
The implication of the results at the water balance calculation on the sludge/septage as a soil conditioner
on surface water and groundwater could be approximated vaguely with greater uncertainty. During dry
season infiltration may play an important factor but with less rainfall and increase evapotranspiration,
there may be an insignificant effect. During the wet season, infiltrated water may percolate further to the
groundwater aquifers but this can be filtrated by the pores of the unconsolidated lahar materials before
reaching the groundwater reservoir. The result of the monthly water balance calculation is shown in Table
3-30.
The water balance represents the crude approximation of the hydrologic regime of the disposal sites. The
difference between input (rainfall) and output (runoff, evatranspiration, infiltration, etc.) may be attributed
to the different length of observations of hydrometeorologic parameters and assumption of infiltration rate
of the application area.
3-11
Environmental Baseline Condition
It is therefore recommended that in order to improve the reliability/ accuracy of estimate a lysimeter or
ring infiltrometers and raingage will be installed in the area. The observation period of these instruments
should be at least 15 years in order to arrive at a realistic conclusion.
Applicability of Historical Streamflow Path to the Current Situation
As mentioned earlier, gaging station network established within Pampanga and Tarlac provinces were
either abandoned or relocated in different locations within two (2) provinces. It is also mentioned that the
reason is probably due to the instability of the gaging station, frequent washed out of the staff gage which
would result to unreliable rating curve (stage-discharge relationship).
A single measurement river discharge is at limited use to the hydrologist or to the hydrological
community; continuous monitoring of the river flow is essential for assessing water availability and as a
basis of water management studies.
As per information from the Hydrology Section, Research and Development Division, BRS, most of
gaging stations in lahar area have questionable data, more data points are scattered which will not give an
exact representation of the real stage-discharge relationship. The stage-discharge (rating curve) will be the
basis for obtaining daily, monthly and year flow at a river. Although there are data currently at the BRS
but are deferred for processing/ evaluation due to the above reasons. Although there are actual streamflow
measurements conducted in Porac and Sacobia-Bamban Rivers but as previously mentioned these will not
suffice in the establishment of rating curve, which would be the basis for determining daily streamflow
data. The other major factor for deferment of the data is the occasional-depositional characteristic of river
which would change its course causing a systematic observational errors. As a result in the absence of
updated reliable data historical streamflow records (since the start of monitoring) will have to be utilized
for this particular project, to show the over-all picture at the hydrological behavior of the existing river
systems. It is assumed that future flows (after abandonment) will be statistically similar to the part using
stochastic method.
3.2.8 Water and Sediment Quality Surveys
The water and sediment quality surveys were undertaken to assess the present physico-chemical
conditions of the aquatic (freshwater) systems and other water bodies in the Project areas in Pampanga and
Tarlac, which the septic/sewage sludge disposal for productivity improvement of lahar for sugarcane
growing is being proposed.
The baseline surveys focused on the basic physico-chemical, nutrient load and bacteriological conditions
of the water, and on the chemical contaminants such as heavy metals, pesticides and polychlorinated
biphenyls in water and sediment.
The study is just a snapshot survey conducted during the dry season on 23-24 March 2004. Thus, the
results only show a snapshot characterization of the study area during the time of sampling and do not
represent the comprehensive picture of the physical and chemical characteristics of the aquatic systems
surveyed. Also, during the survey almost all the major river systems within the study area were totally dry
although in some rivers (e.g. in Gumain River at Barangay Carmencita) a very low water was confined
within small river channels. Therefore, the choice of the sampling stations during this dry season were
dictated by the presence of available water that can be sampled in the river systems and other water bodies
which are located adjacent to the test sites.
3-12
Environmental Baseline Condition
Physico-Chemical and Water Quality Parameters
Water Quality
Four stations were sampled for water and sediment in freshwater bodies within the project area in the
vicinity of Brgys. Carmencita (Floridablanca, Pampanga), Panipuan (San Fernando, Pampanga), Mitla
(Porac, Pampanga) and Telabanca (Concepcion, Tarlac). The locations, approximate distance to test site,
coordinates, and parameters including date/time collected for each sampling station are indicated in Table
331 of Volume II. Figure 3-14 shows the location of water quality sampling stations. Photographs of
the sampling stations are attached in Annex 6.
The basic physico-chemical and water quality parameters observed in all the stations sampled during the
survey is shown in Table 3-32 of Volume II. Supplemental sampling and analyses have to be conducted
to establish a baseline for nitrate levels in groundwater. Nitrate is usually introduced into groundwater
through widespread or diffuse sources which include leaching of chemical fertilizer, leaching of animal
manure and groundwater pollution from septic and sewage discharges.
Nitrate is the most common form of nitrogen found in water. In water, nitrate has no taste or scent and can
only be detected through a chemical test. The acceptable limit for nitrate in potable water according to the
Philippine National Standards for Drinking Water is 50 mg/l and 3 mg/l for nitrogen as NO -
-
3 and NO2 ,
respectively. The nitrate level in most ambient groundwater in the Philippines is, generally much less than
1 mg/L. Therefore, the presence of nitrate in groundwater greater than 3 mg/L usually reflects the impact
of human activities on groundwater quality.
Temperature
The water temperature ranged from 30oC at Station L4 (Pond) to 34oC at Station L2 (Panipuan Creek).
These temperature values recorded for this survey are attributed to the effects of the onset of the dry
summer season and also to the time of sampling.
Dissolved Oxygen
The dissolved oxygen (DO) varied widely among stations sampled, which ranged from 4.3 to 12.0 mg/L.
The lowest DO was recorded at Station L2 (Panipuan Creek), which was slightly below the standard level
of 5 mg/L for Class C waters (the best usage of which is for fishery water for the propagation and growth
of fish and other aquatic resources), but above the standard level of 3 mg/L for Class D waters (the best
usage of which is for agriculture, irrigation, livestock watering, etc.). This low concentration obtained at
this station was probably due to lowering of oxygen solubility with increased temperature. The highest DO
concentration was observed at Station L3 (Fishpond), followed by Station L1 (Gumain River, 6.8 mg/L)
and Station L4 (Pond, 6.2 mg/L). The relatively high DO concentration at Station L3 (Fishpond) was
probably due to high primary (phytoplankton) productivity.
Hydrogen-ion Concentration or pH
The stations sampled had higher pH values obtained ranging from 7.47 to 8.39, well within the normal
limits for marine/estuarine and river waters. The values obtained were also well within the DENR water
quality standard for pH in Class C and Class D types of water bodies which is 6.5 to 8.5 and 6.9 to 9.0,
respectively.
Phosphate and Total Phosphorus
3-13
Environmental Baseline Condition
The highest phosphate concentration was obtained at Station L2 (Panipuan Creek, 47 mg/L). All the rest
of the sampling stations had relatively low phosphate levels that ranged from 4.1 mg/L at Station L1
(Gumain River) to 6.4 mg/L at Station L4 (Pond).
Total phosphorus on the other hand ranged from 2,160 to 3,260 mg/L and was also highest at Station L2
(Panipuan Creek). Discharge of raw untreated wastewater that contains detergents, human wastes, and
animal wastes could be the possible sources of these high nutrient levels at Station L2 (Panipuan Creek).
Lower values were obtained at Station L1 (Gumain River; 2,490 mg/L) and Station L4 (Pond; 2,160
mg/L). The unconsumed feeds and fecal matter of fish stock inside the fishpond at Station L3 contribute to
relatively high nutrient loading and enrichment of the fishpond.
3-14
Environmental Baseline Condition
Oil & Grease
The highest oil & grease level was obtained at Station L1 (Gumain River, 3.3 mg/L), followed by Station
L2 (Panipuan Creek, 2.6 mg/L). These levels were generally above the minimum limit of 2mg/L criterion
of DENR for Class C waters. Only Station L4 (Pond, < 2.0 mg/L) conformed to this standard.
Total and Fecal Coliforms (Surface and Groundwater)
Higher total coliform counts was obtained at Station L2 (Panipuan Creek, 1.6 x 10⁶ MPN/100 mL), which
were well above the standard level of 5,000 MPN/100 mL for Class C waters. The lower counts were
recorded at Station L1 (Gumain River; 2,000 MPN/100 mL) and Station L4 (Pond; 1,300 MPN/100 mL).
Fecal coliform (Escherichia coli) counts that are mostly associated with human and animals wastes, on the
other hand, was also higher at Station L2 (Panipuan Creek, 1.6 x 10⁶ MPN/100 mL). The lower counts
were also obtained at Station L1 (Gumain River; 2,000 MPN/100 mL) and Station L4 (Pond, 400
MPN/100 mL). There was no standard value set for fecal coliform for Class C or Class D waters.
The high total/fecal coliform level obtained at Station L2 (Panipuan Creek) was found close to human
settlement. The high bacterial load may be attributed mainly to domestic organic wastes generated from
households that discharge directly to the water body or to the drainage systems. These discharges also
include sewage, piggery, poultry and other animal wastes.
Information on total and fecal coliform concentrations for groundwater in monitoring wells at Pampanga
and Tarlac (see Figure ES-1) are available from studies conducted by MWCI and Intertek Testing
Services Philippines, Inc. for the project. Results of the laboratory analyses are summarized in Table 3-33.
The studies show that the highest concentrations of total and fecal coliforms (23 x 105 and 30 x 104
MPN/100mL, respectively) for groundwater were found in Mitla (Porac). High values were also found in
Carmencita and Larec (Floridablanca) and Concepcion (Tarlac). These suggest local sources of these
contaminants.
Chemical Contaminants
Heavy Metals (Sediment, Surface and Groundwater)
Arsenic (As), cadmium (Cd), chromium (Cr), lead (Pb) and mercury (Hg) were analyzed in all sampling
stations. Results are summarized in Table 3-34 of Volume II for water and sediment samples analyzed.
Of the 5 metals analyzed, only Cd was detected in all of the water samples, but generally low, which
ranged from 0.01 to 0.009 mg/L. The highest concentrations obtained were found at Station L2 (Panipuan
Creek) and Station L4 (Pond), while the lowest concentrations was found at Station L1 (Gumain River).
DENR Class C and Class D bodies of water are required to maintain Cd concentration up to or below 0.01
and 0.05 mg/L, respectively.
The concentrations of As, Cd, Cr, Pb and Hg in the sediment samples were not detected in all stations
sampled, except in a particular area at Station L2 (Panipuan Creek) where relatively high concentrations of
Cr (14.0 mg/Kg) and Pb (3.7 mg/Kg) were detected in the samples. The detection limits for the laboratory
method used were 0.04 mg/Kg for Cr and 0.06 mg/Kg for Pb. The Cr and Pb concentrations in riverine
sediments at Station L2 (Panipuan Creek) suggest an influence of human activity on the present levels of
these metals in the area.
Information on metal concentrations (As, Cd, Cr, Pb, Ni and Hg) for groundwater samples of monitoring
wells from Pampanga and Tarlac are available from studies conducted by MWCI and Intertek Testing
3-15
Environmental Baseline Condition
Services Philippines, Inc. for the project (see Figure ES-1). Results of the laboratory analyses are
summarized in Table 3 35 of Volume II.
Among the 6 heavy metals analyzed, only Cd and Pb were detected in the deepwell water samples taken
from 9 sampling sites. Concentrations of Cd ranged from not detectable to 0.044 mg/L, with the higher
concentrations measured in samples from Larec (Floridablanca), Porac (Pampanga-1) and Concepcion
(Tarlac). The detected values of Cd were all above the 0.003 mg/L limit of PNSDW for drinking water. Pb
concentrations, on the other hand, ranged from not detectable to 0.776 mg/L. Higher values were generally
found in samples from Carmencita (Floridablanca), Larec (Floridablanca-RDW) and Mancatian (Mitla,
Porac). The detected values of Pb were all above the 0.01 mg/L limit of PNSDW for drinking water.
Surprisingly, results of the analysis also show that all the metal parameters analyzed were found generally
not detectable in samples from Concepcion-2 (Tarlac), suggesting that the groundwater at this particular
area is at present not contaminated with metals.
Polychlorinated Biphenyls (Water, Sediment)
Water and sediment samples from Station L2 (Panipuan Creek) were not detected for Polychlorinated
biphenyls (PCBs) (i.e., below the detection limits).
Organochlorine Pesticides (Water, Sediment)
OCPs were not detected in all of the water and sediment samples analyzed (i.e., below the detection
limits).
Organophosphorus Pesticides (Water, Sediment)
Similarly, OPPs were not detected both in water and sediment in all stations sampled (i.e., below the
detection limits).
Laboratory results for PCBs, organochlorine pesticides and organophosphorus pesticides are shown in
Annex7.
3.3 BIOLOGICAL ENVIRONMENT
3.3.1 Aquatic Ecology Survey
The Aquatic Ecology Survey was undertaken to assess the present biological condition of the aquatic
systems and other freshwater bodies in the "lahar"-laden areas of Pampanga and Tarlac, which the
septic/sewage sludge disposal for productivity improvement of "lahar" for sugar cane growing is being
proposed. This report aims to provide the following outputs:
· Species composition and abundance of plankton and soft-bottom benthos;
· Information on the freshwater fishes and other aquatic life; and
· Local fisheries and other uses of the aquatic systems.
The survey, conducted during the dry season on 23-24 March 2004, represents a snapshot of the biological
conditions and the fishery resources present in the areas surveyed at the time of sampling. Thus, the results
of the study cannot evaluate the effects of seasonality on the composition nor its abundance. The sampling
is likewise limited to the available flooded aquatic systems during the summer season since almost all the
nearby major river systems were totally dry during the survey.
3-16
Environmental Baseline Condition
Plankton
Phytoplankton
The species composition of the phytoplankton represented in the samples, its density and relative
abundance per sampling station are shown in (Table 3-36 of Volume II). Since only one sampling
episode was conducted, there is no temporal data to address seasonality in the variations of phytoplankton
composition and population density at these stations.
The actual number of taxa comprising the phytoplankton considerably varies with the sampling station.
The highest number of taxa was found at Station L2 (Panipuan Creek, 7 taxa) and Station L3 (Fishpond, 7
taxa), followed by Station L1 (Gumain River, 5 taxa) and Station L4 (Pond, only 4 taxa).
The characteristic phytoplankton at Station L2 (Panipuan Creek) are blue-green algae Polycystis and
Nostoc and diatom Gyrosigma, with a number of other phytoplankton forms present. Polycystis and the
green algae Scenedesmus, Selenastrum, Ankistrodesmus and Padiastrum are among the most abundant
phytoplankton at Station L3 (Fishpond), with diatoms absent. Among the blue-green algae, Polycystis
appear to be the most dominant at Station L1 (Gumain River), with a number of diatoms Gyrosigma and
Nitzschia present while green algae absent. Station L1 (Gumain River), showed the same dominant forms.
Polycystis was the chief blue-green algae, other forms Anabaena and Nostoc and the green alga
Pediastrum were present but not abundant.
The blue-green algae (Cyanophyceae) were the most dominant phytoplankton in all stations representing
between 74 and 99% (or an average of 85%) of the total plankton population, represented by the genera
Polycystis, Anabaena and Nostoc. They were all found present in all stations. Polycystis was the most
numerous representing between 58 and 98% of the total plankton population. The highest density of
Polycystis was observed at Station L3 (Fishpond) with 9,300,000 cells/L, followed by Station L2
(Panipuan Creek) with 2,750,000 cells/L and Station L4 (Pond) with 2,100,000 cells/L. The lowest density
was noted at Station L1 (Gumain River) with only 350,000 cells/L.
The most abundant phytoplankton counts were observed at Station L3 (Fishpond) with 12,694,900 cells/L,
followed by Station L2 (Panipuan Creek) with 3,140,000 cells/L and Station L4 (Pond) with 2,140,000
cells/L. The very high phytoplankton populations at Station L3 (Fishpond) may be attributed to the high
organic load and enrichment of the fishpond.
The relatively high phytoplankton productivity at Station L2 (Panipuan Creek) and Station L4 (Pond) may
be due the standing water conditions, slow water flow and, in some instances, due to low water level.
Studies have shown that phytoplankton population is at maximum during low waters while phytoplankton
population is poor during floods (Egborge, 1974; Itis, 1982).
Conversely, the relatively low phytoplankton population observed at Station L1 (Gumain River) with only
600,000 cells/L may be due to higher flow rates observed at the time of sampling which prohibits the
development of new plankton and rapidly suppressed any existing organisms discharged from the
associated standing waters. The literatures on the plankton as reviewed by Welcomme (1983, 1985)
confirm that phytoplankton is more in the still (lentic) waters of the river system than in running (lotic)
waters.
Zooplankton
The overall plankton organisms were dominated by phytoplankton (99%). The zooplankton contributes
only 1% of the total plankton collection (Volume II Table 3-36). Only two major taxonomic groups
represented the zooplankton population. The most common were the ciliate Paramecium but never
abundant (10,000- 20,000 cells/L). They were taken in all stations except at Station L3 (Fishpond) where
3-17
Environmental Baseline Condition
they were found absent in the plankton samples. The copepod Nauplii ranked next but were found present
only at one particular sampling point, Station L3 (Fishpond) with 10,000 indv/L.
Soft-Bottom Benthos
There were only 5 taxa of soft-bottom fauna identified from the samples collected at all stations (Table 3
37 of Volume II). The various animal groups were distributed in varying number of taxa- 1 taxon of
oligochaetes, 1 taxon of mollusks and 3 taxa of insects.
The insects were the most abundant organisms collected comprising about 77 to 100% (average of 99%)
of the total collection. The chironomids (non-biting midges/flies) of the order Diptera, represented by
Chironomus larvae, were the most numerous insects observed at all stations comprising 67 to 95%
followed by Chironomus nymphs (0- 5%). The chironomids are extremely diverse in habitat and may be
found on almost any substratum in freshwater (as cited by Bryce and Hobart, 1971 see Guide to
freshwater Invertebrate Animals). Station L2 (Panipuan Creek) was noted to have the densest benthic
fauna due to the very high abundance of chironomid larvae (23,844 indv/m2) and nymphs (1,289 indv/m2).
Also, they were the only benthic animals found in the samples collected at this station.
Another group of insects found during the survey also belonging to the order Diptera were the
ceratopogonid larvae (Ceratopogonidae biting midges/flies), which were found only at Station L1
(Gumain River) and totally absent in all other stations.
At Station L4 (Pond), the next most numerous benthic organism (after Chironomus larvae) observed in the
samples was the unidentified small gastropod mollusk (snail) belonging to the family Thiaridae that
comprised about 18% of the total collection at this station. It was found totally absent in all other stations
sampled. The occurrence of the snails is probably due to the sheltered area at this station characterized by
"lahar" sediment and presence of aquatic plant life kangkong.
The oligochaetes, which feed principally on pieces of leaves and other vegetation, particles of matter, and
soil (Engemann and Hegner, 1981) were mostly found at Station L3 (Fishpond) and Station L4 (Pond).
The occurrence of oligochaetes is probably due to the general nature of the water bodies fringed with
plants along its bank and characterized by a permanent standing waters or sheltered areas. Some
oligochaetes are important in the diet of fishes and predatory invertebrates (Storer and Usinger, 1957).
Fisheries, Types of Aquatic Life and Other Uses
The survey revealed that Station L1 (Gumain River) support traditional riverine fishery. However, the
fishery is dependent upon seasonal rainfall. Throughout the flood, fishing is very minimal or none at all.
Low water is said to be the most productive for this river fishery. The fishery at the sampling site utilizes
the use of locally made spear guns (pana), cast nets (dala), hook-and-lines (kawil) and electro-fishing
(koryente). Fisherfolks in this river using electro-fishing method have indicated that usually the fish catch
is predominated by tilapia. Such fishery, therefore, is only produced essentially for family consumption
and that the inhabitants concerned have very little dependence on the riverine fishery. The quarrying of
"lahar"sand for the building material/industry was also observed in the river. The river was almost dry at
the time of the survey.
There was no reported fishing activity at Station L2 (Panipuan Creek). However, numerous small fish was
observed during the sampling, presumably gambusia or mosquito fish.
The culture of tilapia in fertilized freshwater pond at Station L3 is already a one-year old aquaculture
practice in the area. The area where the fishpond is located was never affected by the "lahar", only ash
fall. Water source in the fishpond is from groundwater by use of water pumps. The source of tilapia
fingerlings is mainly from Arayat, Pampanga. The stocking density is about 45,000 fingerlings. Harvesting
is usually done every 4 months. Periodic fish kills were reported to occur in the fishpond. These fish kills
3-18
Environmental Baseline Condition
usually occur during warmer periods. High organic load which results in low dissolved oxygen, ammonia
toxicity, presence of toxic metabolites and thermal changes which may cause "thermal shock" to fish are
some of the probable causes of the fish kills. Periodic fish diseases were also reported to occur in the
fishpond. Resident owner-fishpond operators describe the disease as "pumuputi ang mga palikpik." The
disease usually occurs during the rainy season.
Interviews conducted with one of the local residents revealed that Station L4 (Pond) support some
occasional fishing activities. Such fishery can be best described as almost always subsistence and rarely
produced a surplus for sale on the market and the individuals concerned have very little dependence on the
fishery (Welcomme, 1983). Accordingly, some of the important fishes caught in the lagoon are tilapia,
goby, snakehead and gourami. Numerous juvenile fishes were observed in the shallower areas of the pond.
A lot of small snails (with its shells coated with green algae) on the sandy substrate were also noted in the
area during the survey. The only aquatic plant life observed was kangkong. Quarrying of "lahar" sand was
also observed at the adjacent Bamban River, which was totally dry at the time of the survey.
3.3.2 Terrestrial Ecology
Flora
The project area is not situated in an ecologically critical area like national parks in Capas, Tarlac (Capas
Death March Monument) and Arayat & Magalang, Pampanga (Mt. Arayat).
No quadrats sampling was done in the sampling sites for reason that most of the open cultivated areas are
presently planted to sugarcane at the time of the field investigation. Also tilling is regularly undertaken,
which resulted in the eradication of associated weeds. Observations conducted in the project sites showed
uniform occurrence of plant species.
Based on ocular inspection, sugarcane is the dominant species. The weeds species encountered in the
sugarcane plantation are mostly Talahib or Saccharum spontaneum, Imperata cylindrical, Themeda sp.,
Paspalum conjugatum, Carabao grass (Axonopus compressus), Ageratum conyzoides, Eleusine indica, and
Datura metel. Other species which occurred in isolation along the perimeter boundaries of the cultivated
areas are ipil-ipil trees (Leucaena leucocephala) and coconut (Cocos nucifera).
Floral species surveyed inside the sugarcane plantation can also be used as wood materials, food and
medicine ingredients and ecological balance. Majority of the observed species are very common and
widely distributed in the country. The species take the habit form of trees, shrubs, herbs, and grasses. No
rare, endangered and threatened species of flora were observed or recorded in these lahar areas. The
endemicity, distribution, ecological status and roles/uses of plants/species surveyed are shown in Table 3-
38 of Volume II.
Fauna
During the site investigation, a frog (Bufus marinus) has been observed. Few small rodents, probably
household pests were also seen crossing the fields. Red ants especially Aphis maydis were observed
colonizing a few broad leaf species found among the open grassy area. Table 3 - 39 of Volume II exhibits
the faunal species observed and reported from the site visit.
No critical species of fauna were found inside the sugarcane plantation that will be impacted by the
proposed project. All are ecologically important but common and widely distributed in the country.
3-19
Environmental Baseline Condition
3.4 SOCIO-ECONOMIC ENVIRONMENT
3.4.1 Socio-Economic Setting
Demography
The demographic data on the project site are in Table 3 40 of Volume II. Covered are five
municipalities and cities in Pampanga and one in Tarlac. The Project site includes the municipalities of
Floridablanca, Mexico and Porac and the cities of Angeles and San Fernando in Pampanga, and the
municipality of Concepcion, Tarlac. The LGU constituting the project site have a total of 701,484 persons
in 1990 and 876,54148,235 persons in 2000. Within the ten-year period, their population increased by
2.2% per year. Their population growth is only slightly lower than the national population growth of 2.3
percent. The growth rate widely varies among the LGU. Mexico is the fastest growing with 4.7% per year
during the period. San Fernando follows at 3.5 percent. The lowest growth rate is in Angeles City with
only 1.1% per year.
The 12 barangays where the project will be located have much lower combined growth rate than their
cities and municipalities. Their aggregate population of 19,811 in 1990 grew to only 21,754 in 2000. The
average growth rate during the period is 0.9 % per year. The variation of the growth rate among the
barangays is also wider. While nine barangays have positive growth, three have negative growth. The
highest growth rate registers in Molino, San Fernando with 8.3% per year. The lowest growth rate is in
Telebanca, Concepcion where the population size shrinks by 35.5% per year. The extreme increase and
decrease of population in these barangays stem from eruption of Mt. Pinatubo in 1992. The overflow of
lahar into some barangays prompts people to move to other barangays considered safe. The result is the
drastic reduction of population in some and expansion in others.
The cities/municipalities, where the application sites are located, have a combined land area of 972.1
square kilometers. The largest in land area is Porac with 343.1 square kilometers and the smallest is San
Fernando with only 81.2 square kilometers. The average density in the project site is 901 persons per
square kilometer. Such density is about four times the national density of 225 persons per square
kilometer. But their density varies. The densest is Angeles City with 4,378 persons per square kilometer.
The sparsest is Porac with 235 persons per square kilometer or four times less than the average for the
whole project site.
The average household in the project site has 5.1 members. This is the same as the national average. The
households are biggest in Concepcion, Tarlac with an average of 5.5 members. It is smallest is Angeles
city with only 4.7 members. For each household size in the project site indicates the presence of three or
four children. The number of children speaks of high fertility although it is comparable to the national
average (Table 3-40 of Volume II).
The population in the project site is almost equally divided between male and female. There are 96
females for every 100 males. Its gender distribution can still be considered balanced. The variation among
the population is slight although there are more males than females in all except in Angeles City. The
city's population is equally divided between male and female. The males are most dominant in
Concepcion where they compose 52% of the population. Population movement has not drastically altered
the gender ratio. The main reason for the ratio maintenance is the fact that many migrants move around
with their household.
The young or persons whose age is below 15 years compose 36% of the population in the project site.
Together with the aged or persons over 65 years old, the young are considered dependent on the
economically active persons or persons from 15 to 65 years of age. The economically active adults
compose 61% of the population in the project site. Such age distribution results to a dependency ratio of
64 dependents per 100 economically active adults. It means that almost every two economically working
3-20
Environmental Baseline Condition
adult has one dependent to support. This ratio means a relatively light dependency burden. The
dependency ratio is highest in Concepcion, Tarlac where every 100 economically active adults has 69
dependents. It is lowest in Angeles, San Fernando and Porac where there are only 61 dependents per 100
economically active adults.
Lower revenues limit the government's capacity to expend on social services. The constraint on social
services such as education restricts the development of better quality manpower. The quality of the
manpower is seen on the educational attainment of the population. Among persons aged six years old and
over in the project site, the education of 44% is at elementary level. Some 30% are in the high school
level. Only 6% are in the college level. Persons with college degree constitute 8 percent. Among the LGU,
the population of San Fernando is the most educated. Around 12% of its population have a college degree.
Only 4% have no education. In contrast, only 6% are degree holder in Floridablanca while 6% have no
education.
Water Supply
A Water District serves the three municipalities. It covers eight barangays in Floridablanca and
Concepcion respectively. There are 2,401 connections in Floridablanca and 2,418 in Concepcion. The
Water District in San Fernando covers the municipal center and nearby barangays. The barangays that is
not served by the Water District largely relies on deep and swallow wells.
Waste Management
The three municipalities have no sewer. Wastewater is disposed to ground depository or directed to open
drainage. Garbage is collected only within the urban core. It is disposed to an open dumpsite in
Floridablanca and Concepcion. San Fernando has a modified landfill.
Transportation
Only Floridablanca and Concepcion have information on roads. The two municipalities have an average of
237 kilometers of roads. Floridablanca has more roads (261 kilometers) than San Fernando (213
kilometers). Most of these roads are barangay roads. The average length of barangay roads in the two
LGU is 177 kilometers. The average for municipal road is only 11 kilometers and 13 kilometers for
provincial roads. The two municipalities have an average of 37 kilometers of national roads. The national
roads connect both municipalities to Metro Manila. A number of buses traverse the national road daily to
and from various points. The jeepneys are also used to travel within and between municipalities.
Agricultural Setting
From 1999 to 2003, Central Luzon has been steadily producing sugarcane at an average of 1,449,510 M.T.
per year. Similarly, Tarlac and Pampanga continued to produce sugarcane annually at an average of
983,639 M.T. and 465,162 M.T., respectively. Tarlac covered larger areas for production of sugarcane at
an average of 17,735 ha. as compared to Pampanga with 9,269 ha. in the last 5 years. The volume of
production and area covered by sugarcane from 199-2003 is given in Table 3-41 of Volume II.
An average of 48% of the total land area of three municipalities are devoted to crop production.
Concepcion has the largest area and percentage of its total area allocated to crop production. Its total crop
area is 14,262 hectares constituting 58% of the total area. Floridablanca and San Fernando have only 38%
and 48% of their area devoted to crop production, respectively. Sugarcane and rice are considered the
main crop. In San Fernando, sugarcane is planted to 63% of the crop area. The crop is planted to only 22%
of the crop area in Concepcion and 3% in Floridablanca. The size and percentage of agricultural areas in
Floridablanca, San Fernando and Concepcion is given in Table 3 42 of Volume II.
3-21
Environmental Baseline Condition
3.4.2 Household Survey
The results of the household survey are tabulated and presented as Annex 8.
Characteristics of the Respondents
There are more female than male respondents. The female respondents comprise 54 percent. The female
respondents prevail in all LGU except in Floridablanca where they comprise only 32 percent. They
compose 56% in Angeles City, 51% in Mexico and 63% in San Fernando.
About half of the respondents are in the 30-49 age bracket. The respondents within this age bracket
comprise 51 percent. This pattern prevails in all municipalities except in Floridablanca. The respondents
within said age-bracket in the municipality compose only 40 percent. It has older respondents with 60% of
them aged 50 years and over. It has no respondent aged below 30 years old.
The respondents educated only at the elementary level constitute 40 percent. Those who have high school
education constitute 33 percent. The respondents who went to college comprise 13 percent. Among the
municipalities, San Fernando has the most college-level respondents. They comprise 20 percent.
Floridablanca has the least at 4 percent. High school-level respondents dominate Floridablanca
composing 48 percent. Only 36% among the respondents in San Fernando are have high school level
educational attainment. The respondents in Angeles City and Mexico are mostly at the elementary level
constituting 52% and 45%, respectively.
Household Size and Number of Children
The average household of the respondents has 5.5 members. This is higher than the national average
household size of 5.1 members. But household size widely varies among the communities. Mexico has the
largest households with 6.4 members on the average. Angeles City has the smallest with 4.3 members. The
average household has about 3.9 children. The households in Floridablanca have the most number with 4.6
children. Angeles City has the least with 2.4 children. The number of children in the four LGU is almost
equally divided between male and female. There average number of male children is 2.0 and 1.9 for
female children. The equal division indicates the absence or weak gender preference among parents in
bearing and rearing children.
Migration and Settlement History
The respondents in the four municipalities and cities who were born in their present barangay of residence
comprise 64 percent. The rest migrated into their present barangay of residence. About 11% are from
another barangay within the same municipality or city and 14% are from another municipality or city
within the province. This percentage indicate that intra-province movement is more intense that inter-
province movement. Only 6% are from another province in Central Luzon and the remaining 5% are from
other regions in the country. But it can be seen that movement is most intense in the more urbanized cities
of Angeles and San Fernando. All the respondents in Floridablanca are born and raised in their present
barangay of residence. Around 73% in Mexico are similarly situated.
An average respondent has lived in their present barangay of residence for 34 years. The respondents of
Floridablanca and Mexico stayed the longer in their present barangay of residence than those of the more
urbanized Angeles and San Fernando. The respondents in Floridablanca and Mexico have stayed in their
present barangay of residence for 49 and 38 years, respectively. In contrast, the respondents of Angeles
and San Fernando stayed in theirs for only 25 and 29 years, respectively.
But the respondents of Mexico and San Fernando tend to venture farther compared to the two other
municipalities. Around 32% of San Fernando respondents and 27% of Mexico respondents have lived
3-22
Environmental Baseline Condition
outside their present barangay of residence. Only 12% in Angeles and 1% in Floridablanca are doing the
same. On the average, 29% of the respondents have lived outside their present barangay of residence. But
only 2% of them have a plan to move out in the future. Angeles has the highest percentage of potential
migrants at 9 percent.
Among those who moved into their present barangay of residence, 62% are from places within the
province. This is consistent with the finding that intra-province movement is the prevailing pattern in the
project site. They constitute 50% in Angeles, 85% in Mexico and 55% in San Fernando. There are more
in-migrants from other regions other than Central Luzon than from Central Luzon. The in-migrants from
Central Luzon compose only 10% while those from outside the region comprise 30 percent.
Among the respondents who moved into their present barangay of residence, the main reason for their
transfer is the presence of their relatives or marriage to a local person. Around 52% of them cite this as a
reason. In Floridablanca and San Fernando, the main reason given for moving into the barangay is
economic. All the migrants in Floridablanca migrated for work while in San Fernando, 29% move in for
work and 41% for their properties. Although only 6% cite volcanic eruption as a reason, it must be noted
that evacuees tend to move to places where they have relatives.
Among the respondents with no plan of moving out, 32% cited their stable living patterns in the barangay
as the reason. Employment and peace and harmony are also cited as reasons by 24% and 22%,
respectively. The concern for employment is particularly high in Floridablanca being cited by 52% and in
Mexico being cited by 47 percent. The other reasons given are their relatives and marriage as well as the
better environmental quality of their present residence.
Household Income and Expenditure
Although most households in Floridablanca have secondary income source, its women earns the lowest
among the municipalities. The average monthly income of the wives in the municipality is 750.00 Pesos.
This is very low compared to the 5430.00 Pesos in Mexico and 5242.00 Pesos in San Fernando. The
average monthly income of wives in Angeles is 2143.00 Pesos. The average for the four municipalities is
4192.00 Pesos
The main source of income of the four municipalities is salaries and wages. Around 60% of them consider
this source as their main income source. The dependence on this source is particularly high in the more
urbanized Angeles and San Fernando where the households primarily earning from salaries and wages
constitute 68% and 72%, respectively. Similar households compose only 56% in Floridablanca and 52%
in Mexico. Other sources of income are farming (21%), business (15%), animal-raising (2) and
remittances (2%).
The husband is the primary earner in 58% of the households in the four municipalities. There are more
husbands serving as primary income earner in Angeles (69%) and San Fernando (66%) than in
Floridablanca (44%) and Mexico (56%). The wife is the primary earner in 25 households in San Fernando
as it is the son in 23% of the households in Floridablanca. On the average, 16% of the households in the
four municipalities have the wives as the primary earner and it is the son in 17 percent.
About 44% of the households in the four municipalities earn between 1,000.00 and 4,999 Pesos per
month. Those earning between 5,000.00 and 9,999.00 Pesos per month constitute 27 percent. About 19%
of the households earn less than P1000.00 per month. The households in the same income level in
Floridablanca constitute 41 percent. Only 23% in Angeles are in that income level. The households in
Mexico and San Fernando in the same level are 6% and 14%, respectively. Only 10% earn more than
10,000.00 in the four municipalities and cities.
3-23
Environmental Baseline Condition
Farming Operation
An average farming household in the four municipalities has 2.5 hectares of land. The average farm size in
Floridablanca is the smallest at 1.5 hectares. Angeles has 2.0 hectares while Mexico has 2.7 hectares. San
Fernando has the largest average at 2.8 hectares. The main crops are rice and sugarcane. Around 51% of
the sample households plant rice while 40% are into sugarcane. All the sample households in
Floridablanca are rice planters and half of Angeles and Mexico. Only 31% are rice planters in San
Fernando. The sugar planters constitute 38% in Angeles and 31% in San Fernando. Half of the farming
households in Mexico are sugar planters.
Rice is harvested twice a year in all municipalities while it is once a year for sugarcane. The average rice
yield is 66 cavans per hectare. Floridablanca has smaller average yield at 53 cavans per hectare. The three
other LGU have 70 cavans. Around 53% of the farming households are owner cultivators. Around 83% in
Floridablanca are owner cultivators and 62% in Angeles. Only 50% in Mexico and in 36% San Fernando
are owner cultivators. The tenants comprise 20% while the landlords constitute 15 percent among the
farming households. San Fernando has the biggest percentage of landlords at 28% while Mexico has the
biggest percentage of tenants at 26 percent.
The ownership of land in the project site is largely a male domain. Around 77 of the land titles are in the
name of the husband. In Floridablanca, all land titles are in the husband's name. Although only 57% of the
land titles in San Fernando are in the husband's name, 14% are in the name of a male relative. The land
titles in the name of the husband constitute 66% in Angeles and 79% in Mexico.
Housing and Utilities
Housing and utilities indicate the economic status of the households. For housing materials, galvanized
iron (GI) sheet is mainly used for roofing. Around 83% of the respondent's houses are roofed with this
material. The use of GI sheet is widespread in all LGU. The houses using this as a roof range from 75% in
Angeles to 85% in San Fernando. For walling and flooring, concrete is commonly used. It is the wall of
81% of the houses. It is most popular in Angeles and Floridablanca where it is used in 88% of the houses,
respectively. Concrete is the floor of 88% of the houses. All the houses in Angeles have concrete floors.
The material is least used in Mexico where only 84% of the houses have concrete floor. It is seen that most
houses in the project site are made of durable materials and the light materials are not widely used.
The average house in the project site has two rooms. A two-room house is typical in the four LGU. The
houses are relatively old with an average age of 20 years. The newest houses are in Angeles with an
average age of 18 years. The oldest houses are in Floridablanca with an average age of 24 years. Around
85% of the households in the project site own their houses. The ownership rate does not vary much among
the LGU. The lowest ownership rate is in Mexico at 80% and the highest is in Angeles at 100 percent. The
ownership rate of the lot where their houses stand is lower at 76 percent. In Angeles where lot ownership
is the highest, the rate is 86 percent. The lowest lot ownership rate is in Mexico at 70 percent. Most of the
non-lot owners use it for free. The renters constitute only 3 percent.
The title of the lot is usually put under the name of the husband. Around 73% of the households have this
arrangement. The arrangement is common in all the municipalities. For instance, 80% of the households in
Floridablanca have their lot under the husband's name. There are cases where the lot has both the name of
the husband and the wife but these constitute only 15 percent.
Electricity is also used in most houses with 93% having a connection. The percentage of electricity users
is lowest in Mexico where they only constitute 89 percent. The households surveyed pay an average of
599.00 pesos. The highest consumption of electricity is in San Fernando where the average amount paid is
881.00 pesos per month. The lowest consumption is in Floridablanca where the average amount paid is
235 pesos per month. Kerosene is used for lighting in households not connected to electricity.
3-24
Environmental Baseline Condition
Liquefied Petroleum Gas (LPG) is the main cooking fuel used. Some 74% of the households use it. The
users of LPG are particularly substantial in the urbanized area of Angeles and San Fernando where it is the
fuel of 78% and 83% of the households, respectively. Only 76% in Floridablanca and 66% in Mexico use
the same fuel. In the two municipalities, wood is still widely used for cooking.
The toilet ownership rate and quality of toilet in the project site is relatively high. Around 98% of the
households have a toilet and 95% are using flush or water sealed toilet. The users of flush or water sealed
toilet is highest in Angeles at 100%. Mexico has the lowest flush or water sealed toilet users at 90 percent.
Sources of Information
The respondents have an average of two sources of information in four types of information. The types are
town events, provincial events, commodity prices and livelihood. But the respondents in Mexico and San
Fernando have generally more information sources than in Angeles and Floridablanca. For instance, the
respondents in Angeles and Floridablanca have only one information source on average for commodity
prices but Mexico and San Fernando have two.
Among the information sources, the television dominates for all types of information. It is a source of
information of 35% for town events, 39% of provincial events, 84% for commodity prices and 31% for
livelihood. These percentages indicate the prevalence of television in the project site. The television is
particularly relied upon for commodity prices in all municipalities. The percentage of households who
obtains information from it on this type of information constitutes 88% in Floridablanca, 84% in Mexico
and 82% San Fernando. In Angeles, only 67% derive information from it on commodity prices. The radio
is still used as information source but at much less intensity. For instance, only 19% get information from
it for provincial and town events. The newspapers have some users particularly on livelihood information.
Around 25% get information from it. Personal sources such as relatives and public officials have limited
role to play as information sources. Even for town and provincial events, only 13% depend on the public
officials for information. Relatives are most useful to some for information on livelihood. But only 9%
rely of them on this type of information.
Participation in Decision-Making
The respondents' participation is seen at the household and barangay level. At the household level, their
participation is seen in three aspects: children's schooling, house repairs and appliance purchase. In the
aspects of children's schooling and appliance purchase, the husband and wife make the decision in most
cases. This arrangement works in 71% of the households for children's schooling and in 64% for
appliance purchase. The prevalence of this arrangement prevails in all municipalities.
In the case of house repairs, the husband and wife jointly make decision in only 46% of the households. In
44% of the households, it is a domain of the wife. It is only in 9% of the households where the husband
makes decision on house repairs. However, variation exists among the municipalities and cities. In
Angeles and San Fernando, the wife is the main decision maker on this aspect. This is the case in 69% of
the households in Angeles and 54% in San Fernando. In Floridablanca and Mexico, it is the husband and
wife that make the decision 68% and 50% of the households, respectively.
At the barangay level, the respondents' participation in decision-making is seen in two activities. The
activities are barangay election and meeting. In both activities, the respondents have relatively high
participation rate in the two activities. Around 90% of the respondents report participation of their
household members in barangay election. The percentage of participation in this activity varies. It is 100%
in Floridablanca and Mexico. But while it is 96% in Angeles, it is only 42% in San Fernando. In barangay
meeting, the participation rate is 69 percent. But it again varies among the municipalities. The highest
participation rate is in Floridablanca at 100 percent. The lowest is in San Fernando at 58 percent.
3-25
Environmental Baseline Condition
Perception of Environmental Change
The respondents note of the change in the environment in four aspects: trees, animals, water and air. Most
of them report change in all aspects: The highest percentage of respondents note change in air. They
comprise 87 percent. Those who said that there are changes among the animals constitute 82 percent.
Around 80% and 79% note of change in trees and water, respectively. All the respondents in Floridablanca
notice change in all aspects. In Angeles, only 43% said the trees have changed and 67% observe change in
animals. But 89% agreed that there are changes in the water and 80% said the same of the air.
But most of the changes noted are negative. In the four aspects, less than half of the respondents said that
it is positive. The respondents noting positive changes comprise only 45% for trees, 38% for animals and
water and 40% for air. The percentages vary by municipalities and cities. For instance, only 4% in
Floridablanca said that water has changed for the better but 88% in Angeles say the same. In Mexico, only
25% of the respondents say that the animals are better now but 67% in Angeles say the same.
Among the respondents who note a change, pollution is the main reason given. It is mentioned by 36% of
the respondents. Around 57% observe it in San Fernando but none in Floridablanca. The event that
changes all the aspects of the environment as noted in Floridablanca is the eruption of Mt. Pinatubo. The
expansion of population and settlements is pointed out by 26 percent. This is observed in all municipalities
except in Floridablanca. Other reasons cited are poverty and various forms of environmental destruction.
Around 84% of the respondents recommend solutions to arrest the degradation of the environment. Their
main recommendation is environmental protection as mentioned by 54 percent. A high percentage has this
recommendation in Angeles (66%), Floridablanca (76%) and Mexico (65%). The various activities
mentioned under this recommendation include planting trees and keeping the environment clean. Around
19% see the need for proper waste disposal. This recommendation is high in San Fernando being
mentioned by 36 percent. The respondents have been complaining of the animal waste from pig and
chicken farms. The values of unity, cooperation and diligence are also seen as important by 13 percent.
The other recommendations made are road improvement and government assistance.
Community Situation
The top-ranking problem in the four municipalities and cities is unemployment. As the most important
problem, it is mentioned by 36 percent. All respondents in Floridablanca mention it. However, only 46%
in Angeles and 35% in Mexico mention the same. The percentage is much lover in San Fernando at 18
percent.
The second most frequently mentioned problem is waste disposal with 25% of the respondents. But this
problem is more felt in Mexico and San Fernando being mentioned by 39% and 28%, respectively. None
note this as a problem in Angeles and Floridablanca. Disunity is the third most mentioned problem.
Although 12% cite this, it is most frequently mentioned in San Fernando where 39% note of it. Very few
or none mention it in the other municipalities. Other problems mentioned are poor roads, poverty, limited
barangay fund, absent water supply and poor health services.
The recommendations given are aimed to solve the main community problems. For unemployment, 37%
say that employment and livelihood opportunities must be provided. Around 70% in Floridablanca bat for
this recommendation. While 56% in Angeles and 44% in Mexico say the same, only 23% in San Fernando
agree. Their greater concern is the basic values of diligence and unity. Around 35% of the respondents in
San Fernando mention it. But while 26% in Floridablanca make the same recommendation only 12% in
Mexico and none in Angeles say the same. Proper waste management is also recommended in San
Fernando being mentioned by 16% but none consider it in Angeles and Floridablanca. Some 9% have
waste management in mind in Mexico. Other recommendations are to put up a water system, obtain
government assistance and stop corruption.
3-26
Environmental Baseline Condition
Awareness and Perception of the Project
The awareness level on the project is very low. Only 5% of the respondents say that they are aware of it.
The highest awareness level is in Angeles at 12 percent. Only 4% are aware in Mexico, 5% in San
Fernando and none in Floridablanca. Among those who are aware, the main source of information is the
farmers. Around 70% of them credit the farmers for giving the information. The public officials and the
schools are the information source of 20% and 10%, respectively.
As the respondents obtained some information about the project from the interviewers, they answer the
question whether they are for or against it. While 29% are in favor and 24% are not in favor, 47%% have
no opinion. All the respondents in Floridablanca have no opinion. In Angeles and Mexico, 60% and 44%
respectively have taken the same stand. In San Fernando, only 31% have no opinion and 42% are against
it.
The main reason among those who disapprove the project is the possible adverse impact. Around 42% cite
this. The worry over such possibility is highest in San Fernando where 52% mention it. The percentage is
also high in Angeles and Mexico at 40% and 33%, respectively. While 33% give no reason f0r their stand,
15% say that more study and trial should be done. This is complemented by 8% who said that the absence
of information is enough reason to oppose the project. Around 2% question the need for such project.
Among those who are in favor of the project, 29% look forward to some progress in their barangay to
come with it. Around 47% in San Fernando have this expectation. While for 28%, it's the assistance that
might be given to the farmers. Around 26% welcome the project as a new technology. Some 3% expect
the project to spin employment opportunities. But 14% cannot cite any reason why they are for it.
The recommendation of 19% of the respondents is to conduct deeper study on the project and its impact.
The information that will be generated can be shared with the households in the project site and
consultation can be made on such basis. Around 72% of the respondents say that consultations must take
place. The demand for consultation is high in the three LGU: 100% in Angeles, 69% in Mexico and 72%
in San Fernando. If there are adverse impacts, a budget must be provided to mitigate it as recommended
by 2 percent. Some 7% say that the project needs to be prevented at this point.
The respondents are asked on their opinion on the impact of the project on three aspects: plants and
animals; air, water and soil; and people. About 76% cannot form any opinion on the project's impact on
plants and animals. While 17% say the impact of the project may be beneficial, 11% fear that it may bring
disease and death to plants and animals. The same pattern is noted in the aspect of water and soil. Around
79% cannot form an opinion. But only 1% says that there may be beneficial impact and 8% anticipates soil
enhancement. But 12% foresee pollution to occur.
On the possible benefits of the people from the project, 82% have no opinion. Some 11% look forward to
a higher yield. This is mentioned by 14% in Mexico and 15% in San Fernando. The other benefits
mentioned by smaller percentages of respondents are employment, new technology and progress. On the
possible adverse impact on the people, 87% of the respondents have no opinion. But pollution still haunts
10% of them. The other possible adverse impact foreseen is disease.
3.5 SOCIAL BASELINE ASSESSMENT
Two public consultation meetings were held separately to discuss the issues and concerns of the identified
stakeholders of the proposed project. The first level consultation was conducted on June 15, 2004 at the
Greenfields Tennis and Country Club, San Fernando, Pampanga while the second level consultation was
held on June 22, 2004 at the Office of Luzon Agricultural Research Center (LAREC), Floridablanca,
Pampanga. These consultations were attended by the stakeholders of the project who are representatives of
various concerned sectors of farmers and farmlot owners, local government units (barangay and municipal
levels), Sugar Regulatory Agency (SRA), and non-government organization/people's organization
3-27
Environmental Baseline Condition
(Pagkain ng Bayan Foundation and Porac Federation of Cooperatives). The minutes of the first and second
level public consultations are appended in this report as Annex 9.
3.5.1 First Level Consultation
The main objective of the first level consultation is to give the different stakeholders of the project an
opportunity to raise their views and suggestions on the proposed project and consider/incorporate these
items in the conduct of the Environmental Assessment. In order to achieve this, the process of
Environmental Impact Statement System was explained by the project consultant and the details and
components of the proposed project was thoroughly discussed by the representative of the Manila Water
Company, Inc. (MWCI) to the participants of the first level consultation. The project presentation was
supplemented with the results of the various experiments conducted by the LAREC officials in the
experimental site in Floridablanca, Pampanga. After the presentations, the participants were encouraged to
ask questions and share their perception on the proposed project. Seven issues were raised during the first
level consultation and were addressed right away by the presentors. These are summarized in Table 3-43
of Volume II.
3.5.2 Second Level Consultation
In order to maintain the continuity of the consultation process, the same groups of people were invited in
the second level consultation. The meeting started with the presentation of the seven issues raised and
addressed during the first level consultation. Among the seven issues, only the issue on utilizing the agri-
industrial wastes as fertilizer was reiterated. The results of the baseline study and impact assessment were
presented, particularly the soils, microbiology, health, and socio-economic components. The summary of
issues brought up during the second level consultation is also shown in Table 3-43 of Volume II.
3.6 PUBLIC HEALTH
3.6.1 General Health Condition in the Project Areas
Generally, there has been an increase in live births and crude birth rate in Porac and Mexico, while vise-
versa for Floridablanca, San Fernando and Concepcion. Death rates increased for Porac and Concepcion.
Diseases of the gastrointestinal tract (diarrhea, parasitism and other disorders), pulmonary diseases (ARI
and PTB) and skin problems (infected wounds and others) are the common diseases in the impact
barangays. Floridablanca has the highest rate of deaths due to heart diseases, acute respiratory failure,
pneumonia and COPD. The municipality also has high death rates for bronchial asthma and malnutrition.
Porac has the highest rate for cancer, cerebro-vascular diseases, PTB and diabetes mellitus. The leading
causes of mortality is shown in Table 3 44 of Volume II.
The leading causes of diseases common to all the barangays are ARI, infected wound, diarrhea, skin
diseases, hypertension, UTI, PTB, parasitism, GIT disorder, MSD and COPD. Porac has the highest
incidence rate of ARI, infected wounds, UTI, parasitism and MSD. Floridablanca has high rate for ARI
and diarrhea. San Fernando has high rate for ARI, infected wounds, diarrhea, skin diseases, hypertension,
UTI and GIT disorder. The leading causes of morbidity is shown in Table 3 45 of Volume II.
The health facilities in impact areas include rural health unit, barangay health unit, hospitals, drug stores,
"botica ng barangay" and laboratory. There is only one doctor, one nurse, usually one dentist and sanitary
inspector in every rural health unit. The other health facilities are the barangay health units that are
managed by midwives and barangay health workers.
Residents in the periphery usually seek medical consultations at the BHU. Cases that need further medical
evaluation and management are referred to physician in the rural health units. All health programs of the
Department of Health are extended to the rural and barangay health units. The health programs aim to
prevent and control the most common diseases in the country.
3-28
Environmental Baseline Condition
Floridablanca, Pampanga
There was a decrease in livebirths from 1,206 in 2002 to 1,179 in 2003. There is a male preponderance
than females in both years. The number of deaths decreased from 248 to 201, respectively. Males have
more deaths than females in the same years. There was no change in the number of infant deaths. There
were no maternal deaths in the two years.
The leading causes of illness are acute respiratory infection (ARI) and diarrhea. The other leading causes
of morbidity are malnutrition, skin and gastrointestinal (GIT) disorders. There was a decrease in the
incidence rate of ARI from 2001 to 2002 and a slight elevation to 2003. Diarrhea shows a steep decrease
in incidence rate from 2001 to 2003. There was a slight increase in rate of malnutrition from 2001 to 2002.
The leading causes of death are heart disorders, cancer, renal failure, renal failure, cerebro-vascular
accident (CVA) and pneumonia. There was a remarkable decrease in the death rate of heart disease from
2001 to 2003. There is also a slight decrease in the death rate of cancer due to all causes. Renal failure
slightly increased in 2001 to 2002 but slightly decreased in 2003.
Fifty percent of the households get their water directly from deep well (level 1). The water sources of
others either come from deep well with direct pipes (level 2) or deep well with piping and faucets (level
23) respectively. More than 80% of the households use sanitary toilets. Almost 70% of households have a
sanitary way of disposing garbage and have complete basic sanitation facilities.
Porac, Pampanga
In Porac, Pampanga, the birth rate decreased from 1998 to 2001 but abruptly increased again in 2002. The
crude death rate remained steady from 1998 to 2002 but had a single increase in rate in 2000.
The leading causes of mortality in Porac, Pampanga are cerebro-vascular accident (with the highest rate),
heart disease, cancer, respiratory tract infection and pneumonia and renal failure. There has been an
increase in the reporting for all these diseases in 2001 but decreased in 2002, except for renal failure and
pneumonia.
The leading causes of morbidity in Porac, Pampanga include acute respiratory infection, infected wound,
diarrhea and skin disorder. There has been an improvement in the reporting of these diseases. All
mentioned diseases increased continuously from 1999 to present time.
There has been an increase supply of safe water for households from 2001 to 2002. However, the majority
still gets water directly from the deepwell (level 1). There has been an increase in the use of deepwell with
pipes (level 2). No household get water directly from faucets as of 1999.
Concepcion, Tarlac
There was a decrease in the crude birth rate and malnutrition from 1998 to 2002. The infant mortality rate
increased from 2000 to 2002.
Acute respiratory infection remains to be the most common illness in Concepcion followed by skin
disease, gastro-intestinal diseases and parasitism. There has been a decrease in the rate of ARI from 1998
to 2000 but increased in 2001. It slightly decreased again in 2002. Parasitism peaked in 2002. A
downward trend is seen in skin disorder and GIT diseases.
Cardio-vascular diseases, cancer, PTB and diabetes mellitus have the highest rate of diseases in
Concepcion. There was an abrupt decrease in the rate of Cardio-vascular diseases from 1998 to 1999.
There was a slight decrease in rate for skin disease and PTB in the same year. The rates have remained
stable until 2002.
3-29
Environmental Baseline Condition
Mexico, Pampanga
There is an increasing trend in the population and live births from 2001 to 2003. Number of all deaths and
infant death rates also decreased in the same period of time. There were no reported neonatal and maternal
deaths.
Acute respiratory infection (ARI) leads the causes of diseases in Mexico, Pampanga. Skin infections,
diarrhea, COPD, hypertension and diabetes follow ARI. The other causes of diseases are urinary tract
infection (UTI), musculo-skeletal diseases (MSD), pulmonary tuberculosis (PTB), pneumonia, parasitism
and bronchial asthma. The incidence rate remains stable through the three-year period.
The leading causes of deaths in Mexico, Pampanga are CVD, CVA, ARF, diabetes, cancer, pneumonia,
gunshot wounds, PTB, suicide, meningitis, COPD, electrocution and accident. There is a marked decrease
in the incidence rate of cardio vascular diseases and cancer from 2001 to 2003. The rest of the diseases
including CVA, renal failure, diabetes mellitus, pneumonia and others remained relatively stable in rate.
San Fernando, Pampanga
There was a decrease in the crude birth rate from 1999 to 2003. The rest of the health indices remain stable
(death, CDR, ID and IMR). There were maternal deaths recorded until 2003.
The leading causes of diseases from 1999 to 2003 in San Fernando, Pampanga are ARI, diarrhea, skin
disorder, parasitism, vertigo, hypertension, wound infection, myalgia, acute tonsillitis, bronchial asthma,
UTI, vitamin deficiency, GIT disorder and conjunctivitis. There was an increase in acute respiratory
infection from 1999 to 2001. However, ARI decreased from 2001 to 2003. Parasitism increase in rate from
1999 to 2001 but decreased in 2002 and 2003.
The leading causes of mortality in San Fernando include heart diseases, cancer, CVA, pneumonia, chronic
renal failure, PTB, diabetes, COPD, Pancreatitis, accidents, bronchial asthma, upper gastro-intestinal
bleeding, liver cirrhosis, hypertension and fetal death in utero. It shows in the increase in the rate of heart
diseases, cerebro-vascular accident, pneumonia, cancer and pulmonary tuberculosis from 2000 to 2002 but
slightly decreased in 2003.
There is only one physician per municipal health unit. There are several midwives assigned per barangay
health unit. The midwives and barangay health workers are assigned different barangay health station to
serve barangay residents.
Most of the households have safe water for drinking (87%). Many of them get their water from the
deepwell (approximately 76%) while about 17% draw water from pipes in deepwells (level 2). About 13%
of households still make use of non-safe water. Eighty-six percent of the household sanitary toilet. Most of
them have a sanitary way of disposing garbage (93%).
There was a total of 86 respondents from Barangays Panipuan, Baliti and Matalino, San Fernando in this
public health survey. Barangay Matalino had the most respondents. The dominant age group is in the ages
35-39 years old. There were more females than males interviewed and there were more married than
single and widowed seen.
For sanitation services San Fernando, at 98%, has the highest percentage of basic sanitation facilites
(Table 3-46 of Volume II).
3-30
Environmental Impact Assessment
CONTENTS
PAGE
4.
ENVIRONMENTAL IMPACT ASSESSMENT AND MITIGATION........................................................... 2
4.1
PHYSICAL ENVIRONMENT............................................................................................................................... 2
4.1.1
Natural Hazards ....................................................................................................................................... 2
4.1.2
Erosion and Surface Soil Runoff ............................................................................................................ 2
4.1.3
Surface and Groundwater Contamination ............................................................................................. 3
4.1.4
Land Contamination ................................................................................................................................ 5
4.1.5
Odor Generation....................................................................................................................................... 7
4.1.6
Noise Generation...................................................................................................................................... 7
4.1.7
Dust Generation........................................................................................................................................ 7
4.1.8
Traffic Impacts ......................................................................................................................................... 7
4.2
BIOLOGICAL ENVIRONMENTAL ................................................................................................................... 7
4.2.1
Aquatic Ecology........................................................................................................................................ 7
4.2.2
Terrestrial Ecology ................................................................................................................................... 8
4.2.3
Impacts on Agriculture ............................................................................................................................ 8
4.3
SOCIO-CULTURAL AND ECONOMIC ENVIRONMENT................................................................................... 9
4.3.1
Population................................................................................................................................................. 9
4.3.2
Income and Employment ....................................................................................................................... 10
4.3.3
Housing Characteristics and Social Services ....................................................................................... 10
4.3.4
Education ................................................................................................................................................ 10
4.3.5
Culture and Lifestyle.............................................................................................................................. 10
4.4
ARCHEOLOGICAL/ANTHROPOLOGICAL/HISTORICAL SITES ................................................................... 10
4.5
PUBLIC HEALTH .......................................................................................................................................... 10
4.6
ENVIRONMENTAL HEALTH IMPACT ASSESSMENT (EHIA)...................................................................... 11
4.6.1
Incidence Potential Rate ........................................................................................................................ 11
4.6.2
Health Consequence Rating .................................................................................................................. 11
4.7
SUITABILITY OF APPLICATION SITES......................................................................................................... 12
i
Manila Third Sewerage Project (MTSP)
Environmental Impact Assessment
4. ENVIRONMENTAL IMPACT ASSESSMENT AND MITIGATION
This section deals with the prediction and assessment of potential environmental impacts of the
application of Sludge/Septage in the lahar-laden areas of Pampanga and Tarlac. Impacts are described
qualitatively or quantitatively based on specific project activities and existing environmental baseline
conditions. The environmental and health risks brought about by the operation phase of the project are
also discussed in this section. Other proposed measures to minimize, if not totally eliminate the other
potential impacts are discussed and presented separately in the succeeding section.
4.1 PHYSICAL ENVIRONMENT
4.1.1 Natural Hazards
The project region is vulnerable to lahar and flooding. The 1991 Mount Pinatubo eruption disgorged
5 to 7 billion cubic meters (m3) of pyroclastic flow materials on the slopes of the volcano
(PHIVOLCS, 1998). Since then, erosion of these materials produced lahars which have devastated
communities situated along major rivers. Annual sediment yield studies conducted by PHIVOLCS
from 1991 to 1997 estimated that 2.6 billion m3 of pyroclastic flow materials have been eroded and
have affected the provinces of Pampanga, Tarlac and Zambales (Figure 4-1).
It is expected that occurrences of lahar flow will take place but decline exponentially in the next 5-8
years and at which times flooding in low-lying areas will persist (PHIVOLCS, 1998). Table 4-1 of
Volume II describes the lahar hazards zones.
From the delineated Lahar Hazards Zones, the National Economic Development Authority (NEDA)
Region III GIS produced a list of barangays at risks due to lahars and associated flood. Table 4-2 of
Volume II enumerates the existing and proposed septage/sludge disposal sites and the corresponding
lahar hazard zone classification based on the NEDA list.
As indicated in Table 4-2 of Volume II, the lahar hazard classification of the project areas was made
in June, 1998. It is possible that this classification may not hold at present. However, this list has not
been updated to support any reclassification of the lahar hazard zones.
The eruption of Mt. Pinatubo which resulted to massive lahar flow and ash fall on agricultural lands
used to be largely devoted to sugarcane growing. Due to the physical characteristics of the lahar and
the uneven rainfall distribution in the areas, water management has been a big problem in growing
crops in the lahar-laden areas. Poorly drained areas become waterlogged during the months of
October to June while the crop lands remain very droughty during the months of January up to mid
May. Lahar is predominantly sand and therefore the water holding and cation exchange capacity are
relatively poor. Crop production is coupled with low organic matter content.
These phenomena had immensely affected the sugar industry of the region due to a reduction in the
number of hectares devoted to sugar cane. Because of the damage to infrastructure and equipments of
the mills, massive repairs have occupied a large chunk of the mill budget. The sustainability of the
operations cannot be maintained as a result of the relatively low supply of canes. These conditions
have prompted the closure of 2 sugar mills in the areas such as PASUMIL and ARCAM and also
resulted in the inefficient operation of PASUDECO (now BASECOM). This had also caused untimely
displacement of workers and consequently unemployment. The gradual urbanization of Pampanga
and Tarlac areas during the last decade has been felt but efforts by government and private sectors did
not discourage the sugar industry. A new sugar mill that is owned by the Crystal Sugar Corporation is
now operational which makes attractive the expansion of plantations in surrounding areas.
4.1.2 Erosion and Surface Soil Runoff
2
Manila Third Sewerage Project (MTSP)
Environmental Impact Assessment
The raindrop impacts, depending on its intensity, is often the main agent in detaching soil particles
which will be transported by surface runoff to lower elevation. In the early stage of sugar cane plant
preparation, extra precaution should be observed specially on plantation alignment since at this stage
the planting area/s are barren and are exposed to raindrops during rainy season. Erosion on lands
disturbed by man's cultural practices is classified as accelerated or "man-caused erosion". Surface
erosion is the direct result of rain falling on unprotected soil particles, detaching soil particles, and
transporting them by overland flow across the soil surface and move down the slope under the
influence of gravity.
Uncontrolled and unmanaged use of raw septage and sludge as soil conditioners in lahar-affected
areas may contaminate surface and groundwater. Although soils are considered as natural purifiers,
there can be some risks of direct migration of harmful microorganisms and toxic heavy metals to
water bodies and underlying aquifers. The environmental implication of this is that surface and
groundwater resources underlying watersheds which have low sorption capacity and belong to high
rainfall patterns can be susceptible to agrochemical contamination especially if the topography allows
for higher infiltration and leaching. The problem is even aggravated by continuous application of
these substances where accumulation in groundwater can be expected.
4.1.3 Surface and Groundwater Contamination
There are four major factors that affect groundwater contamination: (1) properties of septage and
sewage sludge, (2) properties of soil, (3) site conditions, and (4) human activities (Vandre, 1995).
Important chemical properties are its solubility, adsorption, volatility and degradation. Soil properties
include soil texture, hydraulic conductivity, and organic content. Site conditions pertain to depth of
groundwater, topography and amount of rainfall. Human activities involved include the rate and
timing of substance application.
Chemical Contaminants
From the samples analyzed, the Metro Manila septage, were found not to contain significant
quantities of heavy metals. The study report indicated that the probability of phytotoxicity and
potential hazards posed on humans and animals is low and were found not to contain significant
quantities of heavy metals. The study report indicated that the probability of phytotoxicity and
potential hazards posed on humans and animals is low.
Heavy metals analysis of some of the groundwater samples taken from test areas of MWCI indicated
cadmium and lead values exceeding the Philippine National Standards for Drinking Water (PNSDW).
However, it cannot be ascertained that these contaminants came from either raw septage or sewage
sludge because there is no information of any background groundwater metal concentration levels in
these areas
The results of the early work on chemical analysis of raw septage and sewage sludge fertilized "lahar"
(soil samples) done by Quilloy (2003) at A.B. Gonzales Farm, Telebanca, Concepcion, Tarlac (one
month after application) showed detectable levels of heavy metals very much higher that the metal
levels in sediment taken from the adjacent aquatic system during the present baseline survey. Both
sets of data were taken during the dry season in February 2003 and March 2004, respectively. But,
both results showed that these are still within the pollutant limit. The present background level of
heavy metals, organic material, nitrates, phosphates and other project related contaminants (including
disease producing organisms-protozoa, bacteria, and worms) in the septage/sludge fertilized soil, and
water and sediments in the aquatic system during the rainy season within the vicinity of the project are
not known. Therefore, no impacts could be identified at the moment. However, it is likely that during
the rainy season water from the raw septage/sludge fertilized lahar areas would be carried to the river
systems and other low lying water bodies. The environmental concern would be the possible
contamination of river systems and other water bodies by run-off waters during the rainy season from
3
Manila Third Sewerage Project (MTSP)
Environmental Impact Assessment
the terrestrial component (raw septage/sludge fertilized lahar areas) into the aquatic system due to the
presence of harmful microorganisms and toxic heavy metals. But since these contaminated run-off
waters are diluted there is no vehicle to be accumulated physically, chemically, or biologically to
higher deleterious concentrations. It will be of reduced level of contaminants and therefore it will be
dispersed and be diluted in the water. Also, during rainy season, the major river systems in the lahar
area, which are almost dry during dry season, will be flooded with fast flowing water (turbid/brown).
These discharges will, therefore, not significantly affect the water quality of the adjacent river systems
and other water bodies in the area.
Another possible contaminant is the presence of high levels of nitrate in groundwater. Though nitrate
is considered relatively non-toxic, a high nitrate concentration in drinking water is an environmental
health concern because it can harm infants by reducing the ability of blood to transport oxygen.
Shallow, unconfined aquifers in intensive agricultural and unsewered residential areas are thought to
be most at risk. Proper well site selection and construction and agricultural management practices may
help prevent well contamination by nitrate.
If a well supply is found to have nitrate concentrations higher than the drinking water guideline, use
water from an alternate source, such as a municipal system, or a nearby well that has been tested and
found to be safe, install an effective, in-home water treatment system or use bottled water. Well
owners are encouraged to test their water periodically to ensure the water is safe to drink. Annual
testing is recommended for contaminants such as nitrate that can affect human health.
Soil Properties
One important soil property considered in assessing groundwater contamination is its hydraulic
conductivity. The hydraulic conductivity is defined as the volume of water that will move through a
porous medium in unit time under a unit hydraulic gradient through a unit area measured at right
angles to the direction of flow. Based on grain size characteristics, it can be assumed that the
hydraulic conductivity of the lahar deposits will range from 1 to 102 m/day
The hydraulic conductivities of lahar and alluvial deposits soils are from fast to very fast (1.1 x 10⁻³ to
4 x 10⁻² cm/sec). Infiltration rates, which is also dependent on soil texture is moderately rapid to very
rapid (11 to 92 cm/hr).
On the other hand, the application of sewage sludge or dried sludge as soil conditioners would
increase the amount of organic matter of the lahar deposits thereby increasing its capability to hold
water and adsorb chemicals.
Site Conditions
Site conditions such as low surface gradient, shallow groundwater levels and high rainfall further
increases the vulnerability of groundwater to contamination. Plains, which are often characterized by
presence of local ponds, permit more groundwater to infiltrate than sloping grounds. Obviously,
shallow groundwater levels are more susceptible to contamination than deeper ones. The area
experiences more than 2000 mm of rains per year, 90 % occurring from May to October.
Human Activities
There is a potential of pollutants to be introduced into the surface and groundwater resulting in
potential contamination from the application of septage/sludge in the lahar-affected areas. The
potential is based on the following precepts:
· increase concentration of heavy metals in soils upon application;
· fast to very fast hydraulic conductivity of soils and low adsorption (low CECs);
4
Manila Third Sewerage Project (MTSP)
Environmental Impact Assessment
· shallow groundwater level; and
· relatively flat relief and abundant rainfall
Thus, monitoring of the presence of heavy metals in ground as well as surface water and soils upon
application, hydraulic conductivity and the cation exchange capacity be regularly conducted.
4.1.4 Land Contamination
Chemical Properties of Raw Septage and Sewage Sludge
In 1998, the University of the Philippines' National Engineering Center conducted a study on the
suitability and effectiveness of septage application as a way of rehabilitating soils in the areas of
Central Luzon that had been affected by lahar deposits from the 1992 Pinatubo eruption.
The study took samples of septage from different locations within Metro Manila. Multiple samples
were taken to assure a statistically valid assessment of sludge constituent concentrations. Each sample
was taken from a site where there was an on-going de-sludging operation. Three sub-samples of equal
volume were gathered from the septage hauling truck and mixed to form a composite sample. The
composite samples were brought to the MWSS laboratory for analysis.
The septage characterization was used to obtain a baseline data on the physical and chemical
characteristics, and constituents of the sludge prior to application on lahar-affected lands to be
reclaimed. The quantity, frequency, and method of application of sludge is dependent on the latter's
characteristics. The range and average values for the parameters measured for the raw septage are
summarized in the Table 4-3 of Volume II.
From results of the laboratory analysis it was found that in general, the pH of the sludge is neither too
acidic nor too basic. Heavy metals content is low. The sludge samples were stable based from the
fairly low ratio of total volatile solids to total solids (24-76%). Except for two samples, the rest were
classified as high strength--that is, with COD of 20-50,000 mg/l, Ammonium concentration of 2-
5,000 mg/l and solids concentration equal to or greater than 3.5% (based on a faecal sludge
classification scheme used by EAWAG).
Faecal sludge may contain trace metals such as Pb, Zn, Cu, Cd, and Cr. At high concentrations, they
are potentially toxic to plants, as well as to animals and humans that consume the crops. The Metro
Manila septage, based from the samples analyzed, were found not to contain significant quantities of
heavy metals. The study report indicated that the probability of phytotoxicity and potential hazards
posed on humans and animals is low. The range of concentration of heavy metals in the septage
samples is shown Table 4-4 of Volume II.
Table 4- 5 of Volume II shows the chemical analysis of MWCI raw septage and sewage sludge.
Table 4-6 of Volume II shows the pollutant limits for land application of sewage sludge (US EPA,
1994). Results for chromium. Copper, lead, zinc, and cadmium of sewage sludge are all within the
pollutant limits set by US EPA for land application of sewage sludge.
The discussion on the effects of each parameter to man, aquatic and land animals and flora are given
as Annex 10.
Soil Properties
Lahar Deposits
5
Manila Third Sewerage Project (MTSP)
Environmental Impact Assessment
Lahar deposits vary in texture from poorly sorted and broad distribution of grain size for debris-flow
deposits to a narrower distribution of grain sizes typical of the hypoconcentrated streamflow deposits.
Mean grain size ranges from 0.25 mm to more than 4 mm (medium sand to pebbles
Lahar deposits have very low organic content that further decreases its ability to hold water from
moving downward.
Lahar and Soil Characteristics
Tables 4-7 and 4-8 of Volume II show the results of lahar and soil characteristics. Results of chemical
analysis showed that the pH of both lahar and soil samples are moderately to strongly alkaline.
Consequently, lime adjustment was unnecessary. As expected, lahar samples were nutrient-deficient
and very low in organic matter, organic carbon and CEC. There was absence of nematode eggs in the
samples but faecal coliform is present ( Vol II Table 4-8).
Pre-lahar Quaternary alluvial deposits consist of fine sand, silt loam and clay loam that were
previously planted to rice and sugarcane. Hydraulic conductivities determined from soil horizons
sampled at Panipuan, San Fernando, Pampanga ranged from 1.1 x 10⁻³ to 6.2 x 10⁻³ cm/sec. These
values are classified by USDA as fast. CECs, which ranged from 18.62 to 27.62 meq/100 g, are
considered low.
Site Conditions
It was not possible to measure groundwater levels during the well inventory. The wells inspected
were sealed and do not have any dip tubes where water levels can be measured. Based from well
depths and from interviews with farmers, the wells penetrated the lahar deposits and tapped the
Quaternary alluvium. From groundwater maps of Pampanga and Tarlac, the pre-lahar groundwater
levels are from 2.5 meters below the top of the alluvium at Mexico, Pampanga to 11 meters below the
top of alluvium at Angeles City. The region exhibits low gradient (0.02 to 0.002 m/m) and receives
an annual rainfall of more than 2,000 mm.
Rate of Application
From 1999 to present, MWCI in cooperation with the Sugar Regulatory Authority (SRA) Luzon
Agricultural Research Center (LAREC) have conducted several tests on the use of raw septage and
sewage sludge to enhance lahar-deposited soil. Initially experiments were performed on rice and corn
crops but is now concentrated to sugarcane production. In test areas, liquid sludge is applied from at
40 m3, 80 m3 and 120 m3 per hectare of sugarcane.
Assessment
There is a potential for pollutants to be introduced to the soil resulting in contamination from the
application of septage/sludge in the lahar-affected areas. The potential is based on the following
precepts:
· increase concentration of heavy metals in soils upon application;
· fast to very fast hydraulic conductivity of soils and low adsorption (low CECs);
· relatively flat relief
Analysis of heavy metals from dewatered sewage/sludge fertilized lahar deposits at SRA (LAREC)
Farm at Floridablanca, Pampanga and Telebanca, Concepcion, Tarlac are shown in Volume II Tables
4-9 and 4-10. Analysis indicated an increase in Arsenic, Chromium and Nickel concentrations but
these are still within the pollutant limits for land application.
6
Manila Third Sewerage Project (MTSP)
Environmental Impact Assessment
4.1.5 Odor Generation
The transport, handling and application of septage and domestic wastewater sludges may result in the
generation of malodorus compounds at levels that may cause nuisance to the workers as well as
people affected. Although there is no environmental standards by any government agencies that have
to be met, the nuisance may cause the people affected to file complaints. A buffer zone from the
property line will be provided and shall be planted with trees, or an odor control system may be
installed in the facility..
4.1.6 Noise Generation
The transport of septage and the operation of application equipment will slightly add to the ambient
noise level at the project site. The increased noise levels will have an insignificant impact to the
surrounding area. The exposure of the residents to slightly elevated noise levels near the project site is
considered temporary and intermittent. Regular noise monitoring shall be conducted.
4.1.7 Dust Generation
Septage transport and application are potential sources of dust emissions that may have significant but
temporary impact. It is expected that the ambient level of TSP will increase around the application site
during septage application that involves the use of earthmoving equipment. A large portion of the
increase will result from equipment traffic over temporary roads. This problem will be particularly
true during the dry season.. Frequent rains during the rest of the year will greatly minimize the
generation of dust. Trucks shall be directed by MWCI to move cautiously while passing through the
road to minimize dust emission. Trucks shall be required to pass the smoke emission test, and regular
monitoring on ambient air quality will be conducted.
4.1.8 Traffic Impacts
The increase in the number of trucks transporting septage and sludge to the application sites will
cause traffic movement within the application sites to slow down most especially during operation.
Adequate parking spaces shall be made available by the project, both for trucks off-loading and car
parking. Arrival of trucks shall be coordinated with the MWCI and property owner to avoid
congestion or traffic at the project site.
4.2 BIOLOGICAL ENVIRONMENT
4.2.1 Aquatic Ecology
Impacts on Plankton
Raw septage and sludge contain a considerable amount of essential plant nutrients (i.e., nitrogen and
phosphorus compounds), and hence they are effective in promoting crop production. When rainy
season comes, of course, the nutrient (which is not absorbed by crop roots) will be washed by runoff-
waters into rivers, streams, and low lying water bodies; and hence "enrich" the aquatic systems in
which they are discharged. If this is true then the impact of this on overall plankton productivity is
considered positive. Although, plankton productivity in the major river systems in the lahar area is
expected to be scarce during rainy season when almost all the river systems are flooded with high
current flow and turbidity.
Impacts on Soft-Bottom Benthos
7
Manila Third Sewerage Project (MTSP)
Environmental Impact Assessment
The contaminants in the septage/sludge fertilized lahar areas which will be discharged to the aquatic
environment by run-off waters during rainy season has no potential to cause adverse effects to the
limited soft-bottom benthic organisms in the area.
Impacts on Fisheries
During the rainy season when almost all the major river systems are flooded, fishing is very minimal
or none at all. Therefore, the impact of the proposed project on sustenance fishing in almost all the
major river systems and other water bodies (e.g. fishponds) in the lahar area is insignificant.
4.2.2 Terrestrial Ecology
Impacts on Soil and Leaf Tissue
Sewage sludge/septage dumping activities are still in progress but the areas are not identified properly
especially the sensitive sites such as those sitting on top of the former rivers or waterways that were
covered with lahar. No special attention is being made when it comes to disposal of wastes from other
industrial companies. It was mentioned that CDC, Agrifruit, Ajinomoto and San Miguel Corporation
have been disposing their wastes in the same site some years back and are still doing it at present.
Soil and Leaf Tissue Analysis from March 2004 Sampling
The concentrations (ug/g) of Cadmium and Lead obtained from sugarcane soil samples (Volume II
Table 4-11) are low, although most of the samples were greater than Instrument Minimum Detection
Level (mdl). Even the untreated and the unplanted sugarcane fields exhibited presence of heavy
metals.
With regards to tissue analysis, the concentration of heavy metals in roots and leaf tissues (Volume II
Table 4-12) neither significantly differ with the type of cane field nor with the location. It was
however noted that higher figures of lead were suggested in the root tissues than in the above the
ground tissues. For instance, lead level in San Fernando was higher in the roots of ratoon cane than in
plant canes. Nevertheless, this pattern does not hold with those analyzed from Floridablanca and
Tarlac. The aforementioned analysis collaborated with earlier studies conducted by Estanislao, E. B.,
B. G. Manlapaz and O. T. Quilloy on "Productivity improvement of soils (Angeles loamy sane)
planted to sugarcane with liquid sewage sludge".
4.2.3 Impacts on Agriculture
Positive Impacts identified as a result of sewage/septage application consisted of improved soil
condition and growth / yield of sugarcane and other plant growth.
Plant Growth
The UP-NEC study showed that planting of grasses or any plant which can tolerate the harsh
conditions of lahar and the possible harmful effects of sludge, such as the talahib grass, was found to
help prevent or minimize the leaching of nitrate into the groundwater since plants can assimilate the
nitrate available in the ground.
The amount of sludge applied and irrigation had important consequence on the growth in height of the
talahib grass. For the first four weeks of the experiment, the grass seemed to depend only on the water
being applied. Thereafter, the amount of septage started to show signs of significance. At loading rate
of 80 li/m2, there was no inhibition of plant growth observed. In fact, this application improved plant
growth (i.e., where the lahar to soil ratio was1:0.1, and the type sludge of application was through
mixing).
8
Manila Third Sewerage Project (MTSP)
Environmental Impact Assessment
The pechay (Brassica oleracea) responded well to the sludge treatment, although it took more or less
ten days before the treatment had significant effect on the pechay. It was observed that the treatments
had no significant effect on the increase in the number of leaves. The most notable effect was on the
increase in leaf length.
The application of sewage/septage results in improvement of soil condition and fertility. Initial
increase in pH will make available other nutrients such as phosphorus. When combined with the sugar
mill waste e.g. bagasse and mudpress, composting time is shortened.
Composted sewage sludge/ septage and sugar mill waste improves growth and sugar yield of sugar
cane. Economic study showed that 180 kg NPK + mudpress can increase net profit to P 15,210.22 in
plant cane and P 16, 504.48 in ratoon cane.
In addition to these impacts, no persistent presence of parasitic spores or pathogenic micro-organisms
and heavy metals were analyzed on soil and leaf tissues of sugarcane after sewage/septage
application.
Pathogen Survival Rates.
The UP-NEC study has shown that the faecal sludge in Metro Manila contains a substantial number of
faecal coliform (50x106 MPN/100ml) and nematode eggs (5,733 eggs/kg). Three different septage
samples were applied onto to the plots and were left to stabilize for four months. After four months, a
substantial reduction in faecal coliform count of the faecal sludge was observed. As much as 99%
reduction in faecal coliforms was achieved. The amount of sludge, irrigation and the type of lahar
were found to be significant on the nematode eggs survival. The Table below shows the initial and
final coliform counts, and their respective percentage reductions.
Faecal Sludge Type
Sample 1
Sample 2
Sample 3
Faecal Coliform
Initial 13
x
107
80 x 105
13 x 106
MPN/100ml
Final 80
x
105
30 x 102
50 x 104
Reduction 12
x
107 (93.8%)
79 x 105 (99.9%)
12 x 106
Nematode eggs
Initial 13.333
12,000
2,667
Eggs/kg of sludge
Final 3.667
3.333
2.333
Reduction
9656 (72%)
8667 (72%)
334 (13%)
Fourteen septage samples were analyzed for nematode eggs. A range of 2,667 eggs/kg to 13,667
eggs/kg and a mean of 6,044 eggs/kg were obtained. Septage was applied on plots in Sections I to V
and a nematode count was also conducted after three months from application. The results of the
nematode count are listed in Table 22. A range of 0 egg/kg to 11,333 eggs/kg and a mean of 2,872
eggs/kg were recorded. A comparison of the typical count of nematode eggs present in septage with
ones applied on the soil shows a 50% decrease in number.
Negative Impacts identified on the other hand were the following:
Uptake by plants with heavy metals is not fully documented on long term basis
Handling of liquid sludge is messy and volumetric
Distance and travel time a factor in distribution or shipment to target destination may be
costly and/or potential health hazard during shipment to far places
4.3 SOCIO-CULTURAL AND ECONOMIC ENVIRONMENT
4.3.1 Population
9
Manila Third Sewerage Project (MTSP)
Environmental Impact Assessment
The proposed project sites are far from existing settlements and do not require resettlement. It has also
very low employment potential and will not serve as pull factor for in-migration. The potential full
impact of the project on human health is not fully established. It has to be determined to know
whether there are adverse impacts and the impact is intense enough to affect mortality rate. If it will
affect the mortality rate among workers and residents living nearest to the project sites, the project can
reduce population size. But at moment, no impact is expected on population size. It is not also
established how much increase in yield will be attained if any when the intervention will be
introduced. If the increase in yield will be substantial enough to push up the income of people
employed in the production process, it will augment capability of the economically active adults to
support their dependents. It will not affect the existing dependency ratio in the short term.
4.3.2 Income and Employment
The project is not expected to directly and indirectly generate massive employment. The increase in
income that may be generated is dependent on the increase in yield that is yet to be established. The
increased income if any, will most likely benefit the landowner. In this case the multiplier effect of the
increase in income will be very limited.
4.3.3 Housing Characteristics and Social Services
Because the project will not entail resettlement or drastic income increase, it is not expected to alter
the housing characteristics in the general area of the project sites. The limited employment generation
capacity will neither create settlements close to project sites nor create high demand for services. As a
result, no competition will be created for existing services.
4.3.4 Education
Because the project will not attract in-migrants, it will not impose additional capacity on the schools
in the host barangays. The limited wages that it will generate if any will not be enough to have
significant impact on the capability of the economically active adults to support longer years of
schooling for their children.
4.3.5 Culture and Lifestyle
The project is not expected to have impact on social cohesion in the host barangays nor their
prevailing culture and lifestyle. Because it will not attract in-migrants into the host barangays, there
will be no carriers of new cultural patterns and behavior that may clash with the existing ones. In this
case, the project will maintain the existing level of social harmony and cultural homogeneity in the
host barangays. These barangays are tightly cohesive communities that evolved through generations
to have patterned interactions that changed little through the years. The birthplace of the respondents
and their length of stay in their present places of residence indicate this.
4.4 ARCHEOLOGICAL/ANTHROPOLOGICAL/HISTORICAL SITES
The archeological potential of the project sites is not established. There are no indications that these
are ancient settlements being far from the coasts and big rivers. Because of their location, the
archeological potential of the project sites is low. Nonetheless, some activities that the project will
undertake may lead to some accidental finds. If this will occur, the finds must be submitted to the
National Museum so that its personnel can appraise the area and looting can be avoided.
4.5 PUBLIC HEALTH
Urbanization and the resulting growth in the population are looking and demanding on technology for
procedures to manage municipal wastes in an environmentally "safe" and acceptable manner.
10
Manila Third Sewerage Project (MTSP)
Environmental Impact Assessment
Society's awareness of our need to reuse, when possible, resources contained in wastes has led to an
intense interest in the application of municipal sewage sludge to agricultural land. Because of the
essential plant nutrients contained in sewage sludges, the use of wastes has been shown to be
beneficial to plant growth. However, this procedure may expose the community residents to the toxic
chemicals and/or pathogenic organisms present in contained in the municipal wastes and may,
therefore, be harmful to human consuming food produced on sludge-amended land.
The vast land created by the "lahar" requires fertilization of soil in order to allow the growth and
nourishment of sugar cane plantation. The plan of the MWSS is to make use of the sludge produced in
Metro Manila in the "Lahar" area for the fertilization and agricultural purposes.
Exposure to these chemical substances not only causes adverse health effects to direct handlers, but
also to the community residents who eventually take in food products. The release mechanisms from
several contaminated substrates (soil and water) of chemicals and pathogens may normally continue
for prolonged periods of time even after the closure of the disposal operation. Long-term effects of
exposure to sub-lethal doses of chemical toxins are uncertain, especially where a complex
combination with other metal ions is concerned. There could be some potential threat to the health, if
not the life, of humans and there is the possibility that sub-lethal concentrations will be subjected to
food chain magnification with consequent danger to human beings.
The concern of this study is concentrated on the adverse health effects of sludge disposal in the
"lahar" area on man. Public safety can be endangered on occasions through negligence or unusual or
unforeseen circumstances. The hazards to which men are exposed to could be direct or indirect. This
study will present an assessment of the health risks related with the use of sewage sludge in a soil-
plant-animal food production system.
4.6 ENVIRONMENTAL HEALTH IMPACT ASSESSMENT (EHIA)
4.6.1 Incidence Potential Rate
Identified environmental health hazards brought about by the Sludge/septage Disposal Project are
chemical, physical and biological factors (Volume II Table 4-13). The communities immediately
affected by these hazards are the communities in Porac, San Fernando, Floridablanca, Mexico
(Pampanga) and Concepcion (Tarlac) where the sludge/septage disposal project is closely located.
Volume II Table 4-13 shows the incident potential rating estimates of environmental hazards in the
impact areas. Incidence potential rating estimates the probability of occurrence of the exposure
incident for the proposed developmental project.
Incidence Potential Rating in Volume II Table 4-13 shows that the nearest impact community affected
most by the sludge/septage disposal project. The impact communities are at risk of contamination
from dust, chemicals from the sludge and microorganisms. Psychological stress (irritation,
apprehensions) due to odor and the health effects of wastes to air and water are rated D in the incident
potential rating. This means that this incidence has happened during the operation of a similar
development owned and operated by the project in other areas. Vehicular accidents in access roads
can happen more than once but may not happen at all. Noise, vibrations, heat and ergonomic stress are
unlikely to happen among residents.
4.6.2 Health Consequence Rating
Table 4-14 of Volume II shows the health consequence rating of impact barangays. Identified risk
factors are vehicular accidents, odor, gases and chemical wastes and biological hazards. Psychological
stress of residents stems from the above factors particularly the odor that comes from the
sludge/septage disposal site.
11
Manila Third Sewerage Project (MTSP)
Environmental Impact Assessment
As shown in the Table 4-15 of Volume II, the risk to health matrix is the integration of the incidence
potential rating and health consequence rating. As recommended by the DOH, this tool will guide the
Project operators in the prioritization of environmental health hazards for future courses of action.
Health Risk Matrix in Volume II Table 4-15 shows that the identified risks that should be given
priority in terms of environmental control and mitigating measures are the following:
· Dust, volatile gases, hazardous and non-hazardous wastes, heavy metals. Vehicular accidents,
psychological stress biological hazards
· Psychological stress, odor and air pollution
· NO2, SO2, noise, heat and vibration
Volume II Tables 4-16 and 4-17 enumerate the health effects of chemical, physical and biological
hazards identified in the previous Tables. The health effects of heavy metals are also found in the
literature review found in the Annex 10.
4.7 SUITABILITY OF APPLICATION SITES
A qualitative assessment as to the suitability of the application sites was performed based on the
following criteria:
· Depth of lahar/ashfall deposits (the deeper the deposit, the more suitable);
· Depth to groundwater (the deeper the groundwater level, the more suitable);
· Distance to nearest waterbody (the farther the distance, the more suitable);
· Distance to nearest well (the farther the distance, the more suitable); and
· Distance to nearest house/community (the farther the distance, the more suitable).
The score criteria are shown in the following tables.
Depth of Lahar
Depth (m)
Score
12-15 1
9-11 2
5-8 3
3-4
4
0.5-2 5
0.1-0.4 6
0.06-0.09 7
0.01-0.05 8
Depth to Groundwater (Based on well depth)
Depth (m)
Score
42-45 1
39-41 2
36-38 3
33-35
4
30-32 5
25-29 6
20-24 7
<20 8
Distance to Major River
Distance (m)
Score
12
Manila Third Sewerage Project (MTSP)
Environmental Impact Assessment
4,000-6,000 1
2,500-3,999 2
1,500-2,499 3
1,000-1,499
4
500-999 5
300-499 6
100-299 7
<99 8
Distance to Nearest Well
Distance (m)
Score
1,000-1,300 1
700-999 2
400-699 3
300-399
4
200-299 5
100-199 6
50-99 7
<50 8
Distance to Nearest Community
Distance (m)
Score
1,000-1,250 1
700-999 2
400-699 3
300-399
4
200-299 5
100-199 6
50-99 7
<50 8
Field inspection of the application sites resulted to the observations:
· At the San Fernando Angeles Mexico area, the application sites, except for the Calubasa site,
were not affected by lahar but are merely covered with 1-2 inch ashfall. The area is underlain by
a shallow aquifer (< 20 meters) as evidenced by hand-pump wells that are used for domestic
purposes. The distance to the nearest major river, the Abacan River, ranges from 20 meters
(Ganduz, Baliti) to 5,700 meters (Baliti). Except for Malino, which is about 100 meters from the
nearest home/community, the rest of the application sites are less than 50 meters to the nearest
home/community. Hand-pump wells, which are the main sources of domestic water abound in
the community.
· At Carmencita, Floridablanca, the lahar deposit is between 3-5 meters thick. There are shallow
wells within the application site but are used mostly for irrigation. The site is located on the west
bank of Gumain River and is separated from the community by an elevated access road (3 meters
high). Distance to nearest community is about 50 to 100 meters.
· The Mitla application site at Porac is operated by the Monoport Traders Inc. It is about one
kilometer away from the nearest barangay community. The site is covered from 12 to 15 meters
of lahar deposit and is about 300 meters north of Pasig-Potrero River. There are three irrigation
wells within the farm which are about 45 meters deep.
· The Telebanca-Malonzo application sites at Tarlac Province are on the south bank of Bamban
River. The main access road to the sites runs parallel with the river dike. The road also serves as
access for quarrying lahar deposits which are from 3 to 6 meters thick. Eight resettlement houses
13
Manila Third Sewerage Project (MTSP)
Environmental Impact Assessment
are located along the access road in Telebanca. The nearest well is about 100 meters at Malonzo
and 300 meters at Telebanca. Well depth range from 20 to 25 meters. A fishpond area is about
350 meters northeast of the application site.
The point scoring for each application site and the resulting ranking is shown the matrix
below. The matrix shows the ranking of the application sites based on suitability criteria with the
lowest score as the most suitable site. The most suitable site for application is at Barangay Mitla,
Porac Pampanga, follwed by the Telebanca-Malonzo area at Tarlac and at Barangay Acli, Mexico,
Pampanga. The third most suitable site is located at Barangay Carmencita, Floridablanca, Pampanga.
The least suitable application site is at Barangay Ganduz, Mexico, Pampanga.
The total land area deposited with lahar in Central Luzon is 120,000 hectares. On-going
septage/sludge application involves 1070 has. Out of the sites evaluated, only 15 sites or 900 hectares
sufficiently met the criteria on site selection. MWCI has to explore more sites from the total lahar-
covered areas for future activities.
14
Manila Third Sewerage Project (MTSP)
Environmental Impact Assessment and Mitigation
Matrix on the Suitability of Application Sites
Distance to
Depth of lahar
Depth to
Distance to
Distance to
nearest
deposit/ashflow
Groundwater
Major River
nearest well
Name of
community
Total
Location
Rank
nearest river
Score
Depth (m)
Score
Depth (m)
Score Meters
Score
Meters Score Meters Score
With on-going sludge/septage application
San Jose Mitla, Porac, Pampanga
12-15
1
45
1
300
6
Pasig Potrero River
1,250
1
1250
1
10
1
Panipuan, San Fernando, Pampanga
1-2 in
8
<20
8
3,500
2
Abacan River
<50
8
<50
8
34
7
Malino, San Fernando, Pampanga
1-2 in
8
<20
8
4,500 1 Abacan
River <50 8 100 6 31 5
Mining, Angeles, Pampanga
1-2 in
8
<20
8
400 6 Abacan
River <50 8 <50 8 38 9
Ganduz, Mexico, Pampanga
1-2 in
8
<20
8
20 8 Abacan
River <50 8 <50 8 40 10
Carmencita, Floridablanca, Pampanga
3-5
4
<20
8
400 6 Gumain
River 100 6 100 6 30 4
Telebanca,
Concepcion,
Tarlac
3-6 4 20-25 7 5 8 Bamban
River 300 4 500 3 26 2
Malonzo, Bamban, Tarlac
3-6
4
20-25
7
5
8
Bamban River
100
6
1,000
1
26
2
Potential sites for sludge/septage application
Baliti, San Fernando, Pampanga 1-2
in
8
<20
8
5,700 1 Abacan
River 10 8 10 8 33 6
Eden, Mexico, Pampanga
1-2 in
8
<20
8
1,300 4 Abacan
River 200 5 200 5 30 4
Suclaban, Mexico, Pampanga
1-2 in
8
<20
8
1,500 3 Abacan
River <50 8 <50 8 35 8
Culubasa, Mexico, Pampanga
1.0
5
<20
8
1,000 4 Abacan
River <50 8 <50 8 33 6
Acli, Mexico, Pampanga
1-2 in
8
<20
8
2,700 2 Abacan
River 200 5 200 5 26 3
Camuning, Mexico, Pampanga
1-2 in
8
<20
8
1,600 3 Abacan
River 100 6 100 6 31 5
Panipuan, Mexico, Pampanga
1-2 in
8
<20
8
3,000 2 Abacan
River <50 8 200 5 31 5
*Approximate distance in meter
4-1
Manila Third Sewerage Project (MTSP)
Environmental Management Plan
CONTENTS
PAGE
5.
ENVIRONMENTAL MANAGEMENT PLAN ............................................................................................5-1
5.1
NATURAL HAZARDS .................................................................................................................................5-1
5.2
EROSION AND SURFACE SOIL RUNOFF .....................................................................................................5-1
5.3
SURFACE AND GROUNDWATER CONTAMINATION ....................................................................................5-1
5.4
LAND RECLAMATION OR REHABILITATION...............................................................................................5-2
5.5
ODOR GENERATION ..................................................................................................................................5-3
5.6
NOISE GENERATION..................................................................................................................................5-3
5.7
DUST GENERATION...................................................................................................................................5-3
5.8
TRAFFIC IMPACTS ...............................................................................................................................5-3
5.9
BIOLOGICAL ENVIRONMENT .....................................................................................................................5-3
5.10
COMMUNITY HEALTH HAZARDS...............................................................................................................5-4
5.11
SOCIO-ECONOMICS ...................................................................................................................................5-4
5.11.1
Information and Education.............................................................................................................5-4
5.11.2
Occupational Health and Safety.....................................................................................................5-5
5.11.3
Risk Reduction Measures of Health Hazards .................................................................................5-5
5.11.4
Protection of Personnel from Physical Hazards ............................................................................5-5
5.11.5
Safety of Workers............................................................................................................................5-6
5.11.6
Health of the Workers.....................................................................................................................5-7
5.11.7
Public Health..................................................................................................................................5-7
5.11.8
Biological Hazards.........................................................................................................................5-8
5.12
ARCHAEOLOGICAL FINDINGS....................................................................................................................5-8
5.13
PROJECT ALTERNATIVES ........................................................................................................................5-13
5.13.1
Project Sites..................................................................................................................................5-13
5.13.2
Septage Disposal Option ..............................................................................................................5-13
5.13.3
Septage Transport Option.............................................................................................................5-14
5.13.4
Septage Treatment Option ............................................................................................................5-14
i
Manila Third Sewerage Project (MTSP)
Environmental Management Plan
5. ENVIRONMENTAL MANAGEMENT PLAN
MWCI in the implementation of each project component will adopt a septage/sludge management
program to prevent, if not, minimize the environment impacts associated with the collection and disposal
of septage and sludge. It should also be noted that the septage/sludge is being productively reused by land
application as a soil conditioner and organic fertiliser, and that this will have substantial benefits in terms
of improved crop yields and improvements in overall soil fertility. It is not just a simple disposal scheme.
There are two phases, namely the collection of the raw septage in tankers for transport to the SPTP, and
then the hauling and disposal of the septage/sludge combination from the SPTPs and STPs to the land
disposal areas in the northern provinces. This issue is addressed in the tabulated EMP, and additional
issues are addressed below.
5.1 NATURAL HAZARDS
Since 1993, the Philippine government has spent billions of pesos for lahar control structures. Foremost
of these is the 66-kilometer megadike along the Pasig-Potrero River in Pampanga. Meanwhile, the
rehabilitation and dredging of heavily silted waterways continues. Except for major breach in the dike
structures (e.g. the Gugu Dike failure in October 1995 that caused lahar to bury the town of Bacolor,
Pampanga), lahar episodes have been confined within active river channels.
5.2 EROSION AND SURFACE SOIL RUNOFF
As mentioned earlier, the raindrop impacts depending on its intensity is often the main agent in detaching
soil particles which will be transported by surface runoff to lower elevation. In the early stage of sugar
cane plant preparation extra precaution should be observed specially on plantation alignment since at this
stage the planting area/s are barren and are exposed to raindrops during rainy season. Surface erosion is
the direct result of rain falling on unprotected soil particles, detaching soil particles, and transporting them
by overland flow across the soil surface and move downslope under the influence of gravity. To minimize
the effect of raindrops, proper farm management should be strictly observed to effectively maximize the
utilization of surface runoff to satisfy the water requirement of the sugar cane plantation. With the strict
observance of farm management detached soil particles carried by the surface runoff will be minimized.
This includes the construction of temporary barriers and trenches around the mounds of materials to abate
the spread of spoils through surface runoff. As the plantation grows, raindrop impact will be a less
problem since the canopy or leaves of the sugar cane will absorb most of the impact.
Another strategy to minimize erosion is the site selection of plantation areas where sludge/septage use will
be applied as a soil conditioner. Identified sites should be as much as possible far from the riverbank
where siltation is heavy. Heavily silted rivers will overflow during occurrence of heavy rains and lateral
flooding may reach up to the plantation which soils blended with sludge will be carried during the
recession stage of the flood and may be deposited downstream of the river channels. As mentioned earlier,
this will lessen the conveyance capacity of the rivers. A regular monitoring of surface water quality is to
be programmed for implementation.
5.3 SURFACE AND GROUNDWATER CONTAMINATION
As discussed in Section 4, there are four major factors that affect groundwater contamination: (1)
properties of septage and sewage sludge, (2) properties of soil, (3) site conditions, and (4) human activities
(Vandre, 1995). Important chemical properties are its solubility, adsorption, volatility and degradation.
Soil properties include soil texture, hydraulic conductivity, and organic content. Site conditions pertain to
depth of groundwater, topography and amount of rainfall. Human activities involved include the rate and
5-1
Manila Third Sewerage Project (MTSP)
Environmental Management Plan
timing of substance application. Such factors have to be controlled so that groundwater contamination
shall not occur.
MWCI is ensuring that application sites shall not be located or sited on former river or waterway. Regular
monitoring of quality of surface and groundwater quality will be undertaken.
5.4 LAND RECLAMATION OR REHABILITATION
What used to be fertile lands for the sugar cane has been considered sub-marginal because the surface is
occupied by lahar. Thus, changes to land use in the area have been observed. Farmers changed to
aquaculture as a result of the low productivity of lahar-laden soil. Since the eruption of Mt. Pinatubo,
researches investigations on what could be done to revive the productivity of the once fertile areas for
sugar cane and other crops have been conducted. Government budget or subsidy for a more continuous
development of technologies to revive the sugar industry in the areas has been very scanty.
It is believed that through the years the productivity of the lahar-laden areas can still be improved but the
need to grow crops for the community livelihood and the sugar cane industry is a much needed forum. A
few research reports have demonstrated that under controlled nursery and field conditions, the addition of
organic matter has been proven effective in enriching the productivity of lahar as suggested by better crop
growth and harvest.
Technical measures which can mitigate impacts identified in the preceding section are the following:
Concentrate the sludge through sanitary means of vaporization
Utilize other sugar mill wastes to further improve quality of composted sludge
Study the effect of combining application of sludge on the reduction of heavy metal uptake
Develop protocol for utilization of supernate as a result of concentration of liquid sludge
Study the supernate as a potential source of liquid fertilizer for crops
Study build up of beneficial microorganisms in the soil-root interphase as a result of
sewage/septage application
Start studies to further test the effect of sludge on productivity of other soil types
Utilize other technologies in production of crops raised in lahar-laden areas
The UP-NEC Study reported that lahar samples were obtained from Mexico, Pampanga, and Bamban,
Tarlac. Lahar samples from Pampanga were designated as "Lahar 1", and those from Tarlac as "Lahar 2".
A total of 186 sacks of lahar were obtained from the two sampling areas, with sampling depth of one
meter. The samples were brought to the Bureau of Soil and Water Management (BSWM) for analysis.
Without treatment, the unsuitability of lahar to support vegetation can be easily seen from its
characteristics. The lahar samples from Pampanga and Tarlac have low N, P, K and micronutrient level
such as Cu, Zn, Fe and Mn . The samples also had poor water holding capacity and cation exchange
capacity (CEC). Since CEC is an indicator of the amount of organic and clay content, the values showing
very low organic matter validates the result.
Lime addition before sludge application is usually recommended where the pH values are below 5.5-6.5 in
order to prevent the mobilization of heavy metals. Since pH of the lahar samples were found to be above
this range, the study report indicated that there would be considerable savings, since lime application may
not be necessary.
The report also indicated that application of sludge on pure lahar may be impractical or be more costly
than application on an improved lahar--that is, lahar mixed with soil--since a smaller volume of sludge
would be needed for the latter. The characteristics of the lahar samples are given in Tables 4-7 and 4-8 of
Volume II.
5-2
Manila Third Sewerage Project (MTSP)
Environmental Management Plan
It is to be noted that the application of liquid sewage/septage provide moisture to the sugar cane plants
during the summer months. Sewage sludge plus bagasse and mill ash provides additional nutrients for
plant growth and increase tonnage and sugar yield.
Best practice for land reclamation in lahar-laden areas such as measures that controls and regular
maintenance of trucks, issuance of workers' personal protective equipment, public access restricted,
posting of "No Trespassing" signs in application sites, annual food harvest shall be 30 days after
application, septage incorporated within 6 hours after application, and untreated septage shall be pumped
directly into truck tanks and hauled to non-public contract site shall be implemented. Regular monitoring
of soil samples and lahar including heavy metals will be undertaken.
5.5 ODOR GENERATION
Odor will be generated by transporting trucks and affect residential establishment passed by. Likewise,
odor will result in the application of septage.
As mitigating measures to minimize odor, transport trucks will be sealed and well maintained. Due to the
remoteness of application areas, odor may not be a problem. A buffer zone from the property line will be
provided and shall be planted with trees. An odor control system may be installed in the facility.
5.6 NOISE GENERATION
Regular noise monitoring shall be undertaken to ensure that the workers are exposed to levels within the
DENR standards.
5.7 DUST GENERATION
The generation of air-borne particulates is significant, but temporary and for seasons of strong winds,
sprinkling of water to soil is recommended. Trucks shall be required by MWCI to move cautiously while
passing through the road to minimize dust emission. Trucks will be required to pass smoke emission test,
and regular monitoring on ambient air quality will be conducted.
5.8 TRAFFIC IMPACTS
The arrival of trucks shall be coordinated by MWCI with the property owner to minimize or prevent
congestion at the application site. Likewise, delivery trucks shall be required to post visible identification
and signages for easy recognition.
There is a possibility of deterioration of road condition due to regular movement of trucks at site. As a
mitigation measure, MWCI shall ensure that regular maintenance shall be done on the road link and the
property interior roads. Maintenance and repairs of access roads shall be undertaken at a regular basis.
MWCI shall regularly clean the roads to ensure there will be smooth movement of trucks.
5.9 BIOLOGICAL ENVIRONMENT
As there are no significant impacts of the application to the aquatic ecology, no mitigating measures have
been recommended.
The sewage/septage application resulted in improved soil conditions and growth/yield of sugarcane and
other plant growth. The UP-NEC study showed that grasses or plants such as talahib grass was found to
5-3
Manila Third Sewerage Project (MTSP)
Environmental Management Plan
help prevent or minimize the leaching of nitrate into the groundwater as they can assimilate the nitrate
available in the ground.
5.10 COMMUNITY HEALTH HAZARDS
Health hazards discussions include the community health hazards, those due to accidental spills, exposure
to pathogens and vectors.
The results of the bacteriological analysis of the lahar samples are shown below. There was absence of
nematode eggs in the lahar samples although faecal coliform was present.
Faecal
Nematode
No. of colonies/g of moist soil
Lahar
Source
Coliform
Eggs
MPN/100 ml
(eggs/kg)
Bacteria
Fungi
Pampanga
700
0
375 x 103
1 x 10³
Tarlac
1,100
0
575 x 103
39 x 102
The mitigating measures include the following:
· Site controls and regular maintenance of trucks;
· Issuance of personal protective equipment to workers;
· Public access to application site is restricted;
· Site restriction requires the posting of "No Trespassing" signs;
· Annual food harvest shall be 30 days after application;
· Septage incorporated within 6 hours after application;
· Untreated septage pumped directly into truck tanks and hauled to non-public contract site.
The last three measures are to address the pathogen and vector exposures.
5.11 SOCIO-ECONOMICS
During the operation phase, markers aimed at warning people against going into or near sites considered
dangerous should be installed. The markers should prevent undue exposure to the hazards.
When hazards are known, the workers must be provided with proper protective gears and required to wear
these. This will require additional investment from the landowners, but this is in compliance with the
Philippine labor laws. The workers must also be oriented on these hazards and the risk that they are taking
as well as the necessary precautionary measures that they can perform. If the workers are affected in some
way, they must be provided with social protection in terms of health insurance programs.
5.11.1 Information and Education
Residents and workers should be well informed of the potential sites of chemical contamination including
sources, pathway media and route of intake. They should be advised on how to avoid the sites affected.
They should be educated on the correlation of concentration levels and effects of chemical and emphasize
on the dose-response relationship.
They should be educated on the possible adverse effects of chemicals present. They should be aware of
the signs and symptoms of effects of chemical and these could be similar to the manifestation of more
common diseases in the area.
5-4
Manila Third Sewerage Project (MTSP)
Environmental Management Plan
The residents should be informed of the correlation between drinking water monitoring for microbes and
diseases. They should also be educated on how infectious diseases are transmitted from person to person
and through other means. They should be informed of the importance of laboratory examinations to
confirm presence of offending organisms and chemical toxicity.
5.11.2 Occupational Health and Safety
Workers, local and company, should protect themselves by observing and practicing occupational health
and safety during the hours of duty. The proponent through its vision shall subscribe to an active program
of pursuing a healthy, safe and environment-friendly operation.
Company guidelines on health and safety will be made clear to contractors and all employees during the
activities. An regular orientation/coordination/briefing for contractors may be implemented.
5.11.3 Risk Reduction Measures of Health Hazards
Operation Phase
During the operation phase, workers of the Sludge Disposal Project are most likely affected including the
drivers, distributors of sludge in the lahar area, supervisors and visitors.
The Sludge disposal contractors should be aware of the health risks (work accidents and infectious
diseases) that could occur during the mobilization phase and adopt measures to prevent these hazards.
Pathways in lahar areas should be in safe areas that will minimize road accidents. Workers should be
involved in protecting their own safety and avoid occupational accidents in the distribution of sludge in
designated areas.
Protection of Personnel from Chemical Hazards
Dust and Suspended Particulate Matter may increase in ambient concentrations during the distribution of
sludge in identified sites. These dust and particulate matter may be contaminated with microorganisms
(virus and bacteria) and chemicals (volatile gases, hazardous and non-hazardous wastes and heavy
metals).
During operation, there is the potential of heavy metals contamination. Chemical hazard places a big role
in the risk management. Occupational safety measures should be applied in the handling wastes. Workers
handling such wastes should be protected by using proper body coverings, hand gloves, boots and masks.
Appendix on heavy metals enumerates the agents involved, the health effects, monitoring criteria and
treatment.
Other air pollutants (NO2, SO2, and CO) from motor vehicles and machines may be low especially in
open areas but should still be avoided by adequate maintenance of sources.
5.11.4 Protection of Personnel from Physical Hazards
Exposure to direct sunlight and inability of one's body to release heat adequately can result to heat stress
and strokes. Exposures to heat should be limited by regular work shifts and breaks to allow the body to
handle and release heat better. Workers should be provided with shaded areas during break time to allow
rest from heat of the sun. Adequate supply of water and juices should be made available at all times.
Noise may be a small problem in open areas even when near to sources like motor vehicles or machinery.
However, in closed areas like maintenance, reduction of the noise at source is the most efficient action to
minimize it. Technology is available for solving many typical problems arising from the use of machinery
5-5
Manila Third Sewerage Project (MTSP)
Environmental Management Plan
either by structural and mechanical modifications or the use of mufflers, vibration isolators or enclosures.
Improved area planning to increase the distance between people and the noise source is possible. Restrict
the length of exposure to potentially hazardous levels by job rotation. Workers exposed to high levels of
noise should be aware of its adverse effects and should be educated in (a) the possible consequences of
excessive noise exposure; (b) the means of protection, e.g., ear plugs, earmuffs and /or helmets; and (c)
the limitations of these protective devices.
Odor is a common physical hazard in areas where wastes are actually located. But may extend to distant
surrounding communities. Engineering works in the sludge disposal area like covering of soil on top of
each layer will help mitigate the foul odor. Using cover sheets on top of wastes in trucks or making used
of enclosed receptacle to cover wastes may reduce the odor. Spillage during the transport of sludge along
the way should be avoided.
Good housekeeping to keep insects and rodents away from the wastes should also be implemented.
Furthermore, waste handlers can make use of facemask to minimize the offending odor.
5.11.5 Safety of Workers
With the development and operation of the Sludge Disposal Project, occupational accidents can happen.
Occupational health and safety measures have to be imposed to workers to avoid occupational accidents in
work areas. There should be a Safety Plan for the workers. All occupational injuries and accidents should
be documented, investigated, analyzed and reported. These records will be useful guides for workers in
preventing accidents in the future and at the same time to continuously improve the Safety Program.
The workers should encourage and motivated to observe safety practices while on duty. Installation of
posters, memos and billboards in all premises of the workplace will remind and warn workers on safety
measures in work areas. Workers should be provided with suitable clothing (helmet, masks, gloves and/or
boots) in areas where protection from accidents is needed. Workers should also be involved in protecting
their own safety and health.
It will be their responsibility to see to it that health supplies, like medicines, bandages, etc., that may be
needed to attend to emergency cases are available at all times. Annual report on health vital statistics and
profile should be submitted to the Department of Labor and Employment (DOLE). They should have
adequate supply of safe drinking water and sanitary toilet facilities to prevent the spread of infectious
diseases of the gastrointestinal tract. All diseases should be reported and treated immediately.
Immunization and/or medical prophylaxis should be given to workers in areas where endemic diseases are
present.
These can all be enveloped in an agreement with the workers/contractors which should also cover the
following:
The design and signage of the collection vehicles should conform to approved specifications
(including that required by the RA 6969 for the transport permit) that would eliminate spills and odor
emissions during the collection and transport of septage.
A one page addendum will be included in the haulage contract for the company carting the
septage/sludge to the lahar areas, noting the drivers and haulage company obligations pertaining
handling and applying the septage/sludge in accordance with the required application procedures and
constraints.
MWCI or their contracted consultants will undertake spot audits of the disposal areas to ensure
compliance with the conditions of the EMP and any other permits , licences or approvals associated
with disposing of the septage/sludge
5-6
Manila Third Sewerage Project (MTSP)
Environmental Management Plan
A letter of commitment will be required from all land holders and farmers stating that they will
accept the sludge/septage and that they will indemnify MWCI and LBP from any claims or
responsibilities arising from the application of septage/sludge on their farms and properties
Any spills resulting from the removal of septage from septic tanks must be cleaned immediately with
clean water and disinfectant.
Collection vehicles should be checked periodically for any leaks. The engine should be
maintained regularly to ensure perfect running conditions. Well-kept engines will have
efficient fuel consumption, lesser fume emissions and will last its life span. Major
breakdowns while on the road can also be prevented through proper maintenance.
Workers should be provided with Personal Protective Equipment (PPEs).
5.11.6 Health of the Workers
All applicant workers should undergo complete health examination prior to hiring to assure good physical
fitness at the start of work.. There should be annual health examination of workers of the Project.. There
should be adequate medical equipment/facilities that can be used to attend to primary medical cases and
emergencies of the employees. Telephones or any form of communication should be available in work
areas to be able to attend to emergencies immediately. Medical kits for emergency cases should be made
available at all times in work areas distant to the medical clinics.
5.11.7 Public Health
The proponent and contractors is responsible for the protection of the surrounding communities on health
hazard like accidents and injuries brought about by the Project. They should be informed of the Project
operations through meetings and seminars. They should also be informed on safety measures that the
Project operators are implementing in order to avoid health hazards.
5-7
Manila Third Sewerage Project (MTSP)
Environmental Management Plan
5.11.8 Biological Hazards
Biological hazards are risk factors common to both the Sludge disposal staff and surrounding residents.
Active cases of infectious diseases should be immediately treated to prevent further spread of cases.
Secondary data of health profile should be regularly gathered in the Project site and from the municipal
health office of the surrounding communities. This will be able to monitor the leading causes of deaths
and diseases and other health indices every year. Changes in disease pattern in the community will need
further investigation to determine the contribution of the Sludge Disposal Project to disease causation.
Health and environmental indices should be monitored annually to determine the health status of the
community.
As part of the over-all EMP, the guidelines for the disposal or re-use of septage for lahar reclamation and
make the lahar improve its productivity shall be prepared
5.12 ARCHAEOLOGICAL FINDINGS
In case of accidental archeological findings, the project management must make an effort to preserve a
potential archeological site by reporting it immediately to the National Museum. The National Museum
will appraise the site to protect a potential national patrimony. The project management will receive
guidance from the National Museum on how to manage such site.
As part of the over-all EMP, the guidelines for the disposal or re-use of septage for lahar reclamation and
make the lahar improve its productivity shall be prepared. As a guide for the interim the following
discusses the Guidelines for the application of septage and sludge to lahar-laden areas.
PREPARATION OF GUIDELINES FOR THE DISPOSAL OR REUSE OF SEPTAGE FOR
LAHAR RECLAMATION
The following guidelines are derived from regulations of the US Environmental Protection Agency for
disposal of domestic septage on non-public access sites (or sites where contact with public is minimal or
controlled). These could be incorporated into the environmental management plan.
General Guidelines
For the agricultural land cum lahar reclamation septage disposal (or reuse) environmental management
plan, the following general requirements should be incorporated:
1) Provisions for control of disease-causing organisms called pathogens and the reduction of the
attractiveness of the domestic septage to vectors like flies, rodents, and other potential disease-
carriers. Note that the processes that reduce the attractiveness to vectors also reduce the potential for
objectionable odors being generated and released.
2) Limits on application rates and restrictions on crop harvesting, animal grazing, and site access.
Limited application rates minimize the addition of pollutants and the potential for over application of
the fertilizer element nitrogen, hence protecting ground and surface water from contamination with
excess nitrogen. Restrictions on crop harvesting, animal grazing, and site access protect from contact
with pathogens while these are still potentially viable.
3) The information the party disposing the septage must collect, records that must be kept.
4) Provisions for the disposing party to notify the owner or lease holder of the land onto which the
domestic septage is applied about the crop and site restrictions that the land owner must obey. It is
5-8
Manila Third Sewerage Project (MTSP)
Environmental Management Plan
helpful that the septic tank pumper inform the land owner of how much of the crop's nitrogen
requirement was added by the applied domestic septage. By knowing how much of the crop's nitrogen
requirement was fulfilled through use of the domestic septage, the land owner can determine how
much additional nitrogen in the form of chemical fertilizer, if any, will need to be applied. Domestic
septage application rate requirements apply to each field site, adjusted to the nitrogen requirement for
the crop being grown.
Nitrogen Application Control
The allowable annual rate of applying domestic septage on safe sites (so-called non-public contact sites) is
determined by the nitrogen fertilization rate. Too much nitrogen application can contaminate the
groundwater. Over long periods, nitrates from domestic waste water can build up to high concentrations in
the groundwater. This is situation is associated with occurrence of methaemoglobinaemia (blue baby
syndrome) when nitrate-contaminated water is ingested by infants.
The maximum volume of domestic septage that may be applied to any site during a 365-day period should
therefore not exceed the amount of nitrogen required by the planned crop and the yield. This maximum
volume is calculated by the following formula, where Annual Application Rate is represented below by
AAR. This is based on EPA guidelines.
As an example, if 100 pounds of nitrogen per acre is required to grow a 100 bushel per acre crop of corn,
then the annual application rate of domestic septage is 38,500 gallons per acre.
The primary reason for this annual rate calculation is to prevent the over application of nitrogen in excess
of crop needs and its potential movement through soil to groundwater. The annual application rate formula
was derived using assumptions to make land application very workable for domestic septage haulers. For
example, fractional availability of nitrogen from land-applied domestic septage was assumed over a 3-year
period to obtain the "0.0026" factor in the annual application rate formula. Also, in deriving the formula,
domestic septage was assumed to contain about 350 mg/kg total nitrogen and 2.5% solids (about 1.4%
total nitrogen on a dry weight basis).
Records Keeping
The USEPA records requirements of the following information shall be maintained by the
proponent/contractor for a minimum period of 5 years:
· Application site location;
· Time and date of application;
· Applied area;
· Amount of septage applied;
· Crop grown in the land;
· Certification that the required pathogen and vector reduction requirements were carried out prior
to application.
Typical application rate is 380 m3 per hectare per year.
MWCI existing septage application rate in lahar-laden areas is 200 m3/ha/yr. Records of MWCI are
believed to be inadequate.
5-9
Manila Third Sewerage Project (MTSP)
Environmental Management Plan
Controlling Pathogens
Domestic septage must be managed so that pathogens (disease-causing organisms) are appropriately
reduced. There are two alternatives from which to choose in order to meet this requirement. The first
alternative (no treatment) and its restrictions are presented in Figure 1 below; the requirements of the
second option (pH of 12 for a minimum of 30 minutes) are listed in Figure2.
Note that both of the pathogen reduction alternatives impose crop harvesting restrictions. However, site
access controls are required unless the pH pathogen treatment alternative is used. Disposing party must be
required to inform the owner/operator of the land where the domestic septage has been applied about
these crop harvesting and site access restriction requirements. The applier of the domestic septage may be
required to certify that these conditions are met.
Figure 1.
Pathogen Reduction Alternative Without pH treatment
5-10
Manila Third Sewerage Project (MTSP)
Environmental Management Plan
Figure 2. Pathogen Reduction Alternative With PH Treatment
Controlling Disease Carrying Vectors
If the disposing party chooses pathogen reduction alternative 1 above (see Figure 1, i.e., land application
of the domestic septage without additional treatment) it should also be required to meet one of two vector
attraction reduction alternatives.
One of these alternatives is subsurface injection of the septage, the other is incorporation into the surface
of the soil within 6 hours. The requirements of these two vector attraction reduction alternatives are
discussed in Figure 3 below.
On the other hand, if the disposer chooses pathogen reduction alternative 2 (pH treatment as described in
Figure 2) it should also be required to meet the requirements of vector attraction reduction alternative 3,
also shown in Figure 3.
5-11
Manila Third Sewerage Project (MTSP)
Environmental Management Plan
Figure 3.
Vector Control Alternatives
Specific Guidelines for Septage Disposal on Farmlands/Lahar
More specific guidelines below could be prescribed as to when, where, and how much septage may be
applied to land. These are more stringent and represent the highest level of precaution.
Other restrictions to consider are as follows:
1. Septage may not be spread on land where frequent public access is likely to occur, such as near
schools and playgrounds. When applied to areas without vegetative cover, septage must be
incorporated into the soil within 8 hours.
2. Only septage that has been properly treated by lime stabilization may be land applied.
Stabilization is defined as raising the pH of the septage to at least 12 for a minimum of 2 hours.
3. Areas used for pasture land may not be grazed for 30 days following application of septage.
4. Vegetation or crops for animal feeding may not be harvested for 30 days following application of
septage.
5. Vegetables and fruits which come into contact with the soil surface may not be grown for a
minimum of 18 months following application of septage.
5-12
Manila Third Sewerage Project (MTSP)
Environmental Management Plan
6. No more than 500 pounds (convert to kilos) of nitrogen may be applied to each acre (convert to
hectares) in any 12 month period.
7. Septage may not be land applied within 3000 feet of any Class A water body. For surface waters
of lesser quality (except irrigation canals and ponds), a buffer zone of 200 feet must be
maintained. No buffer is required around irrigation waters that are located entirely on the land
application site
8. Septage may not be applied within 500 feet of any shallow public water supply wells, nor closer
than 300 feet to any private drinking water supply well.
9. At the time of septage application, a minimum of 24 inches of unsaturated soil above the ground
water table must be present.
10. Septage may not be applied during rain events when runoff might occur.
11. Septage application area must have buffer zones and stormwater management structures with a
capacity to hold runoff during flash floods. Rules may require on-site facilities for storing septage
during periods of poor weather and equipment failures.
12. The slope of the land application area may not be more than eight percent and a layer of
permeable soil at least two feet thick should cover the surface.
13. Land used for septage application may not contain any hole or channel (such as subsurface
fractures, solution cavities, sink holes, or excavated core holes) which would allow the septage to
contaminate the groundwater. Also, septage may not be applied within a 200 foot buffer from
such geologic formations or features.
14. Septage may not be applied within 300 feet of any dwelling.
15. Septage may not be applied within 75 feet of the property boundary or any drainage ditches.
These are USEPA guidelines. The Philippines should prepare its own guidelines suitable to Philippine
conditions using this and those from other countries as reference.
5.13 PROJECT ALTERNATIVES
5.13.1 Project Sites
The identified application sites were ranked according to the following criteria:
1)
Remoteness of site
2)
Public access/site access
3)
Distance from rivers, streams, etc.
4)
Distance from groundwater wells
5)
Distance from residents
5.13.2 Septage Disposal Option
Studies conducted showed that the use of septage/sludge in lahar-laden areas as soil conditioner is an
alternative means for septage/sludge disposal. Sea dumping of septage has been proposed but these plans
have been suspended on environmental grounds and it is considered that this disposal option will most
likely not be adopted.
5-13
Manila Third Sewerage Project (MTSP)
Environmental Management Plan
Other septage disposal option is the use of incineration, but with the passage of the Clean Air Act that
prohibits the use of incineration, third option can not be used.
Another option , is the use of landfill. As of the moment, except for Cebu landfill that accepts treated
sludge (domestic and industrial) landfills are not available due to social acceptability problems. However,
with the strict implementation of the Solid Waste Management Act, it is forecasted that LGUs will
construct landfill and thus become available by 2006 to 2008.
Studies results showed that the use of septage/sludge as soil conditioner is the most feasible in terms of
cost, process or methods, and technology. The negative impacts can be addressed by the recommended
mitigation measures. For the interim period and until there is available lahar areas, sludge/septage disposal
may be the alternative MWCI may use.
5.13.3 Septage Transport Option
As an alternative to the transport of untreated septage by tankers would be to pump the septage to the lahar
areas through a high-pressure pipeline. The length of the pipeline would be about 80 km with a diameter
of 200 mm. A receiving/pump station would have to be constructed at the start of the pipeline, including
provision for septage storage, screening and degritting equipment. Along the pipeline route, several
booster pump stations would be required at approximately 10 km intervals. At the end of the pipeline, a
loading facility would transfer the septage to tankers, which in turn would transport the septage to the
lahar areas.
5.13.4 Septage Treatment Option
As an alternative to the disposal of untreated septage, it could be dewatered and transported to the lahar
areas by truck. A dewatering facility would be put up and would include screening and degritting of the
raw septage, and secondary treatment of the filtrate to a standard suitable for discharge to watercourses.
The dewatering of septage prior to final disposal would also open up other alternatives, such as use on
agricultural areas as a soil conditioner, or disposal in sanitary landfills.
5-14
Manila Third Sewerage Project (MTSP)
Environmental Management Plan
5.14 EMP TABLES
Environmental Management Plan
Potential Socio-
Proposed Mitigation Measures
Institutional
Cost
Timing
Environmental Impacts
Responsibilities
Estimates
Possible contamination of
Select and manage the sites for septage/sludge disposal in
Wastewater Department of
0
Prior to application of
surface or ground waters, and
accordance with the following specific criteria:
MWCI
any septage/ sludge
direct and indirect health risks.
and throughout
1) Unstabilized sludge/septage may not be applied in areas
operations
frequented by the public, unless the sludge/septage was
properly treated by lime stabilization.
2) Stabilized septage/sludge can be left on the surface of
the soil, unless applied to soil without any vegetative
cover in which case it must be incorporated into the soil
within 8 hours of application.
3) Septage/sludge shall not be applied to land covered with
rainwater runoff flows or inundated with floodwater at any
time. At such times, the septage/sludge must either be
stored at the STP/SPTP, applied to higher land
elsewhere in the disposal area or stored at an identified
area for later application.
4) Areas used for pasture may not be grazed for 30 days
following application of any septage/sludge.
5) Vegetation or crops for animal feeding may not be
harvested for 30 days following application of septage.
6) Vegetables and fruits which are consumed raw, or
tobacco, shall not be grown on land to which unstabilized
septage/sludge have been applied.
7) The application rate of septage/sludge shall be limited to
the lesser of (a) 400 kilos of nitrogen to each hectare in
any 12 month period, or (b) the nitrogen agronomic
uptake requirements of the crop.
8) Sludge/septage may not be land applied within (a) 50
meters of any Class A water body, (b) 10 meters for
other classes of water, (c) 10 meters of any shallow non-
potable water supply wells, and (d) 30 meters for any
5-1
Manila Third Sewerage Project (MTSP)
Environmental Management Plan
Potential Socio-
Proposed Mitigation Measures
Institutional
Cost
Timing
Environmental Impacts
Responsibilities
Estimates
potable water supply well. No buffer is required around
irrigation waters that are located entirely on the land
application site.
9) At the time of septage/sludge application, a minimum of
600 millimeters of unsaturated soil above the ground
water table must be present.
10) Unstabilized septage/sludge applied during rain events
must be immediately incorporated into the soil, rather
than waiting up to 8 hours.
11) The slope of the land application area may not be more
than eight percent.
12) Land used for septage/sludge application may not
contain any hole or channel (such as subsurface
fractures, solution cavities, sink holes, or excavated core
holes) which would allow the septage/sludge to
contaminate the groundwater, unless the septage/sludge
is not applied within a 30 meter distance from such
geologic formations or features.
13) Septage/sludge may not be applied within 30 meters of
any dwelling located outside the property boundary. A 10
meter buffer applies to any dwellings located within the
individual landholding or within the property boundary or
any drainage ditches.
14) Site selection must account for any archeological
artifacts
Monitoring of Water Quality:
P100,000/yr
15) Select suitable existing water wells in the location of the
proposed disposal area that can be used for groundwater
quality monitoring. Wells should be suitably sealed form
surface water inflow or other sources of contamination.
This applies to both the extensive agricultural lands and
the lahar areas.
16) The wells must source their groundwater from the same
hydrogeological formation as the groundwater under the
5-2
Manila Third Sewerage Project (MTSP)
Environmental Management Plan
Potential Socio-
Proposed Mitigation Measures
Institutional
Cost
Timing
Environmental Impacts
Responsibilities
Estimates
proposed disposal area. Select one well located
hydrogeologically upstream of the disposal area and two
wells downstream of the main disposal areas.
17) If wells cannot be located that satisfy the
hydrogeological, location and operational requirements,
then purpose-built sampling wells must be installed.
These should be equipped with a sealed collar and
lockable caps to prevent tampering. They must be slotted
to the same depth as the groundwater resource most
likely to be used locally as a water supply resource either
now or in the future.
No disposal area for
Septage/sludge shall only be applied during the fallow or
Hauling contractors,
P50,000/yr
Prior to application of
inappropriate periods of the
planting seasons when the septage/sludge can be
Wastewater Department of
any septage/sludge
cropping cycle
incorporated into the soil within 8 hours, if unstabilized.
MWCI
and throughout
Septage/sludge will have to applied to lahar soils without
operations
crops or stored in an appropriate stockpile area.
-
The stockpile area/s must be protected against the
entry of stormwater runoff by constructing bunds
around upslope perimeter of the stockpile area.
-
The area must not be flood-prone
-
The area must have all weather access roads
-
The site should have a separate stockpiling for small
quantity of stabilized sludge. This stabilized
sludge/septage shall be applied as a temporary cover
material to the main stockpile which will contain a
mixture of stabilized and unstabilized septage/sludge.
This stabilized layer will limit odor emissions and also
pathogen washoff and erosion.
-
If the stockpile is going to be remain in place for more
than 30 days, it should be covered with a 300
millimeter thick layer of soil to limit water infiltration,
odor migration and also rodent access.
-
Areas with existing vegetative cover are preferred as
this reduces the likelihood of runoff and provides an
uptake pathway for the nitrogen and other nutrients
5-3
Manila Third Sewerage Project (MTSP)
Environmental Management Plan
Potential Socio-
Proposed Mitigation Measures
Institutional
Cost
Timing
Environmental Impacts
Responsibilities
Estimates
Health risks for workers involved 1) Undertake proper training and education of truck drivers,
Hauling contractors,
P50,000/yr
Prior to application of
in septage/sludge handling,
operators of applicator equipment and other personnel
Wastewater Department of
any septage/sludge
transport, and disposal
involved in septage/sludge handling, transport and
MWCI
and throughout
disposal on the potential health issues
operations
2) Use of suitable PPE, such as gloves, coveralls and masks
Health risks for farm workers
Undertake proper training and education on the potential
Local farmers/landholders,
P50,000/yr
Prior to application of
health issues
Hauling contractors,
any septage/sludge
Wastewater Department of
and throughout
MWCI
operations
Complaints from surrounding
1)
Preference to be given to remote locations
Local farmers/landholders,
P50,000/yr
Prior to application of
residents due to lack of
2)
Preference to be given to disposal sites closest to
Hauling contractors,
any septage/sludge
awareness on the proposed
major and/or sealed roads to minimize haulage
Wastewater Department of
and throughout
activities, possible health
disturbances, such as dust and noise, to rural communities MWCI
operations
impacts, dust and other
located along haulage routes
inconveniences.
3)
Provide public notices to inform/update residents of
the period of septage/sludge disposal, and the
management procedures and interventions proposed.
Spillage of septage/sludge in the 1) As much as possible, haul only dewatered or dried
Hauling contractors,
0
Prior to application of
event of vehicle accidents
septage/sludge
Wastewater Department of
any septage/sludge
2) Implement a scheme of contacting and then diverting
MWCI
and throughout
empty return vehicles to collect and re-haul any spillages
operations
resulting from a vehicle accident. For wet spillage on
roads, implement methods to absorb spilled material like
use of saw dust. Make this a part of the private hauling
company's contract.
Excess septage/sludge
1) Review and update the site allocation program for the
Wastewater Department of
0
Prior to application of
stockpiles awaiting disposal
septage/sludge applications
MWCI, Landholders/farmers,
any septage/sludge
2) Focus on maximizing applications to the extensive
Hauling contractors
and throughout
agricultural areas such as the sugar cane farms in fallow
operations
periods and/or during the planting season
3) Prepare the receiving area in the lahar areas (for use
during the sugar cane growing season or protracted wet
weather )well ahead of the cessation of the planting
season
Septage/sludge application
1) Keep comprehensive records of septage/sludge
Wastewater Department of
Contingency Prior to application of
resulting in surface or ground
application details and data such as:
MWCI, Hauling contractors only
any septage/sludge
5-4
Manila Third Sewerage Project (MTSP)
Environmental Management Plan
Potential Socio-
Proposed Mitigation Measures
Institutional
Cost
Timing
Environmental Impacts
Responsibilities
Estimates
water pollution or soil
-
Location of application, including the area involved
and throughout
contamination as determined
-
Date of application
operations
by the monitoring program
- Amount
applied
-
Source of septage/sludge
-
Crop status/part of planting cycle at time of application
-
Time of incorporation into the soil
-
Weather at time of application
2) Maintain records of environmental monitoring and any
As necessary
environmental reports for a period of at least 5 years.
3) Prepare and maintain a database of monitoring data
results.
4) Increase the intensity and extent of monitoring to confirm
the apparent elevation of results
5) Delineate the size of the area with contaminated
surface/ground water or soil
6) Review septage/sludge application rates
7) Accelerate the covering of septage/sludge with soil
8) Use flatter areas for septage/sludge application
9) Increase the testing required on the septage/sludge for
the pollutants exceeding the adopted water quality
criteria. For example, if the pollutant of concern is lead,
then increase the lead testing frequency to better
determine the lead source and manage the pollutant at
source.
10) Incorporate runoff collection impoundments below the
application areas to trap any septage/sludge in the runoff
11) Increase the separation distance requirements between
application areas and surface water systems
Septage/sludge applications
1) Increase the intensity and extent of monitoring to confirm Wastewater Department of
Contingency As necessary
resulting in crop contamination
the apparent increase in results
MWCI, Hauling contractors, only
as determined by the monitoring 2) Delineate the size of the area with contaminated crops
Landholders/farmers
program
3) Review the sludge application rates for the crop, and
decrease as appropriate based on the monitoring
program results and parameters of concern.
4) Determine if the pollutant can be isolated, removed or
reduced in the septage/sludge
5-5
Manila Third Sewerage Project (MTSP)
Environmental Management Plan
Potential Socio-
Proposed Mitigation Measures
Institutional
Cost
Timing
Environmental Impacts
Responsibilities
Estimates
5) Determine the source of the contaminated
septage/sludge and only apply to the fallow lahar areas
until the contaminants can be reduced to suitable levels
Excessive odor migrating offsite 1) Increase the depth of incorporation of the septage/sludge Wastewater Department of
0 As
necessary
into the soil profile
MWCI, Hauling contractors,
2) Incorporate the septage/sludge into the soil more quickly landholders/farmers
Negative impact on community
1) Determine the nature of the health impact
Wastewater Department of
Contingency As necessary
health
2) Conduct a qualitative epidemiological study to determine MWCI
only
if the septage/sludge application is the actual source of
the morbidity
3) Determine the exposure pathway involved and apply
appropriate interventions to intercept this pathway
4) Ensure that public access is being limited as required
5) Consider only using stabilized septage/sludge in this
area
Negative health impacts on site 1) Determine the nature of the health impact
Wastewater Department of
Contingency As necessary
workers
2) Conduct a qualitative epidemiological study to determine MWCI, Hauling contractors, only
if the septage/sludge application is the actual source of
landholders/farmers
the morbidity
3) Determine the exposure pathway involved and apply
appropriate interventions to intercept this pathway
4) Improve training for staff to better understand the health
risks of septage/sludge, and the need for appropriate
health protection
5) Provide better safety equipment as required, such as
PPE upgrades
6) Consider only using stabilized septage/sludge in this
area
Excessive vermin reported
1) Increase the depth of incorporation into the soil profile
Wastewater Department of
Contingency As necessary
2) Incorporate the septage/sludge into the soil more quickly MWCI, Hauling contractors, only
3) Only apply the stabilized sludge in the area if vermin
landholders/farmers
complaints continue
Damage to truck access/exit
1) Cooperate with local government on road maintenance
MWCI Contingency
As necessary
roads
program
only
2) Seek alternative access roads designed to handle loaded
trucks
5-6
Manila Third Sewerage Project (MTSP)
Environmental Management Plan
Potential Socio-
Proposed Mitigation Measures
Institutional
Cost
Timing
Environmental Impacts
Responsibilities
Estimates
3) Seek alternate disposal areas if alternate access roads
cannot be located
4) Reduce vehicle weight as a last resort
5-7
Manila Third Sewerage Project (MTSP)
Environmental Management Plan
5.15. ENVIRONMENTAL MONITORING PLAN
Location
Parameters to be Monitored
Measurements (1) Frequency
Responsibility
Cost
(2)
Estimates
Downstream of
Turbidity of stormwater runoff
Visual only
Every major rain event
Wastewater
0
selected disposal
Department of
and stockpile sites
MWCI
Downstream of
Suspended Solids in stormwater
Filtration
Every major rain event, but only if
Wastewater
P1,500 / site
selected disposal
runoff
the visual monitoring for turbidity
Department of
per event
and stockpile sites
consistently indicates that
MWCI
excessive suspended solids are
washed off from the site, or if
complaints continue after
implementing all the actions listed
in the EMP
5-8
Manila Third Sewerage Project (MTSP)
Environmental Management Plan
Location
Parameters to be Monitored
Measurements (1) Frequency
Responsibility
Cost
(2)
Estimates
Soil at selected
Analyze two samples from each soil Standard soil scientific Annual, but starting at least one
Wastewater
P50,000/site/yr
disposal and control profile type: one within the
methods acceptable
year after the first septage/sludge
Department of
sites
septage/sludge disposal areas and
to the Department of
application
MWCI
a control site remote from the
Agriculture
disposal area for the following
parameters:
·
Textural analysis
·
PH
·
Sodium Adsorption Ratio (1:5
soil/water mix)
·
Calcium/Magnesium Ratio (1:5
soil/water mix)
·
Exchangeable Cations
·
Total Cations
·
Specific Conductance or electrical
conductivity
·
Total Manganese
·
Total Nitrogen
·
Phosphorus (extractable)
·
Potassium (available)
·
Potassium (extractable)
·
Total Calcium (exchangeable)
·
Total Chloride
·
Total Magnesium (exchangeable)
·
Total Sodium (exchangeable)
·
Heavy Metals scan
Crops at selected
Analyse two plant tissues: one
Standard agronomic
Annual, but starting at least one
Wastewater
P7,500 / site/yr
disposal and control within the septage/sludge disposal
methods acceptable
year after the first septage/sludge
Department of
sites
areas and a control site remote from to the Department of
application
MWCI
the disposal area for presence of
Agriculture and DENR
pathogens
5-9
Manila Third Sewerage Project (MTSP)
Environmental Management Plan
Location
Parameters to be Monitored
Measurements (1) Frequency
Responsibility
Cost
(2)
Estimates
Groundwater from
1) Select two sampling wells
DAO 34/35
Quarterly, but if elevated levels are Wastewater
P25,000 / site
upstream and
downstream of the disposal
detected then more frequent tests
Department of
per event
downstream of
and/or stockpile areas in each
will be required. Sampling
MWCI
selected disposal
soil profile
frequency will be adjusted based
and stockpile sites
2) Select one sampling wells
on monitoring results.
upstream of the disposal and/or
stockpile areas to act as a
control
Test samples for the ffg. water
quality characteristics:
·
Total nitrogen (as N)
·
Nitrate nitrogen (as N)
·
Nitrite nitrogen (as N)
·
Total Kjeldahl nitrogen (as N)
·
Ammonia nitrogen (as N)
·
Total phosphorus (as P)
·
Chloride
·
Electrical conductivity or total
dissolved solids
·
PH
·
Total coliforms (cfu)
·
Faecal coliforms
·
Heavy Metals
5-10
Manila Third Sewerage Project (MTSP)
Environmental Management Plan
Location
Parameters to be Monitored
Measurements (1) Frequency
Responsibility
Cost
(2)
Estimates
Surface water from Select one sampling location
DAO 34/35
Quarterly, but if elevated levels are Wastewater
P25,000 / site
upstream and
downstream of the disposal and/or
detected then more frequent tests
Department of
per event
downstream of
stockpile areas in each soil profile
will be required. Sampling
MWCI
selected disposal
Select one sampling location
frequency will be adjusted based
and stockpile sites
upstream of the disposal and/or
on monitoring results
stockpile areas to act as a control
Test samples for the ff. water quality
characteristics:
-
Total nitrogen (as N)
-
Nitrate nitrogen (as N)
-
Nitrite nitrogen (as N)
-
Total Kjeldahl nitrogen (as
N)
-
Ammonia nitrogen (as N)
-
Total phosphorus (as P)
- Chloride
- Electrical
conductivity
or
total dissolved solids
- PH
- BOD
- SS
- DO
-
Total coliforms (cfu)
- Faecal
coliforms
- Heavy
Metals
(1) The methodology for testing is per the relevant specifications listed/described in the DENR Administrative Orders 34/35. If the relevant methodology is not
specified therein, then the relevant methodology from the latest revision of "Standard methods for the Examination of Water and Wastewater" by the USA
Water Environment Federation will be adopted.
5-11
Manila Third Sewerage Project (MTSP)
Findings and Recommendations
CONTENTS
PAGE
6.
FINDINGS AND RECOMMENDATIONS..................................................................................................... 6-1
i
Manila Third Sewerage Project (MTSP)
Findings and Recommendations
6. FINDINGS AND RECOMMENDATIONS
General conclusions on the study are as follows:
1. Sludge and septage can be used as soil conditioner, reclaim lahar-laden areas and enhance sugar
productivity. MWCI has already obtained registration from the Fertilizer and Pesticides Authority
(FPA).
2. The use of sludge and septage as soil conditioner for sugarcane growth is beneficial to the farmers
in terms of savings on fertilizer cost.
3. This project is sustainable since the sugarcane farms in the lahar-laden areas of Pampanga and
Tarlac spans a vast areas. The farmers are very insistent on their request to the hauling contractor
for sludge and septage.
4. Additional studies must be conducted on the use of biosolids as soil conditioner or fertilizer.
5. There is a need to formulate criteria and standards for biosolids management.
6. The recommended EMP and EMoP have to be strictly implemented for ongoing and future,
related activities.
7. Dewatering will reduce hauling costs. However the degree of dewatering has to be established
taking into consideration that septage, in raw form, is beneficial in that it increases the moisture
content of lahar-laden soil.
8. Pipeline transport of biosolids, as previously suggested is not economically feasible.
The following are the major findings and recommendations suggested on the project:
1)
Lahar is sandy and drains quickly, i.e. it does not retain water very well. Hence, there is the
risk that a portion of the applied liquid septage may drain past the root zone and carry the
nutrients such as nitrate and pollutants to the groundwater. During wet season, the poorly
structure, well-drained lahar may permit leaching of contaminants which were originally
retained in the root zone, down to the groundwater. Thus, nitrate level monitoring in
groundwater is recommended.
2)
Lahar is perceived to be poorly structured soil and prone to erosion. This could lead to
potential release of the applied biosolids. The stability and erodibility of lahar needs to be
reviewed, and necessary measures to improve soil structure and stability identified and
implemented.
3)
The operation of MWCI's wastewater treatment and septage collection facilities will generate
up to about 450 m3 of biosolids that can be reused as soil conditioner, as well as reclaim the
lahar-laden areas and enhance sugar productivity in application areas.
4)
There is a potential of pollutants to be introduced into the surface and groundwater resulting
to increase in concentration of heavy metals in from the application of septage/sludge in the
lahar-affected areas. However, results of studies for the Metro Manila septage based from
samples analyzed showed that the probability of phytotoxicity and potential hazards posed on
humans and animals is low and do not contain significant quantities of heavy metals. Results
for chromium, lead, zinc and cadmium in sewage are all within the pollutant limits set by
6-1
Manila Third Sewerage Project (MTSP)
Findings and Recommendations
USEPA for land application of sewage sludge. Baseline data for surface and groundwater
quality in the project area has to be supplemented and well-documented.
5)
The transport, handling and application of septage may result in the generation of dust, odor
and noise levels that are significant, but temporary except for dust. Water sprinkling should be
done to reduce fugitive dust. There may be slowing down of traffic movement resulting from
an increase in the number of transport trucks. Although these effects are considered nuisance,
these shall be regularly monitored as shown in the EMoP.
6)
Septage and sludge contain nutrients and organic matter beneficial to growing crops that
include nitrogen, phosphorus, potassium, and other essential plant nutrients.
7)
The current transport and hauling of septage to Pampanga entails significant operating costs
primarily due to the excessive amount of liquid in the septage being transported. MWCI
provided the present average cost of hauling septage from Philam and Diego Silang holding
tanks and disposal to Pampanga per m3 is PhP 330.00, while the labor cost for septage
collection per shift (2 shifts) is PhP 1,363.00. Private hauling contractors collect and transport
the septage from Philam and Diego Silang holding tanks to Pampanga and Tarlac using trucks
with capacities ranging from 16 to 25 m3. Each truck makes 2 round trips per day. The total
hauling cost per shift range from PhP 6,643.00 to PhP 9,613.00. With 2 shifts per day that s
equivalent to a minimum cost of PhP 13,286.00 to a maximum of PhP 19,226.00 per truck per
day. The hauling costs can be reduced if excess liquid is removed prior to disposal thereby
reducing the volume of septage required for transport.
8)
Dried and liquid sludge have been proven to be effective in improving the productivity of soil
for agricultural purposes. MWCI obtained temporary registration for both types of sludge to
be used as soil conditioner from FPA. Permanent registration has also been obtained for the
use of sludge as soil conditioner. This required the conduct of follow-up experiments which
gave positive results.
9)
MWCI shall conduct additional studies to determine the efficiency of septage as soil
conditioner or fertilizer. This can be developed as an alternative means for septage and sludge
disposal. Even as septage treatment plants are to be constructed, the biosolids generated as a
result of the septage treatment process needs to be disposed.
10)
Pipeline transport of biosolids to reuse/disposal sites can reduce the transport costs and the
risks arising from trucking operations. However, analyses show that the cost for the pipeline
transport infrastructure are expected to be significant. Therefore, pipeline transport is not
recommended for implementation as part of the biosolids management option
11)
Lahar flows covered about 120,000 hectares with sediment to an average depth of about one
meter, and floods spread rock debris over an area at least several times larger. The total
demand for septage and sludge may be estimated by relating the total land area deposited with
lahar and the optimum application rate (80-120 m3/hectare/year). This roughly estimates the
demand for septage to range from 9.6 million m3/year to 14.4 million m3/year.
12)
Application of septage and sludge to lahar areas is unique in the world and new to the
Philippines. While results of experiments show that this activity enhances sugarcane growth
and yields indicating the potential as an indigenous fertilizer material and soil conditioner,
there is a need to formulate standards for biosolids management. The Philippines has to
develop criteria and standards in biosolids management so that stricter and applicable
performance requirements for biosolids treatment can be enforced. Such guidelines shall
include the determination of the limits on application rates (agronomic rate) and restrictions
on crop harvesting, among others.
6-2
Manila Third Sewerage Project (MTSP)

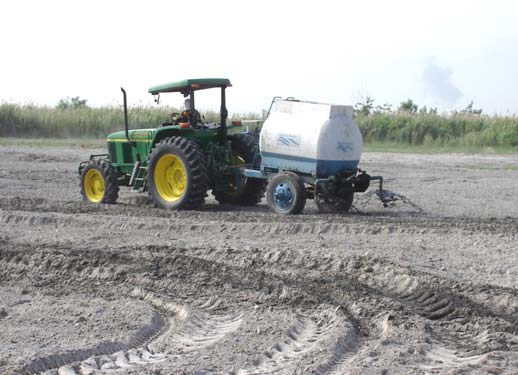

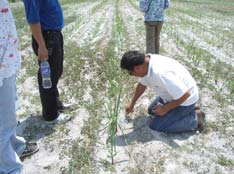

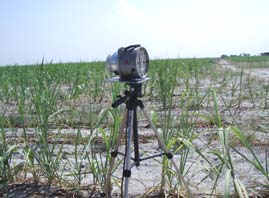


ENVIRONMENTAL ASSESSMENT
FOR SLUDGE/SEPTAGE-USE AS SOIL
CONDITIONER FOR SUGAR CANE
GROWTH IN LAHAR-LADEN AREAS
Prepared by:
Prepared for:
7th Floor, CLMC Building, 259-269
EDSA, Greenhills, Mandaluyong City
Since 1955
in association with
Metropolitan Waterworks and Sewerage System (MWSS)
Ground Floor, MWSS Bldg., Katipunan Road, Balara, Quezon City
Lichel Technologies, Inc.
Unit 1910 Antel Global Corporate Center
#3 Dońa Julia Vargas Avenue
Ortigas Center, Pasig City
and
TABLES, FIGURES AND ANNEXES
Rm. 1021, 10/F Cityland Shaw Tower
St. Francis Street cor. Shaw Blvd., Mandaluyong City

LIST OF FIGURES
Metropolitan Waterworks and Sewerage System
FIGURE 2 - 1.
LOCATION MAP OF THE SEPTAGE/SLUDGE APPLICATION SITES (ANGELES, SAN FERNANDO AND
MEXICO..............................................................................................................................................1
FIGURE 2 - 2.
LOCATION MAP OF THE SEPTAGE/SLUDGE APPLICATION SITES (PORAC, PAMPANGA) ......................2
FIGURE 2 - 3.
LOCATION MAP OF THE SEPTAGE/SLUDGE APPLICATION SITES (FLORIDABLANCA) ..........................3
FIGURE 2 - 4.
LOCATION MAP OF THE SEPTAGE/SLUDGE APPLICATION SITES (CONCEPCION AND BAMBAN)..........4
FIGURE 2 - 5.
ROAD NETWORK AT THE APPLICATION SITES IN SAN FERNANDO, ANGELES AND MEXICO,
PAMPANGA.........................................................................................................................................5
FIGURE 3 - 1.
REGIONAL TECTONIC MAP.................................................................................................................6
FIGURE 3 - 2.
REGIONAL SEISMICITY MAP...............................................................................................................7
FIGURE 3 - 3.
GENERALIZED GEOLOGICAL MAP COVERING THE MOUNT PINATUBO AND THE SURROUNDING
AREAS ................................................................................................................................................8
FIGURE 3 - 4.
DEPOSIT FACIES ASSOCIATED WITH LAHARS FROM PIERSON AND SCOTT, 1985..................................9
FIGURE 3 - 5.
ESTIMATED PEAK HORIZONTAL GROUND ACCELERATION AMPLITUDE...........................................10
FIGURE 3 - 6.
ISOPACH MAP OF AIRFALL TEPHRA DURING THE 12-15 JUNE 1991 ERUPTIONS OF MT. PINATUBO .11
FIGURE 3 - 7.
MAP SHOWING LAHAR-COVERED AREAS (1991-95)........................................................................12
FIGURE 3 - 8.
SOIL SAMPLING STATIONS ...............................................................................................................13
FIGURE 3 - 9.
CLIMATE MAP OF THE PHILIPPINES ..................................................................................................14
FIGURE 3 - 10.
TROPICAL CYCLONE MAP OF THE PHILIPPINES ................................................................................15
FIGURE 3 - 11.
GROUNDWATER MAP (PROVINCE OF PAMPANGA) ...........................................................................16
FIGURE 3 - 12.
GROUNDWATER MAP (PROVINCE OF TARLAC).................................................................................17
FIGURE 3 - 13.
WELLS INVENTORIED AT THE APPLICATION SITES IN SAN FERNANDO, ANGELES AND MEXICO,
PAMPANGA.......................................................................................................................................18
FIGURE 3 - 14.
WATER, AIR AND NOISE SAMPLING STATIONS.................................................................................19
FIGURE 4 - 1.
MOUNT PINATUBO ANNUAL SEDIMENT DELIVERY ..........................................................................20
ANNEXES-FIGURES/11/11/2004
i
Manila Third Sewerage Project (MTSP)

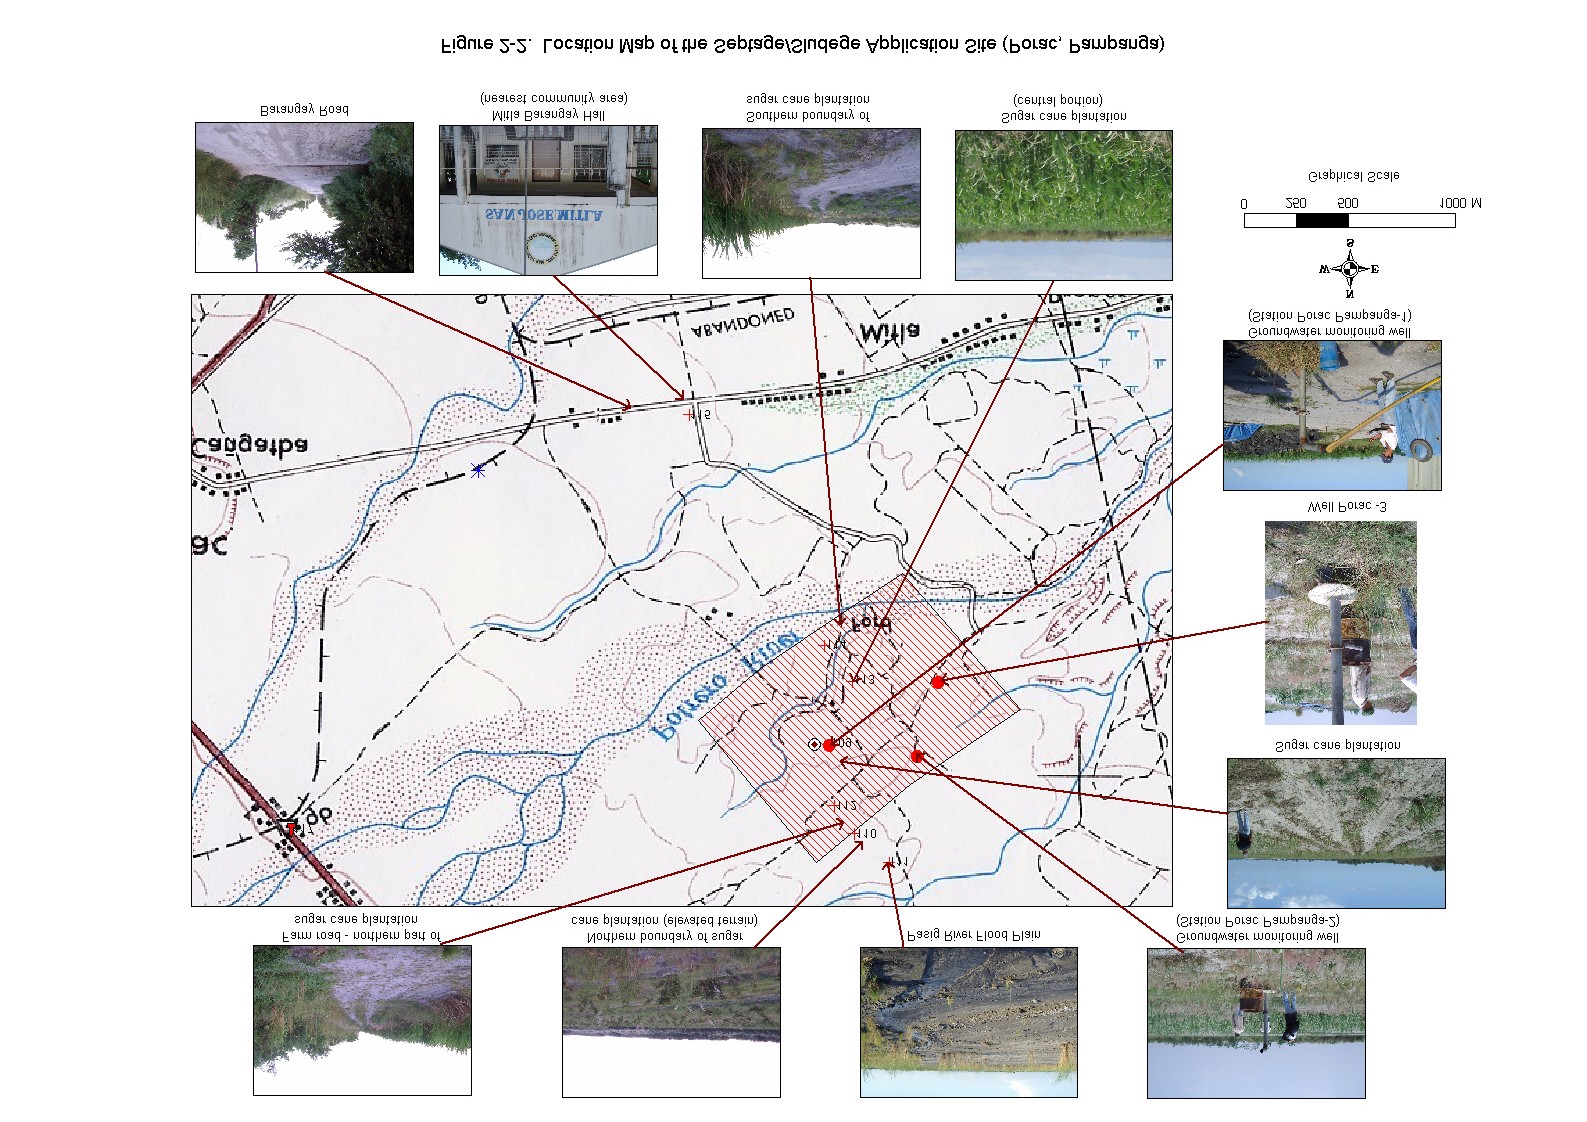
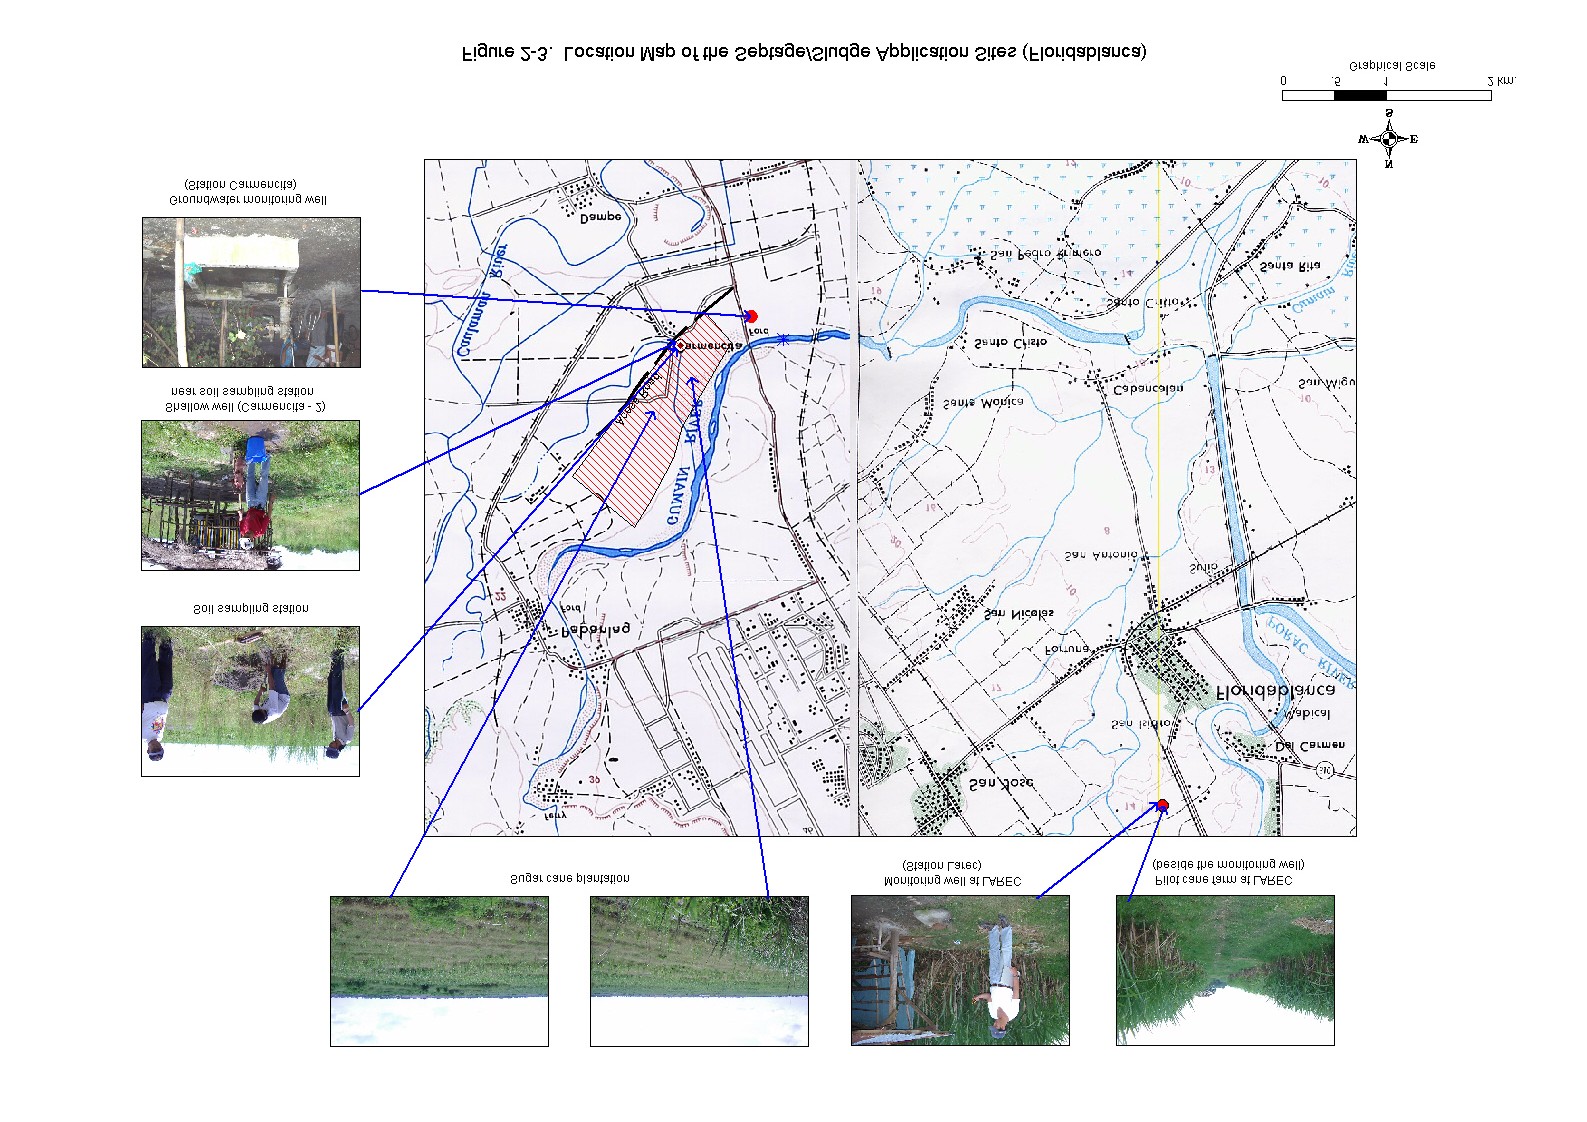
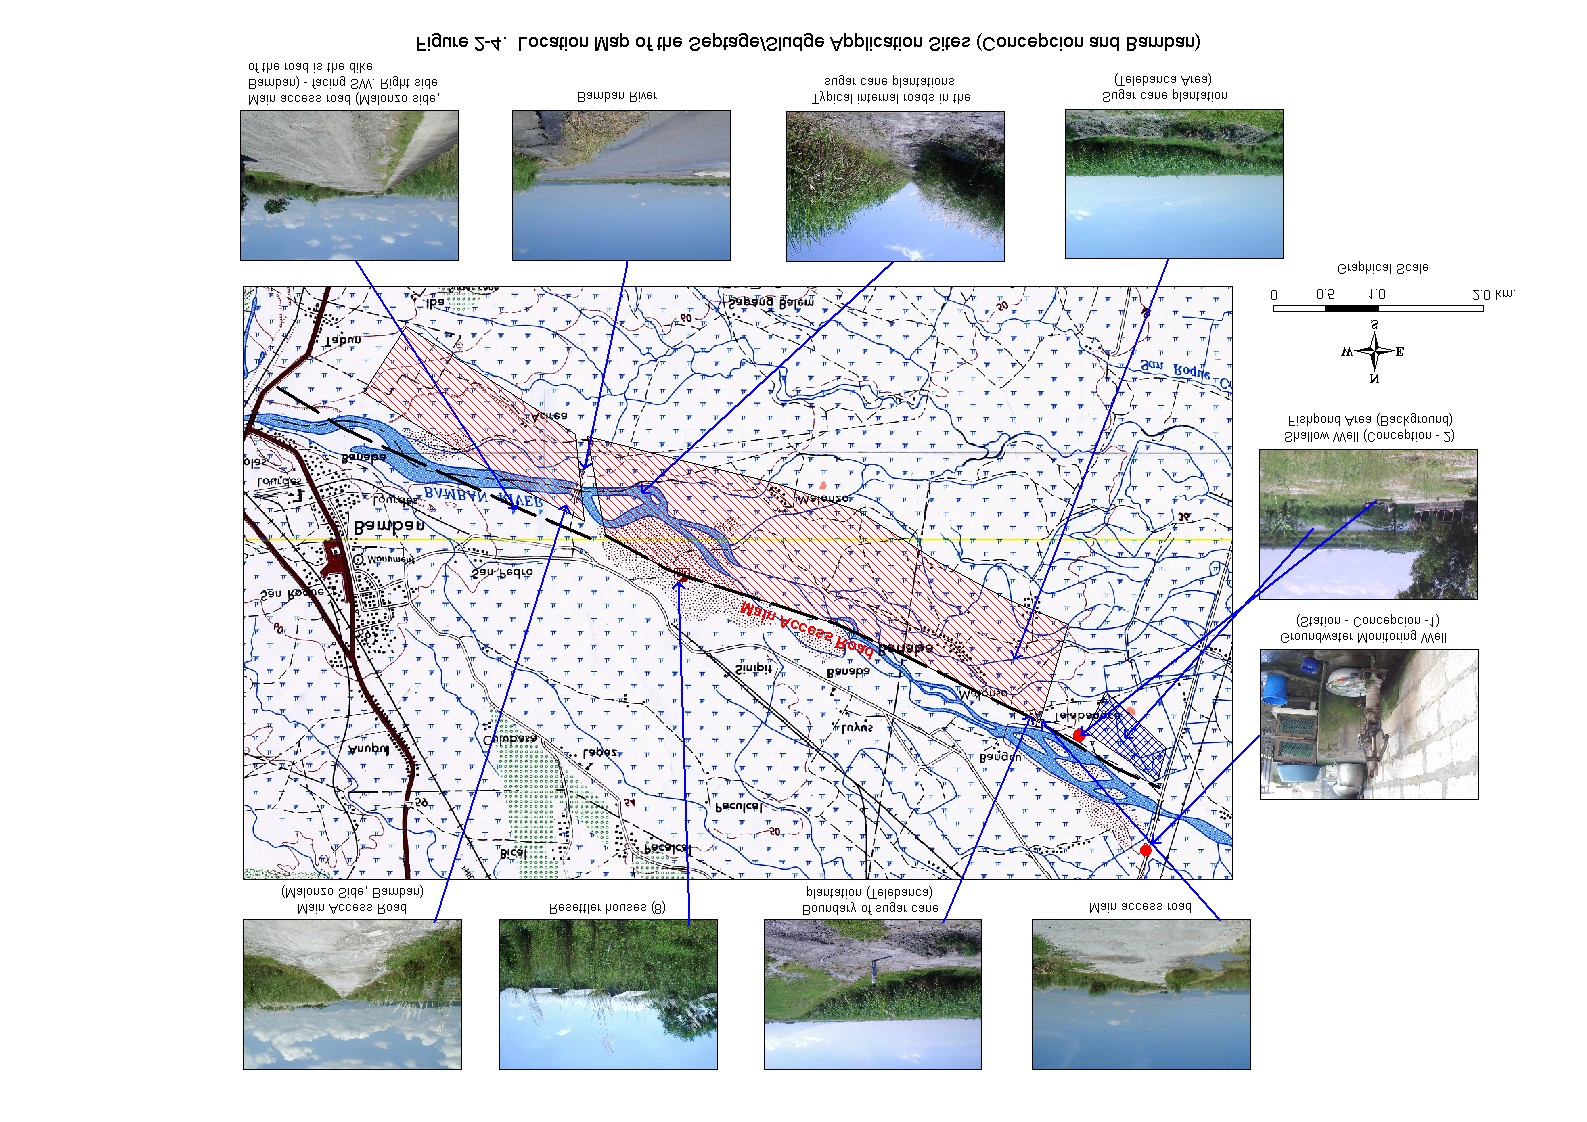
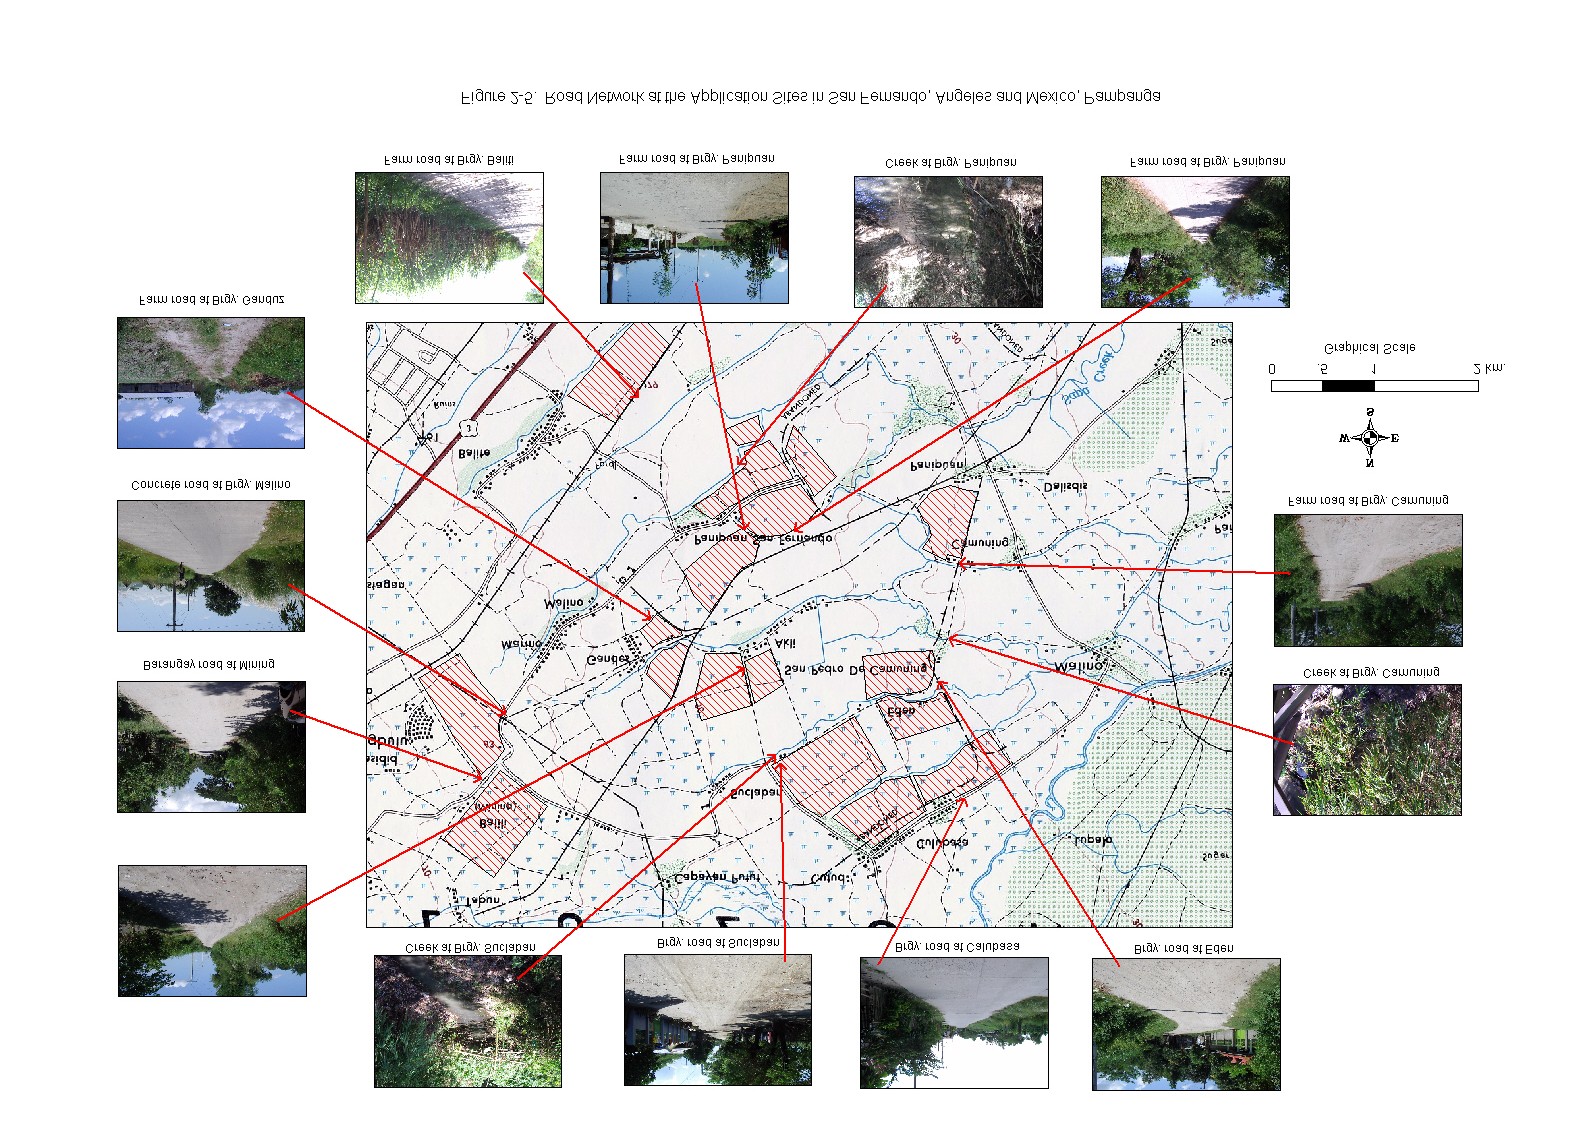
CH
EN
R
MANILA T
Adapted and modified from Nelson and others, 1999
Project Area =
FIGURE NO. FIGURE TITLE:
The Associated Firm: EDCOP
3-1
Regional Tectonic Map of Luzon Island
Lichel Technologies, Inc. and
ISSI
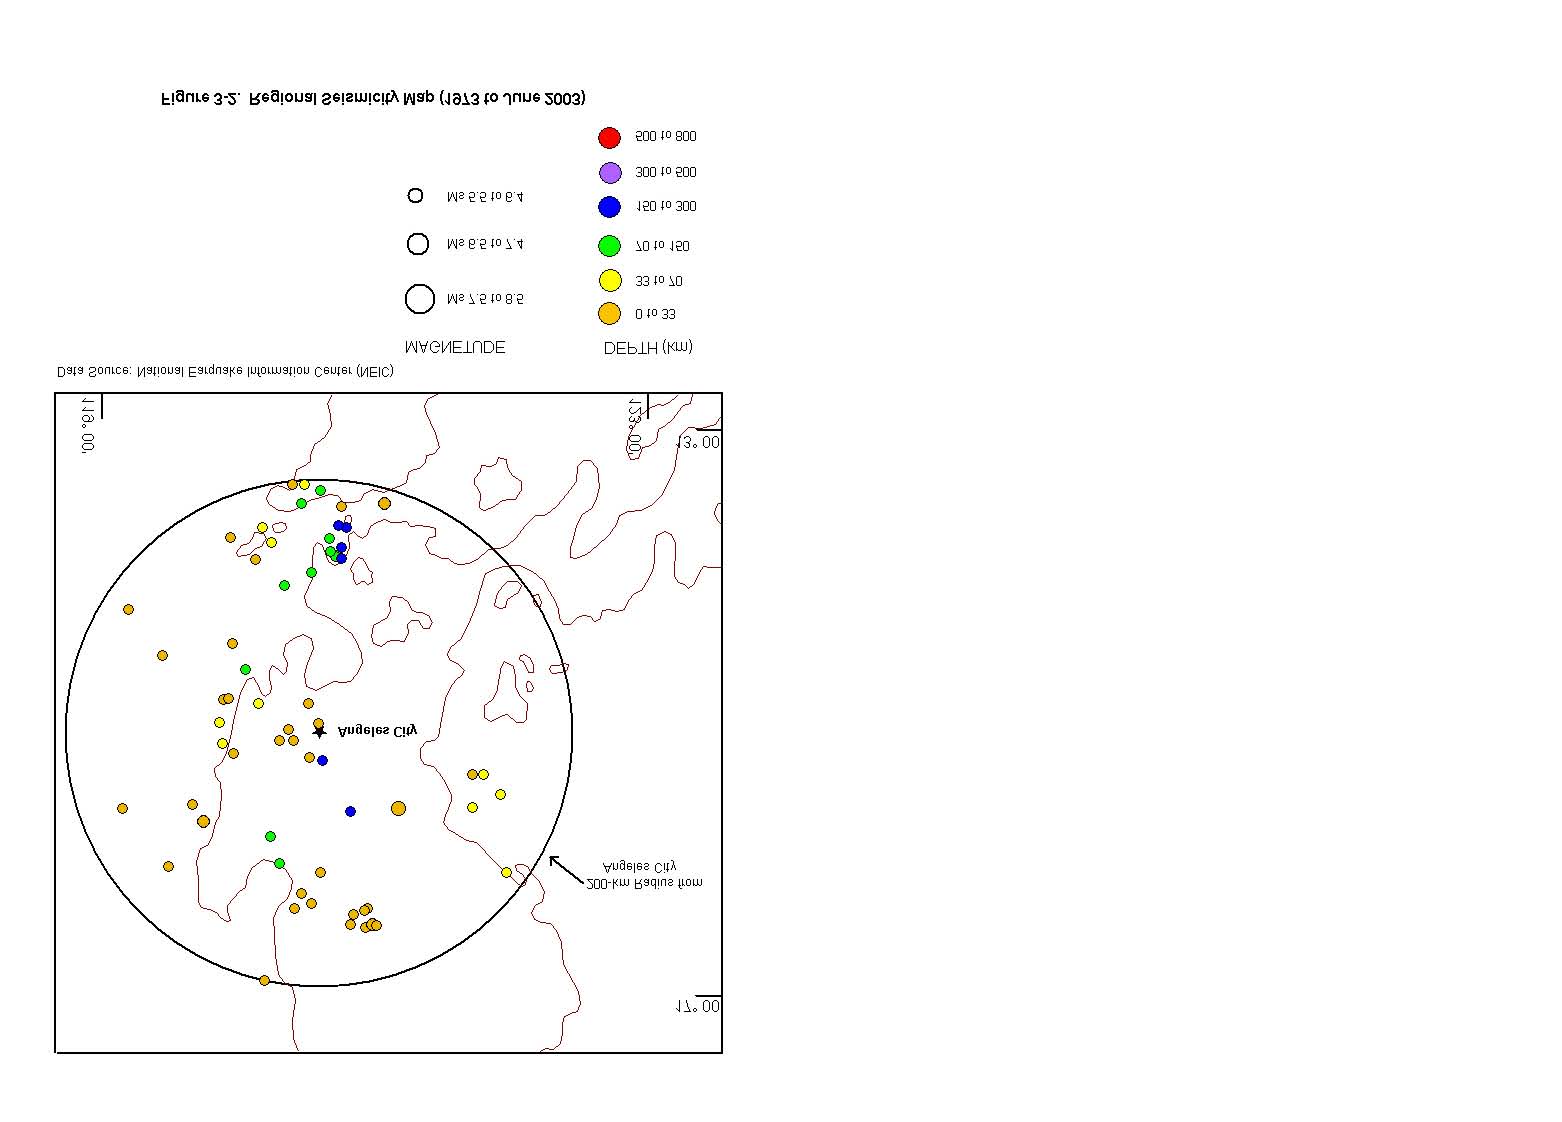
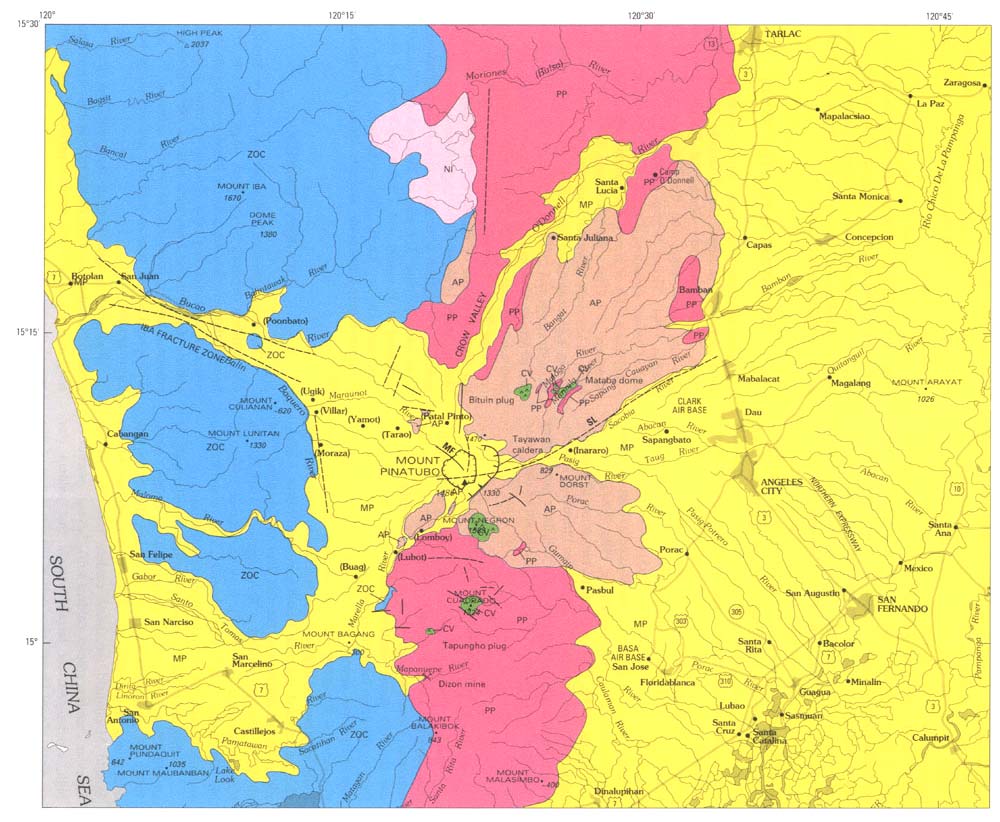
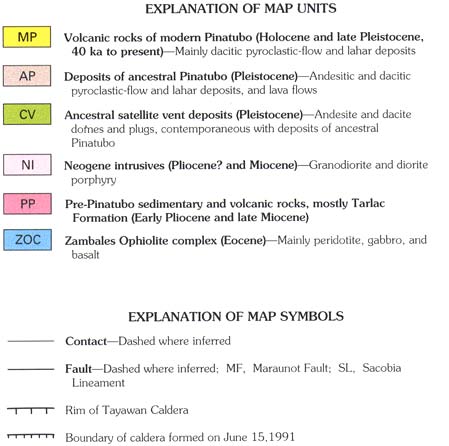
Figure taken from the report Eruptive History of Mount Pinatubo (Fire and Mud: Eruptions and Lahars of Mount Pinatubo,
Philippines, Christopher Newhall and Raymundo Punongbayan, Editors, 1996).
Project Area
FIGURE NO. FIGURE TITLE:
The Associated Firm:
Generalized Geological Map Covering the Mount Pinatubo and
EDCOP
3-3
the Surrounding Areas
Lichel Technologies, Inc. and
(after Philippine Bureau of Mines (1963) and Delfin (1983, 1984)
Inter-Structure Systems, Inc.
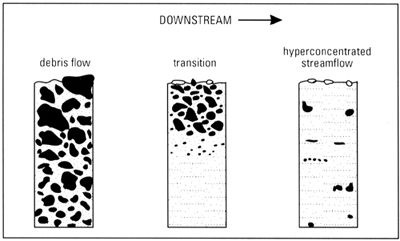

LIST OF FIGURES
Metropolitan Waterworks and Sewerage System
Figure 3 - 4.
Deposit facies associated with lahars from Pierson and Scott, 1985
ANNEXES-FIGURES/11/11/2004
9
Manila Third Sewerage Project (MTSP)
Source: International Institute for Aerospace Survey and Earth Sciences
FIGURE NO. FIGURE TITLE:
The Associated Firm: EDCOP
Isopach Map of Airfal Tephra during the 12-15 June, 1991
3-6
Lichel Technologies, Inc. and
Eruptions of Mt. Pinatubo
Inter-Structure Systems, Inc.
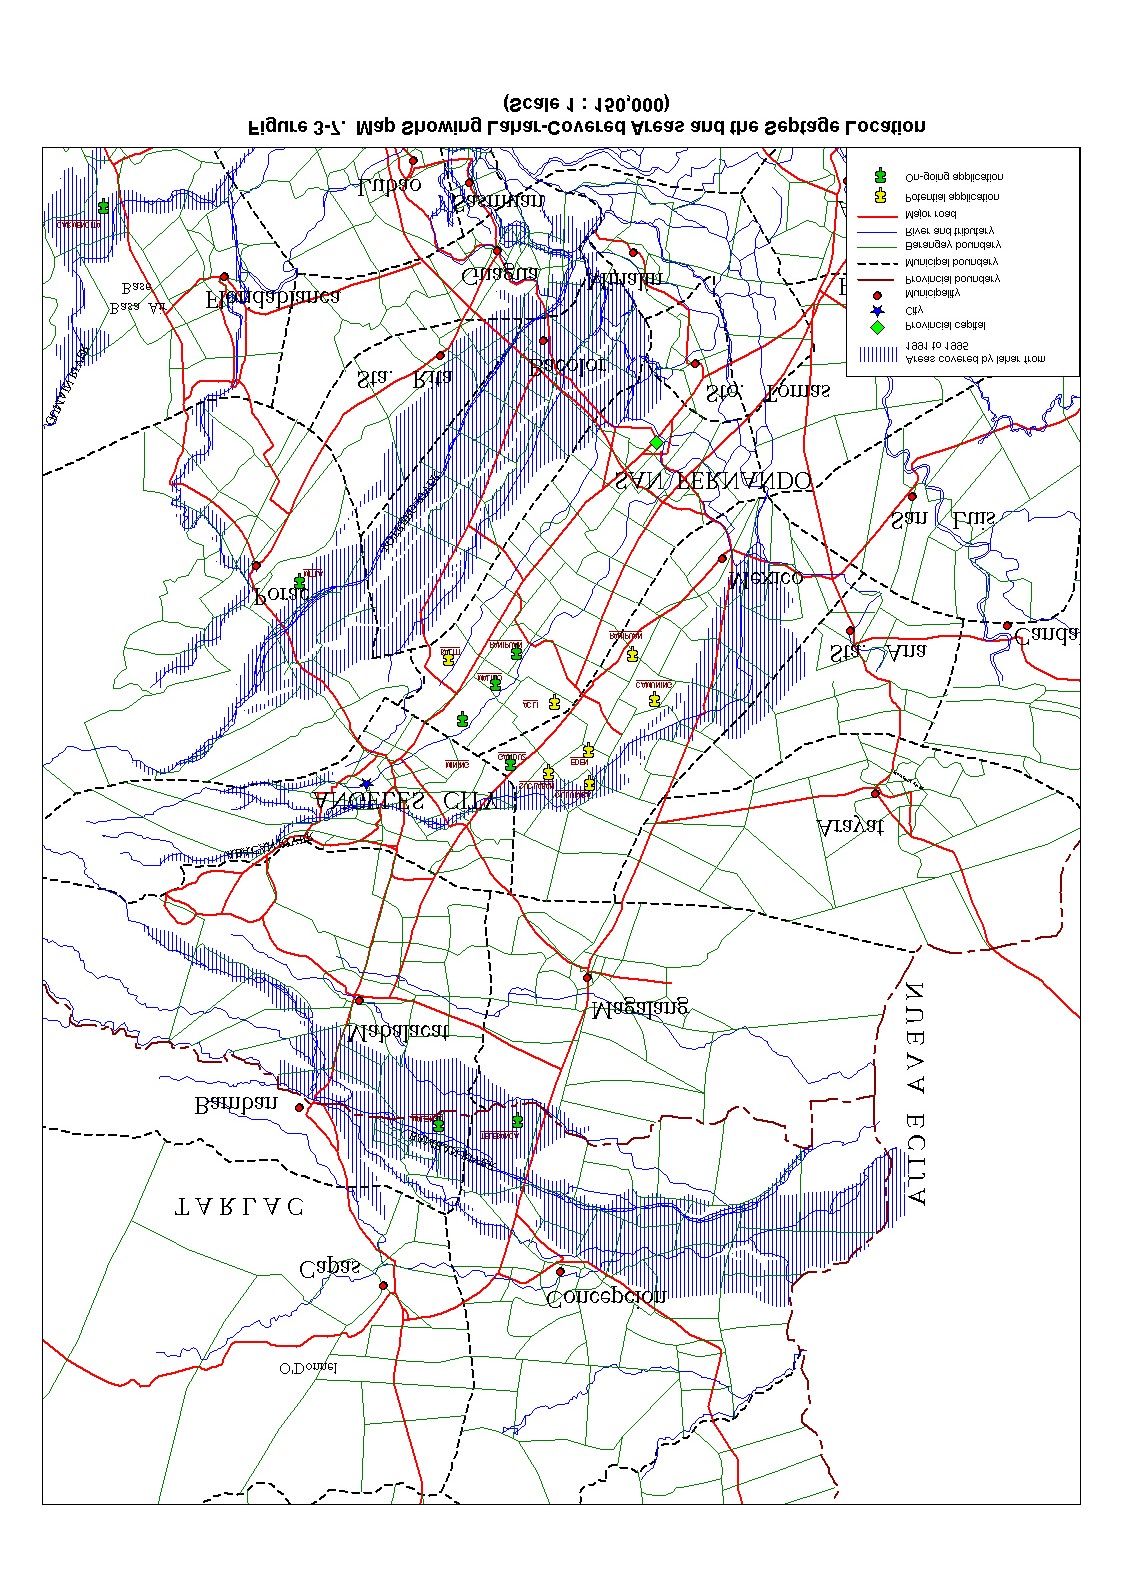
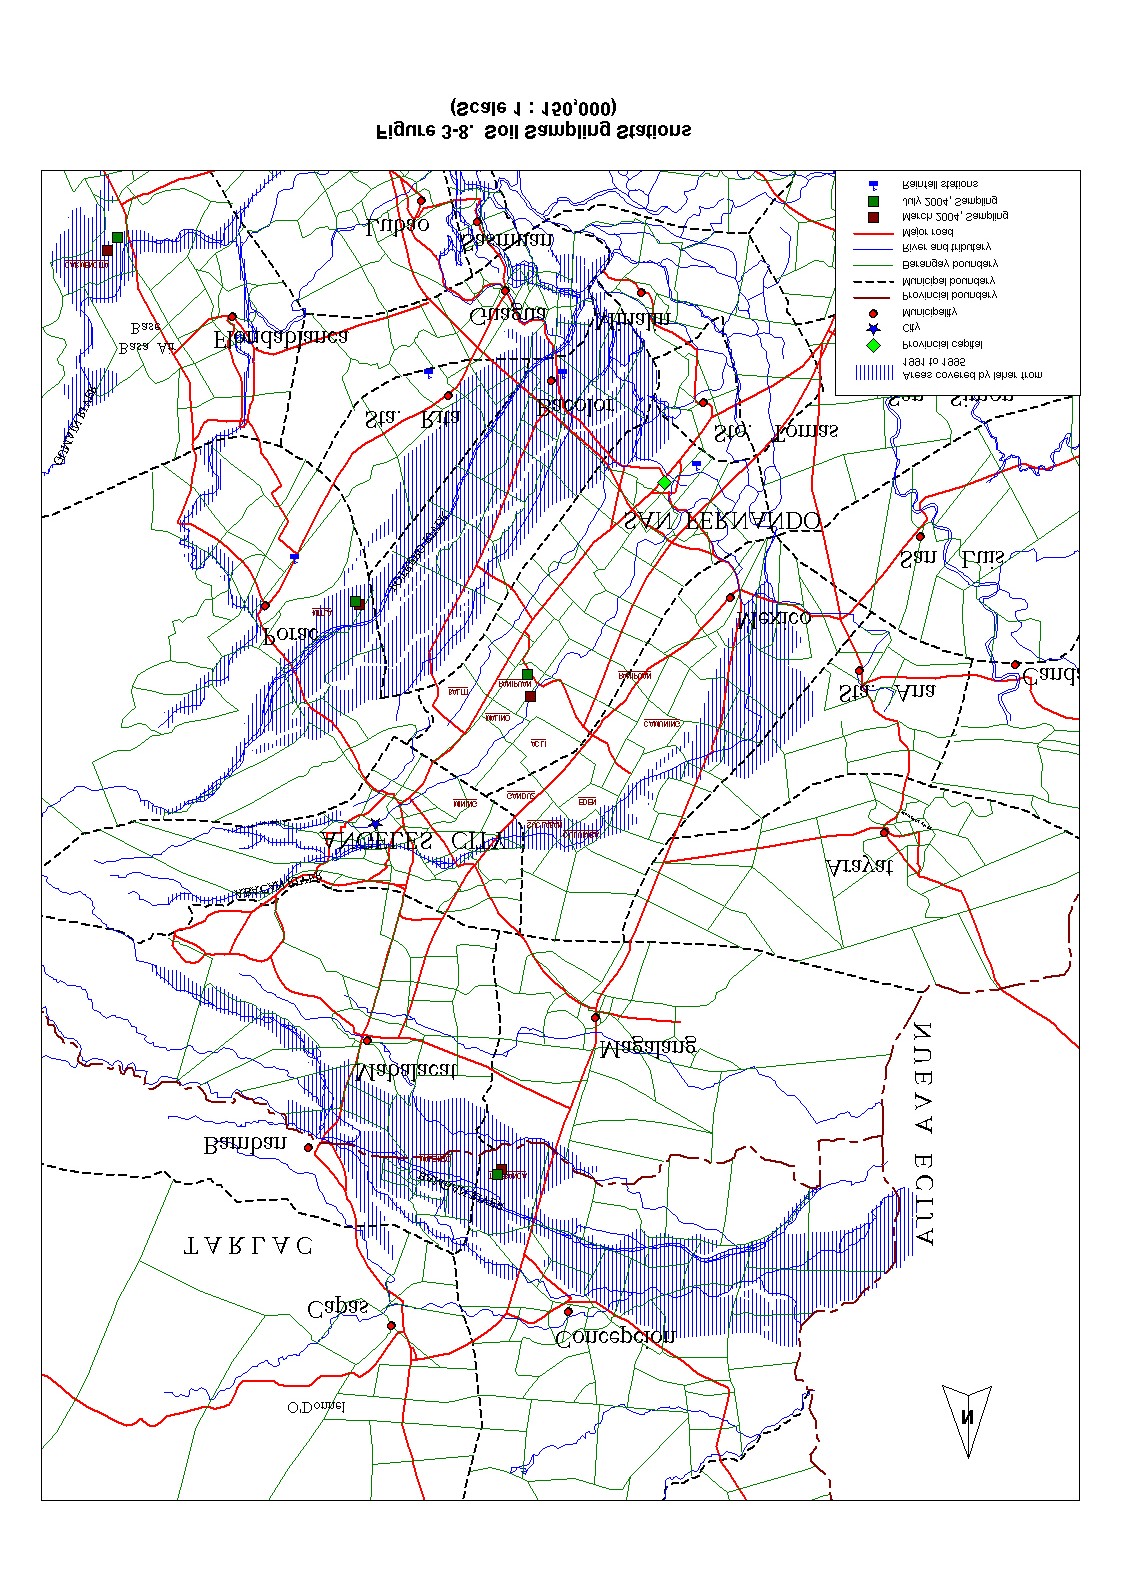
PROJECT SITE
SOURCE: PAGASA
FIGURE NO. FIGURE TITLE:
The Associated Firm:
EDCOP
Climate Map of the Philippines
3-9
Lichel Technologies, Inc. and
Inter-Structure Systems, Inc.
PROJECT SITE
SOURCE: PAGASA
FIGURE NO. FIGURE TITLE:
The Associated Firm:
EDCOP
3-10
Tropical Cyclone Map of the Philippines
Lichel Technologies, Inc. and
Inter-Structure Systems, Inc.
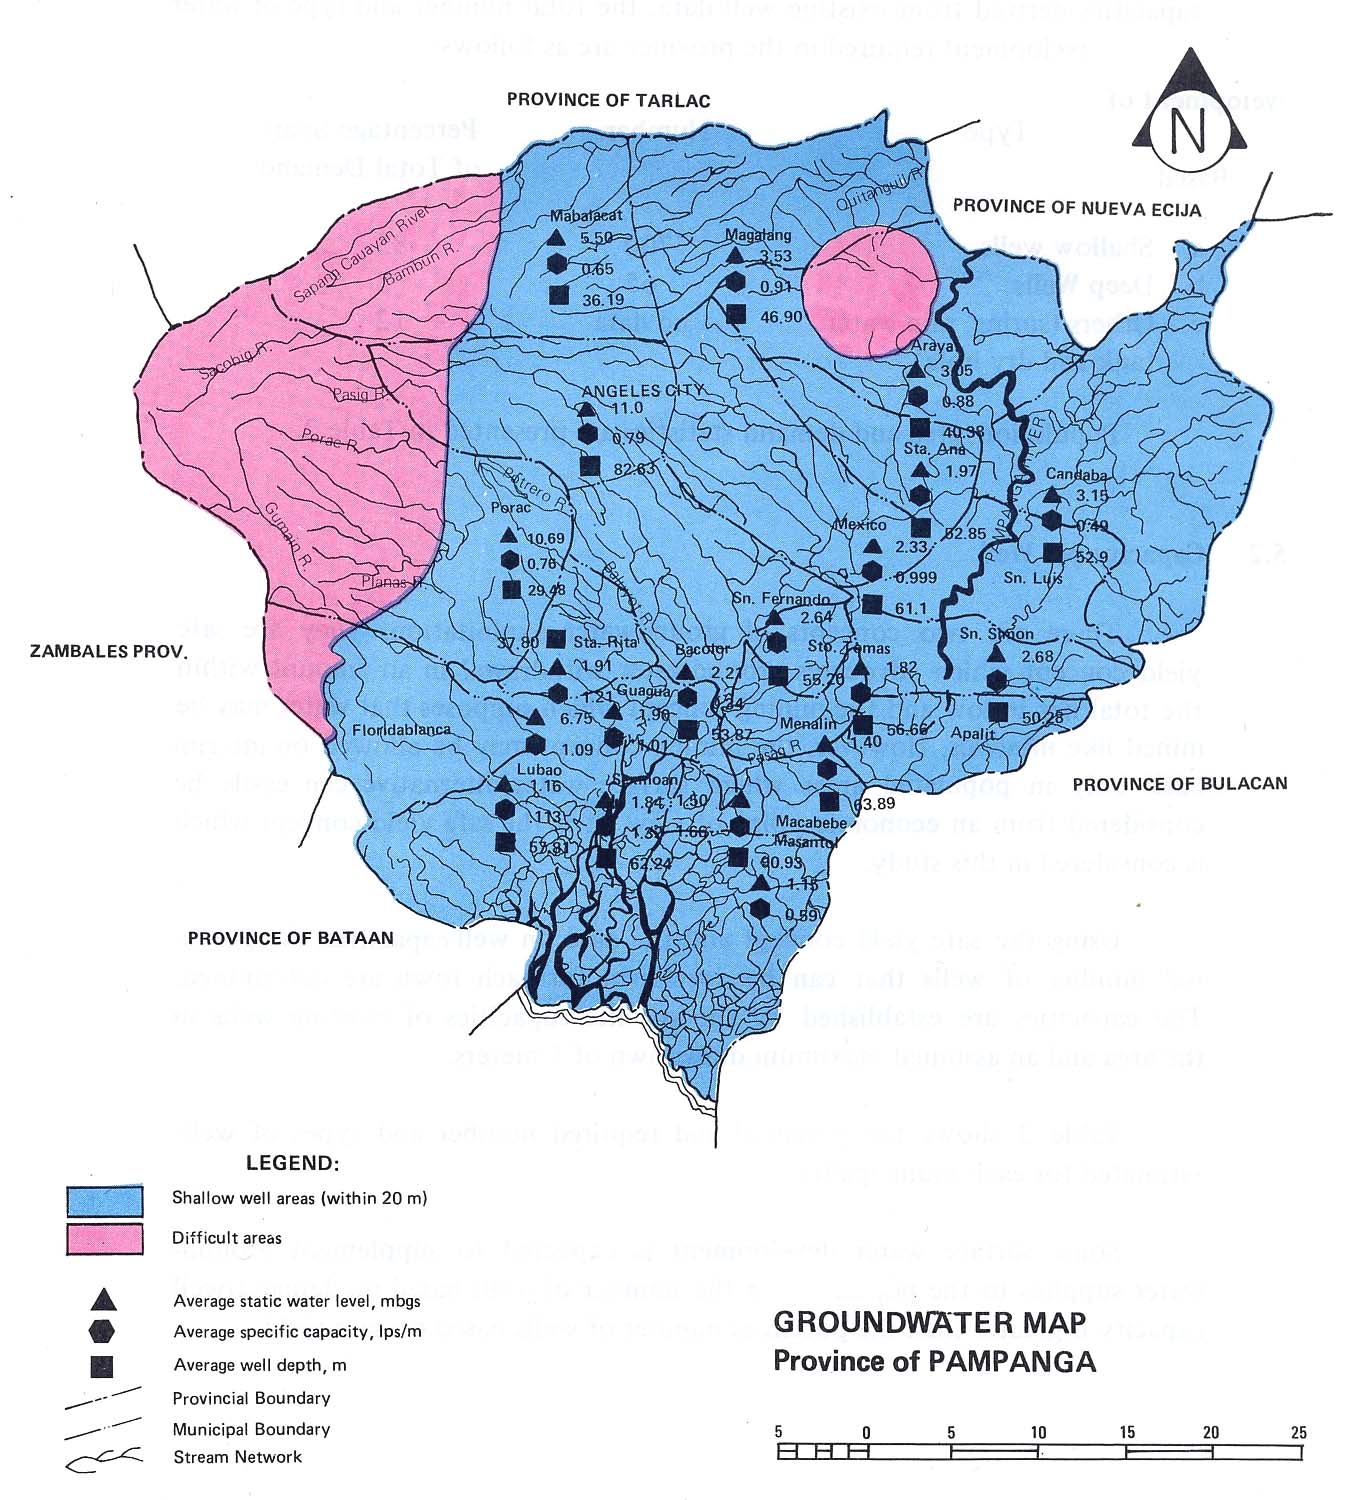
Source: National Water Resources Council
FIGURE NO. FIGURE TITLE:
The Associated Firm: EDCOP
Groundwater Map (Province of Pampanga)
3-11
Lichel Technologies, Inc. and
Inter-Structure Systems, Inc.
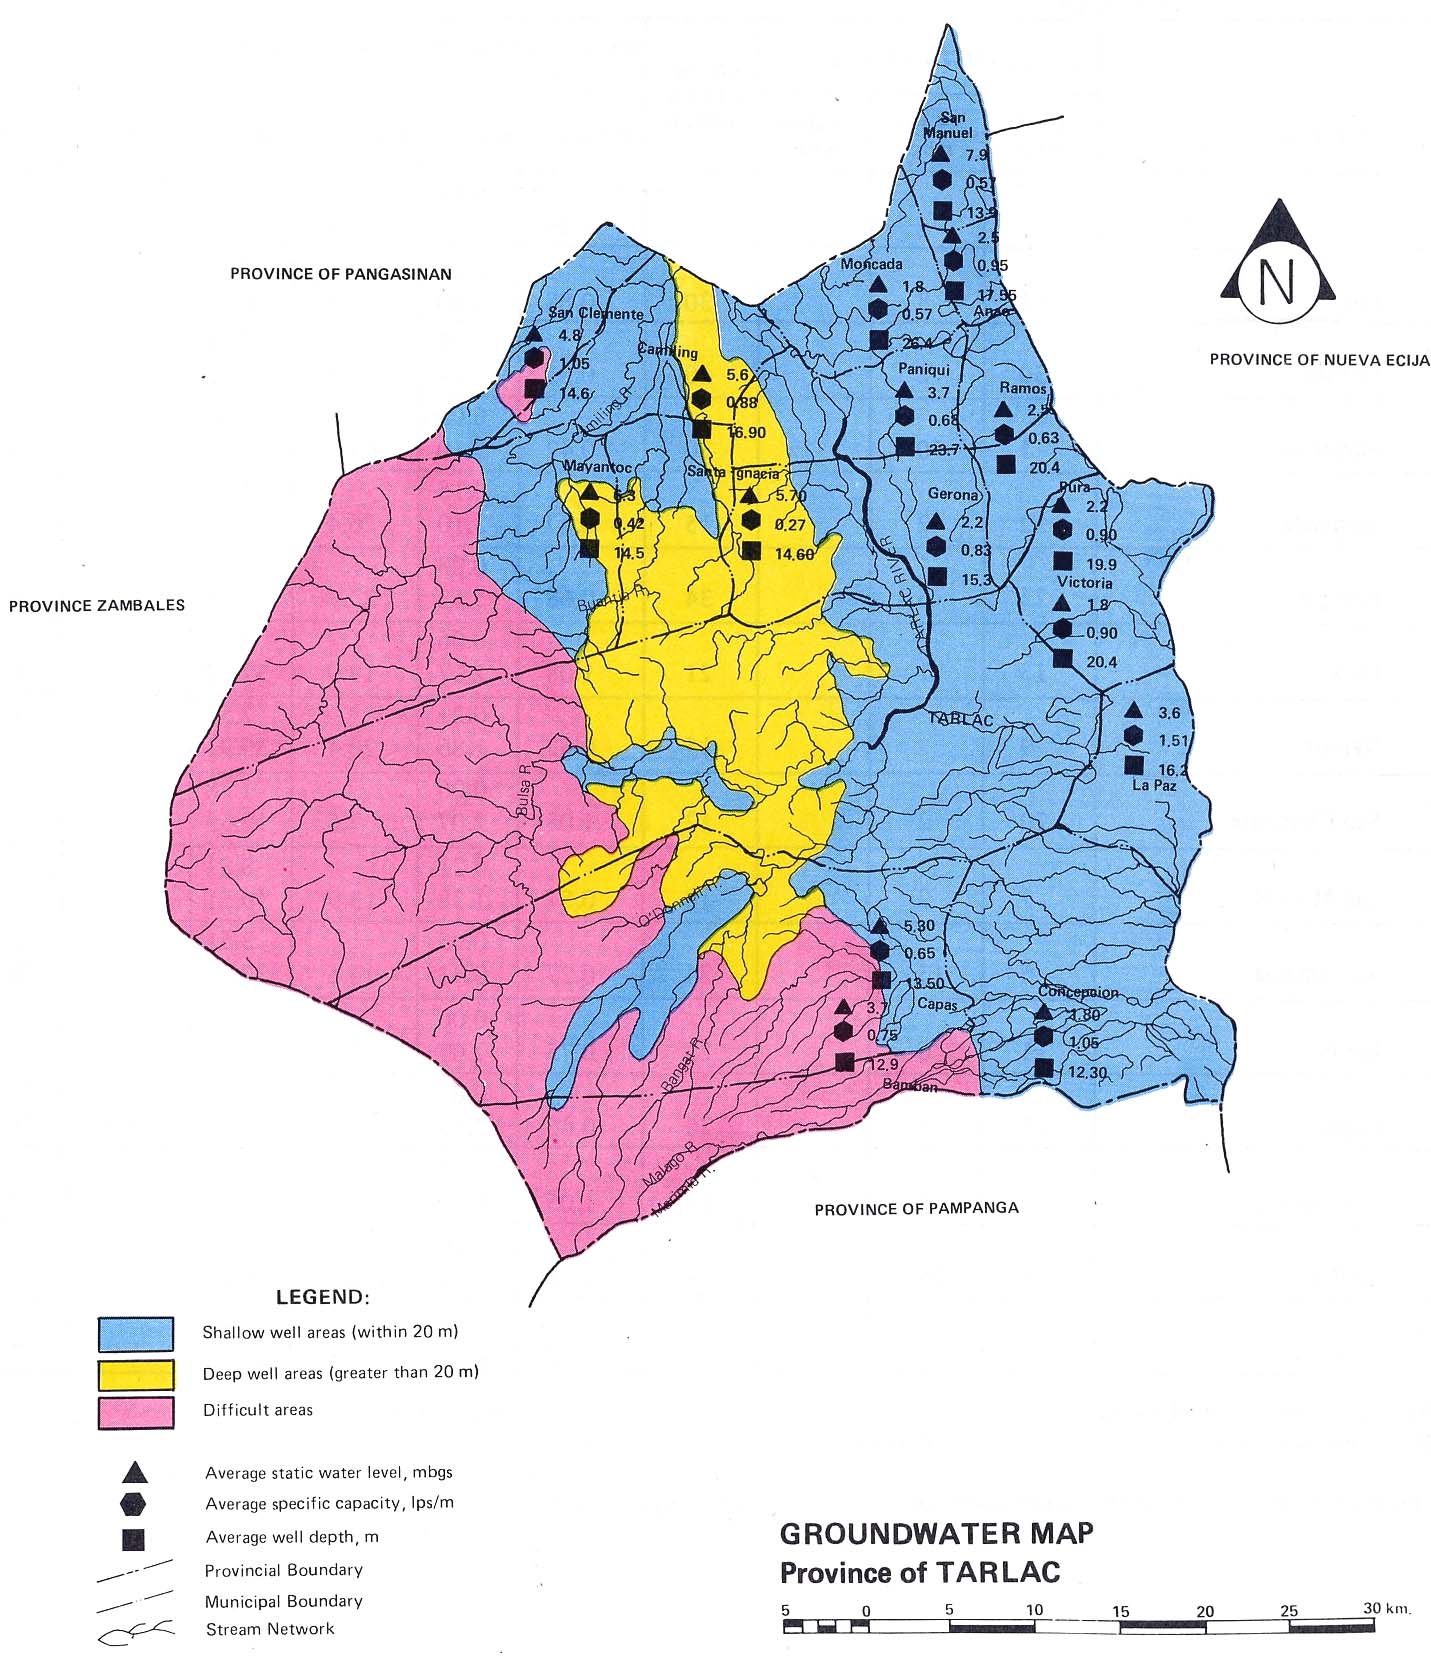
Source: National Water Resources Council
FIGURE NO. FIGURE TITLE:
The Associated Firm: EDCOP
Groundwater Map (Province of Tarlac)
3-12
Lichel Technologies, Inc. and
Inter-Structure Systems, Inc.
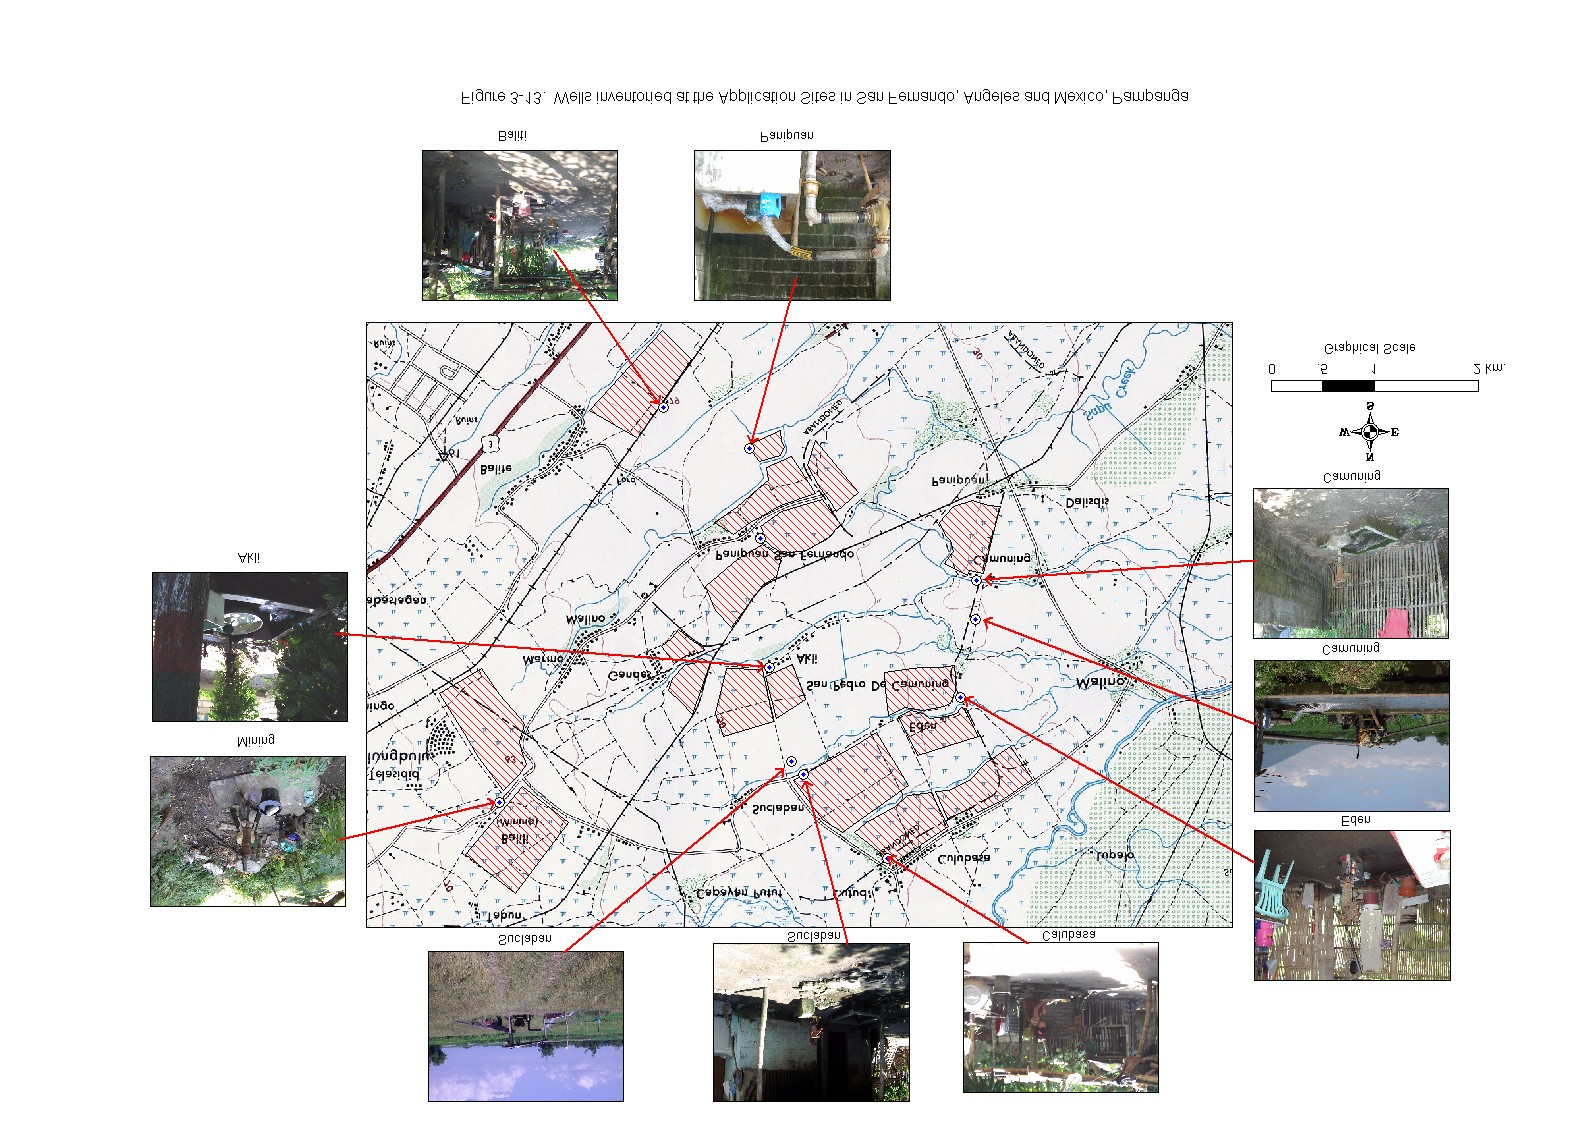
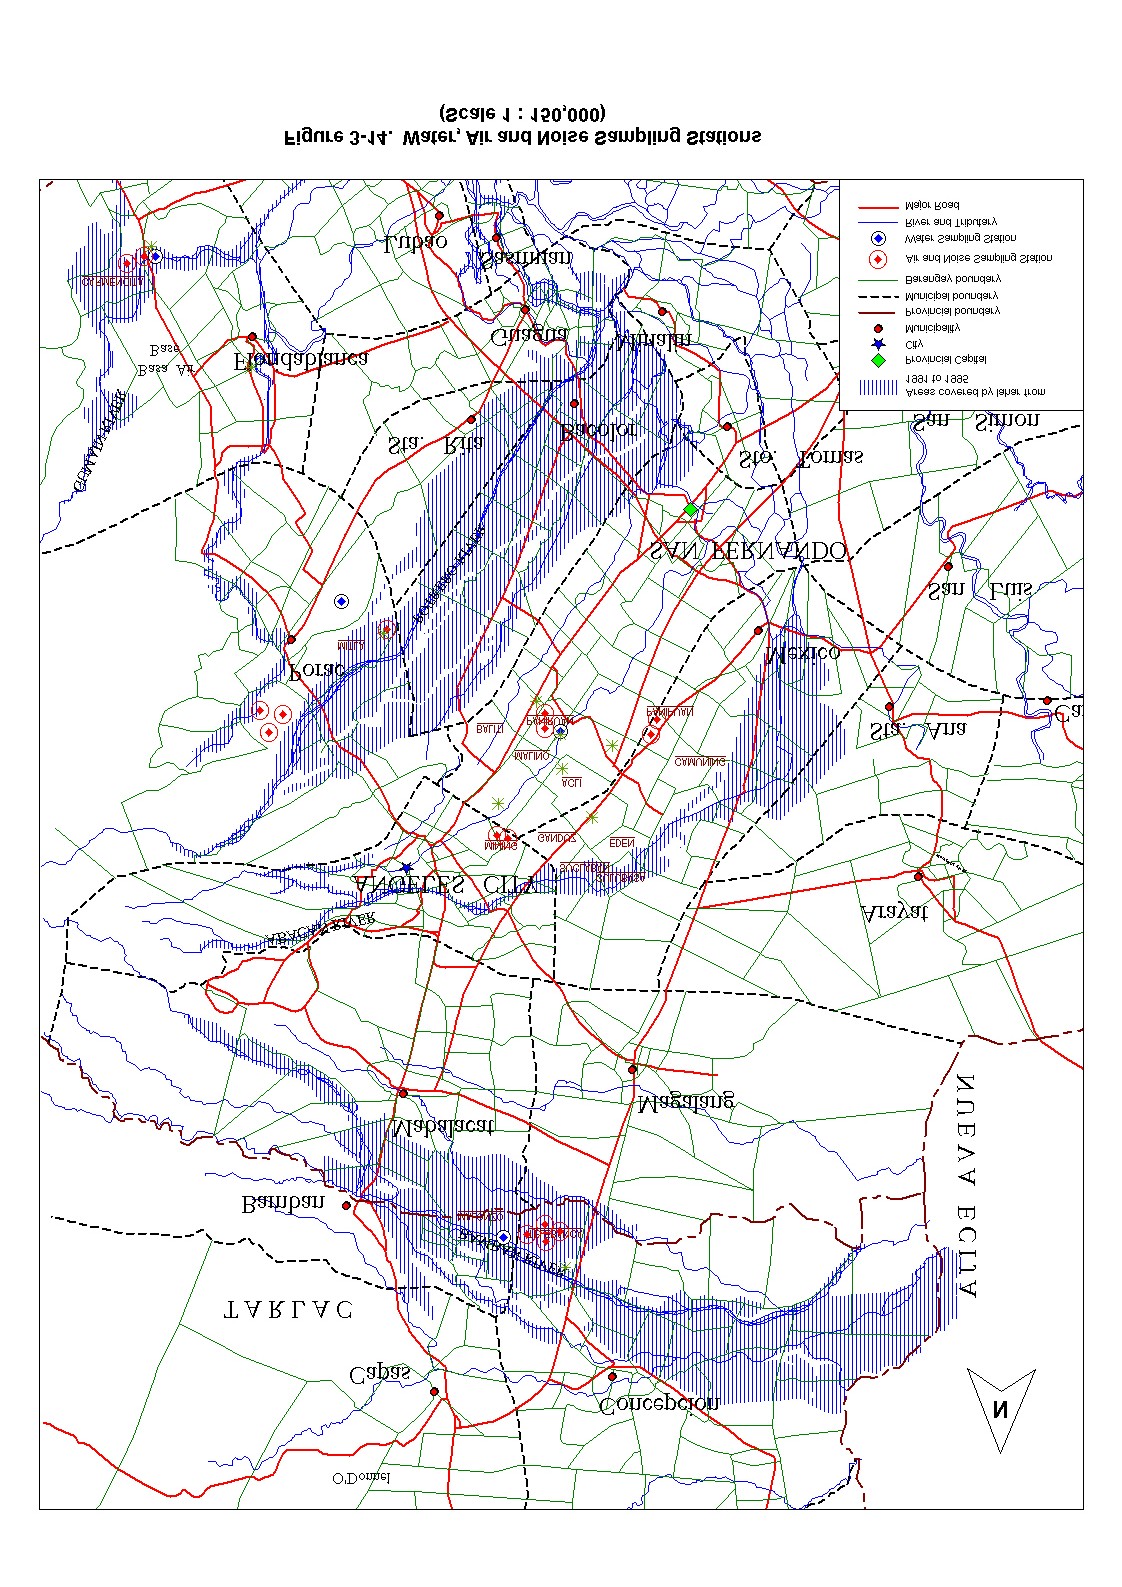
Department of Science and Technology
Philippine Institute of Volcanology and Seismology
Figure 4-1
Mount Pinatubo
Annual Sediment Delivery
Mount Pinatubo
Year
Actual
Best fit
Low
High
1991
805
801
725
925
1,000
1992
555
596
539
688
1993
505
444
401
512
1994
310
330
299
381
Actual
1995
187
246
222
283
800
Low
1996
160
183
165
211
1997
85
136
123
157
High
1998
101
91
117
Best fit
1999
75
68
87
600
2000
56
51
65
2001
42
38
48
2002
31
28
36
2003
23
21
27
400
2004
17
16
20
2005
13
12
15
2006
9
9
11
2007
7
6
8
200
2008
5
5
6
Annual sediment delivery (mcm)
2009
4
4
5
2010
3
3
3
Total
2,607
3,122
2,826
3,605
0
Based on Best Fit and Actual projections (rounded off)
1990
1995
2000
2005
2010
2015
Decay Rate
0.744
Year
Regression Statistics
Multiple R
0.972
R Square
0.944
Adjusted R Square
0.916
Standard Error
0.049

LIST OF TABLES
Metropolitan Waterworks and Sewerage System
TABLE 1 - 1. SUMMARY OF APPROACH AND METHODOLOGY IN THE CONDUCT OF ENVIRONMENTAL
BASELINE STUDY ................................................................................................................................... 1
TABLE 1 - 2. ANALYTICAL METHODOLOGIES EMPLOYED FOR ANALYSIS OF WATER AND SEDIMENT
SAMPLES ................................................................................................................................................ 3
TABLE 2 - 1. MWCI SEWERAGE SERVICE COVERAGE TARGETS (% OF TOTAL POPULATION AREA)1........................ 4
TABLE 2 - 2. MWCI SANITATION SERVICE COVERAGE TARGETS (% OF TOTAL POPULATION IN AREA)1 ................. 4
TABLE 2 - 3. LOCATION AND APPROXIMATE LAND AREA OF SLUDGE/SEPTAGE APPLICATION IN THE LAHAR-
LADEN AREAS ........................................................................................................................................ 5
TABLE 2 - 4. GENERAL CHARACTERISTICS OF APPLICATION SITES ........................................................................... 6
TABLE 2 - 5. PHYSICAL AND CHEMICAL ANALYSES OF SEPTAGE IN METRO MANILA (IN MEAN VALUES) .............. 7
TABLE 2 - 6. METAL CONCENTRATION OF SEPTAGE IN METRO MANILA (IN MEAN VALUES) .................................. 8
TABLE 2 - 7. METAL CONCENTRATIONS IN METRO MANILA SEPTAGE (UP-NEC, 1998) ......................................... 8
TABLE 2 - 8. RESULTS OF LABORATORY ANALYSIS OF SLUDGE (BSWM)................................................................ 9
TABLE 3 - 1. SOIL SAMPLING STATIONS ................................................................................................................... 10
TABLE 3 - 2. INFILTRATION RATE AND HYDRAULIC CONDUCTIVITY OF LAHAR SOILS AT THE PROJECT SITES
(JULY, 2004)......................................................................................................................................... 10
TABLE 3 - 3. CONCENTRATION LEVELS (UG/G) OF CADMIUM AND LEAD IN SOIL SAMPLES COLLECTED FROM 4
SITES IN THE LAHAR AREAS IN PAMPANGA AND TARLAC (MARCH 23 24, 2004). ............................ 10
TABLE 3 - 4. CHEMICAL ANALYSIS OF LAHAR SOILS ( JULY 30 31, 2004)............................................................ 11
TABLE 3 - 5. APPROXIMATE DISTANCE OF METEOROLOGICAL STATIONS TO THE PROJECT SITES (KM)................. 12
TABLE 3 - 6. MONTHLY AND ANNUAL RAINFALL DATA AT FOUR (4) RAINFALL STATIONS IN THE PROVINCE
OF PAMPANGA ...................................................................................................................................... 12
TABLE 3 - 7. MONTHLY AND ANNUAL METEOROLOGICAL DATA IN THE PROJECT SITES ....................................... 13
TABLE 3 - 8. RAINFALL-INTENSITY (IN MILLIMETERS/HOUR) OF COMPUTED EXTREME VALUES .......................... 13
TABLE 3 - 9. RAINFALL-INTENSITY (IN MILLIMETERS/HOUR) OF COMPUTED EXTREME VALUES .......................... 13
TABLE 3 - 10. RAINFALL-INTENSITY (IN MILLIMETERS/HOUR) OF COMPUTED EXTREME VALUES .......................... 14
TABLE 3 - 11. RAINFALL-INTENSITY (IN MILLIMETERS/HOUR) OF COMPUTED EXTREME VALUES .......................... 14
TABLE 3 - 12.
AMBIENT TSP CONCENTRATION AND NOISE LEVEL AT THE PROJECT SITES...................................... 14
TABLE 3 - 13. ENVIRONMENTAL QUALITY STANDARDS FOR NOISE IN GENERAL AREAS ......................................... 15
TABLE 3 - 14. SUMMARY OF WELL DATA FROM INVENTORIED WELLS..................................................................... 15
TABLE 3 - 15. WATER WELL DATA SUMMARY OF PROJECT AREAS (NWRC, 1982) ................................................ 17
TABLE 3 - 16. LIST OF RIVERS NEAR THE APPLICATION SITES .................................................................................. 18
TABLE 3 - 17.
MEAN MONTHLY FLOW IN CUBIC METERS PER SECOND (CMS)....................................................... 18
TABLE 3 - 18. MEAN MONTHLY FLOW IN CUBIC METERS PER SECOND (CMS) ....................................................... 18
TABLE 3 - 19. ACTUAL DISCHARGE MEASUREMENTS AT PORAC RIVER, NASUDECO, FLORIDABLANCA,
PAMPANGA........................................................................................................................................... 19
TABLE 3 - 20. ACTUAL STREAMFLOW MEASUREMENTS AT PORAC RIVER, POBLACION, PORAC, PAMPANGA ......... 19
TABLE 3 - 21. ACTUAL DISCHARGE MEASUREMENTS AT SACOBIA-BAMBAN RIVER, SAN FRANCISCO,
CONCEPCION, TARLAC......................................................................................................................... 19
TABLE 3 - 22. ACTUAL STREAMFLOW MEASUREMENTS AT PASIG-POTRERO RIVER, MANCATIAN, PORAC,
PAMPANGA........................................................................................................................................... 19
TABLE 3 - 23.
ANNUAL PEAK FLOW SERIES OF RIVERS IN TARLAC AND PAMPANGA PROVINCES ........................... 20
TABLE 3 - 24. MAGNITUDE OF FLOOD WITH CORRESPONDING RETURN PERIOD OF VARIOUS RIVERS ..................... 20
TABLE 3 - 25. MAGNITUDE OF FLOOD WITH CORRESPONDING RETURN PERIOD OF SACOBIA-BAMBAN AND
ABACAN RIVERS IN CUBIC METERS PER SECOND (CMS) ....................................................................... 21
TABLE 3 - 26.
MONTHLY RAINFALL AT THE APPLICATION SITES ............................................................................. 21
TABLE 3 - 27. MONTHLY EVAPOTRANSPIRATION AT THE PROJECT SITE..................................................................... 21
TABLE 3 - 28. RUNOFF DEPTH OF THE APPLICATION SITES ........................................................................................ 22
TABLE 3 - 29. ESTIMATED MONTHLY INFILTRATION RATE ....................................................................................... 22
TABLE 3 - 30. MONTHLY BALANCE CALCULATION OF APPLICATION SITES............................................................. 23
TABLE 3 - 31. WATER AND SEDIMENT QUALITY SAMPLING STATION DATA ............................................................ 23
TABLE 3 - 32. BASIC PHYSICO-CHEMICAL AND WATER QUALITY DATA OF SELECTED FRESHWATER BODIES
IN THE LAHAR AREAS OF PAMPANGA AND TARLAC............................................................................ 25
TABLE 3 - 33. TOTAL AND FECAL COLIFORM CONCENTRATIONS (MPN/100ML) REPORTED FOR DEEPWELL
WATER IN PAMPANGA AND TARLAC (20 NOVEMBER 2003- 03 FEBRUARY 2004). ............................ 26
TABLE 3 - 34. METAL CONCENTRATIONS FOR WATER (MG/L) AND SEDIMENT (MG/KG DRY WEIGHT) SAMPLES
AT ALL STATIONS (23 AND 24 MARCH 2004)...................................................................................... 26
ANNEXES-TABLES.DOC/2/9/2005
i

LIST OF TABLES
Metropolitan Waterworks and Sewerage System
TABLE 3 - 35. METAL CONCENTRATIONS (MG/L) REPORTED FOR DEEPWELL WATER IN PAMPANGA AND
TARLAC (20 NOVEMBER 2003 03 FEBRUARY 2004)......................................................................... 27
TABLE 3 - 36. COMPOSITION AND ABUNDANCES OF PHYTOPLANKTON AND ZOOPLANKTON ORGANISMS
SAMPLED AT ALL STATIONS (23 AND 24 MARCH 2004)..................................................................... 28
TABLE 3 - 37. COMPOSITION AND ABUNDANCES OF SOFT-BOTTOM BENTHIC ORGANISMS SAMPLED AT ALL
STATIONS (23 AND 24 MARCH 2004)................................................................................................... 29
TABLE 3 - 38.
ENDEMICITY, DISTRIBUTION, ECOLOGICAL STATUS AND ROLES/USES OF PLANTS SPECIES
SURVEYED IN THE SUGARCANE PLANTATION ..................................................................................... 30
TABLE 3 - 39. FAUNAL SPECIES COMMONLY FOUND IN THE SAMPLING AREA ......................................................... 31
TABLE 3 - 40.
POPULATION SIZE AND GROWTH AND MEAN HOUSEHOLD SIZE IN THE MUNICIPALITIES/CITIES
AND BARANGAYS IN THE PROJECT SITE: 1990 AND 2000.................................................................... 31
TABLE 3 - 41. VOLUME OF PRODUCTION AND AREA COVERED BY SUGARCANE (1999-2003) .................................. 32
TABLE 3 - 42. AGRICULTURAL AREA IN THE MUNICIPALITIES AND CITIES IN THE PROJECT SITE: 2000................... 32
TABLE 3 - 43. SUMMARY OF ISSUES AND RESPONSES DURING THE FIRST AND SECOND LEVEL
CONSULTATIONS .................................................................................................................................. 32
TABLE 3 - 44. LEADING CAUSES OF MORTALITY ....................................................................................................... 33
TABLE 3 - 45.
LEADING CAUSES OF MORBIDITY BY YEAR ....................................................................................... 33
TABLE 3 - 46. BASIC SANITATION FACILITIES............................................................................................................ 34
TABLE 4 - 1. DESCRIPTION OF LAHAR HAZARDS ZONES (PHIVOLCS-DOST, 1997)............................................. 35
TABLE 4 - 2. LAHAR HAZARD ZONE CLASSIFICATION OF EXISTING AND PROPOSED SEPTAGE/SLUDGE
DISPOSAL AREAS. ................................................................................................................................ 35
TABLE 4 - 3. RANGE AND AVERAGE VALUES FOR PARAMETERS FOR RAW SEPTAGE ............................................. 36
TABLE 4 - 4. RANGE OF VALUES OF HEAVY METALS IN SEPTAGE........................................................................... 36
TABLE 4 - 5. CHEMICAL ANALYSIS OF MWCI SEWAGE/SLUDGE ............................................................................ 36
TABLE 4 - 6. POLLUTANT LIMITS FOR THE LAND APPLICATION OF SEWAGE SLUDGE............................................. 37
TABLE 4 - 7.
PHYSICO-CHEMICAL CHARACTERISTICS OF SOIL, LAHAR 1, AND LAHAR 2 ...................................... 38
TABLE 4 - 8. BACTERIOLOGICAL ANALYSIS DATA ON SOIL, LAHAR 1, AND LAHAR 2 ............................................ 38
TABLE 4 - 9. ANALYSIS OF HEAVY METALS FROM SEWAGE SLUDGE FERTILIZED LAHAR DEPOSITS..................... 39
TABLE 4 - 10. ANALYSIS OF HEAVY METALS IN SEWAGE SLUDGE FERTILIZED LAHAR DEPOSITS AT A.B.
GONZALES FARM, TELEBANCA, CONCEPTION, TARLAC (ONE MONTH AFTER APPLICATION) ........... 39
TABLE 4 - 11. CONCENTRATION/LEVELS (UG/G) OF CADMIUM AND LEAD IN SOIL SAMPLES COLLECTED FROM
4 SITES IN THE LAHAR AREAS IN PAMPANGA AND TARLAC. ................................................................ 40
TABLE 4 - 12. CONCENTRATION LEVELS (UG/G) OF CADMIUM AND LEAD IN SUGARCANE TISSUES COLLECTED
FROM 4 SITES IN THE LAHAR AREAS IN PAMPANGA AND TARLAC...................................................... 40
TABLE 4 - 13. INCIDENCE POTENTIAL RATING ........................................................................................................... 41
TABLE 4 - 14. HEALTH CONSEQUENCE RATING ......................................................................................................... 41
TABLE 4 - 15. HEALTH RISK MATRIX......................................................................................................................... 42
TABLE 4 - 16. OCCUPATIONAL HAZARDS AND RELATED INJURIES AND DISEASES OF SLUDGE/SEPTAGE
DISPOSAL PROJECT .............................................................................................................................. 42
TABLE 4 - 17. OCCUPATIONAL AND ENVIRONMENTAL RELATED DISEASES.............................................................. 43
TABLE 5 - 1. MAJOR IMPACTS, MITIGATION/ENHANCEMENT MEASURES AND ENVIRONMENTAL
MANAGEMENT PLAN............................................................................................................................ 44
TABLE 5 - 2.
SUMMARY MATRIX -ENVIRONMENTAL MONITORING PLAN .............................................................. 48
ANNEXES-TABLES.DOC/2/9/2005
ii

SECTION ONE
List of Tables
Metropolitan Waterworks and Sewerage System
Table 1 - 1.
Summary of Approach and Methodology in the Conduct of Environmental Baseline Study
Location and Size of
Study Module
Scope and Coverage
Method of Data Gathering
Method of Assessment
Study Area
Physical
Environment
Geology and Natural
Regional and Local Geology Secondary data, site
Regional: Pampanga and
Identification of hazards, and
Hazards
Hazard zones
observations
Tarlac Provinces, Project site flood prone areas;
Identification of water
resources.
Hydrology Surface
Hydrology
Field mapping and water
Drainage Basins, Project
Surface water discharge,
Hydrogeology
point inventory, spot
sites
groundwater availability,
interviews and secondary
groundwater vulnerability
data
Soils and Land Use
Soils types and
Soil sampling and analysis
Project Sites
Analysis of land uses; review
characteristics
Pedological observations and
and analysis of crop
Extent of soil erosion and
review of secondary data
production system, soils/land
land use study
suitability analysis;
Meteorology
Climate, temperature, wind,
Secondary data gathering
Regional: Pampanga and
Climate type, typhoon
tropical cyclones
Tarlac Provinces
frequency, wind direction
and intensity
Air & Noise Quality
Noise levels, total suspended Noise meter, high volume air Direct/Secondary Impact
Air quality modeling;
particulates (TSP sampling
sampler, review of existing
Areas
comparison with DENR
meteorologic data
air/noise quality standards.
Water Quality
Physicochemical analysis
Water sampling; informal
Direct/Secondary Impact
Laboratory analysis of water
Biological analysis
interviews; review of
Areas
samples; comparison with
secondary data
water quality standards for
waste management and
wastewater treatment.
Biological
Environment
Aquatic Ecology
Species composition, relative Stream and sediment
Direct Impact Areas
Classification and relative
abundance and biodiversity
sampling
abundance of planktons,
benthos and aquatic
resources
ANNEXES-TABLES.DOC/2/9/2005
1
Manila Third Sewerage Project (MTSP)

SECTION ONE
List of Tables
Metropolitan Waterworks and Sewerage System
Location and Size of
Study Module
Scope and Coverage
Method of Data Gathering
Method of Assessment
Study Area
Terrestrial Ecology
Species composition, relative Visual observation
Direct/Secondary Impact
General classification
abundance and biodiversity
Areas
approach for the existing
flora and fauna.
Socio-economic
Environment
Socio-Economics Demographic
Profiles
Informal interviews/
Direct/Secondary Impact
Quantitative and qualitative
Regional/Local economy,
meetings
Areas
analysis of secondary data
livelihood, employment,
Consolidation of municipal
Municipal/Provincial/
and information gathered
income levels
and barangay profile
Regional
from consultations and
Culture and Lifestyles
interviews; process
Health and Sanitation
evaluation; comparison
Land Use
between existing and future
Social Acceptability
Perception survey
Household interview/survey
Direct/Secondary Impact
conditions with and without
Public consultation
Consultations with key
Areas
the project.
informants
Municipal/Provincial/
Regional
Public Health
Household interview/survey
Direct/Secondary Impact
Consolidation of municipal
Areas
and barangay health profile
Municipal/Provincial/
Regional
ANNEXES-TABLES.DOC/2/9/2005
2
Manila Third Sewerage Project (MTSP)

SECTION ONE
List of Tables
Metropolitan Waterworks and Sewerage System
Table 1 - 2.
Analytical Methodologies Employed for Analysis of Water and Sediment Samples
Parameter
Methodology Used
Hydrogen-ion Concentration (pH, water)
Glass Electrode (pH @ 25oC)
Dissolved Oxygen (DO, water)
Titrimetry
Total Suspended Solids (TSS, water)
Gravimetry
Total Dissolved Solids (TDS, water)
Gravimetry
Biological Oxygen Demand (BOD5, water)
Azide Modification
Phosphorus as Phosphate (water)
Colorimetry- Ascorbic Acid
Total Phosphorus as P (water)
Colorimetry- Ascorbic Acid
Oil & Grease (water)
Pet. Ether Ext. Gravimetry
Organophosphorus Pesticides (OPP, water)
EPA Method 8141 (GC-TSD)
Organophosphorus Pesticides (OPP, sediment)
EPA Method 8141 (GC-FPD)
Organochlorine Pesticides (OCP, water/sediment)
EPA Method 8081A
Polychlorinated Biphenyls (PCB, water)
EP Method 8082A (PCB Aroclors)
Total Arsenic (As, water/sediment)
EPA 6010B ICP
Total Cadmium (Cd, water/sediment)
Flame AAS
Total Chromium (Cr, water/sediment)
Flame AAS
Total Lead (Pb, water/sediment)
Flame AAS
Total Mercury (Hg, water/sediment)
AAS- Cold Vapor
Total Coliform (water)
APHA 9221B
Fecal Colifrom (water)
APHA 9221E
ANNEXES-TABLES.DOC/2/9/2005
3
Manila Third Sewerage Project (MTSP)

SECTION TWO
List of Tables
Metropolitan Waterworks and Sewerage System
Table 2 - 1.
MWCI Sewerage Service Coverage Targets (% of total population area)1
Location
2001
2006
2011
2016
2021
Mandaluyong 0.5 4 10 15
Makati
22 40 38 28 23
Quezon
City 13 20 16 17
Pasig
9 10 12 14
San Juan
Taguig
5 25 26 20
1 From MWCI rates rebasing data
Note : Blank cells indicate no specified target for the area. Other cells and municipalities within the MWCI concession are not
planned for connection to a sewer system.
Table 2 - 2.
MWCI Sanitation Service Coverage Targets (% of total population in area)1
Location
2001
2006
2011
2016
2021
Mandaluyong
99.5
96
90
85
Makati 60 62 72 77
Marikina 0 100 100 100 100
Quezon
City
3.2
87 80 84 83
Pasig 1.2
91 90 88 86
Pateros
100 100 100 100
San Juan
100
100
82
59
Taguig 95 75 74 80
Angono 0 100 100 100 100
Antipolo 0.5 100 100 100 100
Baras 0.5
0 0
100
100
Binangonan
0
0 100 100
Cainta 0.2 100 100 100 100
Cardona 0 0 100
100
Jala-jala 0.2 0 0 100 100
Morong 0.7 0 0 100 100
Pililia
0
0
100
100
Rodriguez 100 100 100 100
San
Mateo
0.7 100 100 100 100
Tanay
0
0
100
100
Taytay
0 100 100 100 100
Teresa
0
0
100
100
Manila
100 100 100 100
1 From MWCI rates rebasing data
Note: Blank cells indicate no specified target for the area.
ANNEXES-TABLES.DOC/2/9/2005
4
Manila Third Sewerage Project (MTSP)

SECTION TWO
List of Tables
Metropolitan Waterworks and Sewerage System
Table 2 - 3.
Location and Approximate Land Area of Sludge/Septage Application in the Lahar-
Laden Areas
Approximate Area
Approximate Area
Location
Year Applied
Covered (hectares)
Applied (hectares)
With on-going sludge/septage application
San Jose Mitla, Porac, Pampanga
2003, 2004
100
60
Panipuan, San Fernando,
2003, 2004
100
30
Pampanga
Malino, San Fernando, Pampanga
2003, 2004
50
30
Mining, Angeles, Pampanga
2003, 2004
50
10
Ganduz, Mexico, Pampanga
2003
20
5
Carmencita, Floridablanca,
2004 150 50
Pampanga
Telebanca, Concepcion, Tarlac
2002, 2003, 2004
300
100
Malonzo, Concepcion, Tarlac
2002, 2003, 2004
300
100
Potential sites for sludge/septage
application
Baliti, San Fernando, Pampanga
Not yet applied
50
-
Eden, Mexico, Pampanga
Not yet applied
50
-
Suclaban, Mexico, Pampanga
Not yet applied
50
-
Culubasa, Mexico, Pampanga
Not yet applied
100
-
Acli, Mexico, Pampanga
Not yet applied
50
-
Camuning, Mexico, Pampanga
Not yet applied
20
-
Panipuan, Mexico, Pampanga
Not yet applied
50
-
Source: Manila Water Company, Inc. (MWCI)
ANNEXES-TABLES.DOC/2/9/2005
5
Manila Third Sewerage Project (MTSP)

SECTION TWO
List of Tables
Metropolitan Waterworks and Sewerage System
Table 2 - 4.
General Characteristics of Application Sites
Thickness
Approximate distance to
Approximate distance
Approximate distance
Application Site
Lahar (m)
Ashfall (inches)
nearest water body (m)
to nearest well (m)
to nearest home (m)
Pampanga Province
Panipuan, San Fernando City
-
2.0
50
50
50
Malino, Angeles City
-
2.0
100
100
100
Mining, Angeles City
-
2.0
400
20
20
Ganduz, Mexico
-
2.0
20
50
50
Calubasa, Mexico
1.0
-
20
50
50
Camuning, Mexico
-
1.0
20
50
50
Eden, Mexico
-
2.0
30
20
20
Suclaban, Mexico
-
2.0
50
30
30
Acli, Mexico
-
2.0
50
30
30
Baliti, San Fernando City
-
2.0
20
20
20
Mitla, Porac
12.0
-
300
0 1 1,000
Carmencita, Floridablanca
5.0
-
20
01 75
Tarlac Province
Telebanca, Concepcion
6.0
-
20
300
<20 2
Malonzo, Bamban
6.0
-
20
100
100
1 zero value means means wells are within the application site
2 eight resettlement houses
ANNEXES-TABLES.DOC/2/9/2005
6
Manila Third Sewerage Project (MTSP)

SECTION TWO
List of Tables
Metropolitan Waterworks and Sewerage System
Table 2 - 5.
Physical and Chemical Analyses of Septage in Metro Manila (in Mean Values)
f
MWCI (1998-
PIA (2001)
l
e
s
Montgomery
f
f
f
(1991) from
l
e
s
UP NEC
(1998) during
les
99) Individual
les
from Vacuum
Parameter
Unit
o
. o
o
. o
.
o
.
o
N
Individual Septic
de-sludging
Septic Tanks
Trucks in
samp
N
No
No
Tanks in Manilaa
samp
operations
samp
in Manila
samp
Manilaa
PH
-
13
7.0 6
7.3 9
7.0 7
7.5
BOD
mg/L
13
5,532 7
3,796 9
104 7
4,641
COD
mg/L
1
12,807 7
33,433 9
263 7
16,005
COD/BOD
2.3
8.8
2.5
7
2.6
TS mg/L
6
31,376 15
71,579 9
843 7
19,541
TVS mg/L
5
19,245 15
54,292 9
405 7
11,133
TVS/TS
0.61
0.75
0.48
7
0.54
TSS mg/L
13
26,517
n.a. 9
303 7
16,775
TVSS mg/L
13
11,955
n.a. 9
200 7
5,301
NH3-N mg/L
14 209
n.a.
n.a.
7
115
TKN mg/L
n.a. n.a.
n.a.
n.a.
7
678
TP mg/L
14 12.8
n.a.
n.a.
7 74
TN mg/Kg
n.a.
5
2,800
n.a.
n.a.
P2O5 mg/Kg
n.a.
5
908
n.a.
n.a.
K mg/Kg
n.a.
7
67.32
n.a.
n.a.
Na mg/Kg
n.a.
1
62.97
n.a.
n.a.
Oil and Grease
mg/L
9 1,493
8 96
7 215
Settleable Matter
mL/L
1
750
1.3
1
800
Surfactants (MBAS)
mg/L
n.a.
9
46
n.a.
Phenols
mg/L
n.a.
7
0.11
n.a.
Nematoed eggs
eggs/Kg
n.a.
15
6,044.4
n.a.
n.a.
Fecal Coliform
MPN/ 100 ml
n.a.
4
43.5 x 10⁶
8
94.3 x 10⁶
n.a.
Total Coliform
MPN/ 100 ml
n.a.
n.a.
9
18.3 x 10⁷
n.a.
n..a. = not analyzed
a) Taken from STP Feasibility Study: Treatment, Handling and Disposal of Septage, 2002. Pasig River Environmental Management and Rehabilitation Sector Development
Program (PREMRSDP).
ANNEXES-TABLES.DOC/2/9/2005
7
Manila Third Sewerage Project (MTSP)

SECTION TWO
List of Tables
Metropolitan Waterworks and Sewerage System
Table 2 - 6.
Metal Concentration of Septage in Metro Manila (in Mean Values)
les
Montgomery
les
les
MWCI (1998-
(1991) from
PREMRSDP
99) Individual
Parameter
Unit
samp
Individual
samp
(2002) in Metro
Septic Tanks in
samp
Septic Tanks in
Manila Septagea
Manila
No. of
Manilaa
No. of
No. of
Ag mg/L
2
0.10
n.a.
Cd mg/L
2
0.257 9
0.007 6
0.034
Cr5+ mg/L
n.a.
9
0.010
6
0.007
Cu mg/L
2
29
0.013
n.a.
Fe mg/L
2
1,160
2.73 1
278
Hg mg/L
9
0.004240
n.a. 6
0.0164
Mn mg/L
2
15
0.34
n.a.
Ni mg/L
2
3.1
n.a.
n.a.
Pb mg/L
7 1.988
0.07
6 1.53
S 2- mg/L
12 29.8
n.a.
1 262
Sn mg/L
n.a.
n.a.
6
0.377
Zn mg/L
2 218
0.42
n.a.
n.a. = not analyzed
a) Taken from STP Feasibility Study: Treatment, Handling and Disposal of Septage, 2002. Pasig River
Environmental Management and Rehabilitation Sector Development Program (PREMRSDP).
Table 2 - 7.
Metal Concentrations in Metro Manila Septage (UP-NEC, 1998)
Parameter
Unit
Range of Values
Pb mg/Kg
3.15
7.05
Zn
mg/Kg
102.32 103.22
Cu
mg/Kg
1.57 7.82
Cd
mg/Kg
0.0 0.51
Cr
mg/Kg
0.76 0.79
ANNEXES-TABLES.DOC/2/9/2005
8
Manila Third Sewerage Project (MTSP)

SECTION TWO
List of Tables
Metropolitan Waterworks and Sewerage System
Table 2 - 8.
Results of Laboratory Analysis of Sludge (BSWM)
Date of Analysis
Pollutant
Concentration
Parameters
Unit
(monthly
April, 2000
April, 2004
average in
mg/Kgb )
Total Nitrogen (N)
% by weight
0.15
0.31
Total Phosphorus, (P2O5) %
by
weight
0.06 0.16
Total Potassium (K2O) %
by
weight
0.10 0.007
Total Calcium (CaO)
% by weight
0.15 1.68
Total Magnesium (MgO)
% by weight
0.09 0.07
Ph
7.1
7.4
Sodium (Na)
% by weight
0.01 0.01
Zinc (Zn)
ppm
67.75
201.0
2,800
Copper (Cu)
ppm
11.99 26.94 1,500
Manganese (Mn)
ppm
28.18 35.15
Iron (Fe)
ppm
2,375 1,812
Organic Carbon (Walkley Black
% by weight
1.75 2.71
Method)
n.a. = not analyzed
a) Table 3 of 40 CFR 503.13, EPA
b)
mg/Kg can be interpreted as ppm (parts per million); 1Kg = 1,000,000 mg
ANNEXES-TABLES.DOC/2/9/2005
9
Manila Third Sewerage Project (MTSP)

SECTION THREE
List of Tables
Metropolitan Waterworks and Sewerage System
Table 3 - 1.
Soil Sampling Stations
Coordinates
Sampling
Sampling
Location
Weather
Weather
Longitude
Latitude
Date/Time
Date/Time
23 March 04 /
31 July 04/
Mitla, Porac, Pampanga 120ş 34' 28"
15ş 05' 00"
Clear
Partly Cloudy
11:00 AM
1:45 PM
Carmencita,
23 March 04/
31 July 04/
Floridablanca,
120ş 28' 49"
14ş 57' 21"
Clear
Partly Cloudy
2:00 PM
10:00 AM
Pampanga
Panipuan, San
23 March 04/
30 July 04/
120ş 38' 17"
15ş 06' 59"
Partly Cloudy
Cloudy
Fernando, Pampanga
4:30 PM
4:00 PM
Telebanca, Conception,
23 March 04/
30 July 04/
120ş 37' 38"
15ş 17' 11"
Partly Cloudy
Partly Cloudy
Tarlac
8:30 AM
11:45 AM
Table 3 - 2.
Infiltration Rate and Hydraulic Conductivity of Lahar Soils at the Project Sites
(July, 2004)
Infiltration
Hydraulic
Obs.
USDA
Depth
USDA
Location
Rate
Conductivity
No.
Classification
(cm)
Classificaion
(cm/hr)
(cm/sec)
1 Telebanca
38.0
Very rapid
0 20
3.6 x 10⁻²
Very fast
Conception, Tarlac
20 40
4.0 x 10⁻²
Very fast
40 below
1.2 x 10⁻²
Very fast
2 Panipuan
11.0 Moderately
0 28
6.2 x 10⁻³
Fast
San Fernando,
rapid
28 45
1.1 x 10⁻³
Fast
Pampanga
45 60
5.5 x 10⁻³
Fast
3 Carmencita
92.0
Very rapid
0 10
1.6 x 10⁻²
Very fast
Floridablanca
10 40
2.4 x 10⁻²
Very fast
Pampanga
40 below
1.3 x 10⁻²
Very fast
4 Mitla, Porac, 17.0 Rapid
0
20
4.9 x 10⁻³
Fast
Pampanga
20 below
2.8 x 10⁻³
Fast
Infiltration Rate (USDA)
Hydraulic Conductivity (USDA)
< 0.125 cm./ hr.
-
Very slow
< 105
-
Very slow
0.125 0.50 cm./ hr.
-
Slow
10-5
-
Slow
0.50 2.00 cm./ hr .
-
Moderately slow
10-3 - 10-4 - Medium
2.00 6.25 cm./ hr.
-
Moderate
10-3
-
Fast
6.25 12.5 cm./ hr.
-
Moderately rapid
10-1 10-2
-
Very Fast
12.5 25.0 cm./ hr.
-
Rapid
> 25.0 cm. / hr.
-
Very rapid
Table 3 - 3.
Concentration levels (ug/g) of Cadmium and Lead in soil samples collected from 4
sites in the lahar areas in Pampanga and Tarlac (March 23 24, 2004).
Cadmium
Lead
Code
Sampling Site
Remark
(ug/g)
(ug/g)
SF3a control
0.0497
1.21
Panipuan, San
No sugar cane
SF3.1 3
0.0744 >mdl
1.78
Fernando,
Ratoon cane
SF3c 0.0235 0.62
Pampanga
Plant cane
Porac
0.1005 > mdl
1.21
Mitla, Porac,
Plant cane
Pampanga
Floridablanca 0.0759
>
mdl 1.22
Carmencita, Plant cane
Floridablanca,
Pampanga
Tcon 1
0.0745 > mdl
1.20
Ratoon cane
Telebanca,
Tcon 2
0.0491
1.19
Plant cane
Concepcion, Tarlac
Tcon 3
0.0488
0.75
Plant cane
Note:
Analyzed using Dry ashing/AAS by Central Analytical Services Laboratory, BIOTECH, UPLB
Instrument Minimum Detection Level : Cadmium = 0.044 ug/g; Lead = 0.0353 ug/g
> = above detection level for the element
ANNEXES-TABLES.DOC/2/9/2005
10
Manila Third Sewerage Project (MTSP)

SECTION THREE
List of Tables
Metropolitan Waterworks and Sewerage System
Table 3 - 4.
Chemical Analysis of Lahar Soils ( July 30 31, 2004)
Sample
pH
Exchangeable Bases
Exch.
CEC
% Base
Laboratory
Sample
Interval
Soil : H20 pH Interpretation
Ca
Mg
Na
K
Sum
EA
Sum
AmAc
Sat'n
Number
Location
(cm)
(1:1)
meq/100 g soil
(sum)
Telebanca,
S04.924
1a-0-20
5.77
medium acid
1.50
0.21
0.13
0.14
1.98
21.79
23.77
3.85
8.33
Concepcion,
Tarlac
S04.925
1b-20-40
6.56
slightly acid
0.75
0.14
0.11
0.08
1.08
17.94
19.02
2.56
5.68
S04.926
Panipuan,
2a-0-28
5.26
strongly acid
1.25
0.25
0.14
0.32
1.96
16.66
18.62
3.20
10.53
San
S04.927
Fernando,
2b-28-45
5.04
strongly acid
1.38
0.25
0.58
0.26
2.47
20.76
23.23
3.20
10.63
Pampanga
S04.928
2c-45-60
5.60
medium acid
1.63
0.27
0.15
2.50
4.55
23.07
27.62
5.13
16.47
Carmencita,
S04.929
3a-0-10
5.73
medium acid
2.75
0.39
27.61
3.39
34.14
21.02
55.16
3.85
61.89
Floridablanc
a, Pampanga
S04.930
3b-10-40
6.59
slightly acid
1.38
0.41
0.27
1.02
3.08
18.97
22.05
4.89
13.97
S04.931
4a-0-20
8.27
moderately
1.75
0.19
0.20
0.77
2.91
20.50
23.41
4.89
12.43
Mitla, Porac,
alkaline
Pampanga
S04.932
4b-20-bel
7.63
mildly alkaline
1.13
0.12
10.98 10.30
22.53
19.48
42.01
2.56
53.63
CEC(meq/ 100g) Fertility Status
10 29
low
30 39
medium
40 49
high
> 50
very high
Reference: Food and Agriculture Organization United Nations Development Program (FAO-UNDP)
ANNEXES-TABLES.DOC/2/9/2005
11
Manila Third Sewerage Project (MTSP)

SECTION THREE
List of Tables
Metropolitan Waterworks and Sewerage System
Table 3 - 5.
Approximate Distance of Meteorological Stations to the Project Sites (km)
Cabanatuan
Sta. Rita
Porac
Bacolor
San Fernando
Project Site
15° 29' N
15o 00' N
15o 04' N
15o 00' N
15o 02' N
120° 58' E
120o 36' E
120o 33' E
120o 39' E
120o 42' E
Angeles 70
18
11
19.5
19
Floridablanca 78
8
10
13.5
19.5
Mexico 87
15
17.5
11
5.5
Porac 71
11.5
2
15
18
San Fernando
87
10
15
6
1.5
Concepcion 70
38
32
38
34
Table 3 - 6.
Monthly and Annual Rainfall Data at Four (4) Rainfall Stations in the Province of
Pampanga
Sta. Rita,
Bacolor,
San Fernando,
Pampanga
Porac, Pampanga
Pampanga
Pampanga
Month
Lat. 15o-00'
Lat. 15o-04'
Lat. 15o-00'
Lat. 15o-02'
Long. 120o-36"
Long. 120o-33'
Long. 120o-39'
Long. 120o-42'
Jan.
7.0
7.5
7.9
11.0
Feb.
1.8
9.3
5.5
4.5
Mar.
12.5
15.0
15.8
15.4
Apr.
13.6
32.1
23.1
22.7
May
244.80
179.80
154.20
162.90
Jun.
294.60
242.30
275.20
226.90
Jul.
327.60
489.20
476.70
277.80
Aug.
523.00
412.20
561.40
369.90
Sept.
338.30
305.50
267.30
250.3
Oct.
197.60
224.60
231.50
252.80
Nov.
143.30
107.4
109.1
88.50
Dec.
41.7
39.7
57.9
57.8
Total
2,145.01
2,064.70
2,185.40
1,704.50
Years of
7 13 11
11
Record
ANNEXES-TABLES.DOC/2/9/2005
12
Manila Third Sewerage Project (MTSP)

SECTION THREE
List of Tables
Metropolitan Waterworks and Sewerage System
Table 3 - 7.
Monthly and Annual Meteorological Data in the Project Sites
Month
Mean
No. of
Temperature (oC)
Wind (m/s)
Rainfall (mm) Rainy Days
Max.
Min.
Mean
Dir.
Speed
January
8.4
2
31.3 20.1 25.7 NE 2
February
5.3
1
32.2 20.3 26.3 NE 2
March
14.7
2
33.4 21.3 27.4 SE 2
April
22.9
3
35.1 22.8 29.0 SE 2
May
185.4
11
35.3 23.8 29.5 SE 2
June
259.8
17
33.5 23.7 28.6 S
2
July
392.8
21
32.3 23.5 27.9 S
2
August
466.6
23
31.6 23.4 27.5 S
2
September
290.4
20
32.0 23.3 27.7 S
1
October
226.6
13
32.3 22.8 27.6 NE 2
November
112.1
8
32.1 21.9 27.0 NE 2
December
49.3
4
31.5 20.9 26.2 NE 3
Annual
2034.1
125
32.7 22.3 27.5 NE 2
Source: PAGASA, Station 330-Cabanatuan, Nueva Ecija, 1961-1995
Note:
Mean rainfall data were obtained from various rainfall stations in Sta. Rita, Porac, Bacolor, and San Fenando,
Pampanga (Table 3-6).
Table 3 - 8.
Rainfall-Intensity (in Millimeters/Hour) of Computed Extreme Values
Station: Hacienda Luisita, San Miguel, Tarlac
RETURN
PERIOD
5
10
15
30
60
2
3
6
12
24
(YEARS)
MINS
MINS
MINS
MINS
MINS
HRS
HRS
HRS
HRS
HRS
2 152.4
112.8
100.8
77.6
52.2 30.0 22.9 13.9 8.4 5.3
5
199.2 159.0 141.6 105.4 72.0 42.5 32.1 18.6 12.4 8.3
10
230.4 189.0 168.8 124.0 85.1 50.9 38.2 21.7 14.9 10.2
15
248.4 206.4 184.0 134.4 92.5 55.6 41.6 23.4 16.4 11.3
20
261.6 218.4 194.8 141.6 97.7 58.9 44.0 24.7 17.4 12.1
25
271.2 227.4 202.8 147.2 101.7 61.5 45.9 25.6 18.2 12.7
50
300.0 255.6 228.4 164.6 114.0 69.3 51.6 28.5 20.6 14.6
100
330.0 283.8 253.2 181.8 126.2 77.0 57.3 31.4 23.1 16.4
Based on 11 Years Of Records
Table 3 - 9.
Rainfall-Intensity (in Millimeters/Hour) of Computed Extreme Values
Station: San Agustin, Arayat, Pampanga
RETURN
PERIOD
5
10
15
30
60
2
3
6
12
24
(YEARS)
MINS
MINS
MINS
MINS
MINS
HRS
HRS
HRS
HRS
HRS
2 163.2
126.0
106.4
81.6
53.7 31.6 22.8 13.9 8.9 5.6
5
236.4 192.6 145.6 106.0 76.4 45.6 32.8 19.3 12.6 8.3
10
284.4 236.4 171.6 122.2 91.4 54.9 39.5 22.9 15.1 10.0
15
312.0 261.6 186.4 131.4 99.9 60.1 43.2 25.0 16.5 11.0
20
331.2 279.0 196.4 137.8 105.8 63.9 45.8 26.4 17.5 11.7
25
345.6 292.2 204.4 142.6 110.4 66.7 47.9 27.5 18.2 12.3
50
391.2 333.6 228.8 157.8 124.4 75.4 54.1 30.9 20.6 13.9
100
435.6 375.0 252.8 173.0 138.4 84.0 60.2 34.2 22.9 15.6
Based on 12 Years of Records
ANNEXES-TABLES.DOC/2/9/2005
13
Manila Third Sewerage Project (MTSP)

SECTION THREE
List of Tables
Metropolitan Waterworks and Sewerage System
Table 3 - 10. Rainfall-Intensity (in Millimeters/Hour) of Computed Extreme Values
Station: Cansinala, Apalit, Pampanga
RETURN
PERIOD
5
10
15
30
60
2
3
6
12
24
(YEARS)
MINS
MINS
MINS
MINS
MINS
HRS
HRS
HRS
HRS
HRS
2
159.6 114.6 97.2 68.8 42.5 27.2 20.0 12.0 8.2 5.6
5 234.0
154.2
125.6
85.8
52.3 37.1 29.6 18.0 13.5 8.7
10 284.4
180.6
144.4
97.0
58.7 43.7 35.9 22.0 17.0 10.8
15
313.2 195.6 154.8 103.4 62.3 47.5 39.4 24.2 18.9 12.0
20
332.4 206.4 162.4 107.8 64.9 50.0 41.9 25.8 20.3 12.8
25
348.0 214.2 168.0 111.2 66.9 52.0 43.9 27.0 21.3 13.5
50
394.8 238.8 185.6 121.8 72.9 58.2 49.8 30.7 24.6 15.4
100 440.4 263.4 203.2 132.2 78.9 64.3 55.6 34.5 27.8 17.4
Based on 12 Years of Records
Table 3 - 11. Rainfall-Intensity (in Millimeters/Hour) of Computed Extreme Values
Station: Sta. Cruz, Porac, Pampanga
RETURN
PERIOD
5
10
15
30
60
2
3
6
12
24
(YEARS)
MINS
MINS
MINS
MINS
MINS
HRS
HRS
HRS
HRS
HRS
2
157.2 115.2 96.8 71.8 46.2 27.9 21.6 13.4 8.7 6.4
5 223.2
157.8
126.0
94.8
61.4 37.6 30.2 19.9 12.6 9.4
10
267.6 186.0 145.2 110.2 71.4 44.1 35.8 24.3 15.2 11.3
15
292.8 201.6 156.0 118.8 77.0 47.8 39.0 26.7 16.7 12.4
20
309.6 213.0 163.6 124.8 81.0 50.4 41.3 28.4 17.7 13.2
25
324.0 221.4 169.6 129.4 84.0 52.4 43.0 29.8 18.5 13.8
50
364.8 247.8 187.6 143.8 93.4 58.4 48.3 33.8 21.0 15.6
100
405.6 273.6 205.6 158.0 102.7 64.5 53.6 37.9 23.4 17.4
Based on 10 Years of Records
Table 3 - 12. Ambient TSP Concentration and Noise Level at the Project Sites
Sta.
Location
Coordinates
Date/Time of
TSP Conc.
Noise Level
No.
Sampling
(ug/Ncm)
(dBA)
Porac, Pampanga
1
Brgy. San Jose, Mitla
March 23, 2004
415.9 60
11:30 am
2
Brgy. Mitla
March 23, 2004
392.8 67
11:41 am
3
Brgy. Mitla
March 23, 2004
334.5 67
12:58 pm
4
Brgy. Mitla
March 23, 2004
204.7 68
2:16 pm
Average TSP Concentration at Porac, Pampanga
337.0 65.5
Floridablanca, Pampanga
5
Brgy. Carmencita
March 23, 2004
128.1 64
4:20 pm
6
Brgy. Carmencita
March 23, 2004
177.8 63
5:40 pm
Average TSP Concentration at Floridablanca, Pampanga
153.0 63.5
San Fernando, Pampanga
7
Brgy. Panipuan
March 24, 2004
310.3 64
9:37 am
8
Brgy. Panipuan
March 24, 2004
450.5 55
10:45 am
ANNEXES-TABLES.DOC/2/9/2005
14
Manila Third Sewerage Project (MTSP)

SECTION THREE
List of Tables
Metropolitan Waterworks and Sewerage System
Sta.
Location
Coordinates
Date/Time of
TSP Conc.
Noise Level
No.
Sampling
(ug/Ncm)
(dBA)
Average TSP Concentration at San Fernando, Pampanga
380.4 59.5
Mexico, Pampanga
9 Brgy.
Panipuan,
March
24,
2004
174.4 73
Mexico
12:35 pm
10
Brgy. Panipuan
March 24, 2004
170.3 66
1:45 pm
Average TSP Concentration at Mexico, Pampanga
172.4 69.5
Angeles City, Pampanga
11
Brgy. Mining
March 24, 2004
148.9 66
3:02 pm
12
Brgy. Mining
March 24, 2004
195.6 67
4:15 pm
Average TSP Concentration at Angeles, Pampanga
172.2 66.5
Concepcion, Tarlac
13
Brgy. Telebanca
March 25, 2004
291.7 54
8:25 am
14
Brgy. Telebanca
March 25, 2004
139.8 48
9:30 am
15
Brgy. Telebanca
March 25, 2004
251.7 67
10:40 am
16
Brgy. Telebanca
March 25, 2004
533.1 55
11:50 am
Average TSP Concentration at Concepcion, Tarlac
304.1 56
Source: Air and Noise Quality Monitoring of Berkman Systems, Inc., March 23-25, 2004
Table 3 - 13. Environmental Quality Standards for Noise in General Areas
Category
Daytime
Morning and Evening
Night time
of Area
(in decibels, dBA)
(dBA)
(dBA)
AA 50
45
40
A 55
50
45
B 65
60
55
C 70
65
60
D 75
70
65
To determine the noise levels at various categories, four distinct periods were identified ---morning,
daytime, evening, and night time. The division of the 24-hour period are as follows:
Morning
-
5:00 AM to 9:00 AM
Daytime
-
9:00 AM to 6:00 PM
Evening
-
6:00 PM to 10:00 PM
Nighttime
-
10:00 PM to 5:00 AM
Table 3 - 14. Summary of Well Data from Inventoried Wells
Coordinates
Well
Reported
Location
Type
Remarks
ID.
North
East
Depth (m)
Latitude
Longitude
30 years old;
Panipuan, San
Hand-
GW
1
15ş 06' 59"
120ş 38' 17"
7.6
Fernando
pump
monitoring
well
ANNEXES-TABLES.DOC/2/9/2005
15
Manila Third Sewerage Project (MTSP)

SECTION THREE
List of Tables
Metropolitan Waterworks and Sewerage System
Coordinates
Well
Reported
Location
Type
Remarks
ID.
North
East
Depth (m)
Latitude
Longitude
Mining,
Hand-
2
15ş 08' 24"
120ş 36' 52"
7.6 <
1
year
old
Angeles
pump
Calubasa,
Hand-
3
15ş 08' 41"
120ş 38' 58"
30.5 16
years
old
Mexico
pump
120ş 39'
Camuning,
Hand-
4 15ş
07'
13"
6.0 10
years
old
25.8"
Mexico
pump
Motorized,
Camuning,
Irrigation
5
15ş 07' 25"
120ş 39' 26"
Not known
yield approx.
Mexico
Well
5 lps
Hand
6
15ş 07' 50"
120ş 39' 21"
Eden, Mexico
30.5 7
years
old
pump
Suclaban,
Hand
7
15ş 08' 14"
120ş 38' 30"
6.0 10
years
old
Mexico
pump
Motorized,
Suclaban,
Irrigation
8
15ş 08' 14"
120ş 38' 30"
Not known
yield approx.
Mexico
Well
5 lps
Hand
9
15ş 08' 14"
120ş 38' 30"
Acli, Mexico
6.0 5
years
old
pump
Baliti, San
Hand
10
15ş 08' 14"
120ş 38' 30"
6.7 5
years
old
Fernando
pump
Panipuan, San
Irrigation
11
15ş 06' 31"
120ş 38' 13"
18.3 6
months
old
Fernando
well
GW
LAREC farm,
Irrigation
LAREC
14ş 59' 25"
120ş 31' 35"
Not known
monitoring
Floridablanca
well
well
GW
Carmen
Carmencita,
Hand
14ş 56' 55"
120ş 29' 26"
44.0
monitoring
cita-1
Floridablanca
pump
well
Near soil
Carmen
Carmencita,
Hand
14ş 57' 11"
120ş 29' 04"
6.0
infiltration test
cita-2
Floridablanca
pump
station
Monoport
GW
Irrigation
Porac-1
15ş 04' 54"
120ş 34' 24"
Trading, Inc.
45.0
monitoring
well
Mitla, Porac
well
Monoport
GW
Irrigation
Porac-2
15ş 04' 56"
120ş 34' 38"
Trading, Inc.
45.0
monitoring
well
Mitla, Porac
well
Monoport
Irrigation
Porac-3
14ş 04' 55"
120ş 34' 41"
Trading, Inc.
45.0
well
Mitla, Porac
2 years old;
Concepc
Telebanca,
Hand
GW
15ş 17' 59"
120ş 38' 08"
24.0
ion-1
Concepcion
pump
monitoring
well
Concepc
Telebanca,
Hand
15ş 17' 23"
120ş 37' 48"
27.5 3
years
old
ion-2
Concepcion
pump
ANNEXES-TABLES.DOC/2/9/2005
16
Manila Third Sewerage Project (MTSP)

SECTION THREE
List of Tables
Metropolitan Waterworks and Sewerage System
Table 3 - 15. Water Well Data Summary of Project Areas (NWRC, 1982)
Specific Capacity
Static Water Level (SWL) Statistics
No. of
Well Depth (m)
SWL (mbgs)
(lps/m)
Town
Wells
1 to 3
3.1 to 6
6.1 above
Considered
Average
Range
Average
Range
Average
Range
mbgs
mbgs
mbgs
Pampanga
13.41
0.91
Angeles City
11
5
-
28
0.79
0.72 2.49
82.63
11.0
196.65
29.88
12.2
Floridablanca
-
7
-
36
1.09
0.5 5.17
52.76
6.75 0.3
17.07
160.06
26.52
Mexico 35 2 - 35
0.99
0.05
2.52
61.1
2.33 0.3
9.17
117.38
11.89
Porac 6
10
-
31
0.76
0.1
3.83
29.48
10.69 0.3
35.06
58.23
17.99
San Fernando
35
9
-
41
-
-
52.20
2.64 0.91
5.18
220.43
Tarlac
0.109
Concepcion
29
3
-
34
1.05
0.12 6.90
12.3
4.91 15.1
1.8
7.62
Source: Rapid Assessment of Water Supply Sources, Provinces of Pampanga and Tarlac, NWRC, 1982
ANNEXES-TABLES.DOC/2/9/2005
17
Manila Third Sewerage Project (MTSP)

SECTION THREE
List of Tables
Metropolitan Waterworks and Sewerage System
Table 3 - 16. List of Rivers Near the Application Sites
Drainage Area
Period of
River Name
Location
(sq. km)
Record
Porac River
Del Carmen, Floridablanca,
118 1946
-1970
Pampanga
Pasig-Potrero River
Hacienda Dolores, Porac
28 1966
1970
Pampanga
Caulaman River
Pabanlag, Floridablanca
72 1954
1970
Pampanga
Gumain River
Pabanlag, Floridablanca
128 1946
1970
Pampanga
Abacan River
Palumangui, Angeles City
45 No
Record
Pampanga
Sacobia-Bamban
Bamban, Concepcion
130 No
Record
River
Tarlac
Source: Bureau of Research Standards (BRS) DPWH, 2004
Table 3 - 17. Mean Monthly Flow in Cubic Meters Per Second (CMS)
Caulaman River
Gumain River
Pasig-Potrero
Porac River
Month
Pabanlag,
Pabanlag,
River, Hacienda
Del Carmen,
Floridablanca,
Floridablanca,
Dolores, Porac,
Floridablanca,
Pampanga
Pampanga
Pampanga
Pampanga
January
0.71
2.68
0.35
2.09
February
0.65
2.16
0.14
1.73
March
0.57
2.10
0.42
1.67
April
0.62
2.11
0.50
1.61
May
3.29
4.34
0.58
2.52
June
4.52
8.80
0.49
4.11
July
15.15
15.45
0.58
8.30
August
12.95
24.64
1.66
14.05
September
14.80
21.21
1.33
11.62
October
3.19
11.58
0.72
6.93
November
1.85
6.61
0.82
3.83
December
0.94
3.91
0.40
2.81
Table 3 - 18. Mean Monthly Flow in Cubic Meters Per Second (CMS)
Abacan River
Sacobia Bamban River
Month
Palumangui, Angeles City
Bamban, Concepcion, Tarlac
January 0.85
4.79
February 0.70
2.68
March 0.68
2.97
April 0.065
2.89
May
1.02
3.82
June 1.66
3.86
July 3.36
8.30
August 5.70
10.35
September 4.70
9.70
October 2.81
12.75
November 1.55
10.80
December 1.14
3.58
ANNEXES-TABLES.DOC/2/9/2005
18
Manila Third Sewerage Project (MTSP)

SECTION THREE
List of Tables
Metropolitan Waterworks and Sewerage System
Table 3 - 19. Actual Discharge Measurements at Porac River, Nasudeco, Floridablanca,
Pampanga
Velocity
Area
Discharge (Q)
Date
(meters per second)
(square meter)
(CMS)
2-17-04
0.482
4.92
2.37
1-13-04
0.486
5.00
2.43
11-12-03
0.416
5.40
2.24
10-24-03
0.473
6.32
2.99
9-17-03
0.419
7.66
3.21
8-13-03
0.529
10.85
5.74
7-16-03
0.419
4.12
1.72
6-26-03
0.363
4.31
1.56
5-20-03
0.350
5.68
1.99
Source: BRS DPWH 2004
Table 3 - 20. Actual Streamflow Measurements at Porac River, Poblacion, Porac, Pampanga
Velocity
Area
Discharge (Q)
Date
(meters per second)
(square meter)
(CMS)
1-13-04
0.625
2.97
1.866
11-12-03
0.483
2.953
1.42
10-24-03
0.624
2.870
1.79
9-17-03
0.582
3.07
1.79
8-13-03
0.550
4.30
2.35
7-16-03
0.405
3.14
1.27
6-26-03
0.560
3.64
2.05
Source: BRS DPWH 2004
Table 3 - 21. Actual Discharge Measurements at Sacobia-Bamban River, San Francisco,
Concepcion, Tarlac
Velocity
Area
Discharge (Q)
Date
(meters per second)
(square meter)
(CMS)
9-20-94 0.618
4.25 2.630
8-17-94 0.662
9.90 6.210
7-22-94 1.22 28.34 35.430
5-18-94 0.172 0.799 0.316
4-20-94 0.256 1.145 0.290
3-9-94 0.112 0.610 0.068
2-4-94 0.126 0.732 0.091
1-28-94 0.14 1.440 0.201
12-14-93 0.623
0.623 1.726
Source: BRS DPWH 2004
Table 3 - 22. Actual Streamflow Measurements at Pasig-Potrero River, Mancatian, Porac,
Pampanga
Velocity
Area
Discharge (Q)
Date
(meters per second)
(square meter)
(m3 per second)
8-31-94
1.08 1]
1.45
1.33
8-10-94
1.43 1]
6.00
7.30
8-4-94
0.893 1]
0.10
0.70
9-25-94
0.645 2]
28.125
15.42
Source: BRS DPWH 2004
Note: 1] by float method
2] by float method at Kabitecan bridge
ANNEXES-TABLES.DOC/2/9/2005
19
Manila Third Sewerage Project (MTSP)

SECTION THREE
List of Tables
Metropolitan Waterworks and Sewerage System
Table 3 - 23. Annual Peak Flow Series of Rivers in Tarlac and Pampanga Provinces
Peak Flow in CMS
Porac River
Caulaman River
Gumain River
Porac River
Del Carmen,
Pabanlag,
Pabanlag,
Del Carmen,
Year
Floridablanca,
Floridablanca,
Floridablanca,
Floridablanca,
Pampanga
Pampanga
Pampanga
Pampanga
D.A.-111 km2
D.A.-72 km2
D.A.-128 km2
D.A.-28 km2
1946
508.80
-
187.15
-
1947
198.80
-
115.60
-
1948
484.00
-
197.65
-
1949
232.00
-
127.30
-
1950
400.00
-
154.75
-
1951
232.00
-
74.75
-
1952
282.00
-
138.73
-
1953
481.20
-
188.25
-
1954
201.60
-
93.67
-
1955
267.60
668.70
218.20
-
1956
-
97.16
217.60
-
1957
5.45
570.45
246.70
-
1958
6.93
338.58
192.10
-
1959
21.30
629.40
150.50
-
1960
128.50
240.33
254.50
-
1961
67.60
283.56
206.40
-
1962
400.00
849.48
310.40
-
1963
54.80
668.70
310.40
-
1964
124.10
708.00
375.40
-
1965
134.00
755.16
164.80
-
1966
227.40
959.52
283.10
4.30
1967
224.60
181.38
253.20
7.15
1968
35.90
39.90
127.10
8.86
1969
72.40
157.80
47.50
6.01
1970
146.00
676.56
267.50
2.22
Total
4,936.98
7,824.68
4,903.25
28.54
Mean
205.70
489.06
196.13
5.71
Standard
150.54
289.00
76.28
2.56
Deviation
Source: BRS-DPWH 2004
Table 3 - 24. Magnitude of Flood with Corresponding Return Period of Various Rivers
Porac River
Caulaman River
Gumain River
Pasig-Potrero River
Return
Del Carmen,
Pabanlag,
Pabanlag,
Dolores,
Period
Floridablanca,
Floridablanca,
Floridablanca,
Porac,
(year)
Pampanga
Pampanga
Pampanga
Pampanga
D.A.-111 km2
D.A.-72 km2
D.A.-128 km2
D.A.-28 km2
10 401.40 865.00 295.30
9.04
20 470.00 970.00 330.00
10.00
50 560.00 1,200.00 385.00
12.50
100 678.40 1,396.00 435.60
13.74
ANNEXES-TABLES.DOC/2/9/2005
20
Manila Third Sewerage Project (MTSP)

SECTION THREE
List of Tables
Metropolitan Waterworks and Sewerage System
Table 3 - 25. Magnitude of flood with corresponding return period of Sacobia-Bamban and
Abacan rivers in cubic meters per second (cms)
Abacan River
Sacobia Bamban River
Return Period
Palumangui, Angeles City
Bamban, Concepcion, Tarlac
(Year)
Pampanga, D.A.-45 km2
D.A. 130 km2
10 170.00
448.00
20 240.00
550.00
50 433.00
755.00
100 527.00
910.00
Table 3 - 26. Monthly Rainfall at the Application Sites
Month
Rainfall (mm)
January 8.35
February 5.28
March 14.70
April 22.90
May 185.40
June 259.80
July 392.80
August 466.60
September 290.40
October 226.62
November 112.10
December 49.30
Total 2,034.25
Table 3 - 27. Monthly evapotranspiration at the project site
Month
Evatranspiration (mm)
January 120.00
February 126.00
March 183.00
April 189.00
May 190.00
June 141.00
July 146.00
August 100
September 129
October 121
November 124
December 130
Total 1,709.00
ANNEXES-TABLES.DOC/2/9/2005
21
Manila Third Sewerage Project (MTSP)

SECTION THREE
List of Tables
Metropolitan Waterworks and Sewerage System
Table 3 - 28. Runoff depth of the Application Sites
Month
Runoff (mm)
January (21.70)
59.00
February (0)
37.30
March (5.8)
43.10
April (2.0)
39.00
May (42.70)
80.00
June (78.7)
116.00
July (224.70)
262.00
August (518.70)
256.00
September (244.6)
214.60
October (125.0)
195.00
November (56)
126.00
December (28.70)
66.00
Total (1,846.70)
1,693.00
Table 3 - 29. Estimated Monthly Infiltration Rate
Month
Infiltration Rate (mm)
January 1.25
February 1.80
March 2.21
April 3.44
May 27.00
June 13.00
July 20
August 23.33
September 14.52
October 11.33
November 5.6
December 4.90
Total 128.18
ANNEXES-TABLES.DOC/2/9/2005
22
Manila Third Sewerage Project (MTSP)

SECTION THREE
List of Tables
Metropolitan Waterworks and Sewerage System
Table 3 - 30. Monthly Balance Calculation of Application Sites
Evatran-
Rainfall
Runoff
Infiltration
Month
spiration
Remarks
(mm)
(mm)
(mm)
(mm)
January 8.25
(21.70)
59.0
120 1.25
-134.60
February 5.28
(0)
37.30
136
.80
-131.50
March 14.70
(5.8)
43.10
183 2.21
-176.30
April 22.90
(2.0)
39.00
189 3.44
-171.54
May 185.40
(42.70)
80.00 190 27.80 -75.6
June 259.80
(78.7)
116.00
141.00 13.00 +
27.1
July 392.80 (224.70)
262.00
146.00
2.0 +2.0
August 466.60 (318.70)
356.00 100.00
23.33
+24.60
September 290.40
(244.6)
314.60 129.00
14.52 -97.72
October 226.62
(125)
195.00
121.00 11.33 -30.71
November 112.10
(56)
126.00 124.00
5.6
-
73.50
December 49.30
(28.70)
66.00
130.00
4.90 -114.30
Total 2,034.25 (1,246.70)
1,693.00
1,709.00 128.18
Table 3 - 31. Water and Sediment Quality Sampling Station Data
Station
Location
Approx.
Coordinates
Parameters
Date/Time
Dist. To
Collected
Collected
Test Site
Lat. N
Long. E
(Km)
L1
Gumain River, 50m
1.3 14o57'7.6" 120o29'31.1" -Basic
23 Mar 2004
downstream of the
physico-
4:10 P.M.
bridge (Test site: Brgy.
chemical
Carmencita,
Floridablanca,
-Water quality
(no PCB)
Pampanga)
- Sediment
quality (no
PCB)
L2 Panipuan
Creek,
70m
1.3 15o06'37.2" 120o37'38.8"
-Basic
24 Mar 2004
downstream of the
physico-
12:36 P.M.
bridge (Test site: Brgy.
chemical
Panipuan, San
Fernando, Pampanga)
-Water quality
- Sediment
quality
L3 Freshwater
tilapia
1.8 15o04'13.7" 120o33'28.9"
-Basic
23 Mar 2004
fishpond in Brgy. San
physico-
12:20 P.M.
Jose Mitla. Water
chemical
source is from ground
water by use of water
-Water quality
pumps. (Test site:
(no PCB)
Monoport Traders,
- Sediment
Brgy. Mitla, Porac,
quality (only
Pampanga)
metals)
L4
Pond along the dike
1.2 15o16'58.8" 120o36'52.9"
-Basic
24 Mar 2004
(Bamban River) (Test
physico-
9:06 A.M.
site: A.B. Gonzales
chemical
Farm, Brgy. Telabanca,
-Water quality
Concepcion, Tarlac)
ANNEXES-TABLES.DOC/2/9/2005
23
Manila Third Sewerage Project (MTSP)

SECTION THREE
List of Tables
Metropolitan Waterworks and Sewerage System
Station
Location
Approx.
Coordinates
Parameters
Date/Time
Dist. To
Collected
Collected
Test Site
Lat. N
Long. E
(Km)
(no PCB)
- Sediment
quality (no
PCB)
ANNEXES-TABLES.DOC/2/9/2005
24
Manila Third Sewerage Project (MTSP)

SECTION THREE
List of Tables
Metropolitan Waterworks and Sewerage System
Table 3 - 32. Basic Physico-Chemical and Water Quality Data of Selected Freshwater Bodies in the Lahar Areas of Pampanga and Tarlac
(23 and 24 March 2004).
Stations
National Water Quality
Standards
Parameters
Units
L1
L2
L4
Gumain River
Panipuan Creek
Pond
Class C
Class D
Temperature
oC 32 34 30 3oC rise
3oC rise
Dissolved
Oxygen
(DO) mg/L
6.8 4.3 6.2 5.0
3.0
Hydrogen-ion
Concentration
(pH)
-
8.01 7.83 8.39 6.5-
8.5
6.0-
9.0
Total Suspended Solids (TSS)
mg/L
290
42
9.0
30
60
Total Dissolved Solids (TDS)
mg/L
388
321
1,020
--
1,000
Biological Oxygen Demand (BOD5) mg/L
3
28
3
7
10
Phosphorus as Phosphate
mg/L
4.1
47
6.4
0.4
--
Total Phosphorus as P
mg/L
2,490
3,260
2,160
-
-
Oil
&
Grease
mg/L
3.3 2.6 <2.0
2 5
Total Coliform
MPN/100 mL
2,000
1.6 x 10⁶ 1,300
5,000 --
Fecal Coliform
MPN/100 mL
2,000
1.6 x 10⁶ 400
--
--
Station L1 = sampling point located 50m downstream of the steel/concrete bridge, near Brgy. Carmencita, Floridablanca, Pampanga
Station L2 = sampling point located 70m downstream of the concrete bridge, Brgy. Panipuan, San Fernando, Pampanga
Station L4 = pond located near the lahar dike along Bamban River, Brgy. Telabanca, Concepcion, Tarlac
Class C = fishery water for the propagation and growth of fish and other aquatic resources
Class D = for agriculture, irrigation, livestock watering, etc.
Reporting Limits = DO- 2.0, TSS- 4.0, TDS- 4.0, BOD- 2.0, Phosphate- 0.06, P-3.0, Oil & Grease- 2.0
ANNEXES-TABLES.DOC/2/9/2005
25
Manila Third Sewerage Project (MTSP)

SECTION THREE
List of Tables
Metropolitan Waterworks and Sewerage System
Table 3 - 33. Total and Fecal Coliform Concentrations (MPN/100mL) Reported for Deepwell
Water in Pampanga and Tarlac (20 November 2003- 03 February 2004).
Location
Total Coliform
Fecal Coliform
Carmencita-1
< 2.2 80
< 2.2 - 30
Floridablanca
Larec,
< 2.2 - < 16
< 2.2 - > 16
Floridabl anca
Larec,
< 2.2
< 2.2
Floridablanca-RDW
Porac
9.2 <
2.2
Pampanga
Porac
< 2.2
< 2.2
Pampanga-1
Porac,
2.2 2.2
Pampanga-2
Mancatian
23 x 105
30 x 104
Pampanga
Concepcion-1
< 2.2 9.2
< 2.2
Tarlac
Concepcion-2
9.2 <
2.2
Tarlac
PNSDW Standard
Nil nil
Source: 1) Manila Water Company, Inc. (MWCI) Report of Analysis- DW, Pampanga 04-01-001;
04-02-002; 11-03-11-545, 546,547,548
2) Intertek Lab. Test Report No. RW 0402053 (WT6-0513), 11 February 2004
Table 3 - 34. Metal Concentrations for Water (mg/L) and Sediment (mg/kg dry weight) Samples
at All Stations (23 and 24 March 2004)
Arsenic
Cadmium
Chromium
Lead
Mercury
Station/Location
Water
Sediment
Water
Sediment
Water
Sediment
Water
Sediment
Water
Sediment
Station L1
(Gumain River)
< 0.005
< 0.20
0.009
< 0.02
< 0.04
< 0.04
<0.01
< 0.06
< 0.0001
< 0.0001
Station L2
(Panipuan Creek)
< 0.005
< 0.20
0.01
< 0.02
< 0.04
14
< 0.01
3.7
< 0.0001
< 0.0001
Station L4
(Pond)
< 0.005
< 0.20
0.01
< 0.02
< 0.04
< 0.04
< 0.01
< 0.06
< 0.0001
< 0.0001
Reporting
Limits
0.005
0.20
0.003
0.02
0.04
0.04
0.01
0.06
0.0001
0.0001
National Water
Quality
Standards
-Class C
0.05
-
0.01
-
0.05
-
0.05
-
0.002
-
-Class D
0.1
-
0.05
-
0.1
-
0.5
-
0.002
-
Station L1 = sampling point located 50m downstream of the steel/concrete bridge, near Brgy. Carmencita, Floridablanca, Pampanga
Station L2 = sampling point located 70m downstream of the concrete bridge, Brgy. Panipuan, San Fernando, Pampanga
Station L4 = pond located near the lahar dike along Bamban River, Brgy. Telabanca, Concepcion, Tarlac
Class C = fishery water for the propagation and growth of fish and other aquatic resources
Class D = for agriculture, irrigation, livestock watering, etc.
ANNEXES-TABLES.DOC/2/9/2005
26
Manila Third Sewerage Project (MTSP)

SECTION THREE
List of Tables
Metropolitan Waterworks and Sewerage System
Table 3 - 35. Metal Concentrations (mg/L) Reported for Deepwell Water in Pampanga and
Tarlac (20 November 2003 03 February 2004).
Location
Arsenic
Cadmium
Chromium
Lead
Nickel
Mercury
Carmencita
n.d.
n.d. 0.037
n.d.
n.d. 0.776
n.d.
n.d.
Floridablanca
Larec,
n.d. n.d.-
0.044 n.d.
n.d.- 0.071
n.d.
n.d.
Floridablanca
Larec,
- 0.034 n.d. 0.71 - -
Floridablanca-RDW
Porac
n.d. n.d.-
0.012 n.d. n.d.
n.d.
n.d.
Pampanga
Porac
- 0.04 n.d. 0.053 - -
Pampanga-1
Porac,
- 0.036 n.d 0.041 - -
Pampanga-2
Mancatian
- 0.036 n.d. 0.743 - -
Pampanga
Concepcion
- 0.012-
0.042 n.d.
0.076
-
-
Tarlac
Concepcion-2
n.d. n.d. n.d.
n.d. n.d. n.d
Tarlac
Limits- PNSDW
0.01
0.003
0.05
0.01
-
0.001
Source: 1) Manila Water Company, Inc. (MWCI) Report of Analysis- DW, Pampanga
04-01-001; 04-02-002; 11-03-11-545, 546,547,548
2) Intertek Lab. Test Report No. RW 0402053 (WT6-0513), 11 February 2004
n.d. = not detected by method used
( - ) = no sampling done
ANNEXES-TABLES.DOC/2/9/2005
27
Manila Third Sewerage Project (MTSP)

SECTION THREE
List of Tables
Metropolitan Waterworks and Sewerage System
Table 3 - 36. Composition and Abundances of Phytoplankton and Zooplankton Organisms Sampled at All Stations (23 and 24 March 2004).
Stations
MEAN
MEAN
L1 (Gumain River)
L2 (Panipuan Creek)
L3 (Tilapia Fishpond)
L4 (Pond)
TOTAL
TOTAL
Total
%
Total
%
Total
%
Total
%
ABUNDANCE
ABUNDANCE BY
Taxa
Organism
Total
Organism
Total
Organism
Total
Organism
Total
BY SPECIES
MAJOR GROUP
Abundance
Abundance
Abundance
Abundance
Abundance
Abundance
Abundance
Abundance
(%)
(%)
(no./L)
(no./L)
(no./L)
(no./L)
PHYTOPLANKTON
Blue-Green Algae
(Cyanophyceae)
85.3
Polycystis
350,000
58.3
2,750,000
87.5
9,300,000
73.3
2,100,000
98.0
79.3
Anabaena
30,000
5.0
30,000
1.0
20,000
0.2
10,000
0.5
1.7
Nostoc
70,000
11.7
150,000
4.7
4,900
0.0
10,000
0.5
4.3
Green Algae
6.9
(Chlorophyceae)
Scenedesmus
-
-
-
-
2,150,000
16.9
-
-
4.2
Selenastrum
-
-
30,000
1.0
600,000
4.7
-
-
1.4
Ankistrodesmus
-
-
-
-
460,000
3.6
-
-
0.9
Pediastrum
-
-
-
-
150,000
1.2
10,000
0.5
0.4
Diatoms
6.8
(Bacillariophyceae)
Gyrosigma
50,000
8.3
100,000
3.2
-
-
-
- 2.9
Melosira
-
-
40,000
1.3
-
-
-
- 0.3
Nitzschia
80,000
13.3
30,000
1.0
-
-
-
- 3.6
Sub-Total
580,000
96.6
3,130,000
99.7
12,684,900
99.9
2,130,000
99.5
99.0 99.0
ZOOPLANKTON
Ciliates
1.0
Paramecium
20,000
3.3
10,000
0.3
-
-
10,000
0.5
1.0
Copepods
0.0
Copepod nauplii
-
-
-
-
10,000
0.1
-
-
0.0
Sub-Total
20,000
3.3
10,000
0.3
10,000
0.1
10,000
0.5
1.0 1.0
TOTAL
600,000
100.0
3,140,000
100.0
12,694,900
100.0
2,140,000
100.0
100.0 100.0
Characteristic of the
River channel; fast flowing water;
Main channel; slow flowing
Tilapia fishpond; stagnant, low water;
Shallow depth; stagnant, clear
Sampling Point
very shallow depth, clear water;
water; very shallow depth, clear
water source is from ground water by
water; bottoms of "lahar"
coarse bottoms of small size
water; black sandy-muddy
use of water pumps; turbid/green;
sand; kangkong and talahib lined
pebbles/gravel and "lahar" sand
bottoms
substrates consists of black sand-mud
the banks
Station L1 sampling point located 50m downstream of the steel/concrete bridge, near Brgy. Carmencita, Floridablanca, Pampanga
Station L2 - sampling point located 70m downstream of the concrete bridge, Brgy. Panipuan, San Fernando, Pampanga
Station L3 - fishpond located near the lahar dike at Brgy. San Jose Mitla, Porac Pampanga
Station L4 - pond located near the lahar dike along Bamban River, Brgy. Telabanca, Concepcion, Tarlac
ANNEXES-TABLES.DOC/2/9/2005
28
Manila Third Sewerage Project (MTSP)

SECTION THREE
List of Tables
Metropolitan Waterworks and Sewerage System
Table 3 - 377. Composition and Abundances of Soft-Bottom Benthic Organisms Sampled at All Stations (23 and 24 March 2004).
Stations
L1 (Gumain River)
L2 (Panipuan Creek)
L3 (Tilapia Fishpond)
L4 (Pond)
MEAN
MEAN
Total
%
Total
%
Total
%
Total
%
DENSITY
% RELATIVE
Taxa
Organism
Total
Organism
Total
Organism
Total
Organism
Total
By MAJOR
ABUNDANCE
Abundance
Abundance
Abundance
Abundance
Abundance
Abundance
Abundance
Abundance
GROUP
By MAJOR
(no.
(no. indv/m2)
(no. indv/m2)
(no. indv/m2)
(no. indv/m2)
GROUP
indv/m2)
Oligochaeta
22
2.9
44
4.7
44
5.1
28
0.4
Mollusca
Gastropoda
Thiaridae
156
18.0
39
0.6
Insecta
Diptera
Chironomidae
Chironomus larvae
689
91.3
23,844
94.9
889
95.3
578
66.6
6,856
99.0
Chironomus nymph
22
2.9
1,289
5.1
89
10.3
Ceratopogonidae
Ceratopogonid larvae
22
2.9
TOTAL 755
100.0
25,133
100.0
933
100.0
867
100.0
6,923
100.0
Characteristic of the Sampling
River channel; fast flowing
Main channel; slow flowing
Tilapia fishpond; stagnant,
Shallow depth; stagnant, clear
Point
water; very shallow depth,
water; very shallow depth,
low water; water source is
water; bottoms of "lahar"
clear water; coarse bottoms
clear water; black sandy-
from ground water by use of
sand; kangkong and talahib
of small size pebbles/gravel
muddy bottoms
water pumps; turbid/green;
lined the banks
and "lahar" sand
substrates consists of black
sand-mud
Station L1 sampling point located 50m downstream of the steel/concrete bridge, near Brgy. Carmencita, Floridablanca, Pampanga
Station L2 - sampling point located 70m downstream of the concrete bridge, Brgy. Panipuan, San Fernando, Pampanga
Station L3 - fishpond located near the lahar dike at Brgy. San Jose Mitla, Porac Pampanga
Station L4 - pond located near the lahar dike along Bamban River, Brgy. Telabanca, Concepcion, Tarlac
ANNEXES-TABLES.DOC/2/9/2005
29
Manila Third Sewerage Project (MTSP)

SECTION THREE
List of Tables
Metropolitan Waterworks and Sewerage System
Table 3 - 38. Endemicity, Distribution, Ecological Status and Roles/Uses of Plants Species
Surveyed in the Sugarcane Plantation
Endemicity /
Common
Family
Scientific Name
Habit
Distribution /
Role / Uses
Name
Ecological Status
ARECACEAE (Palmae)
Cocos nucifera
Coconut
-do-
W
Multipurpose
COMPOSITAE (Asteraceae)
Ageratum conyzoides
Bulak manok
Herb
W,C
Weed; Medicinal
Tridax procumbens
Wild daisy
Herb
W,C
Weed
CYPERACEAE
Cyperus rotundus
Mutha Herb
W
-do-
LEGUMINOSAE (Caesalpiniaceae, Papilionaceae and Mimosaceae)
Gliricidia sepium
Kakawate Tree
W
Firewood
Leucaena leococephala
Ipil-ipil Tree
W
Firewood
spiny
Mimosa pudica
Makahiya
W
Weed/medicinal
herbs
POACEAE
Axonopus compressus
Carabao grass
Herb
W
Weed, lawn
Imperata cylindrica
Cogon Herb
W
-do-
Paspalum conjugatum
Kulape Herb
W
-do-
Saccharum spontaneum
Talahib Herb
W
-do-
SOLANACEAE
Talong Punay
Datura metel
Shrub W,
C
Medicinal
VERBENACEAE
Stachytarpheta jamaicensis
Kandi-kandilaan Herb W,
C
Medicinal
Legend: W - Wide distribution (occurred also in other countries)
C - Common
ANNEXES-TABLES.DOC/2/9/2005
30
Manila Third Sewerage Project (MTSP)

SECTION THREE
List of Tables
Metropolitan Waterworks and Sewerage System
Table 3 - 39. Faunal Species Commonly Found in the Sampling Area
Group
Common Name
Scientific Name
Role/Status
Occurrence
Reptiles Common
Snake Lycodon aulicus
Ecological/
Reported
Common
Frog Bufus marinus
Ecological/
Observed
Common
Birds Layang-layang
Hirundo spp.
Ecological/
Observed
Common
Uwak Corvus spp.
Ecological/
Observed
Common
Maya Lonchura malacca
Ecological/
Observed
Common
Insects
Aphis maydis
Ecological/
Observed
Common
Red
Ant
Formica sanguinea
Ecological/
Observed
Black Ant
Monomorium sp.
Common
Grasshopper
Gastrimargus marmoratus
Ecological/
Observed
Brown Grasshopper Mlanoplus sp.
Common
Spider Theridion sp.
Ecological/
Observed
Common
Table 3 - 40. Population Size and Growth and Mean Household Size in the Municipalities/Cities
and Barangays in the Project Site: 1990 and 2000
Mucinipalities/Cities/
1990
2000
Population
Household
Barangay
Growth
Size
Pampanga
Angeles
236,685
263,971
1.1
4.7
Mining
1,122
1,626
3.8
Floridablanca
66,146
85,304
2.6
5.1
Carmencita
1,526
1,701
1.1
Mexico
69,441
109,481
4.7
5.4
Eden
362
543
4.1
Gandus
473
681
3.7
Suklaban
584
748
2.5
Calubasa
2,303
2,002
(1.4)
Acli
979
2,255
8.7
Porac
68,215
80,757
1.7
5.1
Mancatian
3,423
180
(25.5)
San Fernando
157,851
221,857
3.5
5.1
Panipuan
1,620
2,576
4.7
Molino
2,462
5,474
8.3
Baliti
2,708
3,940
3.8
Tarlac
Concepcion
103,146 115,171
1.1
5.5
Telebanca
2,249
28
(35.5)
Total (Barangays)
19,811 21,754
0.9
Total (Municipalities/Cities)
701,484
876,541
2.2
5.1
Source: National Statistics Office
ANNEXES-TABLES.DOC/2/9/2005
31
Manila Third Sewerage Project (MTSP)

SECTION THREE
List of Tables
Metropolitan Waterworks and Sewerage System
Table 3 - 41. Volume of Production and Area covered by Sugarcane (1999-2003)
Region/
Volume of Production (M.T.)
Area (Ha)
Province
1999
2000
2001
2002
2003
1999
2000
2001
2002
2003
Philippines
23,777,828 21,223,438 21,708,722 21,417,288 23,946,822 404,065 383,824 373,705 359,866 389,233
Central
1,275,730 1,557,413 1,454,907 1,531,828 1,427,670 24,349 28,554 25,845 28,302 28,091
Luzon
Pampanga
386,301 476,610 469,708 526,362 466,827 9,143 9,433 8,473 9,698 9,597
Tarlac
889,398 1,079,584 984,369 1,004,686 960,157 15,205 19,083 17,342 18,577 18,467
(Source: Program Monitoring and Evaluation Division (PMED)-Planning Service & Performance of Agriculture, January
December 2003, Bureau of Agricultural Statistics)
Table 3 - 42. Agricultural Area in the Municipalities and Cities in the Project Site: 2000
Size of
Percent to Total
Percent of Sugarcane Area to
Local Government Unit
Agricultural Land
Land Area
Agricultural Land
Pampanga
Floridablanca 6,631
has
38%
3%
San Fernando
3,251 has
48%
63%
Tarlac
Concepcion 14,262
has
58% 22%
Average 8,048
has
48%
29%
Source: Comprehensive Land Use Plans
Table 3 - 43. Summary of Issues and Responses during the First and Second Level Consultations
Issues
Response
First Level
· Source and characteristics of sludge/septage. Has
· Sludge/septage shall be collected from
it passed through the treatment plant? How safe is
different domestic septic tanks in Metro
this?
Manila. These are purely domestic and will
not include wastes from hospitals and
industries. According to Republic Act No.
6969, sludge/septage is not considered
hazardous/toxic waste.
· Can sludge/septage be also utilized as soil
· Vegetables can also be planted in soils
conditioner in other crops such as vegetables?
with sludge/septage conditioner, however,
it is advised that it should be cooked very
well before eating.
· How long can microorganisms live in plant
· Within 100 days, it is guaranteed that the
tissues?
eggs of the microorganisms are completely
dead. However, for extra precaution, it is
recommended that the lahar-amended soil
should not be planted for at least one
month from date of sludge/septage
application.
· Where are the exact locations of the experimental
· The first experimental site is in Barangay
sites?
Telebanca, Concepcion, Tarlac. The
second is within the compound of LAREC
Center in Floridablanca, Pampanga
· Suggestion to use agro-industrial wastes aside
· Utilizing agro-industrial waste as soil
from domestic sludge/septage in the project.
conditioner is not the immediate priority of
MWSS/MWCI at present but they may
ANNEXES-TABLES.DOC/2/9/2005
32
Manila Third Sewerage Project (MTSP)

SECTION THREE
List of Tables
Metropolitan Waterworks and Sewerage System
Issues
Response
consider it as part of their future
plans/alternatives.
· Recommendation to focus on one site in the mean · MWCI will carefully study the scheme on
time in order to meet the farmers' high demand on
sludge/septage distribution.
sludge/septage.
· How do MWSS/MWCI handle sludge/septage
· No definite schedule on sludge/septage
collection?
collection at present. It merely depends on
calls/requests received by MWSS/MWCI
from its subscribers to collect sludge from
their septic tanks.
Second Level
· Difference between sewage sludge and septage
· Sewage sludge is from the wastewater
treatment plant while septage is from the
septic tanks.
· Agro-industrial waste
· Agro-industrial waste is not covered by the
mandate of MWCI.
Table 3 - 44. Leading Causes of Mortality
Florida-
Porac
San
Concepcion
Mexico
blanca
Fernando
Heart Diseases
88.76
71.5
6.9
1
1
Cancer 4.36
46.7
6.4
0.14
0.14
Acute Respiratory Failure
28.58
24.7
2.9
0.14
0.14
CVA 24.07
77
7.2
0.21
0.21
Pneumonia 19.55
16.5
0.8
0.1
0.1
PTB 4.51
13.7
1
0.07
0.07
Diabetes Mellitus
4.51
11
0.14
0.14
COPD 9.33
8.2
2.4
0.14
0.14
Bronchial Asthma
7.45
Malnutrition 13.54
Source: Combined municipal health profile of Floridablanca, Porac, San Fernando, Concepcion, and Mexico, 2003
Table 3 - 45. Leading Causes of Morbidity by Year
Florida-
Porac
San
Concep-
Mexico
blanca
Fernando
cion
ARI 3149.07
14098
9644
167
99.82
Infected Wound
173.02
1659
1440
Diarrheal Diseases
1966.47
1034
1216
14
Skin Diseases
452.87
1001
1035
13.47
14
Hypertension 195.59
79
682
5.5
UTI 167
759
752
9.5
2.2
PTB 123
61
3
1.6
Parasitism
383.66
765 279 330
GIT Disorder
392.69
616
673
22.7
Musculo-skeletal Disorder
817
557
6
2
COPD
9.7
ANNEXES-TABLES.DOC/2/9/2005
33
Manila Third Sewerage Project (MTSP)

SECTION THREE
List of Tables
Metropolitan Waterworks and Sewerage System
Table 3 - 46. Basic Sanitation Facilities
Floridablanca
Porac
San Fernando
Safe water access
Level 1
52.83%
77%
98%
Level 2
37.71%
17%
0.9%
Level 3
0
0
0
Sanitary Toilets
100%
89%
100%
Satisfactory garbage disposal
73.73%
94%
25%
Complete basic sanitation facilities
73.73%
89%
98%
ANNEXES-TABLES.DOC/2/9/2005
34
Manila Third Sewerage Project (MTSP)

SECTION FOUR
List of Tables
Metropolitan Waterworks and Sewerage System
Table 4 - 1.
Description of Lahar Hazards Zones (PHIVOLCS-DOST, 1997)
Zone
Description of Hazard
Criteria
1
Areas at high risk to lahars and associated flash
Areas within the central parts of alluvial fans, or
floods.
along river valleys down to the farthest reaches
where lahars are deemed likely to extend.
2
Areas at low to moderate risk to lahars, and high Areas in the lower reaches or lateral margins of
risk to floods and/or excessive siltation.
alluvial fans.
3
Areas safe from lahar, but at moderate risk to
Areas along former lahar channels, or in distant
flash floods and/or excessive siltation.
reaches of active lahar channels, that were
affected by heavy sedimentation from 1991
eruptive products.
4
Areas safe from lahars, but prone to persistent
Areas in deltaic environments and along lahar-
(>1 week) or recurrent (back) flooding, with
dammed tributaries.
sedimentation mainly confined to river
channels.
Table 4 - 2.
Lahar Hazard Zone Classification of Existing and Proposed Septage/Sludge Disposal
Areas.
(As of June 30, 1998)
Province / Municipality
Barangay
Zone Classification
Pampanga/Porac Mancatian
1
Pampanga/Floridablanca Carmencita
3
Pampanga/San Fernando
Panipuan San Fernando
-
Balite -
Malino -
Pampanga/Angeles City
Mining (Balili)
-
Pampanga/Mexico
Akli -
Calubasa 3
Eden 3
Ganduz 3
Panipuan -
San Jose Malino
3
Suclaban 3
Tarlac/Concepcion
Telabanca 4
Malonzo 2
ANNEXES-TABLES.DOC/2/9/2005
35
Manila Third Sewerage Project (MTSP)

SECTION FOUR
List of Tables
Metropolitan Waterworks and Sewerage System
Table 4 - 3.
Range and Average Values for Parameters for Raw Septage
No. of
Parameters
Range
Average
Samples
PH
6
6.65 8.1
7.3
Alkalinity, mg/l
4
450 2,500
1,712.5
BOD, mg/l
7
1,620 5,500
3,796.00
COD, mg/l
15
15,205 70,655
36,563.00
Total Nitrogen, mg/kg
5
2,100 3,800
2,800
Phosphates (P205), mg/kg
5
100 2,400
908
Potassium, mg/kg
7
36 -121
67.32
Total Solids, mg/l
15
7,301 195,620
71,579.75
Total Volatile Solids, mg/l
15
2,813 53,649
54,292.26
Faecal Coliform, MPN/100ml
4
80x 105 13x107
37,966.93
Nematoed eggs, eggs/kg
15
2,667 13,667
6,044.4
Sodium, mg/kg
1
62.79
62.97
Lead, mg/kg
2
3.15 7.05
5.1
Zinc, mg/kg
2
102.32 103.22
102.77
Copper, mg/kg
2
1.57 7.82
4.695
Cadmium, mg/kg
2
0 0.51
0.255
Chromium, mg/kg
2
0.76 0.79
0.775
Table 4 - 4.
Range of Values of Heavy Metals in Septage
Heavy Metals
Range of Values
Pb, mg/kg
3.15 7.05
Zn, mg/kg
102.32 103.22
Cu, mg/kg
1.57 7.82
Cd, mg/kg
0.0 0.51
Cr, mg/kg
0.76 0.79
Table 4 - 5.
Chemical Analysis of MWCI Sewage/Sludge
Sewage Sludge
Raw Septage
Parameter
(April 2000)
(January 2003)
Total Nitrogen, N
0.15%
0.05%
Total Phosphorus, P2O5 0.06%
0.01%
Total Potassium, K2O 0.10%
0.005%
Total Calcium, CaO
0.15%
0.02%
Total Magnesium, MgO
0.09%
0.01%
Total Sodium, Na
0.01%
0.02%
Zinc, Zn
67.75 ppm
4.89 ppm
Copper, Cu
11.99 ppm
1.22 ppm
Manganese, Mn
28.18 ppm
Trace
Iron, Fe
2,375 ppm
25.08 ppm
Mercury, Hg
-
0.0043 mg/l
Organic matter
3.01%
-
Source: Quilloy, Oscar T. and E.B. Estanislao, 2003. Productivity Improvement of Soils Planted
to Sugarcane Using Raw Septage and Sewage Sludge: Influence of Long-Term
Application.
ANNEXES-TABLES.DOC/2/9/2005
36
Manila Third Sewerage Project (MTSP)

SECTION FOUR
List of Tables
Metropolitan Waterworks and Sewerage System
Table 4 - 6.
Pollutant Limits for the Land Application of Sewage Sludge
Concentration Limits
Pollutant Concentrations
Ceiling Concentrations
(Table 3 of 40 CFR 503.13)
(Table 1 of 40 CFR 503.13)
Pollutant
Monthly Average
(milligrams per kilogram, dry
(milligrams per kilogram, dry
weight)
weight)
Arsenic 75
41
Cadmium 85
39
Chromium 3,000
1,200
Copper 4,300
1,500
Lead 840
300
Mercury 57
17
Molybdenum* 75
--
Nickel 420
420
Selenium 100
36
Zinc 7,500
2,800
Loading Rates
Cumulative Pollutant Loading
Annual Pollutant Loading Rates
Rates
(Table 4 of 40 CFR 503.13)
(Table 2 of 40 CFR 503.13)
Pollutant
(kilogram per
(pounds per
(kilogram per
(pounds per
hectare per
acre per 365-
hectare, dry
acre, dry
365-day period, day period, dry
weight)
weight)
dry weight)
weight)
Arsenic 41 37 2.0 1.8
Cadmium 39 35 1.9 1.7
Chromium 3,000 2,677 150 134
Copper 1,500
1,339 75 67
Lead 300
268
15 13
Mercury 17 15 0.85
0.76
Molybdenum*
-- -- -- --
Nickel 420
375 21 19
Selenium 100 89 5.0 4.5
Zinc 2,800
2,500
140
125
*The pollutant concentration limit, cumulative pollutant loading rate, and annual pollutant loading rate for
molybdenum were deleted from Part 503 effective February 19, 1994. EPA will reconsider establishing these limits
at a later date.
ANNEXES-TABLES.DOC/2/9/2005
37
Manila Third Sewerage Project (MTSP)

SECTION FOUR
List of Tables
Metropolitan Waterworks and Sewerage System
Table 4 - 7.
Physico-Chemical Characteristics of Soil, Lahar 1, and Lahar 2
Parameters
Soil
Lahar 1
Lahar 2
Alkalinity and Salinity:
PH
7.6
8.7
8.1
Conductivity, mmhos/cm
0.43
0.06
0.68
Na, ppm
5.90
1.47
4.33
K, ppm
1.22
0.92
1.83
Ca, ppm
10.07
0.67
10.44
Mg, ppm
9.81
0.46
0.61
Sum of Cations, ppm
27.00
3.52
17.21
CO3, ppm
Trace
Trace
Trace
HCO3, ppm
15.86
3.66
7.93
SO4, ppm
38.31
10.92
140.60
Cl, ppm
4.25
2.13
4.25
Sum of Anions, ppm
58.42
16.71
152.78
Exch. Na%
Trace
Trace
Trace
Sodium Adsorption Ratio
0.32
0.32
0.36
Chemical Analysis:
P, ppm
10.0
7.4
2.1
OC, %
0.21
0.03
0.08
OM, %
0.36
0.05
0.14
Total N, %
0.018
0.0025
0.007
Conductivity, mmhos/cm
0.18
0.01
0.21
Ca, meq/100g soil
13.1
0.8
1.0
Mg, meq/100g soil
6.0
Trace
Trace
Na, meq/100g soil
0.2
Trace
Trace
K, meq/100g soil
0.1
Trace
Trace
Sum, meq/100g soil
19.4
0.8
1.0
Exchangeable Acid, meq/100g soil
7.0
1.0
1.0
CEC Sum, meq/100g soil
26.4
1.8
2.0
Base Saturation % Sum
73
44
50
Physical Properties:
Water Holding Capacity
22.6
22.3
53.7
Total Sand
65.8
87.8
91.8
Silt (0.05 0.002)
18.4
5.4
2.4
Clay less 0.002
15.8
6.8
5.8
Textural Class
sandy loam
sand
sand
Trace Metels:
Cu (ppm)
1.80
0.49
1.48
Zn (ppm)
1.04
0.37
0.31
Fe (ppm)
22.22
14.34
2.75
Mn (ppm)
18.18
7.39
1.18
Table 4 - 8.
Bacteriological Analysis Data on Soil, Lahar 1, and Lahar 2
Faecal Coliform
Nematode Eggs
No. of colonies/g of moist soil
SAMPLE
MPN/100 ml
(eggs/kg)
Bacteria Fungi
Lahar 1
700
0
375 x 103
1 x 10³
Lahar 2
1,100
0
575 x 103
39 x 102
Soil
400
0
16 x 104
265 x 102
ANNEXES-TABLES.DOC/2/9/2005
38
Manila Third Sewerage Project (MTSP)

SECTION FOUR
List of Tables
Metropolitan Waterworks and Sewerage System
Table 4 - 9.
Analysis of Heavy Metals from Sewage Sludge Fertilized Lahar Deposits
(SRA Farm at Floridablanca, Pampanga)
Heavy Metals (mg/kg)
Rate of Application
CHB Tanks (1 year)
Control
100 m3/ha 200
m3/ha
Arsenic, As
0.45
0.56
0.61
Cadmium, Cd
< 3
< 3
< 3
Chromium, Cr
12
13
14
Lead, Pb
< 10
< 10
< 10
Nickel, Ni
3.8
3.8
4.2
Mercury, Hg
< 0.07
< 0.07
< 0.07
Field; Sewage Sludge Expt.
40 m3/ha 80
m3/ha 120
m3/ha
(3 years)
Arsenic, As
0.75
1.10
1.12
Cadmium, Cd
< 3
< 3
< 3
Chromium, Cr
7.8
9.2
10.6
Lead, Pb
< 10
< 10
< 10
Nickel, Ni
3.7
3.9
4.3
Mercury, Hg
< 0.07
< 0.07
< 0.07
Source: Quilloy, Oscar T. and E.B. Estanislao, 2003. Productivity Improvement of Soils Planted to
Sugarcane Using Raw Septage and Sewage Sludge: Influence of Long-Term Application
Table 4 - 10. Analysis of Heavy Metals in Sewage Sludge Fertilized Lahar Deposits at A.B.
Gonzales Farm, Telebanca, Conception, Tarlac (One Month after Application)
Heavy Metals (mg/kg)
Control
120 m3/ha
Arsenic, As
0.32
0.68
Cadmium, Cd
< 3
< 3
Chromium, Cr
1.6
8.4
Lead, Pb
< 10
< 10
Nickel, Ni
3.2
3.6
Mercury, Hg
< 0.07
0.09
Source: Quilloy, Oscar T., 2003. Productivity Improvement of "Lahar" for Sugarcane Growing
Using Raw Sewage and Septic Sludge
ANNEXES-TABLES.DOC/2/9/2005
39
Manila Third Sewerage Project (MTSP)

SECTION FOUR
List of Tables
Metropolitan Waterworks and Sewerage System
Table 4 - 11. Concentration/levels (ug/g) of Cadmium and Lead in soil samples collected from 4
sites in the lahar areas in Pampanga and Tarlac.
CODE
CADMIUM
LEAD
SITE
REMARK
(ug/g)
(ug/g)
SF3a control
0.0497
1.21
San Fernando
No sugar cane
SF3.1 3
0.0744 >mdl
1.78
Sa Fernando
Ratoon cane
SF3c 0.0235
0.62
San
Fernando
Plant
cane
Porac
0.1005 > mdl
1.21
Porac
Plant cane
Floridablanca
0.0759 > mdl
1.22
Floridablanca
Plant cane
Concepcion,
Tcon 1
0.0745 > mdl
1.20
Tarlac
Ratoon cane
Tcon 2
0.0491
1.19
`ditto'
Plant cane
Tcon 3
0.0488
0.75
`ditto'
Plant cane
Analyzed using Dry ashing/AAS by Central Analytical Services Laboratory, BIOTECH, UPLB
Instrument Minimum Detection Level : Cadmium = 0.044 ug/g; Lead = 0.0353 ug/g
> = above detection level for the element
NOTE: Number of times dumping of sewage sludge was done is not known
Table 4 - 12. Concentration Levels (ug/g) of Cadmium and Lead in Sugarcane Tissues Collected
from 4 Sites in the Lahar Areas in Pampanga and Tarlac.
CODE/TISSUE
CADMIUM
LEAD
SITE
REMARK
(ug/g)
(ug/g)
SF3-RT
0.1718> mdl
0.46
San Fernando
Plant cane
SF3-SH
0.0624 > mdl
1.77
Sa Fernando
Plant cane
SF3.1RT
0.1006> mdl
3.31
San Fernando
Ratoon cane
SF3.1 SH
0.0763> mdl
1.78
San Fernando
Ratoon cane
FLA 2-RT
0.2288> mdl
3.26
Floridablanca
Plant cane
FLA 2-SH
0.0491
2.08
Floridablanca
Plant cane
PRC 1- RT
0.1335 >mdl
2.46
Porac
Plant cane
PRC 1-SH
0.1329 >mdl
2.69
Porac
Plant cane
Tcon 1-RT
0.1445>mdl
2.35
Concepcion, Tarlac
Ratoon cane
Tcon 1-SH
0.0344
1.74
`ditto'
Ratoon cane
Tcon 2-RT
0.1899>mdl
3.00
`ditto'
Plant cane
Tcon 2-SH
0.1047>mdl
2.38
`ditto'
Plant cane
Tcon 3- RT
0.0921> mdl
2.85
`ditto'
Plant cane
Tcon 3-SH
0.0921>mdl
2.41
`ditto'
Plant cane
Analyzed using Dry ashing/AAS by Central Analytical Services Laboratory, BIOTECH, UPLB
Instrument Minimum Detection Level (mdl): Cadmium = 0.044 ug/g; Lead = 0.0353 ug/g
NOTE: Number of times dumping of sewage sludge was done is not known
ANNEXES-TABLES.DOC/2/9/2005
40
Manila Third Sewerage Project (MTSP)

SECTION FOUR
List of Tables
Metropolitan Waterworks and Sewerage System
Table 4 - 13. Incidence Potential Rating
Porac
Floridablanca
San
Mexico
Concepcion
Fernando
Chemical Hazards
Dust
D D
D D D
CO, NO2, SO2
D D
D D D
Other volatile gases
D
D
D
D
D
Hazardous wastes
D
D
D
D
D
Non-hazardous
wastes
D D
D D D
Heavy metals
D
D
D
D
D
Psychological
Stress D D
D D D
Physical Hazards
Odor
D D
D D D
Noise
A A
A A A
Heat
A A
A A A
Vibration
A A
A A A
Vehicular accidents
C
C
C
C
C
Biological Hazards
Viral
D D
D D D
Bacterial
D D
D D D
Fungal
D D
D D D
Parasitic
D D
D D D
Note: (A) Unlikely to happen; (B) theoretically possible to happen but no report of the occurrence is available locally and abroad;
(C) has happened once in the Philippines or abroad in an industry or development quite similar to the project being proposed; (D)
has happened more than once in the Philippines or abroad in an industry or development quite similar to the project being
proposed; (E) has happened during the operation of similar development owned and operated by the project proponent in other
parts of the Philippines and abroad.
Table 4 - 14. Health Consequence Rating
Porac
Floridablanca
San
Mexico
Concepcion
Fernando
Chemical Hazards
Dust
3 3
3 3 3
CO, NO2, SO2 2 2
2 2 2
Other volatile gases
3
3
3
3
3
Hazardous wastes
3
3
3
3
3
Non-hazardous
wastes
3 3
3 3 3
Heavy metals
3
3
3
3
3
Psychological
Stress
2 2
2 2 2
Physical Hazards
Odor
2
2
2
2
2
Noise
1
1
1
1
1
Heat
1
1
1
1
1
Vibration
1
1
1
1
1
Vehicular accidents
4
4
4
4
4
Biological Hazards
Viral
3
3
3
3
3
Bacterial
3
3
3
3
3
Note: (1): agents not hazardous to health; (2) agents have limited health effects that are reversible; (3) agents which are capable or
irreversible damage without serious disability; (4) permanent total disability or fatality (small exposed population); (5) agents
with potential to cause multiple fatalities (large exposed population)
ANNEXES-TABLES.DOC/2/9/2005
41
Manila Third Sewerage Project (MTSP)

SECTION FOUR
List of Tables
Metropolitan Waterworks and Sewerage System
Table 4 - 15. Health Risk Matrix
Incidence Potential Rating
Consequence
Very Low
Low
Medium
High
Very High
Rating
(A)
(B)
(C)
(D)
(E)
(1) Slight
9
8
7
6 5
injury/illness
Noise, heat,
vibration
(2) Minor
8
7
6
5
4
injury/illness
psychological stress, odor,
air pollution
(3) Major
7 6
5
4
3
injury/illness
biological hazards, other
volatile gases, hazardous,
heavy metals & non-
hazardous wastes, dust
(4)
6 5
4
3 2
Permanent total
Vehicular
disability or
accident
fatality
(5)
5 4
3
2
1
Multiple
fatalities
Table 4 - 16.
Occupational Hazards and Related Injuries and Diseases of
Sludge/septage Disposal Project
Occupational and Environmental Injury and Diseases
Chemical Hazards
Dust
Exacerbation of Asthma and COPD, allergic rhinitis
Gas
NO2, SO2, CO
Exacerbation of Asthma and COPD, allergic rhinitis
Methane
Burn injuries due to explosion
Volatile gases
Irritation to severe burns of the eyes, throat and lungs and the skin
Solid Wastes
Hazardous
Depending upon the waste
Non Hazardous
Depending upon the waste
Heavy Metals
Depending upon the waste
Physical Hazards
Odor
Psychological stress due to irritation and apprehension
Noise
Reduction to loss of hearing
Temperature
Heat stroke, thermal stress, burns
Vibration
White-fingers disease, musculo-skeletal disease, fatigue
Ergonomic Factors
Exhausting physical work, prolonged standing, excessive mental effort,
unfavorable work posture, static/monotonous work
Biological Hazards
Infectious diseases of the different organ systems most commonly
respiratory and gastrointestinal diseases
ANNEXES-TABLES.DOC/2/9/2005
42
Manila Third Sewerage Project (MTSP)

SECTION FOUR
List of Tables
Metropolitan Waterworks and Sewerage System
Table 4 - 17. Occupational and Environmental Related Diseases
Occupational Diseases
Diseases due to Physical Environment
1. Contusion, bruises, hematoma
1. Diseases due to Noise and Vibration
2. Abrasions
Deafness (due to noise)
3. Cuts, lacerations, punctures
White fingers disease
4. Concussion
Musculo-skeletal disturbances
5. Avulsion
Fatigue
6. Amputation, loss of body parts
2. Diseases due to Temperature and Humidity
7. Crushing injuries
Hot Temperature
8. Spinal injuries
Heat strokes
9. Cranial injuries
Heat cramps
10.Sprains
Dehydration
11.Dislocation/fractures
Heat exhaustion
12.Burns
3. Ergonomic Stress
Exhausting physical work
Prolonged standing
Excessive mental effort
Unfavorable work posture
Static monotonous work
ANNEXES-TABLES.DOC/2/9/2005
43
Manila Third Sewerage Project (MTSP)

SECTION FIVE
List of Tables
Metropolitan Waterworks and Sewerage System
Table 5 - 1.
Major Impacts, Mitigation/Enhancement Measures and Environmental Management Plan
Project
Cost of Mitigation
Guarantees and
Impact Description
Mitigation & Enhancement
Responsible Party
Schedule
Activities
Enhancement
Contracts
Geology
· Geologic hazards resulting
· Rip rapping of creeks/rivers
Undertaken by
DPWH, LGUs and
Done NA
from lahar and flooding
adjacent to project sites.
concerned LGUs
Contractors
· Catchment/drainage of
adequate size should be
constructed around the
project site.
· Erosion and surface soil
· Temporary barriers and
runoff
trenches should be
constructed around the
mounds of materials to abate
the spread of spoils through
surface runoff.
· Monitoring of surface and
groundwater quality
Land Use
· Changes in land use of some · Farmers changed to
None Done Done
NA
lahar areas
aquaculture as a result of the
low productivity of lahar.
Water Quality
· Contamination of surface
· Dumping sites should not sit Covered by
Contractor/Applier Application EMoP,
and groundwater with heavy
on former river or waterway
Application cost,
Phase
Monitoring
metals from sludge
· Monitoring of surface and
EMoP
Team (MT),
groundwater quality
Health and
Safety Program
Odor
· Odor will affect residential
· Remoteness of zones.
Covered by
Contractor/Applier Application EMoP, MT,
establishment that will be
· Transport trucks to be sealed Application Cost
Phase
Health and
passed by transporting
and maintained.
Safety Program
ANNEXES-TABLES.DOC/2/9/2005
44
Manila Third Sewerage Project (MTSP)

SECTION FIVE
List of Tables
Metropolitan Waterworks and Sewerage System
Project
Cost of Mitigation
Guarantees and
Impact Description
Mitigation & Enhancement
Responsible Party
Schedule
Activities
Enhancement
Contracts
trucks.
· Odor in the application of
septage
Soil Quality
· Soil contamination by heavy · Regular monitoring of soil
To be covered by
Contractor/Applier Application EMoP, MT
metals
(heavy metals contents)
Application Cost
Phase (after
operation has
fully
established)
· Improvement of soil
· Regular monitoring of soil
To be covered by
Contractor/Applier Application
condition and fertility
quality
Application Cost
Phase (after
operation has
fully
established)
· Dumping of liquid
None NA
Contractor/Applier
Application
MT
sewage/septage provide
Phase
moisture to the sugarcane
plants during the summer
months
· Sewage sludge + bagasse & · Set up demo trials for other
NA Contractor/Applier
Application
MT
mill ash provides additional
farmers to emulate
Phase (after
nutrients for plant growth
operation has
and increase tonnage and
fully
sugar yield
established)
Traffic
· Traffic congestion at site
· Arrival of trucks should be
Covered by
Contractor/Applier Application MT, Health and
coordinated with the MWCI
Application Cost
Phase
Safety Program
and property owner.
· Delivery trucks should be
required to post visible
identification and signages
for easy recognition.
ANNEXES-TABLES.DOC/2/9/2005
45
Manila Third Sewerage Project (MTSP)

SECTION FIVE
List of Tables
Metropolitan Waterworks and Sewerage System
Project
Cost of Mitigation
Guarantees and
Impact Description
Mitigation & Enhancement
Responsible Party
Schedule
Activities
Enhancement
Contracts
· Deterioration of road
· Regular maintenance should Covered by
Contractor/Applier Application MT, Health and
condition due to regular
be done on the road link and
Application Cost
Phase
Safety Program
movement of trucks at site
property interior roads.
· Maintenance and repairs of
access roads.
· Cleaning of road brought
about by movement of
trucks.
Health
· Health hazard due to
· Provide measures to protect
Covered by
Contractor/Applier Application EMoP, MT,
accidental spills and
community health.
Insurance Cost
Phases
Health and
air/noise nuisance
Safety Program,
Social
Development
Program
· Community Health Hazards
· Measures include site
Covered by
Contractor/Applier Application EMoP, MT,
controls and regular
Application Cost
Phase
Health and
maintenance of trucks
Safety Program
· Issuance of workers'
personal protective
· Pathogen Exposure
equipment
· Public access restricted
· Site restriction; posting of
"No Trespassing"
· Annual food harvest shall be
30 days after application.
· Septage incorporated within
6 hrs after application
· Vector Exposure
· Untreated septage pumped
directly into truck tanks and
hauled to non-public
contract site.
Socio-Economic
· Increased employment
· Peripheral work
Contractor/Applier
Application
MT, Social
opportunities
opportunities as a result of
Phases
Development
· Increased income
increased in productivity
Program
ANNEXES-TABLES.DOC/2/9/2005
46
Manila Third Sewerage Project (MTSP)

SECTION FIVE
List of Tables
Metropolitan Waterworks and Sewerage System
Project
Cost of Mitigation
Guarantees and
Impact Description
Mitigation & Enhancement
Responsible Party
Schedule
Activities
Enhancement
Contracts
· Higher educational
attainment level
Heritage
· In case of accidental
· The project management
MWCI/Contractor
Operation
MT
Preservation
archeological findings
must make an effort to
Phase
preserve a potential
archaeological site by
reporting it immediately to
the National Museum.
*Source: Land Application of Sewage Sludge: A Guide for Land Appliers on the Requirements of the Federal standards for the Use or Disposal of Sewage Sludge, 40 CFR Part 503, U.S. EPA/831-
B-93-002b, Washington D.C., 1994.
ANNEXES-TABLES.DOC/2/9/2005
47
Manila Third Sewerage Project (MTSP)

SECTION FIVE
List of Tables
Metropolitan Waterworks and Sewerage System
Table 5 - 2.
Summary Matrix -Environmental Monitoring Plan
Approximate Cost
Activity/ Parameters
Sampling Locations
Frequency
Responsibility
(PhP)/Monitoring
Groundwater Monitoring
Physico-Chemical:
Temperature, DO, pH, TSS, TDS,
BOD, Phosphate, Total
Phosphorus, Oil & Grease
Covered by
Heavy
Metals:
At defined stations near
Monthly MWCI,
MT Operational Cost,
As, Cd, Cr, Cu, Pb, Hg, Ni, Se,
application sites
EMoP
Zn
Vectors/Pathogens:
Fecal coliform
Nematode eggs
Surface Water/Sediment Monitoring
Physico-Chemical:
Temperature, DO, pH, TSS, TDS,
BOD, Phosphate, Total
Phosphorus, Oil & Grease
Covered by
Heavy
Metals:
At defined stations near
Semi-Annual MWCI,
MT
Operational Cost,
As, Cd, Cr, Cu, Pb, Hg, Ni, Se,
application sites
EMoP
Zn
Vectors/Pathogens:
Fecal coliform
Nematode eggs
Septage Monitoring
Physico-Chemical:
Annual and
Covered by
COD, Total solids, Total volatile
Holding Tank (Composite)
at times of
MWCI, MT
Operational Cost,
solids, Total N, pH, Alkalinity,
suspicion
EMoP
Na, P, K, BOD
from
ANNEXES-TABLES.DOC/2/9/2005
48
Manila Third Sewerage Project (MTSP)

SECTION FIVE
List of Tables
Metropolitan Waterworks and Sewerage System
Approximate Cost
Activity/ Parameters
Sampling Locations
Frequency
Responsibility
(PhP)/Monitoring
Heavy
Metals:
commercial
As, Cd, Cr, Cu, Pb, Hg, Ni, Se,
and industrial
Zn
contractors
Vectors/Pathogens:
Fecal coliform
Nematode eggs
Lahar/Soil Monitoring
Physico-Chemical:
Texture, water holding capacity,
K, CEC, CO3, HCO3, Cl,
conductivity, Total N, pH, Na, K,
Ca, Mg, Phosphorus, organic
content
Covered by
Control sites and Application
Before
MWCI, MT
Operational Cost,
Heavy
Metals:
sites
harvest
EMoP
As, Cd, Cr, Cu, Pb, Hg, Ni, Se,
Zn, Mn
Vectors/Pathogens:
Fecal coliform
Nematode eggs
Health Monitoring
Related
diseases
Impact
communities, survey
Annual
Covered by
MWCI, MT
Operational Cost,
EMoP
Terrestrial/Agriculture
Leaf tissue analysis on sample
Control sites and Application
Before
Covered by
plants
sites
harvest
MWCI, MT
Operational Cost,
EMoP
*Source: Land Application of Sewage Sludge: A Guide for Land Appliers on the Requirements of the Federal standards for the Use or Disposal of Sewage Sludge, 40 CFR Part 503, U.S.
EPA/831-B-93-002b, Washington D.C., 1994.
Note:
MT refers to Third Party Monitoring Team
ANNEXES-TABLES.DOC/2/9/2005
49
Manila Third Sewerage Project (MTSP)
Document Outline
- 1 - EIS Volume 5b Lahar Study Annexes Feb 05.pdf
- COVER2.pdf
- Annexes-Figures 3-4.pdf
- Figure 2-1.pdf
- Figure 2-2.pdf
- Figure 2-3.pdf
- Figure 2-4.pdf
- Figure 2-5.pdf
- Figure 3-1.pdf
- Figure 3-2.pdf
- Figure 3-3.pdf
- Figure 3-6.pdf
- Figure 3-7.pdf
- Figure 3-8.pdf
- Figure 3-9.pdf
- Figure 3-10.pdf
- Figure 3-11.pdf
- Figure 3-12.pdf
- Figure 3-13.pdf
- Figure 3-14.pdf
- Fig_4-1.pdf
- Annexes-Tables.pdf
- Lahar text all.pdf
- Cover Page EIS Volume 4.pdf
- COVER.pdf
- NEW EA-1-Lahar-Executive Summary.pdf
- Figure ES-1.pdf
- EA-2-Lahar-Introduction.pdf
- NEW EA-3-Lahar-Project Description.pdf
- EA-4-Lahar-Baseline.pdf
- EA-5-Lahar-Impacts.pdf
- NEW EA-6-Lahar-EMP final.pdf
- EA-7-Lahar-Findings and Recommendations.pdf