


Sharing
g the Water Resources
Of the Orange
g -Senqu River Basin
Report No: 007/2009
Feasibility Study of the Potential for
Sustainable Water Resources
Development in the Molopo-Nossob
Watercourse
Main Report
Final
Submitted by:
PO Box 68735
Highveld
0169
Tel: (012) 695 0900
Fax: (012) 665 1886
Contact: Dr M van Veelen
July 2009

Molopo Nossob Feasibility Study Ł Main Report
Title:
Main Report
Authors:
Dr M van Veelen and T Baker with input from K Mulale,
A Bron, Dr A Fanta, Dr V Jonker, W Mullins, H Schoeman
Project Name:
Feasibility Study of the Potential for Sustainable Water
Resources
Development
in
the
Molopo-Nossob
Watercourse
Status of report:
Final
ILISO Project No:
700192
Date:
July 2009
Keywords:
Molopo River, Nossob River, Water Resources
______________________________________________________________________
ILISO Consulting (PTY) LTD
Approved for and on behalf of ILISO Consulting (Pty) Ltd, Ninham Shand
Incorporated, Schoeman and Partners and Conningarth Economists by
ORANGE SENQU RIVER COMMISSION
Approved on behalf of ORESECOM by
23 July 2009
i
Molopo Nossob Feasibility Study Ł Main Report
LIST OF STUDY REPORTS IN FEASIBILITY STUDY OF THE POTENTIAL FOR
SUSTAINABLE WATER RESOURCES DEVELOPMENT IN THE MOLOPO-NOSSOB
WATERCOURSE PROJECT:
This report forms part of a series of reports done for the Molopo-Nossob Feasibility Study, all
reports are listed below:
Report Number
Name of Report
002/2008
Hydrology Report
003/2008
Catchment Status Inventory Report
006/2009
Ground water Study
007/2009
Main Report
23 July 2009
ii
Molopo Nossob Feasibility Study Ł Main Report
FEASIBILITY STUDY OF THE POTENTIAL FOR SUSTAINABLE
WATER RESOURCES DEVELOPMENT IN THE MOLOPO NOSSOB
WATERCOURSE: MAIN REPORT
EXECUTIVE SUMMARY
The Molopo River receives most of its flow from tributaries in the Republic of South
Africa, most of which have now been dammed for irrigation in agriculture. As a
result, inflow from these sources to the Molopo River, which forms the boundary
between Botswana and South Africa, has become reduced and even non-existent in
some years. The Nossob River originates in Namibia and some dams have been
constructed in the upper reaches. It later forms the south-western boundary between
Botswana and South Africa down to its confluence with the Molopo River. There is
no record of the Molopo River surface flows ever reaching the main stem of the
Orange River. The reduction of flows in these sub-basins has placed a strain on the
sustainability of rural activities in the south-western corner of Botswana and some
parts of South Africa along the Molopo and Nossob Rivers.
As an attempt to remedy the situation, the ORASECOM countries has appointed
ILISO Consulting, in association with Ninham Shand Incorporated, Schoeman and
Partners and Conningarth Economists to study the feasibility of the potential for the
sustainable water resources development in the Molopo Nossob Sub River Basin.
The objective of the project was to assess and evaluate the water resources of the
Molopo-Nossob catchment to formulate a method to improve the management of the
area that will be environmentally sound, economically viable and financially
achievable. The possibility of restoring flows to the river system was also
investigated, as well as the identification and assessment of sustainable surface
water development options. In doing so the catchment was studied as an interrelated
system, even though it falls within the political area of three different countries
(Namibia, Botswana and South Africa).
Hydrological modelling has been undertaken to provide first order estimates of typical
surface water runoff volumes in the main rivers in the Molopo-Nossob catchment.
The modelling was done by means of the Pitman rainfall-runoff model, local observed
rainfall records and current land use information. Estimates of natural and present
day surface water runoff have been calibrated based on observed flow records where
available as well as on historical records of floods in the Molopo-Nossob catchment.
23 July 2009
iii
Molopo Nossob Feasibility Study Ł Main Report
The modelling results have shown that the total natural runoff from the Molopo-
Nossob catchment, without any channel losses, equals 164 Mm3/a. However, once
losses are taken into account, the total cumulative runoff for each of the main
subcatchments reduces to zero, except in the case of the Kuruman catchment where
the average net outflow equals 4.1 Mm3/a under natural conditions and 4.0 Mm3/a
under present day conditions
First order estimates of typical gross storage-yield characteristics for the upper parts
of the Molopo, Kuruman and Nossob catchments have shown that significant storage
is required to provide yield at an acceptable level of assurance. An assessment of
the central parts of the Molopo-Nossob catchment, situated within the drier, central
Kalahari Desert, has indicated that it is not feasible for dams to be constructed in this
area due to the lack of reliable runoff.
The Molopo-Nossob system does not function in the same way as more conventional
rivers, where groundwater discharge provides a baseflow during dry conditions. In
the case of the Molopo-Nossob system, the occasional floods are totally absorbed
along the river bed and recharge the ground water aquifers along the course of the
river. From the investigation it is clear that surplus water is only generated at a
recurrence interval of less than 20 years. For the rest of the time, floods are entirely
absorbed as ground water recharge along the course of the river.
As the water along the course of the river is needed for small communities and stock
watering, there is little sense in building storage dams. It is far more financially and
economically viable to abstract the water from boreholes and wells at the point of
use, as this will not only cut out the evaporation losses from the surface of a
reservoir, but also the necessity of an expensive distribution network.
The study has conclusively shown that there is no surplus water in the Molopo-
Nossob catchment that can be economically exploited. It was also shown that the
occasional floods serve to recharge the ground water aquifers along the river course,
and that any storage that is created will therefore reduce the availability of ground
water along the course of the river.
23 July 2009
iv
Molopo Nossob Feasibility Study Ł Main Report
It is therefore recommended that no further surface water development in the form of
dams is considered in the study area, and that the development of ground water
sources is investigated in more detail.
However, the development of ground water should be undertaken with some caution,
as making more water available may lead to overgrazing and the destruction of the
natural vegetation, especially where subsistence farming is practised.
23 July 2009
v
Molopo Nossob Feasibility Study Ł Main Report
FEASIBILITY STUDY OF THE POTENTIAL FOR SUSTAINABLE
WATER RESOURCES DEVELOPMENT IN MOLOPO-NOSSOB
WATERCOURSE : MAIN REPORT
TABLE OF CONTENTS
1.
INTRODUCTION .......................................................................................................................... 1-1
1.1
BACKGROUND ........................................................................................................................ 1-1
1.2
PURPOSE OF STUDY ............................................................................................................... 1-1
1.3
PURPOSE OF REPORT ............................................................................................................. 1-2
1.4
REPORT STRUCTURE .............................................................................................................. 1-2
2.
DESCRIPTION OF STUDY AREA .............................................................................................. 2-1
2.1
LOCATION .............................................................................................................................. 2-1
2.2
TOPOGRAPHY ......................................................................................................................... 2-1
2.3
DRAINAGE .............................................................................................................................. 2-1
2.3.1 Nossob River .................................................................................................................... 2-2
2.3.2 Aoub River ........................................................................................................................ 2-2
2.3.3 Kuruman River ................................................................................................................. 2-2
2.3.4 Molopo River .................................................................................................................... 2-3
2.4
LANDUSE ............................................................................................................................... 2-3
2.5
GEOLOGY AND SOIL ................................................................................................................ 2-4
2.5.1 Namibia ............................................................................................................................ 2-4
2.5.2 South Africa ...................................................................................................................... 2-4
2.5.3 Botswana .......................................................................................................................... 2-6
2.6
VEGETATION .......................................................................................................................... 2-6
2.6.1 Namibia ............................................................................................................................ 2-6
2.6.2 South Africa ...................................................................................................................... 2-6
2.6.3 Botswana .......................................................................................................................... 2-7
2.7
CLIMATE ................................................................................................................................ 2-8
2.7.1 Rainfall ............................................................................................................................. 2-8
2.7.2 Evaporation .................................................................................................................... 2-10
3.
SOCIO-ECONOMICS ................................................................................................................ 3-12
3.1
CATCHMENT ADMINISTRATIVE DISTRICTS ................................................................................ 3-12
3.1.1 Botswana ........................................................................................................................ 3-12
3.1.2 Namibia .......................................................................................................................... 3-12
3.1.3 South Africa ...................................................................................................................... 3-1
3.2
LANDUSE ............................................................................................................................... 3-1
3.2.1 Botswana .......................................................................................................................... 3-1
3.2.2 Namibia ............................................................................................................................ 3-2
3.2.3 South Africa ...................................................................................................................... 3-3
3.3
POPULATION .......................................................................................................................... 3-4
3.3.1 Botswana .......................................................................................................................... 3-4
3.3.2 Namibia ............................................................................................................................ 3-8
3.3.3 South Africa .................................................................................................................... 3-11
3.4
ECONOMY ............................................................................................................................ 3-14
23 July 2009
vi
Molopo Nossob Feasibility Study Ł Main Report
3.4.1 Botswana ........................................................................................................................ 3-14
3.4.1.1
Kgalagadi District ................................................................................................................. 3-14
3.4.1.2
Southern District .................................................................................................................. 3-15
3.4.2 Namibia .......................................................................................................................... 3-17
3.4.3 South Africa .................................................................................................................... 3-18
3.5
TOURISM .............................................................................................................................. 3-20
3.5.1 Botswana ........................................................................................................................ 3-20
3.5.2 Namibia .......................................................................................................................... 3-20
3.5.3 South Africa .................................................................................................................... 3-21
3.6
WATER AND SANITATION ....................................................................................................... 3-22
3.6.1 Botswana ........................................................................................................................ 3-22
3.6.1.1
Kgalagadi District ................................................................................................................. 3-22
3.6.1.2
Southern District .................................................................................................................. 3-24
3.6.2 Namibia .......................................................................................................................... 3-25
3.6.3 South Africa .................................................................................................................... 3-27
3.7
ECONOMIC ACTIVITIES .......................................................................................................... 3-29
3.7.1 Irrigation agriculture ....................................................................................................... 3-29
3.7.2 Livestock farming ........................................................................................................... 3-29
3.7.3 Mining ............................................................................................................................. 3-30
3.7.4 Tourism .......................................................................................................................... 3-30
3.8
IRRIGATION AGRICULTURE .................................................................................................... 3-30
3.8.1 Methodology ................................................................................................................... 3-30
3.8.2 Country Discussion: - Irrigation Farming ........................................................................ 3-31
3.9
LIVESTOCK FARMING ............................................................................................................ 3-31
3.9.1 Methodology ................................................................................................................... 3-31
3.9.2 Country Discussion: - Livestock Farming ....................................................................... 3-32
3.9.3 Conclusion ...................................................................................................................... 3-33
3.10
MINING ................................................................................................................................ 3-33
3.10.1
Methodology ............................................................................................................... 3-33
3.10.2
Country Discussion: - Mining ..................................................................................... 3-34
3.10.3
Conclusion .................................................................................................................. 3-34
3.11
TOURISM .............................................................................................................................. 3-35
3.11.1
Botswana .................................................................................................................... 3-35
3.11.2
Conclusion .................................................................................................................. 3-35
3.12
MACRO ECONOMIC IMPACTS ................................................................................................. 3-36
4.
AVAILABILITY OF WATER ........................................................................................................ 4-1
4.1
SURFACE WATER ................................................................................................................... 4-1
4.1.1 Quantity ............................................................................................................................ 4-1
4.1.2 Assurance of Supply ........................................................................................................ 4-3
4.1.3 Water Quality .................................................................................................................... 4-4
4.2
GROUND WATER ..................................................................................................................... 4-5
4.2.1 Aquifers ............................................................................................................................ 4-5
4.2.2 Basement Aquifers ........................................................................................................... 4-5
4.2.3 Karst Aquifers ................................................................................................................... 4-7
4.2.4 Karoo Aquifers .................................................................................................................. 4-8
4.2.4.1
Dwyka Formation Aquifers .................................................................................................... 4-8
4.2.4.2
Ecca Group Aquifers ............................................................................................................. 4-8
4.2.5 Kalahari Group Aquifers ................................................................................................. 4-10
23 July 2009
vii
Molopo Nossob Feasibility Study Ł Main Report
4.2.5.1
Recharge in the Molopo and Kuruman catchments ............................................................. 4-11
4.3
DAMS ................................................................................................................................... 4-12
4.3.1 Main Dams ..................................................................................................................... 4-12
4.3.2 Farm Dams ..................................................................................................................... 4-17
4.3.3 Pans ............................................................................................................................... 4-17
5.
WATER REQUIREMENTS .......................................................................................................... 5-1
5.1
SURFACE WATER .................................................................................................................... 5-1
5.1.1 Urban and Rural Water Requirements ............................................................................. 5-1
5.1.2 Mining Water Requirements ............................................................................................. 5-1
5.1.3 Return Flows .................................................................................................................... 5-1
5.1.4 Water Transfers ................................................................................................................ 5-2
5.1.5 Ecological Reserve Requirements ................................................................................... 5-3
5.2
GROUND WATER ..................................................................................................................... 5-3
5.2.1 Available Water ................................................................................................................ 5-5
5.2.2 Water Quality .................................................................................................................... 5-7
6.
RIVER FLOWS ............................................................................................................................ 6-1
6.1
HISTORICAL EXTREME EVENTS ................................................................................................ 6-1
6.2
DESIGN FLOOD VOLUMES ........................................................................................................ 6-1
7.
DISCUSSION ............................................................................................................................... 7-1
8.
CONCLUSIONS AND RECOMMENDATIONS ........................................................................... 8-1
9.
LITERATURE CONSULTED ....................................................................................................... 9-1
LIST OF TABLES
TABLE 2.1: MAIN SUBCATCHMENTS WITHIN THE MOLOPO-NOSSOB SYSTEM .............................................. 2-1
TABLE 2.2: DETAILS OF PANS IN THE STUDY CATCHMENT .......................................................................... 2-2
TABLE 3.1: NAMIBIAN REGIONS AND CONSTITUENCIES ........................................................................... 3-12
TABLE 3.2: POPULATION BY DISTRICT ...................................................................................................... 3-4
TABLE 3.3: POPULATION OF TOWNS IN DISTRICT ...................................................................................... 3-4
TABLE 3.4: KGALAGADI DISTRICT POPULATION BY VILLAGE/LOCALITY ....................................................... 3-5
TABLE 3.5: NGWAKETSE AND NGWAKETSE WEST POPULATION BY VILLAGE/LOCALITY................................ 3-6
TABLE 3.6: BAROLONG POPULATION BY VILLAGE/LOCALITY ....................................................................... 3-7
TABLE 3.7: NAMIBIAN POPULATION GROWTH ........................................................................................... 3-9
TABLE 3.8: DIFFERENCES IN URBAN AND RURAL POPULATIONS .............................................................. 3-11
TABLE 3.9: SOUTH AFRICAN POPULATION GROWTH ............................................................................... 3-13
TABLE 3.10: WATER SUPPLY DATA FOR SETTLEMENTS UNDER DEPARTMENT OF WATER AFFAIRS IN
KGALAGADI DISTRICT .................................................................................................................... 3-24
TABLE 3.11: NAMIBIA NUMBER OF ACTIVE WATER POINTS ..................................................................... 3-26
TABLE 3.12: NORTHWEST AND NORTHERN CAPE PROVINCES WATER AND SANITATION (2001 CENSUS) ... 3-28
TABLE 3.13: CROPS ANALYZED ............................................................................................................. 3-30
TABLE 3.14: IRRIGATED CROPS, HECTARES AND WATER USE (2007) ..................................................... 3-31
TABLE 3.15: LIVESTOCK CALCULATIONS ................................................................................................ 3-32
TABLE 3.16: MINING IN THE MOLOPO Ł NOSSOB CATCHMENT (2007 PRICES) .......................................... 3-34
TABLE 3.17: TOURISM ACTIVITY IN THE MOLOPO Ł NOSSOB CATCHMENT (2007 ESTIMATES) ................... 3-35
23 July 2009
viii
Molopo Nossob Feasibility Study Ł Main Report
TABLE 3.18: - DIRECT AND TOTAL MACRO ECONOMIC INDICATORS OF THE DIFFERENT ACTIVITIES FOR THE
MOLOPO Ł NOSSOB CATCHMENT (2007 PRICES) ........................................................................... 3-36
TABLE 3.19: - WATER BASED MACRO ECONOMIC MULTIPLIERS APPLICABLE IN THE MOLOPO- NOSSOB
CATCHMENT (2007 PRICES) ......................................................................................................... 3-37
TABLE 4.1: TOTAL INCREMENTAL MAR PER MAIN SUBCATCHMENT ............................................................ 4-2
TABLE 4.2: TYPICAL YIELD-RELIABILITY CHARACTERISTICS (UPPER MOLOPO/KURUMAN) ............................ 4-4
TABLE 4.3: TYPICAL YIELD-RELIABILITY CHARACTERISTICS (UPPER NOSSOB) ............................................. 4-4
TABLE 4.4: FEATURES OF THE MAIN DAMS IN THE MOLOPO-NOSSOB CATCHMENT .................................. 4-15
TABLE 4.5: FEATURES OF THE FARM DAMS IN THE MOLOPO-NOSSOB CATCHMENT.................................. 4-17
TABLE 4.6: FEATURES OF THE PANS IN THE MOLOPO-NOSSOB CATCHMENT............................................ 4-17
TABLE 4.7: SUMMARY OF RUN-OFF, STORAGE AND YIELD ........................................................................ 4-18
T
3
ABLE 5.1: LOCALITY AND AMOUNT OF LARGE SCALE GROUND WATER ABSTRACTION (MILLION M /A) ........... 5-4
TABLE 5.2: ESTIMATES OF WATER USAGE IN THE STAMPRIET ARTESIAN BASIN AREA ................................ 5-5
TABLE 5.3: GROUND WATER STORAGE OF EACH AQUIFER ......................................................................... 5-7
T
3
ABLE 6.1: DESIGN STORM RUNOFF VOLUMES IN THE MOLOPO RIVER (MM ) ............................................. 6-1
T
3
ABLE 6.2: DESIGN STORM RUNOFF VOLUMES IN THE MOLOPO RIVER (MM ): NATURAL CONDITIONS .......... 6-1
T
3
ABLE 6.3: PRESENT DAY CONDITIONS (MM ) (ASSUMING MAXIMUM INTERCEPTION OF FLOODS BY MAJOR AND
FARM DAMS) ................................................................................................................................... 6-1
LIST OF FIGURES
FIGURE 2.1: STUDY CATCHMENT ............................................................................................................. 2-1
FIGURE 2.2: CATCHMENT TOPOGRAPHY .................................................................................................. 2-1
FIGURE 2.3: TYPICAL SEASONAL RAINFALL DISTRIBUTION IN STUDY CATCHMENT ...................................... 2-8
FIGURE 2-4: MAJOR SOIL TYPES ............................................................................................................. 2-9
FIGURE 2-5: MEAN ANNUAL PRECIPITATION ........................................................................................... 2-11
FIGURE 3-1: LOCALITY OF THE MOLOPO NOSSOB RIVER CATCHMENT ..................................................... 3-13
FIGURE 3.2: LANDUSE IN THE CATCHMENT ............................................................................................... 3-1
FIGURE 3.3: POPULATION DISTRIBUTION IN THE CATCHMENT AREA .......................................................... 3-10
FIGURE 3.4: MAP REPRESENTING THE STANDARD OF LIVING IN THE CATCHMENT AREA ............................. 3-16
FIGURE 3-5: WATER SOURCES .............................................................................................................. 3-23
FIGURE 4.1: LOCATION OF MAIN DAMS IN THE MOLOPO-NOSSOB CATCHMENT AREA ............................... 4-16
FIGURE 6.1: SIMULATED EXTREME HISTORICAL RUNOFF EVENTS ............................................................... 6-1
23 July 2009
ix
Molopo Nossob Feasibility Study Ł Main Report
ACRONYMS
BEE
Black Economic Empowerment
CASP
Comprehensive Agricultural Support
CBNRM
Community Based Natural Resource Management
CHA
Controlled Hunting Areas
DM
District Municipality
DWA
Department of Water Affairs
DWAF
Department of Water Affairs and Forestry
DWNP
Department of Wildlife National Parks
IDP
Integrated Development Plan
ISARM
Internationally Shared Aquifer Resources Management
ISRDS
Integrated Sustainable Rural Development Strategy
LM
Local Municipality
LSU
Large Stock Units
MAE
Mean Annual Evaporation
MDG
Millennium Development Goal
ORASECOM
Orange-Senqu River Commission
RADP
Remote Area Development Policy
RADS
Remote Area Dwellers
RDP
Reconstruction and Development Programme
RSA
Republic of South Africa
SES
Socio-Economic Status
TDS
Total Dissolved Solids
TGLP
Tribal Grazing Land Policy
UMK
United Manganese of Kalahari
WARD
Women in Agriculture and Rural Development
WMA
Wildlife Management Area
23 July 2009
x
Molopo Nossob Feasibility Study - Main Report
FEASIBILITY STUDY OF THE POTENTIAL FOR SUSTAINABLE
WATER RESOURCES DEVELOPMENT IN MOLOPO Ł NOSSOB
WATERCOURSE:
MAIN REPORT
1.
INTRODUCTION
1.1
BACKGROUND
The Molopo River is an ephemeral tributary of the Orange Ł Senqu system which is
an international river basin shared by the Kingdom of Lesotho, the Republic of
Namibia, the Republic of Botswana and the Republic of South Africa. The Orange-
Senqu River Agreement signed by the governments of the four countries established
the Orange-Senqu River Commission (ORASECOM) to advise the parties on water
related issues.
The Molopo River receives most of its flow from tributaries in the Republic of South
Africa, most of which have now been dammed for irrigation and urban water supply.
As a result, inflow from these sources to the Molopo River, which forms the boundary
between Botswana and South Africa, has become reduced and even non-existent in
some years. The Nossob River originates in Namibia and some dams have been
constructed in the upper reaches. It later forms the south-western boundary between
Botswana and South Africa down to its confluence with the Molopo River. There is
no record of the Molopo River surface flows ever reaching the main stem of the
Orange River. The reduction of flows in these sub-basins has placed a strain on the
sustainability of rural activities in the south-western corner of Botswana and some
parts of South Africa along the Molopo and Nossob Rivers.
1.2
PURPOSE OF STUDY
As an attempt to remedy the situation, ORASECOM has appointed ILISO Consulting,
in association with Ninham Shand Incorporated, Schoeman and Partners and
Conningarth Economists, to study the feasibility of the potential for the sustainable
water resources development in the Molopo-Nossob Sub River Basin.
The objective of the project was to assess and evaluate the water resources of the
Molopo-Nossob catchment to formulate a method to improve the management of the
area that will be environmentally sound, economically viable and financially
achievable. The possibility of restoring flows to the river system was also
investigated, as well as the identification and assessment of sustainable surface
23 July 2009
1- 1
Molopo Nossob Feasibility Study Ł Main Report
water development options. In doing so the catchment was studied as an interrelated
system, even though it falls within the political area of three different countries
(Namibia, Botswana and South Africa).
The Terms of Reference originally included the identification, feasibility and
prioritisation of possible surface water development schemes. The surface water
investigations undertaken in the second stage of the study (the catchment status
inventory) revealed that the surface water resources of the study area have largely
been developed and there is very little scope for further development. At the same
time the catchment seems to have reached a saturation point as far as development
is concerned. The real need for water that was identified lies in providing water at the
household level and as the population lives dispersed and in small communities,
ground water offers the only viable source of water.
The exploitation of the dolomitic aquifer in South Africa has had a significant
influence on ground water levels, and thereby affected the flow in the upper reaches
of the Molopo River. It was therefore agreed that the third stage of the study would
consider the availability of ground water in more detail, and focus on the
development of this resource, rather than surface water.
1.3
PURPOSE OF REPORT
The purpose of this report is to present the findings and recommendations of the
study.
1.4
REPORT STRUCTURE
The physical aspects of the study area are described in Chapter 2 and the social and
economic in Chapter 3. The availability of water is presented in Chapter 4 and the
water requirements in the study area in Chapter 5. The impact of groundwater use
on river flows in presented in Chapter 6. Chapter 7 is a discussion of the findings
and Chapter 8 presents the conclusion and recommendations.
23 July 2009
1-2
Molopo Nossob Feasibility Study Ł Main Report
2.
DESCRIPTION OF STUDY AREA
2.1
LOCATION
The Molopo-Nossob system forms part of the Orange-Senqu system and is
shared by the countries of Namibia, the Republic of Botswana and the
Republic of South Africa (RSA). A significant portion of the catchment falls
within the Kalahari Desert. The system is an ephemeral system and consists
of four main subcatchments viz. the Molopo, Kuruman, Nossob and Aoub
catchments. The locations of these catchments are shown in, Figure 2-1
while the catchment areas per country are presented in Table 2-1.
Table 2-1: Main Subcatchments within the Molopo-Nossob System
Catchment Area (km2)
RSA
Namibia
Botswana
Total
Molopo
61 882
18 120
112 583
192 585
Kuruman
41 194
0
0
41 194
Nossob
4 704
46 928
17 426
69 058
Aoub
5 589
34 601
0
40 190
Total
113 369
99 649
130 009
343 027
2.2
TOPOGRAPHY
There are no distinct topographic features in the study area, with the
majority of the area being relatively flat with no climatic barriers. The upper
tributaries of the Nossob and Aoub rivers, in the mountainous areas
surrounding Windhoek, are characterised by higher elevations (1 700 to
2 000 masl), while high-lying areas to the east and south of Mafikeng
(1 500 masl) and Kuruman (1 336 masl) form the watershed divide between
the Molopo-Kuruman system to the north and the Vaal-Orange system to the
south.
The Nossob and Aoub catchments gradually fall towards the south, while the
Molopo and Kuruman catchments display a gradual decline in elevation
towards the west.
23 July 2009
2-1
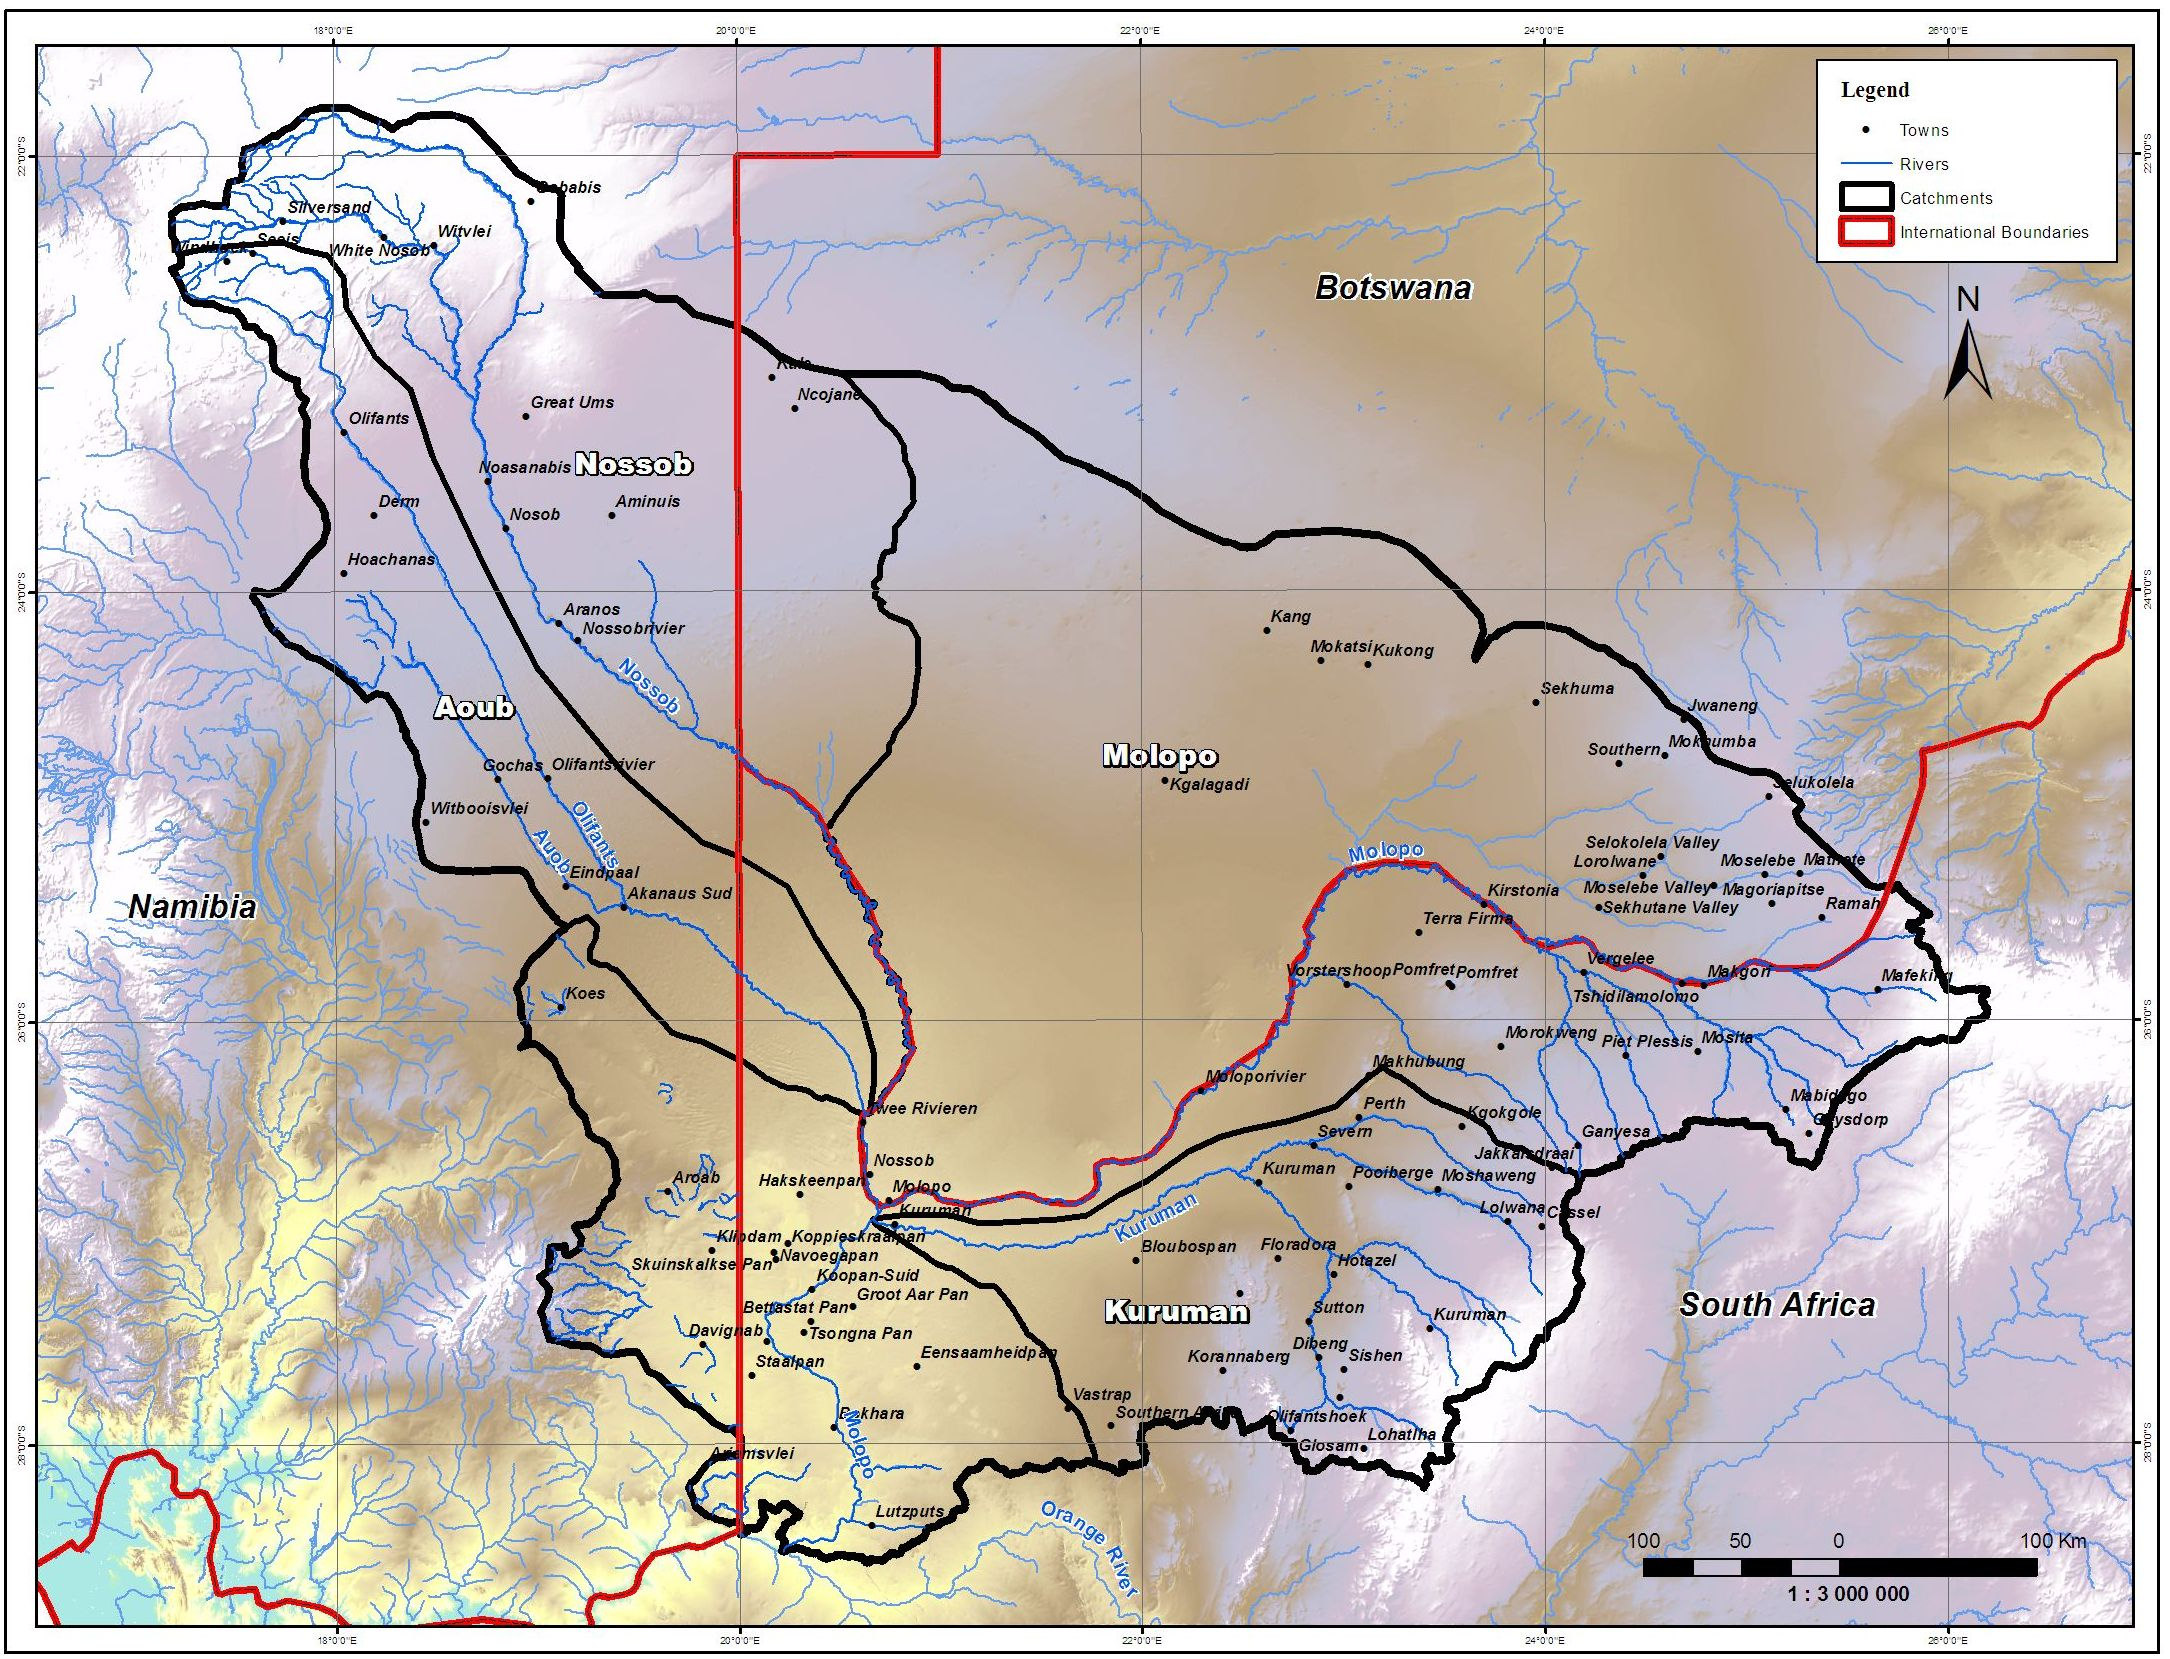
Molopo Nossob Feasibility Study Ł Main Report
Figure 2.1: Study Catchment
23 July 2009
2-1
Molopo Nossob Feasibility Study Ł Main Report
After the confluence of these rivers, to the south of the Kgalagadi
Transfrontier Park, the Molopo River continues southwards until its
confluence with the Orange River in the vicinity of the Augrabies Falls in the
RSA (Figure 2-2).
2.3
DRAINAGE
As a result of the low rainfall, flat topography and the occurrence of pans,
dunes and sandy soils over much of the study area, specifically where the
rivers flow through the Kgalagadi, little surface runoff is generated. Although
occasional runoff occurs in the upper parts of the various subcatchments,
evaporation and seepage losses, in conjunction with relatively large storage
dams, specifically in the upper Molopo and Nossob catchments, prevent this
runoff from reaching the lower reaches except during extreme events.
Although there is anecdotal evidence of occasional flow along the lower
Kuruman, Molopo, Nossob and Aoub rivers, linked to specific flood events,
there is no record of flows in the Molopo River ever having reached the
Orange River and the Molopo-Nossob catchment is therefore classified as an
endoreic area. Previous recordings of flow in the lower reaches of the Molopo
and/or Kuruman rivers were in 1933, 1974/5 and 1975/76. Flow along the
lower reaches of the Nossob and Aoub rivers has been recorded in 1934,
1963, 1974 and 1999/2000. A recent event of flow in the Aoub River in the
Kagalagadi Transfronteir Park was reported in the press
The occurrence of pans in the study area, which are common in the
Botswana and Namibian parts of the catchment, also has a significant impact
on local drainage patterns and further reduces runoff. Schoeman and
Partners, as part of the landuse task of this study, calculated that the water
retaining capacity of all 2 607 the pans in the study area equaled some 1
900 million m│. The number, area and volume of pans in the study area are
summarised in Table 2-2.
.
23 July 2009
2-1
Molopo Nossob Feasibility Study Ł Main Report
Figure 2.2: Catchment Topography
23 July 2009
2-1
Molopo Nossob Feasibility Study Ł Hydrology Report
Table 2-2: Details of Pans in the study catchment
Volume
Area
Subcatchment
No. Pans
(Mm3)
(km2)
Molopo
1 179
1 406
972
Kuruman
226
71
54
Nossob
676
279
167
Aoub
526
230
141
TOTAL
2 607
1 986
1 334
2.3.1
Nossob River
The Nossob River originates in the mountainous area to the north-east of
Windhoek and its upper reaches are characterised by two main tributaries viz.
the Black Nossob and the White Nossob. These tributaries originally drain in
an easterly direction towards Gobabis, where they turn south until their
confluence at the town of Hoaseb, approximately 70 km south of Gobabis.
From Hoaseb, the Nossob River flows in a south-easterly direction and
eventually constitutes the border between the Republic of Botswana and the
Republic of South Africa. The Nossob River has its confluence with the Aoub
River at Twee Rivieren in the Kgalagadi Transfrontier Park and with the
Molopo River at the town of Bokspits, 60 km south of the Aoub confluence.
2.3.2
Aoub River
The Aoub River has its origin in the Karubeam Mountains in Namibia north
east of Mariental, from where it flows in a south-easterly direction towards the
Republic of South Africa. Approximately 80 km upstream of the
Namibian/South African border, the Aoub River is joined, from the north, by its
main tributary, the Olifants River. The Olifants River originates in the
mountainous areas surrounding Windhoek and flows parallel to the Aoub
River until their point of confluence. The Aoub River joins the Nossob River at
Twee Rivieren in the Kgalagadi Transfrontier Park (Figure 2-1).
2.3.3
Kuruman River
The Kuruman River originates south east of Kuruman, where it is fed by
various springs, most notably the Great Koning Eye, Little Koning Eye and
the Kuruman Eye. Originally, the river flows in a north-westerly direction over
____________________________________________________________________________________________________________________________
January 2009
2-2
Molopo Nossob Feasibility Study Ł Hydrology Report
a distance of approximately 140 km, after which it turns west and flows
parallel to the Molopo River, until it has its confluence with the Molopo River
at Andriesvale, in close proximity to the Nossob/Molopo confluence. Various
tributaries join the Kuruman River along its upper reaches, including the Ga-
Mogara, Moshaweng, Mathlawareng and Kgokgole rivers. The Kuruman
catchment is the only subcatchment within the Molopo-Nossob system
which falls completely within the Republic of South Africa (RSA).
2.3.4
Molopo River
The Molopo River emanates from the area to the east of Mafikeng, where it
is fed by various springs, most notably the Molopo Eye and the Grootfontein
Eye. From here it flows in a westerly direction and essentially constitutes the
border between South Africa and Botswana until its confluence with the
Nossob. Several dry-bed, ephemeral streams join the Molopo stem along its
upper reaches. These include localised tributaries from the south (South
Africa) e.g. Setklagole, Phepane and Disipi rivers, which drain north-
westwards towards the Molopo River, and tributaries from Botswana e.g.
Ramatlabama and Melatswane, which drain westwards before joining the
main stem of the Molopo River. The Molopo River is joined by the Nossob
River at Bokspits and the Kuruman River at Andriesvale, immediately south
of the Kgalagadi Transfrontier Park, from where it flows southwards before
joining the Orange River about 300 km downstream.
2.4
LANDUSE
Most of the land in the study catchment is under natural vegetation and a
large portion of the catchment falls within the Kagalagadi. Areas of
cultivation are found in the Upper Nossob and Olifants catchments, where
irrigation is predominantly from ground water sources, and the south-eastern
parts of the Molopo catchment near Mafikeng where the demand is satisfied
from farm dams. No afforestation or large-scale infestations of invasive alien
vegetation occur in the study area, although land-invasion by Prosopis
species is on the increase in Namibia. There is large-scale mining activity in
the vicinity of Sishen and Hotazel in the upper Kuruman catchment where
manganese ore, iron ore, tiger's eye and crocidolite (blue asbestos) are
mined. The towns of Mafikeng, Kuruman, Gobabis and part of Windhoek
represent the only significant urban areas in the study catchment, while
____________________________________________________________________________________________________________________________
January 2009
2-3
Molopo Nossob Feasibility Study Ł Hydrology Report
scattered rural settlements and small towns supporting mining activities
abound.
2.5
GEOLOGY AND SOIL
2.5.1 Namibia
At the Omaheke, the sandveld constitutes mainly an Aeolian sand mantle
about 50 m thick. It has a low relief of vegetated ancient longitudinal sand
dunes and windblown sand. Those sandy soils together with the flat
topography have produced the poorly developed drainage lines of the region
all of which rise in the west. The harder surfaces of the landscapes to the
west, together with the more gentle relief, result in better-defined drainage
lines.
The common base material of the Kalahari is remarkably uniform, relatively
unweathered medium-textured sand. The clay content is very low and the
soils are in general weakly developed, shallow and calcareous. Closer to the
drainage lines the soils contain deposits of limestone and quartzite while
sandstone and shale also occur. The sandy nature of the soil accounts for
the very low water-retaining capacity.
The high clay content of the soil in the Hardap Region limits water penetration
which results in a nearly total absence of vegetation. The western border of
the Kalk plateau is characterised by isolated drainage systems and many
pans. To the north the Kalk plateau changes gradually to the rocky
landscape surrounding Rehoboth.
2.5.2 South Africa
Dunes are associated with the arid environment of the Kalahari occur in the
far western region. It also has an interesting and ancient geological heritage,
rich in minerals and palaeontological artefacts. The north-eastern and north-
central regions of the Province are largely dominated by igneous rock
formations, as a result of the intrusion of the Bushveld Complex. Ancient
igneous volcanic rocks dating back to the Ventersdorp age (more than 2 000
million years) appear to be the dominant formations in the western, eastern
and southern regions of the Province.
____________________________________________________________________________________________________________________________
January 2009
2-4
Molopo Nossob Feasibility Study Ł Hydrology Report
The sub river basin area in the Northern Cape is considered to be of medium-
low ecological sensitivity.The Northern Cape's landscape is characterised by
the Kalahari Desert, wavy hills, sand plains, red sand dunes. The rocky soil
type of the Richtersveld are more suited to crop production than the soils of
the rest of the Namaqua District Municipality (DM), but their relatively shallow
depth and adverse climate conditions as well as the steep mountainous
topography makes crop production non-viable. The southern part of the
district has granite-derived loam soils in the valleys. Alluvial soils with high
loam contents result in relatively highly fertile soils.
Due to the dynamic nature of soils of the North West Province, they are
constantly evolving and degrading by means of natural and man-induced
processes. The weathering of rocks in deserts and semi-arid areas tends to
be superficial and hence these soils tend to be shallow and stony. Erosion
and deposition by the agents of wind and water are responsible for the
transportation of soils from one location to another.
Due to the low rainfall, soils only slightly leached over much of the western
region. With high evaporation rates, there is a predominance of upward
movement of moisture in the soils. This often leads to high concentrations of
salts such as calcium and silica in soils, which sometimes lead to the
formation of hard pans or surface duricusts. As a result, high levels of salinity
or alkalinity may develop in these areas. Levels of organic matter tend to be
low, governing the vegetation types which are able to grow there.
The central region has areas covered by red or brown non-shifting sands with
rock. This region also has weakly developed lime soils associated with the
dolomite limestone formations. The south-western region also has areas
characterised by undifferentiated rock and lithosols. Lithosols are shallow
soils containing coarse fragments and solid rock at depths less than 30 cm.
The southern and central regions have black and red clays as well as
ferrisiallitic soils of sands, loams and clays. The drier western region is
characterised by red and yellow arenosols while the south west has
calcareous sands and loams and arenaceous lithosols.
____________________________________________________________________________________________________________________________
January 2009
2-5
Molopo Nossob Feasibility Study Ł Hydrology Report
2.5.3 Botswana
Botswana is characterised by the Kgalagadi (Kalahari) sanda, a mantle of
sand covering the Kalahari Basin, and vast flat, semi-arid and comparative
featureless landscape, except for occasional rocky outcrops. The mean
altitude above sea level is 1 000 m.
2.6
VEGETATION
2.6.1 Namibia
The vegetation can be classified as dry, medium tall savannah associated
areas with good edible grass cover, dominated by acacia thorn bush over the
western and central areas, but do not always form dense stands. To the east
it changes gradually to the Camelthorn (Acacia eroloba) savannah,
characterised by dense edible grass stands with lone standing trees and
mixed stands of shrubs. To the north east it changes to forest savannah and
dry woodland, becoming denser to the north as taller trees appear.
Tall trees and denser stands of the mixed shrubs are confined to
watercourses between the slopes. Over the extreme eastern and southern
part lone standing Camelthorn (Acacia erioloba) trees are more prominent.
Low shrub trees and bushes of varying density become sparser towards the
west and the vegetation changes to a semi-desert dwarf shrub savannah.
Desertification is an issue throughout the region, but especially in the western
areas due to human activity and the injudicious utilisation of the veld. Since
years of drought always predominate over wetter years in an arid
environment, the degeneration of vegetation cannot be stopped by a period of
high rainfall. In the delicately balanced ecosystem of the arid environment
over-utilisation of vegetation, particularly by feeders such as small stock,
could lead to total destruction of the habitat.
2.6.2 South Africa
Only savannah and grassland biomes occur in the North West Province. The
western part of the province falls within the Grassland Biome comprising a
wide variety of grasses typical of arid areas. Given the arid and semi-arid
conditions of the western half of the North West Province, the vegetation of
this region largely comprises plants that are adapted to these conditions
____________________________________________________________________________________________________________________________
January 2009
2-6
Molopo Nossob Feasibility Study Ł Hydrology Report
(known as xerophytes). As a result, low biomass, productivity and species
richness of plants tend to prevail in this region. With the east-west variation in
climate and rainfall, there is a corresponding gradation in the vegetation types
from xerophytic in the west to open grassland and savannah in the central
region.
There is a predominance of Kalahari deciduous Acacia thornveld (open
savannah of Acacia erioloba and A. haematoxylin as well as desert grasses)
and shrub bushveld in the dry western half of the province. The rocky soil is
conducive to Tarchonanthus veld on the dolomite Ghaap Plateau.
The northern and eastern regions reflect the greatest variability of vegetation
types in the province. Vegetation types include sourish mixed bushveld (open
savannah dominated by Acacia caffra and grasses of the Cymbopogon and
Themeda types), turf thornveld and isolated pockets of Kalahari thornveld and
shrub bushveld.
The Northern Cape has unique vegetation consisting of the orange scattered
field and the Kalahari-Dune field, with a large bio-diversity of plants and
animals' species, which are endemic to the respective field types.
The primary threats to biodiversity, ecosystem goods and services are habitat
transformation and degradation, and invasive alien species. Many invasive
species are well established and cause substantial damage, including:
Atriplex lindleyi (Sponge-fruit saltbush); Nummularia (old-man saltbush);
Nicotiana gluaca (wild tobacco); Opuntia ficus-indica (sweet prickly pear) and
torreyana/velutina (honey mesquite). These alien invasive species cause
threats of massive economic and social threats, in terms of our water security,
the productive use of land, intensity of fires and floods, and ultimately the
ecological integrity of the natural system.
2.6.3 Botswana
The vegetation of the south-western parts of Botswana is the Kalahari Acacia
wooded grassland and deciduous bushland, shrub savanna, dominated by
Acacia species (mainly A. haematoxylin, A. mellifera, and A. erioloba),
Terminalia sericea and same Bascia albitrunca.
____________________________________________________________________________________________________________________________
January 2009
2-7
Molopo Nossob Feasibility Study Ł Hydrology Report
2.7
CLIMATE
2.7.1
Rainfall
Rainfall within the study area is highly seasonal with most rain occurring
during the summer period (October to April). The peak rainfall months are
February and March. Rainfall generally occurs as convective thunderstorms
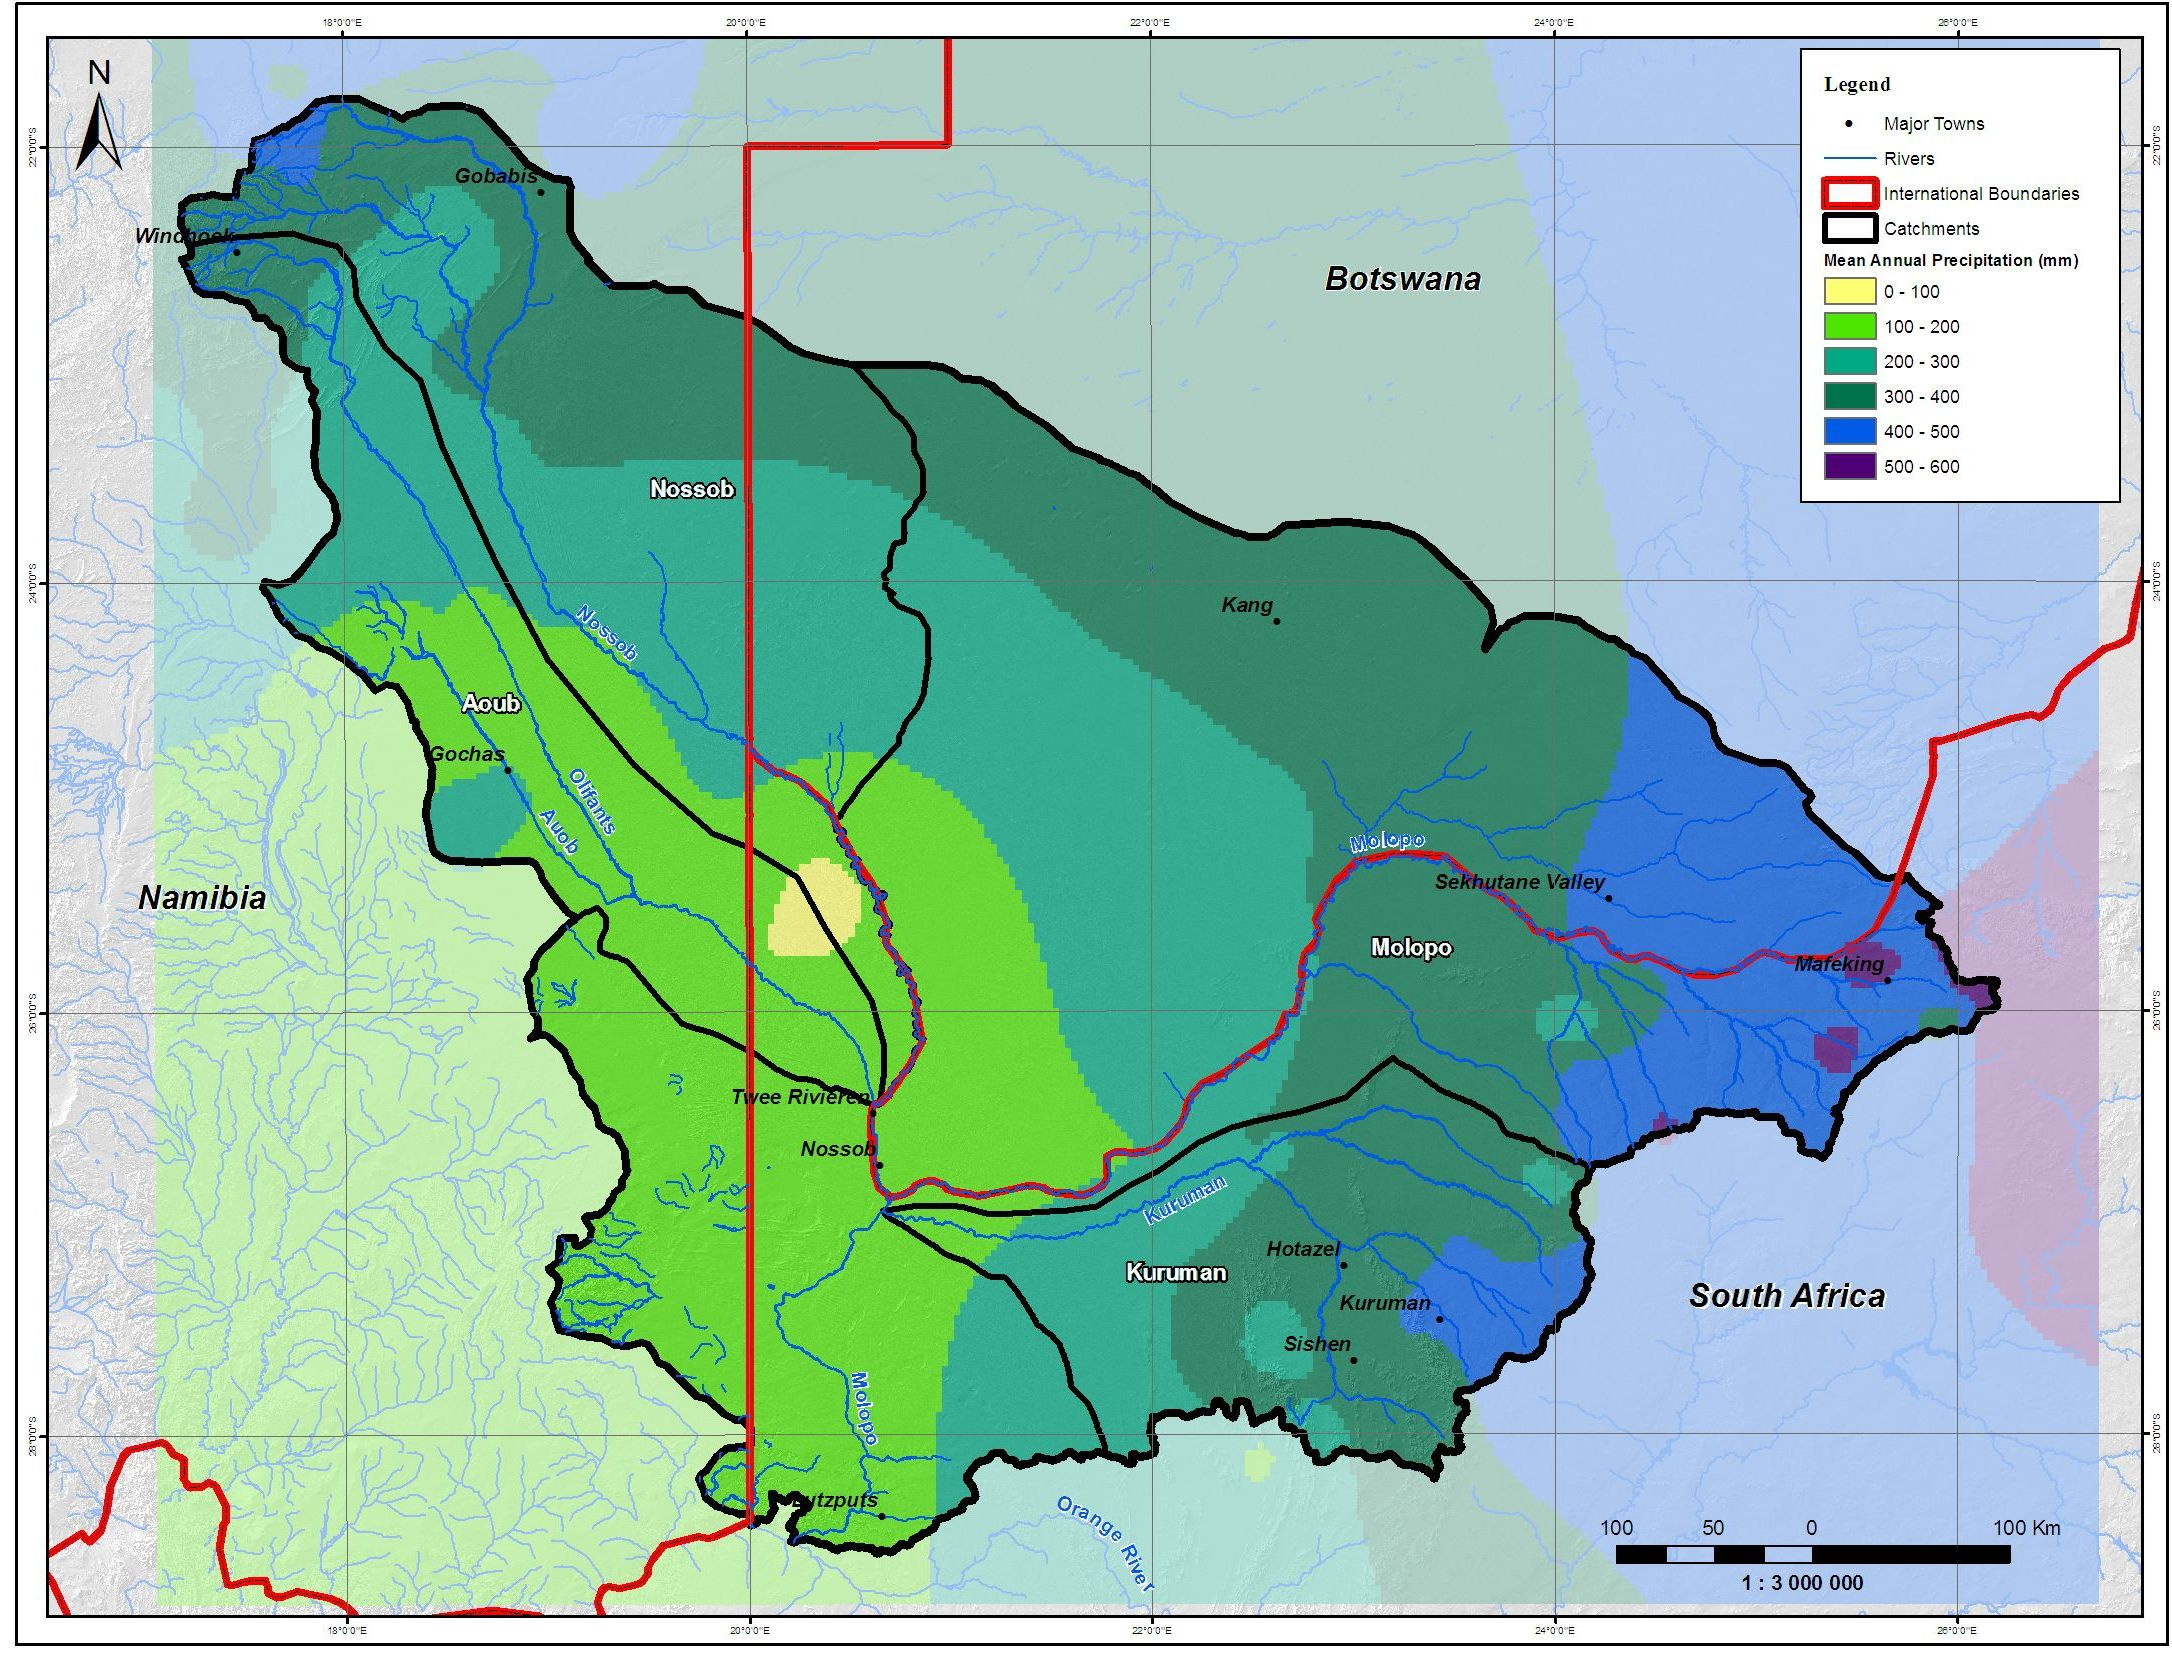
and is sometimes accompanied by hail. The mean annual rainfall over the
Molopo and Kuruman catchments decreases fairly uniformly from more than
500 mm in the east (upper Molopo catchment) to approximately 150 mm in
the vicinity of the Orange River confluence. In the Nossob and Aoub
catchments, mean annual rainfall decreases in a southerly direction and
varies from about 400 mm in the upper Nossob catchment to less than
200 mm at the confluence with the Molopo River.
Figure 2.3 shows the typical seasonal distribution of rainfall within the study
area, while Figure 2-4 depicts the variation in mean annual precipitation over
the study area.
Mariental
28 May 08, 17:08
Seasonal Distribution
30
20
]
P
A
M
%
[
l
l
a
f
n
i
a
R
10
0
Oct
Nov
Dec
Jan
Feb
Mar
Apr
May
Jun
Jul
Aug
Sep
Months, Oct-Sep 1917-1998
Legend:
marient.nsi
Figure 2.3: Typical Seasonal Rainfall Distribution in Study Catchment
____________________________________________________________________________________________________________________________
January 2009
2-8
Molopo Nossob Feasibility Study Ł Hydrology Report
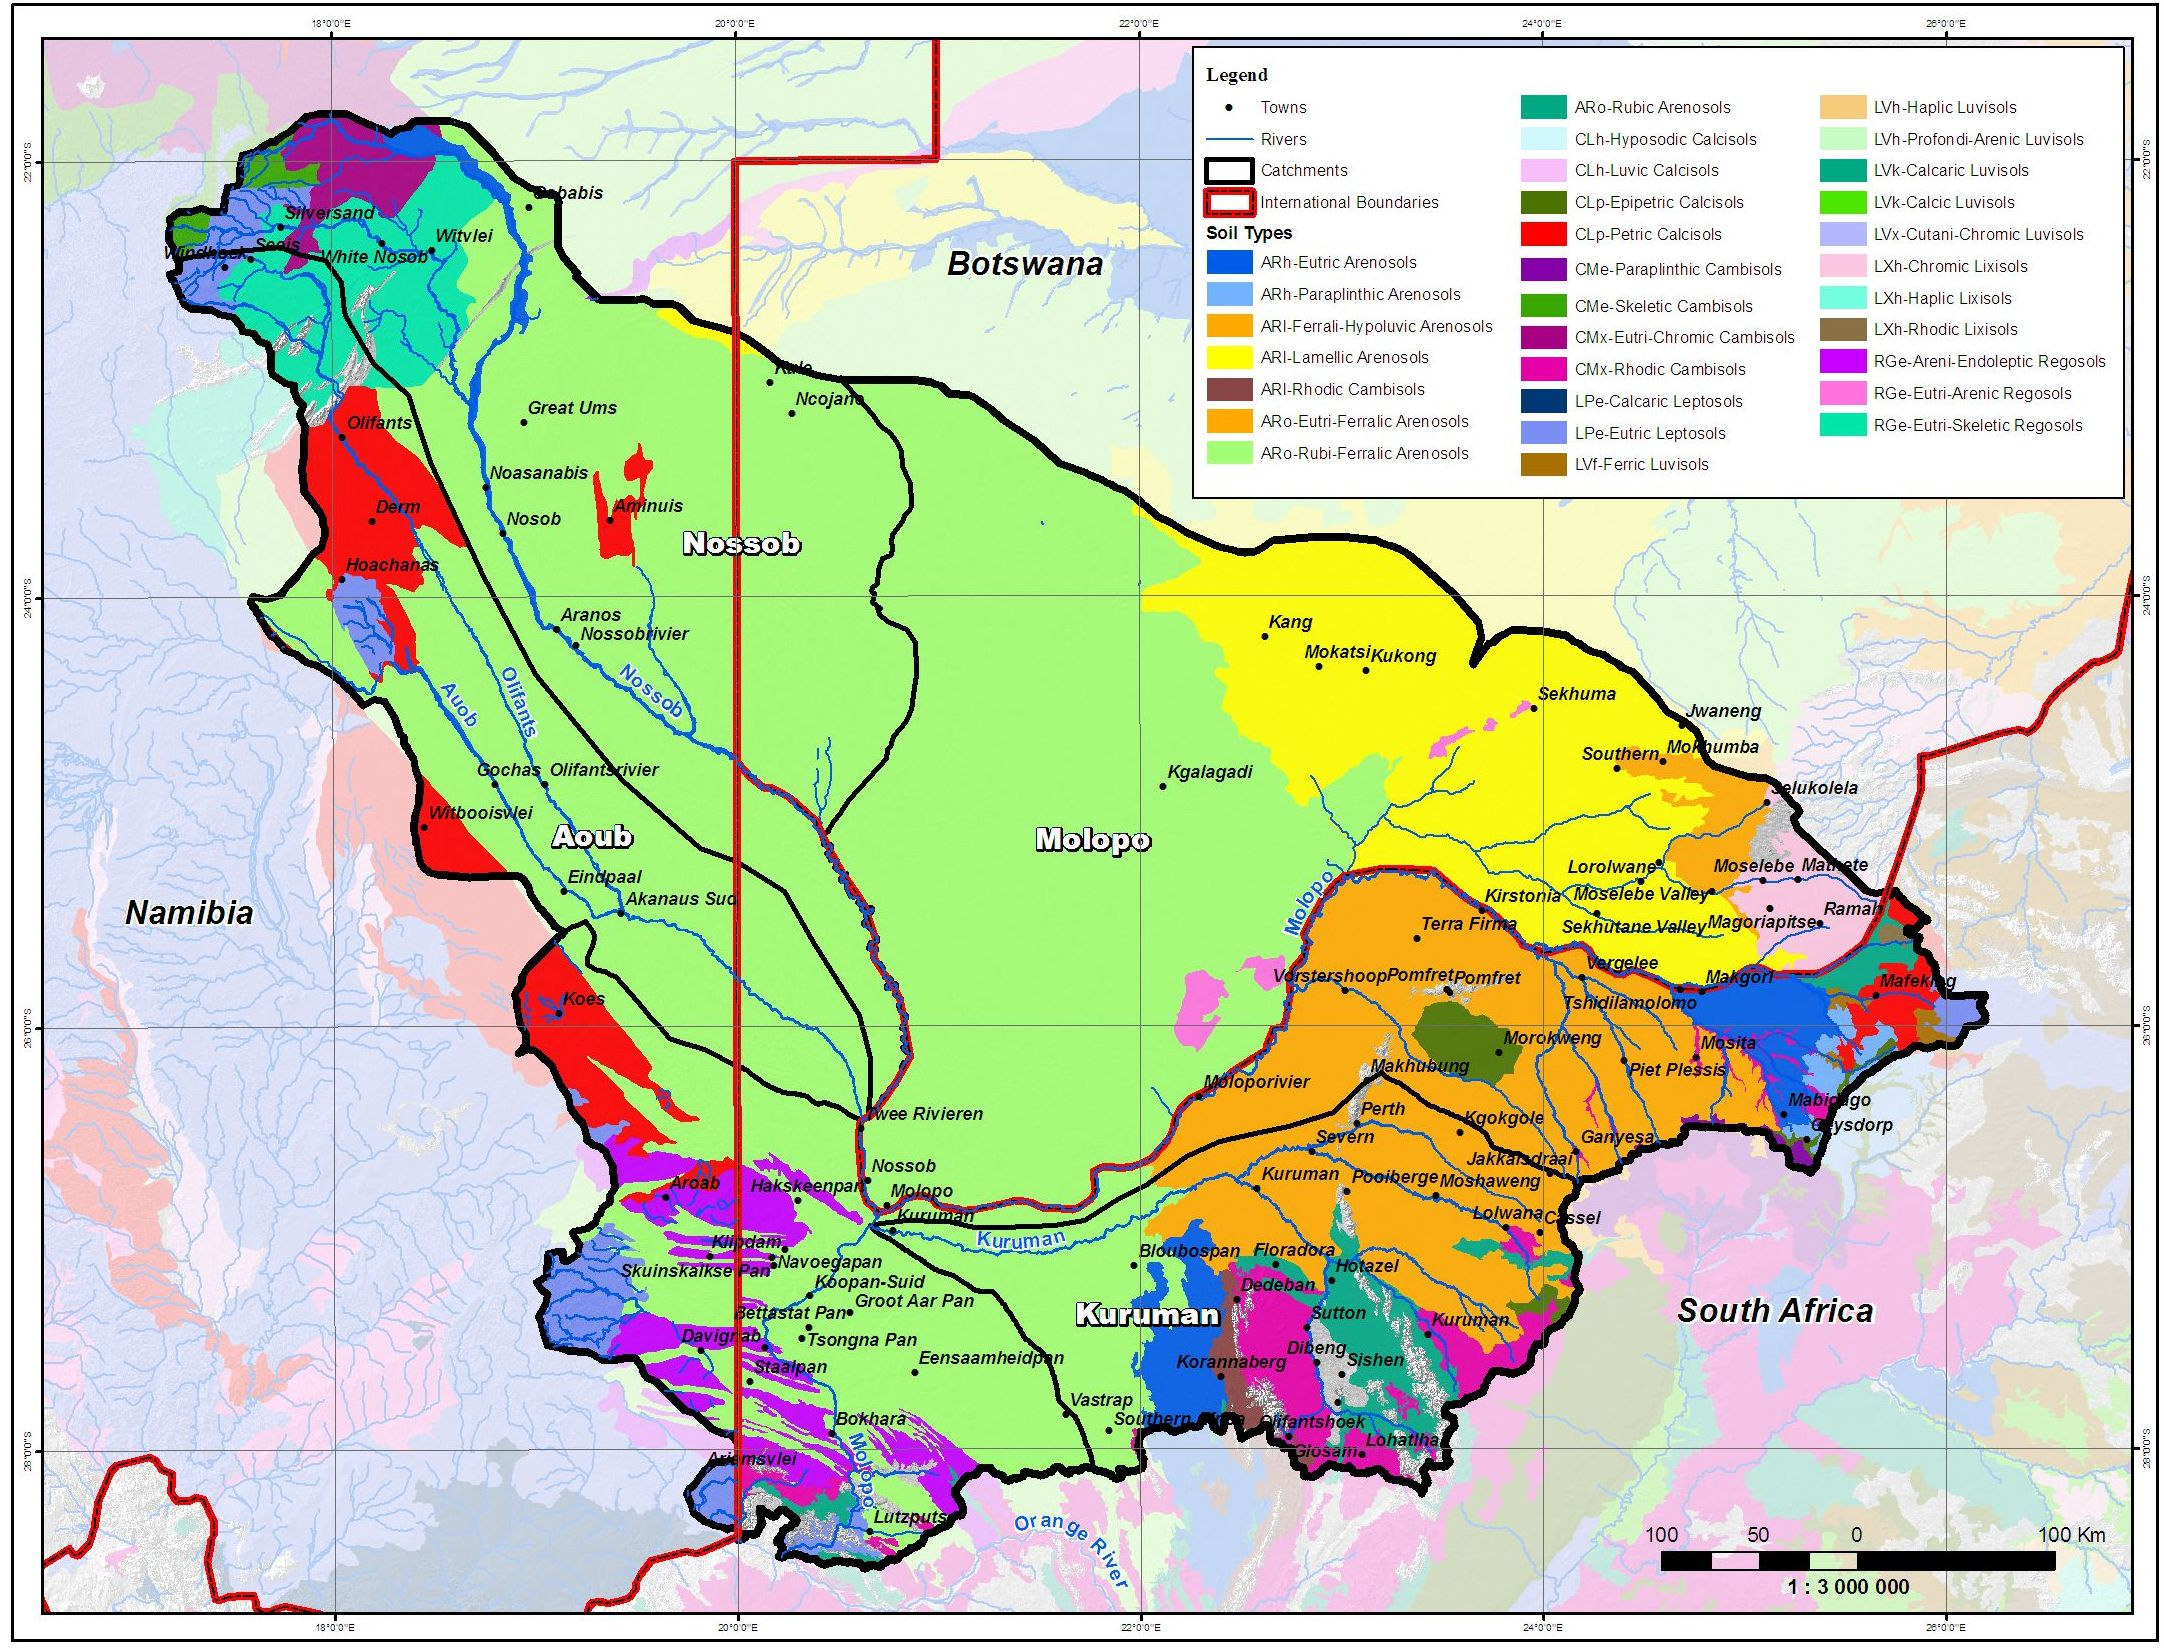
Figure 2-4: Major Soil Types
_________________________________________________________________________________________________________________________________________________________________
February 2009
2-9
Molopo Nossob Feasibility Study Ł Hydrology Report
2.7.2
Evaporation
Evaporation in the Molopo-Nossob catchment is significant with Mean Annual
Evaporation (MAE) generally increasing in a north-westerly direction. MAE (S-
Pan) varies from about 1 900 mm in the upper Molopo catchment to more
than 2 600 mm in the Kalahari Desert. Similar to rainfall, evaporation in the
study area is highly seasonal, with evaporation in the summer months more
than twice as high as during the winter
____________________________________________________________________________________________________________________________
January 2009
2-10
Molopo Nossob Feasibility Study Ł Main Report
Figure 2-5: Mean Annual Precipitation
___________________________________________________________________________________________________________________________________
February 2009
2-11
Molopo Nossob Feasibility Study - Main Report
3.
SOCIO-ECONOMICS
3.1
CATCHMENT ADMINISTRATIVE DISTRICTS
The Molopo River forms the border between South Africa and Botswana for most of
its length to the confluence of the Nossob River, while the Nossob River forms the
border between South Africa and Botswana from where it crosses the border
between Namibia and Botswana to the confluence with the Molopo River. The three
countries have a common border and the point where the Nossob River crosses the
Namibia/Botswana border.
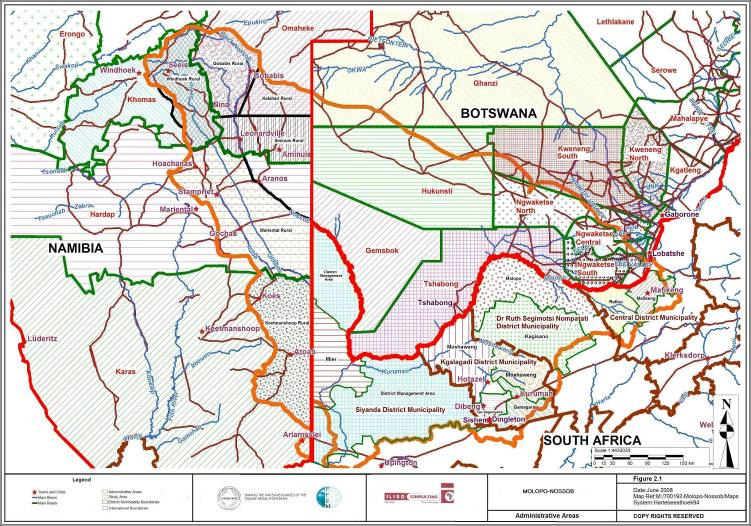
3.1.1 Botswana
The Molopo-Nossob catchment area in Botswana covers the Kgalagadi and
Southern Districts (Figure 3-1). The Kgalagadi District is sub-divided into Kgalagadi
North and South Sub-Districts. The Southern District is sub-divided into three Sub-
regional centers of Good hope, Mabutsane and Moshupa. The district headquarters
is Kanye Village. The Good hope sub-regional center represents the Barolong
region, the Mabutsane sub-regional center represents the Ngwaketse West region
and the Moshupa sub-regional and Kanye regional centers represent the Ngwaketse
region.
3.1.2 Namibia
The administrative regions in Namibia that fall in the Molopo-Nossob catchment are
Omaheke, Komas, Hardap and Karas. More specifically, for Karas, parts of
Keetmanshoop rural and Karasburg constituencies are included; for Hardap mainly
the Mariental rural constituency is included; for Khomas mainly the Windhoek rural
constituency is included; for Omaheke the Aminuis, Gobabis and Kalahari
constituencies are included (Figure 3-1 and Table 3-2).
Table 3-1: Namibian Regions and Constituencies
Region
Constituency
Some Villages in Region
Hardap
Mariental rural
Stampriet, Hoachanas, Bernafy,
Aranos, Gotchas
Karas
Keetmanshoop rural
Koes, Aroab
Karasburg
Ariamsvlei
Khomas
Windhoek rural
Seeis
Omaheke
Aminuis
Aminius, Leonardville
Gobabis
Gobabis
Kalahari
23 July 2009
3- 12
Molopo Nossob Feasibility Study - Main Report
Figure 3-1: Locality of the Molopo Nossob River Catchment
23 July 2009
3- 13
Molopo Nossob Feasibility Study - Main Report
3.1.3 South Africa
In South Africa, the Molopo-Nossob sub river basin covers a northern section of the
Northern Cape Province and the north-western section of the North West Province.
It covers the area between Mafikeng and the South African-Namibian border, north of
the N14. Mafikeng and Kuruman are included in this catchment, and Upington is
excluded. The local municipalities of three district municipalities fall in the sub river
basin (Figure 3-1).
3.2
LANDUSE
3.2.1 Botswana
There are four main types of land use in the Botswana part of the study area
(Figure 3-2) namely:
Ę
Communal Area - In this area all the major villages are situated and traditional
livestock rearing is the most important land use. Apart from livestock rearing a
number of arable fields, especially around the villages are found in this land use
zone.
Ę
Commercial grazing (tribal lease) - In accordance with the Tribal Grazing Land
Policy (TGLP), ranches have been established. TGLP ranches were created to
relieve grazing pressure on communal grazing land. In the Kgalagadi District
there are 6 blocks of TGLP ranches being, the Bokspits Block, the Middlepits
Block, Tsabong Block, Makopong Block, Werda Block and Hukuntsi Block.
Ę
Commercial grazing (freehold, state land leased) - this land use zone is entirely
taken by the freehold and leasehold farms of the Molopo Block. Since these
farms are not situated in the Kgalagadi Tribal Territory, they are administered by
the Department of Surveys and Lands. Generally these farms are developed, well
managed and commercially run.
Ę
Wildlife Management Area (WMAs) - the Wildlife Conservation Policy of 1986
converted stretches of land that were formerly designated as "reserved" under
the Tribal Grazing Land Policy of 1975 into WMAs. According to NDP 9 2003/04
to 2008/09 (MFDP, 2003, p. 246), WMAs were established by the Department of
Wildlife National Parks and Division of Land Use Planning to serve as migratory
corridors for wildlife between the protected areas as they allowed for movement
that is essential for the survival of Botswana's wildlife in the arid environment.
The WMAs were further sub-divided by DWNP and Division of Land Use
Planning into Controlled Hunting Areas (CHAs), and these CHAs were
subsequently earmarked for various kinds of management and utilization, and
23 July 2009
3- 1
Molopo Nossob Feasibility Study - Main Report
Figure 3.2: Landuse in the catchment
23 July 2009
3- 1
Molopo Nossob Feasibility Study - Main Report
3.2.2 Namibia
In Namibia, the area in the sub river basin consists of farms/freeholds farmlands on
which large scale commercial agriculture takes place (Figure 3-2).
Pockets of communal land on which subsistence agricultural activities take place
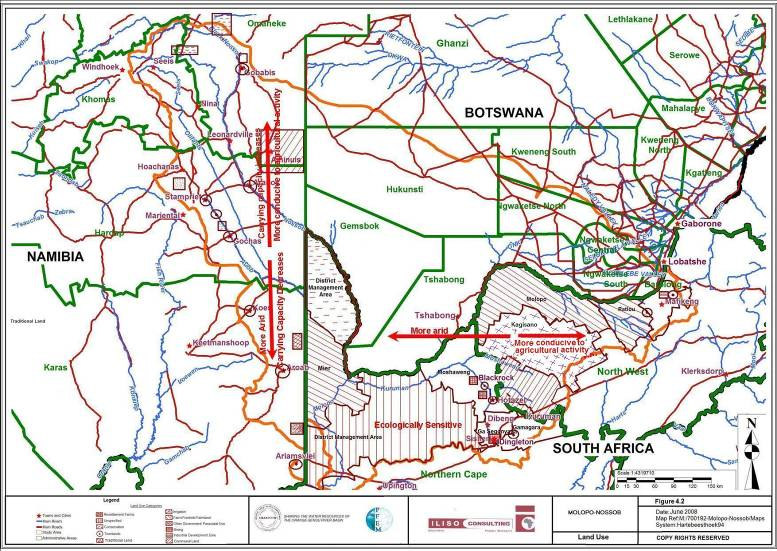
exist north of Aranos and Ariamsvlei. Where grazing for subsistence purposes occur
in this area, the carrying capacity of the land tends to be overloaded.
The carrying capacity of the land decreases from the northern part of the sub basin to
the southern part, from 30-39 kg/ha to 4-9 kg/ha. The cattle density reduces from 5-
12/ha to 0-4/ha (Atlas of Namibia Project, 2002).
Information about the suitability of soil in the affected area in Namibia for crop
production could not be sourced. However, the fact that mostly grazing occurs in this
area indicates that crop farming is not considered to be suitable.
In general, where crop farming occurs, dry land farming is practiced because of lack
of water which is required for effective irrigation. Crop farming and some irrigation
was observed between Gobabis and Windhoek. The Gobabis area where crop
farming with irrigation was observed was in close proximity to the Tilda and Daan
Viljoen Dams in Namibia. The water supply from the dams proved to be inadequate
to provide for the users, and the Gobabis Water Supply Scheme was implemented to
supplement water from the dams.
At Bernatey in the Mariental rural constituency, irrigation of crop fields, mainly
vegetables for subsistence and citrus for the commercial market, occurs. Bernatey is
on the southern end of the Stampriet artesan aquifer on the Auob River.
Mining is not a significant land use in the Namibian sub river basin. Planned mining
developments in the sub basin in Namibia could not be determined.
As far as could be established, no major industries operate in the Namibian sections
of the sub river basin.
23 July 2009
3- 2
Molopo Nossob Feasibility Study Ł Main Report
3.2.3 South Africa
The land in the sub river basin is mainly private land, with some state/tribal land in
the North West Province and Moshaweng LM in the Northern Cape (Figure 3-2).
These are also the areas where most of the subsistence farming occurs.
Irrigation occurs along the Orange River, which does not fall in the sub-basin.
However, water usage along this river might affect the water availability in the sub
basin.
More than 80 % of the land in the Northern Cape is used for natural grazing to feed
an array of animal's mostly cattle, but also sheep, and goats, game and ostriches
(Northern Cape Provincial Government, 2007).
The eastern part is more conducive to agricultural activities. The land south of the
Kgalagadi Transfrontier Park is considered to be of high ecological sensitivity.
Mining does occur, mainly in Kgalagadi District Municipality. The active mining takes
place at Sishen (meaning "new place") and Hotazel. Sishen Iron Ore Mine, a
subsidiary of Kumba Resources, is located south of Kathu ("town under the trees") in
the Gamagara Local Municipality. This mine intends to further expand, which will
have implications for job creation, economic activity, and service delivery.
Almost all of the estimated 12 billion tonnes of manganese in South Africa are
located in the Kalahari (Kgalagadi Nodal Economic Profiling Project, 2007).
Samancor Manganese at Hotazel also plans to expand.
Assmang is situated in Blackrock, and it is not expected to increase (Kgalagadi Nodal
Economic Profiling Project, 2007). Assmang operates three divisions: manganese
ore, iron ore, and chrome ore. The manganese and iron ore operations are in
Nchwaning and Beeshoek in the Northern Cape.
As far as could be established, no other economically viable mineral resources have
been found in the sub river basin, except for recent findings in the Rietfontein (Mier
Municipality) area. According to the Kgalagadi DM's Integrated Development Plan
(IDP) (2004) there are small pockets of various minerals. The largest are copper and
zinc of Areachap north of Upington. Various small concentrations of calcite, lead,
___________________________________________________________________________________________________________________________________
February 2009
3-3
Molopo Nossob Feasibility Study Ł Main Report
fluorspar, barite, wolfram and amethyst have been mapped but not at a notable
scale.
Currently, salt is being mined at two pans, namely Groot Witpan, 95 km northwest of
Upington and at Witpan, 115 km northwest of Upington. If one takes into account
that there are 110 saltpans in the interior (69 coastal saltpans, as well as sea salt
plants where salt is produced), the importance of the two pans north of Upington is
clear. It might seem as if South Africa has inexhaustible reserves because of the
great number of pans, but available information indicates that the production at most
pans is small and uncertain. Rain is not conducive to salt production. Some pans
have to stop production for years after a good rainy season (Kgalagadi DM IDP,
2002).
As far as could be established, except for the Mafikeng area, no major industries
operate in the South African and Namibian sections of the sub river basin. An
Industrial Development Zone is planned for Mafikeng.
3.3
POPULATION
3.3.1 Botswana
The population figures for the census years 1971, 1981, 1991 and 2001 are
presented in Tables 3-2 to 3-6. The data on the tables also shows population
changes between the census years. Overall, there was a population increase.
Table 3-2: Population by District
District
1971
1981
% Change 1991
% Change 2001
% Change
1971-1981
1981 - 1991
1991-2001
Kgalagadi District
Kgalagadi North
3699
6707
81
11 340
69
16 111
42
Kgalagadi
15 137
24 059
59
19 794
-18
25 938
31
South
Southern District
Ngwaketse
70 558
104 182
48
128 989
24
124 175
-4
Barolong
10 973
15 471
41
18 400
19
47 477
158
Total
100 367
150 419
50
178 523
19
213 701
20
Table 3-3: Population of towns in District
Town
1971
1981
% Change 1991
% Change 2001
% Change
1971-1981
1981 - 1991
1991-2001
Towns
Lobatse
12 920
19 034
47
26 052
37
29 689
14
Jwaneng
-
5 567
-
11 188
101
15 179
36
___________________________________________________________________________________________________________________________________
February 2009
3-4
Molopo Nossob Feasibility Study Ł Main Report
Table 3-4: Kgalagadi District Population by Village/Locality
Village/Locality
1971
1981
%
1991
%
2001
% Change
Change
Change
1991-2001
1971-
1981
-
1981
1991
Hukuntsi Sub District (Kgalagadi North)
Hukuntsi
1 116
2 009
73
2 562
28
3 807
49
Hukuntsi area
-
256
-
306
20
4 131
1 250
Kang
1 110
1 684
52
2 657
58
4 124
55
Phuduhudu
-
629
-
322
-49
621
93
Lokgwabe
300
866
189
1 037
20
1 304
26
Lokgwabe area
-
538
-
233
57
1 435
516
Lehututu
448
713
59
1 304
83
1 719
32
Lehututu area
-
753
-
231
-69
1 778
670
Tshane
604
637
5
706
11
858
22
Hunhukwe/Ohe
42
424
910
356
-16
579
63
Ohe
Same
Same
Same as
77
-
Part of
-
as
as
above
Hunhukwe
above
above
Manong (RAD)
4
100
2 400
232
132
172
26
Ukhwi (RAD)
31
274
784
313
14
454
45
Ngwatle (RAD)
-
-
-
92
-
206
124
Zutshwa (RAD)
-
-
-
203
-
525
159
Ncaang
-
-
-
-
-
175
-
Maake (RAD)
-
-
-
182
-
366
101
Lokgware (RAD)
-
-
-
307
-
-
-
Caa Cattle-post
-
-
-
100
-
(Part of
-
Zutshwa)
Cawane
-
-
-
34
-
(Part of
-
Kang)
Shobowe
-
-
-
340
-
-
-
Inalegolo
-
-
-
-
-
558
-
Other settlements
93
-
129
39
Totals
3 699
6 707
81
11 340
69
16 111
42
Kgalagadi South
Tsabong
647
1 732
168
4 585
165
7 228
58
Werda
706
1 109
57
1 974
78
2 237
13
Makopong
519
824
59
1 270
54
1 635
29
Phepheng/Draaihoek
337
569
69
826
45
998
21
Omaweneno
330
491
49
974
98
1 134
16
Khuis
213
490
130
696
42
851
22
Kolonkwane
240
415
73
751
81
762
2
Gakhibana
221
376
70
659
75
797
21
Middlepits
212
369
74
454
23
657
45
Bokspits
250
312
25
395
27
575
46
Maubelo
110
271
146
395
46
453
25
Bogogobo
191
225
18
368
64
341
-7
Kisa
352
197
44
1 021
418
545
-47
Kokotsha (RAD)
-
-
-
874
-
1 333
53
Vaal-hoek
-
185
-
224
21
346
55
Struizendum
136
182
34
289
59
313
8
Rappelspan
82
151
84
306
103
458
50
Bray
135
269
99
768
186
899
17
Maralaleng
164
186
13
Associated
-
487
-
with Kisa
Khawa
-
-
-
424
-
623
47
Maleshe
-
-
-
-
-
455
-
___________________________________________________________________________________________________________________________________
February 2009
3-5
Molopo Nossob Feasibility Study Ł Main Report
Village/Locality
1971
1981
%
1991
%
2001
% Change
Change
Change
1991-2001
1971-
1981
-
1981
1991
Other
settlements
-
-
-
1 743
-
2 811
61
(RADs)
Totals
15
24
59
19 794
-18
25 938
31
137
059
Table 3-5: Ngwaketse and Ngwaketse West population by Village/Locality
Village/Locality
1971
1981
% Change 1991
%
2001
%
1971-1981
Change
Change
1981
-
1991-
1991
2001
Ngwaketse
Kanye
10 664
20 215
90
44 520
120
48 143
8
Ranaka
1 470
1 914
30
3 176
66
3 124
-2
Lotlhakane West
213
884
315
906
2.5
1 192
32
(Lotlhakane
(Lotlhakane
East & West) East & West)
Gasita
84
137
62
-
-
2 046
-
Lorolwana
60
115
30
574
399
1 090
90
Tsonyane
-
304
-
-
-
609
-
Kgomokasitwa
299
838
180
1 518
81
1 447
-5
Pitseng/Ralekgeth
149
226
-
-
-
850
-
o
Mokhoma
-
295
-
-
-
839
-
Lekgolobotlo
204
389
91
1 075
176
1 193
11
Seherelela
-
-
-
-
-
536
-
Lotlhakane
Considered
Considered
Considered
2 581
-
4 692
82
under
under
under
Lotlhakane
Lotlhakane
Lotlhakane
West
West
West
Sese
37
370
900
-
-
1 725
-
Sesung
181
695
284
-
-
440
-
Mogotlhwane
272
661
143
1 039
57
1 131
9
Segwagwa
32
278
760
-
-
1 062
-
Manyana
964
2 004
108
2 943
47
3 488
19
Maokane
140
653
366
1 344
106
1 629
21
Dipotsana
696
-
-
-
-
124
-
Diabo
65
283
337
-
-
272
-
Molapowabojang
346
778
125
4 371
462
7 499
72
Moshaneng
589
716
22
1 732
142
1 637
6
Moshupa
3 114
6 612
112
22 429
239
22 811
2
Ntlhantlhe
421
936
122
2 412
158
2 172
-10
Tshwaane
654
-
-
-
-
204
-
Samane
117
274
134
1 219
345
886
-27
Tlhankane
-
-
-
-
-
503
-
Selokolela
384
512
33
3 028
491
1 825
40
Mogonye
186
362
94
496
37
535
8
Totals
70 558 (for
104 182 (for
48
128 989
24
113
-
Ngwaketse
Ngwaketse
(for
704
and
and
Ngwake
Ngwaketse
Ngwaketse
tse and
West
West
Ngwake
combined)
combined)
tse
West
___________________________________________________________________________________________________________________________________
February 2009
3-6
Molopo Nossob Feasibility Study Ł Main Report
Village/Locality
1971
1981
% Change 1991
%
2001
%
1971-1981
Change
Change
1981
-
1991-
1991
2001
combine
d)
Ngwaketse West
Mabutsane
459
928
102
1 178
27
1 805
53
Morwamosu
180
398
121
648
63
671
4
Sekoma
150
490
227
1 277
161
1 327
4
Khonkhwa
-
204
-
-
-
525
-
Keng
78
387
396
893
131
1 095
23
Khakhea
480
1 273
165
2.330
83
2 529
9
Kokong
374
548
47
800
46
989
24
Kanaku
-
-
-
-
-
149
-
Mahotshwane
-
-
-
-
-
775
-
Itholoke
-
-
-
-
-
343
-
Other settlements
-
-
-
-
-
263
-
Totals
Considere
Considere
Considere
Considered
Considered
10 471
-
d under
d under
d under
under
under
Ngwaketse
Ngwakets
Ngwakets
Ngwaketse
Ngwaketse
e
e
Table 3-6: Barolong population by village/locality
Village/Locality
1971
1981
%
1991
%
2001
%
Change
Change
Change
1971-
1981
-
1991-
1981
1991
2001
Barolong
Pitsane Siding
-
-
-
2 212
-
2 959
34
Tlhareseleele
628
634
1
713
13
767
8
Pitsana-Potokwe
393
556
41
827
49
860
4
Rakhuna
660
866
31
1 417
64
1 246
-12
Malokaganyane
273
315
15
366
16
321
-12
Bethel
275
295
7
351
19
440
25
Dinatshana
110
278
153
373
34
480
29
Ngwatsau
356
333
-6
327
-2
338
3
Ramatlhabama
610
1 025
68
1 150
12
1 421
24
Good Hope
472
841
78
2 003
138
2 972
48
Mokatako
418
743
78
1 223
65
1 427
17
Tswanyaneng
220
292
33
842
188
518
-39
Metlojane
276
335
21
926
176
919
-1
Borobadilepe
250
305
22
373
22
310
-17
Hebron
257
576
124
711
23
776
9
Logagane
238
271
14
371
37
390
5
Tswagare/Lothoje/Lokalana
172
282
64
391
39
347
-11
Makokwe
191
203
6
165
-19
128
-22
Marojane
327
267
-18
272
2
263
3
Papatlo
278
466
68
429
-8
390
9
Phihitshwane
396
506
28
672
33
560
-17
Molete
-
-
-
313
-
320
2
Ditlharapa
286
296
4
274
-7
682
149
Madingwana
115
250
117
323
29
334
3
Kgoro
523
658
26
726
10
782
8
Sheep Farm
279
272
-3
312
15
313
0.3
Motsentshe
144
215
49
-
-
375
-
___________________________________________________________________________________________________________________________________
February 2009
3-7
Molopo Nossob Feasibility Study Ł Main Report
Village/Locality
1971
1981
%
1991
%
2001
%
Change
Change
Change
1971-
1981
-
1991-
1981
1991
2001
Mogwalale
212
367
73
-
-
281
-
Gathwane
347
711
105
2 215
212
1 292
42
Digawana
949
1 780
88
2 156
21
2 675
24
Magoriapitse
272
348
28
1 080
210
1 110
3
Lejwana
210
298
42
379
27
557
47
Mogojogojo
155
358
131
1 533
328
1 910
25
Mmathethe
1 100
1 990
81
6 728
238
6 692
-0.5
Mokgomane
96
359
274
1 735
384
1 309
-25
Pitshane Molopo
768
1 036
35
1 731
67
1 660
-4
Sedibeng
55
139
153
365
163
636
74
Musi
-
-
-
-
-
244
-
Tshwaaneng
144
191
33
625
227
740
18
Gamajalela
-
-
-
-
-
566
-
Dikhukhung
128
156
22
340
118
309
-9
Leporung
276
461
67
708
54
703
-0.7
Mmakgori
220
320
45
435
36
808
86
Mabule
654
1 054
61
2 091
98
1 628
-22
Tshidilamolomo
241
549
128
715
30
702
-2
Metlobo
133
341
156
1 207
254
1 244
3
Lorwana
388
503
30
834
66
725
-13
Kangwe
179
310
73
-
-
166
-
Sekhutlane
-
-
-
-
-
796
-
Other settlements
-
-
-
-
-
86
-
Totals
10 973
15 471
41
18 400
19
47 477
158
3.3.2 Namibia
Despite rapid urbanisation, Namibia is still a mainly rural society. This is anticipated
to change considerably and by 2010 it is expected that 50% of the population will be
urbanised (43 % in 2006).
Namibia's population was 1.8 million in 2001 and the growth rate is estimated at
2.6 % (Namibia Household Income and Expenditure Survey, 2003-2004). However,
aaccording to UNICEF, the HIV prevalence rate in Namibia amongst the population
aged 14-64 was estimated at approximately 19.6 % at the end of 2005. To temper
growth-related expectations, these figures as well as decreasing fertility (UNDP,
2008) has to be factored into the population growth rate figures, which are projected
at 2.61 million by 2011 (4.27 by 2030) (high variants of the projection model) (Office
of the President, 2004).
Overall, the sub river basin is sparsely populated, mainly because the area is too dry
for extensive human settlement (Table 3-7). For Namibia, the majority of the
population (60 %) live in the northern regions that do not fall in the basin. Khomas is
home to 14 % of the Namibian population, and is the most populated area in
___________________________________________________________________________________________________________________________________
February 2009
3-8
Molopo Nossob Feasibility Study Ł Main Report
Namibia. The annual growth rate is 4 % per annum. The least populated area in
Namibia also falls in the sub river basin. This is the Omaheke Region, which is home
to 3 % of the Namibian population. Omaheke Region's annual growth rate is 2.5 %
per annum. The annual growth rate for Karas is 1.3 % and for Hardap 0.3 % per
annum (Karas and Hardap Regional Poverty Profile, 2005).
The population density (Figure 3-3) in the sub river basin is mainly 0.01 to 1.1 people
per km2, and it increases to 1 - 5 people per km2 in the villages such as Nina, 10 - 25
people per km2 in Mariental and surrounding villages, and 50 - 100 people per km2 in
Gobabis (Namibia Vision 2030).
All the areas in Namibia showed a positive population growth rate. Whilst 33 % of
the population lived in urban centres in 2001, the urban population is currently
growing at a much higher rate (over 5 % per annum), than the rural population. The
vision is for Namibia to be a "highly urbanised country with 75 % of the population
residing in the designated urban areas" (Office of the President, 2004: Vision 2030
page 49).
Table 3-7: Namibian Population Growth
Region
Population
Population
Population
(2001)
(2007)
Growth
Karas
69 321
71 701
3.4%
Keetmanshoop Rural
6 349
Karasburg
14 693
Omaheke
68 041
75 620
11.1%
Aminuis
12 343
Gobabis
Kalahari
Hardap
68 246
70 584
3.4%
Mariental Rural
13 596
Khomas
250 260
304 341
21.6%
Windhoek Rural
19 908
Source: Central Bureau of Statistics
___________________________________________________________________________________________________________________________________
February 2009
3-9
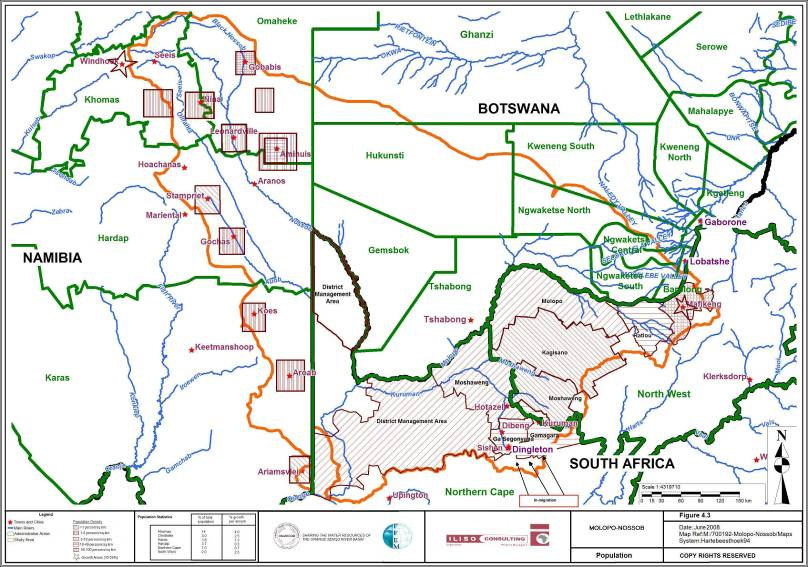
Molopo Nossob Feasibility Study - Main Report
Figure 3.3: Population distribution in the catchment area
23 July 2009
3- 10
Molopo Nossob Feasibility Study - Main Report
The household size in rural areas is larger than in urban areas, 5.4 compared to 4.2
persons. In Namibia, the population in rural areas is generally younger than the
population in urban areas, but urban areas have a larger population of 15-59 year
olds, the working ages. In urban areas, there are more males than females in the 15
- 49 year old age group, which is a reflection of the migration of males to urban areas
in search for jobs. Senior citizens represent 6 % of the urban population. A large
percentage (45 %) of Namibia's households is female-headed. These households
are often worse off than male-headed households (Namibia Vision 2030). See
Table 3-8 for a summary.
In terms of educational attainment, there are large differences between those living in
urban areas, and those living in rural areas. In Namibia, the proportion of those
without formal education is 23 % in rural areas, compared to 7 % in urban areas. In
Omaheke, 37 % of the population has no formal education, whereas in Hardap,
Karas, and Khomas the percentage is below twenty. A higher proportion of
households where heads have no formal education own poultry, goats, pigs and
donkeys/mules compared to households where the head has attained tertiary
education. For households where the head has a tertiary education, the proportion
owning grazing land and sheep is relatively high (Namibia Household Income and
Expenditure Survey, 2003/2004).
Table 3-8: Differences in Urban and Rural Populations
Urban
Rural
more 15-49 year olds
generally younger
more males
more females
7% without formal education
23% without formal education
Population growth over 5% per annum
Slow population growth
Remote Area Dwellers (Botswana) have a similar profile to the profile depicted in
Table 3-8.
3.3.3 South Africa
The census results showed that the population of South Africa increased from
40.5 million in 1996 to 44.8 million in 2001, showing an overall increase of 8.2 %
since 2001 (Community Survey, 2007).
23 July 2009
3- 11
Molopo Nossob Feasibility Study Ł Main Report
The distinction between rural and urban areas in South Africa is difficult to make as
rural poverty in South Africa differs from other developing countries. South Africa is
unique in that migration is circulatory, and households that form part of the migratory
cycle are affected by economic, social and health issues of the rural as well as the
urban areas. Income generated by and food consumed from agriculture therefore
form a small part of the rural household's resources (Northern Cape State of the
Environment Report, updated 2005). Considering the 2001 census data, and the
State of the Cities Report, the area in the basin may still be considered rural. The
Kgalagadi DM was identified as 94 % rural in 2001.
The population of the North West Province has increased by 2.5 % from 2001 to
2007 with the total population estimated at 3.3 million (more than the total Namibian
population), and for Northern Cape has increased by 6.7 % with the total population
estimated at 1.1 million (below the total Namibian population). Northern Cape is
home to approximately 2 % of the South African population, and North West Province
to approximately 7 % (Figure 3-3).
The population density in the Northern Cape is 2 people per km2 and for Northwest
21 per km2. The population density in the Northwest areas that fall in the sub-basin
is approximately 8 people per km2 except for Mafikeng LM with approximately 70
people per km2; Molopo LM with approximately 0.8 people per km2; and Ratlou LM
with approximately 22 people per km2. Because most of the land is invaded by bush,
the actual figure for density is considered to be much higher.
Table 3-9 shows the growth rate. The pattern that emerges is that the growth in
urban areas / close to urban areas, are occurring at a higher rate.
Half of the affected areas in the basin within South Africa showed a negative growth
rate between 2001 and 2007. These negative growth rates ranged from as little as -
0.9 % to as high as - 44.3 %. It is however unclear what the reasons are for these
negative growth rates, i.e. whether it can be ascribed to factors such as high mortality
rates and low birth rates, migration, urbanisation, etc.
___________________________________________________________________________________________________________________________________
February 2009
3-12
Molopo Nossob Feasibility Study Ł Main Report
Table 3-9: South African Population Growth
Region
Population
Population
Population
(2001)
(2007)
Growth
Projected annual population growth rates 2001-2021
(2005 provincial boundaries): 0.73%
North West Province
3 193 676
3 271 948
2.5%
Bophirima District Municipality
432 069
354 554
-17.9%
- Kagisano Local Municipality
88 780
75 946
-14.5%
- Molopo Local Municipality
11 688
6 516
-44.3%
Central District Municipality
762 999
798 783
4.7%
- Ratlou Local Municipality
104 324
98 104
-6.0%
- Mafikeng Local Municipality
259 478
290 229
11.9%
Projected annual population growth rates 2001-2021
(2005 provincial boundaries): 0.43%
Northern Cape Province
991 919
1 058 060
6.7%
Siyanda District Municipality
202 160
238 063
17.8%
- Mier Local Municipality
6 844
7 337
7.2%
Kgalagadi District Municipality
191 539
173 454
-9.4%
-
Ga-Segonyana
Local
70 392
69 791
-0.9%
Municipality
-
Moshaweng
Local
91 708
70 012
-23.7%
Municipality
- Gamagara Local Municipality
23 202
28 054
20.9%
Source: http://www.unisa.ac.za/contents/faculties/ems/docs/Press364.pdf
The average household size in South Africa is 3.9, as per the Community Survey
(2007). This survey no longer distinguishes between rural and urban communities,
and a comparison between urban and rural household sizes can therefore not be
drawn. According to the State of the Cities Report (2006) the average city household
size decreased from 3.7 to 3.6 between 1996 and 2001, and the average city
household size was estimated at 3.31 in 2005. When looking at the difference
between the average South African household size and the average city household
size, it follows that the household size in areas other than the major cities in South
Africa should generally be larger.
___________________________________________________________________________________________________________________________________
February 2009
3-13
Molopo Nossob Feasibility Study Ł Main Report
According to the State of the Cities Report (2006), there has been a consistent
increase between 1996 and 2005 of South African city residents between the ages of
15-34 years, with a proportional decrease of residents aged 65 years and older.
Although the population growth in the cities is decreasing, the Gauteng metropolitan
centres showed a higher than average growth rate between 1996 and 2005, below
2 % compared to above 2 %. In urban areas, similar to that of Namibia, there are
more males than females in the 15-49 year old age group, which is also a reflection
of the migration of males to urban areas in search for jobs.
Part of the negative growth rate might be ascribed to the HIV prevalence rate within
these two provinces. A report released by the National Department of Health (2006)
stated that the HIV prevalence rate within the North West Province is estimated at
29.0 % and within the Northern Cape at 15.6 %.
Another reason might be migration from Moshaweng to the western part of the
district municipality where mining occurs. The Moshaweng LM houses about 60 % of
the Kgalagadi DM population in 165 villages, job opportunities are scarce, poverty
levels are high, and migration of a number of people is therefore a constant
occurrence in this municipality.
The South African section in the basin has a similar educational profile to that of rural
Namibia, where and an average of 20 % of the adult population have completed
grade 12. For Kagisano, Ratlou and Molopo (North West Province) as well as Mier
(Northern Cape Province) Local Municipalities, less than 10 % have completed an
education equivalent to grade 12. In Kgalagadi DM (Northern Cape), Moshaweng LM
has the lowest percentage of adults who passed matric, estimated at 8 %, with
Gamagara LM at 23 % and Ga-Segonyana at about 18 % (census 2001; Kgalagadi
Nodal Economic Profile Project, 2007). Mafikeng LM (North West Province) equals
Gamagara at 23 %. Refer to Table 3-15 to see the comparison between urban and
rural people in this regard.
3.4
ECONOMY
3.4.1 Botswana
3.4.1.1
Kgalagadi District
The Kgalagadi District (Figure 3-4) is largely a ranching region. However, traditional
livestock rearing remains the most important means of living for most households.
___________________________________________________________________________________________________________________________________
February 2009
3-14
Molopo Nossob Feasibility Study Ł Main Report
Livestock ownership in the district is skewed. As the economy of the region is
primarily based on cattle rearing for meat production, most food, domestic supplies
and production inputs to the region come from suppliers based in Lobatse, Jwaneng
and Gaborone. No manufacturing activities of a significant scale are currently taking
place within the district. As with manufacturing, commercial development within the
district is largely constrained by the small, scattered and poor population and
undeveloped district infrastructure. Small general dealers, restaurants, bottle stores
and other commercial establishments are the predominant retail businesses located
in most villages. Informal sector activities provide income for many households.
3.4.1.2
Southern District
The dominant sector in terms of employment is agriculture as most people in the
rural areas earn their living from farming. Activities are diverse and cover crop
production, cattle rearing, horticulture, poultry and small stock farming. Crop
production is more concentrated in the eastern hardveld, while cattle farming is
practiced in the western part of the District. Industrial production in the District is
limited mainly to the Jwaneng mine, although industrial production is also promoted
by servicing industrial areas in Kanye, Pitsane and Moshupa. Small general dealers,
restaurants, bottle stores and other commercial establishments are the predominant
retail businesses located in almost all the villages. Informal sector activities provide
income for many households.
___________________________________________________________________________________________________________________________________
February 2009
3-15
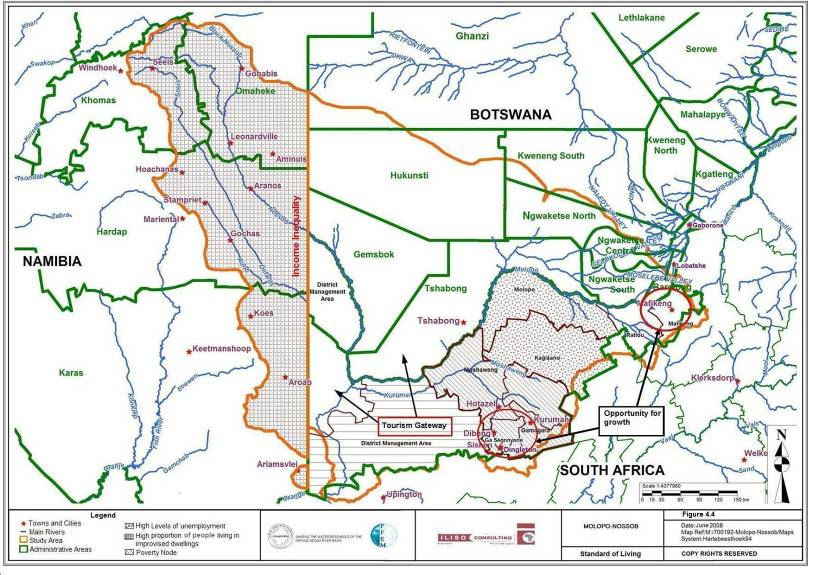
Molopo Nossob Feasibility Study - Main Report
Figure 3.4: Map representing the standard of living in the catchment area
23 July 2009
3- 16
Molopo Nossob Feasibility Study - Main Report
In both Kgalagadi and Southern District are settlements classified as remote area
settlements. To address development challenges in remote area settlements, the
Government of Botswana introduced the Remote Area Development Policy (RADP).
RADP aims to assist people of Basarwa and Balala origin, and other ethnic minorities
of non-stock holding origin. RADP is a government welfare programme. Remote Area
Dwellers (RADS) are defined as people who:
Ę
Live outside villages (i.e. in communities of less than 300 people).
Ę
Have no or inadequate cash income.
Ę
Have no or inadequate land.
Ę
Have no or inadequate water rights.
Ę
Depend to some extent or another on gathered veld foods, usually to a lesser
extent, on wildlife.
Ę
Have to date been out-of-reach in terms of distance from generally, available
services (schools, health posts, extension staff etc.).
Ę
Seldom own stock.
Ę
Are in a dependant position socio-economically to wealthier (usually livestock
owning families).
Ę
Are seldom literate.
Ę
Are politically for the most part a "silent" sector.
Ę
Tend to live in small scattered settlements (5-100 people) and are sometimes
mobile over specified areas of land.
3.4.2 Namibia
In Namibia, the main source of income is derived from salaries and wages (46 %).
The per capita income is low and declining; income inequality is high and
unemployment stands at 33.8 % and is rising, with poverty being widespread
(Namibia Vision 2030).
In rural areas, subsistence farming was reported as the main income by half of the
households, and salaries and wages are the main income for only a quarter.
According to Vision 2030, 85 % of consumption poor households are located in rural
areas, making their living from subsistence. Poverty pockets are found in the
southern regions (scope of this study), where income inequality is higher than in
other regions. This is in contrast to the households in urban areas, for whom the
main source of income is salaries and wages (three quarters). The economic
23 July 2009
3- 17
Molopo Nossob Feasibility Study Ł Main Report
situation of people living in rural areas enhances their vulnerability (Namibia
Household Income and Expenditure Survey 2003/2004).
For Karas and Khomas, salaries and wages were the main income for over 70 %
(seven in ten) of households, whilst for Omaheke only half (five in ten) derived their
income from salaries and wages and four in ten households derived their income
from subsistence farming. For Hardap, approximately six in ten households derived
their income form salaries and wages, whilst four in ten households derived their
income from pensions. Hardap and Omaheke are therefore areas with less job
opportunities. However, Omaheke, Hardap, Karas and Khomas regions reported the
highest proportions of households living in improvised dwellings (42 %, 38 %, 29 %
and 29 % respectively).
Of those surveyed (Namibia Household Income and Expenditure Survey 2003/2004)
large proportions of female headed households in rural areas reported subsistence
farming and pensions as their main source of income. Those dependent on
subsistence farming for an income tended to have no formal education or some
primary education (82 %). Job opportunities for people with this level of education
seem scarce.
3.4.3 South Africa
In the Northern Cape, 42.8 % of the people have an income below the poverty
breadline of R800 per month (Northern Cape Provincial Growth and Development
Strategy 2004-2014).
According to the Siyanda Regional Development Plan (2007), approximately 60 % of
its population earns an income between R 0-800 per month. The Siyanda Regional
Development Plan (2007) reports that only 46 % of its population is employed, and
that the primary sector (specifically agriculture), plays an important role in
employment provision.
Kgalagadi DM was identified as a poverty node in 2001, and Moshaweng LM
represents the real poverty node in this DM. In Kgalagadi DM, over 70 % of the
households live below the poverty line (under R20 000 per household per annum).
Gamagara LM represents the developed part of the DM, because of the job
opportunities the mines present, and about 50 % of households live below the
poverty line.
___________________________________________________________________________________________________________________________________
February 2009
3-18
Molopo Nossob Feasibility Study Ł Main Report
The situation in the more urban Mafikeng LM is similar to Gamagara LM, where one
and a half in five households have no income with 30 % of households living on an
income equal or above the acceptable standards. Just under half (43.0 %) of the
remaining households therefore earn less than R20 000 annually.
Nearly two in five households (37.9 %) in Ratlou LM have no income and 10 % of
households live on an income equal or above the acceptable standards. More than
half (52.2 %) of the remaining households therefore earn less than R20 000 annually,
which is below acceptable standards.
For the Bophirima District Municipality 83 % of the households have an income of
equal to or less than R19 200 per year, meaning that about 15 % of households in
the District Municipality live above the acceptable standard. Molopo and Kagisano
LMs in this DM show similar profiles.
The levels of income correlate with the employment levels. For example, in Ratlou
LM 70 % of the population is not economically active, compared to 43 % in the
Mafikeng LM.
Gamagara LM is the only municipality in the sub river basin of which mining and
quarrying are the main form of employment. Of the iron ore, 30 % is sold locally, and
the remaining 70 % is exported to 36 clients in 16 countries through the port of
Saldannah, north of Cape Town. The mine is seen as one of the seven largest open
cast mines in the world (Kgalagadi Nodal Economic Profiling Project, 2007).
The income profile of the population in this municipality compares favourably to the
other municipalities. For this DM, mining was identified as the sector with the highest
potential growth, followed by catering and accommodation (Kgalagadi Nodal
Economic Profiling Project, 2007). Although there is a ready supply of unskilled
labour for the mines, there is a lack of skilled labour for technical and managerial
positions.
An opportunity to use high quality clay (an estimate of 167 million tonnes) in the
manufacture of ceramics has been identified by Kumba Resources, which could
potentially provide an economic boost to the area (Kgalagadi Nodal Economic
Profiling Project, 2007), and further stimulate other beneficiation activities.
___________________________________________________________________________________________________________________________________
February 2009
3-19
Molopo Nossob Feasibility Study Ł Main Report
The towns Kathu, Dingleton (previously known as Sishen) and Sesheng were
established because of the mining activities at Sishen, which started in the 1950s.
Kathu is considered the biggest mining town in the Kalahari Region. The towns
depend on the mine for water and other services. It seems as if access to services is
generally better in this municipality compared to others in the sub river basin. The
mine creates approximately 3 000 permanent jobs and 1 500 contracts, which might
increase pending the new developments.
The Hotazel mine employs approximately 1 200 people, with a static growth of
approximately 0.5 % per year, as per 2003 (Nodal Economic Profiling Project, 2007).
Assmang is situated in Blackrock, employs approximately 1 000 people, and it is not
expected to increase (Kgalagadi Nodal Economic Profiling Project, 2007).
3.5
TOURISM
3.5.1 Botswana
Tourism opportunities within the district are virtually untapped largely due to poor
state of the district's infrastructure and other supporting facilities. Wildlife is an
important renewable resource in Kgalagadi District with wildlife areas accounting for
about 48.8 % of the District. The District's potential for tourism has improved since
the merging of Gemsbok National Park and Kalahari Gemsbok National Park. The
introduction of community based natural resource management (CBNRM) policy has
also contributed to improved tourism and incomes in the district. There are five areas
earmarked for CBNRM activities and these are, KD 1, Ukhwi, Ncaang and Ngwatle,
KD 2 Zutshwa, KD 11 & 12 Kokotsha, Inalegolo, Phuduhudu, KD 15 for Khawa.
Community mobilization to engage in CBNRM projects commenced in 1998 in the
Kgalagadi District. The aim of CBNRM is to give the communities an opportunity to
manage natural resources especially wildlife in their respective areas.
3.5.2 Namibia
The sub river basin in Namibia does not have any protected or conservation areas.
Between Windhoek and Gobabis conservancies on freehold land occur in the sub-
basin. A need to co-ordinate the establishment of these conservancies was identified.
The area in the sub river basin does have a number of private game farms.
___________________________________________________________________________________________________________________________________
February 2009
3-20
Molopo Nossob Feasibility Study Ł Main Report
3.5.3 South Africa
North West and Northern Cape's share of foreign arrivals decreased, with North
West's decreasing from 7.1 % in Q3 2006 to 6.2 % in Q3 2007, and with Northern
Cape's decreasing from 4.1 % in Q3 2006 to 2.7 % in Q3 2007 (SA Tourism Index,
Quarterly report Q3, July to September 2007).
For the Northern Cape the main purposes of foreign tourist visits were (SA Tourism
Index, Quarterly report Q3, July to September 2007):
Ę
Holiday 42 %;
Ę
Visit friends and family 30 %; and
Ę
Business traveller 12 %.
For North West Province the main purposes of foreign tourist visits were:
Ę
Holiday 21 %;
Ę
Visit friends and family 36 %; and
Ę
Business tourist 14 %.
In the Northern Cape in South Africa, the sub river basin is in close proximity to the
Augrabies Waterfall, and Spitskop Nature Reserve.
In Kgalagadi DM the Moffat Mission, the Raptor Rehabilitation Centre, the
Wonderwork Caves, and the Kuruman Eye are tourist attractions. The Kuruman Eye
is a natural underground fountain delivering 20 - 30 million litres of clear water daily,
and apparently it is the biggest natural fountain in the southern hemisphere. It was
proclaimed a national monument in 1992. The Wonderwerk Caves were formed by
gas and water, close to Kuruman. However, most of the B&Bs in Kuruman
accommodate contractors/long term renters (Kgalagadi Nodal Economic Profiling
Project, 2007). Accommodation facilities include McCarthy's Rest, Soetvlakte Guest
Farm, Amaziah Guesthouse, Tswalu Kalahari Reserve, Oude Werf Lodge, Legaeng
Guesthouse, the Guesthouse on Main, the Tuscany Guesthouse, Riverfield
Guesthouse, Sishen Airport B&B.
The whole area serves as a stop over on the way to Namibia, The Kgalagadi
Transfrontier Park and Botswana. Some Germans, Belgians and British second
comers specifically come to visit this area. The niche market is eco-tourism,
___________________________________________________________________________________________________________________________________
February 2009
3-21
Molopo Nossob Feasibility Study Ł Main Report
adventure routes, historical/archaeological sites, and business people (Kgalagadi
Nodal Economic Profiling Project, 2007).
The Khomani San received farms adjacent the Kgalagadi Transfrontier Park with
game that can be used commercially for hunting (Department of Land Affairs, 2002).
The Department recommended that a serious effort should be made to capacitate the
community members responsible for the management of these game camps in the
tourism industry, financial management and marketing.
3.6
WATER AND SANITATION
3.6.1 Botswana
3.6.1.1
Kgalagadi District
The district lacks surface hydrological features except for seasonal shallow pans and
the Molopo and Nossob fossil valleys (Figure 3-5). The generally low rainfall and
sandy soils results in a total lack of permanent surface water in the district, although
water collects on pans for some periods during and sometime into the rainy season
that occurs between November and April. The underground water though available
in large quantities is often found in isolated perched aquifers and extremely saline.
___________________________________________________________________________________________________________________________________
February 2009
3-22
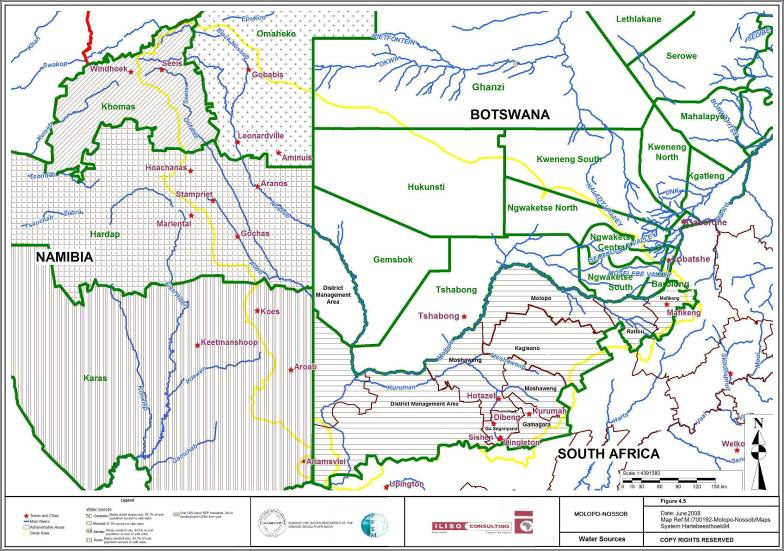
Molopo Nossob Feasibility Study - Main Report
Figure 3-5: Water sources
23 July 2009
3- 23
Molopo Nossob Feasibility Study - Main Report
Table 3-10: Water Supply Data for Settlements under Department of Water
Affairs in Kgalagadi District
Settlement
Water
No. of
Yield
Demand
No. of
No. of
Water
source
boreholes (m/day)
(m/day)
standpipes
private
quality
connections
Tsabong
Borehole
5
1 027
864
30
1 500
Good
Struizendum
Borehole
5
10
Saline
Inversnaid
3
9
Saline
Rapplespan
3
9
Saline
Vaalhoek
Borehole
3
9
Saline
Bokspits
Borehole
3
83
76
9
89
Saline
Gakhibana
Borehole
7
23
Fair
Khuis
Borehole
12
23
Fair
Bogogobo
Borehole
8
12
Fair
Kolonkwaneng
Borehole
11
12
Fair
Middlepits
Borehole
4
56
201
7
56
Poor
Khawa
Borehole
1
11
14
5
8
Saline
Omaweneno
Borehole
112
89
9
84
Good
Maralaleng
Borehole
7
18
Good
Maleshe
Borehole
Kisa
Borehole
2
41
27
6
43
Good
Draaihoek
Borehole
2
53
51
9
71
Good
Makopong
Borehole
2
83
72
132
141
Good
Werda
Borehole
3
227
107
15
139
Good
Hereford
Borehole
2
137
4
Khokhotsha
Borehole
1
36
28
9
31
Good
Inalegolo
Borehole
2
77
21
12
Good
Phuduhudu
Borehole
1
50
42
5
7
Good
Kang
Borehole
3
387
264
22
138
Good
Hukuntsi
Borehole
1
26
240
25
241
Fair
Lehututu
Borehole
5
400
92
18
58
Poor
Lokgwabe
Borehole
2
62
63
12
42
Good
Tshane
Borehole
1
22
68
12
47
Poor
Source: Department of Water Affairs, Botswana.
3.6.1.2
Southern District
The provision of water for domestic use is the responsibility of the Council, assisted
by the Department of Water Affairs (DWA). Between 1983Ł1986 a total of 14
boreholes were successfully drilled and handed over to Council by DWA for
operation and maintenance. Most of the boreholes in the district show a low yield as
the ground water is not recharged. The expansion of the bigger villages, has called
for the expansion of the existing water network. The Southern District operates 60
domestic boreholes and has 83 syndicate boreholes. Council continues to distribute
water (by bowser) to areas and schools where there is no permanent water supply.
According to National Development Plan 6, major villages are those having a
population over 5,000.
23 July 2009
3- 24
Molopo Nossob Feasibility Study Ł Main Report
These villages are serviced by DWA and in the district are mostly the district centres.
However, the growth in some villages, which are presently under district council
control, might lead to a request to DWA to operate these water schemes for them.
The Council Water Unit continues to service the village water schemes under its
responsibility.
The District relies on ground water for human and livestock consumption. There are
few dams in the district that are able to hold water throughout the year, such as the
Moshupa and Mmakgodumo Dams. The western part of the district is experiencing a
water shortage and poor quality water problem.
3.6.2 Namibia
In Namibia, three quarters of households reported piped water as their main source
of drinking water. Of the urban households, 99 % reported to use piped water as their
main source of water, and in rural areas only 58 %. For Hardap, Karas, Khomas and
Omaheke, the main source of drinking water is piped water (for over 80 %). In
Omaheke, the only other source is boreholes/protected wells. Khomas has the
highest percentage of households with access to piped water (Namibia Vision 2030).
The urbanised region of Khomas stands out as a region where the households have
relatively short distances to cover to services. Among urban households, 96 % have
a distance of less than 1 km to cover to the source of drinking water, whereas 56 %
of rural households have 1 or more kms and 11 % have more than 3 kms to cover.
For Hardap, Khomas, Karas and Omaheke, more than 90 % of households are at a
distance of 1 km and less from their drinking water sources.
The number of active water points by technology by 2003 and access to safe water
by 2001 per region are listed in Table 3-11. Although 94 % of the households in
Karas have access to safe water according to the Population and Housing Census of
2001, "due to contamination with nitrates in some areas and high fluoride contents in
other areas, some of the underground sources are only marginally potable" (Karas
Regional Poverty Profile, page 48).
___________________________________________________________________________________________________________________________________
February 2009
3-25
Molopo Nossob Feasibility Study Ł Main Report
Table 3-11: Namibia Number of Active Water Points
Water point source driven by
Hardap
Karas
Omaheke
diesel engine only
77
32
407
windmill only
300
405
5
diesel and windmill
0
0
0
hand pump
4
5
3
solar power
4
1
1
pipeline
10
3
62
Total
395
446
478
Access to safe water % of rural population
94.6
93.7
89.1
Source: Central Bureau of Statistics
In Namibia, just over a third (37 %) reported flush toilets as the main toilet facility
used by a household. In the Omaheke Region, just under two thirds do no have a
toilet/use the bush, and a third of households have a flush toilet. Hardap Region is
also an area of concern where just below half the households have a flush toilet
whilst a third used the bush. The number of households without a flush toilet is on the
increase in urban areas, which gives an indication of the increase in informal
settlements in the area. In the Khomas Region, for example, one in five households
have no toilet and in the Karas Region one in four (Namibia Household Income and
Expenditure Survey 2003/2004).
There is a link between dwelling type and reticulation (water and sanitation).
Informal/improvised houses usually do not have adequate access to water. The most
common dwelling in Namibia is traditional dwellings, and these mostly occur in the
rural areas. For Khomas, Hardap and Karas Regions, on average a third of
households live in improvised (informal) houses. For Omaheke, nearly half (41 %)
live in improvised houses. Traditional dwellings do not form a significant part of the
landscape in the sub river basin. Those living in traditional dwellings and improvised
houses tend to have no formal education or primary school education only, which
impacts on their level of income. An estimate of 1 500 houses needs to be built each
year, assuming a housing backlog of 37 000 houses, by projecting in 5 year intervals
to the year 2030. This has implications for the provision of reticulation Ł more so in
the Omaheke Region.
___________________________________________________________________________________________________________________________________
February 2009
3-26
Molopo Nossob Feasibility Study Ł Main Report
3.6.3 South Africa
In South Africa, the majority of households have access to water below
Reconstruction and Development Programme (RDP) standard. In terms of the
delivery of basic water services, as at March 2006, there are still an estimated
8.22 million people who do not have access to a safe potable water supply to the
standards set in the RDP. Below RDP standard is a river, stream, piped water more
than 200 m away from the household, a water vendor, borehole, and dam or water
tank. Therefore the current targeted delivery rate for water services (1.5 million
people per year) needs to be increased to ensure that all South Africans have access
to safe potable water to RDP standards by 2008, which is the national target
(National Water Sector Plan, 2007/08 to 2011/12).
Table 3-12 shows that provision in the Northern Cape and North West Provinces
need to be targeted in terms of water delivery at acceptable standard. The deduction
is that ground water is of vital importance in the North-West and Northern Cape
Provinces. Ground water is in many instances the only source of drinking water and
water for stock for many rural people, particularly in the arid western region of the
Province. More than 80 % of rural communities in the Province depend on ground
water as a sole source of domestic water. Nineteen (19 %) percent of the total
population has no water supply services or has services below basic standards. A lot
of progress has been made with regard to the targets and the country has achieved
the Millennium Development Goals (MDGs) of halving the backlog of access to basic
sanitation and water by 2015. Areas most affected are rural villages, farm
settlements and informal/peri-urban settlements which form part of new
developments (National Water Sector Plan, 2007/08 to 2011/12).
The provision of consistent quality water is on the priority list of all the affected
municipalities. The bulk water supply system is not sufficient to meet everyone's
needs.
The number of households with toilets below RDP standard is listed in Table 3-19,
and more households in the North West Province are below RDP standard. Toilets
below RDP standard are pit latrines without ventilation, buckets, or nothing. The RDP
standard is a flush toilet, a septic tank, a chemical toilet or a pit latrine with
ventilation.
___________________________________________________________________________________________________________________________________
February 2009
3-27
Molopo Nossob Feasibility Study Ł Main Report
Table 3-12: Northwest and Northern Cape Provinces Water and Sanitation
(2001 census)
Region
Sanitation pit latrine
Water not in
without
dwelling/yard/<200
ventilation/bucket
m from yard
latrine
North West Province
39%
64%
Bophirima District Municipality
33%
69%
- Kagisano Local Municipality
40%
79%
- Molopo Local Municipality
7%
60%
Central District Municipality
47%
69%
- Ratlou Local Municipality
67%
83%
- Mafikeng Local Municipality
46%
71%
Northern Cape Province
20%
58%
Siyanda District Municipality
12%
56%
- Mier Local Municipality
20%
58%
Kgalagadi District Municipality
37%
73%
- Ga-Segonyana Local Municipality
30%
73%
- Moshaweng Local Municipality
54%
81%
- Gamagara Local Municipality
3%
52%
Source: Municipal Demarcation Board
Apart from farming land, the sub basin in Namibia and South Africa is characterised
by scattered villages. These settlements have developed in a formal manner, except
for some in Ratlou LM in the North West Province. The Ratlou settlements have
developed in an informal manner, the properties are large, and it was doubted in
2002 (Central DM IDP, 2002) if geo-technical investigations were undertaken for any
area in the municipality to determine the suitability of the land for example for the
installation of services or the establishment of cemeteries.
Although the number of informal houses in Kagisano LM is on the increase, the
number is still low at 5 %. Moshaweng LMs informal housing is below 5 %. The
informal houses in Mafikeng, Molopo and Mier Local Municipalities have increased
___________________________________________________________________________________________________________________________________
February 2009
3-28
Molopo Nossob Feasibility Study Ł Main Report
(15 % increase on average). Although Gamagara LM has shown a decrease, the
percentage of informal houses is still in the order of 14 % (Community Survey, 2007).
A study done by the Department of Land Affairs (2002) amongst the Mier and
Khomani San in the Northern Cape, found that for the Khomani San, those living in
the municipal area had sufficient water, and that the main source of water was from
taps Ł either in the house or on the stand. This water was used for all household
needs.
The main concern that was voiced by the community members was the water need
on farms. Those living on farms depended on the farmers, the police station at
Witdraai and the local store for all their water needs.
Of those respondents who lived on farms, 80 % lived in shacks or traditional huts. No
formal houses have been constructed on the farms and this was a major problem for
the farm residents. At that time (2002) there was no project for the provisioning of
housing planned, but the intention was to address this as part of the second phase of
the development plan.
Community members living in the town areas all took part in the Local Authority
housing project and did not pay for the construction of their houses. The dwelling
type was brick houses. These respondents indicated that housing was not a problem,
but 60 % of the respondents indicated that they would like to return to the farms, but
could not because of the lack of housing.
3.7
ECONOMIC ACTIVITIES
3.7.1 Irrigation agriculture
Agriculture is one of the major economic activities in the area and although the region
is arid and water scarce, irrigation activities covers around 20 692 ha. It is estimated
that approximately 16 657 ha or 80.5 % of this utilises ground water and 4 040 ha or
19.5 % surface water. The top six crops cultivated are groundnuts, lucerne, maize,
potatoes, wheat and vegetables.
3.7.2 Livestock farming
Due to the semiŁarid and dry climatic conditions of the area, livestock farming is a
very important farming activity. It provides both an income and a livelihood to a large
number of households in the area. Livestock farming in the area has been divided
___________________________________________________________________________________________________________________________________
February 2009
3-29
Molopo Nossob Feasibility Study Ł Main Report
into two categories, namely; commercial and communal/subsistence livestock
farming, with the former mainly as a business venture.
3.7.3 Mining
There are several mining operations in the area, especially on the South African side.
The major minerals being mined are diamonds, iron ore and manganese. On the
South African side mining has grown at a hectic pace in the last three years and the
current number of mineworkers involved is estimated to be around 7 500 permanent
and 3 100 contract workers. Information from the area also indicates that further
growth is due to take place in the immediate future.
3.7.4 Tourism
Tourism is also an important activity in the area, especially on the South African side.
Two specific categories of tourists have been identified, eco-tourists and business
tourists, and the extent of the tourism activity in the catchment was estimated based
on these two categories.
3.8
IRRIGATION AGRICULTURE
3.8.1 Methodology
In order to calculate the value of water used for agricultural activities, crop budgets
were compiled and analysed based on the Combud Enterprise Budget frameworks
developed by the Department of Agriculture in South Africa for each of the six major
crops.
Table 3-13 shows the crops analysed as well as their respective yield per ha in
tonnes. Given that there is currently no irrigation taking place in the catchment on the
Botswana side, no provision was made for Botswana.
Table 3-13: Crops Analyzed
Namibia
South Africa
Crop
Maximum yield per hectare (tons)
Crop
Maximum yield per hectare (tons)
Maize
10
Maize
10
Lucerne
12.5
Wheat
7.1
Vegetables
70.2
Lucerne
12.5
Ground nuts
4.5
Potatoes
34
___________________________________________________________________________________________________________________________________
February 2009
3-30
Molopo Nossob Feasibility Study Ł Main Report
Table 3-13 shows that three major crops dominate Namibian's irrigation activities in
the catchment area while five crops dominate irrigation on the South African side.
Table 3-14 also provides a summary of the main crop types, total ha currently under
irrigation for each crop and the total water usage per crop.
Table 3-14: Irrigated Crops, Hectares and Water Use (2007)
Namibia
South Africa
Crop
Total
Water use
Total
Crop
Total
Water use
Total water
hectares
(m3/ha)
water use
hectares
(m3/ha)
use (Mm3)
(Mm3)
Maize
435.4
5 700
2.48
Maize
12 483
5 700
71.16
Lucerne
64.2
12 850
0.82
Wheat
1 271
6 070
7.71
Vegetables
162.7
3 680
0.65
Lucerne
1 748
12 850
22.46
Ground nuts
2 292
4 410
10.11
Potatoes
2 234
3 870
8.64
3.8.2 Country Discussion: - Irrigation Farming
Namibia
The total area cultivated and irrigated is relatively small, only ▒ 660 ha with maize
being the dominant crop in terms of ha and total water use.
Republic of South Africa
Table 3-14 shows that maize is produced on more than 60 % of the total hectares
irrigated (12 483 ha) and also uses the bulk of the total water (71 16 million m3)
reserved for irrigation in the area. The demand for water use per ha is high for
lucerne irrigation and low for potato irrigation. In terms of maximum yield per ha,
Table 3-3 indicates that 34 tonnes was used as the yield per ha of potatoes, while
groundnuts being the lowest, with 4,5 tonnes per ha.
3.9
LIVESTOCK FARMING
3.9.1 Methodology
The total area used for livestock by each country, was used to calculate the number
of Large Stock Units (LSU), based on the average grazing norm per country, as
determined by the team. An average annual weight gain per LSU was used to
calculate the total weight gain per country, a value per kilogram live weight was used
to calculate the value of livestock farming per country. The annual weight gain per
___________________________________________________________________________________________________________________________________
February 2009
3-31
Molopo Nossob Feasibility Study Ł Main Report
country was set at a conservative level to accommodate losses and the value was
established at a net farm gate price.
In Table 3-15, the results per country are presented. The tabulated results are given
in Rands for comparison purposes, and for the individual countries the results have
been converted to the local currency.
Table 3-15: Livestock Calculations
Item
Botswana
Namibia
South Africa
Total Catchment Area -hectares
13 847 369
9 231 579
11 346 735
Total Game Parks - hectares
2 641 000
959 000
Livestock Area
11 206 369
9 231 579
10 387 735
Average Grazing Norm (ha/LSU)
33.1
33.1
31.45
Estimated Number of LSU
338 561
278 900
330 294
Average Annual Weight Gain (kg/LSU)
120
120
319
Average Price (R/kg)
7.88
7.71
8.23
Average LSU value increase (Rand)
946
925
1 296
Value of Activity (Rand million)
320.3
258.0
326.4
Estimated
Number
of
LSU
per
100
100
100
Labourer
Estimated Number of Employees
3 385
2 789
3 303
3.9.2 Country Discussion: - Livestock Farming
Botswana
The total value of the livestock activity in the Botswana part of the catchment is
estimated at about P266.9 million (R320.3mil.). It is divided between commercial and
communal farmers. According to the division between commercial and communal
area is roughly 75 % to 25 %. Also according to the same source the average
number of cattle per communal farmer converts to 30 LSU, with an average annual
take-off of 6 animals. With the assumption that 50 % is for own consumption and
that three animals are sold, the estimated cash revenue per farmer is around P7 400.
The estimated number of employees in livestock farming is estimated to be 3 385.
Namibia
The value of livestock farming in the Molopo-Nossob is estimated to be around
N$258 million annually. Very little if any communal farming takes place in the
Namibian section of the catchment.
The estimated number of employees in livestock farming is estimated at 2 789.
___________________________________________________________________________________________________________________________________
February 2009
3-32
Molopo Nossob Feasibility Study Ł Main Report
Republic of South Africa
In the South African section of the catchment the value of livestock farming is
estimated at R326.4 million annually. It might, however, be an under estimation
because it appears that large tracts of land is being converted to game farming and
according to a number of sources this type of farming is much more profitable.
Also, in the South African a large area of land is occupied by communal farmers,
according to estimates around 27 % of the land. No literature could be traced that
specifically referred to the number of animals kept by the average communal farmer
in the project area.
About 64 % of rural families own cattle and a slightly higher number own goats. This
percentage is in line with other estimates, specifically in the Transkei region.
According to the survey the average number of cattle kept by the communal farmer is
20 which converts to 17 LSU units, less than the 30 in Botswana. If the same
assumptions are applied as applied in the case of Botswana, it appears as if the
average cattle owner has an annual cash income of around R7 000 pa. It must
however, be borne in mind that only 64 % of the rural households are actually cattle
owners and that the number of cattle vary from 1 to 67.
The estimated number of employees in livestock farming is estimated at 3 303.
3.9.3 Conclusion
Livestock farming occupies the largest part of the catchment and plays a very
important role in the lives of the inhabitants of this very arid and rural region. It is
estimated that the total annual monetary value is R886 million (N$886 million, P768.4
million) and, with a conservative estimate, 9 478 people are directly employed.
3.10
MINING
3.10.1 Methodology
The compilation of this section relied on published reports and other information of
mining companies operating in the respective areas. Most of the information was
taken from these reports and some data figures were verified by means of telephone
calls to the companies concerned. In some cases companies refused to give specific
financial data and it was necessary to use the actual volume of ore mined multiplied
with the average price, to arrive at an annual turnover.
___________________________________________________________________________________________________________________________________
February 2009
3-33
Molopo Nossob Feasibility Study Ł Main Report
Water use by the mining companies in South Africa was obtained from the DWAF
offices in Kimberley.
3.10.2 Country Discussion: - Mining
Botswana
In Botswana, presently one diamond mine could be identified in the area employing
around 120 people with an annual turnover of P76.6 million (R92 mil.).
Namibia
In Namibia at present one copper mine could be identified in the area employing
around 375 people with an annual turnover of N$267 million.
Republic of South Africa
In South Africa a number of mines operate, the most important activity is however,
taking place at the Kathu Ł Hotazel hub with the expansion, due to the worldwide
demand for these commodities, at the iron ore and manganese pits. At present the
total number of people employed in the mining appears to be around 10 600 of which
around 7 500 are fulltime and the rest part time or on contract. All indications are
that this will further increase in the next 2 to 3 years. The present annual monetary
turnover is estimated at R11.5 billion.
3.10.3 Conclusion
From the above analysis it appears that, especially in South Africa, mining activity is
growing dramatically and is an important employment and income generator which
appears to have further potential to expand.
A summary of the activities is presented in Table 3-16.
Table 3-16: Mining in the Molopo Ł Nossob Catchment (2007 prices)
Total sales: R
Direct Labour
Country
Mineral
million
employment
Botswana
Diamond
92
124
Namibia
Copper
267
375
Diamond
12 400
248
Republic of South Africa
Iron Ore
9 687
7 859
Manganese
1 700
2510
___________________________________________________________________________________________________________________________________
February 2009
3-34
Molopo Nossob Feasibility Study Ł Main Report
3.11
TOURISM
3.11.1 Botswana
In the case of Botswana one tourism facility was identified in the Kgalagadi
Transfrontier Park and four others outside the park. The total number of available
beds identified is 66 with an average tariff which varies between P170 to P3 400 per
person per night. The average bed occupation was established at 35 % converting
to an annual turnover of P7.8 million (R9.3 million).
Namibia
In the case of Namibia 493 beds was identified with an average overnight rate of
N$583 and an occupancy rate of around 35 % with the estimated turnover at N$36.7
million.
Republic of South Africa
In South Africa two areas were identified as growth points for tourism, the
Mmbatho/Mafikeng area hosting the capital of the North West Province and a casino
complex. Then the more rural establishments which also target the eco-tourists and
holiday makers in the Molopo area towards the Kgalagadi Transfrontier Park have
been identified. A number of farms have also switched from livestock to game
farming, with the accompanying tourist or hunting facilities and attractions.
The total number of beds identified is 2 544 with an occupancy rate which varies from
65 % in the Kgalagadi Transfrontier Park to 25 % in some of the other areas. The
estimated annual turnover is established at R179, 9 million.
3.11.2 Conclusion
From data in Table 3-17 it is appears that although over 430 000 bed nights are sold
annually the low occupation rates indicate that considerable scope exists for further
expansion.
Table 3-17: Tourism Activity in the Molopo Ł Nossob Catchment (2007
estimates)
Total annual
Total
Total Income per year: R
Country
bed nights
Available
million
sold
Beds
Botswana
8 432
66
9.33
Namibia
62 981
493
36.71
Republic of South Africa
362 226
2 544
179.93
___________________________________________________________________________________________________________________________________
February 2009
3-35
Molopo Nossob Feasibility Study Ł Main Report
3.12
MACRO ECONOMIC IMPACTS
In Table 3-18 a summary of the Direct and Total Macro-economic indictors of the
main economic activities in the catchment, as detailed in the Catchment Inventory
Report are compared.
Table 3-18: - Direct and Total Macro Economic Indicators of the Different
Activities for the Molopo Ł Nossob Catchment (2007 prices)
Employment
Household Income (R
Activity
GDP (R Million)
(Numbers)
Million)
Direct
Total
Direct
Total
Low
Total
Irrigation Agriculture
274.3
435.6
3 450
4 127
65.2
239.2
Livestock (LSU)
518.3
956.7
8 071
10 547
172.2
632.2
Mining
6 390.4
13 345.3
9 999
33 620
2 485.8
9 937.9
Tourism
127.1
251.3
1 034
1 556
48.4
185.2
Total
7 310.0
14 988.8
22 554
49 851
2 771.6
10 94.5
The Macro Economic Impact Model (MEIM) takes the form of a dynamic
computerised model and is used to quantify the macro-economic impacts
when curtailing water availability or changing the scenario to any irrigated
farming enterprise in the study area or any other water policy impacts. It does
this by generating appropriate socio-economic multipliers from a Social
Accounting Matrix applicable to the study area, and estimating the following
indicators:
Ę
Economic growth (i.e. the impact on GDP)
Ę
Job creation (i.e. the impact on labour requirements)
Ę
Income distribution (i.e. the impact on low-income, poor households and
the total income of households)'
In this instance low-income household is the "poor" households as defined by the
appropriate country definition of "poverty". In South Africa it would be the level 1 to 3
households, with medium income 4 to 6 , and high income 7 to 10.
Mining is by far the largest activity followed by livestock farming. The indirect and
induced factor of mining is also much larger than that for irrigation and livestock
farming. The percentage of household income directed at Low Income Households
expressed as a percentage of Total Household Income varies from 25.0 % for
___________________________________________________________________________________________________________________________________
February 2009
3-36
Molopo Nossob Feasibility Study Ł Main Report
mining, the lowest to 27.3 % for irrigation. Although agriculture creates more direct
employment opportunities than mining, at present, the extended number for mining is
considerably larger than the number for agriculture.
In Table 3-19 the macro-economic multipliers expressed as a function of water use is
presented as it can be used in possible scenarios to calculate possible policy
interventions.
Table 3-19: - Water Based Macro Economic Multipliers Applicable in the
Molopo- Nossob Catchment (2007 Prices)
Employment
Household
Activity
GDP (R/m3)
(No/Mm3)
Income (R/m3)
Direct
Total
Direct
Total
Low
Total
Irrigation Agriculture (Weighted)
2.2
3.5
27.8
33.3
0.5
1.9
Livestock (LSU)
35.2
65.0
547.9
716.1
11.7
42.9
Mining
635.9
1 327.9
994.9
3 345.3
247.3
988.8
Tourism
1 465.0
2 897.1
11 926.2
17 943.8
558.2
2 135.9
The multipliers expressed in Table 3-19 in terms of efficient water use, show that the
highest multiplier effect in the Molopo-Nossob Catchment is tourism followed by
mining. Livestock farming also has a large water efficient multiplier. Irrigation,
although economically of strategic value, is not a very efficient user of water.
___________________________________________________________________________________________________________________________________
February 2009
3-37
Molopo Nossob Feasibility Study Ł Main Report
4.
AVAILABILITY OF WATER
4.1
SURFACE WATER
Hydrological modelling was undertaken to provide first order estimates of typical
surface water runoff volumes in the main rivers in the study catchments. For this
purpose, the Pitman rainfall-runoff model was configured for the main
subcatchments in the study area.
Model subcatchments were originally based on existing quaternary catchment
boundaries. However, to facilitate the analysis of scheme development options at
a finer resolution (to be undertaken during subsequent phases of the study), the
quaternary catchments were further delineated based on major tributaries, the
location of existing major dams and international boundaries.
The configured Molopo-Nossob catchment model was calibrated wherever
possible on observed flow records. However, due to the paucity of accurate and
reliable streamflow records within the study catchment, a conventional calibration
approach was only possible in the upper Nossob and Olifants rivers as well as on
the upper Molopo River and some of its tributaries. Once the Pitman model had
been calibrated, the calibrated Pitman parameters were transferred to similar
subcatchments in the remainder of the study catchment.
A further, large-scale calibration of the Pitman model for the main subcatchments
was undertaken, based on historical extreme events and anecdotal evidence of
flows along certain parts of the lower river reaches. This was mainly achieved by
means of adjustments to the soil moisture and the channel loss function in the
WRSM2000 model. The historical flood events in the 1970s are simulated, as
well as two small events in the mid-1950s and the late-1980s, while no flows
occur during the rest of the simulation period, which is consistent with anecdotal
evidence about the occurrence or lack of flows along the lower reaches of these
rivers.
4.1.1 Quantity
Table 4-1 shows that the total incremental natural runoff from the Molopo-
Nossob catchment equals 161 million m3/a, while the present day runoff equals
_________________________________________________________________________________________________________________________________
__
February 2009
4-1
Molopo Nossob Feasibility Study Ł Main Report
85.1 million m3/a. However, it is important to note that not all of this runoff is
available for use, due to excessive losses (infiltration and evaporation) in the
system. For example, the results of the hydrological modelling have shown that
the effect of channel loss on cumulative runoff is such that flow along the
downstream reaches of the main rivers only occurs during extreme events and
that channel losses along the respective main river systems are in the order of
80 % to 90 %. It should however be recognised that most of the losses constitute
a recharge of the groundwater along the river course.
The flows in the Kuruman River are mainly the result of discharge from the
various fountains or `eyes' in the dolomitic area. Very little of this water is
therefore runoff in the true sense of the word, but it should be seen as ground
water. However, since the flows from the fountains are reported as surface flow
in the South African hydrological data base, it has been included as such. Again,
this flow does not reach the lower reaches of the river.
Table 4-1: Total Incremental MAR per main subcatchment
Incremental
Incremental MAR
MAR (no
including local channel losses
River
Quaternary
channel
per quaternary
losses)
Natural
Present-Day
Percentage
Natural
D41A
35.99
9.85
6.22
D41B
12.76
4.75
4.01
D41C
9.65
2.77
2.50
D41D
5.99
1.22
1.19
Z10D
3.57
1.11
1.11
Molopo
Z10C
16.84
3.23
3.23
D41E
0.67
0.00
0.00
D41F
1.94
0.00
0.00
D41H*
0.85
0.00
0.00
Z10F
0.64
0.02
0.02
D42C*
0.10
0.00
0.00
TOTAL
89.00
22.95
18.28
80%
MOLOPO
D41G
7.13
1.42
1.40
Kuruman
D41H*
1.58
0.18
0.17
_________________________________________________________________________________________________________________________________
__
February 2009
4-2
Molopo Nossob Feasibility Study Ł Main Report
Incremental
Incremental MAR
MAR (no
including local channel losses
River
Quaternary
channel
per quaternary
losses)
Natural
Present-Day
Percentage
Natural
D41J
3.66
0.72
0.71
D41K
4.53
1.08
1.08
D41L
30.05
6.43
6.14
D41M
0.89
0.00
0.00
D42C*
1.05
0.00
0.00
TOTAL
48.89
9.83
9.50
97%
KURUMAN
Z10A
2.30
2.30
1.47
Nossob
Z10A
15.83
4.13
4.13
D42A*
0.22
0.00
0.00
TOTAL
18.35
6.43
5.60
87%
NOSSOB
Z10A
1.47
0.42
0.33
Z10A
6.27
4.21
4.21
Auob
D42A*
0.01
0.00
0.00
D42B
0.01
0.00
0.00
TOTAL
7.76
4.63
4.54
98%
AUOB
TOTAL
164
43.8
37.9
87%
If it is considered that most of the channel losses are in actual fact a recharge of
ground water aquifers along the rivers, it is clear that the flow in the rivers
constitutes an important part of the availability of water along the lower reaches.
It is also clear that, apart from the Molopo and Nossob Rivers, current was use
practices have had little impact on the flow of water in the different rivers.
4.1.2 Assurance of Supply
Table 4-2 and Table 4-3 present first order estimates of typical gross storage-
yield characteristics for the upper parts of the Molopo and Kuruman catchments,
which display similar hydro-meteorological characteristics, as well as the upper
Nossob catchment. The tables provide an indication of the storage that is
required to meet certain yields at different levels of assurance and show that,
even in the upper part of the Molopo and Kuruman catchments, significant
_________________________________________________________________________________________________________________________________
__
February 2009
4-3
Molopo Nossob Feasibility Study Ł Main Report
storage is required to provide yield at an acceptable level of assurance. An
assessment of the central parts of the Molopo-Nossob catchment, situated within
the drier, central Kalahari Desert, has indicated that it is not feasible for dams to
be constructed in this area due to the lack of reliable runoff.
Table 4-2: Typical yield-reliability characteristics (upper Molopo/Kuruman)
(1)Gross Yield (% MAR)
Live Storage (% MAR)
1:100 RI
1:20 RI
1:10 RI
50
16
25
32
100
26
41
52
200
34
53
71
(1): Based on WR90 storage-draft frequency curves
Table 4-3: Typical yield-reliability characteristics (upper Nossob)
(1)Gross Yield (% MAR)
Live Storage (% MAR)
1:100 RI
1:20 RI
1:10 RI
50
3
4
4
100
6
8
9
200
12
15
16
(1): Based on results of this study
4.1.3 Water Quality
The surface water quality is generally good. In the upper reaches of the Molopo
and Kuruman Rivers where the water emanates from the dolomitic aquifer, the
salinity is in the order of 450 mg/ , which means that the water is fit for all uses. A
minor problem is that the water tends to be hard and can cause scaling of
pipelines and hot water appliances.
The surface water runoff is fresh and of good quality. Even water that collects on
the pans is usable for domestic purposes and stock watering, although in some
cases it tends to become saline after a few months.
_________________________________________________________________________________________________________________________________
__
February 2009
4-4
Molopo Nossob Feasibility Study Ł Main Report
4.2
GROUND WATER
The Molopo-Nossob sub river basin covers a wide area, from Windhoek in
Namibia to Lobatse in Botswana and Mmabatho in South Africa. Landsat
imagery and aerial photographs show that the Kalahari sand cover obscures
most of the solid rock geology. Aeolian sand deposits have produced a
landscape characterized by WNW to NW trending longitudinal sand dunes in
Botswana. Some rock exposures are found along the Molopo River in the Khuis,
Werda and Phitshane Molopo. The Molopo-Nossob sub river basin constitutes
most of the rock types from Archaean Basement Complex to recent Kalahari
deposits and ground water occurs in most of rock units and water quality is fresh
to hyper saline.
4.2.1 Aquifers
In the Molopo Nossob Sub river basin four main aquifer types were identified
namely, fractured, fractured porous, porous, and karstic. The fractured aquifers,
where the matrix has limited porosity due to the solid rock structure the ground
water is associated with secondary interstices such as fractures, fissures and/or
joints. The fractured aquifer includes Archaean Basement complex, Protoerzoic,
and Karoo Basalts. Fractured porous aquifers are dual porosity systems whereby
water is released from a porous matrix via a series of transmissive
interconnected fractures. These aquifers are represented by the Karoo
sandstones. The porous aquifers, that store and transmit water via the interstitial
pore space in the sedimentary formations represented by alluvial and Kalahari
Bed aquifers. The karstic fractured aquifers are carbonate rocks where solution
weathering along joints, fractures, and bedding has enhanced the water-bearing
capabilities of the rock. This aquifer is very limited in aerial extent and located
eastern and southern part of the study area and represented by dolomites.
4.2.2 Basement Aquifers
Generally, the Basement aquifers offer poor prospects of securing ground water
in the study area. Ground water occurrence in these rocks can be wholly
attributed to secondary porosity (i.e.: water contained in fractures and fissures).
As such the resource is controlled by the size of fractures and their
interconnectivity.
_________________________________________________________________________________________________________________________________
__
February 2009
4-5
Molopo Nossob Feasibility Study Ł Main Report
The Molopo River used to receives most of its flow from tributaries in the
Republic of South Africa, most of which have now been dammed for irrigation. As
a result, inflow from these sources to the Molopo River has become heavily
reduced and even non-existent in some years. The Archaean and proterozic
rocks occupy most of the southern part of the Molopo-Nossob sub river basin.
The Unnamed Swazian Granite and Gneiss extend from west of Mmabatho in
the east to Morokweng in the west up to Cassel in the south. The ability of these
granite and gneisses to host ground water is enhanced by the presence of
fractures and dykes. The aquifers can be subdivided into a weathered (regolith),
intermediate (weathered and bedrock) and a fractured bedrock zone. The grade
and depth of weathering is function of climate and mineralogy. The result is that
borehole yields vary considerably over the study area.
The Basement aquifers are restricted mainly to the east of the study area in
Botswana and this area is classified as having a poor ground water potential by
the National hydro geological reconnaissance maps. The existing borehole data
in the area also indicates that most of the boreholes were unsuccessful. The
most significant aquifer is at Sedibeng where 10 boreholes have been drilled and
have an average yield of 5 m3/hr (DWA, 2000). Over period of time the boreholes
yields have reduced and some boreholes have become dry.
Several boreholes were drilled in the Olifantshoek Supergroup rocks of
Protoerzoic age between Khuis and Kolonkwaneng in Botswana for village water
supply to Khuis, Middlepits, Bogogobo and Kolonkwaneng villages. The quartzite
generally outcrop in the area but can be overlain by Kalahari Beds and river
alluvial. Water strikes in the fractured quartzite range from as shallow as 10 m to
as deep as 199 m. Yields of boreholes are highly variable and range from dry to
40 m3/hr. The static water levels of boreholes range from 5 m to 100 m, indicating
that ground water in the fractures occurs under unconfined to semi-unconfined
conditions. Borehole 5898 in Bogogobo encountered overflowing artesian
conditions when it was drilled indicating some degree of confinement in the
fractured quartzite's. Tsabong is the only major supply wellfield within the Molopo
River Basin catchment area in Botswana exploiting the Transvaal and Waterberg
Aquifers.
_________________________________________________________________________________________________________________________________
__
February 2009
4-6
Molopo Nossob Feasibility Study Ł Main Report
In South Africa, Archaean and Protoerzoic rocks occupy most of the Molopo-
Nossob sub river basin. The borehole yields vary considerably over the
study area. Towards the west where the sand covers increase, low yields
up to 0.36 m3/hr (0.1 /s) prevail and numerous dry boreholes are drilled.
At Coetzersdam, and to the east of this where the local geology includes
pegmatite, high yielding boreholes are encountered (Vryburg, 2006).
The Volop Group and Postmasterburg Group are the other important rock
formations in the study area. The Volop Group consists of predominantly meta -
arenaceous rocks (Quartzite). The borehole yields are generally low. The Hydro
geological map (sheet 2722 9Kimberly) shows that the borehole yields range
from 0.36 m3/hr to 1.80 m3/hr (0.1-0.5 /s). Near Olifantshoek the borehole
yields are up to 7.20 m3/hr (2.0 /s). The Postmasterburg Group consists of basic
and intermediate extrusive rocks (basalt, andesite). Almost 40 % of the boreholes
are dry. Of the 60 % of the boreholes analysed, the yield frequency is highest for
the range 0.36 m3/hr to 1.80 m3/hr (0.1 to 0.5 /s). Boreholes in excess of 7.20
m3/hr (2.0 /s) are less than 5 % (Kimberly 2003).
4.2.3 Karst Aquifers
The karstified fractured aquifers are represented by Transvaal dolomite units in
Botswana and Ghaap Group in South Africa. In Botswana, ground water occurs
in the dolomite sequence of Taupone Group of Transvaal Supergroup and are
well developed as a Chert Breccia aquifer in Kgwakgwe area and as a Dolomite
aquifer in the Ramonnedi area. The clusters of boreholes in these aquifers are
broadly grouped as Kgwakgwe and Ramonnedi Wellfields.
Water strike depths and yields of boreholes in these aquifers vary widely. Water
strikes in Chert breccia aquifer of Kgwakgwe area are generally at 50 to 110 mbg
with yields ranging from 20 to 70 m3/h. In Ramonnedi and Taupone areas water
strikes are shallow at 31 to 50 m within karstic dolomite aquifer and the yields
range from <10 to 90 m3/h (DWA, 2006).
The dolomites of the Ghaap Group in South Africa has generally good ground
water potential and yields in excess of 7.20 m3/hr (2.0 /s) are common. Ground
water occurs along the fractures, joints, and solution cavities commonly
_________________________________________________________________________________________________________________________________
__
February 2009
4-7
Molopo Nossob Feasibility Study Ł Main Report
associated with faults and diabase dykes. An explanation on the General
Hydrogeological Map Vryburg 2522 (2006) indicates that more than 25 % of the
boreholes analysed yielded from 1.80 m3/hr to 7.20 m3/hr (0.5 to 2.0 /s) and 13
% of the boreholes analysed yielded more than 18 m3/hr (5 /s). Boreholes with
these higher yields are used for large volume needs like municipal and irrigation.
4.2.4 Karoo Aquifers
4.2.4.1
Dwyka Formation Aquifers
In Botswana, the Dwyka Formation does not constitute an important aquifer as
indicated by boreholes near Gakhibana. The borehole yields in this aquifer are
generally low, showing little confining head and poor quality water. Three
boreholes in Gakhibana show water strikes ranging from 24 m to 74 m and yields
ranging from less than 1 m3/hr to 6 m3/hr. Two exploration boreholes drilled
during the Bokspits TGLP Ground water Survey Project (DGS, 2002) also
confirms the poor yields in this aquifer.
In South Africa the Dwyka Formation is classified fractured aquifer consists
predominantly diamictite (tillites). The Hydrogeological map (Sheet 2714 Ł
Upington/Alexander Bay) shows that the Dwyka Formation extends from north of
Upington to Inkbospan and the borehole yields range from 0.36 m3/hr to 7.20
m3/hr (0.1-2.0 /s).
4.2.4.2
Ecca Group Aquifers
In Botswana the Ecca Group sediments cover most of the area and majority of
boreholes have been drilled in these sediments. The Ecca sediments occur
under varying thickness of Kalahari beds ranging from 10 m to 55 m
(ORASECOM, 2007). The Otshe (Auob) sandstone of the Ecca Group forms an
important aquifer in the area with localized areas of potable ground water. It
consists of a complex succession of canalized fluvial and deltaic sediments. The
sediments consist of multiple interbedded layers of fine to coarse-grained
sandstone, shale, mudstone, carbonaceous shale and poor coal (DGS, 1994).
Argillaceous units within the formation confine the individual water bearing
sandstone units.
_________________________________________________________________________________________________________________________________
__
February 2009
4-8
Molopo Nossob Feasibility Study Ł Main Report
The Otshe (Auob) sandstone generally provides sufficient yields (2 Ł 3 m3/h) for
livestock watering in both confined and unconfined conditions. The confined
sandstone generally yielded very saline water while semi-confined sandstone
yield usable brackish water and is some places the confined Otshe sandstone
contains water too saline for any agricultural use. Depths to first water strike in
the Ecca sediments are highly variable and range from 30 m to 196 m. Multiple
water strikes have been recorded on several boreholes tapping the Ecca
aquifer(s) with the deepest water strike at 301 m. Yields of boreholes are highly
variable and range from dry to 60 m3/hr.
The Otse Formation in Ncojane Block constitute main aquifer unit within the Ecca
Group occurs beneath relatively thin Kalahari Beds and Lebung/Beaufort Group
rocks and the water strikes are generally between 145 m and 290 m (DWA,
2008). The borehole yields are varying from 20 m3/hr to over 100 m3/hr. The
ground water quality is portable (TDS is about 500 mg/ ) in a broad area in the
western and northern part of the Ncojane Block. The TDS values tend to
increase significantly (> 6 000 mg/ ) to the south and southeast (DWA, 2008).
The Nossob sandstone formation occurs at the base of the Ecca Group and
forms a thin confined aquifer near the north-eastern boundary of the Kgalagadi
Transfrontier Park yielding saline water under very high pressure head
conditions. The Nossob sandstone was encountered in boreholes 7246, 7243,
and 7192 (DGS, 1994). The Nossob sandstone was encountered at 212m depth
in borehole 7243 and at 360 m depth in borehole 7246 and the water is very
saline with TDS value of >25 000 mg/ . This formation is, however, very deep
and has very saline water and thus does not constitute an important aquifer.
One of the Internationally Shared Aquifer Resources Management (ISARM)
Programme case studies was carried out on the Stampriet Artesian Basin an
aquifer shared by Namibia, Botswana, and South Africa, which is part of the
current study area. In Namibia, the Auob aquifer has the highest potential while
the Nossob aquifer shows the lowest potential.
The Ecca Group sediments in South Africa are not productive. Boreholes drilled
in massive shale beds in the Ecca Group yielded very little water less than 0.36
_________________________________________________________________________________________________________________________________
__
February 2009
4-9
Molopo Nossob Feasibility Study Ł Main Report
m3/hr (0.1 /s) and generally not potable for human or livestock. Boreholes drilled
in the Auob and Nossob sandstone formations yielded up to 7.20 m3/hr (2.0 /s)
and the water quality varies from 3000 Ł 20000 mS/cm.
4.2.5 Kalahari Group Aquifers
The Kalahari aquifer(s) constitute an important water supply source in the region,
along the Molopo and Nossob Rivers, for both human and livestock populations.
The water strikes range from 12 m to 72 m with yields ranging from <1.0 m3/hr to
8.6 m3/hr. Broadly the Kalahari Group consists of a layer of aeolian sand up to 20
m thick, which may display relict dune structures. The sand is generally
underlain by a duricrust layer of silcrete and calcrete which must represent an
unconformity within the succession. The duricrust is underlain by poorly
consolidated sandstones which are often calcareous. Where a full succession is
present, red marls and a basal clayey gravel of undoubted fluvial origin underlie
the sandstones. The thickness of the Kalahari succession is largely a function of
pre-Kalahari Group topography, with the gravels being largely confined to
palaeo-valleys.
The basal Kalahari gravels can constitute a useful aquifer. The Kalahari Group
sediment thickness around Bray in Botswana and Vryburg in South Africa
indicate a broad 15-30 km wide trough of these sediments (in excess of 180 m
thickness) forming a palaeo-valley. Steep gradients are observed on the northern
and southern flanks of the palaeo-valley. The northern flank shows several
tributaries, which drain southwards into the palaeo-valley. The palaeo-valley
crosses the international border and passes into the Molopo Farms area.
There is high borehole density on the South African side indicating extensive
abstraction of ground water resource on this aquifer. Thus the Kalahari
aquifer(s) constitute an important water supply source in the region, along the
Molopo and Nossob Rivers, for both human and livestock populations. The
water strikes range from 12 m to 72 m with yields ranging from <1.0 m3/hr to 8.6
m3/hr. The Kalahari Beds aquifer in Namibia is highly developed and account for
greater abstraction (10 MCM/yr) than the underlying Ecca Aquifer (DWA, 2008).
_________________________________________________________________________________________________________________________________
__
February 2009
4-10
Molopo Nossob Feasibility Study Ł Main Report
4.2.5.1
Recharge in the Molopo and Kuruman catchments
The recharge in the areas covered by Kalahari sediments is negligible in areas
with less that 300 mm/year and the quality of the groundwater is poor. The
isolated areas of higher recharge e.g. in the vicinity of Van Zylsrust, at Keesi and
Fullifeesand in close proximity to the Kuruman river are directly linked to
recharge that occurs infrequently at times when floodwater reaches as far as the
confluence of the Nossob-Molopo Rivers. The groundwater exploitation from
dolomitic aquifers is good even in the low rainfall areas like Tosca/Vergelee, as
this aquifer is periodically being recharged by floods occurring in the Molopo
River and it has sufficient storage to be exploited excessively during periods of
low rainfall. Replenishment could occur in one year of high rainfall that has
caused floods to reach the aquifer. Similarly the Louwna-Coetzersdam granite
aquifer is regularly being recharged in view of higher local rainfall and a thin
overburden of unsaturated material overlying the granite aquifer. In areas
overlain by thick Kalahari sediments, representing about 70 % of the investigated
drainage area, the recharge will be small as a result of the retention of potential
recharge in the unsaturated zone, from where it is lost by evapotranspiration.
This is the case in Jwaneng aquifer which receives most of its recharge from the
outcropping area of the aquifer and nothing from infiltration through the Kalahari
(Nijsten and Beekman 1997).
The occurrence of groundwater is closely related to the underlying geology and
the structural deformation it has been subjected to e.g. faulting, folding, fracturing
and intrusion of dolorite dykes. The selection of high-yielding drill sites remains
difficult but the use of aero magnetic surveying and satellite imaging could reveal
regional structures that are often related to higher-yielding boreholes. In view of
the poor quality of the groundwater in the central Kalahari region the prospects of
good groundwater supplies are zero. In these areas alternative sources of water
e.g. from `gatdamme' might still be viable if local rainfall-harvesting could be
applied.
It is most important that the Hydrogeological Sheet of the Vryburg area be
completed without delay and that that the information be conveyed to the water
managers and water users.
_________________________________________________________________________________________________________________________________
__
February 2009
4-11
Molopo Nossob Feasibility Study Ł Main Report
The regional approach to assess the recharge potential of unknown areas is the
only viable method that can be applied in a consistent way to derive a
quantitative prediction of the rainfall-recharge of any aquifer from the exponential
relationship between the recharge and the rainfall. In view of the similarities
between larger part of the Kalahari in the RSA, Botswana and Namibia, much of
the missing information could be ascertained from the regional models. The
outcome indicates that the groundwater potential of the Kalahari areas would
inevitably be small and thus requires that alternative resources be found. Such
possibilities are almost non-existent but the use of `gatdamme' for the collection
of rainwater or by desalinisation of highly saline water, seems to be prospects in
some areas.
The monitoring of rainfall, water levels and abstraction from groundwater is
essential to derive the aquifer parameters that are required to model specific
groundwater system reliably. It would however be rather fruitless to invest in
expensive monitoring in the central dry Kalahari region. The hydrodynamic
modelling of the large aquifers should be extended to incorporate the change of
aquifer storativity with depth that specifically applies to the dolomitic aquifers. An
aspect not to be neglected is proper management of the resource and the
education of the water users to participate in this respect.
The results obtained from simulations of the flows of dolomitic springs have
potential to derive the sustainable exploitation potential of an aquifer as well as
determining the reserve of the aquifer in a consistent way.
In view of the rainfall being the primary factor to cause recharge, the exploitation
of groundwater will be affected by long-term cyclical recurrences of low and high
rainfall, which appears to be synchronized with the sunspot variations. This is
particularly important in view of sub-normal rainfall that could be expected in the
period 2010 to 2014.
4.3
DAMS
4.3.1 Main Dams
There are a total of nine main dams within the study area, none of which are
located in Botswana. Table 4-4 lists their main characteristics and a brief
_________________________________________________________________________________________________________________________________
__
February 2009
4-12
Molopo Nossob Feasibility Study Ł Main Report
description of each is provided hereafter. Figure 4-1 shows their approximate
locations.
The Otjivero Dams (Namibia)
These two dams (Otjivero Main Dam and Otjivero Silt Dam) are located on the
upper reaches of the White Nossob River in Namibia, approximately 100 km to
the to the east of Windhoek. They form the main sources of the bulk water
supply scheme known as the Gobabis Regional State Water Scheme. This
scheme provides water to the town of Gobabis and to some surrounding smaller
settlements in the area. The two dams have a combined full supply capacity of
17,8 million m3. The Silt Dam located about 2,5 km upstream of the Main Dam
and is used to reduce sedimentation accumulation in the Main Dam.
The Daan Viljoen Dam and Tilda Viljoen Dam (Namibia)
These two dams are located at Gobabis and also form part of the Gobabis
Regional State Water Scheme. The Daan Viljoen Dam is an in-channel dam on
the Black Nossob River, which impounds flood waters. The water is then
pumped into the larger Tilda Viljoen Dam (off-channel), located nearby. Water is
also transferred from the Otjivero Main Dam into the Tilda Viljoen Dam via a
110 km pumped pipeline.
Lotlamoreng Dam (RSA)
This small dam is located in the Lotlamoreng Dam Cultural Reserve on the
Molopo River and is used for recreational purposes only. It has a capacity of
0,5 million m3.
Setumo (Modimolo) Dam
This dam is located on the Molopo River near Mafikeng and has a capacity
21.5 million m3. It supplies bulk water for treatment at the Setumo Waterworks
(formally Mmbatho Waterworks). The treated water from the works is blended
with treated water from the Mafikeng Waterworks (supplied from ground water),
and supplied to the urban and peri-urban areas of Mafikeng.
_________________________________________________________________________________________________________________________________
__
February 2009
4-13
Molopo Nossob Feasibility Study Ł Main Report
Disaneng Dam
This dam is also located on the Molopo River, approximately 35 km downstream
of Mafikeng. It provides water for irrigation of about 100 ha at the Disaneng
WUA (former Disaneng Irrigation Board).
Koedoesrand and Blackheath Dams
According to the South African DWAF, these small dams are used for irrigation
purposes. Information available is as shown in Table 4-4.
_________________________________________________________________________________________________________________________________
__
February 2009
4-14
Molopo Nossob Feasibility Study Ł Main Report
Table 4-4: Features of the Main Dams in the Molopo-Nossob Catchment
LOCATION
FULL
YIELD
WALL
RIVER
NEAREST
DATE
SUPPLY
DAM NAME
COUNTRY
(million
HEIGHT DAM TYPE
TOWN
Lat
Long
COMPLETED
CAPACITY
m3/a)
(m)
(million m3)
Otjivero Main
White Nossob
Windhoek
Namibia
22░17'
17░58'
1984
9,808
1,65
16
Concrete Buttress
(95%
Otjivero Silt
White Nossob
Windhoek
Namibia
22░17'
17░57'
1984
7,795
17
Embankment
assurance
Daan Viljoen
Black Nossob
Gobabis
Namibia
1958
0,429
0,36
6,6
Concrete Arch
22░13'
18░50'
(95%
Tilda Viljoen
Off-channel
Gobabis
Namibia
1958
1,224
12.5
Embankment
assurance
Lotlamoreng
Molopo
Mafikeng
RSA
25░52'
25░36'
1958
0,5
7
Embankment
Modimola
Molopo
Mafikeng
RSA
25░51'
25░31'
1995
21,5
13,2
-
Embankment
Disaneng
Molopo
Mafikeng
RSA
25░46'
25░16'
1980
17,4
1,0
17
Embankment
Koedoesrand
Koedoe
Mafikeng
RSA
26░14'
25░13'
1989
0,75
Unknown
9
Embankment
Blackheath
Molopo
Vryburg
RSA
25░41'
24░15'
1971
0,124
Unknown
5
Embankment
Leeubos
Swartbas
Twee Rivieren
RSA
26░ 44'
20░06'
1948
1,071
4
Embankment
Abiekwasputspan
Molopo
Twee Rivieren
RSA
27░18'
20░06
1963
-
Unknown
5
Pan
___________________________________________________________________________________________________________________________________
February 2009
4-15
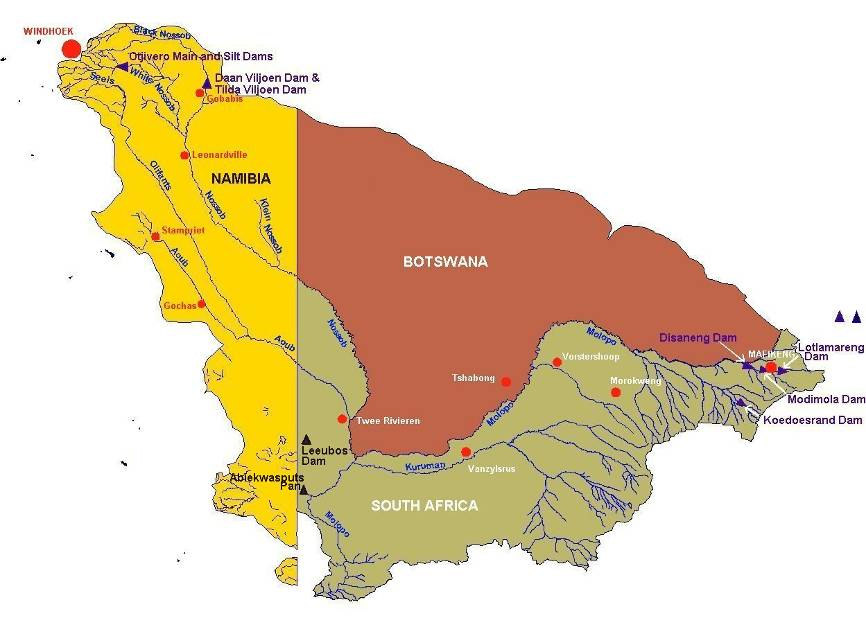
Molopo Nossob Feasibility Study Ł Main Report
Figure 4.1: Location of Main Dams in the Molopo-Nossob Catchment Area
___________________________________________________________________________________________________________________________________
February 2009
4-16
Molopo Nossob Feasibility Study - Main Report
4.3.2 Farm Dams
From the GIS database developed for the study, the information on the extent of farm
dams within the total study area is summarised in Table 4-5.
Table 4-5: Features of the Farm Dams in the Molopo-Nossob Catchment
TOTAL CAPACITY
TOTAL SURFACE
DEPTH RANGE (m)
No. of FARM DAMS
(million m3)
AREA (ha)
0 - 0,5
75
0,44
80
0,5 Ł 0,8
5
0,01
3
0,8 Ł 1,0
126
1,95
214
1,0 Ł 1,5
42
0,67
84
1,5 Ł 2,0
49
0,82
110
2,0 - 2,5
12
0,13
20
2,5 Ł 3,0
5
0,71
50
3,0 Ł 4,0
3
0,12
13
4,0 Ł 5,0
1
0,19
16
TOTAL
318
5,04
590
4.3.3 Pans
From the GIS database developed for the study, the information on the extent of
natural occurring pans within the total study area is summarised in Table 4-6.
Table 4-6: Features of the Pans in the Molopo-Nossob Catchment
TOTAL CAPACITY
TOTAL SURFACE
DEPTH RANGE (m)
No. of PANS
(million m3)
AREA (ha)
0 - 0,5
1 150
17,44
6 977
0,5 Ł 1,0
596
52,52
10 504
1,0 Ł 1,5
234
35,69
4 759
1,5 Ł 2,0
265
256,71
25 671
2,0 Ł 2,5
64
401,54
32 123
2,5 Ł 3,0
105
174,28
11 618
3,0 Ł 3,5
4
4,74
271
3,5 Ł 4,0
74
183,88
9 194
4,0 Ł 5,0
84
754,03
30 161
5,0 Ł 6,0
8
21,66
722
6,0 Ł 7,5
10
44,68
1 192
7,5 -10
9
37,38
748
TOTAL
2 603
1 984,55
133 940
23 July 2009
4- 17
Molopo Nossob Feasibility Study Ł Main Report
Table 4-7: Summary of run-off, storage and yield
MAR(1) (Mm3)
EXISTING MAJOR DAMS
River
Quaternary
Present
Storage
Yield
Natural
Dam name
River
Day
(Mm3)
(Mm3/a)
Lotlamoreng
Molopo
0.50
0
D41A
32.9
6.4
Modimolo
Molopo
21.50
13.2
Disaneng
Molopo
17.40
1
SUB-
32.9
6.4
TOTAL
39.40
14.20
D41B
12.8
4.0
Koedoesrand
Koedoe
0.75
Unknown
D41C
9.7
2.5
Blackheath
Molopo
0.12
Unknown
D41D
6.0
1.1
-
-
-
-
Molopo
Z10D
3.6
1.1
-
-
-
-
Z10C
21.3
8.7
-
-
-
-
D41E
0.7
0.8
-
-
-
-
D41F
1.9
2.4
-
-
-
-
D41H*
0.9
0.9
-
-
-
-
Z10F
0.6
0.0
-
-
-
-
D42C*
0.1
0.1
-
-
-
-
TOTAL
90.3
28.0
-
-
40.27
14.20
D41G
7.1
6.9
-
-
-
-
D41H*
1.6
1.4
-
-
-
-
D41J
3.7
3.4
-
-
-
-
D41K
4.5
4.5
-
-
-
-
Kuruman D41L
25.2
16.9
-
-
-
-
D41M
0.9
0.9
-
-
-
-
D42C*
1.1
1.0
-
-
-
-
TOTAL
44.1
35.0
-
-
-
-
White
Otjivero Main
Nossob
9.81
1.65
White
Z10A
18.1
17.3
Otjivero Silt
Nossob
7.80
Black
Nossob
Daan Viljoen
Nossob
0.43
0.36
Tilda Viljoen
Off-channel
1.22
SUB-
18.1
17.3
TOTAL
19.26
2.01
D42A
0.2
0.2
Leeubos
Swartbas
1.07
Unknown
TOTAL
18.4
17.5
-
-
20.33
2.01
Z10A
7.7
4.5
-
-
-
-
D42A
0.0
0.0
-
-
-
-
Auob
D42B
0.0
0.0
-
-
-
-
TOTAL
7.8
4.5
-
-
-
-
(1) Based on catchment model results
___________________________________________________________________________________________________________________________________
February 2009
4-18
Molopo Nossob Feasibility Study - Main Report
5.
WATER REQUIREMENTS
5.1
SURFACE WATER
5.1.1
Urban and Rural Water Requirements
The largest urban areas within the study catchment are Mafikeng and Kuruman in
South Africa and Gobabis and part of Windhoek in Namibia. The Botswana part of
the catchment includes no major urban areas. Data on urban water requirements
within the study area were obtained from DWAF in South Africa, DWA in Botswana
and NamWater in Namibia.
The urban demands for Mafikeng are approximately 11 million m3/a (Dube,
Pers.com). Approximately 65 % of this demand is sourced from the Molopo and
Grootfontein Eyes and the remaining 35 % from the Modimolo Dam. Kuruman
supplies almost all of its municipal demand of approximately 9 million m3/a from the
Kuruman Eye which is abstracted directly at the source, which is equivalent to 94 %
of its total demand. Only approximately 6 % of the total supply is contributed by
surface water. Some of the rural demands in the lower Molopo-Nossob catchment
is supplied via the Kalahari Water Supply Transfer Schemes (refer to Section
5.1.4). Gobabis' municipal supply of about 1 million m3/a is provided from the
Otjivero Dam with the shortfall being supplemented by ground water during periods
of drought. Most rural water requirements are met from localised ground water
abstractions.
5.1.2
Mining Water Requirements
In the upper Molopo catchment, mining and industrial water requirements are
approximately 5 million m3/a and in the upper Kuruman catchment, approximately 6
million m3/a (DWAF, 2003). Most water requirements for mining are satisfied by
ground water sources in conjunction with transfers from outside the study
catchment.
5.1.3
Return Flows
Urban and mining return flows from the upper Molopo (larger Mafikeng area) are
approximately 7 million m3/a, contributing to the total available water for use in
Mafikeng (Crocodile West WMA, DWAF, 2003). Urban and mining return flows in
the upper Kuruman catchment equal less than 2 million m3/a. Irrigation return flows,
based on information provided by Schoeman and Partners are estimated to be 10
% of the irrigation supply.
23 July 2009
5- 1
Molopo Nossob Feasibility Study Ł Main Report
5.1.4
Water Transfers
Due to the scarcity of water within most of the Molopo-Nossob catchment, no water
is transferred out of the catchment. However, schemes transferring water into the
Molopo-Nossob catchment include the Vaal-Gamagara Regional Water Supply
Scheme and the Kalahari Rural Water Supply Schemes:
Vaal-Gamagara Scheme
The Vaal-Gamagara Regional Water Supply Scheme was initiated in 1964 to mainly
supply water to the mines in the Gamagara Valley in the vicinity of Postmasburg
and further north. The scheme abstracts water from the Vaal River near
Delportshoop, immediately downstream of its confluence with the Harts River, from
where the water is pumped to a water purification works next to the river. From the
purification works, water is pumped via a 99 km double rising main to reservoirs in
the Vaal/Molopo watershed near Clifton, from where water is gravity fed over a
distance of 182 km along a route which serves Postmasburg, Sishen, Hotazel and
Black Rock. Branch pipelines of 24 km and 5 km respectively supply water to the
town of Olifantshoek and a reservoir at Beesthoek. The design capacity of the
scheme is 36.4 M /d (13.3 million m3/a), with allowance having been made to
increase this capacity by means of additional booster pumps and reservoirs. In
1995, the actual abstraction by this scheme was 8.4 million m3/a (this include the
water use by the Kalahari East Rural Water Supply Scheme Ł see next paragraph).
Kalahari West Rural Water Supply Scheme
The Kalahari West Rural water Supply Scheme was constructed in 1982 to supply
farmers north of Upington with water for stock watering and domestic use. The
scheme serves a total of 74 farms covering an area of 633 000 ha, which extends
into the Molopo catchment. The scheme was implemented as an emergency
scheme during a period when ground water sources in the region started to fail and
was designed to serve that part of the Kalahari experiencing the worst water
shortages. The scheme sources water from Upington's municipal system, from
where it is pumped via a number of balancing reservoirs and small booster
pumpstations. The scheme's peak design capacity is 1,99 M /d. In 1995, the
actual water abstraction via the scheme was estimated to be 0,42 million m3/a,
which, taking peak factor requirements into account, implies that the scheme is
being operated at or near capacity.
___________________________________________________________________________________________________________________________________
February 2009
5-2
Molopo Nossob Feasibility Study Ł Main Report
Kalahari East Rural Water Supply Scheme
The Kalahari East Rural Water Supply Scheme was constructed in the early
nineties to supply water to farmers in the Kalahari north of Upington (including parts
of the Molopo catchment) with water for stock watering and domestic use. The
scheme sources its water from the Vaal-Gamagara pipeline, which is currently
underutilised. Water is abstracted from the Vaal-Gamagara pipeline at Kathu,
north-east of Olifantshoek, from where water is distributed via a 32 km long rising
main, a 4.3 M reservoir and an extensive gravity pipe network to serve an area of
approximately 14 000 km2. The scheme was designed to deliver a peak flow of 6.18
M /d, with provision having been made to increase this to 8.52 M /d. The actual
water that was supplied by the scheme in 1995 equalled 1.3 million m3/a.
Based on the assumption that return flows from the above transfer schemes are
negligible, the above transfers have not been included in the hydrological model.
5.1.5
Ecological Reserve Requirements
The ecological Reserve in the Upper Molopo River is estimated to be 5 Mm3/a
(Crocodile West & Marico WMA) (DWAF, 2003) and in the lower Molopo River is
estimated to be 29 Mm3/a (Lower Vaal WMA) (DWAF, 2003).
5.2
GROUND WATER
The ground water is extensively used in the study area for domestic, livestock, and
irrigation purposes. Ground water abstraction increased dramatically in the last 25
years due to improved technology in developing ground water resources.
In Botswana, the Department of Water Affairs: Department of Geological Survey
carried out various major ground water exploration projects, TGLP Projects and Rural
Village Water Supply projects to develop ground water potential to supply to various
major centres, villages and settlements for domestic and livestock purposes. In
Botswana large volume of water consumption is for the domestic use followed by
Livestock watering (BNWMP, 1991).
In South Africa, agriculture was the largest utiliser of ground water resources and
livestock is a minor volumetric consumer. The mining sector and domestic water
supply are also reliant on ground water resources. The large-scale water use is listed
in Table 5-1 where the total use amounts to almost 111 million m3/annum. Other
___________________________________________________________________________________________________________________________________
February 2009
5-3
Molopo Nossob Feasibility Study Ł Main Report
smaller scale water use in the area could increase total use in the map area to
115 million m3/annum (Gawie van Dyk and S.Kisten, 2006).
Table 5-1: Locality and amount of large scale ground water abstraction (million
m3/a)
Locality/Area
Source
Municipal
Agricultural
Mining
Info source
Irrigation
Louwna/Coetzersd
Fractured
and
40
Botha (DWAF
am
weathered granite
1996)
Tosca
Karst dolomite
18
Van
Dyk
(DWAF 2005)
Stella
Fractured
and
0.2
1
Nel
(DWAF
weathered granite
1998)
Mmabatho/
Karst dolomite
8
8
Nel
(DWAF
Mafikeng
1997)
Grootfontein
compartment
Vryburg
Fractured
5
Louw (Africon
quartzites
2002
Delareyville
Fractured
5
13
Louw (Africon
sediments
2002)
Van
Dyk
DWAF
est
2003)
Sannieshof
Fractured lava
0.9
2.5
Louw (Africon
2002)
Van
Dyk
DWAF
est
2003
Ottosdal
Fractured
3
3
Louw (Africon
sediments
2002)
Van
Dyk
DWAF
est
2003
Pomfret
Karst dolomite
1
Van
Dyk
(DWAF 1994)
Kalahari gold mine Fractured
and
2.4
Louw (Africon
Mareetsane
weathered granite
2002)
Total
23.1
82.5
2.4
The estimated water consumption in the Stampriet Artesian Basin in Namibia, which
is part of the current study area, is also indicates that large volume (46.1 %) of water
___________________________________________________________________________________________________________________________________
February 2009
5-4
Molopo Nossob Feasibility Study Ł Main Report
consumption is for the irrigation purpose followed by livestock watering. Table 5.2
shows the estimates of water usage in the Stampriet Artesian Basin area for March
2000 (JICA, 2002).
Table 5-2: Estimates of Water Usage in the Stampriet Artesian Basin area
Water Usage
Proportion
Sectors
(million m3/year)
(%)
1. Domestic water
1.1 Village centres
0.635
4.26
1.2 Commercial farms
1.594
10.69
1.3 Communal land
0.127
0.85
Sub-total
2.356
15.80
2. Industries
0.000
0.00
3. Tourism
0.004
0.03
4. Stock watering
5.678
38.07
5. Irrigation
6.876
46.10
Total
14.914
100.00
5.2.1
Available Water
In the semi-arid areas with limited precipitation and recurring droughts the long term
sustainable use of ground water resources is always be a challenge. Most of the
villages and settlements are situated along the Molopo and Nossob dry valleys where
they rely on the shallow alluvial aquifers for their water supply. All the cattle posts
and ranches in the area rely entirely on ground water sources. The ground water
sources have proven over time to be unreliable and saline in most areas. The
quantification of water availability for the whole Molopo-Nossob sub river basin is not
available. The ground water is already over exploited in the region and the water
levels are declining. Continued good management of ground water resources in the
project area is essential.
In Botswana, major ground water exploration studies namely, Tsabong Ground water
Investigations, Assessment and Development, Bokspits TGPL Areas Ground water
Potential Survey, Werda Ł Mabutsane - Sekoma TGLP Ground water Potential
Survey, and Matsheng Ground water Development Project were carried out in the
Molopo River Basin area to provide the water for domestic and livestock.
The Tsabong wellfield, which extracts from the quartzites of the Olifantshoek Group,
is over exploited. It is unlikely that any more resource is available in this area. The
sustainable yield of the Tsabong wellfield is around 300 m3/day but the abstraction is
more than double (750 m3/day). The Bokspits TGLP ground water potential survey
project (DGS, 2002) covering an area of 7 435 km2 and is bound to the south and
___________________________________________________________________________________________________________________________________
February 2009
5-5
Molopo Nossob Feasibility Study Ł Main Report
west by the Molopo and Nossob rivers, respectively. 95 % of the project area
underlies the Otshe (Auob) sandstone of Ecca Group and forms an important aquifer.
The calculated available water sources of 1 515 m3/d are from the project boreholes
in addition to existing pumping. However the exploitable is only 943 m3/d. The
Werda-Mabutsane-Sekoma TGLP ground water survey project covering an area of
12.000km2 in the three administrative districts (Kgalagadi, Southern, and Kweneng)
with the Molopo River bordering the south of the project area predominantly
quartzites and shale's of the Transvaal Supergroup and concluded that the ground
water potential is poor to very poor for provision of portable water supply. The Ecca
aquifer in the Ncojane Block situated northern side of the study area was explored
during the Matsheng Ground water Development Project (DWA, 2008). The total
calculated reserve in the Ncojane Block is 158 MCM in storage of which the
exploitable reserve is 32 MCM. The Kalahari Group sediments are along the Molopo
River is productive. The thickness is of Kalahari sediments are around 200 m at Bray
(NWMP, 2006). Boreholes drilled around Hereford/Bray yields' vary up to 6.0 m3/hr
and the Total Dissolved Solids (TDS) is generally below 1 000 mg/ , but occasionally
saline water is also present.
In the South African part of the basin, extensive ground water abstraction by
commercial and communal farmers, domestic and other purpose, there is very limited
potential for future exploration of the ground water resources in the study area. The
productive aquifer is mainly along the Molopo and Nossob rivers in the Kalahari
Group.
In Namibia there is a comparatively good understanding of the geology and
hydrogeology of the aquifer in the Stampriet Artesian Basin. Water occurs in the
Auob and Nossob sandstones of the Ecca Group as well as the overlying Kalahari
Group sediments. The strata dip approximately 30 towards the southeast and the
water quality deteriorates in that direction. Construction of a numerical model of the
aquifer was being undertaken by the Department of Water Affairs in Namibia. The
storage of ground water in each of the aquifer in the Stampriet Artesian Basin is
estimated during the ground water potential evaluation and management plan study
(JICA, 2002).
___________________________________________________________________________________________________________________________________
February 2009
5-6
Molopo Nossob Feasibility Study Ł Main Report
Table 5-3: Ground water Storage of each aquifer
Effective
Ground water
Aquifer
Thickness (m)
Area (m2)
Volume (m3) Porosity (%) Storage (m3)
Kalahari
0-250
52.6E+9
2.36E+12
5
120E+9
(Saturated)
Auob Aquifer
0-150
50.7E+9
3.60E+12
5
180E+9
Nossob Aquifer
0-60
9.98E+9
1.24E+12
5
57E+9
The Table 5-3 indicates that the Auob Aquifer contains more ground water than the
Kalahari and the Nossob Aquifer. However, it should be noted that a very little of
ground water within the aquifers is virtually available for the extraction.
5.2.2
Water Quality
Water quality is the major constraint on ground water utilisation in the Molopo-
Nossob Sub river basin area. The water quality in the study area varies from fresh to
hyper saline. The most important ions contributing to the ground water salinity are
chloride, sulphate and sodium. In Botswana, the ground water over much of the
southern and western Kgalagadi District is excessively saline and large areas of the
Otshe (Auob) Formation sandstone aquifers and Kalahari Group aquifers are quite
unusable.
The quality of water in the different aquifers is discussed below.
Basement Aquifers
The quality in the Kraaipan Group of rocks near Pitsane-Molopo indicated that the
water quality for the few yielding boreholes is generally acceptable with TDS values
below 500 mg/ . Nitrate and fluoride registered marginal limits in BH 1218, varying
between 2.0 mg/ to 29 mg/ for Nitrate and 0.16 mg/ to 0.37 mg/ for fluoride. The
water was described as Ca-Mg-HCO3 type (DWA, 2007).
The water quality data of the Vryburg map area in South Africa collected from the
DWAF indicates that elevated magnesium concentration in some of the boreholes
are not suitable for drinking purposes. Aquifers in the Kraaipan Group and Unnamed
Swazian rocks can be used marginally but only in the short term (Gawie van Dyk and
S.Kisten, 2006).
___________________________________________________________________________________________________________________________________
February 2009
5-7
Molopo Nossob Feasibility Study Ł Main Report
The fractured rock aquifers display four types of water, (HCO3+CO3) -Mg Ł Ca; Mg Ł
(Cl+NO3) Ł SO4; Mg Ł (HCO3+CO3) Ł (Cl+NO3); and Mg Ł SO4 - (HCO3+CO3).
Aquifers of the Dominion Group Bothaville Formation, Vryburg, and Black Reef
Formation display recently recharged ground water (Gawie van Dyk and S.Kisten,
2006).
The quality of ground water in the quartzites in Botswana is generally potable with
TDS values of less than 2.000 mg/ . However, two borehole drilled near Middlepits
during the Bokspits TGLP ground water survey project (DGS, 2002) indicates that the
TDS varies between 10.540 mg/ (BH 9421) to 29.550 mg/ (BH 9420) indicating that
the quartzite north of Middlepits has poor quality water. The Olifantshoek quartzite
has a variety of water types ranging from Na-Cl, SO4 to Na-HCO3, Cl and Ca, Mg,
Na-Cl, SO4 (DGS, 2002).
Karst Aquifers
The Ghaap Group of aquifer in the South Africa displays a HCO3+CO3 Ł Mg Ł Cl +
NO3 water type. The bicarbonates and magnesium rich waters indicate recently
recharged aquifers. However there is a presence of the Cl + NO3 anions that could
possibly infer contamination from surface from agricultural practices (Gawie van Dyk
and S.Kisten, 2006).
Dwyka Formation Aquifers
The quality of ground water from the few boreholes that tap the Dwyka Formation in
Botswana varies from brackish to saline with TDS ranging from 2.300 mg/ to
7.170mg/ . The Dwyka Formation water is mainly of the Na-Cl type. In South Africa,
more than 66 % of the boreholes drilled in the Dwyka Group of rocks are dry. The
Dwyka Group aquifer display mixed water type (Mg Ł (HCO3+CO3) Ł (Cl+NO3)). The
Mg2+ cation and the bicarbonate/carbonate anions reflect recently recharged waters.
The Cl+NO3 ratio is strongly influenced by the nitrate content (Gawie van Dyk and
S.Kisten, 2006).
Ecca Group Aquifers
The quality of ground water in the Ecca aquifer(s) in Botswana varies from fresh,
brackish to very saline with TDS ranging from 780 mg/ (BH Z5853) to 129,930 mg/
(BH 8467). The confined sandstone units contain generally very saline waters with
yields up to 60 m3/hr (DGS, 1994) whilst the semi-confined sandstone(s) may yield
brackish usable water with yields up to 25 m3/hr. Several boreholes in the project
___________________________________________________________________________________________________________________________________
February 2009
5-8
Molopo Nossob Feasibility Study Ł Main Report
area also show increasing TDS with depth, e.g. boreholes 7245, 7425, 7475, 7476,
9426, 9427 9430 and 9433. Otshe (Auob) sandstone waters are mainly of the Na-Cl,
SO4 and Ca, Mg, Na-Cl, SO4 type. High concentrations of TDS are observed around
Twee Rivier area in Namibia. The maximum value of TDS concentration was
6.754 mg/ .
Kalahari Beds
The quality of water in this aquifer is also highly variable and ranges from fresh to
hyper-saline. The fresh water aquifer units of the Kalahari beds (alluvial sediments)
are localised and very limited in extent and mainly occur along the Molopo and
Nossob Rivers. Other potential freshwater/brackish water aquifers of the Kalahari
Group are those associated with pans e.g. Tshane-Tshane borehole (BH Z2905).
These occur as isolated perched aquifers developed around pans. The Kalahari
aquifer has waters dominated by Na-Cl, SO4 type.
___________________________________________________________________________________________________________________________________
February 2009
5-9
Molopo Nossob Feasibility Study - Main Report
6.
RIVER FLOWS
6.1
HISTORICAL EXTREME EVENTS
Figure 6.1 shows typical runoff volumes at three locations along the Molopo River as
simulated by the Pitman model. These represent runoff volumes associated with the
three most extreme rainfall events since 1920 viz. in 1943, 1973 and 1975.
6.2
DESIGN FLOOD VOLUMES
In order to verify the above estimates of historical runoff volumes, typical estimates of
design rainfall (Smithers and Schulze, 2002), areal reduction factors (Alexander,
1990), temporal storm distributions (Adamson, 1981) and storm losses (HRU, 1972)
were used to provide first order estimates of storm runoff volumes at locations which
coincide with those shown in Figure 6.1. Design runoff volumes for different return
periods, as well as channel losses as `calibrated' in the Pitman model, are
summarised in Table 6.1.
Table 6.1 shows that only in the case of floods with return periods in excess of 20
years, will flood water propagate down to the Nossob confluence. Furthermore,
based on the `historical' flood volumes as depicted in Figure 6.1, Table 6.1 implies
that the most extreme historical event (1975) represented a storm with a return
period of between 20 and 50 years.
Table 6-1: Design storm runoff volumes in the Molopo River (Mm3)
Sub-catchment
Return Period (a)
100
50
20
10
Upper Molopo
Runoff
492
406
283
223
Losses
120
120
120
120
Balance
372
286
163
103
Middle Molopo
Runoff (1)
499
390
236
161
Losses
135
135
135
135
Balance
364
255
100
26
Lower Molopo
Runoff (1)
364
255
100
26
Losses
100
100
100
100
(Nossob confluence)
Balance
264
155
0
0
Note (1): Includes runoff balance from upstream and runoff from incremental catchment
23 July 2009
6- 1
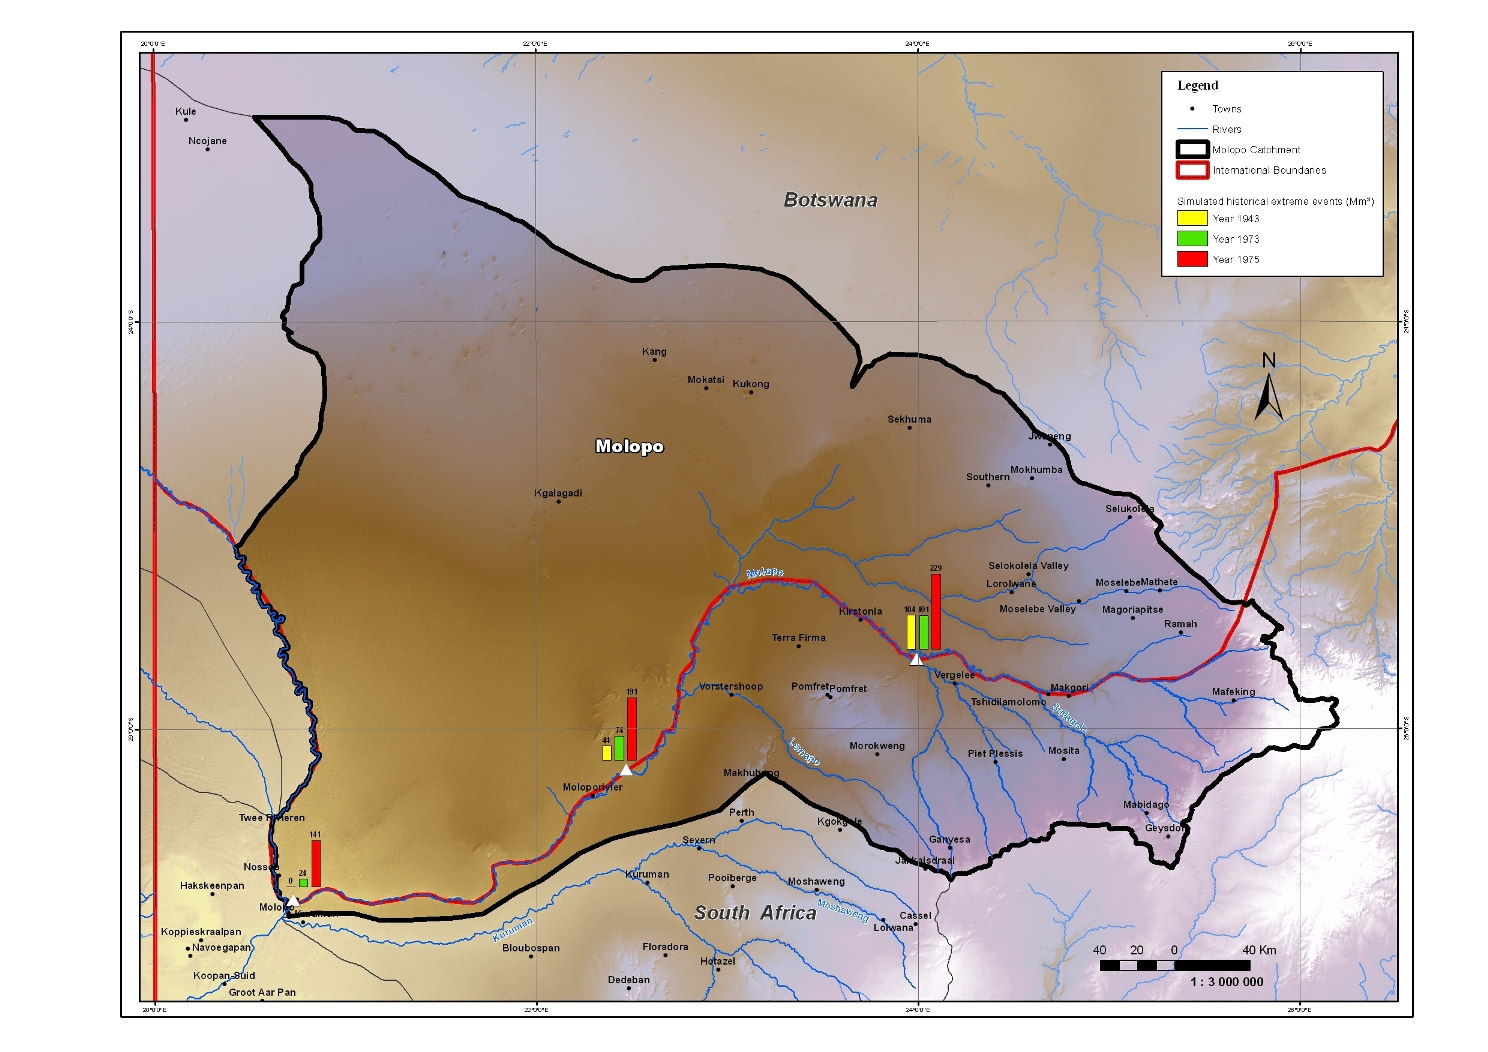
Molopo Nossob Feasibility Study - Main Report
Figure 6.1: Simulated extreme historical runoff events
23 July 2009
6- 1
Molopo Nossob Feasibility Study - Main Report
During discussions with the stakeholders from Botswana, a concern was voiced that
the construction of the dams in the catchment of the Upper Molopo River has
reduced the occurrence of floods reaching the lower reaches of the river, and that
this has reduced the recharge of the aquifers along the river. In order to investigate
this, the volume of the floods was calculated, and taking into account the river losses,
to determine how far down the river the flows would reach. This exercise was done
for a no-dam (natural) scenario (Table 6.2), as well as a with-dam scenario (Table
6.3).
Table 6-2: Design storm runoff volumes in the Molopo River (Mm3): Natural conditions
Subcatchment
Return Period (a)
100
50
20
10
5
2
Upper Molopo
Incremental Runoff
492
406
283
223
160
105
(250 km)
Losses
120
120
120
120
120
120
Runoff Balance
372
286
163
103
40
0
Middle Molopo
Incremental Runoff
127
105
73
58
41
27
(265 km)
Total Runoff
499
390
236
161
81
12
Losses
135
135
135
135
135
135
Runoff Balance
364
255
100
26
0
0
Lower Molopo
Incremental Runoff
0
0
0
0
0
0
(270 km)
Total Runoff
364
255
100
26
0
0
Losses
100
100
100
100
100
100
(Nossob
confluence)
Runoff Balance
264
155
0
0
0
0
Table 6-3: Present day conditions (Mm3) (assuming maximum interception of floods
by major and farm dams)
Subcatchment
Return Period (a)
100
50
20
10
5
2
Upper Molopo
Incremental Runoff
492
406
283
223
160
105
Losses
120
120
120
120
120
120
Interception by Dams 63
63
63
63
63
63
Runoff Balance
309
223
100
40
0
0
Middle Molopo
Incremental Runoff
127
105
73
58
41
27
Total Runoff
436
327
173
98
18
0
Losses
135
135
135
135
135
135
Runoff Balance
301
192
38
0
0
0
Lower Molopo
Incremental Runoff
0
0
0
0
0
0
Total Runoff
301
192
38
0
0
0
Losses
100
100
100
100
100
100
(Nossob
Runoff Balance
201
92
0
0
0
0
23 July 2009
6- 1
Molopo Nossob Feasibility Study Ł Main Report
confluence)
The construction of the dams in the Upper Molopo River has resulted in a reduction
in the frequency of floods reaching the lower reaches of the river. The effect is a
reduction from 1 in 2 years to 1 in 5 years for the Upper Molopo, while for the Middle
and Lower Molopo it was from 1 in 5 to 1 in 10. It is unlikely that a recharge with a
frequency of more than two years will have a significant effect on the long term yield
of the aquifer, and it can safely be stated that the effect of the dam is limited to the
Upper Molopo, and that the effect further downstream is not significant.
At this point in time it is not possible to quantify the effect of the dams on the yield of
the aquifer along the Upper Molopo River, and exactly how far down the river the
effect lasts. A rough estimate is that the effect stretches for about 50 km downstream
of the dams, and that the reduction in groundwater yield is about 5 Mm3/a. This will
be spread evenly along the river, along both sides.
A rainfall trend analysis was conducted, and no statistical significant trend was
observed based on the available rainfall data in the catchment.
___________________________________________________________________________________________________________________________________
February 2009
6-2
Molopo Nossob Feasibility Study - Main Report
7.
DISCUSSION
Hydrological modelling has been undertaken to provide first order estimates of typical
surface water runoff volumes in the main rivers in the Molopo-Nossob catchment.
The modelling was done by means of the Pitman rainfall-runoff model, local observed
rainfall records and current land use information. Estimates of natural and present
day surface water runoff have been calibrated based on observed flow records where
available as well as on historical records of floods in the Molopo-Nossob catchment.
The modelling results have shown that the total natural runoff from the Molopo-
Nossob catchment, without any channel losses, equals 164 Mm3/a. However, once
losses are taken into account, the total cumulative runoff for each of the main
subcatchments reduces to zero, except in the case of the Kuruman catchment where
the average net outflow equals 4.1 Mm3/a under natural conditions and 4.0 Mm3/a
under present day conditions
First order estimates of typical gross storage-yield characteristics for the upper parts
of the Molopo, Kuruman and Nossob catchments have shown that significant storage
is required to provide yield at an acceptable level of assurance. An assessment of
the central parts of the Molopo-Nossob catchment, situated within the drier, central
Kalahari Desert, has indicated that it is not feasible for dams to be constructed in this
area due to the lack of reliable runoff.
The Molopo-Nossob system does not function in the same way as more conventional
rivers, where groundwater discharge provides a baseflow during dry conditions. In
the case of the Molopo-Nossob system, the occasional floods are totally absorbed
along the river bed and recharge the ground water aquifers along the course of the
river. From the investigation it is clear that surplus water is only generated at a
recurrence interval of less than 20 years. For the rest of the time, floods are entirely
absorbed as ground water recharge along the course of the river.
As the water along the course of the river is needed for small communities and stock
watering, there is little sense in building storage dams. It is far more financially and
economically viable to abstract the water from boreholes and wells at the point of
use, as this will not only cut out the evaporation losses from the surface of a
reservoir, but also the necessity of an expensive distribution network.
23 July 2009
7- 1
Molopo Nossob Feasibility Study Ł Main Report
The construction of the dams in the Upper Molopo River has resulted in a reduction
in the frequency of floods reaching the lower reaches of the river. The effect
stretches for about 50 km downstream of the dams in the Upper Molopo, and the
reduction in ground water is estimated at 5 Mm3/a.
___________________________________________________________________________________________________________________________________
February 2009
7-2
Molopo Nossob Feasibility Study - Main Report
8.
CONCLUSIONS AND RECOMMENDATIONS
The study has conclusively shown that there is no surplus water in the Molopo-
Nossob catchment that can be economically exploited. It was also shown that the
occasional floods serve to recharge the ground water aquifers along the river course,
and that any storage that is created will therefore reduce the availability of ground
water along the course of the river.
It is therefore recommended that no further surface water development in the form of
dams is considered in the study area, and that the development of ground water
sources is investigated in more detail.
However, the development of ground water should be undertaken with some caution,
as making more water available may lead to overgrazing and the destruction of the
natural vegetation, especially where subsistence farming is practised.
23 July 2009
8- 1
Molopo Nossob Feasibility Study - Main Report
9.
LITERATURE CONSULTED
Adamson, PT. 1981. Southern African Storm Rainfall. Dept of Environment Affairs, TR 102
Alexander, WJR. 1990. Flood Hydrology for southern Africa
Alexander W J R., Bailey F, Bredenkamp D. B., van der Merwe A and Willemse N (2008).
Linkages between solar activity, climate predictability and water resource development.
SAICE Journal, South Africa.
Botswana National Water Master Plan (2006). Final Report Volume 4 Ł Hydrogeology, by
SMEC in association with EHES.
Botha L.J. (1995) Louwna-Coetzerdam : Re-evaluation of the groundwater potential.
Technical report GH 3860, Department of Water Affairs and Forestry.
Bredenkamp D B. ( 2000) Groundwater monitoring: A critical evaluation of groundwater
monitoring in water resources evaluation and management. WRC project
Bredenkamp D.B. (2007) Use of natural isotopes and groundwater quality for improved
recharge and flow estimates in dolomitc aquifers. Water SA
Bredenkamp D.B. Vogel JC, Wiegmans FE, Xu Y and Van Rensburg HJ (2007) Use of
natural isotopes and groundwater quality for improved estimations of recharge and flow in
dolomitc aquifers. WRC report No. KV 177/07.
Bredenkamp D.B. (2009) A conceptual model towards verification of the impact of planetary
interactions on the earth's climate fluctuations. Submitted for publication in Water SA
2009 (Water Research Commission of South Africa)
Central Statistics Offices, 1972. Report of the Population Census. Government Printer.
Gaborone.
Central Statistics Office, 1981. 1981 Population and Housing Census; Guide to the Villages
and Towns of Botswana. Government Printer. Gaborone.
Central Statistics Office, 1991. Population of Towns, Villages and Associated Localities.
Government Printer. Gaborone.
Central Statistics Office, 2001. Population of Towns, Villages and Associated Localities.
Government Printer. Gaborone.
City of Cape Town, 2002. Integrated Water Resource Planning Study. Water Efficient
Fittings, Automatic Flushing Urinals, Grey-water and Private Boreholes and Wellpoints.
Delali B.K. Dovie, Charlie M. Shackleton and E.T.F. Witkowski: Valuation of communal area
livestock benefits, rural livelihoods and related policy issues.
Department of Water Affairs (2000) Ground water Monitoring, Final Report, Vol. 7 Ł Kanye
Wellfield Report by Geotechnical Consulting Services (Pty) Ltd.
Department of Water Affairs (2000) Ground water Monitoring, Final Report, Vol. 23 Ł
Tsabong Wellfield Report by Geotechnical Consulting Services (Pty) Ltd.
23 July 2009
9- 1
Molopo Nossob Feasibility Study Ł Main Report
Department of Water Affairs (2000) Ground water Monitoring, Final Report, Vol. 24 Ł District
Council Wellfields Ł Bonwapitse, Shoshong, Chadibe, Sefhare, Lecheng, Lerela, and
Sedibenh Wellfields by Geotechnical Consulting Services (Pty) Ltd.
Department of Water Affairs (2003) Tsabong Ground water Investigation, Assessment and
Development, Final Report, by Resources Services (Pty) Ltd.
Department of Water Affairs (2006) Kanye Emergency Water Supply Project, Final Report,
Vol. 1 by Geotechnical Consulting Services (Pty) Ltd.
Department of Water Affairs (2007) Rural Village Water Supply Programme (2003/2004).
Ground water Investigations in Good hope Sub-district for Motsentshe, Phitshane-Molopo &
Tshidilamolomo Villages, Draft Final Report, by Geoflux (Pty) Ltd.
Department of Water Affairs (2008) Matsheng Ground water Development Project, Draft
Final Report, by Water Resources Consultants (Pty) Ltd.
Department of Water Affairs and Forestry (2000) 1:500 00 Hydrogeological Map Series of the
Republic of South Africa, Sheet 2522, Vryburg.
Department of Water Affairs and Forestry (2001) 1:500 00 Hydrogeological Map Series of the
Republic of South Africa, Sheet 2714, Upington/Alexander Bay.
Department of Water Affairs and Forestry (South Africa), 2002. Water Resource Situation
Assessment Study, Crocodile West and Marico Water Management Area, Volume 1. DWAF
Report No. P03000/00/0301.
Department of Water Affairs and Forestry (South Africa), 2002. Water Resource Situation
Assessment Study, Lower Vaal Water Management Area. DWAF Report No.
P10000/00/0301.
Department of Water Affairs and Forestry (South Africa), 2002. Water Resource Situation
Assessment Study, Lower Orange Water Management Area, Main Report. DWAF Report
No.14000/00/0101.
Department of Water Affairs and Forestry (South Africa), 2004. Internal Strategic
Perspective, Crocodile West and Marico Water Management Area. DWAF Report No. P
WMA 03/000/00/0303.
Department of Water Affairs and Forestry (South Africa), 2004. Internal Strategic
Perspective, Lower Vaal Water Management Area. DWAF Report No. P WMA
10/000/00/0203.
Department of Water Affairs and Forestry (South Africa), 2004. Internal Strategic
Perspective, Lower Orange Water Management Area. DWAF Report No. P WMA
14/000/00/0203.
Department of Water Affairs and Forestry (South Africa), http://www.dwaf.gov.za/hydrology/
Department of Water Affairs (Republic of Namibia), 1991. Optimal Operating Rules for the
Eastern Dams. Report No. 11/9/2.
Department of Water Affairs and Forestry (2002) 1:500 00 Hydrogeological Map Series of the
Republic of South Africa, Sheet 2419, Nossob.
___________________________________________________________________________________________________________________________________
February 2009
9-2
Molopo Nossob Feasibility Study Ł Main Report
Department of Water Affairs and Forestry (2003) 1:500 00 Hydrogeological Map Series of the
Republic of South Africa, Sheet 2722, Kimberly.
Department of Water Affairs and Forestry, 2003. Lower Vaal Water Management Area:
Overview of Water Resources Availability, November 2003.
Department of Water Affairs and Forestry, 2003. Crocodile (West) and Marico Water
Management Area. Overview of Water Resources Availabilty and Utilisation. DWAF Report
No. P/WMA/03/000/00/0203. September 2003.
DGS (1994) Ground water Potential Survey Middlepits / Makopong TGLP Areas. Final
Report Volume I Text, Volume II Inventory of Boreholes, Volume III A Project Boreholes, by
Water Surveys (Botswana)
DGS, (2002) Bokspits TGLP Area Ground water Potential Survey. Final Report. By Geoflux
(Pty) Ltd.
DGS, (2003). Werda Ł Mabutsane - Sekoma TGLP Ground water Survey. Final Report, by
Wellfield Consulting Services (Pty) Ltd.
Dube, A. 2008. Mafikeng Municipality. Personal Communication
Dziembowski Z M and Wessels M J.(1979). Preliminary report Gh 3149, Department of
Water Affairs and Forestry .South Africa.
Dziembowski Z M and Appelcryn D T, (1987). Kalahari oos (Soutblok oos area)
Grondwaterbronne, Distrik Kuruman, Technical report Gh 3531, Department of Water
Affairs, Pretoria South Africa.
Gawie van Dyk and Sagadevan Kisten (2006) An Explanation of the 1:500,000 General
Hydrogeological Map Vryburg 2522.
Gombar L. (1974) Hydrogeology in the vicinity of farm Pomfret, Vryburg District. Technical
Report 2910, Directorate Geohydrology, Department of Water Affairs
Greg Christelis and Wilhelm Struckmeier (2001) Ground water in Namibia an explanation to the
Hydrogeological Map.
HRU. 1972. Design flood determination in South Africa. Hydrological Research Unit,
Department of Civil Engineering, University of the Witwatersrand, HRU Report No 1/72.
Internet Sites:
(www.saexplorer.co.za). (http://(www.saexplorer.co.za)/general/town.asp)
State of environmental report, 2002, NW province, S.A (www.nwpg.gov.za).
http://www.siyanda-dm.co.za/data/idp2004/2.html
www.fao.org/docrep/oo6/10628e/j0628e46.htm.
www.environment.gov.za/soer/ncape/sammary.htm
www.npc.gov.na/census/region/indicator.htm
J. Mwenge Kahinda, E.S.B. Lillie, A.E. Taigbenu, R.J. Boroto, 2007. Hydrological Impact of
Rural Domestic Rainwater Harvesting in South Africa: A Broad Assessment. SANCIAHS
Paper, 13th SANCIAHS Symposium, 6&7 September, Cape Town.
___________________________________________________________________________________________________________________________________
February 2009
9-3
Molopo Nossob Feasibility Study Ł Main Report
JICP (2202) The Study on the Ground water Potential Evaluation and Management Plan in the
Southeast Kalahari (Stampriet) Artesian Basin in the Republic of Namibia, Final Report, by
Pacific Consultants International in association with Sanyu Consultants INC.
Kgalagadi District Council, 1989. Kgalagadi District Development Plan 4 1989-1995.
Government Printer. Gaborone.
Kgalagadi District Council, 2003. Kgalagadi District Development Plan 6 2003-2005.
Government Printer. Gaborone.
Kirchner J and Tredoux G. (1975) The Stampriet artesian basin with special reference to the
salt-block.
M.Mahabile; M. Lyne and A. Panin. Agrikon, Vol 41, No 4 (December 2002): Factors
Affection the Productivity of Communal and Private Livestock Farmers in Southern
Botswana: A Descriptive Analysis of Sample Survey Results.
Meyer E I .(1953) `n Geologiese en geofisiese opname van die Kalahari langs die Molopo-
en Kuruman rivieere in die Gordonia- en Kuruman distrikte, met spesiale verwysing nad
ondergrondse water.Verslag 12/2/203, Geologiese Opname , SA Pretoria.
Midgley DC, Pitman WV, Middleton, BJ. Surface Water Resources of South Africa 1990.
WRC Report No. 298/3.1/94. 1994
Mulder M P (1978) Summary of geohydrological informationalong the Molopo River from
Werda to Koopan North (Bokputs). Technical report Gh 3017, Department of Water Affiairs,
Directorate Geohydrology.
Nijsten G,J. and Beekman H.E. (1997) Groundwater flow study in the Llethlakeng-
Botlhapatlou area Gress II Technical report : Groundwater recharge and resources in the
Botswana Kalahari.
ORASECOM (2007) Orange River Integrated Water Resources Management Plan, Review of
Ground water Resources in the Orange River Catchment, by WRP (Pty) Ltd., Jeffares Green
Parkman Consultants (Pty) Ltd., Sechaba Consultants, Water Surveys (Botswana) and
Windhoek Consulting Engineers in association.
ORASECOM (2007) Orange River Integrated Water Resources Management Plan, Water
Quality in the Orange River, by WRP (Pty) Ltd., Jeffares Green Parkman Consultants (Pty) Ltd.,
Sechaba Consultants, Water Surveys (Botswana) and Windhoek Consulting Engineers in
association.
ORASECOM (2008) Feasibility Study of the Potential for Sustainable Water Resources
Development in the Molopo Ł Nossob Water Course, Inception Report, by ILISO Consulting
(Pty) Ltd.
Smit, PJ, (1964). Nasionale Gemsbokpark: Geohidrologiese aspekte. Report , Geological
Survey, Department of Mines , Pretoria, South Africa
Smit, PJ, (1977). Die Geohidrologie in the opvanggebied van die Moloporivier in the
Noordelike Kalahari. PhD Thesis, University Free State
Van Wyk E.and Appelcryn (1989). Grondwater ondersoek Area1, Springbok Berrange Distrik
Kuruman.Department of Water Affairs and Forestry.
___________________________________________________________________________________________________________________________________
February 2009
9-4
Molopo Nossob Feasibility Study Ł Main Report
Smit, PJ, (1978). Grooundwater recharge in the dolomite of the Ghaap Plato near Kuruman
in the Northern Cape, Republic of South Africa.. Water SA vol4, No. 2, April 1978.
Smithers and Shulze, 2002. Design Rainfall and Flood Estimation in South Africa, WRC
Report No K5/1060
Snowy Mountains Engineering Corporation International (SMEC) (Pty) Ltd in association
with Engineering Hydrological and Environmental Services (EHES) (Pty) Ltd, 2006. National
Master Plan Review.
Southern District Council, 1986. Southern District Development Plan 3 1986-1989.
Government Printer. Gaborone.
Southern District Council, 1989. Southern District Development Plan 4 1989-1995.
Government Printer. Gaborone.
Southern District Council, 2003. Southern District Development Plan 6 2003-2005.
Government Printer. Gaborone.
Van Dyk G. (2006). Managing of the Irrigation on the Tosca-Molopo Groundwater Resource.
MSc Thesis . University of the Free State , Department of Geohydroloy, Bloemfontein
Van Dyk G and van Kisten S. (2006). An explanation of the 1: 500 000 General
hydorgeological map ( Vryburg 2522), Department of Water Affairs and Forestry.
Van Rensburg H Janse (Private communications)
Van Wyk E (1992). Watervoorsiening vir Middelputs, SAP Terrein, Distrik Kuruman.
Verhagen B T(1977) Geohydrological studies in the Gamagara Compartment using
Environmental Isotopes and complementary techniques. Third annual report, Nuclear
Physics Research Unit, University of the Witwatersrand, Johannesburg.
Wiegman F.E, ( Private communications) ( VSA Group).
___________________________________________________________________________________________________________________________________
February 2009
9-5