

Report No. ORASECOM/005/2009
ORASECOM
GROUNDWATER REVIEW OF THE MOLOPO-NOSSOB
BASIN FOR RURAL COMMUNITIES INCLUDING
ASSESSMENT OF NATIONAL DATABASES AT THE SUB-
BASIN LEVEL FOR POSSIBLE FUTURE INTEGRATION
FINAL REPORT
July 2009
In association with
GEOTECHNICAL CONSULTING SERVICES (PTY) LTD
CONTINENTAL CONSULTANTS (PTY) LTD
Plot No. 61687, Unit 2, Broadhurst Industrial,
Plot No. 20630, Broadhurst Industrial,
P.O.Box:201675, Gaborone, Botswana
P.O.Box:45560, Gaborone, Botswana
Te
Tel: 00267 316 5820
l/Fax: 00267 313 2967; email Ł gcs@info.bw
Report No. ORASECOM/005/2009
Title:
Final Report
Authors:
Dr Leif Carlsson with inputs from, Mrs Constance Masalila-
Dodo, Dr R Bejugam, Mr L Sola, Dr B F Alemaw, Mr
I.Mahomed, and Mr G.Madec
Project Name:
Groundwater Review of the Molopo-Nossob Basin for Rural
Communities including Assessment of National Databases at
the Sub-basin Level for Possible Future Integration
Status of report:
Final
Date:
July 2009
Keywords:
Molopo River, Nossob River, Groundwater Resources
______________________________________________________________________
Geotechnical Consulting Services (Pty) Ltd
Approved for and on behalf of Geotechnical Consulting Services (Pty) Ltd
by
...............................................
.......................................
Dr Ravinder Bejugam
Date
Director: Geotechnical Consulting Services (Pty) Ltd
ORANGE SENQU RIVER COMMISSION
Approved on behalf of ORESECOM by
...............................................
......................................................
Mr Lenka Thamae
Date
Executive Secretary Ł ORASECOM
Groundwater Review of the Molopo-Nossob Basin
Report No. ORASECOM/005/2009
Groundwater Review of the Molopo-Nossob Basin for Rural Communities
including Assessment of National Databases at the Sub-basin Level for
Possible Future Integration
Executive Summary
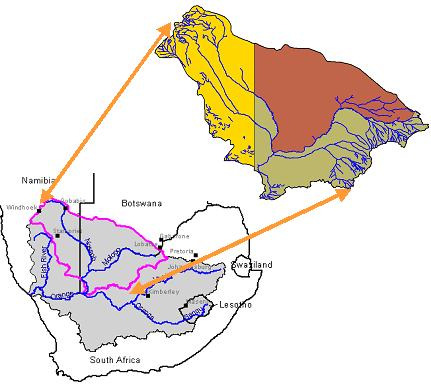
The Molopo River is an ephemeral tributary of the Orange Ł Senqu River system, an
international river basin shared by Lesotho, Namibia, Botswana and South Africa. The
Orange-Senqu River Commission (ORASECOM) is established to advise the parties on water
related issues. The size of the Molopo-Nossob Basin is approximately one and a half times
the size of Great Britain, 12 times the size of Lesotho or almost equal to the size of Japan.
The main objective of the project was to evaluate the groundwater resources of the Molopo-
Nossob Basin based on an exhaustive analysis of the available data and information. This
included a thorough analysis of the data/databases in each of the basin states in order to
make recommendations on how data can best be shared between the basin states and
integrated in a common database.
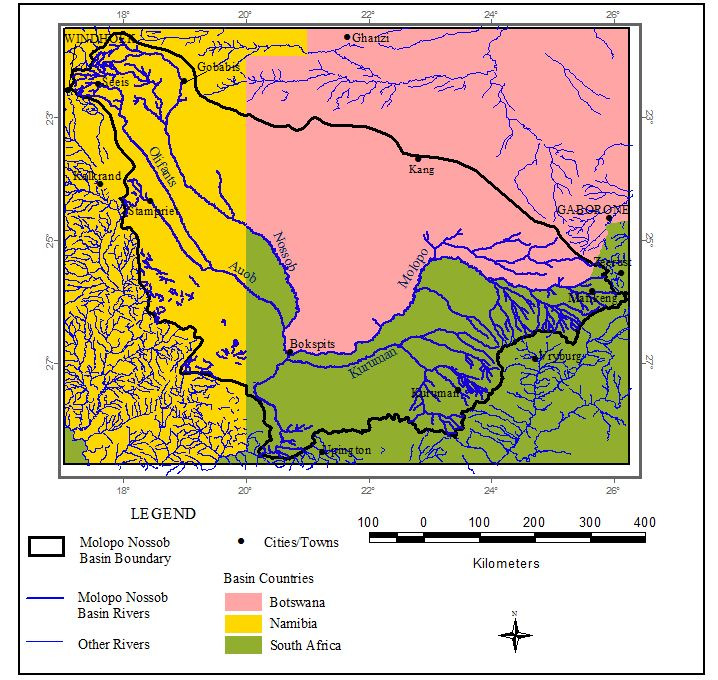
The Molopo-Nossob Basin covers an area of 367,201 km2delineated from the surface water
catchment. Of the basin, Botswana covers 37%, Namibia 33% and South Africa 30%. The
basin contains the catchment areas of four main rivers; Molopo, Kuruman, Nossob and Auob
Rivers.
The long term average annual precipitation varies from 100 mm/a in the south-western part
of the basin to over 500 mm/a in the eastern part in South Africa, and 400 mm/a in the
northern part in Namibia. Evaporation and potential evapotranspiration highly exceed the
average rainfall. According to UNEP classification, the whole basin is arid to semi-arid.
The population in the Molopo-Nossob Basin is about one million, and the livestock units
(ELSU) are about 1.6 million including wildlife. The population per km2 varies from 0.2 in
Kgalagadi North District in Botswana to 62 for the Upper Molopo catchment area
(Mmabatho area in South Africa) and an average for the basin the population density is 2.7
persons per km2. The ELSU density is almost similar in the three countries (4.2 to 4.6 ELSU
per km2).
The water requirement in the Molopo-Nossob Basin is referred to domestic, livestock,
irrigation and mining users. The total requirement is 128 Mm3/a (2000). Of this 69% is
required in South Africa, 18% in Namibia and 13% in Botswana. About 37% of the water
requirement goes to livestock watering, 27% to domestic purposes, 27% to irrigation and 9%
to industry (mining). Only 0.1% is for tourism.
Development which requires a major quantity of water is foreseen in the Botswana part of
the Basin where plans for irrigation developments will require about 6.2 Mm3/a of water
from the year 2015. Other major water consuming developments are for the mining industry
in South Africa together with plans for increased irrigation. The future water requirements
for the three countries will increase by the year 2015 to about 160 Mm3/a. On the average
an annual increase in the water requirement for the Molopo-Nossob Basin is about 1.5%.
Geotechnical Consulting Services
I
Groundwater Review of the Molopo-Nossob Basin
Report No. ORASECOM/005/2009
The geology of the basin covers geological formations from the Archean to Recent, a time
span of more than 2,500 million years. The formations host a variety of aquifers;
intergranular, fractured intergranular, fractured and karstic aquifers.
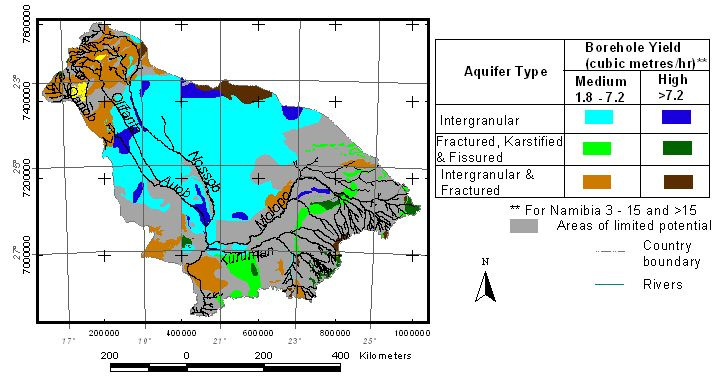
The potential of the aquifer is assessed from the mean borehole yields displayed on
hydrogeological maps over the Namibian and the South African part of the basin. Three
classes of potential are recognized; high, medium and low potential. For Botswana the
potential is based on regional groundwater maps combined with results from groundwater
investigation in local areas in the basin.
The Kalahari Beds contains locally groundwater. "Saturated" Kalahari Beds are found in
the Gemsbok National park and the continuation into the Namibian part of the basin
following the river Nossob and Auob up to Stampriet and Aminuis. Large areas are also
found along the Upper Molopo River Course, in Gordonia and in the central part of
Botswana. Beside these larger areas, "perched aquifers" occur locally in the Kalahari Beds.
-22░S
Saturated Kalahari Beds
-23░S
Aminuis
Kang
-24░S
Stampriet
200
Gochas
-25░S
180
160
140
-26░S
120
100
Bokspits
-27░S
80
60
40
Saturated
-28░S
thickness
20
m
0
Kalahari Beds limit
17░E
18░E
19░E
20░E
21░E
22░E
23░E
24░E
25░E
26░E
Geotechnical Consulting Services
II
Groundwater Review of the Molopo-Nossob Basin
Report No. ORASECOM/005/2009
The largest aquifers in the basin are the fractured intergranular Ecca aquifer (the Auob
aquifer) and the intergranular Kalahari Bed aquifer. These two aquifers interact in areas
where they are in contact with each other. Multiple aquifers occur in areas in Namibia and
Botswana where a deep layer of sandstone (Nossob sandstone) is found below the Ecca
aquifer and interlayered low permeable formations. The extensive Ecca aquifer of Karoo
Supergroup (combined with the Kalahari Bed) is classified as a medium potential aquifer, but
it includes many areas assessed as high potential aquifers. In the Karoo Supergroup a high
potential Ntane Sandstone aquifer is also found above the Ecca aquifer in the northern
Botswana.
The aquifers with the highest potential in karst environment are found in the dolomitic
formations in South Africa and Botswana. These formations are also host areas currently
classified as medium potential aquifers.
The crystalline bedrock is classified as low potential aquifers. These formations are found in
the northern part of Namibia and in eastern Botswana and large part of South Africa.
Groundwater is available but limited to the occurrence in fractures and fissures. Where
fractures form pronounced and extensive zones, good yielding local aquifers are
encountered.
The quality of the groundwater varies within the basin. Guidelines for domestic use and for
livestock watering regarding the content of Total Dissolved Solids (TDS), nitrate (NO3) and
fluoride (F) are similar in the three countries. Maps are constructed to show the areas in
which the guideline values are met or exceed.
-22░S
Areas with water exceeding
-22░S
Areas with water exceeding
quality guidelines
Gobabis
Windhoek
quality guidelines
for human consumption
for livestock watering
-23░S
-23░S
Ncojane
Aminuis
Kang
Hukuntsi
-24░S
-24░S
Stampriet
Gochas
Gochas
-25░S
-25░S
Salt-
Werda
Goodhope
Block
Tosca
Mmabatho
area
Tsabong
-26░S
-26░S
Aroab Bokspits Vanzylsrus
-27░S
-27░S
Kuruman
-28░S
-28░S
17░E
18░E
19░E
20░E
21░E
22░E
23░E
24░E
25░E
26░E
17░E
18░E
19░E
20░E
21░E
22░E
23░E
24░E
25░E
26░E
NO3 > 45 mg/l
F >1,5 mg/l
TDS > 2,000 mg/l
NO3 > 180 mg/l
F >4 mg/l
TDS > 10,000 mg/l
The larger part of Botswana has groundwater quality exceeding the guidelines for human
consumption. In Namibia, the groundwater quality is poor along the Auob River downstream
Gochas (the Salt-Block area). The area of poor water quality continues into South Africa
where almost the whole Gordonia experience water quality exceeding the guideline limits for
TDS and F. Areas of good water quality are found in the middle and northern part on
Namibia, central and eastern part of South Africa and easternmost and north-western part of
Botswana. Limited minor areas of high NO3 are found referring to local groundwater
pollution.
Geotechnical Consulting Services
III
Groundwater Review of the Molopo-Nossob Basin
Report No. ORASECOM/005/2009
For livestock watering the areas of unfit groundwater are limited to central and southern
parts of Botswana, the Salt-Block area in Namibia and a minor part in the Gordonia area.
Monitoring of the groundwater level is done in more than 600 boreholes in the Molopo-
Nossob Basin. The majority of monitoring boreholes are close to abstraction boreholes or in
wellfield areas. Monitoring is done on various time intervals and using different methods.
The use of automatic monitoring devices has increased which has resulted in improved
continuity of the records.
-22░S
Regional groundwater level map
-23░S
Kang
-24░S
1850
Stampriet
1800
1750
-25░S
1700
1650
1600
1550
1500
1450
-26░S
1400
1350
1300
1250
1200
1150
-27░S
1100
1050
Bokspits
1000
950
900
Groundwater
850
-28░S
800
level
750
700
m.a.m.s.l.
650
17░E
18░E
19░E
20░E
21░E
22░E
23░E
24░E
25░E
26░E
Groundwater level data stored in the borehole archives in all the three countries, together
over 34,000 boreholes, forms the background information for a regional groundwater level
map over the Molopo-Nossob Basin. The map shows that the highest groundwater levels
(1,750 mamsl) are in the northern Namibian part of the basin. From there the groundwater
flow is directed southeast into Botswana and South Africa and from there towards the south
and out from the basin through the area along the southern part of the Molopo River (750
mamsl). High groundwater level is also encountered in the south-eastern South African part
of the basin (1,450 mamsl).
The groundwater divide in northern Botswana does not follow the surface water divide as it
is illustrated on Botswana water maps. That makes in fact the Molopo-Nossob Basin smaller
than derived from the surface water divide.
The Chloride Mass Balance method was used to assess the groundwater recharge from the
rainfall. This method shows that large areas of the basin receive less than 1 mm/a recharge
as a long term average. Recharge of more than 10 mm/a is assessed for the northern part and
for the area northwest of Stampriet and Aminuis in Namibia and south-eastern part
(Mmabatho) and the Kuruman area in South Africa.
Extreme low recharge (< 0.1 mm/a as an average annual value) is assessed for the central
part of Botswana close to the Gemsbok National park, an area northeast of Bokspits and for
the central part of Gordonia in South Africa. In Botswana recharge of more than 2 mm/a is
found for the north-western and the south-eastern parts.
Geotechnical Consulting Services
IV
Groundwater Review of the Molopo-Nossob Basin
Report No. ORASECOM/005/2009
-22░S
Groundwater Recharge in mm/a
assessed using
the Chloride Mass Balance Method
-23░S
Aminuis
Kang
-24░S
Stampriet
Gochas
20
-25░S
10
-26░S
5
2
Bokspits
-27░S
1
0.5
Recharge
-28░S
mm/a
0.1
17░E
18░E
19░E
20░E
21░E
22░E
23░E
24░E
25░E
26░E
The hydrogeological regime of the Molopo-Nossob Basin is complex with many types of
geological formation and hence of groundwater resources (aquifers). A qualitative indicative
assessment approach was taken by combining various data sets and knowledge collected to
delimit areas where the already described water quality guidelines are not satisfied together
with recharge estimated at a minimum 0.2 mm/a to produce two new set of maps as part of
the groundwater resource evaluation..
-22░S
Human Consumption
-22░S
Gobabis
Gobabis
Livestock Watering
Windhoek
Windhoek
-23░S
Ncojane
-23░S
Ncojane
Aminuis
Kang
Aminuis
Kang
Hukuntsi
Hukuntsi
-24░S
-24░S
Stampriet
Stampriet
Gochas
Gochas
-25░S
Werda
-25░S
Werda
4
Goodhope
Goodhope
Tosca
Mmabatho
Tosca
Mmabatho
Tsabong
3
Tsabong
-26░S
-26░S
3
Aroab
Bokspits
Vanzylsrus
Aroab
Bokspits
Vanzylsrus
-27░S
-27░S
2
2
Kuruman
Kuruman
-28░S
-28░S
1
1
17░E
18░E
19░E
20░E
21░E
22░E
23░E
24░E
25░E
26░E
17░E
18░E
19░E
20░E
21░E
22░E
23░E
24░E
25░E
26░E
Integrated GIS based Basin Information System is based on the availability and level of
information differs between the countries. There is a need to share data between countries in
order to best understand the groundwater situation and for optimum planning, resource
development and sustainable management. The integration of both databases and the
exchange facilities requires that information systems within the countries are compatible.
A proposal to facilitate the exchange of data as well as possible integration will be a GIS
data storage and management system. The system should have capabilities to be used as an
information centre for the basin in order to provide rapid responses to groundwater
evaluation and modeling of the sub-basin and facility for dissemination and exchange of data
within the states.
Geotechnical Consulting Services
V
Groundwater Review of the Molopo-Nossob Basin
Report No. ORASECOM/005/2009
It is recommended that the database be developed in Microsoft SQL Server technology.
It is recommended that monitoring of groundwater; both quality and level should be
continued and extended to include areas which are remote and not affected by human
development.
It is further recommended that more than the currently used chloride mass method for
recharge assessment should be applied in the basin. The current assessment of recharge
should also be assessed in comparison with the general flow of groundwater in the basin
through mathematical modeling.
The use of the concept of Groundwater Harvest Potential introduced in South Africa should
be extended and map produced also for Namibia and Botswana, especially for areas of low
groundwater recharge.
Large parts of the basin has water unfit for human consumption and for livestock watering.
Water treatment options exist and could be applied for private and communal use. The
current and future use of such treatment option should be addressed.
Geotechnical Consulting Services
VI
Groundwater Review of the Molopo-Nossob Basin
Report No. ORASECOM/005/2009
Groundwater Review of the Molopo-Nossob Basin for Rural Communities
including Assessment of National Databases at the Sub-basin Level for
Possible Future Integration
FINAL REPORT
TABLE OF CONTENTS
1
INTRODUCTION .......................................................................................................................... 1
1.1
Background ............................................................................................................................. 1
1.2
Purpose of the Study ............................................................................................................... 2
1.3
Purpose of this Report ............................................................................................................. 2
1.4
Structure of this Report ........................................................................................................... 2
2
DESCRIPTION OF THE MOLOPO-NOSSOB BASIN ................................................................ 3
2.1
Main Catchment areas ............................................................................................................. 3
2.2
Relief and drainage ................................................................................................................. 5
2.3
Administrative Units ............................................................................................................... 5
2.4
Climate .................................................................................................................................... 7
2.4.1
Climate data considered .................................................................................................. 7
2.4.2
Precipitation .................................................................................................................... 8
2.4.3
Temperature .................................................................................................................. 10
2.4.4
Humidity ....................................................................................................................... 11
2.4.5
Solar radiation and sunshine hours ............................................................................... 13
2.4.6
Evaporation and Evapotranspiration ............................................................................. 14
2.4.7
Rainfall and ETo at selected stations ............................................................................ 16
2.4.8
Aridity Index ................................................................................................................. 16
2.4.9
Droughts ........................................................................................................................ 18
2.5
Main Rivers ........................................................................................................................... 21
2.5.1
Auob River .................................................................................................................... 21
2.5.2
Nossob River ................................................................................................................. 24
2.5.3
Molopo River ................................................................................................................ 25
2.5.4
Kuruman River .............................................................................................................. 26
2.6
Dams ..................................................................................................................................... 26
2.7
Transfer Systems ................................................................................................................... 27
2.8
Pans ....................................................................................................................................... 28
3
WATER REQUIREMENT ........................................................................................................... 30
3.1
Users ..................................................................................................................................... 30
3.2
Botswana ............................................................................................................................... 30
3.3
Namibia ................................................................................................................................. 36
3.4
South Africa .......................................................................................................................... 45
3.4.1
Water management Areas ............................................................................................. 45
3.4.2
Upper Molopo ............................................................................................................... 46
3.4.3
Middle Molopo ............................................................................................................. 47
3.4.4
Lower Molopo .............................................................................................................. 49
Geotechnical Consulting Services
i
Groundwater Review of the Molopo-Nossob Basin
Report No. ORASECOM/005/2009
3.4.5
Summary for Molopo-Nossob Basin in South Africa ................................................... 51
3.5
Summary for Molopo-Nossob Basin .................................................................................... 56
4
DEVELOPMENT ACTIVITIES .................................................................................................. 61
4.1
Introduction ........................................................................................................................... 61
4.2
Current Development Activities ........................................................................................... 61
4.2.1
Botswana ....................................................................................................................... 61
4.2.2
Namibia ......................................................................................................................... 62
4.2.3
South Africa .................................................................................................................. 64
4.3
Development Activities in the Districts ................................................................................ 64
4.3.1
Agriculture .................................................................................................................... 65
4.3.2
Mining ........................................................................................................................... 66
4.3.3
Tourism ......................................................................................................................... 67
4.4
Planned Development Activities ........................................................................................... 69
4.5
Future Water Requirement .................................................................................................... 70
5
GEOLOGY AND HYDROGEOLOGY ....................................................................................... 73
5.1
Geology ................................................................................................................................. 73
5.1.1
Background Information ............................................................................................... 73
5.1.2
Geological Map ............................................................................................................. 73
5.2
Hydrogeology ....................................................................................................................... 82
5.2.1
Aquifers ......................................................................................................................... 82
5.2.2
Groundwater Quality..................................................................................................... 90
5.2.3
Groundwater Monitoring and Flow ............................................................................ 111
5.2.4
Springs ........................................................................................................................ 134
5.2.5
Groundwater Replenishment ....................................................................................... 136
5.2.6
Groundwater Modeling ............................................................................................... 142
6
GROUNDWATER RESOURCES ............................................................................................. 158
6.1
Evaluation process .............................................................................................................. 158
6.2
Resources ............................................................................................................................ 161
7
INTEGRATED GIS BASED SUB-BASIN INFORMATION SYSTEM .................................. 165
7.1
Background ......................................................................................................................... 165
7.2
Elements in an integrated database system ......................................................................... 165
7.3
Existing databases ............................................................................................................... 166
7.3.1
Botswana ..................................................................................................................... 166
7.3.2
Namibia ....................................................................................................................... 167
7.3.3
South Africa ................................................................................................................ 170
7.4
Meta database ...................................................................................................................... 173
7.5
Proposal for storage and exchange of information ............................................................. 174
7.5.1
Separate databases....................................................................................................... 174
7.5.2
Data integration ........................................................................................................... 174
7.5.3
Requirements for developing basin information system ............................................. 176
8
LITERATURE REFERENCES .................................................................................................. 177
8.1
ENDNOTE Software .......................................................................................................... 177
8.2
Geographic and Administrative Description ....................................................................... 178
8.3
Climatic Information ........................................................................................................... 179
Geotechnical Consulting Services
ii
Groundwater Review of the Molopo-Nossob Basin
Report No. ORASECOM/005/2009
8.4
Hydrological Information ................................................................................................... 179
8.5
Groundwater Information ................................................................................................... 179
8.6
Water Requirements ............................................................................................................ 180
8.7
Future Plans and Developments .......................................................................................... 181
9
CONCLUSIONS AND RECOMMENDATIONS ..................................................................... 182
9.1
Conclusions ......................................................................................................................... 182
9.2
Recommendations ............................................................................................................... 185
10
REFERENCES ....................................................................................................................... 187
Geotechnical Consulting Services
iii
Groundwater Review of the Molopo-Nossob Basin
Report No. ORASECOM/005/2009
LIST OF TABLES
Table 2-1 Main sub-catchment areas within the Molopo-Nossob River Basin ................................... 3
Table 2-2 Administrative districts within the three riparian countries of the Molopo-Nossob basin .. 6
Table 2-3 Major districts and settlements in Namibia and South Africa part of Molopo-Nossob ....... 7
Table 2-4 Selected rainfall stations in Molopo-Nossob basin ............................................................. 8
Table 2-5 UNEP classification of various degrees of aridity based on their index of aridity (UNEP,
1992) .................................................................................................................................. 18
Table 2-6 SPI and corresponding cumulative probability ................................................................. 20
Table 2-7 Interpretation of SPI classes .............................................................................................. 21
Table 2-8 Dams within the Molopo-Nossob Basin............................................................................ 26
Table 2-9 Major water transfer schemes into and within the Molopo-Nossob Basin ........................ 28
Table 2-10 Details of Pans in the Molopo-Nossob Sub-basin ............................................................. 29
Table 3-1 Major towns and villages in the Molopo-Nossob Basin.................................................... 31
Table 3-2 Districts and sub-districts covered by the Molopo-Nossob basin in Botswana ................. 32
Table 3-3 Water requirements for the village (domestic water requirement) within the district of
Botswana in the Molopo-Nossob basin (DWA, 2006) ...................................................... 33
Table 3-4 Livestock Population by district and region in the Molopo-Nossob Basin 2002.
Equivalent Large Stock Units (ELSU) .............................................................................. 34
Table 3-5 Water requirement in Mm3/a for various livestock in the Districts in Botswana within the
Molopo-Nossob Basin. The requirements include wastage of water with 50% ................ 34
Table 3-6 Potential and planned irrigation in the Molopo-Nossob Basin in Botswana (NAMPAD,
2000) .................................................................................................................................. 35
Table 3-7 Estimated water requirement for the Molopo-Nossob basin in Botswana ........................ 35
Table 3-8 Sizes of basins in the Namibian part of the Molopo-Nossob Basin (MAWRD, 2000) ..... 36
Table 3-9 Estimated Population in the Molopo-Nossob Basin in Namibia (MAWRD, 2000,
ORASECOM, 2007b) ....................................................................................................... 37
Table 3-10 Water use and requirement in Auob River and Nossob River Basin2 in Namibia 1999,
2005 and 2015 (MAWRD, 2000) ...................................................................................... 38
Table 3-11 Water user and requirement (Mm3/a) in Molopo-Nossob Basin in Namibia 1999, 2005
and 2015 (MAWRD, 2000) ............................................................................................... 38
Table 3-12 Veterinary area codes and sizes in the Molopo-Nossob basin. Calculated water
requirement for livestock, based on numbers from 1999 (MAWF, 2006) ......................... 40
Table 3-13 Daily assumed water consumption of various animals and percentage water wastage
assumed (MAWRD, 2000) ................................................................................................ 41
Table 3-14 Number of livestock and water requirement in Auob River and Nossob River basins
(source: MAWF, 2006) ...................................................................................................... 42
Table 3-15 Nam Water Groundwater Schemes in the Molopo-Nossob basin (Nam Water, 2008,
ORASECOM, 2007a) ........................................................................................................ 44
Table 3-16 Dams within the Molopo-Nossob basin included in the Nam Water schemes .................. 44
Table 3-17 Quaternary regions (WMA) in the Molopo-Nossob basin in South Africa ....................... 45
Table 3-18 The division in three zones for assessment of the water requirement in the Molopo basin
in South Africa................................................................................................................... 45
Geotechnical Consulting Services
iv
Groundwater Review of the Molopo-Nossob Basin
Report No. ORASECOM/005/2009
Table 3-19 Data on population, ESLU (1995) and size of the quaternary WMA in the Upper Molopo
defined area (DWAF 2002d) ............................................................................................. 47
Table 3-20 Water requirement (1995) in Mm3/a for the quaternary WMA in the defined Upper
Molopo area (DWAF, 2002d) ............................................................................................ 47
Table 3-21 Data on population, ESLU (1995) and size of the quaternary WMA in the Middle Molopo
defined area (DWAF 2002b and 2002c) ............................................................................ 48
Table 3-22 Water requirement in Mm3/a (1995) for the quaternary WMA in the defined Middle
Molopo area (DWAF, 2002b and 2002c)........................................................................... 48
Table 3-23 Data on population, ESLU (1995) and size of the quaternary WMA in the Lower Molopo
defined area (DWAF 2002b and 2002c) ............................................................................ 50
Table 3-24 Water requirement in Mm3/a (1995) for the defined Lower Molopo area (DWAF, 2002b
and 2002c) ......................................................................................................................... 51
Table 3-25 Water requirement in Mm3/a (1995) for the defined Lower Molopo area referred to the
major river catchment areas (DWAF, 2002b and 2002c) .................................................. 51
Table 3-26 Summary of sizes, population and ESLU in the Molopo-Nossob basin in South Africa .. 51
Table 3-27 Summary of water requirements (1995) for the Molopo-Nossob basin in South Africa ... 53
Table 3-28 Transfer of water into the Molopo-Nossob basin in South Africa ..................................... 55
Table 3-29 Water balance for the Molopo-Nossob basin in South Africa in the year 2000 (Mm3/a) .. 55
Table 3-30 Figures on area sizes, population and ESLU in the Molopo-Nossob Basin ...................... 56
Table 3-31 Figures on area sizes, population and ESLU in different regions in the Molopo-Nossob
Basin .................................................................................................................................. 56
Table 3-32 Water requirement for Botswana, Namibia and South Africa in the Molopo-Nossob Basin
57
Table 3-33 Water requirement for various uses in different regions in the Molopo-Nossob Basin ..... 58
Table 3-34 Water requirement for various uses in different regions in the Molopo-Nossob Basin ..... 59
Table 4-1 Population Botswana districts in the Molopo- Nossob Basin ........................................... 61
Table 4-2 Namibian Population Growth ............................................................................................ 63
Table 4-3 Summary of the Projected Effect of Aids on the Namibian Population ............................ 63
Table 4-4 Population of South Africa districts in the Molopo- Nossob Basin (CSO, 2001 and
ORASECOM, 2008b) ....................................................................................................... 64
Table 4-5 Tourism Activity in Molopo- Nossob catchment (2007estimates) .................................... 68
Table 4-6 Scenarios for Tourism Growth over a Period of 10 years ................................................. 69
Table 5-1 Geological and Hydrogeological maps used in collation of the simplified geological map
in Figure 5-1. ..................................................................................................................... 73
Table 5-2 Regional stratigraphy in the Molopo-Nossob Basin ......................................................... 75
Table 5-3 Karoo Supergroup Stratigraphy and nomenclature in Botswana, Namibia and South
Africa relevant to the Molopo-Nossob Basin .................................................................... 77
Table 5-4 Reports from groundwater investigations used in collecting information on borehole
yields and aquifer parameters ............................................................................................ 85
Table 5-5 Number of information used in the fitting the yields from various aquifers with normal
distribution and the coefficient of determination, r2 .......................................................... 86
Table 5-6 Borehole yield classes used in Botswana, Namibia and South Africa. (Taken from DWA,
1987, Christelis and Struckmeier, 2001, DWAF, 1995 ...................................................... 89
Geotechnical Consulting Services
v
Groundwater Review of the Molopo-Nossob Basin
Report No. ORASECOM/005/2009
Table 5-7 Databases from which information of groundwater chemistry are extracted to form the
base for construction of map over Molopo-Nossob basin ................................................. 90
Table 5-8 Guidelines and recommendations for domestic water supply regarding the components
TDS, NO3 and F ................................................................................................................ 91
Table 5-9 Guidelines on Total Dissolved Solids, TDS for water use for livestock from FAO (1976)
and proposal from DGS (1994) ......................................................................................... 91
Table 5-10 Livestock salinity tolerance (South Australia department of Agriculture, Livestock Water
Supplies facts sheet no 82/77, September 1982) (Source: DGS, 1994) ............................ 91
Table 5-11 Number of data used in the compilation of water chemistry maps over Molopo-Nossob
basin .................................................................................................................................. 92
Table 5-12 Effects of TDS and EC on Human Health, Aesthetics, Household Distribution Systems
and Water Heating Appliances (DWAF, 1996a) ................................................................ 94
Table 5-13 TDS concentration limits chosen for the construction of the TDS map (Figure 5-12) ..... 97
Table 5-14 Area sizes in the Molopo-Nossob Basin of unsuitable groundwater for human and
livestock consumption based on TDS limits of 2,000 and 5,000 mg/l respectively .......... 97
Table 5-15 Effects of Nitrate on Human Health (DWAF, 1996a) ...................................................... 101
Table 5-16 NO3 concentration limits chosen for the construction of the NO3 map (Figure 5-12) .... 102
Table 5-17 Effects of Fluoride on Aesthetics and Human Health (DWAF, 1996a) ........................... 105
Table 5-18 Effects of Fluoride on Livestock Health (DWAF, 1996b) ............................................... 106
Table 5-19 F concentration limits chosen for the construction of the Fluoride map (Figure 5-14) ... 108
Table 5-20 Number of sites and boreholes for groundwater monitoring in Molopo-Nossob Basin .. 113
Table 5-21 Basic information on the groundwater level monitoring in the Kanye area, Southern
District, presented in Figure 5-24 .................................................................................... 115
Table 5-22 Changes in groundwater level monitored in Bokspits-Khawa area................................. 117
Table 5-23 Data on monitoring sites presented in the current report ................................................. 122
Table 5-24 Data on monitoring sites presented in the current report ................................................. 127
Table 5-25 Groundwater level information sources in the Molopo-Nossob Basin ........................... 134
Table 5-26 Various practical methods to determine recharge (Bredenkamp et al, 1995, ORASECOM,
2009) ................................................................................................................................ 136
Table 5-27 Recharge rainfall relationship in the Molopo-Nossob Basin in South Arfica developed and
presented in ORASECOM report (2009) ........................................................................ 139
Table 5-28 Recharge methods and values obtained from investigation in the Molopo-Nossob Basin
140
Table 5-29 Modeling exercises conducted in the Molopo-Nossob Basin ......................................... 145
Table 5-30 Scenario cases in the JICA groundwater modeling of the SAB (JICA, 2002) ................ 155
Table 5-31 Results of the Groundwater Simulation of the SAB (JICA, 2002) ................................. 155
Table 5-32 Scenario modeled and results obtained in the Tosca Molopo investigation (van Dyk,
2005) ................................................................................................................................ 157
Table 6-1 Classes and values used in the assessing of groundwater potential in the Molopo-Nossob
Basin (human consumption) ............................................................................................ 159
Table 6-2 Classes and values used in the assessing of groundwater potential in the Molopo-Nossob
Basin (livestock watering) ............................................................................................... 159
Table 6-3 Characteristics from the borehole yield and Transmissivity distribution diagrams in
Chapter 5.2 ...................................................................................................................... 160
Geotechnical Consulting Services
vi
Groundwater Review of the Molopo-Nossob Basin
Report No. ORASECOM/005/2009
Table 7-1 Summary of Borehole data table ..................................................................................... 166
Table 7-2 Groundwater monitoring data table ................................................................................. 166
Table 7-3 Water quality data table ................................................................................................... 166
Table 7-4 Databases carrying groundwater information in Botswana ............................................. 167
Table 7-5 Basic site information/borehole data table ...................................................................... 171
Table 7-6 Other borehole identifier used ......................................................................................... 171
Table 7-7 Water level data table ...................................................................................................... 172
Table 7-8 Water quality table ........................................................................................................... 172
Table 7-9 Metadata elements ........................................................................................................... 173
Table 7-10 Integrated Water Levels Table Record Example ............................................................. 175
Geotechnical Consulting Services
vii
Groundwater Review of the Molopo-Nossob Basin
Report No. ORASECOM/005/2009
LIST OF FIGURES
Figure 1-1
Molopo-Nossob Basin and major rivers within the basin ............................................... 1
Figure 2-1
Molopo-Nossob Basin in Botswana, Namibia and South Africa .................................... 4
Figure 2-2
Oanob River sub-basin in the Molopo-Nossob Basin ..................................................... 4
Figure 2-3
Percentage of coverage of the Molopo-Nossob Basin by Botswana, Namibia and South
Africa .............................................................................................................................. 5
Figure 2-4
Percentage of coverage of the Molopo-Nossob Basin by the four major rivers, Molopo,
Kuruman, Nossob and Auob ........................................................................................... 5
Figure 2-5
Relief map of the Molopo-Nossob Basin ........................................................................ 6
Figure 2-6
Administrative units within the Molopo-Nossob Basin belonging to Botswana,
Namibia and South Africa .............................................................................................. 7
Figure 2-7
Distribution of rainfall stations in the Molopo-Nossob Basin ........................................ 8
Figure 2-8
Monthly mean rainfall at selected stations in the Molopo-Nossob Basin ....................... 9
Figure 2-9
Annual average rainfall over the Molopo-Nossob Basin .............................................. 10
Figure 2-10
Mean daily maximum and minimum temperatures and highest and lowest temperatures
for the Meteorological stations Ghanzi, Tshane and Tsabong in Botswana (source;
DWA, 2006) .................................................................................................................. 10
Figure 2-11
Monthly mean maximum temperature at selected sites in the project area................... 11
Figure 2-12
Monthly mean minimum temperature at selected sites in the project area ................... 11
Figure 2-13
Mean monthly Relative Humidity (%) for Tsabong, Tshane and Ghanzi meteorological
stations in Botswana. (Source: data DWA, 2006) ........................................................ 12
Figure 2-14
Mean monthly humidity at selected sites in the project area ........................................ 12
Figure 2-15
Monthly mean wind speed at selected sites in the project area ..................................... 12
Figure 2-16
Monthly mean Sunshine hours at selected sites in the project area .............................. 13
Figure 2-17
Monthly mean solar radiation at selected sites in the project area ................................ 13
Figure 2-18
Monthly mean potential evapotranspiration at selected sites ........................................ 15
Figure 2-19
Monthly mean evaporation at selected stations in the project area ............................... 15
Figure 2-20
Mean annual reference evapotranspiration in the Molopo-Nossob sub-basin .............. 16
Figure 2-21
Mean monthly rainfall and potential evapotranspiration in the Molopo-Nossob Basin 17
Figure 2-22
Aridity Index Map of the Study area ............................................................................. 18
Figure 2-23
Monthly rainfall and SPI values for Tsabong ................................................................ 22
Figure 2-24
Annual rainfall and SPI values for Tsabong .................................................................. 22
Figure 2-25
Annual rainfall and SPI values for Tsabong .................................................................. 23
Figure 2-26
Annual rainfall and SPI values for Kuruman ................................................................ 23
Figure 2-27
Dams in the Molopo-Nossob Basin .............................................................................. 27
Figure 2-28
Major waterworks and transfers in the Molopo-Nossob Basin ..................................... 28
Figure 2-29
Geographic distribution of pans in the Molopo-Nossob Basin ..................................... 29
Figure 3-1
Area of Botswana included in the Molopo-Nossob basin based on surface water divide
...................................................................................................................................... 32
Geotechnical Consulting Services
viii
Groundwater Review of the Molopo-Nossob Basin
Report No. ORASECOM/005/2009
Figure 3-2
(A) Number or various livestock and (B) Water requirement for various livestock and
wildlife in the Kgalagadi, Southern, Barolong and Ghanzi District within the Nossob
River basin (source: DWA, 2006) ................................................................................ 33
Figure 3-3
Predicted water requirements for Molopo-Nossob Basin in Botswana ........................ 36
Figure 3-4
(A). Water requirement in the Auob River and Nossob River Basins in Namibia ........ 39
Figure 3-5
Irrigation schemes in the Auob catchment area (blue) and Nossob catchment area (red)
(source: MAWRD, 2000) ............................................................................................. 39
Figure 3-6
Distribution of water requirements for the Irrigation schemes in the Molopo-Nossob
Basin (MAWRD, 2000) ................................................................................................ 40
Figure 3-7
Veterinary areas in Namibia in the Molopo-Nossob Basin ........................................... 41
Figure 3-8
(A) Number or various livestock and (B) Water requirement for various livestock in the
Auob River and Nossob River basins (MAWF, 2006) ................................................. 42
Figure 3-9
Groundwater Control Areas in the Molopo-Nossob Basin, Namibia ............................ 43
Figure 3-10
Villages supplied by Nam Water ("Bulk Consumers") in the Molopo-Nossob Basin .. 43
Figure 3-11
Upper Molopo WMA (the quaternary WMA D41A), marked D in the figure (DWAF,
2004c) ........................................................................................................................... 46
Figure 3-12
Lower Vaal WMA and its sub-areas Molopo, Harts and Vaal d/s Bloemhof Dam
(DWAF 2004) ............................................................................................................... 49
Figure 3-13
Lower Orange WMA and hydrological sub-catchments (DWAF, 2004b) .................... 50
Figure 3-14
A. Sizes of the quaternary WMA in the Molopo basin in South Africa ........................ 52
Figure 3-15
Number of livestock units (ESLU) and population in the quaternary WMA in the
Molopo River basin of South Africa............................................................................. 52
Figure 3-16
Number of livestock units (ESLU) and population in the Molopo River sub-areas of
South Africa .................................................................................................................. 53
Figure 3-17
Water requirements (1995) in the quaternary WMA in the Molopo River basin of South
Africa ............................................................................................................................ 53
Figure 3-18
Water requirement (1995) in the Molopo River sub-areas of South Africa .................. 54
Figure 3-19
Water requirement assessed as m3/km2 annually (1995 data) in the quaternary WMA in
the Molopo River basin of South Africa ....................................................................... 54
Figure 3-20
Water requirement assessed as m3/km2 annually (1995 data) in the Molopo River sub-
areas of South Africa .................................................................................................... 55
Figure 3-21
Population and ESLU per km2 in Botswana, Namibia and South Africa in the Molopo-
Nossob Basin ................................................................................................................ 56
Figure 3-22
Population and ESLU per km2 in Botswana, Namibia and South Africa within the
Molopo-Nossob Basin .................................................................................................. 57
Figure 3-23
Water requirements for Botswana, Namibia and South Africa in the Molopo-Nossob
Basin ............................................................................................................................. 58
Figure 3-24
Water requirements for various regions in the Molopo-Nossob Basin ......................... 59
Figure 3-25
Water requirements in m3/km2 per year for various regions in the Molopo-Nossob
Basin ............................................................................................................................. 60
Figure 4-1
Future predicted water requirement for the three sub-areas of the Molopo-Nossob basin
in South Africa .............................................................................................................. 71
Figure 4-2
Future predicted water requirements for the Molopo-Nossob River Basin .................. 72
Geotechnical Consulting Services
ix
Groundwater Review of the Molopo-Nossob Basin
Report No. ORASECOM/005/2009
Figure 5-1
Simplified geology map over the Molopo-Nossob Basin. References given in Table 5-1
...................................................................................................................................... 74
Figure 5-2
Geological cross-section through the Ecca sediments in the Stampriet Artesian Basin
from North-West to the border with South Africa in South-East (Gemsbok Park). The
Auob aquifer in orange, Nossob Aquifer in light yellow and the Kalahari beds in light
blue. (Copied from JICA, 2002) ................................................................................... 78
Figure 5-3
Kalahari Bed thickness .................................................................................................. 80
Figure 5-4
Pre-Kalahari surface ...................................................................................................... 81
Figure 5-5
Thickness of Kalahari Beds below the groundwater surface ........................................ 82
Figure 5-6
Borehole yield data from various aquifers and locations in Botswana and Namibia.
SAB (Stampriet Artesian Basin) ................................................................................... 86
Figure 5-7
Borehole yield data from various aquifers and locations in Botswana and Namibia.
SAB (Stampriet Artesian Basin) ................................................................................... 87
Figure 5-8
Borehole yields to be expected within the standard deviation limits of the log-normal
distribution of borehole yields from various aquifers in Botswana and Namibia.
=median value........................................................................................................... 87
Figure 5-9
Transmissivity data from Ecca aquifer at various locations in Botswana ..................... 88
Figure 5-10
Transmissivity data to be expected within the standard deviation limits of the log-
normal distribution of transmissivity from Ecca aquifer in Botswana.
=median value
...................................................................................................................................... 88
Figure 5-11
Groundwater Potential Map. Compiled from hydrogeological Maps over Botswana,
Namibia and South Africa ............................................................................................ 90
Figure 5-12
TDS concentration in the groundwater within the Molopo-Nossob Basin ................... 97
Figure 5-13
Areas of unsuitable groundwater quality of human consumption (TDS>2,000 mg/l) and
livestock watering (TDS>10,000 mg/l) ........................................................................ 98
Figure 5-14
TDS in the Nossob Aquifer in the Stampriet Artesian Aquifer in Molopo-Nossob Basin
in Namibia. Data source: JICA, 2002 ........................................................................... 99
Figure 5-15
NO3 concentration in the groundwater within the Molopo-Nossob Basin .................. 102
Figure 5-16
Relationship between Maximum Daily Air Temperature and Optimum Fluoride
Concentration (after DWAF, 1996a) ........................................................................... 105
Figure 5-17
Fluoride (F) concentration in the groundwater within the Molopo-Nossob Basin ..... 107
Figure 5-18
Groundwater Fluoride (F) content in the Nossob aquifer in the Stampriet Artesian
Basin in Namibia. Data source: JICA, 2002 ............................................................... 108
Figure 5-19
Areas exceeding guideline limits for human consumption ......................................... 109
Figure 5-20
Areas exceeding guidelines for livestock watering ..................................................... 110
Figure 5-21
Location of data (boreholes) from which information of TDS (upper left), NO3 (upper
right) and F (lower) are obtained ................................................................................ 111
Figure 5-22
Monitoring boreholes in Botswana and boreholes presented in the current report ..... 114
Figure 5-23
Monitoring and abstraction boreholes in the Kanye wellfield area in Botswana ........ 114
Figure 5-24
Groundwater level in monitoring boreholes in the Kanye wellfield area, influenced and
not influenced by the abstraction from the wellfields ................................................ 115
Figure 5-25
Abstraction from the Kanye wellfields predicted from linear extrapolation of
monitored annual abstraction ..................................................................................... 115
Geotechnical Consulting Services
x
Groundwater Review of the Molopo-Nossob Basin
Report No. ORASECOM/005/2009
Figure 5-26
Groundwater level monitored in observation boreholes surrounding the Tsabong
wellfield in Botswana ................................................................................................. 116
Figure 5-27
Monitored and predicted abstraction from the Tsabong wellfield, Botswana ............. 116
Figure 5-28
Groundwater level in monitoring boreholes in Matsheng and Bokspits-Khawa ........ 117
Figure 5-29
Mean annual minimum temperature for January and July from the meteorological
station in Tsabong. Calculated difference between the January and July annual mean
minimum temperature. (Data source: Department of Meteorological Services,
Botswana) ................................................................................................................... 118
Figure 5-30
Groundwater level in monitoring boreholes in Makunda, Khakea-Sekoma and
Sedibeng ..................................................................................................................... 118
Figure 5-31
Brief overview of the geological and hydrogeological classification of the Stampriet
Artesian Basin (JICA, 2002) ...................................................................................... 120
Figure 5-32
Monitoring boreholes and boreholes presented in the current report .......................... 121
Figure 5-33
Groundwater level monitoring at Okonyama and Olifantswater in Namibia ............. 123
Figure 5-34
Groundwater level monitoring at Steinrus, Tugela, Jackalsdraai and Tweerivier in
Namibia ...................................................................................................................... 123
Figure 5-35
General groundwater contours in the Nossob aquifer from monitoring of water level in
boreholes penetrating the aquifer. (Data source: JICA, 2002) .................................... 124
Figure 5-36
Blue areas show the groundwater level in the Nossob aquifer being higher than the
general groundwater level (Auob and Kalahari aquifers). (Data source: JICA, 2002)
.................................................................................................................................... 125
Figure 5-37
Blue areas show the groundwater level (head) in the Nossob aquifer above the ground
surface level (artesian conditions). (Data source: JICA, 2002) .................................. 125
Figure 5-38
Monitoring boreholes in South Africa and monitoring results presented in the current
report .......................................................................................................................... 126
Figure 5-39
Monitored groundwater level in boreholes in the Grootfontein area, South Africa,
Water Management Area, WMA, D41A .................................................................... 128
Figure 5-40
Grootfontein, WMA D41A, South Africa, groundwater level counters early-mid 1980-
es (Left) and groundwater counters form recent time, 2000-2004, (Right). The counters
interpolated using Kriging application in the Surfer programme ............................... 128
Figure 5-41
3-D graph for the groundwater level from monitoring boreholes at Grootfontein, South
Africa, WMA D41A ................................................................................................... 129
Figure 5-42
Monitored groundwater level in boreholes in the South Africa, Water Management
Area D41G, H, J and M, see Table 5-24 ..................................................................... 129
Figure 5-43
Monitored groundwater level in boreholes in South Africa, Water Management area
D41H, see Table 5-24 ................................................................................................. 130
Figure 5-44
Monitored groundwater level in boreholes in South Africa, Water Management Area
D41a and C, see Table 5-24 ........................................................................................ 130
Figure 5-45
Groundwater Status in the Northern Cape, winter 2008, based on Groundwater level
Decline since 1990 (van Dyk et al, 2008) .................................................................. 132
Figure 5-46
Regional groundwater level map over Molopo-Nossob Basin ................................... 133
Figure 5-47
Location of boreholes used in the construction of the groundwater level map over
Molopo-Nossob Basin (Figure 5-46) .......................................................................... 135
Geotechnical Consulting Services
xi
Groundwater Review of the Molopo-Nossob Basin
Report No. ORASECOM/005/2009
Figure 5-48
Location of springs in Molopo-Nossob Basin (data source: Vegter, 1995 and DWA
Namibia) ..................................................................................................................... 135
Figure 5-49
Total chloride deposition (mg/a and m2) calculated for the Molopo-Nossob Basin
according to formula given by JICA (2002) and adjusted with a factor 0.75 ............. 141
Figure 5-50
Chloride concentration in the groundwater within Molopo-Nossob Basin ................. 141
Figure 5-51
Groundwater recharge in mm/a assessed using the Chloride Mass Balance method
(CMB) ........................................................................................................................ 142
Figure 5-52
Example of a 3-dimensional grid for numerical modeling ......................................... 143
Figure 5-53
Location of areas where groundwater modeling is conducted. Numbers refer to Table
5-29 ............................................................................................................................. 145
Figure 5-54
Example of protection zone delineation (Ghanzi, Botswana) using results from
numerical modeling (Red zone for 100 years travelling time, green zone restricting for
drilling and abstraction of groundwater) .................................................................... 146
Figure 5-55
Grid lay-out for the Kang-Phuduhudu numerical model wit delineated wellfield areas
and simulated production wells (DWA, 2007) ........................................................... 148
Figure 5-56
Geologic cross section WSW-ENE through the Ncojane area in Botswana (DWA,
2008). The three aquifers considered are Ntane, Otshe sandstone1 and Otshe sandstone
2. ................................................................................................................................. 150
Figure 5-57
Three-dimensional image of the modeled aquifer system. (Note that the upper surface
is not the topographic surface, but extrapolated depth to first water strike. The system
thus represents confined/unconfined structure) (DGS, 2003) .................................... 152
Figure 5-58
Grid net used and assigned Transmissivity values in modeling in Tsabong (DWA,
2002) ........................................................................................................................... 154
Figure 5-59
Simulated drawdown in the Kalahari and Auob aquifers (Case 2) in the Stampriet
Artesian Basin, SAB (JICA, 2002). ............................................................................ 156
Figure 6-1
Grid-net of 0.2o distance over the Molopo-Nossob Basin to achieve values inn points of
chemical and recharge data ......................................................................................... 160
Figure 6-2
Number of chemical guideline for human consumption and for livestock watering
exceeded in the Molopo-Nossob Basin (indicator maps) ........................................... 161
Figure 6-3
Number of chemical guideline for human consumption and for livestock watering
exceeded and recharge of 0.2 mm/a not achieved in the Molopo-Nossob Basin
(indicator maps) .......................................................................................................... 161
Figure 6-4
Values for the groundwater chemistry in accordance with Table 6-1 ......................... 162
Figure 6-5
Values for the groundwater chemistry and recharge in accordance with Table 6-1 .... 162
Figure 6-6
Depth to the groundwater level. Map constructed from the ground surface map and the
groundwater level map given in this report ................................................................ 164
Figure 7-1
The GROWAS database front-end page ..................................................................... 168
Figure 7-2
The GROWAS database - General Borehole Information form ................................. 169
Figure 7-3
The GROWAS database - Groundwater Monitoring form .......................................... 169
Figure 7-4
The GROWAS database Ł Water Analysis form ......................................................... 170
Figure 7-5
Model for the Databases in South Africa (E. Bertman, DWAF, 2007) ....................... 171
Figure 7-6
Integration of water level monitoring data .................................................................. 175
Figure 8-1
Overview of ENDNOTE software .............................................................................. 177
Geotechnical Consulting Services
xii
Groundwater Review of the Molopo-Nossob Basin
Report No. ORASECOM/005/2009
Figure 8-2
Reference types in the ENDNOTE Software .............................................................. 178
LIST OF APPENDICES
Appendix - I
Molopo-Nossob Basin metadata records
Geotechnical Consulting Services
xiii
Groundwater Review of the Molopo-Nossob Basin
Report No. ORASECOM/005/2009
LIST OF ABBREVIATIONS AND SYMBOLS
ADG
Average Daily Gain
AEM
Analytical Element Method
AI
Aridity Index
AIDS
Acquired Immune Deficiency Syndrome
ARV
Anti Rretroviral (HIV/AIDS drug)
BH
Borehole
BDF
Botswana Defence Force
BEM
Boundary Element Method
BOBS
Botswana Bureau of Standards
CBNRM
Community based Natural Resource Management
CMA
Catchment Management Agencies
CMB
Chloride Mass Balance
CRD
Cumulative Rainfall Departures
CSO
Central Statistics Office
DEA
Department of Environmental Affairs
DGS
Department of Geological Survey
DWA
Department of Water Affairs
DWAF
Department of Water Affairs and Forestry
E
East
EC
Electrical conductivity
ELSU
Equivalent Livestock Unit
EOS
Economically Oriented Scenario
ET
Evapotranspiration
F
Fluoride
FAO
Food and Agriculture Organisation
FCR
Feed Conversion Ratio
FDM
Finite Difference Method
FEM
Finite Element Method
GDC
Ghanzi Dostrict Council
GIS
Geographic Information Systems
GOB
Government of Botswana
ha
Hectare
HIV
Human Immunodeficiency Virus
hr
Hour
JICA
Japan International Cooperating Agency
KDC
Kgalagadi District Council
Km
Kilometre
Geotechnical Consulting Services
xiv
Groundwater Review of the Molopo-Nossob Basin
Report No. ORASECOM/005/2009
Km2
Square Kilometre
l/s
Litre per Second
m
Meter
m3
Cubic Meter
MAWRD
Ministry of Agriculture, Water and Rural Development
mamsl
Meters above Mean Sea Level
mg/l
Milligrams per litre
m2/d
Square Meter per Day
m3/a
Cubic Meter Per Annum
m3/d
Cubic Meter per Day
m3/h
Cubic Meter Per Hour
mm
Millimeter
Mm3
Million Cubic Meter
Mm3/yr
Million Cubic Meter per year
mm/a
Milligrams Per Annum
mS/m
Millisimians per meter
N
North
NAMPAAD
National Master Plan for Agricultural Development
NC
Northern Cape
NDP
National Development Plan
NO3
Nitrate
NGIS
National Geological Information System
NWA
National Water Act
NWMPR
National Water Master Plan Review
NWRS
National Water Resource Strategy
ORASECOM
Orange-Senqu River Commission
PDE
Partial Differential Equation
PET
Potential Evapotranspiration
RAPS
Rescaled Adjusted Partial Sums
RDP
Regional Development Plan
oC
Degree Centigrade
S
South
SAB
Stampriet Artesian Basin
SADC
South African Development Community
SDC
Southern District Council
SOS
Socially Oriented Scenario
SPI
Standardized Precipitation Index
SVF
Saturated Volume Fluctuation
SWCA
Subterranean Water Control Area
T
Transmissivity
Geotechnical Consulting Services
xv
Groundwater Review of the Molopo-Nossob Basin
Report No. ORASECOM/005/2009
TDS
Total Dissolved Solids
TWQR
Target Water Quality Range
UNDP
United Nations Development Programme
UNICEF
United Nations International Children's Educational Fund
UNEP
United Nations Environment Programme
USGS
United States Geological Survey
W
West
WMA
Water Management Area
WTO
World Tourism Organization
WUA
Water Users Associations
WUC
Water Utilities Corporation
%
Percentage
Geotechnical Consulting Services
xvi
Groundwater Review of the Molopo-Nossob Basin
Report No. ORASECOM/005/2009
1 INTRODUCTION
1.1
Background
The Molopo River is an ephemeral tributary of the Orange Ł Senqu River system which is an
international river basin shared by Lesotho, Namibia, Botswana and South Africa (Figure 1-
1). The Orange-Senqu River Agreement signed by the governments of the four countries
established the Orange-Senqu River Commission (ORASECOM) to advise the parties on
water related issues.
Orange Ł Senqu River Commission (ORASECOM) has appointed Geotechnical Consulting
Services (Pty) Ltd, to evaluate the groundwater resources in the Molopo-Nossob basin based
on the analysis of available data and information basin-wide. The project commenced on
November 1, 2008.
Figure 1-1
Molopo-Nossob Basin and major rivers within the basin
Geotechnical Consulting Services
1
Groundwater Review of the Molopo-Nossob Basin
Report No. ORASECOM/005/2009
1.2 Purpose of the Study
The main objective of the project is to evaluate the groundwater resources of the Molopo-
Nossob basin based on an exhaustive analysis of the available data and information on
boreholes and wells, groundwater monitoring, existing groundwater models, water supply
and demand, water uses, water rights, pollution sources, infrastructure and operating
procedures, environmental and socio-economic information etc. This is necessitated
accessing and analyzing the data/databases in each of the basin states for the whole project
area.
A major sub-objective of the project is the quality assessment, and integration of different
data sets as well as recommendations for how data can be shared between the basin states and
integrated in a common database.
The study, with the mission as stated by the main objective, is divided into three phases:
1. Inception Phase
2. Data Collection, Assessment and Preliminary Integration Phase
3. Groundwater Evaluation and Reporting Phase
The three phases form a logical sequence, in addition project management and reporting will
be a cross-cutting activity over the duration of the project.
1.3 Purpose of this Report
The purpose of this report is to present the results based on the exhaustive analysis of the
available data and information on the groundwater resources of the Molopo-Nossob and
recommendations of the study.
1.4 Structure of this Report
Chapter 2 presents the description of the Molopo-Nossob Basin which also includes the
catchment areas, main rivers, dams and pans, and transfer schemes. In Chapter 3 are deals
with water requirements and use in the three basin states. Chapter 4 describes the
developmental activities in the study area. Chapter 5 presents the geology and
hydrogeological overview of the Molopo-Nossob basin. The groundwater resources
evaluation is described in the Chapter 6. Chapter 7 is on integration of the databases and
quality assessment. Chapter 8 presents an overview of the ENDNOTE programme and main
sources of information. Chapter 9 presents the conclusions and recommendations and
Chapter 10 presents the references.
Geotechnical Consulting Services
2
Groundwater Review of the Molopo-Nossob Basin
Report No. ORASECOM/005/2009
2 DESCRIPTION OF THE MOLOPO-NOSSOB BASIN
2.1 Main Catchment areas
The Molopo-Nossob Basin is defined as the catchment area for the Molopo River and
extends from the confluence with the Orange River to the end of all its tributaries, see Figure
2-1. The Molopo River is an ephemeral tributary of the Orange Ł Senqu River system which
is an international river basin shared by Lesotho, Namibia, Botswana and South Africa.
The Molopo-Nossob Basin includes four major rivers summarized in Table 2-1. There are
various figures in reports given for the area size of each river's catchment area. In the current
report, the catchment areas in Namibia are designated to Molopo, Nossob and Auob Rivers
respectively.
The Auob catchment area includes the sub-catchment area of Oanob River (MAWRD, 2000).
This basin contains the Oanob River which rises in the Khomas Hochland and flows in a
south-easterly direction to the recently constructed Oanob Dam and then through the town of
Rehoboth. Thereafter the river becomes lost in the Kalahari Sands only to occur 50 km
further to the south-west as a river channel, now as the Auob River (MAWRD, 2000). This
river sub-basin is 15,038 km2 (Figure 2-2).
In South Africa, the catchment of the Molopo River is highlighted in the quaternary Water
Management Areas (WMA). These areas are designed to cover small defined catchment areas
and together they make up for larger catchment areas like the Molopo River. The quaternary
Water Management Areas (WMA) in South Africa together gives the catchment areas of the
Molopo-Nossob Basin in that country. The total figure 110,565 km2 differs from the figure
given in other ORASECOM reports (ORASECOM, 2008a).
Figure 2-3 and Figure 2-4 illustrate the percentage of coverage of the Molopo-Nossob Basin
by the three basin countries and by the four major river courses.
Table 2-1
Main sub-catchment areas within the Molopo-Nossob River Basin
Catchment Area (km2)
River
South Africa
Namibia
Botswana
Total
Molopo
55,891
18,120
118,338
195,536
Kuruman
41,194
0
0
41,194
Nossob
8,339
50,050
17,426
75,815
Auob
5,141
52,702
0
57,843
Total
110,565
120,872
135,764
367,201
Percentage
30.1
32.9
37.0
Geotechnical Consulting Services
3
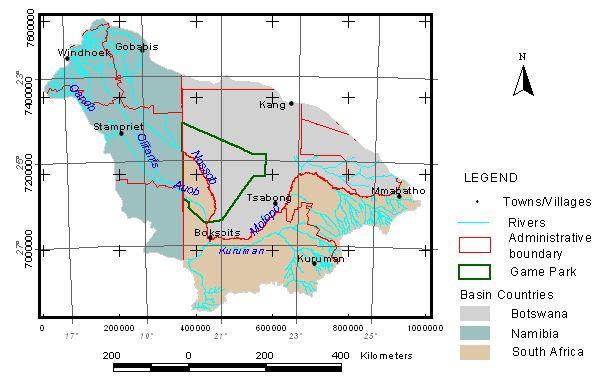
Groundwater Review of the Molopo-Nossob Basin
Report No. ORASECOM/005/2009
Figure 2-1
Molopo-Nossob Basin in Botswana, Namibia and South Africa
Oanob River Catchment
15,038 squarekm
Figure 2-2
Oanob River sub-basin in the Molopo-Nossob Basin
Geotechnical Consulting Services
4
Groundwater Review of the Molopo-Nossob Basin
Report No. ORASECOM/005/2009
40
30
e
a
a
g
n
t
a
a
n
i
a
f
r
i
c
e 20
w
r
c
i
b
A
e
t
s
P
o
m
t
h
a
u
10
B
N
o
S
0
Figure 2-3
Percentage of coverage of the Molopo-Nossob Basin by Botswana, Namibia and South Africa
60
o
b
e 40
p
o
n
g
s
a
t
a
l
o
s
n
o
m
o
b
e
o
r
c
M
N
r
u
u
e
P
u
A
20
K
0
Figure 2-4
Percentage of coverage of the Molopo-Nossob Basin by the four major rivers, Molopo, Kuruman,
Nossob and Auob
2.2 Relief and drainage
The highest elevations in the Molopo-Nossob are found in the northern part of Namibia and
in the southern part of the Molopo and Kuruman catchment areas in South Africa. Figure 2.5
shows the relief map of the Molopo-Nossob Basin reconstructed from 90 m spatial resolution
SRTM data. It shows that around the Aoub/Oanob and Nossob water divides the elevation
reach around 2400 mamsl.
2.3 Administrative Units
The three countries in the Molopo-Nossob Basin, Botswana, Namibia and South Africa all
have their parts covered by different administrative units. A summary of administrative units
in the three riparian states is gien in Table 2-2. The administrative units covering the
Molopo-Nossob Basin are illustrated in Figure 2-6.
Geotechnical Consulting Services
5
Groundwater Review of the Molopo-Nossob Basin
Report No. ORASECOM/005/2009
Elevation (m a.m.s.l.)
-22 S
2300
2200
2100
-23 S
2000
1900
-24 S
1800
1700
1600
-25 S
1500
1400
-26 S
1300
1200
1100
-27 S
1000
900
-28 S
800
700
17 E
18 E
19 E
20 E
21 E
22 E
23 E
24 E
25 E
26 E
Figure 2-5
Relief map of the Molopo-Nossob Basin
In the Botswana part of the basin Tsabong is the largest village. Most of the villages and
settlements in the Kgalagadi district are situated near pans or fossil river valleys, or on rock
outcrops that serve as sources of water supply (groundwater). The administrative regions in
Namibia that fall in the Molopo-Nossob basin are Omaheke, Khomas, Hardap and Karas.
In South Africa the Molopo-Nossob basin covers a northern part of the Northern Cape
Province and the north-western section of the North West Province, see Table 2-3. The basin
extends between Mafikeng and the South African Ł Namibian border. Mafikeng and
Kuruman are major cities included in the basin area.
Table 2-2
Administrative districts within the three riparian countries of the Molopo-Nossob basin
Country
District, Province
Total
area Percentage of the district in Population
in
the
or Region
size (km2)
the Molopo-Nossob basin
Molopo-Nossob Basin
Botswana
Kgalagadi South
66,066
100
26,488
Kalalagadi North
44,004
100
16,968
Southern
80
10,176
Ngwaketse
Southern
26,876
100
10,989
Ngwaketse West
Southern Barolong
100
52,774
Kweneng West
35,890
5
1,529
Ghanzi
117,910
3
1,477
Namibia
Hardap
109,651
Karas
161,215
Khomas
37,007
113,849
Omaheke
84,612
South
North West
116,320
11
728,107
Africa
Province
Northern Cape
361,830
9
11,296
Source: CSO, 2001 and ORASECOM, 2008b
Geotechnical Consulting Services
6
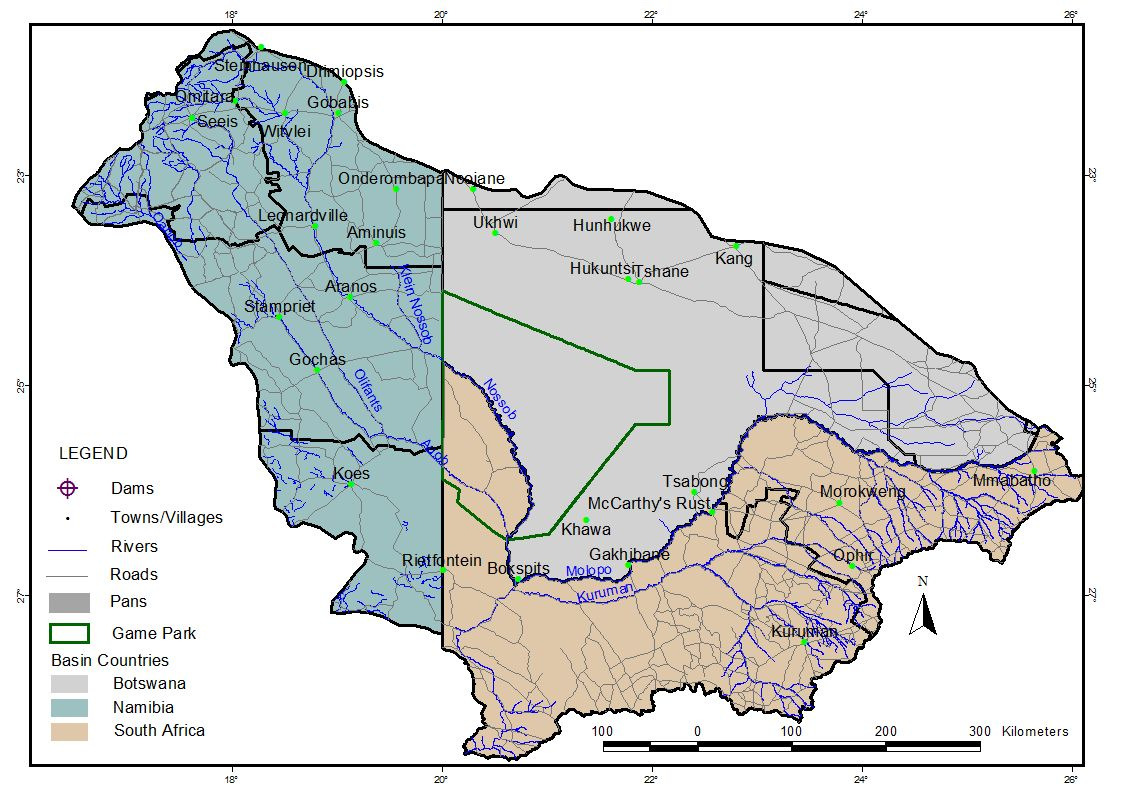
Groundwater Review of the Molopo-Nossob Basin
Report No. ORASECOM/005/2009
Table 2-3
Major districts and settlements in Namibia and South Africa part of Molopo-Nossob
Country
Region
Constituency
Villages in Region
Namibia
Stampriet, Hoachanas, Bernafy,
Hardap
Mariental rural
Aranos, Gotchas
Keetmanshoop rural
Karas
Karasburg
Koes, Aroab, Ariamsvlei
Khomas
Windhoek rural
Seeis
Aminuis, Gobabis,
Omaheke
Kalahari
Aminius, Leonardville, Gobabis
South Africa
Central/Ngaka Modiri
Mafikeng ,Ratlou,
(North West
Molema
Disobotla
Mafikeng
Province)
Bophirima/Dr Ruth
Segomotsi Mompatati
Molopo, Kagisano
Stella
South Africa
Moshaweng,
(North West
Gamagara, Ga
Hotazel, Dibeng, Dingleton/Sishen,
Province)
Kgalagadi
Segonyana
Kathu, Kuruman
Mier, District
Siyanda
Management Area
Figure 2-6
Administrative units within the Molopo-Nossob Basin belonging to Botswana, Namibia and South
Africa
2.4 Climate
2.4.1 Climate data considered
Data on climate are obtained from the meteorological departments in Botswana, Namibia and
South Africa. Information is also retrieved from international databases such as FAO's
CLIMWAT database (FAO, 1993) and publication regarding some of the regional parameters
of the Southern Africa.
Eight parameters are considered in the current climate assessment; rainfall, temperature,
humidity, wind speed, solar radiation, sunshine hours, evaporation and evapotranspiration
Geotechnical Consulting Services
7
Groundwater Review of the Molopo-Nossob Basin
Report No. ORASECOM/005/2009
2.4.2 Precipitation
In 2006 a comprehensive study of the climate in Botswana was presented as part of the
Botswana National Water Master Plan Review (DWA, 2006). For Namibia mean annual
rainfall map exists and point records at selected stations are available from the JICA (2002)
study. The location of the stations is not available, which however is complemented by the
FAO CLIMWAT data base. For South Africa, a total of 949 stations from the WR90 database
are available in producing a precipitation map of the study area, see Figure 2-7.
Rainfall Stations
-21 S
Ghanzi
-22 S
Gobabis
Windhoek
-23 S
Kang
Tshane
-24 S
Jwaneng
-25 S
Werda
Goodhope
Tsabong
-26 S
Keetmanshoop
Bokspits
-27 S
-28 S
-29 S
16 E
17 E
18 E
19 E
20 E
21 E
22 E
23 E
24 E
25 E
26 E
27 E
Figure 2-7
Distribution of rainfall stations in the Molopo-Nossob Basin
Table 2-4 shows the list of the stations used in the preparation of the average annual rainfall
distribution in the Molopo-Nossob Basin. A number of meteorological stations in the
northern part of the Molopo-Nossob Basin are added which were not included in the National
Water Master Plan Review study for Botswana.
Table 2-4
Selected rainfall stations in Molopo-Nossob basin
Country
Location
MAP
Longitude
Latitude
Altitude
Observation
(mm/a)
(mamsl)
period and
Remarks
Botswana
Bokspits
219
-26.70
20.70
850
1998-06
Ghanzi
473
-21.41
21.38
1,131
1998-08
Goodhope
405
-25.28
25.26
1,245
1998-05
Jwaneng
467
-24.35
24.48
935
1998-08
Kang
388
-23.45
22.45
1,163
1998-06
Tsabong
287
-26.03
22.27
962
1998-08, FAO
Tshane
306
-24.01
21.53
1,118
1998-08, FAO
Werda
304
-25.16
23.16
1,000
2002-08
Namibia
Gobabis
362
-22.28
18.58
1445
FAO
Keetmanshoop
149
-26.32
18.07
1067
FAO
Windhoek
361
-22.34
17.06
1728
FAO
Geotechnical Consulting Services
8
Groundwater Review of the Molopo-Nossob Basin
Report No. ORASECOM/005/2009
Country
Location
MAP
Longitude
Latitude
Altitude
Observation
(mm/a)
(mamsl)
period and
Remarks
South Africa
Kimberley
415
-28.48
24.46
1204
FAO+WR90
Kroonstad
606
-27.4
27.14
1348
FAO+WR90
Kuruman
420
-27.28
23.26
1300
FAO+WR90
Okiep
152
-28.36
17.52
927
FAO+WR90
Postmasburg
325
-28.18
23.00
1324
FAO+WR90
Potchefstroom
608
-26.44
27.04
1352
FAO+WR90
Thabazimbi
671
-24.37
27.24
1028
FAO+WR90
Upington
196
-28.26
21.16
809
FAO+WR90
Zeerust
590
-25.33
26.05
1207
FAO+WR90
Note:
FAO
from FAO's CLIMWAT database (FAO, 1993)
WR90
Exist in FAO CLIMWAT database as well as part of the WR90 database, among which about 949
rainfall stations retrieved from WR90 database of DWAF fall within a rectangular region within 16.5 to
26.50 E and -29 to -210S
A regional picture of seasonal distribution of rainfall in terms of monthly mean values at four
selected stations in the basin is shown in Figure 2-8. Most of the rain is registered for
October and April with the peak season usually in December Ł February. In the spatial extent,
the highest average annual precipitation is found in the Eastern part of the Molopo-Nossob
Basin, in the South African part. As a general picture, the rainfall decreases from North
towards South and from East towards West. The area with the lowest precipitation is found in
Southwest part encompassing the southernmost part of Botswana and Namibia and the
Western part of South Africa (see Figure 2-9)
100
90
80
)
m
70
l
l
(
m
60
f
a
i
n
a
50
R
l
y
40
t
h
n
o
30
M
20
10
0
Oct
Nov
Dec
Jan
Feb
Mar
Apr
May
Jun
Jul
Aug
Sep
Tsabong
13
22
39
37
50
46
31
11
8
2
1
11
Kuruman
28
31
49
69
84
68
45
19
8
4
8
7
Gobabis
15
29
43
87
75
70
31
6
1
1
1
3
Windhoek
11
29
39
73
78
81
39
8
1
0
0
2
Figure 2-8
Monthly mean rainfall at selected stations in the Molopo-Nossob Basin
Geotechnical Consulting Services
9
Groundwater Review of the Molopo-Nossob Basin
Report No. ORASECOM/005/2009
Mean Annual Precipitation (mm/a)
-21 S
600
-22 S
550
-23 S
500
450
-24 S
400
350
-25 S
300
-26 S
250
200
-27 S
150
-28 S
100
17 E
18 E
19 E
20 E
21 E
22 E
23 E
24 E
25 E
26 E
Figure 2-9
Annual average rainfall over the Molopo-Nossob Basin
2.4.3 Temperature
The climate in the Molopo-Nossob Basin is characterized by generally unvarying
temperatures. Figure 2-10 shows the maximum and minimum temperatures for three of the
Botswana stations in Molopo-Nossob basin (synoptic stations). The monthly mean maximum
and minimum temperature at four selected stations in the Molopo-Nossob Basin are shown in
Figure 2-11 and Figure 2-12 respectively. The daytime temperatures are generally warm to
hot due to high solar radiation, but because of the low humidity night-time the minimum
temperatures regularly drop to freezing or below 0 oC during `winter' time (DWA, 2006).
The lowest temperatures go as low as below -10 oC (Tsabong), and the highest maximum
temperatures are over 40 oC.
Highest Max
Highest Max
Highest Max
50
Mean Max
50
Mean Max
50
Mean Max
Tsabong
Mean Min
C
Ghanzi
Mean Min
C
Tshane
Mean Min
C
o
Lowest Min
o
Lowest Min
o
Lowest Min
40
r
e
40
r
e
40
r
e
t
u
t
u
t
u
r
a
30
r
a
r
a
30
e
30
e
e
p
p
p
m
m
m
e
20
e
20
e
20
T
T
T
n
n
n
a
a
a
e
10
e
10
e
10
M
M
M
i
l
y
0
i
l
y
0
i
l
y
0
a
a
a
D
D
D
-10
-10
-10
Jan Feb Mar Apr May Jun Jul Aug Sep Oct Nov Dec
Jan Feb Mar Apr May Jun Jul Aug Sep Oct Nov Dec
Jan Feb Mar Apr May Jun Jul Aug Sep Oct Nov Dec
Figure 2-10
Mean daily maximum and minimum temperatures and highest and lowest temperatures for the
Meteorological stations Ghanzi, Tshane and Tsabong in Botswana (source; DWA, 2006)
Geotechnical Consulting Services
10
Groundwater Review of the Molopo-Nossob Basin
Report No. ORASECOM/005/2009
Molopo-Nossob Basin Stations: Maximum Temperature
35
30
)
C
g
25
e
(
D
r
e
20
t
u
r
a
e
p
15
m
x
T
e
10
a
M
5
0
Oct
Nov
Dec
Jan
Feb
Mar
Apr
May
Jun
Jul
Aug
Sep
Tsabong
31
33
34
35
33
31
28
25
22
22
25
28
Kuruman
28
30
31
32
31
28
25
21
20
18
22
25
Gobabis
31
32
33
32
31
29
27
25
22
22
25
29
Windhoek
29
29
30
30
29
27
25
22
20
20
23
25
Figure 2-11
Monthly mean maximum temperature at selected sites in the project area
Molopo-Nossob Basin Stations: Minimum Temperature
35
30
)
C
g
25
e
(
D
r
e
20
t
u
r
a
e
p
15
m
T
e
10
i
n
M
5
0
Oct
Nov
Dec
Jan
Feb
Mar
Apr
May
Jun
Jul
Aug
Sep
Tsabong
12
15
17
18
18
16
11
6
1
1
3
7
Kuruman
11
13
15
17
16
14
10
5
2
1
3
7
Gobabis
13
15
17
17
16
15
11
6
3
2
5
9
Windhoek
15
15
17
17
16
15
13
9
7
6
9
11
Figure 2-12
Monthly mean minimum temperature at selected sites in the project area
2.4.4 Humidity
The relative humidity is a measure of the amount of water vapour in the air. It is a value
representing the ratio of the actual vapour pressure to its saturated limit at a prevailing
temperature of the air. There is very high diurnal fluctuation of humidity. The humidity is
higher in the mornings (0800 hrs) than in the afternoon. Figure 2-13 illustrates this difference
at three locations in the Molopo-Nossob Basin (Botswana). The relative humidity at four
selected stations in the Molopo-Nossob Basin is illustrated in Figure 2-14. The relative
humidity is in general high during the period January to March and minimum in the months
of August and September.
The wind speed is another parameter responsible for aerodynamic component of evaporation
process. There is also high seasonal fluctuation of wind speed. It is in general higher from
around August to February and March. The wind speed at four selected stations in the
Molopo-Nossob Basin is illustrated in Figure 2-15.
Geotechnical Consulting Services
11
Groundwater Review of the Molopo-Nossob Basin
Report No. ORASECOM/005/2009
Stations in Molopo Sub-basin of Botswana
100
Ghanzi 0800 hr
Ghanzi 1400 hr
90
Tshane 0800 hr
Tshane 1400 hr
Tsabong 0800 hr
Tsabong 1400 hr
80
70
)
(
%
60
i
t
y
i
d
m
u
50
H
e
t
i
v
40
l
a
e
R
30
20
10
0
Oct
Nov
Dec
Jan
Feb
Mar
Apr
May
Jun
Jul
Aug
Sep
Figure 2-13
Mean monthly Relative Humidity (%) for Tsabong, Tshane and Ghanzi meteorological stations in
Botswana. (Source: data DWA, 2006)
Molopo-Nossob Basin Stations: Relative Humidity
80
70
)
60
(
%
i
t
y
50
i
d
m
u
40
H
e
30
t
i
v
l
a
e
R
20
10
0
Oct
Nov
Dec
Jan
Feb
Mar
Apr
May
Jun
Jul
Aug
Sep
Tsabong
43
43
42
48
54
63
63
64
72
65
58
46
Kuruman
45
47
50
51
58
67
64
65
56
54
48
46
Gobabis
38
41
48
49
53
56
56
45
44
40
37
34
Windhoek
25
33
39
45
55
51
47
41
40
32
28
25
Figure 2-14
Mean monthly humidity at selected sites in the project area
Molopo-Nossob Basin Stations: Wind Speed
180
160
140
)
120
/
d
m
(
K
100
d
e
e
p
80
S
d
i
n
60
W
40
20
0
Oct
Nov
Dec
Jan
Feb
Mar
Apr
May
Jun
Jul
Aug
Sep
Tsabong
156
130
112
104
95
78
78
60
69
69
95
121
Kuruman
130
164
164
147
147
130
95
95
95
130
130
147
Gobabis
147
147
130
112
112
104
104
112
147
130
147
147
Windhoek
130
130
112
95
95
86
86
95
130
112
130
130
Figure 2-15
Monthly mean wind speed at selected sites in the project area
Geotechnical Consulting Services
12
Groundwater Review of the Molopo-Nossob Basin
Report No. ORASECOM/005/2009
2.4.5 Solar radiation and sunshine hours
Solar radiation and sunshine hours are variables responsible for thermodynamic component
of evaporation process. Solar radiation is a measure of the amount of solar radiation received
from the sun while sunshine hour is the effective hours of clear sky number of sunshine hours
at a given location. There is seasonal fluctuation of solar radiation and sunshine hours owing
to the presence of cloud in the atmosphere. It is in general higher during rainy seasons. A
comparison of the sunshine hours and solar radiation at four selected stations in the Molopo-
Nossob Basin is illustrated in Figure 2-16 and Figure 2-17, respectively.
Molopo-Nossob Basin Stations: Sunshine Hours
12
10
8
r
s
u
o
H
e
6
i
n
s
h
n
u
S
4
2
0
Oct
Nov
Dec
Jan
Feb
Mar
Apr
May
Jun
Jul
Aug
Sep
Tsabong
11.0
11.0
10.6
10.6
10.0
9.8
9.4
9.3
9.7
9.7
10.6
10.6
Kuruman
11.0
11.4
11.2
10.8
10.1
9.5
9.4
9.5
9.5
9.8
10.3
10.6
Gobabis
10.5
10.1
10.3
9.2
9.0
9.1
9.3
10.0
9.8
10.5
10.9
10.5
Windhoek
10.3
9.9
9.3
9.2
8.9
9.1
8.9
9.8
10.1
10.4
10.9
10.7
Figure 2-16
Monthly mean Sunshine hours at selected sites in the project area
Molopo-Nossob Basin Stations: Solar Radiation
35
30
)
/
d
25
2
J
/
m
20
(
M
n
t
i
o
i
a
15
d
a
r
R
l
a
o
10
S
5
0
Oct
Nov
Dec
Jan
Feb
Mar
Apr
May
Jun
Jul
Aug
Sep
Tsabong
26
28
28
28
26
23
19
16
15
16
19
23
Kuruman
26
28
29
28
26
22
19
16
14
15
19
22
Gobabis
26
26
27
25
24
22
20
18
16
18
21
23
Windhoek
25
26
26
25
24
22
20
18
17
18
21
24
Figure 2-17
Monthly mean solar radiation at selected sites in the project area
Geotechnical Consulting Services
13
Groundwater Review of the Molopo-Nossob Basin
Report No. ORASECOM/005/2009
2.4.6 Evaporation and Evapotranspiration
Evapotranspiration (ET) is a term used to describe the sum of evaporation and plant
transpiration from the land surface to atmosphere. Evaporation accounts for the movement of
water to air from sources such as soil, canopy interception, and water bodies. Transpiration
accounts for the movement of water within a plant and the subsequent loss of water as vapor
through stomata in its leaves.
Potential evapotranspiration (PET or ETo) is a representation of the environment demand for
evapotranspiration. In the irrigation water demand terms it is also referred to as reference
evapotranspiration representing ET rate from a short green crop, completely shading the
ground, of uniform height and with adequate water status in the soil profile. It is a reflection
of the energy available to evaporate water, and of the wind available to transport the water
vapor from the ground up into the lower atmosphere. Evapotranspiration is said to equal
potential evapotranspiration when there is ample water.
Evapotranspiration is a significant water loss from a watershed. Types of vegetation and land
use significantly affect evapotranspiration, and therefore the amount of water leaving a
watershed. Because water transpired through leaves comes from the roots, plants with deep
reaching roots can more constantly transpire water. Factors that affect evapotranspiration
include the plant's growth stage or level of maturity, percentage of soil cover, solar radiation,
humidity, temperature and wind.
In areas that are not irrigated, in irrigation practice, actual evapotranspiration is usually no
greater than precipitation, with some buffer in time depending in the soil's ability to hold
water. It will usually be less because some water will be lost due to percolation or surface
runoff. An exception is areas with high water tables, where capillary action can cause water
from the groundwater to rise through the soil matrix to the surface. If potential
evapotranspiration is greater than the actual precipitation, soil will dry out, unless irrigation is
used.
The actual evapotranspiration can never be greater than PET, but can be lower if there is not
enough water to be evaporated or plants are unable to readily transpire.
Potential evapotranspiration (PET) incorporates the energy available for evaporation and the
ability of the lower atmosphere to transport evaporated moisture away from land surface.
PET is higher in the summer, on less cloudy days, and closer to the equator. Because of the
higher levels of solar radiation that provider the energy for evaporation. PET is also higher on
windy days because the evaporated moisture can be quickly moved from the ground of
plants, allowing more evaporation to fill its place.
Even though, extensive open water evaporation measurements do exist in South Africa,
Botswana and Namibia have very scant pan evaporation information. In Botswana, a method
adopted for estimating open water evaporation was developed in 1987 (DWA, 1987) which is
based on a regression model relating annual evaporation with annual rainfall. Other
commonly used approach is to use models such as the Penman or Penman ŁMonteith
Methods that rely on observed climate data. FAO has developed a widely used method based
on the later approach (Allen et al, 1998). The CLIMWAT database (FAO, 1993) comprises of
climate as well as derived reference crop evapotranspiration records at selected synoptic
stations. An approximate map of reference evapotranspiration was prepared from network of
Geotechnical Consulting Services
14
Groundwater Review of the Molopo-Nossob Basin
Report No. ORASECOM/005/2009
existing climate stations available from the project area. The maps are comparable to the ones
prepared based on the 1993 FAO database (FAO, 1993). The data were interpolated using the
inverse distance squared method available in the Arc View spatial analyst module, results of
which are reported in Alemaw and Sebusang (2008).
A typical monthly distribution of potential evapotranspiration for selected stations in the
Molopo-Nossob Basin is illustrated in Figure 2-18. The evaporation estimated by the model
used in Botswana, disaggregated in monthly values assuming similar monthly distribution as
the reference evapotranspiration values shown in Figure 2-19. A generalized spatial pattern
of reference evapotraspiration map based on interpolation of the FAO CLIMWAt database
(FAO, 1993) is shown in Figure 2-20.
Molopo-Nossob Basin Stations: Evapotranspiration
300
250
)
m
200
(
m
n
t
i
o
i
r
a
150
s
p
n
t
r
a
o
p
100
a
v
E
50
0
Oct
Nov
Dec
Jan
Feb
Mar
Apr
May
Jun
Jul
Aug
Sep
Tsabong
180
189
195
195
160
143
108
78
60
65
96
132
Kuruman
161
189
202
198
162
140
102
74
60
71
96
126
Gobabis
180
186
192
180
151
146
117
102
93
96
121
147
Windhoek
171
174
177
171
143
136
108
93
84
87
115
138
Figure 2-18
Monthly mean potential evapotranspiration at selected sites
Molopo-Nossob Basin Stations: Evaporation
300
250
)
200
m
(
m
n
t
i
o
150
r
a
o
p
a
v
E
100
50
0
Oct
Nov
Dec
Jan
Feb
Mar
Apr
May
Jun
Jul
Aug
Sep
Tsabong
239
251
260
260
212
190
144
103
80
87
128
176
Kuruman
210
246
262
258
211
181
133
97
78
93
125
164
Gobabis
219
227
234
219
184
178
143
125
113
117
147
179
Windhoek
223
227
231
223
187
178
141
122
110
113
150
180
Figure 2-19
Monthly mean evaporation at selected stations in the project area
Geotechnical Consulting Services
15
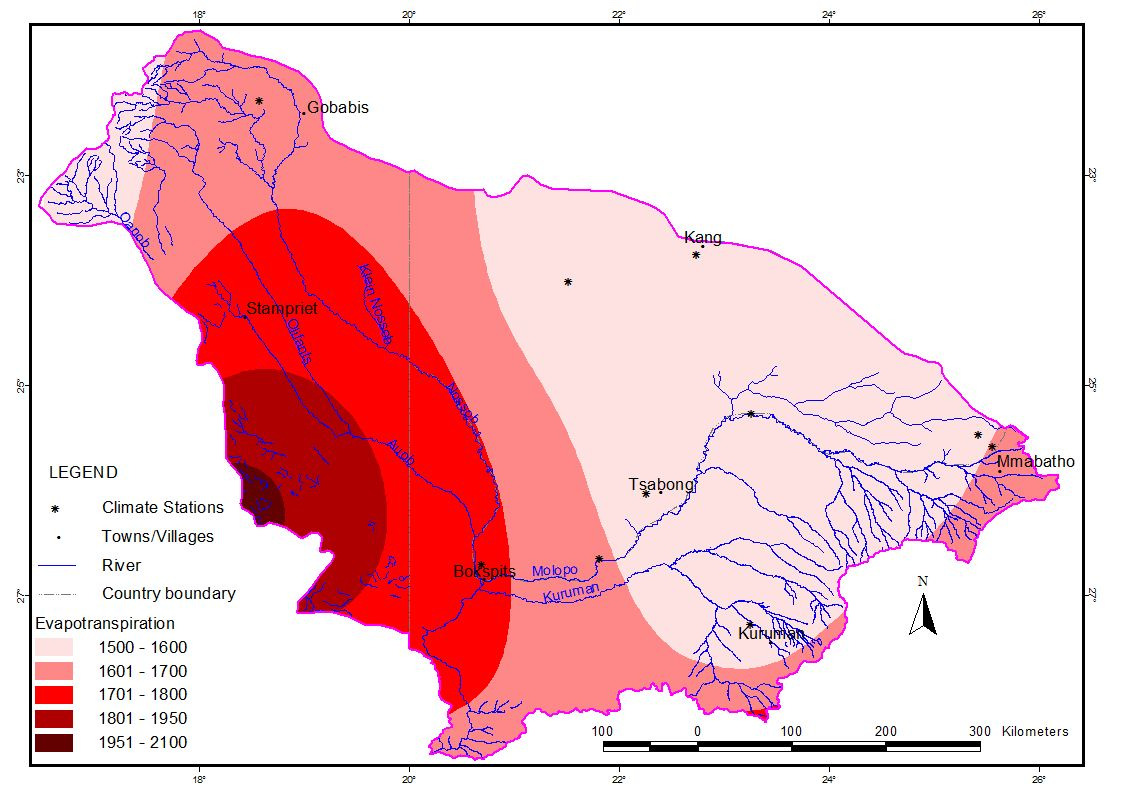
Groundwater Review of the Molopo-Nossob Basin
Report No. ORASECOM/005/2009
Figure 2-20
Mean annual reference evapotranspiration in the Molopo-Nossob sub-basin
2.4.7 Rainfall and ETo at selected stations
The Molopo-Nossob Basin and its tributary rivers have pronounced seasonal variation in
flow, with negligible low season flows. Rainfall varies considerably from year to year.
Figure 2-21 shows the seasonal variation of precipitation in relation to ETo at selected
stations within the Molopo-Nossob Basin.
2.4.8 Aridity Index
Average annual PET is generally compared to average annual precipitation, P. The ratio of
the two, P\PET, is the aridity index (AI). Such an index is a numerical indicator of the degree
of dryness of the climate at a given location, A number of aridity indices have been proposed;
these indicators serve to identify, locate or delimit regions that suffer from a deficit of
available water, a condition that can severely affect the effective use of the land for such
activities as agriculture or stock farming.
UNEP has adopted the index of aridity, defined by the formula:
AI = P/PET
Where PET is the potential evapotranspiration and P is the average annual precipitation
(UNEP, 1992). PET and P must be expressed in the same units, e.g., in mm/a. The various
degrees of aridity are then defined according Table 2-5.
Geotechnical Consulting Services
16
Groundwater Review of the Molopo-Nossob Basin
Report No. ORASECOM/005/2009
a. Tsabong, Botswana, Molopo River
200
Rainfall
180
ETo
160
) 140
m
120
l
(
m
t
a 100
t
o
t
h
80
n
o
M
60
40
20
0
Oct
Nov
Dec
Jan
Feb
Mar
Apr
May
Jun
Jul
Aug
Sep
b. Kuruma, South Africa, Kuruman River
200
Rainfall
180
ETo
160
) 140
m
120
l
(
m
t
a 100
t
o
t
h
80
n
o
M
60
40
20
0
Oct
Nov
Dec
Jan
Feb
Mar
Apr
May
Jun
Jul
Aug
Sep
c. Gababis, Namibia, Nossob River
200
Rainfall
180
ETo
160
) 140
m
120
l
(
m
t
a 100
t
o
t
h
80
n
o
M
60
40
20
0
Oct
Nov
Dec
Jan
Feb
Mar
Apr
May
Jun
Jul
Aug
Sep
d. Windhoek, Namibia, Oanob River
200
Rainfall
180
ETo
160
140
)
m 120
l
(
m
t
a 100
t
o
t
h
n
80
o
M
60
40
20
0
Oct
Nov
Dec
Jan
Feb
Mar
Ap r
May
Jun
Jul
Aug
Sep
Figure 2-21
Mean monthly rainfall and potential evapotranspiration in the Molopo-Nossob Basin
Geotechnical Consulting Services
17
Groundwater Review of the Molopo-Nossob Basin
Report No. ORASECOM/005/2009
Table 2-5
UNEP classification of various degrees of aridity based on their index of aridity (UNEP, 1992)
Global land
Molopo-Nossob Area
Classification
Aridity Index
area
Hyperarid
AI < 0.05
7.5%
0%
Arid
0.05 < AI < 0.20
12.1%
40%
Semi-arid
0.20 < AI < 0.50
17.7%
60%
Dry subhumid
0.50 < AI < 0.65
9.9%
0%
The annual precipitation data and the estimated annual potential evapotranspiration of the
Molopo-Nossob basin was used in developing the Aridity index map for the basin which
shows that the area to be classified as Arid and Semi-Arid.
The aridity Map of the Molopo-Nossob Basin is shown in Figure 2-22. About 18% of the
basin is classified as arid, whereas the remaining 17% is classified as semi-arid.
Aridity Index
-22 S
0.40
-23 S
0.35
-24 S
0.30
-25 S
0.25
0.20
-26 S
0.15
-27 S
0.10
-28 S
0.05
17 E
18 E
19 E
20 E
21 E
22 E
23 E
24 E
25 E
26 E
Figure 2-22
Aridity Index Map of the Study area
2.4.9 Droughts
The Molopo-Nossob Basin is at several occasions hit by what is called drought and the
ramifications thereof. There are numerous conceptions of drought available in the literature.
In water resources planning the concept of drought adopted is based on climatic and
hydrological definitions of drought (DWA, 2006).
Meteorological drought is defined as an interval of time, generally of the order of months or
years, during which the actual moisture supply at a given place cumulatively falls short of the
Geotechnical Consulting Services
18
Groundwater Review of the Molopo-Nossob Basin
Report No. ORASECOM/005/2009
level of supply which is appropriate under the prevailing climatic conditions of that place.
Hydrological drought typically refers to periods of below-normal stream flow and/or depleted
reservoir storage.
Taking these two definitions together, it is obvious that a meteorological drought may lead to
a hydrologic drought but this does not necessarily be so. With careful planning, it is possible
to experience a meteorological drought without it having an impact on water resources, e.g.
by building storage reservoirs.
In terms of water resources planning, two aspects of drought are of interest: (i) the duration
of the drought and (ii) its severity. The severity of a drought indicates the magnitude of the
shortfall in the rainfall. This severity is normally expressed as an index. There are several
indices that measure how much precipitation for a given period of time has deviated from
historically established norms. Although none of the major indices is inherently superior to
the rest in all circumstances, some indices are better suited than others for certain uses. For
example, the Palmer Drought Severity Index is widely used by the U.S. Department of
Agriculture to determine when to grant emergency drought assistance, and this Palmer index
is better when working with large areas of uniform topography.
Quantitatively, a drought is characterized with an index computed as a measure of the extent
of negative departures of the rainfall from a pre-determined normal or average. The larger the
departure in the negative direction, the severe the drought is taken to be. A combination of
the severity and the duration gives an idea of the drought intensity.
There are many methods available for computing drought index. One consideration that
influences the choice of a method is the availability of suitable data and the simplicity of the
interpretation of the indices obtained.
In Botswana, the attention was focused on using the Standardized Precipitation Index (SPI)
(McKee, Doesken, and Kleist, 1993). The SPI was designed to quantify the precipitation
deficit for multiple time scales. These time scales reflect the impact of drought on the
availability of the different water resources. Soil moisture conditions respond to precipitation
anomalies on a relatively short scale. Groundwater, stream flow, and reservoir storage reflect
the longer-term precipitation anomalies. For these reasons, the SPI can be calculated for
various month time scales (3, 6, 12, 24, etc).
The SPI is based on the cumulative probability of a given rainfall event occurring at a station.
The historic rainfall data of the station is fitted to a gamma distribution (as the gamma
distribution has been found to fit the precipitation distribution quite well). The process allows
the rainfall distribution at the station to be effectively represented by a mathematical
cumulative probability function. Based on the historic rainfall data the probability of the
rainfall being less than or equal to a certain amount can be assessed. Thus, the probability of
rainfall being less than or equal to the average rainfall for that area will be about 0.5, while
the probability of rainfall being less than or equal to an amount much smaller than the
average will be also be lower (0.2, 0.1, 0.01 etc, depending on the amount). Therefore if a
particular rainfall event gives a low probability on the cumulative probability function, then
this is indicative of a likely drought event. Alternatively, a rainfall event which gives a high
probability on the cumulative probability function is an anomalously wet event.
Geotechnical Consulting Services
19
Groundwater Review of the Molopo-Nossob Basin
Report No. ORASECOM/005/2009
Rainfall is the variable in a gamma distribution function which will have a standard deviation
and a mean which depends on the rainfall characteristics of that area. Different stations will
most likely have a very different standard deviation and a different mean. Therefore it will be
difficult to compare rainfall events for two or more different areas in terms of drought, as
drought is really a "below-normal" rainfall event. And what is "normal rainfall" in one area
can be surplus rainfall in another area, speaking strictly in terms of rainfall amounts.
The cumulative probability gamma function is therefore transformed into a standard normal
random variable Z with mean of zero and standard deviation of one. A new variable is
formed, and the transformation is done in such a way that each rainfall amount in the old
(gamma) function has got a corresponding value in the new (transformed) Z function. And
the probability that the rainfall is less than or equal to any rainfall amount will be the same as
the probability that the new variable is less than or equal to the corresponding value of that
rainfall amount. All probability functions which have resultant transformed variable are
always in the same units.
The SPI is a representation of the number of standard deviations from the mean at which an
event occurs, often called a "z-score". The unit of the SPI can thus be considered to be
"standard deviations". Standard deviation is often described as the value along a distribution
at which the cumulative probability of an event occurring is 0.1587. In a like manner, the
cumulative probability of any SPI value can be found, and this will be equal to the
cumulative probability of the corresponding rainfall event. Table 2-6 gives the cumulative
probabilities for various SPI values.
Table 2-6
SPI and corresponding cumulative probability
SPI
Cumulative Probability
SPI
Cumulative Probability
-3.0
0.0014
0.0
0.5000
-2.5
0.0062
0.5
0.6915
-2.0
0.0228
1.0
0.8413
-1.5
0.0668
1.5
0.9332
-1.0
0.1587
2.0
0.9772
-0.5
0.3085
2.5
0.9938
0.0
0.5000
3.0
0.9986
The SPI can effectively represent the amount of rainfall over a given time scale, with the
advantage that it provides not only information on the amount of rainfall, but that it also gives
an indication of what this amount is in relation to the normal, thus leading to the definition of
whether a station is experiencing drought or not. The longer the period used to calculate the
distribution parameters, the better results (e.g. 50 years better than 20 years).
McKee et al. (1993) used the classification system shown in the SPI values table (Table 2-7)
to define drought intensities resulting from the SPI. McKee et al. (1993) also defined the
criteria for a drought event for any of the time scales. A drought event occurs any time the
SPI is continuously negative and reaches an intensity of -1.0 or less. The event ends when the
SPI becomes positive. Each drought event, therefore, has a duration defined by its beginning
and end, and intensity for each month that the event continues. The positive sum of the SPI
for all the months within a drought event can be termed the drought's "magnitude".
Geotechnical Consulting Services
20
Groundwater Review of the Molopo-Nossob Basin
Report No. ORASECOM/005/2009
Table 2-7
Interpretation of SPI classes
SPI Values
Characterization
2.0+
Extremely wet
1.5 to 1.99
Very wet
1.0 to 1.49
Moderately wet
-0.99 to 0.99
Near normal
-1.0 to -1.49
Moderately dry
-1.5 to -1.99
Very dry
-2 and less
Extremely dry
The SPI was computed from the rainfall data of 55 years long-term rainfall stations for
Tsabong Station. SPI was also computed for 85 years of Kuruman Station (SA Station Code
0393778W).
The calculations were done on a monthly basis and then aggregated on hydrological year
basis (October to September). Both the monthly and annually aggregated values have been
used to draw Figure 2-23 to Figure -2-26.
The results suggest that drought is endemic to most parts of the Molopo-Nossob Basin.
However, it should be noted that the annual cumulative indices plotted in the above figures
actually obscure the monthly drought occurrences. This is because even for the years showing
above average rainfall, there could be several months of below average rainfall.
The results show further that while drought occurs frequently, it is not persistent as shown by
a large negative SPI being followed by a positive SPI. The stations used in the analysis are
too few to depict any spatial pattern. However, it is interesting to note that while the rainiest
part of the Molopo-Nossob Basin had no drought period, the driest part (Tsabong) only had a
few years of below average rainfall: 8 years over a 55-year period analyzed.
Both the records of Tsabong and Kuruman showed beginning of 1970s and middle of 1990s
as sustained period of below normal rainfall, with lowest SPI, which is a characteristic
manifestation of drought occurrence during these periods. Moreover, Kuruman experienced
another dry period around end of 1960s and beginning of 1970s.
2.5 Main Rivers
2.5.1 Auob River
The Auob River basin can be seen in two distinct parts, which in terms of surface water are
unlikely to be connected except under exceptionally high flood conditions. The top of the
basin is occupied by the Oanob River which rises in the Khomas Holchland and flows in a
south-easterly direction to the recently constructed Oanob Dam and then on through the town
of Rehoboth. After that the terrain becomes very flat and the river eventually becomes lost in
the Kalahari Sands. Only 50 km further to the south-west does the river channel form again to
meet the Auob River. The Auob River has its origin in the Karubeam Mountains Northeast of
Mariental town, from where it flows in a South-easterly direction towards the South African
border and eventual confluence with the Molopo River. Maximum rainfall over the
catchment is close to 400 mm and this reduces to a minimum of about 200 mm in its lower
part.
Geotechnical Consulting Services
21
Groundwater Review of the Molopo-Nossob Basin
Report No. ORASECOM/005/2009
Monthly Rainfall and SPI: Tsabong, 1950/51-2003/04
40
0
35
30
50
25
20
100
15
I
P
S
10
150
5
Monthly Rainfall (mm)
0
200
-5
-10
-15
250
0
1
2
4
5
7
8
9
1
2
4
5
7
8
9
1
2
4
5
6
8
9
1
2
4
5
6
8
9
1
2
3
5
6
8
9
1
2
3
5
5
5
5
5
5
5
5
6
6
6
6
6
6
6
7
7
7
7
7
7
7
8
8
8
8
8
8
8
9
9
9
9
9
9
9
0
0
0
9
9
9
9
9
9
9
9
9
9
9
9
9
9
9
9
9
9
9
9
9
9
9
9
9
9
9
9
9
9
9
9
9
9
9
9
0
0
0
1
1
1
1
1
1
1
1
1
1
1
1
1
1
1
1
1
1
1
1
1
1
1
1
1
1
1
1
1
1
1
1
1
1
1
1
2
2
2
Figure 2-23
Monthly rainfall and SPI values for Tsabong
Annual Rainfall and SPI: Tsabong, 1950/51-2003/04
20.0
0
17.5
100
15.0
200
A
n
n
12.5
300
u
a
l
R
a
10.0
400
i
n
f
a
l
l
I
(
P
m
7.5
500
S
m
)
5.0
600
2.5
700
0.0
800
-2.5
900
-5.0
1000
0
2
4
6
8
0
2
4
6
8
0
2
4
6
8
0
2
4
6
8
0
2
4
6
8
0
2
4
5
5
5
5
5
6
6
6
6
6
7
7
7
7
7
8
8
8
8
8
9
9
9
9
9
0
0
0
9
9
9
9
9
9
9
9
9
9
9
9
9
9
9
9
9
9
9
9
9
9
9
9
9
0
0
0
1
1
1
1
1
1
1
1
1
1
1
1
1
1
1
1
1
1
1
1
1
1
1
1
1
2
2
2
Figure 2-24
Annual rainfall and SPI values for Tsabong
Geotechnical Consulting Services
22
Groundwater Review of the Molopo-Nossob Basin
Report No. ORASECOM/005/2009
Monthly Rainfall and SPI: Kuruman, 1920/21-2003/04
40
0
35
50
30
25
100
20
M
o
n
t
15
h
l
y
150 Ra
10
I
i
n
P
f
a
S
l
l
5
(
m
200 m)
0
-5
250
-10
-15
300
-20
-25
350
0
2
4
6
9
1
3
5
8
0
2
4
7
9
1
3
6
8
0
2
5
7
9
1
4
6
8
0
3
5
7
9
2
4
6
8
1
3
2
2
2
2
2
3
3
3
3
4
4
4
4
4
5
5
5
5
6
6
6
6
6
7
7
7
7
8
8
8
8
8
9
9
9
9
0
0
9
9
9
9
9
9
9
9
9
9
9
9
9
9
9
9
9
9
9
9
9
9
9
9
9
9
9
9
9
9
9
9
9
9
9
9
0
0
1
1
1
1
1
1
1
1
1
1
1
1
1
1
1
1
1
1
1
1
1
1
1
1
1
1
1
1
1
1
1
1
1
1
1
1
2
2
Figure 2-25
Annual rainfall and SPI values for Tsabong
Annual Rainfall and SPI: Kuruman, 1920/21-2003/04
20.0
0
17.5
100
15.0
200
A
12.5
n
n
300
u
a
10.0
l
R
a
i
400
n
7.5
f
a
l
l
I
(
m
P
5.0
500
S
m
)
2.5
600
0.0
700
-2.5
800
-5.0
900
-7.5
-10.0
1000
0
3
6
9
2
5
8
1
4
7
0
3
6
9
2
5
8
1
4
7
0
3
6
9
2
5
8
1
4
2
2
2
2
3
3
3
4
4
4
5
5
5
5
6
6
6
7
7
7
8
8
8
8
9
9
9
0
0
9
9
9
9
9
9
9
9
9
9
9
9
9
9
9
9
9
9
9
9
9
9
9
9
9
9
9
0
0
1
1
1
1
1
1
1
1
1
1
1
1
1
1
1
1
1
1
1
1
1
1
1
1
1
1
1
2
2
Figure 2-26
Annual rainfall and SPI values for Kuruman
The elevation range of the Auob Basin is 1090 -2417 mamsl (meters above mean sea level)
and the catchment vegetation types are high savannah (Oanob) and mixed tree and shrub
savannah (Auob).
Geotechnical Consulting Services
23
Groundwater Review of the Molopo-Nossob Basin
Report No. ORASECOM/005/2009
Most of the upper part of the Oanob River catchment is commercial farmland, with many
farm dams in this area. From the Oanob Dam downstream for about 30 km the land is manly
communal land and most if the remaining land is commercial farmland. Around Rehoboth
most of the communal area is overgrazed.
The Oanob River alluvial aquifer historically supplied bulk water to the town of Rehoboth
but with construction of the Oanob Dam the wellfied has been abandoned. Although the
construction of the dam has drastically reduced recharge to the downstream aquifer it still
remains a resource that could be brought into production. It is however, necessary that the
behaviour of this aquifer be investigated under the change recharge conditions brought about
by the construction of the dam.
In the Auob River Basin the commercial farmers are provided to a great deal by artesian
water to commercial farmers upstream of Stampriet and between Stampriet and Gochas.
Much of the water is used for irrigation.
The Olifants River, main tributary to the Auob River originates in the mountainous area
surrounding Windhoek and flows parallel to and in between the Nossob and Auob Rivers. It
joins Auob River about 175 km upstream of the merging of the Auob and Nossob Rivers a
short distance upstream of its confluence with the Molopo River. In its lower part the Nossob
River forms the south-western boundary between Botswana and South Africa down to its
confluence with the Molopo.
The mean annual runoff of the Oanob River at the Oanob Dam is 12.14 Mm3. The dam has
been placed close to the point of maximum runoff potential and the natural surface runoff
reduces to zero within the next 100 km. In the Auob River the mean annual runoff is
estimated at 5.23 Mm3 at Stampriet rising to 8.60 Mm3/yr at Gochas. After this the runoff
decreases rapidly.
There are several state water schemes in the catchment, at Rehoboth, Stampriet, and Gochas.
Significant quantities of groundwater are used for irrigation alongside the Auob River and
some potential for irrigation in the vicinity of Rehoboth is identified (100 ha). Both the
Oanob and Auob Rivers are adequately monitored.
2.5.2 Nossob River
The Nossob River rises as two main tributaries, the White Nossob in the Otjihavera
Mountains to the east of Windhoek, and as the Black Nossob further to the north-east. Mean
annual precipitation in these areas is approximately 370 mm.
The main commercial activity within the basin, is large stock farming, which is practiced on a
commercial basis almost throughout. The economic activity centers include Gobabis, Witvlei,
Leonardville and Aronos. Agriculture provides the backbone to the economy of the
catchment. Development of Tourism is limited to a few lodges and game farms. In order to
increase water supply security for the town of Gobabis, in the upper part of the Nossob
Catchment, a wellfield is established in carbonate aquifers.
Runoff potential of the upper parts of both river is significant, especially of the White
Nossob. The potential of both the White and the Black Nossob Rivers, however, is
significantly affected by the presence of farm dams in the headwaters. A large dam was built
Geotechnical Consulting Services
24
Groundwater Review of the Molopo-Nossob Basin
Report No. ORASECOM/005/2009
on the White Nossob in 1984, which has effectively reduced the frequency of flow further
downstream from flow most years (90%) to flow once in every four or five years.
Black and White Nossob Rivers join approximately 70 km south of the town of Gobabis.
Black Nossob River is dammed further downstream at Gobabis. The mean annual runoff is
estimated at 1.90 Mm3. Runoff potential of the lower parts of the basin, where the river
crosses the Kalahari Sands is much lower. The Nossob River is gauged after the confluence
of the two streams, and mean annual runoff here is very small, especially after the
construction of the Otjivero Dam.
There is no recorded history of the Nossob River ever contributing surface water flow to the
Molopo River. There are several state water schemes in the catchment, most important of
which is the Gobabis Bulk Water Scheme which includes the Ontjivero, and Viljoen Dams
and boreholes. Other includes Summerdown, Steinhausen, Witvlei, Leonardville and Aranos.
The elevation range of the Nossob catchment area is 1,150-2,177 mamsl. The main
vegetation types in the catchment area are highland Camelthorn savannah, mixed tree and
shrub savannah.
There are six gauging stations in the basin. The Black Nossob River is not gauged in its upper
reaches, but otherwise the catchment is adequately gauged.
Most of the area covered by the Auob and Nossob Rivers is underlain by the Stampriet
Artesian Basin which extends eastwards into Botswana. This is the largest aquifer system in
Namibia, covering an area of some 65,000 km2. This resource is used for domestic supply,
livestock watering and irrigation by both commercial and communal farmers and also
supplies the towns of Stampriet, Gochas, Aranos and Leonardville with bulk water. The
Stampriet Artesian is a Subterranean Water Control Area as described in Chapter 3.
A decline in water levels within the Stampriet Artesian Aquifer has been recorded since
1985, when monitoring commenced. Studies of the resource were made in the late 1980's to
establish the effect of irrigation farming on the resource. Irrigation activity has doubled over
the past decade prompting another major investigation of the resource that is currently in
progress. In the area there are over 7,000 abstraction boreholes for various purposes.
Although abstraction is controlled by permits, little actual regulation and control takes place.
2.5.3 Molopo River
Molopo River emanates in South Africa from the area to the East of Mafeking, where it is fed
by various springs, most notably the Molopo Eye (9.4 Mm3/a) and the Grootfontein Eye 4.9
Mm3/a) (ORASECOM, 2009). The river forms the border between South Africa and
Botswana up to the confluence with the Nossob River. Several dry-beds, ephemeral streams
join the Molopo River along its upper reaches. These include localized tributaries from the
South e.g. Setklagole, Phepane and Disipi Rivers and tributaries from the North (Botswana)
e.g. Ramatlabama and Melatswane.
Molopo River receives most of its flow from tributaries in the South Africa, even if its major
catchment area is within Botswana (58%). In South Africa most of the river are dammed for
irrigation and agriculture. As a result, inflow to the Molopo River, which forms the boundary
Geotechnical Consulting Services
25
Groundwater Review of the Molopo-Nossob Basin
Report No. ORASECOM/005/2009
between Botswana and South Africa, has become heavily reduced and even non-existent in
some years.
Molopo River within Botswana is formed as clear channels draining from the Goodhope,
Phitshane Molopo and the Karst-Dolomitic formations around the Kanye area in Southern
Botswana.
After joining the Nossob River at Bokspits and the Kuruman River 4 km further
downstreams, the Molopo River flows southwards to join Orange River after approximately
another 250 km.
2.5.4 Kuruman River
The Kuruman River originates Southeast of Kuruman town, where it is fed by various
dolomitic springs, most notably the Great Koning Eye, Little Koning Eye and the Kuruman
Eye. Originally, the river flowed in a North-westerly direction over a distance of
approximately 140 km. It then turns West and flows parallel to the Molopo River until its
confluence with Molopo River at Andriesvale, about 4 km downstream the confluence
between Molopo and Nossob Rivers. Various tributaries join the Kuruman River along its
upper reaches, including Ga-Mogara, Moshaweng, Mathlawareng and Kgokgole River. The
whole catchment area for the Kuruman River is located inside South Africa.
2.6 Dams
A number of dams are found within the Molopo-Nossob basin. They supply a few high water
demand sites in South Africa and Namibia. The distribution of dams in the sub-basin is
shown in Figure 2-27. The major dams are listed in Table 2-8.
Irrigation water use and cattle water needs in the sub-basin are also met in the different parts
of the riparian states. In terms of farm dams in the Molopo-Nossob Basin, based on
information obtained from evaluation of 1:50 000 topo-cadastral maps, a total of 687 farm
dams (in year 2000) are identified. The total storage capacity of these dams is estimated to be
125 Mm│ (ORASECOM 2008a). These consist of in-stream dams (369) with a total storage
capacity of 120 Mm│ (95.9%) and of channel dams (318) with a total storage of 5 Mm│
(4.1%) (ORASECOM 2008a, b).
Table 2-8
Dams within the Molopo-Nossob Basin
Full
Nearest
Supply
Yield
Name of Dam
Country
River
Latitude Longitude
City
capacity
(Mm3/a)
(Mm3)
Black
Daan Viljoen
Namibia
Gobabis
-22.2097 18.8389
0,429
0,36
Nossob
Black
Tilda Viljoen
Namibia
Gobabis
-22.4442 18.9528
1,224
0,36
Nossob
White
Otjivero Main
Namibia
Windhoek
-22.2886 17.9653
9,808
1,65
Nossob
Geotechnical Consulting Services
26
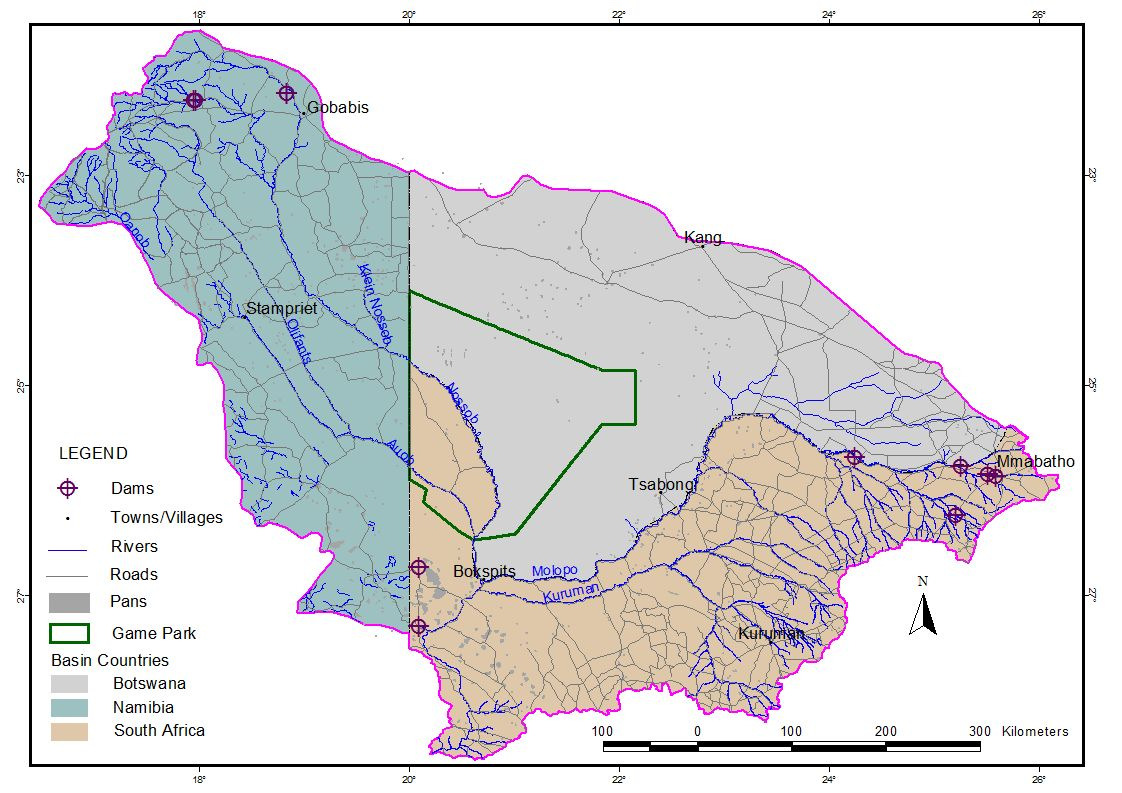
Groundwater Review of the Molopo-Nossob Basin
Report No. ORASECOM/005/2009
Full
Nearest
Supply
Yield
Name of Dam
Country
River
Latitude Longitude
City
capacity
(Mm3/a)
(Mm3)
White
Otjivero Silt
Namibia
Windhoek
-22.2944 17.9406
7,795
1,65
Nossob
Lotlamoreng
South Africa Mafeking
Molopo
-25.8666 25.6000
0.5
Modimolo
South Africa Mafeking
Molopo
-25.8500 25.5166
21,5
13,2
Disaneng
South Africa Mafeking
Molopo
-25.7666 25.2666
17,4
1,0
Koedoesrand
South Africa Mafeking
Koedoe
-26.2333 25.2166
0,75
Unknown
Blackheath
South Africa Vryburg
Molopo
-25.6833 24.2500
0,124
Twe
Leeubos
South Africa
Swartbas
-26.7333 20.1000
1,071
Rivieren
Abiekwasputs
Twee
South Africa
Molopo
-27.3000 20.1000
-
Unknown
pan
Rivieren
Source: ORASECOM, 2008a
Figure 2-27
Dams in the Molopo-Nossob Basin
2.7 Transfer Systems
In the Molopo-Nossob basin, a number of water transfer systems exist. Table 2-9
summarizes the water system in the basin, which is also shown on the map in Figure 2-28.
Geotechnical Consulting Services
27
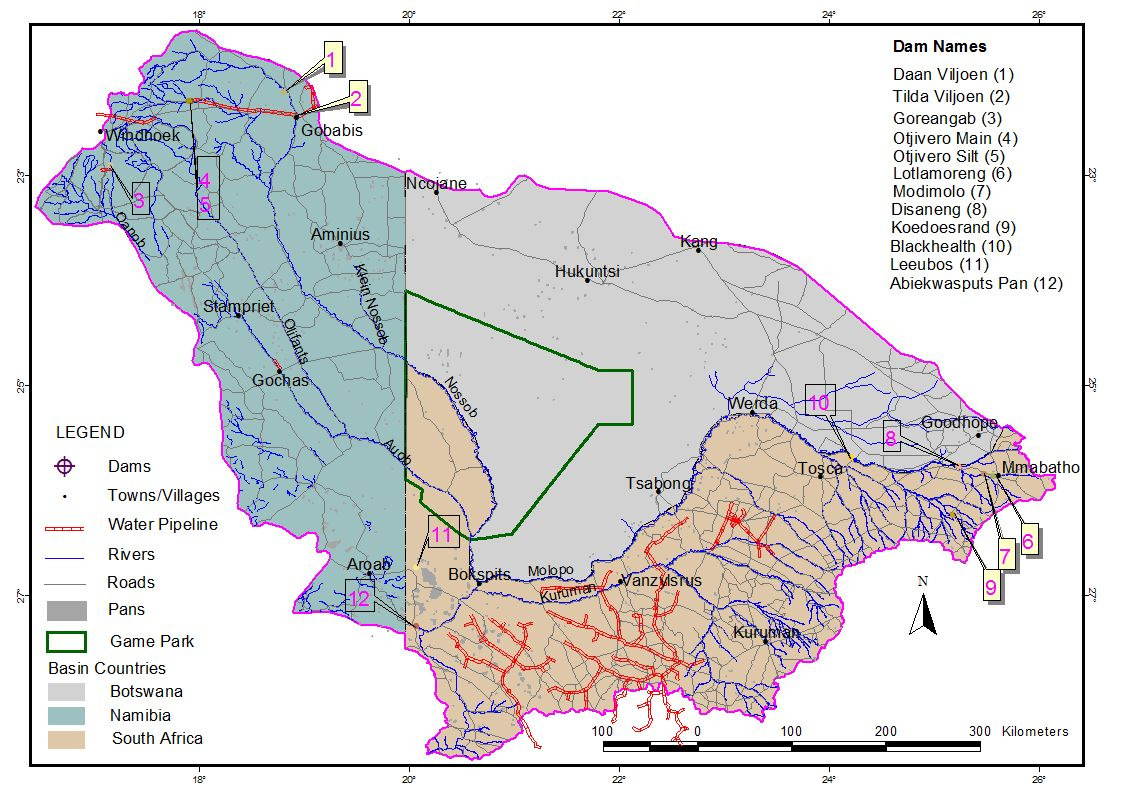
Groundwater Review of the Molopo-Nossob Basin
Report No. ORASECOM/005/2009
Table 2-9
Major water transfer schemes into and within the Molopo-Nossob Basin
Country Scheme
Water from
Water to
Capacity Approximate
Mm3/a
transfer
South
Vaal-Gamagara
Vaal River
Middle basin incl. major
13.3
8.4 (1995)
Africa
mines
South
Kalahari West
Upington's
Western basin excl. the
1.99
0.42 (1995)
Africa
Rural Supply
municipal
Gemsbok area
system
South
Kalahari East
Vaal-Gamagara
Farming in the basin
3.11
1.3 (1995)
Africa
Rural Water
pipeline
north of Upington
Supply
Source: ORASECOM, 2008a
Figure 2-28
Major waterworks and transfers in the Molopo-Nossob Basin
2.8 Pans
Pans in the Molopo-Nossob Basin play a role in terms of meeting seasonal water needs. The
pans are mainly found in the Botswana and Namibian parts of the Basin. Apart from being
sources of water supply, in some instances they also have an impact on local drainage
patterns. The distribution of the pans in the basin is shown in Figure 2-29.
An inventory of existing pans was undertaken through ORASECOM's recently completed
project `Feasibility Study of the Potential for Sustainable Water Resources Development in
Geotechnical Consulting Services
28
Groundwater Review of the Molopo-Nossob Basin
Report No. ORASECOM/005/2009
the Molopo-Nossob Watercourse'. According to this study the water retaining capacity of all
2607 pans that exist in the area is found to be about 1.9 Mm│ (ORASECOM 2008a,b). The
distribution of these pans and their number, area and volume is summarised in Table 2-10.
Table 2-10
Details of Pans in the Molopo-Nossob Sub-basin
Catchment area
No. of pans
Volume (Mm3)
Area (km2)
Molopo
1179
1406
972
Kuruman
226
71
54
Nossob
676
279
167
Auob
526
230
141
Source: ORASECOM 2008a
-22 S
-23 S
-24 S
-25 S
-26 S
-27 S
-28 S
17 E
18 E
19 E
20 E
21 E
22 E
23 E
24 E
25 E
26 E
Figure 2-29
Geographic distribution of pans in the Molopo-Nossob Basin
Geotechnical Consulting Services
29
Groundwater Review of the Molopo-Nossob Basin
Report No. ORASECOM/005/2009
3 WATER REQUIREMENT
3.1 Users
The main part of the Molopo-Nossob Basin is under natural vegetation and a large portion of
the basin falls within the Kalahari Desert. Cultivated areas are found in the catchments areas
of the Upper Nossob and Olifants Rivers, and the south-eastern parts of the Molopo River
catchment near Mmabatho. In the Namibian cultivated areas, irrigation comes mainly from
groundwater sources whereas in South Africa the demand is also satisfied by farm dams.
According to ORASECOM (2008a), no afforestation or large-scale infestations of invasive
alien vegetation occur in the Basin, although land-invasion by Prosopis species is on the
increase in Namibia.
Large scale mining activity is found in the vicinity of Sishen and Hotazel in the upper
Kuruman River catchment where manganese ore, iron ore, tiger's eye and crocidolite (blue
asbestos) are mined.
The major towns and settlements in the Molopo-Nossob basin are listed in Table 3-1. In
South Africa the mining activities are supported by scattered rural settlements.
The water users in the Basin are divided into domestic users (urban and rural domestic),
irrigation, livestock watering, wildlife and mining and industry. In the domestic water
requirement there is usually a portion for small industry common in urban and rural villages.
Larger industry outside the domestic supply refers to activities in connection with mining,
pulp, construction, and energy production etc.
3.2 Botswana
The Molopo-Nossob basin covers a large area of the southern Botswana. In the "Groundwater
Pollution Vulnerability Map" (DGS, 1995) the surface water divide between the Molopo
catchment area in the south and the Okavango catchment area in the north is defined. This
water divide is used in the current project as the northern boundary of the Molopo-Nossob
basin in Botswana. The southern boundary follows the Molopo and Nossob Rivers and the
western boundary is the international border to Namibia (20oE longitude). Figure 3-1
presents the boundary and the area covered including major road and rural villages.
The basin covers approximately 130,000 km2 in Botswana. The area is covered by part of 7
various districts and sub-districts in Botswana, summarized in Table 3-2. In contrast to South
Africa, there are no water management areas delineated and defined in Botswana. For the
assessment of water use in Botswana, the administrative areas within the Molopo-Nossob
basin are used. Table 3-3 defines these areas.
Figures on population within the Molopo-Nossob Basin in Botswana (Table 3-2) are
collected from Central Statistics Office reports (CSO, 1997 and 2005), covering the census
conducted 1991 and 2001. For villages not included in the reports, median figures from the
population statistics in each sub-area are used.
Geotechnical Consulting Services
30
Groundwater Review of the Molopo-Nossob Basin
Report No. ORASECOM/005/2009
Table 3-1
Major towns and villages in the Molopo-Nossob Basin
Country
Town/village
Longitude
Latitude
Population
Botswana*
Tsabong
22.4066
-26.0225 6,731
Mmathethe
25.2746
-25.3314 4,908
Hukuntsi
21.7292
-24.0049 4,010
Kang
22.7919
-23.7246 3,943
Pitsane Siding
25.6192
-25.4693 3,289
Goodhope
25.4547
-25.4877 3,261
Digawana
25.5626
-25.3560 2,973
Khakhea
23.4961
-24.7076 2,136
Werda
23.3013
-25.2635 2,003
Lehututu
21.8355
-23.9171 1,810
Mabule
24.5611
-25.7723 1,766
Pitsane Molopo
25.1386
-25.7413 1,744
Mabutshane
23.5834
-24.3782 1,713
Ncojane
20.2879
-23.1636 1,477
Lokgwabe
21.7765
-24.1017 1,373
Ramatlabama
25.5364
-25.6482 1,305
Rakhuna
25.5850
-25.5670 1,213
Middlepits
21.8381
-26.6667 1,091
Sekoma
23.9181
-24.5194 1,084
Magoriapitse
25.2875
-25.4653 1,077
Kokotsha
23.1981
-24.9189 1,043
Gathwane
25.5334
-25.4215 1,025
Namibia
Gochas
18.7959
-24.8707
Windhoek (part of)
17.0932
-22.5856
Gobabis
18.9615
-22.4493
Aroab
19.6511
-26.7952
Stampriet
18.4022
-24.3431
Aminius
19.3748
-23.6507
Dordabis
17.6462
-22.9394
Uhlenhorst
17.9958
-23.7078
Koļs
19.1233
-25.9395
Onderombapa
19.5536
-23.1857
Rehoboth
17.0784
-23.2994
Leonardville
18.7897
-23.5039
Rietfontein
20.0019
-26.7591
Kwakwas
16.9273
-23.1984
South Africa Kuruman
23.4318
-27.4459
Tosca
23.9545
-25.8783
Vanzylsrus
22.0454
-26.8783
Mmabatho
25.6515
-25.8648
* =Population figures for Botswana year 2006 (CSO,2005)
Geotechnical Consulting Services
31
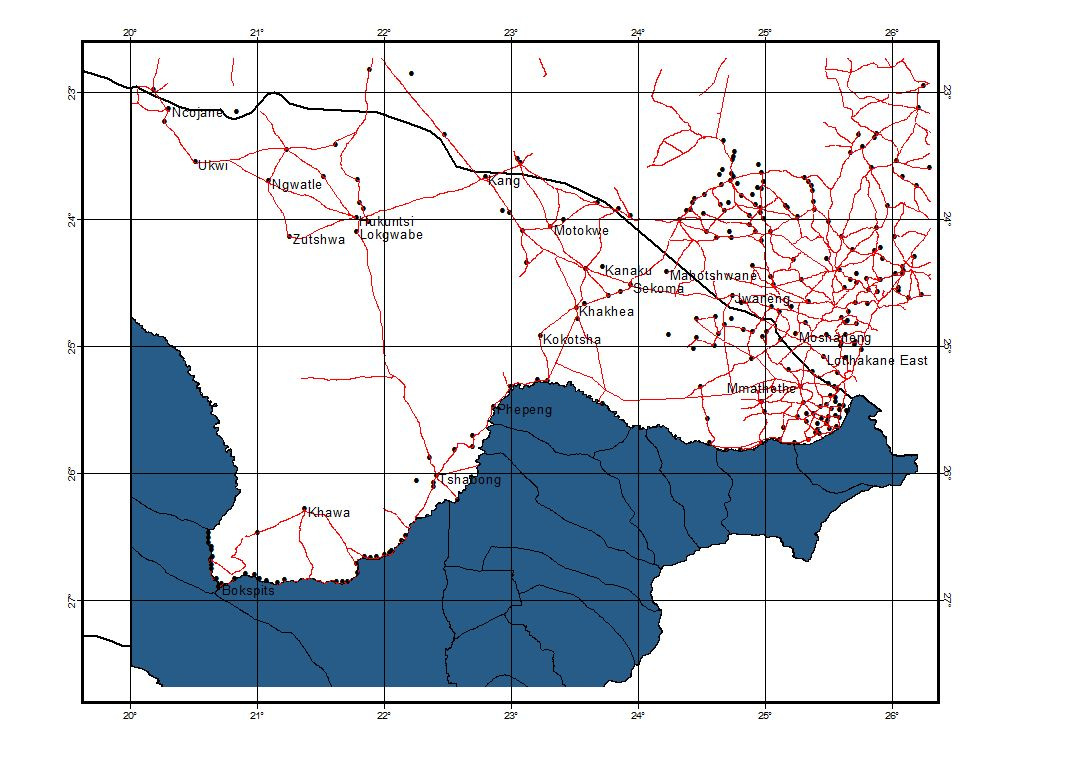
Groundwater Review of the Molopo-Nossob Basin
Report No. ORASECOM/005/2009
Figure 3-1
Area of Botswana included in the Molopo-Nossob basin based on surface water divide
The use of water in the area is based on groundwater or temporary surface water ponds such
as pans, filled after rainy seasons. For sustainable water supply, boreholes and wells are used
and all rural and major villages have their supply based on groundwater.
Table 3-2
Districts and sub-districts covered by the Molopo-Nossob basin in Botswana
Number
Area in
Percentage in
Population 2006 (CSO,
District
Sub-District
of
Molopo-Nossob
Molopo-Nossob basin
1997 and 2005)
villages
basin km2
Kgalagadi South
22
32,800
100
26,488
Kgalagadi
Kgalagadi North
13
72,400
100
16,968
Southern
80
14
Ngwaketse
10,176
Ngwaketse
Southern Barolong
49
25,783
100
52,774
Southern
100
10
Ngwaketse West
10,989
Kweneng
1
1,244
4
1,529
Ghanzi
1
3,537
3
1,477
Total
110
135,764
120,401
Geotechnical Consulting Services
32
Groundwater Review of the Molopo-Nossob Basin
Report No. ORASECOM/005/2009
Table 3-3
Water requirements for the village (domestic water requirement) within the district of Botswana in the
Molopo-Nossob basin (DWA, 2006)
District
Number of
Total water requirement (m3/a)
Sub-district
villages
2006
2010
2015
2020
Kgalagadi South
22
558,686
611,111
675,956
745,260
Kgalagadi North
13
432,470
476,686
530,719
595,604
Southern
14
57,894
58,586
59,086
59,416
Ngwaketse
Southern
49
675,774
744,029
830,214
935,735
Barolong
Southern
10
136,824
152,990
172,885
193,693
Ngwaketse West
Kweneng West
1
14,865
14,939
14,986
15,010
Ghanzi
1
25,001
24,992
24,986
24,983
Total
110
1,901,514
2,083,333
2,308,832
2,569,701
In 2006 Botswana made a review of their National Water Master Plan (DWA, 2006). Data
were compiled and assessed on water supply situation and future demands. The demand
figure for domestic supply is summarized in Table 3-3 for the districts within the Molopo-
Nossob basin.
16
1,000,000
/
a
B
Total
3
14
Wildlife
Total
A
m
i
Basin
Donkeys+Horses
Basin
12
d
r
n
800,000
i
Goats
a
e
d
Sheeps
t
M
g
t
h
a
r
n
Cattle
n
e 10
g
e
l
a
u
a
o
600,000
l
a
t
h
m
g
a
u
8
S
g
o
i
r
e
K
u
S
q
g
g
400,000
K
g
6
n
n
g
e
n
n
i
l
o
e
i
l
o
e
z
z
n
n
r
R
4
n
n
t
e
r
o
e
200,000
r
o
e
a
a
a
a
w
h
a
w
2
h
B
K
G
W
B
K
G
0
0
Figure 3-2
(A) Number or various livestock and (B) Water requirement for various livestock and wildlife in
the Kgalagadi, Southern, Barolong and Ghanzi District within the Nossob River basin (source:
DWA, 2006)
The livestock population within the Botswana part of the Molopo-Nossob basin is given in
Table 3-4 from data in the Annual Agricultural Survey Report 2004 (DWA, 2006). These
figures are different from the livestock figures given in the Southern District Development
Plan 6 (SDC, 2003).
In the calculation of the water requirement for livestock (45 l/head and day), a wastage of
50% is added to the figures assessed from number of ELSU (including Wildlife). This is
similar procedure as used in calculation of the water requirement figures for livestock in
Namibia. Figure 3-2 illustrates the number of livestock in the Molopo-Nossob basin in
Botswana as well as the estimated water requirement. The wildlife area is contained in the
Kalahari Trans-Frontier Park and Mabuasehube Game reserve, in total comprising about 27,300 km2.
Geotechnical Consulting Services
33
Groundwater Review of the Molopo-Nossob Basin
Report No. ORASECOM/005/2009
Table 3-4
Livestock Population by district and region in the Molopo-Nossob Basin 2002. Equivalent Large
Stock Units (ELSU)
ELSU
in
Wildlife
Molopo-
District
Cattle
Goats
Sheep
Donkeys Horses Herbivores Nossob
basin
Kgalagadi
South
113,164 105,082 20,586
12,376
4,581
40,000
210,251
Kgalagadi
North
36,200
25,929
1,871
2,200
1,465
50,812
Southern
Ngwaketse
70,770
30,244
8,458
13,015
2,638
4,000
108,245
Southern
Barolong
22,102
15,044
4,812
3,933
250
33,161
Southern
Ngwaketse
West
113,840
85,253
27,304
27,382
1,150
178,872
Kweneng
West
10,222
6,957
639
871
90
14,204
Ghanzi
2,647
2,139
263
229
107
3,839
Total
368,944 270,648
63,934
60,006
10,282
44,000
599,384
Table 3-5 summarizes the water Requirement for the various users in the Districts within the
Molopo-Nossob Basin.
Table 3-5
Water requirement in Mm3/a for various livestock in the Districts in Botswana within the Molopo-
Nossob Basin. The requirements include wastage of water with 50%
Cattle
Goats
Sheep
Donkeys
Horses
Wildlife
Total
District
(Herbivores)
Kgalagadi 4.329
0.557
0.085
0.326
0.149
0.986
6.432
Southern
5.351
0.491
0.136
0.905
0.093
0.099
7.074
Barolong
0.641
0.064
0.018
0.088
0.006
0.000
0.817
Kweneng
0.296
0.030
0.002
0.020
0.002
0.000
0.350
Ghanzi
0.077
0.009
0.001
0.005
0.003
0.000
0.095
Total
10.694
1.150
0.242
1.344
0.253
1.084
14.767
Irrigation in the Molopo-Nossob basin in Botswana is currently non-existing. Plans for
irrigation schemes have been put forward by the Botswana Government (NAMPAD, 2000).
Irrigation in Botswana is mainly for high value horticultural production such as vegetables
for the domestic market, wine yards and some citrus production. Nevertheless, the
government of Botswana has clearly stated its desire to increase domestic agricultural
production. In regards to irrigated agriculture, especially horticultural production, the
objective of the government as stated in the NAMPAD report is to increase domestic
production to meet 70% of the domestic horticultural demand. This is motivated by the need
for some level of food security and employment generation, especially rural employment.
The National Master Plan for Agricultural Development (NAMPAD) proposed that projects
should be undertaken within the Molopo-Nossob basin of Botswana for irrigation. The
proposed project even includes establishment of wine yards in the area of Tsabong. A
planned abstraction of 1.8 Mm3/a for irrigation is proposed. Further in the Ngwaketse South
Geotechnical Consulting Services
34
Groundwater Review of the Molopo-Nossob Basin
Report No. ORASECOM/005/2009
additional irrigation projects are proposed with planned demands of 0.62 Mm3/a. Table 3-6
summarizes potential and planned utilization of water for irrigation
It is anticipated that irrigation schemes will be established covering the amount of about 6.2
Mm3/a in the areas of Kgalagadi South, Borolong and Ngwaketse (Southern), see Table 3-6.
These schemes will however not be in full capacity until 2015 and afterwards.
Projections of water requirement by visitors to lodges in and around the Kalahari
Transfrontier Park were done in the NWMPR for Botswana (DWA, 2006). A total of 8,680
m3 annually was arrived at. This figure assuming each visitor uses 100 litres per day.
Table 3-6
Potential and planned irrigation in the Molopo-Nossob Basin in Botswana (NAMPAD, 2000)
District/
Water Source
Potential
Potential
Planned utilization
Sub-
production Production
1000 m3/a
District
m3/h
1000 m3/a
SOS
EOS
Barolong
Existing boreholes
3-24
1,000
891
787
Ngwaketse
Existing boreholes
2-4.5
51
30
0
Central
Existing Mmamokhasi dam
35
280
280
282
Kanye wellfield
4-9
500
0
0
Lobatse
waste
water ?
1,750
881
881
reclaims.
Ngwaketse
Existing boreholes
6-2.4
67
61
61
North
Kanye waste water reclaims.
?
2,000
1,007
1,007
Ngwaketse
Existing boreholes
3-12.5
124
114
103
South
Kanye wellfield
4-9
500
0
0
Ngwaketse
Existing boreholes
3-6; 20; 33
576
576
501
West
Kanye wellfield
4-9
500
43
0
Jwaneng
waste
water ?
1,000
536
536
reclaims.
Tshabong
Existing boreholes
1.5-2
28
28
28
(Kgalagadi
Groundwater
development
South)
along Molopo River
5-10
4,000
1,829
1,829
Total region
6,276
6,015
SOS = Socially Oriented Scenario, EOS = Economically Oriented Scenario
The predicted total water requirement for the Molopo-Nossob basin in Botswana is
summarized in Table 3-7 and illustrated in Figure 3-3.
Table 3-7
Estimated water requirement for the Molopo-Nossob basin in Botswana
Consumer
Water requirement Mm3/a
2006
2010
2015
2020
Domestic use
1.90
2.08
2.31
2.57
Livestock
13.68
13.68
13.68
13.68
Wildlife
1.08
1.08
1.08
1.08
Irrigation
0.00
0.00
6.70
6.70
Tourism
0.009
0.009
0.01
0.01
Total
16.67
16.85
23.78
24.03
There is no return flow from any of the villages and settlements. The water resources are
mainly groundwater. Temporary water ponds, for instance at pans after rainy season and
minor flows in parts of Molopo river can be used as water supply mainly for livestock and
Geotechnical Consulting Services
35
Groundwater Review of the Molopo-Nossob Basin
Report No. ORASECOM/005/2009
wildlife. The main water supply is otherwise groundwater through boreholes drilled in
various types of aquifers.
The major problem with the groundwater is related to salinity. Most of the Molopo-Nossob
basin in Botswana contains groundwater with total dissolved solids, TDS, above the
recommended limit of 1,000 mg/l. Even when allowing the higher value of 2,000 mg/l the
main part of the basin in Botswana cannot supply potable water, see further Chapter 5.2.2.
t
n
25
e
Irrigation
m
Wildlife+Tourism
20
Livestock
i
r
e
u
Domestic
q
e
)
/
a 15
3
r
R
m
t
e
a
(
M 10
l
W
a
5
u
n
n
A
0
2006
2010
2015
2020
Figure 3-3
Predicted water requirements for Molopo-Nossob Basin in Botswana
3.3 Namibia
In the year 2000 an analysis was performed of the present and future water demand in
Namibia. The information in that report was used to provide an overview of the present and
future water requirements of Namibia within the Molopo-Nossob Basin (MAWRD, 2000).
In the 2000 report, the Molopo-Nossob basin in Namibia was assessed within two major river
basins, the Auob River and the Nossob River basins. Details about these two basins and the
Molopo River Basin, which constitutes the southernmost part of the Molopo-Nossob Basin in
Namibia, are given in Table 3-8.
The latest national population census in Namibia was completed in 2001. According to the
2001 census the number of people in Namibia was about 1 826 900, and about 105 000
people resided in the Molopo-Nossob Basin (5.7 % of the Namibian population), see Table
3-9.
Table 3-8
Sizes of basins in the Namibian part of the Molopo-Nossob Basin (MAWRD, 2000)
Parameter
Auob River
Nossob
Molopo River
Total (Molopo-
Basin
River Basin
Basin
Nossob Basin)
Catchment area km2
52,702
50,050
18,120
120,872
Remarks
Includes
In the southern most
Oanob River
part of the Basin
Geotechnical Consulting Services
36
Groundwater Review of the Molopo-Nossob Basin
Report No. ORASECOM/005/2009
Table 3-9
Estimated Population in the Molopo-Nossob Basin in Namibia (MAWRD, 2000, ORASECOM, 2007b)
Population
River Catchment
1999
2005
2015
2025
Auob
66,962
75,399
80,022
86,177
Nossob
37,276
38,450
40,757
43,892
Total
104,238
113,849
120,779
130,069
The Auob River basin includes Oanob River basin. There are several state water schemes in
the Auob River catchment; at Rehoboth, Stampriet and Gochas. Significant quantities of
groundwater are used for irrigation alongside the Auob River and some potential for
irrigation in the vicinity of Rehoboth has been identified (100 ha) (MAWRD, 2000).
The Nossob River rises as two main tributaries, the White Nossob in the Otjihavere
Mountains to the east of Windhoek, and as the Black Nossob further to the north-east. In
these areas the mean annual precipitation is assessed as approximately 370 mm.
The main commercial activity within the Nossob basin is large stock farming, which is
practiced on commercial basis. The economically active centres are Gobabis, Witvlei.
Leonardville and Aranos. Agriculture products are the backbone to the economy in this
catchment. Development of tourism is limited to a few lodges and game farms (MAWRD,
2000).
Parallel to and between the two rivers Auob and Nossob, the Olifants River occurs. This river
joins the Auob River about 175 km upstream the merging of Auob and Nossob Rivers.
In its lower part Nossob River forms the south-western boundary between Botswana and
South Africa down to its confluence with the Molopo. There is no recorded history of the
Nossob River ever contributing surface water to the Molopo River (MAWRD, 2000).
There are several state water schemes in the Nossob River catchment, most important of
which is the Gobabis Bulk Water Scheme which includes the Otjivero, and Viljoen Dams and
boreholes. Other schemes in the area include Summerdown, Steinhausen, Witvlei,
Leonardville and Aranos.
The water users in the Auob and Nossob catchment basins are considered in four groups as
summarized in Table 3-10.
Geotechnical Consulting Services
37
Groundwater Review of the Molopo-Nossob Basin
Report No. ORASECOM/005/2009
Table 3-10
Water use and requirement in Auob River and Nossob River Basin2 in Namibia 1999, 2005 and
2015 (MAWRD, 2000)
User
Auob River Basin
Nossob River Basin
1999
2005
2015
1999
2005
2015
Urban
2,464,454
2,161,774
2,700,596
1,141,099
1,139,651
1,228,068
Rural
133,231
128,724
117,325
100,191
94,176
91,916
Irrigation
7,059,000
7,148,000
7,237,000
949,000
961,000
973,000
Stock
3,794,452
3,288,525
3,288,525
8,636,687
7,485,129
7,485,129
Mining
2,000
2,000
2,000
0
0
0
Tourism
63,510
77,110
96,110
48,280
61,545
81,475
Total
13,516,647 12,806,132 13,441,556 10,875,257
9,741,501
9,859,588
Table 3-11 summarizes the water requirement for the two river basins which here represents
the water requirement for the Molopo-Nossob Basin in Namibia.
Table 3-11
Water user and requirement (Mm3/a) in Molopo-Nossob Basin in Namibia 1999, 2005 and 2015
(MAWRD, 2000)
User
1999
2005
2015
Urban
3,605,553
3,301,425
3,928,664
Rural
233,422
222,900
209,241
Irrigation
8,008,000
8,109,000
8,210,000
Stock
12,431,139
10,773,654
10,773,654
Mining
2,000
2,000
2,000
Tourism
111,790
138,655
177,585
Total
24,391,904
22,547,633
23,301,144
The water requirements in the Auob River and Nossob River basins summarized in Table 3-
10 are presented in the diagrams in Figure 3-4A. It can be seen from the figure that Irrigation
is most pronounced in the Auob basin, whereas the highest water consumer in the Nossob
basin is livestock watering.
The water requirement for the whole Molopo-Nossob Basin in Namibia as summarized in
Table 3-11 is illustrated in Figure 3-4B.
In Molopo-Nossob basin numerous irrigation schemes are established. In Namibia as a whole
irrigation is the highest consumer taking 45.7% of the water requirement. In the whole
Molopo-Nossob basin the percentage used for irrigation is 36 % (2005). The location of the
major irrigation schemes in Namibia in Molopo-Nossob basin are shown in Figure 3-5. In
the whole Namibia only 18% of the total irrigable area (42,962 ha) is currently irrigated
(7,573 ha) (MAWRD, 2000). Corresponding figure for the Molopo-Nossob basin area is not
established. According to records of irrigation holders in the Stampriet area (Groundwater
Control area), permits for allocation of 11.18 Mm3 per annum are allocated (DWAF,
Resource Management Law Administration). It is also established that actual water
consumption figures are rarely reported to the authorities (MAWRD, 2000).
Geotechnical Consulting Services
38
Groundwater Review of the Molopo-Nossob Basin
Report No. ORASECOM/005/2009
Tourism
Mining
Livestock
Irrigation
t
Rural
n
15
Urban
t
e
n
30
e
m
A m
B
i
r
e
25
u
i
r
e
q
) 10
u
e
q
) 20
/
a
b
e
3
o
b
b
/
a
r
R
3
m
b
s
b
o
b
o
r
R
m 15
t
e
o
s
o
s
o
s
a
(
M
u
o
u
s
u
s
t
e
(
M
5
o
a
A
o
N
A
A
10
l
W
N
N
a
l
W
u
a
u
5
n
n
n
n
A
0
A
0
1999
2005
2015
1999
2005
2015
Figure 3-4
(A). Water requirement in the Auob River and Nossob River Basins in Namibia
(B). Water requirement in the Molopo-Nossob Basin in Namibia (MAWRD, 2000)
-22░S
Gobabis
Windhoek
Dordabis
-23░S
Onderombapa
Uhlenhorst
-24░S
Botswana
-25░S
Namibia
Koļs
-26░S
Aroab
-27░S
South Africa
-28░S
17░E
18░E
19░E
20░E
21░E
22░E
23░E
24░E
25░E
26░E
Figure 3-5
Irrigation schemes in the Auob catchment area (blue) and Nossob catchment area (red) (source:
MAWRD, 2000)
Geotechnical Consulting Services
39
Groundwater Review of the Molopo-Nossob Basin
Report No. ORASECOM/005/2009
100
80
e
g
60
t
a
n
e
r
c
40
e
P
20
0
0.001
0.01
0.1
1
10
Irrigation water amount Mm3/a
Figure 3-6
Distribution of water requirements for the Irrigation schemes in the Molopo-Nossob Basin (MAWRD,
2000)
The distribution of the water requirement for irrigation schemes (2005) is presented in Figure
3-6. The median value of the 59 schemes is 0.05 Mm3/a and the average value is 0.137
Mm3/a (MAWRD, 2000).
The water requirement for livestock is higher in the Nossob than the Auob catchment area.
The number of livestock is taken from figures from veterinary areas. These areas cover more
than the Molopo-Nossob basin and the amount of livestock for the Molopo-Nossob area is
calculated in regard to the proportion of the veterinary area in the Molopo-Nossob basin.
Table 3-12 summarizes the size and the water requirements for livestock including wastages
(MAWRD, 2000).
Table 3-12
Veterinary area codes and sizes in the Molopo-Nossob basin. Calculated water requirement for
livestock, based on numbers from 1999 (MAWF, 2006)
Veterinary
River Basin
Veterinary
Percentage of
Area size
Water
Area
Area Code
the veterinary
km2
requirement (incl.
area in the
wastage) m3/a
basin
Gobabis
Auob
1.1
526
98,730
Nossob
SX
57.9
27,890
5,232,676
Windhoek
Auob
50.3
18,430
1,774,393
Nossob
SW
10.7
3,921
377,530
Okahandja
Nossob
SH
3.0
527
101,012
Keetmanshoop
Auob
SK
20.0
23,443
1,569,748
Mariental
Auob
33.0
29,498
2,542,715
Nossob
SN
16.0
14,350
1,236,996
Total
118,586
12,933,800
Geotechnical Consulting Services
40
Groundwater Review of the Molopo-Nossob Basin
Report No. ORASECOM/005/2009
Okhandja
-22░S
Windhoek
SH
SW
Gobabis
Windhoek
Gobabis
SX
-23░S
Rehoboth
Leonardville
Aminius
-24░S
Aranos
Stampriet
Mariental
-25░S
SN
-26░S
Aroab
Keetmanshoop
-27░S
SK
-28░S
16░E
17░E
18░E
19░E
20░E
21░E
22░E
23░E
24░E
25░E
26░E
Figure 3-7
Veterinary areas in Namibia in the Molopo-Nossob Basin
The total demand for livestock according to Table 3-12 is slightly higher than the figure
given in Table 3-11. Figure for the both tables are however derived from different
information sources, the "Namibia Water Resource Management Review" (MAWRD, 2000)
and "Technical Summary of Water Accounts' (MAWF, 2006). The veterinary areas within
the Molopo-Nossob basin are shown in Figure 3-7.
In the calculation of the water requirement, the water consumption for the animal heads were
taken from the MAWRD report and summarized in Table 3-13.
Table 3-13
Daily assumed water consumption of various animals and percentage water wastage assumed
(MAWRD, 2000)
Animal head
Daily water demand (m3/day)
Percentage added for wastage
Cattle
0.045
50 %
Sheep
0.010
50 %
Goat
0.010
50 %
Pig
0.010
30 %
Donkey
0.015
50 %
Horse
0.025
50 %
Ostrich
0.004
50 %
The water requirement for the livestock in the Auob and Nossob basin in Namibia is
illustrated in Figure 3-8.
The domestic water demand in the towns and the rural areas is based on water consumption
data and projections of the future demand due to the population increase and the expected
improvement in the standard of living.
Geotechnical Consulting Services
41
Groundwater Review of the Molopo-Nossob Basin
Report No. ORASECOM/005/2009
16
Donkeys+Horses+Camels
B
/
a 14
Pigs+Ostriches+Poultry
3
1,600,000
m
Goats
Poultry
A
12
Sheeps
1,400,000
Pigs+Ostriches
t
M
Cattle
l
s
n
a
Donkeys+Horses+Camels
e 10
u 1,200,000
Goats
i
d
m
Sheeps
i
v 1,000,000
Cattle
8
d
i
r
e
u
800,000
q
f
i
n
e
6
r
o
e
600,000
r
R
b
4
t
e
m
400,000
a
u
N
W
2
200,000
0
0
Auob
Nossob
Total
Auob
Nossob
Total
Basin
Basin
Basin
Basin
Basin
Basin
Figure 3-8
(A) Number or various livestock and (B) Water requirement for various livestock in the Auob River
and Nossob River basins (MAWF, 2006)
A comprehensive database of livestock numbers (cattle, donkeys, horses, goats, sheep, pigs,
camels, poultry and ostriches) exists and was used to determine the number of livestock in the
Auob and Nossob River Basins, as well as the estimated water demand, see Figure 3-8 and
Table 3-14. The grazing capacity of the rangeland is limited and it is not expected that there
will be a significant increase in stock numbers over time. Decrease and increase in the
availability of grazing will be due to the seasonal variations in the rainfall.
Table 3-14
Number of livestock and water requirement in Auob River and Nossob River basins (source: MAWF,
2006)
Number
Water demand m3/a
Auob
Nossob
Total
Auob
Nossob
Total
Cattle
81,417
176,454
257,870
2,007,282
4,350,353
6,357,636
Sheep
575,974
323,856
899,830
3,155,618
1,774,325
4,929,943
Goats
124,445
117,894
242,339
681,801
645,913
1,327,715
Pigs
4,246
2,081
6,327
20,162
9,880
30,042
Donkeys
4,114
6,607
10,721
33,813
54,294
88,107
Horses
5,110
8,116
13,226
69,990
111,169
181,159
Ostriches
3,301
1,604
4,905
7,233
3,516
10,749
Poultry
63,409
36,382
99,791
347
199
547
Camels
2
33
35
46
718
764
ESLU / Total
216,986
292,980
509,966
5,976,295
6,950,368
12,926,662
The main irrigation area in the Molopo-Nossob basin within Namibia is the Stampriet
artesian groundwater basin underlying the Nossob and Auob catchments.
No major mining operations are taken place within the Molopo-Nossob basin in Namibia. An
older plan for coal mining in the basin is shelved due to problems envisaged on stability and
water hazards.
To prevent undue depletion of water resources in certain areas, Groundwater Control Areas
have been proclaimed. Based on the existing Water Act of 1956, permits for large-scale
groundwater abstraction are required in these Groundwater Control Areas of Namibia, see
Figure 3-9. In the Molopo-Nossob basin these are:
Ę Windhoek Ł Gobabis Underground Water Control Area
Geotechnical Consulting Services
42
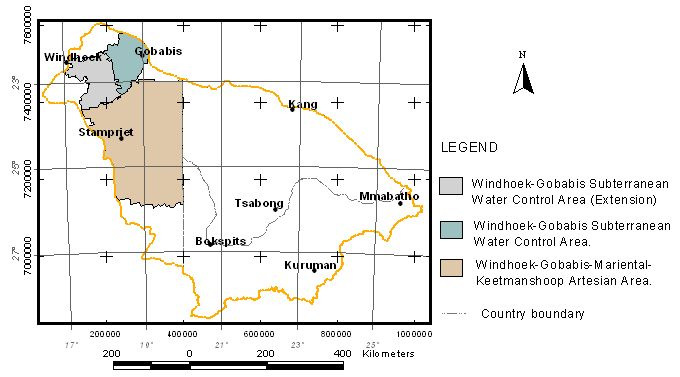
Groundwater Review of the Molopo-Nossob Basin
Report No. ORASECOM/005/2009
Ę "Stampriet Artesian Basin"
Ę Gobabis Artesian Area
Figure 3-9
Groundwater Control Areas in the Molopo-Nossob Basin, Namibia
Village centres are supplied with water by Nam Water, and are called "Bulk Customer" and
operate on a contract basis with a memorandum of agreement being exchanged. Village
councils are responsible for the operation and maintenance of the feeder pipeline network as
well as water supply in the villages.
-22░S
Gobabis
Seets
Witvlei
Omaites
Dordabis
-23░S
Onderombapa
Kwakwas
Aminuis
Leonardville
-24░S
Stampriet
Aronos
-25░S
Gochas
Koes
-26░S
Aroab
-27░S
-28░S
17░E
18░E
19░E
20░E
21░E
22░E
23░E
24░E
25░E
26░E
Figure 3-10 Villages supplied by Nam Water ("Bulk Consumers") in the Molopo-Nossob Basin
Geotechnical Consulting Services
43
Groundwater Review of the Molopo-Nossob Basin
Report No. ORASECOM/005/2009
Nam Water operates groundwater schemes in the Hardap, Karas, Khomas and Omaheke
Regions supplying towns, villages and settlements within the Molopo-Nossob Basin see
Figure 3-10. Table 3-15 summarizes the schemes within the Molopo-Nossob basin.
Table 3-15
Nam Water Groundwater Schemes in the Molopo-Nossob basin (Nam Water, 2008, ORASECOM,
2007a)
Region
Scheme
No of
Production
Production
Production
Remarks
Bore-
2007
2010
2015
holes
m3/a
m3/a
m3/a
Hardap
Aminuis
2
79,126
82,984
88,958
Aranos
9
190,194
198,878
211,622
Gochas
3
49,615
51,118
53,726
Kriess
2
6,096
6,2816
6,602
Leonardville
3
61,487
63,840
67,965
Onderombapa
2
24,827
25,504
26,672
Stampriet
2
51,942
53,118
53,726
Karas
Aroab
5
51,469
53,984
57,302
Koes
2
55,496
58,208
61,785
Khomas
Windhoek airport
12
206,040
Dorbabis
Uhlenhorst
Nauaspoor
2
137,269
142,397
151,372
Recharged from dam
Kwakwas
2
240
250
270
Omaheke
Gobabis
25
196,068
207,281
222,202
Witvlei
3
97,753
102,936
109,803
Total
2,301,582
2,393,177
2,544,526
Commercial farms have their own boreholes dug using their own investment and they do not
pay any water fee to the village councils.
There are a number of dams in the Molopo-Nossob basin in Namibia within the Nam Water
schemes. Table 3-16 summarizes these dams.
Table 3-16
Dams within the Molopo-Nossob basin included in the Nam Water schemes
River
Dam
Longitude
Latitude
Capacity
95% safe
Schemes
Reference
Catchment
Mm3
yield
supplied
Mm3/a
Fish
Hardap
17.851
-24.5091
294
55.5
Ę Mariental
NamWater 2008
Ę Irrigation
Ę Small
consumers
Auob
Nauaspoort
Recharge
NamWater 2008
boreholes
Auob
Oanab
35.5
4.2
Rehoboth
NamWater 2008
(Oanab)
Fish farms
White
Otjivero
17.9604
-22.2886
9.74
Ę Gobabis
ORASECOM,
Nossob
Main
Ę Witvlei
2008
White
Otjivero
17.9406
-22.2944
7.795
ORASECOM,
Nossob
Silt
2008
Black
Daan
18.8380
-22.2097
0.429
ORASECOM,
Nossob
Viljoen
2008
Black
Tilda
18.9528
-22.4442
1.224
ORASECOM,
Nossob
Viljoen
2008
Geotechnical Consulting Services
44
Groundwater Review of the Molopo-Nossob Basin
Report No. ORASECOM/005/2009
3.4 South Africa
3.4.1 Water management Areas
In South Africa the Molopo-Nossob basin is covered by three major water management areas
(WMA) see Table 3-17. These WMAs are further divided into quaternary drainage zones.
These zones or smaller WMAs coincide with the catchment of each area they cover. In a
closer look only parts of the three major WMA fall within the Molopo-Nossob basin. Table
3-17 defines the quaternary WMAs falling within the Molopo-Nossob basin.
Table 3-17
Quaternary regions (WMA) in the Molopo-Nossob basin in South Africa
Water Management Area
WMA No
Quaternary regions in Molopo-Nossob Basin
(WMA)
Crocodile (west) and Marico
3
D41A
(Upper Molopo)
Lower Vaal
10
D41B, D41C, D41E, D41F, D41G, D41E, D41F, D41G,
D41H, D41J, D41K, D41L, D41M, D42C 99%, D42D 14%
Lower Orange
14
D42A, D42B, D42C 1%, D42D 86%, D42E
In the current assessment of the water requirements, the Molopo basin in South Africa is
divided into three parts or zones; Upper, Middle and Lower Molopo. These zones almost
coincide with parts of the three WMA described in reports by DWAF. The differences being
the quaternary WMA D42C and D42 D which are attributed to two different WMA by
DWAF. They are now, in the division of Molopo basin, referred whole to one of the zones
each as summarized in Table 3-18. The Upper and Middle Molopo are catchment areas to
Molopo River whereas the Lower Molopo also includes catchment areas to Nossob and Auob
Rivers.
Table 3-18
The division in three zones for assessment of the water requirement in the Molopo basin in South
Africa
Zone of Molopo basin in
Catchment
Major WMA in Quaternary regions in Molopo-
South Africa
River
DWAF reports
Nossob Basin
Upper
Molopo River
Crocodile
(west) D41A
Molopo River catchment
and Marico (Upper
Molopo), WMA 3
Middle
Molopo River
Lower
Vaal, D41B, D41C, D41E, D41F, D41G,
WMA 10
D41E, D41F, D41G, D41H, D41J,
D41K, D41L, D41M, D42C
Lower
Molopo River
Lower
Orange, D42D, D42E
WMA 14
Nossob River
Lower
Orange, D42A 50%, D42B
WMA 14
Auob River
Lower
Orange, D42A 50%
WMA 14
The water use and demand within those quaternary regions are compiled from various WMA
reports with the subtitle "Water Resources Situation Assessment" (DWAF, 2002b, 2002c and
2002d).
Geotechnical Consulting Services
45
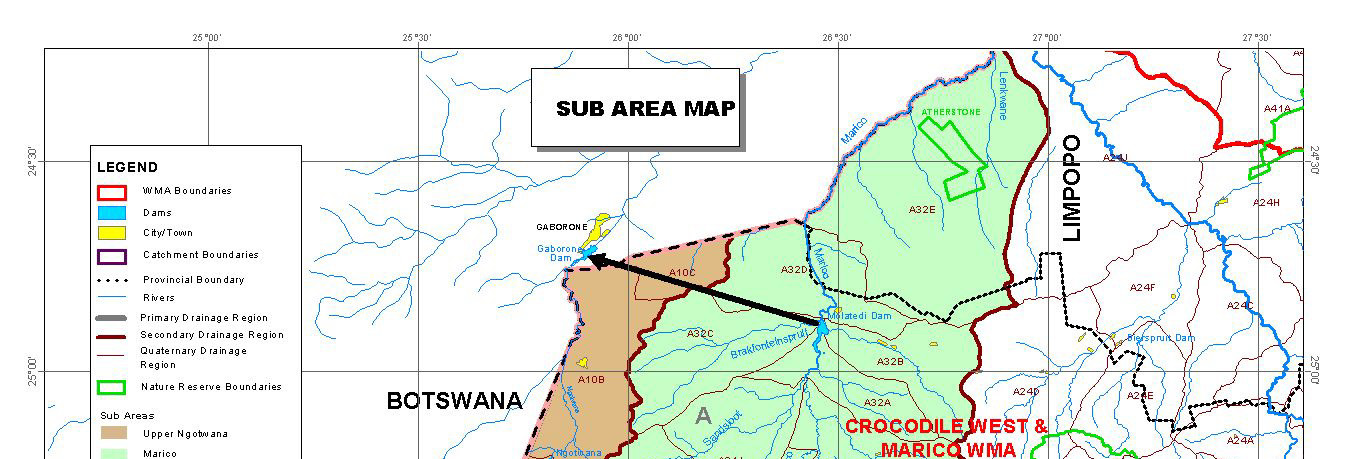
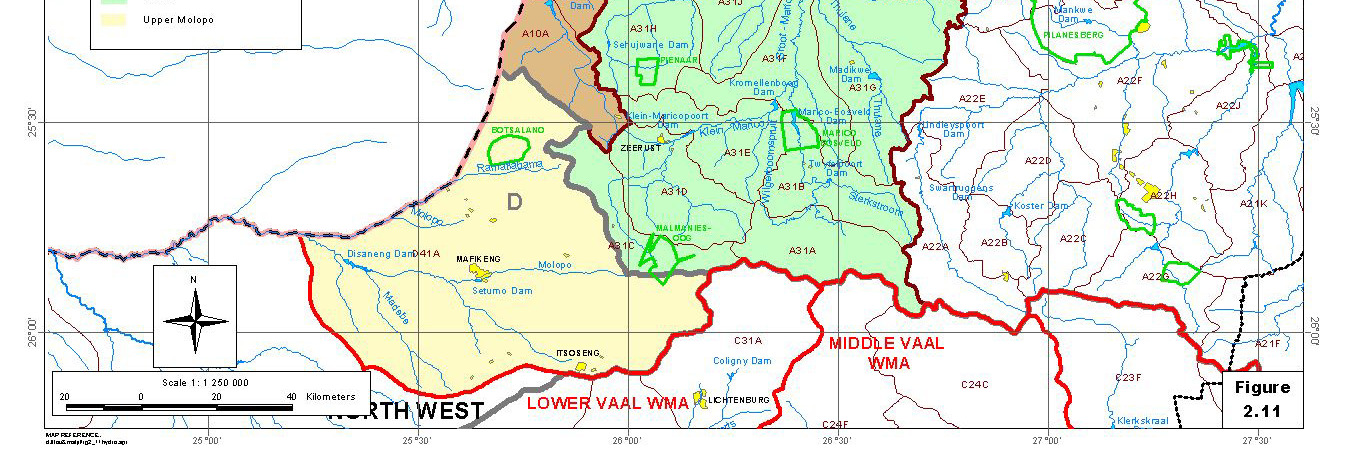
Groundwater Review of the Molopo-Nossob Basin
Report No. ORASECOM/005/2009
3.4.2 Upper Molopo
The Upper Molopo comprises one single quaternary catchment, D41A, see Figure 3-11 and
Table 3-19. The rainfall pattern of the Upper Molopo sub-area is highly variable and
unevenly distributed within the catchment. The intermittence of the rainfall results in frequent
floods and local droughts. According to the WMA report (DWAF, 2004c), the surface water
resource available from the rivers in the Upper Molopo sub-area, before impact of Ecological
Reserve, is estimated at approximately at 14 Mm3/a. The Setumo Dam and Disaneng Dams
are the main dams in the sub-area. The impact of the ecological Reserve is likely small and
difficult to assess since the Upper Molopo River is an ephemeral river. Return flows from the
sewage treatment works in Mafikeng is estimated at approximately 7 Mm3/a.
According to the WMA report (DWAF 2004c), the natural mean annual runoff of the Upper
Molopo River is approximately 37 Mm3/a. The most significant resource in the Upper
Molopo catchment is the groundwater from the dolomitic aquifers of the Grootfontein and
Lichtenburg compartments.
The available surface water in the D41A area is mainly for urban use in Mafikeng (supplied
from the Setumo Dam) and some irrigated agriculture downstream of Disaneng Dam.
The development in the Upper Molopo sub-area is concentrated around Mafikeng, the capital
city of the North West Province. The major water user in the sub-area is the urban use of
Mafikeng which has two sources of supply, namely, groundwater and surface water from
Setumo Dam. Mafikeng Municipality is currently abstracting 11 Mm3/a from the dolomitic
aquifers. Their water allocation is approximately 8 Mm3/a from the government Subterranean
Water Control Area (SWCA). This means the municipality is over-abstracting by 3 Mm3/in
terms of their allocation. There is return flow from the urban and industrial areas of Mafikeng
and Itsoseng.
Figure 3-11 Upper Molopo WMA (the quaternary WMA D41A), marked D in the figure (DWAF, 2004c)
Geotechnical Consulting Services
46
Groundwater Review of the Molopo-Nossob Basin
Report No. ORASECOM/005/2009
The second major water user for the year 1995 as shown in Table 3-20 is irrigation. The
rural domestic water requirement is increasing since most of the rural communities to the
west of the sub-area had no access to potable water supplies in the past and are now at least
beginning to get some basic level of service.
Most of the water requirement in the Upper Molopo sub-area is met by groundwater.
However the municipality of Mafikeng is also dependant on surface water from Setumo Dam
but are currently not utilising this source.
Table 3-19
Data on population, ESLU (1995) and size of the quaternary WMA in the Upper Molopo defined area
(DWAF 2002d)
Area
Size
Urban
Rural
Total
ESLU
km2
Population
Population
Population
D41A
4,322
101,000
167,500
268,500
38,620
Total (2000)*
115,599
Missing data
*= source DWAF, 2004c
Table 3-20
Water requirement (1995) in Mm3/a for the quaternary WMA in the defined Upper Molopo area
(DWAF, 2002d)
Area
Urban Use
Irrigation
Mining
Rural use
Livestock
Total
&others
D41A
10.7
14
5.2
3.2
2.9
36
Total
5**
6
(2000)*
13
24
48
*= source DWAF, 2004c
** = industrial use
3.4.3 Middle Molopo
The Middle Molopo area belongs to the Lower Vaal WMA which is dependant on water
releases from the Middle Vaal WMA for meeting the bulk of the water requirements by the
urban, mining and industrial sectors. The local water resources are mainly used for rural
demands, irrigation and smaller towns.
Before reaching the Atlantic Ocean near the town of Alexander Bay in the western corner of
South Africa, the water in the Lower Vaal has joined Orange River and crossed other WMAs.
There are no distinct topographic features in the Lower Vaal WMA; most of the terrain being
relatively flat. The generally semi-arid climate supports sparse vegetation over the WMA,
consisting mainly of grassland and some thorn trees, notably the majestic camel thorns.
The total urban and rural population in the Lower Vaal WMA is estimated at 1,282,000, of
which about 718,000 live in urban centres. Table 3-21 summarizes the population, size and
ESLU within the Middle Molopo quaternary WMA (DWAF 2002b and 2002c).
There are large rural populations in the Lower Vaal WMA, especially in the areas west of
Mafikeng, around Kuruman, Pampierstad and Lichtenberg.
Geotechnical Consulting Services
47
Groundwater Review of the Molopo-Nossob Basin
Report No. ORASECOM/005/2009
The National Water Resource Strategy, NWRS describes and discusses the WMA in three
sub-areas, viz. the Molopo, Harts and Vaal River downstream of Bloemhof Dam (DWAF,
2003a). The geographical extents of the sub-areas are shown in Figure 3-12. The sub-area
Molopo represents the Middle Molopo area in the current report
Table 3-21
Data on population, ESLU (1995) and size of the quaternary WMA in the Middle Molopo defined area
(DWAF 2002b and 2002c)
Area
Size
Urban
Rural
Total
ESLU
km2
Population
Population
Population
D41B
6,164
1,600
110,100
111,700
38,620
D41C
3,919
0
12,980
12,980
38,620
D41D
4,380
0
36,300
36,300
38,620
D41E
4,497
400
4,933
5,333
38,620
D41F
6,011
0
30,510
30,510
38,620
D41G
4,312
0
45,150
45,150
27,560
D41H
8,657
0
26,900
26,900
55,340
D41J
3,878
14,950
1,106
16,056
24,790
D41K
4,216
4,700
5,568
10,268
26,950
D41L
5,383
22,700
79,280
101,980
34,410
D41M
2,628
0
1,568
1,568
16,800
D42C
18,300
250
3,690
3,940
35,540
Total (1995)
72,345
44,600
358,085
402,685
414,490
Total (2000)*
81,068
378,439
459,507
*= source DWAF, 2003a
The water requirements for the Middle Molopo area (the quaternary WMAs) are summarized
in Table 3-22.
Table 3-22
Water requirement in Mm3/a (1995) for the quaternary WMA in the defined Middle Molopo area
(DWAF, 2002b and 2002c)
Area
Urban Use
Irrigation
Mining +
Rural use
Livestock
others
D41B
0.903
1.010
0.55
2.110
2.240
D41C
0
0.120
0
0.249
1.061
D41D
0
2.160
0
0.696
1.344
D41E
0.031
0.050
0
0.095
0.965
D41F
0
0.280
0
0.585
1.275
D41G
0
0.410
0
0.865
1.195
D41H
0
4.980
0
0.515
1.625
D41J
3.980
0.010
1.93
0.021
0.599
D41K
0.364
0.050
3.3
0.107
0.703
D41L
3.242
1.030
0
1.519
1.771
D41M
0
0.010
0.33
0.039
0.401
D42C
0.019
0.010
0
0.091
3.884
Total (1995)
8.54
10.12
6.11
6.89
17.06
Total
6
11.8
(2000)*
11
0
*= source DWAF, 2003a (with exception of 1% of D42C and 86% of 42D)
Geotechnical Consulting Services
48
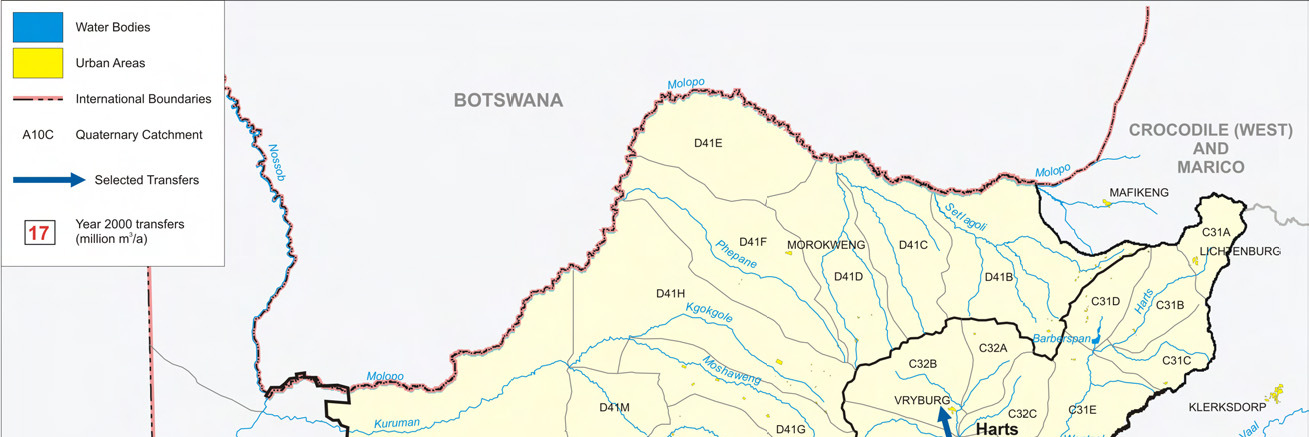
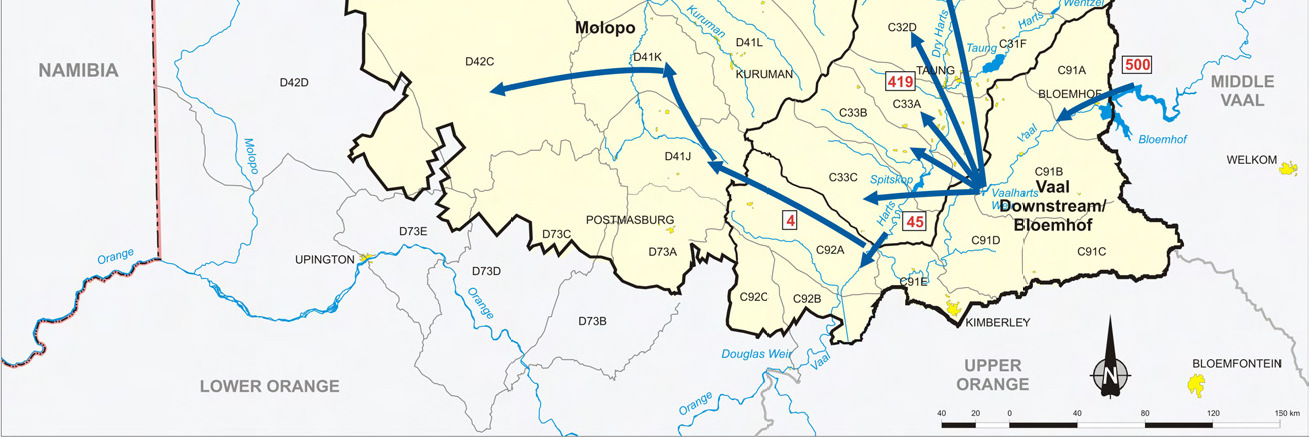
Groundwater Review of the Molopo-Nossob Basin
Report No. ORASECOM/005/2009
Figure 3-12 Lower Vaal WMA and its sub-areas Molopo, Harts and Vaal d/s Bloemhof Dam (DWAF 2004)
Land use within the Middle Molopo area is dominated by livestock farming. The largest
water requirements, as assessed from the DWAF report is also the livestock watering. In the
DWAF (2003a) report no water requirement was assessed for irrigation, whereas in the
DWAF (2002c) report the same requirement was assessed at 10.2 Mm3/a.
In the calculation of the water requirement for livestock (45 l/head and day), a wastage of
50% is added to he figures assessed from the number of ELSU. This is similar procedure as
used in calculation of the water requirement figures for livestock in Namibia.
3.4.4 Lower Molopo
The Lower Orange WMA, to which the Lower Molopo, the Nossob and the Auob Rivers
belong, covers the most sparsely populated part of South Africa. The WMA (D42) is the
country's largest, covering 164,166 km2, however with the population of only 382,000
persons (DWAF, 2003a). The total urban and rural population in the Lower Molopo area is
approximately 11,500 persons, of which about 6,400 live in urban centres. Table 3-23
summarizes the population, size and ESLU within the Middle Molopo quaternary WMA
(DWAF 2002b and 2002c).
From a land use perspective, the area still remains almost totally under natural vegetation.
Sheep and goat farming is practised over most of the area. In the Lower Orange WMA large
mining operations occur in various parts. However in the Lower Molopo area no major
mining is established. There are no large urban developments or power stations in the Lower
Orange WMA. Due to the arid climate, no afforestation occurs. Invading alien vegetation is
found along some tributary water courses and on the banks of the Orange River and is a
problem in some localised areas (DWAF, 2003b).
Geotechnical Consulting Services
49
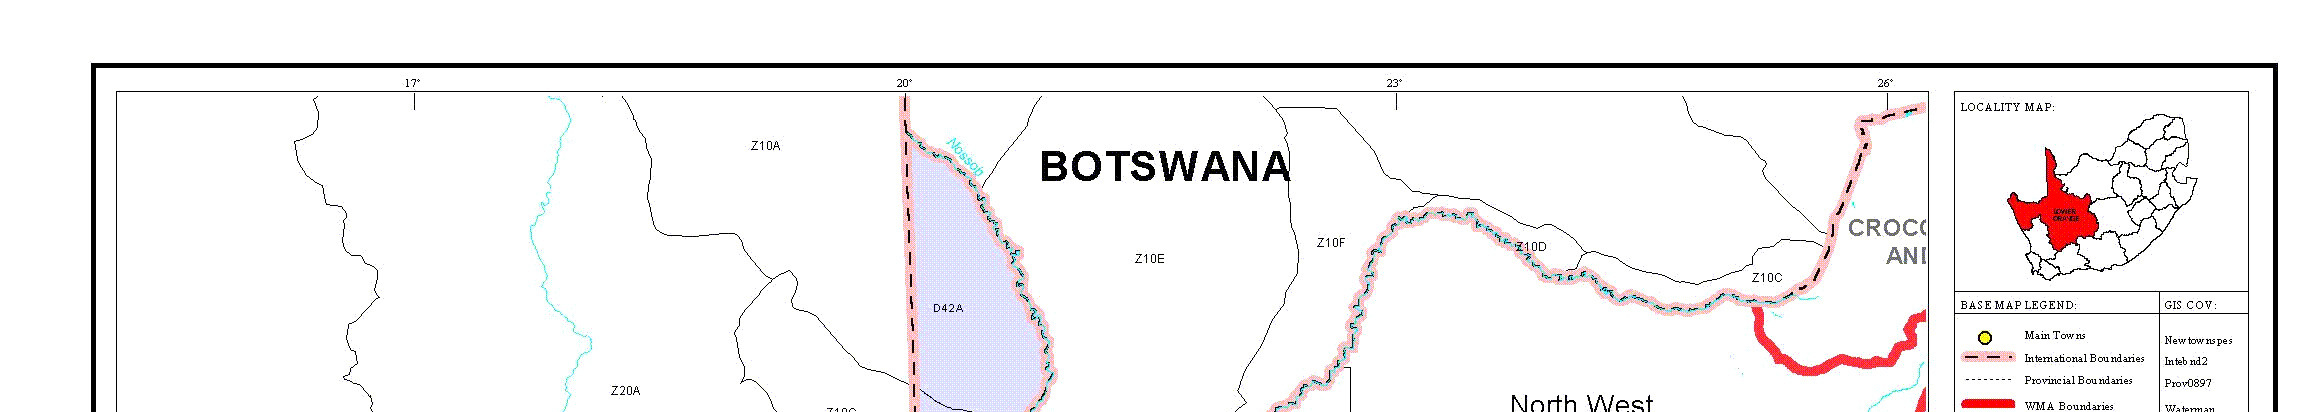
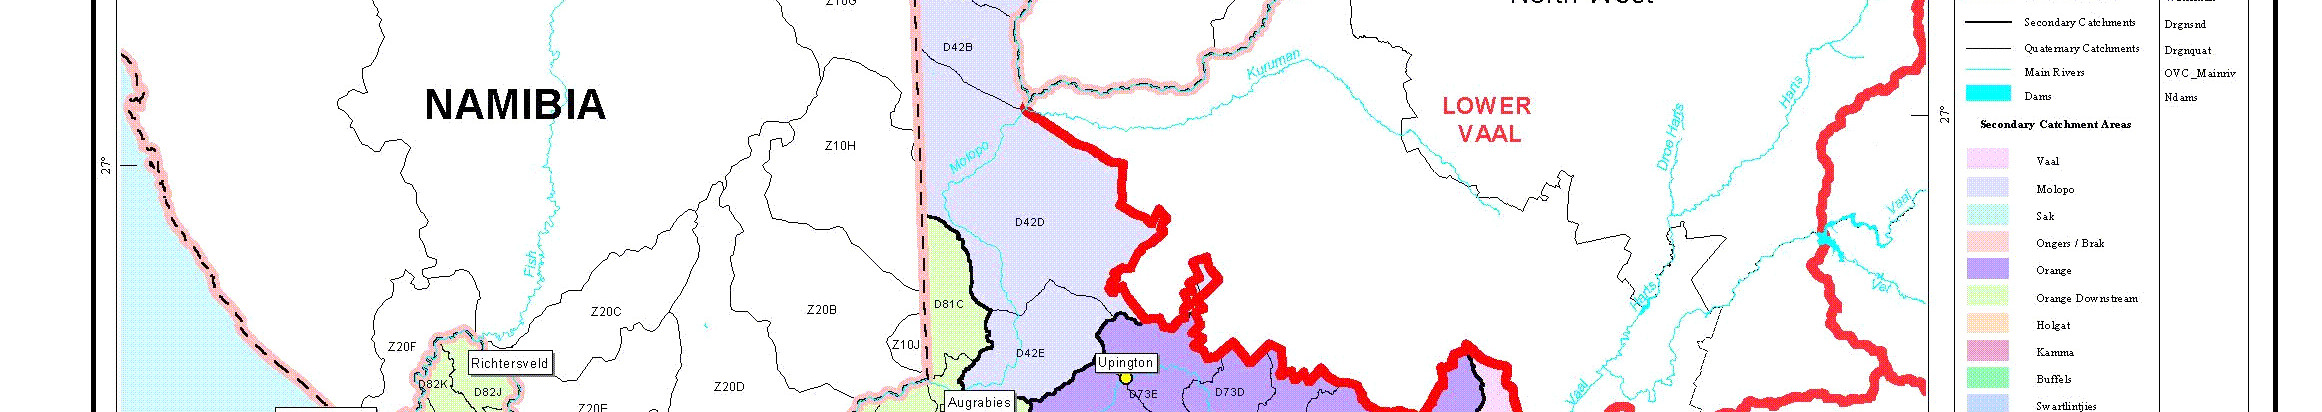
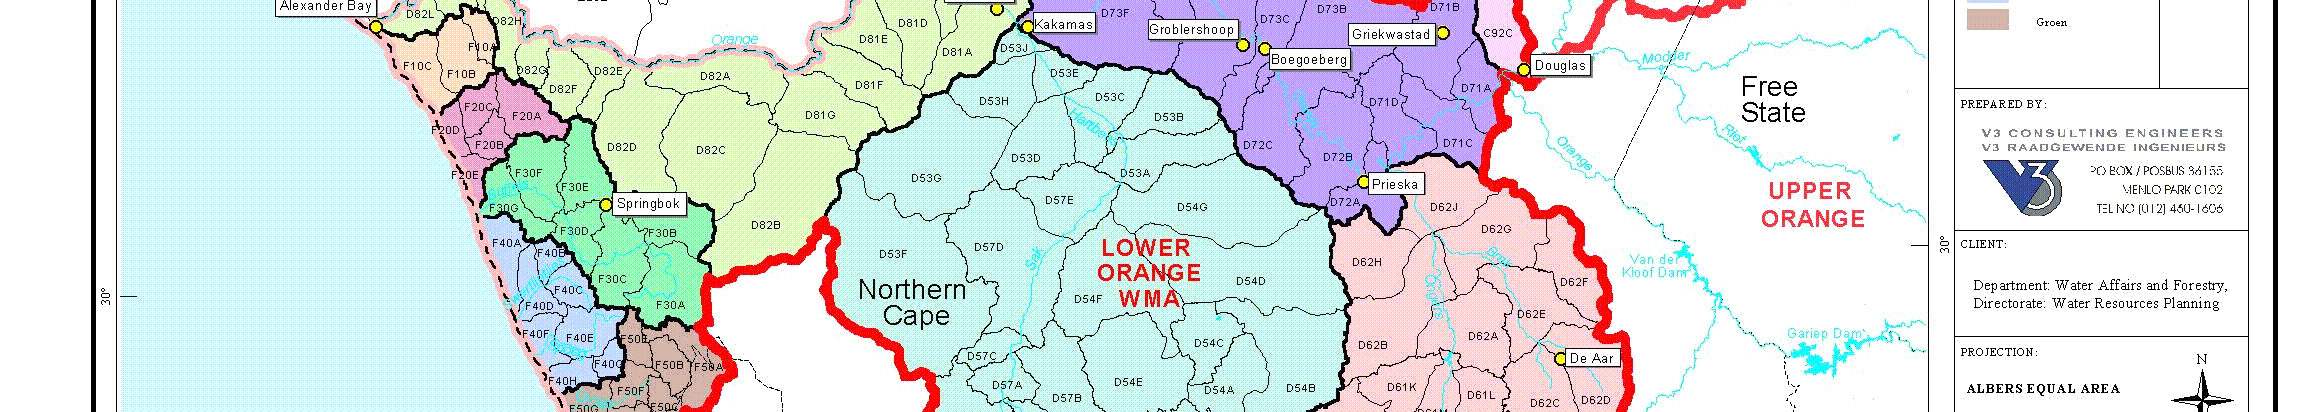
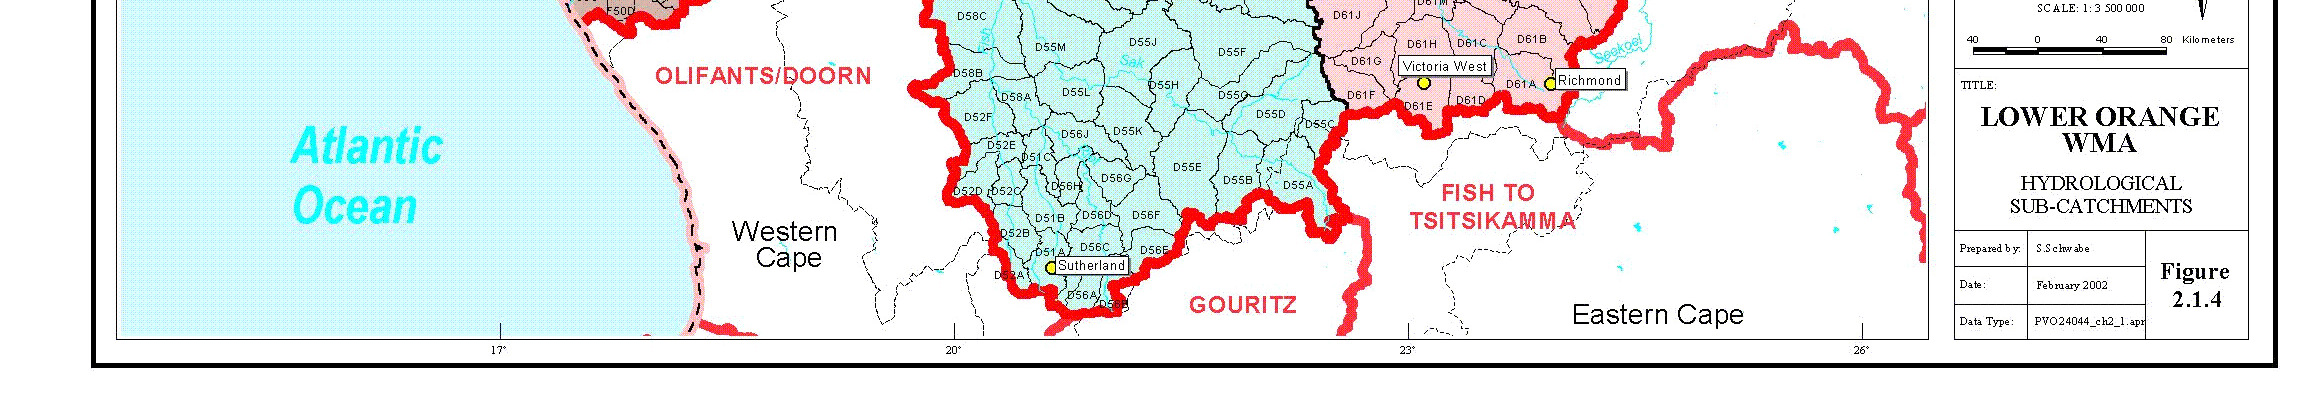
Groundwater Review of the Molopo-Nossob Basin
Report No. ORASECOM/005/2009
Table 3-23
Data on population, ESLU (1995) and size of the quaternary WMA in the Lower Molopo defined area (DWAF
2002b and 2002c)
Area
Size
Urban
Rural
Total
ESLU
km2
Population
Population
Population
D42A
10,282
0
773
773
23,482
D42B
3,198
4,700
424
5,124
7,304
D42D
16,210
0
2,324
2,324
9,610
D42E
4,208
1,653
1,626
3,279
9,610
Total (1995)
33,898
6,353
5,147
11,500
50,006
Total (2000)*
6,353
4,943
11,296
*= source DWAF, 2003b (with exception of 99% of D42C and 14% of 42D)
**= source DWAF, 2003b can be questioned since D42A is fully covered by the Gemsbok National Park
The main water related activity in the Lower Molopo area is for livestock watering.
Groundwater plays a major role in meeting the water requirements of rural settlements
although the volumes are not large.
The Lower Orange WMA is divided in a number of sub-areas. This division was based on
practical considerations such as size and location of sub-catchments, homogeneity of natural
characteristics, location of pertinent water infrastructure (e.g. dams), and economic
development (DWAF, 2003b). One of these sub-areas is the Lower Molopo area (in this
report upgraded with the full quaternary areas include). The sub-areas are shown on Figure
3-13.
Figure 3-13 Lower Orange WMA and hydrological sub-catchments (DWAF, 2004b)
The water requirement for the defined Lower Molopo area is summarised in Table 3-24.
Geotechnical Consulting Services
50
Groundwater Review of the Molopo-Nossob Basin
Report No. ORASECOM/005/2009
Table 3-24
Water requirement in Mm3/a (1995) for the defined Lower Molopo area (DWAF, 2002b and
2002c)
Area
Urban Use
Irrigation
Mining&others
Rural use
Livestock
D42A
0
0
0
0.019
0.528
D42B
0.111
0
0
0.010
0.173
D42D
0
0
0
0.057
0.793
D42E
0.039
0
0
0.040
0.221
Total
0.15
0.00
0.00
0.13
1.72
Total
0.15
0
0
1.81**
(2000)*
*= source DWAF, 2003b
** = includes water for livestock
In an effort to refer the water requirement to the major river catchments, a division as shown
in Table 3-18 is applied to the figures given in Table 3-24. The results are summarized in
Table 3-25.
Table 3-25
Water requirement in Mm3/a (1995) for the defined Lower Molopo area referred to the major
river catchment areas (DWAF, 2002b and 2002c)
River
Urban Use
Irrigation
Mining+
Rural use
Livestock
catchment
others
Molopo
0.039
0
0
0.097
1.014
Nossob
0.111
0
0
0.019
0.437
Auob
0
0
0
0.010
0.264
3.4.5 Summary for Molopo-Nossob Basin in South Africa
Sizes of the sub-areas of the Molopo basin in South Africa are summarized in Table 3-26.
Table 3-26
Summary of sizes, population and ESLU in the Molopo-Nossob basin in South Africa
Sub-Area
River Catchment
Size
Population (1995)
ESLU
km2
Urban
Rural
Total
Upper Molopo
Molopo
4,322
101,000
167,500
268,500
38,620
Middle Molopo
Molopo, Kuruman
72,345
44,600
358,085
402,685
414,490
Lower Molopo
Molopo, Kuruman
20,418
Nossob
8,339
6,353
5,147
11,500
50,006
Auob
5,141
Total
110.565
151,953
530,732
682,685
503,116
The sizes of the quaternary WMA and of the three sub-areas defined are shown in Figure 3-
14.
The number of livestock units (ELSU) and population in the quaternary WMA are illustrated
in Figure 3-15. Summarized figures for the three considered sub-areas, Upper, Middle and
Lower Molopo, are given in Figure 3-16.
Geotechnical Consulting Services
51
Groundwater Review of the Molopo-Nossob Basin
Report No. ORASECOM/005/2009
20,000
A
15,000
A
2
4
2
D
m
4
1
H
10,000
k
F
D
1
C
A
4
1
B
4
G
K
2
1
C
D
1
J
1
4
1
L
D
B
4
4
D
1
1
4
1
4
4
1
E
4
4
4
D
2
D
D
E
M
4
2
5,000
D
D
D
D
D
D
2
D
1
4
D
4
4
D
D
D
0
150,000
B
100,000
2
m
k
50,000
0
Upper
Middle
Lower
Total
Molopo Molopo
Molopo
Molopo
Figure 3-14 A. Sizes of the quaternary WMA in the Molopo basin in South Africa
B. Sizes of the sub-areas defined in the Molopo basin in South Africa
80
A
1
4
D
ESLU/km2
60
Population/km2
r
e
b 40
m
u
N
1
L
4
1
B
C
4
G
20
D
1
D
J
K
M
4
1
F
1
1
1
1
1
C
D
4
4
4
1
E
4
4
4
4
1
H
D
4
A
B
2
E
D
D
D
D
D
D
2
2
4
D
2
D
D
4
4
2
D
4
D
D
4
D
D
0
Figure 3-15 Number of livestock units (ESLU) and population in the quaternary WMA in the Molopo River basin
of South Africa
Geotechnical Consulting Services
52
Groundwater Review of the Molopo-Nossob Basin
Report No. ORASECOM/005/2009
700,000
ELSU
600,000
Population
500,000
r
e 400,000
b
m
u 300,000
N
200,000
100,000
0
Upper
Middle
Lower
Total
Molopo
Molopo Molopo
Molopo
Figure 3-16 Number of livestock units (ESLU) and population in the Molopo River sub-areas of South Africa
The water requirements for the three Molopo areas defined and discussed in previous chapter
are summarized in Table 3-27.
Table 3-27
Summary of water requirements (1995) for the Molopo-Nossob basin in South Africa
Sub-
Water Requirement (Mm3/a)
Transfer
Total
Area
Urban
Rural
Irrigation
Livestock
Mining and
Total local
Water taken
Requirement
water
bulk
requirements
out from the
Industrial
area
Upper
10.70
3.21
15.53
2.94
5.20
37.58
0
37.58
Molopo
Middle
8.54
6.89
10.12
17.06
6.11
48.72
0
48.72
Molopo
Lower
0.15
0.13
0.04
1.72
0
2.03
0
2.03
Molopo
Total
19.39
10.23
25.69
21.72
11.31
88.34
0
88.34
The water demands for the various main users are illustrated in Figure 3-17 and Figure 3-18 for the
quaternary WMA and the three sub-areas respectively.
40
Mining
35
Irrigation
30
Livestock
Rural Water
25
Urban Water
/
a3 20
m
M 15
10
5
0
A
C
D
F
G
J
K
M
A
B
C
D
E
1
1
1
1
1
1
1
1
2
2
2
2
2
4
4
1
B
4
4
4
1
E
4
4
4
1
H
4
4
4
1
L
4
4
4
4
4
4
D
D
D
D
D
D
D
D
D
D
D
D
D
D
D
D
D
Figure 3-17 Water requirements (1995) in the quaternary WMA in the Molopo River basin of South Africa
Geotechnical Consulting Services
53
Groundwater Review of the Molopo-Nossob Basin
Report No. ORASECOM/005/2009
90
Mining
80
Irrigation
t
Livestock
70
n
Rural Water
e
Urban Water
m
60
i
r
e
/
a 50
u
3
q
m 40
r
r
e
M
t
e
30
a
W
20
10
0
Upper
Middle
Lower
Total
Molopo Molopo
Molopo Molopo
Figure 3-18 Water requirement (1995) in the Molopo River sub-areas of South Africa
The water requirements as assessed for 1995 by DWAF calculated as an annual area
requirement (m3/km2) are summarized in Figure 3-19 and Figure 3-20.
In addition to the requirements for local users, a requirement concerning transfer of water out
from the resources within each area is considered. In the case of Molopo-Nossob basin, no
transfer out from the sub-areas considered is taken place in South Africa.
There is however a transfer of water into the sub-areas from other WMA. These contributing
WMA are outside the Molopo-Nossob basin "WMA". In Table 3-28, a summary is presented
of the amount of water transferred in to each sub-area.
10,000
m
u
8,000
n
n
a
6,000
d
n
a2 4,000
m
/
k3 2,000
m
0
A
C
D
F
G
J
K
M
A
B
C
D
E
1
1
1
1
1
1
1
1
2
2
2
2
2
4
4
1
B
4
4
4
1
E
4
4
4
1
H
4
4
4
1
L
4
4
4
4
4
4
D
D
D
D
D
D
D
D
D
D
D
D
D
D
D
D
D
Figure 3-19 Water requirement assessed as m3/km2 annually (1995 data) in the quaternary WMA in the Molopo
River basin of South Africa
Geotechnical Consulting Services
54
Groundwater Review of the Molopo-Nossob Basin
Report No. ORASECOM/005/2009
10,000
m
u
8,000
n
n
a
6,000
d
n
a2 4,000
m
/
k3 2,000
m
0
Upper
Middle
Lower
Total
Molopo
Molopo Molopo
Molopo
Figure 3-20 Water requirement assessed as m3/km2 annually (1995 data) in the Molopo River sub-areas of South
Africa
Table 3-28
Transfer of water into the Molopo-Nossob basin in South Africa
Transfer of water into
Sub-Area
Transfer Scheme
the sub-area (Mm3/a)
Upper Molopo
0
Transfer through Kalahari East Water Supply Scheme as an
Middle Molopo
4
extension of the Vaal Gamara Water Supply Scheme
Transfer through Kalahari-West Water Supply Scheme and
Lower Molopo
0.46
Karos-Geelkoppen Rural Water Supply Scheme
Total
4.46
Based on the resources available and the water requirement, a water balance is made for each
of the sub-areas of the Molopo-Nossob basin in South Africa. Table 3-29 summarizes the
water balance. The data used in the calculation are taken from the WMA reports (DWAF,
2002b, 2003a, 2003b, 2004a, etc)
Table 3-29
Water balance for the Molopo-Nossob basin in South Africa in the year 2000 (Mm3/a)
Sub-
Local water
Ecological
Grand total
Transfer of
Usable
Surface
Ground
Total
Balance
Area
requirements
reserve +
water
water into
return
water
water
water
Alien
requirement
the sub-area
flows
resources
vegetation
Upper
21.44
5
41.05
0
7
14
9
30
-11.05
Molopo
Middle
48.72
48.72
4
2
31
2
33
-9.72
Molopo
Lower
2.04
2.04
0.46
0
2.51
2.51
0.93
Molopo
Total
72.20
91.81
4.46
9
45
13.51
58.51
-19.84
Table 3-29 shows that for the 1995 figures, only the Upper and Lower Molopo sub-areas
have positive balances. An increase in water requirements comes mainly from the increasing
demand associated with population growth and higher level of services in communities. In
the western part of the Upper Molopo catchment area the rural communities are growing. The
WMA report (DWAF 2004b) recommends that the local groundwater resources of the Upper
Molopo catchment should first be fully developed to meet the future water requirements of
the rural communities before transfer of water is considered.
Geotechnical Consulting Services
55
Groundwater Review of the Molopo-Nossob Basin
Report No. ORASECOM/005/2009
3.5 Summary for Molopo-Nossob Basin
The figures about the sizes of areas, population and ESLU are summarized in Table 3-30.
The highest population figure is in South Africa, whereas the ESLU units are highest in
Botswana. Distributed on the area, the figures regarding ESLU are uniformly, about 4.2-4.6
ESLU/km2. The population per km2 varies on the other hand considerably, as seen in Figure
3-21.
Table 3-30
Figures on area sizes, population and ESLU in the Molopo-Nossob Basin
Country
Size
Population
ESLU
Pop/km2 ESLU/km2 ESLU/Pop
Botswana
135,764
120,401
599,384
0.89
4.41
4.98
Namibia
120,872
113,849
509,966
0.94
4.22
4.48
South Africa
110,565
739,303
503,116
6.69
4.55
0.68
Total Basin
367,201
973,553
1,612,466
2.65
4.39
1.66
8
7
Population
2
ESLU
m 6
r
k
e 5
p
l
s 4
a
u
i
d 3
i
v
d 2
I
n
1
0
Botswana
Namibia
South Africa
Molopo-
part
part
part
Nossob Basin
Figure 3-21 Population and ESLU per km2 in Botswana, Namibia and South Africa in the Molopo-Nossob Basin
Looking at the figures of population and ESLU per km2 for various regions in the Molopo-
Basin, the variations are much greater, see Table 3-31. The highest figure on population per
km2, the highest density, is in the Upper Molopo, South Africa, where the town of Mmabatho
is the reason for the high figure. The ESLU density is highest in the Barolong and Southern
District area in Botswana. High ELSU density is also found in the Upper Molopo, South
Africa, see Figure 3-21.
Table 3-31
Figures on area sizes, population and ESLU in different regions in the Molopo-Nossob Basin
Country
Region
km2 Population
ESLU Pop/km2
ESLU/km2
Botswana
Kgalagadi South
32,800
26,488
210,251
0.81
6.41
Kgalagadi North
72,400
16,968
50,812
0.23
0.70
Barolong+Southern
25,783
73,939
320,278
2.87
12.42
Kweneng
1,244
1,529
14,204
1.23
11.42
Ghanzi
3,537
1,477
3,839
0.42
1.09
Geotechnical Consulting Services
56
Groundwater Review of the Molopo-Nossob Basin
Report No. ORASECOM/005/2009
Country
Region
km2 Population
ESLU Pop/km2
ESLU/km2
Namibia
Auob + Molopo
70,822
75,399
216,986
1.06
3.06
Nossob
50,050
38,450
292,980
0.77
5.85
South
Upper Molopo
4,322
268,500
38,620
62.12
8.94
Africa
Middle Molopo
72,345
459,507
414,490
6.35
5.73
Lower Molopo
33,898
11,296
50,006
0.33
1.48
Total
367,201
973,553
1,612,466
2.65
4.39
The water requirements in the Molopo-Nossob Basin for the three countries are summarized
in Table 3-32. The highest requirement is in the South Africa part of the basin with in total
88.34 Mm3/a. Namibia and Botswana only reach up to 39.23 Mm3/a together, less than half
(44%) of South Africa's requirement in the Molopo-Nossob Basin. Figure 3-22 illustrates the
water requirement for the countries in the Molopo-Nossob Basin.
Table 3-32
Water requirement for Botswana, Namibia and South Africa in the Molopo-Nossob Basin
Country
Urban
Rural
Domestic Livestock Irrigation Mining
Tourism Total
Botswana
0
1.9
1.90
14.77
0.00
0.00
0.01
16.68
Namibia
3.3
0.22
3.52
10.77
8.11
0.002
0.14
22.55
South
Africa
19.39
10.23
29.62
21.72
25.69
11.31
88.34
Total
22.69
12.35
35.04
47.26
33.80
11.31
0.15
127.56
70
60
2
m
50
o
r
k
p
e
l
o
i
n
o
s
p 40
r
n
a
n
e
B
t
h
r
M
o
e
p
b
t
i
o
t
h
u
t
30
u
p
o
r
t
h
o
s
o
p
l
o
o
s
l
a
o
o
S
e
p
o
p
s
u
+
U
o
i
S
W
l
o
M
l
o
p
g
20
i
N
d
n
g
o
l
e
o
-
N
o
d
a
a
l
o
n
i
M
b
d
o
P
g
g
e
z
+
r
M
p
l
a
r
o
n
o
i
d
n
b
s
e
l
o
10
l
a
a
e
a
a
a
o
s
o
g
w
M
w
g
B
h
u
o
o
K
K
M
K
G
A
N
L
0
15
t
h
i
n
u
s
o
o
a
p
B
2
i
S
b
d
l
o
o
m 10
a
o
s
g
M
s
r
k
l
a
r
n
o
o
p
l
e
e
a
e
-
N
g
t
d
t
h
s
l
o
o
p
i
d
o
K
u
e
o
p
p
U
r
t
h
o
o
o
M
p
M
l
o
L
S
W
+
l
o
+
g
b
l
o
o
o
S
5
i
N
g
n
o
o
M
E
d
e
a
n
u
n
i
r
M
g
l
o
e
z
A
b
r
M
e
l
a
w
n
o
e
w
a
r
o
a
a
s
p
o
g
K
h
s
p
B
o
L
K
G
U
N
0
Figure 3-22 Population and ESLU per km2 in Botswana, Namibia and South Africa within the Molopo-Nossob
Basin
Geotechnical Consulting Services
57
Groundwater Review of the Molopo-Nossob Basin
Report No. ORASECOM/005/2009
140
Molopo-Nossob
Tourism
Basin
120
Mining
t
n
Irrigation
e
100
Livestock+Wildlife
m
Domestic
South Africa
i
r
e
/
a
80
u
q 3
e
m
M
60
r
R
t
e
a
40
W
Namibia
Botswana
20
0
13 %
18 %
69 %
Figure 3-23 Water requirements for Botswana, Namibia and South Africa in the Molopo-Nossob Basin
Table 3-33
Water requirement for various uses in different regions in the Molopo-Nossob Basin
Water Requirement in Mm3/a
Domesti
Country
Region
Total
c
Livestock
Irrigation
Mining
Tourism
Kgalagadi
South
5.75
0.56
5.18
0.01
Kgalagadi
Botswana
North
1.68
0.43
1.25
Barolong+
Southern
8.76
0.87
7.89
Kweneng
0.37
0.02
0.35
Ghanzi
0.12
0.03
0.10
Namibia
Auob + Molopo
12.81
2.29
3.29
7.15
0.002
0.077
Nossob
9.74
1.23
7.49
0.96
0.062
South
Upper Molopo
37.58
13.91
2.94
15.53
5.20
Africa
Middle Molopo
48.72
15.43
17.06
10.12
6.11
Lower Molopo
2.04
0.28
1.72
0.04
Total
127.57
35.05
47.26
33.80
11.31
0.15
The water requirements for the different regions in the Basin are presented in Table 3-33 and
illustrated in Figure 3-24. The same figures calculated as water requirement per km2 and year
is summarized in Table 3-34 and Figure 3-25.
Geotechnical Consulting Services
58
Groundwater Review of the Molopo-Nossob Basin
Report No. ORASECOM/005/2009
r
a
e
10,000
y
d
Tourism
n
Mining
a2
8,000
Irrigation
m
Livestock
/
k
Domestic
3
6,000
r
n
o
t
m
e
p
o
n
t
h
t
l
o
p
e
t
h
u
o
u
o
s
e
l
o
o
m
4,000
o
r
t
h
S
o
o
p
o
+
p
r
M
i
S
W
e
M
l
o
i
r
e
g
l
o
d
g
i
N
n
n
o
p
l
e
o
u
a
d
e
b
p
d
q
g
a
l
o
n
M
o
i
+
U
i
d
r
M
e
2,000
l
a
g
r
o
e
z
s
e
a
b
s
l
a
a
w
n
M
w
g
o
a
a
o
u
o
r
R
g
B
K
K
h
N
A
L
t
e
K
G
a
0
W
Botswana
Namibia
South Africa
Figure 3-24
Water requirements for various regions in the Molopo-Nossob Basin
Table 3-34
Water requirement for various uses in different regions in the Molopo-Nossob Basin
Water Requirement in m3/km2 and year
Country
Region
Total
Domestic
Livestock
Irrigation
Mining
Tourism
Kgalagadi
South
175.3
17.0
157.9
0.0
0.0
0.3
Botswana
Kgalagadi
North
23.3
6.0
17.3
0.0
0.0
0.0
Barolong and
Southern
339.8
33.7
306.1
0.0
0.0
0.0
Kweneng
293.4
12.1
281.4
0.0
0.0
0.0
Ghanzi
33.9
7.1
26.9
0.0
0.0
0.0
Auob
and
Namibia
Molopo
180.8
32.3
46.4
100.9
0.0
1.1
Nossob
194.6
24.7
149.6
19.2
0.0
1.2
Upper
Molopo
8,695.0
3,218.4
680.2
3,593.2
1,203.1
0.0
Middle
South
Molopo
673.4
213.3
235.8
139.9
84.5
0.0
Africa
Lower
Molopo
60.2
8.3
50.7
1.2
0.0
0.0
Total
347.4
95.4
128.7
62.3
30.8
0.4
Geotechnical Consulting Services
59
Groundwater Review of the Molopo-Nossob Basin
Report No. ORASECOM/005/2009
r
a
e
10,000
y
d
Tourism
n
Mining
a2
8,000
Irrigation
m
Livestock
/
k
Domestic
3
6,000
r
n
o
t
m
e
p
o
n
t
h
t
l
o
p
e
t
h
u
o
u
o
s
e
l
o
o
m
4,000
o
r
t
h
S
o
o
p
o
+
p
r
M
i
S
W
e
M
l
o
i
r
e
g
l
o
d
g
i
N
n
n
o
p
l
e
o
u
a
d
e
b
p
d
q
g
a
l
o
n
M
o
i
+
U
i
d
r
M
e
2,000
l
a
g
r
o
e
z
s
e
a
b
s
l
a
a
w
n
M
w
g
o
a
a
o
u
o
r
R
g
B
K
K
h
N
A
L
t
e
K
G
a
0
W
Botswana
Namibia
South Africa
Figure 3-25 Water requirements in m3/km2 per year for various regions in the Molopo-Nossob Basin
Geotechnical Consulting Services
60
Groundwater Review of the Molopo-Nossob Basin
Report No. ORASECOM/005/2009
4 DEVELOPMENT ACTIVITIES
4.1 Introduction
The major activities in the Molopo- Nossob Basin are agriculture, mining and tourism.
Planned developments will refer to these major activities.
4.2 Current Development Activities
4.2.1 Botswana
About 7 % of the population of Botswana lives within the Molopo-Nossob Basin area. Table
4-1 summarizes the population statistics. The rural population density is low, especially in the
sparsely populated Kgalagadi District (0.4 persons per km2).
Table 4-1
Population Botswana districts in the Molopo- Nossob Basin
Country
District/Sub-District Area size
Percentage in the
Population
(km2)
Molopo-Nossob basin
Botswana
Kgalagadi South
66,066
100
26,488
Kalalagadi North
44,004
100
16,968
Southern Ngwaketse
26,876
80
10,176
Southern Ngwaketse
100
10,989
West
Southern Barolong
100
52,774
Kweneng West
5
1,529
Ghanzi
3
1,477
Source: CSO, 2001 and ORASECOM, 2008a
Over the last 10 years the demographics of the country have changed significantly with
increasing numbers concentrated around the urban centres. Botswana's population is
becoming increasingly urbanized. The traditional way of life of people moving between the
village home (ko gae), the fields or lands area (ko masimong) and the cattle post ( ko
morakeng) is in the decline with people having additional town ( ko toropong) domiciles.
Education and health care continue to be priority areas for the nation as pledged in the Vision
2016 document. Botswana continues to improve and expand the education system,
consuming over a fourth of the 2000- 2001 allocated expenditure budget. The health care
system has also received substantial inputs resulting in about 85% of the rural population
living within 15 km of a health facility. Public health expenditure averaged 5-8% of the
national budget between 1980 and 1999.
The HIV/AIDS epidemic continues to deepen in Botswana. The overall, adjusted HIV
prevalence rate for pregnant women aged 15-49 in Botswana increased from 33.6% in 2000
to 36.2% in 2001. This increase is reflected across nearly all age groups. The trend of HIV
prevalence from 1993 to 2001 indicates that the prevalence rates for 2001 are double those of
1993. Population growth and structure continues to be altered as a result of the HIV and
AIDS epidemic. Mortality across age groups is on the rise in Botswana and life
expectancy has begun a steady decline, from an estimated high of about 66.2 years to the
projected low of 47.4 ( 1999 & 2000 GOB Human Development Reports). It is estimated
Geotechnical Consulting Services
61
Groundwater Review of the Molopo-Nossob Basin
Report No. ORASECOM/005/2009
that by 2010 life expectancy could as low as 29 years. Additionally, if nothing is done to halt
the deepening of the epidemic, one third of Botswana's adult population could be lost over
the next 8-12 years.
The structure of the population will shift to increasing numbers of both very young and very
old. Household income levels are expected to drop at least 8% due to HIV and AIDS, pushing
the number of household below poverty datum line by around 5%. Ever decreasing household
resources may be increasing channelled to medical and care expenses, with less going to
education and social amenities.
The epidemic has a catastrophic impact on the economy with an HIV prevalence of 36 %
among the workforce. The number and quality of people available to work will decline over
the next 5-10 years. The loss of skills, institutional memory and experience will create
vacuum in the labour market. Labour costs will rise along with recruitment and retraining
costs in order to meet the needs of business and industry. Added to that, the costs of
meeting expected medical and support costs may seriously reduce corporate earnings,
savings and investment levels, depressing the economy. It is estimated that the HIV/AIDS
epidemic will cause a contraction of the GDP growth by 1.5% over the next 20-25 years
resulting in an economy at least 31 % smaller than would otherwise be projected without
impact of the epidemic.
A decrease in growth rate of population means that the increase in water requirement as
predicted in any water planning will also be affected.
4.2.2 Namibia
Despite rapid urbanisation, Namibia is still a mainly rural society. This is anticipated to
change considerably and by 2010 it is expected that 50% of the population will be urbanised.
Namibia's population was 1.8 million in 2001 and the growth rate is estimated at 2.6 %
(Namibia Household Income and Expenditure Survey, 2003-2004). However, according to
UNICEF, the HIV prevalence rate in Namibia amongst the population aged 14-64 was
estimated at approximately 19.6 % at the end of 2005. To temper growth-related
expectations, these figures as well as decreasing fertility (UNDP, 2008) has to be factored
into the population growth rate figures, which are projected at 2.61 million by 2011.
The Molopo-Nossob Basin in Namibia is sparsely populated. In Namibia the majority of the
population (60 %) lives in the northern regions that do not fall in the basin. Khomas Region is
home to 14 % of the Namibian population, and is the most populated area in Namibia. The
growth rates for the various regions in the Molopo-Nossob Basin are given in Table 4-2.
The population density in the basin is 0.01 to 1.1 people per km2. Whilst 33 % of the
population lived in urban centres in 2001, the urban population is currently growing at a
much higher rate (over 5 % per annum), than the rural population. The vision is for Namibia
to be a "highly urbanised country with 75 % of the population residing in the designated
urban areas (ORASECOM, 2008a).
Geotechnical Consulting Services
62
Groundwater Review of the Molopo-Nossob Basin
Report No. ORASECOM/005/2009
Table 4-2
Namibian Population Growth
Region
Population (2001)
Population (2007)
Population Growth
Karas
69 321
71 701
3.4%
Keetmashoop Rural
6 349
Karasburg
14 693
Omaheke
68 041
75 620
11.1%
Aminuis
12 343
Gobabis
Kalahari
Hardap
68 246
70 584
3.4%
Mariental
13 596
Khomas
250 260
304 341
21.6%
Windhoek Rural
19 908
Source: Central Bureau of Statistics
The National Statistics on HIV/AIDS in Namibia according to the Human Development
Report of UNDP (2002) are summarized in Table 4-3.
Table 4-3
Summary of the Projected Effect of Aids on the Namibian Population
Indicator
1991
1995
2001
2006
Total Population 1.4
1.6
1.9
2.1
(million)
Population
3.6
3.1
2.1
1.5
growth rate (%)
Annual Number 390
1 440
13 880
23 220
of deaths from
AIDS
Life expectancy 60.0
58.3
43.8
40.2
at birth
Orphans due to 50
1 630
31 290
118 050
AIDS (<15 yrs)
Source: Human Development Report, UNDP 2002.
From the national statistics it is clear that HIV/AIDS will have a devastating impact on the
Namibian population. Firstly, the population growth rates will decline as indicated in Table
4-3 from 3.6 % per annum to a mere 1.5 %. Secondly, HIV/AIDS will play havoc with
quality of life indicators in Namibia as depicted in the table. Life expectancy decreased from
60 years in 1991 to 40 years in 2006. The number of people dying as a result of HIV/AIDS
increased significantly from 390 in 1991 to 23 220 in 2006. HIV/AIDS orphans have
increased from 50 in 1991 to 118 000 in 2006.
In the Hardap Regional Development Plan (2001/2002 Ł 2005/2006) it is contemplated that
the total population of 68,249 (2001) will decrease to approximately 52, 300 by 2010. The
expected population decrease is mainly attributed to the increased mortality as a result of
HIV/AIDS and increased, migration from Hardap Region to larger urban centres in Namibia.
If this scenario is realized, it implies relatively low or possible declining growth in water
demand.
Geotechnical Consulting Services
63
Groundwater Review of the Molopo-Nossob Basin
Report No. ORASECOM/005/2009
4.2.3 South Africa
The population of South Africa part in the Nossob- Molopo is shown in Table 4-4.
Table 4-4
Population of South Africa districts in the Molopo- Nossob Basin (CSO, 2001 and ORASECOM,
2008b)
Country
Province/
Area size
Percentage in the
Population in the
Region
(km2)
Molopo-Nossob Basin
Molopo-Nossob Basin
South Africa
North
West
116,320
11%
728,107
Province
Northern Cape
361,830
9%
11,296
It is generally agreed that the impact of HIV/AIDS on South Africa is likely to be
considerable including:
Ę an increased general mortality rate;
Ę an increased infant mortality rate;
Ę a decrease in life expectancy;
Ę a decrease in the fertility rate;
Ę a decrease in the population growth rate and;
Ę an increase in deaths among the economically active age groups.
The above issues will result in a range of negative social and economic consequences for the
country and thus it is imperative that interventions be made to reduce the impact of the
disease.
The impacts of HIV/AIDS on the demographics of the Molopo River Basin are different
depending on a range of related factors. For example, a high HIV/AIDS death rate could
lead to a reduction in the economically active population in an area and an increase in
opportunities for those living outside the area to be drawn to the jobs of those who are ill
or who have died. Thus whilst there is an impact from HIV/AIDS on the sparsely
populated areas of the Northern Cape, the overall population change in the area is more
likely to be as a result of economic opportunities , which will give rise to migratory shifts.
In the case of a lack of economic opportunities and the out-migration of the economically
active, the HIV/AIDS rate is likely to increase the rate of population decrease in the area.
The availability and use of Antiretroviral (ARV) drugs in Botswana, Namibia and South
Africa will have a major impact in population growth rates in the three countries.
For more details on HIV/AIDS in South Africa refer to ORASECOM Task 10:
Demographics & Economic Activity (2007).
4.3 Development Activities in the Districts
Three main activities currently taking place in the area are identified as the main drivers of
economic development in the study area. These are agriculture, mining and tourism, with
agriculture further divided into irrigation and livestock farming.
Geotechnical Consulting Services
64
Groundwater Review of the Molopo-Nossob Basin
Report No. ORASECOM/005/2009
4.3.1 Agriculture
Irrigation
Agriculture is one of the major economic activities in the Molopo-Nossob Basin and
irrigation activities covers around 207 km2. It is estimated that of this area, around 167 km2
or 80.5% utilizes groundwater and 40 km2 or 19.5 % surface water. Although there are a
diverse number of crops under irrigation, the most commons are groundnuts, Lucerne,
maize, potatoes, wheat and vegetables.
Livestock farming
Livestock is an important farming activity and economic activity provides both income and a
livelihood to a large number of households. Livestock farming is divided into two categories;
commercial and communal/subsistence livestock framing, with the former mainly undertaken
as a business venture. Stock farming is limited by availability of water. Boreholes are
extensively used to open up areas for grazing, but in many cases the quality of the
groundwater is such that it affects the health of the animals. As a consequence some
innovative ideas are implemented in the past to overcome this problem, such as the holes that
were dug in the middle of some pans in South Africa (so-called gatdamme) to conserve rain
water. This had limited success, and this method of rain water harvesting is largely replaced
by the Kalahari West Rural Water Supply Scheme that brings water from the Orange River to
the area.
Livestock farming: Botswana
The total value of livestock activity in the Botswana part of the catchment area is estimated at
about P266.9 million (R320.3 million) (ORASECOM, 2008a). It is divided between
commercial (75%) and communal (25%) farmers. The average number of cattle per
communal farmer converts to 30 Livestock Unit (LSU), with an average annual take-off of 6
animals. With the assumption that 50% is for own consumption and that three animals are
sold, the estimated cash revenue per farmer is around P7, 400. The estimated number of
employees in Livestock Farming is estimated at 3,385 (ORASECOM, 2008a).
Livestock Farming: Namibia
The value of livestock farming in the Molopo-Nossob part in Namibia is estimated to be
around N$258 million annually (ORASECOM, 2008). Very little if any communal farming
takes place in the Namibian section of the catchment area. The estimated number of
employees in Livestock Farming is 2,789 (ORASECOM, 2008a).
Molopo-Nossob Basin in Namibia is about 120,872 km2. The area hosts about 510,000 LSU
requiring almost 13 Mm3/a, see Chapter 3.
Livestock Farming: South Africa
In the South African part of the catchment the value of livestock farming is estimated at
R326, 4 million per annum. This might however be an under estimation because it appears
that large tracts of land is being converted to game farming and according to a number of
sources, this type of farming is much more profitable (ORASECOM,2008a). Also important
to note, in South Africa a large area of land is occupied by communal farmers, approximately
27 % of the land.
About 64% of rural families own cattle and a slightly higher number own goats. This
percentage is in line with other estimates, specifically in the Transkei region. According to
the survey, the average number of cattle kept by the communal farmer is 20 which
Geotechnical Consulting Services
65
Groundwater Review of the Molopo-Nossob Basin
Report No. ORASECOM/005/2009
converts to 17 LSU units, less than the 30 LSU in Botswana. It therefore appears that the
average cattle owner has as an annual cash income of around R7, 000 per annum. It must
however be borne in mind that only 64 % of the rural households are actually cattle owners
and that the number of cattle vary from 1 to 67 (ORASECOM, 2008a).
The estimated number of employees in livestock framing is estimated at 3,303
(ORASECOM, 2008a).
Summary on livestock farming in the Molopo ŁNossob Basin
There is a potential that the livestock numbers in the three countries basin countries may
increase. The livestock increase will be dependent on available land and good rainfall years.
There is also a possibility of livestock numbers decreasing due to the effect of drought
(condition of the veld) and an outbreak of livestock diseases. As for the stocking rates, these
are different from country to country. For example the stocking rates in Botswana are as high
as 30 LSU whereas in South Africa it is 17 LSU. The stability of stocking rates in the three
countries will be dependent on government policy and also climatic conditions.
4.3.2 Mining
There are several mining operations in the study area especially on the South African side.
The major minerals being mined are diamonds, iron ore and manganese. On the South
African side mining has grown at a hectic pace in the last three years and the current number
of mine workers involved is estimated to be around 7,500 permanent and 3,100 contract
workers. Information from the area also indicates that further growth is due to take place in
the immediate future (ORASECOM, 2008a).
Botswana
In Botswana, presently one diamond mine is in operation employing approximately 120
people with an annual turnover of P7.6 million.
Namibia
Mining is not a significant land use in the Namibian part of the Molopo-Nossob Basin.
Planned mining developments in the basin could are not identified. An older plan for coal
mining in the basin is shelved due to problems envisaged on stability and water hazards. In
Namibia at present one copper mine could be identified in the area employing around 375
people with an annual turnover of N$267 million (ORASECOM, 2008a).
South Africa
In South Africa a number of mines operate and the most important activity takes place at the
KathuŁHotazel hub with an expansion, due to the worldwide demand for these commodities,
at the iron ore and manganese pits. At present the total number of people employed in the
mining industry appears to be around 10,600 of which around 7,500 are fulltime and the rest
part time or on contract. All indications are that this will further increase in the next 2 to 3
years. The present annual monetary turnover is estimated at R11.5 billion.
From the above analysis it appears that, especially in SA, mining activity is growing
dramatically and is an important employment and income generator which appears to have
further potential to expand.
Geotechnical Consulting Services
66
Groundwater Review of the Molopo-Nossob Basin
Report No. ORASECOM/005/2009
4.3.3 Tourism
Tourism is an important activity in the basin, especially on the South African side. Two
specific categories of tourists are identified, eco-tourists and business tourists. Tourism can
contribute to development and the reduction of poverty in a number of ways. Economic
benefits are generally the most important element, but there can be social, environmental and
cultural benefits and costs. Tourism contributes to poverty eradication by providing
employment and diversified livelihood opportunities. Within the Molopo-Nossob Basin the
major type of tourism related activities are natural resources based or ecotourism; with the
rich wildlife biodiversity and vast undisturbed wilderness areas being the major attractions
Botswana
The objectives of Botswana Tourism Policy are:
Ę
To increase foreign exchange earnings and government revenues;
Ę
To generate employment , mainly in rural areas;
Ę
To raise incomes in rural areas in order to reduce urban drift;
Ę
Generally to promote rural development and stimulate the provision of other services
in remote areas of the country;
Ę
To improve the quality of national life by providing educational and recreational
opportunities and;
Ę
To project a favorable image to the outside world.
Over and above the mentioned objectives, the Tourism Policy is designed to ensure that
tourist activities are carried out on an ecologically sustainable basis. The Policy provides
local communities with direct and indirect benefits from tourism activities. By doing so the
Policy will encourage concerned communities to appreciate the value of wildlife and its
conservation and giving them growing opportunities to participate in wildlife Łbased
industries including tourism.
Tourism opportunities are virtually untapped largely due to poor state of the districts'
infrastructure and other supporting facilities. Wildlife is an important renewable resource in
Kgalagadi District for example, with wildlife areas accounting for about 4.8% of the district
area. The district's potential for tourism has improved since the merging of the Gemsbok
National Park and the Kalahari Gemsbok National Park. The introduction of community
based natural resource management (CBNRM) policy has also contributed to improved
tourism and incomes in the district. There are five areas earmarked for CBNRM activities.
Community mobilization to engage in CBNRM projects commenced in 1998 in the
Kgalagadi District. The aim of CBNRM is to give the communities an opportunity to manage
natural resources especially wildlife in their respective areas.
Namibia
The Molopo-Nossob Basin in Namibia has no protected or conservation areas. Between
Windhoek and Gobabis conservancies on freehold land occur in the sub basin. There is a
need to coordinate the establishment of these conservancies since the area has a number of
private game farms.
Also in Namibia tourism in (remote) rural areas is perceived as a particularly lucrative and
sustainable incomeŁgenerating and poverty reducing activity.
Geotechnical Consulting Services
67
Groundwater Review of the Molopo-Nossob Basin
Report No. ORASECOM/005/2009
According to Vision 2030 of Namibia, tourism already plays an important role in economic
development but it is not yet been exploited to its full potential. In the Molopo-Nossob Basin,
the number of tourism facilities decreases towards the south and the tourism potential
decreases proportionally. The southern part of the basin is identified with low tourism
potential and between Windhoek/ Gobabis and Mariental, mediumŁhigh to high (Namibia
Vision 2030).
South Africa
In South Africa, strategic interventions to stimulate the development of tourism in the
Northern Cape are identified, as it is considered to have the potential to become a preferred
adventure and ecotourism destination with its recognized cultural heritage. The preservation
of the natural and cultural heritage of the province is crucial to ensure this, and
transformation in the sector needs to be accelerated to ensure equitable growth (Northern
Cape Provincial Government, 2007). North West and Northern Cape's share of foreign
tourists arrivals decreased, with North West's decreasing from 7.1% in Quarter 3 2006 to
6.2% in Quarter 3 in 2007. Whereas Northern Cape is decreasing from 4.1 % in Quarter 3
2006 to 2.7% in Quarter 3 2007 (SA Tourism Index, Quarterly report Q3, July to September
2007).
In Kgalagadi DM the Moffat Mission, the Raptor Rehabilitation Centre, the Wonder Caves
and the Kuruman Eye are tourist attractions. The Kuruman Eye is a natural underground
fountain delivering 20-30 million litres of water daily, and apparently it is the biggest
natural fountain in the southern hemisphere. It was declared a national monument in 1992.
The Wonderwerk Caves were formed by gas and water, close to Kuruman. According to the
Kgalagadi Nodal Economic Profiling Project, 2007, most of the bed and breakfast (B&B) in
Kuruman accommodate contractors and long term renters.
The whole part of Molopo-Nossob Basin in South Africa serves as a stopover on the way to
Namibia, the Kgalagadi Transfrontier Park and Botswana. Some Germans, Belgians and
British second comers specifically come to visit this area. The niche market is eco-tourism,
adventure routes, historical/archaeological sites, and business people (Kgalagadi Nodal
Economic Profiling Project, 2007).
The Khomani San received farms adjacent the Kgalagadi Transfrontier Park with game that
can be used commercially for hunting (Department of Land Affairs, 2002). The department
recommended that serious effort should be made to capacitate the community members
responsible for the management of these game camps in the tourism industry, financial
management and marketing (ORASECOM, 2008a).
Summary on Tourusm Activity in the Molopo ŁNossob Basin
Table 4-5 shows a summary of tourism activities (number of bed nights and total income
generated per annum) for the three Molopo Ł Nossob basin countries.
Table 4-5
Tourism Activity in Molopo- Nossob catchment (2007estimates)
Country
Total annual bed Total
available Total income per
nights sold
beds
year: R million
Botswana
8 432
66
9.33
Namibia
62 981
493
36.71
South Africa
362 226
2 544
179.93
Source: ORASECOM, 2008
Geotechnical Consulting Services
68
Groundwater Review of the Molopo-Nossob Basin
Report No. ORASECOM/005/2009
Three growth scenarios were developed for the three countries over a period of 10 years. (It
must be stressed that these are not expectations of growth but merely predictive tools to pose
the question "what........if?).
Various figures and trends of visitor numbers (annual bed nights sold) were used to generate
the tourism growth scenarios. These include but are not limited to the following;
Ę The visitor statistics for tourist arrivals in Botswana, Namibia and South Africa from
the Tourism Boards of the respective counties.
Ę The visitor statistics for people staying in lodges/hotels/ campsites in the three
countries.
Ę World Tourism organization (WTO) figures and predictions for increases in world-
wide tourism broken down to the Southern African region by country.
Ę Emerging issues such as the impact of Credit Crush on financial expenditure and
visitors (local, regional and international).
The three scenarios considered are summarized in Table 4-6.
Table 4-6
Scenarios for Tourism Growth over a Period of 10 years
Current situation
Scenario
Country
Total amount of
Low growth 7.2%
Medium growth
High growth 14.9%
bed nights sold
annually
11.6% annually
annually
2 time the beds sold
3 times the beds sold 4 times the beds sold
Botswana
8,432
16,864
25,296
33,728
Namibia
62,981
125,962
188,943
251,924
South Africa
362,226
724,452
1,086,678
1,448,904
The growth in tourism in the Molopo ŁNossob basin will be contributed to some extent new
attractions such as the Kgalagadi Transfrontier National Park and the construction of new
ecotourism lodges in the three countries. The rich wildlife biodiversity and the stable political
environment in the region play an important role in tourism growth.
4.4 Planned Development Activities
Botswana: Potential and Planned Groundwater Water Utilization Projects
According to the Kgalagadi District Development Plan 6, the following potential projects are
planned in the area:
Ę
The Botswana Defence Force (BDF) is planning to build a base camp in Tsabong
area. This camp is going to provide both office accommodation and residence. It is
not clear how big this facility is going to be, but it was said to be a regional camp
which may have the potential to house about 100 officers and their families.
Ę
The National Master Plan for Agricultural Development (NAMPAD) of Botswana
has proposed some irrigation projects to be undertaken in the study area The major
proposed project is the establishment of wine yards in Tsabong to take advantage of
sunlight hours of the area and the conditions suitable to stress the crop to the
required standard. The project is further described in Chapter 3.2
Ę
There are also plans to harvest water from the water borne sewage system proposed
for the Tsabong area. Tsabong and Goodhope have waterborne sewage systems
planned for NDP 9; this development is anticipated to increase the water demand of
Geotechnical Consulting Services
69
Groundwater Review of the Molopo-Nossob Basin
Report No. ORASECOM/005/2009
these villages quite extensively. There are plans to harness waste water from these
systems for reuse in agriculture. However, there are cultural barriers which the
implementing officers have to overcome before the communities could wholly accept
such schemes.
Ę
In Ngwaketse South, NAMPAD has proposed some irrigation projects. The source of
the groundwater to be used in these projects would be from the development of Kanye
wellfield in Transvaal Supergroup Dolomites aquifer that is just in the fringe of the
Molopo River Basin northern boundary. The planned water demand for these
proposed projects is 6.2 Mm3/a; the shortfall would be met with the harnessing of
potential wastewater from Jwaneng and existing boreholes, refer to Chapter 3.2.
Namibia: Potential and Planned Groundwater Water Utilization Projects
The potential and planned groundwater utilization projects in Namibia include the following;
Ę The Hardap Regional Development Plan (RDP) identified Aranos as a primary
growth point. Infrastructural development would need to be undertaken and the
accepted target date for the development will be towards the end of 2010. The
estimated 2007 population of the village was approximately 2 920. Approximately 50
% of the high income group consumers have access to their own boreholes for
gardening water. The rest of the population would require water to be provided to
them.
Ę Mariental Town Council plans to upgrade services to the informal settlement area.
Through the Build Together Scheme approximately 20 houses will be built a year.
Ę According Hardap RDP further fish farms may be established near Hardap. Unless
fish or fish products are produced for a larger market in Namibia, it is not anticipated
that new fish farms will be established at Hardap. Currently that proposal is to
upgrade the hatchery to supply fingerlings to the industry. It is not clear if it will
influence the potable water demand of 8 000 to 10 000 m3/ month as supplied during
2007. During the 2007 financial year the raw water requirement was 32 000 m3/month
for the growing ponds.
South Africa: Potential and Planned Groundwater Water Utilization Projects
In South Africa, some future plans for tourism development are as follows:
Ę Tourism will be developed more in the Northern Cape area.
Ę Water provision for tourism must take into account the arid conditions in the area.
4.5 Future Water Requirement
In the South African part of the Molopo-Nossob Basin, Mafeking town has the highest water
requirement regarding urban water supply. According to Department of Water Affairs and
Forestry (DWAF, 2004) more than 11 Mm3/a is drawn from the groundwater resources in
Grootfontein which is more than the allocation of water.
The rural villages west of Mafeking do not have access to treated water. It is proposed to
bring water from the Middle Vaal Water Management Area (WMA) to supply these villages.
Plan for an extended irrigation of 2 km2 ha in the NW province using water from the
Disaneng dam will increase the water requirement in the area. Between 1995 and 2004 an
average annual water increase of 5.9 % is recorded. For the future water requirement, a lower
increase rate might be expected in accordance with increase for the Middle and Lower
Molopo River catchment areas.
Geotechnical Consulting Services
70
Groundwater Review of the Molopo-Nossob Basin
Report No. ORASECOM/005/2009
Due to negligible or even negative population growth and economic growth in the Middle
Molopo River catchment area, a small decrease in the domestic (urban and rural) and
industrial requirements for water are expected. No change is foreseen with respect to the
water requirements for irrigation. Water requirements for mining purposes, which are of more
localized importance, are also expected to remain relatively unchanged. Two scenarios were
developed by DWAF (2003a) a base scenario indicating a water requirement decline of 0.2%
per year and a high scenario with a yearly increase of 0.5%.
Little changes are foreseen with respect to the future urban and rural requirements in the
Lower Molopo River catchment area. A small reduction may be experienced in these sectors
as a result of an expected decline in population. Should there be strong economic
development in the water management area; a moderate increase in the urban, industrial and
mining requirement for water may result.
In a quantification of the projected future requirements for water in the Lower Orange Water
Management Area, development of an additional 40 km2 of irrigation is included, as was
approved in principle by the Minister for purposes of poverty relief and the settlement of
emerging farmers. The location of these irrigation areas is not specified but they will
probably be outside the Molopo-Nossob Basin boundary. The additional water requirement
for those 40 km2 is around 47 Mm3/a. Two scenarios were developed by DWAF (2003b), a
base scenario indicating a water requirement decline of 0.1% per year and a high scenario
with a yearly increase of 1.5%. These scenarios were without the additional irrigation areas
included.
As a summary for the South African part of Molopo-Nossob Basin, the future water
requirement is foreseen to increase slowly (or even to decrease) since the population growth
in the Middle and the Lower Molopo catchment areas is not strong. In the Upper Molopo
catchment area an increase is foreseen of maybe up to 2% annually. Figure 4-1 summarizes
the future water requirement for the three South African parts of the Molopo-Nossob Basin.
Together with the water requirements for Botswana and Namibia, given in Chapter 3, a
summary is presented in Figure 4-2 of the total future water requirement for the Molopo-
Nossob Basin.
80
/
a3
1995 - 2000
m
2015
t
M 60
2020
n
2025
e
m 40
i
r
e
u
q
e 20
r
R
t
e
a
W
0
Upper
Middle
Lower
Molopo
Molopo
Molopo
Figure 4-1
Future predicted water requirement for the three sub-areas of the Molopo-Nossob basin in South
Africa
Geotechnical Consulting Services
71
Groundwater Review of the Molopo-Nossob Basin
Report No. ORASECOM/005/2009
200
/
a3 180
m
1995 - 2000
2015
160
t
M
2020
n 140
e
2025
120
m 100
i
r
e
u
80
q
e
60
r
R
40
t
e
a
20
W
0
Botswana Namibia
South
Molopo-
Africa
Nossob
Figure 4-2
Future predicted water requirements for the Molopo-Nossob River Basin
Geotechnical Consulting Services
72
Groundwater Review of the Molopo-Nossob Basin
Report No. ORASECOM/005/2009
5 GEOLOGY AND HYDROGEOLOGY
5.1 Geology
5.1.1 Background Information
Molopo-Nossob basin is covered by national geological and hydrogeological maps from each
riparian country. Table 5-1 lists the maps available and used to compile the general covering
geology map of the Molopo-Nossob Basin. The geological formations are given various
names in the different country. In the geological map compiled and presented in Figure 5-1,
the nomenclature of the formations used is shown in Table 5-2 and Table 5-3. In selecting
the formations to illustrate in the map, primary emphasis is given to the formations'
importance for groundwater occurrence.
Table 5-1
Geological and Hydrogeological maps used in collation of the simplified geological map in Figure 5-1.
Country/
Map
Scale
Reference
Organisation
Botswana
Groundwater Resources Map of the Republic of 1:1,000,000 DGS, 1987
Botswana
Groundwater Pollution and Vulnerability Map of the 1:1,000,000 DGS, 1995
Republic of Botswana
The Pre-Kalahari Geological Map of the Republic of 1:1,000,000 DGS, 1997
Botswana
Namibia
Namibia Geological Map
1:1,000,000 GSN, 1980
Hydrogeological Map of Namibia
1:1,000,000 DWAF, 2001a
South Africa
Hydrogeological Map of the Republic of South Africa
1:2,000,000 DWAF, 2004d
Groundwater Resources of the Republic of South Africa
1:2,500,000 DWAF,1995
Hydrogeoloical Map Nossob 2419
1:500,000 DWAF, 2002a
Hydrogeological Map Vryburg 2522
1:500,000 DWAF, 2000
Hydrogeological Map Kimberly 2722
1:500,000 DWAF, 2003d
Hydrogeological Map Upington/Alexander Bay 2718
1:500,000 DWAF, 2001b
SADC
Isopach Map of the Kalahari Group
1:2,500,000 SADC, 1999
5.1.2 Geological Map
5.1.2.1 Simplified Geological Map
Information from the geological maps listed in Table 5-1 is used to compile a simplified
geological map over the Molopo-Nossob Basin. In the map bedrocks have been grouped
together have the same type of composition and of the same or close to the same geological
age and history. The nomenclature used for the geology differs between the three countries.
In the simplified map, Figure 5-1, four main formations are considered, Kalahari, Karoo,
Proterozoic and Archaean rock. These formations are then divided in subgroups, in total 12
groups. The division and characteristics of each group is described in Chapter 5.2.2.2.
Geotechnical Consulting Services
73
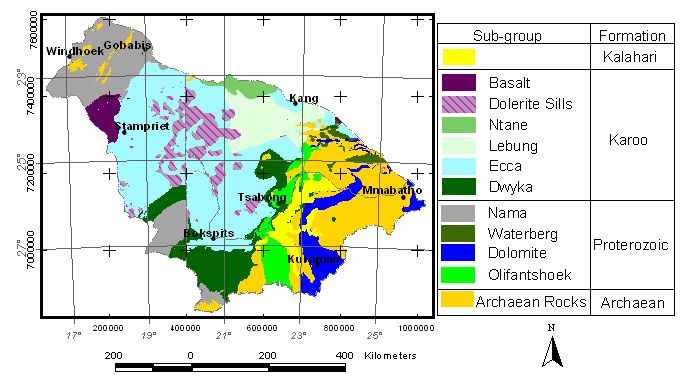
Groundwater Review of the Molopo-Nossob Basin
Report No. ORASECOM/005/2009
The main lithostratigraphic units presented in Figure 5-1 over the Molopo-Nossob Basin area
comprise the Kalahari Group, Karoo Supergroup, Nama Group, Proterozoic and Archaean
Basement rocks. The generalized stratigraphic sequence in the Molopo-Nossob Basin is
presented in Table 5-2.
Figure 5-1
Simplified geology map over the Molopo-Nossob Basin. References given in Table 5-1
5.1.2.2 Archaean Basement Rocks
The Archaean era (also spelled Archaean) is more than 2,500 million years old. Instead of
being based on stratigraphy, this era is defined chronometrically. All the rocks of the
Archaean age are put together in one group in the Map (Figure 5-1). The Archaean Basement
rock occupies the eastern part of the Molopo-Nossob Basin where some of the rocks are
concealed by a veneer of Tertiary to Quaternary continental sediments known as the Kalahari
Group.
One of the oldest units in the Archaean units is the Kraaipan, consisting of metabasalts, basic
schists, ultrabasic and amphibolites.
Other units in the Archaean Group in the Molopo-Nossob Basin are all included under the
Archaean Group Basement in Figure 5-1.
Generally, aquifers in the Basement Archean rocks are poor prospects of securing
groundwater in the Molopo-Nossob Basin. Groundwater occurrence in these rocks can be
wholly attributed to fissures, fractures and joints and controlled by the size of these fractures
and their interconnectivity.
The Swazian Granite and Gneiss which extend from west of Mmabatho in the east to
Morokweng in the west to Cassel in the South Africa, is an example of basement rock groups
where the ability to host groundwater is enhanced by the presence of fractures and dykes.
Geotechnical Consulting Services
74
Groundwater Review of the Molopo-Nossob Basin
Report No. ORASECOM/005/2009
Table 5-2
Regional stratigraphy in the Molopo-Nossob Basin
Age
(M. Era
Supergroup
Group/Formation
Description
years ago)
<85
Cretaceous to Kalahari Beds
Unconsolidated sand, clay and
Recent
duricrusts
65 Ł 145
Cretaceous
Dolerite intrusions and dykes
Dolerite dykes and sills
145 Ł 360
Carboniferous
Karoo
Stormberg Lava
Basalt
to Cretaceous
Lebung
Sandstone, siltstones, mudstone
Ecca
Interlayered sandstones, siltstones,
mudstones with carbonaceous
mudstones and thin coal seams
Dwyka
Tillite, mudstone and siltstone
490 Ł 552
Cambrian
Nama
Conglomerate, sandstones and
siltstones
552 Ł 2,500
Proterozoic to Waterberg
Assemblage of sandstones,
Cambrian
conglomerates and siltstones
Dolomites
(continental red-beds)
Olifantshoek
Dolomitic rocks, quartzites and chert
brezzia
Undifferential grey-red quartzite and
phyllite units
>2,500
Achaean
Mokolium
Metamorphic and igneous rocks
Vaalium
Various
granites and
volcanic
complex
Swazian
Kraaipan
The grade and depth of weathering of the Archean rocks, a function of climate and
mineralogy, is of importance in finding groundwater resources, however limited. This is
illustrated by a considerably variation in borehole yields.
The Basement aquifers are restricted mainly to the east of the Molopo-Nossab Basin and in
Botswana classified as having a poor groundwater potential by the National hydrogeological
reconnaissance maps of Botswana. Achaean basement rocks are also identified in the
northern part of the Molopo-Nossob Basin in Namibia.
5.1.2.2 Proterozoic rocks
Olifantshoek Supergroup
In the Proterozoic Rock Group, the Olifantshoek Supergroup is identified and outlined in the
map Figure 5-1. The Supergroup comprises mainly of coarse arenites including red beds
likely to be of fluvial or shallow marine origin (Beukes, 1990). The Olifantshoek Supergroup
outcrops in and around Tsabong in Botswana. The Supergroup continues in South Africa
(named the Volop and Postmasterburg groups).
The Olfantshoek Supergroup constitutes a group from which promising groundwater
resources can be found. Several boreholes were drilled in the Olifantshoek Supergroup in
Botswana for village water supply. The quartzite generally outcrop in the area but can be
overlain by Kalahari Beds and river alluvial. Tsabong village in Botswana has the only major
supply wellfield within the Molopo River Basin catchment area exploiting the Olifantshek
Supergroup
Geotechnical Consulting Services
75
Groundwater Review of the Molopo-Nossob Basin
Report No. ORASECOM/005/2009
The relationship between the Olifantshoek Supergroup and the Waterberg rocks of eastern
Botswana is uncertain but it is likely that they are chronostratigraphic equivalents belonging to
the Proterozoic Rock group. The Olifantshoek rocks possibly represent a continental margin
facies of the essentially intra-continental Waterberg sediments.
Dolomites
Aquifers in Dolomites, karstified fractured aquifers, are represented by Transvaal dolomite
units, in Botswana and Ghaap Group in South Africa. In Botswana, groundwater occurs in
the dolomite sequence of Taupone Group of Transvaal Supergroup well developed as Chert
Breccia aquifer in Kgwakgwe area and as Dolomite aquifer in Ramonnedi area both
supplying the Kanye village (the village however outside the Molopo-Nossob Basin).
The dolomites of Ghaap Group in South Africa has generally good groundwater potential and
yields in excess of 7.20 m3/hr (2.0 l/s) are common. Groundwater occurs along the fractures,
joints, and solution cavities commonly associated with faults and dolerite dykes. Among the
major supply areas from the dolomites are both Mmabatho and Kuruman.
Nama Group
The Nama Group rocks of Proterozoic or Cambrian age occur widely in the Namibian part of
the Molopo-Nossob Basin. The group rocks are exposed at the Namibia border, northwest of
Rietfontein, Gordonia. The Nama Basin extends from Gobabis area in Namibia in the north to
Vanrhynsdorp in South Africa in the south, a distance of 1000 km. The Nama Group rocks
consist of red, brown, and purple cross bedded sandstone, limestone and grey shales. The
Nama Group is divided into a lower Kuibis sub-group, middle Schwarzrand sub-group and an
upper Fish River sub-Group. In Botswana the Nama Group is not reported in any boreholes in
the Molopo-Nossob Basin.
5.1.2.3 Karoo Supergroup
The Karoo Supergroup represents a volcano-sedimentary sequence of rock across much of
southern Africa, deposited in a time span of about 120 million years (Carboniferous through
Cretaceous era) starting from about 300 million years ago. The lithostratigraphic column of
the Karoo Supergroup in the Molopo-Nossob Basin with some typical lithologies is given in
Table 5-3.
Dwyka Group
The Dwyka Group is the lowermost unit of the Karoo Supergroup. The group hosts glacial
sediments such as diamictites, pebbly mudstone, sandstone and tillites. The Dwyka Group
has variable thickness and lithology, its distribution and facies being controlled by the Pre
Karoo landscape. The Dwyka Group covers the southern part of the Molopo-Nossob Basin in
South Africa and southern parts in Botswana along the Molopo River.
The Dwyka Formation does not constitute an important aquifer in the Botswana part of
Molopo-Nossob Basin. In South Africa the Dwyka Formation is classified as a fractured
aquifer and consists predominantly of diamictite (tillites). Dwyka Formation extending north
of Upington into the Molopo-Nossob Basin is considered an aquifer promising for local water
supply.
Geotechnical Consulting Services
76
Groundwater Review of the Molopo-Nossob Basin
Report No. ORASECOM/005/2009
Table 5-3
Karoo Supergroup Stratigraphy and nomenclature in Botswana, Namibia and South Africa relevant to
the Molopo-Nossob Basin
Age
Botswana
Namibia
South Africa
This
Lithology
Report
Creta-
Dolerite
Dolerite
Dolerite
Dolerite
Dolerites and sills
ceous
intrusions
intru-sions
intru-
Sills
and dykes
and dykes
sions and
dykes
Jurassic
Stormberg
Kalkrand
Drakens-
Stormber
Basalt
lava
berg
g
Triassic
Lebung
Ntane
Clarens
Ntane
Reddish to pink fine
Fm
FM
to medium grained
sandstone
Mosolot-
Neu
Mosolot-
Basal conglomeratic
sane Fm
Loore
sane
sandstone, greenish-
yellow sandstone
interbedded with red-
brown siltstones, red-
brown mudstones
Beaufort
Kule Fm
Beau-
Fine grained
fort
sandstone, grey
mudstone/siltstone/sh
ale. Purple-brown
mudstone
Permian
Ecca
Otshe
Ecca
Auob
Ecca
Auob
Ecca
In Namibia three
Fm
sandstone layers
interbedding two
layers of bituminous
shale and coal
horizons. Similar in
Botswana
Kobe
Muko-
Muko-
In Namibia a shale
rob
rob
section overlain by
an upward-
coarsening sandstone
Ncojane
Nossob
Nossob
In Namibia a one to
two cycles of white
sandstone that
coarsens upwards
into fine to coarse-
grained white
sandstone
Carboni-
Dwyka
Dwyka
Dwyka
Dwyka
Tillite, mudstone and
-ferous
siltstone
= not represented in Molopo-Nossob Basin
Ecca Group
The Ecca Group sediments cover a large part of the Molopo-Nossob Basin. The group hosts
the most widely distributed aquifer in the basin.
Ecca group contains two major aquifers, the Auob aquifer in the upper sequence and the
Nossob aquifer at almost the bottom of the Ecca sequence. Further the Auob aquifer contains
in general three different sandy layers interbedded by coal seams and bituminous mudstones.
The two main aquifers, Auob and Nossob, are separated by a thick layer of low permeable
sequence of mudstones and siltstones (the Mukorob Formation). These two aquifers are
thoroughly investigated in Namibia (JICA, 2002) where the groundwater head and quality
show different status. Figure 5-2 shows a profile through the Namibia Ecca sequence in the
Stampriet Artesian Basin.
Geotechnical Consulting Services
77


Groundwater Review of the Molopo-Nossob Basin
Report No. ORASECOM/005/2009
NW
SE
(m ASL)
Section-1
Section-2
1400
26418
23769
Hoachanas
396
St ampriet
Section-3
Sect ion-4
6646
514
1288
Gochas
1300
K
J-9(Swart Modder)
Auob R.
32272
Tweeriver
105
658
J-5(Mart zivilla)
110
DWA-2
328
Auob R.
1310
392
1200
B
K
JO5-N(7995)Goachas
452
B
528
ACP-29
R
555
ACP-30
1100
A
GR-1
P.E.
A
J-8(Tweeriver)
R
K
1000
N
R
P.E.
R
M
K
A
A
R
900
Do
K
Kalahari Beds
B
Kalkland Basalt
M
A
800
Do
Karoo Dolerite
R
Rietmond Member
A
Auob Member
N
M
Mukorob Member
P.E.
N
Nossob Member
M
700
P.E.
Pre-Ecca Group
N P.E.
0
50
100
150
200
250
300 (Km)
< Fig.2-1 Geological Cross Section of Study Area >
Figure 5-2
Geological cross-section through the Ecca sediments in the Stampriet Artesian Basin from North-West
to the border with South Africa in South-East (Gemsbok Park). The Auob aquifer in orange, Nossob
Aquifer in light yellow and the Kalahari beds in light blue. (Copied from JICA, 2002)
In the Botswana part of the Molopo-Nossob Basin similar two aquifer layer conditions are
recognized. Here, however the two Ecca aquifers investigated in the northern part of the
Molopo-Nossob Basin are interpreted as being two different part of the Auob aquifer, in
Botswana called the Otshe aquifer.
The Auob (Otshe) aquifer is of a complex succession of canalized fluvial and deltaic
sediments consisting consist of multiple interbedded layers of fine to coarse-grained
sandstone, shale, mudstone, carbonaceous shale and poor coal (DGS, 1994). Argillaceous
units within the formation confine the individual water bearing sandstone units.
The Otshe (Auob) sandstone generally provides sufficient yields (2-3m3/h) for livestock
watering in both confined and unconfined conditions. The confined Nossob sandstone
generally yields very saline water. The semi-confined Auob sandstone yields usable brackish
water, in some the water is too saline for any agricultural use.
The Kobe Formation in Botswana overlies the Dwyka Group and this unit can be correlated
with the Nossop and Mukorob Members in Namibia. The Kobe Formation comprises
interbedded sandstones and siltstones with minor shales and mudstones. The Kobe Formation
is divided into lower Kobe Formation (Ncojane sandstone) and Upper Kobe Formation. The
lower Kobe Formation and the Nossob Formation consists of dark grey siltstone followed by
grey sandstone to dark grey siltstone and carbonaceous mudstone. The Nossob Formation in
Namibia and the Nojane sandstone formation in Botswana form the Nossob aquifer with
artesian conditions.
In Botswana the Otshe aquifer in the Ncojane Block occurs beneath relatively thin Kalahari
Beds and Lebung/Beaufort Group rocks.
Geotechnical Consulting Services
78
Groundwater Review of the Molopo-Nossob Basin
Report No. ORASECOM/005/2009
The Nossop sandstone formation in Botswana forms a thin confined aquifer near the north-
eastern boundary of the Kgalagadi Transfrontier Park yielding saline water under very high
pressure head conditions. This formation is, however, very deep and has very saline water
and thus does not constitute an important aquifer.
Lebung
The Lebung group is divided into the Mosolotsane formation and the Ntane sandstone
formation
The Mosolotsane Formation consists of red and brown mudstones, sandstones and siltstones.
The sandstone intercalations are poorly cemented and vary in colour. The formation, which is
found in an area in the north of Botswana and in limited areas in the Stampriet Artesian basin
in Namibia under the name New Loore, is not considered a major groundwater resource.
The Ntane sandstone is one of the most important and widespread aquifer in Botswana. In the
Molopo-Nossob Basin, the sandstone is encountered only in a limited part in the northern
Botswana part where it continues further outside the Molopo-Nossob Basin.
Lithologically the Ntane sandstone consists primarily of red or pink, fine to medium grained
friable sandstone. In large parts of Botswana the sandstone is overlain by the Stormberg
Basalt and the aquifer in the sandstone is under confined conditions. In the Molopo-Nossob
Basin, the occurring Ntane sandstone is not covered by the basalt but by Kalahari Beds. The
hydraulic condition in the aquifer is therefore to be considered as unconfined.
A general rule for the Ntane sandstone in Botswana is that it has a good average yield. Where
intersected by fracture zone, the transmissitivity of the aquifer become high and large amount
of water may be abstracted from the sandstone. In the Molopo-Nossob Basin the Ntane
sandstone is to be regarded as an important aquifer, especially in the area where no or limited
surface water resources can be found. Further the aquifer overlays the Auob (Otshe) aquifer
beneath in the Ecca group sequence.
Stormberg Basalt
The Stromberg Lava Group is the uppermost member of the Karoo Supergroup. This unit can
be correlated with the Kalkrand Basalt in Namibia. It consists of variably weathered, green or
reddish purple, amygdaloidal lava flows. Locally good yielding boreholes can be drilled but
in general the formation is regarded as an unproductive groundwater resource.
5.1.2.4 Kalahari Beds
Kalahari Beds is an informal lithostratigraphical term given to an association of loosely-
consolidated deposits that is between a few meters and almost 400 m thick (Carney et al,
1994).
The Kalahari Beds forms a unit of continental sediments of Quaternary to Recent age. The
Kalahari Group of sediments covers most of the Molopo-Nossob Basin, obscuring the
bedrock geology and structures except some exposures occur along the Molopo River. Pre-
Kalahari valleys are of importance for the groundwater occurrence in the Kalahari Beds. This
is well illustrated in the Molopo Valley around Middlepits area. Recent alluvial gravels are
found in the present and sometimes earlier courses of these rivers but are now buried by wind
Geotechnical Consulting Services
79
Groundwater Review of the Molopo-Nossob Basin
Report No. ORASECOM/005/2009
blown sands. Gravels are possibly deposited on old terraces of the Molopo River (DGS,
1994).
Broadly the Kalahari Group consists of a layer of aeolian sand up to 20 m thick which may
display relict dune structures. The sand is generally underlain by a duricrust layer of silcrete
and calcrete which must represent an unconformity within the succession. The duricrust is
underlain by poorly consolidated sandstones which are in many places calcareous. Where a
full succession is present, the sandstones are underlain by red marls and a basal clayey gravel
of undoubted fluvial origin.
The thickness of the Kalahari succession is largely a function of pre-Kalahari Group
topography, with the gravels being largely confined to palaeo-valleys. The maximum known
thickness of this unit within the Molopo-Nossob Basin is in the excess of 250 m according to
the SADC map of the Isopach of the Kalahari Beds (SADC, 1999). The surface aeolian
sands, named the Gordonia Sand Formation (SACS 1980), are up to 20 m thick and are
underlain by a duricrust horizon of silcrete and calcrete.
On the Map in Figure 5-1, the area covered by the Kalahari Beds is not highlighted. A map
of the Kalahari Beds extension and thicknesses is instead found in Figure 5-3. This map is
composed of data from the borehole archives of Botswana, Namibia and South Africa. To the
map is added information from the SADC Isopach map of the Kalahari Beds and the 15 m
contour line on the South African Hydrogeological map sheets. In total, 1,435 information
points are behind the map in Figure 5-3.
-22░S
Kalahari Beds
-23░S
-24░S
240
-25░S
210
180
-26░S
150
120
-27░S
90
60
30
Thickness
-28░S
m
20
Kalahari Beds limit
10
17░E
18░E
19░E
20░E
21░E
22░E
23░E
24░E
25░E
26░E
Figure 5-3
Kalahari Bed thickness
Geotechnical Consulting Services
80
Groundwater Review of the Molopo-Nossob Basin
Report No. ORASECOM/005/2009
The map in Figure 5-3 shows that only the southeastern most part of the basin together with
the northernmost part is not covered by the Kalahari Beds. The thickest deposits are found in
the pre-Kalahari valleys in Namibia, along the middle and upper part of Molopo River
course, in southeastern Gordonia and the northern part of the basin in Botswana. In those
areas the thickness exceeds 90 m.
The pre-Kalahari surface is shown in Figure 5-4 constructed as the ground surface
substracted by the Kalahari thickness. The lowest parts of this surface is north and east of the
confluence of the Molopo and Nossob Rivers and also in the area of the present large pans in
South Africa, west of Molopo River (Hakskeenpan and Koppieskraalpan area). Clearly
identified valley follows the Molopo River and the Nossob Auob area (the Salt-Block area).
-22░S
Pre-Kalahari surface
-23░S
-24░S
1480
1440
1400
-25░S
1360
1320
1280
1240
1200
-26░S
1160
1120
1080
1040
-27░S
1000
960
920
880
Meter above
-28░S
840
800
mean sea level
760
17░E
18░E
19░E
20░E
21░E
22░E
23░E
24░E
25░E
26░E
Figure 5-4
Pre-Kalahari surface
The Kalahari Beds contains locally groundwater. The groundwater level established from
numerous boreholes and displayed in Figure 5-4 can be used as an indicator of groundwater
occurrence in the Kalahari Beds. Figure 5-5 illustrates the areas in which the groundwater
level in the Molopo-Nossob Basin is found to be within the Kalahari Beds. The map is
constructed from information of ground surface level, thickness of Kalahari Beds and the
groundwater level. The largest area of "saturated" Kalahari Beds are found in the Gemsbok
National part and the continuation into the Namibian part of the basin following the Nossob
and Auob rivers up to Stampriet and Amimuis. Large areas are also found along the Upper
Molopo River Course, in Gordonia and in the central part of Botswana. The map does not
show any of the possible perched aquifer which may exist in the Kalahari Beds in the basin.
Geotechnical Consulting Services
81
Groundwater Review of the Molopo-Nossob Basin
Report No. ORASECOM/005/2009
-22░S
Saturated Kalahari Beds
-23░S
Aminuis
Kang
-24░S
Stampriet
200
Gochas
-25░S
180
160
140
-26░S
120
100
Bokspits
-27░S
80
60
40
Saturated
-28░S
thickness
20
m
0
Kalahari Beds limit
17░E
18░E
19░E
20░E
21░E
22░E
23░E
24░E
25░E
26░E
Figure 5-5
Thickness of Kalahari Beds below the groundwater surface
5.2 Hydrogeology
5.2.1 Aquifers
Definition
An aquifer is defined as a geological formation which contains and transmits groundwater
under gravity conditions in appreciable quantities. Aquifers are commonly divided into four
main types:
Ę porous (intergranular)
Ę fractured,
Ę fractured porous (intergranular and fractured)
Ę karstic aquifers.
The division is based on how the groundwater occurs within the aquifer.
"Intergranular" describes aquifers in which groundwater occurs in openings between granules
and grains of unconsolidated material such as sand and gravel. Such openings can either be of
primary or secondary nature. Primary openings refer to the voids left during the deposition of
the material. The capacity of intergranular aquifers to store water is influenced by factors
such as grain size, roundness of grains, ratio of different grains sizes, clay content and the
density of compaction. The greatest restricting factors on the yield or the development
potential of porous (intergranular) aquifers are occurring content of finer material as for
instance clay and silt.
Geotechnical Consulting Services
82
Groundwater Review of the Molopo-Nossob Basin
Report No. ORASECOM/005/2009
"Fractured" describes aquifers where groundwater is associated with fractures, fissures and
joints. Such structures are usually called secondary because they are commonly formed at a
later stage and not related to the original rock-forming process. Interstices of this nature are
normally the result of tectonic action. Tectonic stress causing compaction, de-composition,
faulting, folding and shearing can result in fractures and fissures in especially more resistant,
lithologies and on contact of different lithologies. Decompression by the removal of material
through erosion can cause openings on contacts and/or bedding planes, especially in
sedimentary successions. Intrusions can likewise cause fracturing. Baking of the host
lithology in the contact zone by molten intrusive can render this zone brittle and thus
susceptible to fracturing. All of the above generally lead to favourable groundwater targets
(van Dyk and Ksiten, 2006).
Fractured porous (intergranular and fractured) aquifers, describe aquifers, in which
groundwater occurs in both fractures and intergranular interstices. In these aquifers, the
fractures act as the main conduits of water and the pores itself in the rock, the intergranular
spaces, for instance in a sand, sandstone, arkose or even siltstone, are contributing water to
these main conduits when water are taken out from a fractured porous aquifer. Weathering is
a process where the less resistant material in a formation, for instance a medium to coarse-
grained hard rock lithology, such as granite and gneiss, is removed. These results in preferred
pass-ways for the water where the remaining more resistant parts still have an intergranular
pore space.
The terms primary and secondary features used for intergranular and fractures are misleading
since the structures called secondary does not imply for instance that fractures, fissures, etc
are of secondary importance for the occurrence and movement of water in the aquifer.
Usually in such media, the fractures are more important for the location and abstraction of
groundwater than the intergranular interstices themselves.
Fractured porous aquifers are also referred to as having a dual porosity system. Such aquifers
show a specific behaviour once water is being release from them. In fact dual porosity system
exist in most type of aquifers, fractured, porous as well as fractured porous, where water is
transmitted in fractured and pores of various transporting and storing capacities.
Karstic aquifers are carbonate rocks where solution weathering along joints, fractures, and
bedding has enhanced the water-bearing capabilities of the rock. Those aquifers are limited in
aerial extent and located eastern and southern part of the Molopo-Nossob Basin and
represented by dolomites.
5.2.1.1 Hydraulic Parameters
Definitions
With hydraulic parameters in groundwater hydrology (hydrogeology) is understood the
following parameters:
Ę Transmissivity
Ę Storativity
Ę Effective porosity
Geotechnical Consulting Services
83
Groundwater Review of the Molopo-Nossob Basin
Report No. ORASECOM/005/2009
Transmissivity is a measure of the rate of flow of water across the unit width of the entire
saturated thickness of the aquifer under a unit hydraulic gradient. It is expressed in terms of
m2/day or equivalent (SADC, 2001).
T = K H
h
Transmissivity (T) is directly proportional to average horizontal permeability (Kh) and aquifer
thickness (H). For a confined aquifer, this remains constant, as the saturated thickness
remains constant. The aquifer thickness of an unconfined aquifer is from the base of the
aquifer to the groundwater table. The water table can fluctuate, which changes the
transmissivity of the unconfined aquifer.
Hydraulic conductivity, symbolically represented as K, is a property of soil or rock that
describes the ease with which water can move through pore spaces or fractures. It depends on
the intrinsic permeability of the material and on the degree of saturation. Hydraulic
conductivity is the parameter in the Darcy equation expressing the relation between the
groundwater flow and the hydraulic gradient. The hydraulic conducitivity varies between
geologic media from less than 10-8 m/s to more than 10m/s.
Porosity (n) is a directly measurable aquifer property; it is a fraction between 0 and 1
indicating the amount of pore space between unconsolidated particles or within a fractured
rock. Typically, the majority of groundwater (and anything dissolved in it) moves through the
porosity available to flow (sometimes called effective porosity).
Effective porosity refers to the fraction of the total volume in which fluid flow is effectively
taking place (this excludes dead-end pores or non-connected cavaties). This is important for
groundwater flow, as well as for solute transport in groundwater.
Hydraulic parameters on Aquifers in the Molopo-Nossob Basin
From investigation, mainly for groundwater supply but also for regional groundwater studies,
in the Molopo-Nossob Basin, the hydraulic parameters are assessed. Basically three different
approaches are used:
Ę Direct measurements through various aquifer tests in the filed
Ę Laboratory measurements on samples
Ę Modeling exercises where the parameters are assessed from model calibration and/or
water balance calculations.
Methods of direct measurements include test pumping where a borehole is tested usually with
a constant rate and at the same time the drawdown in the borehole and in neighbouring
boreholes are measured as function of time. From such test, the hydraulic parameters
Transmissivity and storativity can be calculated. In groundwater investigation there is also a
first estimate of the yield of a borehole by blowing or pumping out the water to an assessment
of the borehole yield in approximate figure. The yield of a borehole is proportional to many
parameters, but the main parameter is the aquifer transmissivity.
Drawdown in a pumping well (pumped with a constant rate) is a function of discharge (Q),
time (t), transmissivity (T), storativity (S), linear and non-linear well losses and aquifer
geometry (including the barrier and/or recharge boundaries).
Geotechnical Consulting Services
84
Groundwater Review of the Molopo-Nossob Basin
Report No. ORASECOM/005/2009
Q
2
s =
{W (u) + 2} + DQ
w
4 T
Where, sw is the drawdown, Q = discharge, T = transmissivity W (u) = Well function
(depending on borehole diameter, time and aquifer storativity), the skin-factor and C a
constant expressing non-linear losses in a discharging borehole. So even if there are a number
of various parameters on which the borehole yield depend, the main and most important one
is the aquifer transmissivity T.
It is assumed that variations of yields and transmissivity in an aquifer in general can be
expressed as a log-normal distribution. In such a distribution the median value represents a
characteristic value for the formation. The spreading of the parameter, can be expressed using
the standard deviation of the log-normal distribution, in the current approach, these value
refer to the borehole yields.
Information on borehole yields from various aquifers is available in reports from areas of
investigation. Table 5-4 indicates a number of investigations from which information on
borehole yield is obtained.
The yield information is illustrated as log-normal distributions in Figure 5-6 and Figure 5-7.
The number of information used in the fitting with normal distribution and the coefficient of
determination, r2 are expressed in Table 5-5.
The results of the statistical treatment of the borehole yields expressed as the Yields to be
expected within the standard deviation limits of log-normal distribution are given in Figure
5-8.
Table 5-4
Reports from groundwater investigations used in collecting information on borehole yields and aquifer
parameters
Country
Area
Report
No of information
Yield
T-value
Aquifer
Botswana
Kanye
DWA, 2006
16
Dolomite
Kang
DWA, 2007
21
17
Ecca
Ncojane
DWA, 2008
12
9
Ntane
42
27
Ecca
Bokspits
DGS, 2004
31
3+2
Kalahari
38
11
Ecca
7
Dwyka
26
Olifantshoek
Middlepits
DWA, 1999
2
2
Ecca
2
2
Olifantshoek
Middlepits-Makopong
DGS, 1994
8
8
Ecca
Tsabong
DWA, 2002
5
2
Kalahari
66
23
Olifantshoek
Werda-Mabutsane
DGS, 2003
21
8
Kalahari
21
17
Ecca
Hunhukwe-Lokalane
DGS, 2000
9
9
Ntane
7
7
Ecca
Namibia
SAB
JICA, 2002
47
5
Kalahari
13
Basalt
55
6
Ecca
16
6
Nossob
Geotechnical Consulting Services
85
Groundwater Review of the Molopo-Nossob Basin
Report No. ORASECOM/005/2009
Table 5-5
Number of information used in the fitting the yields from various aquifers with normal distribution
and the coefficient of determination, r2
Figure
No
Rock Type
Area
r2
Points used
Total data points
5.2-1
Kalahari
Botswana
0.9310
38
57
5.2-1
Kalahari
SAB
0.9774
37
47
5.2-1
Basalt
SAB
0.9507
13
14
5.2-1
Ntane
Ncojane
0.9063
12
14
5.2-2
Ecca
Dutlwe
0.9151
19
21
5.2-2
Ecca
Kang
0.9772
21
26
5.2-2
Ecca
Bokspits
0.9696
38
60
5.2-2
Ecca
Ncojane
0.9696
42
47
5.2-2
Ecca
SAB
0.9025
48
55
5.2-2
Nossob
SAB
0.8196
7
16
5.2-2
Dwyka
Bokspits
0.8985
7
17
5.2-1
Olifantshoek
Botswana
0.9685
69
92
5.2-1
Dolomite
Kanye
0.9074
16
27
100
100
Dolomite Kanye
90
90
Olifantshoek Botswana
Kalahari SAB
Basalt SAB
80
Kalahari Botswana
80
70
70
%
60
%
60
i
l
i
t
y
i
l
i
t
y
b
50
b
50
a
a
b
b
r
o
40
r
o
40
P
P
30
30
20
20
10
10
0
0
0
0.5
1
1.5
2
2.5
0
0.5
1
1.5
2
2.5
10Log (Yield) m3/h
10Log (Yield) m3/h
Figure 5-6
Borehole yield data from various aquifers and locations in Botswana and Namibia. SAB
(Stampriet Artesian Basin)
Geotechnical Consulting Services
86
Groundwater Review of the Molopo-Nossob Basin
Report No. ORASECOM/005/2009
100
100
Ecca Ncojane
Dolomite Kanye
90
Ecca Kang
Ntane Ncojane
Ecca Dutlwe
Nossob SAB
80
Ecca SAB
80
Dwyka Bokspits
Ecca Bokspits
70
%
60
%
60
i
l
i
t
y
i
l
i
t
y
b
50
a
b
a
b
b
r
o
40
r
o
40
P
P
30
20
20
10
0
0
0
0.5
1
1.5
2
2.5
0
0.5
1
1.5
2
2.5
10Log (Yield) m3/h
10Log (Yield) m3/h
Figure 5-7
Borehole yield data from various aquifers and locations in Botswana and Namibia. SAB
(Stampriet Artesian Basin)
Transmissivity
In order to obtain reliable value on transmissivity two main approaches are done (i) flied tests
and (ii) modeling exercises. In the field test usually a limited number of boreholes are
subjected to testing. These selected boreholes are also the ones showing the highest yields
established during the drilling process. Figure 5-8 shows that the yields from the Ecca
aquifers (Otshe and Auob) have different median values but they are distinguished from the
other formations. The transmissivity values reported from theses aquifers are presented in
log-normal diagram in Figure 5-9.
Kalahari - Botswana
Kalahari - SAB
Basalt - SAB
Ntane - Ncojane
Ecca - Dutlwe
Ecca - Kang
Ecca - Bokspits
Ecca - Ncojane
Ecca - SAB
Nossob - SAB
Dwyka - Bokspits
Olifantshoek - Botswana
Dolomite - Kanye
0.01
0.1
1
10
100
Yield m3/h
Figure 5-8
Borehole yields to be expected within the standard deviation limits of the log-normal distribution
of borehole yields from various aquifers in Botswana and Namibia.
=median value
Geotechnical Consulting Services
87
Groundwater Review of the Molopo-Nossob Basin
Report No. ORASECOM/005/2009
100
Ncojane
90
All together
Dutlwe
80
Bokspits
70
%
60
i
l
i
t
y
b
50
a
b
r
o
40
P
30
20
10
0
0
0.5
1
1.5
2
2.5
3
10Log (Yield) m3/h
Figure 5-9
Transmissivity data from Ecca aquifer at various locations in Botswana
The results of the statistical treatment of the transmissivity data expressed as the
transmissivity to be expected within the standard deviation limits of log-normal distribution
are given in Figure 5-10.
Ecca - Ncojane
Ecca - Bokspits
Ecca - Dutlwe
Ecca - All together
1
10
100
1000
Transmissivity m2/day
Figure 5-10
Transmissivity data to be expected within the standard deviation limits of the log-normal
distribution of transmissivity from Ecca aquifer in Botswana.
=median value
Storativity.
Storativity is defined as the volume of water released from storage per unit surface area of the
aquifer per unit decline in the hydraulic head. It is dimensionless coefficient (SADC, 2001).
The size of the storativity depends on whether the aquifer is confined or unconfined:
Geotechnical Consulting Services
88
Groundwater Review of the Molopo-Nossob Basin
Report No. ORASECOM/005/2009
Ę Unconfined Aquifer. An aquifer in which the water is in direct contact with the
atmosphere through open spaces. It has a free water table and the true thickness of the
aquifer is more than or equal to the saturated thickness.
Ę Confined Aquifer. An aquifer that is confined from top and bottom by impervious
layers and the piezometric surface is above the top confining layer.
In unconfined aquifers the storativity varies in general between 10-4 to 10-2, whereas in
confined aquifers the values usually are between 10-6 to 10-4. Storativity values are obyained
from test pumping procedures where drawdown observation are done in boreholes outside the
pumped boreholes and/or from modeling exercises and from analyses of water level
fluctuations and recharge assessment.
5.2.1.2
Potential Aquifers
In hydrogeological maps over Botswana, Namibia and South Africa, the groundwater
resources are given with reference to the yield of the boreholes in a delineated area. Usually
the average or median yield is used to characterize the area. In the three riparian countries,
different scales are used in order to define the yield class or principal groundwater
occurrence. Table 5-6 summarizes the scales used in Botswana, Namibia and South Africa.
Table 5-6
Borehole yield classes used in Botswana, Namibia and South Africa. (Taken from DWA, 1987,
Christelis and Struckmeier, 2001, DWAF, 1995
Country
Yield Classes (median borehole yield)
Botswana
<1.8 m3/h
1.8-7.2 m3/h
7.2-18 m3/h
>18 m3/h
Namibia
<0.5 m3/h
0.5-3 m3/h
3-15 m3/h
>15m3/h
South Africa
0.0-0.1 l/s
0.1-0.5 l/s
0.5-2.0 l/s
2.0-5.0 l/s
>5.0 l/s
Used in Figure 3-
Medium
High
3
In the aquifer productivity map shown in Figure 5-11, two classes are given. These are based
on the Botswana and South African division, however using m3/h for the median borehole
yield. For the Namibian part of the map, the selected intervals are slightly higher, see legend
to map in Figure 5-11.
Of the three type of aquifer identified the intergranular (porous) covers the largest area. Areas
of high potential within this group are identified in Namibia and Botswana (Ecca formation)
and in smaller spots in South Africa (Kalahari Beds). Of the intergranular and fractured
aquifer, the Ntane sandstone in the northern Botswana is highlighted as an aquifer of high
potential. Other high potential areas of this aquifer type are found in southern South Africa.
The Olifantshoek formation, which stretches from South Africa into Botswana is assign a
medium potential on the Botswana side.
Dolomite aquifers are prevailing as the aquifers of the highest potential in South Africa. The
formations holding these aquifers are stretching up into Botswana and in some part showing
high potential.
Geotechnical Consulting Services
89

Groundwater Review of the Molopo-Nossob Basin
Report No. ORASECOM/005/2009
Figure 5-11
Groundwater Potential Map. Compiled from hydrogeological Maps over Botswana, Namibia and
South Africa
5.2.2 Groundwater Quality
5.2.2.1 Quality Components and Guidelines
Three (3) groundwater quality components are considered for the Molopo-Nossob Basin,
TDS, NO3 and F. The groundwater quality components are assessed from compilation of
chemical analyses performed on water samples taken. In the currents maps are constructed
showing the variation of the components within the basin.
The databases from which information of water quality is obtained are summarized in Table
5-7. For Botswana, data are also compiled from investigations reported within areas included
in the Molopo-Nossob basin.
Table 5-7
Databases from which information of groundwater chemistry are extracted to form the base for
construction of map over Molopo-Nossob basin
Country
Data bases containing information of TDS, NO3, F in
groundwater
Botswana
National Borehole Archive
Water Quality database
Investigation reports over selected areas
Namibia
Groundwater database GROWAS
South Africa
Water Management System
Geotechnical Consulting Services
90
Groundwater Review of the Molopo-Nossob Basin
Report No. ORASECOM/005/2009
Water quality guidelines for water use for domestic supply exist in all three countries. Table
5-8 summarizes the guideline for the water quality components considered.
Table 5-8
Guidelines and recommendations for domestic water supply regarding the components TDS, NO3
and F
WHO
Botswana, 2000
Namibia, 1991
South Africa, 2006
1993
Class 1
Class 2
Class 3
Group A
Group B
Group C
Group D
Class I
Class II
Guide-
Ideal
Acceptable
Max.
Excellent
Good
Low
Unsuitable
Recommended
Max allowable for
line
mg/l
mg/l
Allowable
Quality
Quality
Health
mg/l
for operational
limited
duration
Value
mg/l
mg/l
mg/l
Risk
limit
mg/l
mg/l
mg/l
TDS
1,000
450
1,500
2,000
975*
1,950*
2,600*
>2,600*
<1,000
1,000-2,400
NO3
45
45
45
45
45
90
180
>180
45**
45-90**
F
1.5
0.7
1.0
1.5
1.5
2.0
3.0
>3.0
<1.0
1.0-1.5
*= recalculated values from Electronic conductivity using TDS (mg/l) = EC (mS/m) x 6.5
** = recalculated from nitrogen in Nitrate
Guidelines for water use for livestock published by FAO (FAO, 1976) are shown in Table 5-
9 regarding TDS. The tolerance of livestock to salinity varies with the animals. South
Australia Department of Agriculture gave in their fact sheet no 82/77 the maximum TDS for
healthy growth to 6,000 mg/l for sheep, 3,000-4,000 for cattle and 4,000 mg/l for horses, see
Table 5-10. The maximum values of TDS suggested for Southern Kgalagadi in Botswana
(DGS, 1994) are cattle 10,000, sheep/goats 13,000 and horses 6,500 mg/l (DGS, 1994).
Table 5-9
Guidelines on Total Dissolved Solids, TDS for water use for livestock from FAO (1976) and
proposal from DGS (1994)
Livestock (FAO), 1976
Excellent
Very
Satisfactory
Reasonable safety for dairy
Considerable
risk
Unfit
Satisfactory
and beef cattle, sheep, swine
for
pregnant
or
and horses; to be avoided for
lactating cows
pregnant
and
lactating
animals
<1,000
1,000 Ł 3,000
3,000 Ł 5,000
5,000 Ł 7,000
7,000 Ł 10,000
> 10,000
Table 5-10
Livestock salinity tolerance (South Australia department of Agriculture, Livestock Water Supplies
facts sheet no 82/77, September 1982) (Source: DGS, 1994)
Animal
Max TDS for healthy growth
Max TDS to maintain condition
Max TDS tolerated
(mg/l)
(mg/l)
(mg/l)
Sheep
6,000
13,000
*
Beef cattle
4,000
5,000
10,000
Dairy cattle
3,000
4,000
6,000
Horses
4,000
6,000
7,000
Pigs
2,000
3,000
4,000
Poultry
2,000
3,000
3,000
*Depends on type of feed available, e.g. greenfeed, dry feed or saltbush
The amount of data of tree parameters compiled, TDS, F and NO3 from the different
databases and countries as summarized in Table 5-11.
Geotechnical Consulting Services
91
Groundwater Review of the Molopo-Nossob Basin
Report No. ORASECOM/005/2009
Table 5-11
Number of data used in the compilation of water chemistry maps over Molopo-Nossob basin
Parameter
Botswana
Namibia
South Africa
Total
TDS
2,147 *
6,905
7,367
14,933
NO3
1,560
6,898
5,464
13,922
Fluoride
1,648
5,870
5,391
12,909
= data included from neighbouring areas outside the Molopo-Nossob Basin
5.2.2.2 Total Dissolved Solids (TDS)
General TDS
The total dissolved solids (TDS), measured in mg/l (or ppm), and is a measure of the amount
of various inorganic salts dissolved in water. The TDS concentration is usually measured by:
Ę an estimate of the EC value
Ę the dry weight of the salts after evaporation of a known volume of filtered water;
Ę the sum of the concentrations of the constituent cations and anions.
The TDS concentration is directly proportional to the electrical conductivity (EC) of water.
Since EC is much easier to measure than TDS, it is routinely used as an estimate of the TDS
concentration.
Electrical conductivity (EC) is a measure of the ability of water to conduct an electrical
current. This ability is a result of the presence of ions in water all of which carry an electrical
charge. Most organic compounds dissolved in water do not dissociate into ions, consequently
they do not affect the EC.
The TDS concentration is given in mg/l, as well as the equivalent EC, expressed in milli-
Siemens per meter (mS/m), measured at, or corrected to a temperature of 25 oC.
For most natural waters electrical conductivity is related to the dissolved salt concentration
by a conversion factor ranging from 5.5 - 7.5. The average conversion factor for most waters
is 6.5. The conversion equation is as follows:
EC (mS/m at 25 oC) x 6.5 = TDS (mg/R)
The exact value of the conversion factor depends on the ionic composition of the water,
especially the pH and bicarbonate concentration. When accurate measures of TDS are
required, the conversion factor should be determined for specific sites and runoff events.
Virtually all natural waters contain varying concentrations of TDS as a consequence of the
dissolution of minerals in rocks, soils and decomposing plant material and the TDS of natural
waters is therefore usually dependent on the characteristics of the geological formations the
water is in contact with.
The concentration of the TDS varies but is typically (DWAF, 1996a):
Ę in rainwater is low, generally less than 1 mg/l
Geotechnical Consulting Services
92
Groundwater Review of the Molopo-Nossob Basin
Report No. ORASECOM/005/2009
Ę in water in contact with hard crystalline rocks, siliceous sand and well-leached soils
are generally low, less than 30 mg/l.
Ę in water in contact with sedimentary rock formations is generally in the range of 195
Ł 1,100 mg/l.
TDS are likely to accumulate in water moving downstream because salts are continuously
being added through natural and manmade processes while very little of it is removed by
precipitation or natural processes. Domestic and industrial effluent discharges and surface
runoff from urban, industrial and cultivated areas are examples of the types of return flows
that may contribute to increased TDS concentrations. The main factor responsible for
increasing TDS in the Molopo-Nossob Basin is the natural processes of interaction between
water and geological media.
High TDS concentrations in surface water are also caused by evaporation in water bodies
which are isolated from natural drainage systems. The saline pans in the central parts of
Southern Africa are such water bodies.
Treatment TDS
Although some salts, such as those of calcium, magnesium and certain heavy metals can be
removed by chemical precipitation, most of the inorganic salts dissolved in water can only be
removed by distillation or by highly sophisticated physical-chemical separation technologies.
All these technologies are characterised by their high cost and/or their high energy
requirements.
The common technologies available for reducing the concentration of TDS in water are:
Ę Demineralization in a mixed-bed ion exchange column, usually where the feed TDS
concentration is approximately 2 000 mg/l. Disposable ion exchange canisters can be
used to produce potable water for domestic consumption whereas large banks of ion
exchange filter beds, which are capable of being regenerated, are used on an industrial
scale. Ion exchange processes are also used for the production of ultra pure water.
Ę Treatment by membrane processes such as reverse osmosis or electro dialysis where
the TDS concentration is in the range of 2 000 - 3 500 mg/l. Small low-pressure
reverse osmosis modules fed from a domestic supply line reliably produce potable
water for household consumption and are easily replaced after one to three years if the
membrane becomes fouled through scaling. Large-scale treatment is achieved with
banks of reverse osmosis modules in parallel.
Ę Distillation, in cases where the TDS concentration is approximately 10,000 mg/l.
All the process alternatives are usually fouled by suspended matter and may also be impeded
by severe scaling from hard waters. All large-scale processes require high levels of design,
operator and maintenance skills. Furthermore, all processes produce a concentrated waste
stream of the salts removed from the water and may cause disposal difficulties.
Geotechnical Consulting Services
93
Groundwater Review of the Molopo-Nossob Basin
Report No. ORASECOM/005/2009
Effects on humans from TDS
The norms used in the guideline for TDS consider aesthetic and human health effects and
economic impacts.
Low concentrations of particularly calcium and magnesium salts have nutritional value,
although water with an extremely low TDS concentration may be objectionable because of its
flat, insipid taste. Health effects related to TDS are minimal at concentrations below 2 000 - 3
000 mg/l. In contrast, high concentrations of salts impart an unpleasant taste to water and
may also adversely affect the kidneys.
Some of the physiological effects which may be directly related to high concentrations of
dissolved salts include:
Ę laxative effects, mainly from sodium sulphate and magnesium sulphate,
Ę adverse effects of sodium on certain cardiac patients and hypertension sufferers;
Ę effects of sodium on women with toxaemia associated with pregnancy; and
Ę effects on kidney function.
Bathing and washing in water with excessively high concentrations of TDS may give rise to
excessive skin dryness and hence discomfort.
Chemical corrosion may occur when the alkalinity, i.e. the concentrations of carbonate,
bicarbonate and hydroxide are low, the TDS concentration is high, particularly the
concentrations of chloride and sulphate, and the pH is low. Excessively high concentrations
of TDS may adversely affect plumbing and appliances and hence the maintenance and
replacement requirements. The effects of TDS and EC on human health, aesthetics,
household distribution systems and water heating appliances are summarized in Table 5-12.
Effects on Livestock from TDS
The norms used in the guidelines for livestock watering are based on (DWAF, 1996b):
Ę the palatability (tastiness) and toxicological effects of the TDS on livestock
consumption; and
Ę the effects of the TDS on clogging and encrustation of livestock watering systems.
Common salt, sodium chloride (Na Cl), is frequently added to livestock rations to regulate
feed intake, enhance palatability, and as a carrier for other required elements.
Table 5-12
Effects of TDS and EC on Human Health, Aesthetics, Household Distribution Systems and Water
Heating Appliances (DWAF, 1996a)
TDS Range
EC
Aesthetic/Economic Effects
Health Effects
mg/l
Range
mS/m
Target Water Target
Extremely low TDS may give flat, No health effects are expected with
Quality
Water
insipid taste. No effects on plumbing or TDS <300 mg/l.
Range
Quality
appliances.
The upper limit (450 mg/l) takes into
Range
account the higher water consumption
0 Ł 450
which may be expected in hot climates.
Geotechnical Consulting Services
94
Groundwater Review of the Molopo-Nossob Basin
Report No. ORASECOM/005/2009
TDS Range
EC
Aesthetic/Economic Effects
Health Effects
mg/l
Range
mS/m
0 -70
450 Ł 1,000
10 Ł 150
Noticeable salty taste. Well tolerated. No health effects are likely
No effects on plumbing or appliances.
1,000 Ł 2,000 150
Ł Marked salty taste. Probably not used on Consumption of water does not appear
300
aesthetic grounds (if alternative supplies to produce adverse health effects in the
are
available).
Some
effects
on short term.
plumbing and appliances (increased
corrosion or scaling).
2,000 Ł 3,000 300
Ł Taste extremely salty. Corrosion and/or Short-term
consumption
may
be
450
scaling
of
pipes
and
appliances tolerated, but with probable disturbance
increases.
of the body's salt balance
>3,000
>450
Taste extremely salty and bitter. Short-term
consumption
leads
to
Corrosion and/or scaling of pipes and disturbance of the body's salt balance.
appliances increases.
At high concentrations, noticeable
short-term health effects can be
expected.
Saline water may detrimentally affect animal health and thus performance by rendering the
water unpalatable. Palatability is also influenced by the types of salts present and not just the
level of salinity. Magnesium sulphate (Epsom salts) is more harmful than sodium chloride or
sodium sulphate (Glauber's salt). The main water quality constituents implicated in
palatability effects are chloride, sulphate, magnesium, bicarbonates and calcium. However,
other factors such as dust, temperature and algae can also contribute to whether or not water
is deemed palatable or unpalatable by livestock.
Direct effects of unpalatable water are (DWAF, 1996b):
Ę Refusal to consume water.
Ę Depending on the degree of unpalatability stock may consume the water, but at a level
below the physiological requirement (a concurrent increase in water intake with
increasing salinity is required for adequate renal plasma clearance to take place).
Ę In extreme cases, the stock will refuse the water but will eventually be driven to it by
thirst. This may result in a consumption of excessive amounts of water and therefore
salts, which may manifest as "salt poisoning" when a sodium salt is involved.
Indirect effects of unpalatable water are:
Ę Initial refusal to consume water and hence a decline in productivity. Typically, this
may last a few days for stock which have not previously encountered saline waters.
The implications are:
o economic loss for intensive systems where time is a crucial factor; and
o health implications for systems where new, young stock are brought in and are
stress-sensitive (electrolyte imbalance), such as in feedlots.
Ę In more severe cases the stock may regularly consume sufficient water for adequate
plasma clearance, but production declines. This is primarily due to the high positive
correlation between water intake and feed intake. A decline in water intake results in a
decrease in feed intake (dehydration-induced hypophagia) with a resultant drop in
Geotechnical Consulting Services
95
Groundwater Review of the Molopo-Nossob Basin
Report No. ORASECOM/005/2009
performance parameters such as milk production, average daily gain (ADG), feed
conversion ratio (FCR) and body weight.
The types of effects of exposure to TDS concentrations in excess of the TWQR (Target
Water Quality Range) depend on the ability of the stock to adapt to saline or unpalatable
water, and whether or not the stock have been previously exposed to saline water.
Livestock can adapt to highly saline water and continue production without adverse effects
after an initial decline in production. Adaptation may require several days or weeks,
depending on the TDS level and salts involved.
The main effects of TDS on toxicological aspects are attributed to the following:
Ę Symptoms of diarrhea and dehydration due to initial exposure to saline waters. The
primary constituents involved are sulphate, magnesium and bicarbonate.
Ę Ingestion of large volumes of highly saline water following a period of refusal to
unpalatable water. Adverse effects are usually osmotic which may lead to "salt
poisoning", but may be related to a specific ion, depending on the amount of water
ingested and the concentration of the specific ion in the water and feed.
Ę Salt poisoning is invariably acute. Toxic effects related to specific ions are often
indirectly due to the increased water intake and can result in constituents eliciting a
toxic response at levels normally safe. Salts that have little effect on the palatability of
water but are toxic include nitrates, fluorides and the salts of heavy metals.
The recovery from volume-loaded hypertension depends on the TDS concentration, the
length of exposure time and the primary salts involved. Recovery may be complete or
incomplete. Recovery from high ingestion rates of potentially hazardous constituents depends
on the specific salts and constituents involved). It should be noted that there are vast
differences in salt tolerance between and also within species. More information is given by
DWAF "Water Quality Guidelines" (DWAF, 1996b).
TDS in Molopo-Nossob Basin
Using the available data on TDS obtained from analyses of groundwater from boreholes, a
map showing the areal distribution of TDS is constructed, see Figure 5-12. In the map,
contour lines for TDS in accordance with the major guidelines for TDS in water are applied,
see Table 5-13. The calculation is done through the interpolation technique "inverse instance
to a power" using the computer programme "Surfer".
Figure 5-12 shows that the highest values and also largest area of saline groundwater is
found in Botswana. Using the upper limits of 2,000 and 10,000 mg/l as the limits for human
and livestock consumption, the areas unsuitable for water consumption is assessed as
summarized in Table 5-14. The areas are illustrated in Figure 5-13.
Geotechnical Consulting Services
96
Groundwater Review of the Molopo-Nossob Basin
Report No. ORASECOM/005/2009
Table 5-13
TDS concentration limits chosen for the construction of the TDS map (Figure 5-12)
TDS equiv.-concentration level Remarks
450
Upper limit set by Botswana for "ideal" water quality
1,000
Guideline value limit WHO Standard and South African Class I
2,000
Upper limit Botswana Class 3
5,000
Upper limit for satisfactory water quality for livestock
according to FAO
10,000
Unfit water quality for livestock watering according to FAO
20,000
Extreme saline water
Table 5-14
Area sizes in the Molopo-Nossob Basin of unsuitable groundwater for human and livestock
consumption based on TDS limits of 2,000 and 5,000 mg/l respectively
Country
km2 unfit for
km2 unfit for
% of country
% of country
human
livestock
basin size
basin size
consumption
consumption
TDS>2,000 mg/l
TDS>10,000 mg/l
(>2,000 mg/l)
(>10,000 mg/l)
Botswana
106,400
70,400
78
52
Namibia
28,800
1,000
24
<1
South Africa
45,500
5,600
41
5
Total
180,700
77,000
49
21
-22░S
Gobabis
Windhoek
-23░S
Ncojane
Aminius
Kang
Hukuntsi
-24░S
Stampriet
50,000
Gochas
-25░S
20,000
Werda
Goodhope
10,000
Tosca
Mmabatho
Tsabong
-26░S
5,000
Aroab
2,000
Bokspits
Vanzylrus
-27░S
Kuruman
1,000
TDS
-28░S
450
mg/l
0
17░E
18░E
19░E
20░E
21░E
22░E
23░E
24░E
25░E
26░E
Figure 5-12
TDS concentration in the groundwater within the Molopo-Nossob Basin
Geotechnical Consulting Services
97
Groundwater Review of the Molopo-Nossob Basin
Report No. ORASECOM/005/2009
-22░S
Gobabis
Windhoek
-23░S
Ncojane
Aminuis
Kang
Hukuntsi
-24░S
Stampriet
Gochas
-25░S
Werda
Goodhope
Tosca
Mmabatho
Tsabong
-26░S
Aroab Bokspits Vanzylsrus
-27░S
Kuruman
-28░S
17░E
18░E
19░E
20░E
21░E
22░E
23░E
24░E
25░E
26░E
Figure 5-13
Areas of unsuitable groundwater quality of human consumption (TDS>2,000 mg/l) and livestock
watering (TDS>10,000 mg/l)
In the Namibian part of the Molopo-Nossob basin, multiple aquifer system was identified n
the Stampriet Artesian Basin (JICA, 2002), see further Chapter 5.2.2.2. The groundwater
quality in the lowermost aquifer, the Nossob aquifer, shows quality conditions different from
the upper aquifer, the one represented by the regional condition in Figure 5-12. The TDS
values in the Nossob aquifer are higher than in the upper two aquifers. Figure 5-14 illustrates
the TDS values in the Nossob aquifer within the Stampriet Artesian Aquifer.
Geotechnical Consulting Services
98
Groundwater Review of the Molopo-Nossob Basin
Report No. ORASECOM/005/2009
-22░S
-23░S
-24░S
-25░S
20,000
10,000
-26░S
5,000
2,000
-27░S
1,000 TDS in
450
Nossob
-28░S
Aquifer
0
17░E
18░E
19░E
20░E
21░E
22░E
23░E
24░E
25░E
26░E
Figure 5-14
TDS in the Nossob Aquifer in the Stampriet Artesian Aquifer in Molopo-Nossob Basin in Namibia.
Data source: JICA, 2002
5.2.2.3 Nitrate, NO3
General NO3
Nitrate is the end product of the oxidation of ammonia or nitrite. Nitrate (NO3) and nitrite
(NO2) are the oxy-anions of nitrogen. Nitrates and nitrites occur together in the environment
and inter conversion readily occurs. Under oxidizing conditions nitrite is converted to nitrate,
which is the most stable positive oxidation state of nitrogen and far more common in the
aquatic environment than nitrite.
Nitrate in drinking water is primarily a health concern since it can be readily being converted
in the gastrointestinal tract to nitrite as a result of bacterial reduction.
Mineral deposits of nitrates are rare due to the high water solubility of nitrates. Nitrates are
ubiquitous in soils and in the aquatic environment, particularly in association with the
breakdown of organic matter and eutrophic conditions.
Concentrations of nitrate in water are typically less than 5 mg/l of nitrate-nitrogen (or,
alternatively, 22 mg/l nitrate). A significant source of nitrates in natural water results from the
oxidation of vegetable and animal debris and of animal and human excrement. Treated
sewage wastes also contain elevated concentrations of nitrate.
Nitrate tends to increase in shallow ground water sources in association with agricultural and
urban runoff, especially in densely populated areas. Nitrate together with phosphates
stimulate plant growth. In aquatic systems elevated concentrations generally give rise to the
accelerated growth of algae and the occurrence of algal blooms.
Geotechnical Consulting Services
99
Groundwater Review of the Molopo-Nossob Basin
Report No. ORASECOM/005/2009
Where water is well-oxygenated, it can be assumed that the nitrate plus nitrite nitrogen
concentrations are largely due to the presence of nitrate. Nitrite concentrations only become
significant in deoxygenated systems.
Nitrate in water is commonly expressed in mg NO3/l, but also the concentration focused on
the nitrogen as mg N/l (nitrate-nitrogen) is used. The conversion factors between the two
expressions are given as:
1 mg/l NO3 = 0.23 mg/l N
1 mg/l N = 4.43 mg/l NO3
Treatment NO3
Nitrate is not readily removed from domestic water supplies. Some reduction of nitrate may
be achieved using slow sand filtration, but the method is not reliable. Biological reduction of
nitrate to nitrogen gas (de-nitrification) is feasible in the presence of a suitable carbon source,
but the increase in carbonaceous matter is not compatible with a high quality water supply.
Non-specific methods of removing nitrate include:
Ę Passing the water stream through an ion exchange column with a selective affinity for
nitrates. The method is expensive because other anions will be removed at the same
time, depending on the nature of the resin used. However, it may be attractive on a
household scale where only water used for drinking purposes is treated.
Ę Reverse osmosis, which will remove nitrate effectively from water, along with high
percentages of virtually all other ions and many organic compounds. A low-pressure
home unit will conveniently treat small quantities of drinking water satisfactorily.
The module is replaced when it begins to block through fouling or scaling.
On a commercial scale the processes described require competent operation, control and
maintenance.
Effects on Humans from Nitrate and Nitrite
The norm used in the guideline for nitrate and nitrite concerns human health. There are no
direct aesthetic impacts.
Upon absorption, nitrite combines with the oxygen-carrying red blood pigment, haemoglobin,
to form methaemoglobin, which is incapable of carrying oxygen. This condition is termed
methaemoglobinaemia. The reaction of nitrite with haemoglobin can be particularly
hazardous in infants under three months of age and is compounded when the intake of
Vitamin C is inadequate.
Metabolically, nitrates may react with secondary and tertiary amines and amides, commonly
derived from food, to form nitrosamines which are known carcinogens. The effects of nitrate
on human health are summarized in Table 5-15.
Effects on Livestock from Nitrate and Nitrite
The norms used in the guideline for nitrate and nitrite are based on the toxicological and
palatability (tastiness) effects associated with nitrate in water used by livestock.
Geotechnical Consulting Services
100
Groundwater Review of the Molopo-Nossob Basin
Report No. ORASECOM/005/2009
Nitrate does not cause direct toxic effects, but in its reduced form, nitrite (NO2), it is 10 - 15
times more toxic than nitrate. Nitrite is formed through the biological reduction of nitrate in
the rumen, and ruminants (mammals that digests plant-based food by initially softening it
within the animal's first stomach, known as the rumen, then regurgitating the semi-digested
mass and chewing it again. Examples of ruminating mammals are cattle, goats, sheep,
giraffes, camels, wildebeest and antelope) are therefore susceptible to nitrite poisoning. The
same process occurs in the caesium of horses. They are therefore also susceptibility to nitrite
toxicity due to the ingestion of nitrate, although less so than ruminants, but more so than
monogastrics (humans, pigs, dogs and cats).
Table 5-15 Effects of Nitrate on Human Health (DWAF, 1996a)
Nitrate/nitrite
Nitrate/nitrite Range
Effects
Range
(as mg/l N)
(as mg/l NO3)
Target Water Quality
Target Water Quality
No adverse effects
Range
Range
0 Ł 27
0 Ł 6
27 Ł 45
6 Ł 10
Rare instances of methaemoglobinaemia in
infants; no effects in adults. Concentrations in
this range generally well tolerated.
45 Ł 90
10 Ł 20
Methaemoglobinaemia may occur in infants. No
effects in adults.
>90
>20
Methaemoglobinaemia
occurs
in
infants.
Occurrence of mucous membrane irritation in
adults.
It is essential to adapt livestock to water with elevated nitrate concentrations, in order to
avoid poisoning by nitrite. If unadapted animals are suddenly exposed to too high
nitrate/nitrite levels, the rumen is unable to "detoxify" (reduce NO2 to ammonia), whereas
adapted animals cope without any signs of adverse effects. Non-ruminants are less
susceptible, as conversion to nitrite is limited (saliva and intestinal flora) to approximately
five percent of that of ruminants.
Nitrite oxidizes haemoglobin to methaemoglobin which, unlike haemoglobin, cannot
transport oxygen in body tissues. Poisoning results in suffocation due to lack of oxygen in the
tissues and the mucous membranes are often visibly "brownish" in colour due to the presence
of methaemoglobin. Nitrites also cause vasodilation of the capillary bed and thus a profound
drop in blood pressure, which can cause death, even without excessive amounts of
methaemoglobin being formed. Nitrite can cross the placental barrier; the haemoglobin of
foetuses is more susceptible to toxic effects, and abortions may result. Nitrite is not usually
found in milk.
Symptoms of acute nitrate toxicity in non-ruminants include clinical signs of restlessness,
frequent urination, dyspnoea and cyanosis. Advanced stages may include vomiting, ataxia,
convulsions, inability to rise and death. Symptoms of methemoglobinemia include weakness,
ataxia, hypersensitivity, dyspnoea, rapid pulse rate, increase in respiration and urination and
cyanosis. Acute nitrate poisoning in ruminants may manifest itself within two to three hours
after ingestion. Chronic poisoning is associated with a decrease in methemoglobinemia
within one week due to rumen micro-organism adaptation.
Geotechnical Consulting Services
101
Groundwater Review of the Molopo-Nossob Basin
Report No. ORASECOM/005/2009
The target water quality range is 0 Ł 100 mg/l NO3, and for higher concentrations,
monogastrics are more affected than ruminants. More information is given in DWAF "Water
Quality Guidelines" (DWAF, 1996b).
Nitrate in the groundwater in the Molopo-Nossob Basin
Data on NO3 obtained from analyses of groundwater from boreholes and stored in the water
departments in the three basin countries are used to construct a map showing the areal
distribution of NO3, see Figure 5-15. In the map, contour lines for NO3 in accordance with
the major guidelines for NO3 in water are applied, see Table 5-16. The calculation is done
through the interpolation technique "inverse instance to a power" using the computer
programme "Surfer".
Table 5-16
NO3 concentration limits chosen for the construction of the NO3 map (Figure 5-12)
NO3 equiv.-concentration level
Remarks
45
Upper limit set by Botswana for "ideal" water quality. Rare
Instances of methaemoglobinaemia in infants
90
Upper limit Namibia Group B. Methaemoglobinaemia may
occur in infants. No effects in adults.
180
Upper limit Namibia Group C
>180
Unsuitable
-22░S
-23░S
-24░S
-25░S
180
-26░S
90
Nitrate
-27░S
NO3
45
mg/l
-28░S
27
17░E
18░E
19░E
20░E
21░E
22░E
23░E
24░E
25░E
26░E
Figure 5-15
NO3 concentration in the groundwater within the Molopo-Nossob Basin
The areas of highest Nitrate in groundwater are found in the area following the Auob River
and in the south-western part of South Africa. Some few other areas have nitrate level of 45
Geotechnical Consulting Services
102
Groundwater Review of the Molopo-Nossob Basin
Report No. ORASECOM/005/2009
mg/l, for instance around Hukuntsi, East of Nossob River and north of Tsabong in Botswana
and West of Stampriet in Namibia.
In the Nossob aquifer in the Stampriet Artesian Basin in Namibia, NO3 in the groundwater is
below the limit for human consumption. An old (1954) data gives a value higher than the
limit, but can represent a local pollution at the time of sampling.
5.2.2.4 Fluoride, F
General F
Fluoride is the most electronegative member of the halogen group of elements in the periodic
system. It has a strong affinity for positive ions and readily forms complexes with many
metals. In its elemental form, fluorine is a greenish-yellow gas which readily dissolves in
water to form hydrofluoric acid. Fluorine is highly reactive and will attack most materials,
including glass. Most fluorides are insoluble in water. However many soluble complexes are
formed with silicates and the transition metals.
The presence of fluoride in drinking water reduces the occurrence of dental caries in adults
and children. A small amount of fluoride is necessary for proper hardening of dental enamel
and to increase resistance to attack on tooth enamel by bacterial acids. In humans and
animals, fluoride accumulates in the skeleton.
Common fluoride minerals are flour-spar (CaF2) and flour-apatite, a calcium flour-
phosphate. Others of importance include various flour-silicates and mixed fluoride salts.
Typical concentration of fluoride in waters is (DWAF, 1996a):
Ę unpolluted surface water, approximately 0.1 mg/l;
Ę ground water, commonly up to 3 mg/l, but as a consequence of leaching from fluoride
containing minerals to ground water supplies, a range of 3 - 12 mg/l may be found;
Ę sea water, approximately 1.4 mg/l.
Fluoride is present in much food stuff and in water. Drinking water is estimated to contribute
between 50 % - 75 % of the total dietary fluoride intake in adults. In domestic water supplies
as well as industrial supplies used in the food and beverage industries, the fluoride
concentration in the water should not exceed approximately 0.7 mg/l.
Due to the very pronounced electron affinity of the fluoride atom, fluoride is capable of
interacting with almost every element in the periodic table. Fluoride reacts readily with
calcium to form calcium fluoride, which is reasonably insoluble and can be found in
sediments. In the presence of phosphate the more insoluble apatite or hydroxy apatite may
form. Fluoride also reacts very readily with aluminium, a property which is made use of in
the removal of fluoride from water.
Treatment Fluoride, F
Fluoride is difficult to remove from water to a required concentration range. Although
calcium fluoride is relatively insoluble, its solubility is an order of magnitude higher than the
levels which need to be achieved by treatment. The common methods for the removal of
fluoride include:
Geotechnical Consulting Services
103
Groundwater Review of the Molopo-Nossob Basin
Report No. ORASECOM/005/2009
Ę Adsorption in a bed of activated alumina;
Ę Removal in ion exchange columns along with other anions; and
Ę Removal in membrane processes such as reverse osmosis and electro dialysis together
with virtually all other ions.
Regeneration of the activated alumina or ion exchange bed produces a high fluoride stream
which may pose disposal difficulties. A concentrated reject stream is also produced from
reverse osmosis and electro dialysis, hence possible disposal problems.
Effects on Humans from Fluoride (F)
The norms used in the guideline for fluoride primarily concern human health effects. Fluoride
does not affect the aesthetic quality of domestic water.
When fluoride is ingested, it is almost completely absorbed, where after it is distributed
throughout the body. Most of the fluoride is retained in the skeleton and a small proportion in
the teeth. Fluoride accumulates most rapidly in the bones of young people, but continues to
accumulate up to the age of about 55.
The difference between concentrations of fluoride that protect tooth enamel and those that
cause discolouration is marginal. Discolouration of dental enamel and mottling occurs at
concentrations in the range of 1.5 - 2.0 mg/l in persons whose teeth are undergoing
mineralization. Generally, children up to seven years of age are susceptible.
High doses of fluoride interfere with carbohydrate, lipid, protein, vitamin, enzyme and
mineral metabolism. Skeletal fluorosis may occur when concentrations of fluoride in water
exceed 3 - 6 mg/l and becomes crippling at intakes of 20 - 40 mg/day. This is equivalent to a
fluoride concentration of 10 - 20 mg/l, for a mean daily water intake of two litres. Systemic
toxicity and interference with bone formation and metabolism occur at high concentrations.
Chronic effects on the kidneys are observed in persons with renal disorders and rarer
problems, including effects on the thyroid gland, which may occur with long-term exposure
to high fluoride concentrations. Acute toxic effects at high fluoride doses include
haemorrhagic gastroenteritis, acute toxic nephritis and injury to the liver and heart- muscle
tissues. Many symptoms of acute fluoride toxicity are associated with the ability of fluoride
to bind to calcium. Initial symptoms of fluoride toxicity include vomiting, abdominal pain,
nausea, diarrhoea and convulsions.
Where concentrations of fluoride in the drinking water are low dietary fluoride supplements
are recommended. Fluorosis is less severe when drinking water is hard, rather than soft, since
the occurrence of calcium together with fluoride limits fluoride toxicity. However, there is no
way of mitigating against the effects of long-term ingestion of higher than recommended
concentrations of fluoride.
The effects of fluoride on aesthetics and human health are summarized in Table 5-17.
Geotechnical Consulting Services
104
Groundwater Review of the Molopo-Nossob Basin
Report No. ORASECOM/005/2009
Table 5-17
Effects of Fluoride on Aesthetics and Human Health (DWAF, 1996a)
Fluoride Range
Effects
(mg/l)
Target
Necessary to meet requirements for healthy tooth structure is a function of daily water
Quality Range
intake and hence varies with annual maximum daily air temperature. A concentration
0 - 1.0
of approximately 0.75 mg/l corresponds to a maximum daily temperature of
approximately 26 oC Ł 28 oC. No adverse health effects or tooth damage occurs.
1.0 Ł 1.5
Slight mottling of dental enamel may occur in sensitive individuals. No other health
effects are expected.
1.5 Ł 3.5
The threshold for marked dental mottling with associated tooth damage due to
softening of enamel is 1.5 mg/l. Above this, mottling and tooth damage will probably be
noticeable in most continuous users of the water. No other health effects occur.
3.5 Ł 4.0
Severe tooth damage especially to infants' temporary and permanent teeth; softening of
the enamel and dentine will occur on continuous use of water. Threshold for chronic
effects of fluoride exposure, manifested as skeletal effects (detected mainly by
radiological examination, rather than overt).
4.0 Ł 6.0
Severe tooth damage especially to the temporary and permanent teeth of infants; softening
of the enamel and dentine will occur on continuous use of water. Skeletal
fluorosis occurs on long-term exposure.
6.0 Ł 8.0
Severe tooth damage as above. Pronounced skeletal fluorosis occurs on long-term
exposure.
>8.0
Severe tooth damage as above. Crippling skeletal fluorosis is likely to appear on long-
term exposure.
>100
Threshold for onset of acute fluoride poisoning, marked by vomiting and diarrhoea.
>2,000
The lethal concentration of fluoride is approximately 2,000 mg/l.
Ambient air temperature strongly influences the total water intake of humans and animals,
and hence indirectly, susceptibility to the detrimental effects of fluoride. Generally, the hotter
it is, the greater is the water consumption. Calcium and particularly aluminium concentrations
influence the absorption of fluoride. The criteria have taken into account the effects of these
variables at the values likely to be encountered in a "typical" water sample.
The European Union recognizes two maximum admissible concentrations for fluoride,
namely, 1.5 mg/l at 8 - 12oC and 0.7 mg/l at 25 - 30oC. Under conditions in Southern Africa
this is probably in the region of 0.75 mg/l, equivalent to approximately 26 - 28oC maximum
temperature. The relationship between air temperature and recommended fluoride
concentrations is shown in Figure 5-16.
n
1
t
i
o
t
r
a
n
0.8
e
c
n
o
0.6
C
e
/
l
)
g
r
i
d
u
(
m 0.4
l
o
F
m
u
0.2
t
i
m
p
O
0
15
20
25
30
35
40
Maximum Daily Air Temperature
(oC)
Figure 5-16
Relationship between Maximum Daily Air Temperature and Optimum Fluoride Concentration
(after DWAF, 1996a)
Geotechnical Consulting Services
105
Groundwater Review of the Molopo-Nossob Basin
Report No. ORASECOM/005/2009
Effects on Livestock from Fluoride (F)
The norm used in the guideline for livestock watering is primarily based on the toxicological
effects associated with ingestion of fluoride.
Excessive amounts of fluoride result in tooth damage in young growing animals and bone
lesions that cause crippling in older animals, especially in cattle. However, fluoride is also
beneficial to animals and reduces osteoclast activity and increases osteoblast activity.
Signs of fluorosis are generally observed in the second and third year of exposure. Adverse
effects due to fluorosis are indirect and include lameness and decreased feed and water intake
(foraging, mastication and drinking become painful), which result in a decline in growth and
health. Fluorosis first manifests itself in the permanent incisors (front teeth); dairy cattle are
the most sensitive livestock and the most crucial stages are between six months to three years
of age.
Toxicity by fluoride does not directly affect the health of calves since they (i) store the
fluoride in bones and teeth to substantial levels before any adverse effects occur and (ii) high
urinary excretion of fluoride occurs.
It is generally accepted that milk and meat are free from significant accumulations of fluoride
and hence are safe to consumers.
Fluorosis is less severe when drinking water is hard, rather than soft (the presence of calcium
and chloride reduces fluoride toxicity) since the occurrence of calcium together with fluoride
limits fluoride toxicity.
Table 5-18 summarizes the effects of Fluoride on livestock health.
Table 5-18
Effects of Fluoride on Livestock Health (DWAF, 1996b)
Fluoride Range
Effects
(mg/l)
Ruminants
Monogastrics
Target Water
No adverse effects
No adverse affects
Quality Range
0 Ł 2
2 Ł 4
No adverse effects
Adverse chronic effects associated with
dental fluorosis in young livestock and
skeletal fluorosis in mature livestock, such
as mottling of teeth and enamel hypoplasia,
a decrease in feed and water intake and a
decline in productivity may occur, with
continuous long-term exposure. But
are unlikely if:
- feed concentrations are normal
- exposure is short term
Could even be tolerated in the long term,
depending on site-specific factors such as
nutritional interactions and water requirement
4 Ł 6
Adverse effects may occur
Adverse chronic effects (as above) and
effects such as crippling , lameness and
weight loss may occur, although short-term
Geotechnical Consulting Services
106
Groundwater Review of the Molopo-Nossob Basin
Report No. ORASECOM/005/2009
Fluoride Range
Effects
(mg/l)
Ruminants
Monogastrics
exposure could be tolerated depending on site-
specific factors such as nutritional interactions
and water requirement
6 Ł 12
Adverse chronic effects associated with As above
dental fluorosis in young livestock and
skeletal fluorosis in mature livestock,
such as mottling of decrease in feed
and water intake and a decline in
productivity,
may
occur,
with
continuous long-term exposure. But are
unlikely if:
- feed concentrations are normal
- exposure is short term
Could even be tolerated in the long term,
depending on site-specific factors such as
nutritional
interactions
and
water
requirement
>12
Adverse chronic effects (as above) and As above
effects such as crippling , lameness and
weight loss will occur, although short-
term exposure could be tolerated
depending on site-specific factors such as
nutritional
interactions
and
water
requirement
Fluoride F in Molopo-Nossob Basin
Using the available data on F obtained from analyses of groundwater from boreholes, a map
howing the areal distribution of F is constructed, see Figure 5-17. In the map, contour lines
for F in accordance with the major guidelines for F in water are applied, see Table 5-19. The
calculation is done through the interpolation technique "inverse instance to a power" using
the computer programme "Surfer".
-22░S
Gobabis
Windhoek
-23░S
Ncojane
Aminius
Kang
Hukuntsi
-24░S
Stampriet
Gochas
-25░S
Werda
Goodhope
Tosca
Mmabatho
8
Tsabong
-26░S
6
Aroab
Bokspits
Vanzylsrus
-27░S
Fluoride
4
Kuruman
mg/l
-28░S
1.5
0.7
-29░S
17░E
18░E
19░E
20░E
21░E
22░E
23░E
24░E
25░E
26░E
Figure 5-17
Fluoride (F) concentration in the groundwater within the Molopo-Nossob Basin
Geotechnical Consulting Services
107
Groundwater Review of the Molopo-Nossob Basin
Report No. ORASECOM/005/2009
Table 5-19
F concentration limits chosen for the construction of the Fluoride map (Figure 5-14)
TDS equiv.-concentration level
Remarks
0.7
Upper limit set by Botswana for "ideal" water quality
1.5
Guideline value limit, WHO Standard, Namibia Group A and
Botswana max allowable limit, Class 3. Threshold for softening
of enamel.
4
Threshold for chronic effects of fluoride exposure
6
Severe damage on teeth and skeleton
8
Crippling skeletal fluorosis on long-term exposure.
In a major part of Botswana from the South-West up through Kgalagadi and further into the
area mentioned South oh Kang, the groundwater contains F above the limit of 1.5 mg/l, see
Figure 5-17. A major part of the Southern part of Molopo-Nossob Basin along the Auob
River in Namibia has F values above the limit of 1.5 mg/l. Low fluoride values are found in
South Africa with the exception of the western part.
In the Nossob aquifer in the Stampriet Artesian Basin, the groundwater show elevated level
of fluoride, see Figure 5-18.
-22░S
-23░S
-24░S
-25░S
6
-26░S
4
-27░S
1.5
F in
Nossob
-28░S
0.7
Aquifer
17░E
18░E
19░E
20░E
21░E
22░E
23░E
24░E
25░E
26░E
Figure 5-18
Groundwater Fluoride (F) content in the Nossob aquifer in the Stampriet Artesian Basin in
Namibia. Data source: JICA, 2002
5.2.2.5 Areas of Poor Groundwater Quality in the Molopo-Nossob Basin
The three groundwater quality parameters TDS, NO3 and F, have each delineated areas which
exceed the limits set up in the guideline for water use (domestic consumption and livestock
watering).
Figure 5-19 shows for each of the parameter an area delineated in which the guideline limits
are exceeded for human consumption (TDS >2,000 mg/l, NO3 >45 mg/l and F >1.5 mg/l).
Geotechnical Consulting Services
108
Groundwater Review of the Molopo-Nossob Basin
Report No. ORASECOM/005/2009
Figure 5-20 shows similar areas delineated by the guidelines for livestock watering (TDS
>10,000 mg/l, NO3 >180 mg/l and F >4 mg/l).
The areas exceeding the guideline, overlain in Figure 5-19 and 5-20; show as a result
regions within Molopo-Nossob basin having one, two or all parameters exceeding the
guideline values used in the current study.
The regions where having all three guidelines for human consumption exceeded are found in
the South-western part of Botswana, the Western part of South Africa and the South-eastern
part along the Auob River in Namibia. For livestock watering only some limited areas,
probably associated with local pollution of the water sources, show NO3 exceeding 180 mg/l.
Regions exceeding two of the guideline limits for livestock watering are found in the same
areas as for exceeding the guidelines for human consumption in the south-western Botswana,
Western South Africa and along the Auob River in the South-eastern part of Namibia,
however in reduced area extension. An area between Hukuntsi and Werda in Botswana also
has TDS and F exceeding the guideline limits for livestock watering.
-22░S
-23░S
-24░S
Gochas
-25░S
Salt-
Block
area
-26░S
-27░S
-28░S
17░E
18░E
19░E
20░E
21░E
22░E
23░E
24░E
25░E
26░E
NO3 > 45 mg/l
F >1,5 mg/l
TDS > 2,000 mg/l
Figure 5-19
Areas exceeding guideline limits for human consumption
Geotechnical Consulting Services
109
Groundwater Review of the Molopo-Nossob Basin
Report No. ORASECOM/005/2009
-22░S
Gobabis
Windhoek
-23░S
Ncojane
Aminius
Kang
Hukuntsi
-24░S
Stampriet
Gochas
-25░S
Werda
Goodhope
Tosca
Mmabatho
Tsabong
-26░S
Aroab Bokspits Vanzylsrus
-27░S
Kuruman
-28░S
17░E
18░E
19░E
20░E
21░E
22░E
23░E
24░E
25░E
26░E
NO3 > 180 mg/l
F >4 mg/l
TDS > 10,000 mg/l
Figure 5-20
Areas exceeding guidelines for livestock watering
It should be noted that the number of groundwater quality information (borehole data) varies
over the Molopo-Nossob Basin. Whereas South Africa and Namibia are well covered,
Botswana on the other side has only limited number of information on groundwater quality.
Figure 5-21 illustrates this difference where each borehole used in the assessment of the
groundwater quality is shown.
Geotechnical Consulting Services
110
Groundwater Review of the Molopo-Nossob Basin
Report No. ORASECOM/005/2009
-21░S
-22░S
-22░S
-23░S
-23░S
-24░S
-24░S
-25░S
-25░S
-26░S
-26░S
TDS
-27░S
-27░S
NO3
-28░S
-28░S
-29░S
17░E
18░E
19░E
20░E
21░E
22░E
23░E
24░E
25░E
26░E
17░E
18░E
19░E
20░E
21░E
22░E
23░E
24░E
25░E
26░E
-21░S
-22░S
-23░S
-24░S
-25░S
-26░S
F
-27░S
-28░S
-29░S
17░E
18░E
19░E
20░E
21░E
22░E
23░E
24░E
25░E
26░E
Figure 5-21
Location of data (boreholes) from which information of TDS (upper left), NO3 (upper right) and F
(lower) are obtained
5.2.3 Groundwater Monitoring and Flow
5.2.3.1 General
Groundwater monitoring is one of the most important topic in the supply, development and
planning of water for all sectors of a country's society. Domestic, industrial as well as
agricultural water supply for the future of a nation depends on available water resources
where groundwater resources play the most important role. Currently it is estimated that
around 80-90% of the water supply in the Molopo-Nossob Basin comes from groundwater.
The climate situation in the basin does not favour any large replenishment of groundwater.
Therefore groundwater abstraction on very large scales must always consider the available
replenishment to allow groundwater to be abstracted and used in a sustainable manner.
It is of the greatest importance that the available groundwater resources are monitored in
order to avoid situations in which the resources are exploited and no or limited groundwater
resources are left for the future prosperity and development.
With groundwater monitoring is understood the measurement of:
Ę Groundwater level
Geotechnical Consulting Services
111
Groundwater Review of the Molopo-Nossob Basin
Report No. ORASECOM/005/2009
Ę Groundwater abstraction
Ę Groundwater quality
In order to be considered as a monitoring exercise measurements have to be done continuous
at regular interval, decided by the local groundwater situation such as abstraction of
groundwater, mining, irrigation etc within the region subjected to monitoring.
Abstraction of groundwater always has an impact on the groundwater level. The size of the
impact, measured as changes in the groundwater level depends on the stress imposed, the
abstraction (or human implied replenishment), and of the hydraulic parameters of the
groundwater resource and the natural replenishment to the groundwater.
A balance between the outtake of water and the groundwater level is reached in general terms
when the replenishment balances the abstraction. In the climatic environment of the Molopo-
Nossob Basin, extreme large groundwater abstraction will imply that large area will be
influenced with a groundwater lowering in order to reach such a balance.
Beside groundwater abstraction, impact on the groundwater levels can be caused by:
Ę Land use change
Ę Irrigation and drainage
Ę Climate change
Ę Mining and underground construction
Groundwater quality will also be affected by the changes mentioned. However, whereas the
changes in groundwater level are a more or less instance response to any stress or impact, the
changes in quality will take longer time. Groundwater level is changing in time and
groundwater quality is changing with location is a common expression in hydrogeology.
Groundwater monitoring is usually the responsibility of government organizations. There is
however also monitoring has done by communities and private institutions as requirement
within permits given for water abstraction or release of used or unused water.
Most of the groundwater monitoring in the Molopo-Nossob basin are done and collected by
the water departments in the three countries. However the monitoring of groundwater
(abstraction, level, quality, outflow and recharge) is performed by several departments, and
there is the risk of limited flow of information between the stakeholders.
Currently monitored data of the groundwater resources are used in planning purposes for
expansion of the supply, investigation for new resources and for international agreement of
the use of transboundary water resources. In recent time the effect of climate change is an
additional impact source on the groundwater resources. Monitoring is therefore also focused
on providing data on how and where this impact affects the groundwater resources.
In the Molopo-Nossob Basin all sectors of the society are heavily dependent on groundwater.
Good and reliable data about this most important resource is of the greatest importance for
the prosperity and future development of this area and also to approach many of the
challenges now appearing as impacts of the environment, pollution of water, supply of water,
global climate changes, to mention a few.
Geotechnical Consulting Services
112
Groundwater Review of the Molopo-Nossob Basin
Report No. ORASECOM/005/2009
A vital aid to good groundwater management is a well-conceived and properly supported
monitoring and surveillance system. `Out of sight, out of mind' is a poor philosophy for
sustainable development.
The general neglect of groundwater resources in terms of national planning, monitoring and
surveillance will only be overcome once effective monitoring is regarded as an investment
rather than merely a drain on resources.
For this reason monitoring systems should periodically be reassessed to make sure that they
remain capable of informing management decisions so as to afford early warning of
degradation and provide valuable time to devise an effective strategy for sustainable
management.
Groundwater monitoring in the Molopo-Nossob Basin is at many places done in connection
with abstraction of groundwater. The monitoring serves as a control that the water level is not
lowered to such level that the water abstraction is jeopardized or that water in surrounding
area is getting so low that boreholes and wells will get dry and compensations will be
claimed. Table 5-20 summarizes the number of sites where the groundwater is monitored in
the Molopo-Nossob Basin. At each site one or more boreholes are monitored and in some
places, various groundwater levels in various aquifers are monitored in the same borehole
(e.g. Stampriet area in Namibia).
Table 5-20
Number of sites and boreholes for groundwater monitoring in Molopo-Nossob Basin
Country
Number of sites
Boreholes
Total
Presented in this report
Botswana
11*
164
35
Namibia
63
29**
South Africa
456
35
*=Including the Kanye and Makunda monitoring boreholes
**=number of measuring intervals in borehole (different aquifers)
5.2.3.2 Botswana
The location of monitoring boreholes in the Botswana part of the Molopo-Nossob Basin is
shown in Figure 5-22.
Geotechnical Consulting Services
113
Groundwater Review of the Molopo-Nossob Basin
Report No. ORASECOM/005/2009
-22░S
Monitoring boreholes
Presented in this report
Makunda
-23░S
Matsheng
-24░S
Kakhea-Sekoma
-25░S
Kanye
Sedibeng
Tsabong
-26░S
Bokspits-Khawa
-27░S
-28░S
17░E
18░E
19░E
20░E
21░E
22░E
23░E
24░E
25░E
26░E
Figure 5-22
Monitoring boreholes in Botswana and boreholes presented in the current report
The longest time-series of monitoring exists in the Kanye wellfield area. This wellfield area,
comprising three separate wellfields, is on the north-eastern boundary of the basin and the
surface water divide is running through the wellfield, see Figure 5-23. A number of the
monitoring boreholes within the basin show an impact of the abstraction from the wellfields.
Other boreholes within the Molopo-Nossob boundary show no or minor impact of the
abstraction from the Kanye wellfields, see Figure 5-24.
The abstraction from the wellfield is predicted to be the order of 4 Mm3/a in the year 2010,
see Figure 5-25.
Monitoring boreholes
Monitoring boreholes presented and not influenced
Bo
Monitoring boreholes presented and influenced
-25
un
Production boreholes
dary of the
-25.05
Molopo-Nossob
-25.1
B
e
as
d
in
t
i
t
u
a
L
-25.15
-25.2
-25.25
25.2
25.25
25.3
25.35
Longitude
Figure 5-23
Monitoring and abstraction boreholes in the Kanye wellfield area in Botswana
Geotechnical Consulting Services
114
Groundwater Review of the Molopo-Nossob Basin
Report No. ORASECOM/005/2009
1300
1300
Kanye
Kanye
.
l
.
.
l
.
.
s 1280
.
s 1280
.
m
.
m
.
a
.
a
l
m 1260
l
m
e
1260
e
v
v
r
l
e
r
l
e
Outside influence from Kanye abstraction
t
e
t
e
Borehole 5603
a 1240
1240
a
Borehole 5601
w
w
Borehole 5645
d
d
n
n
u
Within influence from Kanye abstraction
u
1220
r
o
Borehole 4874
1220
r
o
G
Borehole 5606
G
Borehole 5647
Borehole 5604
1200
1200
1985
1989
1993
1997
2001
2005
2009
1985
1989
1993
1997
2001
2005
2009
Figure 5-24
Groundwater level in monitoring boreholes in the Kanye wellfield area, influenced and not
influenced by the abstraction from the wellfields
Table 5-21 summarizes the basic information about the presented graphs on the groundwater
level in the Kanye area.
5,000,000
4,000,000
Kanye Wellfields
/
a3
m 3,000,000
n
t
i
o
c
t
r
a 2,000,000
s
b
A
1,000,000
Linear trend
Standard deviation
Monitored data
Sustainable resource
0
1980
1985
1990
1995
2000
2005
2010
2015
Figure 5-25 Abstraction from the Kanye wellfields predicted from linear extrapolation of monitored annual
abstraction
Table 5-21
Basic information on the groundwater level monitoring in the Kanye area, Southern District, presented
in Figure 5-24
Site Id
Name
No of data
Long
Lat
Altitude
Colour
Influenced boreholes
4874
Ramonnedi
263
25.252778
25.175278
1264.00 Black
5606
Kanye
172
25.296944
25.195000
1268.88 Blue
5604
Kanye
166
25.277778
25.241111
1260.35 Red
5647
Kanye
174
25.253611
25.208056
1250.59 Green
Not influenced boreholes
5645
Mmathethe
168
25.286667
25.256111
1229.26 Black
5603
Kanye
171
25.255556
25.092778
1325.00 Blue
5601
Kanye
176
25.252222
25.140000
1296.92 Red
Geotechnical Consulting Services
115
Groundwater Review of the Molopo-Nossob Basin
Report No. ORASECOM/005/2009
Of the monitoring boreholes shown in Figure 5-22, monitoring from 35 boreholes is
presented in the current report.
Groundwater monitoring the Botswana Molopo-Nossob Basin area is mainly performed by
the Department of Geological Survey (DGS), with the exception of the recently started
monitoring in the Kang and Ncojane areas. Since 1992, Department of Water Affairs has
carried out the groundwater monitoring in the Tsabong area, see Figure 5-26. The water level
in the boreholes shows in general a decreasing trend, however with periods of recoveries. The
abstraction from the wellfield in Tsabong, as shown in Figure 5-27, increased up to the year
2004 after which a lower amount was abstracted during the following years up to year 2007
when an increase was recorded. This fluctuation in abstraction is reflected in the monitoring
of the groundwater level in some of the boreholes shown in Figure 5-26.
960
Tshabong
.
l
. 950
.
s
.
m
.
a 940
l
m
e
v
Borehole 9450
930
r
l
e
Borehole 9269
t
e
Borehole 6259
a
Borehole 5451
w 920
d
n
u
r
o 910
G
900
1985
1989
1993
1997
2001
2005
2009
Figure 5-26
Groundwater level monitored in observation boreholes surrounding the Tsabong wellfield in
Botswana
600,000
Tsabong Wellfield
500,000
/
a3 400,000
m
n
t
i
o 300,000
c
t
r
a
s
b 200,000
A
100,000
Monitored abstraction
Linear extrapolation
Standard deviation
0
1985
1990
1995
2000
2005
2010
2015
2020
Figure 5-27
Monitored and predicted abstraction from the Tsabong wellfield, Botswana
Geotechnical Consulting Services
116
Groundwater Review of the Molopo-Nossob Basin
Report No. ORASECOM/005/2009
Monitored groundwater level in boreholes at Matsheng, is shown in Figure 5-28. The
boreholes are all in a perched aquifer the Kalahari beds from which water is abstracted from
an existing wellfield in the area. The dotted graphs in the figure illustrate a groundwater level
which slightly decreases with time but not influenced by any variations in abstraction from
the wellfield, whereas the full lines are from boreholes where influences of recharge are
noticed.
1170
940
Matsheng
.
l
. 1160
.
l
.
Bokspits-Khawa
930
.
s
.
s
.
m
Borehole 7865
.
m
.
a
.
a
1150
Borehole 7851
920
l
m
Borehole 7877
l
m
e
Borehole 7876
e
Borehole 7248
v
Borehole 7870
v
Borehole 7427
1140
Borehole 7875
910
r
l
e
Borehole 7249
Borehole 7874
r
l
e
t
e
t
e
Borehole 7425
a
a
Borehole 7475
w 1130
w
Borehole 7477
d
900
d
Borehole 7476
n
n
u
u
Borehole 7474
r
o 1120
r
o
G
890
G
1110
880
1985
1989
1993
1997
2001
2005
2009
1985
1989
1993
1997
2001
2005
2009
Figure 5-28
Groundwater level in monitoring boreholes in Matsheng and Bokspits-Khawa
Figure 5-28 also shows the groundwater level monitored in the Ecca (Auob) aquifer in the
southernmost part of Botswana (Bokspits-Khawa). No major wellfield is associated with
these monitoring boreholes and a more or less stable groundwater level, with a very slight
decline with time, see Table 5-22.
Table 5-22
Changes in groundwater level monitored in Bokspits-Khawa area
Monitoring area
Borehole No
Monitored period
Average
water
level
change, mm/a
Bokspits - Khawa
7248
2000-2005
-18
7424
1999-2005
-10
7249
1999-2006
-5
7475
1999-2006
3
7477
1999-2006
-3
7476
1999-2006
10
7474
1999-2006
-27
7248
1999-2006
-18
Makunda
7763
1999-2008
-17
7764
1999-2008
-1
7768
1999-2008
18
Minus sign indicates groundwater level decline
Since the area in the southern most Botswana is not influenced by any major water
abstractions, the only abstractions are for local settlements and for watering of livestock
(mainly sheep and goats), a major impact on the water level is not expected. The monitored
decline might therefore be a sign of an impact caused by changes in the climate. A change in
temperature over the period from 1960 is recorded at the nearby meteorological station in
Tsabong. An increase in the daily mean monthly minimum temperature for the hottest month
Geotechnical Consulting Services
117
Groundwater Review of the Molopo-Nossob Basin
Report No. ORASECOM/005/2009
of the year, January, is recorded and a decrease in the same temperature is observed for the
coldest month, July. This means that the difference in mean month minimum temperature has
increase with approximately 0.08 oC/a, see Figure 5-29.
25
Tsabong
20
Co
15
r
e
t
u
r
a 10
January
e
Difference January - July
p
July
m
e
5
T
0
-5
1940
1950
1960
1970
1980
1990
2000
2010
Figure 5-29
Mean annual minimum temperature for January and July from the meteorological station in
Tsabong. Calculated difference between the January and July annual mean minimum
temperature. (Data source: Department of Meteorological Services, Botswana)
Groundwater level monitoring from Makunda, north of the Molopo-Nossob Basin shows
stable groundwater level as from 1999, see Figure 5-30. The slight decline recorded is
calculated as an average value in the same size as for the decline in Bokspits-Khawa, see
Table 5-22.
1120
1040
Makunda
Khakea Sekoma
.
l
. 1110
.
l
. 1030
.
s
.
s
.
m
.
m
.
a
.
a
1100
1020
l
m
l
m
e
Borehole 7768
e
v
Borehole 7764
v
1090
Borehole 7763
1010
r
l
e
r
l
e
t
e
t
e
a
a
w 1080
w
d
1000
d
n
n
u
u
Borehole 5527
r
o 1070
r
o
Borehole 7088
G
990
G
Borehole 7115
Borehole 7116
1060
980
1985
1989
1993
1997
2001
2005
2009
1985
1989
1993
1997
2001
2005
2009
1200
Sedibeng
.
l
. 1190
.
s
.
m
.
a 1180
l
m
e
v 1170
r
l
e
t
e
a
w 1160
d
n
u
r
o 1150
G
Borehole 6612
Borehole 6615
1140
1985
1989
1993
1997
2001
2005
2009
Figure 5-30
Groundwater level in monitoring boreholes in Makunda, Khakea-Sekoma and Sedibeng
Geotechnical Consulting Services
118
Groundwater Review of the Molopo-Nossob Basin
Report No. ORASECOM/005/2009
Groundwater level is also monitored in areas of the Kakhea-Sekoma and the Sedibeng
villages as illustrated in Figure 5-30. Locations of the monitoring areas are shown in Figure
5-22.
5.2.3.3 Namibia
Stampriet Artesian Basin
The groundwater monitoring in Namibia is focused on the Stampriet Artesian Basin, SAB. In
the JICA report (JICA, 2002) results of monitoring of groundwater level in the three
identified aquifers, (i) Kalahari, (ii) Auob and (iii) Nossob are presented. In general the
groundwater level in the three aquifers differs; in some area, the Nossob aquifer has the
highest water level, in other areas it has the lowest level. In order to understand the
hydrogeological conditions in the SAB a short description of the basin given by Prof J.
Kirschner is given below, taken from the report "Groundwater in Namibia" (Christelis and
Struckmeier, 2001).
The Stampriet Artesian Basin, SAB, covers the main part of the Molopo-Nossob Basin in
Namibia. It lies roughly between 23o and 26o S; 17.5o and 20o E (the border to Botswana). It
is the largest groundwater basin in Namibia.
Groundwater extraction within the basin is maintained by the regulations prescribed in the
Water Act. Extensive groundwater extraction by commercial farmers occurs in the central
area of the western side of the basin. According to some monitoring wells installed during
1978, groundwater levels have been declining continuously since 1980.
The groundwater condition (artesian) was recognized in 1906 during siting of boreholes.
Various processes of borehole drilling continued after the first and the second World Wars.
Major investigations covering the whole area of the SAB were undertaken. The problem of
saline groundwater was addressed over a 12-years period (1969-1981) with results presented
in maps and reports.
A hydro census was carried out by the Department of Water Affairs (DWA) during 1986 to
1988 in order to define the impact due to extraction of the groundwater. A major
development project, in cooperation with the Japanese Government with the aim to establish
a groundwater management plan to optimally utilize the groundwater resources of the basin
was completed in 2002 (JICA, 2002).
The Stampriet Artesian Basin is bounded in the west by an escarpment that rises about 80
meters. West of the Auob River a dune field commences which stretches eastwards to and
beyond the Nossob River. The stationary longitudinal dunes are nearly parallel to the river
system and about 10 to 15 m high. The valleys between are several hundred meters wide.
The Auob River below Stampriet and the Nossob River from Leonardville to Aranos are
evidence of a much wetter climate in the past. Here the valleys are several hundred meters
wide and at places incised more than 50 m into the Kalahari sediments. The present river
courses are generally little more than 10 m wide and only 1.5 m deep in occasional gullies.
The Auob River is cut off from its upper tributaries by a dune field east of Kalkrand that
blocks the Oanob and Skaap rivers.
Geotechnical Consulting Services
119
Groundwater Review of the Molopo-Nossob Basin
Report No. ORASECOM/005/2009
The geology and hydrogeology of the Stampriet Artesian Basin within Namibia is
comparatively well understood. It is not well known how far the SAB aquifers stretch into
Botswana and South Africa, partly because the area is sparsely populated and partly because
the quality of the water becomes less suitable towards the southeast. During the past few
years the Artesian Aquifer is identified and explored in Botswana (DWA, 2008).
The aquifer system in SAB is sub-divided into three major aquifers, see Figure 5-31:
Ę The upper phreatic to semi-confined Kalahari aquifer, G3. The Kalahari Sequence
consists of unconsolidated to semi-consolidated sand and silt. This upper aquifer is in
most cases separated from the lower Auob sandstone aquifer by an aquiclude of Karoo
shales and mudstones.
Ę A shale layer also separates the upper Karoo sandstone aquifer (Auob aquifer, G2 in
Namibia) from the lower Karoo sandstone aquifer.
Ę The lower Karoo sandstone aquifer (Nossob aquifer, G1 in Namibia) is underlain by
shales that act as an aquitard, and glacial tillites of the Dwyka Formation.
Geological Classification
Hydrogeological Classification
Kalahari Beds
Ka
K l
a ah
a a
h r
a i Aq
A u
q i
u fer
e (G
( 3
G )
3
Upper (sand)
Rietmond Member Lower (shale)
3rd Impermeable Layer
a
t
i
o
n
A5(sand)
A5
A
A4(shale)
A4
A
Auob Member
A3(sand)
A3
A
A2(shale)
A2
A
Au
A o
u b
o
b Aq
A u
q i
u fer
e (G
( 2
G )
2
A1(sand)
Upper (sand)
A1
A
Mukorob Member Lower (shale)
2nd Impermeable Layer
P
r
i
n
c
e
A
l
b
e
r
t
F
o
r
m
Nossob Member
No
N s
o s
s o
s b
o
b Aq
A u
q i
u fer
e (G
( 1
G )
1
Pre Ecca Group (Basement)
1st Impermeable Layer
Figure 5-31 Brief overview of the geological and hydrogeological classification of the Stampriet Artesian Basin
(JICA, 2002)
Not all of the aquifers occur everywhere and the use of them is determined by water quality,
depth to the aquifer and their yields. The southern part of the Stampriet Artesian Basin
borders to South African Kalahari National Game Park and the Gordonia District. In
Gordonia, the water quality of the Karoo aquifers appears to be as poor as in the Salt block
area, described below.
The Auob and the Nossob aquifers are confined and free-flowing (artesian) in the Auob
valley at and downstream of Stampriet and in the Nossob valley around Leonardville.
Elsewhere sub-artesian conditions prevail, that is, the water in the aquifer is confined, but the
pressure is not sufficient for the water (water level) to rise above the ground surface.
Prior to the deposition of the Kalahari sediments, a major river system entered Namibia at
about 24o S and 20o E. This river flowed in a south-westerly direction, turning east of Gochas
towards the Mata Mata area at the South African border. A major tributary from the north
Geotechnical Consulting Services
120
Groundwater Review of the Molopo-Nossob Basin
Report No. ORASECOM/005/2009
joined the main river at about 24.75o S and just East of 19o E. This river system cut deeply
into the underlying Karoo sequence, in places right down to the base of the Auob formation.
The Kalahari sediments covering the Karoo sequence are thin with calcrete or dune-sand at
the surface along the northern and western boundaries of the basin. South-eastwards the
sediments reach a thickness of 150 m, but in the pre-Kalahari river mentioned the sediments
can reach 250 m in thickness.
With the low rainfall, high potential evapotranspiration and no runoff outside the Auob and
Nossob valley, salts accumulate in the Kalahari and the groundwater quality deteriorates in a
south-easterly direction. Because the confining layers and the Auob aquifer are largely
removed in the pre-Kalahari valley, the quality of the groundwater in the Auob aquifer is also
affected south-east of that valley and that part of the Stampriet Artesian Basin is called the
"Salt bock" (see Figure 5-32).
The recharge mechanisms of the aquifers are understood to be dependent on the occurrence
of identified small, shallow depression caused by dissolution of calcrete where local runoff is
concentrated and fed into permeable layers or structures below. From there the water
continues percolation down into the artesian aquifers below. The artesian aquifers are
recharged during years with abnormally high rainfall.
Most of the water supply schemes in the Stampriet Artesian Basin extract groundwater from
the Auob aquifer, only Koļs uses the Nossob aquifer.
-22░S
Monitoring boreholes
Presented in this report
-23░S
Okonyama
Olifantswater West
-24░S
Steynsrus
Boomplaas
Tugela
-25░S
Jackalsdraai Tweerivier
-26░S
Salt-Block
-27░S
-28░S
17░E
18░E
19░E
20░E
21░E
22░E
23░E
24░E
25░E
26░E
Figure 5-32
Monitoring boreholes and boreholes presented in the current report
Groundwater level monitoring
Geotechnical Consulting Services
121
Groundwater Review of the Molopo-Nossob Basin
Report No. ORASECOM/005/2009
The location of the groundwater monitoring boreholes (or sites) in the Namibian part of the
Molopo-Nossob basin is illustrated in Figure 5-32. In the current report only a selected
number of these sites are presented, summarized in Table 5-23.
Monitoring of the groundwater level in the Nossob aquifer (red lines in diagrams) shows in
general a stable level with time. A slight decline is observed in the monitoring boreholes at
Olifantswater, sees Figure 5-33 and 5-34, and however interrupted by a 6 years higher level
in borehole 22545 and at the same time a slight raise at Tugela. This can be attributed to the
heavy rains during the years 1999 and 2000 which affected the water level in the Kalahari
aquifer (JICA, 2002).
Table 5-23
Data on monitoring sites presented in the current report
No of
Colour in
Map No
Site Id
Name
data
Long
Lat
Altitude
Aquifer
diagrams
2319BC
39845
Okonyama
1778
19.62489
-23.40098
1258.05
Kalahari
Black
39846
Okonyama
613
19.62577
-23.40049
1256.39
Auob
Blue
39847
Okonyama
1198
19.62621
-23.40105
1256.38
Nossob
Red
2519AD
39854
Tweerivier
2520
19.43266
-25.46122
1021.25
Kalahari
Black
39856
Tweerivier
2492
19.43324
-25.46148
1021.26
Nossob
Red
2518AD
39852
Jackalsdraai
1785
18.41678
-25.29163
1148.19
Kalahari
Black
39853
Jackalsdraai
1785
18.41650
-25.09117
1148.14
Nossob
Red
Olifantswater
22546
West
273
18.39241
-23.68523
1268.08
Kalahari
Black
Olifantswater
2318CB
22546
West
273
18.39241
-23.68523
1268.08
Auob
Blue
Olifantswater
22546
West
273
18.39241
-23.68523
1268.08
Nossob
Red
2418CD
22838
Tugela
269
18.25379
-24.82056
1206.46
Kalahari
Black
22838
Tugela
268
18.25379
-24.82056
1206.46
Auob
Blue
22838
Tugela
269
18.25379
-24.82056
1206.46
Nossob
Red
22839
Tugela
272
18.25271
-24.81949
1203.00
Kalahari
Black dots
22839
Tugela
272
18.25271
-24.81949
1203.00
Auob
Blue dots
22839
Tugela
272
18.25271
-24.81949
1203.00
Nossob
Red dots
Olifantswater
21815
West
273
18.39452
-23.68436
1269.63
Kalahari
Black
Olifantswater
21784
West
273
18.39452
-23.68436
1269.63
Auob
Blue dots
Olifantswater
2318CB
21814
West
273
18.39452
-23.68436
1269.63
Kalahari
Black
Olifantswater
1275.26
39840
West
2795
18.38976
-23.64725
Auob
Blue dots
Olifantswater
39841
West
2795
18.38970
-23.64783
1275.60
Nossob
Red
Olifantswater
22544
West
359
18.39462
-23.68476
1269.70
Auob
Blue
Olifantswater
22545
West
273
18.39398
-23.68266
1268.08
Kalahari
Black
2318CB
Olifantswater
22545
West
273
18.39398
-23.68266
1268.08
Auob
Light Blue
Olifantswater
22545
West
273
18.39398
-23.68266
1268.08
Nossob
Red
2418BB
39842
Steynsrus
2377
18.79340
-24.04592
1208.05
Kalahari
Black
39843
Steynsrus
2377
18.79312
-24.04792
1208.05
Auob
Blue
39844
Steynsrus
276
18.79614
-25.04858
1208.05
Nossob
Red
2418DA
10120
Boomplaas
13.2
18.56223
-24.54999
1000.00
Black
Geotechnical Consulting Services
122
Groundwater Review of the Molopo-Nossob Basin
Report No. ORASECOM/005/2009
1280
Olifantswater
1250
Okonyama
21784 A
.
l
.
39845 K
.
l
. 1270
21814 K
.
s
39846 A
.
s
21815 K
.
m 1240
39847 N
.
m
.
a
.
a
39840 A
1260
39841 N
l
m
l
m
e 1230
39847 Nossob
e
v
39845 Kalahari
v
39846 Auob
1250
r
l
e
r
l
e
t
e 1220
a
t
e
a
w
w
d
1240
d
39840
n
n
21814
u 1210
u
21815
r
o
r
o
21784
G
1230
G
39841
1200
1220
1985
1989
1993
1997
2001
2005
2009
1985
1989
1993
1997
2001
2005
2009
1300
1300
.
l
.
Olifantswater
1290
22546 K,A,N
.
l
.
Olifantswater
.
s
1290
22544 A
.
s
22545 K,A,N
.
m
.
m
.
a 1280
.
a 1280
l
m
e
22546 Kalahari
l
m
22544 Auob
v
e
22546 Auob
v
22545 Auob
1270
22546 Nossob
22545 Kalahari
r
l
e
1270
r
l
e
22545 Nossob
t
e
a
t
e
a
w 1260
w
d
1260
d
n
n
u
u
r
o 1250
r
o
G
1250
G
1240
1240
1977 1981 1985 1989 1993 1997 2001 2005 2009
1977 1981 1985 1989 1993 1997 2001 2005 2009
Figure 5-33
Groundwater level monitoring at Okonyama and Olifantswater in Namibia
1240
1220
Steynrus
Tugela
39842 K
.
l
. 1230
.
l
. 1210
.
s
39843 A
.
s
22838 Auob
.
m
39844 N
.
m
22828 Kalahari
.
a
.
a
22838 Nossob
1220
1200
22839 Kalahari
l
m
39844 Nossob
l
m
22839 Auob
e
e
v
39843 Auob
v
22839 Nossob
1210
39842 Kalahari
1190
r
l
e
r
l
e
t
e
t
e
a
a
w 1200
w
d
1180
d
n
n
u
u
r
o 1190
r
o
G
1170
G
1180
1160
1985
1989
1993
1997
2001
2005
2009
1985
1989
1993
1997
2001
2005
2009
1240
1010
Steynrus
Tweerivier
39842 K
39854 K
.
l
. 1230
.
l
. 1000
.
s
39843 A
.
s
39855 N
.
m
39844 N
.
m
.
a
.
a
1220
990
l
m
39844 Nossob
l
m
39855 Nossob
e
e
v
39843 Auob
v
39854 Kalahari
1210
39842 Kalahari
980
r
l
e
r
l
e
t
e
t
e
a
a
w 1200
w
d
970
d
n
n
u
u
r
o 1190
r
o
G
960
G
1180
950
1985
1989
1993
1997
2001
2005
2009
1985
1989
1993
1997
2001
2005
2009
Figure 5-34
Groundwater level monitoring at Steinrus, Tugela, Jackalsdraai and Tweerivier in Namibia
Geotechnical Consulting Services
123
Groundwater Review of the Molopo-Nossob Basin
Report No. ORASECOM/005/2009
The Nossob aquifer, under confined condition was identified in a number of boreholes in the
study of the Stampriet Artesian basin (JICA, 2002). Groundwater level monitored in those
boreholes gives a general flow picture of the water in the Nossob aquifer as illustrated in
Figure 5-35. South of Aranos the groundwater level is lowered to create a local depression in
the otherwise gentle slope towards southeast.
The monitored groundwater level in the Nossob aquifer is higher than in the other aquifers in
a large part of the Stampriet Artesian Basin, see Figure 5-36, also presented by the
monitoring sites (Okonyama, Steynrus and Tweerivier). In some places, as shown in Figure
5-37, the groundwater level (head) of the Nossob aquifer is above the ground surface
(artesian conditions). The general direction of groundwater flow in the Nossob Aquifer is
from the NW to the SE with an average of piezometric gradient of around 1/1000 (JICA,
2002).
-22░S
-23░S
Onderombapa
Leonardville
Aminius
-24░S
Kalkrand
Aranos
Stampriet
Mariental
Gochas
-25░S
Koļs
-26░S
Aroab
-27░S
-28░S
17░E
18░E
19░E
20░E
21░E
22░E
23░E
24░E
25░E
26░E
Figure 5-35
General groundwater contours in the Nossob aquifer from monitoring of water level in boreholes
penetrating the aquifer. (Data source: JICA, 2002)
Geotechnical Consulting Services
124
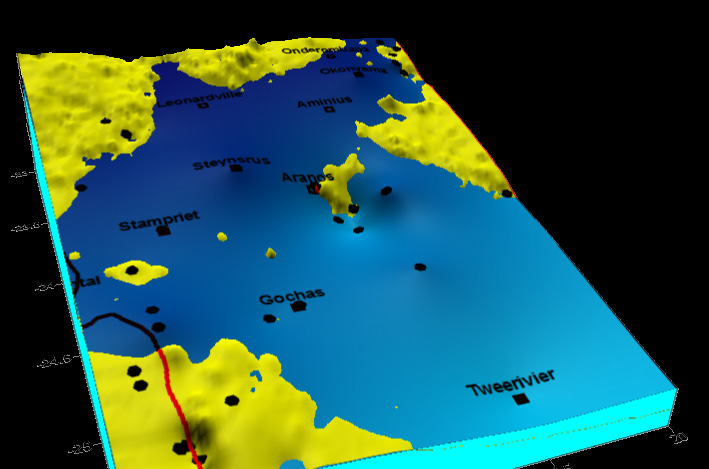
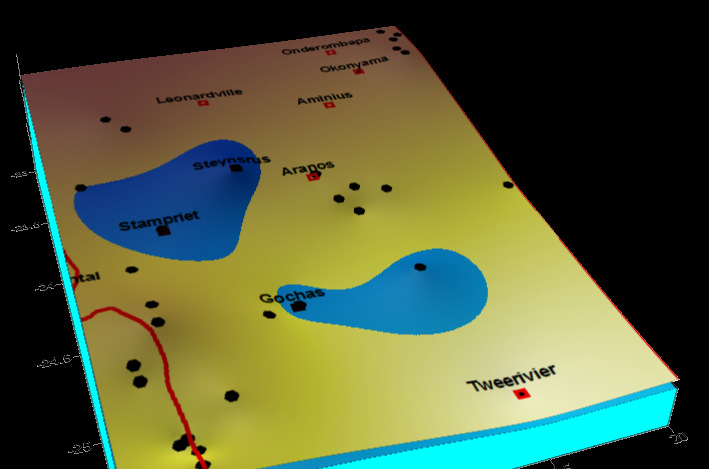
Groundwater Review of the Molopo-Nossob Basin
Report No. ORASECOM/005/2009
Figure 5-36
Blue areas show the groundwater level in the Nossob aquifer being higher than the general
groundwater level (Auob and Kalahari aquifers). (Data source: JICA, 2002)
In the Kalahari Aquifer the groundwater flow is from the northwest to the southeast
harmonizing with hydrogeological conditions. The gradient of the groundwater table
becomes steeper in Aranos -Gochas area but then flattens toward the Salt-block (JICA, 2002).
Groundwater flow of the Auob Aquifer as a whole is similar to the Kalahari Aquifer, and is
seen in the map showing the general groundwater contours over the Nossob-Molopo Basin,
Figure 5-46.
The variation of the groundwater level in the Kalahari Aquifer at Olifants water and Tugela is
shown in Figure 5-33 and 5-34. A slight decreasing water level was recovered in 2000-01.
According to the Japanese study periodic fluctuation of approximately 5 cm/year on average
since 1986 were recognized (JICA, 2002).
Figure 5-37
Blue areas show the groundwater level (head) in the Nossob aquifer above the ground surface level
(artesian conditions). (Data source: JICA, 2002)
Geotechnical Consulting Services
125
Groundwater Review of the Molopo-Nossob Basin
Report No. ORASECOM/005/2009
5.2.3.4 South Africa
Groundwater level monitoring
In South Africa, the regional water and forestry offices (DWAF) are responsible for the
regional groundwater observation networks. The aim of these networks is to observe natural
groundwater trends and water resource reactions to large-scale abstraction. The Catchment
Management Agencies (CMA) also operates large-scale abstraction and compliance
observation networks. Water Users Associations (WUA) representing a group of water users
also manage observation networks in their areas or they will feed into the CMA networks.
Individual water users like mines, municipalities, irrigators, industrial users are also expected
to make groundwater observations to define the impact of their activities on water resources.
Compliance of these users is reported to the CMA. It is also expected that these users keep
records of their observations, capture observations onto database and evaluate the trends. On
request these users may be expected to report on their observations. Observation equipment
can vary from common dip meter readings to complicated electronic measuring and logging
devices (van Dyk et al, 2008).
The location of the groundwater monitoring boreholes (sites) in the South African part of the
Molopo-Nossob basin is illustrated in Figure 5-38. In the current report only a selected
number of these sites are presented, summarized in Table 5-24.
-22░S
Monitoring boreholes
Presented in this report
-23░S
-24░S
-25░S
-26░S
-27░S
-28░S
17░E
18░E
19░E
20░E
21░E
22░E
23░E
24░E
25░E
26░E
Figure 5-38
Monitoring boreholes in South Africa and monitoring results presented in the current report
Geotechnical Consulting Services
126
Groundwater Review of the Molopo-Nossob Basin
Report No. ORASECOM/005/2009
Table 5-24
Data on monitoring sites presented in the current report
Site
No of
Altitude
Colour
Map No
Id
Name
data
Long
Lat
(mamsl)
WMA
diagrams
2525DD
003
Grootfontein
12798
25.86246
-25.9185
1450
D41A
Black
031
Grootfontein
11499
25.86321
-25.9229
1450
D41A
Blue
035
Grootfontein
2948
25.9105
-25.9524
1470
D41A
Red
036
Grootfontein
306
25.9087
-25.9741
1470
D41A
Green
037
Grootfontein
2198
25.90961
-25.9369
1470
D41A
Black
025
Valleifontein
1866
25.84424
-25.9233
1450
D41A
blue
028
Blaauw Bank
6126
25.87396
-25.9977
1470
D41A
Red
029
Kuplaagte
4424
25.92252
-25.982
1480
D41A
Green
2723AD
393
Kuruman Town
4214
23.43603
-27.4695
1330
D41L
Black
381
Kuruman Town
89
23.49044
-27.4469
1340
D41L
Blue
382
Kuruman Town
92
23.46373
-27.4477
1320
D41L
Red
075
Kuruman
58
23.45864
-27.4559
1320
D41L
Green
2722DD
195
Sishen
283
22.98701
-27.8093
1200
D41J
Black
210
Gamagara
224
22.98211
-27.7536
1200
D41J
Blue
190
Sishen
184
22.99443
-27.7698
1200
D41J
Red
641
Sishen-Myn
115
22.99218
-27.8
1200
D41J
Green
642
Sishen-Myn
113
22.99224
-27.8
1200
D41J
Brown
2625BB
031
Dudfield
8741
25.99584
-26.2007
1470
D41A
Black
016
Blaau Bank
1430
25.91207
-26.0088
1480
D41A
Blue
144
La Reys Stryd
330
25.97237
-26.0352
1500
D41A
Red
019
Blaau Bank
305
25.88474
-26.0143
1480
D41A
Green
004
La Reys Stryd
184
25.98368
-26.0069
1490
D41A
Brown
2624AB
003
Swellendam
11
24.26222
-26.0519
1350
D41C
Black
004
Swellendam
24
24.26389
-26.0225
1350
D41C
Blue
010
Mooihoek
23
24.0972
-26.7417
1323
D41H
Black
Mooihoek
2624CA
082
Groenhoek
24
24.11665
-26.7444
1330
D41H
Blue
Mooihoek
084
Groenhoek
26
24.11609
-26.7469
1330
D41H
Red
094
Gannalaagte
26
24.18472
-26.7417
1360
D41H
Black
060
Long Valley
25
24.06526
-26.7375
1327
D41H
Blue
185
Long Valley
26
24.06804
-26.7153
1340
D41H
Red
043
Mooihoek
27
24.08276
-26.7344
1320
D41H
Green
2622BB
020
Bath
39
22.86667
-26.2167
1020
D41H
Black
Pioneer
034
(Kuruman)
95
22.96167
-26.9297
1060
D41M
Blue
Karlsruhe
2622DD
115
(Kuruman)
12
22.95556
-26.9745
1040
D41M
Red
047
Tweed
51
22.78333
-26.5422
1000
D41G
Green
2622DB
045
Severn(Kuruman)
105
22.82667
-26.6019
1020
D41G
Brown
At Grootfontein, in the easternmost part of the Molopo-Nossob Basin, groundwater is
abstracted for the supply of town of Mmabatho. Groundwater level boreholes in that area,
however during different time periods since the start in the late 1960-es. Figure 5-39 shows
the monitored level in some selected boreholes displaying long time series.
Geotechnical Consulting Services
127
Groundwater Review of the Molopo-Nossob Basin
Report No. ORASECOM/005/2009
1470
1470
Kuplaagte 29
Grootfontein 35
Blaauw Bank 28
Grootfontein 36
Grootfontein 37
.
l
.
.
l
.
1460
Grootfontein 3
Valleifontein 25
1460
.
s
.
s
Grootfontein 31
.
m
.
m
.
a
.
a
1450
1450
l
m
l
m
e
e
v
v
1440
1440
r
l
e
r
l
e
t
e
t
e
a
a
w 1430
w
d
1430
d
n
n
u
u
r
o 1420
r
o
G
1420
G
2525DD
2525DD
1410
1410
1975
1985
1995
2005
1975
1985
1995
2005
Figure 5-39
Monitored groundwater level in boreholes in the Grootfontein area, South Africa, Water
Management Area, WMA, D41A
The groundwater level in the Grootfontein area in the early-mid 1980-es and in the recent
time (2000-2004) is illustrated in the two maps in Figure 5-40. A 3-D view of the
groundwater level is shown in Figure 5-41.
-25.9
-25.9
-25.91
-25.91
-25.92
-25.92
-25.93
-25.93
-25.94
-25.94
e
e
d
d
-25.95
-25.95
t
i
t
u
t
i
t
u
a
a
L
L
-25.96
-25.96
-25.97
-25.97
-25.98
-25.98
-25.99
-25.99
-26
-26
25.84
25.85
25.86
25.87
25.88
25.89
25.9
25.91
25.92
25.93
25.94
25.84
25.85
25.86
25.87
25.88
25.89
25.9
25.91
25.92
25.93
25.94
Longitude
Longitude
Figure 5-40
Grootfontein, WMA D41A, South Africa, groundwater level counters early-mid 1980-es (Left) and
groundwater counters form recent time, 2000-2004, (Right). The counters interpolated using
Kriging application in the Surfer programme
Geotechnical Consulting Services
128
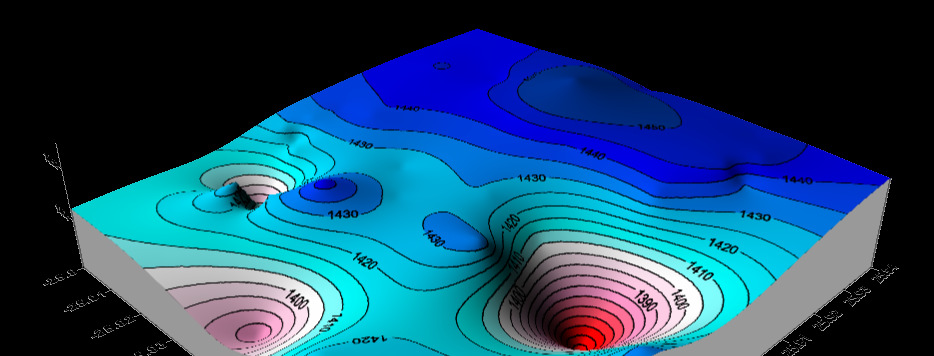
Groundwater Review of the Molopo-Nossob Basin
Report No. ORASECOM/005/2009
Figure 5-41
3-D graph for the groundwater level from monitoring boreholes at Grootfontein, South Africa,
WMA D41A
In the western South Africa part of the Molopo-Nossob Basin, groundwater monitoring in the
map square 2622 is only conducted up to the year 1978. A raise is groundwater level is
monitored, see Figure 5-42. This raise can be compared to the more than usual rainy years in
the end of the 60-ties beginning of 70-ties monitored at the Tsabong meteorological station
about 50 to 150 km Northwest of the monitoring boreholes. In other monitoring boreholes,
the groundwater level is declining; see Figure 5-43 and 5-44.
1070
1200
2722DD
1060
Pioner DD34
2622
1190
Karlsruhe DD115
.
l
. 1050
Bath BD20
.
l
. 1180
.
s
Severn DB45
.
s
.
m 1040
Tweed DB47
.
m 1170
.
a
.
a
1030
1160
l
m
l
m
e 1020
e 1150
v
v
1010
1140
r
l
e
r
l
e
t
e 1000
t
e
a
1130
a
w
990
w
d
1000
1120
d
n
800
n
u
980
/
a
u 1110
m
Sishen 642
r
o
600
970
l
l
m
r
o
Sishen 641
G
1100
400
f
a
G
i
n
Sishen 195
960
a
1090
Gamagara
200
R
Tsabong Rainfall Data
Sishen 190
950
0
1080
1965
1975
1985
1995
1975
1985
1995
2005
Figure 5-42
Monitored groundwater level in boreholes in the South Africa, Water Management Area D41G, H,
J and M, see Table 5-24
Geotechnical Consulting Services
129
Groundwater Review of the Molopo-Nossob Basin
Report No. ORASECOM/005/2009
1320
1320
Mooihoek Groenhoek 84
.
l
.
Mooihoek Groenhoek 82
1310
.
l
.
.
s
1310
.
s
Moihoek 10
.
m
.
m
.
a 1300
.
a 1300
l
m
e
l
m
v
e
v
1290
r
l
e
1290
r
l
e
t
e
a
t
e
a
w 1280
w
d
1280
d
n
n
u
u
r
o 1270
Gannanaagte Denmark 94
r
o
G
1270
LongValley 60
G
Long Valley 185
Mooihoek 43
2624CA
2624CA
1260
1260
1975
1985
1995
2005
1975
1985
1995
2005
Figure 5-43
Monitored groundwater level in boreholes in South Africa, Water Management area D41H, see
Table 5-24
1350
1490
La Reys Stryd 144
Dudfield 31
La Reys Stryd 4
.
l
.
Swellendam 3
1340
.
l
.
Swellendam 4
1480
Blaau Bank 19
.
s
.
s
Blaau Bank 16
.
m
.
m
.
a
.
a
1330
1470
l
m
l
m
e
e
v
v
1320
1460
r
l
e
r
l
e
t
e
t
e
a
a
w 1310
w
d
1450
d
n
n
u
u
r
o 1300
r
o
G
1440
G
2624AB
2625BB
1290
1430
1975
1985
1995
2005
1975
1985
1995
2005
Figure 5-44
Monitored groundwater level in boreholes in South Africa, Water Management Area D41a and C,
see Table 5-24
Groundwater Monitoring in the Northern Cape Province; Trends and Status of Groundwater
Resources 2008
Department of Water Affairs and Forestry, the regional office for Northern Cape Province in
Kimberley presented in a brochure the trends and status of the groundwater resources in their
area (van Dyk et al, 2008). From the brochure the following information is extracted.
The regional groundwater observation network is aimed at observing regionally
representative water quantity, water levels and water quality trends. It is almost impossible or
too costly to observe trends at all boreholes in the areas. Therefore it is essential that
observation points are chosen carefully. The natural factors that could influence changes in
groundwater in the area include the host rock, the precipitation, the evapotranspiration,
drainage, vegetation to name but a few.
The host rock geology contributes to the water level and quality of water in the aquifer. In the
Northern Cape (NC) region groundwater is hosted by sediments of the Kalahari, fractures in
Geotechnical Consulting Services
130
Groundwater Review of the Molopo-Nossob Basin
Report No. ORASECOM/005/2009
the sedimentary Karoo rock, weathering and fractures in the crystalline rocks and in karst in
the dolomites.
The precipitation, intensity and timing thereof influence the selection of borehole positions
and timing of groundwater observations. The precipitation in the Northern Cape region is
summer precipitation that varies from 600 to 200 mm in the east to a winter precipitation that
varies from almost 0 to 400 mm in the west. The evaporation is a major contributor with
evaporation rates of more than 2000 mm from the west receding to between 1000 and 2000
mm. This evaporation determines the evapotranspiration of plants and in riverbeds. Where
plants do occur, water levels and quality is influenced. A groundwater monitoring network
needs to account for the east west variation in precipitation and evapotranspiration.
The long-term groundwater trend in the semi-arid western South Africa is overwhelmed by
the two flood events of 1973 to 1976 and again in 1988. Both were followed by dry events in
1985 to 1987 and 1992.
After the recharge event in 1988 numerous groundwater schemes of abstraction boreholes
with associated observation boreholes were developed. Due to the volume and regional extent
of the 1988 precipitation event and recharge to the aquifers, it is assumed that most aquifers
were recharged to their full capacity in 1988 and the following years. For purposes of
evaluation of groundwater status 1988 to 1990 water levels are taken as the basis of elevated
water levels and full capacity in aquifers.
From observed water level trends a groundwater status map was compiled to indicate the
spatial status of groundwater in 2008, see Figure 5-45. The legend, based on observed trends,
was developed to describe water level situation, aquifer status and associated risk.
Aquifers in the west, south and north (blue areas in the map) are under natural conditions
with only seasonal trends responsible for small water level fluctuation.
Groundwater in the central and eastern portion of the area (green area) is under natural
conditions however with the absence of major precipitation and recharge. Therefore slightly
depleted aquifers with associated problems to abstract water are prevalent. Within these green
areas localized impacted areas (yellow) exist where abstraction is the reason for depleted
aquifers with associated water abstraction problems.
The red and purple areas indicate areas where severe and critical depletion is responsible for
the poor groundwater conditions with associated problems. Boreholes will dry up and
aquifers will dewater. Ground instability and subsidence with do line and sinkhole formation
could result as a consequence of the compaction and destruction of major aquifers.
After the 1988 recharge event numerous groundwater schemes of abstraction boreholes with
associated observation boreholes were developed. The abstraction for water provision,
irrigation, and mine de-watering purposes is responsible for an accelerated water level
decline in aquifers. A classic example is the water level declines of more than 60 m in the
Tosca Molopo aquifer. After 2004 water restrictions were imposed and stabilization and
recovery of the water level are observed since then.
The episodic major recharge and recession events is the dominant observed trend in the
groundwater levels, The reoccurrence of these major recharge events from existing
Geotechnical Consulting Services
131
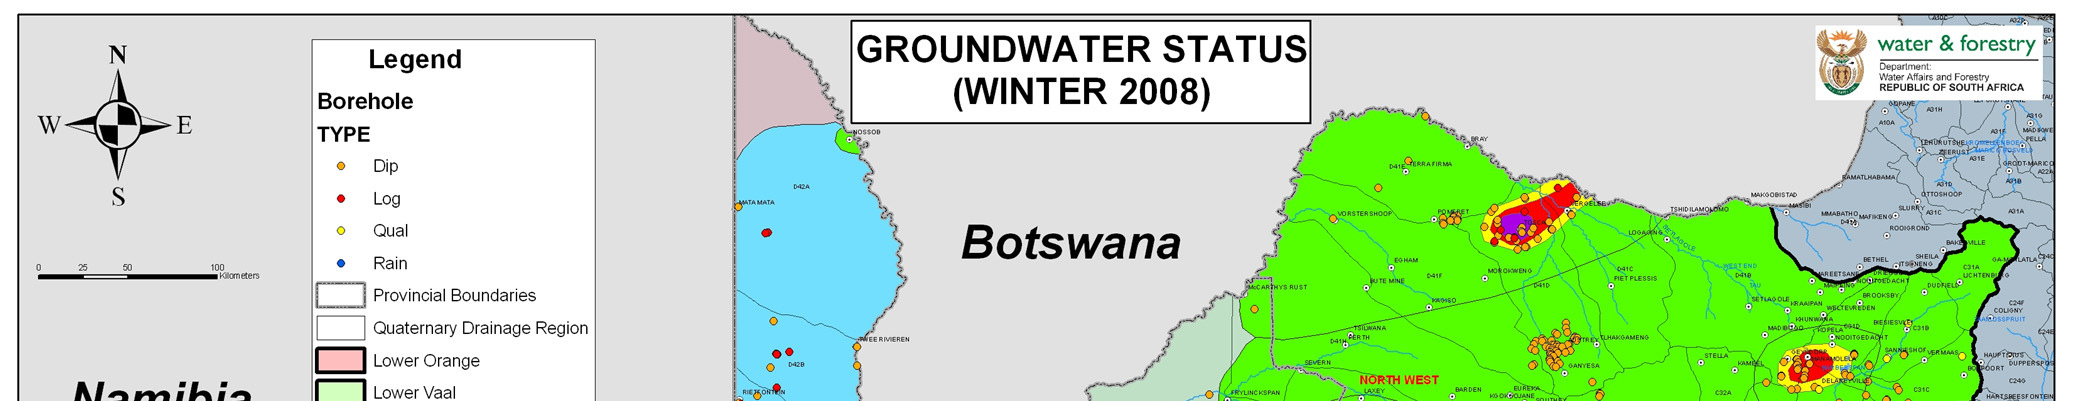
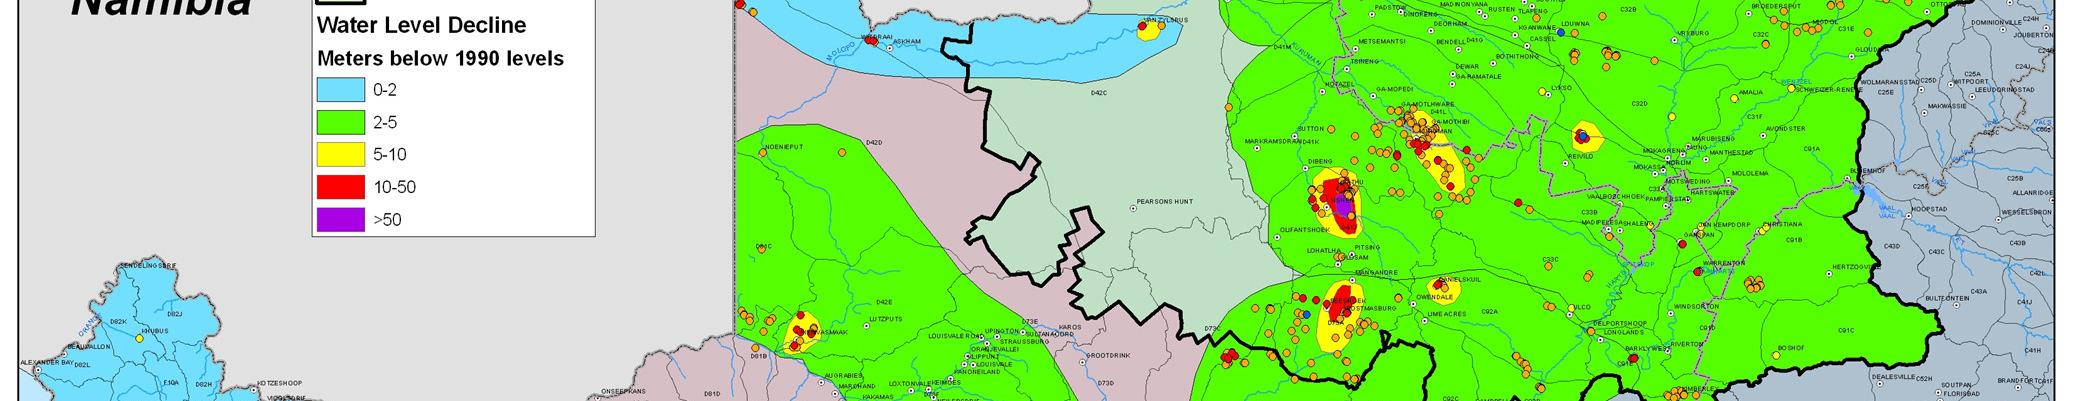
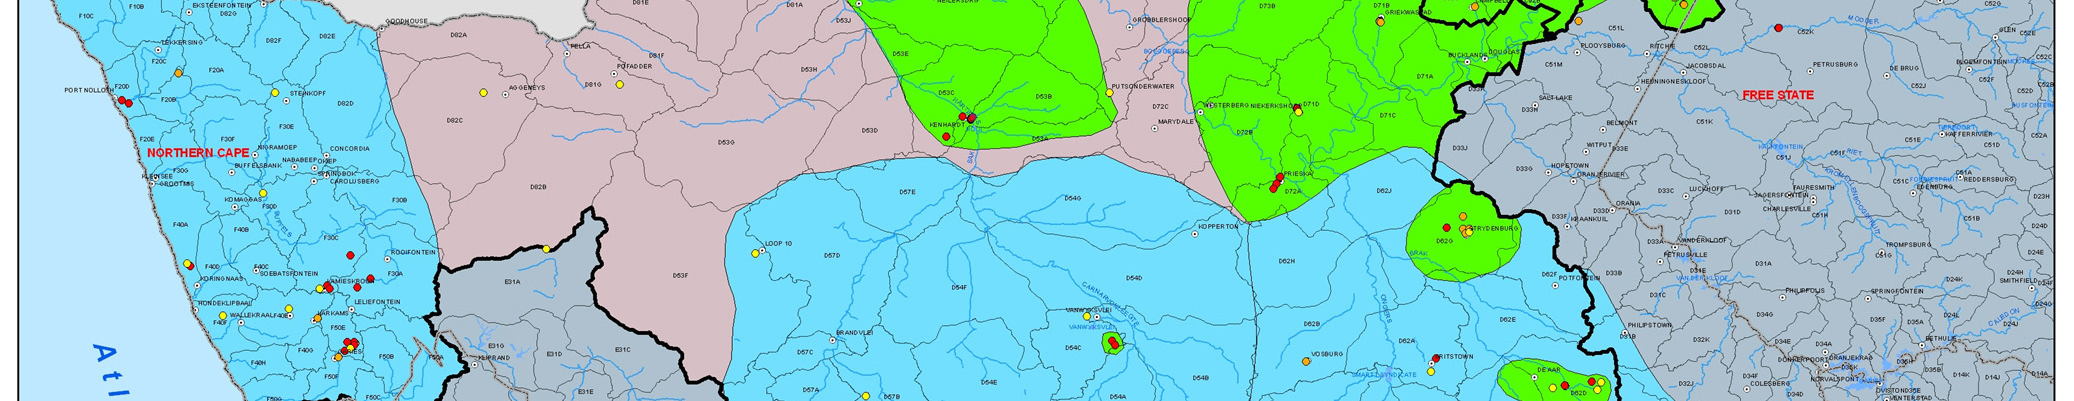
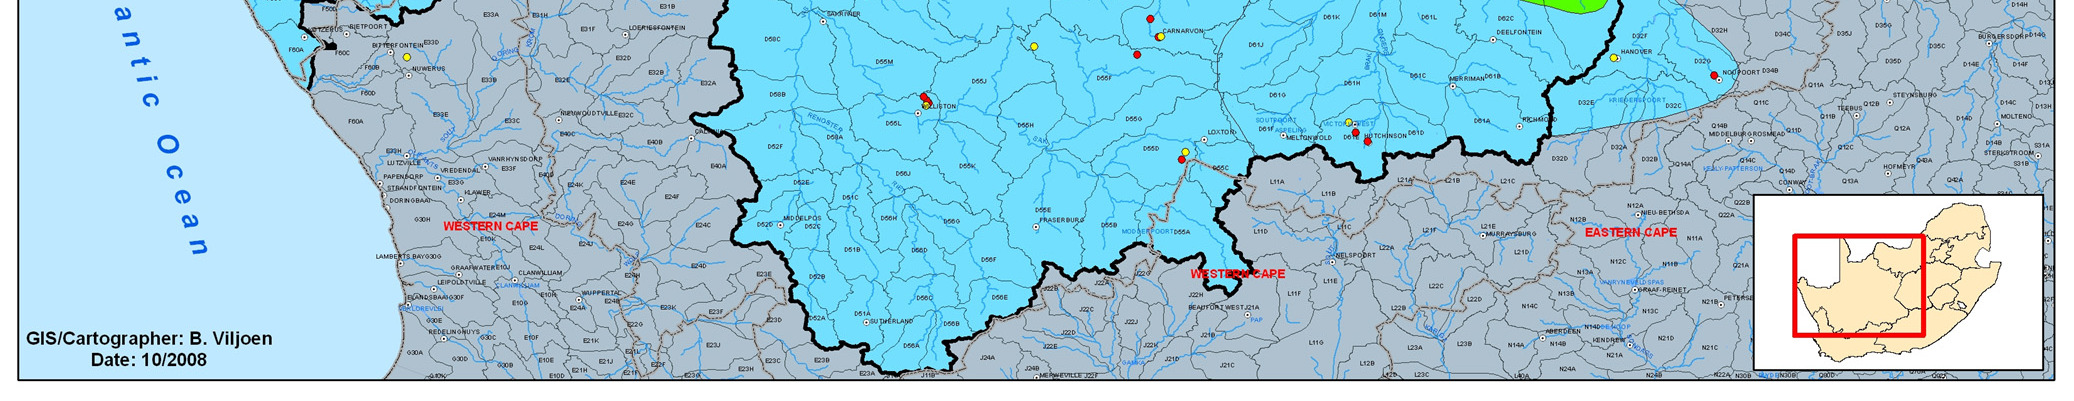
Groundwater Review of the Molopo-Nossob Basin
Report No. ORASECOM/005/2009
information is between 15 and 18 years. Depending on the aquifer type the magnitude in
water level fluctuation can be 2 to 5 m. The seasonal trends with wavelength 1 to 2 years are
super imposed on major trend with fluctuation up to 2 m due to seasonal recharge and
recession. Impacts like abstraction is super imposed on above fluctuations with another
observed fluctuations larger than 5 m that can manifest gradually over few years. Water
levels mostly decline and major recharge can recover the water levels.
The status of water use in each catchment can further be evaluated by comparing the
assessment of the reserve of each catchment with the registered water use for each catchment.
For 92 quaternary catchments of the area, 31 reserves have been determined and when
compared with the water use in each, it is evident that 6 catchments are over allocated.
It is essential that extensive observation networks are operated in catchments where the
allocation of water is close to the potential of the catchment. Groundwater trends in red and
orange catchments (see Figure 5-45) must therefore be carefully observed for impacts. In
these catchments extensive irrigation, mine/industrial and municipal use takes place. These
economic activities are dependent on sustainable water resources based on long-term
groundwater resource observations.
The map in Figure 5-45 indicates the areas where groundwater observations are made and
the type of observation. In the area rainwater samples, groundwater samples are taken for
recharge and quality purposes, and water level monitored with the use of dippers and/or
electronic/mechanic logging devices.
Figure 5-45
Groundwater Status in the Northern Cape, winter 2008, based on Groundwater level Decline since
1990 (van Dyk et al, 2008)
Geotechnical Consulting Services
132
Groundwater Review of the Molopo-Nossob Basin
Report No. ORASECOM/005/2009
5.2.3.5 Regional Groundwater Flow in the Molopo-Nossob Basin
When boreholes are completed after construction, a certificate showing the essential of the
site, the drilling and the construction and equipping of the boreholes is issued. As one part of
the certificate, information about the groundwater level, usually measured as meter below to
top of the boreholes is given. Coordinates together with the altitude of the ground surface (or
the top of the borehole) at the borehole site make it possible to calculate the level of the
groundwater in meters above mean sea level. This procedure is done for all boreholes drilled
and registered.
From records of the registered boreholes in Botswana, Namibia and South Africa
groundwater level measurements are put together to form a regional groundwater level map
over the Molopo-Nossob Basin. The number of boreholes used is summarized in Table 5-25.
In the registers there is information which is incorrect and the information is gathered over a
long period of time. Groundwater level varies due to natural course and due to human
interferences and in the construction of the regional groundwater level map incorrect data and
data which represent time when different conditions were prevailing have been subtracted.
The groundwater level map is illustrated in Figure 5-46.
-22░S
-23░S
Kang
-24░S
1850
Stampriet
1800
1750
-25░S
1700
1650
1600
1550
1500
1450
-26░S
1400
1350
1300
1250
1200
1150
-27░S
1100
1050
Bokspits
1000
950
900
Groundwater
850
level
-28░S
800
750
m.a.m.s.l.
700
650
17░E
18░E
19░E
20░E
21░E
22░E
23░E
24░E
25░E
26░E
Figure 5-46
Regional groundwater level map over Molopo-Nossob Basin
Geotechnical Consulting Services
133
Groundwater Review of the Molopo-Nossob Basin
Report No. ORASECOM/005/2009
Table 5-25
Groundwater level information sources in the Molopo-Nossob Basin
Country
Database
Host
No
of No
of
boreholes
used
in
the
boreholes
construction of the groundwater level
map on the Molopo-Nossob Basin
Botswana
National
Borehole DWA and
3,391
1,214
Archive
DGS
Namibia
GROWAS
MAWRD
9,843
4,262
South Africa Borehole
DWAF
21,185
13,299
Information
Database
Total
34,399
18,775
The groundwater flow gradient within the Molopo-Nossob Basin follows, in the regional
scale, the topography. Exception is in the north of Botswana, where the basins boundaries,
taken as the surface water divide (the topography) does not coincide with the groundwater
divide. There is however limited number of groundwater observations in that area which can
be seen in the Map showing the location of borehole used in the construction of the
groundwater level map (Figure 5-47).
The lowest groundwater level is found in the south-western part of South Africa, along the
Molopo River course out of the basin to the Orange River. In this part of the basin and also
up in the southern part of Botswana the groundwater gradient is less than 0.05%. In the
middle part of the basin in Namibia the groundwater gradient is around 0.10 to 0.15%. The
highest groundwater gradients are found in the north-eastern (Namibia) and eastern part
(South Africa) with gradients according to the map of 0.15 to 0.25%. In the basin's
westernmost area in Namibia the gradient is as high as 0.5%.
5.2.4 Springs
A spring is any natural occurrence where water flows onto the surface of the earth from
below the surface, and is thus where the aquifer surface meets the ground surface. In the
Molopo-Nossob Basin springs are registered in South Africa and Namibia. No spring is found
in the Botswana area of the basin.
In South Africa the springs occur in the dolomite areas and are given names of "eye" in
connection to their locality. The largest ones identified in the basin are shown in Figure 5-48.
The springs in South Africa all have outflows of 1,000 m3/day or more (Vegter, 1995).
Geotechnical Consulting Services
134
Groundwater Review of the Molopo-Nossob Basin
Report No. ORASECOM/005/2009
-22░S
-23░S
-24░S
-25░S
-26░S
-27░S
-28░S
17░E
18░E
19░E
20░E
21░E
22░E
23░E
24░E
25░E
26░E
Figure 5-47
Location of boreholes used in the construction of the groundwater level map over Molopo-Nossob
Basin (Figure 5-46)
-22░S
Gobabis
Windhoek
-23░S
-24░S
Stampriet
Gochas
-25░S
Tosca
Mmabatho
Tsabong
-26░S
Bokspits
-27░S
Kuruman
-28░S
17░E
18░E
19░E
20░E
21░E
22░E
23░E
24░E
25░E
26░E
Figure 5-48
Location of springs in Molopo-Nossob Basin (data source: Vegter, 1995 and DWA Namibia)
Geotechnical Consulting Services
135
Groundwater Review of the Molopo-Nossob Basin
Report No. ORASECOM/005/2009
5.2.5 Groundwater Replenishment
5.2.5.1 Recharge
Replenishment of water to an aquifer includes a variety of processes. The major ones are the
vertical replenishment, usually called recharge or percolation of water from the rain or
through leakage of water from an aquifer above or below. In the latter case there is usually a
semi permeable layer (aquitard) separating the aquifer from where the water emanates and
the receiving aquifer.
An aquifer is also replenished by groundwater flowing in horizontally due to the natural
groundwater head gradient. There is also the component of losing water from the aquifer by
outflow and/or leakage of water to another aquifer.
Recharge is one of the important parameters in describing a groundwater resource. Together
with lateral inflow (and outflow) of water to an aquifer it is the renewal part of the
groundwater. In order to get estimates on the amount of water being renewed, the value of an
average annual recharge is required. Usually this parameter is given in mm/a or as a
percentage of the mean annual precipitation. However recharge varies with climate geology
and topography and the average values, have to be determined over long time observation of
mainly meteorological factors and groundwater level variations.
Usually recharge from precipitation and surface water is divided into (Allison, 1988):
Ę Diffuse recharge from rainfall which infiltrates directly, reaching the water table by
percolation in excess of soil moisture deficits and short-term vegetation requirements.
Ę Localized recharge resulting from infiltration through the beds of perennial or (more
typical) ephemeral surface water courses and from run-off to closed depressions,
lakes, swamps, and alluvial pans on flood plains.
In both categories the recharge occurs in two ways: through preferred pathways or as a front
going through the whole soil profile.
5.2.5.2 Methods to Determine Recharge
Recharge can be assessed using a variety of methods. Bredenkamp et al (1995) describes the
methods into different types as summarized in Table 5-26.
Table 5-26
Various practical methods to determine recharge (Bredenkamp et al, 1995, ORASECOM, 2009)
Class
Method
Parameters needed
Chemistry
Chloride Mass Balance
Chloride
deposition,
Rainfall
data,
methods
Groundwater Chloride content
Meteorological
Cumulative
rain
fall Long-term
rainfall
data
(monthly)
and
methods
departures, CRD
groundwater level data
Saturated volume fluctuation Long-term groundwater level data over a
method (SVF)
defined area.
Rainfall-Recharge relation
Simulation of recharge variability from rainfall
Geotechnical Consulting Services
136
Groundwater Review of the Molopo-Nossob Basin
Report No. ORASECOM/005/2009
Class
Method
Parameters needed
records
One dimensional lumped Rainfall, Potential evapotranspiration, soil
parameter model
moisture parameters, groundwater level
Isotopic
Carbon
Isotopes
and 12C, 13C, 14C
Methods
groundwater age
Stable Isotope Composition
D (2H), 18O
Tritium method
T (3H)
Aquifer
Mathematical modeling
Hydraulic parameters, aquifer boundaries and
Modeling
thickness, geology
Principles of CMB Method (Selaolo, 1998)
The chloride mass balance (CMB) approach capitalizes on the inert behaviour of the chloride
ion once taken into groundwater solution. The ion does not readily enter into rock water
reactions. In areas with no other chlorides sources than rainfall and dry deposition and with
insignificant surface run-off, a rather uncomplicated relationship exists between the chloride
concentration in groundwater Clgw, in precipitation Clp and the dry deposition D and the
annual recharge R.
PCl + D
p
R =
Clgw
Since deposited chloride does not evaporate, the recharging water will carry the deposited
chloride to the groundwater. In general the concentration in the rainwater can be taken as
constant. The fact is however that it varies during the year and probably between wet and dry
periods. A very detailed use of this technique can therefore involve numerous of assumptions
not fully valid in time and space. It could however be a useful assessment method on regional
scale assessment
Principles of CRD Method (DGS, 2002)
The cumulative rainfall departures are defined as follows:
^
^
R = R - R
k
+ R
(1)
i
i
i 1
-
Where R^ is cumulative rainfall departure (CRD) for month I [mm]; R is rainfall in month i
i
i
[mm]; R is average monthly rainfall for the entire rainfall record [mm]; k is constant
representing pumping or injection (equals 1 for no pumping) [dimensionless].
Most often the acceptable correlation exists between the CRD and the groundwater level hi,
expressed as proportionality constant a:
h = R
a ^ + H
(2)
i
i
w
Where Hw = average depth of the groundwater level below surface; or as change in
groundwater level hi:
h
= a
-
(3)
i
(R
R
k
i
)
Constant a represents a lumped coefficient of recharge and storativity, Rp/S. The objective is
to find a fixed proportion of rainfall for every month. The correlation between the CRD and
the groundwater levels can be improved by introducing the concept of lag effects:
1
i
1
i
^
^
R =
R
k
R
R
(4)
i
-
j
+
j
i 1
-
m
n
j 1
= -(m- )
1
j 1
= -(n- )
1
Geotechnical Consulting Services
137
Groundwater Review of the Molopo-Nossob Basin
Report No. ORASECOM/005/2009
where m denotes a time lag required to observe the effect of a recharge event on the water
table (short memory) [month]; and n is a redistributed effect of recharge over long term,
usually reflecting subtle climatic or hydrological cyclicity (long-term memory) [month]; i, j
subscripts denote i-th and j-th month representing long and short term memory (typically i=1,
2,...120 and j=1, 2...12). Considering the change in saturated volume approximated to CRD
we obtain:
i
i
1
1
^
V a
R
k
R
R
(5)
i
-
j
+
j
i-1
m
(
)
1
n
j =i- m-
j = -
1 (n- )
1
The relationship between CRD and water levels is sought using iteration/optimization
techniques. By changing parameters such as m and n and/or k (if abstraction is important)
iteratively, the best fit can be found. The optimization routine can be carried out for
individual boreholes (to assess a point value of recharge) or for a domain (global recharge
estimate).
Principles of SVF Method (DGS, 2002)
The SVF method transforms groundwater level fluctuations above a given datum plane to
equivalent amounts of water. A simplified (saturated) water balance can be expressed as
follows:
V
S
= Q - Q + R - Q
(1)
i
o
a
t
Where QI and Qo = lateral inflows and outflows [mm], respectively during time increment t;
Qa = net abstraction or discharge from the aquifer [mm]; R = recharge [mm], S = storativity
and V is a change in saturated volume of the aquifer.
When the lateral flow can be neglected, the net volume change is dependent only on recharge
and the abstraction. The recharge is equal to abstraction when there is no change in
groundwater level status and the storativity has not changed - this is the basis of equal volume
method. By correlating the equal volume rainfall and abstraction the recharge as a portion of
rainfall can be calculated.
The SVF technique is a lumped parameter method Ł the hydrological status of the aquifer is
integrated into a composite integrated hydrograph derived from water level records in the
studied area. The integration of water levels is achieved over a Thiessen polygon network.
The usual assumptions include (1) the base of aquifer to be impermeable and (2) the
evapotranspiration losses are included in the recharge term.
When the changes over a time period are zero the storativity term is eliminated. The zero
change conditions usually apply to different periods, implying recharge/abstraction
conditions for various monthly rainfall values. The average recharge can thus be calculated
using recharge (from equal volume periods) and rainfall relationship as follows:
R = kR + (Q - Q )
(2)
a
i
o
Where Ra = mean rainfall for the evaluated period.
Empirical rainfall-recharge relationship
Empirical rainfall-recharge relationships are used to obtain approximate values of possible
recharge once the log term annual precipitation is known. Primarily the relationship needs to
be calibrated by other techniques to estimate the recharge. Any relationship obtained is valid
Geotechnical Consulting Services
138
Groundwater Review of the Molopo-Nossob Basin
Report No. ORASECOM/005/2009
for long term average and is site-specific. However some relations developed for specific
geological conditions could be applied in similar conditions (ORASECOM, 2009).
Bredenkamp (1988) obtained a linear relationship between rainfall and recharge for a
dolomite area in Transvaal, South Africa:
R =
(
A P - B)
Where B represents the threshold rainfall that is required to affect recharge, P is the annual
precipitation, and A is lumped catchment parameter. In the ORESECOM report (2009) the
relationships are further developed to be both in exponential and linear relations as
summarized in Table 5-27.
The recharge in the Kalahari Beds in Botswana was approached by van Straten (1955),
Boocock and van Traten (1962) and Foster et al (1982) stating the unlikelihood of recharge in
area where the thickness of the Kalahari Beds exceeds six meters. De Vries (1985) used
calculation based on existing hydraulic gradients and came to the conclusion that the recharge
rate will be less than 5 mm/a. Recent studies by Selaolo (1998) and Obakeng (2007) show
that recharge is possible in their study areas in Central Kalahari in Botswana.
Table 5-27
Recharge rainfall relationship in the Molopo-Nossob Basin in South Arfica developed and
presented in ORASECOM report (2009)
Aquifer
Location
Eqv No
Relationship
Estimated recharge
(mm/a)
Basic relations
Sishen
OR1
R=0.898e0.032x1
Rietondale
OR2
R=0.2837e0.0348x
Manyeding
OR3
R=0.2733e0.0473x
Kuruman
OR4
R=0.7425e0.0538x
Louwa-Coetzerdam
OR5
R=0.086(Rf-286)
Kalahari
OR1
4.6
aquifers
OR2
2.6
OR3
-1.4
Tosca dolomite
OR1
5.3
aquifer
OR3
12.0
OR4
42.2
Coetzersdam
OR1
6.6
granite
OR2
13.7
OR3
18.6
OR5
16.8
5.2.5.3 Recharge values from studies in the Molopo-Nossob Basin
From investigation carried out in various parts of the Molopo-Nossob Basin, assessments of
the recharge values are obtained. The methods used and the recharge values arrived at are
summarized in Table 5-28.
In the National Water Master Plan for Botswana (DWA, 1991) estimates of the recharge
using the CMB method and data on chloride deposition rate presented by GRESS (1989)
were done based on the groundwater chloride content and the average precipitation. Results
applicable to the Molopo-Nossob Basin are included in Table 5-28.
Geotechnical Consulting Services
139
Groundwater Review of the Molopo-Nossob Basin
Report No. ORASECOM/005/2009
The chloride mass balance, CMB, is used to assess estimates of the regional recharge in the
Molopo-Nossob Basin. Beekman et al (1996) presented a map of the total chloride deposition
in mg/a per m2. The map is also published by Selaolo (1998). In the JICA report (JICA, 2002)
a relationship between the chloride deposition and the average annual rainfall is brought
forward (without any reference).
Cl =
0
.
0 00002
2
P + 0
.
0 003 P +
2
.
0 207
p
D = 0.1 Cl
p
A comparison between the chloride deposition assessed by Beekman et al (1996) and the
deposition calculated by the formula given in the JICA report (2002) shows a general relation
of about 0.75. Such discrepancy with have and impact on the recharge calculated by the CMB
method. In the assessment of the recharge for the Molopo-Nossob Basin the chloride
deposition calculated by the JICA formula is reduced by a factor 0.75. The map, presented in
Figure 5-49 shows the chloride deposition over the Molopo-Nossob Basin.
Table 5-28
Recharge methods and values obtained from investigation in the Molopo-Nossob Basin
Country
Area
Method
Recharge
Reference
Remarks
value (mm/a)
Botswana
Ncojane
CMB
5 Ł 38
DWA, 2008
Ecca (Auob)
Modeling
0.15 Ł 0.63
aquifer
14C
0.7 Ł 1.4
CMB
6
DWA, 2008
Ntane aquifer
14C
1 - 6
Kang-Phuduhudu
CMB
3.2 Ł 15
DWA, 2007
Modeling
Stable Isotopes
8
done
with
Modeling
0
conservative
approach
Bokspits
CMB
0.8
DGS, 2002
Three
zones
CMB
0.5
DWA, 1991
with recharge
0.1, 0.3 and
1.5
Tsabong
CMB
5
DWA, 2002
Stable Isotopes
11.5
Kakhea
CMB
2.9
DWA, 1991
50% value
Sekoma
CMB
2.3
DWA, 1991
50% value
Tshane
CMB
1.3
DWA, 1991
50% value
Middlepits
CMB
1.0
DWA, 1991
50% value
Matsheng
Modeling
3.5
DWA, 1996
Sikamatswe
CMB
0.37
DGS, 1994
Namibia
Stampriet
1.5
JICA,2002
Ordinary Year
Artesian Basin
South Africa Kalahari aquifers
2.2
ORASECOM, 2009 Average value
Dolomite aquifers
19.8
ORASECOM, 2009 Average value
Granite aquifer
13
ORASECOM, 2009 Average value
Geotechnical Consulting Services
140
Groundwater Review of the Molopo-Nossob Basin
Report No. ORASECOM/005/2009
-22░S
-23░S
-24░S
-25░S
-26░S
-27░S
-28░S
17░E
18░E
19░E
20░E
21░E
22░E
23░E
24░E
25░E
26░E
Figure 5-49
Total chloride deposition (mg/a and m2) calculated for the Molopo-Nossob Basin according to
formula given by JICA (2002) and adjusted with a factor 0.75
Data on groundwater chloride from boreholes within the Molopo-Nossob Basin are used to
construct a map showing the areal distribution of the Cl in groundwater, see Figure 5-50. The
chloride distribution follows in general the same pattern as the TDS distribution. The highest
concentration of Cl (> 20,000 mg/l) is found in Gordonia. Large area of Botswana has
chloride concentration in exceeding 2,000 mg/l. The WHO Guideline value for human
consumption is Cl <250 mg/l.
The maps on chloride deposition and chloride content are the base in the construction of the
groundwater recharge map in Figure 5-51. The map is based on the chloride mass balance
method and serves as a general picture of the recharge in the Molopo-Nossob Basin.
-22░S
-23░S
-24░S
20,000
-25░S
10,000
5,000
-26░S
2,000
1,000
-27░S
500
200
-28░S
100 Chloride
mg/l
0
17░E
18░E
19░E
20░E
21░E
22░E
23░E
24░E
25░E
26░E
Figure 5-50
Chloride concentration in the groundwater within Molopo-Nossob Basin
Geotechnical Consulting Services
141
Groundwater Review of the Molopo-Nossob Basin
Report No. ORASECOM/005/2009
-22░S
-23░S
-24░S
20
-25░S
10
-26░S
5
2
-27░S
1
0.5
-28░S
0.1
17░E
18░E
19░E
20░E
21░E
22░E
23░E
24░E
25░E
26░E
Figure 5-51
Groundwater recharge in mm/a assessed using the Chloride Mass Balance method (CMB)
5.2.6 Groundwater Modeling
5.2.6.1 Mathematical Methods
To use the groundwater flow equation to estimate the distribution of hydraulic heads, or the
direction and rate of groundwater flow, a partial differential equation (PDE) must be solved.
Both initial conditions (heads at time (t) =0) and boundary conditions (representing either the
physical boundaries of the domain, or an approximation of the domain beyond that point) are
needed in the process of solving the equation. Often the initial conditions are supplied to a
transient simulation, by a corresponding steady state simulation (where the time derivative in
the groundwater flow equation is set equal to 0.
There are two broad categories of how the (PDE) would be solved; either by analytical or
methods, or something possibly in between. Typically, analytic methods solve the
groundwater flow equation under a simplified set of conditions exactly, while numerical
methods solve it under more general conditions to an approximation.
Analytical methods
Analytic methods typically use structure of mathematics to arrive at a simple, elegant
solution, but the required derivation for all the simplest domain geometries can be quite
complex. Analytic solutions typically are also simply an equation that can give a quick
answer based on a few basic parameters. The Theis equation is a simple (yet still very useful)
analytic solution, typically used to analyze the results of an aquifer pumping test.
Geotechnical Consulting Services
142
Groundwater Review of the Molopo-Nossob Basin
Report No. ORASECOM/005/2009
Numerical methods
The topic of numerical methods is quite large, obviously being of use to most scientific and
engineering fields in general. Numerical methods have been around much longer than
computers have, but they have become very important through the availability of fast and
cheap personal computers.
There are two broad categories of numerical methods, gridded or discretized methods and
non-gridded or mesh-free methods. In the common finite difference method (FDM) and finite
element method (FEM) the domain is completely gridded. The analytical element method
(AEM) and the boundary intregral equation method (also called (BEM, or Boundary Element
Method) are only discretized at boundaries or along flow elements (line sinks, area sources,
etc.), the majority of the domain is mesh-free.
Gridded Method
Gridded methods like FDM and FEM solve the groundwater flow equation by breaking the
problem area (domain) into many small elements (squares, rectangles, triangles, blocks,
etc.)and solving the flow equation for each element (all material properties are assumed
constant or possibly linearly variable within an element), then linking together all the
elements using conservation of mass across the boundaries between the elements, see Figure
5-49. This results in a system which overall approximates the groundwater flow equation,
exactly matches the boundary conditions (the head or flux is specified in the elements which
intersect the boundaries).
Figure 5-52
Example of a 3-dimensional grid for numerical modeling
FEM are a way of representing continuous differential operators using discrete intervals (x
and t), and the finite difference methods are based on these. For example the first order time
derivative is often approximated using the following finite difference, where the subscripts
indicate a discrete time location.
Geotechnical Consulting Services
143
Groundwater Review of the Molopo-Nossob Basin
Report No. ORASECOM/005/2009
The forward finite difference approximation is unconditional stable, but leads to and implicit
set of equations (that must be solved using matrix methods). The similar backwards
difference is only conditional stable, but it is explicit and can be used to "march" forward in
the time directions, solving one grid node at a time.
MODFLOW is a well-known example of a general finite difference groundwater flow model.
It is developed by the US Geological Survey as a modular and extensible simulation tool for
modeling groundwater flow. It is free software developed, documented and distributed by the
USGS. Many commercial products have grown up around it, providing graphical user
interfaces to its input file based interface, and typically incorporating pre-and post-processing
of user data. Many other models have been developed to work with MODFLOW input and
output, making linked models which simulate several hydrologic processes possible (flow
and transport models, surface water and groundwater models and chemical reaction models),
because of the simple, well documented nature of MODFLOW.
FEM programs are more flexible in design (triangular elements vs. the block elements most
finite difference models use) and there are some programs available (SUTRA, a 2D or 3D
density-dependent flow model by USGS; Hydrous, a commercial unsaturated flow model;
FEFLOW, a commercial modeling environment for subsurface flow, solute and heat transport
processes; to mention a few), but unless they are gaining in importance they are still not as
popular in with practicing hydrogeologists as MODFLOW is. Finite element models are more
popular in university environments, where specialized models solve non-standard forms of
the flow equation (saturated flow, density dependent flow, coupled heat and groundwater
flow, etc.)
Mesh Ł Free Methods
These include mesh-free methods like the Analytical Element Method (AEM) and the
Boundary Element Method (BEM) which are closer to analytic solutions, but they do
approximate the groundwater flow equation in some way. The BEM and AEM exactly solve
the groundwater flow equation (perfect mass balance), while approximating the boundary
conditions. These methods are more exact and can be much more elegant solutions (like
analytic methods are), but have not seen as widespread use outside academic and research
groups yet.
5.2.6.2 Modeling Performed
A number of modeling exercises are performed in the Molopo-Nossob Basin. These exercises
are done in connection to groundwater investigation with the aim of supplying water to local
and/or regional consumers. Modeling is also conducted in regional groundwater studies and
in connection with academic projects.
A list of groundwater modeling performed is given in Table 5-29 and shown in Figure 5-53.
The latest modeling attempt known is within the Transboundary Groundwater Resource
Program where the Stampriet Artesian Basin, SAB, was modelled by BGR. Other attempts
were previously conducted in the JICA project 2002 and by DWA Namibia over the same
area (SAB). In Botswana, numerical modelling of the area north of Bokspits was performed.
Also the existing wellfield area around Tshabong and future groundwater abstraction from
planned wellfields and Kang and Ncojane were modeled by DWA.
Geotechnical Consulting Services
144
Groundwater Review of the Molopo-Nossob Basin
Report No. ORASECOM/005/2009
Table 5-29
Modeling exercises conducted in the Molopo-Nossob Basin
Country
No
Area
Size km2
Model used
Reference
Remarks
Botswana
B1
Kang
8,480
Modflow
DWA, 2007
B2
Ncojane
55,300
Modflow
DWA, 2008
B3
Bokspits
4,000
Modflow
DGS, 2002
B4
Tsabong
35
Modflow
DWA, 2002
B5
Hunhukwe/Lokalane
Modflow
DGS, 2000
B6
Kanye
Modflow
DWA, 2006
Namibia
N1
SAB
71,000
Modflow
JICA, 2002
N1
SAB
71,000
Feflow
Bõumle, 2008
DWA work
2004/2005
South
SA1 Tosca Molopo
4,000
Modflow
Van Dyk, 2005
Africa
Pering Mine
Moseki, 2001
SA2 Louwna-
1,330?
Botha and van
Coetzerdam
Wyk 1995
SA3 Sishen Mine
Steenekanp,
1998
The models used in the exercises were mainly Modflow and Feflow. The models all have the
possibility to undertake a two or three dimensional, finite difference groundwater flow
modeling.
-22░S
Gobabis
Windhoek
B2
-23░S
B5
Ncojane
B1
-24░S
Kang
N1
Matsheng
B6
Stampriet
-25░S
Gochas
Kanye
SA1
-26░S
B4
Tosca
Mmabatho
Tsabong
B3
SA2
-27░S
Aroab
Bokspits
Kuruman
SA3
-28░S
17░E
18░E
19░E
20░E
21░E
22░E
23░E
24░E
25░E
26░E
Figure 5-53
Location of areas where groundwater modeling is conducted. Numbers refer to Table 5-29
The basic data sets required for development of numerical models will come from the results
of the data assessment:
Geotechnical Consulting Services
145
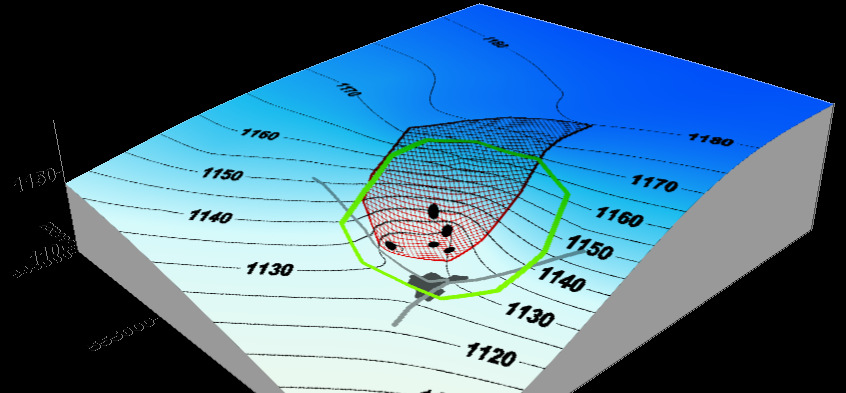
Groundwater Review of the Molopo-Nossob Basin
Report No. ORASECOM/005/2009
Ę Topography
Ę Aquifer base and thickness (geology and structures)
Ę Hydraulic conductivity, transmissivity, and storativity
Ę Recharge
Ę Piezometric surface for steady state calibration
Ę Boundary conditions
Ę Precipitation
Ę Salinity distribution
Ę Evapotranspiration data
Ę Piezometric head (hydrographs) and time series of abstraction for transient
calibration
All the above data sets except for hydrographs are discretizised according to the model grid
units. Some of the data such as hydraulics parameters, piezometric surface, aquifer thickness,
recharge, and TDS are compiled into scattered data files and then gridded before inputting
into the model grid.
A first standard calibration is usually carried out under steady state condition to simulate
observed initial piezometric heads with appropriate boundary conditions. Its aim to refine the
transmissivities/hydraulic conductivity values, natural recharge and evapotranspiration.
The second standard calibration is under transient conditions using hydrographs and
piezometric evolution patterns. The aim is to refine the storativity of the aquifer.
Each model parameter is also subjected to a sensitivity analysis to establish its effect to
uncertainty on the calibrated model.
Once the model is calibrated, the response of the aquifer system to both future natural and
human induced stresses is established in terms of both quantitative and qualitative. The
various scenarios to be applied are usually discussed with the main stakeholders and planners.
The modeling results can also be used for delineation of protection zones based on travel time
in the groundwater by various potential pollutants, see example Figure 5-54.
Figure 5-54
Example of protection zone delineation (Ghanzi, Botswana) using results from numerical modeling
(Red zone for 100 years travelling time, green zone restricting for drilling and abstraction of
groundwater)
Geotechnical Consulting Services
146
Groundwater Review of the Molopo-Nossob Basin
Report No. ORASECOM/005/2009
Kang-Phuduhudu
Groundwater investigations for the supply of Kang village and surrounding rural villages and
farms were carried out in 2007 (DWA, 2007). The study included a modeling exercise with
the objective:
Ę
To comprehensively evaluate and quantify the groundwater resources of the
aquifers present
Ę
To optimize utilization of the identified groundwater resources while mitigating
any detrimental environmental effects of such development
Ę
To determine and assist in delineating protection zones for new and existing
wellfields
Ę
To use groundwater modeling as a tool for future groundwater resources
management and as a reliable tool for decision making
Ę
To predict future aquifer response to various abstraction stress conditions
The targeted aquifer was the Ecca Group aquifers consisting of the Boritse and the underlying
Kweneng Formation where substantial yields were encountered. The Ecca aquifer is
separated from the Kalahari and Lebung by a thick Kwetla and Mosolotsane mudstone
sequence.
Major structures significantly influenced the depth of occurrence of the main aquifer, as well
as the thickness and distribution of the overlying Karoo units, by virtue of the horst and
graben movements with subsequent erosion. The regional groundwater flow within the
modeled area is northwest to south-east.
It was considered highly unlikely of any direct recharge to the Ecca aquifers since thick
Kalahari (20-150 m) and thick Kwetla (>200 m) overlay the aquifer. For modeling purposes
no direct recharge to the aquifer was considered in the modeled area.
With the assumption of assuming zero recharge into the model, the model was calibrated with
a fixed/head dependant boundary to the west during steady state modeling. For the most
conservative approach to resource modeling, the western boundary could also be closed and
zero inflow assumed so as to evaluate wellfield response to closure of the boundary.
Three main types of groundwater fluxes were considered, inward flux from the northwest and
west, outward fluxes to the south, north and southeast and abstraction fluxes. The inward flux
from the northwest was taken from values given by work undertaken in the Stampriet basin in
Namibia, (JICA, 2002).
The numerical model used had the following characteristics;
Ę A Finite Difference MODFLOW model, rectangular grid of 1 km2 consistent with
the UTM coordinates, see Figure 5-55. The size of the total model 8,480 km2
Ę A 2-LAYER model with the two layers separated by a very low permeability unit
Geotechnical Consulting Services
147
Groundwater Review of the Molopo-Nossob Basin
Report No. ORASECOM/005/2009
Ę Fluxes 3-D mainly horizontal flow within each layer and vertical flow across the
intervening aquitard.
Ę Transmissivity and storage coefficient (only in the transient phase) automatically
convertible between confined and unconfined conditions.
After proper calibration the model was used to:
Ę
Simulate groundwater abstraction to the year 2025
Ę
Assess the potential of each individual borehole in meeting the demand
Ę
Verify the recommended abstraction rates interpreted from test pumping data by
numerical groundwater modeling
Ę
Assess the potential of the groundwater resources in meeting the projected water
demand
Ę
Evaluate drawdown spatial distribution from abstraction to 2025.
Ę
Assess the overall regional groundwater flow regime as a result of abstraction to
2025.
Ę
Delineate aquifer protection zones.
The maximum drawdown achieved during predictive modeling was between 30-40m for the
entire model area.
7410000
7400000
7390000
7380000
7370000
7360000
7350000
7340000
7330000
7320000
7310000
650000 660000 670000 680000 690000 700000 710000 720000 730000
Figure 5-55
Grid lay-out for the Kang-Phuduhudu numerical model wit delineated wellfield areas and
simulated production wells (DWA, 2007)
Geotechnical Consulting Services
148
Groundwater Review of the Molopo-Nossob Basin
Report No. ORASECOM/005/2009
Some of the conclusions and recommendations from the modeling exercise were:
Ę The horizontal flow from the northwest was estimated to be 1,300 m3/d which value is
5 times less than the out flux of 6,800 m3/d calculated for the Stampriet basin in
Namibia.
Ę It is a need to evaluate the nature and volume of the groundwater influx into the
modelled area to the northwest.
Ę Drawdown contour maps showed insignificant spread of the cone of depression
outside the major structural features, with drawdown of one metre observed beyond
the northwest boundary.
Ę The predictive model results show that the projected water demand until 2025 will
easily be met with the available production boreholes.
Ę Aquifer groundwater storage will account for 68% of the total groundwater
abstraction by 2025. This aquifer storage use will have delayed effects on the aquifer
recovery with recovery rates of 74-78% estimated after a 20 year period of non-
pumping.
Ę Low groundwater vulnerability within the modelled area due to a deep aquifer, thick
overlying strata which are also generally impermeable. Wellhead protection zones
were delineated based on travel time and travel distance calculation from particle
tracking methods. The 100 day travel time shows travel distances of <100m, while,
the 100 year travel time shows distance of at most 400m.The protection zones were
delineated based on aquifer drawdown response to abstraction at the end of 2025.
Ncojane and Matlho-a-Phuduhudu Blocks
Groundwater investigations to locate and develop sufficient potable groundwater resources
for the supply to the demand centres of northern Kgalagadi District in Botswana were carried
out in 2008 (DWA, 2008). The study included a modeling exercise with the objective:
Ę
To comprehensively evaluate and quantify the groundwater resources of the
aquifers present
Ę
To simulate potential wellfield abstraction
Ę
To determine and assist in delineating protection zones for new and existing
wellfields
Ę
To use groundwater modeling as a tool for future groundwater resources
management and as a reliable tool for decision making
Ę
To predict future aquifer response to various abstraction stress conditions
Geotechnical Consulting Services
149
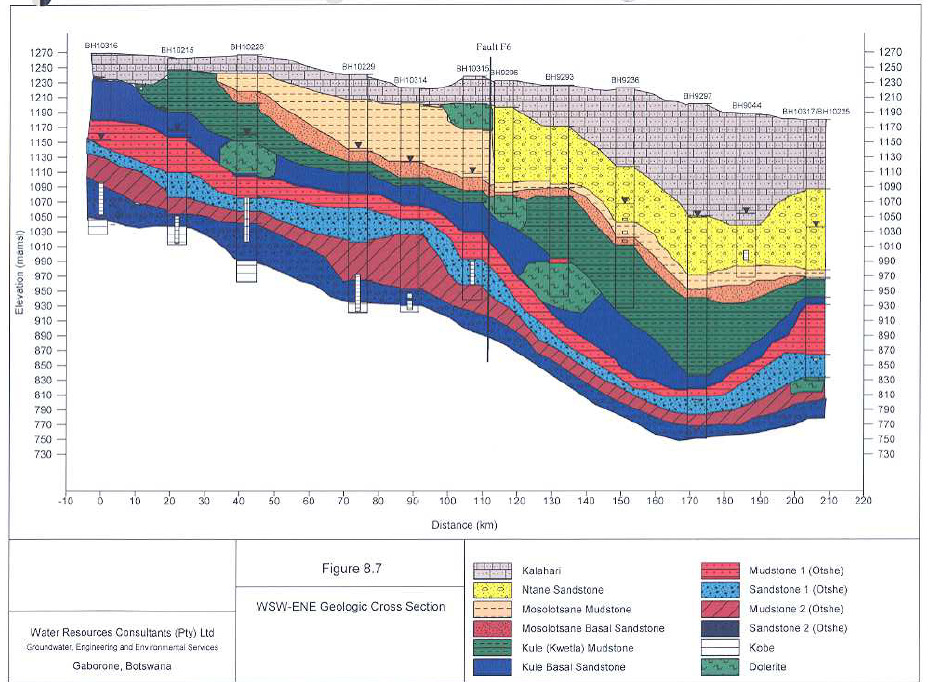
Groundwater Review of the Molopo-Nossob Basin
Report No. ORASECOM/005/2009
Figure 5-56 Geologic cross section WSW-ENE through the Ncojane area in Botswana (DWA, 2008). The three
aquifers considered are Ntane, Otshe sandstone1 and Otshe sandstone 2.
The targeted aquifers were the Ecca and the Ntane sandstone aquifers. The modeled aquifer
system was conceptualized in terms of a four layer model where the top layer represented the
saturated formations overlying the Ecca aquifer (Ntane, Kalahari Beds or a combination). The
underlying layers 2 through 4 represented interpreted aquifer units in the Ecca, with layer 4
representing the deepest saline portion of the system (Kobe aquifer). Figure 5-56 shows a
cross-section over the investigated area with the identified aquifers.
Recharge was applied only to the western part with the value 0.15 to 0.63 mm/a.
The model was given Transmissivity vales of 50 m2/d in the upper layer (layer 1) In the lower
layers a Transmissivity of 25 m2/d was assigned, however with high values (100 m2/d) in
zones identified
The numerical model used had the following characteristics;
Ę A Finite Difference MODFLOW model, rectangular grid of 10x10 km to 1x1 km.
The size of the total model 55,300 km2
Ę A 4-LAYER model separated by a very low permeability unit with vertical
leakage
Geotechnical Consulting Services
150
Groundwater Review of the Molopo-Nossob Basin
Report No. ORASECOM/005/2009
Ę Fluxes 3-D mainly horizontal flow within each layer and vertical flow across the
intervening aquitard.
After proper calibration the model was used to:
Ę Simulate a production of 9,600 m3/d from the Ecca aquifer
Ę Simulate a scenario with two wellfields, western and eastern, in Ecca and Ntane with
abstraction for 20 years of 16,800 and 13,200 m3/d respectively.
Ę Delineating of protection zones for the wellfields.
Some of the conclusions and recommendations from the modelling exercise were:
Ę The total recommended abstraction rate of 9,600 m3/d, representing about half the
recharge value will on long term be a sustainable yield.
Ę The wellfield will probably reach steady-state after a period of more than 80 years..
Ę In the two wellfield scenario, the abstraction from the Ecca aquifer will be just barely
possible. However the abstraction from the Ntane aquifer will result in drying up of
the boreholes.
Ę The predictive model results show a sustainable abstraction from the Ntane sandstone
aquifer should be lower than 2,500 m3/d.
Ę A groundwater protection zone with a radius of 4 km around each production
borehole will contain a capture zone for 100 years of travel time in the aquifer of any
pollution.
Bokspits
To summarize and recommend groundwater abstraction in the Bokspits TGLP area, a 3D
finite difference (MODFLOW) model of the regional groundwater flow was constructed
using information from borehole, water level and pumping test data. The model had
approximately 4 km grid spacing and covered more than 4000 km2. In conceptual model
building information from hydro chemical and isotope evaluation was also used.
Great attention was given to the estimation of recharge and several techniques such as SVF
and CRD were evaluated. Water level contour map was developed with the aid of a digital
terrain model based on grid with 30 arc second resolution.
The model was represented by one layer with interpolated bottom and top based on drilling
results, see Figure 5-57. The model was calibrated as steady state against the regional
piezometry in September 2001. Four hydraulic conductivity and four recharge zones were
considered in the model. Due to poor spatial coverage of the transient data, the unsteady state
calibration was not attempted.
Modeled domain, which extends beyond the project area boundaries, was set up to receive
recharge in the order of over 6000 m3/d (0.5 mm/y). Discharge was taking place mainly in the
south to southwest at a rate of about 0.5 l/s per km. This value was however charged with
large uncertainty due to unavailability of abstraction data on the South African side.
Geotechnical Consulting Services
151
Groundwater Review of the Molopo-Nossob Basin
Report No. ORASECOM/005/2009
Figure 5-57
Three-dimensional image of the modeled aquifer system. (Note that the upper surface is not the
topographic surface, but extrapolated depth to first water strike. The system thus represents
confined/unconfined structure) (DGS, 2003)
Proposed pumping rate of 1,515 m3/d from 13 production boreholes was found to be not
feasible. This was not due to overall deficit, in fact the available recharge exceeded pumping
requirements about three times, but due to demands on specific boreholes. Simulations for 20
and 50 years (using reasonable storativity estimates 0.0015-0.0028) were used to adjust
proposed pumping rates of about 37%.
To improve the modelling exercise it was proposed that:
1. Data from should be requested from the South African to improve the model
reliability in the south and west. The data should include measurements of water
levels and abstraction.
2. The northern boundary of the model should be moved further north and data
required between the current project boundary (northern) and moved model
boundary (about 20-30 km further north).
3. Instead of large pumping from one borehole, the pumping load should be spread to
several boreholes.
4. Hydro chemical monitoring is crucial and influx of saline waters may destroy
pumping schemes if the hydro chemical changes were not monitored. This was
considered especially important in case of Sikamatswe-Khawa wellfield
development area.
5. Periodic reassessment of recharge (and potential model recalibration) was required
together with monitoring of water levels and sampling for isotope data.
Geotechnical Consulting Services
152
Groundwater Review of the Molopo-Nossob Basin
Report No. ORASECOM/005/2009
Tsabong
Groundwater investigations for the supply of Tsabong village and surrounding rural villages
and farms were carried in 2002 (DWA, 2002). The study included a modeling exercise with
the objective:
Ę
To evaluate and quantify the groundwater resources of the aquifers present
Ę
To determine and assist in delineating protection zones for new and existing
wellfields
Ę
To use groundwater modeling as a tool for future groundwater resources
management and as a reliable tool for decision making
Ę
To predict future aquifer response to various abstraction stress conditions
The targeted aquifer was the Olifantshoek aquifer consisting of quartzite sandstone
outcropping and covered by Kalahari Beds. The model used was limited to a grid measured
50 by 70 grids and cantered on a water yielding lineament. Each cell in the grid measured
100x100 m and the size of the model was 35 km2, see Figure 5-58.
The aquifer comprised the fracture zone forming a tabular body, generally dipping to the
southeast. In the model this fracture was assigned 300 m width, 2-5 m thickness and 6,500
lengths. The aquifer was considered both confined and unconfined.
Constant head boundaries were assigned to the two outflow area opposite each other whereas
the other two boundaries were considered no flow boundaries. The transmissivity along the
structural feature was set at 15 and 30 m2/d respectively. Outside the lineament a low
Transmissivity of 0.1 m2/d was assigned.
Recharge of 15 mm/a was assigned to the unconfined part of the aquifer, the rest of the model
was given 3.7 10-5 mm/a.
During calibration process against water level during steady and transient state (test pumping)
the Transmissivity and recharge assignment were adjusted.
Some of the conclusions and recommendations from the modelling exercise were:
Ę The model applied was simple and not recommended to be used for future
groundwater planning purposes.
Ę The recharge at the rock outcropping area was found to be around 40 mm/a.
Geotechnical Consulting Services
153
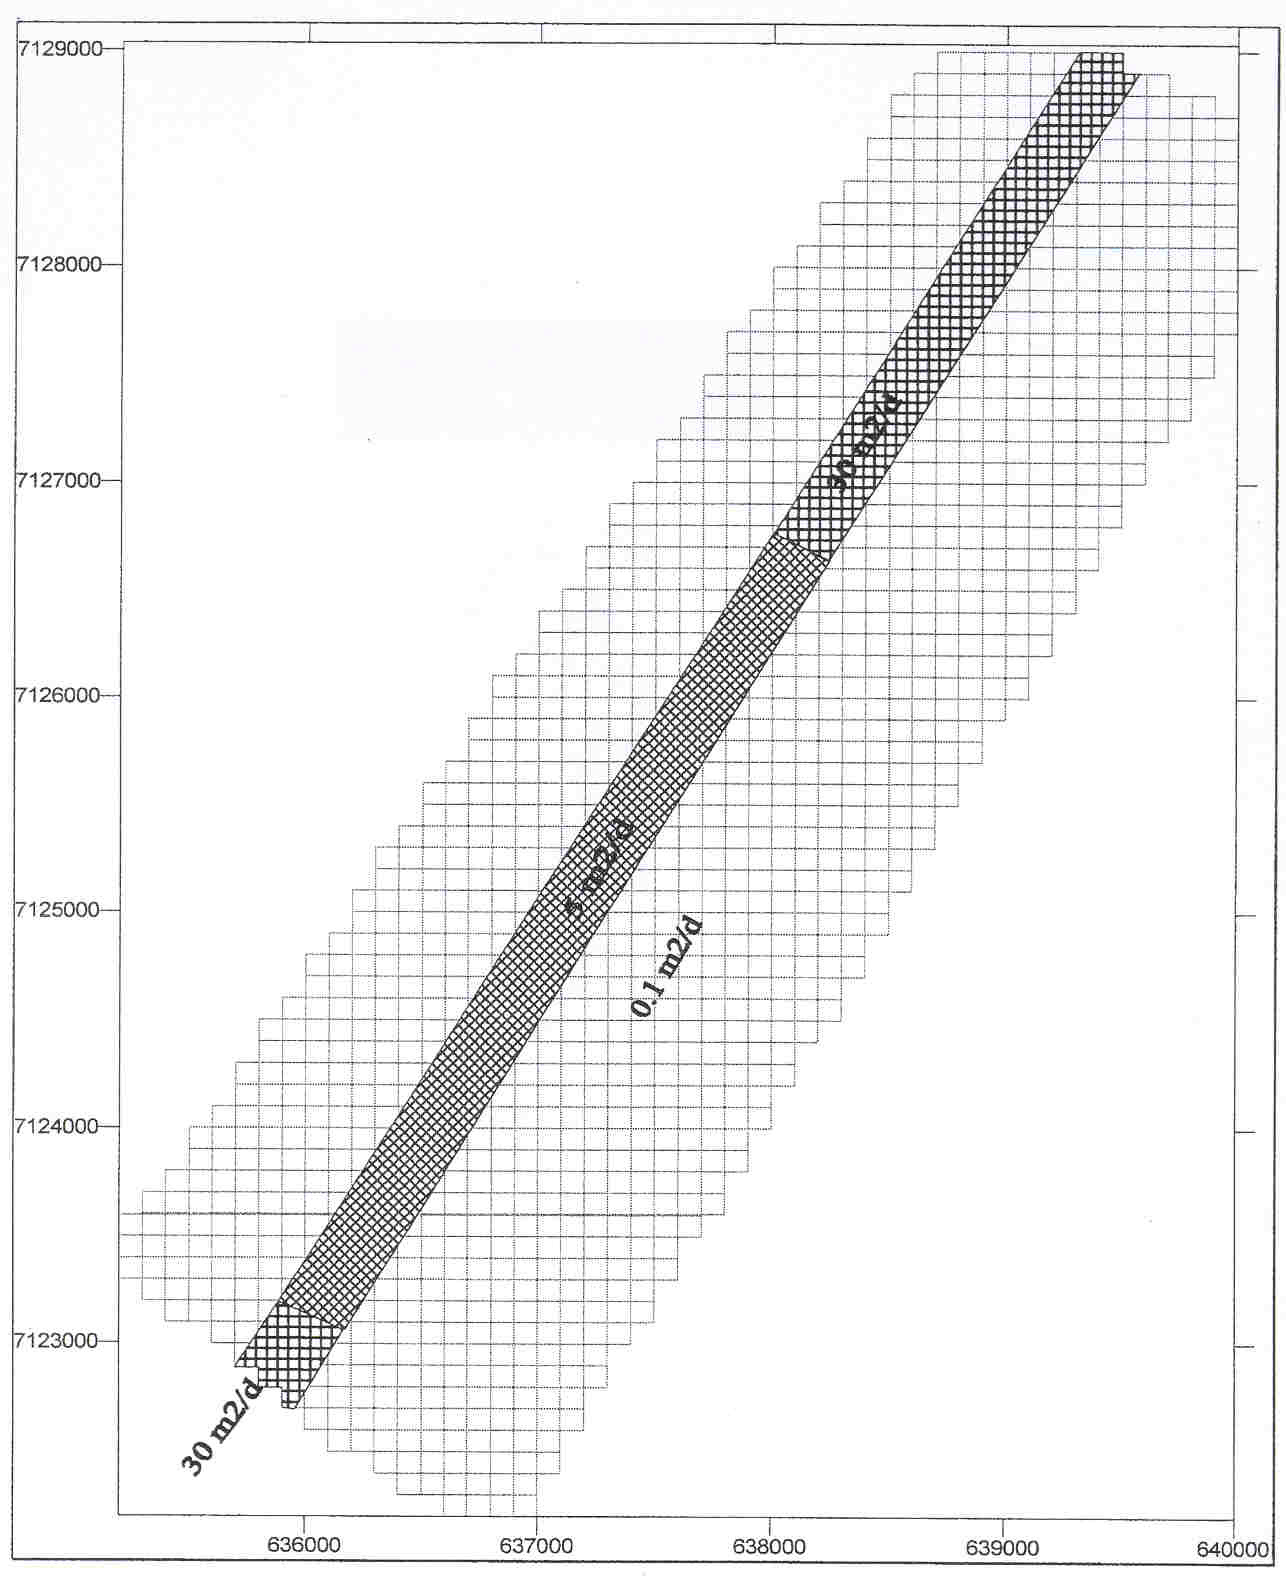
Groundwater Review of the Molopo-Nossob Basin
Report No. ORASECOM/005/2009
Figure 5-58
Grid net used and assigned Transmissivity values in modeling in Tsabong (DWA, 2002)
Stampriet Artesian Basin, SAB
The Stampriet Artesian Basin was investigated regarding the groundwater flow regime, the
recharge mechanism, sustainable groundwater abstraction and to lay out a groundwater
management plan. As part of the groundwater potential evaluation, a numerical modelling
was performed over the area covering about 71,000 km2 (JICA, 2002).
The model used was a finite difference three-dimensional model (Visual Modflow). The
model covered the three aquifers (Kalahari, Auob and Nossob). The Kalahari aquifer was
modelled in unconfined, and the Auob and Nossob aquifer as confined aquifers.
The northern and south-eastern boundaries were regarded as a constant head boundary to
approximate groundwater inflow and outflow.
The model used the data on recharge, aquifer hydraulic properties and abstraction assessed
from the study of the SAB. Irrigation 6.9 Mm3/a, stock watering 5.7 Mm3/a and domestic
groundwater abstraction of 2.4 Mm3/a were applied as stress in the model. Model calibration
was done against monitored groundwater levels.
In the prediction modeling, six (6) different scenarios were applied and simulated for a 100
years period. Case 1 and 2 were assumed to maintain the groundwater use found in the study.
Case 3, introduced an increase of 120% on the irrigation in comparison with use found in the
study. In Cases 4 to 6, the irrigation use was decreased to 70%, 50% and 0% respectively.
Table 5-30 summarizes the scenario cases.
Geotechnical Consulting Services
154
Groundwater Review of the Molopo-Nossob Basin
Report No. ORASECOM/005/2009
The simulation results showed that the Stampriet area in the SAB was over-pumped at the
groundwater usage at the time of the study. A 50% reduction in irrigation use was
recommended necessary for the Stampriet area; otherwise, the Kalahari Aquifer in the area
will dry up in near future. Table 5-31 summarizes the results. The groundwater level
drawdown in the Kalahari and Auob aquifers simulated after 100 years of pumping (Case 2)
are illustrated in Figure 5-59.
Table 5-30
Scenario cases in the JICA groundwater modeling of the SAB (JICA, 2002)
Pumping Rate (Mm3/year)
Case
Domestic
Stock Watering
Irrigation (%)
Total (%)
1
2.36
5.69
6.89 (100)
14.94 (100)
2
2.36
5.69
6.89 (100)
14.94 (100)
3
2.36
5.69
8.27 (120)
16.32 (109)
4
2.36
5.69
4.82 (70)
12.87 (86)
5
2.36
5.69
3.44 (50)
11.49 (77)
6
2.36
5.69
0 (0)
8.05 (54)
Table 5-31
Results of the Groundwater Simulation of the SAB (JICA, 2002)
Area
Stampriet Area
Other Area
Constraint
Water Balance
Economic
Water Balance
Economic
Aquifer
Kalahar
Case
Auob
Kalahari
Auob
Kalahari
Auob
Kalahari
Auob
i
1
NA
NA
UD
A
A
A/UD
G
G
2
NA
NA
UD
A
A
A
G
G
3
NA
NA
UD
UD
A
A
G
G
4
NA
UD
UD
G
A
A
G
G
5
A/UD
A
G
G
A
A
G
G
6
A
A
G
G
A
A
G
G
Remarks:
Water
Balance,
G=Good
(0-0.03m/y),
A=Allowable
(0.03-0.10m/y),
UD=Undesirable (>0.11m/y), NA=Not Allowable (Dry up)
(Drawdown) Economic: G=Good (0-10m), A=Allowable (10-20m), UD=Undesirable
(>20m), NA=Not Allowable (Dry up)
On the other hand, in other areas in the SAB, no problem arose in any of the simulation cases.
In those areas the groundwater use was mainly for stock watering or domestic purpose, and
no remarkable increase was noticed. In Stampriet area, Case 5 (reducing irrigation use to
50%) and Case 6 (reducing irrigation use to 0%) were considered acceptable. Case 4
(reducing irrigation use to 70%) could not be recommended since the Kalahari Aquifer then
would dry up within 80 years. To prevent the dry-up of the aquifer, groundwater pumping
for irrigation use it was proposed that it should at least be reduced to 50% of that in 1999,
almost the same as the irrigation use in 1992.
Geotechnical Consulting Services
155
Groundwater Review of the Molopo-Nossob Basin
Report No. ORASECOM/005/2009
Figure 5-59
Simulated drawdown in the Kalahari and Auob aquifers (Case 2) in the Stampriet Artesian Basin,
SAB (JICA, 2002).
Tosca Molopo
A study to investigate the impact of irrigation on the resource and initiate actions to manage
the resource was conducted in 2005 (van Dyk, 2005). The background for the study was a
monitoring of groundwater decline of up to 60 m due to a rapid development of irrigation
from groundwater resources in dolomite aquifers.
In the evaluation a modeling exercise was performed using the MODFLOW PMWIN 5.1.7
(Chiang 2000) software to construct a 2-layer finite difference flow model. The model
covered an area of 4000 km2 was divided into cells of 0.5 x 0.5 km generating 100 rows and
160 columns. Based on the understanding of the hydrogeology (a conceptual model),
provision was made for 2 layers comprising an unconsolidated primary aquifer by fine-
grained sediments of the Kalahari Group and an underlying fractured dolomite with its
aquifer characteristics.
The general flow is from the SW to the NE with the Molopo River the base of drainage. From
the observed water level reaction the sediments contribute largely towards the storage of the
aquifer system with the fractures of the dolomite contributing to high yielding flow.
Dolerite dykes were taken into consideration in the model and the two most influential
(Grassbank and Quarreefontein dykes, about 15 m thick each) acted as no-flow boundaries of
the Neumann (impervious) type impeding flow from the south and west of the area.
The first layer ranges from an elevation of 1160 mamsl (meters above mean sea level) at a
depth of 10 m in the southwest. To the northeast it range from an elevation of 1080 mamsl to
Geotechnical Consulting Services
156
Groundwater Review of the Molopo-Nossob Basin
Report No. ORASECOM/005/2009
a depth 960 mamsl or a thickness exceeding 120 m. The base of the sediments is the top of
the fractured dolomite aquifer with its base at 900 mamsl.
The surface and groundwater shed formed by the Banded Iron Formation of the Waterberg
formed the boundary to the west. The combination of both a geological contact and
watershed was a leaking boundary. The Molopo River formed the eastern boundary.
Recharge to the aquifer was determined with using the chloride mass balance method.
Various recharge zones as determined from this chloride analysis were used in the model and
the recharge was based on seasonal recharge for the winter (ranging from 0.5% or 0.4 mm to
3% or 1.5 mm) and summer (ranging from 0.5% or 1.6 mm to 3% or 8.3 mm) depending on
the precipitation.
In the modeled area, the sole source of water for both agricultural and domestic requirements
was groundwater. As irrigation use was responsible for 99.5 % of the total use, the domestic
and stock watering abstraction was not considered in the modeling exercise. The irrigation
volume was averaged over a six-month period (182.5 days) according to crop cultivated to
obtain the daily abstraction from the aquifer.
Table 5-32
Scenario modeled and results obtained in the Tosca Molopo investigation (van Dyk, 2005)
Scenario
Precipitation
Abstraction
Results
No
and Recharge
1
Average and
Current high 16.1
level declines of
Not acceptable
normal
Mm3/a
20 to 30m and 60
to 110 m
2
Average and
Irrigation abstraction
water level
With strong
normal
restricted to 11.1
declines of 10 to
abstraction control
Mm3/a
20m and 30 to
this scenario with
60m
controllable water
level declines was
acceptable
3
20% les average Irrigation abstraction
Water level
Not acceptable and
and normal
restricted to 11.1
decline similar to
below normal
Mm3/a
Scenario 1
precipitation would
be an exception.
4
Average and
No irrigation
Water level
Not realistic
normal
recovered after
10 years
The calibrated model was used to test the following 10-year future scenarios of abstraction
and recharge in order to assist in decisions regarding management of abstraction from the
aquifer system. Four scenarios were simulated in the modeling exercises, see Table 5-32.
Based on the evaluation and modeling of the resource the regulating and management of
abstraction was addressed within the legal framework provided by the National Water Act
(NWA) to obtain sustainable, equitable and fare dispensation of water use.
Geotechnical Consulting Services
157
Groundwater Review of the Molopo-Nossob Basin
Report No. ORASECOM/005/2009
6
GROUNDWATER RESOURCES
6.1 Evaluation process
The hydrogeological regime of the Molopo-Nossob Basin is complex with many types of
geological formation and hence of groundwater resources (aquifers). In order to assess the
"groundwater potential" of the basin a groundwater model would be the obvious way in such
an assessment. The paucity of data and the lack of a clear quantitative understanding of the
aquifer parameters over such a large area make it not possible or reliable to assemble such a
model without additional field investigations.
Instead a qualitative assessment is approached by combining various data sets and knowledge
collected during the current project and applying semi-quantitative weighting factors to such
data.
Groundwater potential describes the possibility and ability of an aquifer at a specific area to
supply groundwater in desired quantity and quality to the end user. It must be kept in mind
that an area can have different potential dependent upon the ultimate intended use of the
resource. Groundwater potential in the Molopo-Nossob Basin is therefore approach on
potential for human consumption and secondly also for livestock watering.
In the groundwater potential assessment the hydrogeological characteristics or attributes that
directly or indirectly affect the availability of what is defined as `suitable' groundwater
include the following parameters:
1. Groundwater quality
a. Total dissolved solids, TDS
b. Nitrate, NO3
c. Fluoride, F
2. Groundwater recharge potential
The groundwater quality is described over the whole Basin is described in maps showing the
distribution of the parameters TDS, NO3 and F, see Chapter 5. These groundwater maps are
reclassified with emphasis given to the limits in respect of human consumption and of
livestock watering. Table 6-1 summarized the limits used for the two categories of users.
Figure 5-51 shows the groundwater recharge assessed from chloride mass balance, CMB.
This map is reworked, see Table 6-1 and Table 6-2 for human consumption and livestock
watering respectively, in order to assess areas of different classes and to be combined with
the classes reassessed for the groundwater chemistry.
Areal distribution of the borehole yield is not assessed mainly due to the lack of reliable data
and division of the boreholes on various aquifers they represent. In Chapter 5.2, a number of
aquifer with borehole yields and aquifer Transmissivity values are compiled. These data
shows some characteristics related to the aquifers they represents, summarized in Table 6-3.
Instead of borehole yields assessed in the current project, yields given on the hydrogeological
maps from the three countries are put together in the map under Chapter 5.2 and delineated
as groundwater potential aquifers within limits set on high and medium borehole yields.
Geotechnical Consulting Services
158
Groundwater Review of the Molopo-Nossob Basin
Report No. ORASECOM/005/2009
Table 6-1
Classes and values used in the assessing of groundwater potential in the Molopo-Nossob Basin (human
consumption)
Parameter Class
Value
Remarks
TDS
1. 450 mg/l and lower
1
Limit Class 1 Botswana
2. linear
2
3. interpretation between
3
4. upper and lower value
4
5. 2,000 mg/l and higher
5
Upper limit Class 3 Botswana
F
1. 0.7 mg/l and lower
1
Upper limit for `ideal' water
2. linear
2
3. interpretation between
3
4. upper and lower value
4
5. 1.5 mg/l and higher
5
WHO guideline upper limit
NO3
1. 27 mg/l and lower
1
Target quality upper limit (South
2. linear
2
Africa)
3. interpretation between
3
4. upper and lower value
4
5. 45 mg/l and higher
5
WHO guideline limit
Recharge
1. 5 mm/a and higher
1
Limit set in the current report
2. linear
2
3. interpretation between
3
4. upper and lower value
4
5. 0.2 mm/a and lower
5
In the process of reclassify and reassess the data, the distribution of the three groundwater
quality parameters, TDS, F and NO3 were used as presented in Figure 5-12, 5-15, and 5-17.
Over the special distribution a grid-net of 0.2 geographical degrees spacing, see Figure 6-1,
were overlaid and the values at the interconnection points were used in the reassessment
process.
Table 6-2
Classes and values used in the assessing of groundwater potential in the Molopo-Nossob Basin
(livestock watering)
Parameter
Class
Value
Remarks
TDS
1. 2,000 mg/l and lower
1
Limit Class 1 Botswana
2. linear
2
3. interpretation between
3
4. upper and lower value
4
5. 10,000 mg/l and higher
5
Upper limit Class 3 Botswana
F
1. 2 mg/l and lower
1
2. linear
2
3. interpretation between
3
4. upper and lower value
4
5. 6 mg/l and higher
5
NO3
1. 100 mg/l and lower
1
2. linear
2
3. interpretation between
3
4. upper and lower value
4
5. 180 mg/l and higher
5
Limit for Botswana
Recharge
1. 5 mm/a and higher
1
3
2. linear
2
3
3. interpretation between
3
3
4. upper and lower value
4
3
5. 0.2 mm/a and lower
5
3
Geotechnical Consulting Services
159
Groundwater Review of the Molopo-Nossob Basin
Report No. ORASECOM/005/2009
Table 6-3
Characteristics from the borehole yield and Transmissivity distribution diagrams in Chapter 5.2
Aquifer
Area
Success
Median yield
▒Standard dev/
rate %
m3/h
median yield
Kalahari
Botswana
60
1.7
3.7
Kalahari
SAB
100
4.0
2.0
Basalt
SAB
100
3.7
1.8
Ntane
Ncojane
100
9.6
1.9
Ecca
Dutlwe
100
13.2
2.1
Ecca
Kang
100
28.6
1.6
Ecca
Bokspits
60
2.1
7.7
Ecca
Ncojane
100
36.0
1.6
Ecca
SAB
100
5.1
2.2
Nossob
SAB
70
3.6
0.9
Dwyka
Bokspits
40
0.4
14.6
Olifantshoek
Botswana
75
4.3
7.4
Dolomite
Kanye
100
45.3
0.6
Botswana, Southern
Gneisses
95
3.2
District *
*=Source: DWA, 1991
-22░S
-23░S
-24░S
-25░S
-26░S
-27░S
-28░S
17░E
18░E
19░E
20░E
21░E
22░E
23░E
24░E
25░E
26░E
Figure 6-1
Grid-net of 0.2o distance over the Molopo-Nossob Basin to achieve values inn points of chemical and
recharge data
Geotechnical Consulting Services
160
Groundwater Review of the Molopo-Nossob Basin
Report No. ORASECOM/005/2009
6.2 Resources
In Chapter 5.2, areas are delineated in which the values for TDS, NO3 and F are higher than
the guideline values. These areas are also showed together as overlays in Figure 5-6 and
Figure 5-7 for human consumption and livestock watering respectively. These areas are
given an indicator each and in Figure 6-2 these indicators are overlaid to show areas in which
one or more of the guideline values are exceeded for human consumption and livestock
watering respectively.
-22░S
-22░S
Livestock Watering
Gobabis
Human Consumption
Gobabis
Windhoek
Windhoek
-23░S
Ncojane
-23░S
Ncojane
Aminuis
Kang
Aminuis
Kang
Hukuntsi
Hukuntsi
-24░S
-24░S
Stampriet
Stampriet
Gochas
Gochas
-25░S
Werda
-25░S
Werda
Goodhope
Goodhope
3
Tosca
Mmabatho
Tosca
Mmabatho
Tsabong
Tsabong
-26░S
-26░S
Aroab
Aroab
Bokspits
Vanzylsrus
Bokspits
Vanzylsrus
2
-27░S
2
-27░S
Kuruman
Kuruman
-28░S
-28░S
1
1
17░E
18░E
19░E
20░E
21░E
22░E
23░E
24░E
25░E
26░E
17░E
18░E
19░E
20░E
21░E
22░E
23░E
24░E
25░E
26░E
Figure 6-2
Number of chemical guideline for human consumption and for livestock watering exceeded in the
Molopo-Nossob Basin (indicator maps)
The limits for groundwater recharge set at 0.2 mm/a can serve as an additional indicator and
together with the three chemical indicators, two new set of maps are produced, Figure 6-3.
-22░S
Human Consumption
-22░S
Gobabis
Livestock Watering
Windhoek
Gobabis
Windhoek
-23░S
Ncojane
-23░S
Ncojane
Aminuis
Kang
Aminuis
Kang
Hukuntsi
Hukuntsi
-24░S
Stampriet
-24░S
Stampriet
Gochas
Gochas
-25░S
Werda
-25░S
Werda
4
Goodhope
Goodhope
Tosca
Mmabatho
Tosca
Mmabatho
Tsabong
3
Tsabong
-26░S
-26░S
3
Aroab
Bokspits
Vanzylsrus
Aroab
Bokspits
Vanzylsrus
-27░S
-27░S
2
2
Kuruman
Kuruman
-28░S
-28░S
1
1
17░E
18░E
19░E
20░E
21░E
22░E
23░E
24░E
25░E
26░E
17░E
18░E
19░E
20░E
21░E
22░E
23░E
24░E
25░E
26░E
Figure 6-3
Number of chemical guideline for human consumption and for livestock watering exceeded and
recharge of 0.2 mm/a not achieved in the Molopo-Nossob Basin (indicator maps)
The maps presented in Figure 6-2 and Figure 6-3 are indicator maps, that means they
indicate areas where water quality (and/or recharge) are above (or below) one or several of
the guidelines put forward. Another way to assess the potential is to give different value to
the parameters considered (chemical parameters and recharge) as proposed in Table 6-1. This
means that even if a parameter at one grid point is better than the lowest value given (one) it
is given the value one. The same if it is over the maximum value of five, it will be given five.
In between these two values however the parameter will be given the calculated value in
accordance with Table 6-1.
Geotechnical Consulting Services
161
Groundwater Review of the Molopo-Nossob Basin
Report No. ORASECOM/005/2009
Results from the value assessments are given in Figure 6-4 for the chemical parameters taken
together with the same weight (weight one for each of them). Including the recharge, also
with the weight one, the results are presented in Figure 6-5.
-22░S
-22░S
Gobabis
Human Consumption
Gobabis
Livestock Watering
Windhoek
Windhoek
-23░S
Ncojane
-23░S
Ncojane
Aminius
Kang
Aminuis
Kang
Hukuntsi
Hukuntsi
-24░S
-24░S
Stampriet
Stampriet
14
Gochas
Gochas
-25░S
14
Werda
-25░S
Werda
12
Goodhope
Goodhope
12
Tosca
Mmabatho
Tosca
Mmabatho
10
Tsabong
Tsabong
-26░S
-26░S
10
8
Aroab
Bokspits
Vanzylsrus
8
Aroab
Bokspits
Vanzylsrus
-27░S
-27░S
6
Kuruman
6
Kuruman
4
4
-28░S
-28░S
2
2
17░E
18░E
19░E
20░E
21░E
22░E
23░E
24░E
25░E
26░E
17░E
18░E
19░E
20░E
21░E
22░E
23░E
24░E
25░E
26░E
Figure 6-4
Values for the groundwater chemistry in accordance with Table 6-1
-22░S
-22░S
Livestock Watering
Gobabis
Human Consumption
Gobabis
Windhoek
Windhoek
-23░S
Ncojane
-23░S
Ncojane
Aminuis
Aminuis
Kang
Kang
Hukuntsi
Hukuntsi
-24░S
-24░S
Stampriet
Stampriet
Gochas
20
Gochas
14
-25░S
-25░S
Werda
Werda
18
Goodhope
Goodhope
12
16
Tosca
Mmabatho
Tosca
Mmabatho
Tsabong
Tsabong
-26░S
-26░S
10
14
12
Aroab
8
Aroab
Bokspits
Vanzylsrus
Bokspits
Vanzylsrus
-27░S
10
-27░S
Kuruman
6
Kuruman
8
4
-28░S
6
-28░S
2
4
17░E
18░E
19░E
20░E
21░E
22░E
23░E
24░E
25░E
26░E
17░E
18░E
19░E
20░E
21░E
22░E
23░E
24░E
25░E
26░E
Figure 6-5
Values for the groundwater chemistry and recharge in accordance with Table 6-1
Combining the value maps, the indicator maps and the map showing the potential aquifers
(Figure 5-11) the most promising aquifers can be distinguished. In these aquifers, no limit on
water quality should be exceeded, which leaves out a large area of Botswana for livestock
watering, see Figure 5-20. Also part of the Gordonia area in South Africa and the area along
the Auob River up to east of Gochas have values exceeding the guidelines.
The area useful for livestock watering without exceeding the guidelines for any of the three
studied components is shown in Figure 6-4 as the area having an assigned value of less than
6. The westernmost and the major part of the eastern part of Botswana and the major part of
Namibia and more or less the whole South Africa, with exception of the Gordonia part have
suitable water for livestock watering When the set guidelines, in this report, of recharge
exceeding 0.2 mm/a, is included as an additional indicator, the area `unsuitable' for livestock
watering becomes larger, see Figure 6-5.
Geotechnical Consulting Services
162
Groundwater Review of the Molopo-Nossob Basin
Report No. ORASECOM/005/2009
For human consumption, the areas in which one or more of the chemical guidelines were
exceeded is shown in Figure 6-2 and 6-3 (indicator maps) and Figure 5-19. The limit for
TDS is here set at 2,000 mg/l and large part of Botswana is excluded. Also excluded is the
area along the Auob River, what is also called the `salt block' and the Gordonia area in South
Africa? Also an area northwest of Stampriet (Kirkland) has water exceeding one or two of the
guidelines considered. When the limit of recharge exceeding 0.2 mm/a, Gardenia and part of
southern Namibia Molopo-Nossob Basin are excluded together with the main part of
Botswana In Botswana only the eastern part and the north-western most part have favourable
condition for the groundwater.
The indicator maps should be used when the restrictions on water are hard. Using the value
assigned to the groundwater chemistry, means that in an area, the limit value according to the
guideline could be exceeded for one parameter but the other parameters are so good that the
sum value will become reasonable. In such cases, treatment of the water on the parameter
exceeding the guidelines is one option for consider the water as potential for consumption.
Regarding the quantity of the groundwater, the map based on the borehole yields serves as a
way to assess this parameter. In combination the following points are shown:
Ę The best yielding dolomite aquifers have no limits due to groundwater quality and
recharge (as defined in the current report)
Ę The aquifers assigned as median borehole yields in fractured, fissured and certified
formations have water quality parameters exceeding the guidelines in the Gardenia
area and along the Molopo River course and also in Botswana.
Ę The intergranular and fractured aquifer assigned high borehole yield has good
chemical parameter in the Ncojane area.
Ę The intergranular and fractured aquifer assigned median borehole yield have all one
or more chemical parameter exceeding the guideline limits with the exception of in
the northern part of Namibia.
Ę The intergranular aquifers with assigned high borehole yields have the best quality in
the Stampriet, the Ncojane and the Kang area.
Ę The intergranular aquifers with assigned median borehole yields have the best quality
in Namibian part of the Molopo-Nossob Basin and in the western part of Botswana.
In order to develop a groundwater resource, drilling of boreholes is required. The depth to the
groundwater level will not always tell the drilling depth required since in many places in the
Molopo-Nossob Basin artesian aquifer is encountered, especially in the Stampriet Artesian
Basin in Namibia. Figure 6-6 shows the depth to the groundwater level established from the
groundwater level map, Figure 5-46 and the ground surface level map Figure 2-5.
Geotechnical Consulting Services
163
Groundwater Review of the Molopo-Nossob Basin
Report No. ORASECOM/005/2009
-22░S
Gobabis
Windhoek
-23░S
Ncojane
Aminius
Kang
Hukuntsi
-24░S
Stampriet
500
Gochas
-25░S
Werda
150
Goodhope
Tosca
Mmabatho
Tsabong
-26░S
100
80
Aroab Bokspits Vanzylsrus
-27░S
60
Kuruman
Depth to
Groundwater
40
-28░S
Level
m
20
17░E
18░E
19░E
20░E
21░E
22░E
23░E
24░E
25░E
26░E
Figure 6-6
Depth to the groundwater level. Map constructed from the ground surface map and the groundwater
level map given in this report
Geotechnical Consulting Services
164
Groundwater Review of the Molopo-Nossob Basin
Report No. ORASECOM/005/2009
7 INTEGRATED GIS BASED SUB-BASIN INFORMATION
SYSTEM
7.1 Background
The Molopo-Nossob Basin is a sub-basin in the Orange-Senqu whole river catchment area.
The basin covers three countries, each of them with approximately equal shares of the area
cover. In population there is however a large difference as highlighted in Chapter 2 and 3.
The development on information and the amount of information differ between the countries.
For the understanding of the groundwater situation and for planning and implementation of
future water and environment related activities, there is a need to share the data between the
three countries. The integration of both databases and the exchange facilities requires that
information systems within the countries are compatible.
A proposal to facilitate the exchange of data as well as possible integration will be a GIS data
storage and management system. The system should have capabilities to be used as an
information centre for the basin in order to provide rapid responses to groundwater evaluation
and modeling of the sub-basin and facility for dissemination and exchange of data within the
states.
7.2 Elements in an integrated database system
The most important element in integrating data from country database is similar field naming
of data tables. There are currently no naming standards set or used in the basin countries as
such each country data table for similar feature has different field names. Initial data that is
required for regional groundwater monitoring are:
Ę Monitoring Ł water levels and abstraction
Ę Chemistry Ł TDS, nitrates and fluoride
Ę Hydrogeology map
All these information are tied to a borehole number, and for each country database consisting
of general borehole information is using different field names, used different formats (i.e.
text, numbers) for this field, thus making integration of the data tables difficult. Therefore
editing of the data tables is required prior to integration. Furthermore fields used in water
level monitoring tables are different except for the water level field, for Botswana for
instance the date and time are captured in one field while in South Africa they are separate
fields.
Currently none of the country database is internet based which means to get data from one
database, there will have to be an individual in the respective country contacted to send the
required data.
Geotechnical Consulting Services
165
Groundwater Review of the Molopo-Nossob Basin
Report No. ORASECOM/005/2009
7.3 Existing databases
7.3.1 Botswana
Groundwater monitoring in Botswana is done by numerous governmental organisations and
the various databases are currently not properly linked. The main databases used for
groundwater monitoring are handled by the Department of Water Affairs and are stored in the
following stand-alone databases:
Ę National Borehole Archive (NBA) database - General borehole information
Ę WELLMON database Ł stores water level monitoring from production and observation
boreholes, rainfall and reservoir readings
Ę AQUABASE database - Water quality
An example of data tables from the above mentioned databases are shown in Table 7-1, 7-2
and 7-3.
Table 7-1
Summary of Borehole data table
Field
Value
Borehole Number
5276
Completion date
02/02/55
Depth (mbgl)
76
Drilled diameter (mm)
0 Ł 76m : 152
Casing interval (m)
0 Ł 5m
Casing diameter (mm)
152
Casing type
Plain steel
Water strike (mbgl)
61
Estimated yield (m3/h)
1
SWL (mbgl)
57.91
Geology
0 Ł 5m: Soil
5 Ł 8m: Sandstone
8 Ł 76m: Shale
Geological formation
Recent Deposits
Recent Deposits
Upper Tlapana
Comments
Table 7-2
Groundwater monitoring data table
Bh_No
OnDate
Dry
Water_level (m)
Technician
Comment
5276
3/4/1993 8:00
FALSE
9.67 Fred
Table 7-3
Water quality data table
Field
Value
Field
Value
BH_NUM
5299
CL
532.3
DISTRICT
CENTRAL
SO4
119.7
VILLAGE
DUKWI
NO3
4.5
LOCATION
NJUUTSHA
F
0.79
DATETEST
1/18/1994
NA
425.0
PH
7.45
K
7.0
Geotechnical Consulting Services
166
Groundwater Review of the Molopo-Nossob Basin
Report No. ORASECOM/005/2009
Field
Value
Field
Value
EC
2818
CA
76.9
TDS
1758
MG
23.1
CO3
FE
0.03
HCO3
483
MN
All these databases are not linked to each other and at the moment they are not internet based
but the Department is in the process of migrating the databases to National Geological
Information System (NGIS) which will be internet based.
Other groundwater databases are summarized in Table 7-4. Data are also found at the Central
Statistics Office. These data are mainly from the databases mentioned in Table 7-4; however
these are manipulated and evaluated by the Botswana Government Statistician. Other
databases are found at the major non-governmental organisations which have been given
permit for water abstraction and requirements to monitor their abstraction and water levels.
Table 7-4
Databases carrying groundwater information in Botswana
Department or organization
Database
Information
DWA and DGS
National Borehole Archive
Boreholes.
Location,
construction,
yield
and
formation
DWA and DGS
Wellmon
Groundwater level data from
abstraction
and
observation
boreholes
DWA (O&M division)
Water abstraction major villages Abstraction from individual
boreholes on monthly basis
District offices
Water abstraction rural villages
Abstraction from individual
boreholes on monthly basis
DWA, DGS, DEA, WUC and Aqua base, Water quality
Results of water chemical and
BOBS.
biological analyses
DWA (Groundwater division)
Test pumping data
Tested yield, drawdown and
aquifer hydraulic parameters
DGS
NGIS
All
kind
of
information
regarding geology and location
DEA
Environmental database
Environmental data
7.3.2 Namibia
In Namibia the groundwater database is GROWAS hosted in the Ministry of Agriculture,
Water and Rural Development in Namibia, see Figure 7-1. The database deals with
information from boreholes consisting:
Ę General Borehole Information
Ę Water Analysis
Ę Groundwater Monitoring
Ę Hydraulic Testing
Ę Geophysical Siting
Geotechnical Consulting Services
167
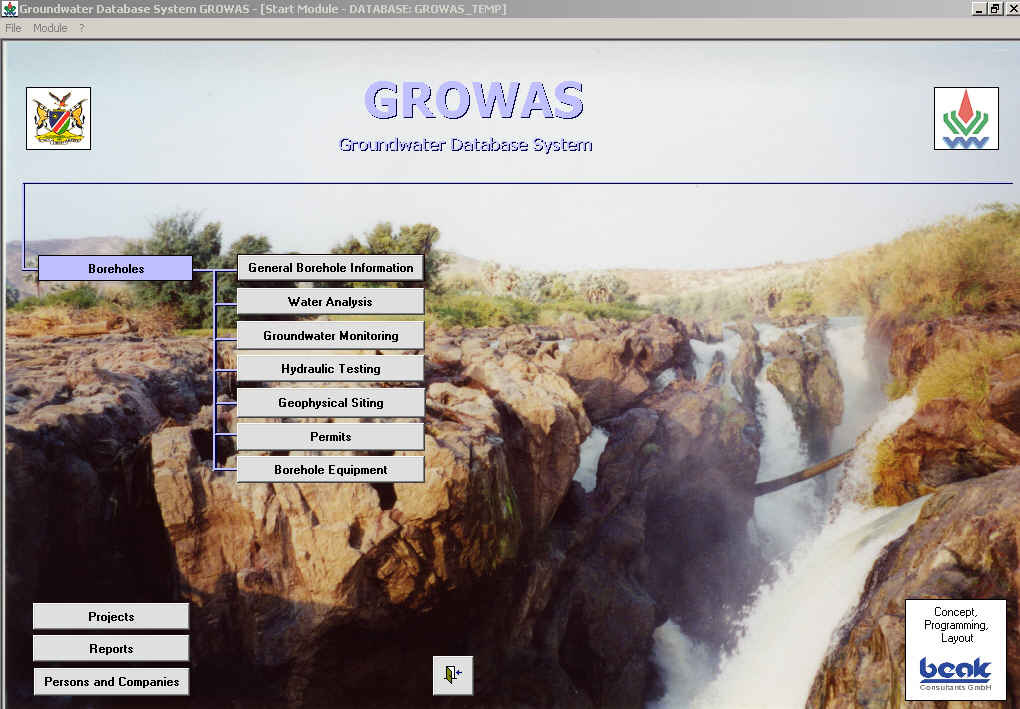
Groundwater Review of the Molopo-Nossob Basin
Report No. ORASECOM/005/2009
Ę Permits
Ę Borehole Equipment
The database is not internet based, but is available within intranet at the Department of Water
affairs. These information tables are linked by borehole number. The database also contains
documents archive. Spatial aspect of boreholes and the lithology is based on the GEODIN
database system.
The GROWAS front end is implemented in MICROSOFT Visual Basic 6.0, the database
itself is running on MICROSOFT SQL Server 2000 (Figure 7-1). The data model was
designed by the Division Hydrogeology who is also the custodian of the database.
Figure 7-1
The GROWAS database front-end page
An example of data forms from GROWAS databases are shown in Figures 7-1, 7-2 and 7-3.
Geotechnical Consulting Services
168
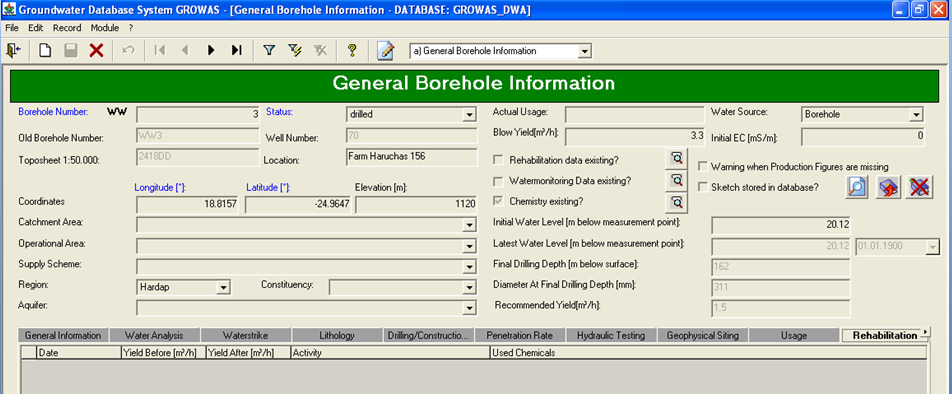
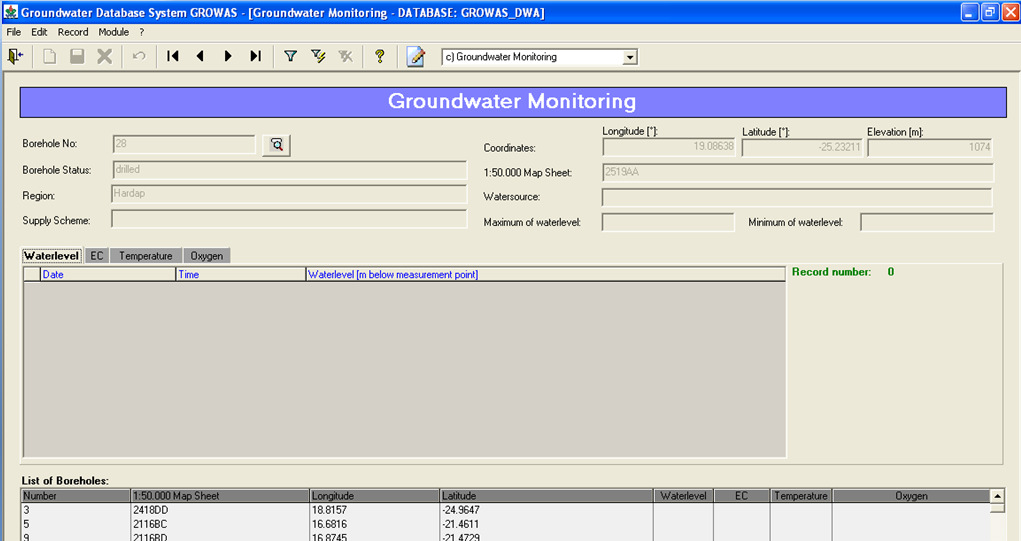
Groundwater Review of the Molopo-Nossob Basin
Report No. ORASECOM/005/2009
Figure 7-2
The GROWAS database - General Borehole Information form
Figure 7-3
The GROWAS database - Groundwater Monitoring form
Geotechnical Consulting Services
169
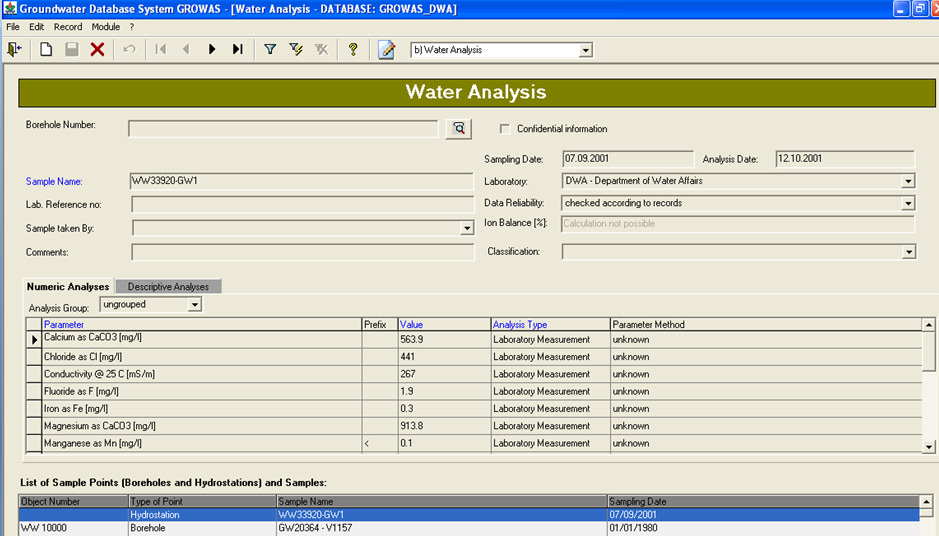
Groundwater Review of the Molopo-Nossob Basin
Report No. ORASECOM/005/2009
Figure 7-4
The GROWAS database Ł Water Analysis form
7.3.3 South Africa
Hydrogeology Databases and Information Systems for Department of Water Affairs (DWAF)
in South Africa consists of several databases that all contain relevant groundwater and
groundwater-related data (Ernst, 2007). The databases contained include the following:
Ę National Groundwater Archive - NGA [other groundwater sources that are not
boreholes]
Ę Borehole information database - Open-NGDB [General borehole information]
Ę Water Management System - WMS [Water quality data]
Ę Water monitoring database - Hydstra [borehole time-series data]
Ę Reports database Ł GH Reports database [Hydrogeology reports archived by
Department of Water Affairs national and regional offices]
Ę Geo Info base Ł Groundwater data Spatial database
Ę General spatial database Ł SLIM [Spatial and Land Information Management]
Ę CHART Ł Analysis tool using data from WMS
Ę WARMS Ł a database containing all information on licensing/registration of water
use (not linked to DWAF databases)
The database is not internet based, but is available within intranet at the Department of Water
affairs. These information tables are linked by site identifier.
Geotechnical Consulting Services
170
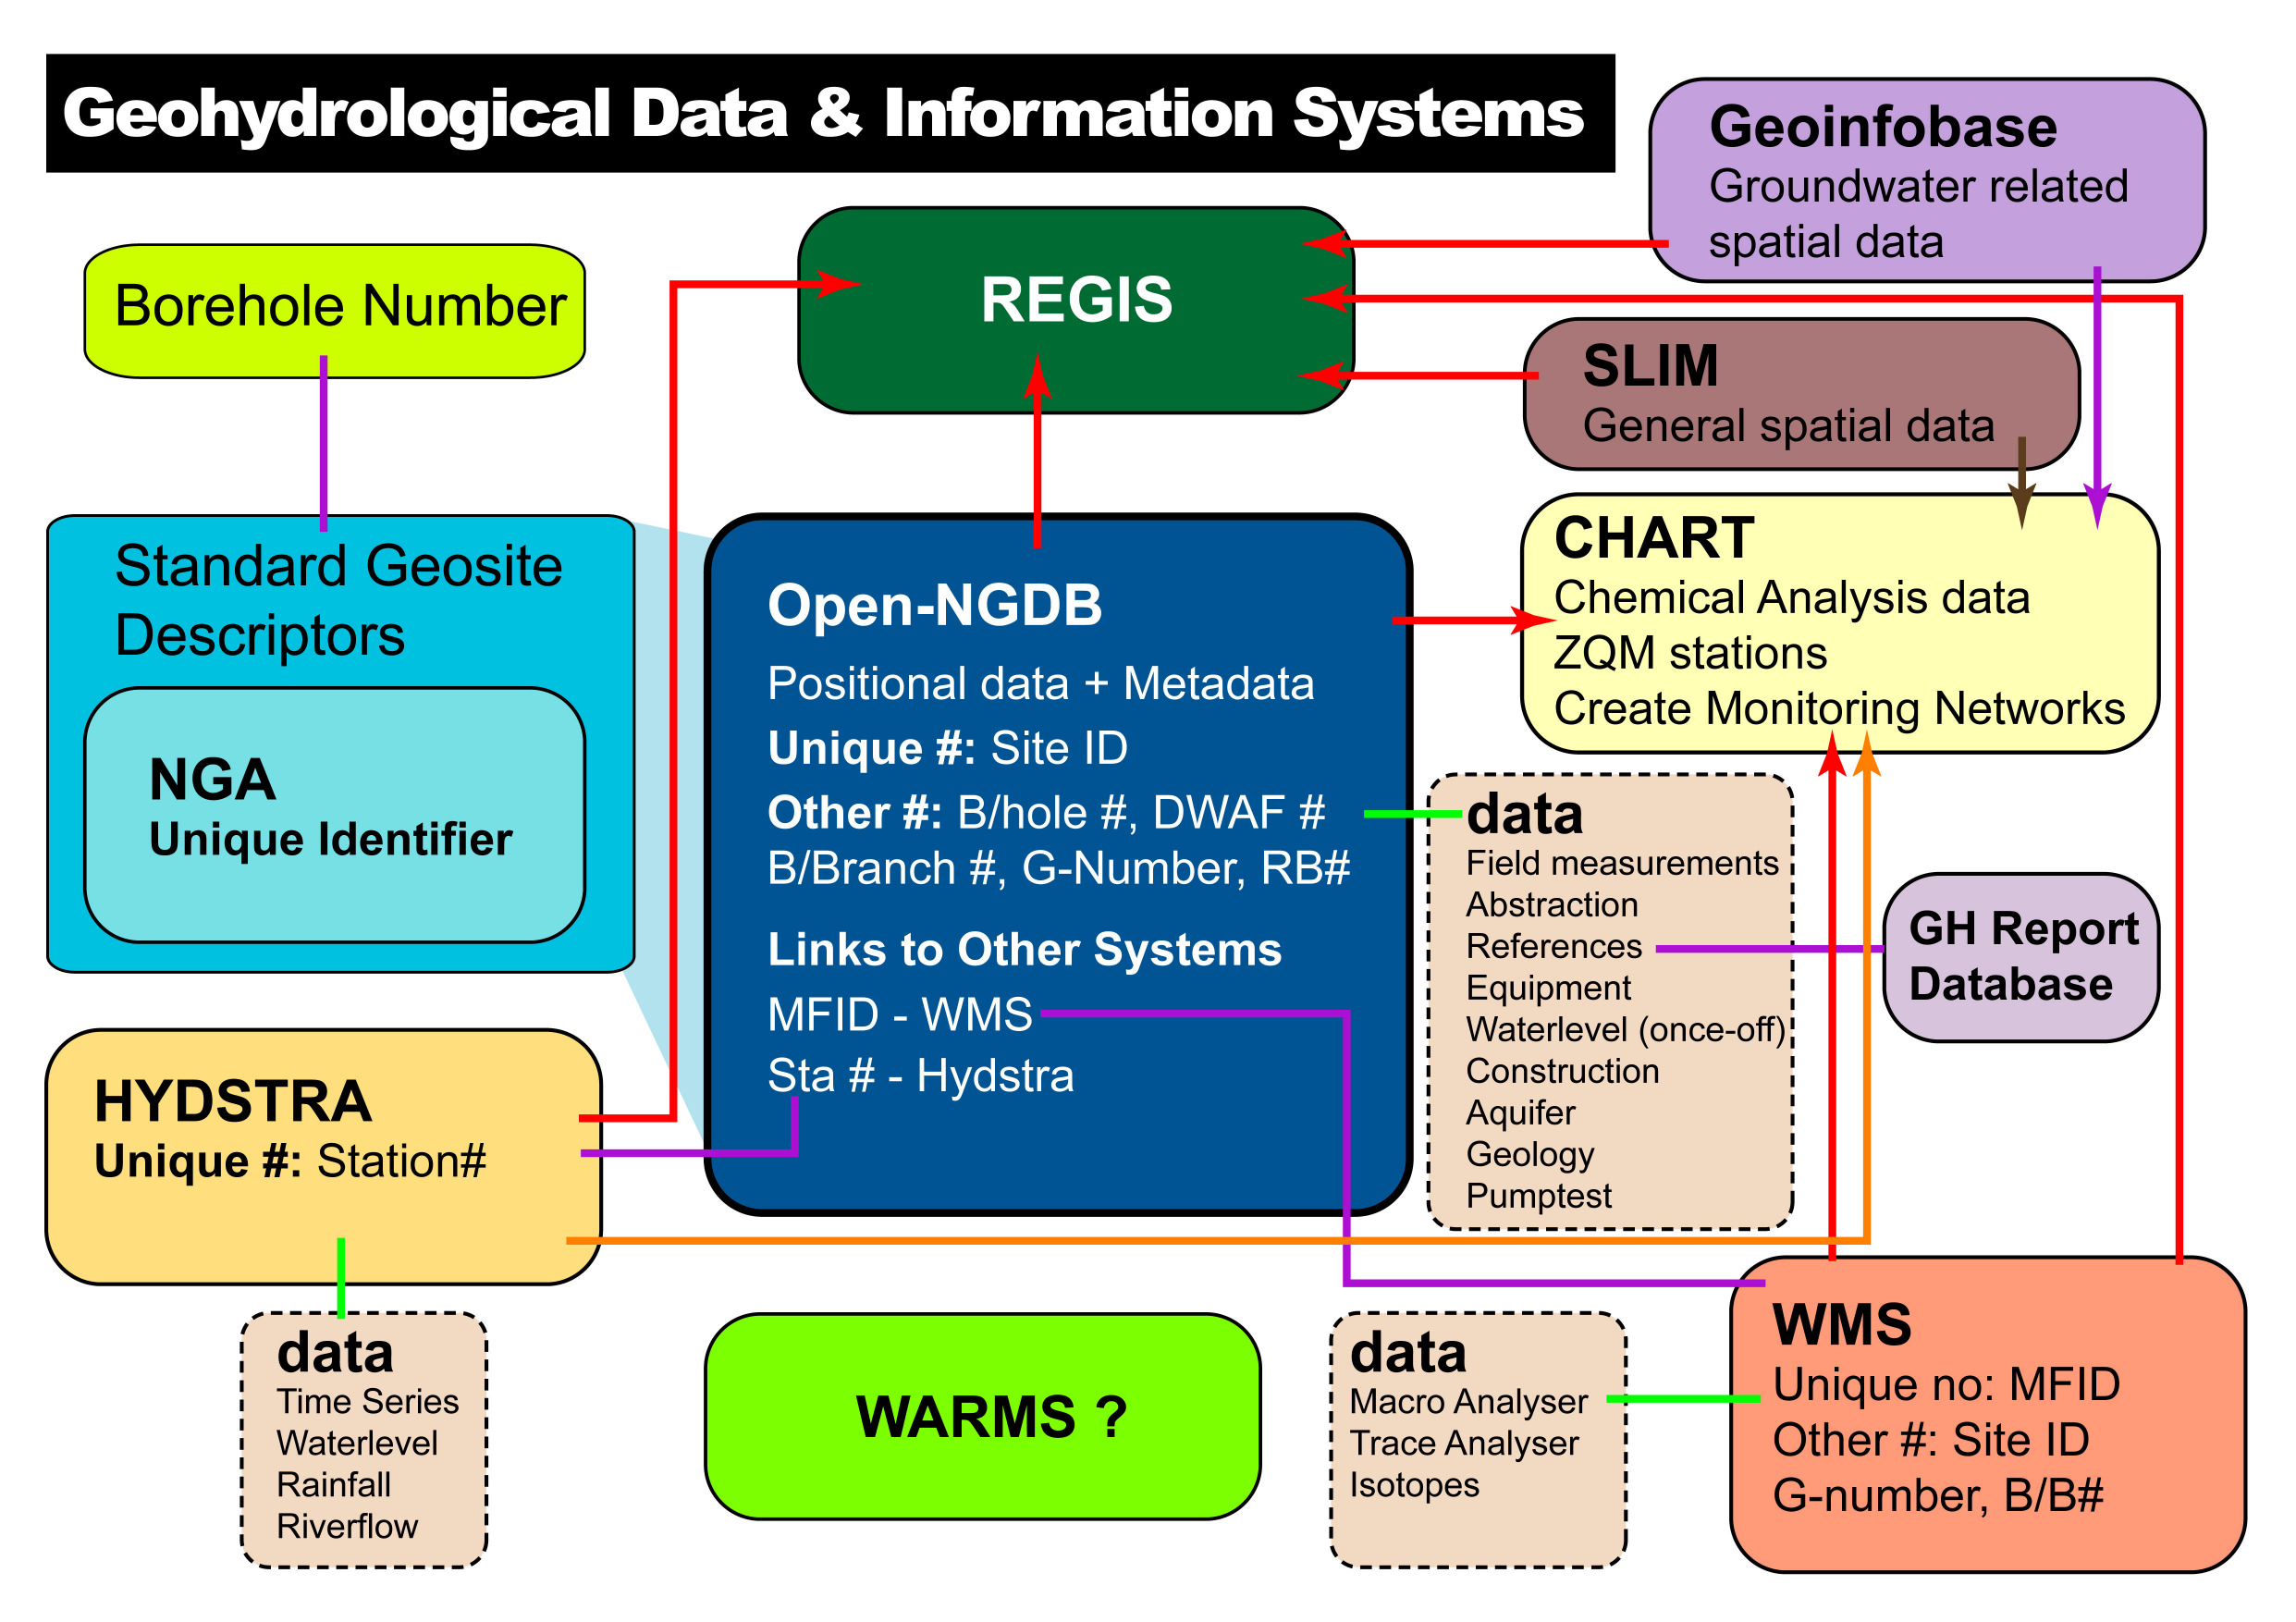
Groundwater Review of the Molopo-Nossob Basin
Report No. ORASECOM/005/2009
The database is running on INFORMIX, with front-end implemented on DELPHI. The data
model for the database is shown in Figure 7-5 (Draft this model still under development).
Figure 7-5
Model for the Databases in South Africa (E. Bertman, DWAF, 2007)
An example of data tables from the databases are shown in Tables 7-5, 7-6, 7-7 and 7-8.
Table 7-5
Basic site information/borehole data table
Field
Value
Field
Value
Site id
2321CC00035
Longitude
21.13333
No on map
35
Co-or Acc
2
Orig. site name
AVONDS SCHIJN
Altitude
870
Drainage reg.
D410
Site status
G
Map no
2621CC
Site purpose
P
Site type
B
Rep inst
DBMI
Latitude
-26.8722
Equip
Q
Portability
G
Table 7-6
Other borehole identifier used
Site id
Other id
Other id type
Assignor
2520AA00001
KGP36
DWAF
VAN WYK; E
2520AA00001
PJS65
DWAF
SMIT; PJ
Geotechnical Consulting Services
171
Groundwater Review of the Molopo-Nossob Basin
Report No. ORASECOM/005/2009
Table 7-7
Water level data table
Time measured
Site id
Date measured
Water level
Method
Status
(hh mm)
2520AA00001
19861120
1200
62.72 E
S
2520AA00002
19640205
1200
58.5 E
S
Table 7-8
Water quality table
Field
Value
Field
Value
Monitoring Point ID
84961
Na-Diss-Water Result
3.91
Monitoring Point Name 2525DB00395
PO4-P-Diss-Water
0.014
TWEEFONTEIN
Result
UPPER (A1G003) -
WR70
Latitude
-25.5454
SO4-Diss-Water
5.243
Result
Longitude
25.9408
Si-Diss-Water Result
5.399
Located on Feature 2525DB00395
TAL-Diss-Water
204.958
Name
TWEEFONTEIN
Result
UPPER (A1H003) -
WR70
Located on Type
Spring/Eye
TEMP-Phys-Water
Result
Drainage Region Name A10A
pH-Diss-Water Result
8.348
Feature
Reference
Al-Diss-Water Result
Code
Monitoring Active
No
As-Diss-Water Result
Sample Start Date
########
B-Diss-Water Result
Sample Start Time
10:00:00
Ba-Diss-Water Result
Sample End Date
Be-Diss-Water Result
Sample End Time
Cd-Diss-Water Result
Time Interval
Co-Diss-Water Result
Sample Start Depth
Cr-Diss-Water Result
Sample End Depth
Cu-Diss-Water Result
Depth Interval
Fe-Diss-Water Result
Preservative
HGCL2
Hg-Diss-Water Result
Action Type
Sample
Mn-Diss-Water Result
Ca-Diss-Water Result
43.243
Mo-Diss-Water Result
Cl-Diss-Water Result
6.59
Ni-Diss-Water Result
DMS-Tot-Water Result 337.031
Pb-Diss-Water Result
EC-Phys-Water Result
39.9
Sr-Diss-Water Result
F-Diss-Water Result
0.132
Ti-Diss-Water Result
K-Diss-Water Result
0.15
V-Diss-Water Result
Mg-Diss-Water Result
23.714
Zn-Diss-Water Result
NH4-N-Diss-Water
0.091
Zr-Diss-Water Result
Result
NO3+NO2-N-Diss-
0.902
Water Result
Geotechnical Consulting Services
172
Groundwater Review of the Molopo-Nossob Basin
Report No. ORASECOM/005/2009
7.4 Meta database
Metadata is defined as "Data about Data". Metadata is descriptive information about an
object or resource whether it is physical or electronic. While the term "metadata" is relatively
new, the underlying concepts behind metadata have been in use for as long as collections of
information have been organized. For example, library card cata logs represent a well-
established type of metadata that has served as collection management and resource
discovery tools for decades. Metadata is information that describes data (the content, quality,
condition, and other characteristics of data). Metadata contains information about the data
such as; fitness for use of a particular dataset, that a user knows where the data came from,
how it was captured, how up-to-date it is, at what scale it was captured and what is its
accuracy, etc. However Metadata do not, in any way, represent the actual content of the data
they only describe the data.
Generating metadata if not initiated by the data custodian is a task on its own. The task is
more daunting when attempting to generate a huge volume of metadata without knowing the
data, its usage, its background knowledge, and its accuracy. Challenges in generating this
metadata included the fact that data sets are scattered, they are not documented, most of data
custodians were not involved in generating the data (either due to originator having left the
departments, or data generated by consultants). Other challenges associated with generation
of metadata are:
The Molopo-Nossob basin metadata consisting of spatial and non-spatial data has been
developed in MS Access. The metadata is based on ISO1915 standard. The metadata
elements and their definitions are listed in Table 7-9:
Table 7-9
Metadata elements
Name
Definition
Title
The name by which the cited resource is known
Alternate Title
An alternative name used for the sited resource
Originator
The organisation that created the original resource
Abstract
Brief narrative summary of the content of the resource
Date Stamp
The date that the metadata was created
Dataset Reference Date
Date when resource was created
Presentation Type
How is the resource presented (document, image, etc)
Access Constraint
Restrictions related to accessing the resource
Use Constraint
Restrictions related to using the resource
Topic Category
Main theme(s) of the dataset
West Bounding Coordinate
Western-most coordinate of the limit of the dataset extent,
expressed in longitude in decimal degrees (positive east)
East Bounding Coordinate
eastern-most coordinate of the limit of the dataset extent,
expressed in longitude in decimal degrees (positive east)
North Bounding Coordinate
Northern-most coordinate of the limit of the dataset extent,
expressed in latitude in decimal degrees (negative north)
South Bounding Coordinate
southern-most coordinate of the limit of the dataset extent,
expressed in longitude in decimal degrees (negative north)
Spatial Reference System
Name or description of the system of spatial referencing, whether
by coordinate or geographic identifiers, used in the dataset
Spatial Resolution
Factor which provides a general understanding of the density of
Geotechnical Consulting Services
173
Groundwater Review of the Molopo-Nossob Basin
Report No. ORASECOM/005/2009
Name
Definition
spatial data in the dataset
Extent
Extent covered by resource
Additional Information Source
Identification of, and means of communication with, person(s)
and organisations associated with the dataset
Sample of Dataset
An image of the resource
Metadata language
Language used for documenting metadata
Spatial Reference Type
Method used to spatially represent geographic information
Lineage
Information about the events or source data used in constructing
the data specified by the scope or lack of knowledge about
lineage
Online Resource
Address for accessing resource via internet
Populating all these elements for existing data was not exhaustive because where data had
exchanged numerous hands it was impossible to get detailed information. Of the three
countries only Namibia and South Africa had metadata for some of the datasets. However the
elements used do not cover all of the elements proposed for this project. The list of metadata
records is attached in Appendix - II. This list only shows the Title, Abstract and Topic
category defined in Table 7.9. The full details of the meta database is contained in the MS
Access database and also in the Metadata application.
The actual data is linked to allow users to have access to data. Where the size of the linked
datasets are big, these have been compressed and are attached as zip files (*.zip) which will
need to be decompressed before opening the files. For map files, that is Arc view files, these
have a number of file extensions all belonging to one layer (*.dbf, *.sbn, *.sbx, *.shp, *.shx,
*.xml and *.prj).
7.5 Proposal for storage and exchange of information
7.5.1 Separate databases
To ensure that data is handled by the professionals, the information system should consist of
separate databases as currently done by the basin states. This will allow the relevant
professionals in the basin states to post data to a relevant database within the basin
information system. As none of the country databases are internet based, there is never going
to be a situation where data will be harvested remotely by ORASECOM, it will have to be
through contact with country database managers. It will be best if such data when received at
ORASECOM is saved under relevant database for ease of use with similar data from the
basin countries.
7.5.2 Data integration
Database integration is possible which will allow the data from Namibia, Botswana and
South Africa to be brought together in one table. A system will have to be developed which
will import data tables from the various databases through export files that can either be in
Comma Separated Value (CSV) Files or through Microsoft Excel or SQL Server Database
Transfer or any other common data transfer and integration medium.
Geotechnical Consulting Services
174
Groundwater Review of the Molopo-Nossob Basin
Report No. ORASECOM/005/2009
It is proposed that the Integrated Database will import an initial CSV file from each country
database to populate all records and the be able to perform a reconciliation of new records,
record updates and record deletions in order to perform periodic updates
It is proposed that the database be developed in Microsoft SQL Server technology which
facilitates for easier integration and data imports with Microsoft Excel in addition to which
the Namibian Database is based on SQL Server technology as well allowing for seamless
integration with that data. Also through Microsoft SQL Server database tools such as Data
Transformation Services (DTS) most data formats are easily importable into a SQL Server
database and can be scheduled to perform the data integration periodically as specified by the
Database Administrator who will be responsible for integrating the databases.
Figure 7-6 shows the proposed integration Table for Water Levels
Figure 7-6
Integration of water level monitoring data
Table 7-10
Integrated Water Levels Table Record Example
Water Level ID
Text
W39854
Date
dd/mm/yyyy
31/12/2009
Time
hh:mm
13:00
Longitude
decimal
19.43266
Latitude
decimal
-25.46122
Water Level
meters
37.07
Below is an example of a CSV export file record for the Integrated Water Levels Data:
W39854,31/12/2009,13:00,19.43266,-25.46122,37.07
Geotechnical Consulting Services
175
Groundwater Review of the Molopo-Nossob Basin
Report No. ORASECOM/005/2009
7.5.3 Requirements for developing basin information system
To develop and integrated database for the following requirements will have to be met:
Ę User Needs Analysis: There is need to understand the users needs in terms of their
business, what do they want to use the information system for, what information/data do
they have and how to they want to present the information (tables, graphs, maps, etc).
Ę Data Management Requirements: Secondly, is the need to have developed database and
populated them with data (selected relevant data, tested them for robustness /
ambiguity, checked that data are available at the right spatial and time scale). Before any
information system solution is designed a complete and robust set of database need to
have been developed, tested and populated with data.
Ę System Requirements, Design, Testing and Implementation: The areas that need to be
considered in the design process are: Outputs, Inputs, File Design, Hardware, and
Software. Outputs and Inputs will be determined during user needs analysis and data
requirements.
Only once these elements have been completed then, and only then, can a system be
designed to house the data. The designed will have to be appropriate to ORASECOM
requirements. The system solution needs to follow, support or be based upon the user's
needs and the database managers' abilities. That is, the system solution should not
determine the users' needs! The salient point being that the information system solution
is decided at the end of the process (once the needs and abilities are fully understood),
not at the beginning of the process. Once the system has been tested it can then be
implemented.
Ę System Documentation: To ensure smooth running of the system by any user, following
system and user documentations will have to be produced. User guides are written in
plain English rather than technical language which are used in the System documentation.
The user guide should cover how to run the system, how to enter data, how to modify
data and how to save and print reports. The guide should include a list of error messages
and advice on what to do if something goes wrong.
Geotechnical Consulting Services
176
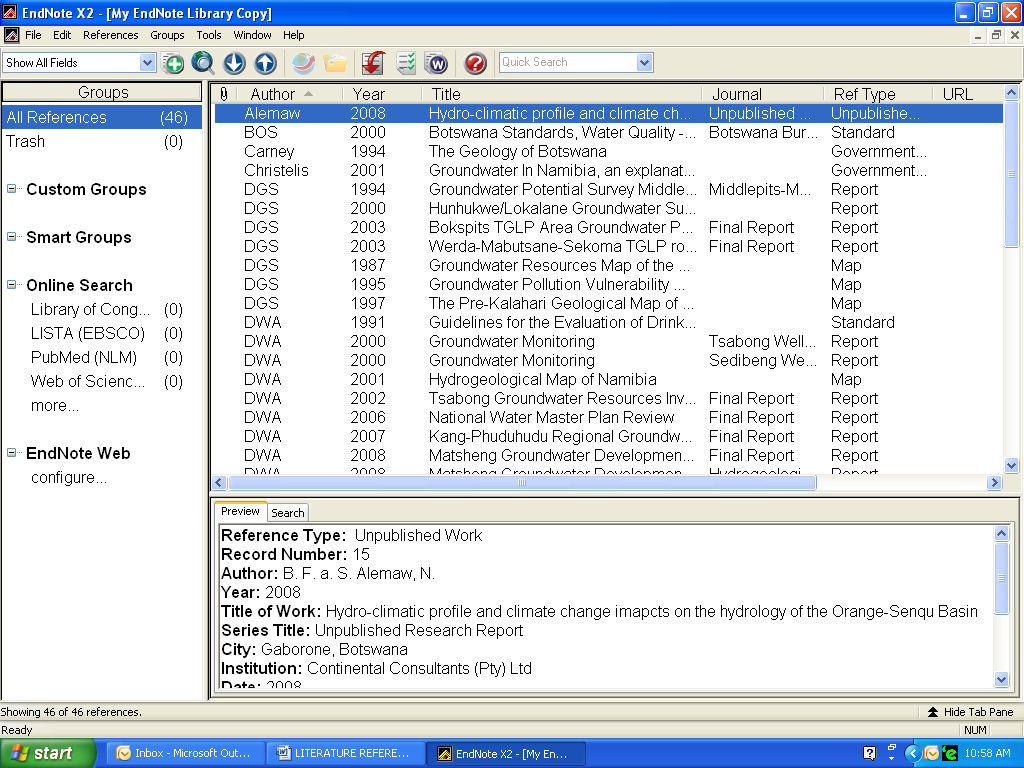
Groundwater Review of the Molopo-Nossob Basin
Report No. ORASECOM/005/2009
8 LITERATURE REFERENCES
8.1 ENDNOTE Software
In any project, research or compilation of information, access to a thorough and up to date
literature reference database is of uttermost importance. Such reference database can be set
up on personal basis or as a product to which companies, organizations or associations have
access.
ENDNOTE is software to set up, maintain and use database information based on literature
references. Once a bibliographic database is established ENDNOTE software include on line
search tools, a simple way to search and retrieve references. The software also provides the
possibility to import information from a variety of online services and databases (Figure 8-
1). ENDNOTE is specializes in storing, managing, and searching for bibliographic references
in private reference library. It can organize images including charts, tables, and figures and
assign each figure its own caption and keywords.
Figure 8-1
Overview of ENDNOTE software
The ENDNOTE software also provides different predefined 48 reference types (Figure 8-2).
The reference type table shows which fields are used in each of the different reference types.
Particular reference type can be assigned to each reference entered into a specific library.
Geotechnical Consulting Services
177
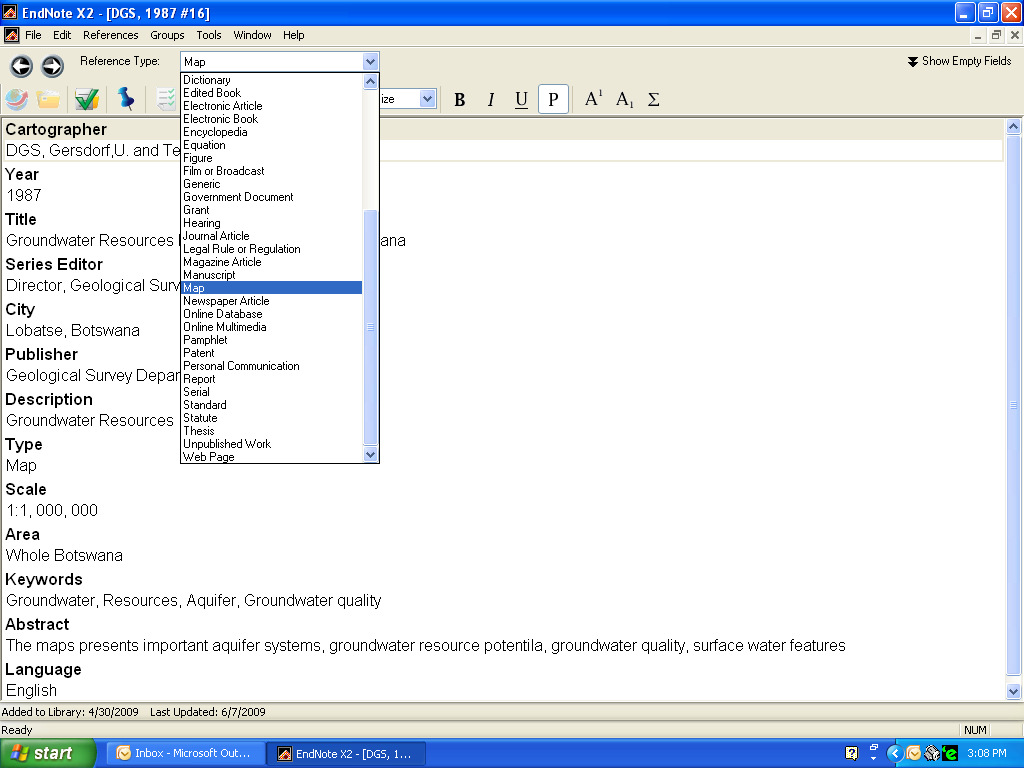
Groundwater Review of the Molopo-Nossob Basin
Report No. ORASECOM/005/2009
Figure 8-2
Reference types in the ENDNOTE Software
Collection of information is a never ending process in every project. In the current project,
information from the three member states in the Molopo-Nossob Basin, Botswana, Namibia
and South Africa, was continuously obtained from the water organizations and through
studies of various relevant literature covering the project area and the related matters.
The ENDNOTE software in the current project hosts information of about 50 relevant
documents in the form of reports, maps, guidelines and some numerical data. The main
sources of information are grouped as geographic and administrative description, Climatic
information, water requirements, hydrology, geology and hydrogeology, future development
plans. All the references used in the project area given in the reference list in Chapter 10, are
available in digital format. The bibliography prepared using library ENDNOTE software are
given as separate volume.
8.2 Geographic and Administrative Description
The Molopo River is an ephemeral tributary of the Orange Ł Senqu River system which is an
international river basin shared by Lesotho, Namibia, Botswana and South Africa. The
Molopo-Nossob sub river basin covers a wide area, from Windhoek in Namibia to Lobatse in
Botswana and Mmabatho in South Africa. The three countries in the Molopo-Nossob Basin,
Botswana, Namibia and South Africa all have their parts covered by different administrative
Geotechnical Consulting Services
178
Groundwater Review of the Molopo-Nossob Basin
Report No. ORASECOM/005/2009
units. A summary of administrative units in the three riparian states and their population has
been obtained from various government departments and consultant reports. Some of the
references are given below:
Ę Central Statistics Office (CSO), 2001. Population of Towns, Villages and Associated
localities, Government Printer, Gaborone.
Ę DWA, 2006. National Water Master Plan Review. Report prepared by Ministry of
Minerals, Energy and Water Resources, Gaborone.
Ę ORASECOM, 2008a. Feasibility Study of the Potential for Sustainable Water
Resources Development in the Molopo-Nossob. Watercourse. Final Inception Report
Ł February 2008.
Ę MAWRD, Ministry of Agriculture, Water and Rural Development, 2000. Namibia
Water Resources Management Review. Ł Reports Vol1 to 5, Windhoek. March 2000.
8.3 Climatic Information
The climatic data is collected from the Meteorological departments within the three member
states and also from the various government and consultant reports. Some of the references
are provided below:
Alemaw, B.F. and N. Sebusang. 2008. Hydro-climatic profile and climate change
impacts on the hydrology of the Orange-Senqu Basin. Unpublished Research Report
No. RR/CCL/03/08 for Continental Consultants (Pty) Ltd, Gaborone, Botswana. 44
pp + appendices
DWA, 2006. National Water Master Plan Review. Report prepared by Ministry of
Minerals, Energy and Water Resources, Gaborone.
FAO. 1993. FAO CLIMWAT for CROPWAT, CD-ROM. Agro climatic database.
Rainfall and evaporation figures. FAO. Rome.
8.4 Hydrological Information
The Molopo-Nossob River Basin hosts four major river courses, namely, Molopo, Nossob,
Auob and Kuruman Rivers. Information about the rivers is collected from various reports and
maps. Some of the references are listed below:
ORASECOM, 2008. Feasibility Study of the Potential for Sustainable Water
Resources Development in the Molopo-Nossob. Watercourse. Catchment Status
Inventory Report Ł Draft report August 2008.
ORASECOM. 2008. Feasibility Study of the Potential for Sustainable Water
Resources Development in the Molopo-Nossob Watercourse. Draft Hydrology Report
8.5 Groundwater Information
The regional geology and hydrogeological information is obtained from national geological
and hydrogeological maps from each riparian countries and reports. Some of the literature is
given below:
Geotechnical Consulting Services
179
Groundwater Review of the Molopo-Nossob Basin
Report No. ORASECOM/005/2009
Ę Carney, J.N., Aldiss, D.T., Lock, N.P. 1994. The Geology of Botswana. Ł Bulletin 37
Department of Geological Survey, Botswana.
Ę Christelis, G., Struckmeier, W. 2001. Groundwater in Namibia, an explanation to the
Hydrogeological Map. Ł Department of Water Affairs, Division Geohydrology,
December 2001.
Ę DWAF, 1995. Groundwater resources of the Republic of South Africa. Ł Map
produced by Department of Water Affairs and Forestry, South Africa. 1995.
Ę GSN, 1980. Namibia Geological Map. Ł Map produced by Geological Survey
Namibia. 1980.
Ę DGS, 1987. Groundwater Resources Map of the Republic of Botswana. Ł Map
produced by Department of Geological Survey, Botswana. 1987.
Ę DGS, 1997. The Pre-Kalahari Geological Map of the Republic of Botswana. Ł Map
produced by Department of Geological Survey. Botswana. 1997.
Ę ORASECOM 2007a. Review of Groundwater Resources in Orange River Catchment.
Ł August 2007.
Ę SADC, 1999. Isopach Map of the Kalahari Group. Ł Map produced by the Council for
Geoscience, South Africa on behalf of SADC. 1999.
Ę DGS, 1995. Groundwater Pollution and Vulnerability Map of the Republic of
Botswana. Ł Map produced by Department of Geological Survey, Botswana. 1995.
8.6 Water Requirements
The main part of the Molopo-Nossob Basin is under natural vegetation and a large portion of
the basin falls within the Kalahari Desert.
Ę DWA, 2006. National Water Master Plan Review. Report prepared by Ministry of
Minerals, Energy and Water Resources, Gaborone.
Ę MAWRD, Ministry of Agriculture, Water and Rural Development, 2000. Namibia
Water Resources Management Review. Ł Reports Vol1 to 5, Windhoek. March 2000.
Ę ORASECOM 2007b. Summary of Water Requirements from the Orange River. Ł
August 2007.
Ę DWAF 2002b. Lower Orange Water Management Area. Water Resources Situation
Assessment. ŁMain Report No P 14/000/00/0101. March 2002.
Ę DWAF 2002c. Lower Vaal Water Management Area. Water Resources Situation
Assessment. ŁMain Report No P 03/000/00/0101. November 2002.
Ę DWAF 2002d. Crocodile West and Marico Water Management Area. Water
Resources Situation Assessment. Volume 1, Report No P03/000/00/0301. April 2002.
Ę DWAF, 2004a. Internal Strategic Perspective. Lower Orange Water Management
Area. Ł Version 1 Report No P WMA 14/000/00/0304. July 2004.
Ę DWAF, 2004b. Internal Strategic Perspective. Lower Vaal Water Management Area. Ł
Version 1 Report No P WMA 14/000/00/0304. October 2004.
Ę DWAF 2004c. Crocodile (West) Marico Water Management Area. Internal Strategic
Perspective for Marico, Upper Molopo and Upper Ngotwane Catchments. Ł Version
1, February 2004.
Geotechnical Consulting Services
180
Groundwater Review of the Molopo-Nossob Basin
Report No. ORASECOM/005/2009
8.7 Future Plans and Developments
The information on future development plans are obtained from various reports and some of
them are:
MOA, 2000. National Master Plan for Agricultural Development, Final Report.
Botswana National Water Master Plan (2006). Final Report Volume 4 Ł
Hydrogeology, by SMEC in association with EHES.
ORASECOM (2007) Orange River Integrated Water Resources Management Plan,
Review of Groundwater Resources in the Orange River Catchment, by WRP (Pty) Ltd.,
Jeffares Green Parkman Consultants (Pty) Ltd., Sechaba Consultants, Water Surveys
(Botswana) and Windhoek Consulting Engineers in association.
ORASECOM (2007) Orange River Integrated Water Resources Management Plan,
Water Quality in the Orange River, by WRP (Pty) Ltd., Jeffares Green Parkman
Consultants (Pty) Ltd., Sechaba Consultants, Water Surveys (Botswana) and Windhoek
Consulting Engineers in association.
Geotechnical Consulting Services
181
Groundwater Review of the Molopo-Nossob Basin
Report No. ORASECOM/005/2009
9 CONCLUSIONS AND RECOMMENDATIONS
9.1 Conclusions
The total Molopo-Nossob Basin covers an area of 367,201 km2delineated from the surface
water catchment. Of the basin, Botswana covers 37%, Namibia 33% and South Africa 30%.
According to UNEP classification, the whole basin is arid to semi-arid.
The long term average annual precipitation is from 100 mm/a in the southwestern part of the
basin to over 500 mm/a in the eastern part, in South Africa, and 400 mm/a in the northern
part, in Namibia. Evaporation and potential evapotranspiration highly exceed the average
rainfall.
The Molopo-Nossob basin is composed of the catchment areas of four main rivers; Molopo,
Kuruman, Nossob and Auob Rivers. Parts of these rivers are ephemeral and at the basin's
outflow to Orange River there are no records of any surface outflow.
The basin covers geological formations from the Archean time period to Recent, a time span
of more than 2,500 million years. The formations host a variety of aquifers; intergranular,
fractured intergranular, fractured and karstic aquifers. The aquifers are given names after the
formations they occur in. Some of the formations further have different names in the different
countries.
The largest aquifers in the basin are the intergranular Kalahari Bed aquifer and the fractured
intergranular Ecca aquifer (the Auob aquifer). These two aquifers interact or are combined in
areas where they are in contact with each other.
Multiple aquifers occur in areas in Namibia and Botswana where a deep layer of sandstone
(Nossob sandstone) is found below the Ecca aquifer and interlayered low permeable
formations.
The potential of the aquifer is assessed from the mean borehole yields displayed on
hydrogeological maps over the Namibian and the South African part of the basin. Three
classes of potential are recognized; high, median and low potential. For Botswana the
potential is based on regional groundwater maps combined with results from groundwater
investigation in local areas in the basin.
The aquifers with the highest potential in karst environment are found in the dolomitic
formations in South Africa and Botswana. These formations also host areas currently
classified as medium potential aquifers. Karst environments are the result of mildly acidic
water acting on soluble bedrock such as limestone and dolomits. This mildly acidic water
dissolves the bedrock along fractures or bedding planes. Over tome, these fractures enlarge as
the bedrock continues to dissolve. Opening in the rock increase in size, and un underground
drainage system begins to develop, allowing more water to pass through the area, and
accelerating the formation of underground karst feature.
Geotechnical Consulting Services
182
Groundwater Review of the Molopo-Nossob Basin
Report No. ORASECOM/005/2009
The extensive Ecca aquifer (also combined with the Kalahari Bed) is classified as a median
potential aquifer, however with many areas within assessed as high potential aquifers. The
Ecca formation is one of many formations in a larger formation group called the Karoo. In
this group (Supergroup) a high potential sandstone aquifer is found above the Ecca aquifer,
the Ntane aquifers, displayed in the northern Botswana.
The Kalahari Beds locally contains groundwater. Areas in which the groundwater level in the
Molopo-Nossob Basin are found to be within the Kalahari Beds "saturated" Kalahari Beds
are found in the Gemsbok National part and the continuation into the Namibian part of the
basin following the river Nossob and Auob up to Stampriet and Amimuis. Large areas are
also found along the Upper Molopo River Course, in Gordonia and in the central part of
Botswana. Beside these larger Kalahari saturated basin, "perched aquifers occur locally in the
Kalahari Beds.
The crystalline bedrock of older age than the Karoo and Kalahari Beds is classified as low
potential aquifers. These formations are found in the northern part of Namibia and in eastern
Botswana and large part of South Africa. Groundwater is available but limited to the
occurrence in fractures and fissures. Where fractures form pronounced and extensive zone,
good yielding local aquifers are encountered.
The quality of the groundwater varies within the basin. Guidelines for domestic water use and
for livestock watering regarding the content of TDS, NO3 and F are similar in the three
countries. Maps are constructed to show the areas in which the guideline values are exceed.
The larger part of Botswana has groundwater with quality exceeding the guidelines for
human consumption of one or more of the chemical components addressed. In Namibia, the
groundwater quality is poor along the Auob River downstreams Gochas (the salt-block area).
The area of poor water quality continues into South Africa where almost the whole Gordonia
experience water quality exceeding the guidance limits for TDS and F. Areas of good water
quality are found in the middle and northern part on Namibia, in the central and eastern part
of South Africa and in the easternmost and northwestern part of Botswana. Limited minor
areas of high NO3 are found referring to local groundwater pollution.
49% of the basin area has groundwater with TDS exceeding 2,000 mg/l (limit or human
consumption). TDS of 10,000 mg/l is exceeded in 21% of the basin area (unfit for livestock
consumption).
For livestock watering the areas of unfit groundwater are limited to central and southern parts
of Botswana, the Salt-Block area in Namibia and a minor part in the Gordonia area. Since
higher NO3 is accepted for cattle watering than for human consumption, only a minor area in
Gordonia is found to have groundwater of too high NO3 content.
Monitoring of the groundwater level is done in more than 600 boreholes in the Molopo-
Nossob Basin. Most of the boreholes are in South Africa. The majority of monitoring
boreholes are in connection to abstraction boreholes or in wellfield areas. Monitoring is done
on various time intervals and using different methods. The use of automatic monitoring
devices has increased which has resulted in improved continuity of the records and in an
addition of new boreholes. There is however a large number of monitoring boreholes which
are abandoned and therefore only display limited time series of groundwater level
observation.
Geotechnical Consulting Services
183
Groundwater Review of the Molopo-Nossob Basin
Report No. ORASECOM/005/2009
Monitoring groundwater levels are stored at the water departments in Botswana, Namibia and
South Africa, head and regional offices. In the largest portion of the monitoring borehole a
declining trend is observed also in borehole located outside the influence of groundwater
abstraction.
Groundwater level data stored in the borehole archives at the water departments in Botswana,
Namibia and South Africa, together over 34,000 thousand boreholes, forms the background
information to a regional groundwater level map over the Molopo-Nossob Basin. The map
shows that the highest groundwater levels (1,750 mamsl) are in the northern Namibian part of
the basin. From there the groundwater flow is directed southeast into Botswana and South
Africa and from there towards the south out from the basin through the area along the
southern part of the Molopo River (750 mamsl).
High groundwater level is also encountered in the southeastern South African part of the
basin (1,450 mamsl). From there the groundwater flow direction is towards northwest until
the Molopo River where the flow is directed southwest to the regions around the lower
Molopo River in Gordonia.
The groundwater divide in northern Botswana does not follow the surface water divide as it is
illustrated on Botswana water maps. That makes in fact the Molopo-Nossob Basin smaller
than derived from the surface water divide.
Assessment of groundwater replenishment through recharge is an issue which can be
approached by different methods. The Chloride Mass Balance method is based on the relation
between chloride deposited through rainfall and wind to the chloride content in the
groundwater. This method shows that large areas of the basin receive less than 1 mm/a
recharge as a long term average. Recharge of more than 10 mm/a is assessed for the northern
part and for the area northwest of Stampriet and Aminuis in Namibia. Also in South Africa
areas of recharge above 10 mm/a are found for the southeastern part (Mmabatho) and the
Kuruman area.
Extreme low recharge (< 0.1 mm/a as an average annual value) is assessed for the central part
of Botswana close to the Gemsbok National park, an area northeast of Bokspits and for the
central part of Gordonia in South Africa. In Botswana recharge of more than 2 mm/a is found
for the north western and the south eastern parts.
The areas of low recharge in the basin are also the areas of poor groundwater quality.
The depth to the groundwater level is more than 100 m in the northern part of Botswana, east
of Gochas in Namibia, along the Molopo River between Tsabong and Werda and in the
southeastern part of Gordonia. It should be mentioned that the groundwater level in the
Nossob aquifer in Namibia, located below the Ecca aquifer, is artesian in large area of the
Namibian part of the basin with a groundwater head in places above the ground surface.
The population in the Molopo-Nossob Basin is about 1 million, and the livestock units
(ELSU) is about 1.6 million including wildlife. Whereas the ELSU per km2 is similar for the
three countries (4.2-4.6) the population per km2 varies from 0.2 in Kgalagadi North District
(Botswana) to 62 for the Upper Molopo catchment area (Mmabatho area in South Africa). As
an average for the basin the population density is 2.7 persons per km2.
Geotechnical Consulting Services
184
Groundwater Review of the Molopo-Nossob Basin
Report No. ORASECOM/005/2009
The water requirement in the Molopo-Nossob Basin is referred to domestic, livestock,
irrigation and mining users. The total requirement is 128 Mm3/a (2000). Of this 69% is
required in South Africa, 18% in Namibia and 13% in Botswana. About 37% of the water
requirement goes to livestock watering, 27% to domestic purposes, 27% to irrigation and 9%
to industry (mining). Only 0.1% is for tourism.
The highest water requirement is found in the Upper Molopo catchment area (Mmabatho area
in South Africa). The requirement represents about 8,700 m3/km2 and annum whereas the
average value for the whole Molopo-Nossob basin is about 350 m3/km2 and annum.
Development which requires a major quantity of water is foreseen in the Botswana part of the
Molopo-Nossob Basin. Plans for irrigation developments will require about 6.2 Mm3/a of
water from the year 2015. Other major water consuming developments are for the mining
industry in South Africa together with plans for increased irrigation. The future requirements
for the three countries will increase the water requirement for the Molopo-Nossob Basin by
the year 2015 to about 160 Mm3/a, the year 2020 to 170 Mm3/a, and in 2025 to 187 Mm3/a.
On the average an annual increase in the water requirement for the Molopo-Nossob Basin is
about 1.5%.
The assessed recharge to the basin (within the groundwater catchment area) is 1,105 Mm3/a.
The current water requirement represents 11.5 % of this recharge.
A variety of databases exist to capture and store information on water and geology in the
Molopo-Nossob Basin. In Botswana the main custodian, holding and using the databases is
Department of Water Affairs and Department of Geological Survey, Four main databases are
working dealing with borehole archive, groundwater monitoring and groundwater chemistry.
In Namibia a groundwater database (GROWAS) is hosted in the Ministry of Agriculture,
Water and Rural Development handles information from boreholes regarding location,
quality, monitoring, testing, permits and borehole equipment.
In South Africa several databases exist containing relevant groundwater information and
groundwater related data such as borehole location, water quality, monitoring, information of
licensing and registration, water management and groundwater reports. The databases are
included in the Geohydrological Data and Information Systems at Department of Water
Affairs and Forestry. The data bases are used also in the regional offices of DWAF in South
Africa.
Information over the Molopo-Nossob Basin, other than stored in digital databases, are found
in numerous reports, maps and information sheets. References used in compilation of the
water requirements, the future development plans, climate, geology and hydrogeology of the
basin are summarized in short abstracts with keywords using the MicroSoft computer
program `EndNote'. This program is specialized in storing, managing and searching in
bibliographic references.
9.2 Recommendations
Ę Monitoring of groundwater, both quality and level should be continued and extended
to include area which are remote and not affected by human development to capture
the natural changes cause by global climate change and regional human development.
Geotechnical Consulting Services
185
Groundwater Review of the Molopo-Nossob Basin
Report No. ORASECOM/005/2009
Ę The distribution of the information from boreholes is hardly skewed. In Botswana,
one borehole covers as an average about 38 km2 whereas the average in the Molopo-
Nossob Basin is one borehole per 10 km2. Especially the western and central part of
the Molopo-Nossob Basin in Botswana is extremely limited on borehole information.
Since those areas are of major importance for both a more detailed understanding of
water chemistry, recharge and flow and for an improved understanding of the regional
groundwater system in the Molopo-Nossob Basin, it is recommended that additional
boreholes be drilled and continuous monitored in these areas.
Ę The continuation of the groundwater resources in the Nossob sandstone, identified in
Namibia should be established. The aquifer probably continues into Botswana but
limited information is available to confirm this. In the on-going project "Integrated
Shared Aquifer Resource Management", the continuation of the Nossob aquifer and
its chemistry, flow, recharge and possible future use should be approached.
Ę Changes in the groundwater resources are currently on-going. The most obvious
evidence of this is an on-going lowering of the groundwater table. A regional and
continuous assessment of such lowering, as is done for the Northern Cape in South
Africa, is recommended to be performed for both for regions in the basin and for the
whole Molopo-Nossob Basin.
Ę Recharge is one of the major elements in a groundwater balance study. Various
methods exist to determine the recharge and it is recommended that more than the one
used in the current project be applied in the basin. The current assessment of recharge
should be assessed in comparison with the general flow of groundwater in the basin.
Such studies will preferably be done through mathematical modelling.
Ę The use of the concept of Groundwater Harvest Potential introduced in South Africa
should be extended and map produced also for Namibia and Botswana, especially for
areas of low groundwater recharge.
Ę The current use of 11.5% of the total recharge in the basin must be detailed down to
smaller regions where the use of groundwater exceeds the recharge in order to get
both a comprehensive and detailed understanding of the groundwater situation within
the large Molopo-Nossob basin.
Ę Large parts of the basin has water unfit for human consumption and for livestock
watering. Water treatment options exist and could be applied in for private and
communal use. The current and future use of such treatment option should be
addressed.
Ę EndNote software program to capture, store and retrieve literature references was
used in the current project. It is recommended that the software be used in similar
projects and the databases established using the software be exchanged between the
users.
Ę Database integration is recommended which will allow the three countries to share
information through a database transfer and integration medium. It is recommended
that the database be developed in Microsoft SQL.
Geotechnical Consulting Services
186
Groundwater Review of the Molopo-Nossob Basin
Report No. ORASECOM/005/2009
10 REFERENCES
Alemaw, B.F. and N. Sebusang. 2008. Hydro-climatic profile and climate change impacts on
the hydrology of the Orange-Senqu Basin. Unpublished Research Report No.
RR/CCL/03/08. for Continental Consultants (Pty) Ltd, Gaborone, Botswana. 44 pp +
appendices
Beekman, H.E., Gieske, A., Selaolo, E.T., 1996. GRES: Groundwater recharge studies in
Botswana 1987-1996. Ł Botswana Journal of Earth Science 3, pp 1-17.
BOBS, Botswana Bureau of Standards, 2000. Water quality Ł Drinking water Ł
Specifications. - BOS 32:2000.
Boocock, C., van Traten, O.J., 19962. Notes on the Geology and Hydrogeology of the Central
Kalahari Region, Bechuanaland Protectorate. Ł Trans. Geol. Soc. S. Afr. 65, pp 125-
171.
Botha, L.J, van Wyk E., 1995. Louwna-Coetzersdam: Re-evaluation of groundwater
potential. Ł Department of Water Affairs and Forestry, Report GH3860.
Bredenkamp, D.B., 1988. Quantitative Estimation of Ground-Water Recharge in Dolomite Ł
In "Estimation of Natural Groundwater Recharge". NATO ASI Serie C, Vol 202, pp
449-460.
Bredenkamp, D.B., Botha, L.J., van Tonder, G.J., Janse van Rensburg, H., 1995. Manual on
Quantitative Estimation of Groundwater Recharge and Aquifer Storativity. Water
Research Commission.
Carney, J.N., Aldiss, D.T., Lock, N.P. 1994. The Geology of Botswana. Ł Bulletin 37
Department of Geological Survey, Botswana.
Christelis, G., Struckmeier, W. 2001. Groundwater in Namibia, an explanation to the
Hydrogeological Map. Ł Department of Water Affairs, Division Geohydrology,
December 2001.
CSO, 1997. Population Projections 1991-2021. Ł 1991 Population and Housing Census,
Central Statistics Office, Ministry of Finance and Development Planning, Gaborone,
April 1997.
CSO, 2001. Population of Towns, Villages and Associated Localities. Ł Central Statistics
Office. Gaborone, 2001.
CSO, 2005. Population Projections for Botswana 2001-2031. - Central Statistics Office,
Gaborone, September 2005.
DGS, 1987. Groundwater Resources Map of the Republic of Botswana. Ł Map produced by
Department of Geological Survey, Botswana. 1987.
DGS, 1994. Groundwater Potential Survey. Middlepits-Makopong TGLP Areas. Ł Final
Report TB 10/2/8/91-92. Botswana, Lobatse 1994
DGS, 1995. Groundwater Pollution and Vulnerability Map of the Republic of Botswana. Ł
Map produced by Department of Geological Survey, Botswana. 1995.
DGS, 1997. The Pre-Kalahari Geological Map of the Republic of Botswana. Ł Map produced
by Department of Geological Survey. Botswana. 1997.
DGS, 2003. Bokspits TGLP Area Groundwater Potential Survey. Final Report. by Geoflux
(Pty) Ltd.
Geotechnical Consulting Services
187
Groundwater Review of the Molopo-Nossob Basin
Report No. ORASECOM/005/2009
DWA, 1991. Botswana National Water Master Plan Study. Volume 5 Ł Hydrogeology, Final
Report, by Snowy Mountain Engineering Corporation, WLPU Consultants, and
Swedish Geological International AB.
DWA, Department of Water Affairs, 1991. Guidelines for evaluation of drinking water for
human consumption with reference to chemical, physical and bacteriological quality Ł
Windhoek, Namibia, 1991.
DWA, 2002. Tsabong Groundwater Investigation, Assessment and Development, Final
Report, by Resources Services (Pty) Ltd.
DWA, 2006. National Water Master Plan Review. Report prepared by Ministry of Minerals,
Energy and Water Resources, Gaborone, Botswana.
DWA (2006) Kanye Emergency Water Supply Project, Final Report, Vol. 1 by Geotechnical
Consulting Services (Pty) Ltd.
DWA, 2007. Kang-Phuduhudu Regional Groundwater Resources Investigation and
Development Porject. Final Report, by Wellfield Consulting Servies.
DWA, 2008. Matsheng Groundwater Developmant Projetc, Draft Final Report, by Water
Resources Consultants (Pty) Ltd.
DWAF, 1995. Groundwater resources of the Republic of South Africa. Ł Map produced by
Department of Water Affairs and Forestry, South Africa. 1995.
DWAF, 1996a. South African Water Quality Guidelines (second edition). Volume 1:
Domestic Use.
DWAF, 1996b. South African Water Quality Guidelines (second edition). Volume 5,
Livestock Watering.
DWA, 2001. Hydrogeological Map of Namibia. Ł Map produced by Department of Water
Affairs and Geological Survey of Namibia. 2001.
DWAF, 2000. Hydrogeological Map Vryburg 2522. Ł Map produced by Department of
Water Affairs and Forestry, South Africa. 2003.
DWAF, 2001. Hydrogeological Map Upington/Alexander Bay 2718. Ł Map produced by
Department of Water Affairs and Forestry, South Africa. 2001.
DWAF, 2002a. Hydrogeological Map Nossob 2419. Ł Map produced by Department of
Water Affairs and Forestry, South Africa. 2002.
DWAF 2002b. Lower Orange Water Management Area. Water Resources Situation
Assessment. ŁMain Report No P 14/000/00/0101. March 2002.
DWAF 2002c. Lower Vaal Water Management Area. Water Resources Situation
Assessment. ŁMain Report No P 03/000/00/0101. November 2002.
DWAF 2002d. Crocodile West and Marico Water Management Area. Water Resources
Situation Assessment. Ł Volume 1 Report No P 03/000/00/0301. April 2002.
DWAF, 2003a. Lower Vaal Water management Area. Overview of Water Resources
Availability and Utilisation. Ł Final Report No P WMA 10/000/00/0203. Septemebr
2003.
DWAF 2003b. Lower Orange Water Management Area. Overview of Water Resources
Availability and Utilisation. Ł Report P WMA 14/000/00/0203. September 2003.
DWAF, 2003c. Hydrogeological Map Kimberly 2722. Ł Map produced by Department of
Water Affairs and Forestry, South Africa. 2003.
DWAF, 2004a. Internal Stratgic Perspective. Lower Orange Water Management Area. Ł
Version 1 Report No P WMA 14/000/00/0304. July 2004.
Geotechnical Consulting Services
188
Groundwater Review of the Molopo-Nossob Basin
Report No. ORASECOM/005/2009
DWAF, 2004b. Internal Stratgic Perspective. Lower Vaal Water Management Area. Ł Version
1 Report No P WMA 14/000/00/0304. October 2004.
DWAF 2004c. Crocodile (West) Marico Water Management Area. Internal Strategic
Perspective for Marico, Upper Molopo and Upper Ngotwane Catchments. Ł Version
1, February 2004.
DWAF, 2004d. Hydrogeological Map of the Republic of South Africa. Ł Map produced by
Department of Water Affairs and Forestry, South Africa. June 2004.
FAO. 1993. FAO CLIMWAT for CROPWAT, CD-ROM. Agro climatic database. Rainfall and
evaporation figures. FAO. Rome.
Foster, S.S.D., Bath, A.H., Farr, J.H., Lewis, W.J., 1982. The Likelihood of Active
Groundwater Recharge in the Botswana Kalahari. Ł Journal of Hydrology 55, pp 113-
136.
GDC (Ghanzi District Council), 2003. 2003-2009, Ghanzi District Development Committee,
Ministry of Local Government, Govern Printer, Gaborone.
GSN, 1980. Namibia Geological Map. Ł Map produced by Geological Survey Namibia.
1980.
JICA, Japan International Cooperation Agency, 2002. The Study on the Groundwater
Potential Evaluation and Management Plan in the Southeast Kalahari (Stampriet)
Artesian Basin in the Republic of Namibia. Ł Final report, March 2002.
KDC (Kgalagadi District Council), 2003. Kgalagadi District Development Plan 6. 2003-
2009: Government Printer, Gaborone.
MAWF, 2006. Technical Summary of Water Accounts. Ł Department of Water Affairs,
Ministry of Agriculture, Water and Forestry, Namibia. January 2006.
MAWRD, Ministry of Agriculture, Water and Rural Development. Namibia Water Resources
Management Review. Ł Final Report in 5 volumes, March 2000.
McKee, T.B., Doesken, N.J., Kleist, J., 1993. The relationship of drought frequency and
duration to time scales. Ł Preprints 8th Conference on Applied Climatology, January
17-22, 1993, Anaheim, California, pp 179-184.
NAMPAAD, 2000. National Master Plan for Agricultural Development. - Final Report,
Volume 1. Main Report, Ministry of Agriculture, Botswana, September 2000.
Obakeng, O.T. 2007. Soil Moisture Dynamics and Evapotranspiration at the Fringe of the
Botswana Kalahari, with emphasis on deep rooting vegetation. ITC.
ORASECOM 2007a. Review of Groundwater Resources in Orange River Catchment. Ł
August 2007.
ORASECOM 2007b. Summary of Water Requirements from the Orange River. Ł August
2007.
ORASECOM 2007c. Demographic and Economic Activity in the four Basin States. Ł August
2007.
ORASECOM, 2008. Feasibility Study of the Potential for Sustainable Water Resources
Development in the Molopo-Nossob. Watercourse. Catchment Status Inventory
Report Ł Draft report August 2008.
ORASECOM, 2008a. Feasibility Study of the Potential for Sustainable Water Resources
Development in the Molopo-Nossob. Watercourse. Hydrology Report Ł Draft report
August 2008.
Geotechnical Consulting Services
189
Groundwater Review of the Molopo-Nossob Basin
Report No. ORASECOM/005/2009
ORASECOM, 2009a. Feasibility Study of the Potential for Sustainable Water Resources
Development in the Molopo-Nossob. Watercourse. Draft Final Report Ł February
2009.
ORASECOM, 2009b. Feasibility Study of the Potential for Sustainable Water Resources
Development in the Molopo-Nossob. Watercourse. Draft Groundwater Report Ł
February 2009.
SADC, 1999. Isopach Map of the Kalahari Group. Ł Map produced by the Council for
Geosciences, South Africa on behalf of SADC. 1999.
SADC, 2001. Development of a Code of Good Practice for Groundwater Development in the
SADC Region. Report No.1 (Final) Situation Analysis Report. - Southern African
Development Community (SADC), Water Sector Coordination Unit (WSCU).
November 2001.
SDC, 2003. Southern District Development Plan 6: 2003 Ł 2009. Report by Southern District
Council, Southern Development Committee and Ministry of Local Government,
Botswana, July 2003.
Selaolo, E.T., 1998. Tracer Studies and Groundwater Recharge Assessment in the Eastern
Frienge of the Botswana Kalahari. The Letlhakeng-Botlhapatlou Area.
Steenekamp, G. 1998. Geohydrological Modelling of the Sishen Aquifer. - Sishen Iron Ore
Mine.
UNEP, 1992. World Atlas of Desertification. Ł United Nations Environment Programme
van Dyk G.S., 2005. Managing the impact of groundwater irrigation from the Tosca Molopo
aquifer, - PhD Thesis, University Free State.
Van Dyk,G. And Kisten, S. 2006. An Explanation of the 1: 500,000 General Hydrogeological
Map. Vryburg 2522. April 2006. Deaprtment of Water Affairs and Foresty.
van Dyk, G.S., Makhetha J., Potgieter D., Zikali T., Leeme V., Moletsane F., Vonya T., 2008.
Groundwater Resources in the Northern Cape Province 2008 - Department Water
Affairs and Forestry, Kimberley, South Africa.
Van Straten, O.J., 1955. The Geology and Groundwater of the Ghanzi Cattle route. Ł Annual
Report, Geological Survey, Bechuanaland Protectorate 1955: 28-39.
Vegter, J.R., 1995. An Explanation of a Set of National Groundwater Maps. Ł Water
Research Commission (WRC) TT 74/95. Pretoria, August 1995.
Wiegmans F., (2006). Water resources strategy for the Kgalagadi District. - Kgalagadi District
Municipality, Groundwater situation assessment Volume 2 maps.
Geotechnical Consulting Services
190
Groundwater Review of the Molopo-Nossob Basin
Report No. ORASECOM/005/2009
APPENDIX Ł I
Molopo-Nossob Basin metadata records
Geotechnical Consulting Services
Groundwater Review of the Molopo-Nossob Basin
Report No. ORASECOM/005/2009
Summary of records within Molopo-Nossob Basin metadata
File_name
Abstract
Topic_Category
International boundaries of
countries covered by Molopo-
Basin_country_boundary.shp
Nossob river basin
Boundaries
International boundaries of
countries covered by Molopo-
Basin_country_boundary_line
Nossob river basin
Boundaries
International boundaries for
Botswana, Namibia and South
Africa (Including Lesotho and
Bot_na_sa.shp
Swaziland
Boundaries
Administrative boundaries
within Molopo-Nossob basin
Bots_admin_bnd
boundary in Botswana
Boundaries
Veterinary zones in Botswana
within Molopo-Nossob Basin
Bots_vet_districts
boundary
Boundaries
Veterinary zones in Botswana
within Molopo-Nossob Basin
Bots_vet_line
boundary
Boundaries
Molopo-Nossob river
catchment boundary from the
Molopo_catchment
Illiso Project
Boundaries
Molopo-Nossob rivers
Molopo_Nossob_catchment
catchment boundary
Boundaries
Molopo-Nossob rivers
Molopo_nossob_catchment_line
catchment boundary
Boundaries
1996 Municipality boundaries
in South Africa within
Municipality boundary_1996_census
Molopo-Nossob basin
Boundaries
Administrative boundaries
within Molopo-Nossob basin
Nam_admin_bnd
boundary in Namibia
Boundaries
Veterinary zones in Namibia
within Molopo-Nossob Basin
Nam_vet_district
boundary
Boundaries
Water Control areas in
Namibia within Molopo-
Nam_watercontrol_areas
Nossob Basin boundary
Boundaries
Map showing Orange River
Orange_basin
Basin Boundary
Boundaries
Wildlife area within the
Parks
Molopo-Nossob Basin area
Boundaries
Proposed Water Management
Area boundaries in the
Proposed_basin_wma
Molopo-Nossob basin
Boundaries
2007 Province boundaries in
South Africa within Molopo-
Province_New2007
Nossob basin
Boundaries
Administrative boundaries
SA_admin_bnd
within Molopo-Nossob basin
Boundaries
Geotechnical Consulting Services
Groundwater Review of the Molopo-Nossob Basin
Report No. ORASECOM/005/2009
File_name
Abstract
Topic_Category
boundary in South Africa
Water Management Area
boundaries in South Africa that
are within Molopo-Nossob
SA_WMA
basin
Boundaries
Detailed monthly rainfall data
for some of the villages in
Botswana_detailed_rainfall(monthly)98-08
Botswana
Climatology
Botswana_rainfall_annual(98-08)
Annual rainfall in Botswana
Climatology
Gantsi mean monthly maxmin for 1997-
Gantsi mean monthly maxmin
2007(2)
for 1997-2007(2)
Climatology
Jwaneng mean monthly max, min for 1997-
Jwaneng mean monthly max,
2007
min for 1997-2007
Climatology
Climate stations within
Molopo-Nossob basin
Molopo_nossob_climate_stn
boundary
Climatology
Map showing
evapotranspiration within
Molopo_nossob_evapotranp
Molopo-Nossob basin
Climatology
Map showing rainfall
distribution within Molopo-
Molopo_nossob_rainfall
Nossob basin
Climatology
Map showing temperature
distribution within Molopo-
Molopo_nossob_temp
Nossob basin
Climatology
Map showing temperature
distribution within Molopo-
Molopo_nossob_temp_line
Nossob basin
Climatology
Rainfall, evapotranspiration
and temperature data from a
few climatic stations covering
Rainfall et and temp
Molopo_nossob basin
Climatology
Rain stations in South Africa
rsa_rain station
within Molopo-Nossob basin
Climatology
Tsabong & Tshane climatic data for 1990-
Tsabong & Tshane climatic
2007
data for 1990-2007
Climatology
Werda climatic data 2002-2007
Werda climatic data 2002-2007 Climatology
Contours covering Molopo
Basin_altitude_200m_interval.shp
Nossob Basin at 200m interval
Elevation
Contours covering Molopo
Basin_contours_100m_interval.shp
Nossob Basin at 100m interval
Elevation
Contours covering Molopo
Molopo_Catchment_20m_contours
Nossob Basin at 20m interval
Elevation
Map showing aquifers within
Aquifer_map
Molopo-Nossob basin
Hydrogeology
Hydrogeology map covering
Basin_geology.shp
Molopo Nossob Basin
Hydrogeology
Kalahari formation in Molopo-
Basin_kalahari_outline
Nossob basin
Hydrogeology
Boreholes within Molopo-
Borehole map.jpg
Nossob basin
Hydrogeology
Geotechnical Consulting Services
Groundwater Review of the Molopo-Nossob Basin
Report No. ORASECOM/005/2009
File_name
Abstract
Topic_Category
List of boreholes with flouride
Boreholes for flouride
data
Hydrogeology
List of boreholes with nitrate
Boreholes for NO3
data
Hydrogeology
List of boreholes with TDS
Boreholes for TDS
data
Hydrogeology
List of boreholes with water
Boreholes for water level
level data
Hydrogeology
Kalahari line in Botswana
Bots_kalahari_formation
within Molopo-Nossob Basin
Hydrogeology
Monitoring boreholes in
Botswana within Molopo-
Bots_monitoring_bholes
Nossob basin
Hydrogeology
Boreholes used for plotting
F_bholes
fluoride distribution map
Hydrogeology
Geology in South Africa within
geology
Molopo-Nossob basin
Hydrogeology
Geological structures in South
Africa within Molopo-Nossob
geology structure
basin
Hydrogeology
Groundwater Harvest Potential
Groundwater Harvest Potential of The
of The Republic of South
Republic of South Africa
Africa
Hydrogeology
Groundwater Pollution and
Groundwater Pollution and Vulnerability
Vulnerability Map, Republic of
Map, Republic of Botswana
Botswana
Hydrogeology
Groundwater Resources Map of The
Groundwater Resources Map
Republic of Botswana
of The Republic of Botswana
Hydrogeology
Groundwater quality map at 1 :
1 500 000 in South Africa
gw_quality_1_in_1500000
within Molopo-Nossob basin
Hydrogeology
Harvest potential map in South
Africa within Molopo-Nossob
Harvest_potential
basin
Hydrogeology
Hydrogeological Map of
Hydrogeological Map of Namibia
Namibia
Hydrogeology
Hydrogeological Map of The Republic of
Hydrogeological Map of The
South Africa
Republic of South Africa
Hydrogeology
In-stream dams within
in_stream_dams_final
Molopo-Nossob Basin
Hydrogeology
Isopach Map of the Kalahari
Isopach Map of the Kalahari Group
Group
Hydrogeology
Kalahari thickness compiled
Kalahari thickness compiled Botswana
Botswana as points
Hydrogeology
Kalahari thickness compiled
Kalahari thickness compiled Namibia JICA
Namibia JICA as points
Hydrogeology
Kalahari formation in Molopo-
Kalahari_formation
Nossob basin
Hydrogeology
Lithology map in South Africa
Lithology
within Molopo-Nossob basin
Hydrogeology
Boreholes within Molopo
Molopo_Nossob_basin_boreholes
Nossob Basin
Hydrogeology
Geotechnical Consulting Services
Groundwater Review of the Molopo-Nossob Basin
Report No. ORASECOM/005/2009
File_name
Abstract
Topic_Category
Map showing fluoride
distribution in Molopo-Nossob
Molopo_nossob_basin_flouride_poly
basin
Hydrogeology
Groundwater yield map within
Molopo_nossob_basin_gw_yield
Molopo-Nossob basin
Hydrogeology
Monitoring boreholes within
Molopo_nossob_basin_monitoring_boreholes Molopo-Nossob basin
Hydrogeology
Map showing nitrate
distribution in Molopo-Nossob
Molopo_nossob_basin_nitrate_poly
basin
Hydrogeology
TDS map as line in Molopo-
Molopo_nossob_basin_tds_line
Nossob basin
Hydrogeology
TDS map in Molopo-Nossob
Molopo_nossob_basin_tds1_poly
basin
Hydrogeology
Geology map of Molopo-
Molopo_nossob_geology
Nossob basin
Hydrogeology
Groundwater level map within
Molopo_nossob_waterlevel
Molopo-Nossob basin
Hydrogeology
List of monitoring boreholes in
Monitoring boreholes in Stampriet area
Stampriet area
Hydrogeology
Monitoring boreholes selected
Monitoring_boreholes_analysed
for analysis during the project
Hydrogeology
Auob aquifer in Namibia
Nam_auob_aquifer
within Molopo-Nossob basin
Hydrogeology
Kalahari line in Namibia
Nam_kalahari_formation
within Molopo-Nossob Basin
Hydrogeology
Monitoring boreholes in
Namibia within Molopo-
Nam_monitoring_bholes
Nossob basin
Hydrogeology
Boreholes used for plotting
No3_bholes
Nitrate distribution map
Hydrogeology
Ecca aquifer in South Africa
SA_ecca_aquifer
within Molopo-Nossob basin
Hydrogeology
Kalahari line in South Africa
SA_kalahari_formation
within Molopo-Nossob Basin
Hydrogeology
Monitoring boreholes in South
Africa within Molopo-Nossob
SA_monitoring_bholes
basin
Hydrogeology
TDS data for Botswana,
TDS Botswana, Namibia and South Africa
Namibia and South Africa
Hydrogeology
TDS map as points in Molopo-
Tds_point
Nossob basin
Hydrogeology
Groundwater regions in South
Africa within Molopo-Nossob
vegter_gw_regions
basin
Hydrogeology
Distribution of water supply
waterpoints hardap_GCS_Schwarzeck
schemes in Hardap
Hydrogeology
Distribution of water supply
waterpoints_omaheke_GCS_Schwarzeck
schemes in Omaheke
Hydrogeology
Groundwater occurrence in
South Africa within Molopo-
yield_gw_occurence
Nossob basin
Hydrogeology
Geotechnical Consulting Services
Groundwater Review of the Molopo-Nossob Basin
Report No. ORASECOM/005/2009
File_name
Abstract
Topic_Category
Water Transfer pipelines in
Namibia within Molopo-
Nam_pipeline
Nossob basin
Infrastructure
Water Transfer pipelines
Water_transfer_pipeline
within Molopo-Nossob basin
Infrastructure
african_dams060908-Bots-Nami-SA
List of Dams
Inlandwaters
dams
List of dams
Inlandwaters
Dams in South Africa within
dams500g_wgs84
Molopo-Nossob basin
Inlandwaters
Molopo catchment boundary in
South Africa within Molopo-
Molofo_catchment
Nossob basin
Inlandwaters
Dams within Molopo-Nossob
Molopo_Nossob_basin_dams
basin
Inlandwaters
Pans within Molopo-Nossob
Molopo_Nossob_basin_pans
basin
Inlandwaters
Rivers forming Molopo-
Molopo_Nossob_basin_rivers
Nossob Basin
Inlandwaters
Off-channel dams within
Off-channel_dams_final
Molopo-Nossob basin
Inlandwaters
Orange_basin_rivers
Rivers forming Orange basin
Inlandwaters
Primary rivers in South Africa
Primary rivers
within Molopo-Nossob basin
Inlandwaters
Rivers forming Molopo-
Rivers_molopo_nossob
Nossob Basin
Inlandwaters
Secondary rivers in South
Africa within Molopo-Nossob
Secondary Rivers
basin
Inlandwaters
Villages, towns and cities
Basin_localities.shp
within Molopo-Nossob basin
Society
Villages, towns and cities
Basin_location.shp
within Molopo-Nossob basin
Society
Cities, Towns and Villages
Basin_settlements.shp
within Molopo Nossob Basin
Society
Cities and Towns in and
around Molopo Nossob Basin
in Botswana, Namibia and
Cities
South Africa
Society
Cities and Towns in South
Africa within Molopo-Nossob
Cities_Towns
basin
Society
Villages, towns and cities
Places
within Molopo-Nossob basin
Society
Location of 600 towns and
Towns and settlements
other settlements in Namibia
Society
Roads within Molopo Nossob
Basin_roads.shp
Basin
Transportation
Railway line in South Africa
Railway_sa
within Molopo-Nossob basin
Transportation
Geotechnical Consulting Services