March 6, 2005
Benguela Current Commission (BCC) Economic Study
Prepared by
Ussif Rashid Sumaila, Gordon Munro and Heather Keith
Fisheries Economics Research Unit, Fisheries Centre, University of British Columbia, Vancouver, B.C., V6T 1Z4 Canada
For
The United Nations Office for Projects Services (UNOPS) and Benguela Current Large Marine Ecosystem (BCLME) Programme
![]()
Table of Contents
Executive Summary 4
1.0. Introduction 12
1.1. Terms of reference 12
1.2. Addressing the terms of reference 13
1.3. The Benguela Current Large Marine Ecosystem (BCLME) 13
1.4. Shared stocks defined 15
1.5. Are the living marine resources of the BCLME shared? 15
1.6. The legal obligations of coastal states sharing transboundary resources 16
1.7. Economic rationale for joint management of shared stocks 16
2.0. Fisheries resources in Namibia, South Africa and Angola 17
2.1. Namibia 17
2.2. South Africa 17
2.3. Angola 18
3.0. Data and information for economic analysis of the cost of fisheries management 18
3.1. Information for computing benefits of fisheries management 18
3.2. Information for computing costs of fisheries management 33
4.0. Benefit cost analysis of incremental regional cooperation 37
4.1. The status quo (default) scenario 37
4.2. The SAP proposal 38
4.3. The management and task oriented scenario 40
5.0. Addressing specific questions raised by the TOR 41
5.1. Other potential costs and benefits from cooperative management 41
5.2 Justification for an ecosystem based approach to fisheries management 42
5.3. Collaboration with the Institutional Review team 43
6.0. Conclusions and Recommendations 44
ACKNOWLEGDEMENTS
We acknowledge the help and information provided by the following: Johann Augustine, Research Director, MCM, Stephen Cederrand, SADC-MCS, Adriana F. Carlos Costa, Angola, Cormac Cullinan, Chief Executive Officer, En Act International, South Africa, Heidi Currie, Institutional Review Team, Anna Erastus, Director, Economic Planning, MFMR, Hashali Humuakuaya, Director, BCLME Activity Centre, Swakopmund, Mick O’Toole BCLME Technical Director, Gabi Schneider, Director, Geological Survey (Namibia), Andre Share, Director, Resource Management and Allocation (MCM, Marine), Neville Sweijd, BENEFIT Director, Filomina Velho, Angola, all those interviewed by the Institutional Review Team, and many others during the course of this work. The financial support of the BCLME programme is gratefully acknowledged. Sumaila and Munro acknowledge the support of the Sea Around Us project of the Fisheries Centre.
Executive Summary
The Benguela Current Large Marine Ecosystem (BCLME) programme is a multi-sectoral initiative undertaken by Angola, Namibia and South Africa to facilitate integrated management, sustainable development and protection of the ecosystem and environment as a whole. The key transboundary issues that are being addressed include the migration or straddling of valuable fish stocks across national boundaries, the introduction of invasive alien species via the ballast water of ships moving through the region, and pollutants or harmful algal blooms that can be advected by winds and currents from the waters of one country into another.
The three countries have agreed to a Strategic Action Programme, which includes the establishment of an Interim Benguela Current Commission (IBCC) initially, which is to be developed later into a fully-fledged regional cooperative management body for the Benguela Current Large Marine Ecosystem.
The main purpose of this study is to analyze the economics of fishery management and other marine industries in the Benguela Current Large Marine Ecosystem (BCLME), reviewing the case for and against regional co-operation in managing the BCLME. The analysis is undertaken for the major transboundary commercial fisheries of the region using hake as the core species underlying the study.
Economic analysis of the status quo management of the BCLME
We analyze the current domestic costs and benefits of fishery management in Angola, Namibia and South Africa, providing a default scenario for further analysis. The analysis utilizes appropriate and comparable economic yardsticks that provide estimates of costs and benefits of current management systems in the three countries of the BCLME.
Economic analysis of the incremental costs and benefits of regional cooperative management of the BCLME
We identify the incremental costs and benefits attached to and derived from regional co-operation on fisheries management and environmental protection to the three countries individually and to the region as a whole.
We assess the costs and risks associated with non-co-operation in fishery management, environmental monitoring and resource protection regionally.
We also provide a general assessment of the net benefits of joint ecosystem management in the region, and discuss its contribution to broader national and regional development objectives such as food security, poverty alleviation and job creation.
Provide economic case for taking an ecosystem approach to LME management
With input and guidance from other team members, we review and present the economic case for taking an ecosystem approach to LME management relative to traditional fisheries management models in relation to fisheries, and as far as possible non-fisheries benefits (e.g. recreational fishing, coastal tourism).
Is regional cooperative management justifiable economically and socially?
Current knowledge of the BCLME fish stocks indicate that (i) the deep water hake stock is shared by South Africa and Namibia, and the Cape hake stock is also shared if only indirectly through cannibalism, (ii) the pilchard and horse mackerel stocks are shared between Angola and Namibia, (iii) red crabs and bronze whaler sharks are shared between Angola and Namibia, and (iv) bigeye, yellowfin and albacore tunas are also shared by the countries of the BCLME both within their EEZs and on the high seas. Based on this and the key results from the economic theory of shared stocks management, the answer to the question posed is YES, cooperative management of the BCLME is indeed justifiable.
We focus on the commercial values from the fisheries of the Benguela in our analysis. This is not to say that non-commercial values are unimportant, but rather, our point of departure is that if it can be shown that the increase in commercial values from joint management of the resources of the BCLME exceed the cost, then the extra benefits from non-market values will be a bonus. We do not include the initial cost of providing physical structures. That is, we provide an analysis of only the cost of running the new management Commission. A key reason for taking this approach is that the new Commission can use the existing physical structures used by the BENEFIT and BCLME programmes.
To investigate the net commercial benefits from current and future management of the fisheries resources of the Benguela, we analyze, as far as data availability will allow, data on the following key economic indicators: (i) landings, (ii) landed values, (iii) economic rent, (iv) exports, (v) contribution to GDP, and (v) employment/food security, for each of the three countries. Each of these variables will capture an important aspect of the benefits from the fisheries of the Benguela. For instance, the contribution to GDP provides a measure of the importance of fisheries at the macroeconomic level, while economic rent and employment generated provide indications of the contribution of fisheries to the livelihood of people and the profitability of businesses at the micro level. Also, by providing numbers on exports, we provide indications of how the post-harvest sector is impacted, as well as the sector’s contribution to the region’s foreign exchange earnings.
Cost and benefits from the status quo (current) fisheries management
The estimated benefits from the status quo management scenario are given in the table below. We see from the table that significant benefits accrue to the countries in terms of economic rent, export values, jobs, etc.
Table 1ES: Annual landings (000 t.); landed values, economic rent, export value (million N$/rand for Namibia and South Africa; billion Kwanza for Angola); Contribution to GDP (%), and jobs (person years).
|
|
Namibia |
South Africa |
Angola |
|
Landings |
572 |
450 |
220 |
|
Landed values |
1 177 |
1 291 |
11.9 |
|
Economic rent |
602 |
462 |
3.2 |
|
Export values |
1 590 |
711 |
2 676 |
|
Contribution to GDP |
8.5 |
0.45 |
4 |
|
Jobs |
7 200 |
26 000 |
30 000 |
The table below summarizes the estimated cost of current fisheries management by Namibia, South Africa, BCLME
Table 2ES: Annual cost of current fisheries management. Total cost in million N$/rand for Namibia, South Africa, BCLME, BENEFIT and SADC Programme; million Kwanza for Angola.
|
|
Total cost |
|
Namibia |
66 |
|
South Africa |
306 |
|
Angola |
357 |
|
BCLME |
45.6 |
|
BENEFIT |
12.5 |
|
SADC |
6.8 |
From the table above, we see that the total annual cost of management to the countries and the regional programmes, taken together, are well below the economic rent derived from the fisheries.
The estimated potential net benefits
The key economic indicator of the performance of fisheries management is economic rent. Converting the economic rent from the three countries into N$/R, gives a total annual economic rent of R 1289 million. The N$/R equivalent total cost of fisheries management is R 462 million. This indicates a significant net benefit from current fisheries management in the three countries.
The Strategic Action Plan (SAP) contains a proposal for the establishment of an Interim Benguela Current Commission (IBCC). The SAP envisages that the IBCC will be a transitional management entity, which will function as the precursor to the Benguela Current Commission.
Quantifying potential benefits
There are two potential benefits of regional cooperative management. First, it will help minimize the risk of wasteful use of shared stocks. That is, it will mitigate the economic risk of non-cooperative management. Second, it can help increase the cake by arranging harvesting by all countries involved in such a way that shared stocks are allowed to grow to their fullest economic potential.
It appears that the SAP proposal will, at least, minimize the economic risk of non-cooperation by providing scientific information on shared stocks, and a framework within which the countries can manage these resources to mitigate this risk. The maximum value of this risk is the current economic rent derived by all the countries from shared stocks. This is estimated to be equal to N$ 502 million, R 213 million and Kwanza 330 million, in Namibia, South Africa and Angola, respectively. This gives a total economic rent from shared stocks of R 738 million. This amount is actually the maximum potential economic risk of non-cooperation. Without regional cooperative management, there is the risk that all the economic rent from the shared stocks of the BCLME would end up being dissipated. In addition, the lack of joint management will reduce the landed values, jobs, and export revenues derived from shared stocks. At the extreme, most of these values can disappear if overfishing leads to the depletion of the shared fish stocks.
The SAP proposal is not far reaching enough in terms of actual cooperative management of the shared resources. We therefore assume that this scenario is not likely to lead to the second benefit expected from cooperation.
Quantifying potential costs
We assume that the countries will continue their current management functions at the current levels of cost. In addition, each country will incur additional cost to help coordinate the activities of the IBCC with national fisheries management activities. We take as our point of departure, the current cost of running the BCLME, BENEFIT and SADC-MCS programmes, and then adjustment this to incorporate the additional coordination costs alluded to earlier. Due to the lack of data, we assume that each country will incur an additional coordination cost of 5% of current management costs. This assumption implies additional coordination cost of R 3.3, 15.3 and 1.26 (17.85 Kwanza) million for Namibia, South Africa and Angola, respectively.
Table 24: Estimated cost of current fisheries management (R million)
|
Cost elements |
Amount (R million) |
|
Current cost of the BCLME Programme |
45.6 |
|
Current cost of the BENEFIT Programme |
12.5 |
|
Additional coordination costs |
|
|
Namibia |
3.3 |
|
South Africa |
15.3 |
|
Angola |
1.26 |
|
Total |
77.96 |
The estimated potential net benefits
For a total cost of R 77.96 million, this management scenario has the potential to protect and provide insurance against the risk of non-cooperation, at a maximum amount of R 738 million annually. Even if only 15% of this amount is lost due to non-cooperation, our analysis indicates that there will still be a net gain from establishing the IBCC.
This scenario is based on the assumption that each country would designate a lead ministry with primary responsibility for coordinating the participation of all relevant ministries and stakeholders from those countries in BCLME activities. Each lead ministry would also be responsible for driving the implementation of BCLME activities in that country and in reporting back to BCC structures.
Quantifying potential benefits
Similar to the case of the SAP proposal, this cooperative management scenario will remove the economic risk of non-cooperation. The maximum value of this insurance against the risk of non-cooperation is the estimated total economic rent from shared stocks of R 738 million. This management scenario is also far reaching enough in terms of actual cooperative management of the shared resources that, if properly implemented, will potentially lead to the second benefit expected from cooperation, namely, increase size of the cake by arranging harvesting by all countries involved in such a way that shared stocks are allowed to grow to their fullest economic potential. It has recently been estimated that the potential increase in economic rent from Benguela hakes due to the introduction of cooperative management is about 40%. A survey of the literature shows that this is actually a conservative estimate. Much higher gains have been estimated for shared stocks in other parts of the world. Based on this estimate, the total potential benefit of implementing this management scenario in terms of economic rent is R 1033 million.
Quantifying potential costs
We assume that the countries will continue their current management functions at the current levels of cost. We therefore focus on the cost of regional management. We take as our point of departure, the current cost of running the BCLME and BENEFIT programmes, and then make adjustments to this to incorporate the cost of new elements in the management scenario. An annual amount of R 7.5 million is budgeted to cover the cost of convening meetings of the BCC, R 26.8 million per annum to run the Activity Centres/Advisory Groups, R 5 million per annum to cover the cost of operating Permanent and Ad hoc Working Groups, and R10 million to cover the cost of ‘other institutional arrangements’.
Table 4ES: Estimated cost of current fisheries management (R million)
|
Cost elements |
Amount (R million) |
|
Current cost of the BCLME Programme |
45.6 |
|
Current cost of the BENEFIT Programme |
12.5 |
|
Additional costs |
|
|
Ministerial Commission |
7.5 |
|
Permanent and Ad Hoc Working Groups |
5.0 |
|
Advisory Groups |
26.8 |
|
Other institutional arrangements |
10 |
|
Total |
107.4 |
The estimated potential net benefits
The total potential gain from this cooperative management scenario is estimated to be the sum of the insurance against the risk of non-cooperation, and the potential for an increase in the economic rent that can be derived from the shared resources of the BCLME. This is calculated to be R 1 033 million annually. The annual cost of implementing this scenario is estimated at R 107.7 million. Therefore, the potential for achieving significant net benefits from this scenario is high. In fact, only about 10% of the estimated benefits are needed to cover the estimated cost.
Since environmental pollutants do not respect national borders, significant benefits may also be derived from cooperation in this area. Close collaboration with the ministries managing the exploitation of non-living marine resources will be crucial in dealing with environmental problems. Work by the BCLME programme in this respect will form a good basis for the future task of the IBCC in this regard.
Benefits may also be obtained due to the economies of scale with respect to training of regional expertise. Joint management of the Benguela could also result in the cultivation of political goodwill, which may produce a positive effect on conflict resolution between the three countries; and thereby help in the resolution of border problems, for example. The BENEFIT and BCLME programmes have already made significant contributions in this regard.
Ecosystem based management is crucial if regional cooperative management is to succeed. In order words, an essential requirement for the attainment of the net benefits presented above is ecosystem based management. This management approach is beneficial in evaluating management policies that take into consideration the dynamics of the entire area including all components. There are many factors contributing to the productivity of one species, fishing pressure is an important factor but not necessarily the only influence. Ecosystem-based management recognizes that certain non-fishery activities have an impact on the marine ecosystem and have consequences for management. These include predator-prey interactions and land-based and sea-based activities, which affect habitat, water quality, fisheries productivity, and food quality and safety.
In recognition of the importance of ecosystem based management, the three BCLME countries have already indicated their intention to adopt this approach, as it is apparent from their Strategic Action programme. In fact, the BCLME Programme in collaboration with the FAO has already commissioned a project to address the question “Is it possible to introduce a more holistic system of fisheries management in the Benguela Current Large Marine Ecosystem?” The result of this study will provide the basis needed for the management of the BCLME as a whole, and therefore help Angola, Namibia and South Africa to reap the economic benefits of such management.
It is worth noting that there already exist structures, which would facilitate the formalization of the IBCC. For example, members of the current BENEFIT programme management committee are also members of the BCLME Programme Steering Committee (PSC). There is also a BCLME/BENEFIT liaison committee which regularly meets for consultations. Therefore, there are institutional structures and working relationships between the two programmes that will serve the IBCC very well.
We recommend that the IBCC should commerce at a modest level, using the experience gathered over the years from the BCLME and BENEFIT programmes. This approach will allow for learning and the building of confidence and mutual trusts between the parties, which are all crucial for the success of the Commission. An additional beauty of this approach is that it will initially not need a huge infusion of new resources.
A fundamental issue that must be agreed upon is how to fund the IBCC sustainably. Ultimately the resources for running the IBCC will have to come from the region if the Commission is to be sustainable over the long run. Various funding sources should be explored and analyzed to help determine the combinations of funding opportunities that will work best. One can foresee a funding structure that consists of both internal and external sources, especially in the beginning of the IBCC. The good news is that even if a fraction of the predicted increase in economic rent that would result from joint management is realized, a move to such joint management will more than pay for itself.
Experience from around the world demonstrates that strong political commitments, at the highest level of government, are required to make joint management work. Therefore, if the region decides to establish the IBCC, it would have to fully back it up politically.
To help the new IBCC get on its feet, we recommend that current funding levels by international donors be continued until a selected date sometime in the future, when the national governments of Angola, Namibia and South Africa will take over the full funding of the Commission.
It is crucial for the success of the IBCC that all stakeholders in the fishing sectors of the three countries (or at least a significant majority) strongly support the concept of joint management. Efforts should be put into making this happen.
To help deal with the occasional disputes that are bound to occur from time to time, the parties need to put in place a binding dispute resolution mechanism.
The following points should be given special attention when designing the nature and structure of the IBCC. First, care should be taken to make sure that the sovereignty issue does not become a significant problem. Second, the fact that there is no assurance that the member states will have identical resource management goals is important, and needs to be taken into account. Third, there will be the need for high quality research, the results of which are seen as being credible by all parties. Fourth, secured sustainable funding and strong political commitment by the countries should be at the center of the development of the IBCC.
Finally, the new Commission should put in place structures for collaborating with international organizations such as ICCAT, SADC and SEAFO.
1. 0. Introduction
1.1. Terms of reference
Objectives
The objective of the proposed study is to analyze the economics of fishery management and other marine industries in the Benguela Current Large Marine Ecosystem (BCLME), reviewing the case for and against regional co-operation in managing the LME.
The analysis is undertaken for the major transboundary commercial fisheries of the region using hake as the core species underlying the study. Insights from the hake analysis are then extended to make inferences about the transboundary management of the other major commercial species, in particular, the pilchard and horse mackerel fisheries. As a further extension, brief descriptions of the potential for managing other natural resources in the Benguela LME, namely, marine mining, offshore oil and gas, maritime transport and tourism sectors, are made as far as it is possible.
Economic analysis of the status quo management of the BCLME
We analyze the current domestic costs and benefits of fishery management in Angola, Namibia and South Africa, providing a default scenario for further analysis. The analysis utilizes appropriate and comparable economic yardsticks that provide estimates of costs and benefits of current management systems in the three countries of the BCLME.
Economic analysis of the incremental costs and benefits of regional cooperative management of the BCLME
We identify the incremental costs and benefits attached to and derived from regional co-operation on fisheries management and environmental protection to the three countries individually and to the region as a whole.
We assess the costs and risks associated with non-co-operation in fishery management, environmental monitoring and resource protection regionally.
We also provide a general assessment of the net benefits of joint ecosystem management in the region, and discuss its contribution to broader national and regional development objectives such as food security, poverty alleviation and job creation.
Provide economic case for taking an ecosystem approach to LME management
With input and guidance from other team members, we review and present the economic case for taking an ecosystem approach to LME management relative to traditional fisheries management models in relation to fisheries, and as far as possible non-fisheries benefits (e.g. recreational fishing, coastal tourism).
Outputs from analyses above
Based on the analysis above, we provide recommendations on the scope and scale of regional co-operation i.e. joint enforcement, scientific investigation, joint stock assessment and monitoring, for different fisheries needed to optimize domestic and regional benefits.
We provided inputs as far as it was feasible to the Institutional Review team in their compilation of the Institutional Review report.
An executive summary, documenting the key findings of the study is included as part of this report. The summary paper will be presented in a format that is presentable to decision makers in the Planning and Finance Ministries of the three countries.
1.2. Addressing terms of reference
To address the questions raised by the TOR, the following will have to be answered:
Are the resources, mainly the living but also the non-living, shared by the countries of the Benguela?
Is there transboundary sharing of the environmental pollutants?
Is joint management of the BCLME necessary?
Can joint managed be justified economically: What does theory and practice have to say about this?
Is joint management politically feasible?
The next sections of the paper will address each of the above and more.
1.3. The Benguela Current Large Marine Ecosystem (BCLME)
The BCLME can be seen as covering the continental shelf between the Angola-Benguela frontal zone in Northern/Southern Angola and the Agulhas retoflection area, typically between 36 and 37 degrees South (Shannon and O’Toole, 1998). It therefore covers the west coast of South Africa, the entire Namibian coast, and Southern Angola depending on the position of the Angola-Benguela front, which moves seasonally between 14 and 17 degrees South (see Fig. 1). The BCLME is one of the world’s major, productive eastern-boundary currents. It is rich in both pelagic and demersal fish populations, supported by plankton production driven by intense coastal upwelling (see Boyer and Hampton, 2001; Sumaila and Vasconcellos, 2000).
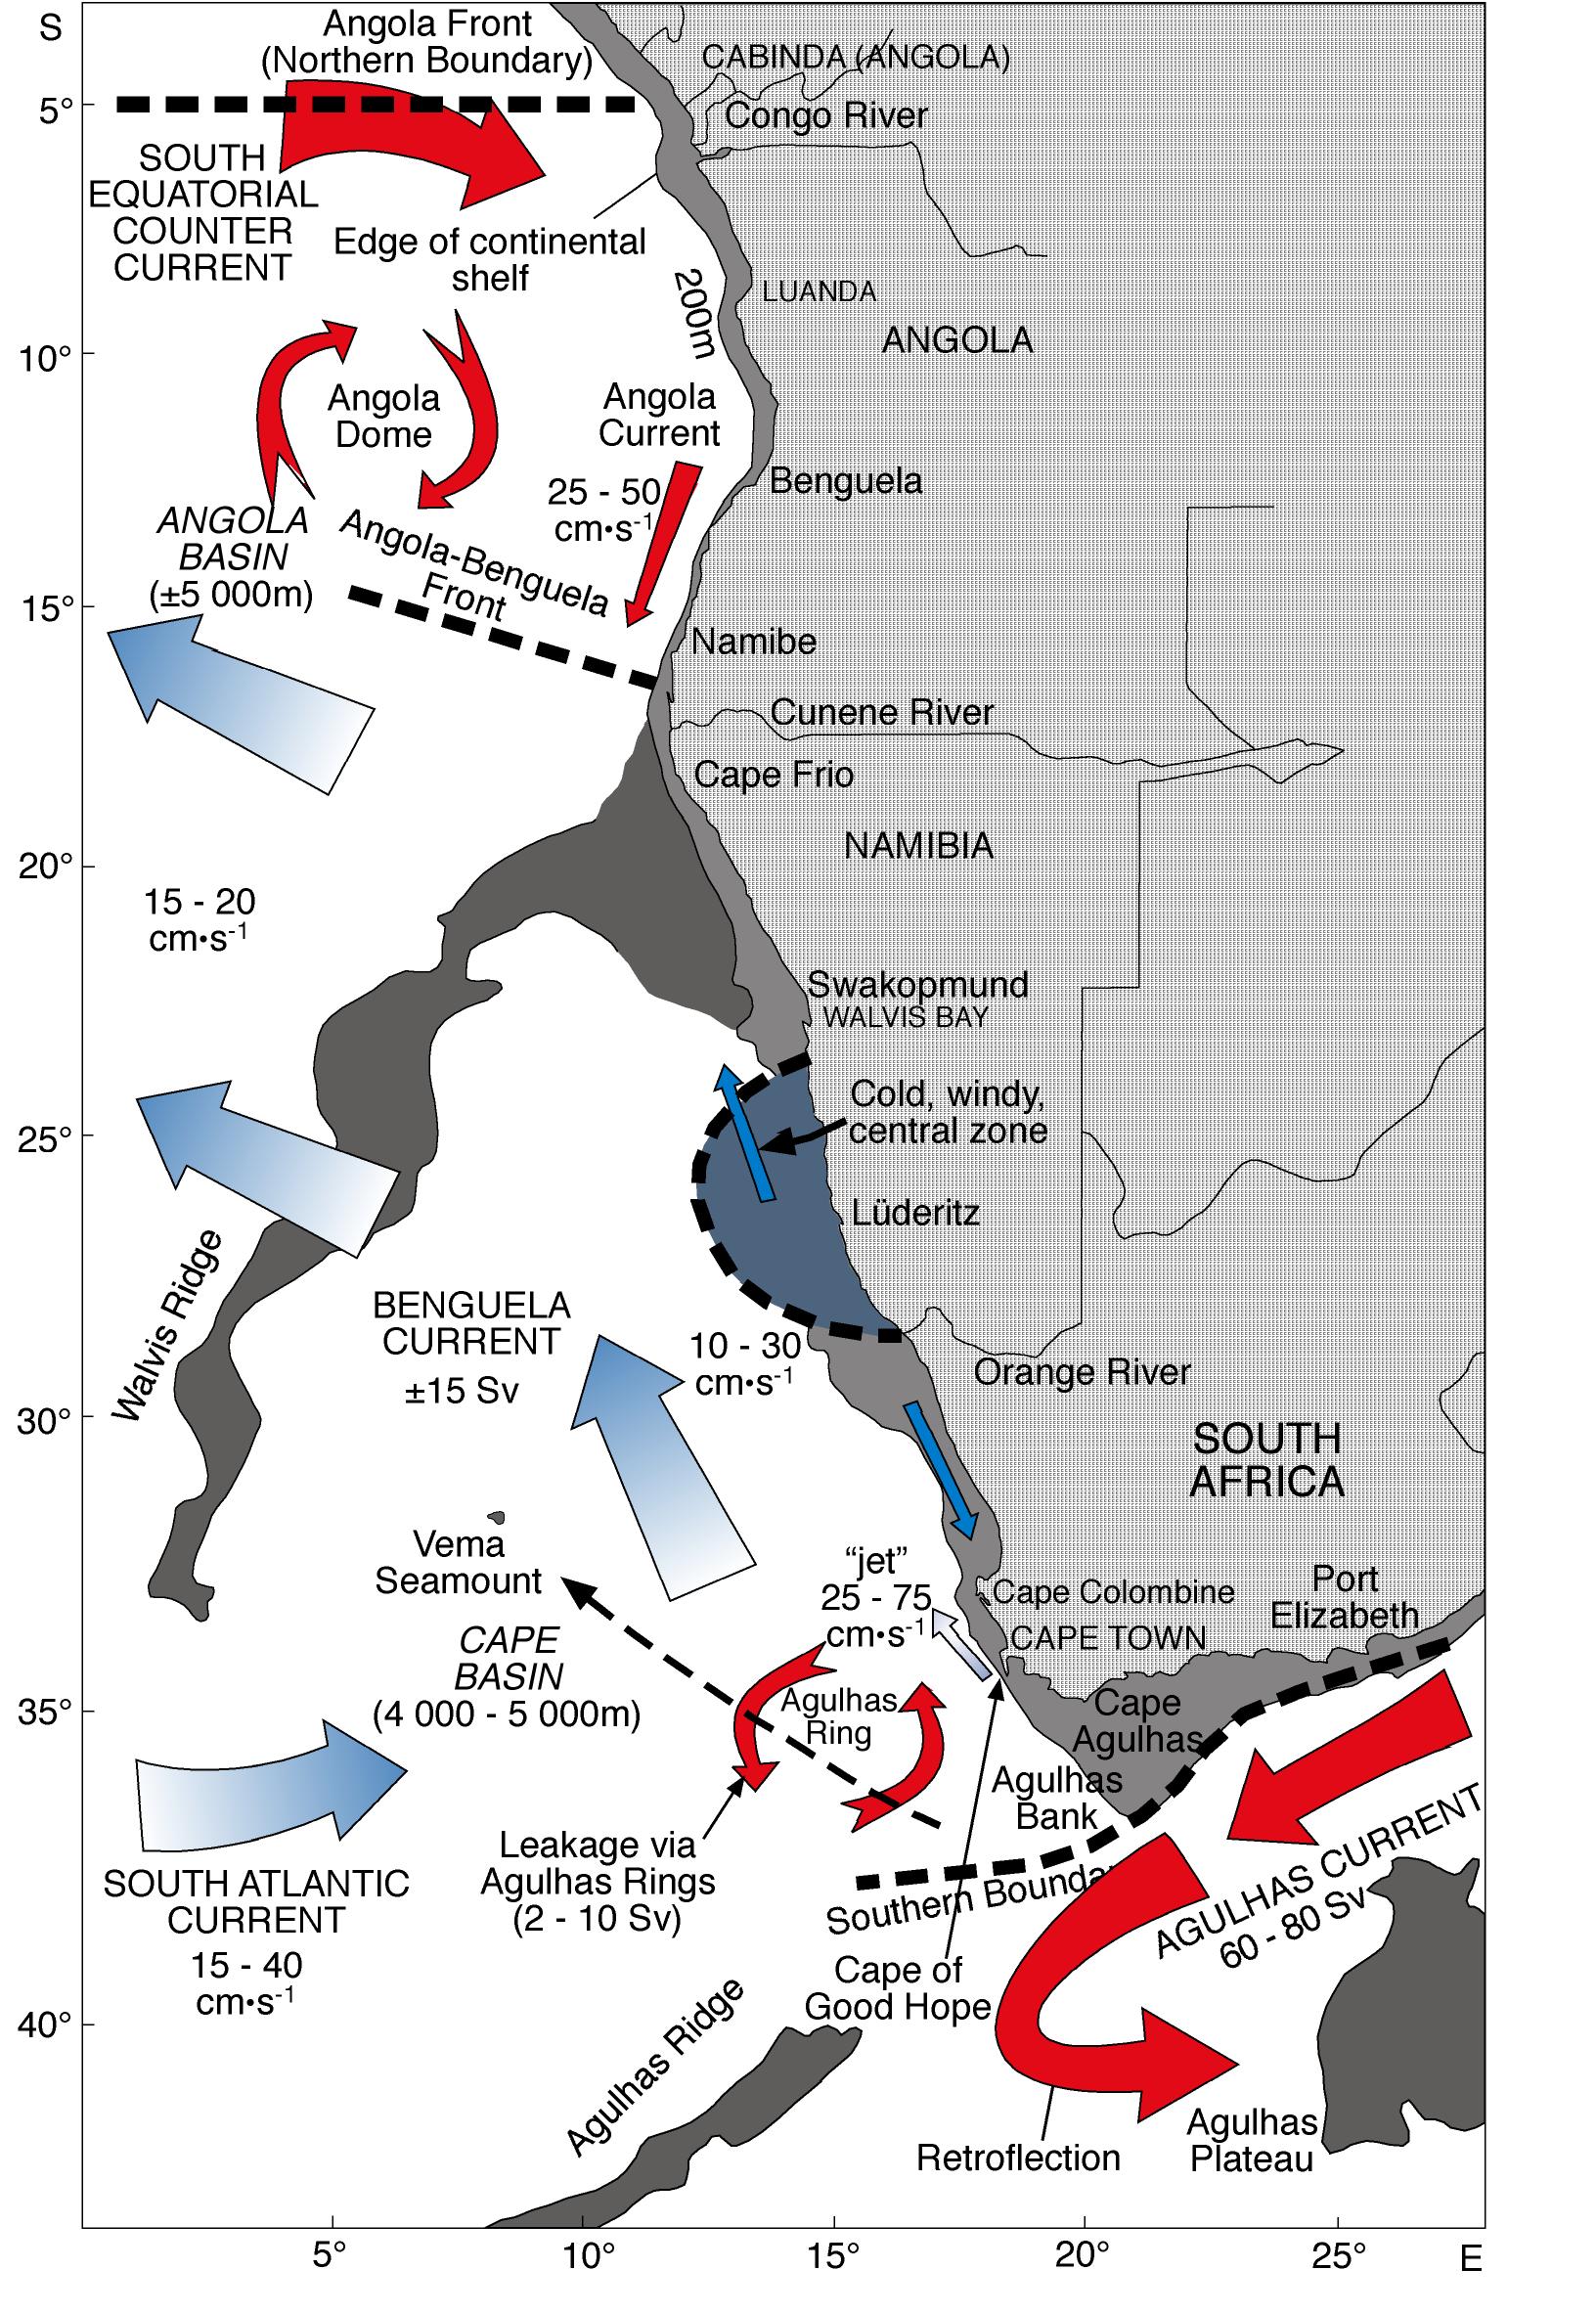
Figure 1: The Benguela Current Large Marine Ecosystem (BCLME)
1.4. Shared stocks defined
The FAO defines shared fish stocks as any fish stock, which is exploited by, more than one state/entity (Munro et al., 2004). The FAO sets forth four non-mutually exclusive categories of such stocks:
fish resources crossing the EEZ boundary of one coastal state into the EEZ(s) of one or more other coastal states – transboundary stocks;
highly migratory species, as set forth in Annex 1 of the 1982 UN Convention on the Law of the Sea (UN, 1982) consisting primarily, of the major tuna species. Being highly migratory in nature, the resources are found, both within the coastal state EEZ, and the adjacent high seas;
all other fish stocks (with the exception of anadromous/catadromous stocks) that are found, both within the coastal state EEZ and the adjacent high seas – known as straddling stocks;
fish stocks found exclusively in the high seas – denoted discrete high seas fish
stocks (Munro, et al., 2004).
Most BCLME fish stocks, in particular hake, are found mainly within the EEZ boundaries of the neighbouring states of Angola, Namibia and South Africa, and not in the high seas (Sumaila et al., 2003). Hence, they fall almost entirely into category (a), transboundary stocks. This is fortunate, since the management of categories (b), (c), and (d) stocks prove to be much more demanding and complex than the management of transboundary stocks (Munro, et al., 2004).
1.5. Are the living marine resources of the BCLME shared?
To address this question, we reviewed the literature and interviewed a number of experts and fisheries managers in the region. In general, almost all the people interviewed believe that a number of commercially important species in the Benguela Current Large Marine Ecosystem (BCLME) (e.g., hake, horse mackerel, deep sea crab, bronze whaler sharks, tuna, and to a lesser extent, pilchard and anchovy) are widely distributed and move seasonally across national borders, and can therefore be classified as shared stocks. The hake stocks of the Benguela have been classified by a recent review (RFIS, 2002) as a prime candidate for cooperative management in the South African Development Cooperation (SADC) region because of their shared nature and the fact that hake is the most valuable commercial species exploited in the large marine ecosystem. The general understanding is that the deep-water hake (paradoxus) is shared mainly between Namibia and South Africa. Most believe that the shallow water hake (capensis) is not shared directly. But there is evidence to show that there is a predator-prey interaction between the two species, in which case the capensis hake can be considered shared, albeit indirectly. In the case of pilchard and horse mackerel, the general understanding is that the stocks are shared primarily between Angola and Namibia.
1.6. The legal obligations of coastal states sharing transboundary resources
The legal obligations of coastal states such as Angola, South Africa and Namibia, sharing transboundary fish stocks are set forth in the 1982 UN Convention on the Law of the Sea (UN, 1982). The Convention has only one provision pertaining directly to the management of such stocks, namely, Article 63(1), which reads as follows:
Where the same stock or stocks of associated species occur within the exclusive economic zones of two or more coastal States, these States shall seek, either directly or through appropriate sub regional or regional organizations, to agree upon the measures necessary to coordinate and ensure the conservation and development of such stocks without prejudice to the other provisions of this Part [V] (UN, 1982, Article 63(1)).
The Convention imposes a duty upon the relevant coastal states to negotiate over arrangements for the management of transboundary stocks. Importantly, however, the Convention does not impose a duty upon the states to reach an agreement. If the states are unable to reach an agreement, then each state shall manage that segment of the transboundary stock occurring within its EEZ. It shall do so in accordance with the rights and duties relating to fisheries management and conservation by a coastal state within its EEZ, as set forth by the Convention (Munro et al., 2004).
In entering into negotiations with respect to the management of such resources, the coastal states, of course, do so in good faith. To quote the International Court of Justice, the states “----are under the obligation so to conduct themselves that the negotiations are meaningful, which will not be the case when either of them insists upon its own position without contemplating any modification of it” (cited in Munro et al., 2004). Nonetheless, the point remains. If such coastal states enter into meaningful negotiations and find that there is no reasonable basis of cooperation, they have the legal right to decline to enter into a cooperative agreement. Each state would then proceed to manage its share of the resource to the best of its ability. This outcome could arise, for example, if the states came honestly to the conclusion that the costs of establishing a cooperative resource management agreement would exceed the anticipated benefits.
1.7. Economic rationale for shared management
From the discussion in section 2, it can be seen that the fisheries sector ranks high in national importance in Namibia. For instance, fish products accounted for 23% of all exports in 1996 (second only to diamonds), and up to 10% of GDP (Tapscott, 2001). Even though the same cannot be said in the case of South Africa (only about 0.5% of GDP is contributed by the fisheries sector), exports are about the same size as those of Namibia. The industry is also an important source of revenue and food in coastal areas, especially in the Western Cape Province, where about 90% of all South African hake are landed. The sector is an influential source of employment in Namibia, although, in this regard, the fishing sector makes a much smaller contribution to South Africa nationally. Fishing in Angola is less important in terms of formal economic activity but is essential to the social fabric of the country in terms of employment and food security. All in all, the fishing sectors in Namibia, South Africa and Angola are economically and socially important. Even in South Africa, where the economy is much more diverse, the socio-economic incentives of optimising resource rent from the hake fishery are significant.
Many economic studies have demonstrated that non-cooperative management of shared fish stocks has undesirable consequences. Even when a given fish remains within the national borders of a country, there are gains to be made from cooperative agreement if different groups of fishers operate in the fishery. For instance, Sumaila (1997) showed that when two different types of vessel gears with different selectivity patterns are employed to exploit the same stock of fish, cooperative management yields some significant gains. With respect to the shared hake stocks of the BCLME, preliminary work by Armstrong and Sumaila indicate that the potential cost of non-cooperative management of the hake stocks of the BCMLE is significant. Probably amounting to over 40% of the discounted rent that is currently being obtained by Namibia and South Africa (Armstrong and Sumaila, 2004).
2.0 Background to fisheries in Namibia, South Africa and Angola
2.1 Namibia
The fisheries sector is the third-largest of the Namibian economy, behind agriculture and mining. The industrial fishery has generated up to 10% of the country’s GDP in recent years. In 2003, the country’s 335 vessels of which 80% were Namibian flagged, landed over 600 000 tonnes of fish (Iyambo, 2004). Landed value of N$ 1 558 million was realised in 1998 from the country’s fisheries. Exports were valued at N$ 2 147 million in that year, making the sector the second-largest export earner behind mining. It is the second-fastest growing industry in the Namibian economy (behind tourism) with the value of production and exports now being six times greater than at Independence.
The fisheries sector is extremely important in the social economy of Namibia, particularly in Walvis Bay, which is the major fishing port and where most of the processing plants are situated. Local employment in the sector grew rapidly after Independence, with an estimated 6 000 jobs having been created between 1991 and 1994. The number of people directly employed in the fisheries sector in 1996 was about 15 000, of which some 7 500 were fishermen. Of these 43% were foreigners, mainly in the horse mackerel and tuna fisheries, a proportion that has decreased from around 66% in 1993. The demersal fishery is the most valuable fishery in Namibia, with hake the dominant commercial species. Almost the entire demersal catch is exported.
2.2. South Africa
South Africa’s living marine resources of the Benguela Current form the basis of a fishing industry which supports some 26 000 people (mostly in the Western Cape), and supplies food for the whole Southern African subregion. In 1997, the South African fishing industry caught a total of 445 000 tonnes of fish, shellfish and seaweed nationwide, of which more than 90% was taken from the Benguela. The wholesale value of the total processed output in this year was estimated at R 1 953 million, with an export value of R 873 million. Fishing is particularly important in the social economy of the Western Cape, where some entire coastal communities depend directly or indirectly on fishing for their livelihood. However, the fishing industry yields less than 1% of South Africa’s GDP.
Economically, the trawl fishery is the most important sector of the South African fishing industry. Catches of hake, which amounted to 147 000 tonnes in 1997, usually contribute about 70% of the trawl catch and about 80% of its value. In 1997 the landed value of processed products from a total demersal trawl catch of 200 000 tonnes was R 428 million. The value of hake exports in 1997 exceeded R 300 million; about a third of the total revenue from all South African fish and shellfish exports.
2.3. Angola
The fisheries sector is very important in Angola, being the third-most important industry after oil and diamond mining. It provides nearly half of the animal protein of the country, and it is an important source of employment and food to populations of the coastal regions, where it is often the only source of livelihood for the poorer population groups. Domestic consumption of fish, which was estimated at about 11 kg per person per annum in 1994, is the highest in the region.
According to the results of a survey conducted in 1992, there were at that time around 30 000 workers directly involved in activities of the fisheries sector, of which some 18 000 were involved in artisanal fisheries. The remainder were involved in industrial fisheries and public administration. In addition, it was estimated that some 5 000 persons (mainly women) were involved in informal fish trade activities. A more recent report (Delgado and Kingombo, 1998) puts the number of artisanal fishermen a few years later at over 23 000, and the number of people involved in informal fish trading at between 20 000 and 30 000. Current numbers directly involved in fishing (not including subsistence fishers) are estimated at 25 000 (Duarte, 2002 pers. comm.). Many artisanal fishers are not able to make a living solely from fishing, and supplement their incomes by, for example, agricultural and commercial activities.
At present, roughly half of the revenue from fish and fish products in Angola comes from exports, which varied in value between US$ 27 million in 1993 and US$ 46 million in 1995. Prawns are the most important product, making up 48% of the total revenue from the fishery sector in 1995, for example. The main export markets are Europe for prawns and demersal fish, African countries for small pelagic fish including horse mackerel, and Japan for tuna and crab.
3.0. Data and information for economic analysis of the cost of fisheries management
3.1. Information for computing benefits of fisheries management
The benefits of fisheries management can be assessed by asking the question, to what extent are the fisheries management objectives for a given management jurisdiction being met. In general, one can summarize the fisheries management objectives of Namibia, Angola and South Africa, and indeed most fishing nations in the world, into three interconnected objectives, namely, (i) an ecological objective, that is, ensuring the long term sustainability of the resource base, (ii) an economic objective, that is, fishing in an economically efficient manner, and (iii) a social objective, that is, ensuring that fishing takes place in an equitable manner with respect to all stakeholders. We will emphasize in this discussion the economic and social benefits. All we will say with respect to the performance of the ecological objectives is that, relative to many fisheries in the world, the resources of the Benguela are considered to be reasonably well managed to ensure their long term sustainability (Shannon et al., 2004; Sumaila et al., 2004).
We focus on the commercial values from the fisheries of the Benguela in what follows. This is not to say that non-commercial values are unimportant, but rather, our point of departure is that if it can be shown that the increase in commercial values from joint management of the resources of the BCLME exceed the cost, then the extra benefits from non-market values will be a bonus. To investigate the net commercial benefits from current and future management of the fisheries resources of the Benguela, we analyze, as far as data availability will allow, data on the following key economic indicators: (i) landings, (ii) landed values, (iii) economic rent, (iv) exports (v) contribution to GDP and (v) employment/food security, for each of the three countries.
We do not include the initial cost of providing physical structures. That is, we provide an analysis of only the cost of running the new management Commission. A key reason for taking this approach is that the new Commission can use the existing physical structures used by the BENEFIT and BCLME programmes.
Each of these variables will capture an important aspect of the benefits from the fisheries of the Benguela. For instance, the contribution to GDP provides a measure of the importance of fisheries at the macroeconomic level, while economic rent and employment generated provides indications of the contribution of fisheries to the livelihood of people and the profitability of businesses at the micro level. Also, by providing numbers on exports, we provide indications of how the post-harvest sector is impacted, as well as the sector’s contribution to the region’s foreign exchange earnings.
As would be expected, there are data limitations. Namibian fisheries data on the variables to be analyzed were more readily available. Data on South African fisheries were patchier. In the case of Angola, we could hardly find any data. This means that we had to make a number of assumptions in analyzing the data available to us. Most of the data we report below are from the mid and late 1990s. Sometimes we have data for a number of years, sometimes we have data for only one year. For our analysis, we employ annual data, depending on data availability, we use average annual values, or just the data for one year. This approach will not give us perfect estimates of costs and benefits but will provide us with estimates of these that would be good enough for our purpose. That is, to provide reasonable estimates of the costs and benefits of incremental regional cooperative management of the resources of the Benguela.
Namibian data and information
Landings
The table below reports total official Namibian fish landings for the period 1994 to 1998, for the major commercial species of Namibia. We see from the table that even though landings from pilchard have been very volatile, the total landings have remained within the 500-650 000 t. range, with an average landings of about 571 500 t. over the years.
Table 1: Landings of fish, 1994-1998 (1000 tonnes). Source: MFMR, Namibia
|
|
1994 |
1995 |
1996 |
1997 |
1998 |
|
Pilchard |
116 |
43 |
1 |
28 |
69 |
|
Anchovy |
25 |
48 |
1 |
2 |
5 |
|
Hake |
112 |
130 |
136 |
118 |
151 |
|
Horse Mackerel |
365 |
311 |
321 |
302 |
312 |
|
Monk |
12 |
10 |
10 |
10 |
16 |
|
Kingclip |
2 |
4 |
4 |
2 |
2 |
|
Tuna |
4 |
3 |
2 |
1 |
1 |
|
Rock lobster |
0.1 |
0.2 |
0.3 |
0.2 |
0.4 |
|
Crab |
4 |
2 |
2 |
2 |
2 |
|
Orange roughy |
0.03 |
6 |
13 |
19 |
11 |
|
Alfonsino |
0 |
1 |
2 |
0.4 |
0.2 |
|
Other |
8 |
11 |
32 |
27 |
35 |
|
Total |
648 |
568 |
524 |
511 |
606 |
Of the average landings of 571 500 t. between 1994 and 1998 reported in table 1, about 507 400 t. or 89% is landings of hake, horse mackerel, pilchard, tuna and crab, that is, the species that are known to be shared.
Landed values
Landed values from Namibia’s fisheries are reported in the table below. The average total landed values from all commercial fisheries for the period 1994 to 1998 is calculated from the table as N$ 1 177 million in current value.
Table 2: Landed value of Namibian fish, by fishing method (current $ millions)
|
|
1994 |
1995 |
1996 |
1997 |
1998 |
|
Pelagic |
106 |
96 |
29 |
74 |
103 |
|
Demersal |
404 |
494 |
597 |
595 |
802 |
|
Midwater |
267 |
243 |
449 |
386 |
462 |
|
Deepwater |
0.2 |
48 |
109 |
137 |
106 |
|
Tuna |
39 |
22 |
13 |
10 |
8 |
|
Linefish |
4 |
5 |
5 |
7 |
9 |
|
Crab |
32 |
18 |
20 |
17 |
27 |
|
Rock Lobster |
6 |
10 |
18 |
14 |
28 |
|
Other |
23 |
9 |
11 |
12 |
14 |
|
Total landed value |
881 |
945 |
1251 |
1252 |
1669 |
Using data reported in Stuttaford (1999), we calculated the proportion of the total landings reported in table 1 above that can be assigned to species that are known to be shared. The results from our calculations are reported in table 3. Using this as a basis, we compute and report in table 2 the landed values from the various groups reported in table 1.
Table 3: Proportion of shared stocks in landings of pelagic, demersal trawl and longline, midwater trawl, tuna and crab groups. Source: Stuttaford (1999).
|
|
1994 |
1995 |
1996 |
1997 |
1998 |
Average |
|
Pilchard (pelagic) |
0.66 |
0.29 |
0.01 |
0.21 |
0.54 |
0.34 |
|
Hake (demersal) |
0.87 |
0.85 |
0.82 |
0.75 |
0.82 |
0.82 |
|
Horse mackerel (Pelagic) |
0.19 |
0.35 |
0.78 |
0.66 |
0.20 |
0.43 |
|
Horse mackerel (midwater) |
0.99 |
0.99 |
0.98 |
0.98 |
0.99 |
0.99 |
|
Tuna |
1.00 |
1.00 |
1.00 |
1.00 |
1.00 |
1.00 |
|
Horse mackerel (demersal) |
0.01 |
0.01 |
0.01 |
0.01 |
0.00 |
0.01 |
|
Crab |
1.00 |
1.00 |
1.00 |
1.00 |
1.00 |
1.00 |
As can be seen from the table, hake and horse mackerel dominate the landed values from the demersal and midwater trawl groups. Taken together, we also see that horse mackerel and pilchard dominant the landed values from the pelagic group.
Table 4: Landed values (N$ millions) from shared stocks.
|
|
1994 |
1995 |
1996 |
1997 |
1998 |
Average |
|
Pilchard |
70 |
28 |
0.30 |
15 |
55 |
34 |
|
Hake |
350 |
421 |
489 |
444 |
661 |
473 |
|
Horse mackerel (Pelagic) |
20 |
34 |
23 |
48 |
20 |
29 |
|
Horse mackerel (midwater) |
265 |
240 |
441 |
379 |
457 |
356 |
|
Tuna |
39 |
22 |
13 |
10 |
8 |
18 |
|
Horse mackerel (demersal) |
3 |
3 |
5 |
5 |
4 |
4 |
|
Crab |
32 |
18 |
20 |
17 |
27 |
23 |
|
Total landed value |
778 |
767 |
991 |
918 |
1233 |
937 |
|
Total for Hake, Horse mackerel, Pilchard |
707 |
727 |
958 |
891 |
1198 |
896 |
From the table, we calculate that shared stocks contributed on average about 80% (N$937 million) of the landed values from Namibia’s fisheries. It is also worth noting that 76% of the total landed values come from what we describe as the ‘big three’, namely, hake, pilchard and horse mackerel. These three species provide 96% (N$ 896 million) of the landed values from shared stocks.
Economic rent
Only the estimated economic rent from the big three species are reported in the table below due to the lack of data on other species. Economic rent is the surplus after all costs related to fishing have been deducted. Given the dominance of these species, it should not be a problem to extrapolate these numbers to cover all commercial species using landed values information provided in the proceeding section of this report.
Table 5. Resource rent for pilchard, hake, and horse mackerel
(N$ million). Source: Lange (2004).
|
|
Pilchard |
Hake |
Horse Mackerel |
Total Rent |
|
1994 |
229 |
159 |
40 |
429 |
|
1995 |
201 |
209 |
39 |
449 |
|
1996 |
* |
192 |
51 |
243 |
|
1997 |
95 |
261 |
49 |
406 |
|
1998 |
150 |
640 |
91 |
881 |
* less than 1.0
Apart from a dip in economic rent in 1996 due to a dramatic drop in rent from pilchard, the reported rent has been steady at around N$ 400 million, with a huge increase in 1998, mainly due to a trebling of economic rent from hake. For the period under consideration, an average economic rent of N$ 482 million was made from the three species. Given that the ‘big three’ contribute about 80% of the landed values in this period, we estimate a total annual average economic rent of N$ 602 million for all of Namibia’s commercial species.
The big three commercial species (hake, pilchard and horse mackerel) are shared stocks, and they contributed an average economic rent of N$ 482 million. Given that the ‘big three’ contribute about 96% of the landed values from shared stocks in this period, we estimate an average economic rent from shared stocks of N$ 502 million.
Export values
A great majority of Namibian fish products are sold in foreign markets. The table below shows the export earnings that accrued to Namibia from exporting fish products.
Table 6: Export value of Namibian fish, by fishing method (current $ millions)
|
|
1994 |
1995 |
1996 |
1997 |
1998 |
|
Pelagic |
458 |
395 |
44 |
233 |
374 |
|
Demersal |
484 |
600 |
715 |
712 |
1077 |
|
Midwater |
261 |
237 |
432 |
373 |
453 |
|
Deepwater |
0.3 |
71 |
156 |
196 |
156 |
|
Tuna |
66 |
51 |
47 |
46 |
8 |
|
Linefish |
4 |
5 |
5 |
7 |
9 |
|
Crab |
32 |
18 |
20 |
17 |
27 |
|
Rock lobster |
9 |
16 |
22 |
17 |
29 |
|
Other |
23 |
9 |
11 |
12 |
14 |
|
Total export value |
1338 |
1401 |
1451 |
1612 |
2147 |
We see that over the years under consideration, there has been an increase in the value of Namibian fish exports, with a lot of the heavy lifting coming from the demersal group (read ‘hake’). The average export value for the period from 1994 to 1998 is N$ 1 590 million.
Using the data on the proportion of total landings of Namibian fish that are shared as a basis (table 3); we compute and report in table 7 the export values that can be assigned to shared stocks.
Table 7: Export values from shared stocks.
|
|
1994 |
1995 |
1996 |
1997 |
1998 |
Average |
|
Pilchard |
301 |
115 |
0.45 |
48 |
201 |
133 |
|
Hake |
419 |
512 |
585 |
531 |
888 |
587 |
|
Horse mackerel (Pelagics) |
87 |
138 |
34 |
153 |
74 |
97 |
|
Horse mackerel (midwater) |
259 |
234 |
425 |
365 |
448 |
346 |
|
Tuna |
66 |
51 |
47 |
46 |
8 |
44 |
|
Horse mackerel (demersal) |
4 |
4 |
6 |
6 |
5 |
5 |
|
Crab |
32 |
18 |
20 |
17 |
27 |
23 |
|
Total landed value |
1168 |
1073 |
1117 |
1167 |
1650 |
1235 |
|
Total for Hake, Horse mackerel, Pilchard |
1070 |
1003 |
1051 |
1104 |
1615 |
1169 |
Of the total average export value of N$ 1 590 million, 78% (N$ 1 235 million) is derived from species that are known to be shared. The big three commercial species contribute 74% of the total export value, and 95% of the export value derived from shared stocks.
Contribution to GDP
Table 8: Contribution of the fishing industry to GDP (current $ millions). Source: www.mfmr.gov.na
|
|
1994 |
1995 |
1996 |
1997 |
1998 |
|
Fishing |
349 |
376 |
477 |
491 |
616 |
|
Fish processing |
494 |
550 |
354 |
525 |
861 |
|
Total contribution |
843 |
927 |
831 |
1,017 |
1,477 |
|
Percentage of GDP |
8.6% |
9.0% |
7.0% |
7.8% |
10.1% |
The contribution to GDP ranged between 7.8 and 10% in the five years from 1994 to 1998, with an average of 8.5% over the years. Given that the estimated landed value derived from shared stocks is 80% of the total for all species, we can attribute the portion of the contribution to GDP to these stocks. That is, shared stocks contribute about 6.8% to Namibia’s GDP.
Employment/food security.
The fisheries sector is important as a source of employment in Namibia, particularly, in Walvis Bay, which is the major fishing port and where most of the processing plants are situated. We report in the table below, the number of jobs in the fishing sector from 1994 to 1998.
Table 9: Employment in Namibian fisheries by fishing method (person years). Source: MFMR, Namibia.
|
|
1994 |
1995 |
1996 |
1997 |
1998 |
Average |
|
Pelagic |
493 |
445 |
476 |
562 |
374 |
470 |
|
Demersal |
1967 |
2427 |
3016 |
2649 |
2212 |
2454 |
|
Midwater |
2664 |
2409 |
2141 |
2100 |
1606 |
2184 |
|
Deepwater |
|
|
|
261 |
139 |
71 |
|
Tuna |
1112 |
1356 |
940 |
957 |
1205 |
1114 |
|
Linefish |
268 |
342 |
294 |
277 |
316 |
1497 |
|
Crab |
190 |
147 |
118 |
73 |
101 |
126 |
|
Rock lobster |
550 |
674 |
541 |
525 |
429 |
544 |
|
Total employment |
7244 |
7800 |
7526 |
7404 |
6382 |
7271 |
From the table we see that the total number of jobs in the fishing industry has remained between 6 300 and 7 800 during the five years under study, with an average of about 7 200 per year. More interestingly, as a result of the Namibianisation policy of the MFMR, the percentage participation of Namibians in the labour force has increased significantly from 89%, 65%, 1%, 57%, 31% to 97%, 79%, 9%, 71% and 65%, respectively, in the pelagic, demersal, midwater, crab and tuna fisheries (Armstrong et al., 2004). Hence, most of these positions were filled by Namibians, thereby providing them with the income they need to buy food for their families, and thus improve their food security.
Table 10: Employment from shared stocks (person years).
|
|
1994 |
1995 |
1996 |
1997 |
1998 |
Average |
|
Pilchard |
325 |
130 |
5 |
117 |
201 |
155 |
|
Hake |
1704 |
2071 |
2470 |
1975 |
1824 |
2009 |
|
Horse mackerel (Pelagics) |
93 |
156 |
371 |
370 |
74 |
213 |
|
Horse mackerel (midwater) |
2644 |
2390 |
2105 |
2057 |
1588 |
2155 |
|
Tuna |
1112 |
1356 |
940 |
957 |
1205 |
1114 |
|
Horse mackerel (demersal) |
15 |
15 |
25 |
23 |
10 |
17 |
|
Crab |
190 |
147 |
118 |
73 |
101 |
125 |
|
Total employment |
6082 |
6255 |
6033 |
5570 |
5004 |
5789 |
|
Total for Hake, Horse mackerel, Pilchard |
4780 |
4752 |
4975 |
4540 |
3698 |
4549 |
Once again the data reported in the table above demonstrates that shared stocks provide the bulk of the reported jobs, providing about 80% (5 789 jobs) of the total. The central role of hake, horse mackerel and pilchard in Namibia’s fisheries is highlighted here too.
South African data and information
Landings
The South African fishing industry caught an average 503 000 tonnes of fish, nationwide between 1994 and 1998 (see Table 11 below). It is reported that over 90% of this was taken from the Benguela side of the South African EEZ. Therefore 450 000 tonnes can be said to be taken from the BCLME. Of this, 294 000 tonnes are landings of shared stocks.
Table 11: Landings of fish, 1994-1998 (000 tonnes). Source: Stuttaford (1999)
|
|
1994 |
1995 |
1996 |
1997 |
1998 |
|
Hake |
146 |
139 |
158 |
148 |
149 |
|
Kingclip |
3 |
3 |
3 |
4 |
3 |
|
Monk |
5 |
6 |
6 |
8 |
8 |
|
Panga |
1 |
1 |
0.9 |
0.9 |
0.9 |
|
Sole |
0.9 |
0.8 |
1 |
0.9 |
0.9 |
|
Snoek (demersal) |
6 |
7 |
6 |
5 |
7 |
|
H. mackerel (demersal) |
12 |
9 |
15 |
23 |
19 |
|
Or. roughy |
|
0.005 |
0.003 |
0.001 |
0.001 |
|
Oreo dory |
|
0.02 |
0.4 |
0.6 |
0.2 |
|
Toothfish |
|
|
1 |
1 |
2 |
|
Pilchard |
93 |
115 |
105 |
117 |
128 |
|
Horse mackerel (pelagic) |
8 |
2 |
19 |
13 |
27 |
|
Chub mackerel |
2 |
3 |
1 |
4 |
0.1 |
|
Anchovy |
156 |
170 |
41 |
60 |
108 |
|
Redeye |
54 |
77 |
47 |
92 |
52 |
|
Rock lobster |
3 |
3 |
2 |
3 |
3 |
|
Snoek (line) |
8 |
9 |
7 |
6 |
7 |
|
Tuna |
4 |
4 |
3 |
3 |
9 |
|
Yellowtail |
0.8 |
0.8 |
0.5 |
0.5 |
0.5 |
|
Mullet |
1 |
1 |
1 |
1 |
0.9 |
|
Squids |
6 |
7 |
7 |
4 |
6 |
|
Total |
510 |
558 |
425 |
495 |
529 |
Landed values
The landed values from South Africa’s fisheries in 1997 are given in the table below. The sum of landed values for the fisheries of South Africa is estimated at R 1 434 million. Using the fact that over 90% of South African landings are from the BCLME, we estimate that R 1 291 million landed value is derived therefrom.
Table 12: Landed value of South African fish, by fishing method (R millions) for 1997. Source: Stuttaford (1999)
|
|
All South Africa |
Benguela* |
|
Demersal |
474 |
427 |
|
Pelagic |
439 |
395 |
|
Rock Lobster |
167 |
150 |
|
Crustacea |
226 |
203 |
|
Line, small nets |
128 |
115 |
|
Total |
1434 |
1291 |
* 90% of total
Using data from Stuttaford (1999), we determined the proportion of shared stocks in the catch of demersal, pelagic, and line groups, and report it in table 13 below. This was then used to calculate the portion of the total landed values that can be assigned to shared stocks. The results of these calculations are reported in table 14 below.
Table 13: Proportion of shared stocks in catch of demersal, pelagic, and line groups.
|
|
1994 |
1995 |
1996 |
1997 |
1998 |
Average |
|
Hake (demersal) |
0.78 |
0.78 |
0.77 |
0.72 |
0.73 |
0.76 |
|
Horse mackerel (demersal) |
0.06 |
0.05 |
0.07 |
0.11 |
0.09 |
0.08 |
|
Horse mackerel (pelagic) |
0.03 |
0.005 |
0.09 |
0.04 |
0.08 |
0.05 |
|
Pilchard (pelagic) |
0.3 |
0.3 |
0.5 |
0.4 |
0.4 |
0.4 |
|
Tuna (line) |
0.2 |
0.2 |
0.1 |
0.2 |
0.06 |
0.15 |
Table 14: Landed values ($R millions) from shared stocks in 1997.
|
|
All South Africa |
Benguela* |
|
Hake (demersal) |
341 |
307 |
|
Horse mackerel (demersal) |
52 |
47 |
|
Horse mackerel (pelagic) |
5 |
4.5 |
|
Pilchard (pelagic) |
45 |
41 |
|
Tuna (line) |
18 |
16 |
|
Total |
462 |
416 |
*90% of total
Economic rent
Due to the lack of data on the economic rent from South Africa’s fisheries, we estimate average annual economic rent using the ratio of economic rent to total landed values in Namibia as a proxy. This ratio is 0.51. Hence, for landed values of R 1 291 million, the estimated economic rent is R 660 million. Of this amount R 213 million can be assigned to shared stocks. This approach to estimating economic rent for South Africa can be justified because the fishing industry in the two countries is very similar, also, in terms of their cost structure.
Export values
Export values in 1998 are reported in the table below for all fish landed in South Africa (R 790 million), and for fish taken from the BCLME (R 711 million). Using the proportion of landed values derived from shared stocks (R 416 million) to landed values derived from the BCLME as a whole (R 462 million), we calculate the amount of export value that can be assigned to shared stocks to be R 642 million.
Table 15: Export value of South African fish in 1998 (R millions).
|
|
All South Africa |
Benguela* |
|
Hake |
267 |
240 |
|
Kingclip |
0.80 |
0.7 |
|
Horse mackerel |
36 |
32 |
|
Pilchard |
23 |
20 |
|
Snoek |
4 |
3.6 |
|
Anchovy |
0.22 |
0.2 |
|
Tuna |
79 |
71 |
|
Rock lobster |
112 |
101 |
|
Other |
269 |
242 |
|
Total |
790 |
711 |
* 90% of total
Contribution to GDP
The fishing sector as a whole yields about 0.5% of South Africa’s GDP. The contribution to GDP is more related to economic rent than any of the other variables under consideration. Hence, we apply the ratio of economic rents derived from the BCLME part of South Africa to that derived from South African fisheries as a whole to allocation the contribution to GDP to shared stock, and then do the same with respect to shared stocks to determine the contribution by shared stock. This gives contribution to GDP by fish in the BCLME as a whole and shared stock in the BCLME of 0.45% and 0.15%, respectively.
Employment/food security
South Africa’s living marine resources of the Benguela Current form the basis of a fishing industry, which supports some 26 000 people (mostly in the Western Cape), and supplies food for the Southern African sub region. Fishing is particularly important in the social economy of the Western Cape, where some entire coastal communities depend directly or indirectly on fishing for their livelihood. We can assign part of this employment to shared stocks in proportion to the ratio of shared stock landing (294 000 tonnes) to total Benguela landings (450 000 tonnes). This gives an estimate of employment from shared stock of 16 980 jobs.
Angolan data and information
Landings
We relied on landings of Angolan fish reported by the FAO, and made available at www.fishbase.org, and catches of Angolan fish reported at the Sea Around Us project website: www.seaaroundus.org. The numbers obtained from these sources are reported in Table 16. It should be noted, in particular, that there were no landings of pilchard in the years being analyzed.
Table 16: Landings of fish, 1994-1998 (000 tonnes): Sources: www.seaaroundus.org and www.fishbase.org
|
Year |
1994 |
1995 |
1996 |
1997 |
1998 |
|
H. Mackerel |
173 |
117 |
116 |
101 |
76 |
|
Sardinella |
35 |
41 |
18 |
24 |
55 |
|
hakes |
0.57 |
0.25 |
1 |
1 |
0.12 |
|
Chub mackerel |
0.80 |
0.05 |
0.02 |
0.90 |
0.39 |
|
drums or croaker |
15 |
14 |
18 |
19 |
12 |
|
Crevaile jack |
0.04 |
0.04 |
0.04 |
0.02 |
0.09 |
|
Catfishes |
9 |
6 |
12 |
12 |
9 |
|
Seabreams |
3 |
8 |
3 |
2 |
8 |
|
Cutlass fishes |
0.02 |
0 |
0.03 |
0.05 |
0.004 |
|
Butter fishes |
6 |
3 |
4 |
4 |
3 |
|
Croakers |
3 |
1 |
4 |
2 |
7 |
|
Little tunny |
0.12 |
0.12 |
0.24 |
0.08 |
0.40 |
|
Snappers |
4 |
2 |
5 |
5 |
4 |
|
Prawns* |
2 |
1 |
2 |
2 |
3 |
|
others |
26 |
18 |
23 |
21 |
34 |
|
Total |
277 |
211 |
207 |
193 |
211 |
* Includes three species: Aristeus varidens, Parapenaeus longirostris, Natantia
The average annual catch is 220 000 tonnes, of which about 117 000 tonnes are from shared stocks.
Landed values
We are not aware of any reported landed values from Angolan fisheries. We will therefore make estimates based on some reasonable assumptions. For some of the fish groups, we were able to use South Africa landed prices from Stuttaford (1999) to calculate the equivalent price in Angola currency, the Kwanza (1R=14.2 Kwanza as of January 10, 2005). We were able to calculate landed values for horse mackerel, hake, chub mackerel, drum, snapper, and prawn from South African price data. For the other species, we made estimates from landed prices in other markets (see sources in table 17). The total landed value for Angola as calculated from the table is 119 178 million Kwanza, of which horse mackerel, sardinella, drums and seabreams are key contributors.
Table 17: Landed values of fish, 1997 (million Kwanza)
|
Year |
1997 |
|
H. mackerel |
6291 |
|
Sardinella |
1642 |
|
Hake |
57 |
|
Chub mackerel |
18
|
|
Drums or croaker |
1179 |
|
Crevaile jack |
0.003 a |
|
Catfishes |
840 b |
|
Seabreams |
1234 c |
|
Cutlass fishes |
0.95 |
|
Butter fishes |
419 d |
|
Croakers |
33 a |
|
Little tunny |
1.6 |
|
Snappers |
128 |
|
Prawns |
74 |
|
Total |
11918 |
b Source: Vietnam market price
c Source: www.eurofish.org
d Source: Taiwan market price
Of the total landed value of about 11.9 billion Kwanza, only 640 million is derived from species known to be shared.
Economic rent
Due to the lack of data on the economic rent from Angola’s fisheries, we estimate average annual economic rent in Angola to be 75% of the ratio of economic rent to total landed values in South Africa. By this we are assuming that the South African industry is more efficient that the Angolan. This ratio is 0.26. Hence, for landed values of Kwanza 11.9 billion, the estimated economic rent is Kwanza 3.2 billion. Of this amount, Kwanza 172 million can be assigned to shared stocks.
Contribution to GDP
The sector generates about 4% of the country’s GDP. Applying the proportion of landed values from shared to the total landed value; we estimate the contribution of shared stocks to Angola’s GDP to be 0.22 %.
Exports
At present, roughly half of the revenue from fish and fish products in Angola comes from exports, with an estimated value of Kwanza 2670 million in 1995. The main export markets are Europe for prawns and demersal fish, African countries for small pelagic fish including horse mackerel, and Japan for tuna and crab. Again, using the ratio of landed values from shared stocks to total landed values as a basis, we estimate that Kwanza 14.4 million is derived from shared stocks.
Employment/food security
The fisheries sector provides nearly half of the animal protein of the country, and is an important source of employment and food to populations of the coastal regions, where it is often the only source of livelihood for the poorer population groups. Domestic consumption of fish, which was estimated at about 11 kg per person per annum in 1994, is the highest in the region. According to the results of a survey conducted in 1992, there were at that time around 30 000 workers directly involved in activities of the fisheries sector, of which some 18 000 were involved in artisanal fisheries. The remainder were involved in industrial fisheries and public administration. In addition, it was estimated that some 5 000 persons (mainly women) were involved in informal fish trade activities. The number of artisanal fishermen a few years later has been estimated at over 23 000, and the number of people involved in informal fish trading at between 20 000 and 30 000. Many artisanal fishers are not able to make a living solely from fishing, and supplement their incomes by, for example, agricultural and commercial activities. We estimate that out of the total number of jobs of 30 000, about 1 600 come from shared stocks.
3.2. Information for computing costs of fisheries management
Fisheries management functions are defined variously by different countries but in essence they consist of three main processes, namely, (i) stock assessment, that is, the scientific assessment of the stock size and age distribution of the given fishery; (ii) setting total allowable catches (TACs), preparing rules and regulations related to the TACs, licensing vessels and fishermen, and disseminating the rules and procedures for the coming years fishery; and third, monitoring, control and surveillance (MCS), that is, enforcement and policing functions. Carrying out these functions cost money, which it is hoped will be justified because management is supposed to result in benefits to a given country by making sure that the country’s fisheries management objectives are met.
For the countries of the Benguela region, fisheries management functions are currently carried out either by the countries themselves domestically, or by regional cooperative management organizations. At the moment the active regional organizations in the region are the Benguela Fisheries Environment Interaction & Training Programme (BENEFIT), the Benguela Current Large Marine Ecosystem (BCLME) Programme and the Southern African Development Cooperation (SADC) Fisheries.
Namibian data and information
Table 18 presents the cost of fisheries management in Namibia for 1997 categorized into three groups, namely, research, MCS and other.
Table 18: Domestic fisheries management costs for Namibia.
|
Section |
Costs ($N millions) |
|
MCS |
34.46 |
|
Research |
22.24 |
|
Other |
9.26 |
|
Total |
65.96 |
$1N=0.1666USD as at Nov. 22, 2004.
Assuming that 1997 is a typical year, Namibia’s total estimated domestic expenditure or cost of fisheries management is about N$ 66 million (US$ 11 million) per year.
We need to isolate the portion of the total amount of N$ 66 million that can be attributed to shared stocks. One could go about apportioning the cost of fisheries management to the various commercial species in a number of ways. Here, we choose to calculate the cost of management per landed value of fish, and then use this to calculate the cost of managing shared stocks by multiplying the per landed value cost with the landed values of the relevant shared stocks.
The average landed value of all fish landed in Namibia between 1994 and 1998 is N$ 1 177 million. Hence, the cost of fisheries management per landed value is N$ 0.06 (that is, 65.96/1 177).
The deep water hake stock is shared by South Africa and Namibia, and the Cape hake stock is also shared if only indirectly through cannibalism. The average landed value of hake for the period under investigation is about N$ 473 million. Hence, the cost of fisheries management that can be assigned to hake is N$ 26.5 million.
The pilchard and horse mackerel stocks are shared between Angola and Namibia. On average, the landed values from pilchard and horse mackerel were N$ 33.79 and N$ 388.99 million, respectively. Therefore the costs of fisheries management that may be assigned to these species are N$ 1.89 and N$ 21.8 million for pilchard and horse mackerel, respectively.
Red-crabs are shared between Angola and Namibia. The landed value from red-crabs, which make up almost all of the crab landings in Namibia, is N$ 22.8 million. Hence, the cost of fisheries management assigned to this species is N$ 1.3 million.
Bigeye, yellowfin and albacore tunas are also shared by the countries of the BCLME both within their EEZs and on the high seas. The average Namibian landed values from tunas in the period under study is N$ 18.30 million, all of which was made up of values from these three shared species of tunas. Therefore the management cost that can be assigned to tuna is N$ 1 million.
Hence, the portion of the total fisheries management cost of N$ 65.96 million that can be assigned to shared stocks is about N$ 52.5 million per year.
South African data and information
The estimated annual domestic cost of fisheries management in South Africa is reported in Table 19.
Table 19: Estimated annual domestic fisheries management costs for South Africa.
|
Section |
Costs (R millions) |
|
Administration |
72 |
|
Resource management |
61 |
|
Research and development |
51 |
|
MCS |
55 |
|
Patrol, research vessels |
101 |
|
Total |
340 |
1R=1N$=$0.1666 USD as at Nov. 22, 2004.
From the table we see that the annual cost of managing South Africa’s fisheries is about R 340 million (US$ 56.6 million). It is estimated that 90% of the total South African landings of 445 000 tonnes is taken from the BCLME. Hence, one can allocate 90% of the total cost of managing South Africa’s fisheries or R 306 million to the management of fisheries operating in the BCLME. Out of this amount, R 200 million can be allocated to shared stocks based on the proportion of shared stock to BCLME landings.
Angolan data and information
We could not find cost data for Angola. From our reading, we found that regulation in Angola is constrained by the lack of operating funds and inadequate equipment and staff. These constraints have limited the amount of management initiatives in the country. To make our analysis complete, we assume conservatively that the cost of fisheries management in Angola per landed value is only half of those of Namibia. From Namibian cost and landed value information, we calculate the ratio of management cost to landed value to be 0.06. We therefore apply half of this number (0.03) to determine the cost of fisheries management in Angola to be Kwanza 357 million, of which Kwanza 19.2 million is apportioned to the management of shared stocks.
Data and information on the BENEFIT Programme
BENEFIT is a regional marine research agency for the three national research institutions of Angola, Namibia and South Africa. The programme comprises three basic elements represented by the Environmental Working Group (EWG); the Resources Working Group (RWG) and the Training Working Group (TWG). BENEFIT is largely co-funded by the GTZ and NORAD (via the Nansen Programme). The Nansen programme’s funding has been focused on the RWG and secondly on training, while the German GTZ funding has focused mainly on the EWG and secondly on the TWG. The programme has therefore funded a series of research projects especially under the BENEFIT RWG including the following: (a) biomass and stock assessment (survey methods, acoustic and trawling methods research); (b) Commercial resource biology and behaviour (horse mackerel, hake, small pelagic, seals); and (c) others (fish aging, whale distribution, gobies, jellyfish, processes and methodology workshops).
The recent total budget for running the BENEFIT programme has been reported to be N$ 12.5 million or US$ 2.08 million. The funds are provided mainly by Angola, Namibia, South Africa, GTZ and NORAD. All of this cost is assigned to the management of the shared resources of the BCLME since the BENEFIT programme is devoted entirely to regional research and training.
Data and information on the BCLME programme
The BCLME programme is a joint initiative by the governments of Angola, Namibia and South Africa. The programme is a partnership among the three countries, the Global Environmental Facility (GEF) and the United Nations Development Programme (UNEP).
The goal of the Programme is to establish regional management of the Benguela current ecosystem. The Programme has received funding from various sources, with the two major sources being the GEF and the national governments of the three participating countries. The annual budget for running the BCLME Programme and sources of funding are given in Table 20.
Table 20: Five-year budget and funding sources for the BCLME Programme
|
Source |
Funding (US$ millions) |
|
GEF (Global Environment Facility) |
15.1 |
|
South Africa, Namibia, Angola |
16 |
|
BENEFIT |
7.6 |
|
Total |
38.7 |
The amounts given in Table 20 are for the entire BCLME programme for five years, which includes other areas besides fisheries, which is important since our estimates of cost for the new Commission will cover other activities other than fisheries (BCLME, 2002, and Cullinan et al., 2004). Hence, the annual budget is US$ 7.7 million. All of this cost is assigned to the management of the shared resources of the BCLME because the BCLME programme is devoted entirely to regional management issues.
Data and information on SADC Fisheries
The main contribution to fisheries management by SADC at the moment is in the area of monitoring, control and surveillance (MCS) under a project called SADC MCS Programme. Funding for this programme comes almost entirely from the European Union. The total budget for the 5-year project is 14.55 million euros (R 113.5). Of this amount, 2.32 (R 18.1), 1.21 (R 9.4), and 0.84 (R 6.6) million euros are allocated specifically to Angola, South Africa, and Namibia, respectively, over this period. This implies a total of 874 000 euros or R 6.84 million annual budget for MCS activities in Angola, South Africa and Namibia. A portion of this amount is assigned to the management of the shared resources, on the basis of the proportion of total landed values that are derived from shared stocks in the three countries. This is necessary because the SADC MCS programme covers all fish species both shared and un-shared. This approach assigns R 4.3 million to the management of shared stocks in the three countries.
4.0. Benefit cost analysis of incremental regional cooperation
The economic analysis in this section is based partly on the suggested institutional options proposed in Cullinan et al. (2004). We analyze the cost and benefits of three scenarios of regional cooperation, namely, (i) the status quo, that is, the current level of cooperation; (ii) the SAP proposal, and (iii) a management and task oriented regional cooperation scenario. The 2nd and 3rd scenarios are Options 1 and 4 in Cullinan et al. (2004).
Our estimate of regional cooperative management costs are based on the current cost of running the BCLME and BENEFIT programmes, adjusted to include the cost of new features of the two management options (scenarios). The table below identifies the key elements of the three management scenarios to be costed.
Table 21: Key elements of the three management scenarios
|
The management and task oriented scenario |
The SAP proposal |
Status quo scenario |
|
Ministerial Commission |
Interim Benguela Current Commission (IBCC) |
None |
|
Benguela Current Joint Management Board (BCJMB) |
Benguela Current Steering Committee (BCSC) |
Project Steering Committee (PSC of the BCLME programme) |
|
BCC Secretariat |
Benguela Current Management Unit (BCMU) |
Programme Coordinating Unit (PSC of the BCLME progamme) Activity Centres |
|
Joint Management Committees |
Advisory Groups and Activity Centre |
Advisory Groups |
|
Permanent and Ad Hoc Working Groups |
|
|
|
Advisory Groups |
|
|
|
Other institutional arrangements |
|
|
|
BENEFIT |
BENEFIT |
BENEFIT |
4.1. The status quo (default) scenario
Quantifying potential benefits
The estimated benefits from the status quo management scenario are given in Table 21 below. We see from the table that significant benefits accrue to the countries in terms of economic rent, export values, jobs, etc.
Table 22: Annual landings (000 t.); landed values, economic rent, export value (million N$/rand for Namibia and South Africa; billion Kwanza for Angola); Contribution to GDP (%), and jobs (per years).
|
|
Namibia |
South Africa |
Angola |
|
Landings |
572 |
450 |
220 |
|
Landed values |
1 177 |
1 291 |
11.9 |
|
Economic rent |
602 |
462 |
3.2 |
|
Export values |
1 590 |
711 |
2 676 |
|
Contribution to GDP |
8.5 |
0.45 |
4 |
|
Jobs |
7 200 |
26 000 |
30 000 |
1 Kwanza=0.0172 USA as at Nov. 22, 2004.
Quantifying potential costs
The table below summarizes the cost of current fisheries management calculated in Section 3.0.
Table 23: Cost of current fisheries management. Total cost in million NS/rand for Namibia, South Africa, BCLME, BENEFIT and SADC; million Kwanza for Angola
|
|
Total cost |
|
Namibia |
66 |
|
South Africa |
306 |
|
Angola |
357 |
|
BCLME |
45.6 |
|
BENEFIT |
12.5 |
|
SADC |
6.8 |
From the table above, we see that the total annual cost of management to the countries and the regional programmes, taken together, are well below the economic rent derived from the fisheries.
The estimated potential net benefits
The key economic indicator of the performance of fisheries management is economic rent. Converting the economic rent from the three countries into N$/R, gives a total annual economic rent of R 1289 million. The N$/R equivalent total cost of fisheries management is R 462 million. This indicates a significant net benefit from current fisheries.
The Strategic Action Plan (SAP) contains a proposal for the establishment of an Interim Benguela Current Commission (IBCC). The SAP envisages that the IBCC will be a transitional management entity, which will function as the precursor to the Benguela Current Commission.
Quantifying potential benefits
There are two potential benefits of regional cooperative management. First, it will help minimize the risk of wasteful use of shared stocks. That is, it will mitigate the economic risk of non-cooperative management (see Appendix). Second, it can help increase the cake by arranging harvesting by all countries involved in such a way that shared stocks are allowed to grow to their fullest economic potential (see Appendix).
It appears that the SAP proposal will, at least, minimize the economic risk of non-cooperation by providing scientific information on shared stocks, and provide a framework within which the countries can manage these resources to mitigate this risk. The maximum value of this risk is the current economic rent derived by all the countries from shared stocks. This is estimated in Section 3 to be equal to N$ 502 million, R 213 million and Kwanza 330 million, in Namibia, South Africa and Angola, respectively. This gives a total economic rent from shared stocks of R 738 million. This amount is actually the economic risk of non-cooperation. Without regional cooperative management, there is the risk that all the economic rent from the shared stocks of the BCLME would end up being dissipated. In addition, the lack of joint management will reduce the landed values, jobs, and export revenues derived from shared stocks. At the extreme, most of these values can disappear if over fishing leads to the depletion of the shared fish stocks.
The SAP proposal is not far reaching enough in terms of actual cooperative management of the shared resources. We therefore assume that this scenario is not likely to lead to the second benefit expected from cooperation.
Quantifying potential costs
We assume that the countries will continue their current management functions at the current levels of cost. In addition, each country will incur additional cost to help coordinate the activities of the IBCC with national fisheries management activities. We take as our point of departure, the current cost of running the BCLME, BENEFIT and SADC-MCS programmes, and then adjustment this to incorporate the additional coordination costs alluded to earlier. Due to the lack of data, we assume that each country will incur an additional coordination cost of 5% of current management costs. This assumption implies additional coordination cost of R 3.3, 15.3 and 1.26 (17.85 kwanza) million for Namibia, South Africa and Angola, respectively.
Table 24: Estimated cost of current fisheries management (R million)
|
Cost elements |
Amount (R million) |
|
Current cost of the BCLME Programme |
45.6 |
|
Current cost of the BENEFIT Programme |
12.5 |
|
Additional coordination costs |
|
|
Namibia |
3.3 |
|
South Africa |
15.3 |
|
Angola |
1.26 |
|
Total |
77.96 |
The estimated potential net benefits
For a total cost of R 77.96 million, this management scenario has the potential to protect and provide insurance against the risk of non-cooperation, at a maximum amount of R 738 million annually. Even if only 15% of this amount is lost due to non-cooperation, our analysis indicates that there will still be a net gain from establishing the IBCC.
This scenario is based on the assumption that each country would designate a lead ministry with primary responsibility for coordinating the participation of all relevant ministries and stakeholder from those countries in BCLME activities. Each lead ministry would also be responsible for driving the implementation of BCLME activities in that country and in reporting back to BCC structures. The details of this option are given in Cullinan et al. (2004).
Quantifying potential benefits
Just like in the case of the SAP proposal, this cooperative management scenario will remove the economic risk of non-cooperation. The value of this insurance against the risk of non-cooperation is the estimated total economic rent from shared stocks of R 738 million. This management scenario is also far reaching enough in terms of actual cooperative management of the shared resources that, if properly implemented, will potentially lead to the second benefit expected from cooperation, namely, increase size of the cake by arranging harvesting by all countries involved in such a way that shared stocks are allowed to grow to their fullest economic potential. In a recent study, Armstrong and Sumaila (2004) estimated the potential increase in economic rent from Benguela hakes due to the introduction of cooperative management to be about 40%. A survey of literature shows that this is actually a conservative estimate, as much higher gains have been estimated for shared stock in other parts of the world (Appendix). Based of this estimate, the total potential benefit of implementing this management scenario in terms of economic rent is R 1033 million.
Quantifying potential costs
We assume that the countries will continue their current management functions at the current levels of cost. We therefore focus sharply on the cost of regional management. We take as our point of departure, the current cost of running the BCLME and BENEFIT programmes, and then make adjustments to this to incorporate the cost of new elements in the management scenario. An amount of R 7.5 million annually is budgeted to cover the cost of convening meetings of the BCC, R 26.8 million per annum to run the Activity/Advisory Groups, R 10 million to cover the cost of ‘Other institutional arrangements’, R 5 million per annum to cover the cost of operating ‘Permanent and Ad hoc Working Groups’.
Table 25: Estimated cost of current fisheries management (R million)
|
Cost elements |
Amount (R million) |
|
Current cost of the BCLME Programme |
45.6 |
|
Current cost of the BENEFIT Programme |
12.5 |
|
Additional costs |
|
|
Ministerial Commission |
7.5 |
|
Permanent and Ad Hoc Working Groups |
5.0 |
|
Advisory Groups |
26.8 |
|
Other institutional arrangements |
10 |
|
Total |
107.4 |
The estimated potential net benefits
The total potential gain from this cooperative management scenario is estimated to be the sum of the insurance against the risk of non-cooperation, and the potential for an increase in the economic rent that can be derived from the shared resources of the BCLME. This is calculated to be R 1 033 million annually. The annual cost of implementing this scenario is estimated at R 107.7 million. Therefore, the potential for achieving significant net benefits from this scenario is high.
5.0. Addressing specific questions raised by the TOR
5.1. Other potential costs and benefits from cooperative management
We have discussed the potential costs and benefits that may accrue from the living marine resources of the Benguela ‘with’ and ‘without’ joint management of the resources by Angola, Namibia and South Africa. But these are not the only likely costs and benefits. It would appear that the arguments made with regards to the living marine resources on the potential economic and social benefits from cooperation applies to environmental and other natural resource management too. In the case of environmental pollution, for example, it is well recognized that they do not respect national borders, and therefore the three countries as a group are bound to gain by cooperating on the management of their environmental pollutants. Significant benefits may also be derived from cooperation due to the possibility for obtaining economies of scale with respect to training of regional expertise.
One potential cost of cooperative management is the loss of sovereignty. Cooperative management entails a give and take posture, which means some autonomy will have to be given up by the countries. But there should be no cause for alarm because joint management of the Benguela could also result in the cultivation of political goodwill, which may produce a positive effect on conflict resolution between the three countries; and thereby help in the resolution of border problems, for example. The BENEFIT and BCLME programmes have already probably made some contributions in this direction. It is also encouraging to note from our interviews that the relevant senior officials in the region recognize the fact that their countries have no option but to cooperate given the circumstances of the BCLME.
5.2. The economic justification for an ecosystem based approach to fisheries management
The goal of ecosystem based management is to maintain ecological viability and health within an entire system (Holt, 2001). Ecosystem based management is beneficial in evaluating management policies that takes into consideration the dynamics of the entire area including all components. There are many factors contributing to the productivity of one species, fishing pressure is a large part component, but not necessarily the only influence. Ecosystem-based management recognizes that certain non-fishery activities have an impact on the marine ecosystem and have consequences for management. These include predator-prey interactions and land-based and sea-based activities which affect habitat, water quality, fisheries productivity, and food quality and safety (FAO, 2002). If a species is considered to be vulnerable, then it is important to assess not only the fishing pressure but other factors in its environment, as they are not independent of each other.
Many economists have become increasingly interested in predator prey interactions in their analyses. Joint management of a predator and prey both fished commercially requires a level of optimal exploitation to achieve the highest overall economics value. Depending on the commercial importance of the predator and prey and their abundance, it may not always be economically viable to fish the higher trophic level species (FAO, 1995). There are two cases in examining a multispecies fishery; i) if the prey species has a higher market value, then it may be more economical to subsidize the fishing of the predator species in order to keep the abundance of the prey species high or ii) if the predator species has greater value, then the prey species should be left untouched so as to supply continuous food to the higher valued predator (FAO, 1995). For these reasons, it is better to evaluate using a multispecies assessment or an ecosystem approach in order to grasp these interactions and define the most optimal outcome. Sumaila has used bioeconomic modeling to evaluate possible management options for two main species in the Barents Sea (1997). Using an ecosystem approach, he has explored the most optimal exploitation of the two species to achieve the maximum value under cooperative versus non-cooperative fisheries management (Sumaila, 1997). Sumaila has found that there would be an economic loss if the fisheries were treated as if there was no interaction between the two fished species, this being another advantage to multispecies assessments.
In terms of looking at areas that have multiple uses, it is beneficial to look at all interactions, users, and activities in an area for an overall optimal management outcome. This type of ecosystem approach needs more information than a single species assessment as well as joint efforts between all stakeholders in order to maintain biodiversity and an economically viable coastal region that is not dependent entirely on one resource but rather can be sustainable through the management of all resources. It will assure that future generations will have the full range of goods and services that an ecosystem can provide. Economically, it will be more effective to see how much value can be obtained from a region as a whole. By examining possible tradeoffs between resources, management goals can be achieved depending on the most efficient methods of use. By exploring tradeoff, you can also evaluate the risks and benefits associated with the value of each resource (Holt, 2001). The development of the Ecopath with Ecosim modeling software has made it possible to develop models of large marine ecosystems. Through collaboration of scientists from 31 institutions, multiple models for the Atlantic and Pacific Oceans have been built in order to develop strategies for the conservation of Large Marine Ecosystems by coastal states and international communities (Christensen and Maclean, 2004). Ecopath with Ecosim explores policy options by evaluating all components such as net economic value, social value, and ecosystem rebuilding and ecosystem structure. The program is designed so that each component can be chosen as a priority in order to explore management policies.
The three BCLME countries have indicated their intention to adopt the ecosystem approach as it is apparent from the SAP report published by the BCLME programme (BCLME, 2002). In fact, the BCLME in collaboration with the FAO has already commissioned a research project to address the question “Is it possible to introduce a more holistic system of fisheries management in the Benguela Current Large Marine Ecosystem? The result of this study will provide the basis needed for the management of the BCLME as a whole, and therefore help Angola, Namibia and South Africa to reap the economic benefits of such management.
5.3. Collaboration with the Institutional Review team
There has been excellent collaboration between our team and the Institutional Review team made up of Cormac Cullian, Svein Munkejord and Heidi Currie. We have shared information, data and our results with each other. In many ways the work of our two teams are strongly linked. The economic theory of joint management of shared resources and Gulland’s categorization of joint management into primary and secondary levels are reasonable frameworks that could feed into the work of the Institutional Review Team. On the other hand, our team needed inputs on the different possible joint management structures for an IBCC from the Institutional Review Team to help us carry out our analysis.
6.0. Conclusions and Recommendations
It is worth noting that there already exist structures, which would facilitate the formalization of the IBCC. For example, members of the current BENEFIT programme management committee are also members of the BCLME Programme Steering Committee (PSC). There is also a BCLME/BENEFIT liaison committee which regularly meets for consultations. Therefore, there are institutional structures and working relationships between the two programmes that will serve the IBCC very well.
We recommend that the IBCC should commerce at a modest level, using the experience gathered over the years from the BCLME and BENEFIT programmes. This approach will allow for learning and the building of confidence and mutual trusts between the parties, which are all crucial for the success of the Commission. An additional beauty of this approach is that it will initially not need a huge infusion of new resources.
A fundamental issue that must be agreed upon is how to fund the IBCC sustainably. Ultimately the resources for running the IBCC will have to come from the region if the Commission is to be sustainable over the long run. Various funding sources should be explored and analyzed to help determine the combinations of funding opportunities that will work best. One can foresee a funding structure that consists of both internal and external sources, especially in the beginning of the IBCC. The good news is that even if a fraction of the predicted increase in economic rent that would result from joint management is realized, a move to such joint management will more than pay for itself.
Experience from around the world demonstrates that strong political commitments, at the highest level of government, are required to make joint management work. Therefore, if the region decides to establish the IBCC, it would have to fully back it up politically.
To help the new IBCC get on its feet, we recommend that current funding levels by international donors be continued until a selected date sometime in the future, when the national governments of Angola, Namibia and South Africa will take over the full funding of the Commission.
It is crucial for the success of the IBCC that all stakeholders (or at least a significant majority) strongly support the concept of joint management. Efforts should be put into making this happen.
To help deal with the occasional disputes that are bound to occur from time to time, the parties need to put in place a binding dispute resolution mechanism.
The following points should be given special attention when designing the nature and structure of the IBCC. First, care should be taken to make sure that the sovereignty issue does not become a significant problem. Second, the fact that there is no assurance that the member states will have identical resource management goals is important and taken into account. Third, there will be the need for high quality research, the results of which are seen as being credible by all parties. Fourth, secured sustainable funding and strong political commitment by the countries should be at the center of the development of the IBCC.
Finally, the new Commission should put in place structures for collaborating with international organizations such as ICCAT, SADC and SEAFO.
Appendix: On the Management of Shared Fish Stocks in the BCLME: Some General Considerations
This paper will focus on the major hake stocks in the BCLME. There are two sub species in question, the Merluccius capensis and the Merluccius paradoxus. It is believed that there is no direct sharing of the capensis stocks between, or among, South Africa, Namibia and Angola. On the other hand, it is believed that the paradoxus stock is shared among the three neighbouring coastal states. It is also believed, however, that the portion of the paradoxus stock to be found in Angolan waters is no more than 5 per cent (Armstrong and Sumaila, 2004). We shall, therefore, regard this stock as being shared by South Africa and Namibia alone in this paper.
The discussion to follow will draw heavily upon a recently published FAO Fisheries Technical Paper, namely Fisheries Technical Paper 465, The Conservation and Management of Shared Fish Stocks: Legal and Economic Aspects (Munro, Van Houtte and Willmann, 2004). We should note, in passing, that many of the points arising from this Paper, which will be used in the discussion to follow, are currently to be found in a recently published paper by Munro, Willmann and Cochrane (Munro, et al., 2004)
In any event, the FAO Fisheries Technical Paper 465 is based largely upon the Norway-FAO Expert Consultation on the Management of Shared Fish Stocks, October 2002. One of the case studies presented at the Expert Consultation, it is worth observing, was entitled: “Management of Shared Hake Stocks in the Benguela Marine Ecosystem” (Sumaila et al., 2003).
Shared Fish Stocks Defined
We shall adopt of the FAO definition of shared fish stocks, namely any fish stock, which is exploited by more than one state/entity (Munro et al., 2004). The FAO sets forth four non-mutually exclusive categories of such stocks:
a) fish resources crossing the EEZ boundary of one coastal state into the EEZ(s) of one, or more, other coastal states – transboundary stocks,
(b) highly migratory species, as set forth in Annex 1 of the 1982 UN Convention on the Law of the Sea (UN, 1982), consisting, primarily, of the major tuna species. Being highly migratory in nature, the resources are to be found, both within the coastal state EEZ, and the adjacent high seas.
(c) all other fish stocks (with the exception of anadromous/catadromous stocks) that are to be found, both within the coastal state EEZ and the adjacent high seas – straddling stocks.
(d) fish stocks to be found exclusively in the high seas – discrete high seas fish
stocks (Munro, et al., ibid.)
The relevant BCLME hake stocks are not to be found in the high seas (Sumaila et al., 2003). Hence, they fall entirely into category (a), transboundary stocks. This is fortunate, since the management of categories (b), (c), and (d) stocks proves to be much more demanding and complex than the management of transboundary stocks (Munro, et al., ibid.).
The Legal Obligations of Coastal States Sharing Transboundary Resources
The legal obligations of coastal states, such as South Africa and Namibia, sharing a transboundary fish stock are set forth in the 1982 UN Convention on the Law of the Sea (UN, 1982). The Convention has only one provision pertaining directly to the management of such stocks, namely Article 63(1), which reads as follows:
Where the same stock or stocks of associated species occur within the exclusive economic zones of two or more coastal States, these States shall seek, either directly or through appropriate sub regional or regional organizations, to agree upon the measures necessary to coordinate and ensure the conservation and development of such stocks without prejudice to the other provisions of this Part [V] (UN, 1982, Article 63(1)).
The Convention imposes a duty upon the relevant coastal states to negotiate over arrangements for the management of transboundary stocks. Importantly, however, the Convention does not impose a duty upon the states to reach an agreement. If the states are unable to reach an agreement, then each state shall manage that segment of the transboundary stock occurring within its EEZ. It shall do so in accordance with the rights and duties relating to fisheries management and conservation by a coastal state within its EEZ, as set forth by the Convention (Munro et al., ibid.).
In entering into negotiations with respect to the management of such resources, the coastal states are, of course, to do so in good faith. To quote the International Court of Justice, the states “----are under the obligation so to conduct themselves that the negotiations are meaningful, which will not be the case when either of them insists upon its own position without contemplating any modification of it” (cited in Munro et al., ibid.). Nonetheless, the point remains. If such coastal states enter into meaningful negotiations and find that there is no reasonable basis of cooperation, they have the legal right to decline to enter into a cooperative agreement. Each state would then proceed to manage its share of the resource to the best of its ability. This outcome could arise, for example, if the states came honestly to the conclusion that the costs of establishing a cooperative resource management agreement would exceed the anticipated benefits. Let us refer to this as the default position.
This project is concerned, inter alia, with costs and benefits of cooperative management of BCLME transboundary stocks. Prior to inquiring into such costs and benefits, we must first recognize that there is more than one level of cooperative management.
The question of the levels of cooperation was discussed two years prior to the close of the UN Third Conference on the Law of the Sea, by John Gulland of the FAO (Gulland, 1980). We would find it difficult to improve upon his discussion. Gulland states that there are essentially two levels of cooperation, which we might refer to as the primary and secondary levels. The primary level consists of cooperation in research alone, without reference to coordinated management programs. The secondary level –“active management” – involves, almost by definition, coordinated joint management programs.
Cooperation at the primary level is relatively low cost, both in financial terms and in terms of possible lost coastal state sovereignty. Munro et al. (2004) argue that, if it is not possible to achieve cooperation at this primary level, it certainly will not be possible to achieve cooperation in active management of the resource. In actual cooperative management regimes, which have proven to be successful, cooperation in research alone is often seen, in retrospect, to have been the precursor to cooperation in active management (Munro et al., ibid.).
Besides the relatively low cost and ease of implementation, there is another key (and obvious) reason why cooperation in scientific research is usually a precursor to the more demanding secondary level of cooperation. This is simply because, without adequate scientific information on the relevant stocks, it is difficult for the coastal states involved to know whether it is worth the effort to engage in secondary level cooperation.
The BCLME hake stocks provide case in point. We have noted that there is evidence that the paradoxus stock is shared between the South Africa and Namibia. However, the evidence is apparently non conclusive. Furthermore, while it is believed that there is no direct sharing of the capensis stocks, there is apparently some evidence that there may be biological interaction between the capensis and paradoxus stocks, in that adult capensis hake predate upon juvenile paradoxus hake (Sumaila et al., 2003). If this is in fact the case, then the South African and Namibian capensis stocks could prove to be shared between the coastal states indirectly.
Until these uncertainties are addressed, it is difficult to assess, with any real degree of accuracy, the costs and benefits of developing cooperation at the secondary level. Indeed, Sumaila et al., in their case study for the Norway-FAO Expert Consultation on the Management of Shared Fish Stocks, state that “knowledge about resource ecology is the basic building block needed for developing a meaningful cooperative management agreement for the management of the hake stocks. One reason for the lack of agreements for cooperative management of shared stocks in the --- region to date is the lack of adequate knowledge about the distribution and movement of fish stocks in the region” (Sumaila et al., 2003, p. 153).
Cooperation at the secondary level, involving coordinated joint management programs, can unquestionably be a formidable undertaking. John Gulland (1980) informs us that this will require:
(a) allocation of harvest shares among the participating states (or entities);
(b) determination of an optimal management strategy through time, including inter alia, the determination of optimal global harvests over time;
(c) implementation and enforcement of coordinated management agreements.
The aforementioned Norway-FAO Expert Consultation addressed itself to the question of what would be needed to satisfy the Gulland requirements. The Report of the Expert Consultation (FAO, 2002) argues that, in order to meet the Gulland requirements, it will be necessary to have:
A cooperative management authority;
A detailed joint management plan;
A set of agreed upon common objectives;
Agreed upon tools for managers, including indicators and reference points to monitor performance;
A joint scientific body to provide advice.
The Report continues that the detailed joint management plan should be expected, at a minimum, to contain: (i) a description of the fishery, (ii) objectives of management, (iii) measures to achieve the objectives, (iv) indicators and reference points to be used to measure actual performance against objectives, (v) decision rules on how to change management, when the objectives are not being reached, and (vi) information needs and research required to support management (cited in Munro, et al., ibid.).
As Munro et al. (2004) point out numerous complexities can arise, when attempting to achieve cooperation at this level. Let three examples suffice. The first one is obvious, arising from Gulland’s requirement (c), namely enforcement. It is difficult to argue with John Gulland’s statement that “… without adequate --- enforcement the best [fisheries] arrangements can be useless” (Gulland, 1980, p. 17).
The Norway-FAO Expert Consultation maintained that even the relatively straightforward sharing arrangement, which South Africa and Namibia might envisage, would require the following as a minimum for effective enforcement.
Maintenance of a register for vessels authorized to fish the stock;
Use of a system to monitor fishing activities (including, as appropriate, ready access to records relating to the authorization to fish, the amount and species of quota, the area of operation, trip duration, fishing logs, etc.); and
Port inspections of vessels, catch on board and catch offloaded (cited in Munro, et al., ibid.).
A much less obvious complexity involves research. If cooperation is confined to the primary level of cooperation in research, cooperation will hopefully be seen to involve a non-threatening, mutually beneficial exchange of information and data. If cooperation is at the secondary level, however, research cooperation may lose its benign character. Research findings can influence harvest allocations and thus can easily become “tools of combat” in negotiations among the relevant coastal states.
Finally, another less obvious complexity arises from (b) in Gulland’s list of requirements –optimal management strategies. There is, in fact, no assurance that the relevant states will have identical resource management goals. The FAO recognized this fact twenty-five years ago, through its Advisory Committee on Marine Research (FAO, 1979). The Committee pointed out that, if two coastal states share a fishery resource, one might favour low long run TACs, but a large stock and high catch rates, while the other might favour large long run TACs, and accept with good grace low catch rates. If management goals are not identical, then one is faced with the burden of developing a mutually acceptable compromise resource management program, or so it would seem (FAO, 1979).
Costs and Benefits of Cooperative Resource Management Arrangements: A Few Comments
Detailed estimates of the costs and benefits of cooperative arrangements will be given in other parts of the study. Our purpose in this section will be to offer a set of general comments, which will hopefully provide a framework for the forthcoming detailed estimates.
There is little that need be said about the costs and benefits of cooperation at the primary level, which is already under way between South Africa and Namibia. The costs, while not trivial, are almost certainly low in comparison with those to be confronted at the secondary level of cooperation. The benefits arising from this primary level of cooperation are, we would guess, high. Indeed, as we have stressed, cooperation at this primary level is essential, if one is going to attempt to determine with accuracy whether or not it is worthwhile developing cooperation at the secondary level.
It is thus the secondary level of cooperation, which demands our attention. The first point to be made is that costs can be expected to arise, not only in financial terms, but also in terms of diminution of coastal state sovereignty. These costs, in turn, will be influenced by the nature of the institutional structure employed for implementing the cooperative arrangement. As Munro et al. (2004) are at some pains to point out; there is no single structure for cooperation and the secondary level. It is reasonable to suppose that the more formal the structure, the more costly will the cooperative management arrangement be. The required formality of the structure can only be determined on a case by case basis. The aforementioned authors turn to a categorization of structures, which have historically been used in the cooperative management of transboundary stocks, set forth by the British Law of the Sea specialists, R.R. Churchill and A.V. Rowe (Churchill and Rowe, 1988). Churchill and Rowe list four categories, three of which are relevant to South African-Namibian hake. They are:
general cooperation agreements for the management of transboundary stocks on an ad hoc basis, but with the likelihood of the management measures being adopted continuing to be uncertain
a set of agreements taking the form of a periodic (usually annual) arrangement negotiated under a pre-existing framework treaty;
a set of arrangements, whereby a bilateral commission set up for the specific purposes of management of transboundary stocks
The structures are in ascending order of formality, and of cost, both financial and in terms of reduced coastal state sovereignty. It is our understanding that South Africa and Namibia are contemplating a category C structure (Benguela Current News, Issue 2 (July, 2004), p.1). Recognition should be given, however, to the fact that there are less costly alternatives.
In any event, even a category A or B structure must be expected to entail significant costs, particularly when enforcement considerations are taken into account. The question then is: why incur these costs, when the primary level of cooperation, let alone the secondary level, is not really required under international law? The answer is in two parts. First, non-cooperative resource management can have consequences that are destructive, both in terms of the economic benefits to be derived from the fishery, and in terms of the resource itself. Hence, the costs of non-cooperation may be very high. Secondly, once cooperation beyond the primary level is achieved, opportunities may arise to improve the efficiency of the shared fisheries, to the benefit of all of the coastal states sharing the resource. Third, there may be possibilities for savings from current management arrangements due to the harmonization of certain management functions.
The possibility of non-cooperative resource management having destructive consequences occurs, when the harvesting activities of one coastal state sharing a transboundary resource are seen to affect the harvesting opportunities of the other state(s) exploiting the resource. To set the stage, we consider a counter example of a transboundary fishery resource, where the harvesting activities of the two coastal states sharing the resource are, or at least were, independent from one another.
The example is provided by the rich Georges Bank scallop fishery, shared by Canada and the United States. The resource was, and is, clearly a transboundary fish stock. Munro, writing in 1987 (Munro, 1987), argued that it was, nonetheless, questionable whether Canadian (American) harvesting of scallops would have any significant impact upon American (Canadian) harvesting opportunities. Adult scallops are more or less stationary. Moreover, while there is some transboundary movement at the larval stage, there were, in 1987, extensive beds of larvae producing scallops, which were free from exploitation due to the sea bed terrain.
These facts led to the argument that, since Americans and Canadians could harvest the resource without affecting one another’s harvest opportunities, cooperative fisheries management of this shared resource might have been of value at the primary level, but certainly not beyond that. Cooperation at the secondary level was not worth the effort and cost (Munro, 1987).
Whether the situation, which prevailed in 1987, continues to prevail today is not known to this author. Nonetheless, the point remains. There will be cases of transboundary fishery resources, in which the costs of establishing a mechanism for cooperative resource management at the secondary level exceed any reasonable estimate of the benefits. To use an old English expression, it will be found that “the game is not worth the candle”.
Suppose, to return to the Georges Bank scallop fishery example, that the harvesting activities of American fleet had had an impact upon the harvesting opportunities of Canadian fleet, and vice- versa. Then the situation would have been entirely different. There would be seen to exist, to use a modest amount of jargon, a “strategic interaction” between the two coastal states.
The BCLME publication, Transboundary Diagnostic Analysis (BCLME, 1999), remarks that, in such circumstances, over-harvesting of the resource in one coastal state’s waters could have the unfortunate consequence of leading to the depletion of the resource in the waters of the neighbouring coastal state, as well (BCLME, 1999, p.13). This is unquestionably correct, but, in fact, the problem goes far beyond this.
To continue with our example, suppose that the American fleet had over-harvested the resource in American waters, with the result that the resource was depleted in Canadian waters as well. If the Canadian fleet had recognized the cause of the resource depletion in its waters, it is all but inevitable that the Canadian fleet would, in the absence of effective Canadian-American cooperation, have reacted, and would have done so with vigour. The consequences could have been, as we shall see, severe.
Economists, in analyzing the economics of the management of transboundary fishery resources, have had no choice other than to recognize explicitly the existence of such “strategic interaction”. The consequence has been that the economics of the management of these resources, which has emerged, is a blend of the economist’s standard economic model of the fishery, and the theory of strategic behaviour, designed to deal with such strategic interaction. The theory is more commonly known as the theory of games, because games, e.g. card games, provided convenient examples in the early development of the theory. It should be noted in passing that economists, analyzing the management of most other shared natural resources, have found themselves compelled to employ the theory of games.
Since many readers will be unfamiliar with the theory of strategic behaviour (games), we shall digress to present an outline of theory and its basic concepts.
The Theory of Games: A Digression
The theory of strategic behaviour is concerned with situations in which the wellbeing of an “individual” depends, not only on the actions of the “individual” itself, but also on the actions of other “individuals,” with which the “individual” in question is interacting. The “individuals” may be persons, firms, political parties, states, et cetera. In our particular case, the “individuals” take the form of coastal states sharing a transboundary fishery resource, or resources. In any event, the “individual” is forced to take into account that its wellbeing will be affected by the actions of others, and vice-versa.
One field of economics, where game theory has come to play a major role, Industrial Organization, presents us with numerous examples. The field is primarily devoted to the study of industries dominated by a few large firms. Let the airline industry serve as an example. The fare structure, and other policies, implemented by a major airline, such as South African Airways, is bound to have an impact upon rival airlines. The rivals can be expected to react. South African Airways will, of course, anticipate such reactions, and will factor these expected reactions into its planning.
Many fields of economics are now influenced by game theory. In recognition of the growing importance of game theory to economics, the Nobel Prize in Economics was awarded to a trio of game theorists in 1994. Furthermore, an increasing number of areas outside of economics employ game theory. Examples are provided by international relations, legal studies, and, in the natural sciences, evolutionary biology.
In the terminology of game theory, the “individuals” are referred to as “players.” The “players” are assumed to be rational and to have various courses of action open to them, which are referred to as “strategies.” The expected return to a player, in following a particular strategy, is then referred to as a “payoff.” The size of the expected return or “payoff” will, needless to say, be dependent upon the known, or expected, reactions of other “players.” The interaction between, or among, the “players”, as they execute their strategies, is the game. The stable outcome of a game, if it exists, is termed the “solution” to the game. Finally, the game may be a “once only” affair, or it may be repeated.
There are two broad categories of games, these being competitive, or non-cooperative, games, and cooperative games. In a cooperative game, the players are assumed to be motivated entirely by self interest, but have some incentive to endeavour to cooperate. Of prime importance is the fact that players are able to communicate with one another effectively. In competitive, non-cooperative, games, the lines of communication between and among the players are, more often than not, faulty, or are simply non-existent.
With the digression now complete, we are now in a position to address the question of non-cooperative management of transboundary fishery resources, and the consequences arising therefrom, when there is “strategic interaction” between and among the coastal states sharing the resource(s). The economic analysis of this case makes use appropriately of the theory of non-cooperative games.
One of the trio to win the 1994 Nobel Prize in Economics was John Nash, who can be seen as the founder of modern game theory, as applied to economics. Nash defined a stable solution to a non-cooperative game as a situation in which each player has no incentive to change, given the strategies being followed by the other player(s) (Nash, 1951).
Two independent investigations of the non-cooperative fisheries game were published in 1980. One of the investigations was carried by Colin Clark, a participant in the BCLME Project: Exploring Economic and Social Contributions of Hake Fisheries in Namibia and South Africa, (Clark, 1980); the other was carried out by Levhari and Mirman (1980). Both came to the same conclusion. A stable solution to the non-cooperative game would involve, except in unusual circumstances, mismanagement of the resource from society’s point of view. Clark (1980) argues that, if the players are symmetric, i.e. identical in all respects, the outcome will be similar to that encountered in an unrestricted open access domestic fishery, i.e. significant overexploitation of the resource, and dissipation of the potential net economic returns (resource rent) from the fishery. The overall outcome to the fisheries game is an example of what is probably the most famous of all non-cooperative games, known as the “Prisoner’s Dilemma”, which merits our close attention.
The point of the “Prisoner’s Dilemma” game is that the players in the non-cooperative game will be driven to adopt strategies, which each recognizes as being undesirable. The name comes from a story told by the author of the game to illustrate the point (Tucker, 1950). Two men are arrested on suspicion of having committed a major theft. The suspicions are, in fact, entirely valid. The two suspects, A and B, are kept completely separate from one another. The impossibility of communication between the two acts as a perfect barrier to cooperation.
Prisoner A is interviewed by the chief prosecutor, who admits that the evidence, which he has, is limited. A is told that, if both he and B plead not guilty, they can each expect to receive a six month sentence on a lesser charge. If both A and B plead guilty, they will each receive a five year sentence. If A pleads guilty, but B pleads not guilty, A will be released for having assisted the prosecution. If A pleads not guilty, but B pleads guilty, then it will go very hard with A, and A will get ten years. The chief prosecutor holds exactly the same interview with B.
A and B are the players. Each player has two alternative strategies: to plead guilty, or to plead not guilty. If A and B could communicate, and importantly, could enter into a binding agreement (i.e. an agreement in which each would be assured that the other could not, and would not, cheat), they would both plead not guilty, and would look forward to being out of prison in six months time. They cannot communicate, however. The best strategy for A, regardless of which of the two strategies B might choose, is to plead guilty. What is true for A is true for B. Hence, both plead guilty and end up with the decidedly inferior outcome of serving five year sentences.
We can show the outcome of, or “solution” to, the game with greater clarity by setting up a so called Payoff Matrix. The payoffs in the Matrix are expressed in terms of prison sentences. Consider the following, adapted from a pioneering text on game theory and economics, by Luce and Raiffa (1957):
|
Prisoner A\Prisoner B |
Pleads guilty |
Pleads not guilty |
|
Pleads guilty |
5 years each |
0 years for A, and 10 years for B |
|
Pleads not guilty |
10 years for A, and 0 years for B |
1/2 year each |
Suppose that Player B pleads guilty. Player A would clearly be better off pleading guilty. Suppose that Player B pleads not guilty. Player A would, once again, be better off pleading guilty. Regardless of which of the two strategies Player B may adopt, the best strategy for Player A is to plead guilty. Hence, pleading guilty is the dominant strategy for Player A. What holds true for Player A, also holds true for Player B.
Colin Clark, to whom we referred earlier, developed a particularly lucid, albeit somewhat technical, example of the Prisoner’s Dilemma applied to fisheries. The example appears in his 1985 book, Bioeconomic Modelling and Fisheries Management (Clark, 1985), the example is as follows.
Consider a fishery resource, shared by two countries, in which the costs of harvesting are independent of the size of the biomass, and in which the price for harvested fish and unit fishing effort costs are the same for the two countries, and are both constants. For each country, the net return for each unit of fish harvested is p-c, where p is the price of harvested fish and c the unit cost of harvesting. For the sake of simplicity, let p-c=1.
Let x denote the biomass, and G(x) the growth of the biomass, and thus the sustainable harvest for any given level of x. Suppose that we commence at the global optimal biomass level, i.e. the biomass level at which the global economic returns from the resource will be maximized. Denote that biomass by x*. The global economic return from the resource at x = x* is the present value of the sustainable harvest through time, which can be expressed as: G(x*)/, where is the appropriate rate of interest, or discount rate, assumed to be common to the two countries.
One possible harvest policy is simply to deplete the resource. Since harvesting costs are independent of the size of the resource, the resource could be reduced to zero. If, commencing at x = x*, the resource is depleted to zero, the economic return from so doing would be just x*. We assume that x* is positive, which implies, in turn, that x * < G(x*)/.
Country 1 has two possible strategies: deplete the resource, or conserve it. If Country 1 adopts the deplete strategy, while Country 2 follows the conserve strategy, it is assumed that Country 1 can deplete the resource so quickly that Country 2 receives nothing (and thus ends up as the “goat”). What holds true for Country 1, holds true for Country 2, which faces the same set of strategies.
Finally, we assume that the two countries have equal bargaining strength and harvesting power. Hence, if the two follow the same strategies, they will share the economic returns from the fishery equally.
The Payoff Matrix looks as follows:
|
Country 1/Country 2 |
Conserve |
Deplete |
|
Conserve |
|
0, x* |
|
Deplete |
x*,0 |
|
If both conserve, each
will receive one-half of the present value of the sustainable
harvest, i.e. .
If both deplete, each will receive
.
If both deplete, each will receive![]() .
Since
.
Since ,
then it follows that, if the two countries could communicate with one
another, and could enter into a binding agreement, they would
cooperate and we would end up with the resource being conserved.
,
then it follows that, if the two countries could communicate with one
another, and could enter into a binding agreement, they would
cooperate and we would end up with the resource being conserved.
Suppose, on the other
hand, that there is no cooperation, no communication, between the two
countries. Assume, to begin with, that
 and consider Country 1. If Country 2 should follow the conserve
strategy, Country 1 will receive
and consider Country 1. If Country 2 should follow the conserve
strategy, Country 1 will receive![]() ,
if it conserves, and x*, if it depletes. If Country 2 should follow
the deplete strategy, Country 1 would receive 0, if it follows the
conserve strategy, and
,
if it conserves, and x*, if it depletes. If Country 2 should follow
the deplete strategy, Country 1 would receive 0, if it follows the
conserve strategy, and
![]() if it follows the deplete strategy. Clearly Country 1 should adopt
the deplete strategy. What holds true for Country 1, hold true for
Country 2, and we end up with a deplete, deplete outcome. This is a
perfect Prisoner’s Dilemma case (Clark, 1985, pp. 151-153).
if it follows the deplete strategy. Clearly Country 1 should adopt
the deplete strategy. What holds true for Country 1, hold true for
Country 2, and we end up with a deplete, deplete outcome. This is a
perfect Prisoner’s Dilemma case (Clark, 1985, pp. 151-153).
Suppose, on the other
hand, that .
Country 1 would be better off conserving, if Country 2 followed the
conserve strategy. It is indeed possible that we could end up with a
conserve, conserve outcome, implying that the two would, in effect,
engage in tacit cooperation. But, be aware that such an outcome is
decidedly fragile and uncertain. Suppose that Country 1, guessing
that Country 2 will conserve, adopts the conserve strategy, but is
then proven wrong. Country 2 depletes, with the result that Country
1 is left with 0, and is indeed the “goat.”
.
Country 1 would be better off conserving, if Country 2 followed the
conserve strategy. It is indeed possible that we could end up with a
conserve, conserve outcome, implying that the two would, in effect,
engage in tacit cooperation. But, be aware that such an outcome is
decidedly fragile and uncertain. Suppose that Country 1, guessing
that Country 2 will conserve, adopts the conserve strategy, but is
then proven wrong. Country 2 depletes, with the result that Country
1 is left with 0, and is indeed the “goat.”
There is, in the theory of
games, a famous criterion for selecting strategies in non-cooperative
games, which is particularly applicable when one’s fellow
player is both aggressive and unpredictable. It is referred to as
the maxmin criterion.
The criterion states that one should look at the worst possible
outcome from following each strategy, and compare. Then one should
choose the strategy having the least bad outcome. In the case under
discussion,
the Payoff Matrix tells us that the worst outcome for Country 1, if
it follows the conserve strategy, is that it will receive 0 (the
“goat” outcome). The worst outcome for Country 1, if it
follows the deplete strategy, is that it will receive![]() .
An application of the maxmin
criterion would lead Country 1 to choose the deplete strategy. If
Countries 1 and 2 each regard one another as aggressive and
unpredictable, we can look forward to a deplete, deplete outcome. We
might refer to this as the imperfect Prisoner’s Dilemma case
(Clark, 1985, ibid.;
Bacharach, 1976).
.
An application of the maxmin
criterion would lead Country 1 to choose the deplete strategy. If
Countries 1 and 2 each regard one another as aggressive and
unpredictable, we can look forward to a deplete, deplete outcome. We
might refer to this as the imperfect Prisoner’s Dilemma case
(Clark, 1985, ibid.;
Bacharach, 1976).
The Clark example is of two countries sharing a fishery resource, which have somehow arrived at a global optimum, perhaps by chance. His example demonstrates how unstable that optimum is likely to be, in the absence of cooperation. What if, on the other hand, the relevant states do not start in that position, but rather start from a position of common open access and mutual overexploitation of the resource. How then does the Prisoner’s Dilemma come into play?
A common sense answer is given by Max Agüero and Exequiel Gonzalez in a study, prepared for the World Bank, on the small pelagic fish stocks (e.g. anchovies) shared by Chile and Peru (Agüero and Gonzalez, 1996). The two coastal states have achieved the primary level of cooperation in the management of these resources, but not the secondary level (Zuzunaga, 2003).
The Chilean and Peruvian fisheries for these resources are essentially open access ones (Agüero and Gonzalez, ibid.). The Prisoners Dilemma does very much prevail in this case. Both countries recognize that there are benefits to be gained from improved management, but no progress towards improved management will be made in the absence off cooperation at the secondary level. Agüero and Gonzalez argue that “although one country’s harvest depends on the harvesting decisions of the other country, each country knows that the unharvested portion of the transboundary stock may not be available in the future, so that there is no incentive to reduce fishing effort------ “(Agüero and Gonzalez, ibid., p. 3).
The authors construct a simulation model of the shared fisheries. One question, which they ask, is what the consequences would be, if one country, in the absence of full cooperation, did, in fact, attempt to reduce fishing effort, with the object of moving towards a MSY level of the resource, while the other country continued with an open access policy. The answer, provided by the model, is that the conservationist country would actually end up with lower harvests than it had under open access, while its “irresponsible” partner country would enjoy a substantial, albeit temporary, windfall. The “irresponsible” partner country would effectively free ride off the conservationist efforts of the “responsible” country (Agüero and Gonzalez, ibid., p.32).
The implications from the foregoing analysis are straightforward enough. In the absence of formal cooperative resource management arrangement, the coastal states sharing a transboundary resource could conceivably prove to be lucky, in that tacit cooperation between the two might emerge. What we have referred to as the default position allowed by the 1982 UN Convention might prove to be more or less adequate. One has no justification whatsoever, however, in assuming that this will in fact be the outcome. The risk exists that the consequences of non-cooperation could be disastrous, that the costs of non-cooperation could be very high indeed.
Analysis is one thing. We need to know, however, whether there is any evidence supporting the predictions of the economist’s model of the non-cooperative management of transboundary fishery resources could have destructive consequences. The answer is that there is. Indeed, the predictive power of the model is high. The Norway-FAO Expert Consultation provided two excellent case studies of the “Prisoner’s Dilemma” at work. Both involve developed coastal states, which pride themselves on the quality of their fisheries management. Let us examine each of the cases in turn.
The first concerns the Pacific salmon resources shared by Canada and the United States. The Pacific salmon species, being anadromous, are produced in fresh water rivers, streams and lakes. Then, after a time, the fish migrate to an ocean environment, and subsequently return to their fresh water habitats to spawn and die. The fish are normally harvested as they approach the river mouths on their way to spawn.
Pacific salmon, in the Northeast Pacific, are found from northern California to Alaska. The Pacific salmon resource is an inherently shared one. It is inevitable that Canadian fishers capture, “intercept,” some American produced salmon. It is equally inevitable that American fishers “intercept” some Canadian produced salmon.
While many Pacific salmon move into the high seas during part of their life cycle, the Pacific salmon is, nonetheless, a transboundary resource to all intents and purposes. This is due to Article 66 of the 1982 UN Convention. The article, which was included in the Convention due to the joint efforts of Canada and the United States, has had the result that direct high seas fishing of Pacific salmon is deemed to be contrary to international law (Burke, 1994; Miller, 2003; UN, 1982).
The two coastal States were in no doubt that cooperative management of the resource would be mutually beneficial. Moreover, the two, priding themselves on the quality of their respective fisheries management, clearly had the joint capability to manage the resources effectively.
Cooperation initially focused on the Fraser River, wholly in Canadian territory, which was, and is, arguably the most important Pacific salmon river in the Western Hemisphere (Munro and Stokes, 1989). In the 1960s, it was decided that the focus on the Fraser River was insufficient. Negotiations on cooperative resource management were extended to include all Pacific salmon resources, from northern California to the Gulf of Alaska.
The negotiations led ultimately to the signing of the Canada – US Pacific Salmon Treaty in 1985 (Treaty, 1985). The negotiations, leading up to the Treaty were difficult. While the arrangements pertaining to the Fraser River remained in place, non-cooperative management governed the other salmon stocks. During the years, prior to the signing of the Treaty, there was a constant threat of damaging “fish wars” – deliberate overexploitation of the resources – erupting. Furthermore, it was recognized that both countries had opportunities to enhance the size and strength of the stock produced in their salmon rivers, through various enhancement projects. Each country held back on initiating such projects, for fear that the other would “free ride” (Munro and Stokes, 1989). Indeed, it was the combined threat of “fish wars”, and the continued blocking of enhancement projects, which served as a prod to drive the negotiators on, until they finally achieved (temporary) success.
The Treaty, while initially successful, encountered serious difficulties, and seized up in the early 1990s. The two countries retreated to what we have referred to as the default option, i.e. managing the share of the resources within their respective EEZs, as best they could. During this period, the two countries reverted to competitive behaviour. The “Prisoner’s Dilemma” returned with a vengeance, to the great detriment of the resources. The two coastal States eventually “patched up” the Treaty by signing an Agreement in 1999. While the Agreement has many critics, even the severest critics, with the thought of “fish wars” in mind, concede that an agreement, however flawed, is better than no agreement at all (Miller, 2003; Miller et al., 2001).
The second example involves an orange roughy resource on the South Tasman Rise, shared by Australia and New Zealand. Strictly speaking one could argue that this example should not be considered, because the resource is really a straddling stock, rather than a transboundary one. The resource is to be found in the Australian Fishing Zone, and the adjacent high seas. We use the example, nonetheless. Australia and New Zealand initially attempted to manage the resource, as if it were a transboundary one (Willing, 2003). Moreover, while the management of the resource did, in time, become complicated by third part involvement, the root of the problem, to be described, lay with inadequate Australian-New Zealand cooperation.
At the Norway-FAO Expert Consultation, the case was examined from both the Australian and New Zealand perspectives (Staples, 2003; Willing, ibid.). The discussion to follow is essentially an amalgam of the two case studies, along with comments from Munro et al. (2004).
Orange roughy is a deep sea resource, requiring specialized technology and great skill to harvest (Willing, ibid.). Once the technological barriers have been surmounted, however, the resource proves to be very vulnerable to overexploitation. The resource is exploited during the spawning phase, when an intense aggregation of the resource occurs. The species is extraordinarily long lived (up to 150 years) and slow growing. The harvests are high valued (Willing, ibid.). Uncontrolled exploitation of the resource, during its spawning phases, can easily lead to the resource being effectively mined out. Although it is true that a heavily exploited resource may ultimately recover, the recovery is likely to take a generation, or more.
Exploitation of the South Tasman Rise orange roughy resource commenced in 1997, initiated by the Australian fishing industry. The Australian exploitation aroused the interest of the New Zealand fishing industry. The Australian resource managers, fearing overexploitation of the resource, approached their New Zealand counterparts to establish what amounted to a cooperative resource management regime. The two “players” commenced with strong advantages. Australia and New Zealand are close neighbours, with similar cultural and historical backgrounds. Secondly, both have exemplary records in domestic fisheries management.
There was, however, an important difficulty. The value of the resource, and its vulnerability, meant that the potential threat of the “Prisoner’s Dilemma” was acute.
If the Australian/New Zealand vessel owners had any doubts about the stability of the management regime, the rational strategy for them, regardless of how fervently they might believe in the benefits of conservation, would be to attempt to exploit the resource quickly, and to do so with all the harvesting capacity at their command.
The Australian and New Zealand authorities entered into an agreement in December 1997, in the form of a Memorandum of Understanding. It was understood that the MoU would come into force at the beginning of March 1998. There was, however, ambiguity over acceptable harvesting activities between December 1997, and the start date of the beginning of March in the following year. New Zealand agreed to withdraw its fleet from the fishery, until the start date. The Australian fleet did not withdraw. It is alleged that, during the December-February interim, the Australian fleet harvested close to the entire agreed upon quota for the 1998/1999 season.
New Zealand maintained that the spirit of the agreement had been violated. During the term of the MOU, Australia was to claim that New Zealand was exceeding its quota. The MoU expired on February 28, 1999, with bitterness and recriminations on both sides. The MoU was not renewed (Staples, ibid.; Willing, ibid.).
There was, however, at least an informal agreement between the two countries for the 1999/2000 season. The two agreed that they would work towards a global quota equal to that set by the previous season, and would use the sharing formula, which was supposed to have been in place in that season. Australia did, this time, more or less adhere to its agreed upon share. The New Zealand fleet’s catch, on the other hand, ended up being almost four times larger than New Zealand’s presumed share (Staples, ibid.). Munro et al. comment that this was not an unexpected reaction by that fleet to its experience in the previous season (Munro et al., ibid.). Validated harvests for the two countries, for the 1999-2000 season proved to be almost 75 per cent in excess of the informally agreed upon total quota (Staples, ibid.).
This unhappy situation was then aggravated by the unexpected appearance of third party vessels. The third party vessels took what were believed to be significant harvests (Munro et al., ibid.).
In 2000, Australia and New Zealand signed a new MoU, which was to be long term in nature, and under which the two countries agreed to address the problem of third party fishing (Staples, ibid.; Willing, ibid.). The new MoU may, however, have come too late.
No one knows for certain what the actual harvests were in the disastrous 1999/2000 season. What is known, however, is that the total harvests during the 2001-2002 season were less than 10 per cent of the agreed upon quota for the earlier seasons (Staples, ibid.). Derek Staples states that “current indicators suggest a low remaining biomass and low future yields,” (Staples, ibid. p. 163). Jane Willing, in turn, remarks that equilibrium is maintained because yields are so low. Third party fishing is no threat, because it is not worth the while of third party participants to bother with the fishery (Willing, ibid., p. 205). Munro et al. speculate that the Australian and New Zealand fishing industries probably do not see one another as a threat worth worrying about, as far as this fishery is concerned (Munro et al., ibid.).
Munro et al. also remark on the fact that the economics of non-cooperative management of transboundary fisheries points to the distinct possibility of a “solution” to competitive fisheries games approaching the equivalent of a true open access fishery, i.e. gross overexploitation. They continue that one could argue that the South Tasman Rise orange roughy fishery has, MoU or no MoU, all of the appearances of such a competitive fisheries game “solution” (Munro et al., ibid.).
The second part of our answer pertains to the fact that cooperation, once in place, may provide opportunities for increasing the efficiency of the joint fisheries, to the benefit of all sharing the resource. An example is provided by the case of the Arcto-Norwegian cod resource, shared by Norway and Russia in the Barents Sea, to which we shall refer in more detail at a later point. The cod tend to spawn largely in the Russian EEZ, and achieve maturity in the Norwegian EEZ. Under a mutual access agreement between the two coastal states, made possible by the cooperative resource management arrangement, the Russians are allowed to take part of their cod quota in the Norwegian zone (Stokke, 2003). This is efficient, both in terms of the biological management of the resource, and in terms of the economics of the fishery.
The next question is whether there have been any attempts to quantify the economic benefits of resource management cooperation. The answer is that there have been several. Armstrong and Sumaila make what may be called a first approximation estimate of the benefits of managing BCLME hake on a full cooperative basis (Armstrong and Sumaila, 2004). They estimate that the net economic benefits (rent) from the combined fishery could be increased by over 40 per cent, if full cooperative management were put in place.
Their assessment of the current situation shows no evidence of what we might call the “Prisoner’s Dilemma” syndrome being present in the exploitation of the shared stock, or stocks. The absence of the “Prisoner’s Dilemma” syndrome could reflect, either the absence, in turn, of recognition of “strategic interaction” between the South African and Namibian fleets (inadvertent tacit cooperation), or the presence of true tacit cooperation (Armstrong and Sumaila, ibid.). In any event, the implication is that there are opportunities for efficiencies offered by cooperation, which have not been realized.
There have been other empirical studies of the consequences of cooperative management, which suggest, if anything, that Armstrong and Sumaila have underestimated the economic benefits of cooperative management (2004). One such study is the World Bank study on the management of transboundary small pelagic stocks shared by Chile and Peru, to which we have already referred. Using their simulation model, Agüero and Gonzalez estimate the present value (PV) of net economic returns from the fishery 40 years into the future (with the mid-1990s as their start date), using a 5 per cent rate of discount, under different scenarios. The two scenarios relevant for our consideration are: (i) a continuation of the current open access, and cooperation at the primary level; (ii) full fledged cooperation at the secondary level. Under scenario (i), the estimated PV is just under US$ 1 billion. Under scenario (ii), the estimated PV is just under US$ 3 billion (Agüero and Gonzalez, ibid.). The latter estimate does not incorporate the costs of administering a full cooperative regime.
An even more striking example is provided by a study, undertaken by Armstrong and Flaaten of the Arcto-Norwegian cod stock, shared by Norway and the Soviet Union/Russia in the Barents Sea, to which we have already referred (Armstrong and Flaaten, 1991). The resource has been cooperatively managed by the two coastal states, under a commission, since the mid- 1970s. The cooperative resource management regime commenced when the two countries were very much on opposite sides of the Cold War, and has survived the upheavals in the Soviet Union/Russia.
Armstrong and Flaaten estimate the net economic returns, in PV terms, from the existing cooperative regime, and compare this estimate with an estimate of the returns under non-cooperation. They argue persuasively that the fishery would, under non-cooperation, degenerate into an open access one – the Prisoner’s Dilemma, once again. The difference is massive. The net economic return from cooperative management is over 50 times the estimated return from non-cooperation. They conclude that the ongoing stability of the cooperative management regime can be explained by the very large “cooperative surplus” (Armstrong and Flaaten, ibid.).
The Armstrong and Flaaten study is, of course, over a decade old. A paper prepared for the Norway-FAO Expert Consultation on the Barents Sea cooperative fisheries management regime, however, confirms that the Armstrong – Flaaten conclusions have lost none of their validity (Stokke, 2003).
Some Conclusions
The question now before us is what implications the preceding discussion has for the cooperative management of BCLME hake. The first and obvious implication is that it is of utmost importance to determine the extent to which the hake resources are in fact shared, directly or indirectly, between South Africa and Namibia.
The existing evidence suggests strongly that there is at least some degree of sharing of the paradoxus, if not the capensis, stocks. We have noted that Armstrong and Sumaila estimate that the net economic returns from the combined fisheries could be increased by 40 per cent if full fledged secondary level cooperative management was achieved (Armstrong and Sumaila, ibid.).
A critical question is how stable the advertent, or inadvertent, current tacit cooperation between the two coastal states is. If the tacit cooperation should break down, then it can be guaranteed that the costs of other than full resource management cooperation will be very high indeed.
Agüero, M. and Exequiel G. (1996) Managing Transboundary Stocks of Small Pelagic Fish: Problems and Options, World Bank Discussion Paper No.329 Fisheries Series, Washington.
Armstrong, C. and Flaaten, O. (1991) The Optimal Management of a Transboundary Fishery Resource. In: The Arcto-Norwegian Cod Stock (R. Arnason and T. Bjørndal eds.), Essays on the Economics of Migratory Fish Stocks, Berlin, Springer-Verlag: 137-152.
Armstrong, C. and Sumaila, U.R. (2004) The Namibian-South African Hake Fishery – Costs of non-cooperative management. In: Namibia’s Fisheries: Ecological, Economic and Social Aspects (U.R. Sumaila, D. Boyer, M. Skog, and S.I. Steinshamm eds.), pp. 231-244. Eburon, Netherlands.
Armstrong, C., A. Erastus O. Msiska and Sumaila, U.R. (2004) The Namibianisation policy. In: Namibia’s Fisheries: Ecological, Economic and Social Aspects (U.R. Sumaila, D. Boyer, M. Skog, and S.I. Steinshamm eds.), pp. 231-244. Eburon, Netherlands.
Bacharach, M. (1976) Economics and the Theory of Games, London, The MacMillan Press.
BCLME (1999) Transboundary Diagnostic Analysis, UNDP, GEF, UNOPS.
BCLME (2002) Strategies Action Programme, UNDP, GEF, UNOPS.
Benguela Current News, July 2004.
Binmore, K. (1992) Fun and Games. Lexington Massachusetts: D.C. Heath.
Boyer, D.C. and Hampton, I. (2001) An overview of the living marine resources of Namibia. South African Journal of Marine Science 23: 5-35.
Burke, W.T. (1994) The New International Law of Fisheries: UNCLOS 1982 and Beyond, Oxford, Clarendon Press.
Christensen, V. and Maclean, J.L. (2004) Placing fisheries in their ecosystem context. In: Ecological modeling: an international journal on ecological modeling and systems ecology 172 (2-4): 103-440.
Churchill, R.R. and Lowe, A.V. (1988) The Law of the Sea, Second Edition, Manchester, Manchester University Press.
Clark, C.W. (1980) Restricted Access to a Common Property Resource. In: Dynamic Optimization and Mathematical Economics (P. Liu ed.), New York, Plenum Press: 117-132.
Clark, C.W. (1985) Bioeconomic Modelling and Fisheries Management, New York, Wiley Interscience.
Cullinan, C, Svein M., and Currie, H. (2004) Institutional Study regarding the establishment of a regional organization to promote integrated management and sustainable use of the BCLME. Draft Report to the BCLME Programme. Windhoek, Namibia.
FAO of the UN (1979) Interim Report of the ACMRR Working Party on the Scientific Basis of Determining Management Measures, FAO Fisheries Circular No. 718, Rome.
FAO (1995) Impacts of predator-prey relationships on harvesting strategies and management. International conference on the sustainable contribution of fisheries to food security. Kyoto, Japan, 4-9 December 1995. FAO Corporate Document Repository.
FAO (2002a) Report of the expert consultation on ecosystem-based fisheries management – Reykjavik, Iceland 16-19 September 2002. FAO Corporate Documentary Repository.
FAO (2002b) Report of the Norway-FAO Expert Consultation on the Management of Shared Fish Stocks Bergen, Norway, 7-10 October 2002, FAO Fisheries Report No. 695, Rome.
Fischer,
R.D. and Mirman, L.J. (1992) Strategic dynamic interaction: fish
wars. Journal of Economic Dynamics and Control 16: 267-287.
Fischer, R.D. and Mirman, L.J. (1996) The complete fish wars: biological and dynamic interactions. Journal of Environmental Economics and Management 30(1): 34-42.
Gordon, H.S. (1954) The economic theory of a common property resource: the fishery. Journal of Political Economics 62:124-152.
Gulland, J.A. (1980) Some Problems of the Management of Shared Stocks, FAO Fisheries Technical Paper No. 206, Rome.
Holt, R.F. (2001) An ecosystem-based management planning framework for the North Coast LRMP. Background Report. www.citbc.org/b-EcoManFra-Holt-Mar01.pdf.
Iyambo, I. (2004) Forward to Namibia’s Fisheries: Ecological, Economic and Social Aspects. In U.R. Sumaila, D. Boyer, M. Skog and S.I. Steinshamm (Editors) Namibia’s fisheries: Ecological, Economic and Social Aspects. Eburon, Netherlands, 363 pp.
Levhari, D. and Mirman, L.J. (1980) The Great Fish War: An Example Using a Dynamic Cournot-Nash Solution. Bell Journal of Economics 11: 649-661.
Luce, R.D. and Raiffa, H. (1957) Games and Decisions: Introduction and Critical Survey, New York, John Wiley & Sons.
MRMR (2000) Annual Report of the Namibian Ministry of Fisheries and Marine Resources.
Miller, K.A. (2003) North American Pacific Salmon: A Case of Fragile Cooperation. In: FAO Papers Presented at the Norway-FAO Expert Consultation on the Management of Shared Fish Stocks Bergen, Norway, 7-10 October 2002, FAO Fisheries Report No. 695 Supplement, Rome: 105-122.
Miller, K., Munro, G., McDorman, G.T., McKelvey, R. and Tydemers, P. (2001) The 1999 Pacific Salmon Agreement: A Sustainable Solution? Occasional Papers: Canadian-American Public Policy, No. 47, Orono, Canadian-American Center, University of Maine.
Munro, G.R. (1987) The Management of Shared Fishery Resources Under Extended Jurisdiction. Marine Resource Economics 3: 271-296.
Munro, G.R. and Stokes, R.L. (1989) The Canada-United States Pacific Salmon Treaty. In: Canadian Oceans Policy: National Strategy and the New Law of the Sea (D. McRae and G. Munro eds.), Vancouver, University of British Columbia Press: 17-38.
Munro, G.R., Willmann, R. and Cochrane, K.L. (2004) On the Management of Shared Fish Stocks. In: Critical Issues and International Initiatives to Address Them (A.I.L Payne, C.M. O’Brien and S.J. Rogers eds.), Oxford, Blackwell Publishing: 95-112.
Munro, G.R, Willmann, R. and Van Houtte, A. (2004) The Conservation and Management of Shared Fish Stocks: Legal and Economic Aspects, FAO Fisheries Technical Paper 465, Rome.
Nash, J. (1951) Noncooperative Games. Annals of Mathematics 54:289-295.
RFIS (2002) A review of information relevant to Development of Effective Cooperative Arrangements for the Management of Shared Fish Stocks in the SADC Region.
Sandifer, P. (2004) Moving toward ecosystem based management: how do we get there from here? www.nmsfocean.org/chow2004/sandifer.ppt.
Shannon, L.V. and O’Toole, M.J. (1998) An overview of the Benguela ecosystem. Collected papers, First Regional Workshop, Benguela Current Large Marine Ecosystem (BCLME) Programme, UNDP, Cape Town, South Africa, 22-24 July 1998: 20pp.
Shannon, L.J., Cochrane, K.L. and Pillar, S.C. (eds.) (2004) Ecosystem approaches to fisheries in the southern Benguela. African Journal of Marine Science (Special Issue) 26: 328 p.
Staples, D. (2003) Management of Shared Fish Stocks – Australian Case Studies. In: FAO Papers Presented at the Norway-FAO Expert Consultation on the Management of Shared Fish Stocks Bergen, Norway, 7-10 October 2002, FAO Fisheries Report No. 695 Supplement, Rome: 159-179.
Stokke, O.S. (2003) Management of Shared Fish Stocks in the Barents Sea, in FAO, Papers Presented at the Norway-FAO Expert Consultation on the Management of Shared Fish Stocks Bergen, Norway, 7-10 October 2002, FAO Fisheries Report No. 695 Supplement, Rome: 180-191.
Stuttaford, M. (ed.) (1999) Fishing Industry Handbook: South Africa, Namibia and Mocambique. Exbury Publications, Cape Town, South Africa. 404 p.
Sumaila, U.R. (1997) Strategic dynamic interaction: the case of Barents Sea Fisheries. Marine Resource Economics 12: 77-94.
Sumaila, U.R. and Vasconcellos, M. (2000) Simulation of ecological and economic impacts of distant water fleets on Namibian fisheries. Ecological Economics 32: 457-464.
Sumaila, U.R., Ninnes, C., and Oelofsen, B. (2003) Management of Shared Fish Stocks in the Bengula Marine Ecosystem. In: FAO Papers Presented at the Norway-FAO Expert Consultation on the Management of Shared Fish Stocks Bergen, Norway, 7-10 October 2002, FAO Fisheries Report No. 695 Supplement, Rome: 143-158.
Tucker, A.W. (1950) A Two-Person Dilemma, Stanford University, unpublished.
United Nations 1982. United Nations Convention on the Law of the Sea. UN Doc. A/Conf.62/122.
UN (1982) United Nations Convention on the Law of the Sea. UN Doc. A/Conf.62/122.
Willing, J. (2003) Arrangement between the Government of Australia and the Government of New Zealand for the Conservation and Management of Orange Roughy on the South Tasman Rise. In: FAO Papers Presented at the Norway-FAO Expert Consultation on the Management of Shared Fish Stocks Bergen, Norway, 7-10 October 2002, FAO Fisheries Report No. 695 Supplement, Rome: 200-214.
Zuzunaga, J. (2003) Some Shared Fish Stocks of South Eastern Pacific. In: FAO Papers Presented at the Norway-FAO Expert Consultation on the Management of Shared Fish Stocks Bergen, Norway, 7-10 October 2002, FAO Fisheries Report No. 695 Supplement, Rome: 216-230.
Acronyms
MFMR: Ministry of Fisheries and Marine Resources
BENEFIT: Benguela Fisheries Environment Interaction & Training Programme
BCLME: Benguela Current Large Marine
ICCAT: The International Commission for the Conservation of Atlantic Tunas
SADC: Southern African Development Cooperation
SEAFO: Southeast Atlantic Fisheries Organization
DEAT: Department of the Environment and Trade
MCM: Marine Coastal Management