


GB Monograph Series 14b.qxd 5/25/04 9:46 AM Page 1
Ballast W
ater Risk Assessment
Global Ballast Water
Management Programme
G L O B A L L A S T M O N O G R A P H S E R I E S N O . 1 4
Port of Sepetiba, Federal Republic of Brazil
Ballast Water Risk Assessment
Port of Sepetiba
Federal Republic of Brazil
Final Report
DECEMBER 2003
Final Report
Chris Clarke, Rob Hilliard,
.dwa.uk.com
Andrea de O. R. Junqueira,
Alexandre de C. Leal Neto, John Polglaze
GLOBALLAST MONOGRAPH SERIES
& Steve Raaymakers
More Information?
el (+44) 020 7928 5888 www
Programme Coordination Unit
Global Ballast Water Management Programme
International Maritime Organization
4 Albert Embankment
London SE1 7SR United Kingdom
Tel: +44 (0)20 7587 3247 or 3251
est & Associates, London. T
Fax: +44 (0)20 7587 3261
Web: http://globallast.imo.org
NO.14
A cooperative initiative of the Global Environment Facility,
United Nations Development Programme and International Maritime Organization.
Cover designed by Daniel W


GloBallast Monograph Series No. 14
Ballast Water Risk Assessment
Port of Sepetiba
Federal Republic of Brazil
December 2003
Final Report
Chris Clarke1, Rob Hilliard1,
Andrea de O. R. Junqueira3, Alexandre de C. Leal Neto2,
John Polglaze1 & Steve Raaymakers4
1 URS Australia Pty Ltd, Perth, Western Australia
2 GloBallast Brazil, Rio de Janeiro
3 Departamento de Biologia Marinha, Universidade Federal do Rio de Janeiro
4 Programme Coordination Unit, GEF/UNDP/IMO Global Ballast Water Management Programme, International
Maritime Organization
! International Maritime Organization
ISSN 1680-3078
Published in April 2004 by the
Programme Coordination Unit
Global Ballast Water Management Programme
International Maritime Organization
4 Albert Embankment, London SE1 7SR, UK
Tel +44 (0)20 7587 3251
Fax +44 (0)20 7587 3261
Email sraaymak@imo.org
Web http://globallast.imo.org
The correct citation of this report is:
Clarke, C., Hilliard, R., Junqueira, A. de O. R., Neto, A. de C. L., Polglaze J. & Raaymakers, S. 2004. Ballast Water Risk
Assessment, Port of Sepetiba, Federal Republic of Brazil, December 2003: Final Report. GloBallast Monograph Series No.
14. IMO London.
The Global Ballast Water Management Programme (GloBallast) is a cooperative initiative of the Global Environment Facility (GEF),
United Nations Development Programme (UNDP) and International Maritime Organization (IMO) to assist developing countries to reduce
the transfer of harmful organisms in ships' ballast water.
The GloBallast Monograph Series is published to disseminate information about and results from the programme, as part of the
programme's global information clearing-house functions.
The opinions expressed in this document are not necessarily those of GEF, UNDP or IMO.
Ballast Water Risk Assessment, Port of Sepetiba, Federal Republic of Brazil, December 2003: Final Report
Acknowledgements
The Ballast Water Risk Assessment for the Port of Sepetiba was undertaken during 2002 and funded
by the GEF/UNDP/IMO Global Ballast Water Management Programme and the Government of
Brazil. The study team (Appendix 2) wishes to thank the following agencies and people for the
assistance:
Companhia Docas do Rio de Janeiro (CDRJ)
Rio de Janeiro
Fundaçăo Estadual de Engenharia do Meio Ambiente (FEEMA)
Rio de Janeiro
Agęncia Nacional de Vigilância Sanitária (ANVISA)
Brasilia
Instituto de Estudos do Mar Almirante Paulo Moreira (IEAPM)
Arraial do Cabo
Ministério do Meio Ambiente (MMA)
Brasilia
Universidade Federal do Rio de Janeiro (UFRJ)
Rio de Janeiro
Universidade Federal do Paraná (UFPR)
Paraná
Dr Luis Antonio O. Proença
Universidade do Vale do Itajaí, Santa Catarina, Brazil
Dr Chad Hewitt
Biosecurity Unit, New Zealand Ministry of Fisheries, Auckland
Dr Fred Wells
Western Australian Museum, Perth, Western Australia
Dr Gustaaf Hallegraeff
University of Tasmania, Hobart, Tasmania
Dr Keith Hayes
CSIRO Marine Research, Hobart, Tasmania
The report was formatted and prepared for print by Leonard Webster.
i
Ballast Water Risk Assessment, Port of Sepetiba, Federal Republic of Brazil, December 2003: Final Report
Acronyms
ANVISA
Agęncia Nacional de Vigilância Sanitária (National Agency for Health Surveillance)
BW
Ballast water
BWM
Ballast water management
BWRA
Ballast Water Risk Assessment
BWRF
Ballast Water Reporting Form (the standard IMO BWRF is shown in Appendix 1)
CDRJ
Companhia Docas do Rio de Janeiro (Rio de Janeiro Port Company)
CFP
Country Focal Point (of the GloBallast Programme in each Pilot Country)
CFP/A
Country Focal Point Assistant
CRIMP
Centre for Research on Introduced Marine Pests (now part of CSIRO Marine
Research, Hobart, Tasmania)
CSIRO
Commonwealth Scientific and Industrial Research Organisation (Australia)
DSS
Decision support system (for BW management)
DWT
Deadweight tonnage (typically reported in metric tonnes)
FEEMA
Fundaçăo Estadual de Engenharia do Meio Ambiente (Foundation for the Study of
Environmental Engineering)
GIS
Geographic information system
GISP
Global Invasive Species Programme
GloBallast
GEF/UNDP/IMO Global Ballast Water Management Programme
GT
Gross tonnage (usually recorded in metric tonnes)
GUI
Graphic User Interface
IALA
International Association of Lighthouse Authorities
IBSS
Institute of Biology of the Southern Seas (Odessa Branch) of the Ukraine National
Academy of Science
IEAPM
Instituto de Estudos do Mar Almirante Paulo Moreira (Admiral Paulo Moreira
Institute of Marine Studies)
IHO
International Hydrographic Organization
IMO
International Maritime Organization
IUCN
The World Conservation Union
LAT
Lowest Astronomical Tide
MESA
Multivariate environmental similarity analysis
MEPC
Marine Environment Protection Committee (of the IMO)
NEMISIS
National Estuarine & Marine Invasive Species Information System (managed by
SERC)
NIMPIS
National Introduced Marine Pests Information System (managed by CSIRO,
Australia)
NIS
Non-indigenous species
OBO
Ore/bulk oil tankers (an rather unsuccessful vessel class now used for oil transport
only)
OS
Operating System (of any personal or mainframe computer)
PCU
Programme Coordination Unit (of the GloBallast Programme based at IMO London)
PRIMER
Plymouth Routines In Marine Environmental Research
PBBS
Port Biological Baseline Survey
ROR
Relative overall risk
SAP
(Regional) Strategic Action Plan
SERC
Smithsonian Environmental Research Center (United States)
VLCC
Very large crude carrier (200,000 300,000 DWT)
UFRJ
Universidade Federal Rio de Janeiro (Federal University of Rio de Janeiro)
ULCC
Ultra large crude carrier (over 300,000 DWT)
ii
Ballast Water Risk Assessment, Port of Sepetiba, Federal Republic of Brazil, December 2003: Final Report
Glossary of Terms and Definitions
The following terms and definitions are summarised from various sources including Carlton (1985,
1996, 2002), Cohen & Carlton (1995), Hilliard et al. (1997a), Leppäkoski et al. (2002), Williamson et
al. (2002) and the GloBallast BWRA User Guide. The latter document contains more detailed
definitions with explanatory notes, plus a glossary of maritime terms.
Ballast water
Any water and associated sediment used to manipulate the trim and
stability of a vessel.
Bioinvasion
A broad based term that refers to both human-assisted introductions
and natural range expansions.
Border
The first entrance point into an economy's jurisdiction.
Cost benefit analysis
Analysis of the cost and benefits of a course of action to determine
whether it should be undertaken.
Cryptogenic
A species that is not demonstrably native or introduced.
Disease
Clinical or non-clinical infection with an aetiological agent.
Domestic
Intra-national coastal voyages (between domestic ports).
routes/shipping
Established
A non-indigenous species that has produced at least one self-sustaining
introduction
population in its introduced range.
Foreign routes/shipping
International voyages (between countries).
Fouling organism
Any plant or animal that attaches to natural and man-made substrates
such as piers, navigation buoys or hull of ship, such as seaweed,
barnacles or mussels.
Harmful marine species
A non-indigenous species that threatens human health, economic or
environmental values.
Hazard
A situation that under certain conditions will cause harm. The
likelihood of these conditions and the magnitude of the subsequent
harm is a measure of the risk.
Indigenous/native
A species with a long natural presence that extends into the pre-historic
species
record.
Inoculation
Any partial or complete discharge of ballast tank water that contains
organisms which are not native to the bioregion of the receiving waters
(analogous to the potentially harmful introduction of disease causing
agents into a body as the outcome depends on inoculum strength and
exposure incidence).
Intentional introduction
The purposeful transfer or deliberate release of a non-indigenous
species into a natural or semi-natural habitat located beyond its natural
range.
iii
Ballast Water Risk Assessment, Port of Sepetiba, Federal Republic of Brazil, December 2003: Final Report
Introduced species
A species that has been intentionally or unintentionally transferred by
human activity into a region beyond its natural range.
Invasive species
An established introduced species that spreads rapidly through a range
of natural or semi-natural habitats and ecosystems, mostly by its own
means.
Marine pest
A harmful introduced species (i.e. an introduced species that threatens
human health, economic or environmental values).
Non-invasive
An established introduced species that remains localised within its new
environment and shows minimal ability to spread despite several
decades of opportunity.
Pathogen
A virus, bacteria or other agent that causes disease or illness.
Pathway (Route)
The geographic route or corridor from point A to point B (see Vector).
Port Biological Baseline
A biological survey to identify the types of introduced marine species
Survey (PBBS)
in a port.
Risk
The likelihood and magnitude of a harmful event.
Risk assessment
Undertaking the tasks required to determine the level of risk.
Risk analysis
Evaluating a risk to determine if, and what type of, actions are worth
taking to reduce the risk.
Risk management
The organisational framework and activities that are directed towards
identifying and reducing risks.
Risk species
A species deemed likely to become a harmful species if it is introduced
to a region beyond its natural range, as based on inductive evaluation
of available evidence.
Translocation
The transfer of an organism or its propagules into a location outside its
natural range by a human activity.
Unintentional
An unwitting (and typically unknowing) introduction resulting from a
introduction
human activity unrelated to the introduced species involved (e.g. via
water used for ballasting a ship or for transferring an aquaculture
species).
Vector
The physical means or agent by which a species is transferred from one
place to another (e.g. BW, a ship's hull, or inside a shipment of
commercial oysters)
iv
Ballast Water Risk Assessment, Port of Sepetiba, Federal Republic of Brazil, December 2003: Final Report
Lead Agencies
Lead Agency for General BW Issues in Brazil:
Contact person:
Mr Robson José Calixto
Position:
Acting Deputy Country Focal Point
Organization:
Ministério do Meio Ambiente (Ministry of Environment)
Address:
Esplanada dos Ministério Bloco B, Sala 831, Brasília - DF
Brazil. 70.068-900
Tel:
+55 61 317 11 56
Fax:
+55 61 224 24 66
Email: robson-jose.calixto@mma.gov.br
Web:
www.mma.gov.br/aguadelastro
Primary contact for BW Risk Assessments in Brazil:
Contact person:
Mr Alexandre de C. Leal Neto
Position:
Country Focal Point Assistant
Organization:
GloBallast - Brazil
Address:
Rua Teófilo Otoni 4, Rio de Janeiro-RJ, Brazil. 20.090-070.
Tel:
+55 21 3870 5674
Fax:
+55 21 3870 5674
Email:
aneto@dpc.mar.mil.br
v
Ballast Water Risk Assessment, Port of Sepetiba, Federal Republic of Brazil, December 2003: Final Report
Executive Summary
The introduction of harmful aquatic organisms and pathogens to new environments via ships' ballast
water (BW) and other vectors has been identified as one of the four greatest threats to the world's
oceans. The International Maritime Organization (IMO) is working to address the BW vector through
various initiatives. One initiative has been the provision of technical assistance to developing
countries through the GEF/UNDP/IMO Global Ballast Water Management Programme (GloBallast).
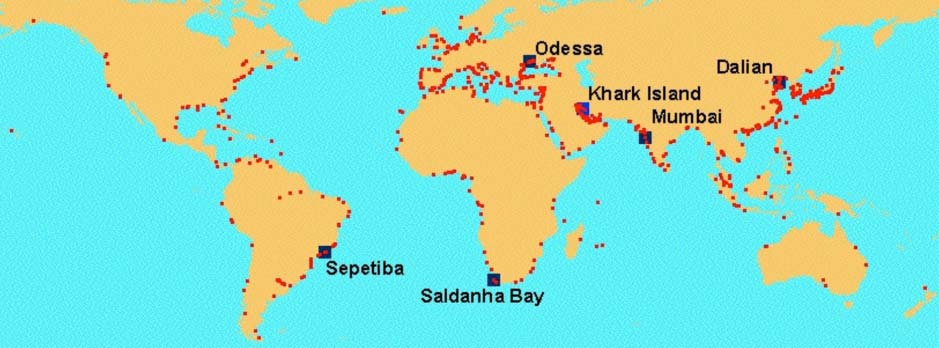
Core activities of the GloBallast Programme are being undertaken at Demonstration Sites in six Pilot
Countries. These sites are the ports at Sepetiba (Brazil), Dalian (China), Mumbai (India), Khark
Island (Iran), Odessa (Ukraine) and Saldanha Bay (South Africa). One of these activities (Activity
3.1) has been to trial a standardised method of BW risk assessment (BWRA) at each of the six
Demonstration Sites. Risk assessment is a fundamental starting point for any country contemplating
implementing a formal system to manage the transfer and introduction of harmful aquatic organisms
and pathogens in ships' BW, whether under existing IMO Ballast Water Guidelines (A.868(20)) or
the new international Convention.
To maximise certainty while seeking cost-effectiveness and a relatively simple, widely applicable
system, a semi-quantitative approach was followed, using widely-supported computer software. The
semi-quantitative method aims to minimise subjectivity by using as much quantitative data as
possible, to identify the riskiest ballast tank discharges with respect to a Demonstration Site's current
pattern of trade. Unlike a fully quantitative approach, it does not attempt to predict the specific risk
posed by each intended tank discharge of individual vessels, nor the level of certainty attached to such
predictions. However, by helping a Demonstration Site to determine its riskiest trading routes,
exploring the semi-quantitative BWRA provides a coherent method for identifying which BW sources
deserve more vessel monitoring and management efforts than others.
This report describes the BWRA activity undertaken for the Port of Sepetiba, which is the
Demonstration Site for the Federal Republic of Brazil, managed by Companhia Docas do Rio de
Janeiro (CDRJ). This capacity-building activity commenced in January 2002, with URS Australia Pty
Ltd (URS) contracted to the Programme Coordination Unit (PCU) to provide BWRA training and
software. Under the terms of reference, the consultants worked closely with their counterparts in a
project team co-managed by URS and the Country Focal Point Assistant (CFPA) for completing all
required tasks. These tasks required two in-country visits by the consultants (in April and August-
September 2002) to install the BWRA software and provide `hands-on' instruction and guidance.
Most of the data collation tasks were undertaken before, between and during these visits, with gap-
filling work undertaken by the consultants prior to a short `project wrap-up' visit in March 2003.
The first step was to collate and computerise data from IMO Ballast Water Reporting Forms
(BWRFs) to identify the source ports from which BW is imported to the Demonstration Site. For
periods or vessel arrivals where BWRFs were not collected or were incomplete, gap-filling data were
extracted from the port shipping records held at the Sepetiba port offices. These records also helped
identify which next ports of call may have been a destination port for any BW taken up at Sepetiba.
A multivariate procedure was then used to determine the relative environmental similarity between
the Demonstration Site and each of its BW source and destination ports. Comparing port-to-port
environmental similarities provides a relative measure of the risk of organism survival, establishment
and potential spread. This is the basis of the `environmental matching' method adopted by the project,
which facilitates estimating the risk of BW introductions when the range and types of potentially
harmful species that could be introduced from a particular source port are poorly known.
Another objective of the BWRA Activity was to identify `high-risk' species that may be transferred to
and/or from the Demonstration Site. The customised BWRA database provided by URS therefore
contained tables and interfaces for storing and managing the names, distribution and other information
on risk species. The taxonomic details, bioregional distribution, native/introduced status and level of
vi
Ballast Water Risk Assessment, Port of Sepetiba, Federal Republic of Brazil, December 2003: Final Report
threat assigned to a species were stored in the database for display, review and update as well as for
the BWRA analysis. For the purposes of the BWRA and its `first-pass' risk assessment, a risk species
was considered to be any introduced, cryptogenic or native species that might pose a threat to marine
ecological, social and/or commercial resources and values if successfully transferred to or from a
Demonstration Site.
During each visit the consultants worked alongside their Pilot Country counterparts to provide skills-
transfer as part of the capacity building objectives of the programme, with the project team divided
into three groups. Group A mapped the port and its resources using ArcView GIS. This group
included counterparts from Rio de Janeiro's State Foundation of Environmental Engineering
(Fundaçăo Estadual de Engenharia do Meio Ambiente - FEEMA) who helped collate and compile
much of the required GIS data. Group B was responsible for managing the customised Access
database supplied by the consultants, and for entering, checking and managing the BW discharge data,
as recorded on the BWRF submitted by arriving ships and/or derived from the port's shipping records.
Group B used the database to identify BW source and destination ports, which was designed by the
consultants for ongoing input and management of BWRFs. Group C undertook the environmental
matching and risk species components of the Activity, using the PRIMER package to perform the
multivariate analyses for determining the environmental distances between Sepetiba and its source
and destination ports.
The various BW discharge, environmental matching and risk species data described above were then
processed by the database with other risk factors, including voyage duration and tank size, to provide
preliminary indication of:
(a) the relative overall risk posed by each BW source port; and
(b) which destination ports appeared most at risk from any BW uplifted at the Demonstration
Site.
This was achieved using a project standard approach, although the database also facilitates instant
modifications of the calculations for exploratory and demonstration purposes. The GloBallast BWRA
also adopted a `whole-of-port' approach to compare the subject port (Demonstration Site) with all of
its BW source and destination ports. The project has therefore established in Rio de Janeiro an
integrated database and geographic information system (GIS) that manages and displays:
· ballast water data obtained from arriving ship BWRFs and port shipping records;
· information on the Demonstration Site's navigational, physical and environmental conditions
and aquatic resources,
· port-to-port environmental matching data,
· risk species data, and
· risk coefficients and graphical categories of risk for ballast discharges.
The results, which were graphically displayed on user-friendly GIS port and world maps as well as in
ranked output tables, help determine the types of management responses.
Of the 919 vessel visits and 1540 associated ballast tank discharges added to the database by the end
of the second consultants visit, half originated from BWRFs submitted between January 2001 and
June 2002, the rest being expanded from spreadsheet data provided by the CFP-A from 1998-2000
port shipping records. The total number of BW source ports identified from the tank discharge records
was 148. The source port `supplying' the highest frequency of BW discharges at Sepetiba was
Rotterdam (9%), followed by Santos (Brazil; 4.4%), Ijmuiden (Netherlands; 4.2%) and Praia Mole
(Brazil; 4.1%). The top 16 source ports provided 50% of all source-identified discharges, while only
38 of all source ports (26%) accounted for 75% of the total number of source-identified discharges at
Sepetiba.
vii
Ballast Water Risk Assessment, Port of Sepetiba, Federal Republic of Brazil, December 2003: Final Report
The total volume of BW discharged at Sepetiba from the identified source ports was 11,652,829
tonnes. The source port rankings for discharged volume were similar to those for discharge frequency.
Source ports providing the largest volume of discharged BW were Rotterdam (13.4%), Santos (Brazil;
7.2%) and Salvador (Brazil; 5.6%). The top 11 of identified source ports provided 50% of the total
discharged volume, while only 33 (22%) of all identified source ports accounted for 75% of the source-
identified volume discharged at Sepetiba. Of the top 20 ports, five were in Brazil, three in both the
Netherlands and United States, two in both France and United Kingdom, and one each in Australia,
Belgium, Gibraltar, Portugal and Spain.
Of the 104 potential BW destination ports (i.e. reported Next Ports of Call where BW uplifted at
Sepetiba could be discharged), only 44 of them accounted for >80% of reported Next Ports of Call.
The nearby port of Santos was by far the most frequently reported destination port (over 10%, and
which serves Brazil's largest industrial city of Sao Paulo). Of the 17 ports accounting for the
destinations of >50% of vessel departures from Sepetiba, five were in Brazil, four in Argentina, two
each in France and China, and one each in Bulgaria, Colombia, Mexico and Taiwan Province.
Of the various BW source and potential destination ports, sufficient environmental data were obtained
to include 58% of the former and 56% of the latter in the multivariate similarity analysis by PRIMER.
These ports accounted for 80% of all tank discharges and 67% of all vessel departures respectively.
To allow all identified BW source ports and next ports of call to be part of the `first-pass' risk
assessment, ports not included in the multivariate analysis were provided with environment matching
coefficient estimates. The most environmentally similar port to Sepetiba was Rio de Janeiro (0.86
matching coefficient), while 22 other Brazilian ports had either calculated or estimated coefficients in
the 0.7 - 0.8 range. The nearest similar ports beyond Brazil were the west African port of Abidjan
(0.70), Singapore (0.63) and several Mediterranean ports (>0.6). The most environmentally dissimilar
ports trading with Sepetiba in 1998-2002 were riverine, highly brackish and/or cool water ports in
North America, southern Argentina and north-west Europe (matching coefficients in the 0.2 -0.3
range).
The relative overall risk (ROR) posed by each of Sepetiba's identified BW source ports was
calculated as proportions of the total threat due its contemporary (1998-2002) trading pattern. The
project standard ROR calculations identified 20 of Septiba's148 identified source ports as
representing the highest risk group, in terms of their BW discharge frequency, volume, environmental
similarity and assigned risk species threat. However it was noted that the risk species threat
component calculated for each source port (which varied according to the number of introduced and
native species in its bioregion, and their categorization as either unlikely, suspected or known harmful
species) did not provide a globally reliable list owing to regional biases in aquatic sampling effort and
taxonomic knowledge.
From the 919 visit records, the project standard calculation indicated that Brazilian ports provided the
top 20% of the total ROR (values in the 0.20-0.29). The highest risk ports were led by Santos (ROR
0.290) and Rio de Janeiro (0.285), closely followed by Rio Grande and Praia Mole (0.248). The first
non-Brazilian ports were Montevideo (Uruguay) and Rotterdam (Netherlands), which were grouped
as `High Risk' ports and ranked 22nd and 23rd overall (RORs close to 0.20). The highest risk ports
beyond the Atlantic were the Mediterranean ports of Taranto, Italy (0.201) and the Adiratic port of
Koper, Slovenia (0.199). The highest risk port beyond the Atlanto-Mediterranean area was the Pacific
coast Mexican port of Lazaro Cardenas (ranked 42nd with a ROR value of 0.183). Seventy five of
Sepetibas's BW source ports were ranked in the low (31) and lowest (44) risk categories. These had a
wide distibution and were warm or cool water ports plus riverine/brackish ports. The source port with
the lowest ROR (0.05) was the cool temperate port of Puerto Madryn in southern Argentina.
Based on Sepetiba's pattern of shipping trade in 1998-2002, the ROR results indicated that BW from
vessels arriving from ports in temperate to cool temperate pose far less of threat than those from
Brazil's coast and southern Europe, with the exception of Rotterdam and Lazaro Cardenas in Mexico.
In the case of the Brazilian ports, their relatively close environmental similarities and regular BW
viii
Ballast Water Risk Assessment, Port of Sepetiba, Federal Republic of Brazil, December 2003: Final Report
sources made them dominate the highest risk group. The project standard results therefore indicated a
much higher threat of BW-mediated introductions is posed by vessels arriving in ballast from
Brazilian and southern European ports, and this was logical given Sepetiba's biogeographic location
and trading pattern. The project standard results also indicated that the `first-pass' treatment of the
risk coefficients provides a reasonable benchmark for any investigative manipulations of the risk
formula or database management.
While the tropical and subtropical coastline of Brazil does not appear to be experiencing the level of
harmful invasive species recently reported for the cooler Uruguayan and Argentinean waters, it was
clear that Sepetiba Bay is not immune to the spread of harmful marine species such as
introduced/cryptogenic toxic dinoflagellates that can increase the severity and impacts of red tides.
For a largely tropical country with a high number of brackish and estuarine ports, the issue of water-
borne tropical pathogens such as cholera, typhus and yellow fever and parasites was also recognized.
The BWRA results confirmed that Sepetiba `exports' considerable volumes of BW, much of which
appeared to be destined for other Brazilian ports (especially via bulk carriers departing the coal and
alumina berths and some of the ships leaving the Tecon wharf). However, reliable identification of the
BW destination ports was confounded by the lack specific questions on the IMO-standard BWRFs,
and the uncertainty of knowing if a recorded `Next of Port Call' is where BW is actually discharged.
The most important BW destination port appeared to be Santos, and this port also had one of the
closest environmental matching values to Sepetiba. The results therefore indicated that any unwanted
species which establishes in Sepetiba Bay has a more than reasonable chance of `port-hopping' to
both Santos or Rio de Janeiro via BW-mediated transfers. In the case of more distant ports, the French
Atlantic port of Quimper was a relatively frequent next port of call with a moderate environmental
similarity (0.5). In the case of the risk species currently assigned to Sepetiba's bioregion, noxious
phytoplanktonic species that can make cysts, survive ballast tank conditions and produce suffocating
or toxic red tides in eutrophic inshore waters, represented species deemed likely to cause the highest
potential impacts if introduced to new areas.
The top 20 ports identified in the highest risk category by the project-standard method were all
Brazilian ports. This outcome was to a large part determined by the size of their environmental
matching coefficients, together with the relatively short voyage durations. An investigation of the
project standard's default weightings confirmed that the environmental coefficient was powerful, and
that altering these can lead to unexpected outcomes and create the potential trap of merely playing
`numbers games', particularly if the objective and rationale for altering the project standard
calculation and default input factors are not clearly established. It was recognized there is a good
argument for allowing environmental matching to remain the most influential component of a BWRA
formula when there is any doubt as to the completeness or reliability about the particular risk species
threat. It was therefore concluded that, when evaluating any BWRA results, each risk component of
the calculation should be examined to understand its contribution to the overall outcome, whichever
method is used.
Of the various BWRA objectives and tasks that were undertaken during the activity, reliable
identification of destination ports that may receive BW from the Demonstration Site was confounded
by the lack of specific questions on the IMO-standard BWRFs, and the uncertainty of knowing if the
`Next Port of Call' recorded on a BWRF is where ballast water is actually discharged. Thus presently
there is no mechanism enabling a `reverse BWRA' to be undertaken reliably. In the case of Sepetiba,
several visiting vessels types do not uniformly discharge or uptake their full capacity of BW, with
many of their previous and next ports of call involving part cargo discharge and loading. If more
reliable and `forward-looking' BWRAs are to be undertaken to identify destination ports in the future,
supplementary questions will need to be added to the present IMO-standard BWRF, including the
names of the three last ports of call as well as the port where discharges from each partially or
completely ballasted tank are predicted.
ix
Ballast Water Risk Assessment, Port of Sepetiba, Federal Republic of Brazil, December 2003: Final Report
The main objectives of the BWRA Activity were successfully completed during the 15 month course
of this project, with the various tasks and exploratory/demonstration software providing a foundation
enabling the regional promulgation of further BW management activities by Brazil. Project outputs
included a trained in-country risk assessment team, and an operational BWRA system and User Guide
for use as a demonstration tool in the region. This places Brazil in a good position to provide
assistance, technical advice, guidance and encouragement to other port States in South America.
x
Ballast Water Risk Assessment, Port of Sepetiba, Federal Republic of Brazil, December 2003: Final Report
Table of Contents
Acknowledgements......................................................................................................................................i
Acronyms......................................................................................................................................................ii
Glossary of Terms and Definitions ..........................................................................................................iii
Lead Agencies..............................................................................................................................................v
Executive Summary ...................................................................................................................................vi
1
Introduction and Background .........................................................................................................1
2
Aims and Objectives .........................................................................................................................5
3
Methods ..............................................................................................................................................6
3.1
Overview and work schedule...................................................................................................................6
3.2
Resource mapping of the demonstration port.........................................................................................8
3.3
De-ballasting/ballasting patterns ...........................................................................................................10
3.4 Identification
of source ports..................................................................................................................11
3.5 Identification
of destination ports ...........................................................................................................12
3.6 BWRF
database.....................................................................................................................................13
3.7
Environmental parameters.....................................................................................................................15
3.8 Environmental
similarity analysis...........................................................................................................16
3.9
Risk species ...........................................................................................................................................17
3.10 Risk assessment ....................................................................................................................................22
3.11 Training and capacity building ...............................................................................................................27
3.12 Identification
of information gaps...........................................................................................................29
4
Results ............................................................................................................................................. 30
4.1 Description
of port ..................................................................................................................................30
4.2 Resource mapping .................................................................................................................................33
4.3 De-ballasting/ballasting pattern .............................................................................................................35
4.4 Identification
of source ports..................................................................................................................38
4.5 Identification
of destination ports ...........................................................................................................41
4.6
Environmental similarity analysis ..........................................................................................................42
4.7
Risk species ...........................................................................................................................................47
4.8
Risk assessment results ........................................................................................................................52
4.9
Training and capacity building ...............................................................................................................57
4.10 Identification
of information gaps...........................................................................................................58
5
Conclusions and Recommendations .......................................................................................... 60
5.1
Recommendations .................................................................................................................................60
5.2
BWRA recommendations and plans by Pilot Country ..........................................................................61
6
Location and maintenance of the BWRA System...................................................................... 62
References................................................................................................................................................. 63
APPENDIX 1: Copy of IMO Ballast Water Reporting Form
APPENDIX 2: Risk Assessment Team for the Port of Sepetiba
APPENDIX 3: Check-list of project requirements
APPENDIX 4: Information sources used for collating Port Environmental Data
APPENDIX 5: Sources and references of Risk Species information
APPENDIX 6: Name, UN code, coordinates and environmental parameters of the 357 ports
used for the multivariate similarity analyses for all Demonstration Sites
APPENDIX 7: Consultants' Terms of Reference
xi
Ballast Water Risk Assessment, Port of Sepetiba, Federal Republic of Brazil, December 2003: Final Report
Figure 1.
Locations of the six GloBallast Demonstration Sites and their various ballast water source
and destination ports. .............................................................................................................................. 3
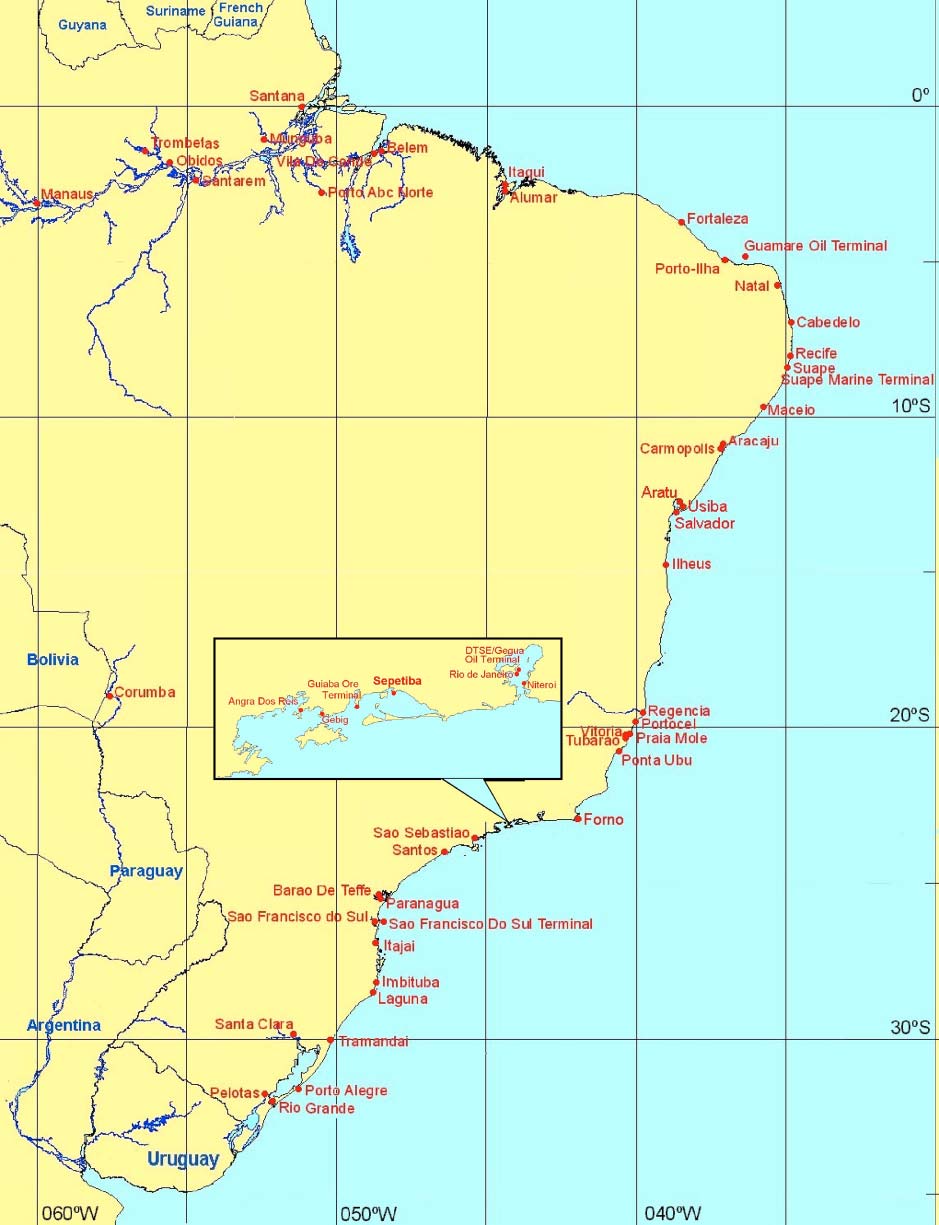
Figure 2.
Location of Sepetiba and other ports of Brazil........................................................................................ 4
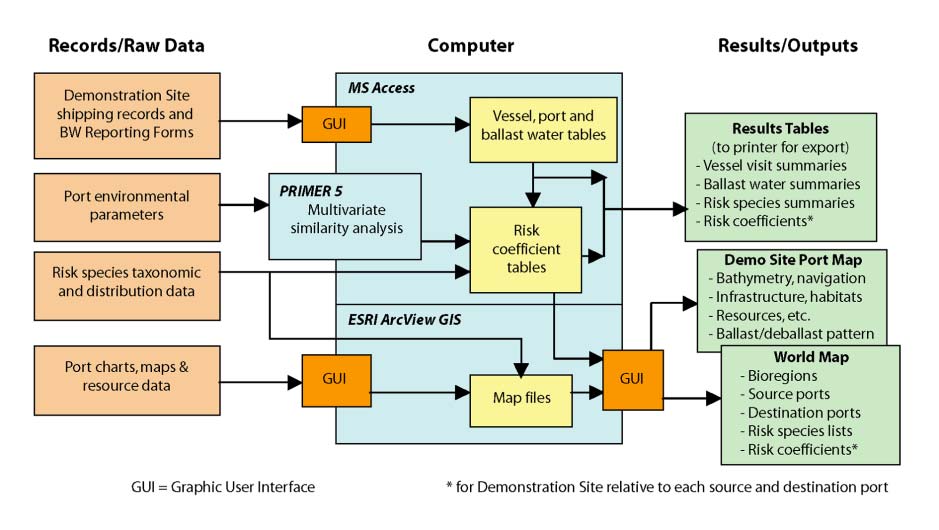
Figure 3.
Schematic of the GloBallast BWRA system ........................................................................................... 6
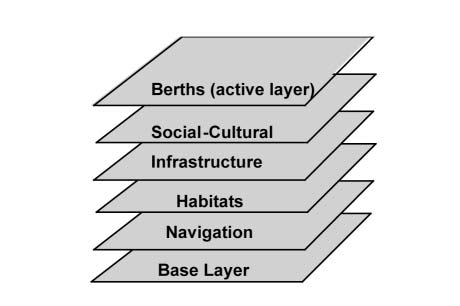
Figure 4.
Thematic layers used for the Port Map GIS............................................................................................ 9
Figure 5.
Working page of the Excel spreadsheet used to estimate BW discharges ......................................... 12
Figure 6.
The three tabs of the GUI used for entering the BWRF data............................................................... 14
Figure 7.
Part of the GIS world map of marine bioregions, showing the code names of those in the
South American region .......................................................................................................................... 19
Figure 8.
Complete GIS world map showing the marine bioregions
[to improve clarity, not all bioregion codes are shown in this example]............................................... 20
Figure 9.
Database GUI used for manipulating the BWRA calculation and weightings ..................................... 23
Figure 10.
Annual wind rose typical of Sepetiba Bay region
(Angra dos Reis; 23o 0.5' S 44o 19.0' W; for 30 years)..................................................................... 30
Figure 11.
GIF frame of modelled ballast water plume dispersing from Sepetiba,
at the 40 hour mark for tide and SW winds (a) and tide plus calm conditions (b) ............................... 31
Figure 12.
GIF frame of modelled ballast water plume dispersing from Sepetiba by the
action of tide and NE winds at the 40 hour (a) and 80 hour (b) marks ................................................ 32
Figure 13.
Part of the GIS Port Map showing the navigation, infrastructure and active berth layers
for Sepetiba (inset shows approach channels and anchorage) ........................................................... 33
Figure 14.
Part of the GIS Port Map showing the marine habitats and reserve layers......................................... 34
Figure 15.
BW discharge statistics displayed by GIS Port Map for the Ferteco (iron ore) export terminal.......... 36
Figure 16.
BW discharge statistics displayed by GIS Port Map for the multi-use Tecon terminal ....................... 37
Figure 17.
BW discharge statistics displayed by GIS Port Map for the Alumina dry and liquid bulk terminal...... 37
Figure 18.
GIS output showing the location and relative importance of BW source ports with respect to
frequency of tank discharges (C1) at Port of Sepetiba......................................................................... 38
Figure 19.
GIS output showing location and relative importance of the source ports with respect to
the volume of tank discharges (C2) at Port of Sepetiba....................................................................... 39
Figure 20.
GIS output showing the location and frequency of destination ports, recorded as the
Next Port of Call in the Port of Sepetiba BWRFs and shipping records .............................................. 41
Figure 21.
GIS output showing the location and environmental matching coefficients (C3) of
BW source ports identified for the Port of Sepetiba ............................................................................. 43
Figure 22.
GIS output showing the location and environmental matching coefficients (C3) of
the destination ports identified for the Port of Sepetiba........................................................................ 43
Figure 23.
GIS output showing the location and risk species threat coefficients (C4) of
the BW source ports identified for the Port of Sepetiba ....................................................................... 48
Figure 24.
GIS output showing the location and categories of relative overall risk (ROR)
of source ports identified for the Port of Sepetiba ................................................................................ 53
Figure 25.
Frequency distribution of the standardised ROR values...................................................................... 53
xii
1
Introduction and Background
The introduction of harmful aquatic organisms and pathogens to new environments via ships' ballast
water (BW) and other vectors, has been identified as one of the four greatest threats to the world's
oceans. The International Maritime Organization (IMO) is working to address the BW vector through
a number of initiatives, including:
· adoption of the IMO Guidelines for the control and management of ships' ballast water to
minimize the transfer of harmful aquatic organisms and pathogens (A.868(20));
· developing a new international legal instrument (International Convention for the Control
and Management of Ships' Ballast Water and Sediments, as adopted by an IMO Diplomatic
Conference in February 2004); and
· providing technical assistance to developing countries through the GEF/UNDP/IMO Global
Ballast Water Management Programme (GloBallast).
Core activities of the GloBallast Programme are being undertaken at Demonstration Sites in six Pilot
Countries. These sites are the ports at Sepetiba (Brazil), Dalian (China), Mumbai (India), Khark
Island (Iran), Odessa (Ukraine) and Saldanha Bay (South Africa). Activities carried out at the
Demonstration Sites will be replicated at additional sites in each region as the programme progresses
(further information at http://globallast.imo.org).
One of GloBallast's core activities (Activity 3.1) has been to trial a standardised method of BW risk
assessment (BWRA) at each of the six Demonstration Sites. Risk assessment is a fundamental starting
point for any country contemplating implementing a formal system to manage the transfer and
introduction of harmful aquatic organisms and pathogens in ships' BW, whether under the existing
IMO Ballast Water Guidelines (A.868(20)) or the new Convention.
A port State may wish to apply its BW management regime uniformly to all vessels that call at its
ports, or it may wish to assess the relative risk of these vessels to its coastal marine resources and
apply its regime selectively. Uniform application or the `blanket' approach offers the advantages of
simplified administration and no requirement for `judgement calls' to be made. This approach also
requires substantially less information management effort. If applied strictly, the uniform approach
offers greater protection from unanticipated bio-invaders, as it does not depend on the reliability of a
decision support system that may not be complete. However, the key disadvantage of the strict blanket
approach are the BW management costs imposed on vessels which otherwise might not be forced to
take action. It also requires a substantial vessel monitoring and crew education effort to ensure all
foreign and domestic flagged ships are properly complying with the required BW management
actions.
A few nations have started to develop and test systems that allow more selective application of BW
management requirements, based on voyage-specific risk assessments. This `selective' approach
offers to reduce the numbers of vessels subject to BW controls and monitoring, and is amenable to
nations that wish to reduce the introduction, and/or domestic spread, of `targeted' marine species only.
More rigorous measures can be justified on ships deemed to be of high risk if fewer restrictions are
placed on low risk vessels.
For countries/ports that choose the selective approach, it is essential to establish an organized means
of evaluating the potential risk posed by each arriving vessel, through a `Decision Support System'
(DSS). However, this approach places commensurate information technology and management
burdens on the port State, and its effectiveness depends on the quality of the information and database
systems that support it. A selective approach that is based on a group of targeted species may also
leave the country/port vulnerable to unknown risks from non-targeted species.
1
Ballast Water Risk Assessment, Port of Sepetiba, Federal Republic of Brazil, December 2003: Final Report
Before a port State decides on whether to adopt the blanket or the selective approach, it needs to carry
out some form of risk assessment for each port under consideration. Ballast water risk assessments
(BWRAs) can be grouped into three categories1:
· Qualitative Risk Identification: this is the simplest approach, and is based on subjective
parameters drawn from previous experience, established principals and relationships and
expert opinion, resulting in simple allocations of `low', `medium' and `high' risk. However it
is often the case that subjective assessments tend to overestimate low probability/high
consequence events and underestimate higher probability/lower consequence events (e.g.
Haugom et al, in Leppäkoski et al. 2002).
· Semi-Quantitative Ranking of Risk: this `middle' approach seeks to increase objectivity and
minimise the need for subjective opinions by using quantitative data and ranking of
proportional results wherever possible. The aim is to improve clarity of process and results,
thereby avoiding the subjective risk-perception issues that can arise in qualitative approaches.
· Quantitative Risk Assessment: this is the most comprehensive approach which aims to
achieve a full probablistic analysis of the risk of BW introductions, including measures of
confidence. It requires significant collation and analysis of physico-chemical, biological and
voyage-specific data, including key lifecycle and tolerance data for every pre-designated
species of risk (`target species'), port environmental conditions, ship/voyage characteristics,
the BW management measures applied, and input and evaluation of all uncertainties. The
approach requires a high level of resourcing, computer networking and sophisticated
techniques that are still being developed1.
The purpose of GloBallast Activity 3.1 has been to conduct initial, first-pass BWRAs for each
Demonstration Site. To maximise certainty while seeking cost-effectiveness and a relatively simple,
widely applicable system, the middle (semi-quantitative) approach was selected.
The first step of the GloBallast method is to collate data from IMO Ballast Water Reporting Forms
(BWRFs) (as contained in Resolution A.868(20); see Appendix 1) to identify the source ports from
which BW is imported to the demonstration port. For periods or vessel arrivals where BWRFs were
not collected or are incomplete, gap-filling data can be extracted from port shipping records.
Source port/discharge port environmental comparisons are then carried out and combined with other
risk factors, including voyage duration and risk species profiles, to give a preliminary indication of
overall risk posed by each source port. The results help determine the types of management responses
required, while the BWRA process provides a foundation block enabling application of more
sophisticated BW management DSSs by Pilot Countries.
The GloBallast approach is not the only one available but is considered to combine the best elements
of the semi-quantitative method to provide useful results within the available budget (US$250,000
spread across the six pilot countries). It has also taken a `whole-of-port' approach which compares the
subject port (Demonstration Site) with all of its BW source and destination ports. The outputs include
published reports, trained in-country risk assessment teams and an operational BWRA system for use
as demonstration tools in each of the six main developing regions of the world, plus a platform and
database to facilitate further DSS development. The GloBallast BWRA activity has therefore
established an integrated database and information system to manage and display:
· ballast water data from arriving ship BWRFs and port shipping records;
· data on the demonstration port's physical and environmental conditions and aquatic
resources,
· port-to-port environmental matching data,
1 for further details see the GloBallast BWRA User Guide.
2
1 Introduction and Background
· risk species data, and
· ballast water discharge risk coefficients.
The results provide a knowledge base that will help the Pilot Countries and other port States to
evaluate the risks currently posed by BW introductions, identify high priority areas for action, and
decide whether to apply a blanket or selective BW management regime. If a selective regime is
adopted, vessel and voyage-specific risk assessments can then be applied using systems such as those
being developed and trialled by the Australian Quarantine & Inspection Service (AQIS Decision
Support System), Det Norsk Veritas in Norway (EMBLA system) and the Cawthron Institute in New
Zealand (SHIPPING EXPLORER), and/or by further development of the GloBallast system. If a
uniform approach is adopted, the results help identify which routes and vessel types warrant the most
vigilance in terms of BW management compliance checking and verification monitoring, including
ship inspections and ballast tank sampling.
The geographical spread and broad representativeness of the six Demonstration Sites also means that
the results help plug a very large gap in the existing global knowledge base. Figure 1 indicates the
broad global spread of the GloBallast risk assessment activity. As a result of this activity,
comprehensive data are now available on source port and destination port linkages, environmental
parameters, environmental matching coefficients, risk species and relative overall risk of BW
transfers for the six GloBallast Demonstration Sites and a total of 723 ports around the world. Project
outcomes will therefore place governments, scientists, the shipping industry and the general public in
a stronger, more enlightened position to deal with the BW problem.
Figure 1. Locations of the six GloBallast Demonstration Sites and their various ballast water source and
destination ports.
This report describes and presents the results of the first Ballast Water Risk Assessment (BWRA)
carried out for the Port of Sepetiba (Brazil) during 2002. This GloBallast Demonstration Site is a
relatively modern bulk commodity and general cargo handling port which was expanded during the
late 1990s to relieve pressure on the crowded facilities inside Rio de Janeiro harbour, which lies some
60 km to the east (Figure 2).
3
Ballast Water Risk Assessment, Port of Sepetiba, Federal Republic of Brazil, December 2003: Final Report
Figure 2. Location of Sepetiba and other ports of Brazil
4
2
Aims and Objectives
The aims of the GloBallast BWRA for the Port of Sepetiba were set by the GloBallast Programme
Coordination Unit (PCU), in accordance with Terms of Reference developed by the PCU Technical
Adviser (Appendix 7) and were to:
1. Assess and describe as far as possible from available data, the risk profile of invasive aquatic
species being both introduced to and exported from Sepetiba in ships' BW, and to identify the
source ports and destination ports posing the highest risk for such introductions.
2. Help determine the types of management responses that are required, and provide the
foundation blocks for implementing a more sophisticated BW management system for the
Port of Sepetiba.
3. Provide training and capacity building to in-country personnel, resulting in a fully trained risk
assessment team and operational risk assessment system, for ongoing use by the Pilot
Country, replication at additional ports and use as a demonstration tool in the region.
The specific objectives of the BWRA for the Port of Sepetiba were to:
1. Identify, describe and map on a Geographic Information System (GIS) all coastal and marine
resources (biological, social/cultural and commercial) in and around the port that might be
impacted by introduced marine species.
2. Characterise, describe and map (on GIS) de-ballasting and ballasting patterns in and around
the port including locations, times, frequencies and volumes of BW discharges and uptakes.
3. Identify all ports/locations from which BW is imported (source ports).
4. Identify all ports/locations to which BW is exported (destination ports).
5. Establish a database at the nominated in-country agency for the efficient ongoing collection,
management and analysis of the data collected at the Port of Sepetiba via standard IMO
BWRFs.
6. Characterise as far as possible from existing data, the physical, chemical and biological
environments for both Sepetiba and each of its source and destination ports.
7. Develop environmental similarity matrices and indices to compare the Port of Sepetiba with
each of its source ports and destination ports, as a key basis of the risk assessment.
8. Identify as far as possible from existing data, any high-risk species present at the source ports
that might pose a threat of introduction to the Port of Sepetiba, and any high-risk species
present at this port that might be exported to a destination port.
9. Identify any information gaps that limit the ability to undertake the aims and objectives and
recommend management actions to address these gaps.
5
Ballast Water Risk Assessment, Port of Sepetiba, Federal Republic of Brazil, December 2003: Final Report
3
Methods
3.1
Overview and work schedule
The BWRA Activity for the Port Sepetiba was conducted by URS Australia Pty Ltd (URS) under
contract to the GloBallast PCU, in accordance with the Terms of Reference (Appendix 7). The
consultants worked alongside their Pilot Country counterparts during the country visits to provide
training and skills-transfer as part of the capacity building objectives of the programme. Structure and
membership of the joint project team is shown in Appendix 2.
The consultants adopted an innovative, modular approach that integrated three widely used computer
software packages to provide a user-friendly tool for conducting, exploring and demonstrating semi-
quantitative BWRAs. As shown in Figure 3, the key software comprised:
· Microsoft Access - for the main database;
· PRIMER 5 [Plymouth Routines In Marine Environmental Research] - a versatile multivariate
analysis package from the United Kingdom enabling convenient multivariate analysis of the
port environmental data; and
· ESRI ArcView 3.2 Geographic Information System (GIS) - to graphically display the results
in a convenient, readily interpretable format using port and world maps.
Figure 3. Schematic of the GloBallast BWRA system
The work schedule commenced with project briefing meetings with personnel from all six
Demonstration Sites to arrange logistics and resource needs, during the third meeting of the
GloBallast Programme's Global Task Force, held in Goa, India on 16-18 January 2002 (Appendix 3).
The majority of tasks subsequently undertaken for the Port of Sepetiba were completed during two in-
country visits by the consultants (14-19 April and 22 August-06 September 2002), with information
searches and data collation undertaken by both consultant and pilot country team members between
and after these visits. A `project wrap-up' visit was subsequently made by one of the consultants on
12-14 March 2003.
6
3 Methods
The specific tasks of the week-long first visit were to:
· Install and test the Access, ArcView and PRIMER software and the functionality of the
computer system that was located in office space provided in the FEEMA building at Rio de
Janeiro.
· Familiarise the project team with the GloBallast BWRA method by seminar and work-
shopping.
· Commence GIS guidance and developing the port map for the Demonstration Site.
· Commence training on the use of the various Graphic User Interfaces (GUI) of the Access
Database for inputting and editing BW discharge data.
· Visit Sepetiba to tour the port facilities, obtain information on the ballasting practises of
visiting ships and gain an understanding of the coastal habitats and local marine resources.
· Review available BWRFs and port shipping records to identify trading patterns, vessel types,
key BW source ports and likely destination ports.
· Check available port environmental data and identify potential in-country and regional
sources of same.
· Commence listing risk species and identifying potential in-country or regional sources of
same.
· Identify critical information gaps and the data assembly work required before the second visit.
During the longer second visit by the consultants, the environmental and risk species data were added
to the database, more vessel arrival, BW and voyage data were entered and checked, the first BWRA
was undertaken, and a workshop was held to review the initial results and identify future actions.
During the third visit in March 2003, the consultants supplied the CFP-A with updated versions of the
database and BWRA User Guide on CD-ROM, which included additional source port environment
and risk species data (as obtained from the BWRA Activities conducted at the other five
Demonstration Sites). The results of the March 2003 version, plus subsequent corrections to some of
the vessel visit records and environmental matching assignments (made by the CFP-A in consultation
with URS), are reported here.
Throughout the schedule, the joint project team was divided into three groups to facilitate training and
progress (Appendix 2). Group A was responsible for developing the port map and graphically
displaying results via the GIS. All coastal and marine resources (biological, social/cultural and
commercial) in and around the port that might be impacted by aquatic bio-invasions were mapped
using the ArcView GIS, using specific layers to show the bathymetry, navigation aids, port
infrastructure and tables of the port's de-ballasting/ballasting patterns (including frequencies and
volumes of discharges and uptakes for the berth locations).
Group B was responsible for managing the customised Access database supplied by the consultants,
and for entering, checking and managing the BW data, as collated from the BWRFs submitted by
arriving ships (and/or derived from shipping records for periods or arrivals when BWRFs were not
obtained or incomplete). This database was used to identify source and destination ports, and was
designed for ongoing input and management of future BWRFs.
The requirement for arriving ships to submit to the relevant port State authority a completed
form that complies with the IMO BWRF (Appendix 1) is a fundamental and essential first basic
step for any port State wishing to commence a BW management programme2.
2 Several port States (e.g. Australia) and Demonstration Sites (e.g. Dalian, Odessa) have produced their own
BWRFs, using translated formats to permit improved BWRF understanding and completion by local shipping.
Such BWRFs need to include all questions of the IMO standard form. Problems arising from voluntary
submission of BWRFs are described in Section 4.10.
7
Ballast Water Risk Assessment, Port of Sepetiba, Federal Republic of Brazil, December 2003: Final Report
Group C was responsible for collating the port environmental and risk species data, undertaking port-
to-port environmental similarity analyses and performing the BWRA. Thirty four environmental
variables were collated for the Demonstration Site and the majority of its source and destination
ports3, including sea water and air temperatures, salinities, seasonal rainfall, tidal regimes and
proximity to a standardised set of intertidal and subtidal habitats. Where water temperature data or
salinity data could not be found for a source or destination port, values were derived for the riverine,
estuarine or coastal location of the port with respect to the temperature and salinity data ranges of its
IUCN marine bioregion, plus ocean maps depicting sea surface temperature/salinity contours at
quarter degree and degree scales (as obtained from CRIMP [now CSIRO Marine Research], URS and
other sources; Appendix 4).
The multivariate analysis of the port environmental data was undertaken using the PRIMER package,
with the similarity values between the Port of Sepetiba and its source and destination ports converted
into environmental matching coefficients then added to the database. Species in or near source ports
that were deemed to pose a threat if introduced to the Demonstration Site, together with species at the
Demonstration Site that might be exported to a destination port, were identified from all available
sources found by the project team. These sources included preliminary results from the Port
Biological Baseline Surveys (PBBS; as recently completed at each Demonstration Site by another
GloBallast Activity), plus searches of `on-line' databases such as those under ongoing development
by the Smithsonian Environmental Research Center (SERC), the Australian Centre for Research on
Introduced Marine Pests (CRIMP; now CSIRO Marine Research), the Baltic Regional Marine
Invasions Database and the Global Invasive Species Programme (GISP) (Appendix 5). The species
taxonomic information and bioregional distributions were also added to the Access database. The
combined BW discharge, environmental matching and risk species coefficients provided the basis of
the semi-quantitative risk assessment.
Graphic User Interfaces (GUIs) customised by the consultants for the Access database and ArcView
GIS were used to generate results tables and graphical outputs that were displayed on interactive maps
of the Demonstration Site and World bioregions. The various BWRA outputs can be printed, exported
to other software, or viewed interactively to enhance the user-friendliness and management utility of
the system.
The methods used to attain each objective of the BWRA Activity are summarised in the following
sections, with technical details of the risk assessment procedures provided in the GloBallast BWRA
User Guide. This manual was developed by the consultants to facilitate BWRA training and
demonstrations for all six GloBallast Pilot Countries. The BWRA User Guide comprises a separate
document that accompanies this report, and is available from the GloBallast PCU
(http://globallast.imo.org).
3.2
Resource mapping of the demonstration port
The port resources were mapped using ArcView GIS to display the bathymetric, navigational and
infrastructure features, including habitats and social-cultural features. The scope of the Sepetiba port
map extends from the open seaway at the mouth of Sepetiba Bay, and along the port's approaches
past the anchorages to its terminals and berths located at Madeira Island. The map also extends further
3 The complete set of source and destination ports identified for the six Demonstration Sites (723) remained
unknown until the end of the BWRF/port record data collation, database entry and checking phases (i.e. end of
the second round of in-country visits; 22 December 2002). A gap-filling effort was made by the consultants to
obtain the environmental parameters during January 2003, but this had to focus on the most frequently
recorded of these ports since there was insufficient time or resources to order charts and search for the
environmental data for all of them (the majority of which were associated with few or only single vessel
arrivals). For these ports, their environmental matching values were provided by a comparison method
described in Section 4.6.
8
3 Methods
eastward to encompass the edges of the bay and landward to show the port hinterland and watershed
drainages.
Approximately 305 km2 of Sepetiba bay and its hinterland were already in a ArchInfo digital map
format owing to a detailed watershed study undertaken for the Rio de Janeiro's Secretary of State of
Environment in 1997. However there was no subtidal or navigational information, and vector-based
electronic nautical charts were not available for the Sepetiba region. Counterparts from the Fundaçăo
Estadual de Engenharia do Meio Ambiente (Foundation for the Study of Environmental Engineering)
(FEEMA) generated the bathymetry and navigation layers using their digitising table to capture
salient details of port infrastructure, shipping channels and anchorages from the 1:20,000 Baia de
Sepetiba Brazilian nautical chart. Point and pattern symbols were based on the international
IHO/IALA system for nautical charts.
Infrastructure and social cultural information was captured by importing and re-registering FEEMA
ArchInfo files showing transportation lines and land uses, plus digital data extracted from other files
showing local drainage and river systems, terrestrial contours, habitats and reserves. Some intertidal
habitat were also available in digital format from the 1997 study, and these were supplemented by
subtidal habitat information provided by Group C.
For clarity and convenience of data management and display, each `theme' of information was added
as a separate layer that followed the scheme shown in Figure 4. Additional layers were provided to
incorporate various FEEMA coastal zone data, including a colour Landsat image of Sepetiba bay.
Two GIF files showing projected movements of discharged BW from tide-only and by two tide/wind
regimes were provided by the CFP-A and these were linked to the port map.
Figure 4. Thematic layers used for the Port Map GIS
The protocol for the five main layers are described in the BWRA User Guide and summarised below:
Base Layer: The base layer includes important planimetric features such as depth contours, jetties,
important channels and other permanent or at least semi-permanent `reference' features that are
unlikely to change or move. The key features of the base layer for the Port of Sepetiba comprised:
· Coastlines of the mainland and various islands within Sepetiba Bay (as depicted by the high
tide mark on the nautical charts).
· The low tide mark (i.e. the 0 metre bathymetric contour of hydrographic charts).
· 5 metre isobath (often the first continuous contour below the low tide mark).
· 10 metre, 20 metre and 30 metre isobaths.
· Edges of the main shipping channels (often blue or purple lines showing the boundary of
depths maintained by port dredging).
9
Ballast Water Risk Assessment, Port of Sepetiba, Federal Republic of Brazil, December 2003: Final Report
The colour scheme of the base layer follows that of standard nautical charts to maintain the familiar
land/sea depth effect.
Navigational Layer: The standard navigational symbols of the IHO/IALA system were followed as
closely as possible. ArcView's symbol libraries do not contain these international navigation symbols,
and convenient third-party symbology could not be found despite extensive searches of public domain
web resources. Closest-match point and pattern symbols were therefore developed for this purpose,
using the UK Hydrographic Office Chart No. 5011 (= IHO INT 1) as the source.
Habitat Layer: This layer used a standardised, logical colour scheme to facilitate recognition of the
main intertidal and subtidal habitat types in and near the port. It contains coastal habitat information
provided by FEEMA, with some of the natural and artificial habitat boundaries based on notes and
map annotations made by BWRA team members during the port tour, and sediment information
provided by the CFP-A from the Sepetiba PBBS. The port tour was undertaken by vehicle and foot on
15 April 2002. Delineation of some intertidal and subtidal habitat boundaries was supplemented from
seafloor and coastal features displayed on the Baia de Sepetiba nautical chart. These included the
intertidal mud flats, sand beaches and rocky shorelines, plus symbols denoting the presence of sand,
mud or rocky substrate.
Infrastructure Layer: This layer shows the urban and developed land surrounding the port, including
roads and railway lines.
Social-Cultural Layer: Social-cultural features include the three different coastal reserves near the
port and two wildlife breeding grounds, plus the locations of mariculture sites and recognised
recreational fishing areas and sardine grounds in Sepetiba Bay. There is no dedicated fishing port in
Sepetiba Bay, with the nearest ramps and a small jetty used by recreational and artesanal fishing boats
located at the head of a shallow embayment 4 km north of the port.
Berth Layer: An `active' berth layer was added to show the principal berthing and anchoring areas at
the Port of Sepetiba. Their names and numbering system were supplied by the Port of Sepetiba
engineer. The same nomenclature was also used for the berthing area information stored in the Access
database, to allow display of statistical summaries of the BW source and discharge data on the correct
locations of the GIS port map (the GloBallast BWRA User Guide shows how the database-GIS link is
established).
3.3
De-ballasting/ballasting patterns
The deballasting/ballasting patterns at Sepetiba were discussed during the port visit (15 April 2002)
where a meeting was held at the port manager's office to confirm the types of port trade, pilotage
rules and draft requirements, current anchorage areas and deballasting/ballasting practises and
locations. Copies of port shipping records covering 1998-2001 had been previously supplied to the
CFP-A for a previous project.
Further information was obtained from the shipping records of Sepetiba's port authority (Companhia
Docas do Rio Janeiro - CDRJ) for periods where BWRFs were unavailable or incomplete4. It was
relatively simple to determine where and which arriving ships discharged or uplifted BW by
identifying their berthing location and vessel type, because the port has dedicated bulk import and
export terminals plus a new multipurpose terminal capable of handling vehicles, containers, break-
bulk and general cargo. However many ships arriving at the latter only part discharged and/or part
loaded cargo and it was often unclear if and how much ballast water was being discharged or taken
up, particularly by ro-ro vessels and container ships.
4 These records listed the vessel name, arrival and departure dates, berth, last port of call, and cargo details.
10
3 Methods
3.4 Identification of source ports
To provide confidence as to which ports were the predominant sources of BW discharged at Sepetiba,
visit records from a spreadsheet containing information extracted from Sepetiba's port shipping
records for the 1998-2000 were added to the Access database. Source ports were therefore identified
from BWRFs (January 2001 - June 2002) and from shipping record information previously obtained
from the Sepetiba port office.
BWRFs had been collected from arriving ships by the Agęncia Nacional de Vigilância Sanitária,
(National Agency for Health Surveillance) (ANVISA); Brazil's federal agency for border health and
quarantine control), at Sepetiba since June 2000 on a voluntarily basis. Completion and submission of
this form became mandatory after January 2001 due to Resolution 17, a national regulation
established by ANVISA to all vessels that claim Free Pratique (as reviewed in November 2001 as
Resolution 217). BWRFs collected from 1 January 2001 were entered into the database. Before a new
port was added to the database, the port and country name spelling, its location coordinates, bioregion
and unique UN Port Code number were checked using the Lloyds Fairplay World Ports Guide and
world bioregion list in the database (port data input is detailed in the GloBallast BWRA User Guide).
Whenever possible, BWRFs were cross-referenced with port shipping records since many of the
former were partly or incorrectly completed. For vessels arriving before BWRFs were collected, or
which submitted incomplete or no forms, gap-filling details were obtained from the port's shipping
records. However these records show only the Last Port of Call, which may not be the BW source. To
identify which last ports of call were probable BW sources, cross-checks were made of source ports
and last ports of call reported in other BWRFs by the same or similar types of vessel. The Lloyds
Fairplay Port Guide and Lloyds Ship Register5 were also used to confirm source port trade and the
vessel's IMO identification number, vessel type and DWT of arriving ships respectively.
Many gaps in the BWRFs and port shipping records could therefore be filled by checking, for any
arrival, the vessel name, type and DWT, its previous visit history, last port/s of call and apparent
charter/liner trade, and by using a customised Excel spreadsheet supplied by the consultants to
estimate the amount BW discharged or taken up6 (Figure 5). This was less easy for the vessels
arriving at the multi-purpose berths, and many incomplete BWRFs could not be filled to the level
allowing a database record.
Nearly all BWRFs had to be carefully checked for completeness and accuracy. In the case of unusual
(or missing) BW values, these were checked using the same Excel spreadsheet to determine likely
volumes based on vessel type, DWT, last port/source port and loading record. This BWRF checking
and gap-filling exercise was undertaken by Group A and B team members during the second in-
country visit, with the database of almost 920 vessel visits constructed by:
· entering visit details from the spreadsheet of port shipping records for the pre-BWRF period
(1998-2000) on the Excel spreadsheet, and using the Fairplay Port Guide and Lloyds Ship
Register to add or correct port details, vessel names, IMO ship numbers, types, DWTs,
voyage durations; and
· cross-checking incomplete or unusual BWRFs with port shipping records, using the Lloyds
Ship Register, Fairplay Port Guide and the Excel spreadsheet to correct errors or add missing
data.
5 A CD-ROM version of the 2001 Lloyds Ship Register was supplied to each Demonstration Site by PCU. These are much
faster to use than the large `directory style' hard-copy volumes.
6 The BW spreadsheet contains coefficients of ballast water taken up or discharged when loading or discharging
cargo (as percentages of DWT for each vessel type), based on ballast water capacity and discharge data from
other studies, BWRFs and Lloyds Ship Register.
11
Ballast Water Risk Assessment, Port of Sepetiba, Federal Republic of Brazil, December 2003: Final Report
Figure 5. Working page of the Excel spreadsheet used to estimate BW discharges
3.5 Identification of destination ports
Since `prevention is better than cure', it is usually most effective to address environmental problems
as close to their source as possible. In the case of ballast-mediated aquatic bio-invasions, actions
helping prevent ships taking up harmful organisms from ballasting areas may be more effective than
trying to treat the organisms once they are inside the tanks, or trying to manage the problem at the
discharge port. To date, however, the majority of actions addressing ballast-mediated introductions
have been driven and undertaken by ports and port States that receive BW, with little activity
occurring at the locations of BW uptake. The GloBallast programme has therefore been attempting to
shift some of the focus from shipboard/point-of-discharge measures towards reducing the uptake of
organisms in the first place.
Knowing the destinations where departing vessels will discharge BW is an important step in helping
port States to reduce the spread of unwanted and potentially harmful species (either introduced or
native to their own ports) to their trading partners. It is also critical for preventing unwanted species
translocations between a State's domestic ports and/or its neighbouring foreign ports. Determining the
destinations of BW exported from the Demonstration Site was therefore an objective of the GloBallast
BWRA (Section 2).
The BWRFs for Sepetiba list the Next Port of Call of all arriving vessels, and these were added to the
database for analysis. However the next port of call may not be where BW carried by a departing ship
is discharged, either fully or partly. For example, the next port may be a bunkering, crew-change or
maintenance port, a port where a `top-up' or other minor cargo is loaded, or a convenient regional
`hub' port where ships anchor and wait for new sailing instructions.
To overcome this problem, a supplementary question needs to be added to the present IMO BWRF,
i.e. requesting the name of the port where discharge from each ballast tank is predicted. These ports
can be predicted by ships engaged on a regular liner service (e.g. many container ships, vehicle
carriers, Ro-Ro ships and LNG carriers, as well as some crude oil tankers, products tankers and large
bulk carriers). However for other ship types (and occasionally the former) ship officers cannot reliably
anticipate where BW discharges will be necessary. For example, for general cargo ships, bulk carriers
and tankers engaged in spot charter work (or when completing a charter period), these vessels may
often depart in ballast having received a general sailing order to proceed towards a strategic location
until further instructions.
In the case of the Port of Sepetiba, there is considerable importation of bulk coal and alumina
requiring the visiting bulk carriers to uplift ballast water whilst unloading to maintain trim, stability
and air draft (i.e. space between the hatch coamings and gantries). The next ports of call were
12
3 Methods
therefore added to the vessel visit data and examined, so that the Pilot Country team could gain
experience and appreciate the problem of identifying ballast water destinations.
Adding the next port of call also improves the trading history for each vessel, and these can be useful
when trouble-shooting missing or incorrect BWRF data. As with the source ports, any new next port
of call added to the database was provided with its country name, UN Port Code, world bioregion and
location coordinates to enable its frequency of use by departing vessels to be displayed on the GIS
world map (port input details are in the GloBallast BWRA User Guide).
3.6 BWRF
database
The Access database developed by the consultants manages all items on the IMO standard BWRF.
Entry, editing and management of the BWRF records are undertaken using a series of GUIs, as
described in Section 2 of the BWRA User Guide. The three `tab' pages of the GUI used for general
BWRF data and the individual ballast tank inputs are shown in Figure 6.
Items not listed on the BWRF but required by the database to run the risk analysis and display the
results on the GIS include the geographic coordinates, bioregion and UN code (a unique five letter
identifier) of every source and destination port, plus the DWT and berthing location of every arrival at
the Demonstration Site.
Many berthing locations had to be identified from the port shipping records because the BWRA
objectives include identifying the locations within a Demonstration Site where deballasting/ballasting
occurs (Section 2). Another item requiring frequent look-up was the vessel's deadweight tonnage
(DWT) since the BWRF requests only the gross tonnage (GT). As noted in Section 3.4, adding the
DWT (present in the Lloyds Ship Register) enables convenient checks of reported volumes and gap-
filling of missing values (see below).
Not all of the BWRF question fields need to be completed by a ship's officer to provide a visit record
that can be saved to the database and later included in the risk analysis. A basic visit record can be
established if three key items are entered. These are outlined in red on the input GUIs (Figure 6) and
are:
· Vessel identification - a unique 7 digit IMO number that remains the same for the life of the
ship, irrespective of any name changes;
· Arrival date; and
· A ballast tank code (which appears on the `Add Tank' sheet and provides an `All Tanks'
option for BWRFs that were submitted without individual tank details).
Without these items the database cannot save a visit / tank record or any other associated information.
Whether or not a saved record is included by the database for the risk analysis depends on which other
BWRF fields were completed or gap-filled. Key items are the source port and volume for each (or all)
ballast tanks discharged, and the berthing location. As described in Sections 3.4 and 3.5, important
BWRF information that is missing or incorrect can usually be substituted or corrected by cross-
checking with port shipping records, the Lloyds Ship Register and a comprehensive port directory
such as the Fairplay guide. However this is time-consuming, and it is far more efficient and reliable
for port officers to ensure the BWRF has been filled in correctly and completely at the time of
submission (Section 4.10).
The database contains reference tables to hold the checked details of every vessel and port previously
added. A new visit record is therefore made by entering the arrival date then using a series of drop-
down lists to select the vessel, source port, last port, next port, destination port and tank details
(Figure 6). This avoids the need to re-enter the same information over and over again, as well as the
risk of generating false, `replicate' vessel, port or tank names due to spelling mistakes on the BWRF.
13
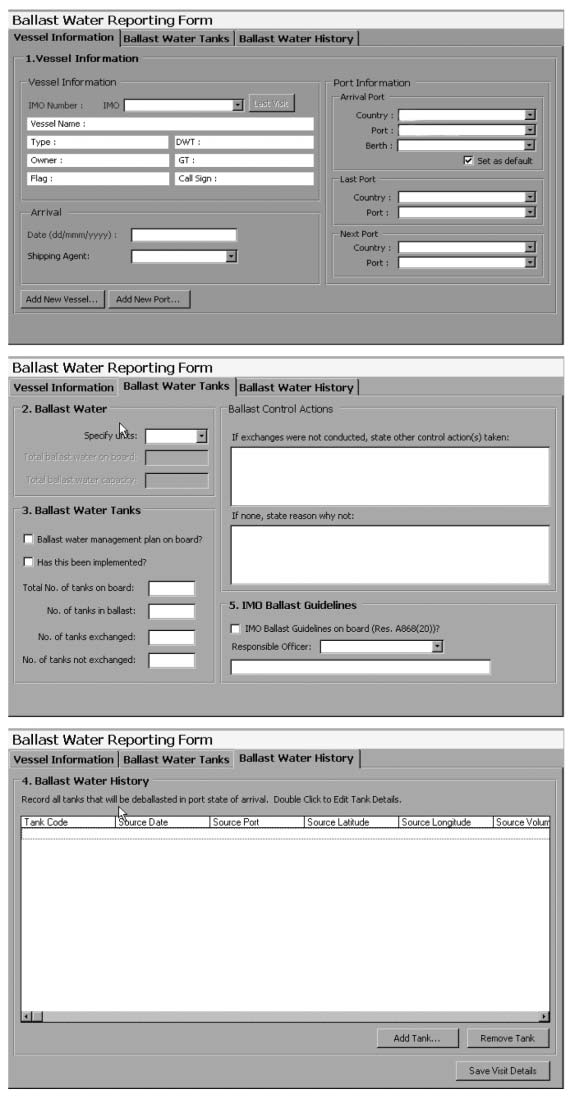
Ballast Water Risk Assessment, Port of Sepetiba, Federal Republic of Brazil, December 2003: Final Report
Spelling mistakes on BWRFs were very common. All data-entry and database managers therefore
need to understand how to avoid transcribing such errors by carefully checking all names and ID
numbers using the database drop-down lists and, where necessary, by referring to a reliable ship
registry or port directory when entering the details of a new vessel or port respectively.
The most easily-trained and efficient database operators are those with previous port and maritime
experience since they (a) bring knowledge of the local shipping trade, (b) are familiar with the
problems of searching for vessel names (e.g. Tokyo Maru 2, Tokyo Maru II , Tokyo Maru No. 11 etc),
and (c) are aware that the official name of many ports in Europe, Africa and South America may be
quite different from the English name (e.g. Vlissingen versus Flushing).
Figure 6. The three tabs of the GUI used for entering the BWRF data
14
3 Methods
3.7
Environmental parameters
During the briefing meetings in January 2002, the consultants provided a preliminary list of
environmental parameters that would be used to generate the environmental matching coefficients
between the Demonstration Sites and their main BW source ports and destination ports (Appendix 3).
The provisional list was based on review of previous port-to-port environmental analyses undertaken
for twelve trading ports in northeast Australia (Hilliard et al. 1997b). The final list of 34 parameters
used for the six Pilot Countries (Table 1) was selected in February 2002, during a joint review of the
provisional list by the consultants and scientists of the Institute of Biology of the Southern Seas
(IBSS) in Odessa7.
Table 1. Port environmental parameters used by the Environmental Similarity Analysis
Name
Variable Type
1.
Port type8
Categorical (1-6)
2.
Mean water temperature during warmest season (oC)
Scalable
3.
Maximum water temperature at warmest time of year (oC)
"
4.
Mean water temperature during coolest season (oC)
"
5.
Minimum water temperature at coolest time of year (oC)
"
6.
Mean day-time air temperature recorded in warmest season (oC)
"
7.
Maximum day-time air temperature recorded in warmest season (oC)
"
8.
Mean night-time air temperature recorded in coolest season(oC)
"
9.
Minimum night-time air temperature recorded in coolest season (oC)
"
10.
Mean water salinity during wettest period of the year (ppt)
"
11.
Lowest water salinity at wettest time of the year (ppt)
"
12.
Mean water salinity during driest period of year (ppt).
"
13.
Maximum water salinity at driest time of year (ppt).
"
14.
Mean spring tidal range (metres)
"
15.
Mean neap tidal Range (metres)
"
16.
Total rainfall during driest 6 months (millimetres)
"
17.
Total rainfall during wettest 6 months (millimetres)
"
18.
Fewest months accounting for 75% of total annual rainfall
Integer
19.
Distance to nearest river mouth (kilometres; negative value if upstream)
Scalable
20.
Catchment size of nearest river with significant flow (square kilometres)
"
Logarithmic distance categories (0-5): From the closest BW discharge location to nearest:
21.
Smooth artificial wall
Categorical
22.
Rocky artificial wall
"
23.
Wooden pilings
"
24.
High tide salt marsh/lagoon, saline flats or sabkah
"
25.
Sand beach
"
26.
Shingle, stony or cobble beach
"
27.
Low tide mud flat
"
28.
Mangrove fringe/mangrove forest
"
29.
Natural rocky shore or cliff
"
30.
Subtidal firm sandy sediments
"
31.
Subtidal soft muddy sediments
"
32.
Seagrass meadow9
"
33.
Rocky reef or pavement
"
34.
Coral reef (with carbonate framework)
"
The 34 parameters were steadily collated during course of BWRA activities for all Demonstration
Sites. They were taken or derived from data and information culled from a wide range of government,
7 Distance categories from the berthing area/s to the nearest rocky artificial wall, smooth artificial wall and
wooden artificial substrate were suggested by IBSS as they provide different types of hard port habitat.
8 Offshore terminal or mooring / Natural bay / Breakwater harbour / Tidal creek / Estuary / River port.
9 Kelp forest/macroalgae bank was not included but should be considered for future analysis.
15
Ballast Water Risk Assessment, Port of Sepetiba, Federal Republic of Brazil, December 2003: Final Report
port and scientific publications, internet web sites, port survey reports and sampling records, SST and
salinity charts, climate databases, atlases, national tide-tables, nautical charts, coastal sensitivity and
oil spill habitat maps, oil spill contingency plans, aerial photographs, national habitat databases and
local expert advice (Appendix 4). The most difficult to find were reliable water temperature and
salinity data, particularly for identifying the averages, maxima and minima for ports in or near
estuaries (Section 3.12).
A preliminary list of frequently recorded BW source ports and destination ports for the Port of
Sepetiba was made at the end of the first in-country visit in April 2002 (the complete list did not
become available until near the end of the second in-country visit; Section 3.1). It was agreed that the
environmental parameters for these ports should be sought between the first and second consultants'
visits, with the Brazilian Group C members focussing on important ports in Brazil, and the consultants
focussing on more distant ports in Asia, Europe, etc. To facilitate this task the consultants provided a
customised Excel spreadsheet for collating the environmental data, which included guidance and
reminder notes plus a format enabling direct export to PRIMER (Section 3.8).
Near the end of the second in-country visit, sufficient port environmental data had been collated to
generate environmental matching coefficients for approximately 40% of all ports identified as trading
with the Port of Sepetiba, with estimates provided for ports where unobtained/incomplete data
prevented their inclusion in the multivariate similarity analysis (Section 4.6). The percentage of ports
with calculated environmental coefficients was subsequently expanded by a gap-filling exercise
undertaken by the consultants between 22 December 2002 and 31 January 2003. These were added to
the updated BWRA provided at the third meeting in March 2003 (Section 3.1) and reported here.
3.8 Environmental similarity analysis
The more a BW receival port is environmentally similar to a BW source port, the greater the chance
that organisms discharged with the imported BW can tolerate their new environment and maintain
sufficient numbers to grow, reproduce and develop a viable population. Comparing port-to-port
environmental similarities therefore provides a relative measure of the risk of organism survival,
establishment and potential spread. This is the basis of the `environmental matching' method, and it
facilitates estimating the risk of BW introductions when the range and types of potentially harmful
species that could be introduced from a particular source port or its bioregion are poorly known.
A limitation of the environmental matching approach is that several harmful species appear capable of
tolerating relatively wide temperature and salinity regimes10. As discussed, other risk factors include
the frequency of ship visits/BW discharges, the volume of BW discharged, voyage times and ballast
tank size and any management measures applied during the voyage. While environmental matching
alone does not provide a complete measure of risk, an analysis of `real world' invasions indicates that
if any one factor is to be used alone, environmental matching is probably the best single indicator of
risk.
Classic examples include the two-way transfer and relatively rapid spread of harmful and other
unwanted species between the Ponto-Caspian and North American watersheds (some via stepping
stones in western Europe, and northern Australian ports that have extremely high risk factors in terms
of frequency and volumes of BW discharges (the very large bulk export ports of Port Headland,
Dampier and Hay Point and smaller bulk export ports like Weipa and Abbot Point), but which have
not experienced any significant harmful invasions (due to a low environmental matching with their
source ports). Conversely, in southern Australia and in particular Tasmania, ports which have
relatively low risk factors in terms of frequency and volumes of BW discharges, have been the entry
points of the most harmful aquatic bio-invasions (due to a high environmental matching with their
source ports).
10
For example, the Asian date mussel (Musculista senhousia) has been reported from Vladivostok to
Singapore.
16
3 Methods
The environmental distances between the Port of Sepetiba and its source and destination ports were
determined using a multivariate method in the PRIMER package. Of the various distance measures
available in PRIMER, the normalised Euclidean distance is the most appropriate. Normalisation of the
various input parameters removes the problem of scale differences, and the method can manage a mix
of scalable, integer and even categorical values, provided the latter reflect a logical sequence of
intensity or distance/location steps. Individual variables cannot be weighted but the predominance of
temperature variables (8) and salinity/salinity-related parameters (also 8; see Table 1) ensured they
exert a strong influence on the results. Air temperature extrema, rainfall and tidal parameters were
included owing to their influence on the survivorship of intertidal and shallow subtidal organisms11.
The similarity values produced by PRIMER were examined using its clustering and ordination
modules, then exported back to the Excel file for conversion into environmental matching coefficients
before insertion into the database12.
To provide consistent and comparable results, the similarity analysis was conducted on a wide
geographical range of ports; i.e. from cold water ports in high latitude areas to warm water ports in
tropical regions, as well as from up-river terminals to those located in relatively exposed offshore
waters. This avoids the possibility of generating spurious patterns among a set of ports located in
neighbouring and/or relatively similar regions. Collating the environmental parameters for the
frequent source and destination ports of all six Demonstration Sites into a single Excel spreadsheet
achieved this, as well as permitting direct comparisons between the results from these sites13.
The Excel file used for collating the port environmental data also contains linked spreadsheets used
for their export to PRIMER, as well as for re-importing the results and converting them into
environmental matching coefficients. In fact the database can import any type of environment
matching value obtained by any method, provided the values are placed in an Excel spreadsheet in the
format expected by the database's import feature. Details on the treatment of the environmental
variables and the production, checking, conversion and import of the similarity measures are given in
the BWRA User Guide.
3.9 Risk
species
One of the BWRA objectives was to identify `high-risk' species that may be transferred to and/or
from the Demonstration Sites (Section 2). The Access database was therefore provided with tables for
storing the names, distribution and other information on risk species. For the purposes of the BWRA
and its `first-pass' risk assessment, a risk species was considered to be any introduced, cryptogenic or
native species that might pose a threat if transferred from a source port to a Demonstration Site. The
taxonomic details, bioregion distribution, native/introduced status and level of threat assigned to a
species are also stored in the database and can be displayed for review, edit and update.
The database manages the bioregional locations and status of each entered species using the same
bioregions displayed on the GIS world map (Figures 7, 8). This map is used as a backdrop for
displaying the source and destination ports and associated BWRA results, and was compiled from a
bioregion map provided by the Australian Centre for Research on Introduced Marine Pests (CRIMP).
The boundaries of some bioregions were subsequently modified according to advice provided by
Group C marine scientists in five of the six the Pilot Countries, including Brazil. The modifications
11 While ecosystem disturbance, pollution, eutrophication and other impacts on habitats and water quality can
increase the `invasibility' of port environments (particularly for r-selected species), these were not included
owing to the problem of obtaining reliable measures of their spatial extent and temporal nature at each port.
12 As described in the BWRA User Guide, a simple proportional conversion of the similarity values was made
so that each matching coefficient lay between 1 (a perfect environmental match) and 0.01 (least matching),
since it is unsafe to assume a port environment can be totally hostile no matter how distant.
13 The total number of ports with a complete set of environmental parameters obtained by the end of the data
collation phase was 357. These were provided to all Demonstration Sites during the third consultant's visit
in February-March 2003 and used for this report.
17
Ballast Water Risk Assessment, Port of Sepetiba, Federal Republic of Brazil, December 2003: Final Report
included adding new bioregions for several large river systems to accommodate some important river
ports that trade with one or more of the Demonstration Sites. In the case of Brazilian coast, bioregion
SA-II which extended southward from Cabo de Săo Tomé (21° 54' S, 40° 59' W) to the large La Plata
river mouth was divided into SA-IIA and SA-IIB at Cabo Santa Marta Grande (28o 36'S, 48o 49'W)
(Figure 7). The SA-IIA / SA-IIB boundary was set at this Cape to accommodate the southern limit of
mangrove occurrence in South America, plus the marked changes in the coastal circulation pattern
and phytoplankton community composition (particularly among the types of harmful toxic species),
all of which occur close to Cape Santa Marta Grande.
The map presently displays 204 discrete bioregions which are coded in similar fashion as those in the
IUCN scheme of marine bioregions from which they were derived (Kelleher et al. 1995; see
Appendix 3 of the GloBallast BWRA User Guide for details). Bioregions serve multiple purposes and
are required for several reasons. Many marine regions of the world remain poorly surveyed and have a
limited marine taxonomy literature. This causes a patchy and essentially artificial distribution of
recorded marine species distributions. Few marine species surveys have been undertaken in port
environments and there are very few bioregions which contain more than one port that has undertaken
a PBBS.
Bioregions represent environmentally similar geographic areas. Thus if a species is found established
in one part of a bioregion, there is a good chance it can spread via natural or human-mediated
processes to other sites in the same bioregion. A conservative approach was therefore adopted for the
GloBallast BWRA, whereby a risk species, if recorded in at least one location of a bioregion, is
assumed potentially present at all source ports within the same bioregion. This type of approach will
remain necessary until a lot more PBBSs are conducted and published. Because taxonomic analyses
of the PBBS samples of the Demonstration Sites had not been completed by the consultants second
visits, the reverse stance was adopted for these ports (i.e. it was assumed they did not contain any risk
species recorded at other location/s in their bioregion).
The corresponding set of bioregions stored in the database has particular sets of risk species assigned
to them. The species and associated data added to the database over the course of the Activity were
collated from a wide range of sources. These included preliminary lists of organisms found by the
recent GloBallast PBBS of Sepetiba (which became available during the second consultants visit).
Brazilian and URS members of Group C also investigated the possible existence of introduced species
lists held by marine biologists in agencies and universities in the South American region, and one was
found for the temperate and cool-temperate coastal bioregions of Uruguay-Argentina-Patagonia
(Orensanz et al. 2002).
18
3 Methods
Figure 7. Part of the GIS world map of marine bioregions, showing the code names of those in the
South American region
19
Ballast Water Risk Assessment, Port of Sepetiba, Federal Republic of Brazil, December 2003: Final Report
Figure 8. Complete GIS world map showing the marine bioregions
[to improve clarity, not all bioregion codes are shown in this example]
20
3 Methods
Sources used for developing the risk species database are listed in Appendix 5 and included a range of
literature plus international and regional internet databases, including those being developed by the
Smithsonian Environmental Research Center's (SERC) National Estuarine & Marine Invasive Species
Information System (NEMISIS), CSIRO's National Introduced Marine Pests Information System
(NIMPIS), the Global Invasive Species Programme's (GISP) Global Invasive Species Database, and
the Baltic, Nordic and Gulf of Mexico web sites. The database used for the `first-pass' risk
assessments and provided to the Demonstration Sites during the consultants last visit (March 2003)
contains 421 species but these do not represent a complete or definitive global list. Thus the database
tables and their associated Excel reference file represent a working source and convenient utility of
risk species information that can be readily updated and improved.
To provide a measure of the risk species threat posed by each source port, the database analyses the
status of each species assigned to each bioregion and generates a set of coefficients that are added to
the project-standard calculation of relative overall risk (Section 3.10). The following description is
summarised from Section 6 of the GloBallast BWRA User Guide, which describes how the species
data are managed and used by the BWRA system.
The database allows each species to be assigned to one of three levels of threat, with each level
weighted in log rhythmic fashion as follows:
· Lowest threat level: This is assigned to species with no special status other than their
reported or strongly suspected introduction by BW and/or hull fouling14 in at least one
bioregion (i.e. population/s with demonstrated genetic ability to survive transfer and establish
in regions beyond their native range). A fixed weighting (1) is applied to each of these species
when present in bioregions outside their native range. This was also the default level assigned
to any new species when first added to the database.
· Intermediate threat level: This level is assigned to any species suspected to be a harmful
species or invasive pest. Risk species assigned to this level receive a default weighting value
of 3 in both their native and introduced bioregions.
· Highest threat level: This level is assigned to known harmful invasive species, as reported in
institutional or government lists of aquatic nuisance species and pests, and/or in peer-
reviewed scientific journals. The default weighting value applied to these species is 10.
The database allows users to change the threat status level assigned to each species, as well as the size
of the second and third level default weighting values. Another risk species weighting option was also
provided in the database, which could be used to proportionally increase the weight of all source port
threat coefficients by increasing its default value of 1. The default values of the four weightings (1, 3,
10 and 1) provided the `project standard' result to permit unbiased comparisons between the `first-
pass' BWRA results for each Demonstration Site.
The database calculated the coefficient of `risk species threat' posed by each source port, with each
port value representing a proportion of the total risk species threat. The latter was the sum of all
weighted risk species assigned to the bioregion of all source ports that export BW to the
Demonstration Site. Species assigned to more than one bioregion are summed only once, and the
algorhythm automatically discounted any species that was native in the Demonstration Site's
bioregion. It included any introduced species assigned to the bioregion of the Demonstration Site
14 At the outset of the project, species capable of transfer only by ballast water were planned to be added to
the database. However many species may be introduced by hull fouling as well as BW, with the principal
vector for many of these remaining unclear. Group C scientists in all Pilot Countries were unanimous in
their preference for including all species introduced by BW and/or hull fouling or possibly aquaculture in
the project standard BWRA database. For future BWRAs a `vector status' value could be assigned to each
species in the database, so that risk assessments could be focussed on specific shipping-mediated vectors.
21
Ballast Water Risk Assessment, Port of Sepetiba, Federal Republic of Brazil, December 2003: Final Report
since, as discussed above, the Demonstration Site was assumed to be free of risk species. This was the
default position of the project-standard BWRA15.
The risk species coefficient for each source port is therefore calculated by firstly summing the number
of non-indigenous species (NIS) in that port's bioregion which have no suspected or known harmful
status. This provides a measure of the low level `weedy' and sometimes cosmopolitan species which,
although having no acknowledged harmful status, have proven transfer credentials that could enable
their establishment in another port with probably low but nevertheless unpredictable biological or
economic consequences. This number is then added to the sums of suspected and known harmful
species in the same bioregion (these include any native species identified as such by Group C local
scientists). The default calculation for the risk species coefficient for each source port (C) is thus:
CSource Port = (NIS + [Suspected Harmfuls x 3] + [Known Harmfuls x 10] ) / Total SumAll Source Ports
The C values lie between 0-1 and represent an objective measure of the relative total species threat,
since the only subjective components within the project standard BWRA database were the
`universal' assignments of species to particular levels of threat, plus the weightings attached to these
levels. Note that the C values for source ports inside the same bioregion will be the same, and that the
Total Sum divisor does not represent all species in the database, but only those assigned to bioregions
containing source port/s that actually trade with the Demonstration Site. It should also be noted there
are several limitations from incorporating a risk species coefficient into the default calculation of the
`first-pass' BWRAs. These included:
· Use of an incomplete list of species that were assigned to one of the three levels of threat
(introductions, suspected harmful species, known invaders).
· Significant knowledge gaps on the global distribution of many native, cryptogenic and
introduced species (as a consequence of the limited number of species surveys that remain
geographically biased to parts of North America, Europe and Australian/New Zealand).
· Gaps and constraints in the taxonomy and reliable identifications for many aquatic species
groups.
Such limitations must be taken into account when considering the weighting of the risk species
coefficient relative to the other risk factors such as environmental matching.
3.10 Risk assessment
Approach
The database employed the BW discharge, port environmental matching and bioregion species
distribution/threat data to calculate, as objectively as possible, the relative risk of a harmful species
introduction to a Demonstration Site, as posed by discharges of BW and associated organisms that
had been ballasted at each of its identified source ports. A GUI enabling convenient alteration of the
risk calculations and weighting values (Figure 9), plus use of ArcView to geographically the display
results, improves the system's value as an exploratory utility and demonstration tool.
The semi-quantitative method aims to identify the riskiest tank discharges with respect to a
Demonstration Site's present pattern of trade. Unlike a fully quantitative approach, it does not attempt
to predict the specific risk posed by each intended tank discharge of individual vessels, nor the level
of confidence attached to such predictions. However, by helping a Demonstration Site to determine its
riskiest trading routes, exploring the semi-quantitative BWRA provides a coherent method for
15 When the taxonomic identifications of the recent port biological baseline surveys are completed, risk
species confirmed as already present at a Demonstration Site may be identified for the BWRA database
maintained for that site. Their deletion would reduce the size of the risk species coefficients obtained by the
`first-pass' BWRA such as reported here for Sepetiba, but the revised database should not be copied for
other port BWRAs.
22
3 Methods
identifying which BW sources deserve more vessel monitoring and management efforts than others,
plus the significance of local, regional and distant trading routes and associated vessel types.
Figure 9. Database GUI used for manipulating the BWRA calculation and weightings
Risk coefficients and risk reduction factors
For each source port, the database used four coefficients of risk (C1-C4) and two risk reduction
factors (R1, R2) to produce a relative overall measure of the risk of a harmful species introduction at
the Demonstration Site. The database GUI shown in Figure 9 can be used to remove one or more of
these components, or alter the way they are treated, from the default `project-standard' formula which
was used for the first-pass BWRA. The four risk coefficients calculated for each source port were:
C1 proportion of the total number of ballast tank discharges made at the Demonstration Site,
C2 proportion of the total volume of BW discharged at the Demonstration Site,
C3 port-to-port environmental similarity, as expressed by the matching coefficient,
C4 source port's contribution to the total risk species threat to the Demonstration Site, as posed
by the contemporary pattern of trade (1999-2002).
In biological terms, C1 and C2 represent the frequency and size of organism `inoculations'
respectively. C3 provides a measure of the likely survivability of these inoculated organisms, and C4
the relative threat posed by the organisms within each inoculation. Each coefficient has values
between 0-1 except C3, where the lowest value was set to 0.01 (it is unsafe to assume a port
environment can be sufficiently hostile to prevent survival/establishment of every transferred
introduced species; Section 3.8).
23
Ballast Water Risk Assessment, Port of Sepetiba, Federal Republic of Brazil, December 2003: Final Report
The two risk reduction factors calculated by the database were R1 (effect of ballast tank size on C2)
and R2 (effect of tank storage time on C4). R1 represents the effect of tank size on the number and
viability of organisms that survive the voyage, since water quality typically deteriorates more rapidly
in small tanks than large tanks (owing to the volume/tank wall ratio and other effects such as more
rapid temperature change, with mortality rates generally higher in small tanks). As described below,
no risk reduction was applied to any source port dispatching vessels with tank volumes greater than
1000 tonnes.
R2 represents the effect of tank storage time on the range and viability of discharged organisms.
Survival of most phytoplankton and aerobic biota inside any tank decreases with time, with relatively
high survival rates reported for voyages less than 5 days (as shown below, this was adopted as the cut-
off point for any risk reduction due to in-tank mortality). If the focus is only on long-lived anaerobes,
dinoflagellate cysts or pathogens (all of which have long tank survival rates), then R2 can be deleted
from the BWRA calculation, using the GUI shown in Figure 9 (details are in the GloBallast BWRA
User Guide).
The database calculates the tank storage time by subtracting the reported tank discharge date from the
ballast uptake date. For incomplete BWRFs with missing discharge or uptake dates, the vessel arrival
date plus a standard voyage duration at 14 knots16 were used to estimate the BW uptake date for
adding to the database. The database automatically provides values for R1 and R2 using a log
rhythmic approach17, with the project-standard BWRAs applying the following default (but
adjustable) R1 and R2 risk-reduction weightings to C2 and C4 respectively:
R1
Maximum tank volume discharged (tonnes) in
<100
100-500
500-1000
>1000
the database record for each source port
W4
Default risk-reduction weighting applied to C2
0.4
0.6
0.8
1
R2
Minimum tank storage time (days) in the
<5
5-10
10-20
20-50
>50
database record for each source port
W5
Default risk-reduction weighting applied to C4
1
0.8
0.6
0.4
0.2
Although all information reported in the ballast tank exchange section of the BWRFs was entered into
the database, the `first-pass' BWRA did not use these data to apply a risk reduction factor for each
source port route for the following reasons:
· implementation of the BWRFs at the Demonstration Sites has been relatively recent, and the
tank exchange did not provide a sufficiently consistent or reliable sample of ballast
importation for most sites (Section 3.4);
· BWRF implementation was on a voluntary basis before 2001, with no formal mechanism
compelling all vessels to submit fully completed forms at Sepetiba;
· insufficient vessel inspection/ tank monitoring data were available for checking claimed
exchanges and their locations (often unrecorded);
· discounting whether or not effective exchange/s were taking place (a) removed the need to
predict the size of the risk reduction, and (b) was precautionary with respect to the ability of
exchanges to remove all organisms taken up at the time of ballasting.
16 The voyage duration between ports for particular vessel speeds are tabled in many maritime guides and
atlases, such as the Lloyds Maritime Atlas of World Ports and Shipping Places and the 2001 Fairplay Port
Directory.
17 As with the risk species threat level weightings, a log rhythmic approach is appropriate for risk reduction
factors in biological risk assessments.
24
3 Methods
BWRA calculation
As shown in Figure 9 and described in the GloBallast BWRA User Guide, the database GUI allows the
six components of the BWRA calculation and the five weighting factors to be altered from the default,
`project-standard' setting. The GUI can therefore be used to explore how particular risk components
and their treatment influence the final result, and also improves the demonstration value of the system.
One example is the way the environmental matching coefficient (C3) is treated by the BWRA
calculation. For scientists who consider that C3 should be treated as an independent coefficient of risk
(see below), then the formula for calculating the relative overall risk (ROR) posed by a source port is:
(1)
ROR = ( C1 + [C2 x R1W4] + C3 + [C4 x R2W5] ) / 4
Equation (1) is the default setting used for the project-standard BWRA for each Demonstration Site.
In this case, ROR is the combined measure of the proportional `inoculation' frequency (C1) and size
(C2), the relative similarity of the source port/Demonstration Site environmental conditions (C3), and
the relative level threat posed by the status of species assigned to the source port's bioregion (C4).
The division by 4 keeps the result in the 0-1 range to allow the convenient expression of the ROR as a
ratio or percentage of the total risk posed by all the source ports.
For those who consider the proportional risk species threat (C4) should provide the focal point of the
risk calculation, they may prefer to treat C3 as a risk reduction factor for influencing the size of C4,
rather than using it as an independent `surrogate' coefficient to help cover unidentified or unknown
species. The GUI allows the formula to be changed to reflect this approach, in which case C3 would
be applied as follows:
(2)
ROR = ( C1 + [C2 x R1W4] + [C3 x C4 x R2W5] ) / 3
[divisor is now 3 because of the reduced number of summed coefficients].
For a source port in a bioregion with a large number of risk species (eg. a relatively high C4 of 0.2)
but with an environment very dissimilar to the Demonstration Site (e.g. C3 = 0.2), then Equation (2)
would reduce C4 to 0.04 (i.e. an 80% reduction). If the minimum tank storage time was relatively
long (e.g. R2 was between 10-20 days for the quickest voyages, so W5 = 0.6), then C4 would be
further reduced to 0.024 (i.e. an 88% reduction to its initial value).
Equation (2) is logical provided the database contains an accurate distribution of appropriately
weighted risk species in the various source port bioregions (including native species considered
potentially harmful if they established in other areas). However Equation (2) is less conservative than
Equation (1), particularly if there are doubts that C4 provides a true picture of potential risk species
threat. As shown in Table 2, Equation (1) produces higher ROR values, unless a single source port
accounts for over 50% of the frequency (C1) and volume (C2) of the total discharges at a
Demonstration Site (this is highly unlikely). The database also allows users to increase the influence
of C4 on the ROR by increasing the default value of the overall W3 weighting factor from 1 (but see
the caution in Section 3.10). Increasing the size of C4 has more affect in Equation (1) because C3 has
no direct influence on the size of C4.
25
Ballast Water Risk Assessment, Port of Sepetiba, Federal Republic of Brazil, December 2003: Final Report
Table 2. Examples showing how Equation (1) provides more conservative outcomes than (2) for typical
situations*
Relative Proportion of Proportion of Enviro-
Relative
Overall
discharge
discharge
mental
Risk species
(*when C1 and C2 are less than 50%)
Risk
Frequency
Volume
matching
threat
ROR
C1
C2
C3
C4
ROR
= [C1 + C2 + C3 + C4] / 4 Equation (1)
0.150
0.1
0.1
0.2
0.2
ROR
= [C1 + C2 + (C3 x C4) ] / 3 Equation (2)
0.080
0.1
0.1
0.2
0.2
ROR
= [C1 + C2 + C3 + C4] / 4 Equation (1)
0.200
0.2
0.2
0.2
0.2
ROR
= [C1 + C2 + (C3 x C4) ] / 3 Equation (2)
0.147
0.2
0.2
0.2
0.2
ROR
= [C1 + C2 + C3 + C4] / 4 Equation (1)
0.350
0.5
0.5
0.2
0.2
ROR
= [C1 + C2 + (C3 x C4) ] / 3 Equation (2)
0.347
0.5
0.5
0.2
0.2
ROR
= [C1 + C2 + C3 + C4] / 4 Equation (1)
0.400
0.6
0.6
0.2
0.2
ROR
= [C1 + C2 + (C3 x C4) ] / 3 Equation (2)
0.413
0.6
0.6
0.2
0.2
ROR
= [C1 + C2 + C3 + C4] / 4 Equation (1)
0.450
0.7
0.7
0.2
0.2
ROR
= [C1 + C2 + (C3 x C4) ] / 3 Equation (2)
0.480
0.7
0.7
0.2
0.2
ROR
= [C1 + C2 + C3 + C4] / 4 Equation (1)
0.550
0.9
0.9
0.2
0.2
ROR
= [C1 + C2 + (C3 x C4) ] / 3 Equation (2)
0.613
0.9
0.9
0.2
0.2
Managing and displaying the results
When the database is requested to calculate the BWRA, it generates a large output table that lists all
sources of tank discharges recorded at the Demonstration Site, as entered from the BWRFs and/or
derived from the port's shipping records. The table shows the ROR values plus their component
coefficients and reduction factors. Because the Demonstration Sites have a large number of source
ports (80-160), trends are difficult to see within long columns of tabled values.
The ROR results are therefore further manipulated by the database to provide additional columns
showing:
· the risk category of each source port, as placed in one of five levels of risk for displaying on
the GIS world map;
· a standardised distribution of the ROR results, i.e. from 1 (highest ROR value) to 0 (lowest
value).
The five risk categories are labelled `highest', `high', `moderate', `low' or `lowest', with their
boundaries set at equal linear intervals along the 0-100% scale of cumulative percentage risk (i.e. at
80%, 60%, 40% and 20% intervals). This is the default setting used for the project-standard BWRAs.
The database GUI (Figure 9) allows users to shift one or more of these boundaries to any point on the
scale. For example, a logbased distribution of the five risk categories may be preferred and is easy to
produce using the GUI.
In the case of the standardisation, the database applies the following simple manipulation to expand
the distribution of ROR values to occupy the 0-1 range, where 1 represents the maximum ROR value
and 0 the minimum value:
RORSTANDARDISED = (ROR RORMINIMUM) x 1/ (RORMAXIMUM RORMINIMUM)
This facilitates comparisons between BWRA results from other sites, as well as from different
treatments of the ROR formula and/or the weightings. As with the ArcView GIS, the database was
designed to optimise the user-friendliness, flexibility and management utility of the system.
Rationale for undertaking `Project Standard' BWRAs
The flexibility provided by the database allows users to investigate and demonstrate various
permutations and avenues without requiring specialised knowledge in database construction and
editing. However it was important to apply a consistent, straightforward approach to the `first-pass'
26
3 Methods
BWRA for each Demonstration Site, so their outcomes could be compared and contrasted to help (a)
evaluate the system and approach, and (b) identify areas where changes could improve future use.
Each Demonstration Site has a particular trade profile and associated pattern of
deballasting/ballasting. Their divergent geographic locations further contributes to their possession of
unique sets of BW source ports which have relatively limited overlap. Thus if results from any two or
more Demonstration Sites are to be compared, all of their shared and non-shared source ports and
bioregions need to be combined for calculating the environmental matching and risk species threat
coefficients.
It was therefore decided that, because the six sites effectively span the globe, the `project-standard'
BWRAs undertaken for each site should use the same global set of source port environment and risk
species data. This ensures the port-to-port similarities and risk species threats were based on the
widest possible range of port conditions and species distributions, thereby reducing the potential for
spurious results resulting from overly narrow regional approaches (Section 3.8).
3.11 Training and capacity building
Members of the consultants team worked with their Brazilian counterparts to provide BWRA
guidance, training, software and associated materials on the following occasions:
Occasion/ Date
Location and
BWA Activity Tasks
Consultants
[working days]
Counterparts*
Activity Kick-Off
Presentation, briefing and logistics meetings to:
NIO Offices in Goa.
January 2002
Identify equipment and counterpart requirements
R Hilliard
CFP/CFPAs from
[1.5 days]
Develop provisional pilot country visit schedule
all Pilot Countries
1st Country Visit
Introductory half-day seminar
FEEMA offices,
April 2002
Install and check computer software
Rio de Janeiro
[5 days]
Commence training and capacity building
Begin GIS mapping of port and resources
D Blumberg
Group A counterparts
Port familiarisation tour
J Polglaze
Group B counterparts
Review BWRFs and Port Shipping Records
R Hilliard
Group C counterparts
Commence BWRF database development & training
Review port environmental data and identify sources
Seminar & tutorials on multivariate similarity analysis
Identify data collation/input tasks before 2nd visit
2nd Country Visit
Update Database GUIs, add-ins & make ODBC links
FEEMA offices,
August-September
Continue training and capacity building
Rio de Janeiro.
2002
[12 days]
Complete GIS mapping of port and resources
Complete BWRF database development and training
C Clarke
Group A counterparts
Complete port environmental data assembly/training
J Polglaze
Group B counterparts
Complete environmental similarity analysis training
R Hilliard
Group C counterparts
Generate environmental matching coefficients
Add risk species data to database, refine bioregions
Complete BWRA training and undertake first analysis
Hold seminar to review and discuss results
Discuss pilot country needs for future BWRA
3rd `Wrap-up' Visit
Provide Database containing all port environmental and
DPC office,
March 2003
risk species data obtained for the six sites
Rio de Janeiro.
[2.5 days]
Provide updated BWRA User Guide and final training on
C. Clarke
Group A leader
BWRA system operation
Group B leader
Review and discuss updated BWRA results
Group C leader
* refer Appendix 2 for project team structure and counterpart details.
27
Ballast Water Risk Assessment, Port of Sepetiba, Federal Republic of Brazil, December 2003: Final Report
At the kick-off meeting in January 2001, CFP/CFPAs were briefed on the nature, objectives and
requirements of the activity. An introductory PowerPoint presentation describing the BWRA system
proposed for achieving the BWRF objectives was made, and logistics meetings with individual Pilot
Countries subsequently held. A project check-list and briefing document were distributed listing the
computer hardware and peripherals required at each Demonstration Site plus the proposed structure of
the joint Pilot Country-consultants project team (see Appendices 2 and 3). Appropriate experience of
Pilot Country counterparts for the three groups forming the team was emphasised during the kick-off
meetings.
During the subsequent in-country visits by the consultants, the main BWRA training and capacity-
building components provided were as follows:
· Supply of software licences and User Guide and installation of ESRI ArcView 3.2 and
PRIMER 5.
· Guidance and `hands-on' training and in GIS mapping of marine resources.
· Supply of 2001 CD-ROM edition of the Lloyds Ship Register, and customised Excel
spreadsheet file for convenient collation of vessel identification and DWT data and reliable
estimation of BW discharges from port shipping records, for the pre-BWRF period and
BWRF checking.
· Guidance, `hands-on' training and assistance with the Access database and BWRF
management;
· Guidance, `hands-on' training and glossaries of terminology on the collation, checking, gap-
filling and computerisation of BWRFs and principles of database management.
· Guidance and assistance on (a) search, collation and computer entry of environmental data for
important BW source and destination ports, and (b) the terminology, networking, data
collation and management requirements for species information used for the risk species
threat coefficient.
· Tutorial, `hands-on' training and assistance on theory, requirements and mechanics of
multivariate similarity analyses of port and coastal environmental data.
· Tutorial, guidance, `hands-on' training, seminars and PowerPoint material on BWRA
approaches, methods and results evaluation.
· Supply of electronic BWRA User Guide with glossaries and technical appendices.
To promote collaboration, understanding and continuity among the three groups, the consultants
arranged for group counterparts to provide presentations and guidance to other group members during
the 2nd visit.
During the first consultant's visit, Mr Daniel Menucci and Mrs Catia Ferreira (initially assigned to
Group B) arranged a demonstration of a prototype electronic BWRF, as developed by ANVISA to
become a user-friendly component of its web-based Free Pratique form system. This also used an
Access application to provide a sophisticated database and BWRF screen images (in Portuguese) to
facilitate the import and management of BWRF data, with particular reference to the management of
water borne pathogens and parasites.
However it was not possible for the consultant and Brazilian counterparts of Group B to conduct a
collaborative evaluation of the ANVISA prototype, which had been designed to allow convenient
internet transmittal of electronic BWRFs from any of ANVISA's 45 port offices to its database centre
in Brasilia.
28
3 Methods
3.12 Identification of information gaps
This was a critical part of the activities undertaken during the first in-country visit by the consultants,
with attention focussed on locating and checking the following BWRA information input
components:
· Completeness of BWRFs submitted by vessels arriving at the Demonstration Site.
· Gaps, legibility and authenticity of information reported in the returned BWRFs.
· Sources and availability of shipping records for BWRF gap-filling.
· Existence of electronic and paper charts, topographic and coastal resource maps, atlases,
aerial photographs and publications for GIS port map.
· Sources, reliability and extent of port environmental data and coastal resource information for
Demonstration Site and its trading ports in the Pilot Country and region.
· Sources and extent of marine species records, information and researchers on introduced
species in and near the Pilot Country.
At the end of the first country visit, the status of the above were reviewed and a list of gap-filling
tasks, as allocated to the Pilot Country groups or consultants and to be undertaken by the second visit,
were agreed upon and minuted. Follow-up gap-filling tasks were also conducted during and after the
second visit.
29
4 Results
4.1 Description of port
General features
The Port of Sepetiba is located in the north-east part of Sepetiba Bay at 22o 56' S 43o 50' W, and is
approximately 80 km west of Rio de Janeiro (Figures 2, 11, 13). The port is located on Madeira
Island, which was formerly separated from the mainland by narrow deltaic estuarine channels and
mangrove areas (see Section 4.2 for coastal habitat details). After entering Sepetiba Bay, ships follow
a well marked shipping channel, the majority of which follows naturally deep (un-dredged) areas
>20 m below chart datum (LAT).
The port was initially developed with a single pier to provide a bulk import terminal for coal and
alumina (in use since 1982). To help alleviate pressure on crowded container and break-bulk facilities
in Rio de Janeiro harbour, a multi-use container, vehicles and general cargo wharf was subsequently
developed by a substantial dredging and land reclamation exercise during the 1990s. This new wharf
and port land has been in use since 1998 for the import and export various cargos, including rolled
steel, vehicles, containers and sulphur. A dedicated conveyor-fed T-jetty and ship-loader was also
installed on the east side of the original import pier to allow iron ore exports, and this has been in use
since 1999.
Climate and weather
The warm subtropical-to-tropical climate of the Sepetiba region comprises hot, humid summers with
variable sea breezes, and cooler but equally moist winters dominated by southerly fronts. Mean day-
time temperatures regularly exceed 26oC during summer (maxima to +38oC), while night-time
temperatures typically fall below 22oC in winter (minima to 11oC). Annual rainfall is moderately high
(1500 mm) and evenly divided between both these seasons. An annual wind rose showing the
dominance of easterly and south-westerly components of the prevailing winds in the area is shown in
Figure 10.
Figure 10. Annual wind rose typical of Sepetiba Bay region (Angra dos Reis; 23o 0.5' S 44o 19.0' W; for 30
years)
30
4 Results
Hydrodynamic conditions
Tidal currents in the open areas of Sepetiba Bay are not particularly strong owing to the relatively
small tidal range, which is close to 1.4 m during springs and 0.7 m during neaps. Strongest tidal flows
near the port are generally to the east and west during the spring flood and ebb tide respectively. A
hydrodynamic study previously undertaken for the Port of Sepetiba generated BW plume dispersal
plots as animated GIF files. These files were obtained by the CFP-A and the consultants wrote a small
piece of code to link them to the GIS port map to enable convenient launch. The animations had been
generated by numerical hydrodynamic modelling at the Laboratório de Modelagem de Processos
Marinhos e Atmosféricos (Universidade Federal de Rio de Janeiro; UFRJ), using a 2-dimensional
model and a bay-wide uniform 250 m grid.
The GIFs show the direction and dilution of dispersing ballast water throughout several tidal cycles
during a south-westerly wind regime, calm conditions and a north-easterly wind regime. The GIF
frames in Figure 11 show the effect of SW winds (a) and calm conditions (b) on BW plume dispersal,
while those in Figure 12 show the effect of NE winds. Figure 11 shows how the near-surface
components of the BW plume are held close against the eastern shore of Sepetiba Bay during south-
westerly breezes (a), whereas under calm conditions the plume spreads slowly into Sepetiba Bay
under the action of the tidal cycle (b).
In Figure 12, the synergistic effect of the tidal cycle and NE winds is very clear, with the plume
rapidly spreading into the bay within 40 hours (a) and continuing to disperse across much of the bay
over the next 40 hours (b).
The modelling summarised in Figures 11 and 12 indicates that the BW plumes discharged at the port
have the capacity to carry any associated organisms to most types of marine and coastal habitats
within the bay by the main prevailing local hydrological forces.
Figure 11. GIF frame of modelled ballast water plume dispersing from Sepetiba, at the 40 hour mark for tide and
SW winds (a) and tide plus calm conditions (b)
31
Ballast Water Risk Assessment, Port of Sepetiba, Federal Republic of Brazil, December 2003: Final Report
Figure 12. GIF frame of modelled ballast water plume dispersing from Sepetiba by the action of tide and NE
winds at the 40 hour (a) and 80 hour (b) marks
Port facilities and maintenance
Since 1999 the Port of Sepetiba has been operating four main berthing areas. These are shown in
Figure 13 and described below.
·
Carvao (coal) import terminal (berths 101, 102): these are located on the outer (south) side of
798 m long `L'-shape import pier, which provides room for two colliers (either one up to 90,000
DWT and another of 50,000 DWT, or two of approximately 65,000 DWT or less). Water depth
is 15.0 m and there are two mooring dolphins to facilitate berthing. Of the seven conveyor .
·
Alumina import terminal (berths 201, 202): these are located on the inner (south) side of the
pier belts on the 540 m long and 40 m wide stem of the import pier, three are dedicated to coal
import, and can accommodate two bulk carriers or chemical/products tankers up to 45,000 DWT
for both dry and liquid bulk cargoes (alumina, caustic soda, etc). Water depth is 12.0 m.
·
Tecon wharf (berths 301, 302): The two berths on the face of this multi-use wharf have design
depths of 14.5 m and are backed by a total hardstand area of 400,000 m2 used for handling
containers, vehicles, rolled steel and other cargos.
·
Ferteco (iron ore) export jetty (berth 401): This terminal commenced operating in 1999, and
has conveyors and a single ship-loader dedicated to iron ore export. Water depth in the single
berth pocket exceeds 17 m during all tides.
Tugs, line boats, port launches and other small vessels generally use the western end of the Tecon
wharf. The port has no commercial fish processing or reception facilities.
Because of the naturally deep waters within many parts of Sepetiba Bay, no significant capital
dredging was required to provide the initial (western) approach channel to the original bulk import
pier. In the case of the Tecon multi-use wharf, a major developmental dredging programme was
undertaken during the 1990s to deepen the inshore area lying behind the import pier, an operation also
providing much of the landfill for developing the large reclaimed hardstand area that services the two
berths. Some extensive deepening was also undertaken to the south and south-west of the new Ferteco
export jetty to provide an alternative and more direct, safer approach and departure and a wider swing
area for large bulk carriers. Dredging to maintain the achieved design depths (21.5 m below LAT) has
not yet been required.
32
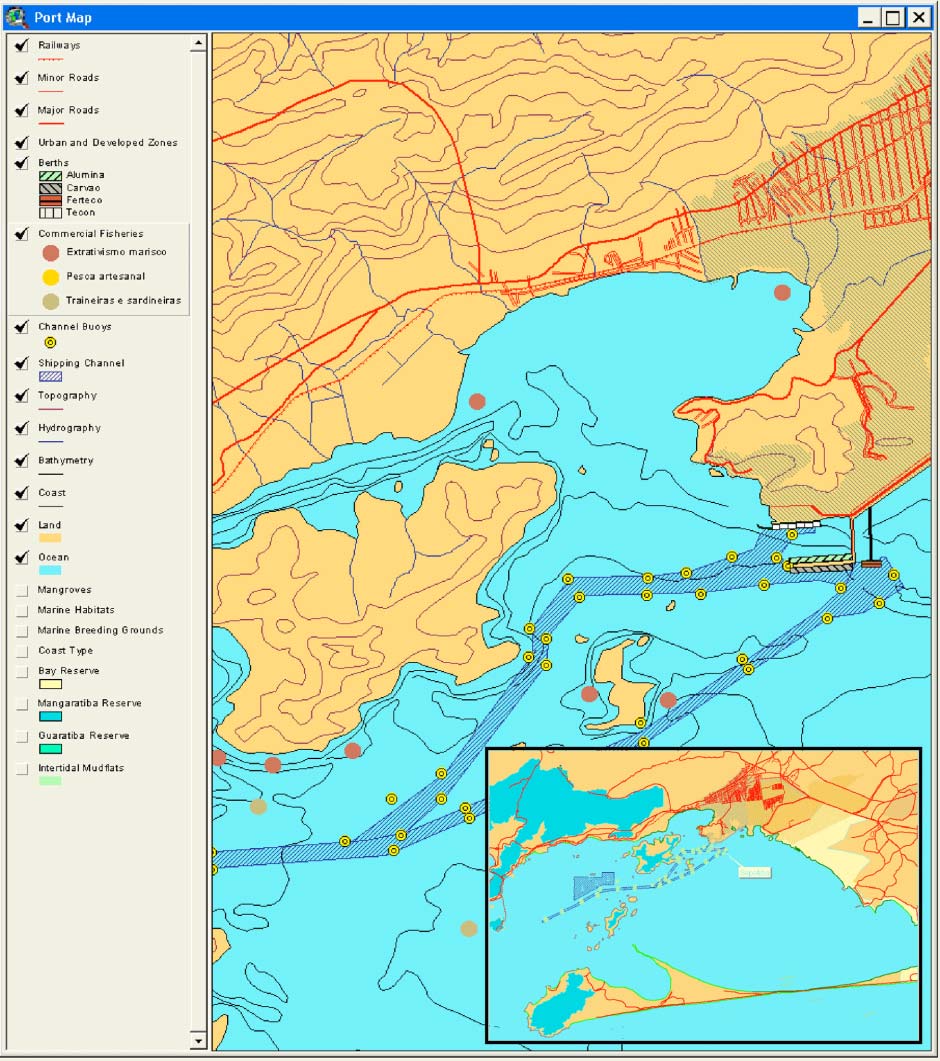
4 Results
Figure 13. Part of the GIS Port Map showing the navigation, infrastructure and active berth layers for Sepetiba
(inset shows approach channels and anchorage)
4.2 Resource
mapping
The subtidal seafloor habitats in Sepetiba Bay are dominated by soft muddy and harder sandy
sediments, and these are shown on the GIS Port Map (Figure 14). It is likely there are some
significant areas of seagrass and/or seaweed beds (e.g. Dictyotis) within Sepetiba Bay, but no
information could be found to help delineate where these might be best developed. There are no coral
reefs in this region of Brazil. The intertidal habitats of Sepetiba Bay comprise the following:
· Artificial rocky walls along the reclaimed, heightened and stabilised shorelines in and near
the port;
33
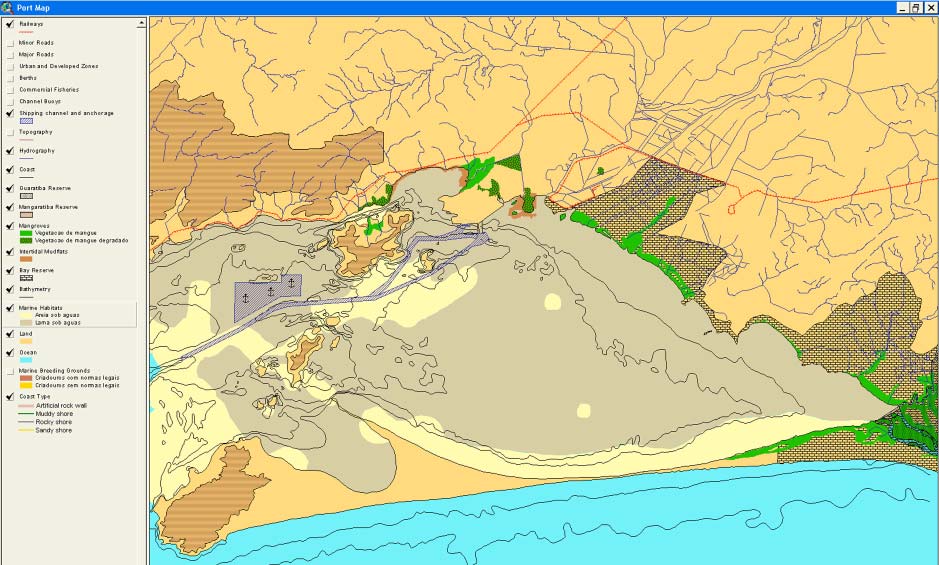
Ballast Water Risk Assessment, Port of Sepetiba, Federal Republic of Brazil, December 2003: Final Report
· Narrow rocky shores;
· Lower intertidal mud flats (best developed in the shallow bay to the north of the Madeira
Island);
· Mid-to-high tidal mangrove forests (relatively intact and degraded mangrove forest areas have
been identified by FEEMA and these are shown accordingly in Figure 14);
· Linear sand beaches (most developed on the south side of the bay along the large sand spit
that separates the bay from the ocean).
There are no high tidal salt flats or salt marshes (salinas) at or near the port owing to the topography
of the hinterland, the large areas of developed land and the relatively high rainfall. Thus the mangrove
forests often terminate abruptly with the commencement of terrestrial woodland and shrub or a
revetment.
There are several gazetted reserves and wildlife breeding areas, as well as recreational, artesanal and
sardine fishing areas, as identified around the bay by FEEMA during a 1997 study of the Sepetiba
region (the latter features are shown in Figure 13 to improve clarity and avoid blending with the
marine habitats).
The GIS port map does not yet show the locations of the PBBS sampling sites, but these can be
readily added when the coordinates of the survey sampling sites become available. The port map does
depict all of the drainage lines, deltaic channels and streams (Figure 14), plus the main navigational
and urban/developed features near the port, including the railway and road system (Figure 13).
Significant hilltops including the one behind the port on Madeira Island are clearly identified by the
topographic contours (Figure 13). Because of the scale of the map and the extent of the urbanised and
other developed areas on the north-east side of the bay (Figure 13), features such as post offices,
churches and radio masts were not added. No historical wreck-sites of archaeological significance or
cultural-heritage value were identified in the area covered by the GIS port map.
Figure 14. Part of the GIS Port Map showing the marine habitats and reserve layers
34
4 Results
4.3 De-ballasting/ballasting pattern
During the port meeting in April 2002, the navigational rules and deballasting and ballasting practises
of arriving vessels were discussed. Pilotage is compulsory, with boarding occurring beyond the mouth
of Sepetiba Bay. As in other ports, pilotage rules require all empty ships to retain sufficient ballast on
board to maintain adequate propulsion, steerage control and forward visibility, and to minimise
windage until berthing is completed. Windage is typically more significant in the winter months due
to the exposed aspect of the port's terminals to the south-westerly winds (Figure 10).
It was not difficult to establish the main deballasting/ballasting pattern for the Port of Sepetiba
because it contains two side-by-side bulk import terminals (`Carvao' and `Alumina'), and one
dedicated export jetty (`Ferteco') nearby at the end of a lengthy approach across the bay (Figure 13).
For example, by the time (cargo) empty (ballasted) vessels destined for the Ferteco terminal reach
their final approach and berthing phase, they typically contain a normal quantity of ballast for
sheltered coastal waters (i.e. 80-95% of standard capacity), even if they had spent time at the
anchorage 8 miles to the west (Figure 13). By contrast, bulk carriers approaching the Carvao or
Alumina berths are either fully or sufficiently loaded with cargo to have negligible ballast on board.
These vessels have no requirement to uplift any ballast water until well after they have berthed and
started discharging their cargo.
While it was straightforward to identify which bulk carriers arriving at these terminals must have
taken up or discharged BW, this was not case for vessels berthing at the multi-use Tecon wharf. Many
of the general cargo ships, smaller bulk carriers, container vessels and ro-ro vessels visiting this
terminal appeared to be part-loaded with cargo, some or all of which was destined for either:
· unloading cargo (i.e. possible ballast water uptake),
· loading additional cargo (i.e. requiring no or relatively small releases of BW), or
· both (an operation that can require some vessels to discharge ballast water to maintain trim
during part of the cargo unloading/loading cycle).
Thus unless these vessels submit a reasonably complete BWRF, it is not possible to estimate what
ballast may have been taken up or released owing to the lack of information concerning the amount of
cargo already on board. Since parts of many BWRFs handed to port officials were often incomplete
and/or contained illogical information, it was also very time consuming and often impossible to
interpret from either these forms or the port shipping records how much ballast water had been taken
up or discharged.
Thus of the total of 919 vessel visits that had been added to the database by the end of the second
consultants visit, only half of these originated from BWRFs submitted between January 2001 and
June 2002, the rest being expanded from the CFP-A's spreadsheet that summarised other visits in the
1998-2000 port shipping records. The following statistics were obtained from the Access database of
919 visit records:
· For the 208 visits entered for the Ferteco export terminal, these comprised bulk carriers
visiting between 27 August 1999 (when it opened) and 25 April 2002, and included the
largest vessel to visit the port (Amy N; 322,457 DWT).
· For the 323 visits relating to the Carvao import terminal, these comprised bulk carriers
spanning the period between 5 January 1998 and 24 May 2002.
· For the 54 visits entered for the Alumina import terminal, these spanned the period from 16
January 1998 to 4 April 2002 and comprised bulk carriers, a few general cargo ships plus
eleven chemical and product tankers delivering caustic soda and other bulk liquids. Since
these berths are supplied with watering but no bunker oil or export lines, some relatively
small BW discharges estimated for vessels visiting this terminal during the pre-BWRF period
(46 tank records, mean 718 tonnes) may not have actually occurred.
35
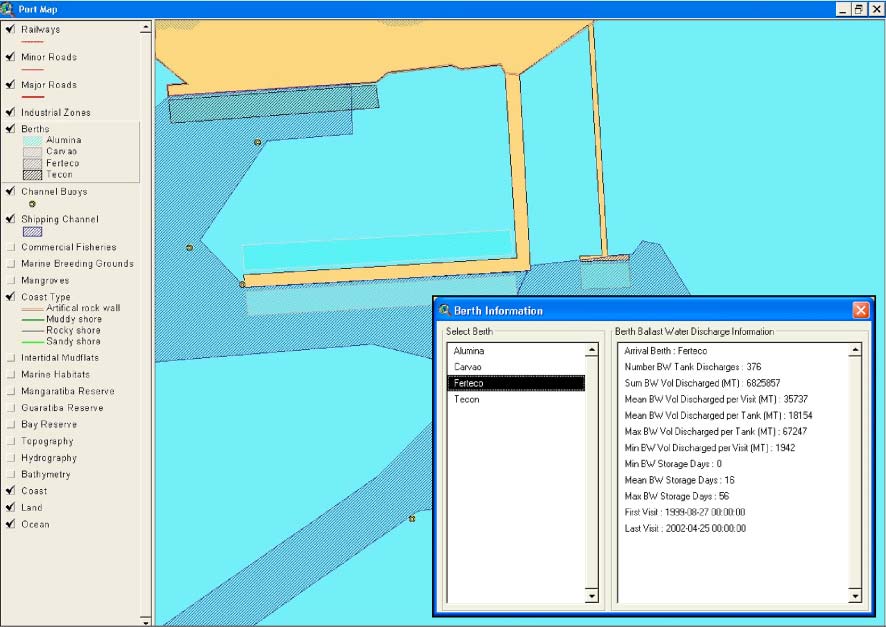
Ballast Water Risk Assessment, Port of Sepetiba, Federal Republic of Brazil, December 2003: Final Report
· For the 197 vessel visits entered for the Tecon terminal, these spanned the period from 28
June 1998 to 1 June 2002 and involved four main types of vessel (i.e. 70 general cargo ships,
29 container ships, 13 ro-ro vessels and 10 vehicle carriers, some of which visited more than
once), plus one reefer (refrigerated cargo ship), four passenger ships and 5 miscellaneous
types classed as `Other' to enable their entry into the BWRA database.
· The remainder comprised 132 visit records entered from incomplete BWRFs submitted
between 23 January 2001 and 2 June 2002. These could not be readily reconciled with port
shipping records to identify their correct berthing terminal and required further attention.
The database stores the amounts and sources of BW discharged from these arrivals (i.e. Ferteco and
Tecon terminals), as entered from the BWRFs and/or supplemented or wholly derived from the port
shipping records (1998-2001). Connection of the active berth layer of the GIS Port Map to the
database allowed tables summarising the BW discharge statistics to be conveniently displayed for
each terminal. Examples of these table displayed by the GIS Port Map are shown for the Ferteco,
Tecon and Alumina terminals in Figures 15, 16 and 17 respectively.
Figure 15. BW discharge statistics displayed by GIS Port Map for the Ferteco (iron ore) export terminal
36
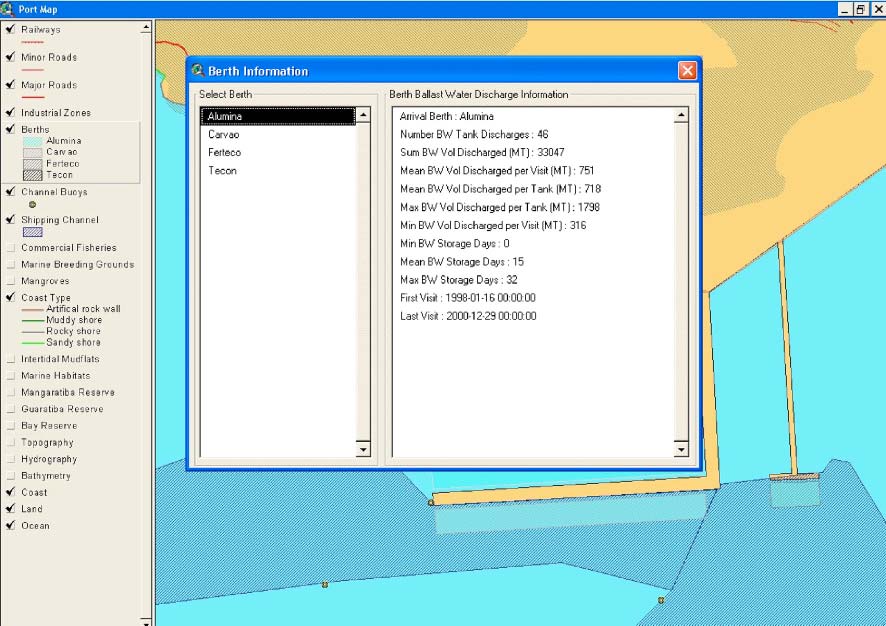
4 Results
Figure 16. BW discharge statistics displayed by GIS Port Map for the multi-use Tecon terminal
Figure 17. BW discharge statistics displayed by GIS Port Map for the Alumina dry and liquid bulk terminal
37
Ballast Water Risk Assessment, Port of Sepetiba, Federal Republic of Brazil, December 2003: Final Report
4.4 Identification of source ports
From the 919 vessel visit records and 1540 associated tank discharges in the Sepetiba database, the
total number of identified BW source ports was 148 (Table 3). Figure 18 shows output from the GIS
world bioregion map depicting the location and relative importance of these source ports with respect
to C1 (BW discharge frequency). As with all GIS outputs, the map is `zoomable' to allow all ports
and symbols to be clearly delineated at smaller scales.
The frequency values for the 148 identified source ports listed in Table 3 are the C1 coefficients used
to calculate the relative overall risk (Section 3.10). The source port `supplying' the highest frequency
of BW discharges at Sepetiba was Rotterdam (9%). This was followed by Santos (Brazil; 4.4%),
Ijmuiden (Netherlands; 4.2%), Praia Mole (Brazil; 4.1%), Salvador (Brazil; 3.4%) and Brest (France;
2.8%).
Of the 148 identified source ports, the top 16 provided 50% of the source-identified discharges at
Sepetiba, while the next 22 ports contributed a further 25%, i.e. only 38 of all source ports (26%)
accounted for 75% of the total number of source-identified BW discharges (Table 3).
As noted earlier, the low number of individual tank discharges (1540) compared to the visits (919), is
due to (a) the need to include port shipping records prior to the regular use of BWRFs (all tanks
combined), and (b) many vessels submitted a single, total discharge volume covering all their tanks on
the BWRF.
The total volume of BW discharged from identified source ports of the 919 vessel visits was
11,652,829 tonnes. The various discharge volume percentages shown for each source port in Table 3
and Figure 19 provide the C2 (BW discharge volume) values used in the risk calculation (Section
3.10).
The port rankings for C2 were close but not exactly the same as those for C1 (as ranked in Table 3). The
source ports providing the largest volume of BW discharged at Sepetiba were Rotterdam (13.4%),
Santos (Brazil; 7.2%) and Salvador (Brazil; 5.6%; Table 3). These were followed by Dunkerque
(France; 4.9%), Ijmuiden (Netherlands; 4.0%), Praia Mole (Brazil; 3.6%) and Fos sur Mer (France;
2.8%). The first non-Atlantic port in the C2 ranking was the Port of Hay Point (Australia; 2.0%) which
was ranked 11th.
The top 11 of identified source ports provided 50% of the total discharged volume, and the next 22
ports a further 25%. Thus only 33 (22%) of all identified source ports accounted for 75% of the source-
identified BW discharged at Sepetiba. Of the top 20 ports in terms of total discharge volume (63% of
C2), five were in Brazil, three in both the Netherlands and United States, two in both France and
United Kingdom, and one in Australia, Belgium, Gibraltar, Portugal and Spain.
Figure 18. GIS output showing the location and relative importance of BW source ports with respect to frequency
of tank discharges (C1) at Port of Sepetiba
38
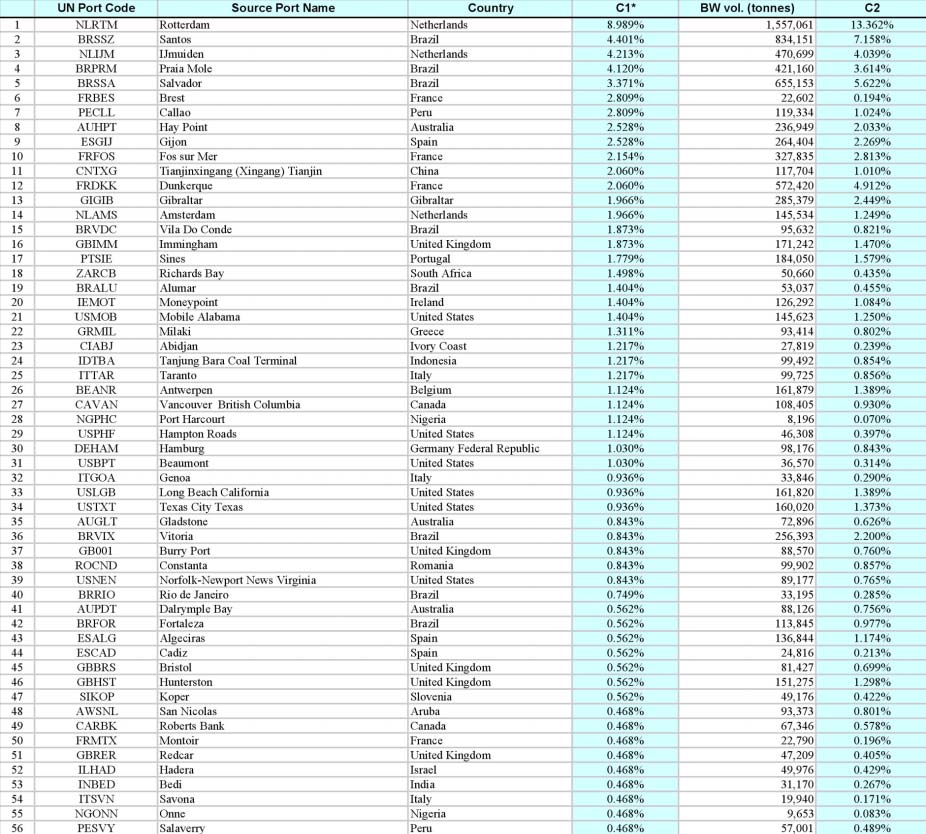
4 Results
Figure 19. GIS output showing location and relative importance of the source ports with respect to the volume of
tank discharges (C2) at Port of Sepetiba
Table 3. List of identified source ports in the Port of Sepetiba database, showing proportions of recorded ballast
tank discharges (C1) and volumes (C2)*
*C1 = proportion of all discharges (% of 1540 charges); C2 = proportion of total discharge volume (%)
39
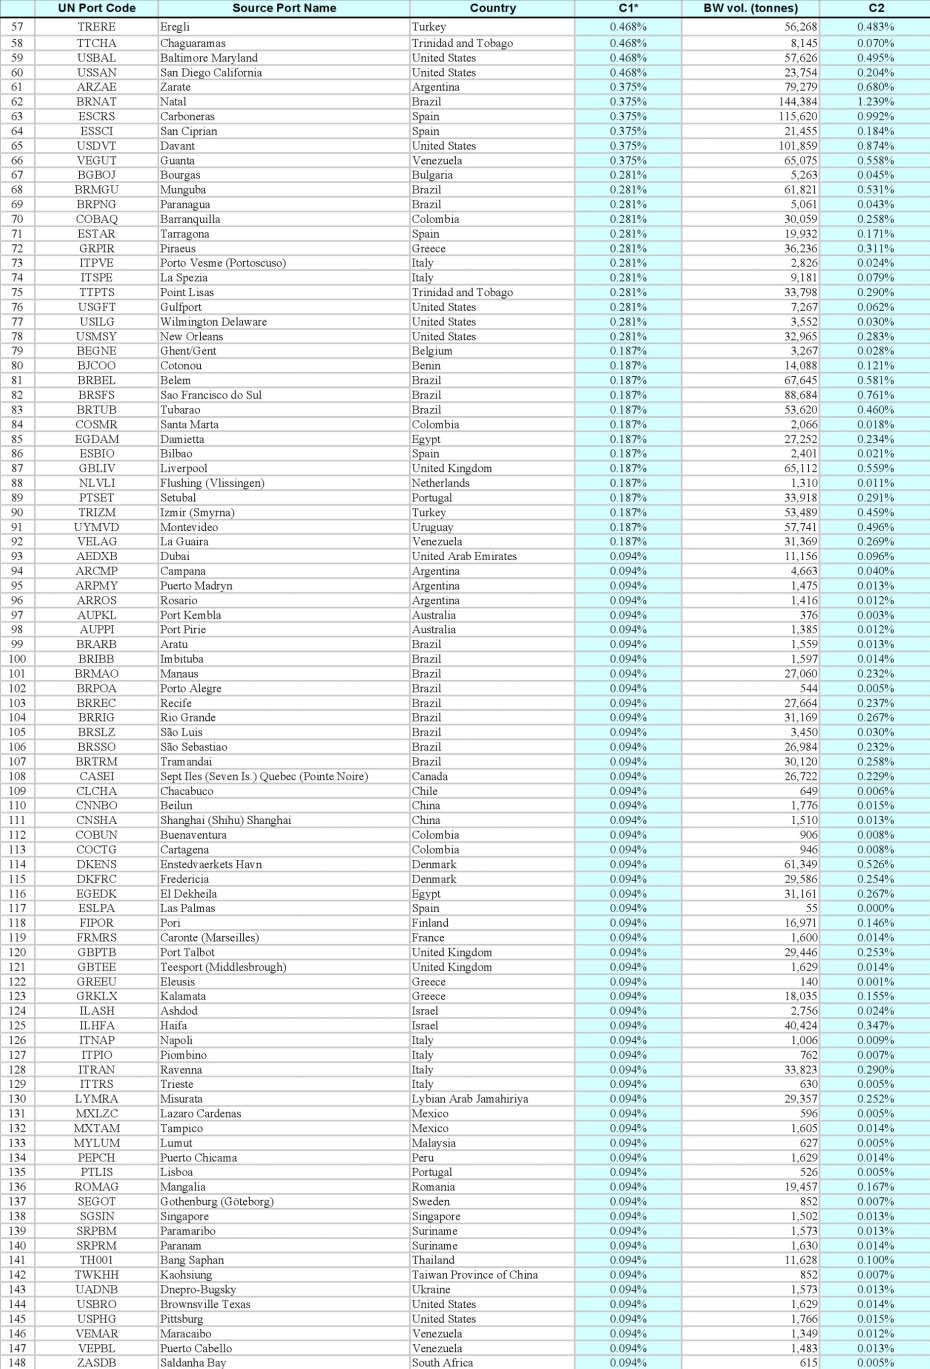
Ballast Water Risk Assessment, Port of Sepetiba, Federal Republic of Brazil, December 2003: Final Report
Table 3 (cont'd). List of identified source ports in the Port of Sepetiba database, showing proportions of recorded
ballast tank discharges (C1) and volumes (C2)*
*C1 = proportion of all discharges (% of 1540 charges); C2 = proportion of total discharge volume (%)
40
4 Results
4.5 Identification of destination ports
As discussed in Section 3.5, identification of destination ports for any BW taken up at a
Demonstration Site is confounded by the lack specific questions on the BWRF, and the uncertainty of
knowing if the Next of Port Call recorded on a BWRF (or in a shipping record) is where BW is
actually discharged. Thus presently there is no reporting mechanism enabling a `reverse BWRA' to be
undertaken reliably. This posed a significant constraint for Sepetiba, since the large majority of bulk
carriers departing the Carvao and Alumina import terminals must have been carrying ballast water uplifted
alongside these berths.
Of the 104 assumed BW destination ports (i.e. Next Ports of Call) in the 1998-2002 database, their
location and proportional frequency are shown Figure 20 and listed in Table 4. The latter lists the top
44 destination ports that accounted for >80% of the reported Next Ports of Call by all 919 vessel
departures. Figure 20 and Table 4 also show that the nearby port of Santos stood out as the most
frequent destination port, with over 10% of Next Ports of Call attributed to this one port which serves
Brazil's largest industrial city of Sao Paulo.
Table 4 shows that, of the 17 ports accounting for the destinations of >50% of the vessel departures
from Sepetiba, five were in Brazil, four were in Argentina, two each in France and China, and one
each in Bulgaria, Colombia, Mexico and Taiwan Province.
Figure 20. GIS output showing the location and frequency of destination ports, recorded as the Next Port of Call
in the Port of Sepetiba BWRFs and shipping records
41
Ballast Water Risk Assessment, Port of Sepetiba, Federal Republic of Brazil, December 2003: Final Report
Table 4. Destination ports accounting for >80% of all vessel departures from Sepetiba in 1998-2002 (recorded as
Next Ports of Call)
UN Port
Destination Port
Proportion of
Cumulative
No.
Country
Code
(Next Port of Call)
Departures (%)
Percentage
1
BRSSZ
Santos
Brazil
10.23
10.23
2
TWKHH
Kaohsiung
Taiwan Province of China
4.05
14.28
3
ARVCN
Villa Constitucion (Puerto Acevedo)
Argentina
3.84
18.12
4
BRTUB
Tubarao
Brazil
3.20
21.32
5
BGBOJ
Bourgas
Bulgaria
2.56
23.88
6
BRSPB
Sepetiba
Brazil
2.56
26.44
7
CNTAO
Qingdao (Longgang) Shandong
China
2.56
29.00
8
FRUIP
Quimper
France
2.56
31.56
9
ARBUE
Buenos Aires
Argentina
2.35
33.91
10
ARSLO
San Lorenzo-San Martin
Argentina
2.35
36.26
11
BRSSA
Salvador
Brazil
2.35
38.61
12
FRDKK
Dunkerque
France
2.35
40.96
13
ARSNS
San Nicolas
Argentina
2.13
43.09
14
BRPNG
Paranagua
Brazil
1.92
45.01
15
CNNBO
Beilun
China
1.92
46.93
16
COBAQ
Barranquilla
Colombia
1.92
48.85
17
MXLZC
Lazaro Cardenas
Mexico
1.92
50.77
18
PLSWI
Swinoujscie
Poland
1.71
52.48
19
BRMAO
Manaus
Brazil
1.49
53.97
20
BRRIG
Rio Grande
Brazil
1.49
55.46
21
BRRIO
Rio de Janeiro
Brazil
1.49
56.95
22
BRSSO
Săo Sebastiao
Brazil
1.49
58.44
23
JPOIT
Oita Oita
Japan
1.49
59.93
24
BEGNE
Ghent/Gent
Belgium
1.28
61.21
25
BRITJ
Itajai
Brazil
1.28
62.49
26
DEHAM
Hamburg
Germany Federal Republic of
1.28
63.77
27
FRFOS
Fos sur Mer
France
1.28
65.05
28
KRKPO
Pohang
Korea
1.28
66.33
29
NLRTM
Rotterdam
Netherlands
1.28
67.61
30
BRVIX
Vitoria
Brazil
1.07
68.68
31
DERSK
Rostock
Germany Federal Republic of
1.07
69.75
32
SAJUB
Jubail
Saudi Arabia
1.07
70.82
33
USBAL
Baltimore Maryland
United States
1.07
71.89
34
BRPRM
Praia Mole
Brazil
0.85
72.74
35
GBPTB
Port Talbot
United Kingdom
0.85
73.59
36
KRKAN
Kwangyang
Korea
0.85
74.44
37
PTLIS
Lisboa
Portugal
0.85
75.29
38
UYMVD
Montevideo
Uruguay
0.85
76.14
39
VEPBL
Puerto Cabello
Venezuela
0.85
76.99
40
AEQIW
Umm Al Qiwain
United Arab Emirates
0.64
77.63
41
ARCMP
Campana
Argentina
0.64
78.27
42
ARZAE
Zarate
Argentina
0.64
78.91
43
BHMAN
Manama
Bahrain
0.64
79.55
44
BRSFS
Sao Francisco do Sul
Brazil
0.64
80.19
4.6
Environmental similarity analysis
Of the identified 148 source ports and 104 destination ports, sufficient port environmental data were
obtained to include 58% of the former and 56% of the latter in the multivariate similarity analysis by
PRIMER. These ports accounted for 79.5% of all recorded tank discharges and 67% of all recorded
departures respectively (Tables 5-6). Details of the 357 ports included in the multivariate analysis
carried out for Sepetiba and the other Demonstration Site BWRAs are listed in Appendix 6 (this list is
ordered alphabetically using the UN port identification code, in which the first two letters represent
the country).
To allow all identified BW source and next ports of Sepetiba to be part of the `first-pass' risk
assessment, those ports not included in the multivariate analysis were provided with environment
matching coefficient estimates, and are noted as such in the database. The C3 estimates were based on
their port type (Section 3.7) and geographic location with respect to the nearest comparable ports for
which C3 had been calculated. A precautionary approach was adopted (i.e. the estimated values were
made higher than the calculated C3s of the comparable ports). Providing C3 estimates allowed the
42
4 Results
database to include all Sepetiba source ports and next ports when calculating the ROR values and
displaying the BWRA results.
The GIS world map outputs that display the C3 values of the Port of Sepetiba source and destination
ports are in Figures 21 and 22 respectively. These plots and Tables 5-6 show that Sepetiba has a
relatively high environmental similarity to a large number of its trading ports (i.e. C3s in the 0.6 - 0.8
range). This can be related to its borderline subtropical-tropical location, providing a wide seasonality
to its temperature regimes, plus an annual pattern of rainfall that constrains any seasonal development
of salinity extrema.
It is not surprising that the most environmentally similar port to Sepetiba was Rio de Janeiro (C3 =
0.86) with 22 other Brazilian ports having either calculated or estimated C3 matching coefficients in
the 0.7-0.8 range (Table 5). The nearest similar source ports beyond Brazil were the west African port
of Abidjan (C3 of 0.70), Singapore (0.63), several Mediterranean ports and the port of Port Kembla
on the east coast of Australia, all of which were in the 0.6-0.63 range (Table 5). The most
environmentally dissimilar ports that were trading with Sepetiba in 1998-2002 were various riverine,
highly brackish and/or cool water ports in North America, southern Argentina and north-west Europe
(0.2 - 0.3; Tables 5-6; Figures 21,22).
Figure 21. GIS output showing the location and environmental matching coefficients (C3) of BW source ports
identified for the Port of Sepetiba
Figure 22. GIS output showing the location and environmental matching coefficients (C3) of the destination ports
identified for the Port of Sepetiba
43
Ballast Water Risk Assessment, Port of Sepetiba, Federal Republic of Brazil, December 2003: Final Report
Table 5. Source ports identified for Port of Sepetiba, as ranked according to size of their environmental matching
coefficient (C3)
UN Port
Proportion of BW
Environmental
Source Port Name
Country
C3 Estimated
Code
discharged
Matching (C3)
BRRIO
Rio de Janeiro
Brazil
0.75%
0.86
BRPRM
Praia Mole
Brazil
4.12%
0.80
BRTUB
Tubarao
Brazil
0.19%
0.79
BRSSZ
Santos
Brazil
4.40%
0.78
BRVIX
Vitoria
Brazil
0.84%
0.74
BRSSA
Salvador
Brazil
3.37%
0.72
BRPNG
Paranagua
Brazil
0.28%
0.72
BRALU
Alumar
Brazil
1.40%
0.70
Estimated
BRARB
Aratu
Brazil
0.09%
0.70
Estimated
BRBEL
Belem
Brazil
0.19%
0.70
Estimated
BRFOR
Fortaleza
Brazil
0.56%
0.70
Estimated
BRIBB
Imbituba
Brazil
0.09%
0.70
Estimated
BRMAO
Manaus
Brazil
0.09%
0.70
Estimated
BRMGU
Munguba
Brazil
0.28%
0.70
Estimated
BRNAT
Natal
Brazil
0.37%
0.70
Estimated
BRPOA
Porto Alegre
Brazil
0.09%
0.70
Estimated
BRREC
Recife
Brazil
0.09%
0.70
Estimated
BRRIG
Rio Grande
Brazil
0.09%
0.70
Estimated
BRSFS
Sao Francisco do Sul
Brazil
0.19%
0.70
Estimated
BRSLZ
Săo Luis
Brazil
0.09%
0.70
Estimated
BRSSO
Săo Sebastiao
Brazil
0.09%
0.70
Estimated
BRTRM
Tramandai
Brazil
0.09%
0.70
Estimated
BRVDC
Vila Do Conde
Brazil
1.87%
0.70
Estimated
CIABJ
Abidjan
Ivory Coast
1.22%
0.70
Estimated
SGSIN
Singapore
Singapore
0.09%
0.63
ITTRS
Trieste
Italy
0.09%
0.62
SIKOP
Koper
Slovenia
0.56%
0.62
AUPKL
Port Kembla
Australia
0.09%
0.61
ITTAR
Taranto
Italy
1.22%
0.60
BJCOO
Cotonou
Benin
0.19%
0.60
Estimated
CLCHA
Chacabuco
Chile
0.09%
0.60
Estimated
ITSPE
La Spezia
Italy
0.28%
0.60
Estimated
ITSVN
Savona
Italy
0.47%
0.60
Estimated
LYMRA
Misurata
Lybian Arab Jamahiriya
0.09%
0.60
Estimated
MXLZC
Lazaro Cardenas
Mexico
0.09%
0.60
Estimated
MXTAM
Tampico
Mexico
0.09%
0.60
Estimated
PEPCH
Puerto Chicama
Peru
0.09%
0.60
Estimated
PESVY
Salaverry
Peru
0.47%
0.60
Estimated
TH001
Bang Saphan
Thailand
0.09%
0.60
Estimated
TTCHA
Chaguaramas
Trinidad and Tobago
0.47%
0.60
Estimated
TTPTS
Point Lisas
Trinidad and Tobago
0.28%
0.60
Estimated
USNEN
Norfolk-Newport News Virginia
United States
0.84%
0.60
ITRAN
Ravenna
Italy
0.09%
0.60
USTXT
Texas City Texas
United States
0.94%
0.59
ZARCB
Richards Bay
South Africa
1.50%
0.59
USPHF
Hampton Roads
United States
1.12%
0.59
ZASDB
Saldanha Bay
South Africa
0.09%
0.58
CNNBO
Beilun
China
0.09%
0.58
GREEU
Eleusis
Greece
0.09%
0.57
ESTAR
Tarragona
Spain
0.28%
0.57
AUPPI
Port Pirie
Australia
0.09%
0.57
ESBIO
Bilbao
Spain
0.19%
0.56
PECLL
Callao
Peru
2.81%
0.56
GIGIB
Gibraltar
Gibraltar
1.97%
0.56
GRMIL
Milaki
Greece
1.31%
0.55
Estimated
ESGIJ
Gijon
Spain
2.53%
0.55
COBAQ
Barranquilla
Colombia
0.28%
0.55
Estimated
COSMR
Santa Marta
Colombia
0.19%
0.55
Estimated
ESCAD
Cadiz
Spain
0.56%
0.55
Estimated
ESSCI
San Ciprian
Spain
0.37%
0.55
Estimated
GRKLX
Kalamata
Greece
0.09%
0.55
Estimated
INBED
Bedi
India
0.47%
0.55
Estimated
PTSET
Setubal
Portugal
0.19%
0.55
Estimated
USSAN
San Diego California
United States
0.47%
0.55
GRPIR
Piraeus
Greece
0.28%
0.55
AWSNL
San Nicolas
Aruba
0.47%
0.54
Estimated
ESCRS
Carboneras
Spain
0.37%
0.54
Estimated
AUGLT
Gladstone
Australia
0.84%
0.54
COCTG
Cartagena
Colombia
0.09%
0.54
MYLUM
Lumut
Malaysia
0.09%
0.54
TRERE
Eregli
Turkey
0.47%
0.53
AUHPT
Hay Point
Australia
2.53%
0.53
AUPDT
Dalrymple Bay
Australia
0.56%
0.53
44
4 Results
Table 5 (cont'd). Source ports identified for Port of Sepetiba, as ranked according to size of their environmental
matching coefficient (C3)
UN Port
Proportion of BW
Environmental
Source Port Name
Country
C3 Estimated
Code
discharged
Matching (C3)
FRMRS
Caronte (Marseilles)
France
0.09%
0.53
USLGB
Long Beach California
United States
0.94%
0.52
PTSIE
Sines
Portugal
1.78%
0.52
TWKHH
Kaohsiung
Taiwan Province of China
0.09%
0.52
COBUN
Buenaventura
Colombia
0.09%
0.52
Estimated
FRFOS
Fos sur Mer
France
2.15%
0.52
ESLPA
Las Palmas
Spain
0.09%
0.52
PTLIS
Lisboa
Portugal
0.09%
0.52
ESALG
Algeciras
Spain
0.56%
0.51
UYMVD
Montevideo
Uruguay
0.19%
0.51
TRIZM
Izmir (Smyrna)
Turkey
0.19%
0.51
USMOB
Mobile Alabama
United States
1.40%
0.50
ITGOA
Genoa
Italy
0.94%
0.50
GBHST
Hunterston
United Kingdom
0.56%
0.50
CNTXG
Tianjinxingang (Xingang) Tianjin
China
2.06%
0.50
Estimated
FRMTX
Montoir
France
0.47%
0.50
Estimated
ITNAP
Napoli
Italy
0.09%
0.50
Estimated
ITPIO
Piombino
Italy
0.09%
0.50
Estimated
ITPVE
Porto Vesme (Portoscuso)
Italy
0.28%
0.50
Estimated
SRPBM
Paramaribo
Suriname
0.09%
0.50
Estimated
SRPRM
Paranam
Suriname
0.09%
0.50
Estimated
USGFT
Gulfport
United States
0.28%
0.50
Estimated
VEGUT
Guanta
Venezuela
0.37%
0.50
Estimated
VELAG
La Guaira
Venezuela
0.19%
0.50
Estimated
VEMAR
Maracaibo
Venezuela
0.09%
0.50
Estimated
VEPBL
Puerto Cabello
Venezuela
0.09%
0.50
Estimated
IDTBA
Tanjung Bara Coal Terminal
Indonesia
1.22%
0.48
EGEDK
El Dekheila
Egypt
0.09%
0.47
NGONN
Onne
Nigeria
0.47%
0.46
GBBRS
Bristol
United Kingdom
0.56%
0.45
Estimated
GBLIV
Liverpool
United Kingdom
0.19%
0.45
Estimated
USBRO
Brownsville Texas
United States
0.09%
0.45
Estimated
NLIJM
IJmuiden
Netherlands
4.21%
0.45
FRBES
Brest
France
2.81%
0.44
DKFRC
Fredericia
Denmark
0.09%
0.42
DKENS
Enstedvaerkets Havn
Denmark
0.09%
0.41
NLVLI
Flushing (Vlissingen)
Netherlands
0.19%
0.41
GBRER
Redcar
United Kingdom
0.47%
0.41
GBTEE
Teesport (Middlesbrough)
United Kingdom
0.09%
0.41
AEDXB
Dubai
United Arab Emirates
0.09%
0.41
NGPHC
Port Harcourt
Nigeria
1.12%
0.39
ROCND
Constanta
Romania
0.84%
0.38
ROMAG
Mangalia
Romania
0.09%
0.38
FRDKK
Dunkerque
France
2.06%
0.37
IEMOT
Moneypoint
Ireland
1.40%
0.37
USBPT
Beaumont
United States
1.03%
0.36
NLRTM
Rotterdam
Netherlands
8.99%
0.35
CARBK
Roberts Bank
Canada
0.47%
0.35
BGBOJ
Bourgas
Bulgaria
0.28%
0.35
CAVAN
Vancouver British Columbia
Canada
1.12%
0.34
GBPTB
Port Talbot
United Kingdom
0.09%
0.32
USBAL
Baltimore Maryland
United States
0.47%
0.31
GB001
Burry Port
United Kingdom
0.84%
0.31
EGDAM
Damietta
Egypt
0.19%
0.30
FIPOR
Pori
Finland
0.09%
0.30
Estimated
ILHAD
Hadera
Israel
0.47%
0.30
Estimated
ILHFA
Haifa
Israel
0.09%
0.30
Estimated
SEGOT
Gothenburg (Göteborg)
Sweden
0.09%
0.30
Estimated
GBIMM
Immingham
United Kingdom
1.87%
0.30
USILG
Wilmington Delaware
United States
0.28%
0.30
DEHAM
Hamburg
Germany Federal Republic
1.03%
0.29
USDVT
Davant
United States
0.37%
0.29
UADNB
Dnepro-Bugsky
Ukraine
0.09%
0.29
CASEI
Sept Iles (Seven Is.) Quebec (Pointe Noire)
Canada
0.09%
0.27
ILASH
Ashdod
Israel
0.09%
0.26
NLAMS
Amsterdam
Netherlands
1.97%
0.25
BEGNE
Ghent/Gent
Belgium
0.19%
0.25
CNSHA
Shanghai (Shihu) Shanghai
China
0.09%
0.24
BEANR
Antwerpen
Belgium
1.12%
0.24
ARCMP
Campana
Argentina
0.09%
0.21
USMSY
New Orleans
United States
0.28%
0.20
ARPMY
Puerto Madryn
Argentina
0.09%
0.20
Estimated
ARROS
Rosario
Argentina
0.09%
0.20
Estimated
ARZAE
Zarate
Argentina
0.37%
0.20
Estimated
USPHG
Pittsburg
United States
0.09%
0.20
Estimated
45
Ballast Water Risk Assessment, Port of Sepetiba, Federal Republic of Brazil, December 2003: Final Report
Table 6. Destination ports identified for Port of Sepetiba, ranked according to the size of their environmental
matching coefficient (C3)
Destination Port
Proportion of
Environmental
Coefficient
UN Port Code
Country
(Next Port of Call)
Departures (%)
Matching (C3)
Calculated
BRRIO
Rio de Janeiro
Brazil
149.00%
0.86
BRPRM
Praia Mole
Brazil
85.00%
0.80
BRTUB
Tubarao
Brazil
320.00%
0.79
BRSSZ
Santos
Brazil
1023.00%
0.78
BRVIX
Vitoria
Brazil
107.00%
0.74
BRSSA
Salvador
Brazil
235.00%
0.72
BRPNG
Paranagua
Brazil
192.00%
0.72
BRARB
Aratu
Brazil
21.00%
0.70
Estimated
BRARE
Areia Branca
Brazil
21.00%
0.70
Estimated
BRIBB
Imbituba
Brazil
21.00%
0.70
Estimated
BRMAO
Manaus
Brazil
149.00%
0.70
Estimated
BRPCL
Portocel
Brazil
21.00%
0.70
Estimated
BRPOA
Porto Alegre
Brazil
21.00%
0.70
Estimated
BRREC
Recife
Brazil
21.00%
0.70
Estimated
BRRIG
Rio Grande
Brazil
149.00%
0.70
Estimated
BRSFS
Sao Francisco do Sul
Brazil
64.00%
0.70
Estimated
BRSLZ
Săo Luis
Brazil
21.00%
0.70
Estimated
BRSSO
Săo Sebastiao
Brazil
149.00%
0.70
Estimated
BRTMT
Trombetas
Brazil
21.00%
0.70
Estimated
SGSIN
Singapore
Singapore
43.00%
0.63
JPKMT
Kimitsu Chiba
Japan
21.00%
0.62
JPCHB
Chiba Chiba
Japan
21.00%
0.62
JPKWS
Kawasaki Kanagawa
Japan
64.00%
0.61
ITTAR
Taranto
Italy
43.00%
0.60
BSFPO
Freeport Grand Bahama
Bahamas
21.00%
0.60
Estimated
CLCHA
Chacabuco
Chile
21.00%
0.60
Estimated
CLSAI
San Antonio
Chile
21.00%
0.60
Estimated
CLVAP
Valparaiso
Chile
21.00%
0.60
Estimated
LYMRA
Misurata
Lybian Arab Jamahiriya
64.00%
0.60
Estimated
MXLZC
Lazaro Cardenas
Mexico
192.00%
0.60
Estimated
PLSWI
Swinoujscie
Poland
171.00%
0.60
Estimated
TH001
Bang Saphan
Thailand
64.00%
0.60
Estimated
THKSI
Koh Sichang
Thailand
21.00%
0.60
Estimated
USNEN
Norfolk-Newport News Virginia
United States
21.00%
0.60
JPKOJ
Kagoshima Kagoshima
Japan
21.00%
0.58
ZASDB
Saldanha Bay
South Africa
43.00%
0.58
CNNBO
Beilun
China
192.00%
0.58
JPKSM
Kashima Ibaraki
Japan
43.00%
0.57
ESBCN
Barcelona
Spain
21.00%
0.56
PECLL
Callao
Peru
21.00%
0.56
JPOSA
Osaka Osaka
Japan
21.00%
0.56
COBAQ
Barranquilla
Colombia
192.00%
0.55
Estimated
CRLIO
Puerto Limon
Costa Rica
21.00%
0.55
Estimated
ESSAG
Sagunto
Spain
21.00%
0.55
Estimated
KRKPO
Pohang
Korea
128.00%
0.54
KRKAN
Kwangyang
Korea
85.00%
0.54
COCTG
Cartagena
Colombia
43.00%
0.54
TRERE
Eregli
Turkey
43.00%
0.53
BRPOU
Ponta do Ubu
Brazil
43.00%
0.53
TWKHH
Kaohsiung
Taiwan Province of China
405.00%
0.52
ITLIV
Livorno
Italy
43.00%
0.52
FRFOS
Fos sur Mer
France
128.00%
0.52
PTLIS
Lisboa
Portugal
85.00%
0.52
ESALG
Algeciras
Spain
21.00%
0.51
UYMVD
Montevideo
Uruguay
85.00%
0.51
TRISD
Isdemir
Turkey
21.00%
0.51
FRUIP
Quimper
France
256.00%
0.51
Estimated
USMOB
Mobile Alabama
United States
43.00%
0.50
ITGOA
Genoa
Italy
64.00%
0.50
VECBL
Ciudad Bolivar
Venezuela
21.00%
0.50
Estimated
CNTXG
Tianjinxingang (Xingang) Tianjin
China
64.00%
0.50
Estimated
ESAGP
Malaga
Spain
21.00%
0.50
Estimated
INHAZ
Hazira
India
21.00%
0.50
Estimated
ITSAL
Salerno
Italy
43.00%
0.50
Estimated
VEGUT
Guanta
Venezuela
21.00%
0.50
Estimated
VELAG
La Guaira
Venezuela
64.00%
0.50
Estimated
VEPBL
Puerto Cabello
Venezuela
85.00%
0.50
Estimated
CNTAO
Qingdao (Longgang) Shandong
China
256.00%
0.50
JPMIZ
Mizushima Okayama
Japan
21.00%
0.49
CNYNT
Yantai (Muping) Shandong
China
43.00%
0.49
BRITJ
Itajai
Brazil
128.00%
0.48
EGEDK
El Dekheila
Egypt
43.00%
0.47
JPOIT
Oita Oita
Japan
149.00%
0.47
46
4 Results
Table 6 (cont'd). Destination ports identified for Port of Sepetiba, ranked according to the size of their
environmental matching coefficient (C3)
Destination Port
Proportion of
Environmental
Coefficient
UN Port Code
Country
(Next Port of Call)
Departures (%)
Matching (C3)
Calculated
ARBUE
Buenos Aires
Argentina
2.3
0.453
GBNPT
Newport
United Kingdom
0.2
0.450
Estimated
USBRO
Brownsville Texas
United States
0.6
0.450
Estimated
BHMAN
Manama
Bahrain
0.6
0.411
AEQIW
Umm Al Qiwain
United Arab Emirates
0.6
0.408
DERSK
Rostock
Germany Federal Republic of
1.1
0.386
Estimated
FRDKK
Dunkerque
France
2.3
0.374
IEBTM
Baltimore (Rep. of Ireland)
Ireland
0.2
0.368
Estimated
NLRTM
Rotterdam
Netherlands
1.3
0.351
BGBOJ
Bourgas
Bulgaria
2.6
0.348
GBPTB
Port Talbot
United Kingdom
0.9
0.325
CABEC
Becancour Quebec
Canada
0.2
0.324
Estimated
CAMTR
Montreal Quebec
Canada
0.2
0.311
Estimated
USBAL
Baltimore Maryland
United States
1.1
0.309
GBIMM
Immingham
United Kingdom
0.6
0.299
DEHAM
Hamburg
Germany Federal Republic of
1.3
0.295
SAJUB
Jubail
Saudi Arabia
1.1
0.293
CACOC
Contrecoeur
Canada
0.2
0.276
Estimated
USPHL
Philadelphia Pennsylvania
United States
0.2
0.272
BEGNE
Ghent/Gent
Belgium
1.3
0.245
CNSHA
Shanghai (Shihu) Shanghai
China
0.4
0.243
IRBKM
Bandar Khomeini
I.R. Iran
0.6
0.223
ARCMP
Campana
Argentina
0.6
0.205
USMSY
New Orleans
United States
0.4
0.204
ARRGL
Rio Gallegos
Argentina
0.4
0.200
Estimated
ARROS
Rosario
Argentina
0.2
0.200
Estimated
ARSLO
San Lorenzo-San Martin
Argentina
2.3
0.200
Estimated
ARSNS
San Nicolas
Argentina
2.1
0.200
Estimated
ARVCN
Villa Constitucion (Puerto Acevedo)
Argentina
3.8
0.200
Estimated
ARZAE
Zarate
Argentina
0.6
0.200
Estimated
4.7
Risk species
The risk species threat from a source port depends on the number of introduced and native species in
its bioregion, and their categorisations as unlikely, suspected or known harmful species (Section 3.9).
The risk species threat coefficient (C4) of each BW source port that was identified for Sepetiba are
shown in Figure 23 and listed in Table 7. Table 7 also lists the scores for the introduced, suspected
and known harmful species of the source port bioregions, as had been added and assigned to the
database's species tables by March 2003.
As noted in Section 3.9, these tables and their associated Excel species reference file do not give a
complete global list, but provide a working resource enabling convenient update and improvement for
each bioregion. Similarly, the 204 bioregions on the GIS world map should not be considered
unalterable. Regional resolution of species-presence records is steadily improving in several areas,
and this will allow many bioregions to become divided into increasingly smaller units (ultimately
approaching the scale of local port waters).
It should also be recognised that the distribution of risk species in the database also contains a
regional bias due to the level of aquatic sampling and taxonomic effort in Australia/New Zealand,
Europe and North America.
The species in Table 8 include preliminary identifications from the Sepetiba PBBS, plus those listed
in published and unpublished reports collated by Group C members (Appendix 5).
Many of the species listed for these areas can be related to their history of species transfers for
aquaculture, plus hull fouling on sailing vessels and the canal-caused invasions of the east
Mediterranean (Suez), north-east Europe (Ponto-Caspian river canal links) and Great Lakes (St
Lawrence River seaway). The regional and often patchy sampling bias needs to be remembered when
comparing C4 values between different bioregions, and is a further reason why the independent
treatment of C3 for calculating the ROR values is a safer approach (Section 3.10).
47
Ballast Water Risk Assessment, Port of Sepetiba, Federal Republic of Brazil, December 2003: Final Report
Because of the different historical vectors (hull fouling, canals, aquaculture, dry ballast, water ballast,
etc), a future version of the BWRA system could provide more accurate C4 values for BW-mediated
introduction threats if vector weightings are added to the database for the C4 calculation.
Finally, it is worth noting the database cannot produce `reverse' C4 values for destination ports (i.e.
measures of the relative threat posed by any BW exported from Sepetiba). This requires knowing the
sources of all the other BW discharged at each destination port. What can be extracted from the
database to assist a `reverse' BWRA is the list of species assigned to the bioregion of Sepetiba (which
is located near the centre of bioregion SAII-B; Figure 7, Table 8).
Figure 23. GIS output showing the location and risk species threat coefficients (C4) of the BW source ports
identified for the Port of Sepetiba
48
4 Results
Table 7. Ranking of BW source ports identified for Port of Sepetiba, according to the size of their risk species
threat (C4)
No. of
Knwn
Total
Suspected
Relative Risk Species
Port Code
Source Port
Country
Bio-Region
Introduced
Harmful
Threat
Harmful Species
Threat (C4)
Species
Species
Value
CARBK Roberts Bank
Canada
NEP-III
66
9
10
193
0.383
USPHG
Pittsburg
United States
NEP-V
66
9
10
193
0.383
CAVAN Vancouver British Columbia
Canada
NEP-III
66
9
10
193
0.383
AUPPI
Port Pirie
Australia
AUS-VII
39
4
14
191
0.379
CNNBO Beilun
China
NWP-3a
15
11
12
168
0.333
CNSHA Shanghai (Shihu) Shanghai
China
NWP-3a
15
11
12
168
0.333
CNTXG Tianjinxingang (Xingang) Tianjin
China
NWP-4a
11
11
12
164
0.325
TWKHH Kaohsiung
Taiwan Province of China
NWP-2
11
10
12
161
0.319
ESTAR
Tarragona
Spain
MED-II
18
5
12
153
0.304
FRMRS
Caronte (Marseilles)
France
MED-II
18
5
12
153
0.304
FRFOS
Fos sur Mer
France
MED-II
18
5
12
153
0.304
GRKLX Kalamata
Greece
MED-IV
18
5
12
153
0.304
LYMRA Misurata
Lybian Arab Jamahiriya
MED-IV
18
5
12
153
0.304
ITGOA
Genoa
Italy
MED-II
18
5
12
153
0.304
ITSPE
La Spezia
Italy
MED-II
18
5
12
153
0.304
ITSVN
Savona
Italy
MED-II
18
5
12
153
0.304
ESCRS
Carboneras
Spain
MED-II
18
5
12
153
0.304
ITTAR
Taranto
Italy
MED-IV
18
5
12
153
0.304
ITPVE
Porto Vesme (Portoscuso)
Italy
MED-II
18
5
12
153
0.304
ITNAP
Napoli
Italy
MED-III
17
5
12
152
0.302
ITPIO
Piombino
Italy
MED-III
17
5
12
152
0.302
FRMTX Montoir
France
NEA-IV
21
9
10
148
0.294
ESCAD
Cadiz
Spain
NEA-V
20
9
10
147
0.292
PTLIS
Lisboa
Portugal
NEA-V
20
9
10
147
0.292
ESGIJ
Gijon
Spain
NEA-V
20
9
10
147
0.292
ESSCI
San Ciprian
Spain
NEA-V
20
9
10
147
0.292
ESBIO
Bilbao
Spain
NEA-V
20
9
10
147
0.292
PTSET
Setubal
Portugal
NEA-V
20
9
10
147
0.292
PTSIE
Sines
Portugal
NEA-V
20
9
10
147
0.292
BEGNE
Ghent/Gent
Belgium
NEA-II
22
8
10
146
0.290
GBBRS
Bristol
United Kingdom
NEA-III
19
9
10
146
0.290
GBLIV
Liverpool
United Kingdom
NEA-II
22
8
10
146
0.290
GBPTB
Port Talbot
United Kingdom
NEA-III
19
9
10
146
0.290
UYMVD Montevideo
Uruguay
SA-IIA
28
6
10
146
0.290
NLRTM Rotterdam
Netherlands
NEA-II
22
8
10
146
0.290
NLIJM
IJmuiden
Netherlands
NEA-II
22
8
10
146
0.290
NLAMS Amsterdam
Netherlands
NEA-II
22
8
10
146
0.290
GBIMM Immingham
United Kingdom
NEA-II
22
8
10
146
0.290
NLVLI
Flushing (Vlissingen)
Netherlands
NEA-II
22
8
10
146
0.290
FRBES
Brest
France
NEA-III
19
9
10
146
0.290
BRRIG
Rio Grande
Brazil
SA-IIA
28
6
10
146
0.290
GBTEE
Teesport (Middlesbrough)
United Kingdom
NEA-II
22
8
10
146
0.290
DEHAM Hamburg
Germany Federal Republic
NEA-II
22
8
10
146
0.290
IEMOT
Moneypoint
Ireland
NEA-III
19
9
10
146
0.290
GB001
Burry Port
United Kingdom
NEA-III
19
9
10
146
0.290
FRDKK Dunkerque
France
NEA-II
22
8
10
146
0.290
BEANR Antwerpen
Belgium
NEA-II
22
8
10
146
0.290
SEGOT
Gothenburg (Göteborg)
Sweden
B-II
22
8
10
146
0.290
GBHST
Hunterston
United Kingdom
NEA-II
22
8
10
146
0.290
BRPOA
Porto Alegre
Brazil
SA-IIA
28
6
10
146
0.290
GBRER
Redcar
United Kingdom
NEA-II
22
8
10
146
0.290
DKFRC
Fredericia
Denmark
B-III
21
8
10
145
0.288
DKENS
Enstedvaerkets Havn
Denmark
B-III
21
8
10
145
0.288
EGEDK El Dekheila
Egypt
MED-V
18
5
11
143
0.284
EGDAM Damietta
Egypt
MED-V
18
5
11
143
0.284
ILHFA
Haifa
Israel
MED-V
18
5
11
143
0.284
ILHAD
Hadera
Israel
MED-V
18
5
11
143
0.284
ILASH
Ashdod
Israel
MED-V
18
5
11
143
0.284
ITRAN
Ravenna
Italy
MED-VII
17
5
11
142
0.282
ITTRS
Trieste
Italy
MED-VII
17
5
11
142
0.282
SIKOP
Koper
Slovenia
MED-VII
17
5
11
142
0.282
TRIZM
Izmir (Smyrna)
Turkey
MED-VI
17
5
11
142
0.282
GRMIL
Milaki
Greece
MED-VI
17
5
11
142
0.282
GREEU
Eleusis
Greece
MED-VI
17
5
11
142
0.282
GIGIB
Gibraltar
Gibraltar
MED-I
17
5
11
142
0.282
GRPIR
Piraeus
Greece
MED-VI
17
5
11
142
0.282
ESALG
Algeciras
Spain
MED-I
17
5
11
142
0.282
BRIBB
Imbituba
Brazil
SA-IIB
21
5
10
136
0.270
BRSSO
Săo Sebastiao
Brazil
SA-IIB
21
5
10
136
0.270
BRSSZ
Santos
Brazil
SA-IIB
21
5
10
136
0.270
BRSFS
Sao Francisco do Sul
Brazil
SA-IIB
21
5
10
136
0.270
BRTRM Tramandai
Brazil
SA-IIB
21
5
10
136
0.270
BRPNG
Paranagua
Brazil
SA-IIB
21
5
10
136
0.270
49
Ballast Water Risk Assessment, Port of Sepetiba, Federal Republic of Brazil, December 2003: Final Report
Table 7 (cont'd). Ranking of BW source ports identified for Port of Sepetiba, according to the size of their risk
species threat (C4)
No. of
Knwn
Total
Suspected
Relative Risk Species
Port Code
Source Port
Country
Bio-Region
Introduced
Harmful
Threat
Harmful Species
Threat (C4)
Species
Species
Value
BRRIO
Rio de Janeiro
Brazil
SA-IIB
21
5
10
136
0.270
ROMAG Mangalia
Romania
MED-IXB
15
5
9
120
0.238
UADNB Dnepro-Bugsky
Ukraine
MED-IXB
15
5
9
120
0.238
ROCND Constanta
Romania
MED-IXB
15
5
9
120
0.238
ZASDB
Saldanha Bay
South Africa
WA-IV
14
3
9
113
0.224
USLGB
Long Beach California
United States
NEP-VI
35
5
6
110
0.218
INBED
Bedi
India
CIO-I
8
14
6
110
0.218
MXLZC Lazaro Cardenas
Mexico
NEP-VIII
35
5
6
110
0.218
USSAN
San Diego California
United States
NEP-VI
35
5
6
110
0.218
TRERE
Eregli
Turkey
MED-IXA
14
5
7
99
0.196
BGBOJ
Bourgas
Bulgaria
MED-IXA
14
5
7
99
0.196
ZARCB
Richards Bay
South Africa
WA-V
13
3
7
92
0.183
TH001
Bang Saphan
Thailand
EAS-I
6
6
6
84
0.167
MYLUM Lumut
Malaysia
EAS-VI
6
6
6
84
0.167
SGSIN
Singapore
Singapore
EAS-VI
6
6
6
84
0.167
BRBEL
Belem
Brazil
SA-IV
8
4
6
80
0.159
BRALU Alumar
Brazil
SA-IV
8
4
6
80
0.159
BRSLZ
Săo Luis
Brazil
SA-IV
8
4
6
80
0.159
BRFOR
Fortaleza
Brazil
SA-IV
8
4
6
80
0.159
BRMGU Munguba
Brazil
SA-IV
8
4
6
80
0.159
BRNAT Natal
Brazil
SA-IV
8
4
6
80
0.159
BRVDC Vila Do Conde
Brazil
SA-IV
8
4
6
80
0.159
USNEN
Norfolk-Newport News Virginia
United States
NA-ET3
10
3
6
79
0.157
USBAL
Baltimore Maryland
United States
NA-ET3
10
3
6
79
0.157
USILG
Wilmington Delaware
United States
NA-ET3
10
3
6
79
0.157
USPHF
Hampton Roads
United States
NA-ET3
10
3
6
79
0.157
AWSNL San Nicolas
Aruba
CAR-III
8
3
6
77
0.153
COSMR Santa Marta
Colombia
CAR-III
8
3
6
77
0.153
VEMAR Maracaibo
Venezuela
CAR-III
8
3
6
77
0.153
COBAQ Barranquilla
Colombia
CAR-III
8
3
6
77
0.153
SRPBM
Paramaribo
Suriname
CAR-VI
8
3
6
77
0.153
COCTG Cartagena
Colombia
CAR-III
8
3
6
77
0.153
SRPRM
Paranam
Suriname
CAR-VI
8
3
6
77
0.153
TTCHA Chaguaramas
Trinidad and Tobago
CAR-III
8
3
6
77
0.153
VELAG La Guaira
Venezuela
CAR-III
8
3
6
77
0.153
TTPTS
Point Lisas
Trinidad and Tobago
CAR-III
8
3
6
77
0.153
VEGUT Guanta
Venezuela
CAR-III
8
3
6
77
0.153
VEPBL
Puerto Cabello
Venezuela
CAR-III
8
3
6
77
0.153
BRARB Aratu
Brazil
SA-III
7
4
4
59
0.117
AEDXB Dubai
United Arab Emirates
AG-5
1
6
4
59
0.117
BRVIX
Vitoria
Brazil
SA-III
7
4
4
59
0.117
BRTUB
Tubarao
Brazil
SA-III
7
4
4
59
0.117
BRPRM Praia Mole
Brazil
SA-III
7
4
4
59
0.117
BRSSA
Salvador
Brazil
SA-III
7
4
4
59
0.117
BRREC
Recife
Brazil
SA-III
7
4
4
59
0.117
Sept Iles (Seven Is.) Quebec (Pointe
CASEI
Canada
NA-S3
7
3
3
46
0.091
Noire)
USGFT
Gulfport
United States
CAR-I
5
3
3
44
0.087
USBPT
Beaumont
United States
CAR-I
5
3
3
44
0.087
USTXT
Texas City Texas
United States
CAR-I
5
3
3
44
0.087
MXTAM Tampico
Mexico
CAR-I
5
3
3
44
0.087
USMOB Mobile Alabama
United States
CAR-I
5
3
3
44
0.087
USMSY New Orleans
United States
CAR-I
5
3
3
44
0.087
USBRO
Brownsville Texas
United States
CAR-I
5
3
3
44
0.087
USDVT
Davant
United States
CAR-I
5
3
3
44
0.087
AUGLT Gladstone
Australia
AUS-XII
10
1
3
43
0.085
AUPDT Dalrymple Bay
Australia
AUS-XII
10
1
3
43
0.085
AUHPT Hay Point
Australia
AUS-XII
10
1
3
43
0.085
IDTBA
Tanjung Bara Coal Terminal
Indonesia
EAS-II
2
3
1
21
0.042
ARCMP Campana
Argentina
SA-IIA-RP
0
0
1
10
0.020
ARROS
Rosario
Argentina
SA-IIA-RP
0
0
1
10
0.020
ARZAE Zarate
Argentina
SA-IIA-RP
0
0
1
10
0.020
PESVY
Salaverry
Peru
SEP-C
3
1
0
6
0.012
PEPCH
Puerto Chicama
Peru
SEP-C
3
1
0
6
0.012
PECLL
Callao
Peru
SEP-C
3
1
0
6
0.012
ARPMY Puerto Madryn
Argentina
SA-I
0
1
0
3
0.006
NGPHC Port Harcourt
Nigeria
WA-II
0
0
0
0
0.000
AUPKL Port Kembla
Australia
AUS-X
0
0
0
0
0.000
BJCOO
Cotonou
Benin
WA-II
0
0
0
0
0.000
BRMAO Manaus
Brazil
SA-IV-AR
0
0
0
0
0.000
FIPOR
Pori
Finland
B-XI
0
0
0
0
0.000
CIABJ
Abidjan
Ivory Coast
WA-II
0
0
0
0
0.000
ESLPA
Las Palmas
Spain
WA-I
0
0
0
0
0.000
CLCHA Chacabuco
Chile
SEP-A'
0
0
0
0
0.000
COBUN Buenaventura
Colombia
SEP-I
0
0
0
0
0.000
NGONN Onne
Nigeria
WA-II
0
0
0
0
0.000
50
4 Results
Table 8. Status of risk species assigned to the bioregions of Sepetiba (SAII-B)
Group
Common Name
Species Name
Regional Status
Threat Status
Bacillariophyta
Pennate diatom
Pseudonitzschia australis
Cryptogenic
Known harmful species
Bacillariophyta
Pennate diatom
Pseudonitzschia delicatissima
Cryptogenic
Known harmful species
Bacillariophyta
Pennate diatom
Pseudonitzschia pseudodelicatissima
Cryptogenic
Known harmful species
Bacillarriophyta/Centricae
Centric diatom
Coscinodiscus wailesii
Introduced
Known harmful species
Bacillarriophyta/Centricae
Centric diatom
Odontella sinensis
Cryptogenic
Not suspected
Bacillarriophyta/Centricae
Centric diatom
Thallassiosira punctigera
Cryptogenic
Not suspected
Pyrrophyta/Dinophycae
Toxic dinoflagellate
Ceratium furca
Native
Known harmful species
Pyrrophyta/Dinophycae
Toxic dinoflagellate
Dinophysis acuminata
Native
Known harmful species
Pyrrophyta/Dinophycae
Toxic dinoflagellate
Gymnodinium catenatum
Introduced
Known harmful species
Pyrrophyta/Dinophycae
Toxic dinoflagellate
Gyrodinium aureolum
Cryptogenic
Known harmful species
Raphidophycea
Raphidophyte
Heterosigma akashiwo
Introduced
Known harmful species
Platyhelminthes
Flatworm
Turbellarid sp.
Introduced
Not suspected
Cnidaria
Octocoral
Stereonephythya aff. curvata
Introduced
Not suspected
Cnidaria
Sea anemone
Paracondylactis hertwigi
Cryptogenic
Not suspected
Cnidaria
Organ pipe coral
Tubastraea coccinea
Introduced
Not suspected
Cnidaria
Organ pipe coral
Tubastraea tagusensis
Introduced
Not suspected
Annelida
Brazilian serpulid worm
Hydroides sp.
Cryptogenic
Suspected harmful species
Annelida
Sabellid fan worm
Sabella spallanzanii
Introduced
Known harmful species
Annelida
Spionid worm
Streblospio benedicti
Introduced
Not suspected
Arthropoda
Copepod
Paracyclopina longifurca
Cryptogenic
Not suspected
Arthropoda
Copepod
Pseudodiaptomus tritamatus
Cryptogenic
Not suspected
Arthropoda
Sea Lice
Paracerceis sculpta
Introduced
Not suspected
Arthropoda
Asian slater
Synidotea laevidorsalis
Introduced
Not suspected
Arthropoda
Barnacle
Balanus venustus
Cryptogenic
Not suspected
Arthropoda
Barnacle
Balanus reticulatus
Introduced
Suspected harmful species
Arthropoda
Barnacle
Chirona amaryllis
Cryptogenic
Suspected harmful species
Arthropoda
Barnacle
Chthamalus proteus
Native
Suspected harmful species
Arthropoda
Giant Barnacle
Megabalanus coccopoma
Introduced
Suspected harmful species
Arthropoda
Shrimp
Metapenaeus monoceros
Introduced
Not suspected
Arthropoda
Alpheid shrimp
Alpheus houvieri, A. heterochaelis
Native
Not suspected
Arthropoda
Green tanaid shrimp
Leptochelia dubia
Introduced
Not suspected
Arthropoda
Prawn
Penaeus japonicus
Introduced
Not suspected
Arthropoda
Prawn
Penaeus monodon
Introduced
Not suspected
Arthropoda
Burrowing xanthid crab
Rhithropanopeus harrisii
Introduced
Not suspected
Arthropoda
Asian grapsid crab
Pachygrapsus gracilis
Cryptogenic
Suspected harmful species
Arthropoda
Swimming crab
Charybdis hellerii
Introduced
Known harmful species
Arthropoda
Mud crab
Scylla serrata
Introduced
Not suspected
Ectoprocta/Ctenostomata
Sea moss (Bryozoan)
Amathia distans
Native
Not suspected
Ectoprocta/Ctenostomata
Sea Moss (Bryozoan)
Bowerbankia caudata
Cryptogenic
Not suspected
Ectoprocta/Cheilostomata
Sea Moss (Bryozoan)
Buskia socialis
Cryptogenic
Not suspected
Ectoprocta/Cheilostomata
Sea moss (Bryozoan)
Watersipora cucullata
Cryptogenic
Not suspected
Ectoprocta/Ctenostomata
Sea Moss (Bryozoan)
Zoobotryon pellucidum
Cryptogenic
Not suspected
Mollusca
Teredinid bivalve
Bankia carinata
Cryptogenic
Not suspected
Mollusca
Teredinid bivalve
Bankia fimbriatula
Cryptogenic
Not suspected
Mollusca
Teredinid bivalve
Bankia gouldi
Cryptogenic
Not suspected
Mollusca
Teredinid bivalve
Lyrodus floridanus
Cryptogenic
Not suspected
Mollusca
Teredinid bivalve
Lyrodus massa
Cryptogenic
Not suspected
Mollusca
Boring bivalve
Nototeredo knoxi
Cryptogenic
Not suspected
Mollusca
Mussel
Isognomon bicolor
Introduced
Suspected harmful species
Mollusca
Brown mussel
Perna perna
Introduced
Known harmful species
Mollusca
Bivalve
Martesia striata
Cryptogenic
Not suspected
Mollusca
Boring bivalve
Teredo bartschi
Cryptogenic
Not suspected
Mollusca
Boring bivalve
Teredo furcifera
Cryptogenic
Not suspected
Mollusca
Polycerid nudibranch
Thecacera pennigera
Cryptogenic
Not suspected
Mollusca
Tergepedid nudibranch
Tenellia adspersa
Introduced
Not suspected
Mollusca
Marine snail
Limacina cf. inflata
Cryptogenic
Not suspected
Urochordata
Colonial sea squirt (tunicate)
Botrylloides nigrum
Cryptogenic
Not suspected
Urochordata
Sea Vase (tunicate)
Ciona intestinalis
Introduced
Not suspected
Urochordata
Sea Squirt (Tunicate)
Didemnum ahu
Cryptogenic
Not suspected
Urochordata
Sea Squirt (Tunicate)
Didemnum apersum
Cryptogenic
Not suspected
Urochordata
Sea Squirt (Tunicate)
Didemnum granulatum
Cryptogenic
Not suspected
Urochordata
Sea Squirt (Tunicate)
Herdmania momus
Cryptogenic
Not suspected
Urochordata
Sea Squirt (Tunicate)
Microcosmus exasperatus
Cryptogenic
Not suspected
Urochordata
Sea Squirt (Tunicate)
Polyandrocarpa zorritensis
Cryptogenic
Not suspected
Urochordata
Sea Squirt (Tunicate)
Stomozoa gigantea
Cryptogenic
Not suspected
Urochordata
Sea Squirt (Tunicate)
Styela canopus
Cryptogenic
Not suspected
51
Ballast Water Risk Assessment, Port of Sepetiba, Federal Republic of Brazil, December 2003: Final Report
4.8
Risk assessment results
The database calculates the relative overall risk (ROR) of a potentially harmful introduction for all
source ports that have C1-C4 coefficients and R1-R2 factors. The ROR value for each source port
represents a proportion of the threat posed to the Demonstration Site as result of its contemporary
trading pattern (1998-2002).
After calculating the RORs the database generates a large output table listing the source ports and
their coefficients, risk-reduction factors and ROR value. It also contains the five categories of ROR
used by the GIS plot, and the standardised ROR values (S-ROR; Section 3.10). Results from the
project-standard BWRA for the Port of Sepetiba are listed in Table 9, and the GIS plot of the ROR
categories is shown in Figure 24.
From the 919 visit records in the database, the project standard identified 20 of the 148 source ports as
representing the highest risk group (in terms of their BW source frequency, volume, environmental
similarity and assigned risk species). These ports, all of which were Brazilian, provided the top 20%
of the total ROR, with individual values in the 0.20-0.29 range (Table 9). The highest risk ports were
led by Santos (ROR = 0.290; S-ROR = 1.0) and Rio de Janeiro (ROR = 0.285; S-ROR = 0.98),
followed by Rio Grande and Praia Mole with almost the same risk values (ROR = 0.248; S-ROR
0.82).
The first non-Brazilian ports were Montevideo (Uruguay) and Rotterdam (Netherlands). These was
grouped as High Risk ports and ranked 22nd and 23rd overall, both with RORs very close to 0.202 (S-
ROR = 0.63; Table 9). The first highest risk ports beyond the Atlantic region were the Mediterranean
ports of Taranto in Italy (ROR = 0.201; S-ROR =0.63) and Koper in Slovenia (ROR = 0.199; S-ROR
= 0.62). The highest risk port beyond the Atlanto-Mediterranean area was the Pacific coast Mexican
port of Lazaro Cardenas (ranked 42nd with a high risk ROR of 0.183 (S-ROR = 0.55; Table 9).
The 75 source ports in the low (31) and lowest (44) risk categories were generally a mixture of cool
and very warm water ports, plus river/brackish ports with a wide distribution. The source port with the
lowest ROR (0.051; S-ROR = 0) was the cool temperate port of Puerto Madryn in southern Argentina
(Table 9).
Based on the current pattern of shipping trade (1998-2002), the ROR results indicate BW from vessels
arriving from ports in temperate to cool temperate areas present much less of threat to Sepetiba than
those from Brazil and the southern European ports, with the exception of Rotterdam (north-west
Europe) and Lazaro Cardenas (Mexico; Figure 24, Table 9). In the case of the latter, their C1-C4
coefficients show that it is the relatively high BW discharge frequency and volume from Rotterdam
and the relatively high environmental similarity estimated for Lazaro (C3 = 0.6), which lifts them into
the High risk group. In the case of the Brazilian ports, their relatively close environmental similarities
(both calculated and estimated) and in many cases regular BW sources made them dominate the
highest risk group.
The risk results in Table 9 and plots in Figure 24 indicate there is a much higher threat of BW-
mediated introductions posed by vessels arriving in ballast from many Brazilian and southern
European ports, and this is logical given Sepetiba's biogeographic location and current pattern of
trade. The results also suggest that the project standard `first-pass' treatment of the risk coefficients
provides a reasonable benchmark for any investigative manipulations of the risk formula or database
management.
The project standard results also imply that any introduced species which establishes in one of the
many small and large ports along the Brazilian coastline could be readily spread by coastal shipping,
and it would be very worth to obtain port environmental data for many of these ports to allow their C3
coefficient to be calculated rather than estimated for the assessment reported here.
52
4 Results
While the tropical and subtropical coastline of Brazil does not appear to be experiencing the level of
harmful invasive species recently reported for the cooler Uruguayan and Argentinean waters
(Orensanz et al. 2002), the number of introduced and cryptogenic toxic dinoflagellates in Table 9
shows that Brazil is not immune to the spread of harmful marine species. These phytoplankton could
increase the severity of red tides in or close to several of the large and gradually eutrophying coastal
bays and lagoons of Brazil.
For a largely tropical country with a high number of brackish and estuarine ports, the issue of water-
borne tropical pathogens such as cholera, typhus and yellow fever and parasites that are widely
present in South America also needs to be remembered, and their almost virtual absence from the risk
species database highlights the fragility of the C4 coefficient and the problem of performing `reverse'
BW risk assessments.
Figure 25 shows the frequency distribution of the standardised ROR values. The two small peaks on
the right side of the plot reflects the gaps between the most highest risk ports (Santos and Rio de
Janeiro, then the next eight ports), while the lower risk ports form an uninterrupted tail to the left side
of the plot.
Figure 24. GIS output showing the location and categories of relative overall risk (ROR) of source ports identified
for the Port of Sepetiba
Distribution of Standardised ROR values (S-RORs)
25
20
15
10
Frequency
5
0
0.00
0.10
0.20
0.30
0.40
0.50
0.60
0.70
0.80
0.90
1.00
S-ROR Value
Figure 25. Frequency distribution of the standardised ROR values
53
Ballast Water Risk Assessment, Port of Sepetiba, Federal Republic of Brazil, December 2003: Final Report
Table 9. BW source ports reported for the Port of Sepetiba, ranked according to their Relative Overall Risk
(ROR)
Min.
Max. Tank
Relative
% of
C1 BW
C2 BW
Tank
C3 Env.
C4 Risk
Port Code
Source Port
Country
Disch
R1
R2
Overall
Total
Freq
Vol
Stor.
Match
Spp.
(MT)
Risk (ROR)
Risk
(d)
Estimated
Cumulative
Percentage
Risk Category
Standrdisd
ROR
BRSSZ
Santos
Brazil
0.0440
0.0716
65,688 1.0
2
1.0
0.776
0.270
0.290
1.21
1.21
Highest
1.00
BRRIO
Rio de Janeiro
Brazil
0.0075
0.0028
22,837 1.0
0
1.0
0.861
0.270
0.285
1.19
2.41
Highest
0.98
BRRIG
Rio Grande
Brazil
0.0009
0.0027
28,877 1.0
2
1.0
0.700
Y
0.290
0.248
1.04
3.44
Highest
0.82
BRPRM
Praia Mole
Brazil
0.0412
0.0361
55,175 1.0
1
1.0
0.799
0.117
0.248
1.04
4.48
Highest
0.82
BRPOA
Porto Alegre
Brazil
0.0009
0.0000
504 0.8
3
1.0
0.700
Y
0.290
0.248
1.04
5.52
Highest
0.82
BRPNG
Paranagua
Brazil
0.0028
0.0004
1,816 1.0
1
1.0
0.717
0.270
0.248
1.03
6.55
Highest
0.82
BRSFS
Sao Francisco do Sul
Brazil
0.0019
0.0076
53,430 1.0
1
1.0
0.700
Y
0.270
0.245
1.02
7.58
Highest
0.81
BRTRM
Tramandai
Brazil
0.0009
0.0026
27,904 1.0
2
1.0
0.700
Y
0.270
0.243
1.02
8.59
Highest
0.80
BRSSO
Săo Sebastiao
Brazil
0.0009
0.0023
24,999 1.0
0
1.0
0.700
Y
0.270
0.243
1.02
9.61
Highest
0.80
BRIBB
Imbituba
Brazil
0.0009
0.0001
1,480 1.0
2
1.0
0.700
Y
0.270
0.243
1.01
10.63
Highest
0.80
BRSSA
Salvador
Brazil
0.0337
0.0562
59,400 1.0
2
1.0
0.725
0.117
0.233
0.97
11.60
Highest
0.76
BRTUB
Tubarao
Brazil
0.0019
0.0046
48,166 1.0
1
1.0
0.791
0.117
0.229
0.96
12.56
Highest
0.74
BRVIX
Vitoria
Brazil
0.0084
0.0220
67,103 1.0
1
1.0
0.738
0.117
0.221
0.93
13.48
Highest
0.71
BRNAT
Natal
Brazil
0.0037
0.0124
47,889 1.0
4
1.0
0.700
Y
0.159
0.219
0.91
14.40
Highest
0.70
BRVDC
Vila Do Conde
Brazil
0.0187
0.0082
58,297 1.0
7
0.8
0.700
Y
0.159
0.213
0.89
15.29
Highest
0.68
BRALU
Alumar
Brazil
0.0140
0.0046
25,227 1.0
6
0.8
0.700
Y
0.159
0.211
0.88
16.17
Highest
0.67
BRFOR
Fortaleza
Brazil
0.0056
0.0098
54,807 1.0
5
0.8
0.700
Y
0.159
0.211
0.88
17.05
Highest
0.67
BRMGU Munguba
Brazil
0.0028
0.0053
54,464 1.0
8
0.8
0.700
Y
0.159
0.209
0.87
17.93
Highest
0.66
BRBEL
Belem
Brazil
0.0019
0.0058
31,335 1.0
7
0.8
0.700
Y
0.159
0.209
0.87
18.80
Highest
0.66
BRREC
Recife
Brazil
0.0009
0.0024
25,629 1.0
3
1.0
0.700
Y
0.117
0.205
0.86
19.65
Highest
0.64
BRARB
Aratu
Brazil
0.0009
0.0001
1,444 1.0
2
1.0
0.700
Y
0.117
0.205
0.86
20.51
High
0.64
UYMVD Montevideo
Uruguay
0.0019
0.0050
29,353 1.0
3
1.0
0.512
0.290
0.202
0.84
21.35
High
0.63
NLRTM
Rotterdam
Netherlands
0.0899
0.1336
107,600 1.0
6
0.8
0.351
0.290
0.202
0.84
22.20
High
0.63
ITTAR
Taranto
Italy
0.0122
0.0086
12,358 1.0
17
0.6
0.603
0.304
0.201
0.84
23.04
High
0.63
SIKOP
Koper
Slovenia
0.0056
0.0042
10,980 1.0
18
0.6
0.619
0.282
0.199
0.83
23.87
High
0.62
BRSLZ
Săo Luis
Brazil
0.0009
0.0003
3,196 1.0
10
0.6
0.700
Y
0.159
0.199
0.83
24.71
High
0.62
ESCRS
Carboneras
Spain
0.0037
0.0099
54,403 1.0
7
0.8
0.538
Y
0.304
0.199
0.83
25.54
High
0.62
ITTRS
Trieste
Italy
0.0009
0.0001
584 0.8
18
0.6
0.622
0.282
0.198
0.83
26.36
High
0.61
ITSVN
Savona
Italy
0.0047
0.0017
5,866 1.0
18
0.6
0.600
Y
0.304
0.197
0.82
27.19
High
0.61
LYMRA Misurata
Lybian Arab Jamahiriya
0.0009
0.0025
27,197 1.0
16
0.6
0.600
Y
0.304
0.196
0.82
28.01
High
0.61
ESGIJ
Gijon
Spain
0.0253
0.0227
27,964 1.0
10
0.6
0.552
0.292
0.194
0.81
28.82
High
0.60
GIGIB
Gibraltar
Gibraltar
0.0197
0.0245
56,619 1.0
13
0.6
0.561
0.282
0.193
0.81
29.63
High
0.59
ITRAN
Ravenna
Italy
0.0009
0.0029
31,335 1.0
18
0.6
0.596
0.282
0.192
0.80
30.43
High
0.59
NLIJM
IJmuiden
Netherlands
0.0421
0.0404
52,848 1.0
8
0.8
0.447
0.290
0.190
0.80
31.23
High
0.58
ESTAR
Tarragona
Spain
0.0028
0.0017
8,706 1.0
15
0.6
0.567
0.304
0.188
0.79
32.02
High
0.57
FRFOS
Fos sur Mer
France
0.0215
0.0281
47,380 1.0
15
0.6
0.516
0.304
0.187
0.78
32.80
High
0.57
GRMIL
Milaki
Greece
0.0131
0.0080
11,229 1.0
18
0.6
0.554
Y
0.282
0.186
0.78
33.57
High
0.56
GREEU
Eleusis
Greece
0.0009
0.0000
130 0.6
17
0.6
0.570
0.282
0.185
0.77
34.35
High
0.56
ESBIO
Bilbao
Spain
0.0019
0.0002
1,374 1.0
15
0.6
0.562
0.292
0.185
0.77
35.12
High
0.56
GRKLX
Kalamata
Greece
0.0009
0.0015
16,708 1.0
17
0.6
0.550
Y
0.304
0.184
0.77
35.89
High
0.55
ESCAD
Cadiz
Spain
0.0056
0.0021
8,609 1.0
10
0.6
0.550
Y
0.292
0.183
0.77
36.65
High
0.55
MXLZC
Lazaro Cardenas
Mexico
0.0009
0.0001
552 0.8
18
0.6
0.600
Y
0.218
0.183
0.76
37.42
High
0.55
ESSCI
San Ciprian
Spain
0.0037
0.0018
11,335 1.0
14
0.6
0.550
Y
0.292
0.183
0.76
38.18
High
0.55
PTSIE
Sines
Portugal
0.0178
0.0158
19,426 1.0
10
0.6
0.521
0.292
0.183
0.76
38.95
High
0.55
PTSET
Setubal
Portugal
0.0019
0.0029
18,321 1.0
13
0.6
0.550
Y
0.292
0.182
0.76
39.71
High
0.55
ITSPE
La Spezia
Italy
0.0028
0.0008
4,574 1.0
22
0.4
0.600
Y
0.304
0.181
0.76
40.47
Medium
0.54
GRPIR
Piraeus
Greece
0.0028
0.0031
24,961 1.0
18
0.6
0.546
0.282
0.180
0.75
41.22
Medium
0.54
ZARCB
Richards Bay
South Africa
0.0150
0.0043
28,861 1.0
13
0.6
0.589
0.183
0.180
0.75
41.97
Medium
0.54
ZASDB
Saldanha Bay
South Africa
0.0009
0.0001
570 0.8
10
0.6
0.583
0.224
0.180
0.75
42.72
Medium
0.54
AUPPI
Port Pirie
Australia
0.0009
0.0001
1,283 1.0
27
0.4
0.565
0.379
0.179
0.75
43.47
Medium
0.54
CIABJ
Abidjan
Ivory Coast
0.0122
0.0024
12,189 1.0
9
0.8
0.700
Y
0.000
0.179
0.75
44.22
Medium
0.53
CNNBO
Beilun
China
0.0009
0.0002
1,645 1.0
34
0.4
0.580
0.333
0.179
0.75
44.96
Medium
0.53
FRMRS
Caronte (Marseilles)
France
0.0009
0.0001
1,483 1.0
15
0.6
0.527
0.304
0.178
0.74
45.71
Medium
0.53
USNEN
Norfolk-Newport News Virginia
United States
0.0084
0.0077
29,328 1.0
15
0.6
0.596
0.157
0.177
0.74
46.44
Medium
0.52
BRMAO Manaus
Brazil
0.0009
0.0023
25,070 1.0
10
0.6
0.700
Y
0.000
0.176
0.74
47.18
Medium
0.52
ESALG
Algeciras
Spain
0.0056
0.0117
50,344 1.0
13
0.6
0.515
0.282
0.175
0.73
47.91
Medium
0.52
SGSIN
Singapore
Singapore
0.0009
0.0001
1,392 1.0
28
0.4
0.630
0.167
0.174
0.73
48.64
Medium
0.51
TTPTS
Point Lisas
Trinidad and Tobago
0.0028
0.0029
28,869 1.0
10
0.6
0.600
Y
0.153
0.174
0.73
49.37
Medium
0.51
TTCHA
Chaguaramas
Trinidad and Tobago
0.0047
0.0007
1,702 1.0
15
0.6
0.600
Y
0.153
0.174
0.73
50.10
Medium
0.51
USPHF
Hampton Roads
United States
0.0112
0.0040
28,763 1.0
15
0.6
0.587
0.157
0.174
0.73
50.83
Medium
0.51
ITGOA
Genoa
Italy
0.0094
0.0029
25,052 1.0
16
0.6
0.501
0.304
0.174
0.73
51.55
Medium
0.51
PTLIS
Lisboa
Portugal
0.0009
0.0000
487 0.6
13
0.6
0.515
0.292
0.173
0.72
52.28
Medium
0.51
ITPVE
Porto Vesme (Portoscuso)
Italy
0.0028
0.0002
1,022 1.0
15
0.6
0.500
Y
0.304
0.171
0.72
52.99
Medium
0.50
FRMTX
Montoir
France
0.0047
0.0020
8,468 1.0
16
0.6
0.500
Y
0.294
0.171
0.71
53.71
Medium
0.50
ITNAP
Napoli
Italy
0.0009
0.0001
932 0.8
18
0.6
0.500
Y
0.302
0.170
0.71
54.42
Medium
0.50
ITPIO
Piombino
Italy
0.0009
0.0001
706 0.8
15
0.6
0.500
Y
0.302
0.170
0.71
55.13
Medium
0.50
TH001
Bang Saphan
Thailand
0.0009
0.0010
10,773 1.0
30
0.4
0.600
Y
0.167
0.167
0.70
55.83
Medium
0.48
USTXT
Texas City Texas
United States
0.0094
0.0137
64,307 1.0
16
0.6
0.591
0.087
0.167
0.70
56.53
Medium
0.48
CNTXG
Tianjinxingang (Xingang) Tianjin
China
0.0206
0.0101
28,878 1.0
32
0.4
0.500
Y
0.325
0.165
0.69
57.22
Medium
0.48
MXTAM Tampico
Mexico
0.0009
0.0001
1,487 1.0
16
0.6
0.600
Y
0.087
0.163
0.68
57.90
Medium
0.47
TWKHH Kaohsiung
Taiwan Province of China
0.0009
0.0001
789 0.8
32
0.4
0.520
0.319
0.162
0.68
58.58
Medium
0.46
54
4 Results
Table 9 (cont'd). BW source ports reported for the Port of Sepetiba, ranked according to their Relative Overall
Risk (ROR)
Min.
Max. Tank
Relative
% of
C1 BW
C2 BW
Tank
C3 Env.
C4 Risk
Port Code
Source Port
Country
Disch
R1
R2
Overall
Total
Freq
Vol
Stor.
Match.
Spp.
(MT)
Risk (ROR)
Risk
(d)
Estimated
Cumulative
Percentage
Risk Category
Standrdisd
ROR
EGEDK
El Dekheila
Egypt
0.0009
0.0027
28,869 1.0
19
0.6
0.473
0.284
0.162
0.68
60.61
Low
0.46
INBED
Bedi
India
0.0047
0.0027
25,121 1.0
24
0.4
0.550
Y
0.218
0.161
0.67
61.28
Low
0.46
COSMR
Santa Marta
Colombia
0.0019
0.0002
1,368 1.0
12
0.6
0.550
Y
0.153
0.161
0.67
61.95
Low
0.46
USSAN
San Diego California
United States
0.0047
0.0020
16,132 1.0
22
0.4
0.548
0.218
0.160
0.67
62.62
Low
0.46
GBBRS
Bristol
United Kingdom
0.0056
0.0070
37,677 1.0
19
0.6
0.450
Y
0.290
0.159
0.67
63.29
Low
0.45
GBHST
Hunterston
United Kingdom
0.0056
0.0130
27,583 1.0
23
0.4
0.500
0.290
0.159
0.66
63.95
Low
0.45
USLGB
Long Beach California
United States
0.0094
0.0139
55,745 1.0
22
0.4
0.524
0.218
0.159
0.66
64.62
Low
0.45
GBLIV
Liverpool
United Kingdom
0.0019
0.0056
58,808 1.0
16
0.6
0.450
Y
0.290
0.158
0.66
65.28
Low
0.45
TRIZM
Izmir (Smyrna)
Turkey
0.0019
0.0046
42,944 1.0
26
0.4
0.511
0.282
0.157
0.66
65.93
Low
0.44
COCTG
Cartagena
Colombia
0.0009
0.0001
876 0.8
13
0.6
0.537
0.153
0.157
0.66
66.59
Low
0.44
SRPRM
Paranam
Suriname
0.0009
0.0001
1,510 1.0
8
0.8
0.500
Y
0.153
0.156
0.65
67.24
Low
0.44
SRPBM
Paramaribo
Suriname
0.0009
0.0001
1,457 1.0
8
0.8
0.500
Y
0.153
0.156
0.65
67.89
Low
0.44
TRERE
Eregli
Turkey
0.0047
0.0048
40,118 1.0
20
0.4
0.534
0.196
0.156
0.65
68.54
Low
0.44
FRDKK
Dunkerque
France
0.0206
0.0491
76,687 1.0
12
0.6
0.374
0.290
0.154
0.65
69.19
Low
0.43
PESVY
Salaverry
Peru
0.0047
0.0049
47,971 1.0
16
0.6
0.600
Y
0.012
0.154
0.64
69.83
Low
0.43
AUPKL
Port Kembla
Australia
0.0009
0.0000
349 0.6
25
0.4
0.614
0.000
0.154
0.64
70.48
Low
0.43
AUHPT
Hay Point
Australia
0.0253
0.0203
51,486 1.0
25
0.4
0.529
0.085
0.152
0.64
71.11
Low
0.42
PEPCH
Puerto Chicama
Peru
0.0009
0.0001
1,509 1.0
15
0.6
0.600
Y
0.012
0.152
0.64
71.75
Low
0.42
PECLL
Callao
Peru
0.0281
0.0102
27,982 1.0
15
0.6
0.561
0.012
0.152
0.63
72.38
Low
0.42
BJCOO
Cotonou
Benin
0.0019
0.0012
7,864 1.0
11
0.6
0.600
Y
0.000
0.151
0.63
73.01
Low
0.42
VEGUT
Guanta
Venezuela
0.0037
0.0056
27,138 1.0
13
0.6
0.500
Y
0.153
0.150
0.63
73.64
Low
0.41
CLCHA
Chacabuco
Chile
0.0009
0.0001
601 0.8
9
0.8
0.600
Y
0.000
0.150
0.63
74.27
Low
0.41
DKFRC
Fredericia
Denmark
0.0009
0.0025
27,410 1.0
18
0.6
0.423
0.288
0.150
0.63
74.90
Low
0.41
VELAG
La Guaira
Venezuela
0.0019
0.0027
26,960 1.0
10
0.6
0.500
Y
0.153
0.149
0.62
75.52
Low
0.41
VEPBL
Puerto Cabello
Venezuela
0.0009
0.0001
1,374 1.0
11
0.6
0.500
Y
0.153
0.148
0.62
76.14
Low
0.40
VEMAR Maracaibo
Venezuela
0.0009
0.0001
1,250 1.0
12
0.6
0.500
Y
0.153
0.148
0.62
76.76
Low
0.40
DKENS
Enstedvaerkets Havn
Denmark
0.0009
0.0053
56,837 1.0
18
0.6
0.411
0.288
0.148
0.62
77.37
Low
0.40
GBRER
Redcar
United Kingdom
0.0047
0.0041
11,372 1.0
18
0.6
0.407
0.290
0.147
0.62
77.99
Low
0.40
AUGLT
Gladstone
Australia
0.0084
0.0063
28,520 1.0
25
0.4
0.537
0.085
0.146
0.61
78.60
Low
0.40
NLVLI
Flushing (Vlissingen)
Netherlands
0.0019
0.0001
674 0.8
16
0.6
0.408
0.290
0.146
0.61
79.21
Low
0.40
USMOB
Mobile Alabama
United States
0.0140
0.0125
58,906 1.0
16
0.6
0.505
0.087
0.146
0.61
79.82
Low
0.40
GBTEE
Teesport (Middlesbrough)
United Kingdom
0.0009
0.0001
1,509 1.0
17
0.6
0.407
0.290
0.145
0.61
80.43
Lowest
0.39
FRBES
Brest
France
0.0281
0.0019
1,603 1.0
21
0.4
0.435
0.290
0.145
0.61
81.04
Lowest
0.39
AUPDT
Dalrymple Bay
Australia
0.0056
0.0076
66,572 1.0
25
0.4
0.529
0.085
0.144
0.60
81.64
Lowest
0.39
MYLUM Lumut
Malaysia
0.0009
0.0001
581 0.8
63
0.2
0.535
0.167
0.142
0.60
82.24
Lowest
0.38
IEMOT
Moneypoint
Ireland
0.0140
0.0108
23,042 1.0
16
0.6
0.368
0.290
0.142
0.59
82.83
Lowest
0.38
USGFT
Gulfport
United States
0.0028
0.0006
3,763 1.0
16
0.6
0.500
Y
0.087
0.139
0.58
83.41
Lowest
0.37
COBUN
Buenaventura
Colombia
0.0009
0.0001
839 0.8
15
0.6
0.518
Y
0.000
0.130
0.54
83.95
Lowest
0.33
ESLPA
Las Palmas
Spain
0.0009
0.0000
51 0.4
11
0.6
0.515
0.000
0.129
0.54
84.49
Lowest
0.32
IDTBA
Tanjung Bara Coal Terminal
Indonesia
0.0122
0.0085
27,086 1.0
28
0.4
0.476
0.042
0.128
0.54
85.03
Lowest
0.32
CARBK
Roberts Bank
Canada
0.0047
0.0058
29,749 1.0
26
0.4
0.348
0.383
0.128
0.54
85.56
Lowest
0.32
CAVAN Vancouver British Columbia
Canada
0.0112
0.0093
35,477 1.0
26
0.4
0.336
0.383
0.127
0.53
86.10
Lowest
0.32
GBIMM
Immingham
United Kingdom
0.0187
0.0147
14,952 1.0
17
0.6
0.299
0.290
0.126
0.53
86.63
Lowest
0.31
USBRO
Brownsville Texas
United States
0.0009
0.0001
1,509 1.0
16
0.6
0.450
Y
0.087
0.126
0.53
87.15
Lowest
0.31
GBPTB
Port Talbot
United Kingdom
0.0009
0.0025
27,280 1.0
16
0.6
0.325
0.290
0.125
0.52
87.68
Lowest
0.31
GB001
Burry Port
United Kingdom
0.0084
0.0076
43,965 1.0
16
0.6
0.305
0.290
0.124
0.52
88.19
Lowest
0.30
ROCND
Constanta
Romania
0.0084
0.0086
16,500 1.0
21
0.4
0.380
0.238
0.123
0.51
88.71
Lowest
0.30
DEHAM Hamburg
Germany Federal Republic
0.0103
0.0084
23,167 1.0
15
0.6
0.295
0.290
0.122
0.51
89.22
Lowest
0.29
EGDAM Damietta
Egypt
0.0019
0.0023
24,757 1.0
19
0.6
0.303
0.284
0.119
0.50
89.72
Lowest
0.28
SEGOT
Gothenburg (Göteborg)
Sweden
0.0009
0.0001
789 0.8
17
0.6
0.300
Y
0.290
0.119
0.50
90.21
Lowest
0.28
ILHFA
Haifa
Israel
0.0009
0.0035
37,451 1.0
19
0.6
0.300
Y
0.284
0.119
0.50
90.71
Lowest
0.28
ROMAG Mangalia
Romania
0.0009
0.0017
18,026 1.0
21
0.4
0.376
0.238
0.118
0.50
91.20
Lowest
0.28
BGBOJ
Bourgas
Bulgaria
0.0028
0.0005
2,206 1.0
19
0.6
0.348
0.196
0.117
0.49
91.69
Lowest
0.28
NGONN Onne
Nigeria
0.0047
0.0008
1,908 1.0
15
0.6
0.463
0.000
0.117
0.49
92.18
Lowest
0.28
NLAMS
Amsterdam
Netherlands
0.0197
0.0125
19,582 1.0
12
0.6
0.254
0.290
0.115
0.48
92.66
Lowest
0.27
AEDXB
Dubai
United Arab Emirates
0.0009
0.0010
10,335 1.0
25
0.4
0.405
0.117
0.114
0.47
93.14
Lowest
0.26
BEANR
Antwerpen
Belgium
0.0112
0.0139
28,869 1.0
16
0.6
0.238
0.290
0.109
0.46
93.60
Lowest
0.24
USBPT
Beaumont
United States
0.0103
0.0031
24,961 1.0
16
0.6
0.364
0.087
0.107
0.45
94.04
Lowest
0.23
ILASH
Ashdod
Israel
0.0009
0.0002
2,553 1.0
19
0.6
0.257
0.284
0.107
0.45
94.49
Lowest
0.23
ILHAD
Hadera
Israel
0.0047
0.0043
12,000 1.0
24
0.4
0.300
Y
0.284
0.106
0.44
94.93
Lowest
0.23
BEGNE
Ghent/Gent
Belgium
0.0019
0.0003
1,618 1.0
16
0.6
0.245
0.290
0.105
0.44
95.37
Lowest
0.23
USBAL
Baltimore Maryland
United States
0.0047
0.0049
48,166 1.0
15
0.6
0.309
0.157
0.103
0.43
95.81
Lowest
0.22
NGPHC
Port Harcourt
Nigeria
0.0112
0.0007
1,206 1.0
9
0.8
0.391
0.000
0.101
0.42
96.23
Lowest
0.21
UADNB Dnepro-Bugsky
Ukraine
0.0009
0.0001
1,457 1.0
21
0.4
0.286
0.238
0.096
0.40
96.63
Lowest
0.18
CNSHA
Shanghai (Shihu) Shanghai
China
0.0009
0.0001
1,399 1.0
34
0.4
0.243
0.333
0.094
0.39
97.02
Lowest
0.18
USILG
Wilmington Delaware
United States
0.0028
0.0003
1,472 1.0
22
0.4
0.296
0.157
0.090
0.38
97.40
Lowest
0.16
USDVT
Davant
United States
0.0037
0.0087
67,247 1.0
16
0.6
0.291
0.087
0.089
0.37
97.77
Lowest
0.16
USPHG
Pittsburg
United States
0.0009
0.0002
1,636 1.0
24
0.4
0.200
Y
0.383
0.089
0.37
98.14
Lowest
0.16
CASEI
Sept Iles (Seven Is.) Quebec
Canada
0.0009
0.0023
24,757 1.0
15
0.6
0.273
0.091
0.083
0.35
98.49
Lowest
0.13
FIPOR
Pori
Finland
0.0009
0.0015
15,723 1.0
20
0.4
0.300
Y
0.000
0.076
0.32
98.80
Lowest
0.10
USMSY
New Orleans
United States
0.0028
0.0028
27,791 1.0
16
0.6
0.204
0.087
0.065
0.27
99.08
Lowest
0.06
55
Ballast Water Risk Assessment, Port of Sepetiba, Federal Republic of Brazil, December 2003: Final Report
Reverse BWRA
There is no doubt that Sepetiba `exports' considerable volumes of ballast water, much of which
appears destined for other Brazilian ports via bulk carriers departing from the coal and alumina berths,
plus much smaller quantities in some of the ships that leave the Tecon wharf. The most important BW
destination port appears to be Santos (Section 4.5) which, like Rio de Janeiro, has one of the closest
environmental matching values to Sepetiba. This suggests any unwelcome species that can establish
in Sepetiba Bay have a more than reasonable chance of `port-hopping' to Santos or Rio de Janeiro via
BW-mediated transfer. For distant ports, the French Atlantic port of Quimper is a relatively frequent
next port of call (2.6% of departures) with a C3 of 0.51. This combination implies a greater chance of
introductions from vessels departing in ballast from Sepetiba than for other European ports. In the
case of the risk species currently assigned to Sepetiba's bioregion SA-IIB, the noxious phytoplankton
species that can make cysts, survive tank conditions and produce suffocating and/or toxic red tides in
eutrophic inshore waters, represent the type of species that could have most potential impact if
introduced to new areas (Table 8).
Influence of coefficients and C4 weightings
The project-standard method classified 20 ports in the highest risk category, and these were all
Brazilian (Section 4.8). This outcome was to a large part determined by the size of their
environmental matching coefficients (C3), together with relatively short voyage durations (R2). An
example of how C3 markedly influenced the ROR outcome is the port of Tubarăo. This port had a
relatively low C1 (83rd; Table 3) and a C4 that was 40% of the highest risk species threat value (0.383;
Table 7), but its ROR was ranked 13th in the highest risk group (Table 9). Such outcomes were not
uncommon since the project standard calculation of ROR used the simple mean of the C1-C4
coefficients (Section 3.10), and C3 was usually the largest (Table 9). This is because C3 is a direct
index of port-to-port similarity that is unaffected by the number or locations of other trading ports,
while C1, C2 and C4 are proportions of the total discharge frequency, volume and risk species threat
posed by all 148 BW source ports (Table 9; Section 3.10).
Because C4 typically exerts less influence on the ROR result than C3, Group C counterparts altered
the three default weights used in the project standard calculation of C4 (w1=3, w2=10, w3=1;
Sections 3.9, 3.10) to evaluate their influence on the size of C4 and hence ROR outcomes. For
example, the database's formula GUI was used in one of the trials firstly to decrease w3 to 0.2, and
then increase it by two and then five times. This showed that only ports with medium-range
environmental matching coefficients had ROR rankings that were sensitive to changes in C4 size. In
the case of trials on w2 (the weight applied to a known pest), its influence on C4 was investigated by
simulating three scenarios where the bioregion of interest had different numbers of Non-Indigenous
Species (NIS) and the same number of Suspected (S) and Known harmful (K) species. This trial
confirmed that altering w2 may cause C4 to increase, decrease or remain virtually unaltered,
depending on the particular combination of NIS, S and K numbers.
The investigation by Group C counterparts showed that altering the default weightings can lead to
unexpected outcomes and creates the potential trap of merely playing `numbers games', particularly if
the objective and rationale used for altering the project standard calculation and default input factors
have not been carefully assessed. In this context, there is a good argument for allowing C3 to remain
the most influential component of the BWRA formula when there is any paucity or reliability doubt
about C4, and for the reverse to be arranged when C4 carries adequate survey data, and specifically
unwanted species have been targeted. Group C counterparts concluded that the formula GUI of the
GloBallast BRWA system provides users the choice of enhancing the environmental matching or
target species approach, and to trial some hybrid approaches. It was also concluded that when
evaluating results, each risk component of the calculation needs to be examined individually to
understand its importance and contribution to the overall outcomes, whichever method is used.
56
4 Results
4.9 Training and capacity building
The computer hardware and software provided by the GloBallast Programme for the BWRA activity
was successfully installed and is currently maintained at the Programa GloBallast office in Rio de
Janeiro. This PC, plus another made available by FEEMA's GIS section for port map development
and group demonstrations, proved reliable and adequate for running the database, undertaking the
similarity analyses, displaying the GIS maps and results and providing other project needs.
Most counterparts had had sufficient experience in the routine use of MS Windows applications to
pick up the use of the Access database with difficulty. The mapping work was conducted at FEEMA's
GIS office in Rio de Janeiro, with the Group A counterparts already familiar with ESRI products and
therefore requiring only minor guidance in the use of ArcView and the structure of the layers
recommended for the port map. One member of Group B and two from Group C also received basic
training in GIS map development and file management. There is no doubt that FEEMA is capable of
producing similar resource maps for future BWRA demonstration and training activities in the region.
Experienced FEEMA GIS staff such as Mr Joăo Batista, will be able to provide very useful continuity
to any future BW management projects involving GIS applications. FEEMA also provided several
counterparts to Group B and C (Section 3.11; Appendix 2).
As noted in Section 3.6, the most easily-trained and efficient database operators are those with port
and maritime work experience, plus previous hands-on experience with Windows applications. In the
absence of available personal with this profile to input the BWRF information, two oceanographic
graduate students were contracted at short notice. A combined Group A / B effort was then made
during the second consultants visit to boost the number of BWRF records in the system and to check
those recently entered by the students.
Much effort was focussed on removing a wide range of BWRF discrepancies and errors in the
database (both ship-entry related and computer-entry related). `Fixing' tasks included the need to fix
misinterpretations and duplications of BW tank data, illogical date formats, replicated vessels and
ports, and to remove ~140 records for BWRFs collated by neighbouring ports (MBR Terminal and
Rio de Janeiro). Group B also worked hard to expand the CFP-A spreadsheet of the 1998-2000 visit
data to include key requirements for the database (i.e. estimated BW uptake dates, berth location (by
cargo type), and estimated BW discharge volumes). Group C provided help in BWRF date-checking
and calculating minimum voyage durations. By 6 September 2002, over 910 ship visit records had
been entered and edited within the Access database, of which 589 were from the (1998-2000) port
shipping records and 330 from BWRFs.
It is unfortunate that key counterparts of the initial Group B membership were unable to attend the
second visit to gain a similar understanding of the BWRF data-checking requirements, and thus
improve their knowledge in using port shipping records and other databases for checking, verifying
and/or gap-filling BWRFs (e.g. Fairplay Ports Guide, the Lloyds Ship Register and the consultants
Excel spreadsheet for estimating BW discharge volumes). There was no time to undertake a formal
analysis of the rates of different error types, and what kind of improvement had occurred after the
voluntary BWRF system at Sepetiba was replaced with more a formal requirement for BWRF
submissions in January 2001.
Of the three groups, Group C was the largest (Appendix 2). Group C received instruction in the
approach and methods of the environmental similarity analysis using the PRIMER package during the
in-country visits by the consultants, with intensive `hands-on' training provided in the second visit.
The lead counterpart of Group B (CFP-A) also received guidance and became very adept at importing
the C3 coefficients to the database. Collation of risk species information and networking with other
marine scientists was undertaken by Dr Andrea Junqueira (UFRJ; lead counterpart of Group C) with
assistance from Dr Luciano Fernandes (UFPR), Dr Flavio Fernandes (IEAPM) and Dr Luis Proença
(UNIVALI). Much of the Brazilian port environment data was ably collated and entered into the
required Excel spreadsheet format by Mrs Fátima Soares (FEEMA), Mrs Karen Larsen (IEAPM) and
57
Ballast Water Risk Assessment, Port of Sepetiba, Federal Republic of Brazil, December 2003: Final Report
Ms Maria Matos (UFRJ). Dr Junqueira worked closely with the CFP-A to review the project-standard
BWRA calculations and investigate the effects on results when the various weighting coefficients are
altered.
4.10 Identification of information gaps
Ballast Water Reporting Forms
The majority of BWRFs provided sufficient data to allow reasonable corrections, gap-filling and
estimations. Nevertheless considerable work was still required to `salvage' them, and many BWRFs
could not be inputted (the overall rejection rate was ~40%). The number and status of the BWRFs
collected under the initial voluntary scheme (from June to December 2000) showed improvement in
2001, when BWRF lodgements became an official requirement and were more readily associated with
Free Pratique and other formalities. However BWRFs containing many empty or incorrect entries for
BW source/s, uptake date/s and tank volumes intended to be discharged remained common (as was
the case for other Demonstration Sites). It had been planned to conduct an error analysis of the
BWRFs during the second country visit, but the unexpected need to populate and restore the database
prevented this. However the following list summarises the most common omissions or mistakes in
submitted BWRFs that were informally observed and also recorded by other Demonstration sites:
· BW uptake date, source port/location and/or discharge volume provided for none, one, or
only a few of the total number of tanks considered most likely to have been discharged.
· No exchange data in the BW exchange field (Part 4 of the BWRF; Appendix 1), or no reason
given for not undertaking an exchange.
· BWRFs showing BW exchange data contained empty BW source cells (it is important to
enter the source port/location details because exchanges are often well below 95% effective
and never 100%).
· different and confusing combinations of ballast tanks listed in the BW source and BW
discharge columns of the BWRF (in Part 4 of the form; Appendix 1).
· BW Discharge field often ignored or partly filled, even by ships loading a full cargo and
therefore discharging most of their ballast.
The above summary shows which items port officers should immediately check when collecting or
receiving any BWRF. Unless guidance is provided and errors corrected, ships' officers, shipping
agents and the port officers will take much longer to become familiar with and effectively use the
BWRF process. Apart from lack of BWRF familiarity, the time provided for a ship's officer to
complete a BWRF is another important factor influencing the number of mistakes and omissions.
Linking BWRFs to the radio Free Pratique system (i.e. 1-2 days before arrival) is therefore valuable,
since BWRFs provided to ships during their arrival/berthing phase cannot be expected to receive the
same level attention as those completed prior to arrival. Unless BWRFs are completed accurately and
fully by vessels visiting Sepetiba, a significant percentage of BW sources and discharge volumes will
remain unclear especially for the Tecon wharf. Even with correctly completed forms, it is often
impossible to identify the ultimate destination of any BW uplifted by a port that receives and analyses
BWRFs (Section 3.5). This is important given the objective of the GloBallast BWRA to identify the
destinations of BW uplifted at each Demonstration Site. In fact some of the GloBallast BWRA
objectives required considerable effort searching and/or deducing the following information, which is
not available from the standard BWRFs:
· Destination Port/s where either BW will be discharged or cargo actually offloaded (not
necessarily the Next Port of Call).
· Berth number/location at the reception port (obtained for each Demonstration Site by
laborious cross-checking with port records);
58
4 Results
· Deadweight tonnage (DWT). This is very useful for checking claimed BW discharge volumes
(DWTs were eventually obtained for most ships from the Lloyds Ship Register, but this is a
time-consuming task, particularly for ships that had entered a new name, incorrect IMO
number or Call Sign on the BWRF).
It is therefore recommended that the IMO Marine Environment Protection Committee (MEPC) review
the standard BWRF with a view to improving its global application under the new convention (see
Section 5).
Port environmental and risk species data
It was particularly difficult to obtain reliable environmental information for a port's waters,
particularly for the seasonal water temperature and salinity averages and extrema. This was true for
ports in very developed regions (e.g. North America, Europe and Japan) as it was for less developed
areas. Most of Brazil's ports are not exceptions to this finding. In the case of species data, many
national and regional data sets remain incomplete and/or unpublished, and there are none for South
America except for its southernmost area (Oresanz et al 2002). Many sites for North American
Caribbean, European, Asian and Australasian regions list species which were historically introduced
by the aquaculture, fisheries, aquarium industry or hull fouling vectors, while many do not identify
the likely vector/s of their listed species.
59
5
Conclusions and Recommendations
The main objectives of the BWRA Activity were successfully completed during the course of this
project, which took 14 months (i.e. between the initial briefing in January 2002 and the final
consultants visit in March 2003). The level of port and maritime experience brought to the project by
the Brazilian counterparts, including the GIS and environmental expertise from FEEMA facilitated
effective instruction and familiarisation of the BWRA system. In addition, some of the team members
are hoping to repeat the exercise for the southern Brazilian port of Paranaguá.
Continuing work in ballast water management projects will enable Brazil to provide assistance,
technical advice, guidance and encouragement to other South American port States. It could adopt a
leading role if it could make coordinated and strategic use of its existing agencies, several of which
have expertise and complimenting roles in the various maritime, technical, statistical, ecological and
public health aspects of ballast water management.
The Regional Strategic Action Plan (SAP) being developed by GloBallast for coordinating BW
management activities in the region provides the best mechanism for replicating the collation analysis
of BWRF data. Important items requiring attention for any future BW management activity in the
South American region comprise:
· availability of guidelines and instructions about BWRF reporting to ship's officers, shipping
agents and port officers;
· virtual lack of species surveys (PBBSs) in South America;
· relative lack of reliable port water temperature and salinity data for the major seasons
· lack of any regional web-based database for exchanging and updating species survey
information.
Regional organisations, port authorities and shipping companies in the region should be encouraged to
support efforts in the above areas.
5.1
Recommendations
· To identify the locations where BW is discharged within a port, a more useful BWRF should
include an entry for the berth or terminal name/number (instead of simply `Port' and/or
geographic coordinates, which was usually left blank).
· Modifying the "Last Port of Call" field to provide a "Last Three (3) Ports of Call" question
would assist BWRF verification checking and analysis for part-loaded vessels visiting multi-
use terminals.
· Linking BWRF submissions to electronic methods such as the radio Free Pratique system
offers very significant labour and cost-saving benefits, as well as removing the problem of
illegible writing.
· BWRFs submitted by paper or electronically are likely to contain errors and gaps. Any port
officer whose duties include collecting or receiving BWRFs should check that all relevant
fields have been completed, and be instructed to decline any Ballast Water Management Plan
offered by the vessel in lieu of a BWRF. A short BWRF information kit and training course
provided to port officers and local shipping agents is recommended, particularly during the
implementation of a BWRF system at any port.
60
5 Conclusions and Recommendations
· To help interpret incomplete or suspect BWRFs, BWRF database officers should have access
to up-to-date copies of the Lloyds Ship Register, the Fairplay Ports Guide, Lloyd's Maritime
Atlas of World Ports or equivalent publications18.
· Students do not make suitable BWRF data-entry people owing to the large number of possible
errors and misinterpretations that can be made with the these types of form. People with a
practical knowledge of port and shipping operations are far more easier and cost effective to
train.
5.2
BWRA recommendations and plans by Pilot Country
· The project standard method allows the environmental similarity coefficient (C3) to be the
most influential component of the BWRA formula, and the resultant `environmental
matching' approach is valid and useful when there is a paucity, bias or other doubt about the
reliability about the bioregional distribution and categorisation of the various risk species that
form the C4 coefficient.
· The reverse needs to be arranged (using the formula GUI of the BWRA database) when C4
carries adequate survey data and specifically unwanted species have been targeted and
weighted accordingly.
· Whichever method is applied, each risk component of the calculation should be examined
individually when evaluating the BWRA results in order to understand its importance and
contribution to the outcome.
18 For ports using the GloBallast BWRA system, a copy of the world bioregions map will also be needed so
that the bioregion of any new port added to the database can be quickly identified. This is available in the
User Guide.
61
6
Location and maintenance of the BWRA System
The GloBallast BWRA hardware and software packages in Brazil are presently maintained by the
Country Focal Point Assistant at the Programa GloBallast office in the Diretoria de Portos e Costas
offices in Rio de Janeiro. The following people are currently responsible for maintaining and updating
the following features of the BWRA system in Brazil:
Port resource mapping and GIS display requirements:
Name:
Mr Joăo Batista Dias
Organisation:
Fundaçăo Estadual de Engenharia do Meio Ambiente (FEEMA)
Address:
Rua Fonseca Teles 121 16o Andar
Rio de Janeiro Rio de Janeiro, Brazil, 20.940-200.
Tel:
+55 21 3891 3486
Fax:
+55 21 2589 7388
Email: depdivea@feema.rj.gov.br
Ballast water reporting form database:
Name:
Mr Alexandre de C. Leal Neto
Organization:
GloBallast - Brazil
Address:
Rua Teófilo Otoni 4,
Rio de Janeiro Rio de Janeiro, Brazil. 20.090-070.
Tel:
+55 21 3870 5674
Fax:
+55 21 3870 5674
Email:
aneto@dpc.mar.mil.br
Port environmental and risk species data:
Contact person:
Dr Andrea de O. R. Junqueira (coordination of risk species data)
Position:
Departamento de Biologia Marinha
Organization:
Instituto de Biologia, Universidade Federal do Rio de Janeiro
Address:
CCS Bloco A Ilha do Fundăo
Rio de Janeiro Rio de Janeiro, Brazil. 21.949-900
Tel:
+55 21 2280 2394
Fax:
+55 21 2562 6306
Email:
ajunq@biologia.ufrj.br
Contact person:
Ms Fátima de F. L. Soares (environmental data for ports in Rio de Janeiro
State)
Position:
Aquatic environment coordinator
Position:
Group C - Port environmental and habitat data collection
Organization:
Fundaçăo Estadual de Engenharia do Meio Ambiente (FEEMA)
Email:
ffls@gbl.com.br
Contact person:
Dr Luciano F. Fernandes (phytoplankton risk spp., environment data in
Paraná State)
Position:
Departamento de Botanica
Organization:
Setor de Cięncias Biológicas, Universidade Federal do Paraná
Address:
Centro Politécnico, Jardim das Américas CP 19031
Curitiba, Paraná, Brazil. 81.531-990
Tel:
+55 41 361 1759
Fax:
+55 41 266 2042
Email:
lff@ufpr.br
62
References
Carlton, J.T. 1985. Transoceanic and interoceanic dispersal of coastal marine organisms: the biology
of ballast water. Oceanography and Marine Biology Annual Review 23: 313-371.
Carlton, J.T. 1996. Biological invasions and cryptogenic species. Ecology 77: 1653-1655.
Carlton, J.T. 2002. Bioinvasion ecology: assessing impact and scale. In: Invasive aquatic species of
Europe: Distribution, impacts and management. (E Leppäkoski, S Gollasch & S Olenin eds). Kluwer
Academic Publishers, Dordrecht, Netherlands, pp. 7-19..
Cohen, A .& Carlton, J.T. 1995. Non-indigenous aquatic species in a United States estuary: a case
study of the biological invasions of the San Francisco Bay and delta. Report to the US Fish &
Wildlife Service (Washington) and the National Sea Grant College Program Connecticut Sea Grant,
December 1995, 211 pp. (from http://nas.nfreg.gov/sfinvade.htm).
Hilliard, R.W., Hutchings, P.A. & Raaymakers, S. 1997a. Ballast water risk assessment for twelve
Queensland ports:, Stage 4: Review of candidate risk biota. Ecoports Monograph Series No. 13. Ports
Corporation of Queensland, Brisbane.
Hilliard, R.W., Walker, S., Vogt, F., Belbin, L. & Raaymakers, S. 1997b. Ballast water risk
assessment for twelve Queensland ports, Stage 3B: Environmental similarity analyses. EcoPorts
Monograph Series No. 12. Ports Corporation of Queensland, Brisbane (two volumes).
Kelleher, G., Bleakley, C. & Wells, S. 1995. A Global representative system of marine protected
areas. The World Bank, Washington DC, USA.
Leppäkoski, E., Gollasch, S. & Olenin, S. 2002. Invasive aquatic species of Europe: Distribution,
impacts and management. Kluwer Academic Publishers, Dordrecht, Netherlands. 583 pp.
Orensanz, J.M., Schwindt, E., Pastorino, G., Bortolus, A., Casas1, G., Darrigran, G., Elías, R., López
Gappa, J.J., Obenat, S., Pascual, M., Penchaszadeh, P., Piriz1, M.L., Scarabino, F., Spivak, E.D. &
Vallarino, E.A. 2002. No longer the pristine confines of the world ocean: a survey of exotic marine
species in the south-western Atlantic. Biological Invasions 4: pp. 115143.
Williamson, A.T., Bax, N.J., Gonzalez, E. & Geeves, W. 2002. Development of a regional risk
management framework for APEC economies for use in the control and prevention of introduced
marine pests. Final report of APEC Marine Resource Conservation Working Group (MRCWG),
produced by Environment Australia, Canberra. 182 pp.
63
APPENDIX 1
Copy of
IMO Ballast Water Reporting Form
from Resolution A.868(20) Appendix 1
(Can be downloaded from http://globallast.imo.org/guidelines)
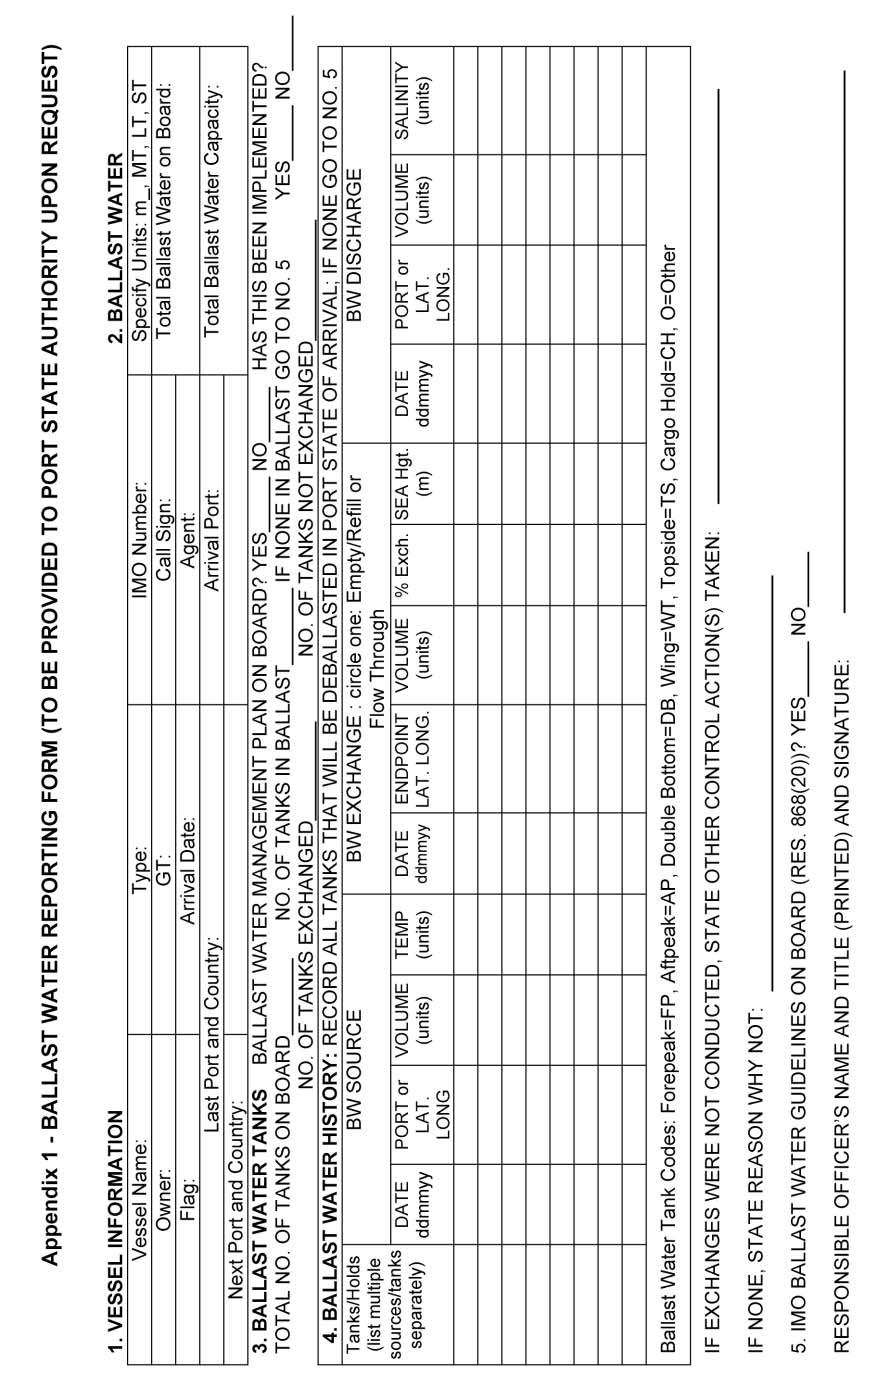
Appendix 1: Copy of IMO Ballast Water Reporting Form
1
APPENDIX 2
Risk Assessment Team for the
Port of Sepetiba, Brazil
Appendix 2: Risk Assessment Team for the Port of Sepetiba, Brazil
The BWRA team contained three groups which undertook the GIS mapping (Group A), database
development (Group B) and environmental matching/risk species (Group C) components of the
Activity. The activities of the three groups were coordinated by Mr Alexandre de C. Leal Neto
(GloBallast Country Focal Point Assistant) and Dr Rob Hilliard (URS Australia Pty Ltd).
Group A (GIS mapping)
Person:
Mr Joăo Batista Dias
Position:
Group A Leader
Organization:
Fundaçăo Estadual de Engenharia do Meio Ambiente (FEEMA), Rio de Janeiro
Email:
depdivea@feema.rj.gov.br
Person:
Mr Chris Clarke
Position:
Group A Counterpart Trainer
Organization: Meridian GIS Pty Ltd
Email: chris@meridian-gis.com.au
Person:
Mr Eduardo Soares Cruz
Position:
Group A GIS cartographer
Organization:
Fundaçăo Estadual de Engenharia do Meio Ambiente (FEEMA), Rio de Janeiro
Email:
educruz@rio.com.br
Group B (database BW records)
Person:
Mr Alexandre de C. Leal Neto
Position:
Group B Leader
Organization:
GloBallast Programme
Email:
aneto@dpc.mar.mil.br
Person:
Mr John Polglaze
Position:
Group B Counterpart Trainer
Organization:
URS Australia Pty Ltd
Email:
john_polglaze@urscorp.com
Person:
Mr Paulo César Francisco Alves
Position:
Group B Port records, port shipping data extraction, BW report forms.
Organization: Port Engineer, Companhia Docas do Rio de Janeiro, Porto de Sepetiba, Brazil.
Email:
pcfa48@ig.com.br
Person:
Mrs Catia Pedroso Ferreira
Position:
Group B Port records, port shipping data extraction, BW report forms.
Organization: Agęncia Nacional de Vigilância Sanitária, Geręncia Geral de Portos e Fronteiras,
Brazil.
Email:
catia.ferreira@anvisa.gov.br
Group C (port environment and risk species data)
Person:
Dr Andrea de Oliveira Ribeiro Junqueira
Position:
Group C Leader risk species database and port environmental similarity analysis
Organization:
Departamento de Biologia Marinha, Universidade Federal do Rio de Janeiro
Email:
ajunq@biologia.ufrj.br
Person:
Dr Robert Hilliard
Position:
Group C Counterpart Trainer
Organization:
URS Australia Pty Ltd
Email:
robert_hilliard@urscorp.com.au
1
Ballast Water Risk Assessment, Port of Sepetiba, Federal Republic of Brazil, December 2003: Final Report
Person:
Dr. Flavio da Costa Fernandes
Position:
Group C risk species database and port environmental similarity analysis
Organisation:
Instituto de Estudos do Mar Almirante Paulo Moreira, Arraial do Cabo, Brazil.
Email:
flaviocofe@yahoo.com
Person:
Mrs Karen Tereza Sampaio Larsen
Position:
Group C port environment data collation and similarity analysis
Organisation:
Instituto de Estudos do Mar Almirante Paulo Moreira, Arraial do Cabo, Brazil.
Email:
karen.larsen@mail.com
Person:
Mrs Fátima de Freitas Lopes Soares
Position:
Group C - port environmental and habitat data collation and similarity analysis
Organization: Fundaçăo Estadual de Engenharia do Meio Ambiente (FEEMA), Rio de Janeiro.
Email:
ffls@gbl.com.br
Person:
Dr Luciano Felicio Fernandes
Position:
Group C plankton risk species and port environment data collection
(southern Brazil)
Organization:
Departamento de Botânica, Universidade Federal do Paraná, Paraná, Brazil.
Email:
lff@ufpr.br
Person:
Mrs Gisele Alves Gomara
Position:
Group C - Port environmental and habitat data collection
Organization: Fundaçăo Estadual de Engenharia do Meio Ambiente (FEEMA), Rio de Janeiro.
Email:
ggomara@ig.com.br
Person:
Ms Maria Cordeiro de Farias Gouveia Matos
Position:
Group C port environmental data collection and similarity analysis.
Organisation:
Universidade Federal do Rio de Janeiro
Email:
mariacfgm@netscape.net
Person:
Mrs Zila Maria Cunha de Andrade
Position:
Group C assistant for port environmental data collection.
Organisation:
Fundaçăo Estadual de Engenharia do Meio Ambiente (FEEMA), Rio de Janeiro
Email:
sambaiba@infolink.com.br
Project Manager
Steve Raaymakers
Programme Coordination Unit
International Maritime Organization
sraaymak@imo.org
http://globallast.imo.org
2
.
APPENDIX 3
Check-list of project requirements
circulated at initial briefings in January 2001
(during 3rd GPTF meeting, Goa)
Appendix 3: Check-list of project requirements circulated at initial briefings in January 2001 (during 3rd GPTF meeting, Goa)
PROJECT REQUIREMENTS AND PROVISIONAL SCHEDULE
REMINDER AND CHECK LIST FOR CFP/CFP-A
(1)
Confirm your availability of adequate PC hardware, + Windows, Access & peripherals
At least one PC with sufficient processor speed, memory, Windows software and peripherals must be
dedicated to the project (plus full-time use during the two visits by the URS Team).
PC Capability: - at least 600 MHz Processor speed
- at least 10 GB of Hard Disk capacity
- at least 128 MB RAM
- 3D Graphics Card with 16 MB of RAM
- x24 speed CD-ROM drive
- 21" 16-bit high-colour Monitor (XVGA or higher)
- a 10/100 base Network Card and 56k modem.
PC Software: OS: at least MS Windows 98 (preferably higher).
MS Access: This database program is usually bundled inside MS Office 97 (Business
Edition), Office Pro; Office 2000; etc. Please check with your IT people if unsure.
MS Word, MS Excel, MS PowerPoint.
PC Peripherals: Convenient access to following peripherals for convenient data inputs and outputs:
- B/W laser printer (>8 pages per minute);
- A3 or A4 colour printer;
- CD Burner
- Flatbed scanner and digitising board
- Semi-auto or auto-archiving system, such as external Zip-Drive, Tape Drive or
LAN servers. This is essential for protecting databases from accidental erasures,
hard drive crashes, system failures, office fire, burglary, etc.
(2)
Identify Your BWRA Project Team (10 people recommended):
Required Pilot Country Counterparts
PCU Consultants
BWRA project team leader
Consultants team leader
PC system and GIS operator (x2)
GIS and database specialist
MS Access database operator (x2)
BWRF and shipping record manager (x2)
Shipping record & port data specialist
Port environmental data searcher (x2)
Environmental similarity analyst (x2)
BWRA specialist
Risk species networker / biologist
NB: when selecting team members, please note training will be conducted in English.
1
Ballast Water Risk Assessment, Port of Sepetiba, Federal Republic of Brazil, December 2003: Final Report
(3)
Check all existing Port GIS, Coastal Resource Atlas, Electronic Charts/Digital
Databases [refer to Briefing Paper - GTPF Agenda Item 4 [BWRA Action Required], and the
consultants questionnaire provided at Goa (please complete and return a copy)
(4)
Confirm Dates and Local Arrangements for first consultants visit.
Provisional Dates for 1st Visit (5 working days)
Monday 25 February- Friday 1 March 2002
Odessa, Ukraine
Saturday 2 March- Thursday 7 March 2002
Tehran/Khark Is, I.R. Iran
Monday 11 March- Friday 15 March 2002
Mumbai/Goa, India
Monday 25 March - Friday 29 March 2002
Saldahna, South Africa
Monday 1 April- Friday 5 April 2002
Sepetiba, Brazil
Tuesday 9 April- Saturday 14 April 2002
Dalian, China
Logistics:
Assistance required for visa applications?
Customs clearance required for importation of computer software?
Local transport / work location / office facilities / accommodation
1st Visit Activities:
·
Install and test the ArcView 3.2 GIS package, and the Primer 5 statistical package;
·
Commence GIS training by digitising the port map (from any existing digital files, paper charts,
maps, habitat information, articles, publications, aerial photos, etc);
·
Review all data collated by Country Project Team, including existing databases. Set up the Access
database for ship arrival records and the IMO BWRF. Commence training on the Graphic User
Interfaces for BWRF inputs
·
Collate and review pre-IMO BWRF shipping records to determine source and destination ports,
vessel types and trading patterns.
·
Review available port environmental data and potential sources of same (see Attachment)
·
Commence assembling the risk species list (locate and commence networking with marine
biologists in your country and region).
·
Identify the critical information gaps.
·
Identify the data collating and input work to be completed before the 2nd Visit.
·
Agree on a provisional date for start of 2nd Visit (10 working days).
2nd Visits (10 work days). Complete port map digitising; install bioregional map; complete and add
risk species to database; perform environmental similarity analysis; undertake risk assessment;
evaluate results; review and reporting.
Environmental Data Requirements - see next page, attached.
2
Appendix 3: Check-list of project requirements circulated at initial briefings in January 2001 (during 3rd GPTF meeting, Goa)
ATTACHMENT
TYPES OF ENVIRONMENTAL DATA FOR PORT SIMILARITY ANALYSIS
The project requires two types of port environmental data:
(A) Charts and marine habitat and resources data are required for the GIS Port Map, and
(B) A range of parameters (measured in or near port) for the Environmental Similarity Analysis.
In the case of the quantitative parameters, these include:
·
Mean water temperature during the summer [monsoon] season (oC)
·
Maximum water temperature at the hottest time of the summer [monsoon] season (oC)
·
Mean water temperature during the winter [dry] season (oC)
·
Minimum water temperature at the coldest time of the winter [dry] season (oC)
·
Mean day-time air temperature recorded in summer [monsoon] season (oC)
·
Maximum day-time air temperature recorded in summer [monsoon] season (oC)
·
Mean night-time air temperature recorded in winter [dry] season (oC)
·
Minimum night-time air temperature recorded in winter [dry] season (oC)
·
Mean water salinity during the wettest period of the year (grams/litre; ppt)
·
Lowest water salinity at the wettest time of the year (grams/litre; ppt)
·
Mean water salinity during the driest period of the year (grams/litre; ppt).
·
Highest water salinity at the driest time of the year (grams/litre; ppt).
·
Mean Spring Tidal range (metres)
·
Mean Neap Tide range (metres)
·
Total rainfall in the port's driest 6 months season (millimetres)
·
Total rainfall in the port's wettest 6 months season (millimetres)
·
Number of months accounting for 75% of total annual rainfall (=duration of peak discharges)
·
Number of kilometres from the berths to the nearest river mouth (negative value if upstream)
·
Size of this river's catchment (square kilometres)
[Categorical variables are also required, but these are easy to obtain from charts, maps, articles,
etc]
3
.
APPENDIX 4
Information sources used for collating
Port Environmental Data
Appendix 4: Information sources used for collating Port Environmental Data
Continued over...
1
Ballast Water Risk Assessment, Port of Sepetiba, Federal Republic of Brazil, December 2003: Final Report
2
APPENDIX 5
Sources and references of
Risk Species information
Appendix 5: Sources and references of Risk Species information
1
Furlani, D (1996). Guide to Introduced Species, CSIRO Marine Research, Hobart, Tasmania (folder-file
format).
2
McClary DJ & Nelligan RJ, 2001. Alternate Biosecurity Maangement Tools for Vector Threats: Technical
guidelines for Acceptable Hull Cleaning Facilities. Research Report No. ZBS 2000/03, prepared by Kingett
Mitchell & Associates for New Zealand Ministry of Fisheries, September 2001. 29 pp.
2a M. Shaffelke, cited in McClary DJ & Nelligan RJ (2001). [see reference 2]
3
Cohen AN & Carlton JT (1995). Biological study: Non-indigenous aquatic species in a united States
estuary: a case study of the biological invasions of the San Francisco Bay and Delta. US Fisheries &
Wildlife National Sea Grant College Program Report PB96-168525. Springfield Virginia, USA.
http://nas.er.usgs.gov/publications/sfinvade.htm
4
Pollard DA & PA Hutchings (1990a,b). A review of exotic marine organisms introduced to the Australian
region. I. Fishes (a); and II. Invertebrates and Algae (b). Asian Fisheries Science 3: 205-222 (a) and 223-
250 (b).
4a Wallaston 1968 and Wommersley 1981, cited in Pollard D & Hutchings PA (1990). [see reference 4]
4b Skinner & Womersley 1983, cited in Pollard D & Hutchings PA (1990). [see reference 4]
4c Allen (1953) - cited in Pollard D & Hutchings PA (1990). [see reference 4]
5
Australian NIS lists compiled by CSIRO-CRIMP (1997); CCIMPE (2001); SSC/SCFA (2000)[see reference
23]
6
Hutchings PM, Van Der Velde J & S Keable (1989). Baseline survey of the benthic macrofauna of Twofold
Bay, NSW, with a discussion of the marine species introduced into the bay. Proceedings of the Linnaean
Society of New South Wales 110 (4): 339-367.
6a Baker, cited by Hutchings et al (1989). [see reference 6]
7
Australian Coral Reef Society (1993). A Coral Reef Handbook (3rd Edition). Surrey Beatty & Sons Pty Ltd,
Chipping Norton NSW, 264 pp.
8
Coles SL, DeFelice RC, Eldredge LG and JT Carlton (1997) Biodiversity of marine communities in Pearl
Harbor, Oahu, Hawaii with observations on introduced exotic species. Bernice Pauahi Bishop Museum
Technical Report No. 10: 1-76
9
Dakin WJ (1976). Australian Seashores (Australian Natural Science Library Edition). Angus & Robertson,
Sydney, 372 pp.
10 Carlton JT (1985). Transoceanic and Interoceanic Dispersal of Coastal Marine Organisms: The Biology of
Ballast Water. Oceanogr. Mar. Biol. Ann. Rev. 23: 313-371.
11 Boyd S, Poore GCB & RS Wilson (1996). Macrobenthic invertebrates of soft sediments in Port Phillip Bay:
Introduced Species. Unpubl. report to CSIRO-CRIMP by Museum of Victoria, Melbourne, 7-96. 122 pp.
12 Gosliner TM, Behrens DW & Williams GC (1996). Coral Reef Animals of the Indo-Pacific - Animal life from
Africa to Hawaii exclusive of vertebrates. Sea Challengers, Monterey CA, 314 pp.
13 Wells FE & C Bryce (1988). Seashells of Western Australia (Revised Edition). Western Australian
Museum, Perth. 207 pp.
14 Tan LWH & PKL Ng (1988). A guide to the seashore of Singapore. Singapore Science Centre, Singapore,
159 pp.
15 Wells FE & RN Kilburn, 1986. Three temperate-water species of South African gastropods recorded for the
first time in southwestern Australia. Veliger 28(4): 453-456.
16 Gosliner TM (1987). Guide to the nudibranchs (opisthobranch molluscs) of Southern Africa. Sea
Challengers and Jeff Hamann. Monterey.
17 Wasson & Shepherd (1995): cited in Cohen & Carlton (1995) [see reference 3].
18 Middleton MJ (1982). The oriental goby, Acanthogobius flavimanus (Temminck and Schlegel), an
introducedfish in the coastal waters of New South Wales, Australia. J. Fish Biology 21: 513-523.
19 In: Leppäkoski E, Gollasch S. & S Olenin (eds) (2002). Invasive aquatic apecies of Europe: Distribution,
impacts and management. Kluwer Academic Publishers, Dordrecht. 583 pp.
20 Morton, B (1981). Biology and functional morphology of Mytilopsis sallei (Recluz) (Bivalvia: Dreissenacea)
fouling Visakhapatnam Harbour, Andra Pradesh, India. Journal of Molluscan Studies 47: 25-42.
21 Gollasch, S (2002). Importance of ship hull fouling as a vector of species introductions into the North Sea.
Biofouling 18: 105-121.
22 Hass CG & DS Jones (1999). Marine introductions to western Australia, with a focus on crustaceans. In:
Kesby JA, Stanley JM, McLen RF & Olive LJ (eds). Geodiversity: Readings in Australian Geography at the
close of the 20th Century. Special Publication Series No. 6, School of Geography & Oceanography,
University College, Australian Defence Force Academy, Canberra ACT. pp. 37-44.
23 Environment Australia (2000). Joint SCC-SCFA Report of the National Taskforce on the Prevention and
Management of Marine Pest Incursions (October 2000 edition). Environment Australia, Canberra,
Australia.
24 Domingues Rodrigues M & AI Brossi Garcia (1989). New records of Pachygrapsus gracilis (Saussure,
1858) in the Brazilian Littoral. Ciene Cult San Paulo 41: 63-66.
1
Ballast Water Risk Assessment, Port of Sepetiba, Federal Republic of Brazil, December 2003: Final Report
25 Dadon JR (1984). Distribution and abundance of Pteropoda: Thecostomata (Gastropoda) in the
Southwestern Atlantic. Physis (Buenos Aires) 42: 25-38.
26 Christeffersen ML (1980). Is Alpheus heterochaelis Say (Crustacea, Decapoda, Alpheidae) found along the
Brazilian coasts? Review Nordestina Biology 3: 236-237.
27 Galil B & C Golani (1990). Two new migrant decapods from the Eastern Mediterranean. Crusteceana 58:
229-236.
28 Hanna GD (1966). Introduced molluscs of western North America. Occasional Papers of Californian
Academy of Science 48: 1-108.
29 Yoloye V (1976). The ecology of the West African Bloody cockle, Anadara (Senilia) senilis (L.). Bulletin of
the Institute Portdam Africique Noire (Series A) 38: 25-56.
30 Jones DS (1992). A review of Australian fouling barnacles. Asian Marine Biology 9: 89-100.
31 Wang JJ & ZG Huang (1993). Fouling polychaetes of Hong Kong and adjacent waters. Asian Marine
Biology 10: 1-12.
32 Arakawa KY (1980). On alien immigration of marine sessile invertebrates into Japanese waters. Marine
Fouling 2: 29-33.
33 Carlton J (1999). Molluscan invasions in marine and estuarine communities. Malacologia 41(2): 439-454.
34 Griffiths CL, Hockey PAR, Van Erkom Shurink C & PJ Le Roux (1992). Marine invasive aliens on South
Africa's shores: implications for community structure and trophic functioning. South African Journal of
Marine Science 12: 713-722.
35 Wang C (1995). Some introduced molluscas [sic] in China. Sinozoologia 12: 181-191 (in Chinese).
36 Cranfield HJ, et al (1998). Adventive marine species in New Zealand. National Institute of Water and Air
Research (NIWA) Technical Report 34, Auckland, New Zealand, 48 pp.
37 Dineen J, 2001. Exotic species reports for Indian River Lagoon, Florida. Smithsonian Fort Pierce website:
http://www.serc.si.edu
38 J Mackie, 2001. Bryozoans at Port of Geraldton, with notes on taxonomy and distribution. In: Geraldton
Port Survey. Unpublished report to Geraldton Port Authority by the Western Australian Museum, Perth,
August 2001.
39 Wonham MJ, Carlton JT, Ruiz GM & LD Smith (2000). Fish and ships: relating dispersal frequency to
success in biological invasions. Marine Biology 136: 1111-1121.
40 NIS data for Angola; supplied by Adnan Adawad (GloBallast Programme, Cape Town, South Africa:
adawad@mcm.wcape.gov.za).
41 Dr Tamara Robertson, University of Cape Town (pers. comm.; August 2002).
42 Gollasch, S. & Griffiths, C (2000). Case studies of introduced species in South African waters prepared for
the GloBallast Programme. Report prepared for Globallast Programme; available from Adnan Adawad
(GloBallast Programme, Cape Town, South Africa: adawad@mcm.wcape.gov.za).
43 Draft provisional species list (9/02) from the Saldanha Bay Port Baseline Biological Survey (supplied by
Adan Adawad (GloBallast Programme, Cape Town, South Africa): adawad@mcm.wcape.gov.za)
44 NIS data for Tanzania; supplied by Adnan Adawad (GloBallast Programme, Cape Town, South Africa:
adawad@mcm.wcape.gov.za).
45 NIS data for Mauritius; supplied by Adnan Adawad (GloBallast Programme, Cape Town, South Africa:
adawad@mcm.wcape.gov.za).
46 NIS data for Mozambique; supplied by Adnan Adawad (GloBallast Programme, Cape Town, South Africa:
adawad@mcm.wcape.gov.za).
47 GloBallast Programme (2002). List of Alien Species. http://www.globallast.org
48 Williamson AT, Bax NJ, Gonzalez E & W Geeves (2002). Development of a regional risk management
framework for APEC economies for use in the control and prevention of introduced marine pests. Final
report of APEC Marine Resource Conservation Working Group, produced by Environment Australia,
Canberra. 182 pp.
49 Walters S, 1996. Ballast water, hull fouling and exotic marine organism introductions via ships - a Victorian
study. Environment Protection Authority of Victoria, Publication 494 (May 1996).
50 Pitcher, G (1998). Harmful algal blooms of the Benguela current. Colour publication available from Sea
Fisheries Research Institute (Private Bag X2, Rogge Bay 8012), Cape Town, Republic of South Africa (20
pp).
51 Benson AJ, Williams JD, Marelli DC, Frischer ME & Danforth JM, 2002. Establishment of the green
mussel, Perna viridis, on the West Coast of Florida. In: Proceedings of 11th International Conference of
Aquatic Invasive species (Feb 25 to March 1, 2002, Washington DC). nvironment Department, US Army
Engineer & Research Development Laboratory, US.
52 Platvoet D, Dick JTA & DW Kelly (2002). Comparative morphometrics of mouthparts and antennae in the
invasive Dikerogammeros villosus and the native Gammarus duebeni (Crustacea, Amphipoda). In:
Proceedings of 11th International Conference of Aquatic Invasive species (Feb 25 to March 1, 2002,
Washington DC). Environment Department, US Army Engineer & Research Development Laboratory, US.
2
Appendix 5: Sources and references of Risk Species information
53 Strong JA (2002). Faunal and habitat comparisons from under and outside canopies of Sargassum
muticum. In: Proceedings of 11th International Conference of Aquatic Invasive species (Feb 25 to March
1, 2002, Washington DC). Hosted by Environment Department, US Army Engineer & Research
Development Laboratory.
54 Verween A (2002). Economic impact of biofouling control of an exotic bivalve, Mytilopsis leucophaeta, in
the harbour of Antwerp, Belgium. In: Proceedings of 11th International Conference of Aquatic Invasive
species (Feb 25 to March 1, 2002, Washington DC). Environment Department, US Army Engineer &
Research Development Laboratory, US.
55 Perry HM, Lukens R, et al, 2002. Invasive species and implications for fisheries sustainability in the Gulf of
Mexico. In: Proceedings of 11th International Conference of Aquatic Invasive species (Feb 25 to March 1,
2002, Washington DC). Environment Department, US Army Engineer & Research Development
Laboratory, US.
56 Makarewicz, JC (2002). Distribution, fecundity, genetics and invasion routes of Cercopafis pengoi
(Ostroumov) - a new exotic zooplankter in the Great Lakes Basin. In: Proceedings of 11th International
Conference of Aquatic Invasive species (Feb 25 to March 1, 2002, Washington DC). Hosted by
Environment Department, US Army Engineer & Research Development Laboratory.
57 Bauer CR & Lamberti GA (2002). Potential interactions between Eurasian Ruffe and Round Gobies in the
Great Lakes: Prey and habitat differences. In: Proceedings of 11th International Conference of Aquatic
Invasive species (Feb 25 to March 1, 2002, Washington DC). Environment Department, US Army Engineer
& Research Development Laboratory. US.
58 Darrigran G et al (2002). Abundance and distribution of golden mussel (Limnoperna fortunei) larvae in a
hydroelectric plant in South America. In: Proceedings of 11th International Conference of Aquatic Invasive
species (Feb 25 to March 1, 2002, Washington DC). Environment Department, US Army Engineer &
Research Development Laboratory, US.
59 Personal communications and manuscripts supplied by Dr Andrea Junqueira, Dr Flavio Fernandes, Dr
Luciano Felicio Fernandes , Dr Luis Proenca during BWRA workshop at FEEMA, Rio de Janeiro (30
August 2002).
60 Fernandes, LF et al (2001). The recently established diatom Coscinodiscus wailesii in Brazilian waters:
taxonomy and distribution. Phycological Research 2001.
61 Paula, A,F (2002). Spatial abundance and distribution of invading coral Tubastraea in Ilha Grande Bay
(RJ) and record of T. tagusensis and T. coccinea in Brazil. M.Sc thesis, State University of Rio de Janeiro,
May 2002.
62 Translated material provided by Assoc Prof. (Biol.) Wang Lijun and Mr Jiang Yuewen (National Marine
Environment Protection & Monitoring Centre, State Administration of Oceanography (Dalian Office), China
(including preliminary lists of identified species sampled by Port Baseline Biological Survey for Dalian
(GloBallast Programme); September 2002).
63 Anil AC, Venkat K, Sawant SS, Dileepkumar M, Dhargalkar VK, Ramaiah N, Harkantra SN & ZA Ansari
(2002). Marine bioinvasions: Concern for ecology and shipping. Current Science 83(3): 214-218.
64 K Satyanarya Rao (2002). Proceedings of 1st R&D Seminar, Global Ballast Water Management
Programme. National Institute of Oceanography, Goa, India. June 2002.
65 National Institute of Oceanography (2001). Report released to mass-media (from Dr AC Anil, NIO, Goa).
66 Xu, CY (1982). Surveys on the causal organisms of red tides in Dalian Bay. Journal of Fisheries, China
6(2): 173-180 (in Chinese).
67 Iizuka S (1976). Succession of red tide organisms in Omura Bay with relation to water pollution. Bulletin of
the Plankton Society of Japan 23(1): 31-43 (in Japanese).
68 Kuriakose PS (1980). Mussels (Genus Perna) of the Indian coast. In: Coastal aquaculture of mussels -
Progress and Prospects. Central Marine Research Fisheries Institute (Cochin, India).
69 Thompson MF (1994). Recent developments in biofouling control. Oxford & IBH Publishing Co, Pty Ltd,
UK.
70 National Institute of Oceanography: Bryozoan Identifications (volume provided by Dr AC Anil, NIO, Goa,
India)
71 Zaitsev Y & B Ozturk (2001). Exotic Species in the Aegean, Marmara, Black, Azov and Caspian Seas.
Publication No.8, Turkish Marine Foundation, Istanbul. Turk Deniz Arastirmalari Vakfi. Istanbul.
72 CIESM Atlas of Introduced Species in Mediterranean Sea (2002). http://www.ciesm.org/atlas
73 McMinn, A (1990). Recent dinoflagellate cyst distribution in eastern Australia. Review of Paleobotany and
Palynology 65: 305-310.
74 Karunasagar I, Gowda HSV, Subburaj M, Venugopal MN & I Karunasagar (1984). Outbreak of paralytic
shellfish poisoning in Mangalore, west coast of India. Current Science 53(5): 247-249.
75 Yoon YH et al (1991). Red tide organisms in the coastal waters of Cheju Island, southern Korea. Bulletin of
Marine Research Institute, Cheju National University 15: 1-14.
76 Pillai CSG & Jasmine S (1991). Life cycle of Perna indica. In: Symposium on tropical marine living
resources, Cochin, Kerala (india), 12-16 January 1988. J. Mar Biol. Association India 33(1-2): 159-165.
3
Ballast Water Risk Assessment, Port of Sepetiba, Federal Republic of Brazil, December 2003: Final Report
77 Coles SL, DeFelice RC & LG Eldredge (1999). Nonindigenous marine species introductions in the harbors
of the south and west shores of Oahu, Hawaii. Bishop Museum Technical Report No. 15 (Bernice Pauahi
Bishop Museum, Honolulu, Hawaii).
78 Coles SL, DeFelice RC, Eldredge LG & JT Carlton (1999). Historical and recent introductions of non-
indigenous marine species into Pearl Harbor, Oahu, Hawaiian Islands. Marine Biology 135:147-158.
79 Coles SL, DeFelice RC & D Minton (2001). Marine species survey of Johnston Atoll, Central Pacific
Ocean, June 2000. Bishop Museum Technical Report No. 19 (Bernice Pauahi Bishop Museum, Honolulu,
Hawaii).
80 DeFelice RC, Coles SL, Muir D & LG Eldredge (1998). Investigation of marine communities at Midway
Harbor and adjacent lagoon, Midway Atoll, north western Hawaiian Islands. Bishop Museum Hawaiian
Biological Survey Contribution No. 1998-014 (Bernice Pauahi Bishop Museum, Honolulu, Hawaii).
81 Hewitt C (2002). Distribution and biodiversity of Australian tropical marine bioinvasions. Pacific Science
56(2): 213-222.
82 Coles SL & LG Eldredge (2002). Nonindigenous species introductions on coral reefs: a need for more
information. Pacific Science 56(2): 191-209.
83 Hoedt FE, Choat JH, Collins J & JJ Cruz (2000). Mourilyan Harbour and Abbot Point surveys: Port
baseline surveys for introduced marine pests. Unpubl. report to Ports Corporation of Queensland
(Brisbane). School of Marine Biology & Aquaculture, James Cook University, Townsville
84 Choo PS, 1994. A Review on Red Tide Occurrences in Malaysia. Department of Fisheries, Ministry of
Agriculture, Kuala Lumpur, Malaysia.
85 Southward AJ, Burton RS, Coles SL, Dando PR, DeFelice R, Hoover J, Newman WA, Parnel E,
Yamaguchi (1998). Invasion of Hawaiian inner shores by an Atlantic barnacle. Marine Ecology Progress
Series 165:119-126.
86 Nichols FH, Thompson JK & LE Schemel (1990). Remarkable invasion of San Francisco Bay (California,
USA) by the Asian clam Potamocorbula amurensis. II. Displacement of a former community. Marine
Ecology Progress Series 66: 95-101.
87 Pyne R (1999). The black-striped mussel (Mytilopsis sallei) infestation in Darwin: clean-up strategy. In:
EcoPorts Monograph Series No.19 (77-83). Ports Corporation of Queensland, Brisbane.
88 Culver, CS (2000). Apparent eradication of a locally established introduced marine pest. Biological
Invasions 2 (3): 245-253.
89 Fofonoff PW, Ruiz GM, Hines AH & L McCann (1999). Overview of biological invasions in the Chesapeake
Bay region: summary of impacts on coonservation of biological diversity: a key to the restoration of the
Chesapeake Bay and beyond. Monograph. Maryland Department of Natural Resources, pp.168-180.
90 Veldhuizen TC & S Stanish (1999). Overview of the Life History, Distribution, Abundance, and Impacts of
the Chinese mitten crab, Eriocheir sinensis. Environmental Studies Office, California Department of Water
Resources, Sacramento, CA 95816. March 1999.
91 NTMAG & CSIRO, 2000. Port survey of introduced marine species., Port of Darwin. Unpublished report
provided by Dr Barry Russel, Museum & Art Gallery of the Northern Territory, Darwin, Northern Territory,
Australia.
92 Faunce CH and Lorenz JJ (2000) Reproductive biology of the introduced Mayan cichlid, Cichlasoma
urophthalmus, within an estuarine mangrove habitat of southern Florida. Environmental Biology of Fishes
58: 215225.
93 Zhang F & M Dickman (1999). Mid-ocean exchange of container vessel ballast water. 1: Seasonal factors
affecting the transport of harmful diatoms and dinoflagellates. Marine Ecology Progress Series 176:243-
251.
94 Harris LG & MC Tyrell (2001). Changing Community States in the Gulf of Maine: Synergism Between
Invaders, Overfishing and Climate Change. Biological Invasions 3 (1): 9-21.
95 Crooks JA & CA Jolla (2001). Assessing invader roles within changing ecosystems: historical and
experimental perspectives on an exotic mussel in an urbanized lagoon. Biological Invasions 3 (1): 23-36.
96 In: Raaymakers S (Ed.) (2002). Baltic regional workshop on ballast water management, Tallinn, Estonia.,
22-24 October 2001: Workshop report. GloBallast Monograph Series No.2. IMO, London.
97 Gosling EM (1992). Systematics and geographic distribution of Mytilus. In: Gosling EM (Ed.) The Mussel
Mytilus: Ecology, Physiology, Genetics and Culture. Elsevier Press, Netherlands.
98 In: Raaymakers S & C Gregory (Eds) (2002). 1st East Asia regional workshop on ballast water control and
management, Beijing, China. 31 Oct 2 Nov 2002: Workshop report. GloBallast Monograph Series No.6.
IMO, London.
99 Eno NC, Clark RA & Sanderson WG (Eds). Directory of non-native marine species in British waters.
http://www.jncc.gov.uk/marine/dns/default.htm
100 Oderbrecht et al (2002).
101 Ports & Shipping Organisation (2002). Species tables. In: Draft report of seasonal Port Baseline
Biological Surveys for Port of Khark Island. Unpublished manuscript provided by PSO, Tehran, I.R. Iran.
4
Appendix 5: Sources and references of Risk Species information
102 Introduction to non-indigenous species of the Gulf of Mexico (2002). Website:
http://www.gsmfc.org/nis/nis/Perna_perna.html
103 Erkki Leppäkoski E & S Olenin (2000). Non-native species and rates of spread: Lessons from the brackish
Baltic Sea. Biological Invasions 2 (2):151-163.
104 Ambrogi AO (2000). Biotic invasions in a Mediterranean lagoon. Biological Invasions 2 (2): 165-176
105 Galil BS (2000). A sea under siege alien species in the Mediterranean. Biological Invasions 2 (2):177-
186
106 Mann, R (2000). Invasion of the North American atlantic coast by a large predatory Asian mollusc
Biological Invasions 2(1): 7-22
107 Lohrer AM, Whitlatch RB, Wada K & Y Fukui (2000). Home and away: comparisons of resource utilization
by a marine species in native and invaded habitats. Biological Invasions 2 (1):41-57
108 Wasson, K & B Von Holle (2000). Detecting invasions of marine organisms: Kamptozoan case histories.
Biological Invasions 2(1): 59-74.
109 Rivest BR, Coyer J, Haren AA & S Tyler (1999). The first known invasion of a free-living marine flatworm.
Biological Invasions 1(4): 393-394
110 E x o t i c s p e c i e s l i s t o f t h e M o n t e r e y B a y N a t i o n a l M a r i n e S a n c t u a r y .
http://bonita.mbnms.nos.noaa.gov/sitechar/spex.html
111 F A O d a t a b a s e o n a q u a t i c s p e c i e s i n t r o d u c t i o n s :
http://www.fao.org/waicent/faoinfo/fishery/statist/fisoft/dias/index.htm
112 Global Invasive Species Program (GISP): http://jasper.stanford.edu/GISP/ and GISP Database:
http://www.issg.org/database/welcome/
113 Group on Aquatic Alien Species (GAAS) (Russia): http://www.zin.ru/projects/invasions/index.html
114 Gulf of Maine Ballast Water and Exotic Species Web Sites: http://www.gulfofmaine.org/library/exotic.htm
115 Gulf of Mexico Program Nonindigenous Species Information: http://pelican.gmpo.gov/nonindig.html
116 Smithsonian Environmental Research Center (SERC marine invasions lab): http://invasions.si.edu/
117 Ecological Society of Japan (Ed.) (2002). Handbook of alien species in Japan. (published 9/02).
Chijinchokan Ltd, Tokyo (in Japanese). 390pp. http://www.chijinshokan.co.jp
118 Fine M, Zibrowius H & Y Loya (2001). Oculina patagonica: a non-lessepsian scleractinian coral invading
the Mediterranean Sea. Springer-Verlag (New York):
http://linl.springer-ny.com/link/service/journals/00227/contents/01/00539/
119 Schaffelke B, Murphy N & S Uthicke (2002). Using genetic techniques to investigate the sources of the
invasive alga Caulerpa taxifolia in three new locations in Australia. Mar Poll Bull 44: 204-210.
120 Washington State Sea Grant Program: Non-indigenous aquatic species:
http://www.wsg.washington.edu/outreach/mas/nis/nis.html
121 Baltic Research Network on invasions and introductions (NEMO). Website:
http://www.ku.lt/nemo/mainnemo.htm
122 US Geological Service non-indigenous aquatic species (NIAS) website:
http://nas.er.usgs.gov/
123 National aquatic nuisance species clearing house - Seagrant Program:
http://www.entryway.com/seagrant/
124 Esmaili Sari A, Khodabandeh S, Abtahi B, Sifabadi J & H Arshad (2001). Invasive comb jelly Mnemiopsis
leidyi and the future of the Caspian Sea. Faculty of Natural Resources and Marine Sciences, University of
Tarbiat Modarres. Kor, Mazandaran, IR Iran. ISBN: 964-91086-2-9. (+95 pp; non-English). Obtainable
from: yavarivahid@hotmail.com ; yavari@ir-pso.com .
125 Cohen BF, Heislers S, Parry GD, Asplin MD, Werner GF & JE Restall (2002). Exotic marine pests in the
outer harbour of the Port of Adelaide. Marine and Freshwater Resources Institute of Victoria (Report No.
40), MAFRE, Queenscliffe, Victoria, Australia. (9/02; 86pp.).
5
APPENDIX 6
Name, UN code, coordinates and environmental
parameters of the 357 ports used for the multivariate
similarity analyses for all Demonstration Sites
Appendix 6: Name, UN code, coordinates and environmental parameters
1
Ballast Water Risk Assessment, Port of Sepetiba, Federal Republic of Brazil, December 2003: Final Report
2
Appendix 6: Name, UN code, coordinates and environmental parameters
3
Ballast Water Risk Assessment, Port of Sepetiba, Federal Republic of Brazil, December 2003: Final Report
4
Appendix 6: Name, UN code, coordinates and environmental parameters
5
Ballast Water Risk Assessment, Port of Sepetiba, Federal Republic of Brazil, December 2003: Final Report
6
Appendix 6: Name, UN code, coordinates and environmental parameters
7
Ballast Water Risk Assessment, Port of Sepetiba, Federal Republic of Brazil, December 2003: Final Report
8
Appendix 6: Name, UN code, coordinates and environmental parameters
9
Ballast Water Risk Assessment, Port of Sepetiba, Federal Republic of Brazil, December 2003: Final Report
10
Appendix 6: Name, UN code, coordinates and environmental parameters
11
Ballast Water Risk Assessment, Port of Sepetiba, Federal Republic of Brazil, December 2003: Final Report
12
Appendix 6: Name, UN code, coordinates and environmental parameters
13
Ballast Water Risk Assessment, Port of Sepetiba, Federal Republic of Brazil, December 2003: Final Report
14
APPENDIX 7
Consultants' Terms of Reference
Appendix 7: Consultants' Terms of Reference
Consultants' Terms of Reference
Activity 3.1: Ballast Water Risk Assessments
6 Demonstration Sites
1. Introduction & Background
The International Maritime Organization (IMO), with funding provided by the Global Environment
Facility (GEF) through the United Nations Development Programme (UNDP), has initiated the Global
Ballast Water Management Programme (GloBallast).
This programme is aimed at reducing the transfer of harmful marine species in ships' ballast water, by
assisting developing countries to implement existing IMO voluntary guidelines on ballast water
management (IMO Assembly Resolution A.868(20)), and to prepare for the anticipated introduction
of an international legal instrument regulating ballast water management currently being developed by
IMO member countries.
The programme aims to achieve this by providing technical assistance, capacity building and
institutional strengthening to remove barriers to effective ballast water management arrangements in
six initial demonstration sites. These six sites are Sepetiba, Brazil; Dalian, China; Mumbai, India;
Kharg Island, Iran; Saldanha, South Africa and Odessa, Ukraine. The initial demonstration sites are
intended to be representative of the six main developing regions of the world, as defined by GEF.
These are respectively, South America, East Asia, South Asia, Middle East, Africa and Eastern
Europe. As the programme proceeds it is intended to replicate these initial demonstration sites
throughout each region.
2. The Need for the Risk Assessments
The development objectives of the programme are to assist countries to implement the existing IMO
voluntary ballast water management guidelines and to prepare for the introduction of a new
international legal instrument on ballast water.
The current IMO ballast water management guidelines offer states significant flexibility in
determining the nature and extent of their national ballast water management regimes. This flexibility
is warranted given that nations are still experimenting with approaches. A port state may wish to
apply its regime uniformly to all vessels which visit, or it may wish to attempt to assess the relative
risk of vessels to valuable resources and apply the regime selectively to those which are deemed of
highest risk.
The uniform application option offers the advantages of simplified programme administration in that
there are no "judgement calls" to be made or justified by the port state regarding which vessels must
1
Ballast Water Risk Assessment, Port of Sepetiba, Federal Republic of Brazil, December 2003: Final Report
participate and which need not. In addition, the system requires substantially less information
management demands. Finally, it offers more protection from unanticipated invaders, and overall
protection is not dependent upon the quality of a decision support system which may not be complete.
The primary disadvantages of this approach are: 1) additional overall cost to vessels which otherwise
might not need to take action, and 2) more vessels will be involved in undertaking the measures, and
therefore the port state will need to monitor compliance from a greater number of vessels.
Some nations are experimenting with systems to allow more selective applicability based upon
voyage-specific risk assessments because this approach offers to reduce the numbers of vessels
subject to ballast water controls and monitoring. The prospect of reducing the numbers of ships to
which the program applies is especially attractive to nations that wish to eliminate introductions of
target organisms such as toxic dinoflagellates. More rigorous measures can be justified on ships
deemed to be of `high risk' if fewer restrictions are placed on low risk vessels. However, this
approach places commensurate information technology and management burdens on port state and its
effectiveness depends on the quality of the information supporting it. The approach may also leave the
country/port vulnerable to unknown risks from non-target organisms.
For countries/ports which choose the selective approach, it will be essential to establish an organized
means of evaluating the potential risk posed by each vessel entering their port, through a Decision
Support System (DSS). Only in this way can they take the most appropriate decision regarding any
required action concerning that vessels' ballast water discharge. The DSS is a management system
that provides a mechanism for assessing all available information relating to individual vessels and
their individual management of ballast water so that, based upon assessed risk, the appropriate course
of action can be taken.
Before a pilot country decides on whether to adopt the `blanket' (i.e. all vessels) approach or to target
specific, identified high risk vessels only, a general, first-past risk assessment needs to be carried out.
This should look at shipping arrival patterns and identify the source ports from which ballast water is
imported. Once these are identified, source port/discharge port environmental comparisons should be
carried out to give a preliminary indication of overall risk. This will greatly assist the port state to
assess which approach to take.
The GloBallast programme, under Activity 3.1; will support these initial , `first-past' risk assessments
as a consultancy on contract to the PCU. This is important for establishing the level and types of risks
of introductions that each port faces, as well as the most sensitive resources and values that might be
threatened. These will differ from site to site, and will determine the types of management responses
that are required.
The PCU risk assessment consultants, in conducting the risk assessment in each pilot country, will
work with and train country counterpart(s) and include them in the study process as part of the
capacity building objectives of the programme, so as to allow each country to undertake its own risk
assessments in future.
3. Scope of the Risk Assessments
A Risk Assessment will be undertaken for each of the ports of:
· Sepetiba, Brazil;
· Dalian, China;
· Mumbai, India;
· Kharg Island, Iran;
· Saldanha, South Africa and
· Odessa, Ukraine.
2
Appendix 7: Consultants' Terms of Reference
The Risk Assessments will apply to all ship movements into and out of these ports based on shipping
data for the last 10 years (or longer if available).
4. Services Required & Tasks to be Undertaken
The GloBallast PCU requires a suitably qualified and experienced consultancy team to undertake the
ballast water risk assessments. The consultancy team will undertake the following Tasks, for each
demonstration site:
Task 1: Resource Mapping
Identify, describe and map on Geographic Information System (GIS) all coastal and marine resources
(biological, social/cultural and commercial) in and around the demonstration site that might be
impacted by introduced marine species.
Task 2: De-ballasting/Ballasting Patterns
Characterise, describe and map (on GIS) de-ballasting and ballasting patterns in and around the ports
including locations, times, frequencies and volumes of ballast water discharges and uptakes.
Task 3: Identify Source Ports
Identify all ports/locations from which ballast water is imported (source ports).
Task 4: Identify Destination Ports
Identify all ports/locations to which ballast water is exported (destination ports).
Task 5: Database - IMO Ballast Water Reporting Form
Establish a database at the nominated in-country agency for the efficient ongoing collection,
management and analysis of the data collected at the demonstration site according to the standard
IMO Ballast Water Reporting Form, and the data referred to under Tasks 2, 3 and 4.
Task 6: Environmental Parameters
Characterise as far as possible from existing data, the physical, chemical and biological environments
for both the demonstration site and each of its source and destination ports.
Task 7: Environmental Similarity Analysis
Using the data from Task 6 and an appropriate multivariate environmental similarity analysis
programme, develop environmental similarity matrices and indices to compare each demonstration
site with each of its source ports and destination ports, as the basis for the risk assessment.
Task 8: High Risk Species
Identify as far as possible from existing data, any high risk species present at the source ports that
might pose a threat of introduction to the demonstration site, and any high risk species present at the
demonstration site that might be exported to a destination port.
3
Ballast Water Risk Assessment, Port of Sepetiba, Federal Republic of Brazil, December 2003: Final Report
Task 9: Risk Assessment
For each demonstration site, assess and describe as far as possible, the risk profile for invasive marine
species being both introduced from its set of source ports and exported to its set of destination ports,
and identify the highest risk source and destination ports, using the outputs of Tasks 1 to 8 and based
on the environmental similarity indices developed under Task 7.
Task 10: Training & Capacity Building
While undertaking the risk assessment, provide training and capacity building to the in-country risk
assessment team (up to 10 people) in the risk assessment methodology, including use of database
established under Task 5 and the multivariate environmental similarity analysis programme
established under Task 7.
Task 11: Information Gaps
Identify any information gaps that limit the ability to undertake these Tasks and recommend
management actions to address these gaps.
5. Methods to be Used
The consultants should clearly outline in their Tender how each Task will be achieved. These should
comply with but are not necessarily restricted to the following:
Site Visits:
The consultants will undertake an initial one week (5 working days) visit to each demonstration site to
hold discussions with the CFP, CFP-A, port authority, maritime administration, environment
administration, fisheries/marine resources administration, marine science community and shipping
industry, to identify and obtain information and data for the various Tasks, establish a working
relationship with the in-country risk assessment team, conduct a site familiarisation to the
demonstration site (port) and to identify information gaps.
The consultants will undertake second 8 to 10 working day visit to each demonstration to install the
GIS, database and multivariate environmental similarity analysis programme and to provide training
and capacity building in their use and the overall risk assessment methodology to the in-country risk
assessment team.
Coordination:
The consultants will maintain close consultation and cooperation with the PCU Technical Adviser
(TA), who will manage this consultancy, and with the Country Focal Point (CFP) and CFP Assistant
(CFP-A) in each pilot country, who provide the primary contact point for all in-country activities and
for accessing in-country information and data.
Tasks 1& 2:
This will be restricted existing data only, field surveys are not provided for in the budget. The CFP
and/or CFP-A will compile as much existing information as possible in relation to Tasks 1 and 2 to
provide to the consultants.
The consultants should identify and evaluate any existing in-country databases and GIS for use in
these Tasks. The GIS should be tailored to suit the country's circumstances while ensuring user-
friendliness and consistency across all sites.
4
Appendix 7: Consultants' Terms of Reference
Tasks 3 & 4:
This will be restricted to existing data only. The CFP and/or CFP-A will compile as much existing
information as possible in relation to Tasks 3 and 4 to provide to the consultants. However, the
consultants should identify potential additional sources of data for these two tasks, including records
held by port authorities, shipping agents, customs agencies and similar, that may not have been
identified/compiled by the CFP/CFP-A.
Task 5:
The consultants should identify and evaluate any existing in-country databases for use in this Task.
The database should be tailored to suit the country's circumstances while ensuring user-friendliness,
consistency with the IMO Ballast Water Record Form and consistency across all sites.
Task 6:
This will be based on existing data only. The consultants should clearly outline in their Tender what
parameters will be used, and how the data for these parameters will be collected from the source and
destination ports.
Task 7:
The consultants should clearly outline in their Tender what multivariate environmental similarity
analysis programme will be used, and how it will be used.
Task 8:
The consultants should clearly outline in their Tender how this Task will be achieved, including how
relevant national and international invasive marine species records and databases will be accessed.
Task 9:
The consultants should clearly outline in their Tender how the outputs of Tasks 1 to 8, and in
particular Task 4, will be used to produce the risk profiles for each demonstration site, and what form
these will take.
Task 10 & 11:
The consultants should clearly outline in their Tender how these Tasks will be achieved.
6. Time Frame, End Product and Reporting Procedure
·
The risk assessments will be conducted for each of the six demonstration sites in the second
half of 2001 and into the first half of 2002. A detailed workplan and timeline will be proposed by
the consultant in their Tender and the precise timing for each site will be refined through
consultation with each country, once the contract is awarded.
·
The end product of this consultancy will be the establishment of the databases, GIS's,
multivariate environmental similarity analysis programmes and risk assessment outputs at each
demonstration site, including training in their use.
·
There will also be a report for each demonstration site which addresses as fully as possible all
of the Tasks under section 4, consistent with all parts of these Terms of Reference and the
5
Ballast Water Risk Assessment, Port of Sepetiba, Federal Republic of Brazil, December 2003: Final Report
consultancy contract. Results presented should be supported by maps, figures, diagrams and
tables here useful.
·
Each report should be submitted to the PCU in draft form first, for review by the PCU and
the demonstration site risk assessment team. The final report for each site will be submitted to the
PCU within one month of the consultants receiving review comments.
·
The PCU may arrange for peer review of the draft reports, to ensure scientific credibility and
quality control.
·
The final reports should be submitted to the PCU in both hard-copy and electronic form,
including figures, images and data, ready for publication. The PCU will publish each final report
in both English and the main language of the pilot country (if different).
7. Selection Criteria
· Cost effectiveness.
· Demonstrated record of meeting deadlines and completing tasks within budget.
· Extensive experience with the issue of introduced marine species.
· Extensive experience with the issue of ballast water.
· Extensive experience with risk assessment in relation to introduced marine species and ballast
water.
· Demonstrated abilities in literature search and review and in identifying and obtaining reports,
publications, information and data from sometimes obscure and difficult sources.
· Demonstrated skills in information analysis and synthesis.
· Experience in working in developing countries.
· Experience in training and capacity building in developing countries.
· Ability of the proposed methods and workplan to complete all Tasks satisfactorily.
8. Content of Tenders
The Tender should include the following:
· Total lump-sum price in US$D.
· Detailed cost break-down for all Tasks in US$ (NB. Total budget must not exceed US$250,000
and cost-effectiveness and competitiveness within this budget forms a primary selection criteria).
· Detailed workplan and provisional timeline for all Tasks outlined under section 4 above.
· Details of the methods proposed to achieve all Tasks, framed against each Task under section 4
above and consistent with section 5 above.
6
Appendix 7: Consultants' Terms of Reference
· CV's of each consultancy team member (maximum of 3 pages per person) (consultancy teams
should be kept as small as possible).
· Details of the consultancy's professional indemnity and liability insurance and quality assurance
procedures.
Further Information
Steve Raaymakers
Technical Adviser
Programme Coordination Unit
Tel +44 (0)20 7587 3251
Fax +44 (0)20 7587 3261
Email sraaymak@imo.org
7


GB Monograph Series 14b.qxd 5/25/04 9:46 AM Page 1
Ballast W
ater Risk Assessment
Global Ballast Water
Management Programme
G L O B A L L A S T M O N O G R A P H S E R I E S N O . 1 4
Port of Sepetiba, Federal Republic of Brazil
Ballast Water Risk Assessment
Port of Sepetiba
Federal Republic of Brazil
Final Report
DECEMBER 2003
Final Report
Chris Clarke, Rob Hilliard,
.dwa.uk.com
Andrea de O. R. Junqueira,
Alexandre de C. Leal Neto, John Polglaze
GLOBALLAST MONOGRAPH SERIES
& Steve Raaymakers
More Information?
el (+44) 020 7928 5888 www
Programme Coordination Unit
Global Ballast Water Management Programme
International Maritime Organization
4 Albert Embankment
London SE1 7SR United Kingdom
Tel: +44 (0)20 7587 3247 or 3251
est & Associates, London. T
Fax: +44 (0)20 7587 3261
Web: http://globallast.imo.org
NO.14
A cooperative initiative of the Global Environment Facility,
United Nations Development Programme and International Maritime Organization.
Cover designed by Daniel W