


Ballast W
a
ter Risk Assessment
Global Ballast Water
Management Programme
G L O B A L L A S T M O N O G R A P H S E R I E S N O . 1 2
Port of Dalian, People'
Ballast Water Risk Assessment
Port of Dalian
s Republic of China
People's Republic of China
Final Report
NOVEMBER 2003
Final Report
.dwa.uk.com
Chris Clarke, Rob Hilliard, Liuy Yan,
John Polglaze, Xu Xiaoman,
GLOBALLAST MONOGRAPH SERIES
Zhao Dianrong & Steve Raaymakers
More Information?
el (+44) 020 7928 5888 www
Programme Coordination Unit
Global Ballast Water Management Programme
International Maritime Organization
4 Albert Embankment
London SE1 7SR United Kingdom
Tel: +44 (0)20 7587 3247 or 3251
est & Associates, London. T
Fax: +44 (0)20 7587 3261
Web: http://globallast.imo.org
NO.12
A cooperative initiative of the Global Environment Facility,
United Nations Development Programme and International Maritime Organization.
Cover designed by Daniel W


GloBallast Monograph Series No. 12
Ballast Water Risk Assessment
Port of Dalian
People's Republic of China
November 2003
Final Report
Chris Clarke1, Rob Hilliard1, Liuy Yan3, John Polglaze1,
Xu Xiaoman3, Zhao Dianrong2 & Steve Raaymakers4
1 URS Australia Pty Ltd, Perth, Western Australia
2 Liaoning Maritime Safety Administration, Dalian
3 China Maritime Safety Administration, Beijing
4 Programme Coordination Unit, GEF/UNDP/IMO Global Ballast Water Management Programme, International
Maritime Organization
! International Maritime Organization
ISSN 1680-3078
Published in April 2004 by the
Programme Coordination Unit
Global Ballast Water Management Programme
International Maritime Organization
4 Albert Embankment, London SE1 7SR, UK
Tel +44 (0)20 7587 3251
Fax +44 (0)20 7587 3261
Email sraaymak@imo.org
Web http://globallast.imo.org
The correct citation of this report is:
Clarke, C., Hilliard, R., Liuy, Y., Polglaze, J., Zhao, D., Xu, X. & Raaymakers, S. 2004. Ballast Water Risk Assessment, Port
of Dalian, People's Republic of China, November 2003: Final Report. GloBallast Monograph Series No. 12. IMO London.
The Global Ballast Water Management Programme (GloBallast) is a cooperative initiative of the Global Environment Facility (GEF),
United Nations Development Programme (UNDP) and International Maritime Organization (IMO) to assist developing countries to reduce
the transfer of harmful organisms in ships' ballast water.
The GloBallast Monograph Series is published to disseminate information about and results from the programme, as part of the
programme's global information clearing-house functions.
The opinions expressed in this document are not necessarily those of GEF, UNDP or IMO.
Ballast Water Risk Assessment, Port of Dalian, People's Republic of China, November 2003: Final Report
Acknowledgements
The Ballast Water Risk Assessment for the Port of Dalian was undertaken during 2002 and funded by
the GEF/UNDP/IMO Global Ballast Water Management Programme and the Government of China.
The study team (Appendix 2) thanks the following for their help and assistance:
Mr Yang Weiqun
Dalian Port Authority, Dalian.
Mr Lu Fengtong
National Marine Environment Protection and Monitoring Centre,
State Administration of Oceanography, Dalian.
Dr Gustaaf Hallegraeff
University of Tasmania, Hobart, Tasmania.
Dr Keith Hayes
CSIRO Marine Research, Hobart, Tasmania.
Dr Chad Hewitt
Biosecurity Unit, New Zealand Ministry of Fisheries, Auckland.
Dr Fred Wells
Western Australian Museum, Perth, Western Australia.
The report was formatted and prepared for print by Leonard Webster.
i
Ballast Water Risk Assessment, Port of Dalian, People's Republic of China, November 2003: Final Report
Acronyms
BW
Ballast water
BWM
Ballast water management
BWRA
Ballast Water Risk Assessment
BWRF
Ballast Water Reporting Form (the standard IMO BWRF is shown in Appendix 1)
CFP
Country Focal Point (of the GloBallast Programme in each Pilot Country)
CFPA
Country Focal Point Assistant
CRIMP
Centre for Research on Introduced Marine Pests (now part of CSIRO Marine
Research, Hobart, Tasmania)
CSIRO
Commonwealth Scientific and Industrial Research Organisation (Australia)
DMU
Dalian Maritime University
DPA
Dalian Port Authority
DSS
Decision support system (for BW management)
DWT
Deadweight tonnage (typically reported in metric tonnes)
GIS
Geographic information system
GISP
Global Invasive Species Programme
GloBallast
GEF/UNDP/IMO Global Ballast Water Management Programme
GT
Gross tonnage (usually recorded in metric tonnes)
GUI
Graphic User Interface
IALA
International Association of Lighthouse Authorities
IBSS
Institute of Biology of the Southern Seas (Odessa Branch) of the Ukraine National
Academy of Science
IHO
International Hydrographic Organization
IMO
International Maritime Organization
IUCN
The World Conservation Union
LAT
Lowest Astronomical Tide
MESA
Multivariate environmental similarity analysis
MEPC
Marine Environment Protection Committee (of the IMO)
MSA
Maritime Safety Administration
NEMISIS
National Estuarine & Marine Invasive Species Information System (managed by
SERC)
NIMPIS
National Introduced Marine Pests Information System (managed by CSIRO,
Australia)
NIS
Non-indigenous species
OBO
Ore/bulk oil tankers (an rather unsuccessful vessel class now used for oil transport
only)
OS
Operating System (of any personal or mainframe computer)
PCU
Programme Coordination Unit (of the GloBallast Programme based at IMO London)
PRIMER
Plymouth Routines In Marine Environmental Research
PBBS
Port Biological Baseline Survey
ROR
Relative overall risk
SAP
(Regional) Strategic Action Plan
SERC
Smithsonian Environmental Research Center (United States)
VLCC
Very large crude carrier (200,000 300,000 DWT)
ULCC
Ultra large crude carrier (over 300,000 DWT)
ii
Ballast Water Risk Assessment, Port of Dalian, People's Republic of China, November 2003: Final Report
Glossary of Terms and Definitions
The following terms and definitions are summarised from various sources including Carlton (1985,
1996, 2002), Cohen & Carlton (1995), Hilliard et al. (1997a), Leppäkoski et al. (2002), Williamson et
al. (2002) and the GloBallast BWRA User Guide. The latter document contains more detailed
definitions with explanatory notes, plus a glossary of maritime terms.
Ballast water
Any water and associated sediment used to manipulate the trim and
stability of a vessel.
Bioinvasion
A broad based term that refers to both human-assisted introductions
and natural range expansions.
Border
The first entrance point into an economy's jurisdiction.
Cost benefit analysis
Analysis of the cost and benefits of a course of action to determine
whether it should be undertaken.
Cryptogenic
A species that is not demonstrably native or introduced.
Disease
Clinical or non-clinical infection with an aetiological agent.
Domestic
Intra-national coastal voyages (between domestic ports).
routes/shipping
Established
A non-indigenous species that has produced at least one self-sustaining
introduction
population in its introduced range.
Foreign routes/shipping
International voyages (between countries).
Fouling organism
Any plant or animal that attaches to natural and man-made substrates
such as piers, navigation buoys or hull of ship, such as seaweed,
barnacles or mussels.
Harmful marine species
A non-indigenous species that threatens human health, economic or
environmental values.
Hazard
A situation that under certain conditions will cause harm. The
likelihood of these conditions and the magnitude of the subsequent
harm is a measure of the risk.
Indigenous/native
A species with a long natural presence that extends into the pre-historic
species
record.
Inoculation
Any partial or complete discharge of ballast tank water that contains
organisms which are not native to the bioregion of the receiving waters
(analogous to the potentially harmful introduction of disease causing
agents into a body as the outcome depends on inoculum strength and
exposure incidence).
Intentional introduction
The purposeful transfer or deliberate release of a non-indigenous
species into a natural or semi-natural habitat located beyond its natural
range.
iii
Ballast Water Risk Assessment, Port of Dalian, People's Republic of China, November 2003: Final Report
Introduced species
A species that has been intentionally or unintentionally transferred by
human activity into a region beyond its natural range.
Invasive species
An established introduced species that spreads rapidly through a range
of natural or semi-natural habitats and ecosystems, mostly by its own
means.
Marine pest
A harmful introduced species (i.e. an introduced species that threatens
human health, economic or environmental values).
Non-invasive
An established introduced species that remains localised within its new
environment and shows minimal ability to spread despite several
decades of opportunity.
Pathogen
A virus, bacteria or other agent that causes disease or illness.
Pathway (Route)
The geographic route or corridor from point A to point B (see Vector).
Port Biological Baseline
A biological survey to identify the types of introduced marine species
Survey (PBBS)
in a port.
Risk
The likelihood and magnitude of a harmful event.
Risk assessment
Undertaking the tasks required to determine the level of risk.
Risk analysis
Evaluating a risk to determine if, and what type of, actions are worth
taking to reduce the risk.
Risk management
The organisational framework and activities that are directed towards
identifying and reducing risks.
Risk species
A species deemed likely to become a harmful species if it is introduced
to a region beyond its natural range, as based on inductive evaluation
of available evidence.
Translocation
The transfer of an organism or its propagules into a location outside its
natural range by a human activity.
Unintentional
An unwitting (and typically unknowing) introduction resulting from a
introduction
human activity unrelated to the introduced species involved (e.g. via
water used for ballasting a ship or for transferring an aquaculture
species).
Vector
The physical means or agent by which a species is transferred from one
place to another (e.g. BW, a ship's hull, or inside a shipment of
commercial oysters)
iv
Ballast Water Risk Assessment, Port of Dalian, People's Republic of China, November 2003: Final Report
Lead Agencies
Lead Agency for General BW Issues in China:
Contact person:
Mr Zheng Heping
Position:
Deputy Director-General of China MSA, and Country Focal Point,
GloBallast - China
Organization:
China Maritime Safety Administration
Address:
11 Jianguomennei Avenue, Beijing, P.R. China 100736
Tel: 86-(0)10-6529-2466
Fax:
86-(0)10-6529-2875
Email: zhengheping@msa.gov.cn
Web:
www.globallast-china.org
Primary contact for BW Risk Assessments in China:
Contact person:
Mr Zhao Dianrong
Position:
Country Focal Point Assistant, GloBallast - China
Organization:
China Maritime Safety Administration
Address:
11 Jianguomennei Avenue, Beijing, P.R. China 100736
Tel: 86-(0)10-6529-2862
Fax:
86-(0)10-6529-2875
Email:
vkdmdzhao@vip.sina.com
v
Ballast Water Risk Assessment, Port of Dalian, People's Republic of China, November 2003: Final Report
Executive Summary
The introduction of harmful aquatic organisms and pathogens to new environments via ships' ballast
water (BW) and other vectors has been identified as one of the four greatest threats to the world's
oceans. The International Maritime Organization (IMO) is working to address the BW vector through
various initiatives. One initiative has been the provision of technical assistance to developing
countries through the GEF/UNDP/IMO Global Ballast Water Management Programme (GloBallast).
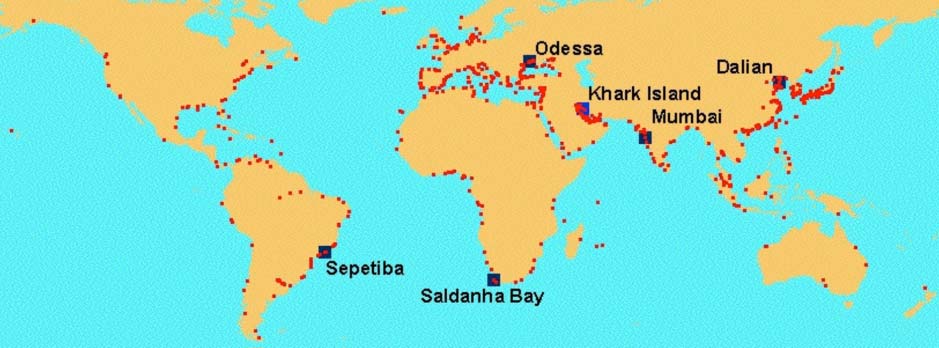
Core activities of the GloBallast Programme are being undertaken at Demonstration Sites in six Pilot
Countries. These sites are the ports at Sepetiba (Brazil), Dalian (China), Mumbai (India), Khark
Island (Iran), Odessa (Ukraine) and Saldanha Bay (South Africa). One of these activities (Activity
3.1) has been to trial a standardised method of BW risk assessment (BWRA) at each of the six
Demonstration Sites. Risk assessment is a fundamental starting point for any country contemplating
implementing a formal system to manage the transfer and introduction of harmful aquatic organisms
and pathogens in ships' BW, whether under existing IMO Ballast Water Guidelines (A.868(20)) or
the new international Convention.
To maximise certainty while seeking cost-effectiveness and a relatively simple, widely applicable
system, a semi-quantitative approach was followed, using widely-supported computer software. The
semi-quantitative method aims to minimise subjectivity by using as much quantitative data as
possible, to identify the riskiest ballast tank discharges with respect to a Demonstration Site's current
pattern of trade. Unlike a fully quantitative approach, it does not attempt to predict the specific risk
posed by each intended tank discharge of individual vessels, nor the level of certainty attached to such
predictions. However, by helping a Demonstration Site to determine its riskiest trading routes,
exploring the semi-quantitative BWRA provides a coherent method for identifying which BW sources
deserve more vessel monitoring and management efforts than others.
This report describes the BWRA activity undertaken for the Port of Dalian, which is the
Demonstration Site managed by the Dalian Port Authority (DPA) in close coordination with the
Liaoning Maritime Safety Administration (MSA). This capacity-building activity commenced in
January 2002, with URS Australia Pty Ltd (URS) contracted to the Programme Coordination Unit
(PCU) to provide BWRA training and software. Under the terms of reference, the consultants worked
closely with their counterparts in a project team co-managed by URS and the Country Focal Point
Assistant (CFPA) for completing all required tasks. These tasks required two in-country visits by the
consultants (in April and September 2002) to install the BWRA software and provide `hands-on'
instruction and guidance. Most of the data collation tasks were undertaken before, between and during
these visits, with gap-filling work undertaken by the consultants prior to a short `project wrap-up'
visit in March 2003.
The first step was to collate and computerise data from IMO Ballast Water Reporting Forms
(BWRFs) to identify the source ports from which BW is imported to the Demonstration Site. For
periods or vessel arrivals where BWRFs were not collected or were incomplete, gap-filling data were
extracted from the port shipping records held at the Dalian Port Authority's (DPA) port offices.
These records also helped identify which next ports of call may have been a destination port for any
BW taken up at Dalian.
A multivariate procedure was then used to determine the relative environmental similarity between
the Demonstration Site and each of its BW source and destination ports. Comparing port-to-port
environmental similarities provides a relative measure of the risk of organism survival, establishment
and potential spread. This is the basis of the `environmental matching' method adopted by the project,
which facilitates estimating the risk of BW introductions when the range and types of potentially
harmful species that could be introduced from a particular source port are poorly known.
Another objective of the BWRA was to identify `high-risk' species that may be transferred to and/or
from the Demonstration Site. The customised BWRA database provided by URS therefore contained
vi
Ballast Water Risk Assessment, Port of Dalian, People's Republic of China, November 2003: Final Report
tables and interfaces for storing and managing the names, distribution and other information on risk
species. The taxonomic details, bioregional distribution, native/introduced status and level of threat
assigned to a species were stored in the database for display, review and update as well as for the
BWRA analysis. For the purposes of the BWRA and its `first-pass' risk assessment, a risk species was
considered to be any introduced, cryptogenic or native species that might pose a threat to marine
ecological, social and/or commercial resources and values if successfully transferred to or from a
Demonstration Site.
During each visit the consultants worked alongside their Pilot Country counterparts to provide skills-
transfer as part of the capacity building objectives of the programme, with the project team divided
into three groups. Group A mapped the port and its resources using ArcView GIS. This group
included counterparts from the Liaoning MSA, who helped collate and compile much of the required
GIS data. Group B was responsible for managing the customised Access database supplied by the
consultants, and for entering, checking and managing the BW discharge data, as recorded on the
BWRFs voluntarily submitted by arriving ships and/or derived from the port's shipping records.
Group B used the database to identify BW source and destination ports, and it is designed for ongoing
input and management of BWRFs. Group C undertook the environmental matching and risk species
components of the Activity, using the PRIMER package to perform the multivariate analyses for
determining the environmental distances between Dalian and its source and destination ports.
The various BW discharge, environmental matching and risk species data described above were then
processed by the database with other risk factors, including voyage duration and tank size, to provide
preliminary indication of:
(a) the relative overall risk posed by each BW source port; and
(b) which destination ports appeared most at risk from any BW uplifted at the Demonstration Site.
This was achieved using a project standard approach, although the database also facilitates instant
modifications of the calculations for exploratory and demonstration purposes. The GloBallast BWRA
also adopted a `whole-of-port' approach to compare the subject port (Demonstration Site) with all of
its BW source and destination ports.
Liaoning MSA personnel at Dalian had started collecting BWRFs from international arrivals plus
domestic bulk carriers and oil tankers in July 2000. To provide confidence as to which ports were the
predominant sources of discharged BW, 3278 BWRFs collected between 1 August 2000 and 4 August
2002 were entered into the Access database during the project. The project therefore established at the
Dalian offices of the Liaoning MSA an integrated database and geographic information system (GIS)
that manages and displays:
· ballast water data obtained from the BWRFs of arriving ships;
· information on the Demonstration Site's navigational, physical and environmental conditions
and aquatic resources,
· port-to-port environmental matching data,
· risk species data, and
· risk coefficients and graphical categories of risk for BW discharges.
The results, which were graphically displayed on user-friendly GIS port and world maps as well as in
ranked output tables, help determine appropriate types of management focus and responses.
Of the 4319 ballast tank records in the Dalian BWRF database, the percentage showing there had been
zero discharge was high (82.4%). Of the 759 tank records with a discharge, these provided a total of
77 identifiable BW source ports. Of these ports, the top eighteen (23.4%) accounted for 75% of the
total number of source-identified tank discharges. The source port with the highest frequency of tank
discharges at Dalian was Shanghai (10.6%). This was followed by Qingdao (a regional port near
vii
Ballast Water Risk Assessment, Port of Dalian, People's Republic of China, November 2003: Final Report
Dalian; 7.4%), then Guangzhu (a major estuary port on the Pearl River in southern China; 6.6%),
Ningbo (north of Shanghai; 5.5%) and another regional port (Yantai; 5.5%).
The total volume of source-identified BW discharged at Dalian was 1,632,020 tonnes, with a further
159,219 tonnes (8.8%) discharged from unrecorded sources. The source ports providing the largest
recorded volume of discharged BW were the southern Guangdong Province ports of Zhuhai (8.9%)
and Chiwan (8.3%), followed by Korea's capital port of Inchon (7.5%), then Shanghai (7.2%). In fact
five of China's southern province ports were in the top seven that provided >50% of the total source-
identified volume discharged at Dalian. Nagoya was the top Japanese port (ranked 9th with 2.6% of
the total source-identified volume), while Sakai (ranked 12th at 2.5%) and five other Japanese ports
were in the top 20 ports ranked by discharged volume. Of the top 20 ports, ten were in China
(including Hong Kong), seven were in Japan and three in Korea, and these accounted for 83.6% of the
total volume.
Of the 77 identified BW source ports, it was not surprising that the most similar ports identified by the
multivariate environmental analysis were some of Dalian's geographically closest ports which share a
similar coastal aspect to the Bohai and northern Yellow Seas. Thus Longkou, Wei Hai, Yantai,
Shidao, Rushan, Laizhou, Qingdao and Rizhao all had environmental matching values (C3s) above
0.8. The environmentally closest foreign port (C3 of 0.78) was Mokpo in Korea, which also faces the
Yellow Sea. The most environmentally dissimilar ports trading with Dalian in 2000-2002 were the
river and estuary ports of the Yangste River system (0.20-0.37), plus warm water ports in south China
and south-east Asia.
The risk species threat from a source port depends on the number of introduced and native species in
its bioregion, and their categorizations as unlikely, suspected or known harmful species. A total of 84
native, cryptogenic and introduced risk species were collated for China's bioregions. These were not
considered to form part of a definitive global database but to provide a working resource for the `first-
pass' assessment and to enable convenient updates and refinement for each bioregion as more data
become available. The risk species in the Dalian bioregion included preliminary identifications from
the Dalian Port Baseline Biological Survey (PBBS) plus taxa listed in published and unpublished
reports collated by Group C members. Species native to the Bohai Sea/Yellow Sea bioregions with
harmful or suspected reputations in other regions were also added. These provide important
components for any `reverse' BWRA since many have already gained a harmful species status in parts
of Europe, the north-east Pacific and/or southern Australia (e.g. the Asian strangle weed, wakame
kelp, Chinese mitten crab, Asian clam, date mussel and Northern Pacific starfish).
The database calculates the relative overall risk (ROR) of a potentially harmful introduction for all
source ports that have C1-C4 coefficients and R1-R2 factors. Thus the ROR value for each BW
source port represents a proportion of the total marine invasive species threat posed to Dalian as result
of its trading pattern in 2000-2002, as indicated by the BWRFs. From the 3278 BWRF records, the
project standard method ranked 11 of the 77 source ports as representing the highest risk group in
terms of their BW source frequency, volume, environmental similarity, voyage distance and assigned
risk species. These ports were all regionally close to Dalian and provided the top 20% of the total
ROR, with individual ROR values above 0.3. This highest risk group was led by Yantai (ROR =
0.354; S-ROR = 1.0) followed by Qingdao (ROR = 0.344; S-ROR = 0.96) and Longko (0.343; 0.95),
with the Korean port of Inchon being the highest risk foreign port (ranked 10th with an ROR of 0.302
and S-ROR of 0.78).
The highest ranked port located beyond the Bohai-Yellow Sea region was Iwakuni (in Japan's inland
Seto Sea). With an ROR of 0.297 (S-ROR = 0.76), Iwakuni was ranked 14th overall and 3rd in the
second group (i.e. high risk ports). The highest ranked ports beyond East Asia were on the American
west coast (Long Beach and San Francisco; ranked in the lowest group of risk ports with RORs of
0.215 and 0.202 (S-RORs of 0.41 and 0.35 respectively). These ports fell into the lowest risk group
because of their smaller contribution to the overall threat, as represented by the BWRFs collected in
2000-2002. Thus while their environmental matching coefficients were moderately high (C3s of 0.62
viii
Ballast Water Risk Assessment, Port of Dalian, People's Republic of China, November 2003: Final Report
and 0.65), their voyage duration factor (R2) and low incidence of recorded BW discharges resulted in
the low ranking. However the percentage contribution made by Long Beach (1.13%) and San
Francisco (1.06%) to Dalian's overall risk (100%) was not substantially lower than those of the
highest ranked ports (contributions all in the 1.6% - 1.9% range). The source port with the lowest
ROR (0.119; S-ROR = 0.0) was Los Angeles in southern California, which represented 0.62% of the
total threat. The 38 source ports grouped in the low (16 ports) and lowest (22 ports) risk categories
were a mixture of river, estuarine and/or warmer water ports in Asia and north America. In summary,
the results generated by the project-standard `fist-pass' method highlighted the following:
· Dalian's pattern of trade makes it one of the key regional `hub' ports of East Asia;
· Dalian appeared to receive very little BW transferred directly from distant overseas ports in
2000-02;
· BW arriving in vessels from riverine and warm water ports presented much less threat than
from open coastline ports in the Bohai and Yellow Sea region, not only because of the latter's
high environmental matching but also their short voyage durations and high level of BW
transfers.
This indicates that Dalian's trade makes it more prone to introductions of species which `port-hop'
after establishing in one or more of its commonly-traded regional ports in north China, Korea and
Japan, rather than by introductions directly from America, Europe or other distant regions. The results
appeared logical given Dalian's biogeographic location and recent pattern of trade, and will provide a
very useful benchmark for any investigative manipulations of the risk formula or database
management.
The results also implied that any introduced species which establishes in one of the many ports along
the Bohai and Yellow Sea coastline may rapidly spread owing to the high level of coastal shipping. In
this context, there is no doubt that northern China is experiencing a number of invasive species, both
known and cryptogenic, some of which are contributing to the increased fouling and noxious red tide
problems of the intensive mariculture operations, which form an important part of its coastal
economy. These problems have been most felt in the Bohai Sea due its progressive eutrophication in
recent decades, but increased fouling and red tide events are being noticed along parts of the Yellow
Sea and Korea Bay coastlines. Since China's extensive coastline extends well into the tropics and
supports numerous small ports serviced by a large coastal trading fleet, the issue of water-borne
parasites and pathogens that can threaten commercially cultured species and/or public health was also
noted.
Of the various BWRA objectives and tasks, reliable identification of destination ports that may
receive BW from Dalian was confounded by the lack of specific questions on the IMO-standard
BWRFs, and the uncertainty of knowing if the Next of Port Call recorded on a BWRF is where this
BW is actually discharged. Thus presently there is no mechanism enabling a `reverse BWRA' to be
undertaken reliably. In the case of Dalian, several types of visiting vessels do not uniformly discharge
or uptake their full capacity of ballast water (especially general cargo ships, container and Ro-Ro
vessels), with many of their previous and next ports of call involving part discharge and loading of
cargo.
Of the 121 assumed BW destination ports identified by the 2000-2002 database, the Bohai Sea port of
Tianjin (13.1% of all departures from Dalian), the Korean port of Pusan (12.5%) and the nearby
Chinese port of Qingdao (9.6%) stood out as the most frequently cited Next Ports of Call, a feature
related to the large number of container and other liner services operating to these ports. Of the top 22
destination ports (accounting for >80% of all reported Next Ports of Call), 14 were in China
(including Hong Kong), seven were in Japan and only one was Korean (Pusan).
Two of the three most frequent presumed BW destination ports had relatively high environmental
matching coefficients (i.e. Tianjin and Qingdao with C3s of 0.71 and 0.82), while Pusan was less
similar (C3 of 0.44). The most common Japanese destination ports (Kobe at 3.2% and Moji at 3.0%)
ix
Ballast Water Risk Assessment, Port of Dalian, People's Republic of China, November 2003: Final Report
are in Japan's Seto Sea and had intermediate C3 values (0.69 and 0.57 respectively). If more reliable
forward-looking BWRAs are to be undertaken to identify destination ports in the future, supplementary
questions will need to be added to the present BWRF, including the names of the three last ports of call
as well as the port where discharges from each partially or completely ballasted tank are predicted.
The main objectives of the BWRA were successfully completed during the 14 month course of this
project, with the various tasks and exploratory/demonstration software providing a foundation enabling
the regional promulgation of further BW management activities by China. Project outputs included a
trained in-country risk assessment team, an operational BWRA system and User Guide for use as a
demonstration tool in the region and recommendations regarding the future use of BW risk assessment
in and beyond China. This places China in a good position to provide assistance, technical advice,
guidance and encouragement to other port States in the East Asian region.
x
Ballast Water Risk Assessment, Port of Dalian, People's Republic of China, November 2003: Final Report
Table of Contents
Acknowledgements......................................................................................................................................i
Acronyms......................................................................................................................................................ii
Glossary of Terms and Definitions ..........................................................................................................iii
Lead Agencies..............................................................................................................................................v
Executive Summary ...................................................................................................................................vi
1
Introduction and Background .........................................................................................................1
2
Aims and Objectives .........................................................................................................................5
3
Methods ..............................................................................................................................................6
3.1
Overview and work schedule...................................................................................................................6
3.2 Resource mapping of the demonstration port.........................................................................................8
3.3 De-ballasting/ballasting patterns ...........................................................................................................10
3.4 Identification
of source ports..................................................................................................................10
3.5 Identification
of destination ports ...........................................................................................................12
3.6 BWRF
database.....................................................................................................................................13
3.7
Environmental parameters.....................................................................................................................15
3.8 Environmental
similarity analysis...........................................................................................................17
3.9
Risk species ...........................................................................................................................................18
3.10 Risk assessment ....................................................................................................................................22
3.11 Training and capacity building ...............................................................................................................27
3.12 Identification
of information gaps...........................................................................................................28
4
Results ............................................................................................................................................. 30
4.1 Description
of port ..................................................................................................................................30
4.2 Resource mapping .................................................................................................................................35
4.3 De-ballasting/ballasting patterns ...........................................................................................................36
4.4 Identification
of source ports..................................................................................................................41
4.5 Identification
of destination ports ...........................................................................................................43
4.6
Environmental similarity analysis ..........................................................................................................45
4.7
Risk species ...........................................................................................................................................49
4.8
Risk assessment results ........................................................................................................................53
4.9
Training and capacity building ...............................................................................................................56
4.10 Identification
of information gaps...........................................................................................................58
5
Conclusions and Recommendations .......................................................................................... 60
5.1
Recommendations .................................................................................................................................60
5.2
BWRA recommendations and plans by Pilot Country ..........................................................................61
6
Location and maintenance of the BWRA System...................................................................... 62
References................................................................................................................................................. 63
APPENDIX 1: Copy of IMO Ballast Water Reporting Form
APPENDIX 2: Risk Assessment Team for Port of Dalian
APPENDIX 3: Check-list of project requirements
APPENDIX 4: Information sources used for collating Port Environmental Data
APPENDIX 5: Sources and references of Risk Species information
APPENDIX 6: Name, UN code, coordinates and environmental parameters of the 357 ports
used for the multivariate similarity analyses for all Demonstration Sites
APPENDIX 7: Ships, trade and ballasting statistics for the multi-use Dayaowan terminal at
Dalian
APPENDIX 8: Consultants' Terms of Reference
xi
Ballast Water Risk Assessment, Port of Dalian, People's Republic of China, November 2003: Final Report
Figure 1.
Locations of the six GloBallast Demonstration Sites and their various ballast water source
and destination ports. .............................................................................................................................. 3
Figure 2.
Location of Dalian and other ports in East Asia...................................................................................... 4
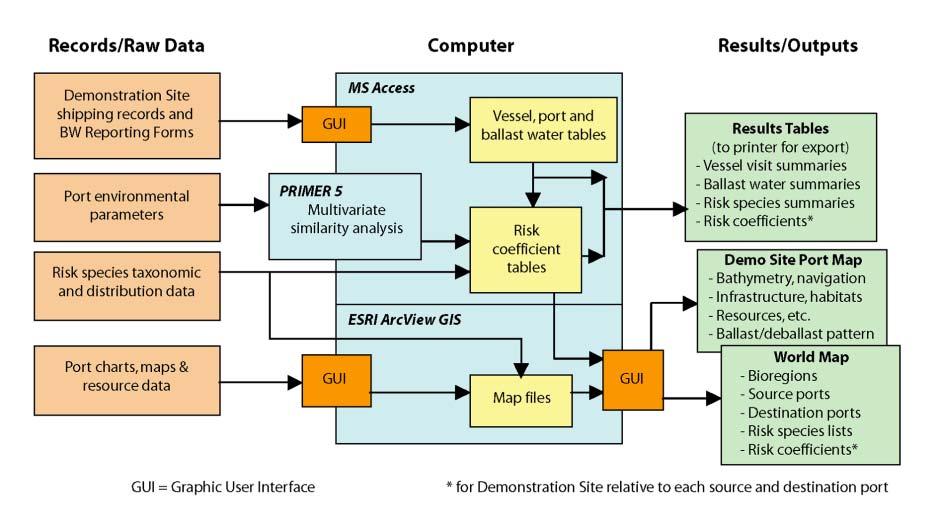
Figure 3.
Schematic of the GloBallast BWRA system ........................................................................................... 6
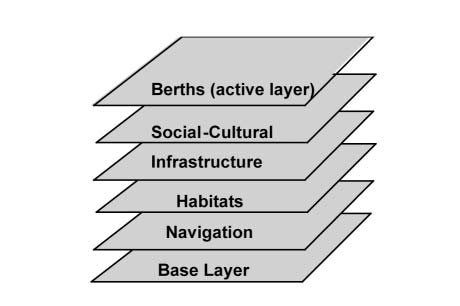
Figure 4.
Thematic layers used for the Port Map GIS............................................................................................ 9
Figure 5.
Working page of the Excel spreadsheet used to estimate BW discharges ......................................... 12
Figure 6.
The three tabs of the GUI used for entering the BWRF data............................................................... 15
Figure 7.
Part of the GIS world map of marine bioregions, showing the code names of those in the
East Asian region................................................................................................................................... 19
Figure 8.
Complete GIS world map showing the marine bioregions
[to improve clarity, not all bioregion codes are shown in this example]............................................... 20
Figure 9.
Database GUI used for manipulating the BWRA calculation and weightings ..................................... 23
Figure 10.
Annual wind rose typical of the Dalian Bay region ............................................................................... 30
Figure 11.
Surface-water current plots in Dalian Bay............................................................................................. 31
Figure 12a. Part of the GIS Port Map showing the navigation, infrastructure and active berth layers
on the west side of Dalian Bay .............................................................................................................. 34
Figure 12b. Part of the GIS Port Map showing the navigation, infrastructure and active berth layers
on the east side of Dalian Bay............................................................................................................... 34
Figure 13.
GIS Port Map showing the marine habitat and mariculture layers....................................................... 35
Figure 14.
BW discharge statistics displayed by GIS Port Map for the Xingang oil terminal ............................... 39
Figure 15.
BW discharge statistics displayed by GIS Port Map for the Siergou terminal ..................................... 39
Figure 16.
BW discharge statistics displayed by GIS Port Map for the Dayaowan terminal ................................ 40
Figure 17.
BW discharge statistics displayed by GIS Port Map for the Ganjingzi terminal .................................. 40
Figure 18.
GIS outputs showing the location and relative importance of BW source ports
with respect to the frequency of tank discharges (C1) at the Port of Dalian. ...................................... 41
Figure 19.
GIS outputs showing location and relative importance of the source ports
with respect to the volume of tank discharges (C2) at Port of Dalian.................................................. 42
Figure 20.
GIS outputs showing the location and frequency of destination ports,
recorded as the Next Port of Call in the Port of Dalian BWRFs........................................................... 44
Figure 21.
GIS outputs showing the location and environmental matching coefficients (C3)
of BW source ports identified for the Port of Dalian ............................................................................. 46
Figure 22.
GIS output showing the location and environmental matching coefficients (C3)
of the destination ports identified for the Port of Dalian........................................................................ 46
Figure 23.
GIS outputs showing the location and risk species threat coefficients (C4)
of the BW source ports identified for the Port of Dalian ....................................................................... 50
Figure 24.
GIS outputs showing the location and categories of relative overall risk (ROR)
of source ports identified for the Port of Dalian .................................................................................... 54
Figure 25.
Frequency distribution of the standardised ROR values...................................................................... 56
xii
1
Introduction and Background
The introduction of harmful aquatic organisms and pathogens to new environments via ships' ballast
water (BW) and other vectors, has been identified as one of the four greatest threats to the world's
oceans. The International Maritime Organization (IMO) is working to address the BW vector through
a number of initiatives, including:
· adoption of the IMO Guidelines for the control and management of ships' ballast water to
minimize the transfer of harmful aquatic organisms and pathogens (A.868(20));
· developing a new international legal instrument (International Convention for the Control
and Management of Ships' Ballast Water and Sediments, as adopted by an IMO Diplomatic
Conference in February 2004); and
· providing technical assistance to developing countries through the GEF/UNDP/IMO Global
Ballast Water Management Programme (GloBallast).
Core activities of the GloBallast Programme are being undertaken at Demonstration Sites in six Pilot
Countries. These sites are the ports at Sepetiba (Brazil), Dalian (China), Mumbai (India), Khark
Island (Iran), Odessa (Ukraine) and Saldanha Bay (South Africa). Activities carried out at the
Demonstration Sites will be replicated at additional sites in each region as the programme progresses
(further information at http://globallast.imo.org).
One of GloBallast's core activities (Activity 3.1) has been to trial a standardised method of BW risk
assessment (BWRA) at each of the six Demonstration Sites. Risk assessment is a fundamental starting
point for any country contemplating implementing a formal system to manage the transfer and
introduction of harmful aquatic organisms and pathogens in ships' BW, whether under the existing
IMO Ballast Water Guidelines (A.868(20)) or the new Convention.
A port State may wish to apply its BW management regime uniformly to all vessels that call at its
ports, or it may wish to assess the relative risk of these vessels to its coastal marine resources and
apply its regime selectively. Uniform application or the `blanket' approach offers the advantages of
simplified administration and no requirement for `judgement calls' to be made. This approach also
requires substantially less information management effort. If applied strictly, the uniform approach
offers greater protection from unanticipated bio-invaders, as it does not depend on the reliability of a
decision support system that may not be complete. However, the key disadvantage of the strict blanket
approach are the BW management costs imposed on vessels which otherwise might not be forced to
take action. It also requires a substantial vessel monitoring and crew education effort to ensure all
foreign and domestic flagged ships are properly complying with the required BW management
actions.
A few nations have started to develop and test systems that allow more selective application of BW
management requirements, based on voyage-specific risk assessments. This `selective' approach
offers to reduce the numbers of vessels subject to BW controls and monitoring, and is amenable to
nations that wish to reduce the introduction, and/or domestic spread, of `targeted' marine species only.
More rigorous measures can be justified on ships deemed to be of high risk if fewer restrictions are
placed on low risk vessels.
For countries/ports that choose the selective approach, it is essential to establish an organized means
of evaluating the potential risk posed by each arriving vessel, through a `Decision Support System'
(DSS). However, this approach places commensurate information technology and management
burdens on the port State, and its effectiveness depends on the quality of the information and database
systems that support it. A selective approach that is based on a group of targeted species may also
leave the country/port vulnerable to unknown risks from non-targeted species.
1
Ballast Water Risk Assessment, Port of Dalian, People's Republic of China, November 2003: Final Report
Before a port State decides on whether to adopt the blanket or the selective approach, it needs to carry
out some form of risk assessment for each port under consideration. Ballast water risk assessments
(BWRAs) can be grouped into three categories1:
· Qualitative Risk Identification: this is the simplest approach, and is based on subjective
parameters drawn from previous experience, established principals and relationships and
expert opinion, resulting in simple allocations of `low', `medium' and `high' risk. However it
is often the case that subjective assessments tend to overestimate low probability/high
consequence events and underestimate higher probability/lower consequence events (e.g.
Haugom et al, in Leppäkoski et al. 2002).
· Semi-Quantitative Ranking of Risk: this `middle' approach seeks to increase objectivity and
minimise the need for subjective opinions by using quantitative data and ranking of
proportional results wherever possible. The aim is to improve clarity of process and results,
thereby avoiding the subjective risk-perception issues that can arise in qualitative approaches.
· Quantitative Risk Assessment: this is the most comprehensive approach which aims to
achieve a full probablistic analysis of the risk of BW introductions, including measures of
confidence. It requires significant collation and analysis of physico-chemical, biological and
voyage-specific data, including key lifecycle and tolerance data for every pre-designated
species of risk (`target species'), port environmental conditions, ship/voyage characteristics,
the BW management measures applied, and input and evaluation of all uncertainties. The
approach requires a high level of resourcing, computer networking and sophisticated
techniques that are still being developed1.
The purpose of GloBallast Activity 3.1 has been to conduct initial, first-pass BWRAs for each
Demonstration Site. To maximise certainty while seeking cost-effectiveness and a relatively simple,
widely applicable system, the middle (semi-quantitative) approach was selected.
The first step of the GloBallast method is to collate data from IMO Ballast Water Reporting Forms
(BWRFs) (as contained in Resolution A.868(20); see Appendix 1) to identify the source ports from
which BW is imported to the demonstration port. For periods or vessel arrivals where BWRFs were
not collected or are incomplete, gap-filling data can be extracted from port shipping records.
Source port/discharge port environmental comparisons are then carried out and combined with other
risk factors, including voyage duration and risk species profiles, to give a preliminary indication of
overall risk posed by each source port. The results help determine the types of management responses
required, while the BWRA process provides a foundation block enabling application of more
sophisticated BW management DSSs by Pilot Countries.
The GloBallast approach is not the only one available but is considered to combine the best elements
of the semi-quantitative method to provide useful results within the available budget (US$250,000
spread across the six pilot countries). It has also taken a `whole-of-port' approach which compares the
subject port (Demonstration Site) with all of its BW source and destination ports. The outputs include
published reports, trained in-country risk assessment teams and an operational BWRA system for use
as demonstration tools in each of the six main developing regions of the world, plus a platform and
database to facilitate further DSS development. The GloBallast BWRA activity has therefore
established an integrated database and information system to manage and display:
· ballast water data from arriving ship BWRFs and port shipping records;
· data on the demonstration port's physical and environmental conditions and aquatic
resources,
· port-to-port environmental matching data,
1 for further details see the GloBallast BWRA User Guide.
2
1 Introduction and Background
· risk species data, and
· ballast water discharge risk coefficients.
The results provide a knowledge base that will help the Pilot Countries and other port States to
evaluate the risks currently posed by BW introductions, identify high priority areas for action, and
decide whether to apply a blanket or selective BW management regime. If a selective regime is
adopted, vessel and voyage-specific risk assessments can then be applied using systems such as those
being developed and trialled by the Australian Quarantine & Inspection Service (AQIS Decision
Support System), Det Norsk Veritas in Norway (EMBLA system) and the Cawthron Institute in New
Zealand (SHIPPING EXPLORER), and/or by further development of the GloBallast system. If a
uniform approach is adopted, the results help identify which routes and vessel types warrant the most
vigilance in terms of BW management compliance checking and verification monitoring, including
ship inspections and ballast tank sampling.
The geographical spread and broad representativeness of the six Demonstration Sites also means that
the results help plug a very large gap in the existing global knowledge base. Figure 1 indicates the
broad global spread of the GloBallast risk assessment activity. As a result of this activity,
comprehensive data are now available on source port and destination port linkages, environmental
parameters, environmental matching coefficients, risk species and relative overall risk of BW
transfers for the six GloBallast Demonstration Sites and a total of 723 ports around the world. Project
outcomes will therefore place governments, scientists, the shipping industry and the general public in
a stronger, more enlightened position to deal with the BW problem.
Figure 1. Locations of the six GloBallast Demonstration Sites and their various ballast water source and
destination ports.
This report describes and presents the results of the first Ballast Water Risk Assessment (BWRA)
carried out for the Port of Dalian (P.R. China) during 2002. This GloBallast Demonstrate Site is a
large and rapidly modernising general cargo and bulk commodity handling port, located in north-east
China on the Bohai Peninsula, which has been extended and modified many times since its opening in
1899 as one of China's first free trade ports (Figure 2).
3
Ballast Water Risk Assessment, Port of Dalian, People's Republic of China, November 2003: Final Report
Figure 2. Location of Dalian and other ports in East Asia
4
2
Aims and Objectives
The aims of the GloBallast BWRA for the Port of Dalian were set by the GloBallast Programme
Coordination Unit (PCU), in accordance with Terms of Reference developed by the PCU Technical
Adviser (Appendix 8) and were to:
1. Assess and describe as far as possible from available data, the risk profile of invasive aquatic
species being both introduced to and exported from Dalian in ships' BW, and to identify the
source ports and destination ports posing the highest risk for such introductions.
2. Help determine the types of management responses that are required, and provide the
foundation blocks for implementing a more sophisticated BW management system for the
Port of Dalian.
3. Provide training and capacity building to in-country personnel, resulting in a fully trained risk
assessment team and operational risk assessment system, for ongoing use by the Pilot
Country, replication at additional ports and use as a demonstration tool in the region.
The specific objectives of the BWRA for the Port of Dalian were to:
1. Identify, describe and map on a Geographic Information System (GIS) all coastal and marine
resources (biological, social/cultural and commercial) in and around the port that might be
impacted by introduced marine species.
2. Characterise, describe and map (on GIS) de-ballasting and ballasting patterns in and around
the port including locations, times, frequencies and volumes of BW discharges and uptakes.
3. Identify all ports/locations from which BW is imported (source ports).
4. Identify all ports/locations to which BW is exported (destination ports).
5. Establish a database at the nominated in-country agency for the efficient ongoing collection,
management and analysis of the data collected at the Port of Dalian via standard IMO
BWRFs.
6. Characterise as far as possible from existing data, the physical, chemical and biological
environments for both Dalian and each of its source and destination ports.
7. Develop environmental similarity matrices and indices to compare the Port of Dalian with
each of its source ports and destination ports, as a key basis of the risk assessment.
8. Identify as far as possible from existing data, any high-risk species present at the source ports
that might pose a threat of introduction to the Port of Dalian, and any high-risk species
present at this port that might be exported to a destination port.
9. Identify any information gaps that limit the ability to undertake the aims and objectives and
recommend management actions to address these gaps.
5
3
Methods
3.1
Overview and work schedule
The BWRA Activity for the Port Dalian was conducted by URS Australia Pty Ltd (URS) under
contract to the GloBallast PCU, in accordance with the Terms of Reference (Appendix 8). The
consultants worked alongside their Pilot Country counterparts during the country visits to provide
training and skills-transfer as part of the capacity building objectives of the programme. Structure and
membership of the joint project team is shown in Appendix 2.
The consultants adopted an innovative, modular approach that integrated three widely used computer
software packages to provide a user-friendly tool for conducting, exploring and demonstrating semi-
quantitative BWRAs. As shown in Figure 3, the key software comprised:
· Microsoft Access - for the main database;
· PRIMER 5 [Plymouth Routines In Marine Environmental Research] - a versatile multivariate
analysis package from the United Kingdom enabling convenient multivariate analysis of the
port environmental data; and
· ESRI ArcView 3.2 Geographic Information System (GIS) - to graphically display the results
in a convenient, readily interpretable format using port and world maps.
Figure 3. Schematic of the GloBallast BWRA system
The work schedule commenced with project briefing meetings with personnel from all six
Demonstration Sites to arrange logistics and resource needs, during the third meeting of the
GloBallast Programme's Global Task Force, held in Goa, India on 16-18 January 2002 (Appendix 3).
The majority of tasks subsequently undertaken for the Port of Dalian were completed during two in-
country visits by the consultants (22-26 April and 9-21 September 2002), with information searches
and data collation undertaken by both consultant and pilot country team members between and after
these visits. A `project wrap-up' visit was subsequently made by one of the consultants on 17-19
March 2003.
6
3 Methods
The specific tasks of the week-long first visit were to:
· Install and test the Access, ArcView and PRIMER software and the functionality of the
computer system that was located in function rooms arranged by Liaoning MSA in Dalian.
· Familiarise the project team with the GloBallast BWRA method by seminar and work-
shopping.
· Commence GIS guidance and developing the port map for the Demonstration Site.
· Commence training on the use of the various Graphic User Interfaces (GUI) of the Access
Database for inputting and editing BW discharge data.
· Tour the port facilities at Dalian, obtain information on the ballasting practises of visiting
ships and gain an understanding of the coastal habitats and local marine resources.
· Review available BWRFs and port shipping records to identify trading patterns, vessel types,
key BW source ports and likely destination ports.
· Check available port environmental data and identify potential in-country and regional
sources of same.
· Commence listing risk species and identifying potential in-country or regional sources of
same.
· Identify critical information gaps and the data assembly work required before the second visit.
During the longer second visit by the consultants, the environmental and risk species data were added
to the database, more vessel arrival, BW and voyage data were entered and checked, the first BWRA
was undertaken, and a workshop was held to review the initial results and identify future actions.
During the third visit in March 2003, the consultants supplied the CFP-A with updated versions of the
database and BWRA User Guide on CD-ROM, which included additional source port environment
and risk species data (as obtained from the BWRA Activities conducted at the other five
Demonstration Sites). The results of the March 2003 version, plus subsequent minor corrections to
some of the vessel visit records, are reported here.
Throughout the schedule, the joint project team was divided into three groups to facilitate training and
progress (Appendix 2). Group A was responsible for developing the port map and graphically
displaying results via the GIS. All coastal and marine resources (biological, social/cultural and
commercial) in and around the port that might be impacted by aquatic bio-invasions were mapped
using the ArcView GIS, using specific layers to show the bathymetry, navigation aids, port
infrastructure and tables of the port's de-ballasting/ballasting patterns (including frequencies and
volumes of discharges and uptakes for the berth locations).
Group B was responsible for managing the customised Access database supplied by the consultants,
and for entering, checking and managing the BW data, as collated from the BWRFs submitted by
arriving ships (and/or derived from shipping records for periods or arrivals when BWRFs were not
obtained or incomplete). The Access database was designed for ongoing input and management of
future BWRFs.
The requirement for arriving ships to submit to the relevant port State authority a completed
form that complies with the IMO BWRF (Appendix 1) is a fundamental and essential first basic
step for any port State wishing to commence a BW management programme2.
2 Several port States (e.g. Australia) and Demonstration Sites (including Dalian) have produced their own
BWRFs, the latter using translated formats to permit improved BWRF understanding and completion by local
shipping. Such BWRFs need to include all questions of the IMO standard form. Problems arising from
voluntary submission of BWRFs are described in Section 4.10.
7
Ballast Water Risk Assessment, Port of Dalian, People's Republic of China, November 2003: Final Report
Group C was responsible for collating the port environmental and risk species data, undertaking port-
to-port environmental similarity analyses and performing the BWRA. Thirty four environmental
variables were collated for the Demonstration Site and the majority of its source and destination
ports3, including sea water and air temperatures, salinities, seasonal rainfall, tidal regimes and
proximity to a standardised set of intertidal and subtidal habitats. Where water temperature data or
salinity data could not be found for a source or destination port, values were derived for the riverine,
estuarine or coastal location of the port with respect to the temperature and salinity data ranges of its
IUCN marine bioregion, plus ocean maps depicting sea surface temperature/salinity contours at
quarter degree and degree scales (as obtained from the Australian Centre for Research on Introduced
Marine Pests [CRIMP; now CSIRO Marine Research], URS and other sources; Appendix 4).
The multivariate analysis of the port environmental data was undertaken using the PRIMER package,
with the similarity values between the Port of Dalian and its source and destination ports converted
into environmental matching coefficients then added to the database. Species in or near source ports
that were deemed to pose a threat if introduced to the Demonstration Site, together with species at the
Demonstration Site that might be exported to a destination port, were identified from all available
sources found by the project team. These sources included preliminary results from the Port
Biological Baseline Surveys (PBBS; as recently completed at each Demonstration Site by another
GloBallast Activity), plus searches of `on-line' databases such as those under ongoing development
by the Smithsonian Environmental Research Center (SERC), CSIRO Marine Research, the Baltic
Regional Marine Invasions Database and the Global Invasive Species Programme (GISP) (Appendix
5). The species taxonomic information and bioregional distributions were also added to the Access
database. The combined BW discharge, environmental matching and risk species coefficients
provided the basis of the semi-quantitative risk assessment.
Graphic User Interfaces (GUIs) customised by the consultants for the Access database and ArcView
GIS were used to generate results tables and graphical outputs that were displayed on interactive maps
of the Demonstration Site and World bioregions. The various BWRA outputs can be printed, exported
to other software, or viewed interactively to enhance the user-friendliness and management utility of
the system.
The methods used to attain each objective of the BWRA Activity are summarised in the following
sections, with technical details of the risk assessment procedures provided in the GloBallast BWRA
User Guide. This manual was developed by the consultants to facilitate BWRA training and
demonstrations for all six GloBallast Pilot Countries. The BWRA User Guide comprises a separate
document that accompanies this report, and is available from the GloBallast PCU
(http://globallast.imo.org).
3.2 Resource mapping of the demonstration port
The port resources were mapped using ArcView GIS to display the bathymetric, navigational and
infrastructure features, including habitats and social-cultural features. The scope of the Dalian port
map extends beyond the wide mouth of Dalian Bay to include Dayao Bay, the outer anchorages and
the neighbouring coastline. The map also extends south-west to include the edge of Dalian Bay and
landward to show the port's industrial and urban hinterlands.
3 The complete set of source and destination ports identified for the six Demonstration Sites (723) remained
unknown until the end of the BWRF/port record data collation, database entry and checking phases (i.e. end of
the second round of in-country visits; 22 December 2002). A gap-filling effort was made by the consultants to
obtain the environmental parameters during January 2003, but this had to focus on the most frequently
recorded of these ports, since there was insufficient time or resources to order charts and search for the
environmental data for all of them (the majority of which were associated with few or only single vessel
arrivals). For these ports, their environmental matching values were provided by a comparison method
described in Section 4.6.
8
3 Methods
Parts of the western and northern Dalian Bay was available in several MapInfo GIS files at the Dalian
Maritime University (DMU), and these were translated into ArcView format to help develop the base
layer. However there was no subtidal or navigational information, and no vector-based electronic
nautical charts were available for the region. Group A counterparts therefore generated the
bathymetry and navigation layers by capturing the salient details of port bathymetry, infrastructure,
shipping channels and anchorages from georeferenced, 360 dpi colour scans of the Dalian Bay
nautical charts (BA 1255 and China national hydrographic chart).
Infrastructure and social/cultural information was captured by scanning and georeferencing urban
maps showing transportation lines and land use areas. Point and pattern symbols were based on the
international IHO/IALA system for nautical charts. Capture of the various intertidal and subtidal
habitats was undertaken by digitising an annotated copy of the Dalian Port chart provided by Group
C. For clarity and convenience of data management and display, each `theme' of information was
added as a separate layer that followed the scheme shown in Figure 4.
Figure 4. Thematic layers used for the Port Map GIS
The protocol for the five main layers are described in the BWRA User Guide and summarised below:
Base Layer: The base layer includes important planimetric features such as depth contours, jetties,
important channels and other permanent or at least semi-permanent `reference' features that are
unlikely to change or move. The key features of the base layer for the Port of Dalian comprised:
· Coastlines of the mainland and various islands within Dalian Bay (as depicted by the high tide
mark on the nautical charts).
· The low tide mark (i.e. the 0 metre bathymetric contour of hydrographic charts).
· 5 metre isobath (often the first continuous contour below the low tide mark).
· 10 metre, 20 metre and 30 metre isobaths.
· Edges of the main shipping channels (often blue or purple lines showing the boundary of
depths maintained by port dredging programs).
The colour scheme of the base layer followed that of standard nautical charts to maintain the familiar
land/sea depth effect.
Navigational Layer: The standard navigational symbols of the IHO/IALA system were followed as
closely as possible. ArcView's symbol libraries do not contain these international navigation symbols,
and convenient third-party symbology could not be found despite extensive searches of public domain
web resources. Closest-match point and pattern symbols were therefore developed for this purpose,
using the UK Hydrographic Office Chart No. 5011 (= IHO INT 1) as the source. The fairway
boundaries and dredged approach channels, together with the anchorages designated by the Dalian
9
Ballast Water Risk Assessment, Port of Dalian, People's Republic of China, November 2003: Final Report
Port Authority (DPA) and the seven individual super tanker anchorage points near the Xingang oil
terminal, were also included.
Habitat Layer: This layer used a standardised, logical colour scheme to facilitate recognition of the
main intertidal and subtidal habitat types in and near the port. It contains coastal habitat information
provided by Group C, with some of the natural and artificial habitat boundaries based on field notes
and map annotations made by Group C team members during the shoreline port tour in the second
consultant's visit, plus seafloor sediment information provided by a Group C member involved in the
Dalian PBBS. Two port tours had been undertaken, one by port launch on 22 April 2002 (which
rapidly became constrained by coastal fog reducing visibility to ~200 m) and a second more extensive
tour by vehicle and on foot on 15 September 2002. Delineation of some intertidal and subtidal habitat
boundaries was supplemented from seafloor and coastal features displayed on the nautical chart.
These included the sand and stony beaches, natural and artificial rocky shorelines, plus seafloor
symbols denoting the presence of sand, mud and rocky substrates.
Infrastructure Layer: This shows the urban and developed land areas near the port, including major
and minor roads and railway lines.
Social-Cultural Layer: Social-cultural features include the three different coastal reserves near the
port and two wildlife breeding grounds, plus the locations of seaweed, mussel and fish farm
mariculture sites in the Dalian port region.
Berth Layer: An `active' berth layer was added to show the nine principal terminals at the Port of
Dalian, following the names and numbering system used by the DPA. The same nomenclature was
also used for the berthing area information stored in the Access database, to allow display of statistical
summaries of the BW source and discharge data on the correct locations of the GIS port map (the
GloBallast BWRA User Guide shows how the database-GIS link is established).
3.3 De-ballasting/ballasting
patterns
The deballasting/ballasting patterns at Dalian were discussed with representatives from the DPA,
MSA and DMU during the first port tour to confirm the main types of port trade, its pilotage rules and
draft requirements, use of current anchorage areas and general deballasting/ballasting practises and
locations.
Further information was extracted from the BWRFs that Liaoning MSA had commenced collecting
from visiting ships on a voluntary basis in July 2000, plus checks of some of the port terminal
shipping records. Because Dalian has several dedicated bulk import and export terminals, for many
vessel visits it was relatively simple to confirm the BWRF records as to which ships had discharged
BW and where, by checking their berth location and vessel type. The situation at the general cargo
and container terminals was less clear, particularly for ballasting (i.e. BW uplift during cargo
unloading). Many ships arriving at the Dagang and Heizuzui terminals only part unload and/or load
cargo, and it was unclear how much ballast water these vessels were discharging and/or taking up.
This was particularly the case for the general cargo ships, small dry bulk carriers, reefers and ro-ro
vessels visiting the Dagang terminal, from which relatively few BWRFs were collected as Liaoning
MSA had focussed its BWRF collection effort on vessels and terminals identified as importing the
largest quantities of BW into Dalian.
3.4 Identification of source ports
Personnel from the Liaoning MSA had started collecting BWRFs from international arrivals plus
domestic bulk carriers and oil tankers during July 2000. These forms comprised facsimile copies of
the IMO and translated forms. To provide confidence as to which ports were the predominant sources
of BW discharged at Dalian, a total of 3,278 of the ~3,800 BWRFs collected between 1 August 2000
10
3 Methods
and 4 August 2002 were entered into the Access database. While data for previous and other ship
visits were probably held in archives at individual terminal offices (more than 14 different companies)
and national agencies such as Customs, obtaining and consolidating these records to produce a useful
data set4 would have been a major and very difficult task that was considered neither realistic nor
achievable by Liaoning MSA staff. Source ports were therefore identified from this two year BWRF
record, and no attempt was made to add additional visit information from terminal company shipping
records. Another reason for not attempting to collate pre-2000 visit records had been the halt in
overseas crude oil exports in 1999. This would have yielded BW sources no longer forming a
contemporary component of Dalian's trade.
BWRFs were first collected by port officers at Dalian in July 2000, and by August these were being
obtained from most international arrivals plus domestic bulk carrier and oil tanker arrivals, with a
focus on vessels arriving to load cargo. This pattern of BWRF collection was continued for two years,
with an average 140 BWRFs collected each month (range 43-213). While most ships conformed to
Liaoning MSA's request for BWRF submission, checks or follow-up verification queries of submitted
forms was not undertaken. The paper forms were stored in terminal batches until their entry into the
Access database between April and September 2002, a laborious exercise requiring virtually full-time
work by two MSA officers who received database training during the consultants first visit in April
2002 (Section 3.6). Before any new port was added to the database, its name and country spelling,
location coordinates, unique UN Port Code and bioregion number were checked using Lloyds'
Fairplay World Ports Guide and world bioregion list in the database (port data input is detailed in the
GloBallast BWRA User Guide).
For vessels which submitted incomplete forms with no BW source, gap-filling information potentially
available in terminal or Customs records would have provided only the Last Port of Call, which were
usually already present on the BWRF but may not be actual BW sources. To help identify which last
ports of call were probable sources, some cross-checking was made of the source ports and last ports
of call reported in other BWRFs by the same or similar vessels visiting the same terminal. For tankers
and bulk carriers arriving at export terminals with no BW source recorded on their BWRF, it was
assumed these had uplifted BW at their last port of call, as many were evidently engaged in regular,
shuttle-style trade. The Lloyds Fairplay Port Guide and Lloyds Ship Register5 were also used to
confirm source port trade and the vessel's IMO identification number, vessel type and DWT
respectively. A customised Excel spreadsheet supplied by the consultants was also used to check
claimed BW discharge volume6 (Figure 5).
Important gaps in the BWRFs could therefore be filled or checked, including the vessel name, type
and DWT, its previous visit history, last port/s of call, apparent charter/liner trade and claimed
discharge. However many incomplete BWRFs could not be filled to the level allowing the database to
add the record to its risk assessment calculations.
In the case of unusual (or missing) BW discharge values, these were checked using the Excel
spreadsheet to determine likely volumes, based on vessel type, DWT and cargo loading record. While
this spreadsheet could also be used to provide an estimate of BW uplifted by ships unloading cargo,
this was not possible for vessels arriving at the general cargo, container and multi-purpose berths
owing to the difficulty of accessing cargo loading/unloading details. In summary, the laborious
checking, gap-filling and data entry exercise of nearly 3,300 BWRFs required six months, with
incomplete or unusual BWRFs checked and gap-filled where possible using the Lloyds Ship Register,
Fairplay Port Guide and Excel spreadsheet to correct errors or add missing data, particularly for port
4 i.e. vessel name, IMO number, type, arrival and departure dates, berth, last and next ports of call, and cargo details.
5 A CD-ROM version of the 2001 Lloyds Ship Register was supplied to each Demonstration Site by PCU. These are much
faster to use than the large `directory style' hard-copy volumes.
6 The BW spreadsheet contains coefficients of ballast water taken up or discharged when loading or discharging
cargo (as percentages of DWT for each vessel type), based on ballast water capacity and discharge data from
other studies, BWRFs and Lloyds Ship Register.
11
Ballast Water Risk Assessment, Port of Dalian, People's Republic of China, November 2003: Final Report
details, vessel name, IMO number, type, DWT and BW discharge. Vessels with no IMO number
(181) received a unique `dummy' number (Section 3.6).
Figure 5. Working page of the Excel spreadsheet used to estimate BW discharges
3.5 Identification of destination ports
Since `prevention is better than cure', it is usually most effective to address environmental problems
as close to their source as possible. In the case of ballast-mediated aquatic bio-invasions, actions
helping prevent ships taking up harmful organisms from ballasting areas may be more effective than
trying to treat the organisms once they are inside the tanks, or trying to manage the problem at the
discharge port. To date, however, the majority of actions addressing ballast-mediated introductions
have been driven and undertaken by ports and port States that receive BW, with little activity
occurring at the locations of BW uptake. The GloBallast programme has therefore been attempting to
shift some of the focus from shipboard/point-of-discharge measures towards reducing the uptake of
organisms in the first place.
Knowing the destinations where departing vessels will discharge BW is an important step in helping
port States to reduce the spread of unwanted and potentially harmful species (either introduced or
native to their own ports) to their trading partners. It is also critical for preventing unwanted species
translocations between a State's domestic ports and/or its neighbouring foreign ports. Determining the
destinations of BW exported from the Demonstration Site was therefore an objective of the GloBallast
BWRA (Section 2).
Both the BWRFs and port shipping records for Dalian list the Next Port of Call of all departing
vessels, and these were added to the database for analysis. However the next port of call may not be
where BW carried by a departing ship is discharged, either fully or partly. For example, the next port
may be a bunkering, crew-change or maintenance port, a port where a `top-up' or other minor cargo is
loaded, or a convenient regional `hub' port where ships anchor and wait for new sailing instructions.
To overcome this problem, a supplementary question needs to be added to the present IMO BWRF,
i.e. requesting the name of the port where discharge from each ballast tank is predicted. These ports
can be predicted by ships engaged on a regular liner service (e.g. most container ships, vehicle
carriers, Ro-Ro ships, LNG carriers and some bulk carriers). However for other ship types (and
occasionally the former) ship officers cannot reliably anticipate where BW discharges will be
necessary. For example, for bulk carriers, general cargo ships and tankers engaged in spot charter
work (or when completing a charter period), these vessels may often depart in ballast having received
a general sailing order to proceed towards a strategic location until further instructions.
In the case of the Port of Dalian, there is considerable importation of crude oil, coal, grain and other
cargos requiring visiting vessels to uplift ballast water whilst unloading to maintain trim, stability and
12
3 Methods
air draft (i.e. space between the hatch coamings and gantries). The next ports of call were therefore
added to the vessel visit data and examined, so that the Pilot Country team could gain experience and
appreciate the problem of identifying ballast water destinations.
Adding the next port of call also improves the trading history for each vessel, and these can be useful
when trouble-shooting missing or incorrect BWRF data. As with the source ports, any new next port
of call added to the database was provided with its country name, UN Port Code, world bioregion and
location coordinates to enable its frequency of use by departing vessels to be displayed on the GIS
world map (port input details are in the GloBallast BWRA User Guide).
3.6 BWRF
database
The Access database developed by the consultants manages all items on the IMO standard BWRF.
Entry, editing and management of the BWRF records are undertaken using a series of GUIs, as
described in Section 2 of the BWRA User Guide. The three `tab' pages of the GUI used for general
BWRF data and the individual ballast tank inputs are shown in Figure 6.
Items not listed on the BWRF but required by the database to run the risk analysis and display the
results on the GIS include the geographic coordinates, bioregion and UN code (a unique five letter
identifier) of every source and destination port, plus the DWT and berthing location of every arrival at
the Demonstration Site.
Many berthing locations had to be identified from the port shipping records because the BWRA
objectives include identifying the locations within a Demonstration Site where deballasting/ballasting
occurs (Section 2). This was not insurmountable at Dalian owing to the discreteness of its berthing
terminals and usually the existence of a berth record for recorded BWRFs. Another item frequently
requiring look-up was the vessel's deadweight tonnage (DWT) since the BWRF requests only the
gross tonnage (GT). As noted in Section 3.4, adding the DWT (present in the Lloyds Ship Register)
enables convenient checks of reported volumes and gap-filling of missing values (see below).
Not all of the BWRF question fields need to be completed by a ship's officer to provide a visit record
that can be saved to the database and later included in the risk analysis. A basic visit record can be
established if three key items are entered. These are outlined in red on the input GUIs (Figure 6) and
are:
· Vessel identification - a unique 7 digit IMO number that remains the same for the life of the
ship, irrespective of any name changes;
· Arrival date; and
· A ballast tank code (which appears on the `Add Tank' sheet and provides an `All Tanks'
option for BWRFs that were submitted without individual tank details).
Without these items the database cannot save a vessel visit / tank record or any other associated
information. Whether or not a saved record is included by the database for the risk analysis depends
on which other BWRF fields were completed or gap-filled. Key items are the source port and volume
for each (or all) ballast tanks discharged, and the berthing location. As described in Sections 3.4 and
3.5, important BWRF information that is missing or incorrect can usually be substituted or corrected
by cross-checking with port shipping records, the Lloyds Ship Register and a comprehensive port
directory such as the Fairplay guide. However this is very time-consuming and, if there are no
convenient `look-up' features offered by the port's shipping record system, impractical. It is far more
efficient and reliable for port officers to ensure the BWRF has been filled in correctly and completely
at the time of submission, and to annotate the berth on this form prior to its dispatch to record
keepers/database entry (Section 4.10).
The Access database contains reference tables to hold the checked details of every vessel and port
previously added. A new visit record is therefore made by entering the arrival date then using a series
13
Ballast Water Risk Assessment, Port of Dalian, People's Republic of China, November 2003: Final Report
of drop-down lists to select the vessel, source port, last port, next port, destination port and tank
details (Figure 6). This avoids the need to re-enter the same information over and over again, as well
as the risk of generating false, `replicate' vessel, port or tank names due to spelling mistakes on the
BWRF.
Spelling mistakes on BWRFs were very common. All data-entry and database managers therefore
need to understand how to avoid transcribing such errors by carefully checking all names and ID
numbers using the database drop-down lists and, where necessary, by referring to a reliable ship
registry or port directory when entering the details of a new vessel or port respectively.
The most easily-trained and efficient database operators are those with previous port and maritime
experience since they (a) bring knowledge of the local shipping trade, (b) are familiar with the
problems of searching for vessel names (e.g. Tokyo Maru 2, Tokyo Maru II , Tokyo Maru No. 11 etc),
and (c) are aware that the official name of many ports in Europe, Africa and South America may be
quite different from the English name (e.g. Vlissingen versus Flushing).
14
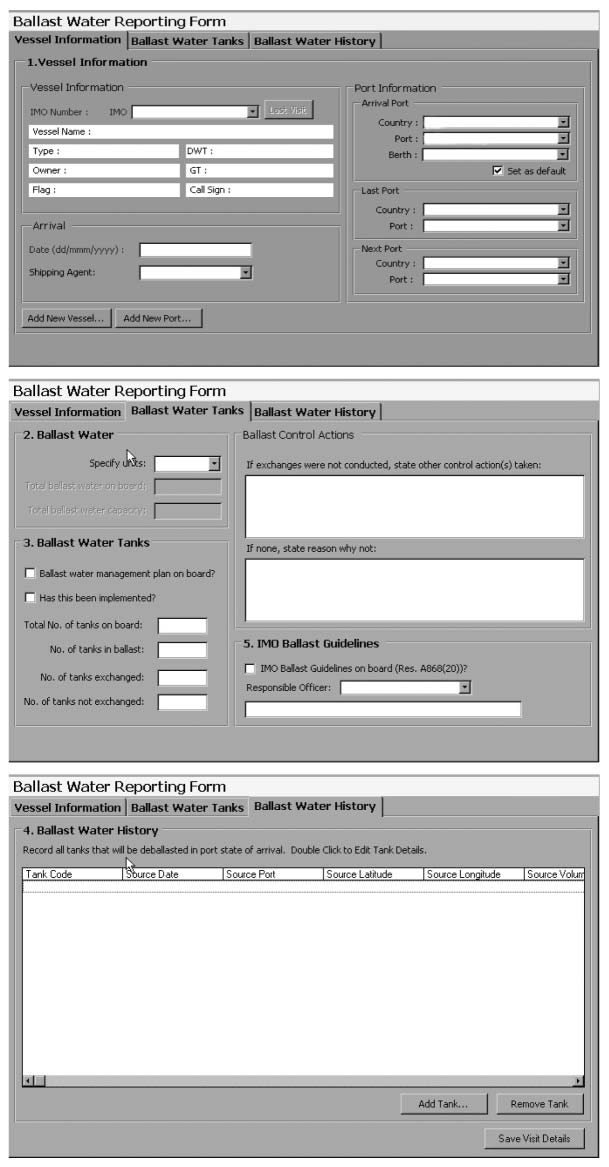
3 Methods
Figure 6. The three tabs of the GUI used for entering the BWRF data
3.7
Environmental parameters
During the briefing meetings in January 2002, the consultants provided a preliminary list of
environmental parameters that would be used to generate the environmental matching coefficients
between the Demonstration Sites and their main BW source ports and destination ports (Appendix 3).
15
Ballast Water Risk Assessment, Port of Dalian, People's Republic of China, November 2003: Final Report
The provisional list was based on review of previous port-to-port environmental analyses undertaken
for twelve trading ports in northeast Australia (Hilliard et al. 1997b). The final list of 34 parameters
used for the six Pilot Countries (Table 1) was selected in February 2002, during a joint review of the
provisional list by the consultants and scientists of the Institute of Biology of the Southern Seas
(IBSS) in Odessa7.
Table 1. Port environmental parameters used by the Environmental Similarity Analysis
Name
Variable Type
1.
Port type8
Categorical (1-6)
2.
Mean water temperature during warmest season (oC)
Scalable
3.
Maximum water temperature at warmest time of year (oC)
"
4.
Mean water temperature during coolest season (oC)
"
5.
Minimum water temperature at coolest time of year (oC)
"
6.
Mean day-time air temperature recorded in warmest season (oC)
"
7.
Maximum day-time air temperature recorded in warmest season (oC)
"
8.
Mean night-time air temperature recorded in coolest season(oC)
"
9.
Minimum night-time air temperature recorded in coolest season (oC)
"
10.
Mean water salinity during wettest period of the year (ppt)
"
11.
Lowest water salinity at wettest time of the year (ppt)
"
12.
Mean water salinity during driest period of year (ppt).
"
13.
Maximum water salinity at driest time of year (ppt).
"
14.
Mean spring tidal range (metres)
"
15.
Mean neap tidal Range (metres)
"
16.
Total rainfall during driest 6 months (millimetres)
"
17.
Total rainfall during wettest 6 months (millimetres)
"
18.
Fewest months accounting for 75% of total annual rainfall
Integer
19.
Distance to nearest river mouth (kilometres; negative value if upstream)
Scalable
20.
Catchment size of nearest river with significant flow (square kilometres)
"
Logarithmic distance categories (0-5): From the closest BW discharge location to nearest:
21.
Smooth artificial wall
Categorical
22.
Rocky artificial wall
"
23.
Wooden pilings
"
24.
High tide salt marsh/lagoon, saline flats or sabkah
"
25.
Sand beach
"
26.
Shingle, stony or cobble beach
"
27.
Low tide mud flat
"
28.
Mangrove fringe/mangrove forest
"
29.
Natural rocky shore or cliff
"
30.
Subtidal firm sandy sediments
"
31.
Subtidal soft muddy sediments
"
32.
Seagrass meadow9
"
33.
Rocky reef or pavement
"
34.
Coral reef (with carbonate framework)
"
The 34 parameters were steadily collated during course of BWRA activities for all Demonstration
Sites. They were taken or derived from data and information culled from a wide range of government,
port and scientific publications, internet web sites, port survey reports and sampling records, SST and
salinity charts, climate databases, atlases, national tide-tables, nautical charts, coastal sensitivity and
oil spill habitat maps, oil spill contingency plans, aerial photographs, national habitat databases and
local expert advice (Appendix 4). The most difficult to find were reliable water temperature and
7 Distance categories from the berthing area/s to the nearest rocky artificial wall, smooth artificial wall and
wooden artificial substrate were suggested by IBSS as they provide different types of hard port habitat.
8 Offshore terminal or mooring / Natural bay / Breakwater harbour / Tidal creek / Estuary / River port.
9 Kelp forest/macroalgae bank was not included but should be considered for future analysis.
16
3 Methods
salinity data, particularly for identifying the averages, maxima and minima for ports in or near
estuaries (Section 3.12).
A preliminary list of frequently recorded BW source ports and destination ports for the Port of Dalian
was made at the end of the first in-country visit in April 2002 (the complete list did not become
available until near the end of the second in-country visit; Section 3.1). It was agreed that the
environmental parameters for these ports should be sought between the first and second consultants'
visits, with Dalian's Group C members focussing on important ports in China, and the consultants
focussing on more distant ports in Asia, Europe, etc. To facilitate this task the consultants provided a
customised Excel spreadsheet for collating the environmental data, which included guidance and
reminder notes plus a format enabling direct export to PRIMER (Section 3.8).
Near the end of the second in-country visit, sufficient port environmental data had been collated to
generate environmental matching coefficients for approximately 25% of all ports identified as trading
with Dalian, with estimates provided for ports where unobtained/incomplete data prevented their
inclusion in the multivariate similarity analysis (Section 4.6). The percentage of ports with calculated
environmental coefficients was subsequently expanded by two gap-filling exercises undertaken by the
consultants in October 2002 (focussing on Japan and Korean ports) then between 22 December 2002
and 31 January 2003 (focussing on NW European, Mediterranean, African and American ports).
These were added to the updated BWRA provided at the third meeting in March 2003 (Section 3.1)
and reported here.
3.8 Environmental similarity analysis
The more a BW receival port is environmentally similar to a BW source port, the greater the chance
that organisms discharged with the imported BW can tolerate their new environment and maintain
sufficient numbers to grow, reproduce and develop a viable population. Comparing port-to-port
environmental similarities therefore provides a relative measure of the risk of organism survival,
establishment and potential spread. This is the basis of the `environmental matching' method, and it
facilitates estimating the risk of BW introductions when the range and types of potentially harmful
species that could be introduced from a particular source port or its bioregion are poorly known.
A limitation of the environmental matching approach is that several harmful species appear capable of
tolerating relatively wide temperature and salinity regimes10. As discussed, other risk factors include
the frequency of ship visits/BW discharges, the volume of BW discharged, voyage times and ballast
tank size and any management measures applied during the voyage. While environmental matching
alone does not provide a complete measure of risk, an analysis of `real world' invasions indicates that
if any one factor is to be used alone, environmental matching is probably the best single indicator of
risk.
Classic examples include the two-way transfer and relatively rapid spread of harmful and other
unwanted species between the Ponto-Caspian and North American watersheds (some via stepping
stones in western Europe, and northern Australian ports that have extremely high risk factors in terms
of frequency and volumes of BW discharges (the very large bulk export ports of Port Headland,
Dampier and Hay Point and smaller bulk export ports like Weipa and Abbot Point), but which have
not experienced any significant harmful invasions (due to a low environmental matching with their
source ports). Conversely, in southern Australia and in particular Tasmania, ports which have
relatively low risk factors in terms of frequency and volumes of BW discharges, have been the entry
points of the most harmful aquatic bio-invasions (due to a high environmental matching with their
source ports).
The environmental distances between the Port of Dalian and its source and destination ports were
determined using a multivariate method in the PRIMER package. Of the various distance measures
10 For example, the Asian date mussel (Musculista senhousia) has been reported from Vladivostok to Singapore.
17
Ballast Water Risk Assessment, Port of Dalian, People's Republic of China, November 2003: Final Report
available in PRIMER, the normalised Euclidean distance is the most appropriate. Normalisation of the
various input parameters removes the problem of scale differences, and the method can manage a mix
of scalable, integer and even categorical values, provided the latter reflect a logical sequence of
intensity or distance/location steps. Individual variables cannot be weighted but the predominance of
temperature variables (8) and salinity/salinity-related parameters (also 8; see Table 1) ensured they
exert a strong influence on the results. Air temperature extrema, rainfall and tidal parameters were
included owing to their influence on the survivorship of intertidal and shallow subtidal organisms11.
The similarity values produced by PRIMER were examined using its clustering and ordination
modules, then exported back to the Excel file for conversion into environmental matching coefficients
before insertion into the database12.
To provide consistent and comparable results, the similarity analysis was conducted on a wide
geographical range of ports; i.e. from cold water ports in high latitude areas to warm water ports in
tropical regions, as well as from up-river terminals to those located in relatively exposed offshore
waters. This avoids the possibility of generating spurious patterns among a set of ports located in
neighbouring and/or relatively similar regions. Collating the environmental parameters for the
frequent source and destination ports of all six Demonstration Sites into a single Excel spreadsheet
achieved this, as well as permitting direct comparisons between the results from these sites13.
The Excel file used for collating the port environmental data also contains linked spreadsheets used
for their export to PRIMER, as well as for re-importing the results and converting them into
environmental matching coefficients. In fact the database can import any type of environment
matching value obtained by any method, provided the values are placed in an Excel spreadsheet in the
format expected by the database's import feature. Details on the treatment of the environmental
variables and the production, checking, conversion and import of the similarity measures are given in
the BWRA User Guide.
3.9 Risk
species
One of the BWRA objectives was to identify `high-risk' species that may be transferred to and/or
from the Demonstration Sites (Section 2). The Access database was therefore provided with tables for
storing the names, distribution and other information on risk species. For the purposes of the BWRA
and its `first-pass' risk assessment, a risk species was considered to be any introduced, cryptogenic or
native species that might pose a threat if transferred from a source port to a Demonstration Site. The
taxonomic details, bioregion distribution, native/introduced status and level of threat assigned to a
species are also stored in the database and can be displayed for review, edit and update.
The database manages the bioregional locations and status of each entered species using the same
bioregions displayed on the GIS world map (Figures 7, 8). This map is used as a backdrop for
displaying the source and destination ports and associated BWRA results, and was compiled from a
bioregion map provided by the Australian Centre for Research on Introduced Marine Pests (CRIMP).
The boundaries of some bioregions were subsequently modified according to advice provided by
Group C marine scientists in five of the six the Pilot Countries, including Dalian. The modifications
included adding new bioregions for river systems to accommodate important river ports that trade
with one or more of the Demonstration Sites. In the case of Dalian, bioregions NWP-3 and NWP-4
11 While ecosystem disturbance, pollution, eutrophication and other impacts on habitats and water quality can
increase the `invasibility' of port environments (particularly for r-selected species), these were not included
owing to the problem of obtaining reliable measures of their spatial extent and temporal nature at each port.
12 As described in the BWRA User Guide, a simple proportional conversion of the similarity values was made
so that each matching coefficient lay between 1 (a perfect environmental match) and 0.01 (least matching),
since it is unsafe to assume a port environment can be totally hostile no matter how distant.
13 The total number of ports with a complete set of environmental parameters obtained by the end of the data
collation phase was 357. These were provided to all Demonstration Sites during the third consultant's visit
in February-March 2003 and used for this report.
18
3 Methods
were divided into two and three portions respectively because of community composition differences
in the Sea of Japan (NWP-4a) versus the Yellow Sea and Bohai Bay (NWP-3a/4c), and the Pacific
coastal waters east of Japan (NWP-3b/4b; Figure 7). The Yangtse system was also added to cater for
important river ports (NWP-3a-YR; Figure 7).
The map presently displays 204 discrete bioregions which are coded in similar fashion as those in the
IUCN scheme of marine bioregions from which they were derived (Kelleher et al. 1995; see
Appendix 3 of the GloBallast BWRA User Guide for details). Bioregions serve multiple purposes and
are required for several reasons. Many marine regions of the world remain poorly surveyed and have a
limited marine taxonomy literature. This causes a patchy and essentially artificial distribution of
recorded marine species distributions. Few marine species surveys have been undertaken in port
environments and there are very few bioregions which contain more than one port that has undertaken
a PBBS.
Bioregions represent environmentally similar geographic areas. Thus if a species is found established
in one part of a bioregion, there is a good chance it can spread via natural or human-mediated
processes to other sites in the same bioregion. A conservative approach was therefore adopted for the
GloBallast BWRA, whereby a risk species, if recorded in at least one location of a bioregion, is
assumed potentially present at all source ports within the same bioregion. This type of approach will
remain necessary until a lot more PBBSs are conducted and published. Because taxonomic analyses
of the PBBS samples of the Demonstration Sites had not been completed by the consultants second
visits, the reverse stance was adopted for these ports (i.e. it was assumed they did not contain any risk
species recorded at other location/s in their bioregion).
The corresponding set of bioregions stored in the database has particular sets of risk species assigned
to them. The species and associated data added to the database over the course of the Activity were
collated from a wide range of sources. These included a preliminary list of organisms found by the
recent GloBallast PBBS of Dalian (which became available during the second consultants visit).
Dalian and URS members of Group C also investigated the possible existence of introduced species
lists held by marine biologists in agencies and universities in other parts of China. No sources were
found except for the papers published by Morton and other Hong Kong-based marine researchers
(Appendix 5).
Figure 7. Part of the GIS world map of marine bioregions, showing the code names of those in the East Asian
region
19
Ballast Water Risk Assessment, Port of Dalian, People's Republic of China, November 2003: Final Report
Figure 8. Complete GIS world map showing the marine bioregions
[to improve clarity, not all bioregion codes are shown in this example]
20
3 Methods
Sources used for developing the risk species database are listed in Appendix 5 and included a range of
literature plus international and regional internet databases, including those being developed by the
Smithsonian Environmental Research Center's (SERC) National Estuarine & Marine Invasive Species
Information System (NEMISIS), CSIRO's National Introduced Marine Pests Information System
(NIMPIS), the Global Invasive Species Programme's (GISP) Global Invasive Species Database, and
the Baltic, Nordic and Gulf of Mexico web sites. The database used for the `first-pass' risk
assessments and provided to the Demonstration Sites during the consultants last visit (February 2003)
contains 421 species but these do not represent a complete or definitive global list. Thus the database
tables and their associated Excel reference file represent a working source and convenient utility of
risk species information that can be readily updated and improved.
To provide a measure of the risk species threat posed by each source port, the database analyses the
status of each species assigned to each bioregion and generates a set of coefficients that are added to
the project-standard calculation of relative overall risk (Section 3.10). The following description is
summarised from Section 6 of the GloBallast BWRA User Guide, which describes how the species
data are managed and used by the BWRA system.
The database allows each species to be assigned to one of three levels of threat, with each level
weighted in log rhythmic fashion as follows:
· Lowest threat level: This is assigned to species with no special status other than their
reported or strongly suspected introduction by BW and/or hull fouling14 in at least one
bioregion (i.e. population/s with demonstrated genetic ability to survive transfer and establish
in regions beyond their native range). A fixed weighting (1) is applied to each of these species
when present in bioregions outside their native range. This was also the default level assigned
to any new species when first added to the database.
· Intermediate threat level: This level is assigned to any species suspected to be a harmful
species or invasive pest. Risk species assigned to this level receive a default weighting value
of 3 in both their native and introduced bioregions.
· Highest threat level: This level is assigned to known harmful invasive species, as reported in
institutional or government lists of aquatic nuisance species and pests, and/or in peer-
reviewed scientific journals. The default weighting value applied to these species is 10.
The database allows users to change the threat status level assigned to each species, as well as the size
of the second and third level default weighting values. A third type of risk species weighting option is
also available. This can be used to proportionally increase the weight of all source port threat
coefficients by increasing its default value of 1. The four default values (1, 3, 10 and 1) provided a
`project standard' result to permit unbiased comparisons between the `first-pass' BWRA results for
each Demonstration Site.
The database calculated the coefficient of `risk species threat' posed by each source port, with each
port value representing a proportion of the total risk species threat. The latter was the sum of all
weighted risk species assigned to the bioregion of all source ports that export BW to the
Demonstration Site. Species assigned to more than one bioregion are summed only once, and the
algorhythm automatically discounted any species that was native in the Demonstration Site's
bioregion. It included any introduced species assigned to the bioregion of the Demonstration Site
14 At the outset of the project, species capable of transfer only by ballast water were planned to be added to
the database. However many species may be introduced by hull fouling as well as BW, with the principal
vector for many of these remaining unclear. Group C scientists in all Pilot Countries were unanimous in
their preference for including all species introduced by ballast water and/or hull fouling in the project
standard BWRA database. For future BWRAs a `vector status' value could be assigned to each species in
the database, so that risk assessments could be focussed on either or both of these shipping-mediated
vectors.
21
Ballast Water Risk Assessment, Port of Dalian, People's Republic of China, November 2003: Final Report
since, as discussed above, the Demonstration Site was assumed to be free of risk species. This was the
default position of the project-standard BWRA15.
The risk species coefficient for each source port is therefore calculated by firstly summing the number
of non-indigenous species (NIS) in that port's bioregion which have no suspected or known harmful
status. This provides a measure of the low level `weedy' and sometimes cosmopolitan species which,
although having no acknowledged harmful status, have proven transfer credentials that could enable
their establishment in another port with probably low but nevertheless unpredictable biological or
economic consequences. This number is then added to the sums of suspected and known harmful
species in the same bioregion (these include any native species identified as such by Group C local
scientists). The default calculation for the risk species coefficient for each source port (C) is thus:
CSource Port = (NIS + [Suspected Harmfuls x 3] + [Known Harmfuls x 10] ) / Total SumAll Source Ports
The C values lie between 0-1 and represent an objective measure of the relative total species threat,
since the only subjective components within the project standard BWRA database were the
`universal' assignments of species to particular levels of threat, plus the weightings attached to these
levels. Note that the C values for source ports inside the same bioregion will be the same, and that the
Total Sum divisor does not represent all species in the database, but only those assigned to bioregions
containing source port/s that actually trade with the Demonstration Site. It should also be noted there
are several limitations from incorporating a risk species coefficient into the default calculation of the
`first-pass' BWRAs. These included:
· Use of an incomplete list of species that were assigned to one of the three levels of threat
(introductions, suspected harmful species, known invaders).
· Significant knowledge gaps on the global distribution of many native, cryptogenic and
introduced species (as a consequence of the limited number of species surveys that remain
geographically biased to parts of North America, Europe and Australia/New Zealand).
· Gaps and constraints in the taxonomy and reliable identifications for many aquatic species
groups.
Such limitations must be taken into account when considering the weighting of the risk species
coefficient relative to the other risk factors such as environmental matching.
3.10 Risk assessment
Approach
The database employed the BW discharge, port environmental matching and bioregion species
distribution/threat data to calculate, as objectively as possible, the relative risk of a harmful species
introduction to a Demonstration Site, as posed by discharges of BW and associated organisms that
had been ballasted at each of its identified source ports. A GUI enabling convenient alteration of the
risk calculations and weighting values (Figure 9), plus use of ArcView to geographically the display
results, improves the system's value as an exploratory utility and demonstration tool.
The semi-quantitative method aims to identify the riskiest tank discharges with respect to a
Demonstration Site's present pattern of trade. Unlike a fully quantitative approach, it does not attempt
to predict the specific risk posed by each intended tank discharge of individual vessels, nor the level
of confidence attached to such predictions. However, by helping a Demonstration Site to determine its
riskiest trading routes, exploring the semi-quantitative BWRA provides a coherent method for
identifying which BW sources deserve more vessel monitoring and management efforts than others,
plus the significance of local, regional and distant trading routes and associated vessel types.
15 When the taxonomic identifications of the recent port biological baseline surveys are completed, risk species confirmed
as already present at a Demonstration Site may be identified for the BWRA database maintained for that site. Their
deletion would reduce the size of the risk species coefficients obtained by the `first-pass' BWRA such as reported here,
but the revised database should not be copied for undertaking other port BWRAs.
22
3 Methods
Figure 9. Database GUI used for manipulating the BWRA calculation and weightings
Risk coefficients and risk reduction factors
For each source port, the database used four coefficients of risk (C1-C4) and two risk reduction
factors (R1, R2) to produce a relative overall measure of the risk of a harmful species introduction at
the Demonstration Site. The database GUI shown in Figure 9 can be used to remove one or more of
these components, or alter the way they are treated, from the default `project-standard' formula which
was used for the first-pass BWRA. The four risk coefficients calculated for each source port were:
C1 proportion of the total number of ballast tank discharges made at the Demonstration Site,
C2 proportion of the total volume of BW discharged at the Demonstration Site,
C3 port-to-port environmental similarity, as expressed by the matching coefficient,
C4 source port's contribution to the total risk species threat to the Demonstration Site, as posed
by the contemporary pattern of trade (1999-2002).
In biological terms, C1 and C2 represent the frequency and size of organism `inoculations'
respectively. C3 provides a measure of the likely survivability of these inoculated organisms, and C4
the relative threat posed by the organisms within each inoculation. Each coefficient has values
between 0-1 except C3, where the lowest value was set to 0.01 (it is unsafe to assume a port
environment can be sufficiently hostile to prevent survival/establishment of every transferred
introduced species; Section 3.8).
The two risk reduction factors calculated by the database were R1 (effect of ballast tank size on C2)
and R2 (effect of tank storage time on C4). R1 represents the effect of tank size on the number and
viability of organisms that survive the voyage, since water quality typically deteriorates more rapidly
23
Ballast Water Risk Assessment, Port of Dalian, People's Republic of China, November 2003: Final Report
in small tanks than large tanks (owing to the volume/tank wall ratio and other effects such as more
rapid temperature change, with mortality rates generally higher in small tanks). As described below,
no risk reduction was applied to any source port dispatching vessels with tank volumes greater than
1000 tonnes.
R2 represents the effect of tank storage time on the range and viability of discharged organisms.
Survival of most phytoplankton and aerobic biota inside any tank decreases with time, with relatively
high survival rates reported for voyages less than 5 days (as shown below, this was adopted as the cut-
off point for any risk reduction due to in-tank mortality). If the focus is only on long-lived anaerobes,
dinoflagellate cysts or pathogens (all of which have long tank survival rates), then R2 can be deleted
from the BWRA calculation, using the GUI shown in Figure 9 (details are in the GloBallast BWRA
User Guide).
The database calculates the tank storage time by subtracting the reported tank discharge date from the
ballast uptake date. For incomplete BWRFs with missing discharge or uptake dates, the vessel arrival
date plus a standard voyage duration at 14 knots16 were used to estimate the BW uptake date for
adding to the database. The database automatically provides values for R1 and R2 using a log
rhythmic approach17, with the project-standard BWRAs applying the following default (but
adjustable) R1 and R2 risk-reduction weightings to C2 and C4 respectively:
R1
Maximum tank volume discharged (tonnes) in
<100
100-500
500-1000
>1000
the database record for each source port
W4
Default risk-reduction weighting applied to C2
0.4
0.6
0.8
1
R2
Minimum tank storage time (days) in the
<5
5-10
10-20
20-50
>50
database record for each source port
W5
Default risk-reduction weighting applied to C4
1
0.8
0.6
0.4
0.2
Although all information reported in the ballast tank exchange section of the BWRFs was entered into
the database, the `first-pass' BWRA did not use these data to apply a risk reduction factor for each
source port route for the following reasons:
· implementation of the BWRFs at the Demonstration Sites has been relatively recent, and the
tank exchange did not provide a sufficiently consistent or reliable sample of ballast
importation for most sites (Section 3.4);
· BWRF implementation was generally on a voluntary basis, with no formal mechanism
compelling all vessels to submit fully completed forms at Dalian;
· insufficient vessel inspection/ tank monitoring data were available for checking claimed
exchanges and their locations (often unrecorded);
· discounting whether or not effective exchange/s were taking place (a) removed the need to
predict the size of the risk reduction, and (b) was precautionary with respect to the ability of
exchanges to remove all organisms taken up at the time of ballasting.
BWRA calculation
As shown in Figure 9 and described in the GloBallast BWRA User Guide, the database GUI allows the
six components of the BWRA calculation and the five weighting factors to be altered from the default,
16 The voyage duration between ports for particular vessel speeds are tabled in many maritime guides and
atlases, such as the Lloyds Maritime Atlas of World Ports and Shipping Places and the 2001 Fairplay Port
Directory.
17 As with the risk species threat level weightings, a log rhythmic approach is appropriate for risk reduction
factors in biological risk assessments.
24
3 Methods
`project-standard' setting. The GUI can therefore be used to explore how particular risk components
and their treatment influence the final result, and also improves the demonstration value of the system.
One example is the way the environmental matching coefficient (C3) is treated by the BWRA
calculation. For scientists who consider that C3 should be treated as an independent coefficient of risk
(see below), then the formula for calculating the relative overall risk (ROR) posed by a source port is:
(1)
ROR = ( C1 + [C2 x R1W4] + C3 + [C4 x R2W5] ) / 4
Equation (1) is the default setting used for the project-standard BWRA for each Demonstration Site.
In this case, ROR is the combined measure of the proportional `inoculation' frequency (C1) and size
(C2), the relative similarity of the source port/Demonstration Site environmental conditions (C3), and
the relative level threat posed by the status of species assigned to the source port's bioregion (C4).
The division by 4 keeps the result in the 0-1 range to allow the convenient expression of the ROR as a
ratio or percentage of the total risk posed by all the source ports.
For those who consider the proportional risk species threat (C4) should provide the focal point of the
risk calculation, they may prefer to treat C3 as a risk reduction factor for influencing the size of C4,
rather than using it as an independent `surrogate' coefficient to help cover unidentified or unknown
species. The GUI allows the formula to be changed to reflect this approach, in which case C3 would
be applied as follows:
(2)
ROR = ( C1 + [C2 x R1W4] + [C3 x C4 x R2W5] ) / 3
[divisor is now 3 because of the reduced number of summed coefficients].
For a source port in a bioregion with a large number of risk species (eg. a relatively high C4 of 0.2)
but with an environment very dissimilar to the Demonstration Site (e.g. C3 = 0.2), then Equation (2)
would reduce C4 to 0.04 (i.e. an 80% reduction). If the minimum tank storage time was relatively
long (e.g. R2 was between 10-20 days for the quickest voyages, so W5 = 0.6), then C4 would be
further reduced to 0.024 (i.e. an 88% reduction to its initial value).
Table 2. Examples showing how Equation (1) provides more conservative outcomes than (2) for typical
situations*
Relative Proportion of Proportion of Environ-
Relative
Overall
discharge
discharge
mental
Risk species
(*when C1 and C2 are less than 50%)
Risk
Frequency
Volume
matching
threat
ROR
C1
C2
C3
C4
ROR
= [C1 + C2 + C3 + C4] / 4 Equation (1)
0.150
0.1
0.1
0.2
0.2
ROR
= [C1 + C2 + (C3 x C4) ] / 3 Equation (2)
0.080
0.1
0.1
0.2
0.2
ROR
= [C1 + C2 + C3 + C4] / 4 Equation (1)
0.200
0.2
0.2
0.2
0.2
ROR
= [C1 + C2 + (C3 x C4) ] / 3 Equation (2)
0.147
0.2
0.2
0.2
0.2
ROR
= [C1 + C2 + C3 + C4] / 4 Equation (1)
0.350
0.5
0.5
0.2
0.2
ROR
= [C1 + C2 + (C3 x C4) ] / 3 Equation (2)
0.347
0.5
0.5
0.2
0.2
ROR
= [C1 + C2 + C3 + C4] / 4 Equation (1)
0.400
0.6
0.6
0.2
0.2
ROR
= [C1 + C2 + (C3 x C4) ] / 3 Equation (2)
0.413
0.6
0.6
0.2
0.2
ROR
= [C1 + C2 + C3 + C4] / 4 Equation (1)
0.450
0.7
0.7
0.2
0.2
ROR
= [C1 + C2 + (C3 x C4) ] / 3 Equation (2)
0.480
0.7
0.7
0.2
0.2
ROR
= [C1 + C2 + C3 + C4] / 4 Equation (1)
0.550
0.9
0.9
0.2
0.2
ROR
= [C1 + C2 + (C3 x C4) ] / 3 Equation (2)
0.613
0.9
0.9
0.2
0.2
Equation (2) is logical provided the database contains an accurate distribution of appropriately
weighted risk species in the various source port bioregions (including native species considered
potentially harmful if they established in other areas). However Equation (2) is less conservative than
Equation (1), particularly if there are doubts that C4 provides a true picture of potential risk species
threat. As shown in Table 2, Equation (1) produces higher ROR values, unless a single source port
accounts for over 50% of the frequency (C1) and volume (C2) of the total discharges at a
Demonstration Site (this is highly unlikely). The database also allows users to increase the influence
25
Ballast Water Risk Assessment, Port of Dalian, People's Republic of China, November 2003: Final Report
of C4 on the ROR by increasing the default value of the overall W3 weighting factor from 1 (but see
the caution in Section 3.10). Increasing the size of C4 has more affect in Equation (1) because C3 has
no direct influence on the size of C4.
Managing and displaying the results
When the database is requested to calculate the BWRA, it generates a large output table that lists all
sources of tank discharges recorded at the Demonstration Site, as entered from the BWRFs and/or
derived from the port's shipping records. The table shows the ROR values plus their component
coefficients and reduction factors. Because the Demonstration Sites have a large number of source
ports (80-160), trends are difficult to see within long columns of tabled values.
The ROR results are therefore further manipulated by the database to provide additional columns
showing:
· the risk category of each source port, as placed in one of five levels of risk for displaying on
the GIS world map;
· a standardised distribution of the ROR results, i.e. from 1 (highest ROR value) to 0 (lowest
value).
The five risk categories are labelled `highest', `high', `moderate', `low' or `lowest', with their
boundaries set at equal linear intervals along the 0-100% scale of cumulative percentage risk (i.e. at
80%, 60%, 40% and 20% intervals). This is the default setting used for the project-standard BWRAs.
The database GUI (Figure 9) allows users to shift one or more of these boundaries to any point on the
scale. For example, a logbased distribution of the five risk categories may be preferred and is easy to
produce using the GUI.
In the case of the standardisation, the database applies the following simple manipulation to expand
the distribution of ROR values to occupy the 0-1 range, where 1 represents the maximum ROR value
and 0 the minimum value:
RORSTANDARDISED = (ROR RORMINIMUM) x 1/ (RORMAXIMUM RORMINIMUM)
This facilitates comparisons between BWRA results from other sites, as well as from different
treatments of the ROR formula and/or the weightings. As with the ArcView GIS, the database was
designed to optimise the user-friendliness, flexibility and management utility of the system.
Rationale for undertaking `Project Standard' BWRAs
The flexibility provided by the database allows users to investigate and demonstrate various
permutations and avenues without requiring specialised knowledge in database construction and
editing. However it was important to apply a consistent, straightforward approach to the `first-pass'
BWRA for each Demonstration Site, so their outcomes could be compared and contrasted to help (a)
evaluate the system and approach, and (b) identify areas where changes could improve future use.
Each Demonstration Site has a particular trade profile and associated pattern of
deballasting/ballasting. Their divergent geographic locations further contributes to their possession of
unique sets of BW source ports which have relatively limited overlap. Thus if results from any two or
more Demonstration Sites are to be compared, all of their shared and non-shared source ports and
bioregions need to be combined for calculating the environmental matching and risk species threat
coefficients.
It was therefore decided that, because the six sites effectively span the globe, the `project-standard'
BWRAs undertaken for each site should use the same global set of source port environment and risk
species data. This ensures the port-to-port similarities and risk species threats were based on the
widest possible range of port conditions and species distributions, thereby reducing the potential for
spurious results resulting from overly narrow regional approaches (Section 3.8).
26
3 Methods
3.11 Training and capacity building
Members of the consultants team worked with their Dalian counterparts to provide BWRA guidance,
training, software and associated materials on the following occasions:
Occasion/ Date
Location and
BWA Activity Tasks
Consultants
[working days]
Counterparts*
Activity Kick-Off Presentation, briefing and logistics meetings to:
NIO Offices in Goa.
January 2002
Identify equipment and counterpart requirements
R Hilliard
CFP:/CFPAs from
[1.5 days]
Develop provisional pilot country visit schedule
all Pilot Countries
1st Country Visit
Introductory half-day seminar
Function rooms in
April 2002
Install and check computer software
Dalian provided by
[5 work days]
Liaoning MSA.
Commence training and capacity building
Port familiarisation tour
Group A
Begin GIS mapping of port and resources
D Blumberg
counterparts
Review BWRFs collected by Liaoning MSA
J Polglaze
Group B
Commence BWRF database development &
R Hilliard
counterparts
training
K. Lin
Group C
Review port environmental data and identify
counterparts
sources
Translation support
Seminar & tutorials on multivariate similarity
analysis
Identify data collation and input tasks required
before 2nd consultants visit
2nd Country Visit
Update Database GUIs, add-ins & make ODBC
Function rooms in
September 2002
links
Dalian provided by
[12 work days]
Continue training and capacity building
Liaoning MSA.
Complete GIS mapping of port and resources
Complete BWRF database development and
Group A
C Clarke
training
counterparts
J Polglaze
Complete port environmental data
Group B
R Hilliard
assembly/training
counterparts
Complete environmental similarity analysis
J. Zhao
Group C
training
counterparts
Generate environmental matching coefficients
Translation support
Add risk species data to database, refine bioregions
Complete BWRA training and undertake first
analysis
Hold seminar to review and discuss results
Discuss pilot country needs for future BWRA
3rd `Wrap-up'
Provide Database containing all port environmental
China MSA offices,
Visit
and risk species data obtained for the six sites
Beijing.
March 2003
Provide updated BWRA User Guide and final
CFP-A
[2.5 days]
training on BWRA system operation
C. Clarke
Group A leader
Review and discuss updated BWRA results.
Group B leader
* refer Appendix 2 for project team structure and counterpart details.
At the project kick-off meeting in January 2001, CFP/CFPAs were briefed on the nature, objectives
and requirements of the activity. An introductory PowerPoint presentation was made describing the
BWRA system proposed for achieving the BWRF objectives, and logistics meetings were
subsequently held with individual Pilot Countries. A project check-list and briefing document were
distributed, listing the computer hardware and peripherals required at each Demonstration Site, plus
27
Ballast Water Risk Assessment, Port of Dalian, People's Republic of China, November 2003: Final Report
the proposed structure of the joint Pilot Country-consultants project team (Appendices 2 and 3).
Appropriate experience of Pilot Country counterparts for the three groups forming the team was
emphasised during the kick-off meetings.
During the subsequent in-country visits by the consultants, the main BWRA training and capacity-
building components provided were as follows:
· Supply of software licences and User Guide and installation of ESRI ArcView 3.2 and
PRIMER 5.
· Guidance and `hands-on' training and in GIS mapping of marine resources.
· Supply of 2001 CD-ROM edition of the Lloyds Ship Register, and customised Excel
spreadsheet file for convenient collation of vessel identification and DWT data and reliable
estimation of BW discharges from port shipping records, for the pre-BWRF period and
BWRF checking.
· Guidance, `hands-on' training and assistance with the Access database and BWRF
management;
· Guidance, `hands-on' training and glossaries of terminology on the collation, checking, gap-
filling and computerisation of BWRFs and principles of database management.
· Guidance and assistance on (a) search, collation and computer entry of environmental data for
important BW source and destination ports, and (b) the terminology, networking, data
collation and management requirements for species information used for the risk species
threat coefficient.
· Tutorial, `hands-on' training and assistance on theory, requirements and mechanics of
multivariate similarity analyses of port and coastal environmental data.
· Tutorial, guidance, `hands-on' training, seminars and PowerPoint material on BWRA
approaches, methods and results evaluation.
· Supply of electronic BWRA User Guide with glossaries and technical appendices.
To improve training, guidance and capacity-building components, the consultants provided a technical
English-Mandarin translator with maritime experience for the first and second country visits. To
promote collaboration, understanding and continuity among the three groups, the consultants arranged
for group counterparts to provide presentations and guidance to other group members during the 2nd
visit.
3.12 Identification of information gaps
This was a critical part of the activities undertaken during the first in-country visit by the consultants,
with attention focussed on locating and checking the following BWRA information input
components:
· Completeness of BWRFs submitted by vessels arriving at the Demonstration Site.
· Gaps, legibility and authenticity of information reported in the returned BWRFs.
· Sources and availability of shipping records for BWRF gap-filling.
· Existence of electronic and paper charts, topographic and coastal resource maps, atlases,
aerial photographs and publications for GIS port map.
· Sources, reliability and extent of port environmental data and coastal resource information for
Demonstration Site and its trading ports in the Pilot Country and region.
· Sources and extent of marine species records, information and researchers on introduced
species in and near the Pilot Country.
28
3 Methods
At the end of the first country visit, the status of the above were reviewed and a list of gap-filling
tasks, as allocated to the Pilot Country groups or consultants and to be undertaken by the second visit,
were agreed upon and minuted. Follow-up gap-filling tasks were also conducted during and after the
second visit.
29
4 Results
4.1 Description of port
General features
The Port of Dalian is located at 38o 56' N 121o 39' E on the south side the Liaodong peninsula that
separates the east side of the Bohai Sea (Liaodong Bay) from the Yellow Sea (Figures 2,7). Dalian is
the main commercial port of north-east China and one of major eastern terminuses of the trans-
Siberian railway system. This strategic port was coveted by three nations over the last century because
its wide natural harbour remains silt and ice free year-round and provided access to coal. Dalian had a
small fishing harbour when Russia took lease of the Liaodong peninsula under a forced agreement in
1898. Named Dalny in 1899, Russia quickly developed the port to provide coal bunkering facilities.
Following the Russo-Japanese war, control of the peninsula shifted to Japan in 1905. Japan continued
developing the port which it renamed Dairen during its 1905-1945 occupation of Manchuria. From the
1950s to present Dalian has been further developed and modernised to become one of China's leading
petroleum, steel and ship-building/repair ports. The local economy has also been significantly boosted
by Dalian's popularity as a summer-autumn resort and fresh seafood centre, owing to its picturesque
rocky shorelines, sand beaches, fishing and mariculture industries, while some of the city's older
architecture retains Russian and Japanese influences. Dalian also provides regular passenger and ro-ro
ferry services to Tian Jin, Longkou, Wei Hai and other ports in the Bohai Sea region, as well as to
Inchon near Seoul, handling over 6 million passengers each year.
Climate and weather
The temperate continental climate experienced in the Dalian region is characterised by warm, humid
summers with prevailing southerly breezes followed by cold dry winters dominated by strong north
and north-westerly winds. Freezing weather lasts from early January to March, although the sea ice
which can develop in the bay and last for up to 60 days in certain years is always thin (5-20 mm) and
does not hinder navigation. Morning fogs are common from early March to late September, with
longer spells occurring mostly in June and July.
Mean day-time temperatures regularly exceed 22oC during high summer (maxima to ~35oC), while
night-time temperatures often fall below -2oC in winter (minima to -15oC). Annual rainfall is
relatively low with most occurring from spring to autumn. A wind rose showing the strength and
alternation of the summer southerly breezes and winter northerlies of the region is shown in
Figure 10.
Figure 10. Annual wind rose typical of the Dalian Bay region
30
4 Results
Hydrodynamic conditions
The average range of the semi-diurnal tidal regime at Dalian is 2.1 m. Tidal currents >2 knots develop
around the various headlands of Dalian Bay during strong spring tides (3.9 m average; 4.6 m
maximum), declining to ~1 knot during neaps (average 2.6 m; minimum 0.7 m). Flows in the fairway
and shipping channels are weaker (0.5-1 knots). The direction of tidal flows in and near Dalian Bay
are generally to the west and south-west during flood tides and to the east during ebb tides. Figure 11
shows a map with surface-water movement plots for Dalian Bay obtained from Dalian Maritime
University.
The water currents shown in Figure 11 indicate that BW discharged at the terminals in Dalian Bay is
dispersed towards and around the south-west corner of the bay (Huangbaizui Point) during flood tides
and eastward along shorelines during ebb tides. Even in neaps, the tidal regime is sufficiently strong
to shift and disperse BW plumes and any associated organisms to one or more of the various
mariculture areas in or near Dalian Bay within two tidal cycles (Section 4.2).
Figure 11. Surface-water current plots in Dalian Bay
Port facilities and maintenance
From its original town-site and coal bunkering/supply wharfs opened in 1899, Dalian has undergone a
series of extensions and modernisations throughout its 104 year history to become north-east China's
foremost trading port, with a diverse cargo throughput reaching almost 100 million tonnes in 2002.
About 2,000 ships arrive at Dalian each year, plus a similar number of small coastal traders, fishing
vessels and service vessel movements.
During the first half of the twentieth century the port was extended eastward along the south side of
Dalian Bay, with the large Dagang harbour formed by installation of detached breakwaters plus
dredging and backfill to develop its four piers and warehouse areas. This harbour remains protected
by 7 km of rocky breakwater along its western, northern and eastern sides (Figure 12a). Other terminals
were provided at Xianglujiao and Ganjingzi to service steel-making, ship building and other
industries, followed by the Siergou terminal for fuel oils and liquid chemicals. The Heshangdao
31
Ballast Water Risk Assessment, Port of Dalian, People's Republic of China, November 2003: Final Report
(Dalianwan) terminal was developed on the north side of Dalian Bay in the l960s-70s. To achieve the
navigation depths which are now in the 6-14.5 m range, all of these terminals have had their berths
and approach channels dredged (Figure 12a).
While continuous or regularly-repeated maintenance dredging has not been required owing to the lack
of significant riverine silt inputs, the depth requirements of crude oil tankers and the steep rise in
freight containerisation during the 1980s led to the development of new terminals which take
advantage of naturally deeper waters near the Dagushan peninsula on the east side of Dalian Bay. The
port presently contains 72 berths distributed among nine terminals, three of which are located on
Dagushan Peninsula on the east side of Dalian Bay. The latter include the busy Dayaowan container
and multi-use terminal which continues to be expanded in Dayao Bay via dredging and backfill (c.f.
Figures 12b, 13).
Dalian was the focal point of China's overseas crude oil exports from its Bohai Sea oil fields until
1999, when this trade ceased as a result of declining outputs plus the rapid 1990s rise in domestic
consumption. Since then the main components of the port's trade have remained liquid bulk cargos
(i.e. continuing crude oil imports plus petroleum product and chemical exports), dry bulk cargos (coal,
mineral ores, grain, fertilizers, woodchips, cement), general and break-bulk cargos (steel, pig iron,
timber, machinery, packaged goods, LPG), plus containers (now ~1 million TEU per annum),
vehicles and other ro-ro freight. Eight berths in the Dagan harbour also service the passenger/ro-ro
ferries. Much of the coal is imported from nearby Qinhuangdao on the north coast of the Bohai Sea
(Figure 2). Dalian is also an important grain port, exporting some 60% of the national corn export
which is railed from the three north-east China provinces and Inner Mongolia. Imports of wheat and
other cereals also take place, but not as regularly during 2000-2002 as in previous years.
After entering Dalian Bay from the south via the Dasanshan fairway, ships follow well-marked
shipping channels past the main anchorages to either the new, deeper water terminals on the
Dagushan Peninsula or into the approach channels, swing basins and berthing areas of the older
terminals closer to the city. The nine separately managed terminal areas in the Port of Dalian are
shown in Figure 12, and are described clockwise from the Siergou terminal (on the south-east side of
Dalian Bay) as follows:
· Siergou: This refined products and chemicals export terminal is located east of Dagang
harbour on the south side of Dalian Bay, and has four 9.1-9.4 m deep berths (total length
1,363 m) which handle product/chemical tankers up to 50,000 DWT. Two smaller berths
handle vessels up to 3,000 DWT which are used for bunkering services. The busy Siergou
terminal is a significant BW discharge site.
· Dagang: This large general cargo and multi-use terminal is located close to the city on the
south shore of Dalian Bay and has two districts (East and West). There are a total of 30 berths
beside three quays and four wide piers providing a total frontage of 3,185 m. Four of the
berths handle vessels up to 25,000 DWT, eleven to 10,000 DWT, one to 7,000 DWT, seven
to 5,000 DWT, and seven to 3,000 DWT. While No. 18 berth can service liquid chemical
tankers, the Dagang terminal accommodates mostly general cargo ships, small bulk carriers,
reefers and various passenger/ro-ro vessels, with steel products, mineral ores, grain, soya
beans, coal, break-bulk/palleted goods, containers and ro-ro freight forming the principal
cargos. The majority of arrivals discharge relatively little or no BW at Dagang as its trade
comprises bulk imports plus an import-export mix of general, break-bulk and palleted cargos,
containers, ro-ro freight and passengers. Few BWRFs were targeted from this terminal.
· Heizuizi: This general cargo terminal has six relatively shallow berths providing a wharf
frontage of 2,880 m which services small coastal traders in the 750-2,500 DWT range (the
majority engaged on domestic voyages in the Bohai and north Yellow seas). A few BWRFs
targeted by MSA indicate its arrivals occasionally discharge minor BW quantities (100-400
tonnes) uplifted from regional ports as far south as Ningbo in the southern Yellow Sea near
Shanghai and eastward across Korea Bay to Inchon (Figure 2).
32
4 Results
· Xianglujiao: This terminal has two piers with eight berths totalling 2,382 m in length and 6.6-
9.2 m depths for accommodating ships in the 3,000-50,000 DWT range. This terminal exports
mainly timber and steel products and other general cargo. The adjacent shipyards provide
maintenance, repair and fit-out services, including three dry docks capable of handling vessels
up to 600 DWT (length 44 m, width 14 m), 3000 DWT (length 135 m, width 16 m; depth
8.3m) and >200,000 DWT (length 365 m, width 82 m, depth 12.7 m).
· Ganjingzi: This terminal area contains a coal and coke import jetty equipped with four coal
unloaders and two berths 200 m long, 9.5 m deep, plus a small terminal for LPG and liquid
chemical exports. Since much of the coal is reported to come from Qinhuangdao in the Bohai
Sea, this port may be a regular destination of BW uplifted by the colliers when alongside the
Ganjingzi jetty.
· Heshangdao (Dalianwan): This terminal area has a total wharf frontage of 1,500 m and six
berths, the largest of which can handle colliers and general cargo vessels up to 30,000 DWT
(the berths are 200-235 m long and 9.7-11.5 m deep). The main trade is coal imports (3 berths
at Heshangdao plus 1at Dalianwan), plus grain and general cargo, including hazardous goods
at the Heshangdao berths.
· Beiliang: This grain export/import terminal is located on the west side of the Dagushan
Peninsula (east side of Dalian Bay), and provides two deepwater berths for handling bulk
carriers to 100,000 DWT. The BWRFs added to the database from this terminal indicate few
exports in 2000-2002.
· Xingang: This oil terminal area has three piers. The long southern pier is operated by the
Dalian Xin Gang Port Company and has two berths. No. 1 is 423 m long and 17.5 m deep and
can service tankers up to 120,000 DWT for crude oil export or import. No. 2 is 423 m long,
14.5 m deep and can accommodate tankers up to 50,000 DWT for crude or refined product
exports. To the north there are two shorter piers at Nianyuwan operated by the New Product
Oil Atlantic Co., each with a single berth for export of petroleum and chemical products. The
outer berth is 346 m long and 13.5 m deep and handles tankers up to 50,000 DWT. The inner
180 m berth handles small product and chemical tankers to 10,000 DWT.
· Dayaowan: This new multi-purpose terminal is located north-west of Xingang at the entrance
to Dayao Bay (Figure 12b), and includes two piers and silos servicing two 250 m long and
12.0 m deep multi-use berths, plus a dedicated grain import berth. The latter unloads grain
from carriers up to 80,000 DWT, while the former have ship loaders for exporting corn in
carriers up to 50,000 DWT. Nearby, the long wharf of the Dayaowan container terminal has
five multi-use berths providing depths up to 13.5 m. These are serviced by nine gantries and
backed by a 400,000 m2 hardstand area for handling containers, vehicles and other ro-ro
cargo. The busy Dayaowan terminal has maintained Dalian's status as China's leading north-
east port, and it was by far the largest source of BWRFs as the majority of non-tanker
international arrivals visit this terminal, particularly from Korea and Japan.
Most of the port's tugs, line boats, pilot launches and other workboats are serviced in Dagang harbour,
with similar small vessel facilities at the Dalianwan and Dayaowan terminals. The Siergou oil
terminal provides the port's bunkering and refuelling services, while Dalian's main commercial fish
reception and market facilities are located east of the Heizuzui terminal.
33
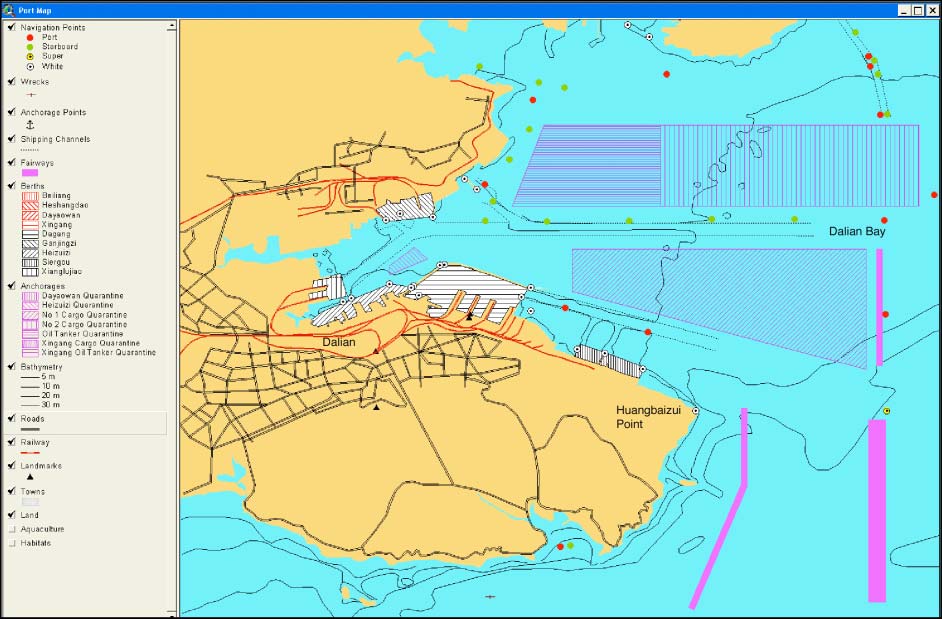
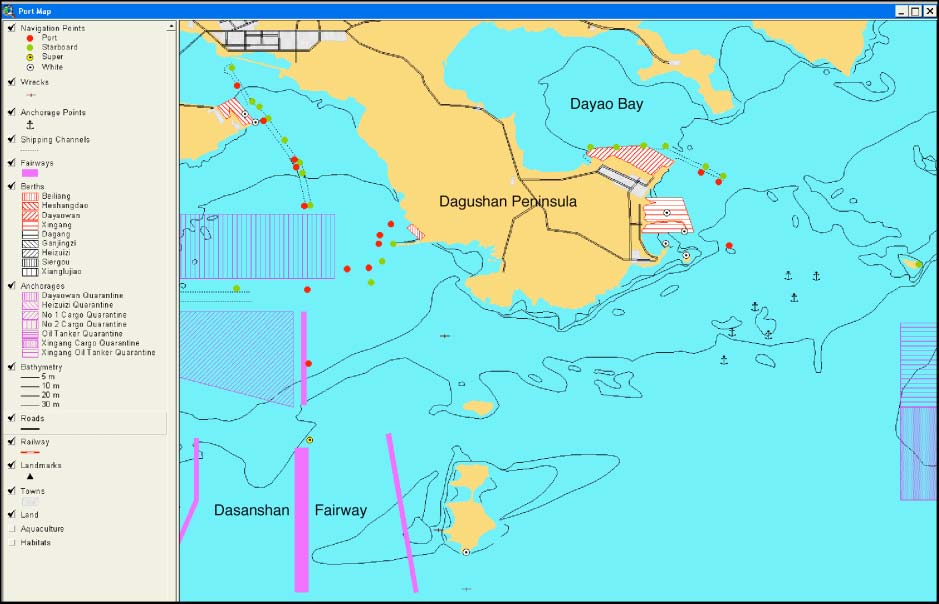
Ballast Water Risk Assessment, Port of Dalian, People's Republic of China, November 2003: Final Report
Figure 12a. Part of the GIS Port Map showing the navigation, infrastructure and active berth layers on the west
side of Dalian Bay
Figure 12b. Part of the GIS Port Map showing the navigation, infrastructure and active berth layers on the east
side of Dalian Bay
34
4 Results
4.2 Resource
mapping
The subtidal seafloor habitats in Dalian Bay are dominated by soft silty sediment sheets overlying
rocky substrate, the latter outcropping in many places around islands, points and reefs, as shown on
the GIS Port Map (Figure 13). Seagrasses (Zostera marinus, Triglochin maritimum, Phyllospadix
spp.) occur in patches along the shallow subtidal-lower intertidal shores and embayments in and
beyond Dalian Bay, but no information could be found to delineate where these were best developed
and mappable.
There are no longer any high tide salt marshes which open naturally to Dalian Bay owing to the
progressive port, industrial and urban developments of the previous century. The intertidal habitats
delineated by Group C and added by Group A to the GIS Port Map (Figure 13) therefore comprised:
· Artificial rocky walls along breakwaters and reclaimed shorelines;
· Smooth artificial walls inside terminals;
· Natural rocky shores;
· Sand beaches and stoney beaches;
· Partial and completed land reclamations;
· Various salt field, coal ash and land fill/waste disposal areas.
There are many local mariculture enterprises near Dalian which focus on edible algae, mussels,
oysters, scallops and fish farming, and these are also delineated on the GIS port map (Figure 13).
There are no gazetted marine nature reserves or wildlife breeding areas in the area. Two wreck-sites
were added to the map although these have no particular historical significance, and no points of
locally significant marine or cultural heritage value were identified within the area of the port map.
The map does depict the main urban features and landmarks near the port, including the
TV/communications tower, city railway station and Dagang passenger terminal, plus the main road
and railway systems (Figure 12).
Figure 13. GIS Port Map showing the marine habitat and mariculture layers
35
Ballast Water Risk Assessment, Port of Dalian, People's Republic of China, November 2003: Final Report
4.3 De-ballasting/ballasting
patterns
The navigational rules and deballasting/ballasting practises of arriving vessels were discussed during
the first port tour in April 2002 (Section 3.3). Pilotage is compulsory for foreign flagged ships and is
recommended for various domestic vessels, with boardings typically occurring where the fairway
meets the anchorages (Figure 12a). As in other ports, the port and pilotage rules require all empty
ships to retain sufficient ballast on board to maintain adequate propulsion, steerage control and
forward visibility, and to minimise windage, until berthing is completed. Windage at Dalian can be
significant in the winter months due to the strong northerly winds, and is least in June-July. BW
discharges in port waters require permission from the local MSA office.
Because the MSA had targeted international vessels plus domestic tankers and bulk carriers arriving
in ballast, the BWRF database entries mirrored local expectations as to which terminals were
significant BW discharge sites18. It was also possible to identify which of the terminals were
significant BW uptake sites because of their dedicated cargo importing infrastructure (i.e. the various
grain and coal import berths, plus occasionally the southern jetty at Xingang for oil imports since
2001).
However it was not possible from the BWRFs or database to determine which of the ships that had
uplifted BW when discharging grain, coal or other bulk cargo, subsequently moved to another berth
(either directly or after a short lay-off at one of the anchorages) to load cargo and thus discharge this
water before departing Dalian Bay. While this was unlikely for the coal carriers (because of their need
to tank-wash if switching cargos), it probably occurred for some of the grain carriers and
product/chemical tankers.
In the case of the various multi-use berths at Dagang, Heshangdao (Dalianwan) and Dayaowan, the
Dayaowan component of the database indicated that 20% of the container ships and 12% of the
general cargo ships were arriving at these berths with less than 50% of their total ballast capacity
(Appendix 7), and therefore were probably unloading cargo before any loading. While there was no
easy way of determining how frequent and large were any associated BW uplifts, the tank records of
the Dayaowan BWRFs showed a high incidence of zero discharges (86%), with recorded BW
discharges totalling 181,147 tonnes (166,132 tonnes from identified sources). This fits with the part
ballasted condition of most arrivals and the part-unloading/loading nature of the container liner trade
(Appendix 7).
In summary, even when vessels submit reasonably complete IMO-style BWRFs, these forms do not
permit a port to identify the frequency, volume or ultimate destination of uplifted BW, particularly for
any arrival at a general cargo, container or ro-ro terminal which:
· unloads all or a large part of its cargo (= at least some initial BW uptake to maintain trim,
stability or air draft beneath gantries); or
· retains all or most cargo on board (=none or little BW uptake required); before
· departing with little additional cargo (= uplifted BW kept); or
18
The large number of IMO-style BWRFs collected in 2000-2002 and entered into the Dalian database (3,278)
by MSA made it unique among the Pilot Country Demonstration Sites by containing BW source and
discharge values obtained solely from these forms (i.e. no visit data were drawn from shipping records).
Following error checks and gap-filling, the majority of the 2185 BWRFs entered for the busy Dayaowan
terminal contained sufficient information to offer a useful insight of the ballasting/deballasting patterns of a
modern multi-purpose terminal where ships were being turned around within lengths of stay averaging 2.3
days. This part of the database was therefore used to investigate total BW capacities, ballasted conditions
and discharges of the four main ship types using this terminal (i.e. container and general cargo ships, bulk
carriers and vehicles carriers; see Appendix 7).
36
4 Results
· loading cargo before departing (= possible discharge of the same or different BW, depending
on cargo/trim needs, tank layout and ability to make internal tank transfers [many container
ships]).
Dalian has large anchorages (Figure 12) but the BWRFs provided no indication of any BW discharges
in these areas. Liaoning MSA and DPA staff noted that none of the anchorages have been significant
discharge sites in recent years for several reasons, including:
· there is no longer any tanker queuing following the halt in crude oil exports from Dalian in
1999;
· bulk carriers arriving to load grain or other cargos have been proceeding directly to berths at
the various new and old terminals because these were not being used to full capacity during
2000-2002;
· cargo transhipments within the anchorages are uncommon (there are no local river ports and
associated barge traffic); and
· the various general cargo ships, bulk carriers, tankers and other vessels which do anchor are
usually waiting for new cargos/sailing orders having discharged their cargo.
While the anchorages were being used mostly for vessel lay-offs, the ship repair yards at Xianglujiao
were identified as a potentially significant site of discharged BW. This site was therefore provided
with a summary table of BW discharge data, as estimated from dry-docking statistics obtained by the
MSA (no BWRFs were collected from the yards and dry dock discharges are not archived by the yard
companies).
The following statistics were extracted from the Dalian database of 3,278 visit records for the nine
terminal areas, which are ranked below in terms of BW discharge importance:
· Xingang: Of the 191 BWRFs entered from this oil terminal, 181 provided 184 tank discharge
records amounting to a total discharge volume of 794,278 tonnes (Figure 14). The discharges
were reported by 19 chemical/oil product tankers, 19 gas tankers, 31 crude oil tankers and 118
product tankers (including the largest ship in the database, the 133,966 DWT oil products
tanker Nikolaos).
· Siergou: For the 695 BWRF visit records entered from this liquid products terminal, most
were from China Flag product tankers in the 900-30,000 DWT range. The number of BW
discharges from identified sources was 598 and totalled 483,022 tonnes (Figure 15).
· Dayaowan: The 2185 BWRFs entered from this multi-use but predominantly container
terminal, showed a very high level of liner trade, with the majority of arrivals being dedicated
container ships in the 2,000-65,000 DWT range plus 2,000-16,000 DWT general cargo ships
also handling containers (Appendix 7). Dry bulk carriers in the 20,000-70,000 DWT range
made 47 visits, most to the Dayaowan grain berths including the 73,000 DWT Hua Shan Hai
(the largest bulk carrier visiting Dalian in 2000-2002). Vehicle carriers in the 3,000-18,000
DWT range made 30 visits. The total number of BW discharges from identified source ports
was 598 and totalled 166,332 tonnes (Figure 16).
· Ganjingzi: Of the 56 BWRFs entered from this terminal, 13 were from colliers importing coal
and 39 from product and chemical tankers visiting the neighbouring liquid bulk berths.
BWRFs from four gas tankers were also included. Total BW discharged was 132,676 tonnes
(Figure 17).
· Beiliang: BWRFs were collected from 10 bulk carriers and five general cargo ships arriving
at this terminal to load grain, with intended discharges from recorded sources totalling 99,187
tonnes.
· Xianglujiao: Of the 45 BWRFs entered from this terminal, these came from 10 bulk carriers,
29 general cargo ships, three ro-ro vessels and a container ship. Of the tank records with
37
Ballast Water Risk Assessment, Port of Dalian, People's Republic of China, November 2003: Final Report
identified sources, total BW volume discharged was 48,269 tonnes from Chinese, Korean and
Japanese ports.
· Dagang: Of the 15 BWRF visit records entered by MSA for this terminal, two were collected
from bulk carriers, two from container ships, ten from general cargo ships and one from a
reefer. Of the 19 tank discharges with identified sources, total BW volume discharged was
20,135 tonnes.
· Heizuizi: Three BWRFs are present for this terminal, one from a small bulk carrier (4,143
DWT) and two from small coaster traders. BW discharges from these three vessels amounted
to 1,273 tonnes.
· Heshangdao (Dalianwan): Three BWRFs were entered for this terminal, one from a 65,000
DWT bulk carrier and two from 4,650 DWT general cargo ships. Only one the latter reported
a BW discharge (544 tonnes from Haimen in the Zhejiang Province).
Connection of the active berth layer of the GIS Port Map to the database allows tables summarising
the BW discharge statistics to be displayed for each terminal. Examples of the tables displayed by this
map are shown for the Xingang, Siergou, Dayaowan and Ganjingzi terminals in Figures 14-17
respectively.
Finally, it is worth noting that when all of the tanks planned for discharge contain the same source
water, ships' officers often submit a BWRF showing a single total discharge volume in place of
individual tank values. While this is an understandable and convenient time-saving measure for both
the ship and data-entry officers, such values reduce the precision of the BWRA calculations. This is
because the database needs to treat individual tank discharges as discrete, fundamental units to ensure
all BW sources identified on a completed IMO-style BWRF (Appendix 1) can be managed and
analysed separately. Thus a large total value representing the combined discharge from an `all tanks'
discharge from the same source must also be treated as a single entity (there is no way of knowing
how many and what sizes were the individual tank discharges unless these had been added to the
BWRF).
Combined discharge values not only fail to reflect the actual numbers and sizes of tank discharges
made at the port but also inflate the database's mean and maximum `tank' discharge volumes, often to
values approaching the total BW capacity of the largest arriving vessels; Figures 14-17). They also
cause more conservative but less precise BWRA outcomes because of their negative influence on the
R1 risk-reduction factors (Section 3.10), and may introduce inadvertent bias if ships submitting `all
tank' values are not evenly distributed among the receiving port's trading routes and vessel types.
While such bias did not arise from the many `all tank' values in the Dalian database, it is worth noting
that a database containing individual ballast tank data from, say, a 12 month set of carefully
completed BWRFs, will generate more precise C1, C2 and R1 components for each source port than a
two or three year database containing a high number of `lump-sum' total discharge values (BWRF
inconvenience and reliability issues are addressed further in Sections 4.9, 4.10 and 5).
38
4 Results
Figure 14. BW discharge statistics displayed by GIS Port Map for the Xingang oil terminal
Figure 15. BW discharge statistics displayed by GIS Port Map for the Siergou terminal
39
Ballast Water Risk Assessment, Port of Dalian, People's Republic of China, November 2003: Final Report
Figure 16. BW discharge statistics displayed by GIS Port Map for the Dayaowan terminal
Figure 17. BW discharge statistics displayed by GIS Port Map for the Ganjingzi terminal
40
4 Results
4.4 Identification of source ports
From the 3278 BWRFs and their 4319 associated ballast tank records in the Dalian database, the
percentage of records showing zero discharge at Dalian was high (82.4%). Of the 759 tank records
showing a discharge, 652 listed a total of 77 identifiable source ports. These are ranked in Table 3
according to their proportional contribution to the total number of identified discharges, and these
provide the C1 (BW discharge frequency) coefficients used to calculate the relative overall risk
(Section 3.10). Outputs from the GIS world bioregion map which show the location and relative
importance of these source ports with respect to C1 are in Figure 18. As with all GIS outputs, the map
is `zoomable' to allow all ports and symbols to be clearly delineated at smaller scales (Figure 18). As
shown in Table 3, the source port `supplying' the highest frequency of identified BW discharges to
Dalian in 2000-2002 was Shanghai (10.6%). This was followed by Qingdao (one of Dalian's regional
ports; 7.4%), then Guangzhu (a major estuary port on the Pearl River in southern China; 6.6%),
Ningbo (north of Shanghai; 5.5%) and another regional port (Yantai; 5.5%)(Table 3; see also Figure 2
for port locations).
Of the 77 identified source ports, the top 9 (11.7%) provided >50% of all source-identified discharges
at Dalian, while the next 9 ports contributed a further 25%, i.e. only 18 of the source ports (23.4%)
accounted for 75% of the total number of source-identified discharges (Table 3). As noted earlier, the
low number of tank records (4319) compared to the visits (3278) was due to the large number of
single value, `all tank' entries in the database.
The total volume of source identified BW discharged was 1,632,020 tonnes, with a further 159,219
tonnes (8.8%) discharged from unrecorded sources. The discharge volume percentages listed for each
source port in Table 3 and depicted in Figure 19 provided the C2 values used in the risk calculation
(Section 3.10).
Source port rankings for C2 (BW discharge volumes) were not the same as that for C1 (discharge
frequency; as ranked in Table 3). The source ports providing the largest recorded volume of BW
discharged at Dalian were Zhuhai (8.9%) and Chiwan (8.3%; both in the southern Guangdong
Province), followed by Korea's capital port of Inchon (7.5%), then Shanghai (7.2%). These were
followed by three more Guangdong ports, i.e. Shekou (6.6%), Huangpu (5.6%) and Guangzhou
(5.3%). Thus five of China's southern province ports were in the top seven that provided >50% of the
total source-identified volume. Nagoya was the top Japanese port (ranked 9th with 2.6% of the total
source-identified volume), while Sakai (ranked 12th at 2.5%) and five other Japanese ports were in the
top 20 ports. Only 15 source ports (19.5%) provided >75% of the total source-identified discharge
volume. Of the top 20 ports for C2, ten were in China (including Hong Kong), seven were in Japan
and three in Korea, and these accounted for 83.6% of the total.
Figure 18. GIS outputs showing the location and relative importance of BW source ports with respect to the
frequency of tank discharges (C1) at the Port of Dalian.
41
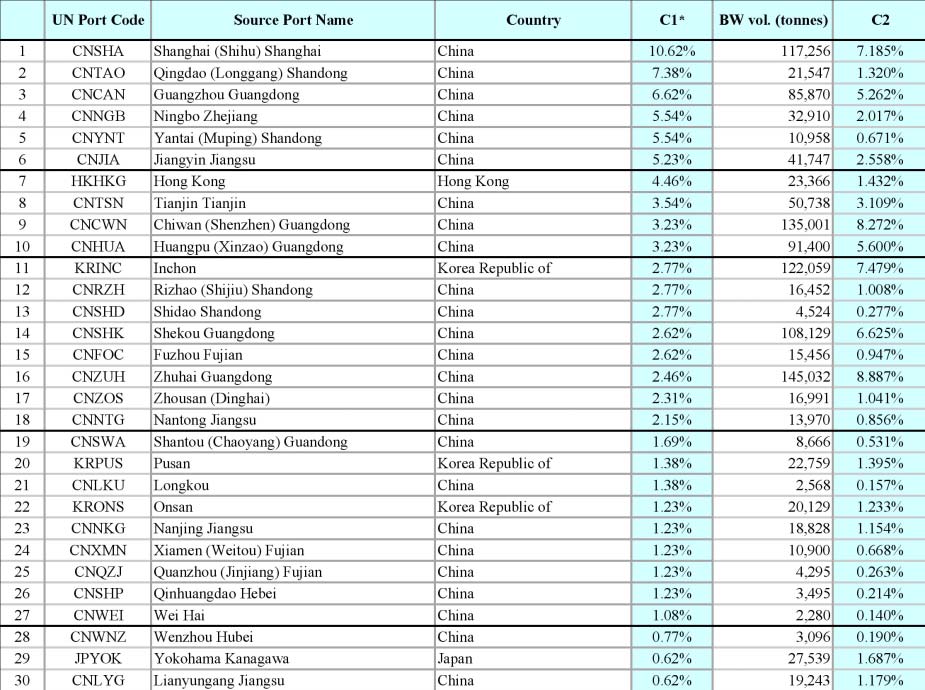
Ballast Water Risk Assessment, Port of Dalian, People's Republic of China, November 2003: Final Report
Figure 19. GIS outputs showing location and relative importance of the source ports with respect to the volume
of tank discharges (C2) at Port of Dalian
Table 3. List of identified source ports in the Port of Dalian database, showing their proportion of recorded tank
discharges (C1) and volumes (C2)*
*C1 = proportion of tank discharge records from known sources (652); C2 = proportion of total discharge volume (%)
42
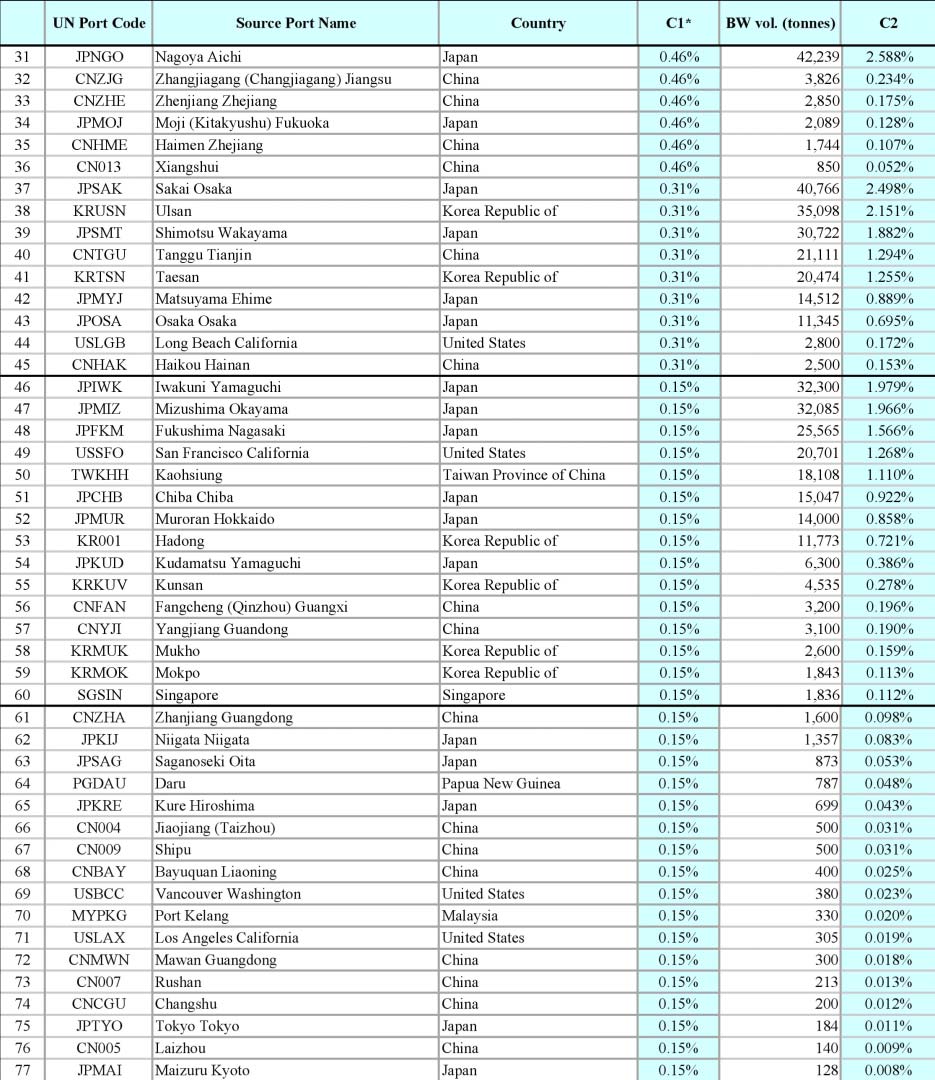
4 Results
Table 3 (cont.). List of identified source ports in the Port of Dalian database, showing their proportion of recorded
tank discharges (C1) and volumes (C2)*
*C1 = proportion of tank discharge records from known sources (652); C2 = proportion of total discharge volume (%)
4.5 Identification of destination ports
As discussed in Section 3.5, identification of destination ports for any BW taken up at a
Demonstration Site is confounded by the lack specific questions on the BWRF, and the uncertainty of
knowing if the Next of Port Call recorded on a BWRF (or in a shipping record) is where the uplifted
BW is actually discharged. Thus presently there is no reporting mechanism enabling a `reverse BWRA'
to be undertaken reliably. This posed a significant constraint for Dalian, since many vessels departing the
43
Ballast Water Risk Assessment, Port of Dalian, People's Republic of China, November 2003: Final Report
various import berths at the Dagang, Heshangdao (Dalianwan), Beilian, Dayaowan, Ganjingzi and
Xingang terminals would have been carrying BW uplifted alongside these berths.
Of the 121 assumed BW destination ports (i.e. Next Ports of Call) in the 2000-2002 database, their
location and proportional frequency are shown Figure 20 and listed in Table 4. The latter lists the top
22 destination ports that accounted for 80% of the reported Next Ports of Call, as had been listed in
3051 of the 3278 BWRFs (93%). Figure 20 and Table 4 show that the regional (Bohai Sea) port of
Tianjin (13.1%), the Korean port of Pusan (12.5%) and Qingdao (9.6%) stood out as the most
frequent destination ports, a feature caused by the large number of container and other cargo liner
services to these ports within the collected BWRFs (Appendix 7). Table 4 also shows that, of the 22
ports accounting for the destinations of 80% of the BWRF nominated vessel departures from Dalian,
14 were in China (including Hong Kong), seven were in Japan and one was in Korea (Pusan).
Figure 20. GIS outputs showing the location and frequency of destination ports, recorded as the Next Port of Call
in the Port of Dalian BWRFs
Table 4. Destination ports accounting for >80% of all vessel departures from Dalian in 1998-2002 (recorded as
Next Ports of Call)
Destination Port
% Proportion of
UN Port Code
Country
Cumulative %
(Next Port of Call)
Departures
1
CNTSN
Tianjin Tianjin
China
13.14
13.1
2
KRPUS
Pusan
Korea Republic of
12.52
25.7
3
CNTAO
Qingdao (Longgang) Shandong
China
9.44
35.1
4
CNYNT
Yantai (Muping) Shandong
China
5.54
40.6
5
CNSHA
Shanghai (Shihu) Shanghai
China
4.06
44.7
6
JPUKB
Kobe Hyogo
Japan
3.24
47.9
7
JPMOJ
Moji (Kitakyushu) Fukuoka
Japan
2.98
50.9
8
HKHKG
Hong Kong
Hong Kong
2.95
53.9
9
JPNGO
Nagoya Aichi
Japan
2.56
56.4
10
JPOSA
Osaka Osaka
Japan
2.43
58.9
11
JPYOK
Yokohama Kanagawa
Japan
2.39
61.3
12
CNTGU
Tanggu Tianjin
China
2.33
63.6
13
CNJIA
Jiangyin Jiangsu
China
2.06
65.6
14
CNWEI
Wei Hai
China
2.03
67.7
15
JPHKT
Hakata Fukuoka
Japan
1.97
69.6
16
CNNGB
Ningbo Zhejiang
China
1.80
71.4
17
CNDDG
Dandong Liaoning
China
1.74
73.2
18
CNCAN
Guangzhou Guangdong
China
1.70
74.9
19
JPTYO
Tokyo Tokyo
Japan
1.47
76.4
20
CNHUA
Huangpu (Xinzao) Guangdong
China
1.28
77.6
21
CNRZH
Rizhao (Shijiu) Shandong
China
1.28
78.9
22
CNNTG
Nantong Jiangsu
China
1.08
80.0
44
4 Results
4.6
Environmental similarity analysis
Of the 77 identified source ports and 121 destination ports, sufficient port environmental data were
obtained to include 53% of both the former and latter ports in the multivariate similarity analysis by
PRIMER. These ports accounted for 62% of all recorded tank discharges and 77% of all recorded
departures respectively (Tables 5, 6). Details of the 357 ports included in the multivariate analysis
carried out for Dalian and the other Demonstration Site BWRAs are listed in Appendix 6 (this list is
ordered alphabetically using the UN port identification code, in which the first two letters represent
the country).
To allow all identified BW source and next ports of Dalian to be part of the `first-pass' risk
assessment, those ports not included in the multivariate analysis were provided with environment
matching coefficient estimates, and are noted as such in the database. The C3 estimates were based on
their port type (Section 3.7) and geographic location with respect to the nearest comparable ports for
which C3 had been calculated. A precautionary approach was adopted (i.e. the estimated values were
made higher than the calculated C3s of the comparable ports). Providing C3 estimates allowed the
database to include all of Dalian source ports and next ports when calculating the ROR values and
displaying the BWRA results.
The GIS world map outputs that display the C3 values of the Port of Dalian source and destination
ports are in Figures 21 and 22 respectively. These plots and Tables 5-6 show that Dalian has a
relatively high environmental similarity to a large number of its trading ports (e.g. 55% of the source
ports had calculated or estimated C3s above 0.6). This can be related to their relatively close regional
location to Dalian and similar suite of marine habitats, the continental weather regime that provides a
wide seasonality to the temperature range, and Dalian's `middle of the road' annual rainfall pattern
and salinity range that lack extrema.
It is not surprising that the most environmentally similar ports to Dalian were some of its
geographically closest ports sharing a similar coastal aspect to the Bohai and north Yellow Seas. Thus
Longkou, Wei Hai, Yantai, Shidao, Rushan, Laizhou, Qingdao and Rizhao all shared calculated or
estimated C3s above 0.8 (Table 5). The environmentally closest foreign port was Mokpo in Korea (C3
of 0.78) which also faces the Yellow Sea. The most environmentally dissimilar ports trading with
Dalian in 2000-2002 were the river and estuary ports of the Yangste River system (0.20-0.37), warm
water ports in southern China and south-east Asia (Tables 5-6; Figures 21, 22).
As discussed in Section 4.6 and highlighted in Figure 20, the most frequent destination ports were
Tianjin (13.1% of all departures) and Qingdao (9.6%) in the Bohai Sea, and the south-west Korean
port of Pusan in the Sea of Japan (12.5%). The former had relatively high environmental matching
coefficients (0.71 and 0.82) while Pusan was less similar at 0.44 (Table 6). The most common
Japanese destination ports (Kobe at 3.2% and Moji at 3.0%; Table 4) are in Japan's Seto Sea and had
intermediate environmental matching coefficients (i.e. 0.69 and 0.57 respectively; Table 6).
45
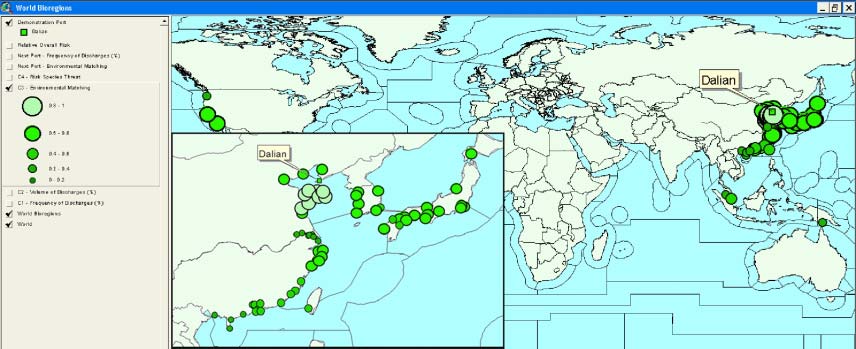
Ballast Water Risk Assessment, Port of Dalian, People's Republic of China, November 2003: Final Report
Figure 21. GIS outputs showing the location and environmental matching coefficients (C3) of BW source ports
identified for the Port of Dalian
Figure 22. GIS output showing the location and environmental matching coefficients (C3) of the destination ports
identified for the Port of Dalian
46
4 Results
Table 5. Source ports identified for Port of Dalian, as ranked according to size of their environmental matching
coefficient (C3)
Proportion of BW
Environmental Matching
UN Port Code
Source Port Name
Country
C3 Estimated
discharged
(C3)
CNLKU
Longkou
China
1.38%
0.890
E
CNWEI
Wei Hai
China
1.08%
0.890
E
CNYNT
Yantai (Muping) Shandong
China
5.54%
0.886
CNSHD
Shidao Shandong
China
2.77%
0.850
E
CN007
Rushan
China
0.15%
0.850
E
CN005
Laizhou
China
0.15%
0.850
CNTAO
Qingdao (Longgang) Shandong
China
7.38%
0.823
CNRZH
Rizhao (Shijiu) Shandong
China
2.77%
0.820
E
KRMOK
Mokpo
Korea Republic of
0.15%
0.722
JPKRE
Kure Hiroshima
Japan
0.15%
0.715
CNTSN
Tianjin Tianjin
China
3.54%
0.714
JPMYJ
Matsuyama Ehime
Japan
0.31%
0.714
JPIWK
Iwakuni Yamaguchi
Japan
0.15%
0.710
CNZOS
Zhousan (Dinghai)
China
2.31%
0.700
E
CNSHP
Qinhuangdao Hebei
China
1.23%
0.700
E
CNLYG
Lianyungang Jiangsu
China
0.62%
0.700
E
KRTSN
Taesan
Korea Republic of
0.31%
0.700
E
KR001
Hadong
Korea Republic of
0.15%
0.700
E
KRMUK
Mukho
Korea Republic of
0.15%
0.700
E
CNBAY
Bayuquan Liaoning
China
0.15%
0.700
E
JPYOK
Yokohama Kanagawa
Japan
0.62%
0.687
JPCHB
Chiba Chiba
Japan
0.15%
0.685
JPFKM
Fukushima Nagasaki
Japan
0.15%
0.684
JPMUR
Muroran Hokkaido
Japan
0.15%
0.669
KRKUV
Kunsan
Korea Republic of
0.15%
0.668
CNNGB
Ningbo Zhejiang
China
5.54%
0.656
JPKUD
Kudamatsu Yamaguchi
Japan
0.15%
0.653
USSFO
San Francisco California
United States
0.15%
0.652
JPNGO
Nagoya Aichi
Japan
0.46%
0.651
CNHME
Haimen Zhejiang
China
0.46%
0.650
E
CN004
Jiaojiang (Taizhou)
China
0.15%
0.650
E
CN009
Shipu
China
0.15%
0.650
E
JPMAI
Maizuru Kyoto
Japan
0.15%
0.646
JPKIJ
Niigata Niigata
Japan
0.15%
0.643
JPSAK
Sakai Osaka
Japan
0.31%
0.638
KRINC
Inchon
Korea Republic of
2.77%
0.637
JPSMT
Shimotsu Wakayama
Japan
0.31%
0.637
JPMIZ
Mizushima Okayama
Japan
0.15%
0.628
USLGB
Long Beach California
United States
0.31%
0.623
JPOSA
Osaka Osaka
Japan
0.31%
0.619
JPTYO
Tokyo Tokyo
Japan
0.15%
0.609
CNWNZ
Wenzhou Hubei
China
0.77%
0.600
E
KRONS
Onsan
Korea Republic of
1.23%
0.581
JPMOJ
Moji (Kitakyushu) Fukuoka
Japan
0.46%
0.569
CNFOC
Fuzhou Fujian
China
2.62%
0.550
E
KRUSN
Ulsan
Korea Republic of
0.31%
0.546
JPSAG
Saganoseki Oita
Japan
0.15%
0.521
CNQZJ
Quanzhou (Jinjiang) Fujian
China
1.23%
0.500
E
CNXMN
Xiamen (Weitou) Fujian
China
1.23%
0.500
E
CNSHK
Shekou Guangdong
China
2.62%
0.490
E
CNMWN
Mawan Guangdong
China
0.15%
0.490
E
CNCWN
Chiwan (Shenzhen) Guangdong
China
3.23%
0.490
CNZUH
Zhuhai Guangdong
China
2.46%
0.450
E
CNSWA
Shantou (Chaoyang) Guandong
China
1.69%
0.450
E
CN013
Xiangshui
China
0.46%
0.450
E
CNCAN
Guangzhou Guangdong
China
6.62%
0.445
KRPUS
Pusan
Korea Republic of
1.38%
0.441
TWKHH
Kaohsiung
Taiwan Province of China
0.15%
0.437
SGSIN
Singapore
Singapore
0.15%
0.423
HKHKG
Hong Kong
Hong Kong
4.46%
0.415
CNHUA
Huangpu (Xinzao) Guangdong
China
3.23%
0.414
CNTGU
Tanggu Tianjin
China
0.31%
0.400
E
USBCC
Vancouver Washington
United States
0.15%
0.396
USLAX
Los Angeles California
United States
0.15%
0.395
E
PGDAU
Daru
Papua New Guinea
0.15%
0.388
CNSHA
Shanghai (Shihu) Shanghai
China
10.62%
0.370
CNHAK
Haikou Hainan
China
0.31%
0.350
E
CNCGU
Changshu
China
0.15%
0.350
E
CNYJI
Yangjiang Guandong
China
0.15%
0.350
E
CNZHA
Zhanjiang Guangdong
China
0.15%
0.350
E
CNZJG
Zhangjiagang (Changjiagang) Jiangsu
China
0.46%
0.330
E
MYPKG
Port Kelang
Malaysia
0.15%
0.326
CNNKG
Nanjing Jiangsu
China
1.23%
0.300
E
CNFAN
Fangcheng (Qinzhou) Guangxi
China
0.15%
0.300
E
CNJIA
Jiangyin Jiangsu
China
5.23%
0.200
E
CNNTG
Nantong Jiangsu
China
2.15%
0.200
E
CNZHE
Zhenjiang Zhejiang
China
0.46%
0.200
E
47
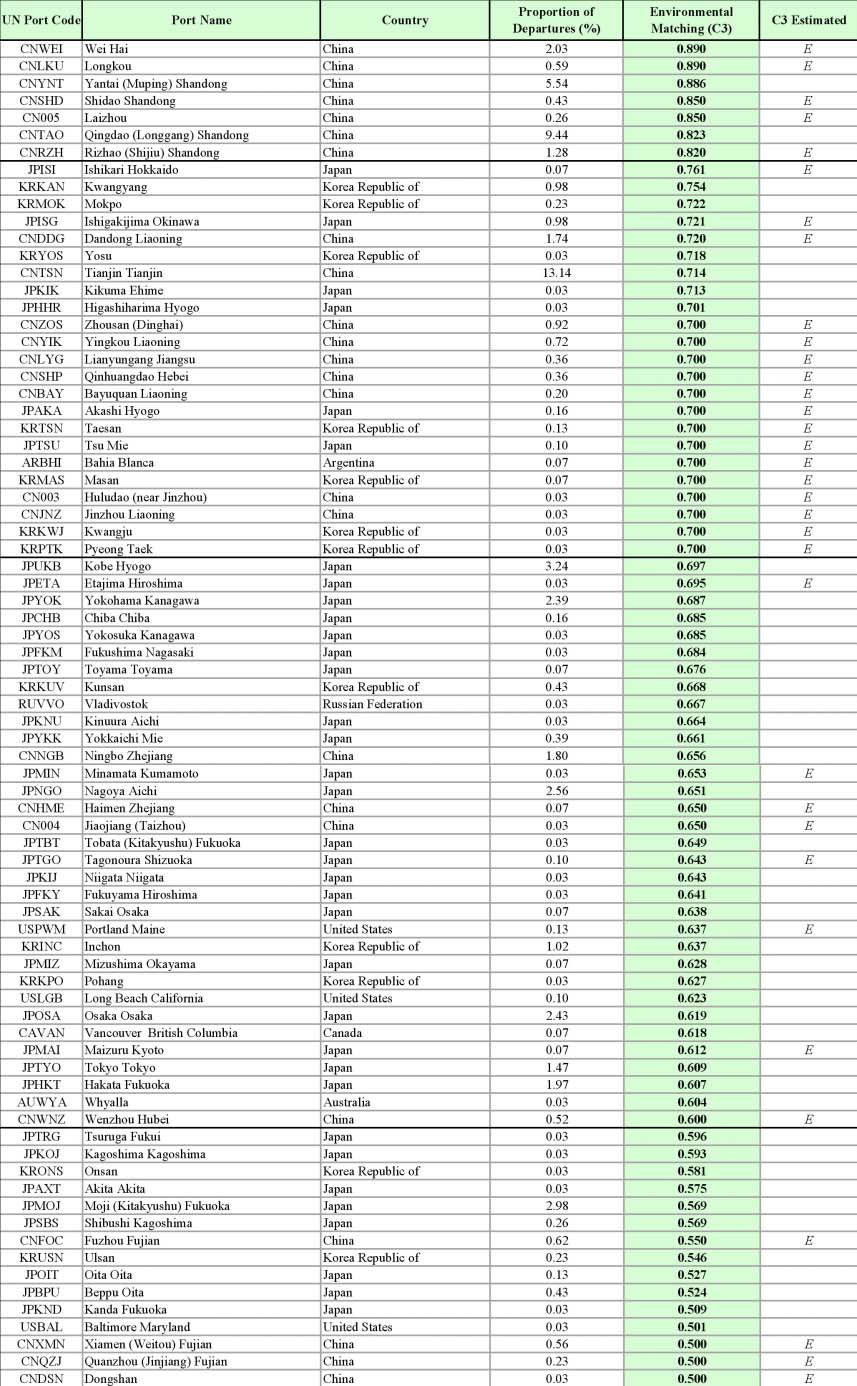
Ballast Water Risk Assessment, Port of Dalian, People's Republic of China, November 2003: Final Report
Table 6. Destination ports identified for Port of Dalian, ranked according to the size of their environmental
matching coefficient (C3)*
48
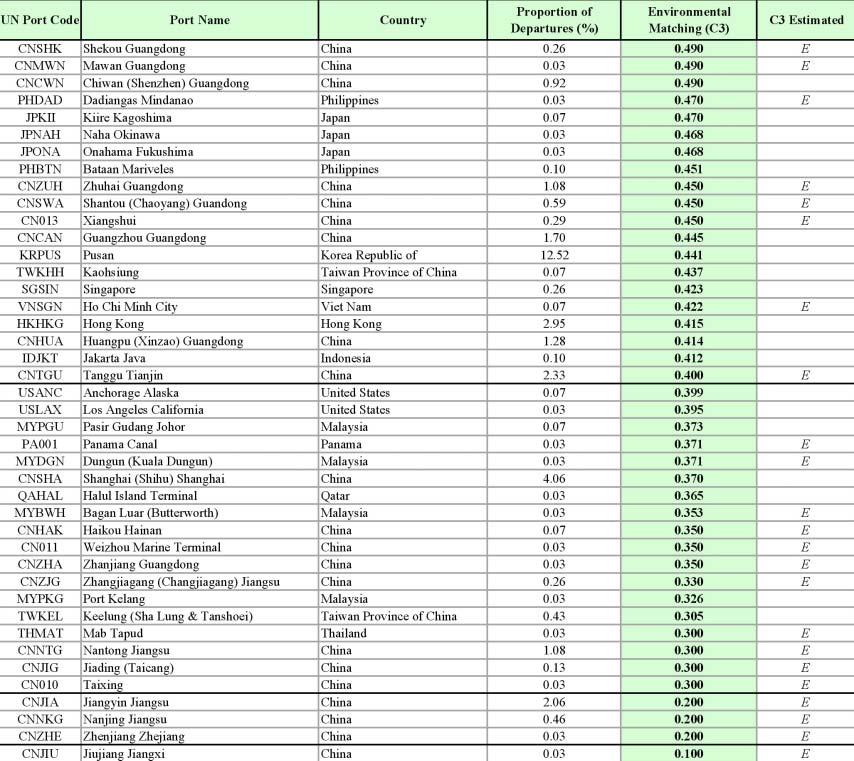
4 Results
Table 6 (cont'd). Destination ports identified for Port of Dalian, ranked according to the size of their
environmental matching coefficient (C3)*
4.7
Risk species
The risk species threat from a source port depends on the number of introduced and native species in
its bioregion, and their categorisations as unlikely, suspected or known harmful species (Section 3.9).
The risk species threat coefficient (C4) of each BW source port identified for Dalian are shown in
Figure 23 and listed in Table 7. Table 7 also lists the scores for the introduced, suspected and known
harmful species of the source port bioregions, as had been collated and assigned to the database's
species tables by March 2003.
A total of 84 native and introduced risk species were collated for the China bioregions, including
species information sourced from Dalian, Hong Kong, Japan, Australia, Canada and US (Appendix
5). As noted in Section 3.9, the species tables and their associated Excel reference file do not form a
complete global list but provide a working resource enabling convenient update and improvement for
each bioregion. Similarly, the 204 bioregions on the GIS world map should not be considered
unalterable. Regional resolution of species-presence records is steadily improving in several areas,
and this will allow many bioregions to become divided into increasingly smaller units (ultimately
approaching the scale of local port waters). It should also be remembered that the distribution of risk
species in the database contains a regional bias due to the level of aquatic sampling and taxonomic
effort in Australia/New Zealand, Europe and North America.
Many of the species listed for these areas can be related to their history of species transfers for
aquaculture, plus hull fouling on sailing vessels and the canal-caused invasions of the east
49
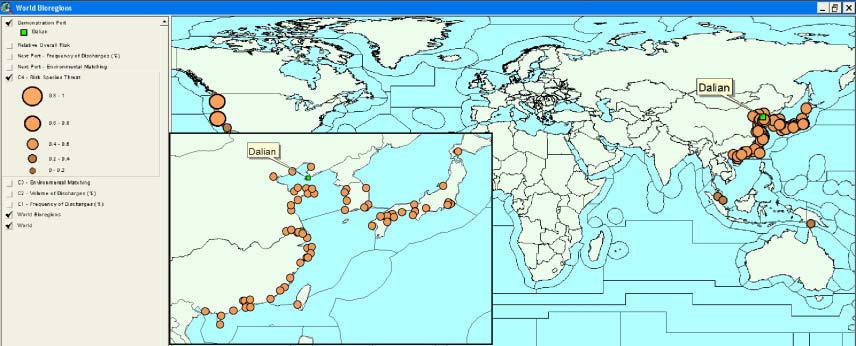
Ballast Water Risk Assessment, Port of Dalian, People's Republic of China, November 2003: Final Report
Mediterranean (Suez), north-east Europe (Ponto-Caspian river canal links) and Great Lakes (St
Lawrence River seaway).
The regional and often patchy sampling bias needs to be recognised when comparing C4 values
between different bioregions, and is a further reason why the independent treatment of C3 for
calculating the ROR values is a safer approach (Section 3.10). Because of the different historical
vectors (hull fouling, canals, aquaculture, dry ballast, water ballast, etc), a future version of the
BWRA system could provide more accurate C4 values for BW-mediated introduction threats if vector
weightings are added to the database for the C4 calculation.
Finally, it is worth noting the database cannot produce `reverse' C4 values for destination ports (i.e.
measures of the relative threat posed by any BW exported from Dalian). This requires knowing the
sources of all the other BW discharged at each destination port. What can be extracted from the
database to assist a `reverse' BWRA is the list of species assigned to the bioregion of Dalian (which is
located in bioregion NWP-4c; Figure 7, Table 8).
The risk species listed in Table 8 include preliminary identifications from the Dalian PBBS plus taxa
listed in published and unpublished reports collated by Group C members (Appendix 5). Species
native to the Bohai Sea/Yellow Sea regions which have harmful or suspected reputations in other
regions are also present. These provide important components to a reverse BWRA since many of
them have gained harmful species credentials in Europe, the north-east Pacific and/or southern
Australia (particularly the Asian strangle weed, wakame kelp, Chinese mitten crab, Asian clam, date
mussel and Northern Pacific starfish).
Figure 23. GIS outputs showing the location and risk species threat coefficients (C4) of the BW source ports
identified for the Port of Dalian
50
4 Results
Table 7. Ranking of BW source ports identified for Port of Dalian, according to the size of their risk species threat
(C4).
No. of
Suspected
Knwn
Total
Relative Risk
UN Port
Source Port
Country
Bio-Region
Introduced
Harmful
Harmful
Threat
Species Threat
Code
Species
Species
Species
Value
(C4)
USBCC Vancouver Washington
United States
NEP-IV
41
5
7
126
0.700
USSFO San Francisco California
United States
NEP-V
41
5
7
126
0.700
CN004
Jiaojiang (Taizhou)
China
NWP-3a
15
3
6
84
0.467
CN005
Laizhou
China
NWP-4c
15
3
6
84
0.467
CN007
Rushan
China
NWP-4c
15
3
6
84
0.467
CN009
Shipu
China
NWP-3a
15
3
6
84
0.467
CNBAY Bayuquan Liaoning
China
NWP-4c
15
3
6
84
0.467
CNCGU Changshu
China
NWP-3a
15
3
6
84
0.467
CNFOC Fuzhou Fujian
China
NWP-3a
15
3
6
84
0.467
CNHME Haimen Zhejiang
China
NWP-3a
15
3
6
84
0.467
CNJIA Jiangyin Jiangsu
China
NWP-3a
15
3
6
84
0.467
CNLKU Longkou
China
NWP-4c
15
3
6
84
0.467
CNLYG Lianyungang Jiangsu
China
NWP-4c
15
3
6
84
0.467
CNNGB Ningbo Zhejiang
China
NWP-3a
15
3
6
84
0.467
CNNKG Nanjing Jiangsu
China
NWP-3a
15
3
6
84
0.467
CNNTG Nantong Jiangsu
China
NWP-3a
15
3
6
84
0.467
CNQZJ Quanzhou (Jinjiang) Fujian
China
NWP-3a
15
3
6
84
0.467
CNRZH Rizhao (Shijiu) Shandong
China
NWP-4c
15
3
6
84
0.467
CNSHA Shanghai (Shihu) Shanghai
China
NWP-3a
15
3
6
84
0.467
CNSHD Shidao Shandong
China
NWP-4c
15
3
6
84
0.467
CNSHP Qinhuangdao Hebei
China
NWP-4c
15
3
6
84
0.467
CNSWA Shantou (Chaoyang) Guandong
China
NWP-3a
15
3
6
84
0.467
CNTAO Qingdao (Longgang) Shandong
China
NWP-4c
15
3
6
84
0.467
CNTGU Tanggu Tianjin
China
NWP-4c
15
3
6
84
0.467
CNTSN Tianjin Tianjin
China
NWP-4c
15
3
6
84
0.467
CNWEI Wei Hai
China
NWP-4c
15
3
6
84
0.467
CNWNZ Wenzhou Hubei
China
NWP-3a
15
3
6
84
0.467
CNXMN Xiamen (Weitou) Fujian
China
NWP-3a
15
3
6
84
0.467
CNYNT Yantai (Muping) Shandong
China
NWP-4c
15
3
6
84
0.467
CNZHE Zhenjiang Zhejiang
China
NWP-3a
15
3
6
84
0.467
Zhangjiagang (Changjiagang)
CNZJG
China
NWP-3a
15
3
6
84
0.467
Jiangsu
CNZOS Zhousan (Dinghai)
China
NWP-3a
15
3
6
84
0.467
JPFKM Fukushima Nagasaki
Japan
NWP-3a
15
3
6
84
0.467
JPMOJ Moji (Kitakyushu) Fukuoka
Japan
NWP-3a
15
3
6
84
0.467
KR001
Hadong
Korea Republic of
NWP-3a
15
3
6
84
0.467
KRINC Inchon
Korea Republic of
NWP-4c
15
3
6
84
0.467
KRKUV Kunsan
Korea Republic of
NWP-4c
15
3
6
84
0.467
KRMOK Mokpo
Korea Republic of
NWP-3a
15
3
6
84
0.467
KRPUS Pusan
Korea Republic of
NWP-3a
15
3
6
84
0.467
KRTSN Taesan
Korea Republic of
NWP-4c
15
3
6
84
0.467
JPCHB Chiba Chiba
Japan
NWP-3b
13
3
6
82
0.456
JPIWK Iwakuni Yamaguchi
Japan
NWP-3b
13
3
6
82
0.456
JPKRE Kure Hiroshima
Japan
NWP-3b
13
3
6
82
0.456
JPKUD Kudamatsu Yamaguchi
Japan
NWP-3b
13
3
6
82
0.456
JPMIZ
Mizushima Okayama
Japan
NWP-3b
13
3
6
82
0.456
JPMYJ Matsuyama Ehime
Japan
NWP-3b
13
3
6
82
0.456
JPNGO Nagoya Aichi
Japan
NWP-3b
13
3
6
82
0.456
JPOSA Osaka Osaka
Japan
NWP-3b
13
3
6
82
0.456
JPSAG Saganoseki Oita
Japan
NWP-3b
13
3
6
82
0.456
JPSAK Sakai Osaka
Japan
NWP-3b
13
3
6
82
0.456
JPSMT Shimotsu Wakayama
Japan
NWP-3b
13
3
6
82
0.456
JPTYO Tokyo Tokyo
Japan
NWP-3b
13
3
6
82
0.456
JPYOK Yokohama Kanagawa
Japan
NWP-3b
13
3
6
82
0.456
JPKIJ
Niigata Niigata
Japan
NWP-4a
11
3
6
80
0.444
JPMAI Maizuru Kyoto
Japan
NWP-4a
11
3
6
80
0.444
KRMUK Mukho
Korea Republic of
NWP-4a
11
3
6
80
0.444
KRONS Onsan
Korea Republic of
NWP-4a
11
3
6
80
0.444
KRUSN Ulsan
Korea Republic of
NWP-4a
11
3
6
80
0.444
CN013
Xiangshui
China
NWP-2
11
2
6
77
0.428
CNCAN Guangzhou Guangdong
China
NWP-2
11
2
6
77
0.428
CNCWN Chiwan (Shenzhen) Guangdong
China
NWP-2
11
2
6
77
0.428
CNFAN Fangcheng (Qinzhou) Guangxi
China
NWP-2
11
2
6
77
0.428
CNHAK Haikou Hainan
China
NWP-2
11
2
6
77
0.428
CNHUA Huangpu (Xinzao) Guangdong
China
NWP-2
11
2
6
77
0.428
CNMWN Mawan Guangdong
China
NWP-2
11
2
6
77
0.428
CNSHK Shekou Guangdong
China
NWP-2
11
2
6
77
0.428
CNYJI Yangjiang Guandong
China
NWP-2
11
2
6
77
0.428
CNZHA Zhanjiang Guangdong
China
NWP-2
11
2
6
77
0.428
CNZUH Zhuhai Guangdong
China
NWP-2
11
2
6
77
0.428
HKHKG Hong Kong
Hong Kong
NWP-2
11
2
6
77
0.428
JPMUR Muroran Hokkaido
Japan
NWP-4b
11
2
6
77
0.428
TWKHH Kaohsiung
Taiwan Province of China
NWP-2
11
2
6
77
0.428
USLAX Los Angeles California
United States
NEP-VI
21
3
4
70
0.389
USLGB Long Beach California
United States
NEP-VI
21
3
4
70
0.389
MYPKG Port Kelang
Malaysia
EAS-VI
5
4
5
67
0.372
SGSIN Singapore
Singapore
EAS-VI
5
4
5
67
0.372
PGDAU Daru
Papua New Guinea
SP-I
8
1
3
41
0.228
51
Ballast Water Risk Assessment, Port of Dalian, People's Republic of China, November 2003: Final Report
Table 8. Status of risk species assigned to the bioregion of Dalian (NWP-4c)
Group
Common Name
Species Name
Regional Status
Threat Status
Toxic dinoflagellate
Pyrrophyta/Dinophycae
Gymnodinium catenatum
Cryptogenic
Known harmful species
Toxic dinoflagellate
Pyrrophyta/Dinophycae
Gymnodinium cf. mikimotoi
Cryptogenic
Known harmful species
Broccoli weed
Chlorophyta
Codium fragile spp. tomentosoides
Native
Known harmful species
Filamentous red alga
Rhodophyta
Polysiphonia brodiaei
Introduced
Not suspected
Red seaweed
Rhodophyta
Eucheuma debticulatum
Native
Not suspected
Red seaweed
Rhodophyta
Eucheuma striatu
Native
Not suspected
Red seaweed
Rhodophyta
Kappaphycus alvareii
Native
Not suspected
Red seaweed
Rhodophyta
Kappaphycus cottonii
Native
Not suspected
Asian strangle weed
Phaeophyta
Sargassum muticum
Native
Suspected harmful species
Asian kelp/Wakame/Qundaicai
Phaeophyta
Undaria pinnatifida
Native
Known harmful species
Hydroid
Cnidaria, Hydrozoa
Ectopleura crocea
Introduced
Not suspected
Sea anemone
Cnidaria, Anthazoa
Diadumene lineata (=Haliplanella luciae)
Native
Suspected harmful species
Colonial burrowing worm
Annelida, Polychaeta
Boccardia proboscidea
Native
Not suspected
Estuarine rag worm
Annelida, Polychaeta
Perinereis vancaurica tetradentata
Native
Not suspected
Serpulid tube worm
Annelida, Polychaeta
Ficopomatous enigmaticus
Cryptogenic
Not suspected
Serpulid tube worm
Annelida, Polychaeta
Hydroides cf. ezoensis
Cryptogenic
Not suspected
Serpulid tube worm
Annelida, Polychaeta
Hydroides elegans
Introduced
Known harmful species
Serpulid tube worm
Annelida, Polychaeta
Hydroides norvegica
Introduced
Suspected harmful species
Serpulid tube worm
Annelida, Polychaeta
Pomatoleios kraussii
Native
Not suspected
Sedentary spionid worm
Annelida, Polychaeta
Pseudopolydora paucibranchiata
Native
Not suspected
Copepod
Arthropoda, Copepoda
Acartiella sinensis
Native
Not suspected
Parasitic oyster copepod
Arthropoda, Copepoda
Mytilicola orientalis
Native
Suspected harmful species
Copepod
Arthropoda, Copepoda
Oithona davisae
Native
Not suspected
Copepod
Arthropoda, Copepoda
Pseudodiaptomus marinus
Native
Not suspected
Bay barnacle
Arthropoda, Cirrepedia
Balanus improvisus
Introduced
Not suspected
Acorn barnacle
Arthropoda, Cirrepedia
Balanus variegatus
Native
Not suspected
Pink giant barnacle
Arthropoda, Cirrepedia
Megabalanus rosa
Native
Not suspected
Giant barnacle
Arthropoda, Cirrepedia
Megabalanus tintinnabulum
Introduced
Known harmful species
Zebra barnacle
Arthropoda, Cirrepedia
Megabalanus zebra
Cryptogenic
Not suspected
Sea flea
Arthropoda, Amphipoda
Jassa marmorata
Introduced
Not suspected
Skeleton shrimp
Arthropoda, Caprellidae
Caprella acanthogaster (cf. C. mutica)
Native
Not suspected
Asian slater
Arthropoda, Isopoda
Synidotea laevidorsalis
Native
Not suspected
Japanese opossum shrimp
Arthropoda, Mysdiacea
Neomysis japonica
Native
Suspected harmful species
Oriental shrimp
Arthropoda, Palaemonidae
Palaemon macrodactylus
Native
Not suspected
European green shore crab
Arthropoda, Brachyura
Carcinus maenas
Introduced
Known harmful species
Asian paddle crab
Arthropoda, Brachyura
Charybdis cf. japonica
Native
Suspected harmful species
Dromiid crab
Arthropoda, Brachyura
Dromia wilsoni
Introduced
Not suspected
Chinese mitten crab
Arthropoda, Brachyura
Eriocheir sinensis
Native
Known harmful species
Asian grapsid crab
Arthropoda, Brachyura
Hemigrapsus penicillatus
Native
Suspected harmful species
Atlantic scallop
Mollusca, Bivalvia
Argopecten irradians
Introduced
Not suspected
Pacific oyster
Mollusca, Bivalvia
Crassostrea gigas
Native
Suspected harmful species
Mud clam
Mollusca, Bivalvia
Macira discors
Native
Not suspected
Asian date mussel
Mollusca, Bivalvia
Musculista senhousia
Native
Known harmful species
Mediteranean blue mussel
Mollusca, Bivalvia
Mytilus galloprovincialis
Introduced
Known harmful species
Varnish clam
Mollusca, Bivalvia
Nuttallia obscurata
Native
Not suspected
Asian clam
Mollusca, Bivalvia
Potamocorbula amurensis
Native
Known harmful species
Periwinkle
Mollusca, Gastropoda
Litorina saxatilis
Introduced
Suspected harmful species
Mactrid whelk
Mollusca, Gastropoda
Raeta (Raetellops) pulchella
Native
Not suspected
Veined rapa whelk
Mollusca, Gastropoda
Rapana venosa (= R. thomasiana)
Native
Suspected harmful species
White-tentacled aeolis
Mollusca, Gastropoda
Sakuraeolis enosimensis
Native
Not suspected
Anemone-feeding nudibranch
Mollusca, Ophistobranchia
Aeolidiella indica (=Carolaria indica)
Native
Not suspected
Tergepedid nudibranch
Mollusca, Ophistobranchia
Cuthona alpha, C beta
Native
Not suspected
Flat okenid nudibranch
Mollusca, Ophistobranchia
Okenia plana
Native
Not suspected
Northern Pacific seastar
Echinodermata, Asteroidea
Asterias amurensis
Native
Known harmful species
Sea moss (Bryozoan)
Ectoprocta/Cheilostomata
Bugula stolonifera
Introduced
Not suspected
Sea moss (Bryozoan)
Ectoprocta/Cheilostomata
Cryptosula pallasiana
Introduced
Suspected harmful species
Sea moss (Bryozoan)
Ectoprocta/Cheilostomata
Schizoporella 'unicornis' spp.
Native
Not suspected
Sea moss (Bryozoan)
Ectoprocta/Cheilostomata
Tricellaria occidentalis (=T. inopinata)
Native
Not suspected
Colonial sea squirt (tunicate)
Urochordata, Ascidiacea
Botryllus aurantius (cf. B. violaceus)
Native
Not suspected
Colonial sea squirt (tunicate)
Urochordata, Ascidiacea
Botryllus schlosseri
Introduced
Not suspected
Sea eggplant (tunicate)
Urochordata, Ascidiacea
Styela clava
Native
Not suspected
Oriental Yellowfin Goby
Pisces, Gobiidae
Acanthogobius flavimanus
Native
Not suspected
Japanese Goby
Pisces, Gobiidae
Tridentiger barbatus
Native
Not suspected
Japanese Goby
Pisces, Gobiidae
Tridentiger trigonocephalus
Native
Not suspected
52
4 Results
4.8
Risk assessment results
The database calculates the relative overall risk (ROR) of a potentially harmful introduction for all
source ports that have C1-C4 coefficients and R1-R2 factors. The ROR value for each source port
represents a proportion of the threat posed to the Demonstration Site as result of its contemporary
trading pattern (1999-2002).
After calculating the RORs the database generates a large output table listing the source ports and
their coefficients, risk-reduction factors and ROR value, plus the five ROR categories used for the
GIS plot and the standardised ROR values (S-ROR; Section 3.10). Results from the project-standard
BWRA for the Port of Dalian are listed in Table 9, and the GIS plot of the ROR categories is shown
in Figure 24.
From the 3278 BWRF records in the Dalian database, the project standard method ranked 11 of the 77
source ports as representing the highest risk group in terms of their BW source frequency, volume,
environmental similarity and assigned risk species. These ports were all regionally close to Dalian and
provided the top 20% of the total ROR, with individual ROR values above 0.3 (Table 9). The highest
risk group was led by Yantai (ROR = 0.354; S-ROR = 1.0), Qingdao (ROR = 0.344; S-ROR = 0.96)
and Longko (0.343; 0.95), with the Korean Port of Inchon being the highest risk foreign port (ranked
10th with an ROR of 0.302 and S-ROR of 0.78; Table 9).
The first port in the ranking that lies beyond the Bohai-Yellow Sea region was Iwakuni in Japan's
Seto Sea, which was ranked 14th overall and 3rd in the second (high risk) group of ports with an ROR
of 0.297 (S-ROR = 0.76; Table 9). The highest risk ports beyond East Asia were the American west
coast ports of Long Beach and San Francisco (ranked in the lowest group of risk ports in Table 9, with
ROR values of 0.215 (S-ROR = 0.41) and 0.202 (S-ROR = 0.35) respectively. These ports fell into
the lowest risk group because of their relative contribution to the overall threat of harmful species
transfers as a result of Dalian's shipping trade in 2000-2002, as represented by the BWRFs collected
for this period. Thus while their environmental matching coefficients were moderately high (C3s of
0.62 and 0.65; Table 4), their voyage duration factor (R2) and very low incidence of recorded BW
discharge resulted in the low ranking. However it should be noted from Table 9 that the percentage
contribution made to Dalian's overall risk by Long Beach (1.13%) and San Francisco (1.06%) was not
substantially different from the highest risk ports (all in the 1.6% - 1.9% range).
The 38 source ports grouped in the low (16) and lowest (22) risk categories were a mixture of river,
estuarine and/or warmer water ports in Asia and north America. The source port with the lowest ROR
(0.119; S-ROR = 0.0) was Los Angeles in southern California (Table 9). This port had been provided
an estimated C3 value based on that calculated for nearby San Diego (Appendix 6), and contributed
0.62% of the total threat (Table 9).
Figure 25 shows the frequency distribution of the standardised risk values (S-RORs) listed in Table 9,
with the vertical bars showing the boundaries separating the five categories of risk. This figure shows
that the highest and high risk groups each form discrete peaks (on the right side of the plot), which
indicates a natural grouping occurred (i.e. not an artificial splitting of a uniform grade). While the
moderate risk group also forms a central peak, it is not surprising that the low and lowest risk groups
grade into each other. The small peak between S-RORs 0.15 0.35 indicates some grouping among
the ports of the lowest risk category.
Based on Dalian's current pattern of shipping trade (as represented by the BWRFs collected in 2000-
2002), the C1-C4 and ROR results generated by the project-standard method highlight the following:
· Dalian's pattern of trade makes it one of the key regional `hub' ports of East Asia;
· Dalian appears to receive very little BW transferred directly from distant overseas ports;
· BW arriving in vessels from riverine and warm water ports present much less threat than from
open coastline ports in the Bohai and Yellow Sea region, not only because of the latter's high
environmental matching but also their shorter voyage durations and higher level of BW
transfers.
53
Ballast Water Risk Assessment, Port of Dalian, People's Republic of China, November 2003: Final Report
Thus the take-home message from the project's `first-pass' risk assessment is that Dalian's trade
makes it more prone to introductions of species which `port-hop' after establishing in one or more of
its commonly-traded regional ports in north China, Korea and Japan, rather than by introductions
directly from America, Europe or other distant regions. The risk results in Table 9 and Figures 24, 25
appear logical given Dalian's biogeographic location and recent pattern of trade, and therefore
indicate that the project standard `first-pass' treatment of the risk coefficients will provide a very
useful benchmark for any investigative manipulations of the risk formula or database management.
The project standard results also imply that any introduced species which establishes in one of the
many small and large ports along the Bohai and Yellow Sea coastline could be readily spread by
coastal shipping. Thus it would be very worthwhile to obtain port environmental data for many of
these ports, so as to allow their C3 coefficients to be calculated rather than estimated for the
assessment reported here.
In this context, there is no doubt that northern China is experiencing a number of invasive species,
both known and cryptogenic, some of which are contributing to the increased fouling and noxious red
tide problems of the intensive mariculture operations which form an important part of its coastal
economy. While these problems have so far been most felt in the Bohai Sea due its progressive
eutrophication in recent decades, increased fouling and red tide events are being noticed along parts of
the Yellow Sea and Korea Bay coastlines (Assoc. Prof. Wang Lijun, pers. comm.) Since China's
extensive coastline extends well into the tropics and supports numerous small ports serviced by a
large coastal trading fleet, the issue of water-borne parasites and pathogens that threaten commercially
cultured species and/or public health also needs to be remembered (their virtual absence from the
current risk species database highlights the fragility of the C4 coefficient as well as the difficulty of
performing `reverse' BW risk assessments).
Figure 24. GIS outputs showing the location and categories of relative overall risk (ROR) of source ports
identified for the Port of Dalian
54
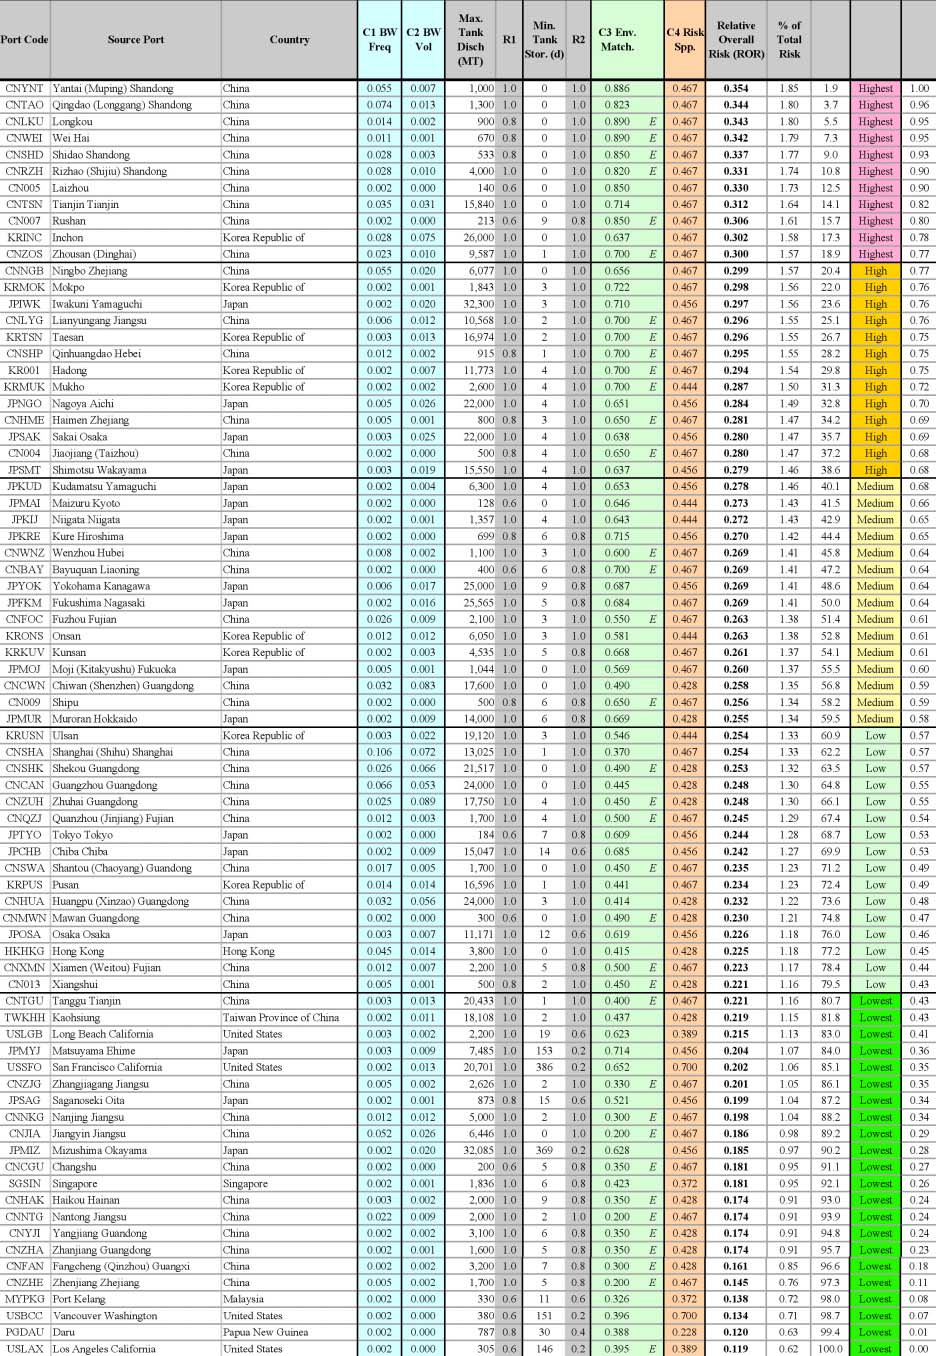
4 Results
Table 9. BW source ports reported for the Port of Dalian, ranked according to their Relative Overall Risk (ROR)
55
Ballast Water Risk Assessment, Port of Dalian, People's Republic of China, November 2003: Final Report
Distribution of Standardised ROR values
10
9
8
7
6
5
Frequency 4
3
2
1
0
0.00
0.10
0.20
0.30
0.40
0.50
0.60
0.70
0.80
0.90
1.00
Standardised ROR Value
Figure 25. Frequency distribution of the standardised ROR values
Reverse BWRA
There is no doubt that Dalian `exports' significant volumes of ballast water, much of which appears
destined for regional ports via bulk carriers departing from the various grain, coal and oil import
berths, plus smaller quantities in many of the ships that depart from the container and ro-ro berths at
Dagang, Heshangdao (Dalianwan) and Dayaowan terminals (Appendix 7). The most important BW
destination ports appear to be Tianjin in the north Bohai Sea and both Qingdao and Inchon which face
the Yellow Sea coastline (Figure 2; also Section 4.5). These ports also have relatively high
environmental matching values with Dalian, all of which were calculated (0.64-0.82; Table 5). This
suggests any harmful species that establishes a viable population in Dalian has a more than reasonable
chance of `port-hopping' to these and ports via BW-mediated transfers. In the case of the risk species
assigned to the Dalian bioregion the vast majority are already widely distributed in East Asia.
However any new suspected harmful phytoplankton or fouling species that appears in Dalian may
represent the type of species likely to exert the most potential impact if translocated to ports in the
Bohai Sea, Yellow Sea and Sea of Japan (i.e. bioregions NWP-3a, NWP-4a, NWP-4c; Figure 7),
particularly owing to the high level of fouling-growth sensitive mariculture and industrial
infrastructure in these regions.
4.9 Training and capacity building
The computer hardware and software provided by the GloBallast Programme for the BWRA activity
was successfully installed and is currently maintained at the Liaoning MSA office in Dalian. This PC,
plus others made available from MSA for port map development and group demonstrations, proved
reliable and adequate for running the database, undertaking the similarity analyses, displaying the GIS
maps and results and providing other project needs.
Most counterparts had had sufficient experience in the routine use of MS Windows applications to
pick up the use of the Access database with difficulty. The GIS mapping work was new to the MSA
counterparts of Group A (Appendix 2), but sufficient guidance and assistance was provided by the
56
4 Results
DMU and URS counterparts in this Group for them to become familiar with the use of ArcView,
digitising and geo-referencing new data, the types of theme layers recommended for the port map and
how to housekeep the various metafiles. It is therefore considered that the close relationship between
the Liaoning MSA and DMU provides a strong capacity-base for China to produce similar port
resource maps for future BWRA, PBBS and/or other BW management activities and demonstrations
in the region.
MSA counterparts of Group B quickly mastered the use of the Database and undertook the onerous
task of entering nearly 3,200 BWRFs, a total far exceeding that of the other Pilot Country
demonstration sites. As noted in Section 3.6, the most easily-trained and efficient database operators
are those with port and maritime work experience, plus previous hands-on experience with Windows
applications, and this was the case at Dalian. This is not to say that Group B did not encounter the
same types of BWRF data entry problems experienced at the other Demonstration Sites (Section
4.11). For example, the decision by Group B counterparts to use five separate databases to allow
simultaneous BWRF entries for different terminal areas led to the same problem experienced at the
Mumbai Demonstration Site, namely the time wasted in duplicating ship and port details and the
technically challenging difficulties of merging complex Access databases19.
Group B also encountered but eventually overcame some technical data-entry and database
calculation problems unique to Dalian. These stemmed from the wide mix of Chinese (yy-mm-dd),
English (dd-mmm-yy) and US (mm-dd-yy) date formats in the BWRFs, which caused erroneous
database calculations and Access/Windows-OS problems despite warnings and advice provided by the
consultants during and after the first country visit. Another issue was the difficulty in relocating
original BWRFs to double-check dates actually recorded by the ships' officer. The date format
problem was eventually overcome by a multi-step approach led by the consultants during their second
visit, and the database provided in the third visit was further modified to only accept date entries with
a complete "dd-mmm-yyyy" format, to ensure no further potential for any confusion and
Access/Windows conflicts. Random checks of 50 BWRFs also confirmed that, apart from the date
format confusion, there had been a high level of data-entry accuracy for the other data fields.
Group C received instruction in the approach and methods of the environmental similarity analysis
using the PRIMER package during the in-country visits by the consultants, with intensive `hands-on'
training provided in the second visit. Group C lead counterpart Mr Zhang Jiu Xin mastered the use of
the Excel spreadsheets and PRIMER package for undertaking the multivariate environmental
similarity analysis, checking the results and then generating the environmental matching coefficients
for Group B to insert into the database. Other Group C members focussed on the way to add/edit risk
species data, and the calculations used for the project-standard risk assessment. All Group C
counterparts contributed to the collation of the port environmental data required for Dalian and six
other Chinese ports. The risk species information was collated by Group C counterpart Mr Wang
Lijun, who was also a senior member of the Dalian PBBS team, plus URS (Section 4.7).
Near the end of the consultants second visit the Dalian counterparts presented a very successful
demonstration and briefing of the total BWRA system and its initial risk results to the Deputy
Director General of the Liaoning MSA, three representatives from the Marine Environment
Monitoring Centre of the State Oceanic Administration, Professor Zhang from Dalian Maritime
University plus nine other representatives from DMU and interested agencies. The good ability of the
key team members to demonstrate and explain the system in Mandarin was confirmed by this detailed
presentation which lasted more than 3 hours. A productive `lessons-learned' session was subsequently
held by the project team and consultants on the final day.
19 Merging the five separate databases took over three days to complete during the consultants second visit,
because of the need to remove duplicated vessel, port and country data, and to completely re-organise the
unique identifiers and then check all tables for linking errors. While BWRF entries should only be made
into one database for a port, a single database can be loaded onto a network server to allow convenient
multi-user access.
57
Ballast Water Risk Assessment, Port of Dalian, People's Republic of China, November 2003: Final Report
4.10 Identification of information gaps
Ballast Water Reporting Forms
As noted in Section 4.9, inattentive or hasty completion of the IMO-style BWRFs in busy East Asian
ports such as Dalian can lead to date confusions because of the differing formats, and not all fields in
the BWRF provide a date format guide (Appendix 1). It was also clear that many ship's did not
complete BWRFs correctly or logically, particularly with respect to tank source, exchange and
discharge data. While many of these errors were spotted and fixed, this demanded considerable time
and effort. Such waste of resources will re-occur unless more importance is attached to explaining to
ships what is required, and for port or MSA officials to scrutinise forms at the point of collection and
refuse to accept them if they have illogical or missing data in the key fields. It also became apparent
that not all product tankers visiting the Siergou Terminal to load refined products were reporting all
BW discharges made at the berths or just after their departure, a feature picked up and noted by the
MSA counterparts.
In general, the Dalian database indicates that BWRFs containing many empty or incorrect entries for
BW source/s, uptake date/s and tank volumes intended to be discharged were not as common as those
collected at other Demonstration Sites where BWRFs had been submitted on a more voluntary basis.
It had been planned to conduct an error analysis of the Dalian BWRFs during the second country visit,
but the need to merge five complex databases and resolve the mixture of date formats (Section 4.9)
prevented this. However the following list summarises common omissions or mistakes in submitted
BWRFs that were noted, many of which also encountered at the other Demonstration Sites:
· BW uptake date, source port/location and/or discharge volume provided for none, one, or
only a few of the total number of tanks considered most likely to have been discharged
(especially at the Siergou Terminal).
· Illogical dates and confusing mixes of date formats, some easy to resolve quickly but other
impossible to fix with surety (e.g. 01-03-02).
· No exchange data in the BW exchange field (Part 4 of the BWRF; Appendix 1), or no reason
given for not undertaking an exchange.
· BWRFS showing BW exchange data contained empty BW source cells (it is important to
enter the source port/location details because exchanges are often well below 95% effective
and never 100%).
The above summary shows which items are immediately worth checking by MSA officers whenever
collecting or receiving BWRFs. Unless guidance is provided and errors corrected, ships' officers,
shipping agents and port officers will not become familiar with and effectively use the BWRF
process.
Apart from lack of BWRF familiarity, the time provided for a ships' officer to complete a form is
another factor influencing the number of mistakes and omissions. BWRFs provided to ships during
their berthing or departure phases cannot be expected to receive the same level attention as forms
already onboard the ship and completed prior to arrival. For example, the level of reporting could be
improved if the MSA or shipping agents can arrange to send reminders, a guidance sheet and blank
forms (where necessary) to ships 1-2 days prior to arrival. Unless BWRFs are completed accurately
and fully by vessels visiting Dalian, a significant percentage of BW sources and discharge volumes
will remain unclear for future BWRA studies. For example, in the case of the Dalian study the volume
of unidentified BW discharges was 11%, which was larger than the 8.9% of the leading source port
(Table 3).
Even with correctly completed forms, it is very difficult and often impossible to identify with any
useful certainty the ultimate destination of BW uplifted by a port that relies only on BWRF collection
and analysis (Section 3.5). This is important since one of the objectives of the GloBallast BWRA was
to identify the destinations of BW uplifted at each Demonstration Site, which is a fundamental
requirement for any `reverse' risk assessment. In fact several of the GloBallast BWRA objectives
58
4 Results
required considerable effort in checking and fixing BWRF errors, plus searching and/or deducing the
following information which is not available from a standard BWRF:
· Berth number/location at the reception port (obtained for each Demonstration Site by
laborious cross-checking with port records);
· Deadweight tonnage (DWT). This is very useful for checking claimed BW discharge volumes
(DWTs were eventually obtained for most ships from the Lloyds Ship Register, but this is a
time-consuming task, particularly for ships that had entered a new name, incorrect IMO
number or Call Sign on the BWRF).
· Destination Port/s where either BW will be discharged or cargo actually offloaded (not
necessarily the Next Port of Call).
It is therefore recommended that the IMO Marine Environment Protection Committee (MEPC) review
the standard BWRF with a view to improving its global application under the new BW convention
(see Section 5).
Port environmental and risk species data
It was particularly difficult to obtain reliable environmental information for a port's waters,
particularly for the seasonal water temperature and salinity averages and extrema. This was true for
ports in very developed regions (e.g. North America, Europe and Japan) as it was for less developed
areas. Most of China's ports are not exceptions to this finding. In fact Group C counterparts
frequently commented on the difficulty in locating reliable sources for the basic seasonal water
temperature and salinity data needed for major and nearby ports such as Yantai in the neighbouring
province of Shandong.
Dalian's Group C counterparts also confirmed there is very limited knowledge of aquatic risk species
(both introduced and native) among marine academics and research agencies along China's coastline.
This appears to have been caused by:
· historical lack of networking, coordination and cooperation between marine institutions and
universities;
· very few natural history museums with marine curators (none present in Liaoning Province);
· very few comprehensive marine species surveys undertaken along China's coast; and
· the relatively few number of Chinese marine biologists who have gained specialist marine
taxonomic knowledge, including good experience with the international binomial (Linnean)
system of species classification.
In the case of aquatic risk species data beyond China, many national and regional data sets remain
incomplete and/or unpublished, while many sites covering locations in North America, the Caribbean,
Europea, Asia and Australasia list species which were historically introduced by the aquaculture,
fisheries or aquarium industries or hull fouling vector. Many do not identify the likely vector/s of their
listed species.
59
5
Conclusions and Recommendations
The main objectives of the BWRA Activity were successfully completed during the course of this
project, which took 14 months (i.e. between the initial briefing in January 2002 and the final
consultants visit in March 2003). The level of port and maritime experience brought to the project by
the various Dalian counterparts, including the GIS and environmental expertise from DMU and
NMEPMC, considerably facilitated effective instruction and familiarisation of the BWRA system. In
addition, some of the team members are hoping to repeat the exercise for another port in the north
China region.
Continuing work in ballast water management projects will enable China to provide assistance,
technical advice, guidance and encouragement to other port States in East Asia, and allow it to
maintain a leading and coordinative role. A key task will for China to expand its base of marine
scientists who can become more familiar with coastal species surveys and obtain valuable marine
taxonomic expertise if provided funds and encouragement to undertake more field survey work and
international networking.
The Regional Strategic Action Plan (SAP) being developed by GloBallast for coordinating BW
management activities in the region provides the best mechanism for replicating the collation and
analysis of BWRF data. Items requiring critical attention for future BWRA and/or associated BW
management activities in the East Asian region should include:
· availability and promulgation of guidelines and instructions about BWRF reporting to ship's
officers, shipping agents and port officers;
· the need for BWRF checking /verification procedures;
· the potential reliability and cost-saving benefits from implementing electronic BWRF
reporting systems in place of laborious and error prone paper-based BWRF collation methods
· the value of developing and testing more sophisticated systems involving automatic
electronic/GPS/satellite linked BW discharge transmissions;
· virtual lack of comprehensive port species surveys (PBBSs) in China, Korea and Russia (and
surprisingly few in Japan);
· lack of reliable port water temperature and salinity data for the major seasons, even for major
ports;
· lack of a regional web-based database for exchanging and updating species survey
information.
Regional organisations, port authorities and major national shipping companies in the region should
be encouraged to support efforts in the above areas.
5.1
Recommendations
· To identify the locations where BW is discharged within a port, a more useful paper or
electronic BWRF should include an entry for the berth or terminal name/number (instead of
simply `Port' and/or geographic coordinates, which was usually left blank).
· Modifying the "Last Port of Call" field to provide a "Last Three (3) Ports of Call" question
would assist paper/electronic BWRF verification checking and analysis for part-loaded
vessels visiting multi-use terminals.
· Any port officer whose duties include collecting or receiving BWRFs should be instructed to
check that all relevant fields have been completed in legible script, and to decline any Ballast
Water Management Plan offered by the vessel in lieu of a BWRF. A short BWRF information
60
5 Conclusions and Recommendations
kit and training course provided to port officers and local shipping agents is strongly
recommended, particularly during the implementation of the BWRF system at any port.
· To help decipher and interpret incomplete or suspect BWRFs, BW database entry and
management officers should always have access to up-to-date copies of the Lloyds Ship
Register, Fairplay Ports Guide, Lloyd's Maritime Atlas of World Ports or equivalent
publications. For ports using the GloBallast BWRA system, a copy of the world bioregions
map should also be provided so that the bioregion of any new port added to the database can
be quickly identified.
· To ensure cost-effective training in BW reporting and management requirements, people with
a sound knowledge and practical experience of port and shipping operations should always be
selected in preference to newcomers, with latter more acceptable for carefully supervised
apprentice roles.
5.2
BWRA recommendations and plans by Pilot Country
· Continuation of BWRF collecting, database updating and capacity-building of relevant
personnel. Collection of BWRFs at Dalian has continued following completion of the
BWRA project, with some of the newly collected BWRFs already added to the database. To
facilitate future work and expected implementation of IMO's new BW Convention, collecting
BWRFs from ships and database updating will be continued. Because existing Group B
members are officers of the Liaoning MSA who are also responsible for other ship control
activities, more people (especially newcomers) are planned to be trained for maintaining and
operating the database, GIS and related software at Dalian.
· Expansion of the IMO BWRFs and database establishment at other major ports. Some
ports in China have already expressed their intention to use IMO BWRFs for their ballast
water reporting needs, and the reporting form currently used by the Chinese Quarantine
Authority can include all of the information requested by the IMO BWRF through small
modifications. By the end of 2002, about 3,500 BWRFs had been collected in the Port of
Qinhuangdao (another major port in the Bohai Sea), so it is possible to establish a similar BW
database at that port. A proposal has therefore been made to the China MSA (Beijing), that
BWRFs be collected in the major ports with databases progressively established to
accommodate this information, and that the Liaoning MSA members of the Group B BWRA
project team can provide assistance in this regard.
· Inclusion of BW reporting, information collecting and training into the National
Regulations now under consideration for implementing the IMO BW Guidelines and
expected new Convention. The Ministry of Communications is considering formulating
Provisional Regulations for the Management and Control of Ship's BW and Sediments at the
ministerial level. The proposed Regulations include a requirement for ships' BW reporting
and training of onboard personnel, BW information collecting, preventive measures, control
procedures and a ship-specific BW management plan.
· Replication of BWRA in other ports. The China MSA will consider replicating the BWRA
in some selected major ports. The Port of Qinhuangdao may be the first for this activity
because it has already collected sufficient BWRFs.
61
6
Location and maintenance of the BWRA System
The GloBallast BWRF hardware and software packages in China are presently maintained by
Liaoning MSA staff at their offices in Dalian. The following people are currently responsible for
maintaining and updating the following features of the BWRA system in China:
Port resource mapping and GIS display requirements:
Name:
Ms Xu Xiaoman
Organisation:
Liaoning Maritime Safety Administration
Address:
Dalian, Changjiang Road 25#
Liaining Province, P.R. China 116001
Tel:
Fax:
Email: Xu_xiaoman@hotmail.com
Ballast water reporting form database:
Name:
Mr Liu Yan (Rock)
Organisation:
Liaoning Maritime Safety Administration
Address:
Dalian, Changjiang Road 25#
Liaining Province, P.R. China 116001
Tel:
Fax:
Email: rock_liuy123456@hotmail.com
Port environmental and risk species data:
Name:
Mr Zhanj Jiu Xin
Organisation:
Liaoning Maritime Safety Administration
Address:
Dalian
Tel:
Fax:
Email:
wffwk_lndl@sina.com
Name:
Assoc Prof Wang Lijun
Organisation:
National Marine Environment Protection & Monitoring Centre
Address:
State Administration of Oceanography, Dalian
Tel:
Fax:
Email:
ljwang@nmemc.gov.cn
62
References
Carlton, J.T. 1985. Transoceanic and interoceanic dispersal of coastal marine organisms: the biology
of ballast water. Oceanography and Marine Biology Annual Review 23: pp. 313-371.
Carlton, J.T. 1996. Biological invasions and cryptogenic species. Ecology 77: pp. 1653-1655.
Carlton, J.T. 2002. Bioinvasion ecology: assessing impact and scale. In: Invasive aquatic species of
Europe: Distribution, impacts and management. (E Leppäkoski, S Gollasch & S Olenin eds). Kluwer
Academic Publishers, Dordrecht, Netherlands, pp. 7-19..
Cohen, A. & Carlton, J.T. 1995. Non-indigenous aquatic species in a United States estuary: a case
study of the biological invasions of the San Francisco Bay and delta. Report to the US Fish &
Wildlife Service (Washington) and the National Sea Grant College Program Connecticut Sea Grant,
December 1995, 211 pp. (from http://nas.nfreg.gov/sfinvade.htm).
Hilliard, R.W., Hutchings, P.A. & Raaymakers, S. 1997a. Ballast water risk assessment for twelve
Queensland ports:, Stage 4: Review of candidate risk biota. Ecoports Monograph Series No. 13. Ports
Corporation of Queensland, Brisbane.
Hilliard ,R.W., Walker, S., Vogt, F., Belbin, L. & Raaymakers, S. 1997b. Ballast water risk
assessment for twelve Queensland ports, Stage 3B: Environmental similarity analyses. EcoPorts
Monograph Series No. 12. Ports Corporation of Queensland, Brisbane (two volumes).
Kelleher, G., Bleakley, C. & Wells, S. 1995. A Global representative system of marine protected
areas. The World Bank, Washington DC, USA.
Leppäkoski, E., Gollasch, S. & Olenin, S. 2002. Invasive aquatic apecies of Europe: Distribution,
impacts and management. Kluwer Academic Publishers, Dordrecht, Netherlands. 583 pp.
Williamson, A.T., Bax, N.J., Gonzalez, E. & Geeves, W. 2002. Development of a regional risk
management framework for APEC economies for use in the control and prevention of introduced
marine pests. Final report of APEC Marine Resource Conservation Working Group (MRCWG),
produced by Environment Australia, Canberra. 182 pp.
63
APPENDIX 1
Copy of
IMO Ballast Water Reporting Form
from Resolution A.868(20) Appendix 1
(Can be downloaded from http://globallast.imo.org/guidelines)
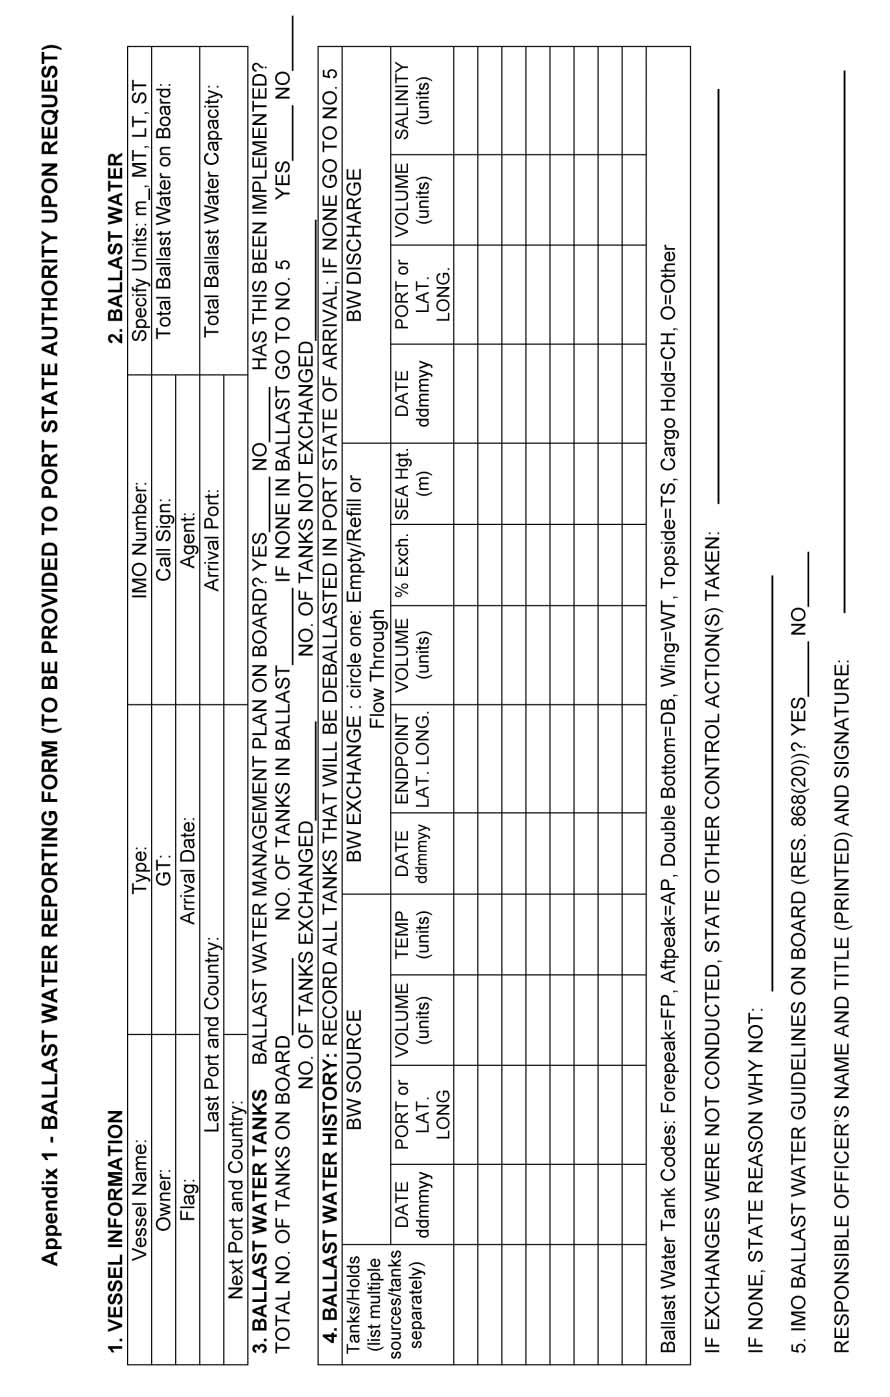
Appendix 1: Copy of IMO Ballast Water Reporting Form
1
APPENDIX 2
Risk Assessment Team for
Port of Dalian, P R China
Appendix 2: Risk Assessment Team for Port of Dalian, P.R. China
The BWRA team contained three groups which undertook the GIS mapping (Group A), database
development (Group B) and environmental matching/risk species (Group C) components of the
Activity. The activities of the three groups were coordinated by Mr Zhao Dianrong (China Maritime
Safety Administration, Beijing), Mr Zhao Dexiang (Liaoning Maritime Safety Administration,
Dalian) and Dr Rob Hilliard (URS Australia Pty Ltd).
Group A (GIS mapping)
Person:
Ms Xu Xiaoman
Position:
Group A Leader
Organization:
Liaoning Maritime Safety Administration, Dalian
Email:
Xu_xiaoman@hotmail.com
Person:
Mr Chris Clarke
Position:
Group A Counterpart Trainer
Organization: Meridian GIS Pty Ltd
Email: chris@meridian-gis.com.au
Person:
Professor Xiong Deqi
Position
Group A provision of GIS file data
Organization:
Department of Geography, Dalian Maritime University, Dalian
Email:
xiongdq@dlmu.edu.cn
Person:
Ms Jin Xiumei
Position:
Group A GIS cartography trainee
Organization:
Liaoning Maritime Safety Administration, Dalian
Person:
Mr Ji Shan
Position:
Group A GIS cartography trainee
Organization:
Liaoning Maritime Safety Administration, Dalian
Group B (Database BW records)
Person:
Mr Liu Yan
Position:
Group B Leader Database management
Organization:
Liaoning Maritime Safety Administration, Dalian
Email:
rock_liuy123456@hotmail.com
Person:
Mr John Polglaze
Position:
Group B Counterpart trainer
Organization:
URS Australia Pty Ltd
Email:
john_polglaze@urscorp.com
Person:
Ms Li Xia
Position:
Group B BW report form data entries
Organization:
Liaoning Maritime Safety Administration, Dalian
Person:
Mr Zhang Chunlong
Position:
Group B BW report form data entries.
Organization:
Liaoning Maritime Safety Administration, Dalian
1
Ballast Water Risk Assessment, Port of Dalian, People's Republic of China, November 2003: Final Report
Group C (port environment and risk species data)
Person:
Mr Zhanj Jiuxin
Position:
Group C Coordinator and environmental similarity analysis
Organization:
Liaoning Maritime Safety Administration, Dalian
Email:
wffwk_lndl@sina.com
Person:
Dr Robert Hilliard
Position:
Group C Counterpart trainer
Organization:
URS Australia Pty Ltd
Email:
robert_hilliard@urscorp.com.au
Person:
Assoc. Prof. (Biol.) Wang Lijun
Position:
Group C collation of risk species data and environmental similarity analysis
Organisation:
National Marine Environment Protection & Monitoring Centre (State Administration
of Oceanography), Dalian
Email:
ljwang@nmemc.gov.cn
Person:
Mr Jiang Yuewen
Position:
Group C collation port environment data and environmental similarity analysis
Organisation:
National Marine environment Protection & Monitoring Centre (State Administration
of Oceanography), Dalian
Email:
yjiang@nmemc.gov.cn
Person:
Professor Zhang Shuohui
Position:
Group C port environment data and environmental similarity analysis
Organisation:
Dalian Maritime University, Dalian
Email:
zhangsh@dlmu.edu.cn
Team translators
Person:
Dr Lin Kaiyu
Position:
Technical translation assistance 1st consultants visit
Organisation:
URS Australia Pty Ltd
Email:
kaiyu_lin@urscorp.com
Person:
Mr Zhao Ji
Position:
Technical translation assistance 2nd consultants visit
Organisation:
Independent translator, c/- Liaoning Maritime Safety Administration, Dalian
Email:
zj8130@yahoo.com.cn
Project Manager
Steve Raaymakers
Programme Coordination Unit
International Maritime Organization
sraaymak@imo.org
http://globallast.imo.org
2
.
APPENDIX 3
Check-list of project requirements
circulated at initial briefings in January 2001
(during 3rd GPTF meeting, Goa)
Appendix 3: Check-list of project requirements circulated at initial briefings in January 2001 (during 3rd GPTF meeting, Goa)
PROJECT REQUIREMENTS AND PROVISIONAL SCHEDULE
REMINDER AND CHECK LIST FOR CFP/CFP-A
(1)
Confirm your availability of adequate PC hardware, + Windows, Access & peripherals
At least one PC with sufficient processor speed, memory, Windows software and peripherals must be
dedicated to the project (plus full-time use during the two visits by the URS Team).
PC Capability: - at least 600 MHz Processor speed
- at least 10 GB of Hard Disk capacity
- at least 128 MB RAM
- 3D Graphics Card with 16 MB of RAM
- x24 speed CD-ROM drive
- 21" 16-bit high-colour Monitor (XVGA or higher)
- a 10/100 base Network Card and 56k modem.
PC Software: OS: at least MS Windows 98 (preferably higher).
MS Access: This database program is usually bundled inside MS Office 97 (Business
Edition), Office Pro; Office 2000; etc. Please check with your IT people if unsure.
MS Word, MS Excel, MS PowerPoint.
PC Peripherals: Convenient access to following peripherals for convenient data inputs and outputs:
- B/W laser printer (>8 pages per minute);
- A3 or A4 colour printer;
- CD Burner
- Flatbed scanner and digitising board
- Semi-auto or auto-archiving system, such as external Zip-Drive, Tape Drive or
LAN servers. This is essential for protecting databases from accidental erasures,
hard drive crashes, system failures, office fire, burglary, etc.
(2)
Identify Your BWRA Project Team (10 people recommended):
Required Pilot Country Counterparts
PCU Consultants
BWRA project team leader
Consultants team leader
PC system and GIS operator (x2)
GIS and database specialist
MS Access database operator (x2)
BWRF and shipping record manager (x2)
Shipping record & port data specialist
Port environmental data searcher (x2)
Environmental similarity analyst (x2)
BWRA specialist
Risk species networker / biologist
NB: when selecting team members, please note training will be conducted in English.
1
Ballast Water Risk Assessment, Port of Dalian, People's Republic of China, November 2003: Final Report
(3)
Check all existing Port GIS, Coastal Resource Atlas, Electronic Charts/Digital
Databases [refer to Briefing Paper - GTPF Agenda Item 4 [BWRA Action Required], and the
consultants questionnaire provided at Goa (please complete and return a copy)
(4)
Confirm Dates and Local Arrangements for first consultants visit.
Provisional Dates for 1st Visit (5 working days)
Monday 25 February- Friday 1 March 2002
Odessa, Ukraine
Saturday 2 March- Thursday 7 March 2002
Tehran/Khark Is, I.R. Iran
Monday 11 March- Friday 15 March 2002
Mumbai/Goa, India
Monday 25 March - Friday 29 March 2002
Saldahna, South Africa
Monday 1 April- Friday 5 April 2002
Sepetiba, Brazil
Tuesday 9 April- Saturday 14 April 2002
Dalian, China
Logistics:
Assistance required for visa applications?
Customs clearance required for importation of computer software?
Local transport / work location / office facilities / accommodation
1st Visit Activities:
·
Install and test the ArcView 3.2 GIS package, and the Primer 5 statistical package;
·
Commence GIS training by digitising the port map (from any existing digital files, paper charts,
maps, habitat information, articles, publications, aerial photos, etc);
·
Review all data collated by Country Project Team, including existing databases. Set up the Access
database for ship arrival records and the IMO BWRF. Commence training on the Graphic User
Interfaces for BWRF inputs
·
Collate and review pre-IMO BWRF shipping records to determine source and destination ports,
vessel types and trading patterns.
·
Review available port environmental data and potential sources of same (see Attachment)
·
Commence assembling the risk species list (locate and commence networking with marine
biologists in your country and region).
·
Identify the critical information gaps.
·
Identify the data collating and input work to be completed before the 2nd Visit.
·
Agree on a provisional date for start of 2nd Visit (10 working days).
2nd Visits (10 work days). Complete port map digitising; install bioregional map; complete and add
risk species to database; perform environmental similarity analysis; undertake risk assessment;
evaluate results; review and reporting.
Environmental Data Requirements - see next page, attached.
2
Appendix 3: Check-list of project requirements circulated at initial briefings in January 2001 (during 3rd GPTF meeting, Goa)
ATTACHMENT
TYPES OF ENVIRONMENTAL DATA FOR PORT SIMILARITY ANALYSIS
The project requires two types of port environmental data:
(A) Charts and marine habitat and resources data are required for the GIS Port Map, and
(B) A range of parameters (measured in or near port) for the Environmental Similarity Analysis.
In the case of the quantitative parameters, these include:
·
Mean water temperature during the summer [monsoon] season (oC)
·
Maximum water temperature at the hottest time of the summer [monsoon] season (oC)
·
Mean water temperature during the winter [dry] season (oC)
·
Minimum water temperature at the coldest time of the winter [dry] season (oC)
·
Mean day-time air temperature recorded in summer [monsoon] season (oC)
·
Maximum day-time air temperature recorded in summer [monsoon] season (oC)
·
Mean night-time air temperature recorded in winter [dry] season (oC)
·
Minimum night-time air temperature recorded in winter [dry] season (oC)
·
Mean water salinity during the wettest period of the year (grams/litre; ppt)
·
Lowest water salinity at the wettest time of the year (grams/litre; ppt)
·
Mean water salinity during the driest period of the year (grams/litre; ppt).
·
Highest water salinity at the driest time of the year (grams/litre; ppt).
·
Mean Spring Tidal range (metres)
·
Mean Neap Tide range (metres)
·
Total rainfall in the port's driest 6 months season (millimetres)
·
Total rainfall in the port's wettest 6 months season (millimetres)
·
Number of months accounting for 75% of total annual rainfall (=duration of peak discharges)
·
Number of kilometres from the berths to the nearest river mouth (negative value if upstream)
·
Size of this river's catchment (square kilometres)
[Categorical variables are also required, but these are easy to obtain from charts, maps, articles,
etc]
3
.
APPENDIX 4
Information sources used for collating
Port Environmental Data
Appendix 4: Information sources used for collating Port Environmental Data
Continued over...
1
Ballast Water Risk Assessment, Port of Dalian, People's Republic of China, November 2003: Final Report
2
APPENDIX 5
Sources and references of
Risk Species information
Appendix 5: Sources and references of Risk Species information
1
Furlani, D (1996). Guide to Introduced Species, CSIRO Marine Research, Hobart, Tasmania (folder-file
format).
2
McClary DJ & Nelligan RJ, 2001. Alternate Biosecurity Maangement Tools for Vector Threats: Technical
guidelines for Acceptable Hull Cleaning Facilities. Research Report No. ZBS 2000/03, prepared by Kingett
Mitchell & Associates for New Zealand Ministry of Fisheries, September 2001. 29 pp.
2a M. Shaffelke, cited in McClary DJ & Nelligan RJ (2001). [see reference 2]
3
Cohen AN & Carlton JT (1995). Biological study: Non-indigenous aquatic species in a united States
estuary: a case study of the biological invasions of the San Francisco Bay and Delta. US Fisheries &
Wildlife National Sea Grant College Program Report PB96-168525. Springfield Virginia, USA.
http://nas.er.usgs.gov/publications/sfinvade.htm
4
Pollard DA & PA Hutchings (1990a,b). A review of exotic marine organisms introduced to the Australian
region. I. Fishes (a); and II. Invertebrates and Algae (b). Asian Fisheries Science 3: 205-222 (a) and 223-
250 (b).
4a Wallaston 1968 and Wommersley 1981, cited in Pollard D & Hutchings PA (1990). [see reference 4]
4b Skinner & Womersley 1983, cited in Pollard D & Hutchings PA (1990). [see reference 4]
4c Allen (1953) - cited in Pollard D & Hutchings PA (1990). [see reference 4]
5
Australian NIS lists compiled by CSIRO-CRIMP (1997); CCIMPE (2001); SSC/SCFA (2000)[see reference
23]
6
Hutchings PM, Van Der Velde J & S Keable (1989). Baseline survey of the benthic macrofauna of Twofold
Bay, NSW, with a discussion of the marine species introduced into the bay. Proceedings of the Linnaean
Society of New South Wales 110 (4): 339-367.
6a Baker, cited by Hutchings et al (1989). [see reference 6]
7
Australian Coral Reef Society (1993). A Coral Reef Handbook (3rd Edition). Surrey Beatty & Sons Pty Ltd,
Chipping Norton NSW, 264 pp.
8
Coles SL, DeFelice RC, Eldredge LG and JT Carlton (1997) Biodiversity of marine communities in Pearl
Harbor, Oahu, Hawaii with observations on introduced exotic species. Bernice Pauahi Bishop Museum
Technical Report No. 10: 1-76
9
Dakin WJ (1976). Australian Seashores (Australian Natural Science Library Edition). Angus & Robertson,
Sydney, 372 pp.
10 Carlton JT (1985). Transoceanic and Interoceanic Dispersal of Coastal Marine Organisms: The Biology of
Ballast Water. Oceanogr. Mar. Biol. Ann. Rev. 23: 313-371.
11 Boyd S, Poore GCB & RS Wilson (1996). Macrobenthic invertebrates of soft sediments in Port Phillip Bay:
Introduced Species. Unpubl. report to CSIRO-CRIMP by Museum of Victoria, Melbourne, 7-96. 122 pp.
12 Gosliner TM, Behrens DW & Williams GC (1996). Coral Reef Animals of the Indo-Pacific - Animal life from
Africa to Hawaii exclusive of vertebrates. Sea Challengers, Monterey CA, 314 pp.
13 Wells FE & C Bryce (1988). Seashells of Western Australia (Revised Edition). Western Australian
Museum, Perth. 207 pp.
14 Tan LWH & PKL Ng (1988). A guide to the seashore of Singapore. Singapore Science Centre, Singapore,
159 pp.
15 Wells FE & RN Kilburn, 1986. Three temperate-water species of South African gastropods recorded for the
first time in southwestern Australia. Veliger 28(4): 453-456.
16 Gosliner TM (1987). Guide to the nudibranchs (opisthobranch molluscs) of Southern Africa. Sea
Challengers and Jeff Hamann. Monterey.
17 Wasson & Shepherd (1995): cited in Cohen & Carlton (1995) [see reference 3].
18 Middleton MJ (1982). The oriental goby, Acanthogobius flavimanus (Temminck and Schlegel), an
introducedfish in the coastal waters of New South Wales, Australia. J. Fish Biology 21: 513-523.
19 In: Leppäkoski E, Gollasch S. & S Olenin (eds) (2002). Invasive aquatic apecies of Europe: Distribution,
impacts and management. Kluwer Academic Publishers, Dordrecht. 583 pp.
20 Morton, B (1981). Biology and functional morphology of Mytilopsis sallei (Recluz) (Bivalvia: Dreissenacea)
fouling Visakhapatnam Harbour, Andra Pradesh, India. Journal of Molluscan Studies 47: 25-42.
21 Gollasch, S (2002). Importance of ship hull fouling as a vector of species introductions into the North Sea.
Biofouling 18: 105-121.
22 Hass CG & DS Jones (1999). Marine introductions to western Australia, with a focus on crustaceans. In:
Kesby JA, Stanley JM, McLen RF & Olive LJ (eds). Geodiversity: Readings in Australian Geography at the
close of the 20th Century. Special Publication Series No. 6, School of Geography & Oceanography,
University College, Australian Defence Force Academy, Canberra ACT. pp. 37-44.
23 Environment Australia (2000). Joint SCC-SCFA Report of the National Taskforce on the Prevention and
Management of Marine Pest Incursions (October 2000 edition). Environment Australia, Canberra,
Australia.
24 Domingues Rodrigues M & AI Brossi Garcia (1989). New records of Pachygrapsus gracilis (Saussure,
1858) in the Brazilian Littoral. Ciene Cult San Paulo 41: 63-66.
1
Ballast Water Risk Assessment, Port of Dalian, People's Republic of China, November 2003: Final Report
25 Dadon JR (1984). Distribution and abundance of Pteropoda: Thecostomata (Gastropoda) in the
Southwestern Atlantic. Physis (Buenos Aires) 42: 25-38.
26 Christeffersen ML (1980). Is Alpheus heterochaelis Say (Crustacea, Decapoda, Alpheidae) found along the
Brazilian coasts? Review Nordestina Biology 3: 236-237.
27 Galil B & C Golani (1990). Two new migrant decapods from the Eastern Mediterranean. Crusteceana 58:
229-236.
28 Hanna GD (1966). Introduced molluscs of western North America. Occasional Papers of Californian
Academy of Science 48: 1-108.
29 Yoloye V (1976). The ecology of the West African Bloody cockle, Anadara (Senilia) senilis (L.). Bulletin of
the Institute Portdam Africique Noire (Series A) 38: 25-56.
30 Jones DS (1992). A review of Australian fouling barnacles. Asian Marine Biology 9: 89-100.
31 Wang JJ & ZG Huang (1993). Fouling polychaetes of Hong Kong and adjacent waters. Asian Marine
Biology 10: 1-12.
32 Arakawa KY (1980). On alien immigration of marine sessile invertebrates into Japanese waters. Marine
Fouling 2: 29-33.
33 Carlton J (1999). Molluscan invasions in marine and estuarine communities. Malacologia 41(2): 439-454.
34 Griffiths CL, Hockey PAR, Van Erkom Shurink C & PJ Le Roux (1992). Marine invasive aliens on South
Africa's shores: implications for community structure and trophic functioning. South African Journal of
Marine Science 12: 713-722.
35 Wang C (1995). Some introduced molluscas [sic] in China. Sinozoologia 12: 181-191 (in Chinese).
36 Cranfield HJ, et al (1998). Adventive marine species in New Zealand. National Institute of Water and Air
Research (NIWA) Technical Report 34, Auckland, New Zealand, 48 pp.
37 Dineen J, 2001. Exotic species reports for Indian River Lagoon, Florida. Smithsonian Fort Pierce website:
http://www.serc.si.edu
38 J Mackie, 2001. Bryozoans at Port of Geraldton, with notes on taxonomy and distribution. In: Geraldton
Port Survey. Unpublished report to Geraldton Port Authority by the Western Australian Museum, Perth,
August 2001.
39 Wonham MJ, Carlton JT, Ruiz GM & LD Smith (2000). Fish and ships: relating dispersal frequency to
success in biological invasions. Marine Biology 136: 1111-1121.
40 NIS data for Angola; supplied by Adnan Adawad (GloBallast Programme, Cape Town, South Africa:
adawad@mcm.wcape.gov.za).
41 Dr Tamara Robertson, University of Cape Town (pers. comm.; August 2002).
42 Gollasch, S. & Griffiths, C (2000). Case studies of introduced species in South African waters prepared for
the GloBallast Programme. Report prepared for Globallast Programme; available from Adnan Adawad
(GloBallast Programme, Cape Town, South Africa: adawad@mcm.wcape.gov.za).
43 Draft provisional species list (9/02) from the Saldanha Bay Port Baseline Biological Survey (supplied by
Adan Adawad (GloBallast Programme, Cape Town, South Africa): adawad@mcm.wcape.gov.za)
44 NIS data for Tanzania; supplied by Adnan Adawad (GloBallast Programme, Cape Town, South Africa:
adawad@mcm.wcape.gov.za).
45 NIS data for Mauritius; supplied by Adnan Adawad (GloBallast Programme, Cape Town, South Africa:
adawad@mcm.wcape.gov.za).
46 NIS data for Mozambique; supplied by Adnan Adawad (GloBallast Programme, Cape Town, South Africa:
adawad@mcm.wcape.gov.za).
47 GloBallast Programme (2002). List of Alien Species. http://www.globallast.org
48 Williamson AT, Bax NJ, Gonzalez E & W Geeves (2002). Development of a regional risk management
framework for APEC economies for use in the control and prevention of introduced marine pests. Final
report of APEC Marine Resource Conservation Working Group, produced by Environment Australia,
Canberra. 182 pp.
49 Walters S, 1996. Ballast water, hull fouling and exotic marine organism introductions via ships - a Victorian
study. Environment Protection Authority of Victoria, Publication 494 (May 1996).
50 Pitcher, G (1998). Harmful algal blooms of the Benguela current. Colour publication available from Sea
Fisheries Research Institute (Private Bag X2, Rogge Bay 8012), Cape Town, Republic of South Africa (20
pp).
51 Benson AJ, Williams JD, Marelli DC, Frischer ME & Danforth JM, 2002. Establishment of the green
mussel, Perna viridis, on the West Coast of Florida. In: Proceedings of 11th International Conference of
Aquatic Invasive species (Feb 25 to March 1, 2002, Washington DC). nvironment Department, US Army
Engineer & Research Development Laboratory, US.
52 Platvoet D, Dick JTA & DW Kelly (2002). Comparative morphometrics of mouthparts and antennae in the
invasive Dikerogammeros villosus and the native Gammarus duebeni (Crustacea, Amphipoda). In:
Proceedings of 11th International Conference of Aquatic Invasive species (Feb 25 to March 1, 2002,
Washington DC). Environment Department, US Army Engineer & Research Development Laboratory, US.
2
Appendix 5: Sources and references of Risk Species information
53 Strong JA (2002). Faunal and habitat comparisons from under and outside canopies of Sargassum
muticum. In: Proceedings of 11th International Conference of Aquatic Invasive species (Feb 25 to March 1,
2002, Washington DC). Hosted by Environment Department, US Army Engineer & Research Development
Laboratory.
54 Verween A (2002). Economic impact of biofouling control of an exotic bivalve, Mytilopsis leucophaeta, in
the harbour of Antwerp, Belgium. In: Proceedings of 11th International Conference of Aquatic Invasive
species (Feb 25 to March 1, 2002, Washington DC). Environment Department, US Army Engineer &
Research Development Laboratory, US.
55 Perry HM, Lukens R, et al, 2002. Invasive species and implications for fisheries sustainability in the Gulf of
Mexico. In: Proceedings of 11th International Conference of Aquatic Invasive species (Feb 25 to March 1,
2002, Washington DC). Environment Department, US Army Engineer & Research Development
Laboratory, US.
56 Makarewicz, JC (2002). Distribution, fecundity, genetics and invasion routes of Cercopafis pengoi
(Ostroumov) - a new exotic zooplankter in the Great Lakes Basin. In: Proceedings of 11th International
Conference of Aquatic Invasive species (Feb 25 to March 1, 2002, Washington DC). Hosted by
Environment Department, US Army Engineer & Research Development Laboratory.
57 Bauer CR & Lamberti GA (2002). Potential interactions between Eurasian Ruffe and Round Gobies in the
Great Lakes: Prey and habitat differences. In: Proceedings of 11th International Conference of Aquatic
Invasive species (Feb 25 to March 1, 2002, Washington DC). Environment Department, US Army Engineer
& Research Development Laboratory. US.
58 Darrigran G et al (2002). Abundance and distribution of golden mussel (Limnoperna fortunei) larvae in a
hydroelectric plant in South America. In: Proceedings of 11th International Conference of Aquatic Invasive
species (Feb 25 to March 1, 2002, Washington DC). Environment Department, US Army Engineer &
Research Development Laboratory, US.
59 Personal communications and manuscripts supplied by Dr Andrea Junqueira, Dr Flavio Fernandes, Dr
Luciano Felicio Fernandes , Dr Luis Proenca during BWRA workshop at FEEMA, Rio de Janeiro (30
August 2002).
60 Fernandes, LF et al (2001). The recently established diatom Coscinodiscus wailesii in Brazilian waters:
taxonomy and distribution. Phycological Research 2001.
61 Paula, A,F (2002). Spatial abundance and distribution of invading coral Tubastraea in Ilha Grande Bay
(RJ) and record of T. tagusensis and T. coccinea in Brazil. M.Sc thesis, State University of Rio de Janeiro,
May 2002.
62 Translated material provided by Assoc Prof. (Biol.) Wang Lijun and Mr Jiang Yuewen (National Marine
Environment Protection & Monitoring Centre, State Administration of Oceanography (Dalian Office), China
(including preliminary lists of identified species sampled by Port Baseline Biological Survey for Dalian
(GloBallast Programme); September 2002).
63 Anil AC, Venkat K, Sawant SS, Dileepkumar M, Dhargalkar VK, Ramaiah N, Harkantra SN & ZA Ansari
(2002). Marine bioinvasions: Concern for ecology and shipping. Current Science 83(3): 214-218.
64 K Satyanarya Rao (2002). Proceedings of 1st R&D Seminar, Global Ballast Water Management
Programme. National Institute of Oceanography, Goa, India. June 2002.
65 National Institute of Oceanography (2001). Report released to mass-media (from Dr AC Anil, NIO, Goa).
66 Xu, CY (1982). Surveys on the causal organisms of red tides in Dalian Bay. Journal of Fisheries, China
6(2): 173-180 (in Chinese).
67 Iizuka S (1976). Succession of red tide organisms in Omura Bay with relation to water pollution. Bulletin of
the Plankton Society of Japan 23(1): 31-43 (in Japanese).
68 Kuriakose PS (1980). Mussels (Genus Perna) of the Indian coast. In: Coastal aquaculture of mussels -
Progress and Prospects. Central Marine Research Fisheries Institute (Cochin, India).
69 Thompson MF (1994). Recent developments in biofouling control. Oxford & IBH Publishing Co, Pty Ltd,
UK.
70 National Institute of Oceanography: Bryozoan Identifications (volume provided by Dr AC Anil, NIO, Goa,
India)
71 Zaitsev Y & B Ozturk (2001). Exotic Species in the Aegean, Marmara, Black, Azov and Caspian Seas.
Publication No.8, Turkish Marine Foundation, Istanbul. Turk Deniz Arastirmalari Vakfi. Istanbul.
72 CIESM Atlas of Introduced Species in Mediterranean Sea (2002). http://www.ciesm.org/atlas
73 McMinn, A (1990). Recent dinoflagellate cyst distribution in eastern Australia. Review of Paleobotany and
Palynology 65: 305-310.
74 Karunasagar I, Gowda HSV, Subburaj M, Venugopal MN & I Karunasagar (1984). Outbreak of paralytic
shellfish poisoning in Mangalore, west coast of India. Current Science 53(5): 247-249.
75 Yoon YH et al (1991). Red tide organisms in the coastal waters of Cheju Island, southern Korea. Bulletin of
Marine Research Institute, Cheju National University 15: 1-14.
76 Pillai CSG & Jasmine S (1991). Life cycle of Perna indica. In: Symposium on tropical marine living
resources, Cochin, Kerala (india), 12-16 January 1988. J. Mar Biol. Association India 33(1-2): 159-165.
3
Ballast Water Risk Assessment, Port of Dalian, People's Republic of China, November 2003: Final Report
77 Coles SL, DeFelice RC & LG Eldredge (1999). Nonindigenous marine species introductions in the harbors
of the south and west shores of Oahu, Hawaii. Bishop Museum Technical Report No. 15 (Bernice Pauahi
Bishop Museum, Honolulu, Hawaii).
78 Coles SL, DeFelice RC, Eldredge LG & JT Carlton (1999). Historical and recent introductions of non-
indigenous marine species into Pearl Harbor, Oahu, Hawaiian Islands. Marine Biology 135:147-158.
79 Coles SL, DeFelice RC & D Minton (2001). Marine species survey of Johnston Atoll, Central Pacific
Ocean, June 2000. Bishop Museum Technical Report No. 19 (Bernice Pauahi Bishop Museum, Honolulu,
Hawaii).
80 DeFelice RC, Coles SL, Muir D & LG Eldredge (1998). Investigation of marine communities at Midway
Harbor and adjacent lagoon, Midway Atoll, north western Hawaiian Islands. Bishop Museum Hawaiian
Biological Survey Contribution No. 1998-014 (Bernice Pauahi Bishop Museum, Honolulu, Hawaii).
81 Hewitt C (2002). Distribution and biodiversity of Australian tropical marine bioinvasions. Pacific Science
56(2): 213-222.
82 Coles SL & LG Eldredge (2002). Nonindigenous species introductions on coral reefs: a need for more
information. Pacific Science 56(2): 191-209.
83 Hoedt FE, Choat JH, Collins J & JJ Cruz (2000). Mourilyan Harbour and Abbot Point surveys: Port
baseline surveys for introduced marine pests. Unpubl. report to Ports Corporation of Queensland
(Brisbane). School of Marine Biology & Aquaculture, James Cook University, Townsville
84 Choo PS, 1994. A Review on Red Tide Occurrences in Malaysia. Department of Fisheries, Ministry of
Agriculture, Kuala Lumpur, Malaysia.
85 Southward AJ, Burton RS, Coles SL, Dando PR, DeFelice R, Hoover J, Newman WA, Parnel E,
Yamaguchi (1998). Invasion of Hawaiian inner shores by an Atlantic barnacle. Marine Ecology Progress
Series 165:119-126.
86 Nichols FH, Thompson JK & LE Schemel (1990). Remarkable invasion of San Francisco Bay (California,
USA) by the Asian clam Potamocorbula amurensis. II. Displacement of a former community. Marine
Ecology Progress Series 66: 95-101.
87 Pyne R (1999). The black-striped mussel (Mytilopsis sallei) infestation in Darwin: clean-up strategy. In:
EcoPorts Monograph Series No.19 (77-83). Ports Corporation of Queensland, Brisbane.
88 Culver, CS (2000). Apparent eradication of a locally established introduced marine pest. Biological
Invasions 2 (3): 245-253.
89 Fofonoff PW, Ruiz GM, Hines AH & L McCann (1999). Overview of biological invasions in the Chesapeake
Bay region: summary of impacts on coonservation of biological diversity: a key to the restoration of the
Chesapeake Bay and beyond. Monograph. Maryland Department of Natural Resources, pp.168-180.
90 Veldhuizen TC & S Stanish (1999). Overview of the Life History, Distribution, Abundance, and Impacts of
the Chinese mitten crab, Eriocheir sinensis. Environmental Studies Office, California Department of Water
Resources, Sacramento, CA 95816. March 1999.
91 NTMAG & CSIRO, 2000. Port survey of introduced marine species., Port of Darwin. Unpublished report
provided by Dr Barry Russel, Museum & Art Gallery of the Northern Territory, Darwin, Northern Territory,
Australia.
92 Faunce CH and Lorenz JJ (2000) Reproductive biology of the introduced Mayan cichlid, Cichlasoma
urophthalmus, within an estuarine mangrove habitat of southern Florida. Environmental Biology of Fishes
58: 215225.
93 Zhang F & M Dickman (1999). Mid-ocean exchange of container vessel ballast water. 1: Seasonal factors
affecting the transport of harmful diatoms and dinoflagellates. Marine Ecology Progress Series 176:243-
251.
94 Harris LG & MC Tyrell (2001). Changing Community States in the Gulf of Maine: Synergism Between
Invaders, Overfishing and Climate Change. Biological Invasions 3 (1): 9-21.
95 Crooks JA & CA Jolla (2001). Assessing invader roles within changing ecosystems: historical and
experimental perspectives on an exotic mussel in an urbanized lagoon. Biological Invasions 3 (1): 23-36.
96 In: Raaymakers S (Ed.) (2002). Baltic regional workshop on ballast water management, Tallinn, Estonia.,
22-24 October 2001: Workshop report. GloBallast Monograph Series No.2. IMO, London.
97 Gosling EM (1992). Systematics and geographic distribution of Mytilus. In: Gosling EM (Ed.) The Mussel
Mytilus: Ecology, Physiology, Genetics and Culture. Elsevier Press, Netherlands.
98 In: Raaymakers S & C Gregory (Eds) (2002). 1st East Asia regional workshop on ballast water control and
management, Beijing, China. 31 Oct 2 Nov 2002: Workshop report. GloBallast Monograph Series No.6.
IMO, London.
99 Eno NC, Clark RA & Sanderson WG (Eds). Directory of non-native marine species in British waters.
http://www.jncc.gov.uk/marine/dns/default.htm
100 Oderbrecht et al (2002).
101 Ports & Shipping Organisation (2002). Species tables. In: Draft report of seasonal Port Baseline Biological
Surveys for Port of Khark Island. Unpublished manuscript provided by PSO, Tehran, I.R. Iran.
4
Appendix 5: Sources and references of Risk Species information
102 Introduction to non-indigenous species of the Gulf of Mexico (2002). Website:
http://www.gsmfc.org/nis/nis/Perna_perna.html
103 Erkki Leppäkoski E & S Olenin (2000). Non-native species and rates of spread: Lessons from the brackish
Baltic Sea. Biological Invasions 2 (2):151-163.
104 Ambrogi AO (2000). Biotic invasions in a Mediterranean lagoon. Biological Invasions 2 (2): 165-176
105 Galil BS (2000). A sea under siege alien species in the Mediterranean. Biological Invasions 2 (2):177-
186
106 Mann, R (2000). Invasion of the North American atlantic coast by a large predatory Asian mollusc
Biological Invasions 2(1): 7-22
107 Lohrer AM, Whitlatch RB, Wada K & Y Fukui (2000). Home and away: comparisons of resource utilization
by a marine species in native and invaded habitats. Biological Invasions 2 (1):41-57
108 Wasson, K & B Von Holle (2000). Detecting invasions of marine organisms: Kamptozoan case histories.
Biological Invasions 2(1): 59-74.
109 Rivest BR, Coyer J, Haren AA & S Tyler (1999). The first known invasion of a free-living marine flatworm.
Biological Invasions 1(4): 393-394
110 E x o t i c s p e c i e s l i s t o f t h e M o n t e r e y B a y N a t i o n a l M a r i n e S a n c t u a r y .
http://bonita.mbnms.nos.noaa.gov/sitechar/spex.html
111 F A O d a t a b a s e o n a q u a t i c s p e c i e s i n t r o d u c t i o n s :
http://www.fao.org/waicent/faoinfo/fishery/statist/fisoft/dias/index.htm
112 Global Invasive Species Program (GISP): http://jasper.stanford.edu/GISP/ and GISP Database:
http://www.issg.org/database/welcome/
113 Group on Aquatic Alien Species (GAAS) (Russia): http://www.zin.ru/projects/invasions/index.html
114 Gulf of Maine Ballast Water and Exotic Species Web Sites: http://www.gulfofmaine.org/library/exotic.htm
115 Gulf of Mexico Program Nonindigenous Species Information: http://pelican.gmpo.gov/nonindig.html
116 Smithsonian Environmental Research Center (SERC marine invasions lab): http://invasions.si.edu/
117 Ecological Society of Japan (Ed.) (2002). Handbook of alien species in Japan. (published 9/02).
Chijinchokan Ltd, Tokyo (in Japanese). 390pp. http://www.chijinshokan.co.jp
118 Fine M, Zibrowius H & Y Loya (2001). Oculina patagonica: a non-lessepsian scleractinian coral invading
the Mediterranean Sea. Springer-Verlag (New York):
http://linl.springer-ny.com/link/service/journals/00227/contents/01/00539/
119 Schaffelke B, Murphy N & S Uthicke (2002). Using genetic techniques to investigate the sources of the
invasive alga Caulerpa taxifolia in three new locations in Australia. Mar Poll Bull 44: 204-210.
120 Washington State Sea Grant Program: Non-indigenous aquatic species:
http://www.wsg.washington.edu/outreach/mas/nis/nis.html
121 Baltic Research Network on invasions and introductions (NEMO). Website:
http://www.ku.lt/nemo/mainnemo.htm
122 US Geological Service non-indigenous aquatic species (NIAS) website:
http://nas.er.usgs.gov/
123 National aquatic nuisance species clearing house - Seagrant Program:
http://www.entryway.com/seagrant/
124 Esmaili Sari A, Khodabandeh S, Abtahi B, Sifabadi J & H Arshad (2001). Invasive comb jelly Mnemiopsis
leidyi and the future of the Caspian Sea. Faculty of Natural Resources and Marine Sciences, University of
Tarbiat Modarres. Kor, Mazandaran, IR Iran. ISBN: 964-91086-2-9. (+95 pp; non-English). Obtainable
from: yavarivahid@hotmail.com ; yavari@ir-pso.com .
125 Cohen BF, Heislers S, Parry GD, Asplin MD, Werner GF & JE Restall (2002). Exotic marine pests in the
outer harbour of the Port of Adelaide. Marine and Freshwater Resources Institute of Victoria (Report No.
40), MAFRE, Queenscliffe, Victoria, Australia. (9/02; 86pp.).
5
APPENDIX 6
Name, UN code, coordinates and environmental
parameters of the 357 ports used for the multivariate
similarity analyses for all Demonstration Sites
Appendix 6: Name, UN code, coordinates and environmental parameters
1
Ballast Water Risk Assessment, Port of Dalian, People's Republic of China, November 2003: Final Report
2
Appendix 6: Name, UN code, coordinates and environmental parameters
3
Ballast Water Risk Assessment, Port of Dalian, People's Republic of China, November 2003: Final Report
4
Appendix 6: Name, UN code, coordinates and environmental parameters
5
Ballast Water Risk Assessment, Port of Dalian, People's Republic of China, November 2003: Final Report
6
Appendix 6: Name, UN code, coordinates and environmental parameters
7
Ballast Water Risk Assessment, Port of Dalian, People's Republic of China, November 2003: Final Report
8
Appendix 6: Name, UN code, coordinates and environmental parameters
9
Ballast Water Risk Assessment, Port of Dalian, People's Republic of China, November 2003: Final Report
10
Appendix 6: Name, UN code, coordinates and environmental parameters
11
Ballast Water Risk Assessment, Port of Dalian, People's Republic of China, November 2003: Final Report
12
Appendix 6: Name, UN code, coordinates and environmental parameters
13
Ballast Water Risk Assessment, Port of Dalian, People's Republic of China, November 2003: Final Report
14
APPENDIX 7
Ships, trade and ballasting statistics for the
multi-use Dayaowan terminal at Dalian
Appendix 7: Ships, trade and ballasting statistics for the multi-use Dayaowan terminal at Dalian
This Appendix presents summary statistics on the visit frequencies and ballast data of the three main
ships types visiting the Dayaowan multi-purpose terminal at Dalian between August 2000 and July
2002.
Number of
BWRF
Type
records
No. of ships
Container Ship
1498*
184
Main
General Cargo Ship
441*
37
types
Bulk carrier
47*
38
Vehicles carrier/Ro-Ro
30
16
Minor
Reefer
1
1
types
Product/chemical tanker
3
3
Total
2020
279
The visit frequency plot shows that the majority of container and general cargo ships made return
visits to Dayaowan, with only 52 of 221 (23%) of these vessels making a single visit during the two
period. The majority of visits are associated with regular services (liner trade) to/from ports in Korea,
Japan and China.
The following plots show range of ballasted condition of arriving container and general cargo ships,
and relationships between Deadweight Tonnage (DWT) and Total Ballast Capacity (as % of DWT),
and Gross Tonnage (GT).
1
Ballast Water Risk Assessment, Port of Dalian, People's Republic of China, November 2003: Final Report
Container ship DWT versus Total Ballast Capacity
(average TBC = 32.3% of DWT)
80.0%
70.0%
60.0%
50.0%
40.0%
30.0%
20.0%
Total Ballast Capacity (as % of DWT)
10.0%
r2 = 0.0556 (no significant relationship with size)
0.0%
0
10,000
20,000
30,000
40,000
50,000
60,000
70,000
Container Ship deadweight tonnage (DWT)
Gross tonnage (GT) versus Deadweight tonnage (DWT) of Container Ships
80,000
y = -5E-06x2 + 1.3345x + 373.76; r2 = 0.953
70,000
60,000
50,000
40,000
GT
30,000
20,000
10,000
0
0
10,000
20,000
30,000
40,000
50,000
60,000
70,000
DWT
General Cargo Ship DWT versus Total Ballast Capacity
(average TBC = 33.3% DWT)
60.0%
50.0%
40.0%
30.0%
20.0%
Total Ballast Capacity (as % of DWT)
10.0%
r2 = 0.0538 (no significant relationship between general cargo ship DWT and Total BW capacity
0.0%
2,000
4,000
6,000
8,000
10,000
12,000
14,000
16,000
18,000
General Cargo Ship Deadweight Tonnage (DWT)
2
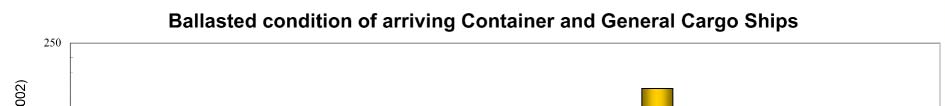
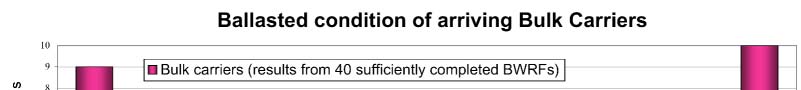
Appendix 7: Ships, trade and ballasting statistics for the multi-use Dayaowan terminal at Dalian
Gross tonnage (GT) versus Deadweight (DWT) of General Cargo Ships
18,000
y = 1.3235x + 21.443; r2 = 0.932
16,000
14,000
12,000
10,000
GT
8,000
6,000
4,000
2,000
0
0
2,000
4,000
6,000
8,000
10,000
12,000
14,000
Deadweight Tonnage (DWT)
No of container ships less than 50% ballasted = 298
(20.5%)
No. of general cargo ships less than 50% ballasted = 51
(11.7%)
No of container ships less than 60% ballasted = 515
(35.4%)
General cargo ships less than 60% ballasted = 104
(23.9%)
No of container ships over 80% ballasted = 391
(26.9%)
No. of general cargo ships over 80% ballasted = 157
(36.1%)
3
APPENDIX 8
Consultants' Terms of Reference
Appendix 8: Consultants' Terms of Reference
Consultants' Terms of Reference
Activity 3.1: Ballast Water Risk Assessments
6 Demonstration Sites
1. Introduction & Background
The International Maritime Organization (IMO), with funding provided by the Global Environment
Facility (GEF) through the United Nations Development Programme (UNDP), has initiated the Global
Ballast Water Management Programme (GloBallast).
This programme is aimed at reducing the transfer of harmful marine species in ships' ballast water, by
assisting developing countries to implement existing IMO voluntary guidelines on ballast water
management (IMO Assembly Resolution A.868(20)), and to prepare for the anticipated introduction
of an international legal instrument regulating ballast water management currently being developed by
IMO member countries.
The programme aims to achieve this by providing technical assistance, capacity building and
institutional strengthening to remove barriers to effective ballast water management arrangements in
six initial demonstration sites. These six sites are Sepetiba, Brazil; Dalian, China; Mumbai, India;
Kharg Island, Iran; Saldanha, South Africa and Odessa, Ukraine. The initial demonstration sites are
intended to be representative of the six main developing regions of the world, as defined by GEF.
These are respectively, South America, East Asia, South Asia, Middle East, Africa and Eastern
Europe. As the programme proceeds it is intended to replicate these initial demonstration sites
throughout each region.
2. The Need for the Risk Assessments
The development objectives of the programme are to assist countries to implement the existing IMO
voluntary ballast water management guidelines and to prepare for the introduction of a new
international legal instrument on ballast water.
The current IMO ballast water management guidelines offer states significant flexibility in
determining the nature and extent of their national ballast water management regimes. This flexibility
is warranted given that nations are still experimenting with approaches. A port state may wish to
apply its regime uniformly to all vessels which visit, or it may wish to attempt to assess the relative
risk of vessels to valuable resources and apply the regime selectively to those which are deemed of
highest risk.
The uniform application option offers the advantages of simplified programme administration in that
there are no "judgement calls" to be made or justified by the port state regarding which vessels must
1
Ballast Water Risk Assessment, Port of Dalian, People's Republic of China, November 2003: Final Report
participate and which need not. In addition, the system requires substantially less information
management demands. Finally, it offers more protection from unanticipated invaders, and overall
protection is not dependent upon the quality of a decision support system which may not be complete.
The primary disadvantages of this approach are: 1) additional overall cost to vessels which otherwise
might not need to take action, and 2) more vessels will be involved in undertaking the measures, and
therefore the port state will need to monitor compliance from a greater number of vessels.
Some nations are experimenting with systems to allow more selective applicability based upon
voyage-specific risk assessments because this approach offers to reduce the numbers of vessels
subject to ballast water controls and monitoring. The prospect of reducing the numbers of ships to
which the program applies is especially attractive to nations that wish to eliminate introductions of
target organisms such as toxic dinoflagellates. More rigorous measures can be justified on ships
deemed to be of `high risk' if fewer restrictions are placed on low risk vessels. However, this
approach places commensurate information technology and management burdens on port state and its
effectiveness depends on the quality of the information supporting it. The approach may also leave the
country/port vulnerable to unknown risks from non-target organisms.
For countries/ports which choose the selective approach, it will be essential to establish an organized
means of evaluating the potential risk posed by each vessel entering their port, through a Decision
Support System (DSS). Only in this way can they take the most appropriate decision regarding any
required action concerning that vessels' ballast water discharge. The DSS is a management system
that provides a mechanism for assessing all available information relating to individual vessels and
their individual management of ballast water so that, based upon assessed risk, the appropriate course
of action can be taken.
Before a pilot country decides on whether to adopt the `blanket' (i.e. all vessels) approach or to target
specific, identified high risk vessels only, a general, first-past risk assessment needs to be carried out.
This should look at shipping arrival patterns and identify the source ports from which ballast water is
imported. Once these are identified, source port/discharge port environmental comparisons should be
carried out to give a preliminary indication of overall risk. This will greatly assist the port state to
assess which approach to take.
The GloBallast programme, under Activity 3.1; will support these initial , `first-past' risk assessments
as a consultancy on contract to the PCU. This is important for establishing the level and types of risks
of introductions that each port faces, as well as the most sensitive resources and values that might be
threatened. These will differ from site to site, and will determine the types of management responses
that are required.
The PCU risk assessment consultants, in conducting the risk assessment in each pilot country, will
work with and train country counterpart(s) and include them in the study process as part of the
capacity building objectives of the programme, so as to allow each country to undertake its own risk
assessments in future.
3. Scope of the Risk Assessments
A Risk Assessment will be undertaken for each of the ports of:
· Sepetiba, Brazil;
· Dalian, China;
· Mumbai, India;
· Kharg Island, Iran;
· Saldanha, South Africa and
· Odessa, Ukraine.
2
Appendix 8: Consultants' Terms of Reference
The Risk Assessments will apply to all ship movements into and out of these ports based on shipping
data for the last 10 years (or longer if available).
4. Services Required & Tasks to be Undertaken
The GloBallast PCU requires a suitably qualified and experienced consultancy team to undertake the
ballast water risk assessments. The consultancy team will undertake the following Tasks, for each
demonstration site:
Task 1: Resource Mapping
Identify, describe and map on Geographic Information System (GIS) all coastal and marine resources
(biological, social/cultural and commercial) in and around the demonstration site that might be
impacted by introduced marine species.
Task 2: De-ballasting/Ballasting Patterns
Characterise, describe and map (on GIS) de-ballasting and ballasting patterns in and around the ports
including locations, times, frequencies and volumes of ballast water discharges and uptakes.
Task 3: Identify Source Ports
Identify all ports/locations from which ballast water is imported (source ports).
Task 4: Identify Destination Ports
Identify all ports/locations to which ballast water is exported (destination ports).
Task 5: Database - IMO Ballast Water Reporting Form
Establish a database at the nominated in-country agency for the efficient ongoing collection,
management and analysis of the data collected at the demonstration site according to the standard
IMO Ballast Water Reporting Form, and the data referred to under Tasks 2, 3 and 4.
Task 6: Environmental Parameters
Characterise as far as possible from existing data, the physical, chemical and biological environments
for both the demonstration site and each of its source and destination ports.
Task 7: Environmental Similarity Analysis
Using the data from Task 6 and an appropriate multivariate environmental similarity analysis
programme, develop environmental similarity matrices and indices to compare each demonstration
site with each of its source ports and destination ports, as the basis for the risk assessment.
Task 8: High Risk Species
Identify as far as possible from existing data, any high risk species present at the source ports that
might pose a threat of introduction to the demonstration site, and any high risk species present at the
demonstration site that might be exported to a destination port.
3
Ballast Water Risk Assessment, Port of Dalian, People's Republic of China, November 2003: Final Report
Task 9: Risk Assessment
For each demonstration site, assess and describe as far as possible, the risk profile for invasive marine
species being both introduced from its set of source ports and exported to its set of destination ports,
and identify the highest risk source and destination ports, using the outputs of Tasks 1 to 8 and based
on the environmental similarity indices developed under Task 7.
Task 10: Training & Capacity Building
While undertaking the risk assessment, provide training and capacity building to the in-country risk
assessment team (up to 10 people) in the risk assessment methodology, including use of database
established under Task 5 and the multivariate environmental similarity analysis programme
established under Task 7.
Task 11: Information Gaps
Identify any information gaps that limit the ability to undertake these Tasks and recommend
management actions to address these gaps.
5. Methods to be Used
The consultants should clearly outline in their Tender how each Task will be achieved. These should
comply with but are not necessarily restricted to the following:
Site Visits:
The consultants will undertake an initial one week (5 working days) visit to each demonstration site to
hold discussions with the CFP, CFP-A, port authority, maritime administration, environment
administration, fisheries/marine resources administration, marine science community and shipping
industry, to identify and obtain information and data for the various Tasks, establish a working
relationship with the in-country risk assessment team, conduct a site familiarisation to the
demonstration site (port) and to identify information gaps.
The consultants will undertake second 8 to 10 working day visit to each demonstration to install the
GIS, database and multivariate environmental similarity analysis programme and to provide training
and capacity building in their use and the overall risk assessment methodology to the in-country risk
assessment team.
Coordination:
The consultants will maintain close consultation and cooperation with the PCU Technical Adviser
(TA), who will manage this consultancy, and with the Country Focal Point (CFP) and CFP Assistant
(CFP-A) in each pilot country, who provide the primary contact point for all in-country activities and
for accessing in-country information and data.
Tasks 1& 2:
This will be restricted existing data only, field surveys are not provided for in the budget. The CFP
and/or CFP-A will compile as much existing information as possible in relation to Tasks 1 and 2 to
provide to the consultants.
The consultants should identify and evaluate any existing in-country databases and GIS for use in
these Tasks. The GIS should be tailored to suit the country's circumstances while ensuring user-
friendliness and consistency across all sites.
4
Appendix 8: Consultants' Terms of Reference
Tasks 3 & 4:
This will be restricted to existing data only. The CFP and/or CFP-A will compile as much existing
information as possible in relation to Tasks 3 and 4 to provide to the consultants. However, the
consultants should identify potential additional sources of data for these two tasks, including records
held by port authorities, shipping agents, customs agencies and similar, that may not have been
identified/compiled by the CFP/CFP-A.
Task 5:
The consultants should identify and evaluate any existing in-country databases for use in this Task.
The database should be tailored to suit the country's circumstances while ensuring user-friendliness,
consistency with the IMO Ballast Water Record Form and consistency across all sites.
Task 6:
This will be based on existing data only. The consultants should clearly outline in their Tender what
parameters will be used, and how the data for these parameters will be collected from the source and
destination ports.
Task 7:
The consultants should clearly outline in their Tender what multivariate environmental similarity
analysis programme will be used, and how it will be used.
Task 8:
The consultants should clearly outline in their Tender how this Task will be achieved, including how
relevant national and international invasive marine species records and databases will be accessed.
Task 9:
The consultants should clearly outline in their Tender how the outputs of Tasks 1 to 8, and in
particular Task 4, will be used to produce the risk profiles for each demonstration site, and what form
these will take.
Task 10 & 11:
The consultants should clearly outline in their Tender how these Tasks will be achieved.
6. Time Frame, End Product and Reporting Procedure
· The risk assessments will be conducted for each of the six demonstration sites in the second
half of 2001 and into the first half of 2002. A detailed workplan and timeline will be
proposed by the consultant in their Tender and the precise timing for each site will be refined
through consultation with each country, once the contract is awarded.
· The end product of this consultancy will be the establishment of the databases, GIS's,
multivariate environmental similarity analysis programmes and risk assessment outputs at
each demonstration site, including training in their use.
· There will also be a report for each demonstration site which addresses as fully as possible all
of the Tasks under section 4, consistent with all parts of these Terms of Reference and the
5
Ballast Water Risk Assessment, Port of Dalian, People's Republic of China, November 2003: Final Report
consultancy contract. Results presented should be supported by maps, figures, diagrams and
tables here useful.
· Each report should be submitted to the PCU in draft form first, for review by the PCU and
the demonstration site risk assessment team. The final report for each site will be submitted to
the PCU within one month of the consultants receiving review comments.
· The PCU may arrange for peer review of the draft reports, to ensure scientific credibility and
quality control.
· The final reports should be submitted to the PCU in both hard-copy and electronic form,
including figures, images and data, ready for publication. The PCU will publish each final
report in both English and the main language of the pilot country (if different).
7. Selection Criteria
· Cost effectiveness.
· Demonstrated record of meeting deadlines and completing tasks within budget.
· Extensive experience with the issue of introduced marine species.
· Extensive experience with the issue of ballast water.
· Extensive experience with risk assessment in relation to introduced marine species and ballast
water.
· Demonstrated abilities in literature search and review and in identifying and obtaining reports,
publications, information and data from sometimes obscure and difficult sources.
· Demonstrated skills in information analysis and synthesis.
· Experience in working in developing countries.
· Experience in training and capacity building in developing countries.
· Ability of the proposed methods and workplan to complete all Tasks satisfactorily.
8. Content of Tenders
The Tender should include the following:
· Total lump-sum price in US$D.
· Detailed cost break-down for all Tasks in US$ (NB. Total budget must not exceed US$250,000
and cost-effectiveness and competitiveness within this budget forms a primary selection criteria).
· Detailed workplan and provisional timeline for all Tasks outlined under section 4 above.
· Details of the methods proposed to achieve all Tasks, framed against each Task under section 4
above and consistent with section 5 above.
6
Appendix 8: Consultants' Terms of Reference
· CV's of each consultancy team member (maximum of 3 pages per person) (consultancy teams
should be kept as small as possible).
· Details of the consultancy's professional indemnity and liability insurance and quality assurance
procedures.
Further Information
Steve Raaymakers
Technical Adviser
Programme Coordination Unit
Tel +44 (0)20 7587 3251
Fax +44 (0)20 7587 3261
Email sraaymak@imo.org
7


Ballast W
a
ter Risk Assessment
Global Ballast Water
Management Programme
G L O B A L L A S T M O N O G R A P H S E R I E S N O . 1 2
Port of Dalian, People'
Ballast Water Risk Assessment
Port of Dalian
s Republic of China
People's Republic of China
Final Report
NOVEMBER 2003
Final Report
.dwa.uk.com
Chris Clarke, Rob Hilliard, Liuy Yan,
John Polglaze, Xu Xiaoman,
GLOBALLAST MONOGRAPH SERIES
Zhao Dianrong & Steve Raaymakers
More Information?
el (+44) 020 7928 5888 www
Programme Coordination Unit
Global Ballast Water Management Programme
International Maritime Organization
4 Albert Embankment
London SE1 7SR United Kingdom
Tel: +44 (0)20 7587 3247 or 3251
est & Associates, London. T
Fax: +44 (0)20 7587 3261
Web: http://globallast.imo.org
NO.12
A cooperative initiative of the Global Environment Facility,
United Nations Development Programme and International Maritime Organization.
Cover designed by Daniel W