


Ballast W
a
ter Risk Assessment
Global Ballast Water
Management Programme
G L O B A L L A S T M O N O G R A P H S E R I E S N O . 1 1
Ports of Mumbai and Jawaharlal Nehru, India
Ballast Water Risk Assessment
Ports of Mumbai and Jawaharlal Nehru
India
Final Report
OCTOBER 2003
Final Report
A. C. Anil, C. Clarke,
.dwa.uk.com
T. Hayes, R. Hilliard, G. Joshi,
V. Krishnamurthy, J. Polglaze,
GLOBALLAST MONOGRAPH SERIES
S. S. Sawant & S. Raaymakers
More Information?
el (+44) 020 7928 5888 www
Programme Coordination Unit
Global Ballast Water Management Programme
International Maritime Organization
4 Albert Embankment
London SE1 7SR United Kingdom
Tel: +44 (0)20 7587 3247 or 3251
est & Associates, London. T
Fax: +44 (0)20 7587 3261
Web: http://globallast.imo.org
NO.11
A cooperative initiative of the Global Environment Facility,
United Nations Development Programme and International Maritime Organization.
Cover designed by Daniel W
GloBallast Monograph Series No. 11
Ballast Water Risk Assessment
Ports of Mumbai and Jawaharlal Nehru
India
October 2003
Final Report
Arga Chandrashekar Anil2, Christopher Clarke1,
Terry Hayes1, Robert Hilliard1, Geeta Joshi3,
Venkat Krishnamurthy2, John Polglaze1,
Subhash S. Sawant2 & Steve Raaymakers4
1 URS Australia Pty Ltd, Perth, Western Australia
2 National Institute of Oceanography, Dona Paula, Goa
3 GloBallast - India, Directorate General of Shipping (Ministry of Shipping), Government of India, Mumbai
4 Programme Coordination Unit, GEF/UNDP/IMO Global Ballast Water Management Programme, International
Maritime Organization
International Maritime Organization
ISSN 1680-3078
Published in March 2004 by the
Programme Coordination Unit
Global Ballast Water Management Programme
International Maritime Organization
4 Albert Embankment, London SE1 7SR, UK
Tel +44 (0)20 7587 3251
Fax +44 (0)20 7587 3261
Email sraaymak@imo.org
Web http://globallast.imo.org
The correct citation of this report is:
Anil, A.C., Clarke, C., Hayes, T., Hilliard, R., Joshi, G., Krishnamurthy, V., Polglaze, J., Sawant S.S. & Raaymakers, S.
2004. Ballast Water Risk Assessment, Ports of Mumbai and Jawaharlal Nehru, India, October 2003: Final Report.
GloBallast Monograph Series No. 11. IMO London.
The Global Ballast Water Management Programme (GloBallast) is a cooperative initiative of the Global Environment Facility (GEF),
United Nations Development Programme (UNDP) and International Maritime Organization (IMO) to assist developing countries to reduce
the transfer of harmful organisms in ships' ballast water.
The GloBallast Monograph Series is published to disseminate information about and results from the programme, as part of the
programme's global information clearing-house functions.
The opinions expressed in this document are not necessarily those of GEF, UNDP or IMO.
Ballast Water Risk Assessment, Ports of Mumbai and Jawaharlal Nehru, India, October 2003: Final Report
Acknowledgements
The Ballast Water Risk Assessment for the Ports of Mumbai and Jawaharlal Nehru was undertaken
during 2002 and funded by the GEF/UNDP/IMO Global Ballast Water Management Programme and
the Government of India. The study team (Appendix 2) thanks the following for their help and
assistance:
Mr Sanjoy Chakrabarty
Former Country Focal Point, Ministry of Shipping, Mumbai.
Mr S. N. Chakrabartty
Director, Planning and Research Department, Mumbai Port Trust.
Dr Gustaaf Hallegraeff
University of Tasmania, Hobart, Tasmania.
Dr Keith Hayes
CSIRO Marine Research, Hobart, Tasmania.
Dr Chad Hewitt
Biosecurity Unit, New Zealand Ministry of Fisheries, Auckland.
Dr Fred Wells
Western Australian Museum, Perth, Western Australia.
The report was formatted and prepared for print by Leonard Webster.
i
Ballast Water Risk Assessment, Ports of Mumbai and Jawaharlal Nehru, India, October 2003: Final Report
Acronyms
BW
Ballast water
BWM
Ballast water management
BWRA
Ballast Water Risk Assessment
BWRF
Ballast Water Reporting Form (the standard IMO BWRF is shown in Appendix 1)
CFP
Country Focal Point (of the GloBallast Programme in each Pilot Country)
CFP/A
Country Focal Point Assistant
CRIMP
Centre for Research on Introduced Marine Pests (now part of CSIRO Marine
Research, Hobart, Tasmania)
CSIRO
Commonwealth Scientific and Industrial Research Organisation (Australia)
CSPO
Commercial Sea Port of Odessa (port authority)
DGS
Directorate General of Shipping (Ministry of Shipping), India
DSS
Decision support system (for BW management)
DWT
Deadweight tonnage (typically reported in metric tonnes)
GIS
Geographic information system
GISP
Global Invasive Species Programme
GloBallast
GEF/UNDP/IMO Global Ballast Water Management Programme
GT
Gross tonnage (usually recorded in metric tonnes)
GUI
Graphic User Interface
IACSS
Information and Analytical Centre for Shipping Safety, State Department of Maritime
and Inland Water Transport, Ministry of Transport of Ukraine.
IALA
International Association of Lighthouse Authorities
IBSS
Institute of Biology of the Southern Seas (Odessa Branch) of the Ukraine National
Academy of Science
IHO
International Hydrographic Organization
IMO
International Maritime Organization
IUCN
The World Conservation Union
JNP
Jawaharlal Nehru Port
JNPT
Jawaharlal Nehru Port Trust
LAT
Lowest Astronomical Tide
MESA
Multivariate environmental similarity analysis
MEPC
Marine Environment Protection Committee (of the IMO)
MP
Mumbai Port
MPT
Mumbai Port Trust
NEMISIS
National Estuarine & Marine Invasive Species Information System (managed by
SERC)
NIMPIS
National Introduced Marine Pests Information System (managed by CSIRO,
Australia)
NIO
National Institute of Oceanography (India)
NIS
Non-indigenous species
OBO
Ore/bulk oil tankers (an rather unsuccessful vessel class now used for oil transport
only)
OS
Operating System (of any personal or mainframe computer)
PCU
Programme Coordination Unit (of the GloBallast Programme based at IMO London)
PRIMER
Plymouth Routines In Marine Environmental Research
PBBS
Port Biological Baseline Survey
ROR
Relative overall risk
SAP
(Regional) Strategic Action Plan
SERC
Smithsonian Environmental Research Center (Washington DC, United States)
SIPBS
State Inspection for Protection of the Black Sea
VLCC
Very large crude carrier (200,000 300,000 DWT)
ULCC
Ultra large crude carrier (over 300,000 DWT)
ii
Ballast Water Risk Assessment, Ports of Mumbai and Jawaharlal Nehru, India, October 2003: Final Report
Glossary of Terms and Definitions
The following terms and definitions are summarised from various sources including Carlton (1985,
1996, 2002), Cohen & Carlton (1995), Hilliard et al. (1997a), Leppäkoski et al. (2002), Williamson et
al. (2002) and the GloBallast BWRA User Guide. The latter document contains more detailed
definitions with explanatory notes, plus a glossary of maritime terms.
Ballast water
Any water and associated sediment used to manipulate the trim and
stability of a vessel.
Bioinvasion
A broad based term that refers to both human-assisted introductions
and natural range expansions.
Border
The first entrance point into an economy's jurisdiction.
Cost benefit analysis
Analysis of the cost and benefits of a course of action to determine
whether it should be undertaken.
Cryptogenic
A species that is not demonstrably native or introduced.
Disease
Clinical or non-clinical infection with an aetiological agent.
Domestic
Intra-national coastal voyages (between domestic ports).
routes/shipping
Established
A non-indigenous species that has produced at least one self-sustaining
introduction
population in its introduced range.
Foreign routes/shipping
International voyages (between countries).
Fouling organism
Any plant or animal that attaches to natural and man-made substrates
such as piers, navigation buoys or hull of ship, such as seaweed,
barnacles or mussels.
Harmful marine species
A non-indigenous species that threatens human health, economic or
environmental values.
Hazard
A situation that under certain conditions will cause harm. The
likelihood of these conditions and the magnitude of the subsequent
harm is a measure of the risk.
Indigenous/native
A species with a long natural presence that extends into the pre-historic
species
record.
Inoculation
Any partial or complete discharge of ballast tank water that contains
organisms which are not native to the bioregion of the receiving waters
(analogous to the potentially harmful introduction of disease causing
agents into a body as the outcome depends on inoculum strength and
exposure incidence).
Intentional introduction
The purposeful transfer or deliberate release of a non-indigenous
species into a natural or semi-natural habitat located beyond its natural
range.
iii
Ballast Water Risk Assessment, Ports of Mumbai and Jawaharlal Nehru, India, October 2003: Final Report
Introduced species
A species that has been intentionally or unintentionally transferred by
human activity into a region beyond its natural range.
Invasive species
An established introduced species that spreads rapidly through a range
of natural or semi-natural habitats and ecosystems, mostly by its own
means.
Marine pest
A harmful introduced species (i.e. an introduced species that threatens
human health, economic or environmental values).
Non-invasive
An established introduced species that remains localised within its new
environment and shows minimal ability to spread despite several
decades of opportunity.
Pathogen
A virus, bacteria or other agent that causes disease or illness.
Pathway (Route)
The geographic route or corridor from point A to point B (see Vector).
Port Biological Baseline
A biological survey to identify the types of introduced marine species
Survey (PBBS)
in a port.
Risk
The likelihood and magnitude of a harmful event.
Risk assessment
Undertaking the tasks required to determine the level of risk.
Risk analysis
Evaluating a risk to determine if, and what type of, actions are worth
taking to reduce the risk.
Risk management
The organisational framework and activities that are directed towards
identifying and reducing risks.
Risk species
A species deemed likely to become a harmful species if it is introduced
to a region beyond its natural range, as based on inductive evaluation
of available evidence.
Translocation
The transfer of an organism or its propagules into a location outside its
natural range by a human activity.
Unintentional
An unwitting (and typically unknowing) introduction resulting from a
introduction
human activity unrelated to the introduced species involved (e.g. via
water used for ballasting a ship or for transferring an aquaculture
species).
Vector
The physical means or agent by which a species is transferred from one
place to another (e.g. BW, a ship's hull, or inside a shipment of
commercial oysters)
iv
Ballast Water Risk Assessment, Ports of Mumbai and Jawaharlal Nehru, India, October 2003: Final Report
Lead Agencies
Lead Agency for General BW Issues in India:
Contact person:
Mr Ajoy Chatterjee,
Position:
Chief Surveyor to the Government of India and GloBallast Programme
Country Focal Point
Organization:
Directorate General of Shipping, Ministry of Shipping
Address:
Jahaz Bhavan, Walchand Hirachand Marg,
Mumbai 400 001, India
Tel: 91-22-2261-1788
Fax:
91-22-2261-3655
Email: cs@dgshipping.com
Primary contact for BW Risk Assessments in India:
Contact person:
Dr A.C. Anil
Position:
Scientist & Head, Marine Corrosion & Materials Research
Organization:
National Institute of Oceanography
Address:
Dona Paula, Goa 403 004, India
Tel: 91-832-245-404
Fax:
91-832-245-602
Email:
acanil@darya.nio.org
Web:
http://www.nio.org
v
Ballast Water Risk Assessment, Ports of Mumbai and Jawaharlal Nehru, India, October 2003: Final Report
Executive Summary
The introduction of harmful aquatic organisms and pathogens to new environments via ships' ballast
water (BW) and other vectors has been identified as one of the four greatest threats to the world's
oceans. The International Maritime Organization (IMO) is working to address the BW vector through
various initiatives. One initiative has been the provision of technical assistance to developing
countries through the GEF/UNDP/IMO Global Ballast Water Management Programme (GloBallast).
Core activities of the GloBallast Programme are being undertaken at Demonstration Sites in six Pilot
Countries. These sites are the ports at Sepetiba (Brazil), Dalian (China), Mumbai (India), Khark
Island (Iran), Odessa (Ukraine) and Saldanha Bay (South Africa). One of these activities (Activity
3.1) has been to trial a standardised method of BW risk assessment (BWRA) at each of the six
Demonstration Sites. Risk assessment is a fundamental starting point for any country contemplating
implementing a formal system to manage the transfer and introduction of harmful aquatic organisms
and pathogens in ships' BW, whether under existing IMO Ballast Water Guidelines (A.868(20)) or
the new international Convention.
To maximise certainty while seeking cost-effectiveness and a relatively simple, widely applicable
system, a semi-quantitative approach was followed, using widely-supported computer software. The
semi-quantitative method aims to minimise subjectivity by using as much quantitative data as
possible, to identify the riskiest ballast tank discharges with respect to a Demonstration Site's current
pattern of trade. Unlike a fully quantitative approach, it does not attempt to predict the specific risk
posed by each intended tank discharge of individual vessels, nor the level of certainty attached to such
predictions. However, by helping a Demonstration Site to determine its riskiest trading routes,
exploring the semi-quantitative BWRA provides a coherent method for identifying which BW sources
deserve more vessel monitoring and management efforts than others.
This report describes the BWRA activity undertaken for the neighbouring ports of Mumbai and
Jawaharlal Nehru, which form the Mumbai Demonstration Site and are managed by the Mumbai Port
Trust (MPT) and Jawaharlal Nehru Port Trust (JNPT) respectively. This capacity-building activity
commenced in January 2002, with URS Australia Pty Ltd (URS) contracted to the Programme
Coordination Unit (PCU) to provide BWRA training and software. Under the terms of reference, the
consultants worked closely with their counterparts in a project team co-managed by URS and the
Country Focal Point Assistant (CFPA) for completing all required tasks. These tasks required two in-
country visits by the consultants (in March and October 2002) to install the BWRA software and
provide `hands-on' instruction and guidance. Most of the data collation tasks were undertaken before,
between and during these visits, with gap-filling work undertaken by the consultants prior to a short
`project wrap-up' visit in February 2003.
The first step was to collate and computerise data from IMO Ballast Water Reporting Forms
(BWRFs) to identify the source ports from which BW is imported to the Demonstration Site. For
periods or vessel arrivals where BWRFs were not collected or were incomplete, gap-filling data were
extracted from the port shipping records obtained from terminals and offices managed by the MPT
and JNPT. These records also helped identify which next ports of call may have been a destination
port for any BW taken up at Mumbai.
A multivariate procedure was then use to determine the relative environmental similarity between the
Demonstration Site and each of its BW source and destination ports. Comparing port-to-port
environmental similarities provides a relative measure of the risk of organism survival, establishment
and potential spread. This is the basis of the `environmental matching' method adopted by the project,
which facilitates estimating the risk of BW introductions when the range and types of potentially
harmful species that could be introduced from a particular source port are poorly known.
Another objective of the BWRA Activity was to identify `high-risk' species that may be transferred to
and/or from the Demonstration Site. The customised BWRA database provided by URS therefore
vi
Ballast Water Risk Assessment, Ports of Mumbai and Jawaharlal Nehru, India, October 2003: Final Report
contained tables and interfaces for storing and managing the names, distribution and other information
on risk species. Thus the taxonomic details, bioregional distribution, native/introduced status and level
of threat assigned to a species were stored in the database for display, review and update as well as for
the BWRA analysis. For the purposes of the BWRA and its `first-pass' risk assessment, a risk species
was considered to be any introduced, cryptogenic or native species that might pose a threat to marine
ecological, social and/or commercial resources and values if successfully transferred to or from a
Demonstration Site.
During each visit the consultants worked alongside their Pilot Country counterparts to provide skills-
transfer as part of the capacity building objectives of the programme, with the project team divided
into three groups. Group A mapped the port and its resources using ArcView GIS. This group
included counterparts from the National Institute of Oceanography (NIO) at Goa, who helped collate
much of the required GIS data. Group B was responsible for managing the customised Access
database supplied by the consultants, and for entering, checking and managing the BW discharge data,
as recorded on the BWRFs voluntarily submitted by arriving ships and/or derived from the port's
shipping records. Group B used the database to identify BW source and destination ports, and is
designed for ongoing input and management of BWRFs. Group C was also based at the NIO, and
undertook the environmental matching and risk species components of the Activity, using the
PRIMER package to perform the multivariate analyses for determining the environmental distances
between Mumbai-JNP and their source and destination ports.
The various BW discharge, environmental matching and risk species data described above were then
processed by the database with other risk factors, including voyage duration and tank size, to provide
preliminary indication of:
(a) the relative overall risk posed by each BW source port, and
(b) which destination ports appeared most at risk from any BW uplifted at the Demonstration
Site.
This was achieved using a project standard approach, although the database also facilitates instant
modifications of the calculations for exploratory and demonstration purposes. The GloBallast BWRA
also adopted a `whole-of-port' approach to compare the subject port (Demonstration Site) with all of
its BW source and destination ports. The project has therefore established at the NIO an integrated
database and geographic information system (GIS) that manages and displays:
· ballast water data obtained from arriving ship BWRFs and port shipping records;
· information on the Demonstration Site's navigational, physical and environmental conditions
and aquatic resources,
· port-to-port environmental matching data,
· risk species data, and
· risk coefficients and graphical categories of risk for ballast discharges.
The results, which were graphically displayed on user-friendly GIS port and world maps as well as in
ranked output tables, help determine the types of management responses.
From the 3,581 vessel visit records and 4,934 associated BW tank records in the 2000-2002 database
that was developed for Mumbai-JNP, the total number of identified BW source ports was 82. The
three source ports supplying the highest frequencies of BW discharges were Karachi (13.9% of all
recorded discharges), Singapore (10.9%) and Colombo (10.1%). These were followed by Jebel Ali
(UAE; 8%), Kandla (India; 5.8%), Mohammed Bin Qasim (Pakistan; 4.0%), Dubai and Fujairah
(UAE; both 3.9%). Of the 82 identified source ports, the top six and sixteen provided >50% and
>75% of all source-identified discharges respectively. The top 24 ports contributed a further 15%, i.e.
only 24 (29%) of the 82 source ports accounted for 90% of all source-identified BW discharges.
vii
Ballast Water Risk Assessment, Ports of Mumbai and Jawaharlal Nehru, India, October 2003: Final Report
The total volume of BW discharged from the identified source ports was 2,619,625 tonnes. The
source port rankings in terms of the BW volume discharged were similar but not the same as those
ranked for discharge frequencies. Thus the source ports providing the largest BW volumes discharged
at Mumbai-JNP were Sikka (17.4%), Chennai (12.8%) and Cochin (9.7%) in India, followed by
Singapore (8.1%), Dubai (4.8%), Kandla (4.7%) and Surat (4.2%). The top five source ports provided
>50% of the total discharged volume, and the next seven ports a further 25%, i.e. only 12 of the
identified source ports (14.6%) accounted for >75% of the total source-identified BW discharge at
Mumbai-JNP. Of the top 20 ports which accounted for almost 90% of the volume, 12 were in India,
two were in the UAE (Dubai and Jebel Ali), and one each in the Netherlands (Rotterdam), Oman
(Salalah), Pakistan (Karachi), Singapore, South Africa (Richards Bay) and Sri Lanka (Colombo).
Of the identified 82 BW source ports and 108 potential BW destination ports (i.e. Next Ports of Call),
sufficient port environmental data were obtained to include 77% of the former and 71% of the latter in
the multivariate similarity analysis by PRIMER. These ports accounted for 95.7% of recorded BW
tank discharges and 92.5% of all recorded departures respectively.
To allow all identified BW source and next ports of Mumbai-JNP to be part of the risk assessment, the
ports with missing environmental data were provided with environmental matching coefficient
estimates, based on their port type and geographic location with respect to the nearest comparable port
with a calculated coefficient. The environmental matching results show that Mumbai-JNP has a
moderately high environmental similarity to 28% of its trading ports (coefficients between 0.5-0.7).
All ports with an environmental matching coefficient >0.535 were humid tropical ports in Asia and
Africa that experience relatively intense seasonal monsoons. The most environmentally similar ports
to Mumbai-JNP were Mangalore (0.64), Pondichery (C3 estimated), Marmagao (0.62) and Porbandar
(0.61). The most environmentally dissimilar ports trading with Mumbai-JNP in 2000-2002 were cool
temperate estuary ports in northern Europe (i.e. Hamburg, Ilyichevsk and Antwerpen; all <0.2).
From the 3,581 visit records in the Mumbai-JNP database, the project standard BWRA identified that
eleven of the 82 identified source ports represented the highest risk group (in terms of their BW
source frequency, volume, voyage duration, environmental similarity and assigned risk species).
These ports, nine of which were Indian plus Colombo (Sri Lanka) and Singapore, provided the top
20% of the total relative risk. The highest risk ports were led by Marmagao and Mangalore, with
Colombo a close third and the first non-Indian port in the ranking. Karachi (Pakistan) was ranked as a
high risk port in 12th overall position. The highest ranked ports beyond South Asia were firstly
Singapore (ranked 10th), followed by Nagasaki in Japan (ranked 14th as a high risk port). The highest
ranked port beyond the South and East Asian regions was Durban in South Africa (ranked 25th with a
medium risk). There forty-two source ports ranked in the low (19) and lowest (23) risk categories.
These were a mixture of cool, hot-salty and/or riverine ports with a wide distribution. The source port
with the lowest risk was the cool freshwater port of Antwerpen in Belgium.
Based on Mumbai-JNP's current pattern of trade (as implied by the 2000-2002 database), the results
suggest that BW sourced from Europe and the Red Sea/Gulf pose less threat than many ports in India,
other South Asian countries and the humid South-East Asian region. In fact the take-home message
was that Mumbai-JNP's current shipping trade causes most risk to be posed by relatively local `port-
hopping' by harmful species that establish and acclimate in other Indian or nearby foreign ports,
rather than from remote comparable regions such as the Caribbean and Gulf of Mexico. The presence
of the East Asian green lipped mussel (Perna viridis) and the Caribbean black-striped mussel
(Mytilopsis sallei) in the navy dock at Mumbai-JNP conform with this conclusion. Thus P. viridis is
common in Malay Peninsula and other East Asian ports that regularly trade with Mumbai-JNP, while
M. sallei is believed to have `port-hopped' from its earlier establishment inside Visakhapatnam (a
major bulk export port on India's east coast that has more frequent vessel arrivals from Atlantic ports
than Mumbai-JNP).
Unlike the above fouling organisms, none of the noxious phytoplankton species in the Mumbai-JNP
bioregion have clear-cut origins, and some have the potential to increase the incidence and/or severity
viii
Ballast Water Risk Assessment, Ports of Mumbai and Jawaharlal Nehru, India, October 2003: Final Report
of red tides within heavily developed, eutrophying coastal systems. Because India is a large
tropical/sub-tropical country with a large number of rapidly urbanising estuarine and lagoonal ports,
possible BW mediated transfers of water-borne pathogens (such as cholera) and parasites also needs
to be considered. Since cholera outbreaks do occur on the Indian subcontinent, running the BWRA
with its calculation options tailored to identifying the transfer of unwanted pathogenic strains of
Vibrio bacteria or other water-borne diseases would be useful (i.e. for predicting which ports on the
subcontinent pose the highest risk to Mumbai-JNP should they report an outbreak, in terms of their
shipping and BW trade, voyage duration and environmental similarity).
The results of the project standard `first-pass' risk assessment imply that Mumbai-JNP is susceptible
to unwanted introduced species which establish populations in similar tidal creek/estuarine
environment harbours between Karachi and the Pondichery-Visakhapatnam region. This appears
logical given Mumbai-JNPs biogeographic location and current pattern of trade, and it indicates that
the relative risk coefficients should provide a useful benchmark for exploring the risk formula and
refining the database. It is also worth noting that the BWRA activity is based on two years of shipping
data, so the results can change if there is any major change to the current (2000-2002) pattern of
Mumbai-JNP trade assembled in the database.
The `port-hopping' risk mentioned above signifies that India's domestic port-to-port shipping is an
important vector and therefore, as with other large nations such as Australia, warrants active BW
management and use of BWRFs, especially to help determine the intra-national pattern of BW
transfers. Thus delineation of BW-mediated species invasions and public health risks for any Indian
port will need to measure and contrast the influence of domestic arrivals versus international arrivals,
together with port proximity (facilitating both natural and BW tank dispersion of organisms), and use
of a more port-oriented rather than bioregional approach for the database's storage and treatment of
the risk species data.
In the case of the `reverse' BWRA for Mumbai-JNP, there is no doubt both ports annually `export' a
considerable volume of ballast water, with most of this being transferred to other ports in relatively
small but frequent quantities within the tanks of container ships, general cargo ships, small bulk
carriers, ro-ro vessels and vegetable oil (chemical) tankers. The 2000/2001 ratio of total imported
cargo to total exported cargo indicates that some ~1.5 million tonnes of BW is exported annually.
The most frequent destination port appeared to be Colombo, which has a moderate environmental
matching as it experiences a comparable climate regime but is a breakwater harbour located on an
open sandy coast without significant tidal creek habitats or major river. Ports more at risk from
unwanted species transfers from Mumbai-JNP were identified as Mangalore, Pondichery, Marmagao,
Porbandar, Muhammad Bin Qasim and Singapore. It was clear that Mumbai-JNP forms a significant
hub in the Indian Ocean, with most trading voyages occurring between the Red Sea and Indo-Malay
peninsula. Of the top 17 ports accounting for 80% of the destinations recorded by departing vessels,
five were Indian, seven were in the Middle East and others were single ports in Malaysia, Pakistan,
Singapore, Sri Lanka and United States. Of the risk species assigned to the Mumbai-JNP bioregion,
fouling tube worms, bivalve molluscs and potentially noxious phytoplankton were identified as
potentially the most economically and ecologically harmful organisms.
Of the various BWRA objectives and tasks, reliable identification of destination ports that receive the
largest amounts of BW exported from Mumbai-JNP was the least successful task. It was confounded
by the lack of specific questions on the IMO-standard BWRFs, and the uncertainty of knowing if the
Next of Port Call recorded on a BWRF is where BW is actually discharged. Thus presently there is no
mechanism enabling a `reverse BWRA' to be undertaken reliably. In the case of Mumbai-JNP, many
visiting vessels types do not uniformly discharge or uptake their full capacity of ballast water
(especially Ro-Ro vessels, general cargo ships and container vessels), with many of their previous and
next ports of call involving part cargo discharge and loading. If more reliable forward-looking
BWRAs are to be undertaken to identify destination ports in the future, supplementary questions will
ix
Ballast Water Risk Assessment, Ports of Mumbai and Jawaharlal Nehru, India, October 2003: Final Report
need to be added to the present BWRF, including the names of the three last ports of call as well as
the port where discharges from each partially or completely ballasted tank are predicted.
The main objectives of the BWRA Activity were successfully completed during the 14 month course
of this project, with the various tasks and exploratory/demonstration software providing a foundation
to facilitate the regional promulgation of further BW management activities by India. Project outputs
included a trained in-country risk assessment team base at the National Institute of Oceanography
(NIO) in Goa, and an operational BWRA system and User Guide for use as a demonstration tool in
the region. These have improved India's ability to provide assistance, technical advice, guidance and
encouragement to other port States in South Asia.
x
Ballast Water Risk Assessment, Ports of Mumbai and Jawaharlal Nehru, India, October 2003: Final Report
Table of Contents
Acknowledgements......................................................................................................................................i
Acronyms......................................................................................................................................................ii
Glossary of Terms and Definitions ..........................................................................................................iii
Lead Agencies..............................................................................................................................................v
Executive Summary ...................................................................................................................................vi
1
Introduction and Background .........................................................................................................1
2
Aims and Objectives .........................................................................................................................5
3
Methods ..............................................................................................................................................6
3.1
Overview and work schedule...................................................................................................................6
3.2 Resource mapping of the demonstration port.........................................................................................9
3.3 De-ballasting/ballasting patterns ...........................................................................................................10
3.4 Identification
of source ports..................................................................................................................11
3.5 Identification
of destination ports ...........................................................................................................12
3.6 BWRF
database.....................................................................................................................................13
3.7
Environmental parameters.....................................................................................................................15
3.8 Environmental
similarity analysis...........................................................................................................17
3.9
Risk species ...........................................................................................................................................18
3.10 Risk assessment ....................................................................................................................................22
3.11 Training and capacity building ...............................................................................................................27
3.12 Identification
of information gaps...........................................................................................................29
4
Results ............................................................................................................................................. 30
4.1 Description
of port ..................................................................................................................................30
4.2 Resource mapping .................................................................................................................................32
4.3 De-ballasting/ballasting patterns ...........................................................................................................34
4.4 Identification
of source ports..................................................................................................................41
4.5 Identification
of destination ports ...........................................................................................................44
4.6
Environmental similarity analysis ..........................................................................................................45
4.7
Risk species threat.................................................................................................................................50
4.8
Risk assessment results ........................................................................................................................54
4.9
Training and capacity building ...............................................................................................................57
4.10 Identification
of information gaps...........................................................................................................58
5
Conclusions and Recommendations .......................................................................................... 60
5.1
Recommendations .................................................................................................................................60
5.2
BWRA recommendations and plans by Pilot Country ..........................................................................61
6
Location and maintenance of the BWRA System...................................................................... 62
References................................................................................................................................................. 63
APPENDIX 1: Copy of IMO Ballast Water Reporting Form
APPENDIX 2: Risk Assessment Team for Mumbai-JNP
APPENDIX 3: Check-list of project requirements
APPENDIX 4: Information sources used for collating Port Environmental Data
APPENDIX 5: Sources and references of Risk Species information
APPENDIX 6: Name, UN code, coordinates and environmental parameters of the 357 ports
used for the multivariate similarity analyses for all Demonstration Sites
APPENDIX 7: Consultants' Terms of Reference
xi
Ballast Water Risk Assessment, Ports of Mumbai and Jawaharlal Nehru, India, October 2003: Final Report
Figure 1.
Locations of the six GloBallast Demonstration Sites and their various ballast water source and
destination ports....................................................................................................................................... 3
Figure 2.
Location of Mumbai-JNP and other ports in South Asia ........................................................................ 4
Figure 3.
Schematic of the GloBallast BWRA system ........................................................................................... 6
Figure 4.
Thematic layers used for the Port Map GIS............................................................................................ 9
Figure 5.
Working page of the Excel spreadsheet used to estimate BW discharges ......................................... 12
Figure 6.
The three tabs of the GUI used for entering the BWRF data............................................................... 15
Figure 7.
Part of the GIS world map of marine bioregions, showing the code names of those in the
South Asian region ................................................................................................................................ 19
Figure 8.
Complete GIS world map showing the marine bioregions
[to improve clarity, not all bioregion codes are shown in this example]............................................... 20
Figure 9.
Database GUI used for manipulating the BWRA calculation and weightings ..................................... 23
Figure 10.
Annual wind rose typical of the Mumbai region .................................................................................... 30
Figure 11.
Part of the GIS Port Map showing the navigation, infrastructure and active berth layers
for the ports of Mumbai and JNP. ......................................................................................................... 32
Figure 12.
Part of the GIS Port Map showing the active berth and marine habitat layers.................................... 33
Figure 13.
BW discharge statistics displayed by GIS port map for the Mumbai docks ........................................ 36
Figure 14.
BW discharge statistics displayed by GIS port map for the Pir Pau terminal ...................................... 37
Figure 15a. BW discharge statistics displayed for the Butcher Island products terminal ....................................... 37
Figure 15b. BW discharge statistics displayed for the Butcher Island crude terminal ............................................ 38
Figure 16a. BW discharge statistics displayed by the port map for the JNP Ro-Ro terminal................................. 38
Figure 16b. BW discharge statistics displayed for the JNP Chemical terminal....................................................... 39
Figure 17a. BW discharge statistics displayed for the JNP Container terminal ...................................................... 39
Figure 17b. BW discharge statistics displayed for the JNP Dry Bulk terminal ........................................................ 40
Figure 18.
GIS output showing the location and relative importance of BW source ports with respect to
frequency of tank discharges (C1) at Mumbai-JNP.............................................................................. 42
Figure 19.
GIS output showing location and relative importance of the source ports with respect to
the volume of BW discharges (C2) recorded for Mumbai-JNP. ........................................................... 42
Figure 20.
GIS output showing the location and frequency of destination ports, recorded as the
Next Port of Call in the Mumbai-JNP BWRFs and shipping records. .................................................. 44
Figure 21.
GIS outputs showing the location and environmental matching coefficients (C3) of
BW source ports identified for Mumbai-JNP......................................................................................... 46
Figure 22.
GIS outputs showing the location and environmental matching coefficients (C3) of
the destination ports identified for Mumbai-JNP................................................................................... 46
Figure 23.
GIS output showing the location and risk species threat coefficients (C4) of
the BW source ports identified for Mumbai-JNP................................................................................... 51
Figure 24.
GIS outputs showing the location and categories of relative overall risk (ROR-cat) of
source ports identified for Mumbai-JNP................................................................................................ 54
Figure 25.
Frequency distribution of the standardised ROR values...................................................................... 57
xii
1
Introduction and Background
The introduction of harmful aquatic organisms and pathogens to new environments via ships' ballast
water (BW) and other vectors, has been identified as one of the four greatest threats to the world's
oceans. The International Maritime Organization (IMO) is working to address the BW vector through
a number of initiatives, including:
· adoption of the IMO Guidelines for the control and management of ships' ballast water to
minimize the transfer of harmful aquatic organisms and pathogens (A.868(20));
· developing a new international legal instrument (International Convention for the Control
and Management of Ships' Ballast Water and Sediments, as adopted by IMO in February
2004); and
· providing technical assistance to developing countries through the GEF/UNDP/IMO Global
Ballast Water Management Programme (GloBallast).
Core activities of the GloBallast Programme are being undertaken at Demonstration Sites in six Pilot
Countries. These sites are the ports at Sepetiba (Brazil), Dalian (China), Mumbai (India), Khark
Island (Iran), Odessa (Ukraine) and Saldanha Bay (South Africa). Activities carried out at the
Demonstration Sites will be replicated at additional sites in each region as the programme progresses
(further information at http://globallast.imo.org).
One of GloBallast's core activities (Activity 3.1) has been to trial a standardised method of BW risk
assessment (BWRA) at each of the six Demonstration Sites. Risk assessment is a fundamental starting
point for any country contemplating implementing a formal system to manage the transfer and
introduction of harmful aquatic organisms and pathogens in ships' BW, whether under the existing
IMO Ballast Water Guidelines (A.868(20)) or the new Convention.
A port State may wish to apply its BW management regime uniformly to all vessels that call at its
ports, or it may wish to assess the relative risk of these vessels to its coastal marine resources and
apply its regime selectively. Uniform application or the `blanket' approach offers the advantages of
simplified administration and no requirement for `judgement calls' to be made. This approach also
requires substantially less information management effort. If applied strictly, the uniform approach
offers greater protection from unanticipated bio-invaders, as it does not depend on the reliability of a
decision support system that may not be complete. However, the key disadvantage of the strict blanket
approach are the BW management costs imposed on vessels which otherwise might not be forced to
take action. It also requires a substantial vessel monitoring and crew education effort to ensure all
foreign and domestic flagged ships are properly complying with the required BW management
actions.
A few nations have started to develop and test systems that allow more selective application of BW
management requirements, based on voyage-specific risk assessments. This `selective' approach
offers to reduce the numbers of vessels subject to BW controls and monitoring, and is amenable to
nations that wish to reduce the introduction, and/or domestic spread, of `targeted' marine species only.
More rigorous measures can be justified on ships deemed to be of high risk if fewer restrictions are
placed on low risk vessels.
For countries/ports that choose the selective approach, it is essential to establish an organized means
of evaluating the potential risk posed by each arriving vessel, through a `Decision Support System'
(DSS). However, this approach places commensurate information technology and management
burdens on the port State, and its effectiveness depends on the quality of the information and database
systems that support it. A selective approach that is based on a group of targeted species may also
leave the country/port vulnerable to unknown risks from non-targeted species.
1
Ballast Water Risk Assessment, Ports of Mumbai and Jawaharlal Nehru, India, October 2003: Final Report
Before a port State decides on whether to adopt the blanket or the selective approach, it needs to carry
out some form of risk assessment for each port under consideration. Ballast water risk assessments
(BWRAs) can be grouped into three categories1:
· Qualitative Risk Identification: this is the simplest approach, and is based on subjective
parameters drawn from previous experience, established principals and relationships and
expert opinion, resulting in simple allocations of `low', `medium' and `high' risk. However it
is often the case that subjective assessments tend to overestimate low probability/high
consequence events and underestimate higher probability/lower consequence events (e.g.
Haugom et al, in Leppäkoski et al. 2002).
· Semi-Quantitative Ranking of Risk: this `middle' approach seeks to increase objectivity and
minimise the need for subjective opinions by using quantitative data and ranking of
proportional results wherever possible. The aim is to improve clarity of process and results,
thereby avoiding the subjective risk-perception issues that can arise in qualitative approaches.
· Quantitative Risk Assessment: this is the most comprehensive approach which aims to
achieve a full probablistic analysis of the risk of BW introductions, including measures of
confidence. It requires significant collation and analysis of physico-chemical, biological and
voyage-specific data, including key lifecycle and tolerance data for every pre-designated
species of risk (`target species'), port environmental conditions, ship/voyage characteristics,
the BW management measures applied, and input and evaluation of all uncertainties. The
approach requires a high level of resourcing, computer networking and sophisticated
techniques that are still being developed1.
The purpose of GloBallast Activity 3.1 has been to conduct initial, first-pass BWRAs for each
Demonstration Site. To maximise certainty while seeking cost-effectiveness and a relatively simple,
widely applicable system, the middle (semi-quantitative) approach was selected.
The first step of the GloBallast method is to collate data from IMO Ballast Water Reporting Forms
(BWRFs) (as contained in Resolution A.868(20); see Appendix 1) to identify the source ports from
which BW is imported to the demonstration port. For periods or vessel arrivals where BWRFs were
not collected or are incomplete, gap-filling data can be extracted from port shipping records.
Source port/discharge port environmental comparisons are then carried out and combined with other
risk factors, including voyage duration and risk species profiles, to give a preliminary indication of
overall risk posed by each source port. The results help determine the types of management responses
required, while the BWRA process provides a foundation block enabling application of more
sophisticated BW management DSSs by Pilot Countries.
The GloBallast approach is not the only one available but is considered to combine the best elements
of the semi-quantitative method to provide useful results within the available budget (US$250,000
spread across the six pilot countries). It has also taken a `whole-of-port' approach which compares the
subject port (Demonstration Site) with all of its BW source and destination ports. The outputs include
published reports, trained in-country risk assessment teams and an operational BWRA system for use
as demonstration tools in each of the six main developing regions of the world, plus a platform and
database to facilitate further DSS development. The GloBallast BWRA activity has therefore
established an integrated database and information system to manage and display:
· ballast water data from arriving ship BWRFs and port shipping records;
· data on the demonstration port's physical and environmental conditions and aquatic
resources,
· port-to-port environmental matching data,
1 for further details see the GloBallast BWRA User Guide.
2
1 Introduction and Background
· risk species data, and
· ballast water discharge risk coefficients.
The results provide a knowledge base that will help the Pilot Countries and other port States to
evaluate the risks currently posed by BW introductions, identify high priority areas for action, and
decide whether to apply a blanket or selective BW management regime. If a selective regime is
adopted, vessel and voyage-specific risk assessments can then be applied using systems such as those
being developed and trialled by the Australian Quarantine & Inspection Service (AQIS Decision
Support System), Det Norsk Veritas in Norway (EMBLA system) and the Cawthron Institute in New
Zealand (SHIPPING EXPLORER), and/or by further development of the GloBallast system. If a
uniform approach is adopted, the results help identify which routes and vessel types warrant the most
vigilance in terms of BW management compliance checking and verification monitoring, including
ship inspections and ballast tank sampling.
The geographical spread and broad representativeness of the six Demonstration Sites also means that
the results help plug a very large gap in the existing global knowledge base. Figure 1 indicates the
broad global spread of the GloBallast risk assessment activity. As a result of this activity,
comprehensive data are now available on source port and destination port linkages, environmental
parameters, environmental matching coefficients, risk species and relative overall risk of BW
transfers for the six GloBallast Demonstration Sites and a total of 723 ports around the world. Project
outcomes will therefore place governments, scientists, the shipping industry and the general public in
a stronger, more enlightened position to deal with the BW problem.
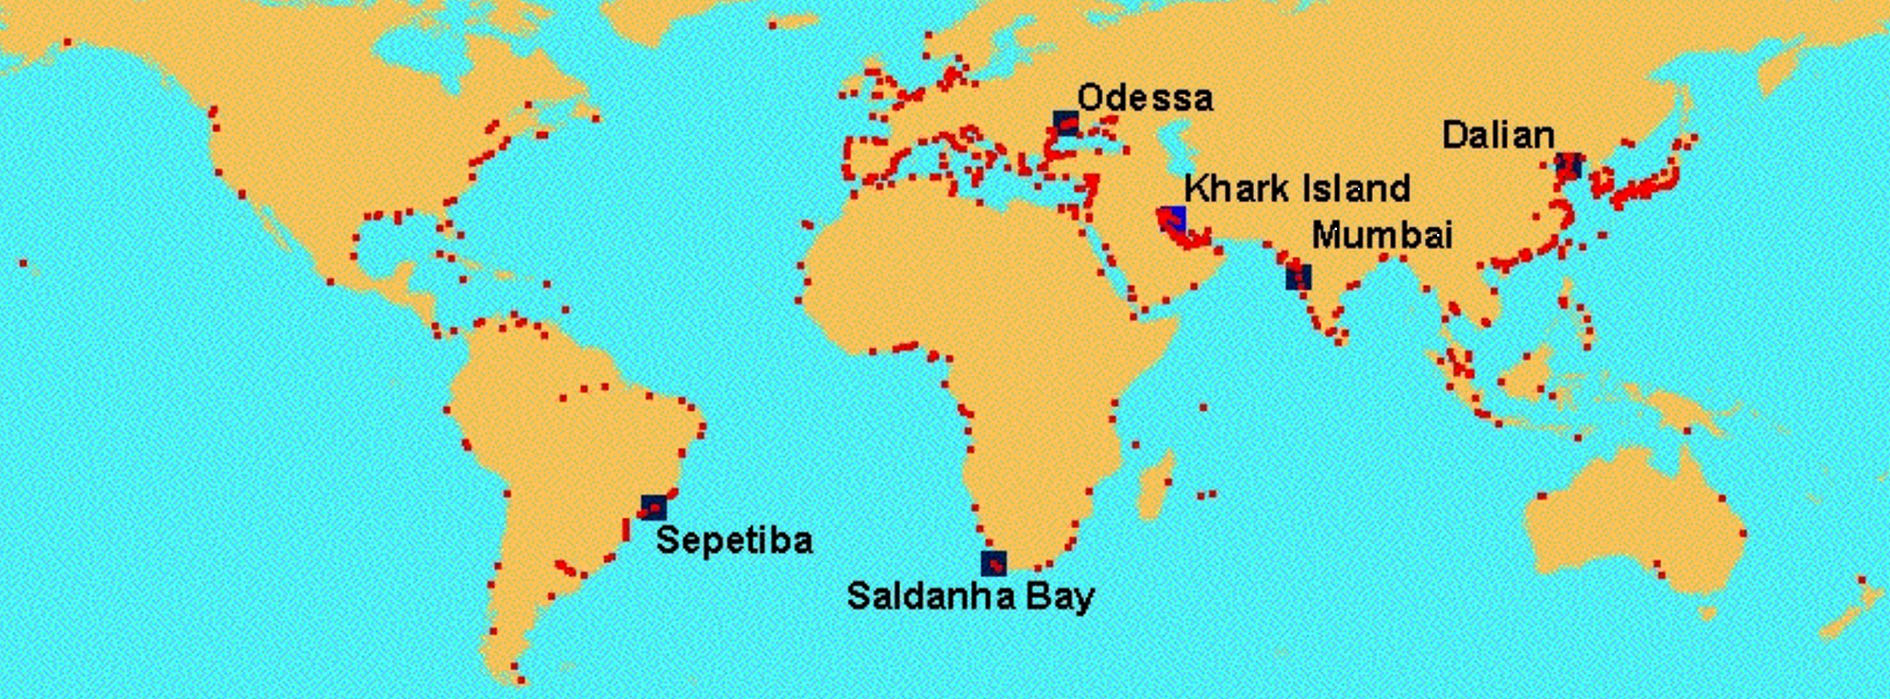
Figure 1. Locations of the six GloBallast Demonstration Sites and their various ballast water source and
destination ports.
This report describes and presents the results of the first Ballast Water Risk Assessment (BWRA)
carried out for the neighbouring Mumbai and Jawaharlal Nehru ports (Mumbai-JNP) during 2002.
This GloBallast Demonstrate Site comprises a large and historic `city' port and associated terminals,
plus a modern container and bulk terminal port developed on reclaimed land on the nearby Sheva
Island within Mumbai bay (Figure 2).
3
Ballast Water Risk Assessment, Ports of Mumbai and Jawaharlal Nehru, India, October 2003: Final Report
Figure 2. Location of Mumbai-JNP and other ports in South Asia
4
2
Aims and Objectives
The aims of the GloBallast BWRA for Mumbai-JNP were set by the GloBallast Programme
Coordination Unit (PCU), in accordance with Terms of Reference developed by the PCU Technical
Adviser (Appendix 7) and were to:
1. Assess and describe as far as possible from available data, the risk profile of invasive aquatic
species being both introduced to and exported from Mumbai-JNP in ships' BW, and to
identify the source ports and destination ports posing the highest risk for such introductions.
2. Help determine the types of management responses that are required, and provide the
foundation blocks for implementing a more sophisticated BW management system for
Mumbai-JNP.
3. Provide training and capacity building to in-country personnel, resulting in a fully trained risk
assessment team and operational risk assessment system, for ongoing use by the Pilot
Country, replication at additional ports and use as a demonstration tool in the region.
The specific objectives of the BWRA for Mumbai-JNP were to:
1. Identify, describe and map on a Geographic Information System (GIS) all coastal and marine
resources (biological, social/cultural and commercial) in and around the port that might be
impacted by introduced marine species.
2. Characterise, describe and map (on GIS) de-ballasting and ballasting patterns in and around
the port including locations, times, frequencies and volumes of BW discharges and uptakes.
3. Identify all ports/locations from which BW is imported (source ports).
4. Identify all ports/locations to which BW is exported (destination ports).
5. Establish a database at the nominated in-country agency for the efficient ongoing collection,
management and analysis of the data collected at Mumbai-JNP via standard IMO BWRFs.
6. Characterise as far as possible from existing data, the physical, chemical and biological
environments for Mumbai-JNP and each of their source and destination ports.
7. Develop environmental similarity matrices and indices to compare Mumbai-JNP with each of
their source ports and destination ports, as a key basis of the risk assessment.
8. Identify as far as possible from existing data, any high-risk species present at the source ports
that might pose a threat of introduction to Mumbai-JNP, and any high-risk species present at
this port that might be exported to a destination port.
9. Identify any information gaps that limit the ability to undertake the aims and objectives and
recommend management actions to address these gaps.
5
3
Methods
3.1
Overview and work schedule
The BWRA Activity for Mumbai-JNP was conducted by URS Australia Pty Ltd (URS) under contract
to the GloBallast Programme Coordination Unit (PCU), in accordance with the Terms of Reference
(Appendix 7). The consultants worked alongside their Pilot Country counterparts during the country
visits to provide training and skills-transfer as part of the capacity building objectives of the
programme. Structure and membership of the joint project team is shown in Appendix 2.
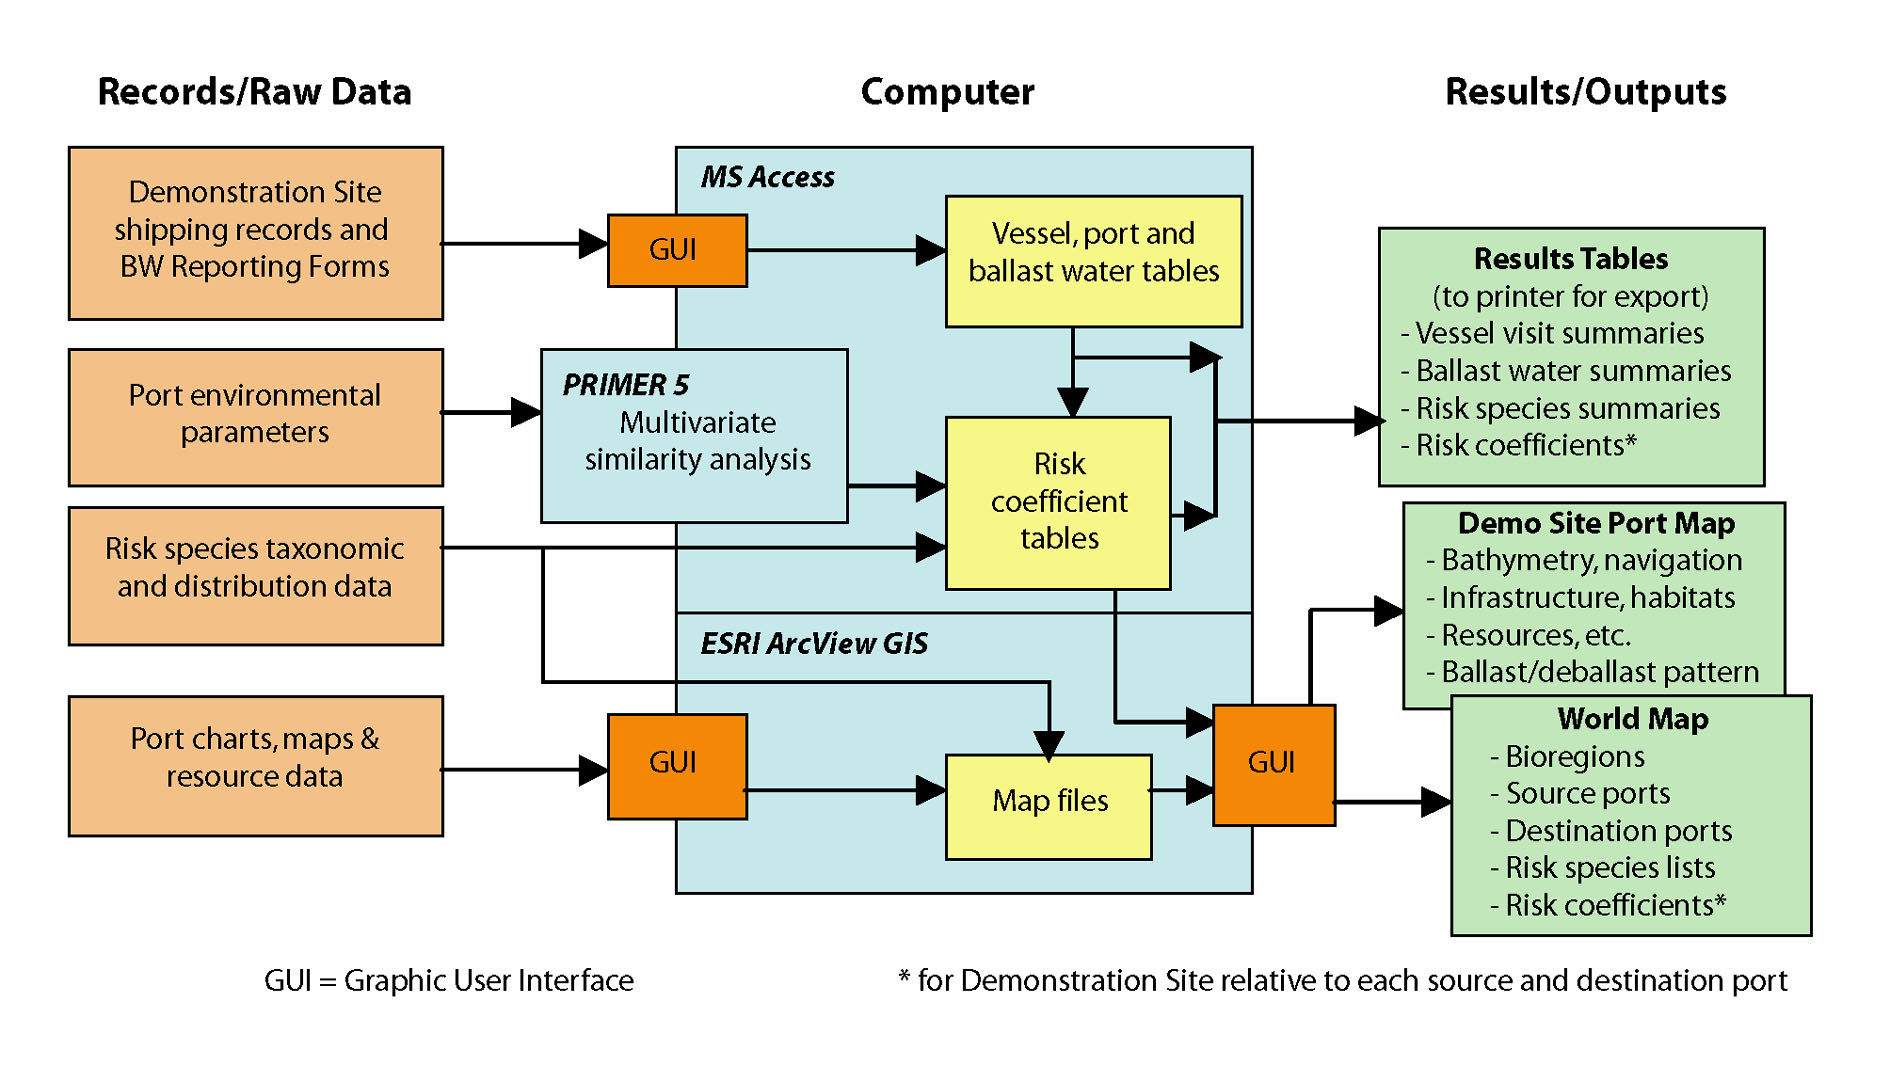
The consultants adopted an innovative, modular approach that integrated three widely used computer
software packages to provide a user-friendly tool for conducting, exploring and demonstrating semi-
quantitative BWRAs. As shown in Figure 3, the key software comprised:
· Microsoft Access - for the main database;
· PRIMER 5 [Plymouth Routines In Marine Environmental Research] - a versatile multivariate
analysis package from the United Kingdom enabling convenient multivariate analysis of the
port environmental data; and
· ESRI ArcView 3.2 Geographic Information System (GIS) - to graphically display the results
in a convenient, readily interpretable format using port and world maps.
Figure 3. Schematic of the GloBallast BWRA system
The work schedule commenced with project briefing meetings with personnel from all six
Demonstration Sites to arrange logistics and resource needs, during the third meeting of the
GloBallast Programme's Global Task Force, held in Goa, India on 16-18 January 2002 (Appendix 3).
The majority of tasks subsequently undertaken for Mumbai-JNP were completed during two in-
country visits by the consultants (11-15 March and 11-22 November 2002), with information searches
and data collation undertaken by both consultant and pilot country team members between and after
these visits. A two-day `project wrap-up' visit was subsequently made by one of the consultants,
working at the Directorate General of Shipping (DGS) in Mumbai on 19-20 February 2003.
6
3 Methods
The specific tasks of the week-long first visit were to:
· Install and test the Access, ArcView and PRIMER software and the functionality of the
computer system at Mumbai (DGS Offices) and the National Institute of Oceanography
(NIO) at Goa.
· Familiarise the project team with the GloBallast BWRA method by seminar and work-
shopping.
· Visit the MPT and JNPT offices and undertake a tour of the port facilities with the Deputy
Harbour Masters to obtain information on trading patterns and ballasting practises of visiting
ships and improve understanding of the surrounding coastal habitats and marine resources.
· Review available BWRFs and port shipping records to identify trading patterns, vessel types,
key BW source ports and likely destination ports.
· Commence GIS guidance and developing the port map for the Demonstration Site.
· Commence training on the use of the various Graphic User Interfaces (GUI) of the Access
Database for inputting and editing BW discharge data.
· Check available port environmental data and identify potential in-country and regional
sources of same.
· Commence listing risk species and identifying potential in-country or regional sources of
same.
· Identify critical information gaps and the data assembly work required before the second visit.
During the longer second visit by the consultants, the environmental and risk species data were added
to the database, more vessel arrival, BW and voyage data were entered and checked, the first BWRA
was undertaken, and a workshop was held to review the initial results and identify future actions.
During the third visit in February 2003, the consultants supplied the CFP-A with updated versions of
the database and BWRA User Guide on CD-ROM, which included additional source port environment
and risk species data (as obtained from the BWRA Activities conducted at the other five
Demonstration Sites). The results of the March 2003 version, plus subsequent corrections to some of
the vessel visit records and environmental matching assignments (made by the CFP-A in consultation
with URS), are reported here.
Throughout the schedule, the joint project team was divided into three groups to facilitate training and
progress (Appendix 2). Group A was responsible for developing the port map and graphically
displaying results via the GIS. All coastal and marine resources (biological, social/cultural and
commercial) in and around the port that might be impacted by aquatic bio-invasions were mapped
using the ArcView GIS, using specific layers to show the bathymetry, navigation aids, port
infrastructure and tables of the port's de-ballasting/ballasting patterns (including frequencies and
volumes of discharges and uptakes for the berth locations).
Group B was responsible for managing the customised Access database supplied by the consultants,
and for entering, checking and managing the BW data, as collated from the BWRFs submitted by
arriving ships (and/or derived from shipping records for periods or arrivals when BWRFs were not
obtained or incomplete). The Access database was designed for ongoing input and management of
future BWRFs.
The requirement for arriving ships to submit to the relevant port State authority a completed
form that complies with the IMO BWRF (Appendix 1) is a fundamental and essential first basic
step for any port State wishing to commence a BW management programme2.
2 Several port States (e.g. Australia) and Demonstration Sites (e.g. Dalian, Odessa, Sepetiba) have produced
their own BWRFs, the latter using translated formats to permit improved BWRF understanding and
7
Ballast Water Risk Assessment, Ports of Mumbai and Jawaharlal Nehru, India, October 2003: Final Report
Database management was subsequently transferred to the NIO Group C counterparts in Goa, where it
was used to identify source and destination ports, enter the Group C data and perform the first
BWRAs.
Of the three Group B counterparts assigned by the CFP to the BWRA activity, two were the Dock
Masters for the Ports of Mumbai and Jawaharlal Nehru who had very limited available time for
Database instruction, preferring to act as co-ordinators for the supply of port shipping record
information and collected BWRFs. The third Group B counterpart was the GloBallast Programme
CFP-A based at the DGS office in Mumbai, who was assigned the role of entering supplied BWRFs
into the BWRA database. Although it was advised that this would be a heavy work load and there was
a project requirement to train more than single counterparts, no other counterparts were assigned.
Group C was responsible for collating the port environmental and risk species data, undertaking port-
to-port environmental similarity analyses and performing the BWRA. Thirty four environmental
variables were collated for the Demonstration Site and the majority of its source and destination
ports3, including sea water and air temperatures, salinities, seasonal rainfall, tidal regimes and
proximity to a standardised set of intertidal and subtidal habitats. Where water temperature data or
salinity data could not be found for a source or destination port, values were derived for the riverine,
estuarine or coastal location of the port with respect to the temperature and salinity data ranges of its
IUCN marine bioregion, plus ocean maps depicting sea surface temperature/salinity contours at
quarter degree and degree scales (as obtained from CRIMP [now CSIRO Marine Research], URS and
other sources; Appendix 4).
The multivariate analysis of the port environmental data was undertaken using the PRIMER package,
with the similarity values between Mumbai-JNP and its source and destination ports converted into
environmental matching coefficients then added to the database. Species in or near source ports that
were deemed to pose a threat if introduced to the Demonstration Site, together with species at the
Demonstration Site that might be exported to a destination port, were identified from all available
sources found by the project team.
These sources included preliminary results from the Port Biological Baseline Surveys (PBBS; as
recently completed at each Demonstration Site by another GloBallast Activity), plus searches of `on-
line' databases such as those under ongoing development by the Smithsonian Environmental Research
Center (SERC), the Australian Centre for Research on Introduced Marine Pests (CRIMP; now CSIRO
Marine Research), the Baltic Regional Marine Invasions Database and the Global Invasive Species
Programme (GISP) (Appendix 5). The species taxonomic information and bioregional distributions
were also added to the Access database. The combined BW discharge, environmental matching and
risk species coefficients provided the basis of the semi-quantitative risk assessment.
Graphic User Interfaces (GUIs) customised by the consultants for the Access database and ArcView
GIS were used to generate results tables and graphical outputs that were displayed on interactive maps
of the Demonstration Site and World bioregions. The various BWRA outputs can be printed, exported
to other software, or viewed interactively to enhance the user-friendliness and management utility of
the system.
completion by local shipping. Such BWRFs need to include all questions of the IMO standard form. Problems
arising from voluntary submission of BWRFs are described in Section 4.10.
3 The complete set of source and destination ports identified for the six Demonstration Sites (723) remained
unknown until the end of the BWRF/port record data collation, database entry and checking phases (i.e. end
of the second round of in-country visits; 22 December 2002). A gap-filling effort was made by the consultants
to obtain the environmental parameters during January 2003, but this had to focus on the most frequently
recorded of these ports, since there was insufficient time or resources to order charts and search for the
environmental data for all of them (the majority of which were associated with few or only single vessel
arrivals). For these ports, their environmental matching values were provided by a comparison method
described in Section 4.6.
8
3 Methods
The methods used to attain each objective of the BWRA Activity are summarised in the following
sections, with technical details of the risk assessment procedures provided in the GloBallast BWRA
User Guide. This manual was developed by the consultants to facilitate BWRA training and
demonstrations for all six GloBallast Pilot Countries. The BWRA User Guide comprises a separate
document that accompanies this report, and is available from the GloBallast PCU
(http://globallast.imo.org).
3.2 Resource mapping of the demonstration port
The port resources were mapped using ArcView GIS to display the bathymetric, navigational and
infrastructure features, including habitats and social-cultural features. The scope of the Mumbai-JNP
port map includes the open seaway west of Mumbai, the dredged Jawahar Dweep approach channel
and nearby anchorages, and all docks and terminals at Mumbai and JNP. The GIS port map also
extends east and south to include coastal habitats along the Thane and Dharamtar Creeks.
It was confirmed there were no vector-based electronic nautical charts for the Mumbai region. NIO
counterparts therefore generated the baseline bathymetry and navigation layers by digitising salient
details of port infrastructure, navigation channels and anchorages from three nautical charts obtained
by the consultants from a chart agent in Mumbai. These were Admiralty hydrographic charts No.
2621 (1:60,000) covering the greater Mumbai-JNP area, No. 2624 (1:20,000) for the Port of Mumbai,
and No. 2627 (1:20,000) for JNP.
Based on the guidance and instructions left by the consultants during the first visit, NIO cartographers
digitally captured urban infrastructure and social cultural information from these charts, with the
overlapping and more detailed features on the 1:20,000 charts taking precedence, and attribute data
attached to the key graphical objects. Point and pattern symbols developed by NIO for the
navigational features were based on the international IHO/IALA system.
During the consultants second visit, the intertidal habitats delineated from the chart information were
supplemented by subtidal and other habitat information provided by Group C. A berth layer was
added and gap-filling work on the symbol and graphical objects was completed. For clarity and
convenience of data management and display, each `theme' of information was added by NIO as a
separate layer that followed the BWRA project-standard scheme shown in Figure 4.
Figure 4. Thematic layers used for the Port Map GIS
The protocol for the five main layers are described in the BWRA User Guide and summarised below:
Base Layer: The base layer includes important planimetric features such as depth contours, jetties,
important channels and other permanent or at least semi-permanent `reference' features that are
unlikely to change or move. The key features of the base layer for Mumbai-JNP comprised:
9
Ballast Water Risk Assessment, Ports of Mumbai and Jawaharlal Nehru, India, October 2003: Final Report
· Coastlines of the mainland and various islands within greater Mumbai-JNP area (as depicted
by the high tide mark on the nautical charts).
· The low tide mark (i.e. the 0 metre bathymetric contour of hydrographic charts).
· 5 metre isobath (often the first continuous contour below the low tide mark).
· 10 metre, 20 metre and 30 metre isobaths.
· Edges of the main shipping channels (often blue or purple lines showing the boundary of
depths maintained by port dredging programs).
The colour scheme of the base layer followed that of standard nautical charts to maintain the familiar
land/sea depth effect.
Navigational Layer: The standard navigational symbols of the IHO/IALA system were followed as
closely as possible. ArcView's symbol libraries do not contain these international navigation symbols,
and convenient third-party symbology could not be found despite extensive searches of public domain
web resources. Closest-match point and pattern symbols were therefore developed for this purpose,
using the UK Hydrographic Office Chart No. 5011 (= IHO INT 1) as the source.
Habitat Layer: This layer used a standardised, logical colour scheme to facilitate recognition of the
main intertidal and subtidal habitat types in and near the port. It contains coastal habitat information
assembled by Group C, with some of the natural and artificial habitat boundaries based on notes and
map annotations made by BWRA team members during a port tour undertaken on an MPT launch at
the beginning of the second visit in November 2002. Delineation of some intertidal and subtidal
habitat boundaries was supplemented from seafloor and coastal features displayed on the
hydrographic charts described above. These included the intertidal mud flats, sand beaches and rocky
shorelines, plus symbols denoting the presence of sand, mud or rocky substrate
Infrastructure Layer: This shows the urban and developed land areas near the port, including major
and minor roads and railway lines.
Social-Cultural Layer: Social-cultural features include sites or boundaries of recognised coastal
reserves, wildlife conservation areas, fishery areas and/or aquaculture sites, including any recognised
recreational fishing sites. Coastal or marine sites of cultural, heritage or archaeological significance,
such as an important temple or historic shipwreck site, form part of this layer.
Berth Layer: An `active' berth layer was added to show the principal berthing and anchoring areas at
Mumbai-JNP. Their names and numbering system were based on information in MPT and JNPT
publications obtained by Group B. The same nomenclature was also used for the berthing area
information stored in the Access database, to allow display of statistical summaries of the BW source
and discharge data on the correct locations of the GIS port map (the GloBallast BWRA User Guide
shows how the database-GIS link is established).
3.3 De-ballasting/ballasting
patterns
The deballasting/ballasting patterns at Mumbai-JNP are very complex owing to the number and
geographic spread of the various docks, terminals and offshore cargo-transfer points, and the wide
range of domestic and overseas vessel types using the port. Port trade and ballasting/deballasting
activities were discussed during consultant/counterpart meetings at DGS (11 March and 14 November
2002), the port tour (12 March 2002) and at JNPT (12-13 November 2002). Pilotage rules, draft
requirements, container barging and cargo-transfer activities in the anchorage areas were also
discussed during these meetings.
10
3 Methods
Further information was gleaned from spreadsheet records of non-standard BWRFs that MPT and
JNPT had commenced using on a voluntary basis in August 20004, plus analysis of available BWRFs
and port shipping records held at JNPT and the spreadsheet records obtained for the MPT, Pir Pau and
Butcher Island terminals. This work was undertaken during and after both the first and second visits to
improve the database visit record size and reliability, and to check, gap-fill, modify or remove
incomplete, absent or illogical database entries for BWRFs that had not been archived and were
therefore unavailable.
For the terminals dedicated to importing crude, exporting refined products and importing chemical
liquids it was relatively simple to check (or identify) what BW discharge or uptake volumes were
occurring, although BW sources for many visits remained unclear (records using the Last Port of Call
instead of specifically reported BW source port/s can be misleading). In the case of the container,
break-bulk, Ro-Ro and general cargo trade, the majority of vessels involved were either part
discharging cargo, part loading cargo or a combination of both, and thus it was not possible to
determine specific sources and volumes of discharged BW unless reasonably complete BWRFs were
available (Section 3.1).
3.4 Identification of source ports
To provide confidence as to which ports were predominant sources of BW discharged at Mumbai-
JNP, over 3000 vessel visit records spanning arrivals from January 2000 to July 2002 were collated
from three main sources and added to the Access database. These sources were:
(a) Excel spreadsheet records developed at DGS that contained vessel visit and BW entries
estimated from port shipping records for January-August 2000, plus records of BWRFs
collected on a voluntarily basis from August 2000 to December 2001 by MPT (226 records)
and JNPT (1832 records);
(b) 965 records from part-archived BWRFs, as entered by CFP-A into various `monthly'
databases between the consultants first and second visits and by Group B members during and
after the second visit;
(c) additional spreadsheets of port records containing 558 tanker visits between April 2001 and
March 2002, as obtained for the Pir Pau and Butcher Point terminals from MPT's Planning &
Research Department during the consultants second visit.
A total of 3581 visit records and details for 1018 vessels had therefore been entered into the final
database by the time of the consultants wrap-up visit in February 2003. For vessel visits recorded
before BWRFs were collected, or which had submitted incomplete or no form following the generally
port-wide introduction of BWRFs in August 2000, gap-filling details were sought from port shipping
records. However these records show only the Last Port of Call, which may not be the BW source. To
identify which last ports of call were probable BW sources, cross-checks were made of source ports
and last ports of call reported in other BWRFs by the same or similar types of vessel using the same
terminal.
The Lloyds Fairplay Port Guide and Lloyds Ship Register5 were also used to help confirm source port
trade and to check or add the name, IMO number, type and DWT of arriving ships respectively.
Before any new port was added to the database, the port and country name spelling, its location
coordinates, bioregion and unique UN Port Code number were checked using the Lloyds Fairplay
World Ports Guide and world bioregion list in the database (port data input is detailed in the
GloBallast BWRA User Guide).
4 These spreadsheet records listed basic vessel visit information, including vessel name, arrival and departure dates, last and
next ports of call, and total reported BW discharge or uptake only. The particular visit berth or terminal was not recorded.
5 A CD-ROM version of the 2001 Lloyds Ship Register was supplied to each Demonstration Site by PCU. These are much
faster to use than the large `directory style' hard-copy volumes.
11
Ballast Water Risk Assessment, Ports of Mumbai and Jawaharlal Nehru, India, October 2003: Final Report
Gaps in the 2000-2001 spreadsheets, entered BWRF records and the additional Pir Pau/Butcher Island
records supplied by MPT were therefore filled by checking, for each arrival, its name, type and DWT,
its last port/s of call and apparent charter/liner trade, and by using a customised Excel spreadsheet
supplied by the consultants to estimate the amount BW discharged or taken up6 (Figure 5). This was
not possible for the majority of vessels arriving at the break-bulk and general cargo berths in the MPT
docks or transferring cargo between vessels or barges in the `bunders' (MPTs anchorages), with the
number of sufficiently completed BWRFs enabling a database record restricted to 531.
These record checking and gap-filling exercises were undertaken by the consultants in July and
October 2002 (in Australia), in November 2002 (by Group B and C members during the second visit),
and in January 2003 (before the wrap-up visit). In summary, the present (February 2003) database for
Mumbai-JNP was constructed by:
· entering visit details from the spreadsheets, port shipping records and BWRFs, using the
Fairplay Port Guide and Lloyds Ship Register to add or correct port details, vessel name,
IMO number, type and DWT; plus
· cross-checking unusual or incomplete entries using port shipping records (for JNPT visits
only), plus the Lloyds Ship Register, Fairplay Port Guide and the customised Excel
spreadsheet to correct illogical or missing BW discharges, sources or dates.
Figure 5. Working page of the Excel spreadsheet used to estimate BW discharges
3.5 Identification of destination ports
Since `prevention is better than cure', it is usually most effective to address environmental problems
as close to their source as possible. In the case of ballast-mediated aquatic bio-invasions, actions
helping prevent ships taking up harmful organisms from ballasting areas may be more effective than
trying to treat the organisms once they are inside the tanks, or trying to manage the problem at the
discharge port. To date, however, the majority of actions addressing ballast-mediated introductions
have been driven and undertaken by ports and port States that receive BW, with little activity
occurring at the locations of BW uptake. The GloBallast programme has therefore been attempting to
shift some of the focus from shipboard/point-of-discharge measures towards reducing the uptake of
organisms in the first place.
Knowing the destinations where departing vessels will discharge BW is an important step in helping
port States to reduce the spread of unwanted and potentially harmful species (either introduced or
native to their own ports) to their trading partners. It is also critical for preventing unwanted species
6 The BW spreadsheet contains coefficients of ballast water taken up or discharged when loading or discharging
cargo (as percentages of DWT for each vessel type), based on ballast water capacity and discharge data from
other studies, BWRFs and Lloyds Ship Register.
12
3 Methods
translocations between a State's domestic ports and/or its neighbouring foreign ports. Determining the
destinations of BW exported from the Demonstration Site was therefore an objective of the GloBallast
BWRA (Section 2).
Both the BWRFs and port shipping records for Mumbai-JNP list the Next Port of Call of all departing
vessels, and these were added to the database for analysis. However the next port of call may not be
where BW carried by a departing ship is discharged, either fully or partly. For example, the next port
may be a bunkering, crew-change or maintenance port, a port where a `top-up' or other minor cargo is
loaded, or a convenient `hub' port where ships anchor and wait for new sailing instructions. A
problem specific to the Mumbai-JNP Demonstration Site stemmed from not uncommon movements
of container vessels, general cargo ships and bulk carriers between these two ports, and hence the
declaration of either Mumbai or JNP as being the `Next' or `Last' port of call on their BWRFs
collected by MPT or JNPT. Since the Database treats Mumbai-JNP as a single port (allocated to the
UN Port Code INBOM), such records did not provide any clue as to BW sources or destinations. This
problem was solvable for arrivals to JNP owing to the accessibility of its computerised port shipping
records, unlike the case for Mumbai where less sophisticated, paper reliant record systems provided
no ready `look-up' capabilities (Section 4.3).
To overcome this problem, a supplementary question needs to be added to the present IMO BWRF,
i.e. requesting the name of the port where discharge from each ballast tank is predicted. These ports
can be predicted by ships engaged on a regular liner service (e.g. most container ships, vehicle
carriers, Ro-Ro ships, LNG carriers and some bulk carriers). However for other ship types (and
occasionally the former) ship officers cannot reliably anticipate where BW discharges will be
necessary. For example, for bulk carriers, general cargo ships and tankers engaged in spot charter
work (or when completing a charter period), these vessels may often depart in ballast having a
received a general sailing order to proceed towards a strategic location until further instructions.
In the case of Mumbai-JNP, there is considerable importation of coal, iron ore, timber and other raw
commodities requiring visiting general cargo ships and bulk carriers to uplift ballast water whilst
unloading to maintain trim, stability and in some cases air draft (i.e. space between the hatch
coamings and gantries). The next ports of call were therefore added to the vessel visit data and
examined, so that the Pilot Country team could gain experience and appreciate the problem of
identifying ballast water destinations.
Adding the next port of call also improves the trading history for each vessel, and these can be useful
when trouble-shooting missing or incorrect BWRF data. As with the source ports, any new next port
of call added to the database was provided with its country name, UN Port Code, world bioregion and
location coordinates to enable its frequency of use by departing vessels to be displayed on the GIS
world map (port input details are in the GloBallast BWRA User Guide).
3.6 BWRF
database
The Access database developed by the consultants manages all items on the IMO standard BWRF.
Entry, editing and management of the BWRF records are undertaken using a series of GUIs, as
described in Section 2 of the BWRA User Guide. The three `tab' pages of the GUI used for general
BWRF data and the individual ballast tank inputs are shown in Figure 6.
Items not listed on the BWRF but required by the database to run the risk analysis and display the
results on the GIS include the geographic coordinates, bioregion and UN code (a unique five letter
identifier) of every source and destination port, plus the DWT and berthing location of every arrival at
the Demonstration Site.
Many berthing locations had to be identified from the port shipping records because the BWRA
objectives include identifying the locations within a Demonstration Site where deballasting/ballasting
occurs (Section 2). This was not insurmountable at JNP owing to the discreteness of its berthing
13
Ballast Water Risk Assessment, Ports of Mumbai and Jawaharlal Nehru, India, October 2003: Final Report
terminals and usually the existence of a berth record for recorded BWRFs. In the case of MPT's three
docks, however, visit records did not distinguish individual berths or docks and there was no
accessible information allowing convenient separation (Section 4.3).
Another item frequently requiring look-up was the vessel's deadweight tonnage (DWT) since the
BWRF requests only the gross tonnage (GT). As noted in Section 3.4, adding the DWT (present in the
Lloyds Ship Register) enables convenient checks of reported volumes and gap-filling of missing
values (see below).
Not all of the BWRF question fields need to be completed by a ship's officer to provide a visit record
that can be saved to the database and later included in the risk analysis. A basic visit record can be
established if three key items are entered. These are outlined in red on the input GUIs (Figure 6) and
are:
· Vessel identification - a unique 7 digit IMO number that remains the same for the life of the
ship, irrespective of any name changes;
· Arrival date; and
· A ballast tank code (which appears on the `Add Tank' sheet and provides an `All Tanks'
option for BWRFs that were submitted without individual tank details).
Without these items the database cannot save a vessel visit / tank record or any other associated
information. Whether or not a saved record is included by the database for the risk analysis depends
on which other BWRF fields were completed or gap-filled. Key items are the source port and volume
for each (or all) ballast tanks discharged, and the berthing location. As described in Sections 3.4 and
3.5, important BWRF information that is missing or incorrect can usually be substituted or corrected
by cross-checking with port shipping records, the Lloyds Ship Register and a comprehensive port
directory such as the Fairplay guide. However this is very time-consuming and, if there are no
convenient `look-up' features offered by the port's shipping record system, impractical. It is far more
efficient and reliable for port officers to ensure the BWRF has been filled in correctly and completely
at the time of submission, and to annotate the berth on this form prior to its dispatch to record
keepers/database entry (Section 4.10).
The Access database contains reference tables to hold the checked details of every vessel and port
previously added. A new visit record is therefore made by entering the arrival date then using a series
of drop-down lists to select the vessel, source port, last port, next port, destination port and tank
details (Figure 6). This avoids the need to re-enter the same information over and over again, as well
as the risk of generating false, `replicate' vessel, port or tank names due to spelling mistakes on the
BWRF.
Spelling mistakes on BWRFs were very common. All data-entry and database managers therefore
need to understand how to avoid transcribing such errors by carefully checking all names and ID
numbers using the database drop-down lists and, where necessary, by referring to a reliable ship
registry or port directory when entering the details of a new vessel or port respectively.
The most easily-trained and efficient database operators are those with previous port and maritime
experience since they (a) bring knowledge of the local shipping trade, (b) are familiar with the
problems of searching for vessel names (e.g. Tokyo Maru 2, Tokyo Maru II , Tokyo Maru No. 11 etc),
and (c) are aware that the official name of many ports in Europe, Africa and South America may be
quite different from the English name (e.g. Vlissingen versus Flushing).
14
3 Methods
Figure 6. The three tabs of the GUI used for entering the BWRF data
3.7
Environmental parameters
During the briefing meetings in January 2002, the consultants provided a preliminary list of
environmental parameters that would be used to generate the environmental matching coefficients
between the Demonstration Sites and their main BW source ports and destination ports (Appendix 3).
15
Ballast Water Risk Assessment, Ports of Mumbai and Jawaharlal Nehru, India, October 2003: Final Report
The provisional list was based on review of previous port-to-port environmental analyses undertaken
for twelve trading ports in northeast Australia (Hilliard et al. 1997b). The final list of 34 parameters
used for the six Pilot Countries (Table 1) was selected in February 2002, during a joint review of the
provisional list by the consultants and scientists of the Institute of Biology of the Southern Seas
(IBSS) in Odessa7.
Table 1. Port environmental parameters used by the Environmental Similarity Analysis
Name
Variable Type
1.
Port type8
Categorical (1-6)
2.
Mean water temperature during warmest season (oC)
Scalable
3.
Maximum water temperature at warmest time of year (oC)
"
4.
Mean water temperature during coolest season (oC)
"
5.
Minimum water temperature at coolest time of year (oC)
"
6.
Mean day-time air temperature recorded in warmest season (oC)
"
7.
Maximum day-time air temperature recorded in warmest season (oC)
"
8.
Mean night-time air temperature recorded in coolest season(oC)
"
9.
Minimum night-time air temperature recorded in coolest season (oC)
"
10.
Mean water salinity during wettest period of the year (ppt)
"
11.
Lowest water salinity at wettest time of the year (ppt)
"
12.
Mean water salinity during driest period of year (ppt).
"
13.
Maximum water salinity at driest time of year (ppt).
"
14.
Mean spring tidal range (metres)
"
15.
Mean neap tidal Range (metres)
"
16.
Total rainfall during driest 6 months (millimetres)
"
17.
Total rainfall during wettest 6 months (millimetres)
"
18.
Fewest months accounting for 75% of total annual rainfall
Integer
19.
Distance to nearest river mouth (kilometres; negative value if upstream)
Scalable
20.
Catchment size of nearest river with significant flow (square kilometres)
"
Logarithmic distance categories (0-5): From the closest BW discharge location to nearest:
21.
Smooth artificial wall
Categorical
22.
Rocky artificial wall
"
23.
Wooden pilings
"
24.
High tide salt marsh/lagoon, saline flats or sabkah
"
25.
Sand beach
"
26.
Shingle, stony or cobble beach
"
27.
Low tide mud flat
"
28.
Mangrove fringe/mangrove forest
"
29.
Natural rocky shore or cliff
"
30.
Subtidal firm sandy sediments
"
31.
Subtidal soft muddy sediments
"
32.
Seagrass meadow9
"
33.
Rocky reef or pavement
"
34.
Coral reef (with carbonate framework)
"
The 34 parameters were steadily collated during course of BWRA activities for all Demonstration
Sites. They were taken or derived from data and information culled from a wide range of government,
port and scientific publications, internet web sites, port survey reports and sampling records, SST and
salinity charts, climate databases, atlases, national tide-tables, nautical charts, coastal sensitivity and
oil spill habitat maps, oil spill contingency plans, aerial photographs, national habitat databases and
local expert advice (Appendix 4). The most difficult to find were reliable water temperature and
7 Distance categories from the berthing area/s to the nearest rocky artificial wall, smooth artificial wall and
wooden artificial substrate were suggested by IBSS as they provide different types of hard port habitat.
8 Offshore terminal or mooring / Natural bay / Breakwater harbour / Tidal creek / Estuary / River port.
9 Kelp forest/macroalgae bank was not included but should be considered for future analysis.
16
3 Methods
salinity data, particularly for identifying the averages, maxima and minima for ports in or near
estuaries (Section 3.12).
A preliminary list of frequently recorded BW source ports and destination ports for Mumbai-JNP was
made at the end of the first in-country visit in April 2002 (the complete list did not become available
until near the end of the second in-country visit; Section 3.1). It was agreed that the environmental
parameters for these ports should be sought between the first and second consultants' visits, with the
Group C counterparts focussing on important ports in India and the consultants focussing on more
distant ports in Asia, Middle East and Europe. To facilitate this task the consultants provided a
customised Excel spreadsheet for collating the environmental data, which included guidance and
reminder notes plus a format enabling direct export to PRIMER (Section 3.8).
Near the end of the second in-country visit, sufficient port environmental data had been collated to
generate environmental matching coefficients for approximately 35% of all ports identified as trading
with Mumbai-JNP, with estimates provided for ports where unobtained/incomplete data would have
prevented their inclusion in the multivariate similarity analysis (Section 4.6). The percentage of ports
with calculated environmental coefficients was subsequently expanded by a gap-filling exercise
undertaken by the consultants between 22 December 2002 and 31 January 2003. These were added to
the updated BWRA provided at the third meeting in February 2003 (Section 3.1) and reported here.
3.8 Environmental similarity analysis
The more a BW receival port is environmentally similar to a BW source port, the greater the chance
that organisms discharged with the imported BW can tolerate their new environment and maintain
sufficient numbers to grow, reproduce and develop a viable population. Comparing port-to-port
environmental similarities therefore provides a relative measure of the risk of organism survival,
establishment and potential spread. This is the basis of the `environmental matching' method, and it
facilitates estimating the risk of BW introductions when the range and types of potentially harmful
species that could be introduced from a particular source port or its bioregion are poorly known.
A limitation of the environmental matching approach is that several harmful species appear capable of
tolerating relatively wide temperature and salinity regimes10.As discussed, other risk factors include
the frequency of ship visits/BW discharges, the volume of BW discharged, voyage times and ballast
tank size and any management measures applied during the voyage. While environmental matching
alone does not provide a complete measure of risk, an analysis of `real world' invasions indicates that
if any one factor is to be used alone, environmental matching is probably the best single indicator of
risk.
Classic examples include the two-way transfer and relatively rapid spread of harmful and other
unwanted species between the Ponto-Caspian and North American watersheds (some via stepping
stones in western Europe, and northern Australian ports that have extremely high risk factors in terms
of frequency and volumes of BW discharges (the very large bulk export ports of Port Headland,
Dampier and Hay Point and smaller bulk export ports like Weipa and Abbot Point), but which have
not experienced any significant harmful invasions (due to a low environmental matching with their
source ports). Conversely, in southern Australia and in particular Tasmania, ports which have
relatively low risk factors in terms of frequency and volumes of BW discharges, have been the entry
points of the most harmful aquatic bio-invasions (due to a high environmental matching with their
source ports).
The environmental distances between Mumbai-JNP and its source and destination ports were
determined using a multivariate method in the PRIMER package. Of the various distance measures
available in PRIMER, the normalised Euclidean distance is the most appropriate. Normalisation of the
various input parameters removes the problem of scale differences, and the method can manage a mix
10 For example, the Asian date mussel (Musculista senhousia) has been reported from Vladivostok to Singapore.
17
Ballast Water Risk Assessment, Ports of Mumbai and Jawaharlal Nehru, India, October 2003: Final Report
of scalable, integer and even categorical values, provided the latter reflect a logical sequence of
intensity or distance/location steps. Individual variables cannot be weighted but the predominance of
temperature variables (8) and salinity/salinity-related parameters (also 8; see Table 1) ensured they
exert a strong influence on the results. Air temperature extrema, rainfall and tidal parameters were
included owing to their influence on the survivorship of intertidal and shallow subtidal organisms11.
The similarity values produced by PRIMER were examined using its clustering and ordination
modules, then exported back to the Excel file for conversion into environmental matching coefficients
before insertion into the database12.
To provide consistent and comparable results, the similarity analysis was conducted on a wide
geographical range of ports; i.e. from cold water ports in high latitude areas to warm water ports in
tropical regions, as well as from up-river terminals to those located in relatively exposed offshore
waters. This avoids the possibility of generating spurious patterns among a set of ports located in
neighbouring and/or relatively similar regions. Collating the environmental parameters for the
frequent source and destination ports of all six Demonstration Sites into a single Excel spreadsheet
achieved this, as well as permitting direct comparisons between the results from these sites13.
The Excel file used for collating the port environmental data also contains linked spreadsheets used
for their export to PRIMER, as well as for re-importing the results and converting them into
environmental matching coefficients. In fact the database can import any type of environment
matching value obtained by any method, provided the values are placed in an Excel spreadsheet in the
format expected by the database's import feature. Details on the treatment of the environmental
variables and the production, checking, conversion and import of the similarity measures are given in
the BWRA User Guide.
3.9 Risk
species
One of the BWRA objectives was to identify `high-risk' species that may be transferred to and/or
from the Demonstration Sites (Section 2). The Access database was therefore provided with tables for
storing the names, distribution and other information on risk species. For the purposes of the BWRA
and its `first-pass' risk assessment, a risk species was considered to be any introduced, cryptogenic or
native species that might pose a threat if transferred from a source port to a Demonstration Site. The
taxonomic details, bioregion distribution, native/introduced status and level of threat assigned to a
species are also stored in the database and can be displayed for review, edit and update.
The database manages the bioregional locations and status of each entered species using the same
bioregions displayed on the GIS world map (Figures 7, 8). This map is used as a backdrop for
displaying the source and destination ports and associated BWRA results, and was compiled from a
bioregion map provided by the Australian Centre for Research on Introduced marine Pests (CRIMP).
The boundaries of some bioregions were subsequently modified according to advice provided by
Group C marine scientists in five of the six the Pilot Countries, with careful review of the South Asian
boundaries by NIO scientists confirming that no change was necessary for its coastal regions
(Figure 7). However the modifications included adding new bioregions for several large river systems
to accommodate some important river ports that trade with one or more of the Demonstration Sites. In
the case of India, the upstream port of Calcutta may merit inclusion in a bioregion comprising the
11 While ecosystem disturbance, pollution, eutrophication and other impacts on habitats and water quality can
increase the `invasibility' of port environments (particularly for r-selected species), these were not included
owing to the problem of obtaining reliable measures of their spatial extent and temporal nature at each port.
12 As described in the BWRA User Guide, a simple proportional conversion of the similarity values was made
so that each matching coefficient lay between 1 (a perfect environmental match) and 0.01 (least matching),
since it is unsafe to assume a port environment can be totally hostile no matter how distant.
13 The total number of ports with a complete set of environmental parameters obtained by the end of the data
collation phase was 357. These were provided to all Demonstration Sites during the third consultant's visit
in February-March 2003 and used for this report.
18
3 Methods
Ganges delta, although these brackish waters annually occupy a large portion of the upper Bay of
Bengal (CIO-III bioregion) during the summer monsoon (Figure 7).
The map presently displays 204 discrete bioregions which are coded in similar fashion as those in the
IUCN scheme of marine bioregions from which they were derived (Kelleher et al. 1995; see
Appendix 3 of the GloBallast BWRA User Guide for details). Bioregions serve multiple purposes and
are required for several reasons. Many marine regions of the world remain poorly surveyed and have a
limited marine taxonomy literature. This causes a patchy and essentially artificial distribution of
recorded marine species distributions. Few marine species surveys have been undertaken in port
environments and there are very few bioregions which contain more than one port that has undertaken
a PBBS.
Bioregions represent environmentally similar geographic areas. Thus if a species is found established
in one part of a bioregion, there is a good chance it can spread via natural or human-mediated
processes to other sites in the same bioregion. A conservative approach was therefore adopted for the
GloBallast BWRA, whereby a risk species, if recorded in at least one location of a bioregion, is
assumed potentially present at all source ports within the same bioregion. This type of approach will
remain necessary until a lot more PBBSs are conducted and published. Because taxonomic analyses
of the PBBS samples of the Demonstration Sites had not been completed by the consultants second
visits, the reverse stance was adopted for these ports (i.e. it was assumed they did not contain any risk
species recorded at other location/s in their bioregion).
The corresponding set of bioregions stored in the database has particular sets of risk species assigned
to them. The species and associated data added to the database over the course of the Activity were
collated from a wide range of sources. These included preliminary lists of organisms found by the
recent GloBallast PBBS of Mumbai-JNP (which became available during the second consultants
visit). Counterpart and URS members of Group C also investigated the possible existence of
introduced species lists held by marine biologists at institutions and agencies in the South Asian
region, but none were found.
Figure 7. Part of the GIS world map of marine bioregions, showing the code names of those in the South Asian
region
19
Ballast Water Risk Assessment, Ports of Mumbai and Jawaharlal Nehru, India, October 2003: Final Report
Figure 8. Complete GIS world map showing the marine bioregions
[to improve clarity, not all bioregion codes are shown in this example]
20
3 Methods
Sources used for developing the risk species database are listed in Appendix 5 and included a range of
literature plus international and regional internet databases, including those being developed by the
Smithsonian Environmental Research Center's (SERC) National Estuarine & Marine Invasive Species
Information System (NEMISIS), CSIRO's National Introduced Marine Pests Information System
(NIMPIS), the Global Invasive Species Programme's (GISP) Global Invasive Species Database, and
the Baltic, Nordic and Gulf of Mexico web sites. The database used for the `first-pass' risk
assessments and provided to the Demonstration Sites during the consultants last visit (February 2003)
contains 421 species but these do not represent a complete or definitive global list. Thus the database
tables and their associated Excel reference file represent a working source and convenient utility of
risk species information that can be readily updated and improved.
To provide a measure of the risk species threat posed by each source port, the database analyses the
status of each species assigned to each bioregion and generates a set of coefficients that are added to
the project-standard calculation of relative overall risk (Section 3.10). The following description is
summarised from Section 6 of the GloBallast BWRA User Guide, which describes how the species
data are managed and used by the BWRA system.
The database allows each species to be assigned to one of three levels of threat, with each level
weighted in log rhythmic fashion as follows:
· Lowest threat level: This is assigned to species with no special status other than their
reported or strongly suspected introduction by BW and/or hull fouling14 in at least one
bioregion (i.e. population/s with demonstrated genetic ability to survive transfer and establish
in regions beyond their native range). A fixed weighting (1) is applied to each of these species
when present in bioregions outside their native range. This was also the default level assigned
to any new species when first added to the database.
· Intermediate threat level: This level is assigned to any species suspected to be a harmful
species or invasive pest. Risk species assigned to this level receive a default weighting value
of 3 in both their native and introduced bioregions.
· Highest threat level: This level is assigned to known harmful invasive species, as reported in
institutional or government lists of aquatic nuisance species and pests, and/or in peer-
reviewed scientific journals. The default weighting value applied to these species is 10.
The database allows users to change the threat status level assigned to each species, as well as the size
of the second and third level default weighting values. A third type of risk species weighting option is
also available. This can be used to proportionally increase the weight of all source port threat
coefficients by increasing its default value of 1. The four default values (1, 3, 10 and 1) provided a
`project standard' result to permit unbiased comparisons between the `first-pass' BWRA results for
each Demonstration Site.
The database calculated the coefficient of `risk species threat' posed by each source port, with each
port value representing a proportion of the total risk species threat. The latter was the sum of all
weighted risk species assigned to the bioregion of all source ports that export BW to the
Demonstration Site. Species assigned to more than one bioregion are summed only once, and the
algorhythm automatically discounted any species that was native in the Demonstration Site's
bioregion. It included any introduced species assigned to the bioregion of the Demonstration Site
14 At the outset of the project, species capable of transfer only by ballast water were planned to be added to
the database. However many species may be introduced by hull fouling as well as BW, with the principal
vector for many of these remaining unclear. Group C scientists in all Pilot Countries were unanimous in
their preference for including all species introduced by ballast water and/or hull fouling in the project
standard BWRA database. For future BWRAs a `vector status' value could be assigned to each species in
the database, so that risk assessments could be focussed on either or both of these shipping-mediated
vectors.
21
Ballast Water Risk Assessment, Ports of Mumbai and Jawaharlal Nehru, India, October 2003: Final Report
since, as discussed above, the Demonstration Site was assumed to be free of risk species. This was the
default position of the project-standard BWRA15.
The risk species coefficient for each source port is therefore calculated by firstly summing the number
of non-indigenous species (NIS) in that port's bioregion which have no suspected or known harmful
status. This provides a measure of the low level `weedy' and sometimes cosmopolitan species which,
although having no acknowledged harmful status, have proven transfer credentials that could enable
their establishment in another port with probably low but nevertheless unpredictable biological or
economic consequences. This number is then added to the sums of suspected and known harmful
species in the same bioregion (these include any native species identified as such by Group C local
scientists). The default calculation for the risk species coefficient for each source port (C) is thus:
CSource Port = (NIS + [Suspected Harmfuls x 3] + [Known Harmfuls x 10] ) / Total SumAll Source Ports
The C values lie between 0-1 and represent an objective measure of the relative total species threat,
since the only subjective components within the project standard BWRA database were the
`universal' assignments of species to particular levels of threat, plus the weightings attached to these
levels. Note that the C values for source ports inside the same bioregion will be the same, and that the
Total Sum divisor does not represent all species in the database, but only those assigned to bioregions
containing source port/s that actually trade with the Demonstration Site. It should also be noted there
are several limitations from incorporating a risk species coefficient into the default calculation of the
`first-pass' BWRAs. These included:
· Use of an incomplete list of species that were assigned to one of the three levels of threat
(introductions, suspected harmful species, known invaders).
· Significant knowledge gaps on the global distribution of many native, cryptogenic and
introduced species (as a consequence of the limited number of species surveys that remain
geographically biased to parts of North America, Europe and Australian/New Zealand).
· Gaps and constraints in the taxonomy and reliable identifications for many aquatic species
groups.
Such limitations must be taken into account when considering the weighting of the risk species
coefficient relative to the other risk factors such as environmental matching.
3.10 Risk assessment
Approach
The database employed the BW discharge, port environmental matching and bioregion species
distribution/threat data to calculate, as objectively as possible, the relative risk of a harmful species
introduction to a Demonstration Site, as posed by discharges of BW and associated organisms that
had been ballasted at each of its identified source ports. A GUI enabling convenient alteration of the
risk calculations and weighting values (Figure 9), plus use of ArcView to geographically the display
results, improves the system's value as an exploratory utility and demonstration tool.
The semi-quantitative method aims to identify the riskiest tank discharges with respect to a
Demonstration Site's present pattern of trade. Unlike a fully quantitative approach, it does not attempt
to predict the specific risk posed by each intended tank discharge of individual vessels, nor the level
of confidence attached to such predictions. However, by helping a Demonstration Site to determine its
riskiest trading routes, exploring the semi-quantitative BWRA provides a coherent method for
identifying which BW sources deserve more vessel monitoring and management efforts than others,
plus the significance of local, regional and distant trading routes and associated vessel types.
15 When the taxonomic identifications of the recent port biological baseline surveys are completed, risk species confirmed
as already present at a Demonstration Site may be identified for the BWRA database maintained for that site. Their
deletion would reduce the size of the risk species coefficients obtained by the `first-pass' BWRA such as reported here,
but the revised database should not be copied for undertaking other port BWRAs.
22
3 Methods
Figure 9. Database GUI used for manipulating the BWRA calculation and weightings
Risk coefficients and risk reduction factors
For each source port, the database used four coefficients of risk (C1-C4) and two risk reduction
factors (R1, R2) to produce a relative overall measure of the risk of a harmful species introduction at
the Demonstration Site. The database GUI shown in Figure 9 can be used to remove one or more of
these components, or alter the way they are treated, from the default `project-standard' formula which
was used for the first-pass BWRA. The four risk coefficients calculated for each source port were:
C1 proportion of the total number of ballast tank discharges made at the Demonstration Site,
C2 proportion of the total volume of BW discharged at the Demonstration Site,
C3 port-to-port environmental similarity, as expressed by the matching coefficient,
C4 source port's contribution to the total risk species threat to the Demonstration Site, as posed
by the contemporary pattern of trade (1999-2002).
In biological terms, C1 and C2 represent the frequency and size of organism `inoculations'
respectively. C3 provides a measure of the likely survivability of these inoculated organisms, and C4
the relative threat posed by the organisms within each inoculation. Each coefficient has values
between 0-1 except C3, where the lowest value was set to 0.01 (it is unsafe to assume a port
environment can be sufficiently hostile to prevent survival/establishment of every transferred
introduced species; Section 3.8).
The two risk reduction factors calculated by the database were R1 (effect of ballast tank size on C2)
and R2 (effect of tank storage time on C4). R1 represents the effect of tank size on the number and
viability of organisms that survive the voyage, since water quality typically deteriorates more rapidly
23
Ballast Water Risk Assessment, Ports of Mumbai and Jawaharlal Nehru, India, October 2003: Final Report
in small tanks than large tanks (owing to the volume/tank wall ratio and other effects such as more
rapid temperature change, with mortality rates generally higher in small tanks). As described below,
no risk reduction was applied to any source port dispatching vessels with tank volumes greater than
1000 tonnes.
R2 represents the effect of tank storage time on the range and viability of discharged organisms.
Survival of most phytoplankton and aerobic biota inside any tank decreases with time, with relatively
high survival rates reported for voyages less than 5 days (as shown below, this was adopted as the cut-
off point for any risk reduction due to in-tank mortality). If the focus is only on long-lived anaerobes,
dinoflagellate cysts or pathogens (all of which have long tank survival rates), then R2 can be deleted
from the BWRA calculation, using the GUI shown in Figure 9 (details are in the GloBallast BWRA
User Guide).
The database calculates the tank storage time by subtracting the reported tank discharge date from the
ballast uptake date. For incomplete BWRFs with missing discharge or uptake dates, the vessel arrival
date plus a standard voyage duration at 14 knots16 were used to estimate the BW uptake date for
adding to the database. The database automatically provides values for R1 and R2 using a log
rhythmic approach17, with the project-standard BWRAs applying the following default (but
adjustable) R1 and R2 risk-reduction weightings to C2 and C4 respectively:
R1
Maximum tank volume discharged (tonnes) in
<100
100-500
500-1000
>1000
the database record for each source port
W4
Default risk-reduction weighting applied to C2
0.4
0.6
0.8
1
R2
Minimum tank storage time (days) in the
<5
5-10
10-20
20-50
>50
database record for each source port
W5
Default risk-reduction weighting applied to C4
1
0.8
0.6
0.4
0.2
Although all information reported in the ballast tank exchange section of the BWRFs was entered into
the database, the `first-pass' BWRA did not use these data to apply a risk reduction factor for each
source port route for the following reasons:
· implementation of the BWRFs at the Demonstration Sites has been relatively recent, and the
tank exchange did not provide a sufficiently consistent or reliable sample of ballast
importation for most sites (Section 3.4);
· BWRF implementation was generally on a voluntary basis, with no formal mechanism
compelling all vessels to submit fully completed forms at Mumbai-JNP;
· insufficient vessel inspection/ tank monitoring data were available for checking claimed
exchanges and their locations (often unrecorded);
· discounting whether or not effective exchange/s were taking place (a) removed the need to
predict the size of the risk reduction, and (b) was precautionary with respect to the ability of
exchanges to remove all organisms taken up at the time of ballasting.
BWRA calculation
As shown in Figure 9 and described in the GloBallast BWRA User Guide, the database GUI allows the
six components of the BWRA calculation and the five weighting factors to be altered from the default,
16 The voyage duration between ports for particular vessel speeds are tabled in many maritime guides and
atlases, such as the Lloyds Maritime Atlas of World Ports and Shipping Places and the 2001 Fairplay Port
Directory.
17 As with the risk species threat level weightings, a log rhythmic approach is appropriate for risk reduction
factors in biological risk assessments.
24
3 Methods
`project-standard' setting. The GUI can therefore be used to explore how particular risk components
and their treatment influence the final result, and also improves the demonstration value of the system.
One example is the way the environmental matching coefficient (C3) is treated by the BWRA
calculation. For scientists who consider that C3 should be treated as an independent coefficient of risk
(see below), then the formula for calculating the relative overall risk (ROR) posed by a source port is:
(1)
ROR = ( C1 + [C2 x R1W4] + C3 + [C4 x R2W5] ) / 4
Equation (1) is the default setting used for the project-standard BWRA for each Demonstration Site.
In this case, ROR is the combined measure of the proportional `inoculation' frequency (C1) and size
(C2), the relative similarity of the source port/Demonstration Site environmental conditions (C3), and
the relative level threat posed by the status of species assigned to the source port's bioregion (C4).
The division by 4 keeps the result in the 0-1 range to allow the convenient expression of the ROR as a
ratio or percentage of the total risk posed by all the source ports.
For those who consider the proportional risk species threat (C4) should provide the focal point of the
risk calculation, they may prefer to treat C3 as a risk reduction factor for influencing the size of C4,
rather than using it as an independent `surrogate' coefficient to help cover unidentified or unknown
species. The GUI allows the formula to be changed to reflect this approach, in which case C3 would
be applied as follows:
(2)
ROR = ( C1 + [C2 x R1W4] + [C3 x C4 x R2W5] ) / 3
[divisor is now 3 because of the reduced number of summed coefficients].
For a source port in a bioregion with a large number of risk species (eg. a relatively high C4 of 0.2)
but with an environment very dissimilar to the Demonstration Site (e.g. C3 = 0.2), then Equation (2)
would reduce C4 to 0.04 (i.e. an 80% reduction). If the minimum tank storage time was relatively
long (e.g. R2 was between 10-20 days for the quickest voyages, so W5 = 0.6), then C4 would be
further reduced to 0.024 (i.e. an 88% reduction to its initial value).
Table 2. Examples showing how Equation (1) provides more conservative outcomes than (2) for typical
situations*
Relative Proportion of Proportion of Enviro-
Relative
Overall
discharge
discharge
mental
Risk species
(*when C1 and C2 are less than 50%)
Risk
Frequency
Volume
matching
threat
ROR
C1
C2
C3
C4
ROR
= [C1 + C2 + C3 + C4] / 4 Equation (1)
0.150
0.1
0.1
0.2
0.2
ROR
= [C1 + C2 + (C3 x C4) ] / 3 Equation (2)
0.080
0.1
0.1
0.2
0.2
ROR
= [C1 + C2 + C3 + C4] / 4 Equation (1)
0.200
0.2
0.2
0.2
0.2
ROR
= [C1 + C2 + (C3 x C4) ] / 3 Equation (2)
0.147
0.2
0.2
0.2
0.2
ROR
= [C1 + C2 + C3 + C4] / 4 Equation (1)
0.350
0.5
0.5
0.2
0.2
ROR
= [C1 + C2 + (C3 x C4) ] / 3 Equation (2)
0.347
0.5
0.5
0.2
0.2
ROR
= [C1 + C2 + C3 + C4] / 4 Equation (1)
0.400
0.6
0.6
0.2
0.2
ROR
= [C1 + C2 + (C3 x C4) ] / 3 Equation (2)
0.413
0.6
0.6
0.2
0.2
ROR
= [C1 + C2 + C3 + C4] / 4 Equation (1)
0.450
0.7
0.7
0.2
0.2
ROR
= [C1 + C2 + (C3 x C4) ] / 3 Equation (2)
0.480
0.7
0.7
0.2
0.2
ROR
= [C1 + C2 + C3 + C4] / 4 Equation (1)
0.550
0.9
0.9
0.2
0.2
ROR
= [C1 + C2 + (C3 x C4) ] / 3 Equation (2)
0.613
0.9
0.9
0.2
0.2
Equation (2) is logical provided the database contains an accurate distribution of appropriately
weighted risk species in the various source port bioregions (including native species considered
potentially harmful if they established in other areas). However Equation (2) is less conservative than
Equation (1), particularly if there are doubts that C4 provides a true picture of potential risk species
threat. As shown in Table 2, Equation (1) produces higher ROR values, unless a single source port
accounts for over 50% of the frequency (C1) and volume (C2) of the total discharges at a
Demonstration Site (this is highly unlikely). The database also allows users to increase the influence
25
Ballast Water Risk Assessment, Ports of Mumbai and Jawaharlal Nehru, India, October 2003: Final Report
of C4 on the ROR by increasing the default value of the overall W3 weighting factor from 1 (but see
the caution in Section 3.10). Increasing the size of C4 has more affect in Equation (1) because C3 has
no direct influence on the size of C4.
Managing and displaying the results
When the database is requested to calculate the BWRA, it generates a large output table that lists all
sources of tank discharges recorded at the Demonstration Site, as entered from the BWRFs and/or
derived from the port's shipping records. The table shows the ROR values plus their component
coefficients and reduction factors. Because the Demonstration Sites have a large number of source
ports (80-160), trends are difficult to see within long columns of tabled values.
The ROR results are therefore further manipulated by the database to provide additional columns
showing:
· the risk category of each source port, as placed in one of five levels of risk for displaying on
the GIS world map;
· a standardised distribution of the ROR results, i.e. from 1 (highest ROR value) to 0 (lowest
value).
The five risk categories are labelled `highest', `high', `moderate', `low' or `lowest', with their
boundaries set at equal linear intervals along the 0-100% scale of cumulative percentage risk (i.e. at
80%, 60%, 40% and 20% intervals). This is the default setting used for the project-standard BWRAs.
The database GUI (Figure 9) allows users to shift one or more of these boundaries to any point on the
scale. For example, a logbased distribution of the five risk categories may be preferred and is easy to
produce using the GUI.
In the case of the standardisation, the database applies the following simple manipulation to expand
the distribution of ROR values to occupy the 0-1 range, where 1 represents the maximum ROR value
and 0 the minimum value:
RORSTANDARDISED = (ROR RORMINIMUM) x 1/ (RORMAXIMUM RORMINIMUM)
This facilitates comparisons between BWRA results from other sites, as well as from different
treatments of the ROR formula and/or the weightings. As with the ArcView GIS, the database was
designed to optimise the user-friendliness, flexibility and management utility of the system.
Rationale for undertaking `Project Standard' BWRAs
The flexibility provided by the database allows users to investigate and demonstrate various
permutations and avenues without requiring specialised knowledge in database construction and
editing. However it was important to apply a consistent, straightforward approach to the `first-pass'
BWRA for each Demonstration Site, so their outcomes could be compared and contrasted to help (a)
evaluate the system and approach, and (b) identify areas where changes could improve future use.
Each Demonstration Site has a particular trade profile and associated pattern of
deballasting/ballasting. Their divergent geographic locations further contributes to their possession of
unique sets of BW source ports which have relatively limited overlap. Thus if results from any two or
more Demonstration Sites are to be compared, all of their shared and non-shared source ports and
bioregions need to be combined for calculating the environmental matching and risk species threat
coefficients.
It was therefore decided that, because the six sites effectively span the globe, the `project-standard'
BWRAs undertaken for each site should use the same global set of source port environment and risk
species data. This ensures the port-to-port similarities and risk species threats were based on the
widest possible range of port conditions and species distributions, thereby reducing the potential for
spurious results resulting from overly narrow regional approaches (Section 3.8).
26
3 Methods
3.11 Training and capacity building
Members of the consultants team worked with their Indian counterparts to provide BWRA guidance,
training, software and associated materials on the following occasions:
Occasion/ Date
Location and
BWA Activity Tasks
Consultants
[working days]
Counterparts*
Activity Kick-Off Presentation, briefing and logistics meetings to:
NIO, Goa.
January 2002
Identify equipment and counterpart requirements
R Hilliard
CFP / CFPAs from
[1.5 days]
Develop provisional pilot country visit schedule
all Pilot Countries
1st Country Visit
Introductory discussions
DGS Mumbai;
March 2002
Install and check computer software
JNP Sheva Is.;
[5 days]
Review BWRFs and identify port record locations
NIO, Goa
Commence training and capacity building at
DGSO
Group A
Commence BWRF database development &
R Healy
counterparts
training
T Hayes
Group B counterparts
Begin GIS mapping of port and resources in NIO
R Hilliard
Group C counterparts
Review port environmental data and sources in
NIO
Seminar on multivariate similarity analysis at NIO
Identify data collation/input tasks before 2nd visit
End of visit logistics meeting at DGSO.
2nd Country Visit
Update Database GUIs, add-ins & make ODBC
DGS Mumbai;
November 2002
links
JNP Sheva Is;
[12 days]
Port tour of Mumbai and JNP provided by MPT-
NIO, Goa.
JNPT
Complete GIS mapping of port and resources at
NIO Collate and enter port shipping records from
JNPT Locate Butcher Point oil terminal shipping
C Clarke
Group A
records.
T Hayes
counterparts
Further BWRF database instruction at DGSO
R Hilliard
Group B counterparts
Continued guidance and capacity building at NIO
Group C counterparts
Port environmental data assembly and input at NIO
Complete environmental similarity analysis
training
Generate environmental matching coefficients at
NIO
Review bioregions and add species data to
database.
Complete NIO training with initial BW risk
analysis
Hold seminar at DGSO to review BWRA activity
and discuss initial results.
Discuss pilot country needs at DGSO for future
BWRA
3rd `Wrap-up'
Provide database containing all port environmental
Visit
and risk species data obtained for the six Demo
DGS Mumbai;
February 2003
Sites
CFP India
[2 days]
Provide updated BWRA User Guide and final
C Clarke
Group B leader
training on BWRA system operation
Group C leader
Review and discuss updated BWRA results.
* refer Appendix 2 for project team structure and counterpart details.
27
Ballast Water Risk Assessment, Ports of Mumbai and Jawaharlal Nehru, India, October 2003: Final Report
At the kick-off meeting in January 2001, CFP/CFPAs were briefed on the nature, objectives and
requirements of the activity. An introductory PowerPoint presentation describing the BWRA system
proposed for achieving the BWRF objectives was made, and logistics meetings with individual Pilot
Countries subsequently held. A project check-list and briefing document were distributed listing the
computer hardware and peripherals required at each Demonstration Site plus the proposed structure of
the joint Pilot Country-consultants project team (see Appendices 2 and 3). Appropriate experience of
Pilot Country counterparts for the three groups forming the team was emphasised during the kick-off
meetings.
During the subsequent in-country visits by the consultants, the main BWRA training and capacity-
building components provided to Pilot Country counterparts were as follows:
· Supply of software licences and User Guide and installation of ESRI ArcView 3.2 and
PRIMER 5.
· Guidance for GIS port mapping of marine resources and habitats.
· Supply of 2001 CD-ROM edition of the Lloyds Ship Register (direct from PCU) and a
customised Excel spreadsheet file for convenient collation of vessel identification and DWT
data and reliable estimation of BW discharges from port shipping records (for the pre-BWRF
period and BWRF checking).
· Guidance, `hands-on' training and assistance with the Access database and BWRF
management18;
· Guidance, `hands-on' training and glossaries of terminology on the collation, checking, gap-
filling and computerisation of BWRFs and principles of database management.
· Guidance and assistance on (a) search, collation and computer entry of environmental data for
important BW source and destination ports, and (b) the terminology, networking, data
collation and management requirements for species information used for the risk species
threat coefficient.
· Tutorial, `hands-on' training and assistance on theory, requirements and mechanics of
multivariate similarity analyses of port and coastal environmental data.
· Tutorial, guidance, `hands-on' training, seminars and PowerPoint material on BWRA
approaches, methods and results evaluation.
· Supply of electronic BWRA User Guide with glossaries and technical appendices.
To promote collaboration, understanding and continuity among the three groups, the consultants
arranged for group counterparts to provide presentations and guidance to other group members during
the 2nd visit. This was achieved for Groups A and C at the NIO offices in Goa during the second visit,
with inter-group presentations involving Pilot Country counterparts in Group B and Group C being
limited to the Seminar held at the end of this visit at the DGS offices in Mumbai.
18 As noted in Section 3.1, there was a lack of Group B counterparts to support the CFP-A (Group B leader) in
Mumbai following the consultants first visit. The consultants therefore provided `distance-support' between
visits for database updates and port shipping record spreadsheet data sent from CFP-A. This resulted in the
consultants receiving thirteen separate databases, each containing different groups of visit records (some
repeated) plus various new and often replicated entries for new vessel details and port names. The vessel,
port, visit record and BW tank records in these individual databases were therefore extracted, sorted,
checked as much as possible without access to shipping records (i.e. ship and port details added/corrected)
and then recombined by the consultants to produce a single, more coherent single database by the start of the
second visit. Visit records from MPT terminals were still insufficient, however, and much port record
checking at JNPT was also required to gap-fill and confirm which records were actually Mumbai or JNP
terminal visits. Much of the Group B consultant's effort in the second visit was therefore diverted towards
record clarification plus sourcing more visit records for Mumbai. Group C also provided support during the
second visit for sourcing visit records for the Butcher Island terminals, and subsequently gap-filling these to
allow database entries.
28
3 Methods
3.12 Identification of information gaps
This was a critical part of the activities undertaken during the first in-country visit by the consultants,
with attention focussed on locating and checking the following BWRA data-input components:
· Completeness of BWRFs submitted by vessels arriving at the Demonstration Site.
· Gaps, legibility and authenticity of information reported in returned BWRFs.
· Sources and availability of port shipping records for BWRF checking and gap-filling.
· Existence of electronic and paper charts, topographic and coastal resource maps, atlases,
aerial photographs and publications for GIS port map.
· Sources, reliability and extent of port environmental data and coastal resource information for
Demonstration Site and its trading ports in the Pilot Country and region.
· Sources and extent of marine species records, information and researchers on introduced
species in and near the Pilot Country.
At the end of the first country visit, the status of the above were reviewed and a list of gap-filling
tasks, as allocated to the Pilot Country groups or consultants and to be undertaken by the second visit,
were agreed upon and minuted. Extensive follow-up database sort-out, expansion and gap-filling tasks
were subsequently conducted before, during and after the consultants second visit.
29
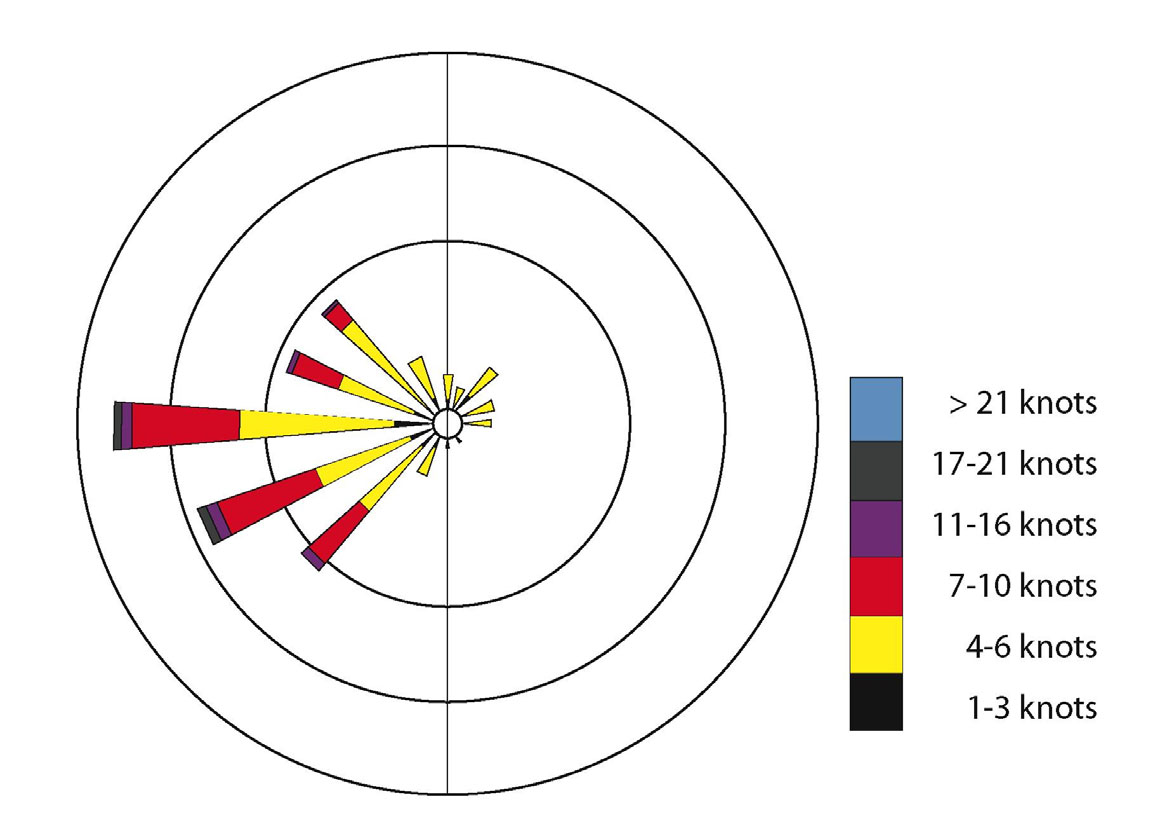
4 Results
4.1 Description of port
General features
The Ports of Mumbai and Jawaharlal Nehru (Mumbai-JNP) are located on the north-west Indian coast
close to 18o 54' N and 72o 49' E (Figures 2, 7, 11). The neighbouring ports are located on either sides
of the wide, long entrance channel to Thane Creek, which encapsulates the greater city area of
Mumbai. This generally narrow and part-mangrove lined tidal channel delineates Mumbai (Bombay)
Island from the mainland, and is linked to various creeks and coastal drainages, including the Amba
River (see Section 4.2 for coastal habitat details).
After entering Mumbai's inshore waters near Colăba Point, ships collect a pilot and follow the
dredged Main Channel (maintained depth ~11.0 m below chart datum) which leads to the short inner
approaches that connect with the various Mumbai and JNP berthing areas (Figure 11). Because of the
relatively large tide range (3.6 m and 1.4 in springs and neaps respectively), vessels up to 12.5 m in
draft may undertake tidally-assisted arrivals or departures.
Climate and weather
The humid tropical climate of the Mumbai-JNP region comprises hot, humid summers with cooler
and drier winters. The summer (south west) monsoon which influences the Mumbai region occurs
during June-September. Day-time temperatures regularly exceed 29oC during summer (typical
maxima to +36oC), while night-time temperatures can fall below 24oC in winter (typical lowest
minima 19oC). Over 75% of the high annual average rainfall (2246 mm) falls during the two months
of the summer monsoon. An annual wind rose showing the dominance of easterly and south-westerly
components of the prevailing winds in the area is shown in Figure 10.
Figure 10. Annual wind rose typical of the Mumbai region
Hydrodynamic conditions
Tidal currents in the port channel areas regularly exceed 3 knots owing to the moderate tidal range,
which is close to 3.6 m during springs and 1.4 m during neaps. Strongest tidal flows follow the
direction of the central channel, i.e. to the east and north-east during the flood tide and to the south-
west and west during the ebb tide. No hydrodynamic modelling study providing a water movement
30
4 Results
plot for Mumbai and JNP could be located by Group A for incorporating or linking to the GIS Port
Map19.
Port facilities and maintenance
The city docks and other terminals on the west and north sides of the navigation channel are managed
by the MPT, while the container, bulk and multi-use berths located on the east side (i.e. on the Nhava
Sheva Islands) are managed by the JNPT. The various Mumbai-JPN approach channels and berthing
areas are maintained by regular dredging, and are shown in Figure 11 and described below. Figure 11
also shows the spoil grounds, port limits and anchorages (frequently used for transhipments), plus
Mumbai's large Naval anchorage and port to the south of the city.
The Port of Mumbai (UN Port Code INBOM) contains the following docks and jetty terminals, as
ordered from north to south (Figure 11):
Pir Pau petrochemical jetties
· Pir Pau old jetty: 1 petrochemicals berth (7.5 m).
· Pir Pau new jetty: 1 petrochemicals berth (12 m).
Butcher Island oil terminals
· Jawahar Dweep: Nos 1-3 products and crude import/export berths (11 - 11.6 m).
· Jawahar Dweep: No. 4 crude oil import and export berth (14.6 m).
City Docks
· Prince's Dock: 8 multi-purpose berths (6 6.4 m).
· Victoria Dock: 14 multi-purpose berths (6 - 6.7 m).
· Indira Dock: 27 multi-purpose, container, grain and heavy-lift berths (8 - 9.2 m).
· Ballard Pier: 1 container berth (10 m) and 1 passenger/cargo berth (10 m).
Transhipment anchorages for barge-ship/ship-ship container and other cargo exports/imports
· Bunders: Various anchorage points on the north side of the Main Channel (7-10 m).
The modern Port of Jawaharlal Nehru (UN Port Code INNSA) was developed at Nhava Sheva and
commissioned in 1989. It has continued to develop rapidly and contains the following facilities and
berths (from north to south):
Transhipment anchorage for barge-ship/ship-ship cargo transfers
(mostly bagged/dry bulk cargo; 11 m)
· Nhava Base: Handles the supply vessels supporting the offshore Bombay High oil fields
(approximately 1800 vessel movements per year)
Container Terminal
· NSICT: 2 berths (13.5 m)
· JNP CT: 3 berths (13.5 m)
19 It is possible one or more useful plots may be present in: V. Abral (1990). Numerical modelling of tidal
circulation and tide induced water level variation in Bombay Harbour. Indian Journal of Marine Sciences 10,
89-94.
31
Ballast Water Risk Assessment, Ports of Mumbai and Jawaharlal Nehru, India, October 2003: Final Report
Bulk terminal
· Ro-Ro/multi-purpose: 1 multi-use berth for Ro-Ro, liquid bulk (incl. naphtha) and general
cargo (13.5 m)
· Dry bulk: 1 dry bulk berth (13.5 m)
· BPCL terminal: 2 chemical berths recently commissioned for liquid bulk cargos (13.5 m)
Mumbai
JNP
Figure 11. Part of the GIS Port Map showing the navigation, infrastructure and active berth layers for the ports of
Mumbai and JNP.
4.2 Resource
mapping
The subtidal seafloor habitats in the Mumbai-JNP region are dominated by soft muddy sediments, and
they are shown on the GIS Port Map (Figure 12). There are no major seagrass, seaweed beds in the
estuarine port area owing to the turbidity, depth and reduced salinities during the seasonal monsoons,
nor any coral reefs in the region. The intertidal habitats comprise the following:
· Artificial rocky walls along the dock breakwaters and bounding various reclaimed,
heightened and stabilised shorelines at JNP and other parts of the Trombay Channel;
· High tidal salt pan areas;
· Rocky and stony shores around some of the islands and points;
· Extensive areas of intertidal muddy shores;
· Mid-to-high tidal fringes of mangrove forest;
· Sand beaches and spits (most developed in Dharamtar Creek to the south-east).
There are no gazetted fishery reserves or wildlife breeding areas in the Mumbai-JNP region, while
artesanal fishing and netting is practised at various informal sites in the area. It was decided not to
show the location of abandoned fish traps as this would be misleading as to current locations of
fishing activity.
32
4 Results
The GIS port map show the locations of the Port Biological Baseline Survey (PBBS) sampling sites
on a separate layer (Figure 11), so that the final results from each site can be readily added from the
final PBBS report. The GIS port map also depicts all the deltaic tidal channels plus the main
navigational and urban/developed features near the port, including railways and roads (Figure 11).
Because of the scale of the map and the extent of the urbanised and other developed areas in the
Mumbai-JNP region, individual features such as post offices, places of worship or radio masts were
not added. The fort and historic Hindu temple on Elephanta Island was added as this remains a
significant pilgrimage site in the greater harbour of Mumbai-JNP. Wreck-sites were also added,
although none could be identified as having significant archaeological or cultural-heritage value.
Figure 12. Part of the GIS Port Map showing the active berth and marine habitat layers.
33
Ballast Water Risk Assessment, Ports of Mumbai and Jawaharlal Nehru, India, October 2003: Final Report
4.3 De-ballasting/ballasting
patterns
During meetings with the MPT and JNPT dock masters in March and November 2002, the
navigational rules and deballasting/ ballasting practises of arriving vessels were discussed. Pilotage is
compulsory, with boarding occurring near the entrance to the Main Channel. Once entering sheltered
water, any cargo-empty vessel arriving during a heavy swell period (most common in the summer
monsoon) is allowed to release any `heavy weather' ballast it may have taken up in the open ocean to
improve stability. However this is rare and probably occurs only for empty products tankers going to
Butcher Island. As in other ports, the port and pilotage rules require all empty ships to retain sufficient
ballast on board to maintain adequate propulsion and steerage control, and to minimise windage until
berthing is completed. Windage is typically most consistent and significant in the June-July
monsoonal season.
It was difficult to establish an overall picture of deballasting/ballasting patterns for Mumbai-JNP
because of the large number terminals, transhipment points and berths, many of which are multi-
purpose (for break-bulk, palleted, bulk grain, metals, scrap, vegetable oil, containers, Ro-Ro and other
cargos), and the difficulty of accessing port shipping records and previously collected BWRFs. For
example, during the first visit it was agreed to source copies of MPT's FoxPro files of its port
shipping records but these were not available, neither were BWRFs that had been previously collected
and entered but unfortunately not archived by DGS.
Many of the general cargo ships, smaller bulk carriers, container vessels and Ro-Ro vessels do not
arrive fully loaded, and with some or all their cargo on board destined for:
· unloading (i.e. possible ballast water uptake),
· retention on board (i.e. vessel arriving to take on more cargo, requiring no or relatively small
releases of BW), or
· both (i.e. transhipment operations that can require some vessels to discharge ballast trim water
during part of the unloading /loading cycle whilst alongside a berth or at anchor in the
bunders).
Thus unless vessels submit a reasonably complete BWRF, it is not possible to estimate how much
BW they may be taking up or releasing owing to the lack of information concerning the amount of
cargo already on board and/or retained on board.
By the end of the consultants first visit it was established that the BWRF records collated until
December 2001 (as forwarded to DGS for spreadsheet consolidation by the CFP-A) had been returned
at a markedly different rates, covering only ~10% of total MPT arrivals and transhipments versus
>90% of JNP berth arrivals (transhipments at JNP are relatively few; typically totalling ~35,000
tonnes per year of bagged and dry bulk commodities such as rock phosphate, ammonium sulphate and
sulphur). The disparity was due to several factors, particularly:
· the types of trade and compactness of the JNP terminals, plus their modern, computerised
management offices located close to the berths20;
· the more spatially dispersed and wider range of domestic, overseas and vessel-transfer trades
managed by MPT, plus its more paper-reliant and distant record keeping and accounting
offices21;
· virtual non-collation of BW records from the MPT Pir Pau and Butcher Island oil terminals.
20 A computerised Control Room Register was maintained at the JNPT offices which inter alia recorded the vessel name,
flag, call sign, agent, GRT, NRT, DWT, dates of arrival/departure, last port, next port, cargo import/export and, since
2001, if the arrival was intending to discharge ballast
21 MPT employs over 20,000 staff across a range of buildings and offices near the port Shipping records include paper
Mumbai HM Arrival (121AR1) and Departure (121DR1) Reports, which between them include the ship name and type,
flag, call sign, agent, GRT, NRT, DWT, last port, cargo type, arrival date, next port, cargo onboard and departure date
(subsequently entered at various stages into FoxPro (DOS), spreadsheets and other systems for generating accounting
records and annual statistics).
34
4 Results
Because of the number of berths and lack of specific berth number information on the MPT records,
main berthing areas managed by the Database and GIS Port Map were therefore consolidated into the
following terminals:
MPT: Docks (i.e. Indira, Victoria and Prince's docks and Ballard Pier); Butcher Island products
terminal; Butcher Island crude oil terminal; Pir Pau terminal (old and new petrochemical
berths).
JNPT: Container berths; Ro-Ro/multi-use berth; Dry bulk berth; Chemical berths.
It was not possible to differentiate which BWRF records might have come from vessels at the MPT
transhipment Bunders versus those in the nearby Docks due to the problem of accessing MPT port
records, although the Group B coordinator for MPT noted that the vast majority of visit records
allocated to the Docks were from such visits.
By the beginning of the February 2003 wrap-up visit, BW statistics could be extracted from the
following 3581 visit records in the Access database which covered the period from 2 January 2000 to
7 July 2002:
MPT Pir Pau terminal:
213 chemical tanker, 219 products tanker, 165 oil tanker, 33 gas
tanker visits (18 April 2000 - 23 June 2002).
MPT Butcher products berth: 75 products tanker visits (15 April 2000 - 13 June 2002).
MPT Butcher crude berth:
42 crude oil tanker visits (25 April 2000 - 21 June 2002).
MPT Docks:
154 general cargo ship, 303 container ship, 60 small bulk carrier,
13 ro-ro visits (15 April 2000 - 13 June 2002).
JNPT Container Terminal:
1576 container ship, 196 general cargo ship and 23 ro-ro/other
visits (1 January - 23 June 2002).
JNPT Dry Bulk Berth:
76 bulk carrier and 12 general cargo ship visits (1 March 2000 - 1
June 2002).
JNPT Ro-Ro (Multi-Use):
103 ro-ro and vehicle carrier visits, with chemical tankers added to
the next berth (1 January 2000 - 1 June 2002).
JNPT Chemical Berths:
315 chemical and products tanker visits (2 January 2000 - 10 June
2002).
It needs to be recognised that these visit records do not provide a complete picture of all cargo vessel
arrivals. For example, in 2000-2001 there were approximately 10 vessel visits per day to the Port of
Mumbai (3,614 for the year), of which 1,921 were cargo carriers (the remainder were 39 passenger
carriers and 1,654 rig supply and miscellaneous movements; MPT summary data obtained by Group
B). The MPT Annual Report for the same period shows that total cargo import and export tonnages
exceeded 15 million and 9 million tonnes respectively. Given the vast majority of vessels servicing
this trade arrive to both discharge and load cargo, the Port of Mumbai is overwhelmingly a net
exporter of BW.
This pattern is virtually identical to that at JNP, which imported 6.04 million tonnes and exported 3.81
million tonnes of cargo during 2000/2001. During this period, JNP experienced 3,164 vessel
movements, of which 1,507 comprised offshore supply vessels, Naval ships and miscellaneous
movements. Vessels arriving to discharge and/or load cargo comprised 1,247 container and general
cargo ships, 269 chemical and other tankers, 88 dry bulk carriers and 53 ro-ro/vehicles carriers (JNPT
Annual Report summary).
35
Ballast Water Risk Assessment, Ports of Mumbai and Jawaharlal Nehru, India, October 2003: Final Report
The database stores the amounts and sources of BW discharged recorded for these arrivals, as entered
from BWRFs before, during and after the consultants first and second visits, with many of these
records partly supplemented and/or wholly derived from port shipping records. Connection of the
database to the active berth layer of the GIS Port Map allowed tables summarising the BW discharge
statistics to be conveniently displayed for each terminal. Examples of these tables displayed by the
GIS Port Map are shown in Figures 13-17 respectively.
Because the database must accept and manage individual tank discharges as discrete units (as
recorded in IMO-standard BWRFs; Appendix 1), the need to treat all BW tanks as a single entity for
all vessels arriving prior to BWRF use (or which submit non-standard BWRFs or incomplete IMO
BWRFs; Section 3.6) reduces the number of individual tank discharges actually made between
January 2000 and June 2002, whilst inflating the mean and maximum tank discharge volumes. Thus
the latter can reflect the total ballast water capacity of the largest visiting vessels (Figures 15-17). This
causes more conservative outcomes in terms of BWRA results, particularly if a source port is
exporting BW to the Demonstration site via relatively large vessels arriving in a fully ballasted
condition.
While this is an uncommon feature of Mumbai-JNP's trade, it is worth emphasising that a database
containing individual tank data collated from, say, a 12 month set of fully completed BWRFs, will
generate more precise BW source port values for the C1, C2 and R1 components (Section 3.10).
Figure 13. BW discharge statistics displayed by GIS port map for the Mumbai docks
36
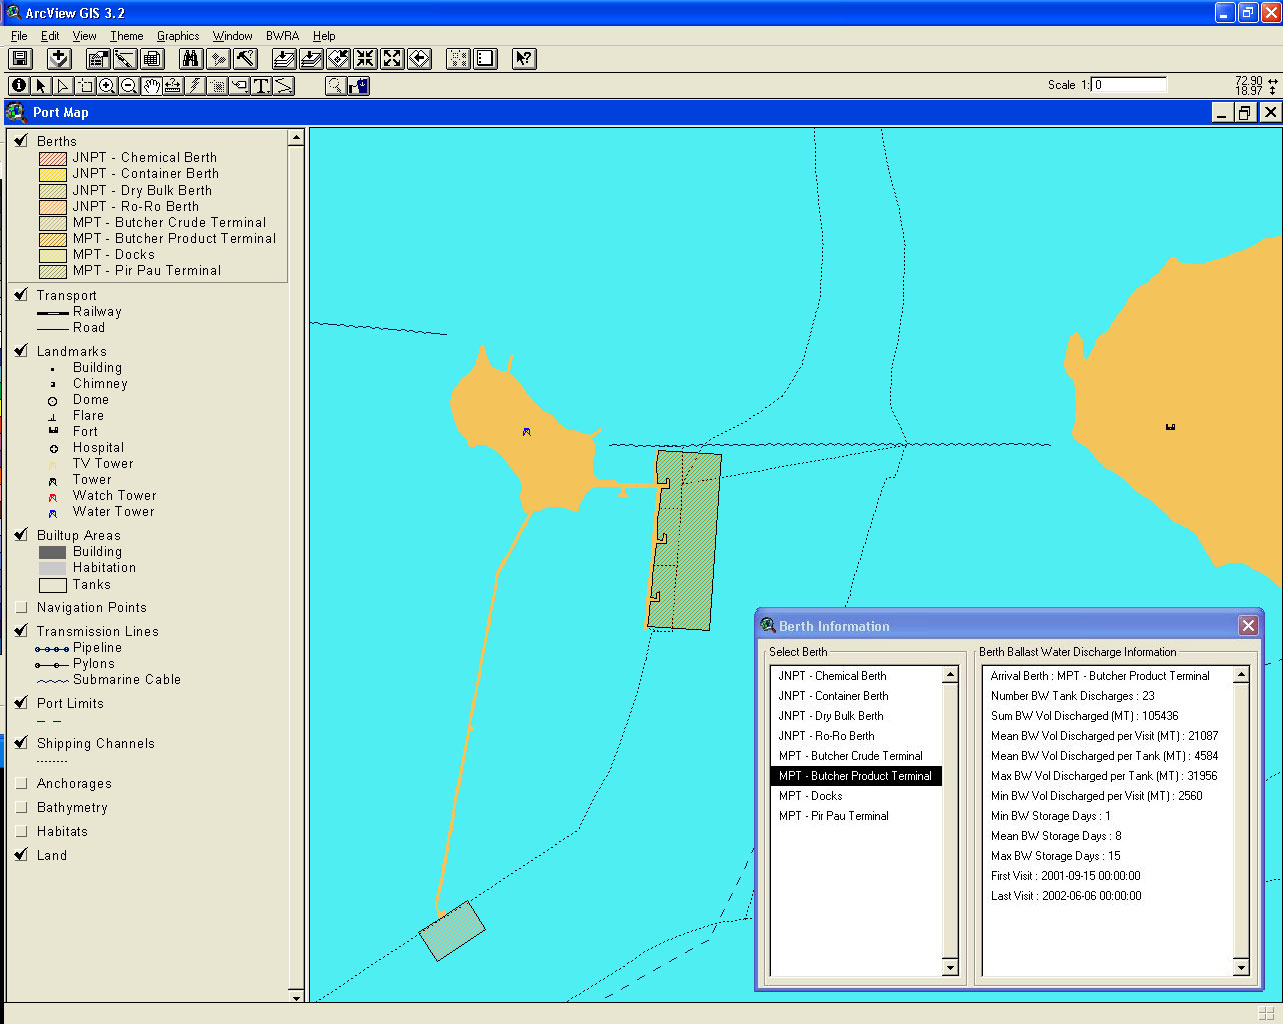
4 Results
Figure 14. BW discharge statistics displayed by GIS port map for the Pir Pau terminal
Figure 15a. BW discharge statistics displayed for the Butcher Island products terminal
37
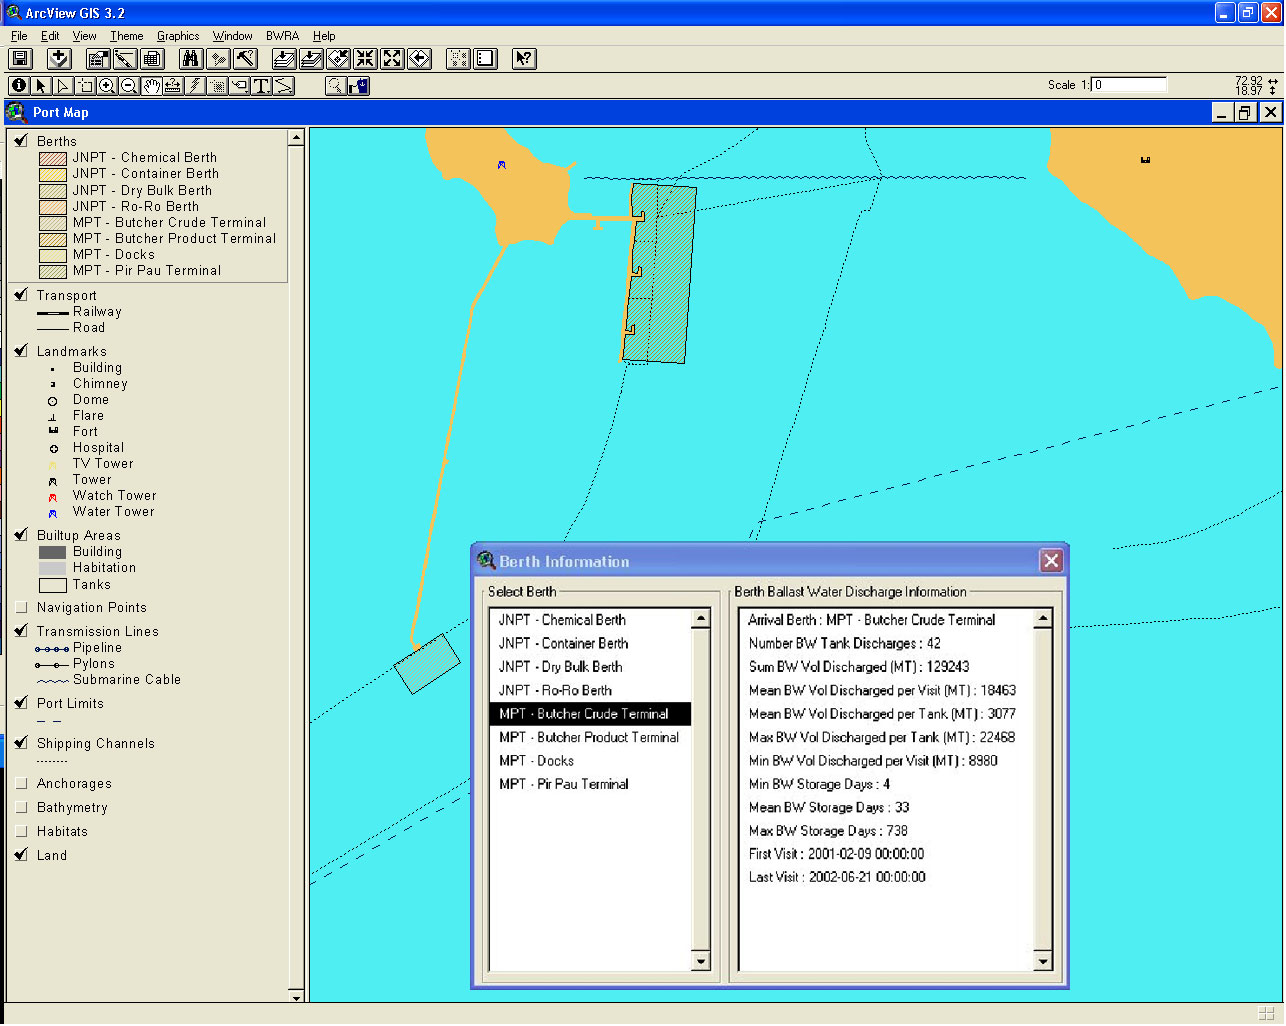
Ballast Water Risk Assessment, Ports of Mumbai and Jawaharlal Nehru, India, October 2003: Final Report
Figure 15b. BW discharge statistics displayed for the Butcher Island crude terminal
Figure 16a. BW discharge statistics displayed by the port map for the JNP Ro-Ro terminal
38
4 Results
Figure 16b. BW discharge statistics displayed for the JNP Chemical terminal
Figure 17a. BW discharge statistics displayed for the JNP Container terminal
39
Ballast Water Risk Assessment, Ports of Mumbai and Jawaharlal Nehru, India, October 2003: Final Report
Figure 17b. BW discharge statistics displayed for the JNP Dry Bulk terminal
40
4 Results
4.4 Identification of source ports
From the 3,581 vessel visit records and 4,934 associated BW tank records in the 2000-2002 database
for Mumbai-JNP, the total number of identified BW source ports was 82 (Table 3). Figure 18 shows
output from the GIS world bioregion map depicting the location and relative importance of these
source ports with respect to C1 (BW discharge frequency). As with all GIS outputs, the map is
`zoomable' to allow all ports and symbols to be clearly delineated at smaller scales.
The percentage frequency values for the 82 identified source ports listed in Table 3 are the C1
coefficients used to calculate the relative overall risk (Section 3.10). The three source ports
`supplying' the highest frequencies of BW discharges in the database were Karachi (13.9%),
Singapore (10.9%) and Colombo (10.1%) (Figure 18). These were followed by Jebel Ali (UAE; %),
Kandla (India; 4.2%) and Mohammed Bin Qasim (Pakistan; 4.0%) and Dubai and Fujairah (UAE;
both 3.5%).
Of the 82 identified source ports, the top 6 and 16 provided >50% and >75% of the source-identified
discharges respectively, while the next 8 ports contributed a further 15%, i.e. only 24 of the 82 source
ports (29%) accounted for 90% of all source-identified BW discharges (Table 3).
As noted earlier, the relatively low number of tank records (4,934) compared to visits (3,581), was
due to (a) the need to include port shipping records prior to the regular use of BWRFs (all tanks
combined), and (b) many vessels recording a single volume for discharged tanks. The total volume of
BW discharged from identified source ports of the 4,581 vessel visits was 2,619,625 tonnes. The
various discharge percentages for each source port in Table 3 and Figure 19 provide the C2 values
used in the risk calculation (Section 3.10).
The port rankings for C2 (BW volume) were similar but not the same as those for C1 (i.e. discharge
frequencies, as ranked in Table 3). The source ports providing the largest volume of BW discharged at
Mumbai-JNP were Sikka (17.4%), Chennai (12.8%) and Cochin (9.7%) in India, followed by
Singapore (8.1%; Table 3). These were followed by Dubai (4.8%), Kandla (4.7%) and Surat
(4.2%)(Table 3).
The top five identified source ports provided >50% of the total discharged volume, and the next seven
ports a further 25%. Thus only 12 of the identified source ports (14.6%) accounted for >75% of the
source-identified BW discharges recorded for Mumbai-JNP. Of the top 20 ports in terms of total
discharge volume (89%), 12 were in India, two were in the United Arab Emirates (Dubai and Jebel
Ali), and one each in the Netherlands (Rotterdam), Oman (Salalah), Pakistan (Karachi), Singapore,
South Africa (Richards Bay) and Sri Lanka (Colombo).
41
Ballast Water Risk Assessment, Ports of Mumbai and Jawaharlal Nehru, India, October 2003: Final Report
Figure 18. GIS output showing the location and relative importance of BW source ports with respect to frequency
of tank discharges (C1) at Mumbai-JNP.
Figure 19. GIS output showing location and relative importance of the source ports with respect to the volume of
BW discharges (C2) recorded for Mumbai-JNP.
Table 3. List of identified source ports in Mumbai-JNP database, showing proportions of recorded ballast tank
discharges (C1) and volumes (C2)*
*C1 = percentage proportion of all discharges; C2 = % proportion of total discharge volume
42
4 Results
Table 3 (cont'd). List of identified source ports in Mumbai-JNP database, showing proportions of recorded
ballast tank discharges (C1) and volumes (C2)*
*C1 = proportion of all discharges; C2 = proportion of total discharge volume (%)
43
Ballast Water Risk Assessment, Ports of Mumbai and Jawaharlal Nehru, India, October 2003: Final Report
4.5 Identification of destination ports
As discussed in Section 3.5, identification of destination ports for any BW taken up at a
Demonstration Site is confounded by the lack specific questions on the BWRF, and the uncertainty of
knowing if the Next of Port Call recorded on a BWRF (or in a shipping record) is where BW is
actually discharged. Thus presently there is no reporting mechanism enabling a `reverse BWRA' to be
undertaken reliably. This posed a significant constraint for Mumbai-JNP, since it is not clear which of the
large number of container ships, general cargo ships and small bulk carriers had or had not uplifted BW
whilst alongside berths or in the transhipment anchorages.
To provide an idea of the number of inter-port movements between Mumbai and JNP, Table 4 lists
the proportional frequency of reported movements to Mumbai (8.7%) and to JNP (0.7%). Of the other
106 assumed BW destination ports (i.e. Next Ports of Call) identified in the 2000-2002 database, their
location and proportional frequency are shown in Figure 20 as well as Table 4. Table 4 lists the top 27
destination ports that accounted for >90% of the reported Next Ports of Call by all recorded vessel
departures. Figure 20 and Table 4 show that the Port of Colombo (Sri Lanka; Figure 2) stood out as
the most frequent destination port, with 12.5% of all Next Ports of Call. This may be related to (a) the
frequency of container liner and other regular services from the Middle East and Europe (which stop
at Mumbai before heading south-east to Colombo, the next container hub), (b) regular exports of
product and petrochemicals to Sri Lanka, and/or (c) use of Colombo as a strategic `destination' for
initial sailing instructions.
The source and destination plots shown in Figures 19 and 20 show how Mumbai-JNP form a
significant hub in the Indian Ocean, with most of their trading voyages occurring in the area between
the Red Sea and Gulf (ROPME Sea Area) and the Indo-Malay peninsula.
Of the top 17 ports accounting for 80% of the destinations recorded for vessels departing Mumbai-
JNPT, five were Indian, seven were in the Middle East (Oman, Egypt, Saudi Arabia, United Arab
Emirates) and the others were single ports in Malaysia, Pakistan, Singapore, Sri Lanka and United
States (Table 4).
Figure 20. GIS output showing the location and frequency of destination ports, recorded as the Next Port of Call
in the Mumbai-JNP BWRFs and shipping records.
44
4 Results
Table 4. BW destination ports accounting for >80% of all vessel departures from Mumbai-JNP in 2000-2002
(recorded as Next Ports of Call).
UN Port
Destination Port
% Proportion of
Country
Cumulative %
Code
(Next Port of Call)
Departures
1
LKCMB
Colombo
Sri Lanka
12.5
12.5
2
INBOM
Mumbai (Ex Bombay)
India
8.72
21.3
3
SGSIN
Singapore
Singapore
7.42
28.7
4
AEJEA
Jebel Ali
United Arab Emirates
6.94
35.6
5
INIXY
Kandla (Muldwarka)
India
5.49
41.1
6
PKKHI
Karachi
Pakistan
4.78
45.9
7
MYPKG
Port Kelang
Malaysia
4.56
50.5
8
OMSLL
Salalah
Oman
4.19
54.6
9
INCOK
Cochin
India
3.86
58.5
10
EGPSD
Port Said
Egypt
3.64
62.1
11
AEDXB
Dubai
United Arab Emirates
3.30
65.4
12
AEFJR
Fujairah (Al-Fujairah)
United Arab Emirates
3.15
68.6
13
INPAV
Pipavav (Victor) Port
India
3.12
71.7
14
AEKLF
Khor Al Fakkan
United Arab Emirates
2.67
74.4
15
INTUT
Tuticorin (New Tuticorin)
India
2.56
76.9
16
SAJED
Jeddah
Saudi Arabia
2.41
79.4
17
USNYC
New York New York
United States
2.19
81.5
18
EGSUZ
Suez (El Suweis)
Egypt
1.67
83.2
19
INIXE
Mangalore (New Mangalore)
India
1.63
84.8
20
MYPEN
Penang (Georgetown)
Malaysia
0.89
85.7
21
INSIK
Sikka (Jamnagar)
India
0.78
86.5
22
MUPLU
Port Louis
Mauritius
0.78
87.3
23
IDBLW
Belawan Sumatra
Indonesia
0.67
88.0
24
INNSA
Jawaharlal Nehru (Nhava Sheva)
India
0.67
88.6
25
INMAA
Chennai (Ex Madras)
India
0.59
89.2
26
INMUN
Mundra
India
0.56
89.8
27
YEHOD
Hodeidah
Yemen
0.56
90.3
4.6
Environmental similarity analysis
Of the identified 82 BW source ports and 108 destination ports, sufficient port environmental data
were obtained to include 77% of the former and 71% of the latter in the multivariate similarity
analysis by PRIMER. These ports accounted for 95.7% of recorded BW tank discharges and 92.5% of
all recorded departures respectively (Tables 5-6). Details of the 357 ports included in the multivariate
analysis carried out for Mumbai-JNP and the other Demonstration Site BWRAs are listed in
Appendix 6 (this list is ordered alphabetically using the UN port identification code, in which the first
two letters represent the country).
To allow all identified BW source and next ports of Mumbai-JNP to be part of the `first-pass' risk
assessment, those ports not included in the multivariate analysis were provided with environment
matching coefficient estimates, and are noted as such in the database. The C3 estimates were based on
their port type (Section 3.7) and geographic location with respect to the nearest comparable ports for
which C3 had been calculated. A precautionary approach was adopted (i.e. the estimated values were
made higher than the calculated C3s of comparable ports). Providing C3 estimates allowed the
database to include all the identified source ports and next ports when calculating the ROR values and
displaying the BWRA results.
The GIS world map outputs that display the C3 values of Mumbai-JNP's source and destination ports
are in Figures 21 and 22 respectively. These plots and Tables 5-6 show that Mumbai-JNP has a
moderately high environmental similarity to some 23 (28%) of its trading ports (i.e. C3s in the 0.5 -
0.7 range, with the four ports greater than 0.6). In fact all of the closest ports (C3 >0.535) are in the
humid tropical Asian and African regions that experience relatively intense seasonal monsoons.
It is not surprising that the most environmentally similar ports to Mumbai-JNP were Mangalore
(0.64), Pondichery (C3 estimated), Marmagao (0.62) and Porbandar (0.61; Table 5). The most
environmentally dissimilar ports trading with Mumbai-JNP in 2000-2002 were those in northern
45
Ballast Water Risk Assessment, Ports of Mumbai and Jawaharlal Nehru, India, October 2003: Final Report
Europe (i.e. Hamburg, Ilyichevsk and Antwerpen), which had C3s at or below 0.2 (Tables 5-6;
Figures 21, 22).
As discussed in Section 4.6 and highlighted in Figure 20, the most frequent destination port recorded
for Mumbai-JNP (12.5% of all departures) was Colombo, which had a moderate environmental
matching (0.54; Table 6; Figure 22). The assumed BW destination ports with the closest
environmental matches (i.e. Mangalore [0.64] and Marmagao [0.62]) were ranked 18th and 32rd as
Next Ports of Call (i.e. 1.63% and 0.3%), while Porbandar (C3 of 0.61) and Mandapam (estimated C3
of 0.60) were ranked 43rd and 89th as assumed BW destination ports.
Figure 21. GIS outputs showing the location and environmental matching coefficients (C3) of BW source ports
identified for Mumbai-JNP.
Figure 22. GIS outputs showing the location and environmental matching coefficients (C3) of the destination
ports identified for Mumbai-JNP.
46
4 Results
Table 5. Source ports identified for Mumbai-JNP, as ranked according to size of their environmental matching
coefficient (C3)
47
Ballast Water Risk Assessment, Ports of Mumbai and Jawaharlal Nehru, India, October 2003: Final Report
Table 5 (cont'd). Source ports identified for Mumbai-JNP, ranked according to the size of their environmental
matching coefficient (C3)
Proportion of BW
Environmental
UN Port Code
Source Port Name
Country
C3 Estimated
discharged
Matching (C3)
KWMEA
Mina Al Ahmadi
Kuwait
0.06%
0.399
BHMAN
Manama
Bahrain
0.12%
0.397
AEJEA
Jebel Ali
United Arab Emirates
7.96%
0.391
AEQIW
Umm Al Qiwain
United Arab Emirates
0.50%
0.384
KWKWI
Kuwait
Kuwait
0.68%
0.368
OMMCT
Muscat
Oman
0.19%
0.351
Y
IQMAB
Mina Al Bakir
Iraq
0.06%
0.336
Y
IRKHK
Khark Island
Iran Islamic Republic of
0.06%
0.331
KRPUS
Pusan
Korea Republic of
0.06%
0.302
INCCJ
Calicut
India
0.12%
0.299
Y
SAJUB
Jubail
Saudi Arabia
0.44%
0.297
MMRGN
Yangon (Rangoon)
Myanmar (Former Burma)
0.06%
0.295
ILASH
Ashdod
Israel
0.06%
0.262
NLRTM
Rotterdam
Netherlands
0.44%
0.245
EGPSD
Port Said
Egypt
0.31%
0.217
DEHAM
Hamburg
Germany Federal Republic Of
3.36%
0.201
UAILK
Ilyichevsk
Ukraine
0.06%
0.179
BEANR
Antwerpen
Belgium
0.06%
0.143
Table 6. Destination ports identified for Mumbai-JNP, ranked according to the size of their environmental
matching coefficient (C3)*
UN Port
Proportion of
Environmental
Port Name
Country
C3 Estimated
Code
Departures
Matching (C3)
INIXE
Mangalore (New Mangalore)
India
1.63
0.642
INMRM
Marmugao (Marmagoa)
India
0.30
0.624
INPBD
Porbandar
India
0.19
0.609
INMDP
Mandapam
India
0.04
0.600
Y
IDBLW
Belawan Sumatra
Indonesia
0.67
0.593
INTUT
Tuticorin (New Tuticorin)
India
2.56
0.580
PKBQM
Muhammad Bin Qasim
Pakistan
0.30
0.576
INPAN
Panaji Port (Goa)
India
0.15
0.571
INPAV
Pipavav (Victor) Port
India
3.12
0.570
MYPDI
Port Dickson
Malaysia
0.11
0.564
IDDUM
Dumai Sumatra
Indonesia
0.04
0.560
PHMNL
Manila
Philippines
0.04
0.559
IDKOE
Kupang Timor
Indonesia
0.04
0.554
Y
IDMRK
Merak Java
Indonesia
0.04
0.554
INVTZ
Visakhapatnam
India
0.11
0.547
LKCMB
Colombo
Sri Lanka
12.54
0.542
PKKHI
Karachi
Pakistan
4.78
0.535
ZADUR
Durban
South Africa
0.30
0.534
SGSIN
Singapore
Singapore
7.42
0.530
TZDAR
Dar Es Salaam
Tanzania United Republic Of
0.04
0.526
IDPLM
Palembang Sumatra
Indonesia
0.04
0.521
Y
INRTC
Ratnagiri
India
0.07
0.520
Y
IDPNJ
Panjang
Indonesia
0.04
0.520
Y
IDPNK
Pontianak Kalimantan
Indonesia
0.04
0.520
Y
IDJKT
Jakarta Java
Indonesia
0.07
0.519
SDPZU
Port Sudan
Sudan
0.04
0.502
INDAM
Daman
India
0.22
0.500
Y
INBED
Bedi
India
0.11
0.500
Y
INDAH
Dahej
India
0.07
0.500
Y
INVAD
Vadinar
India
0.19
0.500
48
4 Results
Table 6 (cont'd). Destination ports identified for Mumbai-JNP, ranked according to the size of their
environmental matching coefficient (C3)
UN Port
Proportion of
Environmental
Port Name
Country
C3 Estimated
Code
Departures
Matching (C3)
EGSUZ
Suez (El Suweis)
Egypt
1.67
0.496
INCOK
Cochin
India
3.86
0.495
MYTPP
Tanjong Pelepas
Malaysia
0.04
0.494
Y
INHAL
Haldia
India
0.26
0.494
INMAA
Chennai (Ex Madras)
India
0.59
0.493
MYPGU
Pasir Gudang Johor
Malaysia
0.15
0.487
JPYKK
Yokkaichi Mie
Japan
0.04
0.483
KEMBA
Mombasa
Kenya
0.30
0.482
CNCWN
Chiwan (Shenzhen) Guangdong
China
0.04
0.478
SAYNB
Yanbu
Saudi Arabia
0.22
0.477
JPNGO
Nagoya Aichi
Japan
0.04
0.475
OMSLL
Salalah
Oman
4.19
0.460
Y
OMOPQ
Port Sultan Qaboos
Oman
0.19
0.460
Y
OMMFH
Min-Al-Fahal
Oman
0.04
0.460
Y
SAJED
Jeddah
Saudi Arabia
2.41
0.459
MYPKG
Port Kelang
Malaysia
4.56
0.457
JPYOK
Yokohama Kanagawa
Japan
0.04
0.457
INSIK
Sikka (Jamnagar)
India
0.78
0.456
IRBND
Bandar Abbas
Iran Islamic Republic of
0.19
0.456
MZBEW
Beira
Mozambique
0.07
0.452
Y
AEDXB
Dubai
United Arab Emirates
3.30
0.450
INKAK
Kakinada
India
0.11
0.450
Y
INKRW
Karwar
India
0.11
0.450
Y
INHAZ
Hazira
India
0.07
0.450
Y
JOAQJ
Aqaba (El Akaba)
Jordan
0.04
0.450
Y
AEKLF
Khor Al Fakkan
United Arab Emirates
2.67
0.444
TRDIL
Diliskelesi
Turkey
0.04
0.443
Y
SCPOV
Port Victoria
Seychelles
0.15
0.441
Y
MYPEN
Penang (Georgetown)
Malaysia
0.89
0.436
INMUN
Mundra
India
0.56
0.435
YEHOD
Hodeidah
Yemen
0.56
0.433
SADMN
Damman
Saudi Arabia
0.30
0.429
MUPLU
Port Louis
Mauritius
0.78
0.426
Y
YEADE
Aden
Yemen
0.52
0.423
QADOH
Doha
Qatar
0.04
0.422
YEMKX
Mukalla
Yemen
0.07
0.419
IRBUZ
Bushehr
Iran Islamic Republic of
0.04
0.417
BDCGP
Chittagong
Bangladesh
0.19
0.415
INIXY
Kandla (Muldwarka)
India
5.49
0.415
AEDAS
Das Island
United Arab Emirates
0.04
0.414
AESHJ
Sharjah
United Arab Emirates
0.04
0.413
TRMER
Mersin
Turkey
0.15
0.412
DJJIB
Djibouti
Djibouti
0.22
0.411
CYLCA
Larnaca
Cyprus
0.04
0.410
AEAUH
Abu Dhabi
United Arab Emirates
0.30
0.408
AEFJR
Fujairah (Al-Fujairah)
United Arab Emirates
3.15
0.402
KWSAA
Shuaiba
Kuwait
0.11
0.401
SARTA
Ras Tanura
Saudi Arabia
0.04
0.401
AEAJM
Ajman
United Arab Emirates
0.07
0.401
Y
QAUMS
Umm Said
Qatar
0.15
0.400
BHMAN
Manama
Bahrain
0.11
0.397
BHSIT
Sitra
Bahrain
0.07
0.396
CYLMS
Limassol
Cyprus
0.04
0.391
AEJEA
Jebel Ali
United Arab Emirates
6.94
0.391
AERKT
Ras Al Khaimah
United Arab Emirates
0.04
0.384
Y
THBKK
Bangkok
Thailand
0.07
0.382
IRBMR
Bandar Mashur
Iran Islamic Republic of
0.04
0.380
USCHS
Charleston South Carolina
United States
0.04
0.374
KWKWI
Kuwait
Kuwait
0.15
0.368
OMMCT
Muscat
Oman
0.48
0.351
Y
IQUQR
Umm Qasr
Iraq
0.07
0.350
Y
IRBKM
Bandar Khomeini
Iran Islamic Republic of
0.11
0.336
IQMAB
Mina Al Bakir
Iraq
0.04
0.336
Y
ITLIV
Livorno
Italy
0.04
0.335
IRKHK
Khark Island
Iran Islamic Republic of
0.11
0.331
ITPSS
Porto Santo Stefano
Italy
0.04
0.330
Y
BJCOO
Cotonou
Benin
0.04
0.317
Y
INCCU
Calcutta
India
0.04
0.299
SAJUB
Jubail
Saudi Arabia
0.33
0.297
49
Ballast Water Risk Assessment, Ports of Mumbai and Jawaharlal Nehru, India, October 2003: Final Report
4.7
Risk species threat
The risk species threat from a BW source port depends on the number of introduced and native
species in its bioregion, and their categorisations as unlikely, suspected or known harmful species
(Section 3.9). The risk species threat coefficients (C4) for each source port identified for Mumbai-JNP
are shown in Figure 23 and listed in Table 7. Table 7 also lists the scores for the introduced, suspected
and known harmful species of the source port bioregions, as assigned to the database's species tables
by March 2003.
As noted in Section 3.9, these tables and their associated Excel species reference file do not give a
complete global list, but provide a working resource enabling convenient update and improvement for
each bioregion. Similarly, the 204 bioregions on the GIS world map should not be considered
unalterable. Regional resolution of species-presence records is steadily improving in several areas,
and this will allow many bioregions to become divided into increasingly smaller units (ultimately
approaching the scale of local port waters). It should also be recognised that the distribution of risk
species in the database contains a regional bias due to the level of aquatic sampling and taxonomic
effort in Australia/New Zealand, Europe and North America. Many of the species listed for these
areas can be related to their history of species transfers for aquaculture, plus hull fouling on sailing
vessels and the canal-caused invasions of the east Mediterranean (Suez), north-east Europe (Ponto-
Caspian river canal links) and Great Lakes (St Lawrence River seaway).
The species in Table 8 include preliminary identifications from the Mumbai-JPN PBBS, plus those
listed in published and unpublished reports collated by Group C members (Appendix 5). The regional
and often patchy sampling bias needs to be remembered when comparing C4 values between different
bioregions, and is a further reason why the independent treatment of C3 for calculating the ROR
values is a safer approach (Section 3.10).
Because of the different historical vectors (hull fouling, canals, aquaculture, dry ballast, water ballast,
etc), a future version of the BWRA system could provide more accurate C4 values for BW-mediated
introduction threats if vector weightings are added to the database for the C4 calculation.
Finally, it is worth noting the database cannot produce `reverse' C4 values for destination ports (i.e.
measures of the relative threat posed by any BW exported from Mumbai-JNP). This requires knowing
the sources of all the other BW discharged at each destination port. What can be extracted from the
database to assist a `reverse' BWRA are species assigned to the Mumbai-JNP bioregion, which is
CIO-1 (Figure 7, Table 8).
50
4 Results
Figure 23. GIS output showing the location and risk species threat coefficients (C4) of the BW source ports
identified for Mumbai-JNP
Table 7. Ranking of BW source ports identified for Mumbai-JNP, according to the size of their risk species threat
(C4).
No. of
Suspected
Knwn
Total
Relative Risk Species
Port Code
Source Port
Country
Bio-Region
Introduced
Harmful
Harmful
Threat
Threat (C4)
Species
Species
Species
Value
JPNGS
Nagasaki Nagasaki
Japan
NWP-3a
15
11
12
168
0.600
KRINC
Inchon
Korea Republic of
NWP-4c
15
11
12
168
0.600
KRPUS Pusan
Korea Republic of
NWP-3a
15
11
12
168
0.600
DKAAB Aabenraa
Denmark
B-III
39
7
10
160
0.571
BEANR Antwerpen
Belgium
NEA-II
21
8
10
145
0.518
DEHAM Hamburg
Germany Federal Republic Of
NEA-II
21
8
10
145
0.518
NLRTM Rotterdam
Netherlands
NEA-II
21
8
10
145
0.518
ITGOA Genoa
Italy
MED-II
16
5
11
141
0.504
CYKYR Kyrenia
Cyprus
MED-V
17
5
10
132
0.471
EGALY Alexandria (El Iskandariya)
Egypt
MED-V
17
5
10
132
0.471
EGPSD
Port Said
Egypt
MED-V
17
5
10
132
0.471
ILASH
Ashdod
Israel
MED-V
17
5
10
132
0.471
LYKHO Khoms
Lybian Arab Jamahiriya
MED-IV
17
5
10
132
0.471
ZADUR Durban
South Africa
WA-V
13
3
9
112
0.400
ZARCB Richards Bay
South Africa
WA-V
13
3
9
112
0.400
UAILK Ilyichevsk
Ukraine
MED-IXB
14
5
8
109
0.389
BDCGP Chittagong
Bangladesh
CIO-III
8
12
5
94
0.336
INCCJ
Calicut
India
CIO-I
8
12
5
94
0.336
INCOK Cochin
India
CIO-I
8
12
5
94
0.336
INDAH Dahej
India
CIO-I
8
12
5
94
0.336
INDAM Daman
India
CIO-I
8
12
5
94
0.336
INHAL Haldia
India
CIO-III
8
12
5
94
0.336
INHAZ Hazira
India
CIO-I
8
12
5
94
0.336
INIXE
Mangalore (New Mangalore)
India
CIO-I
8
12
5
94
0.336
INIXY
Kandla (Muldwarka)
India
CIO-I
8
12
5
94
0.336
INKRW Karwar
India
CIO-I
8
12
5
94
0.336
INMAA Chennai (Ex Madras)
India
CIO-II
8
12
5
94
0.336
INMRM Marmugao (Marmagoa)
India
CIO-I
8
12
5
94
0.336
INMUN Mundra
India
CIO-I
8
12
5
94
0.336
INPAV
Pipavav (Victor) Port
India
CIO-I
8
12
5
94
0.336
INPBD
Porbandar
India
CIO-I
8
12
5
94
0.336
INPNY
Pondicherry
India
CIO-II
8
12
5
94
0.336
INSIK
Sikka (Jamnagar)
India
CIO-I
8
12
5
94
0.336
INTUT
Tuticorin (New Tuticorin)
India
CIO-II
8
12
5
94
0.336
INVAD Vadinar
India
CIO-I
8
12
5
94
0.336
INVTZ
Visakhapatnam
India
CIO-II
8
12
5
94
0.336
LKCMB Colombo
Sri Lanka
CIO-II
8
12
5
94
0.336
MMRGN Yangon (Rangoon)
Myanmar (Former Burma)
CIO-IV
8
12
5
94
0.336
INSTV
Surat
India
CIO-I
8
12
5
94
0.336
51
Ballast Water Risk Assessment, Ports of Mumbai and Jawaharlal Nehru, India, October 2003: Final Report
Table 7 (cont'd). Ranking of BW source ports identified for Mumbai-JNP, according to the size of their risk
species threat (C4).
No. of
Suspected
Knwn
Total
Relative Risk Species
Port Code
Source Port
Country
Bio-Region
Introduced
Harmful
Harmful
Threat
Threat (C4)
Species
Species
Species
Value
IDBLW Belawan Sumatra
Indonesia
EAS-VI
6
4
5
68
0.243
IDMRK Merak Java
Indonesia
EAS-VII
6
4
5
68
0.243
MYDGN Dungun (Kuala Dungun)
Malaysia
EAS-I
6
4
5
68
0.243
MYKUA Kuantan (Tanjong Gelang)
Malaysia
EAS-I
6
4
5
68
0.243
MYPKG Port Kelang
Malaysia
EAS-VI
6
4
5
68
0.243
SGSIN
Singapore
Singapore
EAS-VI
6
4
5
68
0.243
THLCH Laem Chabang
Thailand
EAS-I
6
4
5
68
0.243
MYLUT Lutong Sarawak
Malaysia
EAS-I
6
4
5
68
0.243
BBBGI
Bridgetown
Barbados
CAR-IV
7
3
4
56
0.200
AEFJR
Fujairah (Al-Fujairah)
United Arab Emirates
IP-1
8
2
4
54
0.193
AEKLF Khor Al Fakkan
United Arab Emirates
IP-1
8
2
4
54
0.193
OMMCT Muscat
Oman
IP-1
8
2
4
54
0.193
OMOPQ Port Sultan Qaboos
Oman
IP-1
8
2
4
54
0.193
PKBQM Muhammad Bin Qasim
Pakistan
IP-1
8
2
4
54
0.193
PKKHI
Karachi
Pakistan
IP-1
8
2
4
54
0.193
AEFAT Fateh Terminal
United Arab Emirates
AG-1
4
5
3
49
0.175
IRBND
Bandar Abbas
Iran Islamic Republic of
AG-1
4
5
3
49
0.175
AEAJM Ajman
United Arab Emirates
AG-5
1
5
3
46
0.164
AEAUH Abu Dhabi
United Arab Emirates
AG-5
1
5
3
46
0.164
AEDXB Dubai
United Arab Emirates
AG-5
1
5
3
46
0.164
AEJEA
Jebel Ali
United Arab Emirates
AG-5
1
5
3
46
0.164
AEQIW Umm Al Qiwain
United Arab Emirates
AG-5
1
5
3
46
0.164
BHMAN Manama
Bahrain
AG-5
1
5
3
46
0.164
IQMAB Mina Al Bakir
Iraq
AG-3
1
5
3
46
0.164
IRKHK Khark Island
Iran Islamic Republic of
AG-3
1
5
3
46
0.164
KWKWI Kuwait
Kuwait
AG-3
1
5
3
46
0.164
KWMEA Mina Al Ahmadi
Kuwait
AG-3
1
5
3
46
0.164
QAUMS Umm Said
Qatar
AG-5
1
5
3
46
0.164
SAJUB
Jubail
Saudi Arabia
AG-3
1
5
3
46
0.164
SARAR Ras al Khafji
Saudi Arabia
AG-5
1
5
3
46
0.164
SARTA Ras Tanura
Saudi Arabia
AG-5
1
5
3
46
0.164
OMSLL Salalah
Oman
OM
6
2
2
32
0.114
EGSUZ Suez (El Suweis)
Egypt
RS-3
6
0
2
26
0.093
JOAQJ
Aqaba (El Akaba)
Jordan
RS-3
6
0
2
26
0.093
SAJED
Jeddah
Saudi Arabia
RS-2
6
0
2
26
0.093
SAYNB Yanbu
Saudi Arabia
RS-2
6
0
2
26
0.093
DJJIB
Djibouti
Djibouti
GA
3
2
0
9
0.032
KEMBA Mombasa
Kenya
EA-III
6
1
0
9
0.032
TZDAR Dar Es Salaam
Tanzania United Republic Of
EA-III
6
1
0
9
0.032
YEADE Aden
Yemen
GA
3
2
0
9
0.032
YEMKX Mukalla
Yemen
GA
3
2
0
9
0.032
IDBPN
Balikpapan Kalimantan
Indonesia
EAS-II
2
2
0
8
0.029
NGBON Bonny
Nigeria
WA-II
1
0
0
1
0.004
52
4 Results
Table 8. Status of risk species assigned to the bioregion of Mumbai-JNP (CIO-I)
Regional
Group
Common Name
Species Name
Threat Status
Status
Diatomaceae, Rhizosoleniacaea
Polar diatom
Dactyliosolen mediterraneus Peragallo
Cryptogenic
Suspected harmful species
Diatomaceae, Rhizosoleniacaea
Polar diatom
Peragallo
Cryptogenic
Suspected harmful species
Diatomaceae, Biddulphidaceae
Centric diatom
Chaetoceros curvisetus Cleve
Cryptogenic
Suspected harmful species
Diatomaceae, Coscinodiscoceae
Centric diatom
Coscinodiscus radiatus
Cryptogenic
Suspected harmful species
Diatomaceae, Solenoideae
Centric diatom
Leptocylindrus danicus Cleve
Cryptogenic
Suspected harmful species
Diatomaceae, Coscinodiscoceae
Centric diatom
Skeletonema costatum (Greville) Cleve
Cryptogenic
Known harmful species
Prorocentrates, Prorocentrales
Noxious dinoflagellate
Prorocentrum micans Ehrenberg
Cryptogenic
Suspected harmful species
Peridiniales, Gonyaulaceae
Toxic dinoflagellate
Cochlodinium polykrikoides
Cryptogenic
Suspected harmful species
Chlorophyceae
Green algae
Monostroma oxyspermum
Cryptogenic
Not suspected
Silicoflagellatales, Dictyochaceae
Silicoflagellate
Dictyocha fibula Ehrenberg
Cryptogenic
Suspected harmful species
Hydrozoa, Hydroidea
Hydroid
Blackfordia virginica
Cryptogenic
Not suspected
Scyphomedusae
Moon Jellyfish
Aurelia aurita
Cryptogenic
Suspected harmful species
Scyphomedusae
Sea jelly
Phyllorhiza punctata
Native
Not suspected
Polychaeta, Serpulidae
Serpulid tube worm
Ficopomatous enigmaticus
Cryptogenic
Not suspected
Polychaeta, Serpulidae
Serpulid tube worm
Hydroides elegans
Introduced
Known harmful species
Polychaeta, Serpulidae
Serpulid tube worm
Hydroides norvegica
Cryptogenic
Suspected harmful species
Polychaeta, Spionidae
Sedentary spionid worm
Pseudopolydora paucibranchiata
Introduced
Not suspected
Cirripedia, Balanidae
Striped barnacle
Balanus amphitrite amphitrite
Native
Suspected harmful species
Cirripedia, Balanidae
Acorn barnacle
Balanus amphitrite cirratus
Native
Not suspected
Cirripedia, Balanidae
Ivory barnacle
Balanus eburneus
Cryptogenic
Not suspected
Cirripedia, Balanidae
Reticulate barnacle
Balanus reticulatus
Cryptogenic
Not suspected
Cirripedia, Balanidae
Acorn barnacle
Balanus trigonus
Native
Not suspected
Cirripedia, Megabalanidae
Giant barnacle
Megabalanus tintinnabulum
Introduced
Known harmful species
Cirripedia, Megabalanidae
Zebra barnacle
Megabalanus zebra
Cryptogenic
Not suspected
Amphipoda, Ischyroceridae
Sea flea
Jassa marmorata
Introduced
Not suspected
Isopoda, Flabellifera, Limnoriidae
Sea Lice
Cilicaea lateraillei
Cryptogenic
Not suspected
Isopoda, Flabillifera, Cirolanidae
Sea Lice
Cirolana hardfordi
Introduced
Not suspected
Isopoda, Sphaeromatidae
Sea Lice
Paradella dianae
Introduced
Not suspected
Isopoda, Sphaeromatidae
Sea Lice
Sphaeroma serratum
Cryptogenic
Not suspected
Isopoda, Sphaeromatidae
Sea Lice
Sphaeroma walkeri
Native
Not suspected
Isopoda, Valveria, Idoteidae
Asian slater
Synidotea laevidorsalis
Cryptogenic
Not suspected
Decapoda, Penaidae
Prawn
Penaeus monodon
Cryptogenic
Not suspected
Decapoda, Portunidae
Swimming crab
Charybdis feriatus
Native
Suspected harmful species
Decapoda, Portunidae
Swimming crab
Charybdis hellerii
Native
Known harmful species
Decapoda, Portunidae
Mud crab
Scylla serrata
Cryptogenic
Not suspected
Bivalvia, Chamidae
Red Sea jewel box
Chama elatensis
Native
Not suspected
Bivalvia, Dreissenidae
Black-striped mussel
Mytilopsis sallei
Introduced
Known harmful species
Bivalvia, Mytilidae
Asian date mussel
Musculista senhousia
Introduced
Known harmful species
Bivalvia, Mytilidae
Indian brown mussel
Perna indica
Cryptogenic
Suspected harmful species
Bivalvia, Mytilidae
Asian Green-lipped mussel
Perna viridis
Cryptogenic
Suspected harmful species
Bivalvia, Ostreidae
Portuguese oyster
Crassostrea angulata
Cryptogenic
Not suspected
Bivalvia, Ostreidae
Indian oyster
Crassostrea gryphoides
Cryptogenic
Not suspected
Bivalvia, Ostreidae
Rock oyster
Saccostrea cucullata
Native
Not suspected
Bivalvia, Teredinidae
Teredinid bivalve
Bankia carinata
Cryptogenic
Not suspected
Bivalvia, Teredinidae
Teredinid bivalve
Bankia gouldi
Cryptogenic
Not suspected
Bivalvia, Teredinidae
Teredinid bivalve
Lyrodus massa
Cryptogenic
Not suspected
Bivalvia, Teredinidae
Teredinid bivalve
Lyrodus medilobata
Cryptogenic
Not suspected
Ascidiacea, Styelidae
Sea Squirt (Tunicate)
Eusynstyela tincta
Cryptogenic
Not suspected
Ascidiacea, Styelidae
Colonial sea squirt (tunicate)
Phallusia nigra
Cryptogenic
Not suspected
Ascidiacea, Styelidae
Sea Squirt (Tunicate)
Styela bicolor
Cryptogenic
Not suspected
Anasca
Sea moss (Bryozoan)
Bugula neritina
Cryptogenic
Not suspected
Anasca
Sea moss (Bryozoan)
Bugula stolonifera
Cryptogenic
Not suspected
Anasca, Electriidae
Sea moss (Bryozoan)
Electra bengalensis
Cryptogenic
Not suspected
Anasca
Sea moss (Bryozoan)
Membranipora tenuis
Cryptogenic
Not suspected
Anasca
Sea Moss (Bryozoan)
Watersipora cucullata
Cryptogenic
Not suspected
Stolonifera, Vesiculariidae
Sea Moss (Bryozoan)
Bowerbankia caudata
Cryptogenic
Not suspected
Stolonifera, Vesiculariidae
Sea moss (Bryozoan)
Bowerbankia gracilis
Cryptogenic
Not suspected
Stolonifera, Vesiculariidae
Sea moss (Bryozoan)
Zoobotryon verticillatum
Cryptogenic
Not suspected
Pedicellinidae, Barentsiidae
Kamptozoan nodding heads
Barentsia ramose
Cryptogenic
Not suspected
Pisces, Eleotriidae
Sleeper goby
Butis koilomatodon
Native
Not suspected
Pisces, Blennidae
Combtooth blenny
Ornobranchus punctatus
Native
Not suspected
53
Ballast Water Risk Assessment, Ports of Mumbai and Jawaharlal Nehru, India, October 2003: Final Report
4.8
Risk assessment results
The database calculates the relative overall risk (ROR) of a potentially harmful introduction for all
source ports that have C1-C4 coefficients and R1-R2 factors. The ROR value for each source port
represents a proportion of the threat posed to the Demonstration Site as result of its contemporary
trading pattern (1999-2002).
After calculating the RORs the database generates a large output table listing the source ports and
their coefficients, risk-reduction factors and ROR value, plus the five ROR categories used for the
GIS plot and the standardised ROR values (S-ROR; Section 3.10). Results from the project-standard
BWRA for Mumbai-JNP are listed in Table 9, and the GIS plot of the ROR categories is shown in
Figure 24.
From the 3,581 visit records in the Mumbai-JNP database, the project standard identified 11 of the 82
identified source ports as representing the highest risk group (in terms of their BW source frequency,
volume, voyage duration, environmental similarity and assigned risk species). These ports, 9 of which
were Indian, provided the top 20% of the total ROR, with individual values in the 0.23 - 0.25 range
(S-ROR = 0.85 - 1.0; Table 9). The highest risk ports were led by Marmagao and Mangalore, with
Colombo a close third and being the first non-Indian port in the ranking (ROR = 0.249; S-ROR =
0.99).
Karachi (Pakistan) was ranked 12th as a high risk port with an ROR of 0.23 (S-ROR = 0.85). The
highest ranked ports beyond South Asia were firstly Singapore (ranked 10th with an ROR = 0.23; S-
ROR = 0.93), followed by Nagasaki in Japan (ranked 14th as a high risk port (ROR = 0.22; S-ROR =
0.81). The highest ranked port beyond the South and East Asian regions was Durban in South Africa,
which was ranked 25th with a medium risk ROR of 0.195 (S-ROR = 0.66; Table 9).
The 42 source ports in the low (19) and lowest (23) risk categories were a mixture of cool, hot-saline
and/or riverine ports with a wide distribution. The source port with the lowest ROR (0._; S-ROR =
0.0) was the cool freshwater port of Antwerpen in Belgium (ROR = 0.09; Table 9). The frequency
distribution of the 82 standardised ROR values is shown in Figure 25.
Based on Mumbai-JNP's current pattern of trade (as implied by the 2000-2002 records), the results
suggest that BW from vessels arriving from Europe and the Red Sea/Gulf pose less threat than many
ports in India, other South Asian countries and humid East Asian regions.
In fact the take-home message is that Mumbai appears most at risk from relatively local `port-
hopping' by harmful species that establish and acclimate to other Indian or nearby foreign ports,
rather than from remote comparable regions such as the Caribbean and Gulf of Mexico. The presence
of the East Asian green lipped mussel (Perna viridis) and the Caribbean black-striped mussel
(Mytilopsis sallei) in the navy dock at Mumbai-JNP conform to this conclusion Thus Perna viridis is
a tropical mussel native regions that is common in Malay Peninsula and other East Asian ports that
regularly trade with Mumbai-JNP. In the case of Mytilopsis sallei, this nuisance fouling mussel is
believed to have `port-hopped' from its earlier establishment at Indian ports such as Visakhapatnam,
which is a major export port on India's east coast that has more frequent vessel arrivals from Atlantic
ports than Mumbai-JNP. It is also worth noting that the BWRA activity is based on two years of
shipping data, so that the results can change if there is any major change to the present patterns of
Mumbai-JNP trade.
The risk results in Table 9 and plots in Figure 24 appear logical given Mumbai-JNPs biogeographic
location and current pattern of trade. They also suggest that the project standard `first-pass' treatment
of the risk coefficients should provide a useful benchmark for exploring the risk formula and refining
the database. The indication that Mumbai-JNP is susceptible to unwanted introduced species which
establish populations in similar tidal creek/estuarine environment harbours between Karachi and the
Pondichery-Visakhapatnam region (on the south-east side of India) could be strengthened by:
54
4 Results
· collecting environmental data for ports all ports in this region (to allow their C3 coefficients
to be calculated accurately); and
· undertaking PBBS which are targeted at known harmful species in India, in order to elucidate
their current distribution pattern and the vectors causing their spread.
Unlike the benthic fouling organisms, none of the noxious phytoplankton species listed in Table 8 for
the CIO-I bioregion have clear-cut origins, and some have the potential to increase the incidence
and/or severity of red tides within heavily developed, eutrophying coastal systems such as urbanised
lagoons, harbours and embayments. Because India is a large tropical/sub-tropical country with a high
number of estuarine/lagoonal ports, possible BW mediated transfers of water-borne pathogens (such
as cholera) and parasites also needs to be remembered (and their almost virtual absence from the risk
species tables of the present database further increases the fragility of the C4 coefficient). Since
cholera outbreaks do occur on the Indian subcontinent, running the BWRA with its calculation
options tailored to identifying the transfer of unwanted pathogenic strains of Vibrio bacteria, and/or
other water-borne diseases would be useful for predicting which ports on the subcontinent pose the
highest risk to Mumbai-JNP should they report an outbreak, in terms of their shipping and BW trade,
voyage duration and environmental similarity.
The `port-hopping' risk mentioned above signifies that India's domestic port-to-port shipping is an
important vector and therefore, as with other large nations such as Australia, warrants active BW
management and use of BWRFs, especially to help determine the intra-national pattern of BW
transfers. Thus delineation of BW-mediated species invasions and public health risks for any Indian
port will need to measure and contrast the influence of domestic arrivals versus international arrivals,
together with port proximity (facilitating both natural and BW tank dispersion of organisms), and use
of a more port-oriented rather than bioregional approach for the database's storage and treatment of
the risk species data.
Figure 24. GIS outputs showing the location and categories of relative overall risk (ROR) of source ports
identified for Mumbai-JNP
55
Ballast Water Risk Assessment, Ports of Mumbai and Jawaharlal Nehru, India, October 2003: Final Report
Table 9. BW source ports reported for Mumbai-JNP, ranked according to their Relative Overall Risk (ROR)
56
4 Results
Distribution of Standardised ROR values (S-RORs)
16
14
12
10
8
Frequency
6
4
2
0
0.00
0.10
0.20
0.30
0.40
0.50
0.60
0.70
0.80
0.90
1.00
S-ROR Value
Figure 25. Frequency distribution of the standardised ROR values
Reverse BWRA
There is no doubt that Mumbai-JNP annually `exports' a considerable volume of ballast water, with
most of it being transferred to other ports in relatively small but frequent quantities within the tanks of
container ships, general cargo ships, small bulk carriers, ro-ro vessels and vegetable oil (chemical)
tankers. If the vessel visit and tank discharge records of the present database is unbiased (i.e. provides
a reasonable sample of the present pattern of trade and volume of BW imported per year; ~1 millions
tonnes), then using the 2000/2001 ratio of total imported cargo (~21 million tonnes) to exported cargo
(~13 million tonnes) produces a crude BW export estimate of ~1.5 million tonnes per annum.
The most frequent destination port appears to be Colombo (Section 4.5). This container hub port has a
moderate environmental matching value (0.54) as it experiences a comparable climate regime but is a
breakwater harbour located on an open sandy coast without significant tidal creek habitats or major
land drainages. This would be expected to limit the range of species which could be successfully
transferred from Mumbai-JNP to Colombo harbour with BW. This prediction cannot be drawn for
natural embayment, lagoonal/estuarine ports such as Mangalore, Pondichery, Marmagao, Porbandar,
Muhammad Bin Qasim and parts of Singapore, all of which are more closely matched with Mumbai-
JNP (c.f. Tables 4, 6).
In the case of risk species currently assigned to the Mumbai-JNP bioregion (CIO-I; Table 8), the
fouling tube worm, bivalve mollusc and potentially noxious phytoplankton species represent both
economically and ecologically harmful species transferred with ballast water uplifted at Mumbai-JNP.
4.9 Training and capacity building
The computer hardware and software provided by the GloBallast Programme for the BWRA activity
was successfully installed and is currently maintained at the DGS office in Mumbai. This PC, plus
others made available by NIO for port map development, database operation and group
demonstrations, proved reliable and adequate for running the database, undertaking the similarity
analyses, displaying the GIS maps and results and providing other project needs.
57
Ballast Water Risk Assessment, Ports of Mumbai and Jawaharlal Nehru, India, October 2003: Final Report
Groups A and C contained sufficient number of active counterparts to enable planned training,
collation of information and completion of tasks. Group B was hampered by lack of counterparts
assigned to support the Group B leader (CFP-A), who was burdened by other Programme duties.
While the consultants were able to help search sources and collate shipping record information, and to
review, correct, gap-fill and combine visit record entries into a single coherent database, it will be
necessary to operate and expand the database and train others on all procedures. This will need the
active support and cooperation from Group C counterparts at NIO, plus possible further guidance and
assistance from the consultants.
4.10 Identification of information gaps
Ballast Water Reporting Forms
The number and status of the BWRFs collected that were made available for reviewing and checking
by the consultants during the 1st and 2nd visits was limited to approximately 400 forms. Of these,
many contained gaps or errors which could be correct and filled, while others provided insufficient
data to identify items (date/source/discharge location, etc) to allow reasonable estimations to be
added, and therefore had to be rejected.
BWRFs viewed by the consultants that contained many empty or incorrect entries for BW source/s,
uptake date/s and tank volumes intended to be discharged were common (approximately 25%; which
was similar to other Demonstration Sites where BWRF submissions were gradually implemented on a
voluntary basis). It had been planned to conduct an error analysis of the BWRFs during the second
country visit, but the lack of available BWRFs and the priority need to expand the database with
records derived from MPT terminal shipping records prevented this.
The following list summarises the most common omissions or mistakes in submitted BWRFs that
were informally observed and also recorded by other sites:
· BW uptake date, source port/location and/or discharge volume provided for none, one, or
only a few of the total number of tanks considered most likely to have been discharged.
· No exchange data in the BW exchange field (Part 4 of the BWRF; Appendix 1), or no reason
given for not undertaking an exchange.
· BWRFS showing BW exchange data contained empty BW source cells (it is important to
enter the source port/location details because exchanges are often well below 95% effective
and never 100%).
· BW Discharge field often ignored or partly filled, even by ships loading a full cargo and
therefore discharging most of their ballast.
· "Next Port of Call" occasionally not reported (as BWRFs were being completed and
submitted just after arrival, this may be a matter of timing, and this would form an important
logistical note for any future `reverse' risk assessment activity).
· BW Exchange in Section 4 - circle one: The `Empty/refill or Flow-through' option had been
omitted from the Mumbai and JNP BWRFs. This was brought to the attention of MPT and
JNPT during the first consultants visit, with advice for rectification on future issues;
· BW Exchange in Section 4, under "sea height" (waves/swell height) the sea depth in metres
is frequently recorded. This reflects simple translation confusions, and a lack of guidance
information provided with the BWRFs
The above summary shows which items port officers need to immediately check for when collecting
or receiving any BWRF. Unless guidance is provided and errors corrected, ships' officers, shipping
agents and the port officers will take longer to become familiar with and effectively use the BWRF
process. Apart from lack of BWRF familiarity, the time provided for a ships' officer to complete a
BWRF is another important factor influencing the number of mistakes and omissions. BWRFs
58
4 Results
provided to ships during their berthing or departure phases cannot be expected to receive the same
level attention as forms already onboard the ship and completed prior to arrival. Thus reporting can be
improved if shipping agents send BWRF reminders (and blank forms where necessary) to ships 1-2
days prior to arrival. Unless BWRFs are completed accurately and fully by vessels visiting Mumbai-
JNP, a significant percentage of BW sources and discharge volumes will remain unclear especially
for the general cargo berths at MPT docks and the container and Ro-Ro berths at JNP.
Even with correctly completed forms, it is often impossible to identify the ultimate destination of any
BW uplifted by a port that receives and analyses BWRFs (Section 3.5). This is important given the
objective of the GloBallast BWRA to identify the destinations of BW uplifted at each Demonstration
Site. In fact some of the GloBallast BWRA objectives required considerable effort searching and/or
deducing the following information, which is not available from the standard BWRFs:
· Destination Port/s where either BW will be discharged or cargo actually offloaded (not
necessarily the Next Port of Call).
· Berth number/location at the reception port (obtained for each Demonstration Site by
laborious cross-checking with port records);
· Deadweight tonnage (DWT). This is very useful for checking claimed BW discharge volumes
(DWTs were eventually obtained for most ships from the Lloyds Ship Register, but this is a
time-consuming task, particularly for ships that had entered a new name, incorrect IMO
number or Call Sign on the BWRF).
It is therefore recommended that IMO Marine Environment Protection Committee (MEPC) review the
standard BWRF with a view to improving its global application under the new BW convention (see
Section 5).
Port environmental and risk species data
It was particularly difficult to obtain reliable environmental information for a port's waters,
particularly for the seasonal water temperature and salinity averages and extrema. This was true for
ports in very developed regions (e.g. North America, Europe and Japan) as it was for less developed
areas. Most of India's ports are not exceptions to this finding.
In the case of species data, many national and regional data sets remain incomplete and/or
unpublished, and there are none published for India or its neighbouring countries. Many sites for
North American Caribbean, European, Asian and Australasian regions list species which were
historically introduced by the aquaculture, fisheries, aquarium industry or hull fouling vectors, while
many do not identify the likely vector/s of their listed species.
59
5
Conclusions and Recommendations
The main objectives of the BWRA Activity were completed during the course of this project, which
took 13 months (i.e. between the initial briefing in January 2002 and the final consultants visit in
February 2003). The level of experience brought to the project by the NIO counterparts facilitated
effective instruction and familiarisation of the GIS, Database operation and port environmental and
risk species components of the BWRA system.
NIO will be able to provide technical assistance and advice to the Ministry of Shipping for future
ballast water risk management projects, and it also wishes to undertake a second BWRA for the Port
of Marmagao (for which it already has collated important environmental and risk species data). The
NIO will also be able to facilitate India's training and networking plans with other port States in South
Asia. In the case of future BWRA projects, however, the Ministry of Shipping will need to strengthen
Group B by securing more definitive and formal arrangements with the managers of the selected
port/s.
The Regional Strategic Action Plan (SAP) being developed by GloBallast for coordinating BW
management activities in the South Asian region can provide an ideal mechanism for replicating the
collation and analysis of BWRF data for other ports. Important items requiring attention for any future
BW management activity in the South Asian region comprise:
· availability of guidelines and instructions about BWRF reporting to ship's officers, shipping
agents and port officers;
· virtual lack of risk species and port baseline biological surveys (PBBSs) in South Asia;
· relative lack of reliable port water temperature and salinity data for the major seasons;
· lack of any regional web-based database for exchanging and updating species survey
information.
Port authorities, major national shipping companies and regional maritime organisations in South Asia
should be encouraged to support efforts in the above areas.
5.1
Recommendations
· To identify the locations where BW is discharged within a port, a more useful BWRF should
include an entry for the berth or terminal name/number (instead of simply `Port' and/or
geographic coordinates, which was usually left blank).
· Modifying the "Last Port of Call" field to provide a "Last Three (3) Ports of Call" question
would assist BWRF verification checking and analysis for part-loaded vessels visiting multi-
use terminals.
· To help decipher and interpret poorly written, incomplete or suspect BWRFs, port and BW
database entry officers should have access to up-to-date copies of the Lloyds Ship Register,
the Fairplay Ports Guide, Lloyd's Maritime Atlas of World Ports or equivalent publications.
For any port using the GloBallast BWRA system, a copy of the world bioregions map should
also be provided to the data-entry officers so that the bioregion of any new port added to the
database can be quickly identified.
· Any port officer whose duties include collecting or receiving BWRFs should be instructed to
check that all relevant fields have been completed in legible script, and to decline any Ballast
Water Management Plan offered by the vessel in lieu of a BWRF. A short BWRF information
kit and training course provided to port officers and local shipping agents is strongly
recommended, particularly during the implementation of the BWRF system at any port.
· Owing to the large number of possible errors and misinterpretations that can be made with the
existing IMO-BWRF (particularly if collected by a port on a voluntary basis), there is no
60
5 Conclusions and Recommendations
doubt that only people with previous experience or practical knowledge of port and shipping
operations make the best BWRF collation and data-entry personnel, and have proved far more
easier and cost effective to train during the BWRA projects undertaken for the six
Demonstration Sites.
5.2
BWRA recommendations and plans by Pilot Country
· The first-pass BWRA indicates that India's domestic port-to-port shipping is an important
vector and therefore merits active BW management and use of BWRFs, especially to help
determine the intra-national pattern of BW transfers. Future delineation of BW-mediated
species invasion and public health risk at any Indian port should measure and contrast the
influence of domestic arrivals versus international arrivals (together with port proximity since
this facilitates both natural and BW dispersion of organisms), and use more port-oriented
approaches for management and treatment of risk species data.
· The current BWRA system does not include vector strength (ballast water vs hull fouling) to
help categorize the risk species, and this will form a useful addition in future risk assessments.
· To make future BWRAs more robust, the port environmental data set needs strengthening for
all Indian and other South Asian region ports, particularly those for which environmental
matching estimates could only be estimated. An appropriate action plan needs to be
developed and sustainable funding requirements evaluated.
· Inadequacies in the BWRFs were found to be a major constraint to the assessment objectives
and reliability of results. The problem of incomplete and problematic paper BWRFs can be
overcome if collation of BW source and discharge data is undertaken via an appropriate
electronic reporting system that is purpose-designed to overcome the shortcomings of the
present BWRF method.
· An action plan needs to be promulgated to bring key stakeholders (port authorities and trusts)
into the realm of BW management in India and other South Asia countries, particularly for
the collation of reliable BWRF information and assistance with port environmental data.
61
6
Location and maintenance of the BWRA System
The GloBallast BWRF hardware and software packages in India are presently maintained at the
GloBallast Programme office in the Ministry of Shipping (Director General office, Mumbai) and at
the NIO in Goa. The following people are currently responsible for maintaining and updating the
following features of the BWRA system in India:
Port resource GIS mapping:
Name:
Dr. A.S. Surnarayana
Organisation:
National Institute of Oceanography, Goa
Organization:
National Institute of Oceanography
Address:
Dona Paula, Goa 403 004, India
Tel: 91-832-245-0301
Fax:
91-832-245-0602
Email:
Ballast water reporting form database:
Name:
Dr Geeta Joshi
Organization:
Directorate General of Shipping, Ministry of Shipping
Address:
Jahaz Bhavan, Walchand Hirachand Marg,
Mumbai 400 001, India
Tel:
91-22-2261-3651 (Ext. 303)
Fax:
91-22-2261-3655
Email: geeta@dgshipping.com
Database management and operations:
Name:
Mr Venkat Krishnamurthy
Organization:
National Institute of Oceanography
Address:
Dona Paula, Goa 403 004, India
Tel: 91-832-245-0380
Fax:
91-832-245-0602
Email:
kvenkat@darya.nio.org
Port environmental and risk species data:
Name:
Dr A.C. Anil
Organization:
National Institute of Oceanography
Address:
Dona Paula, Goa 403 004, India
Tel: 91-832-245-0404
Fax:
91-832-245-0602
Email:
acanil@darya.nio.org
62
References
Carlton, J.T. 1985. Transoceanic and interoceanic dispersal of coastal marine organisms: the biology
of ballast water. Oceanography and Marine Biology Annual Review 23: pp. 313-371.
Carlton, J.T. 1996. Biological invasions and cryptogenic species. Ecology 77: pp. 1653-1655.
Carlton, J.T. 2002. Bioinvasion ecology: assessing impact and scale. In: Invasive aquatic species of
Europe: Distribution, impacts and management. (E Leppäkoski, S Gollasch & S Olenin eds). Kluwer
Academic Publishers, Dordrecht, Netherlands, pp. 7-19..
Cohen, A. & Carlton, J.T. 1995. Non-indigenous aquatic species in a United States estuary: a case
study of the biological invasions of the San Francisco Bay and delta. Report to the US Fish &
Wildlife Service (Washington) and the National Sea Grant College Program Connecticut Sea Grant,
December 1995, 211 pp. (from http://nas.nfreg.gov/sfinvade.htm).
Hilliard, R.W., Hutchings, P.A. & Raaymakers, S. 1997a. Ballast water risk assessment for twelve
Queensland ports:, Stage 4: Review of candidate risk biota. Ecoports Monograph Series No. 13. Ports
Corporation of Queensland, Brisbane.
Hilliard ,R.W., Walker, S., Vogt, F., Belbin, L. & Raaymakers, S. 1997b. Ballast water risk
assessment for twelve Queensland ports, Stage 3B: Environmental similarity analyses. EcoPorts
Monograph Series No. 12. Ports Corporation of Queensland, Brisbane (two volumes).
Kelleher, G., Bleakley, C. & Wells, S. 1995. A Global representative system of marine protected
areas. The World Bank, Washington DC, USA.
Leppäkoski, E., Gollasch, S. & Olenin, S. 2002. Invasive aquatic apecies of Europe: Distribution,
impacts and management. Kluwer Academic Publishers, Dordrecht, Netherlands. 583 pp.
Williamson, A.T., Bax, N.J., Gonzalez, E. & Geeves, W. 2002. Development of a regional risk
management framework for APEC economies for use in the control and prevention of introduced
marine pests. Final report of APEC Marine Resource Conservation Working Group (MRCWG),
produced by Environment Australia, Canberra. 182 pp.
63
APPENDIX 1
Copy of
IMO Ballast Water Reporting Form
from Resolution A.868(20) Appendix 1
(Can be downloaded from http://globallast.imo.org/guidelines)
Appendix 1: Copy of IMO Ballast Water Reporting Form
1
APPENDIX 2
Risk Assessment Team for
Mumbai-JNP, India
Appendix 2: Risk Assessment Team for Mumbai-JNP, India
The BWRA team contained three groups which undertook the GIS mapping (Group A), database
development (Group B) and environmental matching/risk species (Group C) components of the
Activity. The activities of the three groups were coordinated by Dr Arga Chandrashekar Anil Anil
(National Institute of Oceanography, Goa) and Dr Rob Hilliard (URS Australia Pty Ltd).
Group A (GIS mapping)
Person:
Dr. A.S. Surnarayana
Position:
Group A Leader
Organization: National Institute of Oceanography
Address:
Dona Paula, Goa 403 004, India
Email:
surya@darya.nio.org
Person:
Mr Chris Clarke
Position:
Group A Counterpart Trainer
Organization: Meridian GIS Pty Ltd
Email: chris@meridian-gis.com.au
Person:
Mr Andrew Menezes
Position:
Group A GIS cartographer
Organization: National Institute of Oceanography
Address:
Dona Paula, Goa 403 004, India
Email:
amenezes@darya.nio,.org
Person:
Mr Vibhav V. Joglekar
Position:
Group A GIS cartographer
Organization: National Institute of Oceanography
Address:
Dona Paula, Goa 403 004, India
Email:
vhibav@darya.nio.org
Group B (database BW records)
Person:
Dr Geeta Joshi
Position:
Group B Leader BWRF collation and data entries
Organization:
GloBallast Programme, Directorate General of Shipping Office, Mumbai.
Email:
geeta@dgshipping.com
Person:
Mr Terry Hayes
Position:
Group B Counterpart Trainer
Organization:
URS Australia Pty Ltd
Email:
john_polglaze@urscorp.com
Person:
Captain J Misra (Senior Dock Master, JNP)
Position:
Group B JNPT port record coordinator
Organization: JNPT Port Authority, Sheva Island, Mumbai.
Person:
Captain A.W. Kakare (Dock Master, MPT)
Position:
Group B MPT port record coordinator
Organization: Mumbai Port Trust (Port House, S.V.Marg, Ballard Estate, Mumbai 400-001, India)
1
Ballast Water Risk Assessment, Ports of Mumbai and Jawaharlal Nehru, India, October 2003: Final Report
Group C (port environment and risk species data)
Person:
Dr Arga Chandrashekar Anil
Position:
Group C Leader (risk species data collation, regional networking and similarity
analysis)
Organization:
National Institute of Oceanography, Dona Paula, Goa, India
Email:
acanil@darya.nio.in
Person:
Dr Robert Hilliard
Position:
Group C Counterpart Trainer
Organization:
URS Australia Pty Ltd
Email:
robert_hilliard@urscorp.com.au
Person:
Mr Venkat Krishnamurthy
Position:
Group C Risk species data collation and BWRA computer system manager
Organisation:
National Institute of Oceanography, Dona Paula, Goa, India
Email:
kvenkat@darya.nio.org
Person:
Dr Shubhash S. Sawant
Position:
Group C Port environmental data collation
Organisation:
National Institute of Oceanography, Dona Paula, Goa, India.
Email:
sawant@darya.nio.org
Project Manager
Steve Raaymakers
Programme Coordination Unit
International Maritime Organization
sraaymak@imo.org
http://globallast.imo.org
2
.
APPENDIX 3
Check-list of project requirements
circulated at initial briefings in January 2001
(during 3rd GPTF meeting, Goa)
Appendix 3: Check-list of project requirements circulated at initial briefings in January 2001 (during 3rd GPTF meeting, Goa)
PROJECT REQUIREMENTS AND PROVISIONAL SCHEDULE
REMINDER AND CHECK LIST FOR CFP/CFP-A
(1)
Confirm your availability of adequate PC hardware, + Windows, Access & peripherals
At least one PC with sufficient processor speed, memory, Windows software and peripherals must be
dedicated to the project (plus full-time use during the two visits by the URS Team).
PC Capability: - at least 600 MHz Processor speed
- at least 10 GB of Hard Disk capacity
- at least 128 MB RAM
- 3D Graphics Card with 16 MB of RAM
- x24 speed CD-ROM drive
- 21" 16-bit high-colour Monitor (XVGA or higher)
- a 10/100 base Network Card and 56k modem.
PC Software: OS: at least MS Windows 98 (preferably higher).
MS Access: This database program is usually bundled inside MS Office 97 (Business
Edition), Office Pro; Office 2000; etc. Please check with your IT people if unsure.
MS Word, MS Excel, MS PowerPoint.
PC Peripherals: Convenient access to following peripherals for convenient data inputs and outputs:
- B/W laser printer (>8 pages per minute);
- A3 or A4 colour printer;
- CD Burner
- Flatbed scanner and digitising board
- Semi-auto or auto-archiving system, such as external Zip-Drive, Tape Drive or
LAN servers. This is essential for protecting databases from accidental erasures,
hard drive crashes, system failures, office fire, burglary, etc.
(2)
Identify Your BWRA Project Team (10 people recommended):
Required Pilot Country Counterparts
PCU Consultants
BWRA project team leader
Consultants team leader
PC system and GIS operator (x2)
GIS and database specialist
MS Access database operator (x2)
BWRF and shipping record manager (x2)
Shipping record & port data specialist
Port environmental data searcher (x2)
Environmental similarity analyst (x2)
BWRA specialist
Risk species networker / biologist
NB: when selecting team members, please note training will be conducted in English.
1
Ballast Water Risk Assessment, Ports of Mumbai and Jawaharlal Nehru, India, October 2003: Final Report
(3)
Check all existing Port GIS, Coastal Resource Atlas, Electronic Charts/Digital
Databases [refer to Briefing Paper - GTPF Agenda Item 4 [BWRA Action Required], and the
consultants questionnaire provided at Goa (please complete and return a copy)
(4)
Confirm Dates and Local Arrangements for first consultants visit.
Provisional Dates for 1st Visit (5 working days)
Monday 25 February- Friday 1 March 2002
Odessa, Ukraine
Saturday 2 March- Thursday 7 March 2002
Tehran/Khark Is, I.R. Iran
Monday 11 March- Friday 15 March 2002
Mumbai/Goa, India
Monday 25 March - Friday 29 March 2002
Saldahna, South Africa
Monday 1 April- Friday 5 April 2002
Sepetiba, Brazil
Tuesday 9 April- Saturday 14 April 2002
Dalian, China
Logistics:
Assistance required for visa applications?
Customs clearance required for importation of computer software?
Local transport / work location / office facilities / accommodation
1st Visit Activities:
·
Install and test the ArcView 3.2 GIS package, and the Primer 5 statistical package;
·
Commence GIS training by digitising the port map (from any existing digital files, paper charts,
maps, habitat information, articles, publications, aerial photos, etc);
·
Review all data collated by Country Project Team, including existing databases. Set up the Access
database for ship arrival records and the IMO BWRF. Commence training on the Graphic User
Interfaces for BWRF inputs
·
Collate and review pre-IMO BWRF shipping records to determine source and destination ports,
vessel types and trading patterns.
·
Review available port environmental data and potential sources of same (see Attachment)
·
Commence assembling the risk species list (locate and commence networking with marine
biologists in your country and region).
·
Identify the critical information gaps.
·
Identify the data collating and input work to be completed before the 2nd Visit.
·
Agree on a provisional date for start of 2nd Visit (10 working days).
2nd Visits (10 work days). Complete port map digitising; install bioregional map; complete and add
risk species to database; perform environmental similarity analysis; undertake risk assessment;
evaluate results; review and reporting.
Environmental Data Requirements - see next page, attached.
2
Appendix 3: Check-list of project requirements circulated at initial briefings in January 2001 (during 3rd GPTF meeting, Goa)
ATTACHMENT
TYPES OF ENVIRONMENTAL DATA FOR PORT SIMILARITY ANALYSIS
The project requires two types of port environmental data:
(A) Charts and marine habitat and resources data are required for the GIS Port Map, and
(B) A range of parameters (measured in or near port) for the Environmental Similarity Analysis.
In the case of the quantitative parameters, these include:
·
Mean water temperature during the summer [monsoon] season (oC)
·
Maximum water temperature at the hottest time of the summer [monsoon] season (oC)
·
Mean water temperature during the winter [dry] season (oC)
·
Minimum water temperature at the coldest time of the winter [dry] season (oC)
·
Mean day-time air temperature recorded in summer [monsoon] season (oC)
·
Maximum day-time air temperature recorded in summer [monsoon] season (oC)
·
Mean night-time air temperature recorded in winter [dry] season (oC)
·
Minimum night-time air temperature recorded in winter [dry] season (oC)
·
Mean water salinity during the wettest period of the year (grams/litre; ppt)
·
Lowest water salinity at the wettest time of the year (grams/litre; ppt)
·
Mean water salinity during the driest period of the year (grams/litre; ppt).
·
Highest water salinity at the driest time of the year (grams/litre; ppt).
·
Mean Spring Tidal range (metres)
·
Mean Neap Tide range (metres)
·
Total rainfall in the port's driest 6 months season (millimetres)
·
Total rainfall in the port's wettest 6 months season (millimetres)
·
Number of months accounting for 75% of total annual rainfall (=duration of peak discharges)
·
Number of kilometres from the berths to the nearest river mouth (negative value if upstream)
·
Size of this river's catchment (square kilometres)
[Categorical variables are also required, but these are easy to obtain from charts, maps, articles,
etc]
3
.
APPENDIX 4
Information sources used for collating
Port Environmental Data
Appendix 4: Information sources used for collating Port Environmental Data
Continued over...
1
Ballast Water Risk Assessment, Ports of Mumbai and Jawaharlal Nehru, India, October 2003: Final Report
2
APPENDIX 5
Sources and references of
Risk Species information
Appendix 5: Sources and references of Risk Species information
1
Furlani, D (1996). Guide to Introduced Species, CSIRO Marine Research, Hobart, Tasmania (folder-file
format).
2
McClary DJ & Nelligan RJ, 2001. Alternate Biosecurity Maangement Tools for Vector Threats: Technical
guidelines for Acceptable Hull Cleaning Facilities. Research Report No. ZBS 2000/03, prepared by Kingett
Mitchell & Associates for New Zealand Ministry of Fisheries, September 2001. 29 pp.
2a M. Shaffelke, cited in McClary DJ & Nelligan RJ (2001). [see reference 2]
3
Cohen AN & Carlton JT (1995). Biological study: Non-indigenous aquatic species in a united States
estuary: a case study of the biological invasions of the San Francisco Bay and Delta. US Fisheries &
Wildlife National Sea Grant College Program Report PB96-168525. Springfield Virginia, USA.
http://nas.er.usgs.gov/publications/sfinvade.htm
4
Pollard DA & PA Hutchings (1990a,b). A review of exotic marine organisms introduced to the Australian
region. I. Fishes (a); and II. Invertebrates and Algae (b). Asian Fisheries Science 3: 205-222 (a) and 223-
250 (b).
4a Wallaston 1968 and Wommersley 1981, cited in Pollard D & Hutchings PA (1990). [see reference 4]
4b Skinner & Womersley 1983, cited in Pollard D & Hutchings PA (1990). [see reference 4]
4c Allen (1953) - cited in Pollard D & Hutchings PA (1990). [see reference 4]
5
Australian NIS lists compiled by CSIRO-CRIMP (1997); CCIMPE (2001); SSC/SCFA (2000)[see reference
23]
6
Hutchings PM, Van Der Velde J & S Keable (1989). Baseline survey of the benthic macrofauna of Twofold
Bay, NSW, with a discussion of the marine species introduced into the bay. Proceedings of the Linnaean
Society of New South Wales 110 (4): 339-367.
6a Baker, cited by Hutchings et al (1989). [see reference 6]
7
Australian Coral Reef Society (1993). A Coral Reef Handbook (3rd Edition). Surrey Beatty & Sons Pty Ltd,
Chipping Norton NSW, 264 pp.
8
Coles SL, DeFelice RC, Eldredge LG and JT Carlton (1997) Biodiversity of marine communities in Pearl
Harbor, Oahu, Hawaii with observations on introduced exotic species. Bernice Pauahi Bishop Museum
Technical Report No. 10: 1-76
9
Dakin WJ (1976). Australian Seashores (Australian Natural Science Library Edition). Angus & Robertson,
Sydney, 372 pp.
10 Carlton JT (1985). Transoceanic and Interoceanic Dispersal of Coastal Marine Organisms: The Biology of
Ballast Water. Oceanogr. Mar. Biol. Ann. Rev. 23: 313-371.
11 Boyd S, Poore GCB & RS Wilson (1996). Macrobenthic invertebrates of soft sediments in Port Phillip Bay:
Introduced Species. Unpubl. report to CSIRO-CRIMP by Museum of Victoria, Melbourne, 7-96. 122 pp.
12 Gosliner TM, Behrens DW & Williams GC (1996). Coral Reef Animals of the Indo-Pacific - Animal life from
Africa to Hawaii exclusive of vertebrates. Sea Challengers, Monterey CA, 314 pp.
13 Wells FE & C Bryce (1988). Seashells of Western Australia (Revised Edition). Western Australian
Museum, Perth. 207 pp.
14 Tan LWH & PKL Ng (1988). A guide to the seashore of Singapore. Singapore Science Centre, Singapore,
159 pp.
15 Wells FE & RN Kilburn, 1986. Three temperate-water species of South African gastropods recorded for the
first time in southwestern Australia. Veliger 28(4): 453-456.
16 Gosliner TM (1987). Guide to the nudibranchs (opisthobranch molluscs) of Southern Africa. Sea
Challengers and Jeff Hamann. Monterey.
17 Wasson & Shepherd (1995): cited in Cohen & Carlton (1995) [see reference 3].
18 Middleton MJ (1982). The oriental goby, Acanthogobius flavimanus (Temminck and Schlegel), an
introducedfish in the coastal waters of New South Wales, Australia. J. Fish Biology 21: 513-523.
19 In: Leppäkoski E, Gollasch S. & S Olenin (eds) (2002). Invasive aquatic apecies of Europe: Distribution,
impacts and management. Kluwer Academic Publishers, Dordrecht. 583 pp.
20 Morton, B (1981). Biology and functional morphology of Mytilopsis sallei (Recluz) (Bivalvia: Dreissenacea)
fouling Visakhapatnam Harbour, Andra Pradesh, India. Journal of Molluscan Studies 47: 25-42.
21 Gollasch, S (2002). Importance of ship hull fouling as a vector of species introductions into the North Sea.
Biofouling 18: 105-121.
22 Hass CG & DS Jones (1999). Marine introductions to western Australia, with a focus on crustaceans. In:
Kesby JA, Stanley JM, McLen RF & Olive LJ (eds). Geodiversity: Readings in Australian Geography at the
close of the 20th Century. Special Publication Series No. 6, School of Geography & Oceanography,
University College, Australian Defence Force Academy, Canberra ACT. pp. 37-44.
23 Environment Australia (2000). Joint SCC-SCFA Report of the National Taskforce on the Prevention and
Management of Marine Pest Incursions (October 2000 edition). Environment Australia, Canberra,
Australia.
24 Domingues Rodrigues M & AI Brossi Garcia (1989). New records of Pachygrapsus gracilis (Saussure,
1858) in the Brazilian Littoral. Ciene Cult San Paulo 41: 63-66.
1
Ballast Water Risk Assessment, Ports of Mumbai and Jawaharlal Nehru, India, October 2003: Final Report
25 Dadon JR (1984). Distribution and abundance of Pteropoda: Thecostomata (Gastropoda) in the
Southwestern Atlantic. Physis (Buenos Aires) 42: 25-38.
26 Christeffersen ML (1980). Is Alpheus heterochaelis Say (Crustacea, Decapoda, Alpheidae) found along the
Brazilian coasts? Review Nordestina Biology 3: 236-237.
27 Galil B & C Golani (1990). Two new migrant decapods from the Eastern Mediterranean. Crusteceana 58:
229-236.
28 Hanna GD (1966). Introduced molluscs of western North America. Occasional Papers of Californian
Academy of Science 48: 1-108.
29 Yoloye V (1976). The ecology of the West African Bloody cockle, Anadara (Senilia) senilis (L.). Bulletin of
the Institute Portdam Africique Noire (Series A) 38: 25-56.
30 Jones DS (1992). A review of Australian fouling barnacles. Asian Marine Biology 9: 89-100.
31 Wang JJ & ZG Huang (1993). Fouling polychaetes of Hong Kong and adjacent waters. Asian Marine
Biology 10: 1-12.
32 Arakawa KY (1980). On alien immigration of marine sessile invertebrates into Japanese waters. Marine
Fouling 2: 29-33.
33 Carlton J (1999). Molluscan invasions in marine and estuarine communities. Malacologia 41(2): 439-454.
34 Griffiths CL, Hockey PAR, Van Erkom Shurink C & PJ Le Roux (1992). Marine invasive aliens on South
Africa's shores: implications for community structure and trophic functioning. South African Journal of
Marine Science 12: 713-722.
35 Wang C (1995). Some introduced molluscas [sic] in China. Sinozoologia 12: 181-191 (in Chinese).
36 Cranfield HJ, et al (1998). Adventive marine species in New Zealand. National Institute of Water and Air
Research (NIWA) Technical Report 34, Auckland, New Zealand, 48 pp.
37 Dineen J, 2001. Exotic species reports for Indian River Lagoon, Florida. Smithsonian Fort Pierce website:
http://www.serc.si.edu
38 J Mackie, 2001. Bryozoans at Port of Geraldton, with notes on taxonomy and distribution. In: Geraldton
Port Survey. Unpublished report to Geraldton Port Authority by the Western Australian Museum, Perth,
August 2001.
39 Wonham MJ, Carlton JT, Ruiz GM & LD Smith (2000). Fish and ships: relating dispersal frequency to
success in biological invasions. Marine Biology 136: 1111-1121.
40 NIS data for Angola; supplied by Adnan Adawad (GloBallast Programme, Cape Town, South Africa:
adawad@mcm.wcape.gov.za).
41 Dr Tamara Robertson, University of Cape Town (pers. comm.; August 2002).
42 Gollasch, S. & Griffiths, C (2000). Case studies of introduced species in South African waters prepared for
the GloBallast Programme. Report prepared for Globallast Programme; available from Adnan Adawad
(GloBallast Programme, Cape Town, South Africa: adawad@mcm.wcape.gov.za).
43 Draft provisional species list (9/02) from the Saldanha Bay Port Baseline Biological Survey (supplied by
Adan Adawad (GloBallast Programme, Cape Town, South Africa): adawad@mcm.wcape.gov.za)
44 NIS data for Tanzania; supplied by Adnan Adawad (GloBallast Programme, Cape Town, South Africa:
adawad@mcm.wcape.gov.za).
45 NIS data for Mauritius; supplied by Adnan Adawad (GloBallast Programme, Cape Town, South Africa:
adawad@mcm.wcape.gov.za).
46 NIS data for Mozambique; supplied by Adnan Adawad (GloBallast Programme, Cape Town, South Africa:
adawad@mcm.wcape.gov.za).
47 GloBallast Programme (2002). List of Alien Species. http://www.globallast.org
48 Williamson AT, Bax NJ, Gonzalez E & W Geeves (2002). Development of a regional risk management
framework for APEC economies for use in the control and prevention of introduced marine pests. Final
report of APEC Marine Resource Conservation Working Group, produced by Environment Australia,
Canberra. 182 pp.
49 Walters S, 1996. Ballast water, hull fouling and exotic marine organism introductions via ships - a Victorian
study. Environment Protection Authority of Victoria, Publication 494 (May 1996).
50 Pitcher, G (1998). Harmful algal blooms of the Benguela current. Colour publication available from Sea
Fisheries Research Institute (Private Bag X2, Rogge Bay 8012), Cape Town, Republic of South Africa (20
pp).
51 Benson AJ, Williams JD, Marelli DC, Frischer ME & Danforth JM, 2002. Establishment of the green
mussel, Perna viridis, on the West Coast of Florida. In: Proceedings of 11th International Conference of
Aquatic Invasive species (Feb 25 to March 1, 2002, Washington DC). nvironment Department, US Army
Engineer & Research Development Laboratory, US.
52 Platvoet D, Dick JTA & DW Kelly (2002). Comparative morphometrics of mouthparts and antennae in the
invasive Dikerogammeros villosus and the native Gammarus duebeni (Crustacea, Amphipoda). In:
Proceedings of 11th International Conference of Aquatic Invasive species (Feb 25 to March 1, 2002,
Washington DC). Environment Department, US Army Engineer & Research Development Laboratory, US.
2
Appendix 5: Sources and references of Risk Species information
53 Strong JA (2002). Faunal and habitat comparisons from under and outside canopies of Sargassum
muticum. In: Proceedings of 11th International Conference of Aquatic Invasive species (Feb 25 to March 1,
2002, Washington DC). Hosted by Environment Department, US Army Engineer & Research Development
Laboratory.
54 Verween A (2002). Economic impact of biofouling control of an exotic bivalve, Mytilopsis leucophaeta, in
the harbour of Antwerp, Belgium. In: Proceedings of 11th International Conference of Aquatic Invasive
species (Feb 25 to March 1, 2002, Washington DC). Environment Department, US Army Engineer &
Research Development Laboratory, US.
55 Perry HM, Lukens R, et al, 2002. Invasive species and implications for fisheries sustainability in the Gulf of
Mexico. In: Proceedings of 11th International Conference of Aquatic Invasive species (Feb 25 to March 1,
2002, Washington DC). Environment Department, US Army Engineer & Research Development
Laboratory, US.
56 Makarewicz, JC (2002). Distribution, fecundity, genetics and invasion routes of Cercopafis pengoi
(Ostroumov) - a new exotic zooplankter in the Great Lakes Basin. In: Proceedings of 11th International
Conference of Aquatic Invasive species (Feb 25 to March 1, 2002, Washington DC). Hosted by
Environment Department, US Army Engineer & Research Development Laboratory.
57 Bauer CR & Lamberti GA (2002). Potential interactions between Eurasian Ruffe and Round Gobies in the
Great Lakes: Prey and habitat differences. In: Proceedings of 11th International Conference of Aquatic
Invasive species (Feb 25 to March 1, 2002, Washington DC). Environment Department, US Army Engineer
& Research Development Laboratory. US.
58 Darrigran G et al (2002). Abundance and distribution of golden mussel (Limnoperna fortunei) larvae in a
hydroelectric plant in South America. In: Proceedings of 11th International Conference of Aquatic Invasive
species (Feb 25 to March 1, 2002, Washington DC). Environment Department, US Army Engineer &
Research Development Laboratory, US.
59 Personal communications and manuscripts supplied by Dr Andrea Junqueira, Dr Flavio Fernandes, Dr
Luciano Felicio Fernandes , Dr Luis Proenca during BWRA workshop at FEEMA, Rio de Janeiro (30
August 2002).
60 Fernandes, LF et al (2001). The recently established diatom Coscinodiscus wailesii in Brazilian waters:
taxonomy and distribution. Phycological Research 2001.
61 Paula, A,F (2002). Spatial abundance and distribution of invading coral Tubastraea in Ilha Grande Bay
(RJ) and record of T. tagusensis and T. coccinea in Brazil. M.Sc thesis, State University of Rio de Janeiro,
May 2002.
62 Translated material provided by Assoc Prof. (Biol.) Wang Lijun and Mr Jiang Yuewen (National Marine
Environment Protection & Monitoring Centre, State Administration of Oceanography (Dalian Office), China
(including preliminary lists of identified species sampled by Port Baseline Biological Survey for Dalian
(GloBallast Programme); September 2002).
63 Anil AC, Venkat K, Sawant SS, Dileepkumar M, Dhargalkar VK, Ramaiah N, Harkantra SN & ZA Ansari
(2002). Marine bioinvasions: Concern for ecology and shipping. Current Science 83(3): 214-218.
64 K Satyanarya Rao (2002). Proceedings of 1st R&D Seminar, Global Ballast Water Management
Programme. National Institute of Oceanography, Goa, India. June 2002.
65 National Institute of Oceanography (2001). Report released to mass-media (from Dr AC Anil, NIO, Goa).
66 Xu, CY (1982). Surveys on the causal organisms of red tides in Dalian Bay. Journal of Fisheries, China
6(2): 173-180 (in Chinese).
67 Iizuka S (1976). Succession of red tide organisms in Omura Bay with relation to water pollution. Bulletin of
the Plankton Society of Japan 23(1): 31-43 (in Japanese).
68 Kuriakose PS (1980). Mussels (Genus Perna) of the Indian coast. In: Coastal aquaculture of mussels -
Progress and Prospects. Central Marine Research Fisheries Institute (Cochin, India).
69 Thompson MF (1994). Recent developments in biofouling control. Oxford & IBH Publishing Co, Pty Ltd,
UK.
70 National Institute of Oceanography: Bryozoan Identifications (volume provided by Dr AC Anil, NIO, Goa,
India)
71 Zaitsev Y & B Ozturk (2001). Exotic Species in the Aegean, Marmara, Black, Azov and Caspian Seas.
Publication No.8, Turkish Marine Foundation, Istanbul. Turk Deniz Arastirmalari Vakfi. Istanbul.
72 CIESM Atlas of Introduced Species in Mediterranean Sea (2002). http://www.ciesm.org/atlas
73 McMinn, A (1990). Recent dinoflagellate cyst distribution in eastern Australia. Review of Paleobotany and
Palynology 65: 305-310.
74 Karunasagar I, Gowda HSV, Subburaj M, Venugopal MN & I Karunasagar (1984). Outbreak of paralytic
shellfish poisoning in Mangalore, west coast of India. Current Science 53(5): 247-249.
75 Yoon YH et al (1991). Red tide organisms in the coastal waters of Cheju Island, southern Korea. Bulletin of
Marine Research Institute, Cheju National University 15: 1-14.
76 Pillai CSG & Jasmine S (1991). Life cycle of Perna indica. In: Symposium on tropical marine living
resources, Cochin, Kerala (india), 12-16 January 1988. J. Mar Biol. Association India 33(1-2): 159-165.
3
Ballast Water Risk Assessment, Ports of Mumbai and Jawaharlal Nehru, India, October 2003: Final Report
77 Coles SL, DeFelice RC & LG Eldredge (1999). Nonindigenous marine species introductions in the harbors
of the south and west shores of Oahu, Hawaii. Bishop Museum Technical Report No. 15 (Bernice Pauahi
Bishop Museum, Honolulu, Hawaii).
78 Coles SL, DeFelice RC, Eldredge LG & JT Carlton (1999). Historical and recent introductions of non-
indigenous marine species into Pearl Harbor, Oahu, Hawaiian Islands. Marine Biology 135:147-158.
79 Coles SL, DeFelice RC & D Minton (2001). Marine species survey of Johnston Atoll, Central Pacific
Ocean, June 2000. Bishop Museum Technical Report No. 19 (Bernice Pauahi Bishop Museum, Honolulu,
Hawaii).
80 DeFelice RC, Coles SL, Muir D & LG Eldredge (1998). Investigation of marine communities at Midway
Harbor and adjacent lagoon, Midway Atoll, north western Hawaiian Islands. Bishop Museum Hawaiian
Biological Survey Contribution No. 1998-014 (Bernice Pauahi Bishop Museum, Honolulu, Hawaii).
81 Hewitt C (2002). Distribution and biodiversity of Australian tropical marine bioinvasions. Pacific Science
56(2): 213-222.
82 Coles SL & LG Eldredge (2002). Nonindigenous species introductions on coral reefs: a need for more
information. Pacific Science 56(2): 191-209.
83 Hoedt FE, Choat JH, Collins J & JJ Cruz (2000). Mourilyan Harbour and Abbot Point surveys: Port
baseline surveys for introduced marine pests. Unpubl. report to Ports Corporation of Queensland
(Brisbane). School of Marine Biology & Aquaculture, James Cook University, Townsville
84 Choo PS, 1994. A Review on Red Tide Occurrences in Malaysia. Department of Fisheries, Ministry of
Agriculture, Kuala Lumpur, Malaysia.
85 Southward AJ, Burton RS, Coles SL, Dando PR, DeFelice R, Hoover J, Newman WA, Parnel E,
Yamaguchi (1998). Invasion of Hawaiian inner shores by an Atlantic barnacle. Marine Ecology Progress
Series 165:119-126.
86 Nichols FH, Thompson JK & LE Schemel (1990). Remarkable invasion of San Francisco Bay (California,
USA) by the Asian clam Potamocorbula amurensis. II. Displacement of a former community. Marine
Ecology Progress Series 66: 95-101.
87 Pyne R (1999). The black-striped mussel (Mytilopsis sallei) infestation in Darwin: clean-up strategy. In:
EcoPorts Monograph Series No.19 (77-83). Ports Corporation of Queensland, Brisbane.
88 Culver, CS (2000). Apparent eradication of a locally established introduced marine pest. Biological
Invasions 2 (3): 245-253.
89 Fofonoff PW, Ruiz GM, Hines AH & L McCann (1999). Overview of biological invasions in the Chesapeake
Bay region: summary of impacts on coonservation of biological diversity: a key to the restoration of the
Chesapeake Bay and beyond. Monograph. Maryland Department of Natural Resources, pp.168-180.
90 Veldhuizen TC & S Stanish (1999). Overview of the Life History, Distribution, Abundance, and Impacts of
the Chinese mitten crab, Eriocheir sinensis. Environmental Studies Office, California Department of Water
Resources, Sacramento, CA 95816. March 1999.
91 NTMAG & CSIRO, 2000. Port survey of introduced marine species., Port of Darwin. Unpublished report
provided by Dr Barry Russel, Museum & Art Gallery of the Northern Territory, Darwin, Northern Territory,
Australia.
92 Faunce CH and Lorenz JJ (2000) Reproductive biology of the introduced Mayan cichlid, Cichlasoma
urophthalmus, within an estuarine mangrove habitat of southern Florida. Environmental Biology of Fishes
58: 215225.
93 Zhang F & M Dickman (1999). Mid-ocean exchange of container vessel ballast water. 1: Seasonal factors
affecting the transport of harmful diatoms and dinoflagellates. Marine Ecology Progress Series 176:243-
251.
94 Harris LG & MC Tyrell (2001). Changing Community States in the Gulf of Maine: Synergism Between
Invaders, Overfishing and Climate Change. Biological Invasions 3 (1): 9-21.
95 Crooks JA & CA Jolla (2001). Assessing invader roles within changing ecosystems: historical and
experimental perspectives on an exotic mussel in an urbanized lagoon. Biological Invasions 3 (1): 23-36.
96 In: Raaymakers S (Ed.) (2002). Baltic regional workshop on ballast water management, Tallinn, Estonia.,
22-24 October 2001: Workshop report. GloBallast Monograph Series No.2. IMO, London.
97 Gosling EM (1992). Systematics and geographic distribution of Mytilus. In: Gosling EM (Ed.) The Mussel
Mytilus: Ecology, Physiology, Genetics and Culture. Elsevier Press, Netherlands.
98 In: Raaymakers S & C Gregory (Eds) (2002). 1st East Asia regional workshop on ballast water control and
management, Beijing, China. 31 Oct 2 Nov 2002: Workshop report. GloBallast Monograph Series No.6.
IMO, London.
99 Eno NC, Clark RA & Sanderson WG (Eds). Directory of non-native marine species in British waters.
http://www.jncc.gov.uk/marine/dns/default.htm
100 Oderbrecht et al (2002).
101 Ports & Shipping Organisation (2002). Species tables. In: Draft report of seasonal Port Baseline Biological
Surveys for Port of Khark Island. Unpublished manuscript provided by PSO, Tehran, I.R. Iran.
4
Appendix 5: Sources and references of Risk Species information
102 Introduction to non-indigenous species of the Gulf of Mexico (2002). Website:
http://www.gsmfc.org/nis/nis/Perna_perna.html
103 Erkki Leppäkoski E & S Olenin (2000). Non-native species and rates of spread: Lessons from the brackish
Baltic Sea. Biological Invasions 2 (2):151-163.
104 Ambrogi AO (2000). Biotic invasions in a Mediterranean lagoon. Biological Invasions 2 (2): 165-176
105 Galil BS (2000). A sea under siege alien species in the Mediterranean. Biological Invasions 2 (2):177-
186
106 Mann, R (2000). Invasion of the North American atlantic coast by a large predatory Asian mollusc
Biological Invasions 2(1): 7-22
107 Lohrer AM, Whitlatch RB, Wada K & Y Fukui (2000). Home and away: comparisons of resource utilization
by a marine species in native and invaded habitats. Biological Invasions 2 (1):41-57
108 Wasson, K & B Von Holle (2000). Detecting invasions of marine organisms: Kamptozoan case histories.
Biological Invasions 2(1): 59-74.
109 Rivest BR, Coyer J, Haren AA & S Tyler (1999). The first known invasion of a free-living marine flatworm.
Biological Invasions 1(4): 393-394
110 E x o t i c s p e c i e s l i s t o f t h e M o n t e r e y B a y N a t i o n a l M a r i n e S a n c t u a r y .
http://bonita.mbnms.nos.noaa.gov/sitechar/spex.html
111 F A O d a t a b a s e o n a q u a t i c s p e c i e s i n t r o d u c t i o n s :
http://www.fao.org/waicent/faoinfo/fishery/statist/fisoft/dias/index.htm
112 Global Invasive Species Program (GISP): http://jasper.stanford.edu/GISP/ and GISP Database:
http://www.issg.org/database/welcome/
113 Group on Aquatic Alien Species (GAAS) (Russia): http://www.zin.ru/projects/invasions/index.html
114 Gulf of Maine Ballast Water and Exotic Species Web Sites: http://www.gulfofmaine.org/library/exotic.htm
115 Gulf of Mexico Program Nonindigenous Species Information: http://pelican.gmpo.gov/nonindig.html
116 Smithsonian Environmental Research Center (SERC marine invasions lab): http://invasions.si.edu/
117 Ecological Society of Japan (Ed.) (2002). Handbook of alien species in Japan. (published 9/02).
Chijinchokan Ltd, Tokyo (in Japanese). 390pp. http://www.chijinshokan.co.jp
118 Fine M, Zibrowius H & Y Loya (2001). Oculina patagonica: a non-lessepsian scleractinian coral invading
the Mediterranean Sea. Springer-Verlag (New York):
http://linl.springer-ny.com/link/service/journals/00227/contents/01/00539/
119 Schaffelke B, Murphy N & S Uthicke (2002). Using genetic techniques to investigate the sources of the
invasive alga Caulerpa taxifolia in three new locations in Australia. Mar Poll Bull 44: 204-210.
120 Washington State Sea Grant Program: Non-indigenous aquatic species:
http://www.wsg.washington.edu/outreach/mas/nis/nis.html
121 Baltic Research Network on invasions and introductions (NEMO). Website:
http://www.ku.lt/nemo/mainnemo.htm
122 US Geological Service non-indigenous aquatic species (NIAS) website:
http://nas.er.usgs.gov/
123 National aquatic nuisance species clearing house - Seagrant Program:
http://www.entryway.com/seagrant/
124 Esmaili Sari A, Khodabandeh S, Abtahi B, Sifabadi J & H Arshad (2001). Invasive comb jelly Mnemiopsis
leidyi and the future of the Caspian Sea. Faculty of Natural Resources and Marine Sciences, University of
Tarbiat Modarres. Kor, Mazandaran, IR Iran. ISBN: 964-91086-2-9. (+95 pp; non-English). Obtainable
from: yavarivahid@hotmail.com ; yavari@ir-pso.com .
125 Cohen BF, Heislers S, Parry GD, Asplin MD, Werner GF & JE Restall (2002). Exotic marine pests in the
outer harbour of the Port of Adelaide. Marine and Freshwater Resources Institute of Victoria (Report No.
40), MAFRE, Queenscliffe, Victoria, Australia. (9/02; 86pp.).
5
APPENDIX 6
Name, UN code, coordinates and environmental
parameters of the 357 ports used for the multivariate
similarity analyses for all Demonstration Sites
Appendix 6: Name, UN code, coordinates and environmental parameters
1
Ballast Water Risk Assessment, Ports of Mumbai and Jawaharlal Nehru, India, October 2003: Final Report
2
Appendix 6: Name, UN code, coordinates and environmental parameters
3
Ballast Water Risk Assessment, Ports of Mumbai and Jawaharlal Nehru, India, October 2003: Final Report
4
Appendix 6: Name, UN code, coordinates and environmental parameters
5
Ballast Water Risk Assessment, Ports of Mumbai and Jawaharlal Nehru, India, October 2003: Final Report
6
Appendix 6: Name, UN code, coordinates and environmental parameters
7
Ballast Water Risk Assessment, Ports of Mumbai and Jawaharlal Nehru, India, October 2003: Final Report
8
Appendix 6: Name, UN code, coordinates and environmental parameters
9
Ballast Water Risk Assessment, Ports of Mumbai and Jawaharlal Nehru, India, October 2003: Final Report
10
Appendix 6: Name, UN code, coordinates and environmental parameters
11
Ballast Water Risk Assessment, Ports of Mumbai and Jawaharlal Nehru, India, October 2003: Final Report
12
Appendix 6: Name, UN code, coordinates and environmental parameters
13
Ballast Water Risk Assessment, Ports of Mumbai and Jawaharlal Nehru, India, October 2003: Final Report
14
APPENDIX 7
Consultants' Terms of Reference
Appendix 7: Consultants' Terms of Reference
Consultants' Terms of Reference
Activity 3.1: Ballast Water Risk Assessments
6 Demonstration Sites
1. Introduction & Background
The International Maritime Organization (IMO), with funding provided by the Global Environment
Facility (GEF) through the United Nations Development Programme (UNDP), has initiated the Global
Ballast Water Management Programme (GloBallast).
This programme is aimed at reducing the transfer of harmful marine species in ships' ballast water, by
assisting developing countries to implement existing IMO voluntary guidelines on ballast water
management (IMO Assembly Resolution A.868(20)), and to prepare for the anticipated introduction
of an international legal instrument regulating ballast water management currently being developed by
IMO member countries.
The programme aims to achieve this by providing technical assistance, capacity building and
institutional strengthening to remove barriers to effective ballast water management arrangements in
six initial demonstration sites. These six sites are Sepetiba, Brazil; Dalian, China; Mumbai, India;
Kharg Island, Iran; Saldanha, South Africa and Odessa, Ukraine. The initial demonstration sites are
intended to be representative of the six main developing regions of the world, as defined by GEF.
These are respectively, South America, East Asia, South Asia, Middle East, Africa and Eastern
Europe. As the programme proceeds it is intended to replicate these initial demonstration sites
throughout each region.
2. The Need for the Risk Assessments
The development objectives of the programme are to assist countries to implement the existing IMO
voluntary ballast water management guidelines and to prepare for the introduction of a new
international legal instrument on ballast water.
The current IMO ballast water management guidelines offer states significant flexibility in
determining the nature and extent of their national ballast water management regimes. This flexibility
is warranted given that nations are still experimenting with approaches. A port state may wish to
apply its regime uniformly to all vessels which visit, or it may wish to attempt to assess the relative
risk of vessels to valuable resources and apply the regime selectively to those which are deemed of
highest risk.
The uniform application option offers the advantages of simplified programme administration in that
there are no "judgement calls" to be made or justified by the port state regarding which vessels must
1
Ballast Water Risk Assessment, Ports of Mumbai and Jawaharlal Nehru, India, October 2003: Final Report
participate and which need not. In addition, the system requires substantially less information
management demands. Finally, it offers more protection from unanticipated invaders, and overall
protection is not dependent upon the quality of a decision support system which may not be complete.
The primary disadvantages of this approach are: 1) additional overall cost to vessels which otherwise
might not need to take action, and 2) more vessels will be involved in undertaking the measures, and
therefore the port state will need to monitor compliance from a greater number of vessels.
Some nations are experimenting with systems to allow more selective applicability based upon
voyage-specific risk assessments because this approach offers to reduce the numbers of vessels
subject to ballast water controls and monitoring. The prospect of reducing the numbers of ships to
which the program applies is especially attractive to nations that wish to eliminate introductions of
target organisms such as toxic dinoflagellates. More rigorous measures can be justified on ships
deemed to be of `high risk' if fewer restrictions are placed on low risk vessels. However, this
approach places commensurate information technology and management burdens on port state and its
effectiveness depends on the quality of the information supporting it. The approach may also leave the
country/port vulnerable to unknown risks from non-target organisms.
For countries/ports which choose the selective approach, it will be essential to establish an organized
means of evaluating the potential risk posed by each vessel entering their port, through a Decision
Support System (DSS). Only in this way can they take the most appropriate decision regarding any
required action concerning that vessels' ballast water discharge. The DSS is a management system
that provides a mechanism for assessing all available information relating to individual vessels and
their individual management of ballast water so that, based upon assessed risk, the appropriate course
of action can be taken.
Before a pilot country decides on whether to adopt the `blanket' (i.e. all vessels) approach or to target
specific, identified high risk vessels only, a general, first-past risk assessment needs to be carried out.
This should look at shipping arrival patterns and identify the source ports from which ballast water is
imported. Once these are identified, source port/discharge port environmental comparisons should be
carried out to give a preliminary indication of overall risk. This will greatly assist the port state to
assess which approach to take.
The GloBallast programme, under Activity 3.1; will support these initial , `first-past' risk assessments
as a consultancy on contract to the PCU. This is important for establishing the level and types of risks
of introductions that each port faces, as well as the most sensitive resources and values that might be
threatened. These will differ from site to site, and will determine the types of management responses
that are required.
The PCU risk assessment consultants, in conducting the risk assessment in each pilot country, will
work with and train country counterpart(s) and include them in the study process as part of the
capacity building objectives of the programme, so as to allow each country to undertake its own risk
assessments in future.
3. Scope of the Risk Assessments
A Risk Assessment will be undertaken for each of the ports of:
· Sepetiba, Brazil;
· Dalian, China;
· Mumbai, India;
· Kharg Island, Iran;
· Saldanha, South Africa and
· Odessa, Ukraine.
2
Appendix 7: Consultants' Terms of Reference
The Risk Assessments will apply to all ship movements into and out of these ports based on shipping
data for the last 10 years (or longer if available).
4. Services Required & Tasks to be Undertaken
The GloBallast PCU requires a suitably qualified and experienced consultancy team to undertake the
ballast water risk assessments. The consultancy team will undertake the following Tasks, for each
demonstration site:
Task 1: Resource Mapping
Identify, describe and map on Geographic Information System (GIS) all coastal and marine resources
(biological, social/cultural and commercial) in and around the demonstration site that might be
impacted by introduced marine species.
Task 2: De-ballasting/Ballasting Patterns
Characterise, describe and map (on GIS) de-ballasting and ballasting patterns in and around the ports
including locations, times, frequencies and volumes of ballast water discharges and uptakes.
Task 3: Identify Source Ports
Identify all ports/locations from which ballast water is imported (source ports).
Task 4: Identify Destination Ports
Identify all ports/locations to which ballast water is exported (destination ports).
Task 5: Database - IMO Ballast Water Reporting Form
Establish a database at the nominated in-country agency for the efficient ongoing collection,
management and analysis of the data collected at the demonstration site according to the standard
IMO Ballast Water Reporting Form, and the data referred to under Tasks 2, 3 and 4.
Task 6: Environmental Parameters
Characterise as far as possible from existing data, the physical, chemical and biological environments
for both the demonstration site and each of its source and destination ports.
Task 7: Environmental Similarity Analysis
Using the data from Task 6 and an appropriate multivariate environmental similarity analysis
programme, develop environmental similarity matrices and indices to compare each demonstration
site with each of its source ports and destination ports, as the basis for the risk assessment.
Task 8: High Risk Species
Identify as far as possible from existing data, any high risk species present at the source ports that
might pose a threat of introduction to the demonstration site, and any high risk species present at the
demonstration site that might be exported to a destination port.
3
Ballast Water Risk Assessment, Ports of Mumbai and Jawaharlal Nehru, India, October 2003: Final Report
Task 9: Risk Assessment
For each demonstration site, assess and describe as far as possible, the risk profile for invasive marine
species being both introduced from its set of source ports and exported to its set of destination ports,
and identify the highest risk source and destination ports, using the outputs of Tasks 1 to 8 and based
on the environmental similarity indices developed under Task 7.
Task 10: Training & Capacity Building
While undertaking the risk assessment, provide training and capacity building to the in-country risk
assessment team (up to 10 people) in the risk assessment methodology, including use of database
established under Task 5 and the multivariate environmental similarity analysis programme
established under Task 7.
Task 11: Information Gaps
Identify any information gaps that limit the ability to undertake these Tasks and recommend
management actions to address these gaps.
5. Methods to be Used
The consultants should clearly outline in their Tender how each Task will be achieved. These should
comply with but are not necessarily restricted to the following:
Site Visits:
The consultants will undertake an initial one week (5 working days) visit to each demonstration site to
hold discussions with the CFP, CFP-A, port authority, maritime administration, environment
administration, fisheries/marine resources administration, marine science community and shipping
industry, to identify and obtain information and data for the various Tasks, establish a working
relationship with the in-country risk assessment team, conduct a site familiarisation to the
demonstration site (port) and to identify information gaps.
The consultants will undertake second 8 to 10 working day visit to each demonstration to install the
GIS, database and multivariate environmental similarity analysis programme and to provide training
and capacity building in their use and the overall risk assessment methodology to the in-country risk
assessment team.
Coordination:
The consultants will maintain close consultation and cooperation with the PCU Technical Adviser
(TA), who will manage this consultancy, and with the Country Focal Point (CFP) and CFP Assistant
(CFP-A) in each pilot country, who provide the primary contact point for all in-country activities and
for accessing in-country information and data.
Tasks 1& 2:
This will be restricted existing data only, field surveys are not provided for in the budget. The CFP
and/or CFP-A will compile as much existing information as possible in relation to Tasks 1 and 2 to
provide to the consultants.
The consultants should identify and evaluate any existing in-country databases and GIS for use in
these Tasks. The GIS should be tailored to suit the country's circumstances while ensuring user-
friendliness and consistency across all sites.
4
Appendix 7: Consultants' Terms of Reference
Tasks 3 & 4:
This will be restricted to existing data only. The CFP and/or CFP-A will compile as much existing
information as possible in relation to Tasks 3 and 4 to provide to the consultants. However, the
consultants should identify potential additional sources of data for these two tasks, including records
held by port authorities, shipping agents, customs agencies and similar, that may not have been
identified/compiled by the CFP/CFP-A.
Task 5:
The consultants should identify and evaluate any existing in-country databases for use in this Task.
The database should be tailored to suit the country's circumstances while ensuring user-friendliness,
consistency with the IMO Ballast Water Record Form and consistency across all sites.
Task 6:
This will be based on existing data only. The consultants should clearly outline in their Tender what
parameters will be used, and how the data for these parameters will be collected from the source and
destination ports.
Task 7:
The consultants should clearly outline in their Tender what multivariate environmental similarity
analysis programme will be used, and how it will be used.
Task 8:
The consultants should clearly outline in their Tender how this Task will be achieved, including how
relevant national and international invasive marine species records and databases will be accessed.
Task 9:
The consultants should clearly outline in their Tender how the outputs of Tasks 1 to 8, and in
particular Task 4, will be used to produce the risk profiles for each demonstration site, and what form
these will take.
Task 10 & 11:
The consultants should clearly outline in their Tender how these Tasks will be achieved.
6. Time Frame, End Product and Reporting Procedure
· The risk assessments will be conducted for each of the six demonstration sites in the second
half of 2001 and into the first half of 2002. A detailed workplan and timeline will be
proposed by the consultant in their Tender and the precise timing for each site will be refined
through consultation with each country, once the contract is awarded.
· The end product of this consultancy will be the establishment of the databases, GIS's,
multivariate environmental similarity analysis programmes and risk assessment outputs at
each demonstration site, including training in their use.
· There will also be a report for each demonstration site which addresses as fully as possible all
of the Tasks under section 4, consistent with all parts of these Terms of Reference and the
5
Ballast Water Risk Assessment, Ports of Mumbai and Jawaharlal Nehru, India, October 2003: Final Report
consultancy contract. Results presented should be supported by maps, figures, diagrams and
tables here useful.
· Each report should be submitted to the PCU in draft form first, for review by the PCU and
the demonstration site risk assessment team. The final report for each site will be submitted to
the PCU within one month of the consultants receiving review comments.
· The PCU may arrange for peer review of the draft reports, to ensure scientific credibility and
quality control.
· The final reports should be submitted to the PCU in both hard-copy and electronic form,
including figures, images and data, ready for publication. The PCU will publish each final
report in both English and the main language of the pilot country (if different).
7. Selection Criteria
· Cost effectiveness.
· Demonstrated record of meeting deadlines and completing tasks within budget.
· Extensive experience with the issue of introduced marine species.
· Extensive experience with the issue of ballast water.
· Extensive experience with risk assessment in relation to introduced marine species and ballast
water.
· Demonstrated abilities in literature search and review and in identifying and obtaining reports,
publications, information and data from sometimes obscure and difficult sources.
· Demonstrated skills in information analysis and synthesis.
· Experience in working in developing countries.
· Experience in training and capacity building in developing countries.
· Ability of the proposed methods and workplan to complete all Tasks satisfactorally.
8. Content of Tenders
The Tender should include the following:
· Total lump-sum price in US$D.
· Detailed cost break-down for all Tasks in US$ (NB. Total budget must not exceed US$250,000
and cost-effectiveness and competitiveness within this budget forms a primary selection criteria).
· Detailed workplan and provisional timeline for all Tasks outlined under section 4 above.
· Details of the methods proposed to achieve all Tasks, framed against each Task under section 4
above and consistent with section 5 above.
6
Appendix 7: Consultants' Terms of Reference
· CV's of each consultancy team member (maximum of 3 pages per person) (consultancy teams
should be kept as small as possible).
· Details of the consultancy's professional indemnity and liability insurance and quality assurance
procedures.
Further Information
Steve Raaymakers
Technical Adviser
Programme Coordination Unit
Tel +44 (0)20 7587 3251
Fax +44 (0)20 7587 3261
Email sraaymak@imo.org
7


Ballast W
a
ter Risk Assessment
Global Ballast Water
Management Programme
G L O B A L L A S T M O N O G R A P H S E R I E S N O . 1 1
Ports of Mumbai and Jawaharlal Nehru, India
Ballast Water Risk Assessment
Ports of Mumbai and Jawaharlal Nehru
India
Final Report
OCTOBER 2003
Final Report
A. C. Anil, C. Clarke,
.dwa.uk.com
T. Hayes, R. Hilliard, G. Joshi,
V. Krishnamurthy, J. Polglaze,
GLOBALLAST MONOGRAPH SERIES
S. S. Sawant & S. Raaymakers
More Information?
el (+44) 020 7928 5888 www
Programme Coordination Unit
Global Ballast Water Management Programme
International Maritime Organization
4 Albert Embankment
London SE1 7SR United Kingdom
Tel: +44 (0)20 7587 3247 or 3251
est & Associates, London. T
Fax: +44 (0)20 7587 3261
Web: http://globallast.imo.org
NO.11
A cooperative initiative of the Global Environment Facility,
United Nations Development Programme and International Maritime Organization.
Cover designed by Daniel W