


Ballast W
a
ter Risk Assessment
Global Ballast Water
Management Programme
G L O B A L L A S T M O N O G R A P H S E R I E S N O . 1 0
Port of Odessa, Ukraine
Ballast Water Risk Assessment
Port of Odessa
Ukraine
Final Report
OCTOBER 2003
Final Report
.dwa.uk.com
B. Alexandrov, R. Bashtannyy,
C. Clarke, T. Hayes, R. Hilliard,
J. Polglaze, V. Rabotnyov
GLOBALLAST MONOGRAPH SERIES
& S. Raaymakers
More Information?
el (+44) 020 7928 5888 www
Programme Coordination Unit
Global Ballast Water Management Programme
International Maritime Organization
4 Albert Embankment
London SE1 7SR United Kingdom
Tel: +44 (0)20 7587 3247 or 3251
est & Associates, London. T
Fax: +44 (0)20 7587 3261
Web: http://globallast.imo.org
NO.10
A cooperative initiative of the Global Environment Facility,
United Nations Development Programme and International Maritime Organization.
Cover designed by Daniel W
GloBallast Monograph Series No. 10
Ballast Water Risk Assessment
Port of Odessa
Ukraine
October 2003
Final Report
Boris Alexandrov3, Roman Bashtannyy2,
Christopher Clarke1, Terry Hayes1, Robert Hilliard1,
John Polglaze1, Vladimir Rabotnyov2 & Steve Raaymakers4
1 URS Australia Pty Ltd, Perth, Western Australia
2 Information and Analytical Centre for Shipping Safety, State Department of Maritime and Inland Water
Transport, Ministry of Transport of Ukraine
3 Institute of Biology of the Southern Seas, Odessa Branch
4 Programme Coordination Unit, GEF/UNDP/IMO Global Ballast Water Management Programme, International
Maritime Organization
International Maritime Organization
ISSN 1680-3078
Published in March 2004 by the
Programme Coordination Unit
Global Ballast Water Management Programme
International Maritime Organization
4 Albert Embankment, London SE1 7SR, UK
Tel +44 (0)20 7587 3251
Fax +44 (0)20 7587 3261
Email sraaymak@imo.org
Web http://globallast.imo.org
The correct citation of this report is:
Alexandrov, B, Bashtannyy, R., Clarke, C., Hayes, T., Hilliard, R., Polglaze, J., Rabotnyov, V. & Raaymakers, S. 2004.
Ballast Water Risk Assessment, Port of Odessa, Ukraine, October 2003: Final Report. GloBallast Monograph Series No. 10.
IMO London.
The Global Ballast Water Management Programme (GloBallast) is a cooperative initiative of the Global Environment Facility (GEF),
United Nations Development Programme (UNDP) and International Maritime Organization (IMO) to assist developing countries to reduce
the transfer of harmful organisms in ships' ballast water.
The GloBallast Monograph Series is published to disseminate information about and results from the programme, as part of the
programme's global information clearing-house functions.
The opinions expressed in this document are not necessarily those of GEF, UNDP or IMO.
Ballast Water Risk Assessment, Port of Odessa, Ukraine, October 2003: Final Report
Acknowledgements
The Ballast Water Risk Assessment for the Port of Odessa was undertaken during 2002 and funded by
the GEF/UNDP/IMO Global Ballast Water Management Programme and the Government of Ukraine.
The study team (Appendix 2) thanks the following for their help and assistance:
Mr Ruslan Barskiy
Commercial Sea Port of Illichivsk, Illichivsk, Ukraine
Dr Gustaaf Hallegraeff
University of Tasmania, Hobart, Tasmania
Dr Keith Hayes
CSIRO Marine Research, Hobart, Tasmania
Dr Chad Hewitt
Biosecurity Unit, New Zealand Ministry of Fisheries, Auckland
Mr Vladimir Savusin
State Inspectorate for the Protection of the Black Sea, Ministry of
Environment &Natural Resources of Ukraine, Odessa
Ms Olesya Serdyuk
Department of Energy Saving &Environment Safety, Ministry of
Transport, Kiev, Ukraine
Ms Natalia Syomina
Commercial Sea Port of Yuzhny, Yuzhny, Ukraine
Dr Fred Wells
Western Australian Museum, Perth, Western Australia
The report was formatted and prepared for print by Leonard Webster.
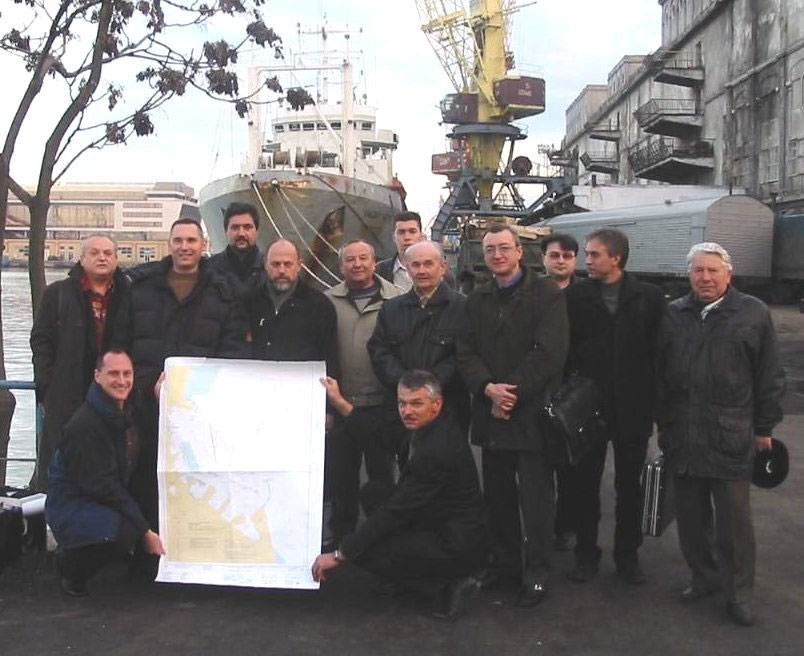
Some of the Ukraine risk assessment team
i
Ballast Water Risk Assessment, Port of Odessa, Ukraine, October 2003: Final Report
Acronyms
BW
Ballast water
BWM
Ballast water management
BWRA
Ballast Water Risk Assessment
BWRF
Ballast Water Reporting Form (the standard IMO BWRF is shown in Appendix 1)
CFP
Country Focal Point (of the GloBallast Programme in each Pilot Country)
CFP/A
Country Focal Point Assistant
CRIMP
Centre for Research on Introduced Marine Pests (now part of CSIRO Marine
Research, Hobart, Tasmania)
CSIRO
Commonwealth Scientific and Industrial Research Organisation (Australia)
CSPO
Commercial Sea Port of Odessa (port authority)
DSS
Decision support system (for BW management)
DWT
Deadweight tonnage (typically reported in metric tonnes)
GIS
Geographic information system
GISP
Global Invasive Species Programme
GloBallast
GEF/UNDP/IMO Global Ballast Water Management Programme
GT
Gross tonnage (usually recorded in metric tonnes)
GUI
Graphic User Interface
IACSS
Information and Analytical Centre for Shipping Safety, State Department of Maritime
and Inland Water Transport, Ministry of Transport of Ukraine.
IALA
International Association of Lighthouse Authorities
IBSS
Institute of Biology of the Southern Seas (Odessa Branch) of the Ukraine National
Academy of Science
IHO
International Hydrographic Organization
IMO
International Maritime Organization
IUCN
The World Conservation Union
LAT
Lowest Astronomical Tide
MESA
Multivariate environmental similarity analysis
MEPC
Marine Environment Protection Committee (of the IMO)
NEMISIS
National Estuarine & Marine Invasive Species Information System (managed by
SERC)
NIMPIS
National Introduced Marine Pests Information System (managed by CSIRO,
Australia)
NIS
Non-indigenous species
OBO
Ore/bulk oil tankers (an rather unsuccessful vessel class now used for oil transport
only)
OS
Operating System (of any personal or mainframe computer)
PCU
Programme Coordination Unit (of the GloBallast Programme based at IMO London)
PRIMER
Plymouth Routines In Marine Environmental Research
PBBS
Port Biological Baseline Survey
ROR
Relative overall risk
SAP
(Regional) Strategic Action Plan
SERC
Smithsonian Environmental Research Center (Washington DC, United States)
SIPBS
State Inspection for Protection of the Black Sea
VLCC
Very large crude carrier (200,000 300,000 DWT)
ULCC
Ultra large crude carrier (over 300,000 DWT)
ii
Ballast Water Risk Assessment, Port of Odessa, Ukraine, October 2003: Final Report
Glossary of Terms and Definitions
The following terms and definitions are summarised from various sources including Carlton (1985,
1996, 2002), Cohen & Carlton (1995), Hilliard et al. (1997a), Leppäkoski et al. (2002), Williamson et
al. (2002) and the GloBallast BWRA User Guide. The latter document contains more detailed
definitions with explanatory notes, plus a glossary of maritime terms.
Ballast water
Any water and associated sediment used to manipulate the trim and
stability of a vessel.
Bioinvasion
A broad based term that refers to both human-assisted introductions
and natural range expansions.
Border
The first entrance point into an economy's jurisdiction.
Cost benefit analysis
Analysis of the cost and benefits of a course of action to determine
whether it should be undertaken.
Cryptogenic
A species that is not demonstrably native or introduced.
Disease
Clinical or non-clinical infection with an aetiological agent.
Domestic
Intra-national coastal voyages (between domestic ports).
routes/shipping
Established
A non-indigenous species that has produced at least one self-sustaining
introduction
population in its introduced range.
Foreign routes/shipping
International voyages (between countries).
Fouling organism
Any plant or animal that attaches to natural and man-made substrates
such as piers, navigation buoys or hull of ship, such as seaweed,
barnacles or mussels.
Harmful marine species
A non-indigenous species that threatens human health, economic or
environmental values.
Hazard
A situation that under certain conditions will cause harm. The
likelihood of these conditions and the magnitude of the subsequent
harm is a measure of the risk.
Indigenous/native
A species with a long natural presence that extends into the pre-historic
species
record.
Inoculation
Any partial or complete discharge of ballast tank water that contains
organisms which are not native to the bioregion of the receiving waters
(analogous to the potentially harmful introduction of disease causing
agents into a body as the outcome depends on inoculum strength and
exposure incidence).
Intentional introduction
The purposeful transfer or deliberate release of a non-indigenous
species into a natural or semi-natural habitat located beyond its natural
range.
iii
Ballast Water Risk Assessment, Port of Odessa, Ukraine, October 2003: Final Report
Introduced species
A species that has been intentionally or unintentionally transferred by
human activity into a region beyond its natural range.
Invasive species
An established introduced species that spreads rapidly through a range
of natural or semi-natural habitats and ecosystems, mostly by its own
means.
Marine pest
A harmful introduced species (i.e. an introduced species that threatens
human health, economic or environmental values).
Non-invasive
An established introduced species that remains localised within its new
environment and shows minimal ability to spread despite several
decades of opportunity.
Pathogen
A virus, bacteria or other agent that causes disease or illness.
Pathway (Route)
The geographic route or corridor from point A to point B (see Vector).
Port Biological Baseline
A biological survey to identify the types of introduced marine species
Survey (PBBS)
in a port.
Risk
The likelihood and magnitude of a harmful event.
Risk assessment
Undertaking the tasks required to determine the level of risk.
Risk analysis
Evaluating a risk to determine if, and what type of, actions are worth
taking to reduce the risk.
Risk management
The organisational framework and activities that are directed towards
identifying and reducing risks.
Risk species
A species deemed likely to become a harmful species if it is introduced
to a region beyond its natural range, as based on inductive evaluation
of available evidence.
Translocation
The transfer of an organism or its propagules into a location outside its
natural range by a human activity.
Unintentional
An unwitting (and typically unknowing) introduction resulting from a
introduction
human activity unrelated to the introduced species involved (e.g. via
water used for ballasting a ship or for transferring an aquaculture
species).
Vector
The physical means or agent by which a species is transferred from one
place to another (e.g. BW, a ship's hull, or inside a shipment of
commercial oysters)
iv
Ballast Water Risk Assessment, Port of Odessa, Ukraine, October 2003: Final Report
Lead Agencies
Lead Agency for General BW Issues in Ukraine:
Contact person:
Mr Vladimir Rabotnyov
Position:
Head, Information and Analytical Centre for Shipping Safety
Organization:
State Department of Maritime and Inland Water Transport,
Ministry of Transport.
Address:
Post Box 44, Post Office 58, 65058 Odessa, Ukraine
Tel:
+38 (0482) 219 488
Fax:
+38 (0482) 219 483
Email: rabotn@te.net.ua
Web:
www.globallast.od.ua
Primary contact for BW Risk Assessments in Ukraine:
Contact person:
Mr Roman Bashtannyy
Position:
Scientist, Information and Analytical Centre for Shipping Safety
Organization:
State Department of Maritime and Inland Water Transport,
Ministry of Transport.
Address:
Post Box 44, Post Office 58, 65058 Odessa, Ukraine
Tel:
+38 (0482) 219 488
Fax:
+38 (0482) 219 483
Email: rabotn@te.net.ua
Web:
www.globallast.od.ua
v
Ballast Water Risk Assessment, Port of Odessa, Ukraine, October 2003: Final Report
Executive Summary
The introduction of harmful aquatic organisms and pathogens to new environments via ships' ballast
water (BW) and other vectors has been identified as one of the four greatest threats to the world's
oceans. The International Maritime Organization (IMO) is working to address the BW vector through
various initiatives. One initiative has been the provision of technical assistance to developing
countries through the GEF/UNDP/IMO Global Ballast Water Management Programme (GloBallast).
Core activities of the GloBallast Programme are being undertaken at Demonstration Sites in six Pilot
Countries. These sites are the ports at Sepetiba (Brazil), Dalian (China), Mumbai (India), Khark
Island (Iran), Odessa (Ukraine) and Saldanha Bay (South Africa). One of these activities (Activity
3.1) has been to trial a standardised method of BW risk assessment (BWRA) at each of the six
Demonstration Sites. Risk assessment is a fundamental starting point for any country contemplating
implementing a formal system to manage the transfer and introduction of harmful aquatic organisms
and pathogens in ships' BW, whether under existing IMO Ballast Water Guidelines (A.868(20)) or a
new international Convention..
To maximise certainty while seeking cost-effectiveness and a relatively simple, widely applicable
system, a semi-quantitative approach was followed, using widely-supported computer software. The
semi-quantitative method aims to minimise subjectivity by using as much quantitative data as
possible, to identify the riskiest ballast tank discharges with respect to a Demonstration Site's current
pattern of trade. Unlike a fully quantitative approach, it does not attempt to predict the specific risk
posed by each intended tank discharge of individual vessels, nor the level of certainty attached to such
predictions. However, by helping a Demonstration Site to determine its riskiest trading routes,
exploring the semi-quantitative BWRA provides a coherent method for identifying which BW sources
deserve more vessel monitoring and management efforts than others.
This report describes the BWRA activity undertaken for the Port of Odessa, which is the
Demonstration Site managed by the Commercial Sea Port of Odessa (CSPO). This capacity-building
activity commenced in January 2002, with URS Australia Pty Ltd (URS) contracted to the Programme
Coordination Unit (PCU) to provide BWRA training and software. Under the terms of reference, the
consultants worked closely with their counterparts in a project team co-managed by URS and the
Country Focal Point Assistant (CFPA) for completing all required tasks. These tasks required two in-
country visits by the consultants (in April and August-September 2002) to install the BWRA software
and provide `hands-on' instruction and guidance. Most of the data collation tasks were undertaken
before, between and during these visits, with gap-filling work undertaken by the consultants prior to a
short `project wrap-up' visit in February 2003.
The first step was to collate and computerise data from IMO Ballast Water Reporting Forms
(BWRFs) to identify the source ports from which BW is imported to the Demonstration Site. For
periods or vessel arrivals where BWRFs were not collected or were incomplete, gap-filling data were
extracted from the port shipping records held at the Odessa port offices. These records also helped
identify which next ports of call may have been a destination port for any BW taken up at Odessa.
A multivariate procedure was then use to determine the relative environmental similarity between the
Demonstration Site and each of its BW source and destination ports. Comparing port-to-port
environmental similarities provides a relative measure of the risk of organism survival, establishment
and potential spread. This is the basis of the `environmental matching' method adopted by the project,
which facilitates estimating the risk of BW introductions when the range and types of potentially
harmful species that could be introduced from a particular source port are poorly known.
Another objective of the BWRA Activity was to identify `high-risk' species that may be transferred to
and/or from the Demonstration Site. The customised BWRA database provided by URS therefore
contained tables and interfaces for storing and managing the names, distribution and other information
on risk species. Thus the taxonomic details, bioregional distribution, native/introduced status and level
vi
Ballast Water Risk Assessment, Port of Odessa, Ukraine, October 2003: Final Report
of threat assigned to a species were stored in the database for display, review and update as well as for
the BWRA analysis. For the purposes of the BWRA and its `first-pass' risk assessment, a risk species
was considered to be any introduced, cryptogenic or native species that might pose a threat to marine
ecological, social and/or commercial resources and values if successfully transferred to or from a
Demonstration Site.
During each visit the consultants worked alongside their Pilot Country counterparts to provide skills-
transfer as part of the capacity building objectives of the programme, with the project team divided
into three groups. Group A mapped the port and its resources using ArcView GIS. This group
included counterparts from the Institute of Biology of the Southern Seas (IBSS, Odessa Branch) and
the Port of Odessa, who helped collate and compile much of the required GIS data. Group B was
responsible for managing the customised Access database supplied by the consultants, and for
entering, checking and managing the BW discharge data, as recorded on the BWRFs voluntarily
submitted by arriving ships and/or derived from the port's shipping records. Group B used the
database to identify BW source and destination ports, and it is designed for ongoing input and
management of BWRFs. Group C undertook the environmental matching and risk species
components of the Activity, using the PRIMER package to perform the multivariate analyses for
determining the environmental distances between Odessa and its source and destination ports.
The various BW discharge, environmental matching and risk species data described above were then
processed by the database with other risk factors, including voyage duration and tank size, to provide
preliminary indication of:
(a) the relative overall risk posed by each BW source port, and
(b) which destination ports appeared most at risk from any BW uplifted at the Demonstration
Site.
This was achieved using a project standard approach, although the database also facilitates instant
modifications of the calculations for exploratory and demonstration purposes. The GloBallast BWRA
also adopted a `whole-of-port' approach to compare the subject port (Demonstration Site) with all of
its BW source and destination ports. The project has therefore established in Odessa an integrated
database and geographic information system (GIS) that manages and displays:
· ballast water data obtained from arriving ship BWRFs and port shipping records;
· information on the Demonstration Site's navigational, physical and environmental conditions
and aquatic resources,
· port-to-port environmental matching data,
· risk species data, and
· risk coefficients and graphical categories of risk for ballast discharges.
The results, which were graphically displayed on user-friendly GIS port and world maps as well as in
ranked output tables, help determine the types of management responses.
From the 2297 vessel visit and 3387 associated ballast tank records in the 1999-2002 Odessa
database, the total number of identified BW source ports was 122. The source port supplying the
highest frequency of BW discharges at Odessa was the Bulgarian Black Sea port of Bourgas (14.4%).
This was followed by the Italian Adriatic port of Trieste (7.7%), the Romanian Black Sea port of
Constanta (5.6%), the Greek port of Piraeus (4.9%), the French Atlantic port of Fos sur Mer (4.1%)
and the Croatian Adriatic port of Omisalj (3.6%). The highest-ranked source port in terms of BW
discharge frequency from beyond the Euro-Mediterranean region was the east Russian port of Nakhodka
(Sea of Japan), which at 0.73% was ranked 32nd. The top 10 of the 122 identified source ports provided
>50% of the recorded discharges at Odessa, with the top 29 (24%) accounting for >75%.
vii
Ballast Water Risk Assessment, Port of Odessa, Ukraine, October 2003: Final Report
Of the 2297 visits, 933 record BW tank discharges at Odessa that total 12,439,796 tonnes. Source port
ranking on the basis of discharged volumes was very similar but not exactly the same as that based on
discharge frequency. Source ports providing the largest volumes of discharged BW were Bourgas
(17.3%), Trieste (9%), Constanta (7.5%) and Piraeus (6.7%). Only 21 of the 122 ports (17%)
accounted for 75% of the source-identified total BW volume discharged at Odessa. Of the top 20
ports, seven were in the Black Sea, seven in the Adriatic Sea, two in the Aegean Sea, three in the
Eastern Mediterranean and one on the Atlantic French coast. There were no recorded discharges from
transhipment ports in the Azov Sea and Don River which facilitate trade with the Caspian Sea region
via the Volga-Don canal.
Of the identified 122 BW source ports and 145 potential destination ports, sufficient port
environmental data were obtained to include 53% of the former and 50% of the latter in the
multivariate similarity analysis by PRIMER. These accounted for 75% of all recorded BW discharges
and 82% of all recorded vessel departures respectively. To allow all identified source and potential
destination ports to be part of the risk assessment, those which could not be included in the
multivariate analysis were provided with environment matching coefficient estimates. These were
based on their port type and geographic location with respect to the nearest comparable port for which
the coefficient had been calculated. The calculated coefficients showed that Odessa has a relatively
high environmental similarity to the majority of its regular trading ports. This was related to their
regional proximity plus the relatively wide seasonal temperature and salinity ranges experienced at
Odessa.
It was therefore not surprising that the most environmentally similar port was the nearby port of
Illyichevsk (0.82), while 21 other Black Sea and Adriatic Sea ports had matching coefficients above
0.6. The most environmentally similar ports beyond the Mediterranean region were Nakhodka in the
Sea of Japan (0.65), Boston on the north-east American seaboard (0.59), Fos sur Mer and Lavera on
the French Atlantic coast (0.59) and Rotterdam (0.58). The most environmentally dissimilar ports
trading with Odessa were two wet tropics Malaysian ports (Port Kelang and Kuala Baram) and the
hot, high salinity Gulf port of Dubai (all below 0.3).
From the tank discharge records in the Odessa database, the project standard calculation identified 19
of the 122 source ports (15.6%) as representing the highest risk group (in terms of their BW source
frequency, volume, environmental similarity and assigned risk species). The highest risk ports were
led by Nakhodka followed by Bourgas in the Black Sea and Trieste in the northern Adriatic. Eight of
the 19 highest risk ports were in Black Sea, nine were in the Adriatic and Eastern Mediterranean and
two were beyond this region (including Nakhodka). The other was the French Atlantic port of Fos sur
Mer. The vast majority of source ports in the lowest risk category were subtropical or tropical, with
four exceptions comprising the ports of Bremen (Germany), Rijeka Bakar (Croatia) and Piombino and
Ancone (Italy). The lowest risk source port (0.36% of total risk) was the Mauritanian port of
Nouakchott on the West African coast.
Based on the current pattern of shipping trade (1999-2002), the results imply that BW from vessels
arriving from the temperate to warm temperate ports of southern Europe provide the highest risk,
together with the eastern Russian port of Nakhodka located on the Sea of Japan. These results are
logical given Odessa's biogeographic location and current pattern of trade. The recent history of
invasions to and from the NE American seaboard and the Black Sea, most via Western European
stepping stones, also match these results, since they indicate that Odessa has not been the key entry or
exit point for these introductions (Boston was the only NE American port to trade with Odessa in
1999-2002, but the frequency of visits and BW volume discharged was low ). The picture was
uncertain for Odessa being a source of introductions into the Caspian Sea, although the results show
Odessa does trade with ports in and beside the Azov Sea and Don River mouth (which leads to the
Volga-Don canal). The results of the `first pass' project standard BWRA do imply that any species
which establishes in a Black Sea or northern Mediterranean port can be readily spread to Odessa,
Illyichivesk or other ports in their NW Black Sea bioregion via the current pattern of shipping trade.
viii
Ballast Water Risk Assessment, Port of Odessa, Ukraine, October 2003: Final Report
Identification of destination ports for BW taken up at a Demonstration Site is confounded by the lack
specific questions on the standard IMO BWRF, and the uncertainty of knowing if the Next Port of
Call recorded on a BWRF (or in a shipping record) is where BW is actually discharged. Thus there is
no reporting mechanism enabling a `reverse BWRA' to be undertaken reliably. This posed a significant
constraint on objective 4 for Odessa (Section 2), since a significant portion of general cargo ships and
some bulk carriers departing the dry bulk/general cargo terminal had probably uplifted at least some BW
when alongside these berths (e.g. for trimming purposes when unloading then loading cargo).
Of the 145 potential BW destination ports in the 1999-2002 database (i.e. Next Ports of Call), their
location and proportional frequency are shown in Figure 20. Table 4 lists the top 62 `BW destination'
ports that accounted for 90% of all reported the Next Ports of Call. This shows that the Romanian
Black Sea port of Constanta stood out as the most frequent destination port, with 16% of Next Ports of
Call attributed to this one port, which was a frequent destination for ships departing the container and
oil terminals, and some from the dry bulk/general cargo terminal.
Constanta was followed by a group of ports in the 6-10% range, namely the nearby Ukrainian port of
Ilyichevsk (9.3%), which is deeper and often visited for top-up cargos, followed by the Bulgarian
Black Sea port of Bourgas (8.9%; much of this traffic comprising a shuttle export service involving
three Bulgarian flagged crude oil tankers Osam, Khan Asparukh and Mesta plus a few product
tankers), the roadstead off Odessa (7.0%; used for cargo top-ups and transhipments with small vessels
trading from river ports in the Denpr and Yuzhny-Bug systems) and then Istanbul (6.6%). Istanbul
may also not represent an important BW destination port since it was found that some bulk carriers
and tankers departing Odessa had sailing instructions to proceed to Istanbul only for the purpose of
entering the Turkish Straits (Bosphorus then Dardanelles) to visit a unknown Mediterranean port.
It was not clear how much BW is `exported' from Odessa. The largest volumes of exported BW were
identified to occur in the ships departing the dry bulk/general cargo terminal, and some from the
container terminal. Of the top 20 Next Port of Calls which accounted for the potential BW destination
of 72% of all vessel departures from Odessa, nine were located in the Black Sea, six were in the
Eastern Mediterranean, four in the Eastern Mediterranean and two were in the Adriatic. The highest
ranked possible destination port beyond the Mediterranean was Singapore (ranked 24th with 0.68% of
all departures). None of the small general cargo ships reported they were sailing direct to a Caspian
Sea port, but six of these reported staging ports in the Azov Sea (i.e. where transhipments can also be
made to vessels using the Volga-Don canal).
While the three most important Next Ports of Call were Bourgas, Constanta and Illyichevsk, these
may not be important BW destinations since much of the trade to these ports are ships departing fully-
loaded with oil or other liquid bulk cargo, or were sailing for top-up cargos. These ports are `down-
current' from Odessa with respect to the surface water circulation in the Black Sea. Any harmful
species that establishes in Odessa therefore has a chance to spread south-westward by the prevailing
current regime, provided its dispersive and adult stages can tolerate the increased salinity beyond the
north-west gulf of the Black Sea. In the case of the risk species currently assigned to Odessa's
bioregion, several have achieved extensive populations in this direction, while some of these plus
other species have spread to the Caspian Sea. As noted above, the database suggested Odessa could
not be ruled out as a potentially significant source of shipping-mediated introductions to the Azov
Sea, Volga-Don system and Caspian region.
Of the various BWRA objectives and tasks, reliable identification of destination ports that may receive
BW from the Demonstration Site was the least successful, as it was confounded by the lack of specific
questions on the IMO-standard BWRFs, and the uncertainty of knowing if the Next port of Call
recorded on a BWRF is where BW is actually discharged. Thus there is presently no mechanism
enabling a `reverse BWRA' to be undertaken reliably. In the case of Odessa, many visiting vessels types
do not uniformly discharge or uptake their full capacity of ballast water (especially general cargo ships,
container vessels and some of the bulk carriers visiting the dry bulk/general cargo terminal). If more
reliable forward-looking BWRAs are to be undertaken to identify destination ports, supplementary
ix
Ballast Water Risk Assessment, Port of Odessa, Ukraine, October 2003: Final Report
questions will need to be added to the present BWRF, including the names of the three last ports of call
as well as the port where discharges from each partially or completely ballasted tank are predicted.
The main objectives of the BWRA Activity were successfully completed during the 14 month course
of the project, with the various tasks and exploratory/demonstration software providing a foundation
enabling the regional promulgation of further BW management activities by Ukraine. Project outputs
included a trained in-country risk assessment team, and an operational BWRA system and User Guide
for use as a demonstration tool in the region. A series of valuable ideas and recommendations also
emerged from the process and are contained in this report. Successful completion of the BWRA
project places Ukraine in a strong position to provide assistance, technical advice, guidance and
encouragement to other port States in the region of the Black Sea, Caspian Sea and Eastern
Mediterranean.
x
Ballast Water Risk Assessment, Port of Odessa, Ukraine, October 2003: Final Report
Table of Contents
Acknowledgements......................................................................................................................................i
Acronyms......................................................................................................................................................ii
Glossary of Terms and Definitions ..........................................................................................................iii
Lead Agencies..............................................................................................................................................v
Executive Summary ...................................................................................................................................vi
1
Introduction and Background .........................................................................................................1
2
Aims and Objectives .........................................................................................................................5
3
Methods ..............................................................................................................................................6
3.1
Overview and work schedule...................................................................................................................6
3.2
Resource mapping of the demonstration port.........................................................................................9
3.3
De-ballasting/ballasting patterns ...........................................................................................................10
3.4 Identification
of source ports..................................................................................................................11
3.5 Identification
of destination ports ...........................................................................................................12
3.6 BWRF
database.....................................................................................................................................13
3.7
Environmental parameters.....................................................................................................................15
3.8 Environmental
similarity analysis...........................................................................................................16
3.9
Risk species ...........................................................................................................................................18
3.10 Risk assessment ....................................................................................................................................22
3.11 Training and capacity building ...............................................................................................................27
3.12 Identification
of information gaps...........................................................................................................28
4
Results ............................................................................................................................................. 29
4.1 Description
of port ..................................................................................................................................29
4.2 Resource mapping .................................................................................................................................33
4.3 De-ballasting/ballasting pattern .............................................................................................................34
4.4 Identification
of source ports..................................................................................................................38
4.5 Identification
of destination ports ...........................................................................................................42
4.6
Environmental similarity analysis ..........................................................................................................44
4.7
Risk species ..........................................................................................................................................50
4.8
Risk assessment results ........................................................................................................................56
4.9
Training and capacity building ...............................................................................................................60
4.10 Identification
of information gaps...........................................................................................................61
5
Conclusions and Recommendations .......................................................................................... 64
6
Location and maintenance of the BWRA System...................................................................... 66
References................................................................................................................................................. 67
APPENDIX 1: Copy of IMO Ballast Water Reporting Form
APPENDIX 2: Risk Assessment Team for the Port of Odessa
APPENDIX 3: Check-list of project requirements
APPENDIX 4: Information sources used for collating Port Environmental Data
APPENDIX 5: Sources and references of Risk Species information
APPENDIX 6: Name, UN code, coordinates and environmental parameters of the 357 ports
used for the multivariate similarity analyses for all Demonstration Sites
APPENDIX 7: Consultants' Terms of Reference
xi
Ballast Water Risk Assessment, Port of Odessa, Ukraine, October 2003: Final Report
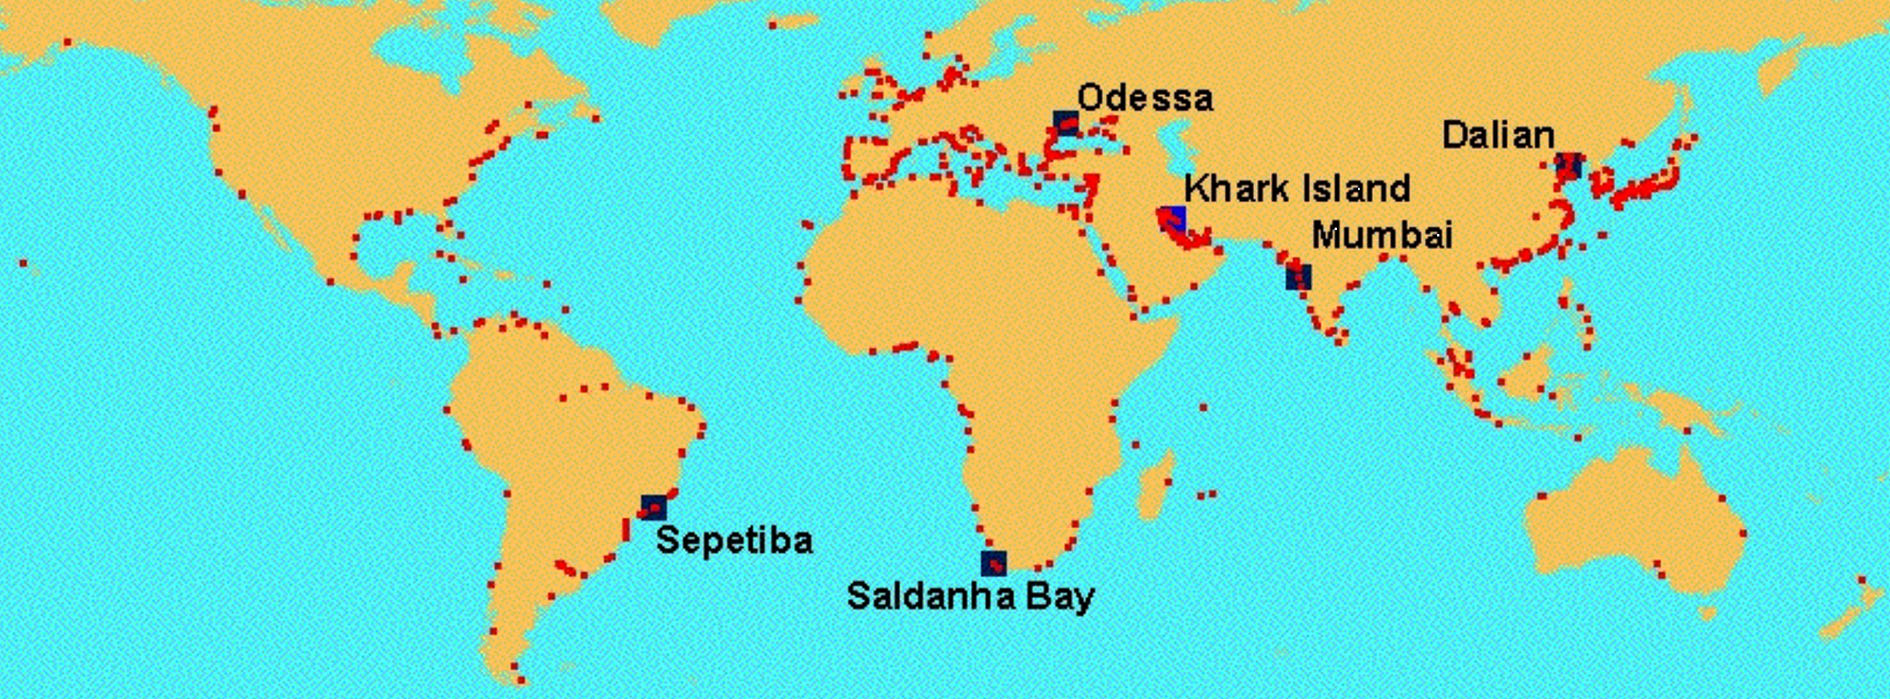
Figure 1.
Locations of the six GloBallast Demonstration Sites and their various ballast water source and
destination ports....................................................................................................................................... 3
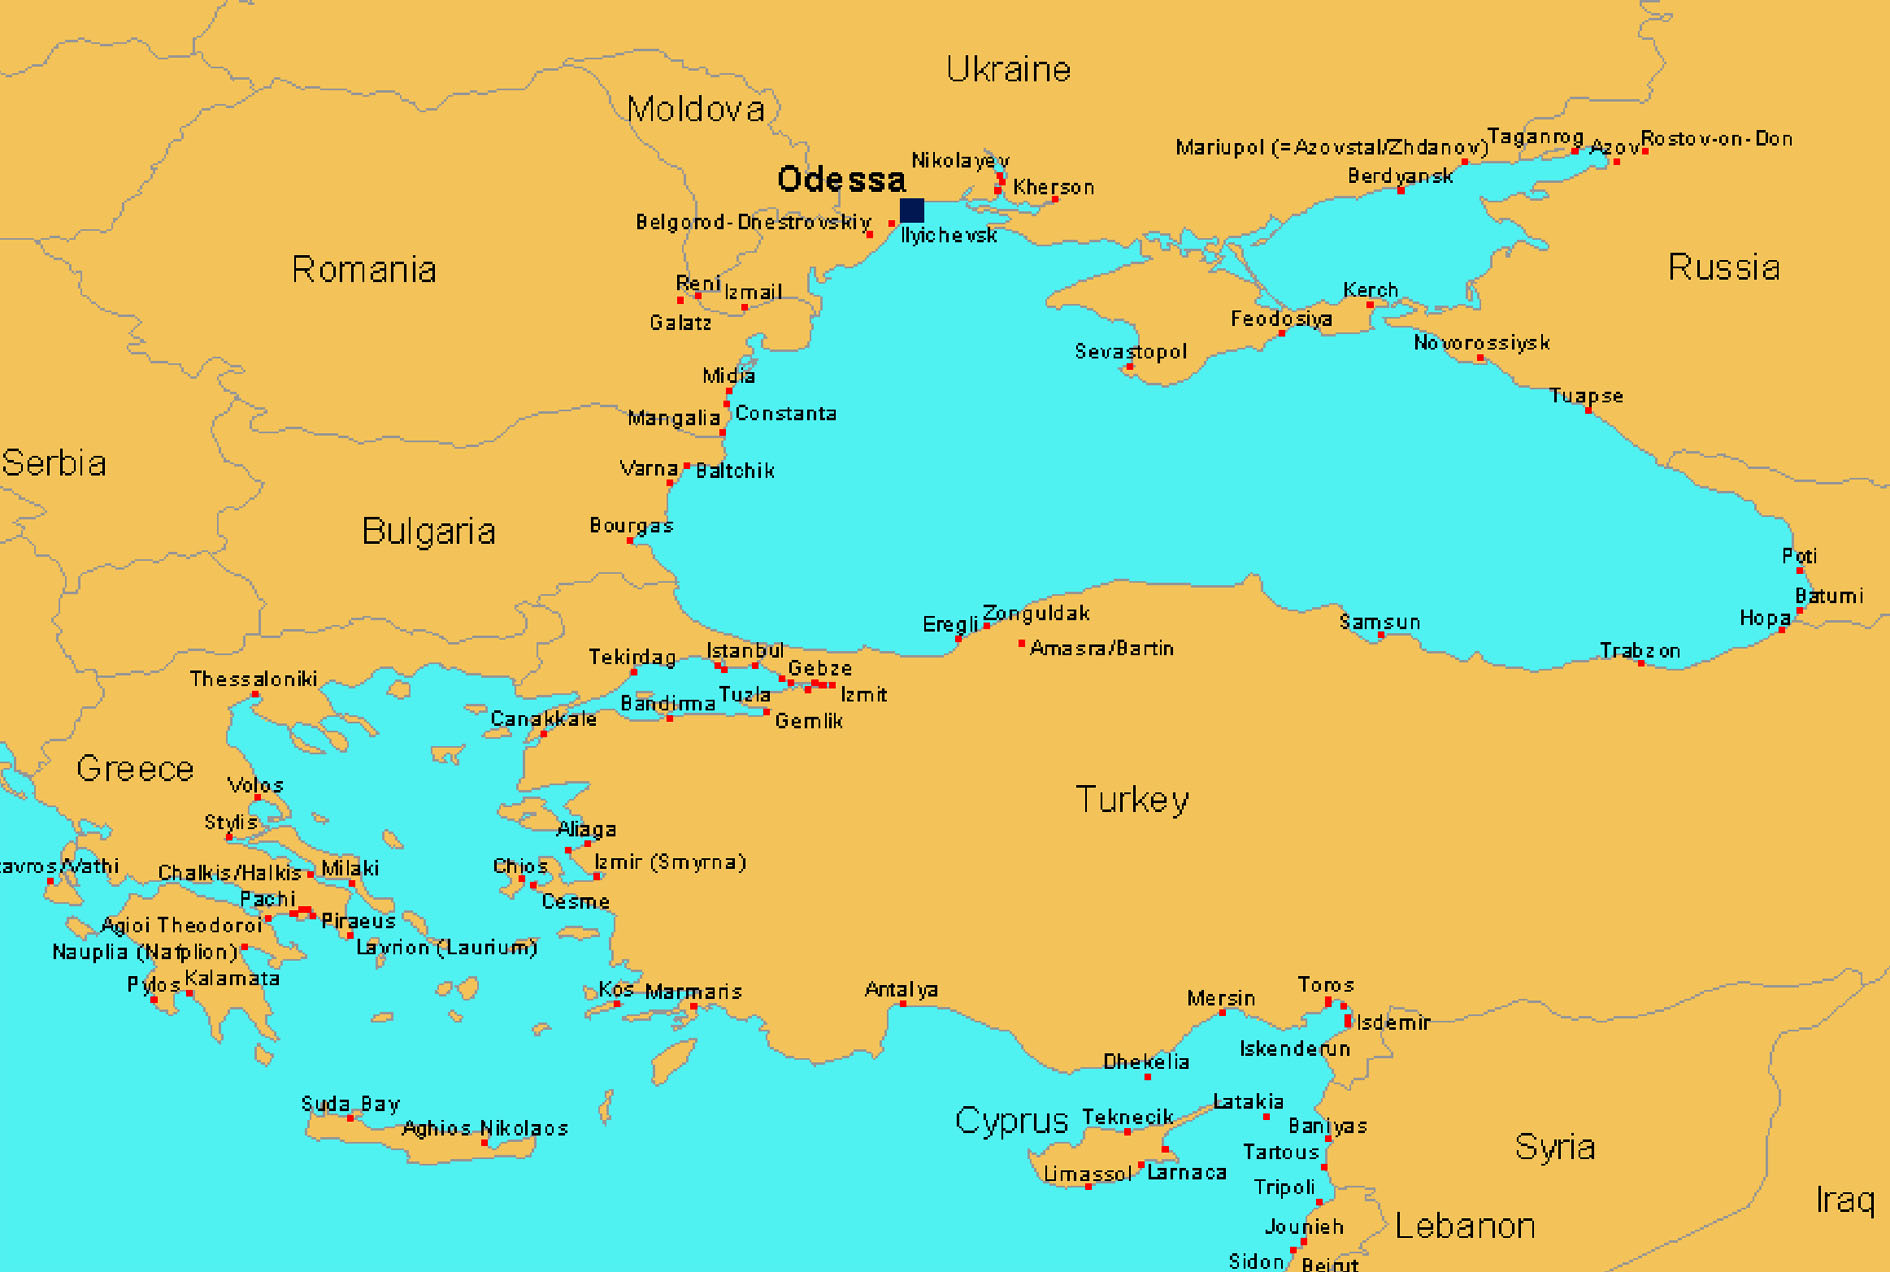
Figure 2.
Location of Odessa and other ports in the Black Sea region................................................................. 4
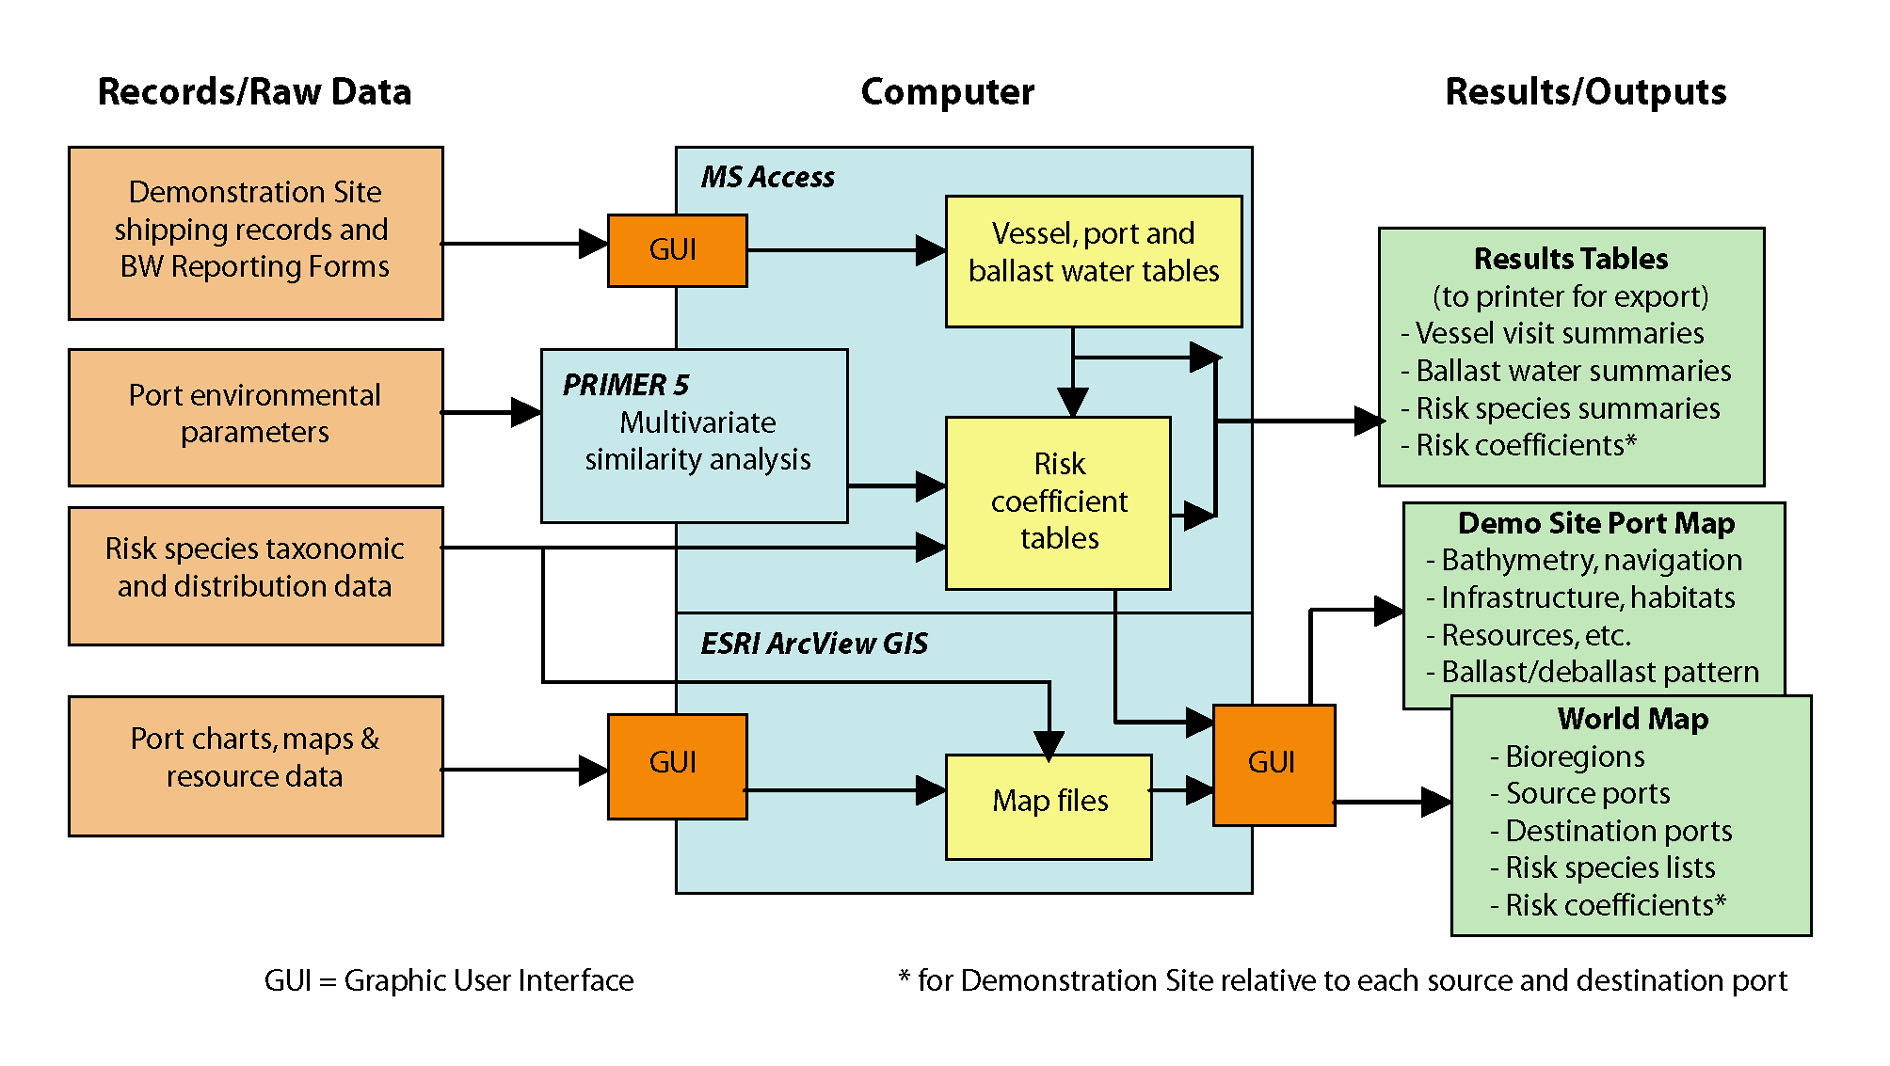
Figure 3.
Schematic of the GloBallast BWRA system ........................................................................................... 6
Figure 4.
Thematic layers used for the Port Map GIS............................................................................................ 9
Figure 5.
Working page of the Excel spreadsheet used to estimate BW discharges ......................................... 12
Figure 6.
The three tabs of the GUI used for entering the BWRF data............................................................... 14
Figure 7.
Part of the GIS world map of marine bioregions, showing the code names of those
in the Black Sea region.......................................................................................................................... 19
Figure 8.
Complete GIS world map showing the marine bioregions [to improve clarity, not all
bioregion codes are shown in this example]......................................................................................... 20
Figure 9.
Database GUI used for manipulating the BWRA calculation and weightings ..................................... 23
Figure 10.
Wind rose typical of the Odessa Bay region......................................................................................... 29
Figure 11.
Regional surface water circulation in the Black Sea ............................................................................ 30
Figure 12.
Part of the GIS Port Map showing the navigation and active berth layers. ......................................... 32
Figure 13.
Part of the GIS Port Map showing the marine habitat layer................................................................. 34
Figure 14.
BW discharge statistics displayed by GIS Port Map for the oil terminal. ............................................ 36
Figure 15.
BW discharge statistics displayed by GIS Port Map for the grain terminal.......................................... 37
Figure 16.
BW discharge statistics displayed for the dry bulk/general cargo terminal.......................................... 37
Figure 17.
BW discharge statistics displayed by the GIS Port Map for the container terminal ............................ 38
Figure 18.
GIS output showing the location and relative importance of BW source ports with respect to
frequency of tank discharges (C1) at the Port of Odessa. ................................................................... 39
Figure 19.
GIS output showing location and relative importance of the source ports with respect to
the volume of tank discharges (C2) at the Port of Odessa. ................................................................. 39
Figure 20.
GIS output showing the location and frequency of destination ports, recorded as the
Next Port of Call in the Port of Odessa BWRFs and shipping records................................................ 42
Figure 21.
GIS output showing the location and environmental matching coefficients (C3) of
BW source ports identified for the Port of Odessa. .............................................................................. 45
Figure 22.
GIS output showing the location and environmental matching coefficients (C3) of
the destination ports identified for the Port of Odessa. ........................................................................ 45
Figure 23.
GIS output showing the location and risk species threat coefficients (C4) of the BW
source ports identified for the Port of Odessa ...................................................................................... 50
Figure 24.
Plots showing numbers of all and recently-introduced species in the four terminal areas
that receive almost all BW discharged in the Port of Odessa. ............................................................. 54
Figure 25.
Comparison of BW volumes discharged at the Odessa terminals from all source ports (A)
and from the Italian source ports (B)..................................................................................................... 55
Figure 26.
GIS world map outputs (two scales) showing the location and categories of relative overall risk
(ROR) of the BW source ports identified for Odessa. .......................................................................... 57
Figure 27.
Frequency distribution of the standardised ROR values...................................................................... 57
xii
1
Introduction and Background
The introduction of harmful aquatic organisms and pathogens to new environments via ships' ballast
water (BW) and other vectors, has been identified as one of the four greatest threats to the world's
oceans. The International Maritime Organization (IMO) is working to address the BW vector through
a number of initiatives, including:
· adoption of the IMO Guidelines for the control and management of ships' ballast water to
minimize the transfer of harmful aquatic organisms and pathogens (A.868(20));
· developing a new international legal instrument (Draft International Convention for the
Control and Management of Ships' Ballast Water and Sediments, as currently scheduled to be
considered for adoption by an IMO Diplomatic Conference in February 2004); and
· providing technical assistance to developing countries through the GEF/UNDP/IMO Global
Ballast Water Management Programme (GloBallast).
Core activities of the GloBallast Programme are being undertaken at Demonstration Sites in six Pilot
Countries. These sites are the ports at Sepetiba (Brazil), Dalian (China), Mumbai (India), Khark
Island (Iran), Odessa (Ukraine) and Saldanha Bay (South Africa). Activities carried out at the
Demonstration Sites will be replicated at additional sites in each region as the programme progresses
(further information at http://globallast.imo.org).
One of GloBallast's core activities (Activity 3.1) has been to trial a standardised method of BW risk
assessment (BWRA) at each of the six Demonstration Sites. Risk assessment is a fundamental starting
point for any country contemplating implementing a formal system to manage the transfer and
introduction of harmful aquatic organisms and pathogens in ships' BW, whether under the existing
IMO Ballast Water Guidelines (A.868(20)) or the forthcoming Convention.
A port State may wish to apply its BW management regime uniformly to all vessels that call at its
ports, or it may wish to assess the relative risk of these vessels to its coastal marine resources and
apply its regime selectively. Uniform application or the `blanket' approach offers the advantages of
simplified administration and no requirement for `judgement calls' to be made. This approach also
requires substantially less information management effort. If applied strictly, the uniform approach
offers greater protection from unanticipated bio-invaders, as it does not depend on the reliability of a
decision support system that may not be complete. However, the key disadvantage of the strict blanket
approach are the BW management costs imposed on vessels which otherwise might not be forced to
take action. It also requires a substantial vessel monitoring and crew education effort to ensure all
foreign and domestic flagged ships are properly complying with the required BW management
actions.
A few nations have started to develop and test systems that allow more selective application of BW
management requirements, based on voyage-specific risk assessments. This `selective' approach
offers to reduce the numbers of vessels subject to BW controls and monitoring, and is amenable to
nations that wish to reduce the introduction, and/or domestic spread, of `targeted' marine species only.
More rigorous measures can be justified on ships deemed to be of high risk if fewer restrictions are
placed on low risk vessels.
For countries/ports that choose the selective approach, it is essential to establish an organized means
of evaluating the potential risk posed by each arriving vessel, through a `Decision Support System'
(DSS). However, this approach places commensurate information technology and management
burdens on the port State, and its effectiveness depends on the quality of the information and database
systems that support it. A selective approach that is based on a group of targeted species may also
leave the country/port vulnerable to unknown risks from non-targeted species.
1
Ballast Water Risk Assessment, Port of Odessa, Ukraine, October 2003: Final Report
Before a port State decides on whether to adopt the blanket or the selective approach, it needs to carry
out some form of risk assessment for each port under consideration. Ballast water risk assessments
(BWRAs) can be grouped into three categories1:
· Qualitative Risk Identification: this is the simplest approach, and is based on subjective
parameters drawn from previous experience, established principals and relationships and
expert opinion, resulting in simple allocations of `low', `medium' and `high' risk. However it
is often the case that subjective assessments tend to overestimate low probability/high
consequence events and underestimate higher probability/lower consequence events (e.g.
Haugom et al, in Leppäkoski et al. 2002).
· Semi-Quantitative Ranking of Risk: this `middle' approach seeks to increase objectivity and
minimise the need for subjective opinions by using quantitative data and ranking of
proportional results wherever possible. The aim is to improve clarity of process and results,
thereby avoiding the subjective risk-perception issues that can arise in qualitative approaches.
· Quantitative Risk Assessment: this is the most comprehensive approach which aims to
achieve a full probablistic analysis of the risk of BW introductions, including measures of
confidence. It requires significant collation and analysis of physico-chemical, biological and
voyage-specific data, including key lifecycle and tolerance data for every pre-designated
species of risk (`target species'), port environmental conditions, ship/voyage characteristics,
the BW management measures applied, and input and evaluation of all uncertainties. The
approach requires a high level of resourcing, computer networking and sophisticated
techniques that are still being developed1.
The purpose of GloBallast Activity 3.1 has been to conduct initial, first-pass BWRAs for each
Demonstration Site. To maximise certainty while seeking cost-effectiveness and a relatively simple,
widely applicable system, the middle (semi-quantitative) approach was selected.
The first step of the GloBallast method is to collate data from IMO Ballast Water Reporting Forms
(BWRFs) (as contained in Resolution A.868(20); see Appendix 1) to identify the source ports from
which BW is imported to the demonstration port. For periods or vessel arrivals where BWRFs were
not collected or are incomplete, gap-filling data can be extracted from port shipping records.
Source port/discharge port environmental comparisons are then carried out and combined with other
risk factors, including voyage duration and risk species profiles, to give a preliminary indication of
overall risk posed by each source port. The results help determine the types of management responses
required, while the BWRA process provides a foundation block enabling application of more
sophisticated BW management DSSs by Pilot Countries.
The GloBallast approach is not the only one available but is considered to combine the best elements
of the semi-quantitative method to provide useful results within the available budget (US$250,000
spread across the six pilot countries). It has also taken a `whole-of-port' approach which compares the
subject port (Demonstration Site) with all of its BW source and destination ports. The outputs include
published reports, trained in-country risk assessment teams and an operational BWRA system for use
as demonstration tools in each of the six main developing regions of the world, plus a platform and
database to facilitate further DSS development. The GloBallast BWRA activity has therefore
established an integrated database and information system to manage and display:
· ballast water data from arriving ship BWRFs and port shipping records;
· data on the demonstration port's physical and environmental conditions and aquatic
resources,
· port-to-port environmental matching data,
1 for further details see the GloBallast BWRA User Guide.
2
1 Introduction and Background
· risk species data, and
· ballast water discharge risk coefficients.
The results provide a knowledge base that will help the Pilot Countries and other port States to
evaluate the risks currently posed by BW introductions, identify high priority areas for action, and
decide whether to apply a blanket or selective BW management regime. If a selective regime is
adopted, vessel and voyage-specific risk assessments can then be applied using systems such as those
being developed and trialled by the Australian Quarantine & Inspection Service (AQIS Decision
Support System), Det Norsk Veritas in Norway (EMBLA system) and the Cawthron Institute in New
Zealand (SHIPPING EXPLORER), and/or by further development of the GloBallast system. If a
uniform approach is adopted, the results help identify which routes and vessel types warrant the most
vigilance in terms of BW management compliance checking and verification monitoring, including
ship inspections and ballast tank sampling.
The geographical spread and broad representativeness of the six Demonstration Sites also means that
the results help plug a very large gap in the existing global knowledge base. Figure 1 indicates the
broad global spread of the GloBallast risk assessment activity. As a result of this activity,
comprehensive data are now available on source port and destination port linkages, environmental
parameters, environmental matching coefficients, risk species and relative overall risk of BW
transfers for the six GloBallast Demonstration Sites and a total of 723 ports around the world. Project
outcomes will therefore place governments, scientists, the shipping industry and the general public in
a stronger, more enlightened position to deal with the BW problem.
Figure 1. Locations of the six GloBallast Demonstration Sites and their various ballast water source and
destination ports.
This report describes and presents the results of the first Ballast Water Risk Assessment (BWRA)
carried out for the Port of Odessa (Ukraine) during 2002. This GloBallast Demonstrate Site is one of
the busiest ports in the Black Sea (Figure 2), being equipped with liquid and dry bulk terminals, a
variety of break bulk and general cargo berths, a modern container terminal, a passenger terminal and
a ship repair yard.
3
Ballast Water Risk Assessment, Port of Odessa, Ukraine, October 2003: Final Report
Figure 2. Location of Odessa and other ports in the Black Sea region
4
2
Aims and Objectives
The aims and objectives of the GloBallast BWRA were set by the GloBallast Programme
Coordination Unit (PCU), in accordance with Terms of Reference developed by the PCU Technical
Adviser (Appendix 7).
The aims of the GloBallast BWRA for the Port of Odessa were to:
1. Assess and describe as far as possible from available data, the risk profile of invasive aquatic
species being both introduced to and exported from Odessa in ships' BW, and to identify the
source ports and destination ports posing the highest risk for such introductions.
2. Help determine the types of management responses that are required, and provide the
foundation blocks for implementing a more sophisticated BW management system for the
Port of Odessa.
3. Provide training and capacity building to in-country personnel, resulting in a fully trained risk
assessment team and operational risk assessment system, for ongoing use by the Pilot
Country, replication at additional ports and use as a demonstration tool in the region.
The specific objectives of the BWRA for the Port of Odessa were to:
1. Identify, describe and map on a Geographic Information System (GIS) all coastal and marine
resources (biological, social/cultural and commercial) in and around the port that might be
impacted by introduced marine species.
2. Characterise, describe and map (on GIS) de-ballasting and ballasting patterns in and around
the port including locations, times, frequencies and volumes of BW discharges and uptakes.
3. Identify all ports/locations from which BW is imported (source ports).
4. Identify all ports/locations to which BW is exported (destination ports).
5. Establish a database at the nominated in-country agency for the efficient ongoing collection,
management and analysis of the data collected at the Port of Odessa via standard IMO
BWRFs.
6. Characterise as far as possible from existing data, the physical, chemical and biological
environments for both Odessa and each of its source and destination ports.
7. Develop environmental similarity matrices and indices to compare the Port of Odessa with
each of its source ports and destination ports, as a key basis of the risk assessment.
8. Identify as far as possible from existing data, any high-risk species present at the source ports
that might pose a threat of introduction to the Port of Odessa, and any high-risk species
present at this port that might be exported to a destination port.
9. Identify any information gaps that limit the ability to undertake the aims and objectives and
recommend management actions to address these gaps.
5
Ballast Water Risk Assessment, Port of Odessa, Ukraine, October 2003: Final Report
3
Methods
3.1
Overview and work schedule
The BWRA for the Port of Odessa was conducted by URS Australia Pty Ltd (URS) under contract to
the GloBallast PCU, in accordance with the Terms of Reference (Appendix 7). The consultants
worked alongside their Pilot Country counterparts during the country visits to provide training and
skills-transfer as part of the capacity building objectives of the programme. Structure and membership
of the joint project team is shown in Appendix 2.
To achieve the Terms of Reference, the consultants adopted an innovative, modular approach that
integrated three widely used computer software packages to provide a user-friendly tool for
conducting, exploring and demonstrating semi-quantitative BWRAs. As shown in Figure 3, the key
software comprised:
· Microsoft Access - for the main database;
· PRIMER 5 [Plymouth Routines In Marine Environmental Research] - a versatile multivariate
analysis package from the United Kingdom enabling convenient multivariate analysis of the
port environmental data; and
· ESRI ArcView 3.2 Geographic Information System (GIS) - to graphically display the results
in a convenient, readily interpretable format using port and world maps.
Figure 3. Schematic of the GloBallast BWRA system
The work schedule started with project briefing meetings with personnel from all six Demonstration
Sites to arrange logistics and resource needs, during the third meeting of the GloBallast Programme's
Global Task Force, held in Goa (India) on 16-18 January 2002 (Appendix 3). The majority of tasks
subsequently undertaken for the Port of Odessa were completed during two in-country visits by the
consultants (25 February 1 March and 23 November 5 December 2002), with information
searches and data collation undertaken by both consultant and pilot country team members between
and after these visits. A `project wrap-up' visit was subsequently made by one of the consultants on
24-26 February 2003.
6
3 Methods
The specific tasks of the week-long first visit were to:
· Install and test the Access, ArcView and PRIMER software and the functionality of the
computer system that was located in office space provided by the Commercial Sea Port of
Odessa (CSPO).
· Familiarise the project team with the GloBallast BWRA method by seminar and work-
shopping.
· Commence GIS guidance and developing the port map for the Demonstration Site.
· Commence training on the use of the various Graphic User Interfaces (GUI) of the Access
Database for inputting and editing BW discharge data.
· Make a tour of the port facilities, obtain information on the ballasting practises of visiting
ships and gain an understanding of the coastal habitats and local marine resources.
· Review available BWRFs and port shipping records to identify trading patterns, vessel types,
key BW source ports and likely destination ports.
· Check available port environmental data and identify potential in-country and regional
sources of same.
· Commence listing risk species and identifying potential in-country or regional sources of
same.
· Identify critical information gaps and the data assembly work required before the second visit.
During the longer second visit by the consultants, the environmental and risk species data were added
to the database, more vessel arrival, BW and voyage data were entered and checked, the first BWRA
was undertaken, and a workshop was held to review the initial results and identify future actions.
During the third visit in February 2003, the consultants supplied the Information and Analytical
Centre for Shipping Safety (in State Department of Maritime and Inland Water Transport, Ministry of
Transport of Ukraine) with updated versions of the database and BWRA User Guide on CD-ROM,
which included additional source port environment and risk species data (as obtained from the BWRA
Activities conducted at the other five Demonstration Sites). The results of the February 2003 version,
plus subsequent corrections to some of the vessel visit records and port-to-port environmental
matching assignments, are reported here.
Throughout the schedule, the joint project team was divided into three groups to facilitate training and
progress (Appendix 2). Group A was responsible for developing the port map and graphically
displaying results via the GIS. All coastal and marine resources (biological, social/cultural and
commercial) in and near the port that could be impacted by aquatic bio-invasions were mapped using
the ArcView GIS, using specific layers to show the bathymetry, navigation aids, port infrastructure
and tables of the port's de-ballasting/ballasting patterns (including frequencies and volumes of
discharges and uptakes for the berth locations), as well as the marine habitat types.
Group B was responsible for managing the customised Access database supplied by the consultants,
and for entering, checking and managing the BW data, as collated from the BWRFs submitted by
arriving ships (and/or derived from port shipping records for periods or arrivals when BWRFs were
not obtained or incomplete). This database was used to identify source and destination ports, and was
designed for ongoing input and management of future BWRFs.
7
Ballast Water Risk Assessment, Port of Odessa, Ukraine, October 2003: Final Report
The requirement for arriving ships to submit to the relevant port State authority a completed
form that complies with the IMO BWRF (Appendix 1) is a fundamental and essential first basic
step for any port State wishing to commence a BW management programme2.
Group C was responsible for collating the port environmental and risk species data, undertaking port-
to-port environmental similarity analyses and performing the BWRA. Thirty four environmental
variables were collated for the Demonstration Site and the majority of its source and destination
ports3, including sea water and air temperatures, salinities, seasonal rainfall, tidal regimes and
proximity to a standardised set of intertidal and subtidal habitats. Where water temperature data or
salinity data could not be found for a source or destination port, values were derived for the riverine,
estuarine or coastal location of the port with respect to the temperature and salinity data ranges of its
IUCN marine bioregion, plus ocean maps depicting sea surface temperature/salinity contours at
quarter degree and degree scales (as obtained from CRIMP [now CSIRO Marine Research], URS and
other sources; Appendix 4).
The multivariate analysis of the port environmental data was undertaken using the PRIMER package,
with the similarity values between the Port of Odessa and its source and destination ports converted
into environmental matching coefficients then added to the database. Species in or near source ports
that were deemed to pose a threat if introduced to the Demonstration Site, together with species at the
Demonstration Site that might be exported to a destination port, were identified from all available
sources found by the project team. These sources included lists of introduced species compiled for the
Aegean, Marmara, Black, Azov and Caspian Seas by IBSS (Zaitsev & Öztürk, 2001) and preliminary
results from the Port Biological Baseline Surveys (PBBS; as recently completed at each
Demonstration Site by another GloBallast Activity). Searches were also made of `on-line' databases
such as those under ongoing development by the Smithsonian Environmental Research Center
(SERC), the Australian Centre for Research on Introduced Marine Pests (CRIMP; now CSIRO
Marine Research), the Baltic Regional Marine Invasions Database and the Global Invasive Species
Programme (GISP) (Appendix 5). The species taxonomic information and bioregional distributions
were also added to the Access database. The combined BW discharge, environmental matching and
risk species coefficients provided the basis of the semi-quantitative risk assessment.
Graphic User Interfaces (GUIs) customised by the consultants for the Access database and ArcView
GIS were used to generate results tables and graphical outputs that were displayed on interactive maps
of the Demonstration Site and World bioregions. The various BWRA outputs can be printed, exported
to other software, or viewed interactively to enhance the user-friendliness and management utility of
the system.
The methods used to attain each objective of the BWRA Activity are summarised in the following
sections, with technical details of the risk assessment procedures provided in the GloBallast BWRA
User Guide. This manual was developed by the consultants to facilitate BWRA training and
demonstrations for all six GloBallast Pilot Countries. The BWRA User Guide comprises a separate
document that accompanies this report, and is available from the GloBallast PCU
(http://globallast.imo.org).
2 Several port States (e.g. Australia) and some of the Demonstration Sites, including Odessa, have produced
their own BWRFs, the latter using translated formats to permit improved BWRF understanding and
completion by local shipping. Such BWRFs need to include all questions of the IMO standard form.
3 The complete set of source and destination ports identified for the six Demonstration Sites (723) remained
unknown until the end of the BWRF/port record data collation, database entry and checking phases (i.e. end of
the second round of in-country visits; 22 December 2002). A gap-filling effort was made by the consultants to
obtain the environmental parameters during January 2003, but this had to focus on the most frequently
recorded of these ports, since there was insufficient time or resources to order charts and search for the
environmental data for all of them (the majority of which were associated with few or only single vessel
arrivals). For these ports, their environmental matching values were provided by a comparison method
described in Section 4.6.
8
3 Methods
3.2
Resource mapping of the demonstration port
The port resources were mapped using ArcView GIS to display the bathymetric, navigational and
infrastructure features, including habitats and social-cultural features. The scope of the Odessa port
map includes the offshore coastal waters south of the port, the port's approaches and anchorages, and
the various terminals and berths located behind its breakwaters. Lower resolution portions of the port
map show the Black Sea and the deltas of the four major river systems that enter the Black Sea after
traversing the south-west region of Ukraine (i.e. from the Romanian border to the Crimean Peninsula;
Figure 2). These sections of the port map were obtained by scanning and geographically correcting
regional maps provided by the Institute of Biology of the Southern Seas (IBSS) and CSPO.
There were no vector-based electronic nautical charts available for the Odessa region. Group A
members therefore generated the baseline layer containing the coastline, bathymetry and navigation
data from geo-referenced high resolution scan images of existing nautical charts provided by CSPO.
This layer contains details of the port infrastructure, the approach channel and anchorages. Point and
pattern symbols for the navigational features were based on the international IHO/IALA system for
nautical charts.
Infrastructure and social cultural information was taken from the Odessa port chart and an urban map,
while some existing digital data showing habitat types was obtained from IBSS in Mapinfo format
and converted to ArcView to help construct the habitat layer. This layer also contained subtidal
habitat information provided by Group C members from review of the PBBS field results and results
of previous marine benthic surveys undertaken by IBSS. For clarity and convenience of data
management and display, each `theme' of information was added as a separate layer that followed the
scheme shown in Figure 4.
Figure 4. Thematic layers used for the Port Map GIS
The protocol for the five main layers are described in the BWRA User Guide and summarised below:
Base Layer: The base layer includes important planimetric features such as depth contours, jetties,
important channels and other permanent or at least semi-permanent `reference' features that are
unlikely to change or move. The key features of the base layer for the Port of Odessa comprised:
· Coastlines of the mainland and various islands within Odessa Bay (as depicted by the high
tide mark on the nautical charts).
· The low tide mark (i.e. the 0 metre bathymetric contour of hydrographic charts).
· 5 metre isobath (often the first continuous contour below the low tide mark).
· 10 metre, 20 metre and 30 metre isobaths.
· Edges of the main shipping channels (often blue or purple lines showing the boundary of
depths maintained by port dredging).
9
Ballast Water Risk Assessment, Port of Odessa, Ukraine, October 2003: Final Report
The colour scheme of the base layer follows that of standard nautical charts to maintain the familiar
land/sea depth effect.
Navigational Layer: The standard navigational symbols of the IHO/IALA system were followed as
closely as possible. ArcView's symbol libraries do not contain these international navigation symbols,
and convenient third-party symbology could not be found despite extensive searches of public domain
web resources. Closest-match point and pattern symbols were therefore developed for this purpose,
using the UK Hydrographic Office Chart No. 5011 (= IHO INT 1) as the source.
Habitat Layer: This layer displays the coastal habitat information compiled by Group C in a
standardised, logical colour scheme to facilitate recognition of the main intertidal and subtidal habitat
types in and near the port. Delineation of some of the boundaries between natural and artificial
intertidal habitats were based on notes and map annotations of harbour and shoreline features made by
BWRA team members during two tours of the port area by launch and inspections along the coast as
far as Yuzhny (~35 km south of Odessa) by vehicle. Beyond the harbour walls, shorelines in the
Odessa region are predominantly narrow stony beaches backed eroding cliffs, with sand dunes and
beaches occurring both to the east and more than 10 km to the south of Odessa.
Infrastructure Layer: This layer shows the urban and developed land surrounding the port, including
roads and railway lines.
Social-Cultural Layer: This layer facilitates the addition of significant social-cultural features at the
port. There are no commercial fish processing facilities, fishing harbour or aquaculture operations in
the port, and recreational fishing from wharfs, breakwaters or privates boats is prohibited in
accordance with the 1997 Odessa Sea Port Obligatory Regulations (as amended 2000).
Berth Layer: An `active' berth layer was added to show the principal berthing and anchorage areas at
the Port of Odessa. Their names and numbering system were supplied by CSPO members of Group B.
The same nomenclature was used for the berthing information stored in the Access database, to allow
display of statistical summaries of the BW source and discharge data on the correct locations of the
GIS port map (the GloBallast BWRA User Guide shows how the database-GIS link is established).
3.3
De-ballasting/ballasting patterns
The deballasting/ballasting patterns at Odessa were discussed with CSPO personnel during the first
tour of the port's terminals, berthing areas and shipyards, and at a subsequent meeting with the
Harbour Master on 22 February 2002. During this meeting the various pilotage rules, draft
requirements and State environmental regulations pertaining to BW discharges and uptake in and near
the port were canvassed.
A copy of a paper record listing the total deballasted volume from each vessel which made a licensed
BW discharge at the port from 19 November 1999 to 31 December 2000 was obtained from CSPO
during the first visit for data entry and evaluation. Further information was obtained from the IMO-
style BWRFs (translated into Russian) that CSPO had phased in during early 2001, while access to the
port's general shipping records (Harbour Master Log) provided a source of gap-filling information for
last and next ports of call and vessel identification details4. BWRF submission rates were high owing
to Order No 62 of the State Department of Maritime and Inland Water Transport (11 March 2001)
requiring Harbour Masters to collect IMO BWRFs, plus a mandatory licensing requirement for BW
discharges, as managed under the environmental regulations of Ukraine's State Inspection for
Protection of the Black Sea (SIPBS). Records held at the Odessa office of SIPBS contained the same
vessel visit information as in the port shipping records, plus the results of tested BW (sampled mostly
from the tanks of oil tankers and other vessels suspected to contain oily BW).
4 These records list vessel name, IMO number, GT, arrival/departure dates, berth, last and next ports of call, and cargo
details.
10
3 Methods
The ballasting/deballasting picture for Odessa was therefore assembled from CSPO's 1999-2000
paper record and the Russian-translated BWRFs collected between January 2001 and July 2002, plus
record cross-checking and gap-filling using the Harbour Master's port shipping records5 (both for the
paper record and where incomplete or doubtful BWRF entries were found during database entry).
The Port of Odessa has dedicated liquid and dry bulk import/export terminals, rail and road-served
general cargo wharfs, a ship repair yard and a modern container terminal. The multi-purpose wharfs
handle a wide variety of break-bulk, palleted and dry bulk cargos. Determining where and which
arriving ships were discharging or uplifting BW was therefore based on their BWRFs, identifying the
vessel type and berthing location, plus cross-checks of cargo loading/unloading details in the Harbour
Master's records.
3.4 Identification of source ports
To provide confidence as to which ports were the predominant sources of BW discharged at Odessa,
the ship name, arrival date, source port and volume of discharged BW listed in CSPO's 1999-2000
paper record were first entered into a customised Excel spreadsheet supplied to Group B members by
the consultants. Vessel ID information and port location details required by the database were then
added to this spreadsheet in a format enabling convenient copy/pasting into the relational Visit,
Vessel, Tank and Port tables of the Access database. Before any new port was added to the database,
its correct port name and country spelling, unique UN Port Code number, location coordinates and
bioregion were checked using Lloyds' Fairplay World Ports Guide and the world bioregion list in the
Access database (full details on entering the required port data are given in the GloBallast BWRA
User Guide).
BWRFs collected between January 2001 and July 2002 by CSPO's Ecology Department officers were
entered to the database, an operation started by Group B members during the consultants first visit and
completed during their second visit. Collection of the Russian-translated BWRFs became virtually
mandatory for any ship deemed likely to discharge significant quantities of BW after entering the Port
of Odessa in March 2001, so there had been a high return rate of these forms from this month forward.
These BWRFs were initially sorted by source port, country and date, translated to English, entered
into the database, then gap-filled and double-checked as and where necessary.
For vessels arriving before BWRFs were regularly collected, or which submitted incomplete forms
and/or doubtful data, checking and gap-filling details were obtained by cross-referencing with
CSPO's paper record and the Harbour Master's port shipping records. However the latter showed only
the Last Port of Call, which may not be the BW source. To identify which last ports of call were
probable BW sources, cross-checks were made of source ports and last ports of call reported in other
BWRFs by the same or similar types of vessel. The Lloyds Fairplay Port Guide and Lloyds Ship
Register6 were also used to confirm source port trade and the vessel's IMO identification number,
vessel type and DWT of arriving ships respectively.
Many gaps or doubtful values in the BWRFs and CSPO's paper record could therefore be filled by
checking, for any arrival, the vessel name, type and DWT, its previous visit history, last port/s of call
and apparent charter/liner trade, and by using the Excel spreadsheet supplied by the consultants to
estimate the amount BW discharged or taken up7 (Figure 5). This was less easy for vessels arriving at
the general cargo and container berths, for which some incomplete BWRFs could not be gap-filled to
5 The Harbour Master Log was used in preference to SIPBS's BW testing and licensing records owing to the former's
convenient location at the port offices, its port-oriented filing order and the lack of access and confidentiality issues with
respect to SIPBS evidence used for past and potential court rulings.
6 A CD-ROM version of the 2001 Lloyds Ship Register was supplied to each Demonstration Site by PCU. These are much
faster to use than the large `directory style' hard-copy volumes.
7 This spreadsheet contained coefficients of the BW taken up or discharged (as percentages of DWT for each vessel type
when loading and/or discharging cargo), based on BW capacity and discharge data obtained from other studies, BWRFs
and Lloyds Ship Register.
11
Ballast Water Risk Assessment, Port of Odessa, Ukraine, October 2003: Final Report
the level allowing inclusion by the automatic calculation of BW tank discharge frequency and volume
for every identified source port.
Most BWRFs required careful checking for completeness and accuracy. In the case of unusual (or
missing) BW discharge values, these were checked using the Excel spreadsheet to determine likely
volumes based on vessel type, DWT, last port/source port and loading record.
Figure 5. Working page of the Excel spreadsheet used to estimate BW discharges
The database filling, checking and gap-filling exercise was undertaken by Group B members before
and during the consultants' second visit, with the database of 2297 vessel visits compiled by:
· entering visit details to the Excel spreadsheet from the CSPO paper record and Harbour
Master's shipping records for the pre-BWRF and BWRF phase-in periods (19 November
1999 - 28 February 2001), then using the Fairplay Port Guide and Lloyds Ship Register to
add or correct the port details, vessel names, IMO numbers, vessel types, DWTs and BW
volumes; and
· entering the BWRFs (1 March 2001 4 July 2002) then cross-checking and gap-filling
incomplete, unusual or missing forms using the Harbour Master shipping records, the Lloyds
Ship Register, Fairplay Port Guide and/or Excel spreadsheet.
3.5 Identification of destination ports
Since `prevention is better than cure', it is usually most effective to address environmental problems
as close to their source as possible. In the case of ballast-mediated aquatic bio-invasions, actions
helping prevent ships taking up harmful organisms from ballasting areas may be more effective than
trying to treat the organisms once they are inside the tanks, or trying to manage the problem at the
discharge port. To date, however, the majority of actions addressing ballast-mediated introductions
have been driven and undertaken by ports and port States that receive BW, with little activity
occurring at the locations of BW uptake. The GloBallast programme has therefore been attempting to
shift some of the focus from shipboard/point-of-discharge measures towards reducing the uptake of
organisms in the first place.
Knowing the destinations where departing vessels will discharge BW is an important step in helping
port States to reduce the spread of unwanted and potentially harmful species (either introduced or
native to their own ports) to their trading partners. It is also critical for preventing unwanted species
translocations between a State's domestic ports and/or its neighbouring foreign ports. Determining the
destinations of BW exported from the Demonstration Site was therefore an objective of the GloBallast
BWRA (Section 2).
12
3 Methods
Both the BWRFs and port shipping records for Odessa list the Next Port of Call of all departing
vessels, and these were added to the database for analysis. However the next port of call may not be
where BW carried by a ship is discharged, either fully or partly. For example, it may be a nearby port
where some minor cargo is unloaded/loaded, a strategic destination port that was received in the
initial sailing instructions (e.g. Istanbul, Suez, Gibraltar), and/or a convenient `hub' port where ships
anchor and wait for new sailing instructions.
To overcome this problem, a supplementary question needs to be added to the present IMO BWRF,
i.e. requesting the name of the port where discharge from each ballast tank is predicted. These ports
can be predicted by ships engaged on a regular liner service (e.g. many container ships, vehicle
carriers, Ro-Ro ships and LNG carriers, as well as some crude oil tankers, products tankers and large
bulk carriers). However for other ship types (and occasionally the former) ship officers cannot reliably
anticipate where BW discharges will be necessary. For example, for general cargo ships, bulk carriers
and tankers engaged in spot charter work (or when completing a charter period), these vessels may
often depart in ballast having a received a general sailing order to proceed towards a strategic location
until further instructions.
The next ports of call were therefore added to the vessel visit data and examined, so that the Pilot
Country team could gain experience in the problem of identifying ballast water destinations. Adding
the next port of call also improves the trading history for each vessel, and these can be useful when
trouble-shooting missing or incorrect BWRF data. As with the source ports, any new next port of call
added to the database was provided with its country name, UN Port Code, world bioregion and
location coordinates to enable its frequency of use by departing vessels to be displayed on the GIS
world map (port input details are in the GloBallast BWRA User Guide).
3.6 BWRF
database
The Access database developed by the consultants manages all items on the IMO standard BWRF.
Entry, editing and management of the BWRF records are undertaken using a series of GUIs, as
described in Section 2 of the BWRA User Guide. The three `tab' pages of the GUI used for general
BWRF data and the individual ballast tank inputs are shown in Figure 6.
Items not listed on the BWRF but required by the database to run the risk analysis and display the
results on the GIS include the geographic coordinates, bioregion and UN code (a unique five letter
identifier) of every source and destination port, plus the berthing location and DWT of every arrival at
the Demonstration Site.
Many berthing locations had to be identified from the port shipping records because the BWRA
objectives include identifying the locations within a Demonstration Site where deballasting/ballasting
occurs (Section 2). After the consultants first in-country visit (February 2002), CPSO Ecology
Department officers ensured the berthing location was annotated to submitted BWRFs to help reduce
the data-entry workload. Another item requiring frequent look-up was the vessel's deadweight
tonnage (DWT) since the BWRF requests only the gross tonnage (GT). As noted in Section 3.4,
adding the DWT (present in the Lloyds Ship Register) enables convenient checks of reported volumes
and gap-filling of missing values (see below).
Not all of the BWRF question fields need to be completed by a ship's officer to provide a visit record
that can be saved to the database and later included in the risk analysis. A basic visit record can be
established if three key items are entered. These are outlined in red on the input GUIs (Figure 6) and
are:
· Vessel identification - a unique 7 digit IMO number that remains the same for the life of the
ship, irrespective of any name changes;.
· Arrival date.
· A ballast tank code (which appears on the `Add Tank' sheet and provides an `All Tanks'
option for BWRFs that were submitted without individual tank details).
13
Ballast Water Risk Assessment, Port of Odessa, Ukraine, October 2003: Final Report
Figure 6. The three tabs of the GUI used for entering the BWRF data
Without these items the database cannot save a visit / tank record or any other associated information.
Whether or not a saved record is included by the database for its risk analysis calculations depends on
which other BWRF fields were completed or gap-filled. Key items are the source port, source date,
volume and discharge date for each (or all) ballast tanks discharged, and the berthing location. As
described in Sections 3.4 and 3.5, important BWRF information that is missing or incorrect can
usually be substituted or corrected by cross-checking with port shipping records, the Lloyd's Ship
Register and a comprehensive port directory such as the Fairplay guide. However this is time-
14
3 Methods
consuming, and it is far more efficient and reliable for port officers to ensure the BWRF has been
filled in correctly and completely at the time of submission (Section 4.10).
The database contains reference tables which hold the checked details of every vessel and port
previously added. A new visit record is therefore made by entering the arrival date then using a series
of drop-down lists to select the vessel, source port, last port, next port, destination port and tank
details (Figure 6). This avoids the need to re-enter the same information over and over again, as well
as the risk of generating false, `replicate' vessel, port or tank names due to spelling mistakes on the
BWRF.
Spelling mistakes on BWRFs are common. All data-entry and database managers therefore need to
understand how to avoid transcribing such errors by carefully checking all names and ID numbers
using the database drop-down lists and, where necessary, by referring to a reliable ship registry or port
directory when entering the details of a new vessel or port respectively.
The most easily-trained and efficient database operators are those with previous port and maritime
experience since they (a) bring knowledge of the local shipping trade, (b) are familiar with the
problems of checking and searching for vessel names (e.g. Tokyo Maru 2, Tokyo Maru II, Tokyo
Maru No. 11 etc), and (c) are aware that the official name of many ports in Europe, Africa and South
America may be quite different from the English name (e.g. Vlissingen versus Flushing).
3.7
Environmental parameters
During the briefing meetings in January 2002, the consultants provided a preliminary list of
environmental parameters that would be used to generate the environmental matching coefficients
between the Demonstration Sites and their main BW source ports and destination ports (Appendix 3).
The provisional list was based on review of previous port-to-port environmental analyses undertaken
for twelve trading ports in northeast Australia (Hilliard et al. 1997b). The final list of 34 parameters
used for the six Pilot Countries (Table 1) was selected in February 2002, during a joint review of the
provisional list by the consultants and scientists of IBSS in Odessa who were members of Group C.
IBSS recommended that distance categories from the berthing area/s to the nearest rocky artificial
wall, smooth artificial wall and wooden artificial substrates should be added to the list of parameters,
since these surfaces offer different types of hard port habitat which become colonised by different
types of native and introduced biota. Group C biologists at the other the Demonstration Sites were
informed of the IBSS recommendation, which was accepted unanimously.
The 34 parameters were steadily collated during course of BWRA activities for all Demonstration
Sites. They were taken or derived from data and information culled from a wide range of government,
port and scientific publications, internet web sites, port survey reports and sampling records, SST and
salinity charts, climate databases, atlases, national tide-tables, nautical charts, coastal sensitivity and
oil spill habitat maps, oil spill contingency plans, aerial photographs, national habitat databases and
local expert advice (Appendix 4). The most difficult to find were reliable water temperature and
salinity data, particularly for identifying the averages, maxima and minima for ports in or near
estuaries (Section 3.12).
A preliminary list of frequently recorded BW source ports and destination ports for the Port of Odessa
was made at the end of the first in-country visit in April 2002 (the complete list did not become
available until near the end of the second in-country visit; Section 3.1). It was agreed that the
environmental parameters for these ports should be sought between the first and second consultants'
visits, with the Odessa Group C members focussing on important ports in the Black Sea and the
consultants focussing on more distant ports in western Europe, the Middle East, Asia etc. To facilitate
this task the consultants provided a customised Excel spreadsheet for collating the environmental
data, which included guidance and reminder notes plus a format enabling direct export to PRIMER
(Section 3.8).
15
Ballast Water Risk Assessment, Port of Odessa, Ukraine, October 2003: Final Report
Near the end of the second in-country visit, sufficient port environmental data had been collated to
generate environmental matching coefficients for approximately 40% of all ports identified as trading
with the Port of Odessa, with estimates provided for ports where unobtained/incomplete data
prevented their inclusion in the multivariate similarity analysis (Section 4.6). The percentage of ports
with calculated environmental coefficients was subsequently expanded by a gap-filling exercise
undertaken by the consultants between 22 December 2002 and 31 January 2003. These were added to
the updated BWRA provided at the third meeting in February 2003 (Section 3.1) and reported here.
Table 1. Port environmental parameters used by the Environmental Similarity Analysis
Name
Variable Type
1.
Port type8
Categorical (1-6)
2.
Mean water temperature during warmest season (oC)
Scalable
3.
Maximum water temperature at warmest time of year (oC)
"
4.
Mean water temperature during coolest season (oC)
"
5.
Minimum water temperature at coolest time of year (oC)
"
6.
Mean day-time air temperature recorded in warmest season (oC)
"
7.
Maximum day-time air temperature recorded in warmest season (oC)
"
8.
Mean night-time air temperature recorded in coolest season(oC)
"
9.
Minimum night-time air temperature recorded in coolest season (oC)
"
10.
Mean water salinity during wettest period of the year (ppt)
"
11.
Lowest water salinity at wettest time of the year (ppt)
"
12.
Mean water salinity during driest period of year (ppt).
"
13.
Maximum water salinity at driest time of year (ppt).
"
14.
Mean spring tidal range (metres)
"
15.
Mean neap tidal Range (metres)
"
16.
Total rainfall during driest 6 months (millimetres)
"
17.
Total rainfall during wettest 6 months (millimetres)
"
18.
Fewest months accounting for 75% of total annual rainfall
Integer
19.
Distance to nearest river mouth (kilometres; negative value if upstream)
Scalable
20.
Catchment size of nearest river with significant flow (square kilometres)
"
Logarithmic distance categories (0-5): From the closest BW discharge location to nearest:
21.
Smooth artificial wall
Categorical
22.
Rocky artificial wall
"
23.
Wooden pilings
"
24.
High tide salt marsh/lagoon, saline flats or sabkah
"
25.
Sand beach
"
26.
Shingle, stony or cobble beach
"
27.
Low tide mud flat
"
28.
Mangrove fringe/mangrove forest
"
29.
Natural rocky shore or cliff
"
30.
Subtidal firm sandy sediments
"
31.
Subtidal soft muddy sediments
"
32.
Seagrass meadow9
"
33.
Rocky reef or pavement
"
34.
Coral reef (with carbonate framework)
"
3.8 Environmental similarity analysis
The more a BW receival port is environmentally similar to a BW source port, the greater the chance
that organisms discharged with the imported BW can tolerate their new environment and maintain
sufficient numbers to grow, reproduce and develop a viable population. Comparing port-to-port
environmental similarities therefore provides a relative measure of the risk of organism survival,
establishment and potential spread. This is the basis of the `environmental matching' method, and it
8 Offshore terminal or mooring / Natural bay / Breakwater harbour / Tidal creek / Estuary / River port.
9 Kelp forest/macroalgae bank was not included but should be considered for future analysis.
16
3 Methods
facilitates estimating the risk of BW introductions when the range and types of potentially harmful
species that could be introduced from a particular source port or its bioregion are poorly known.
A limitation of the environmental matching approach is that several harmful species appear capable of
tolerating relatively wide temperature and salinity regimes10. As discussed, other risk factors include
the frequency of ship visits/BW discharges, the volume of BW discharged, voyage times and ballast
tank size and any management measures applied during the voyage. While environmental matching
alone does not provide a complete measure of risk, an analysis of `real world' invasions indicates that
if any one factor is to be used alone, environmental matching is probably the best single indicator of
risk.
Classic examples include the two-way transfer and relatively rapid spread of harmful and other
unwanted species between the Ponto-Caspian and North American watersheds (some via stepping
stones in western Europe), and northern Australian ports that have extremely high risk factors in
terms of frequency and volumes of BW discharges (the very large bulk export ports of Port Headland,
Dampier and Hay Point and smaller bulk export ports like Weipa and Abbot Point), but which have
not experienced any significant harmful invasions (due to a low environmental matching with their
source ports). Conversely, in southern Australia and in particular Tasmania, ports which have
relatively low risk factors in terms of frequency and volumes of BW discharges, have been the entry
points of the most harmful aquatic bio-invasions (due to a high environmental matching with their
source ports).
The environmental distances between the Port of Odessa and its source and destination ports were
determined using a multivariate method in the PRIMER package. Of the various distance measures
available in PRIMER, the normalised Euclidean distance is the most appropriate. Normalisation of the
various input parameters removes the problem of scale differences, and the method can manage a mix
of scalable, integer and even categorical values, provided the latter reflect a logical sequence of
intensity or distance/location steps. Individual variables cannot be weighted but the predominance of
temperature variables (8) and salinity/salinity-related parameters (also 8; see Table 1) ensured these
exerted a strong influence on the results. Air temperature extrema, rainfall and tidal parameters were
included owing to their influence on the survivorship of intertidal and shallow subtidal organisms11.
The similarity values produced by PRIMER were examined using its clustering and ordination
modules, then exported back to the Excel file for conversion into environmental matching coefficients
before insertion into the database12.
To provide consistent and comparable results, the similarity analysis was conducted on a wide
geographical range of ports; i.e. from cold water ports in high latitude areas to warm water ports in
tropical regions, as well as from up-river terminals to those located in relatively exposed offshore
waters. This avoids the possibility of generating spurious patterns among a set of ports located in
neighbouring and/or relatively similar regions. Collating the environmental parameters for the
frequent source and destination ports of all six Demonstration Sites into a single Excel spreadsheet
achieved this, as well as permitting direct comparisons between the results from these sites13.
10
For example, the Asian date mussel (Musculista senhousia) has been reported from Vladivostok to
Singapore.
11
While ecosystem disturbance, pollution, eutrophication and other impacts on habitats and water quality can
increase the `invasibility' of port environments (particularly for r-selected species), this information was
not collated for the environmental similarity analysis owing to the problem of obtaining reliable measures
of their spatial extent and temporal nature at each port. This topic is discussed further in Sections 4.8 and 5.
12
As described in the BWRA User Guide, a simple proportional conversion of the similarity values was made
so that each matching coefficient lay between 1 (a perfect environmental match) and 0.01 (least matching),
since it is unsafe to assume a port environment can be totally hostile no matter how distant.
13 The total number of ports with a complete set of environmental parameters obtained by the end of the data
collation phase was 357. These were provided to all Demonstration Sites during the third consultant's visit
in February-March 2003 and used for this report.
17
Ballast Water Risk Assessment, Port of Odessa, Ukraine, October 2003: Final Report
The Excel file used for collating the port environmental data also contains linked spreadsheets used
for their export to PRIMER, as well as for re-importing the results and converting them into
environmental matching coefficients. In fact the database can import any type of environment
matching value obtained by any method, provided the values are placed in an Excel spreadsheet in the
format expected by the database's import feature. Details on the treatment of the environmental
variables and the production, checking, conversion and import of the similarity measures are given in
the BWRA User Guide.
3.9 Risk
species
One of the BWRA objectives was to identify `high-risk' species that may be transferred to and/or
from the Demonstration Sites (Section 2). The Access database was therefore provided with tables for
storing the names, distribution and other information on risk species. For the purposes of the BWRA
and its `first-pass' risk assessment, a risk species was considered to be any introduced, cryptogenic or
native species that might pose a threat if transferred from a source port to a Demonstration Site. The
taxonomic details, bioregion distribution, native/introduced status and level of threat assigned to a
species are also stored in the database and can be displayed for review, edit and update.
The database manages the bioregional locations and status of each entered species using the same
bioregions displayed on the GIS world map (Figures 7, 8). This map is used as a backdrop for
displaying the source and destination ports and associated BWRA results, and was compiled from a
bioregion map provided by CRIMP (now CSIRO Marine Research). The boundaries of some
bioregions were subsequently modified according to advice provided by Group C marine scientists in
five of the Demonstration Sites, including Odessa. The modifications included adding new bioregions
for large river systems to accommodate some important river ports that trade with one or more of the
Demonstration Sites. In the case of Odessa, the Black Sea bioregion MED-IX was divided into two
regions (MED-IXA and MED-IXB) owing to the distinctive salinity boundary that separates the
shallow north-west gulf of the Black Sea from the central basin (Figure 7), and four new bioregions
were added for the following river systems which contain ports and barge terminals that trade to
Odessa and other Black Sea ports:
MED-IXA-RDA
=
Danube River system and Delta
MED-IXA-RDT
=
Dniestr River system
MED-IXA-RYB
=
Yuzhny-Bug River system
MED-IXA-RDP
=
Dnepr River system
The world map displays 204 discrete bioregions which are coded in similar fashion as those in the
IUCN scheme of marine bioregions from which they were derived (Figure 8; Kelleher et al. 1995; see
Appendix 3 of the GloBallast BWRA User Guide). Bioregions serve multiple purposes and are
required for several reasons. For example, many marine regions of the world remain poorly surveyed
and have a limited marine taxonomy literature. This causes a patchy and essentially artificial
distribution of recorded marine species distributions. Few marine species surveys have been
undertaken in port environments and there are very few bioregions which contain more than one port
that has undertaken a PBBS.
Bioregions represent environmentally similar geographic areas. Thus if a species is found established
in one part of a bioregion, there is a good chance it can spread via natural or human-mediated
processes to other sites in the same bioregion. A conservative approach was therefore adopted for the
GloBallast BWRA, whereby a risk species, if recorded in at least one location of a bioregion, is
assumed potentially present at all source ports within the same bioregion. This type of approach will
remain necessary until a lot more PBBSs are conducted and published. Because taxonomic analyses
of the PBBS samples of the Demonstration Sites had not been completed by the consultants second
visits, the reverse stance was adopted for these ports (i.e. it was assumed they did not contain any risk
species recorded at other location/s in their bioregion).
18
3 Methods
The corresponding set of bioregions stored in the database has particular sets of risk species assigned
to them. The species and associated data added to the database over the course of the Activity were
collated from a range of sources. These included the book of introduced species in the Aegean,
Marmara, Black Azov and Caspian Seas (AMBACS) published by Group C member Professor
Yuvenaly Zaitsev (Zaitsev & Öztürk, 2001) and a preliminary list of organisms found by the recent
GloBallast PBBS of Odessa (which became available during the consultants' second visit).
Other sources used for developing the risk species database are listed in Appendix 5. These comprised
a range of literature plus international and regional internet databases, including those being
developed by the Smithsonian Environmental Research Center's (SERC) National Estuarine &
Marine Invasive Species Information System (NEMISIS), CSIRO's National Introduced Marine Pests
Information System (NIMPIS), the Global Invasive Species Programme's (GISP) Global Invasive
Species Database, and the Baltic, Nordic and Gulf of Mexico web sites. The database used for the
`first-pass' risk assessments and provided to the Demonstration Sites during the consultants third visit
contained 421 species but these do not represent a complete or definitive global list. Thus the database
tables and their associated Excel reference file represent a working source and convenient utility of
risk species information that can be readily updated and improved.
Figure 7. Part of the GIS world map of marine bioregions, showing the code names of those in the Black Sea
region
19
Ballast Water Risk Assessment, Port of Odessa, Ukraine, October 2003: Final Report
Figure 8. Complete GIS world map showing the marine bioregions
[to improve clarity, not all bioregion codes are shown in this example]
20
3 Methods
To provide a measure of the risk species threat posed by each source port, the database analyses the
status of each species assigned to each bioregion and generates a set of coefficients that are added to
the project-standard calculation of relative overall risk (Section 3.10). The following description is
summarised from Section 6 of the GloBallast BWRA User Guide, which describes how the species
data are managed and used by the BWRA system.
The database allows each species to be assigned to one of three levels of threat, with each level
weighted in log rhythmic fashion as follows:
· Lowest threat level: This is assigned to species with no special status other than their
reported or strongly suspected introduction by BW and/or hull fouling14 in at least one
bioregion (i.e. population/s with demonstrated genetic ability to survive transfer and establish
in regions beyond their native range). A fixed weighting (1) is applied to each of these species
when present in bioregions outside their native range. This was also the default level assigned
to any new species when first added to the database.
· Intermediate threat level: This level is assigned to any species suspected to be a harmful
species or invasive pest. Risk species assigned to this level receive a default weighting value
of 3 in both their native and introduced bioregions.
· Highest threat level: This level is assigned to known harmful invasive species, as reported in
institutional or government lists of aquatic nuisance species and pests, and/or in peer-
reviewed scientific journals. The default weighting value applied to these species is 10.
The database allows users to change the threat status level assigned to each species, as well as the size
of the second and third level default weighting values. Another risk species weighting option was also
provided in the database, which could be used to proportionally increase the weight of all source port
threat coefficients by increasing its default value of 1. The default values of the four weightings (1, 3,
10 and 1) provided the `project standard' result to permit unbiased comparisons between the `first-
pass' BWRA results for each Demonstration Site.
The database calculated the coefficient of `risk species threat' posed by each source port, with each
port value representing a proportion of the total risk species threat. The latter was the sum of all
weighted risk species assigned to the bioregion of all source ports that export BW to the
Demonstration Site. Species assigned to more than one bioregion are summed only once, and the
algorhythm automatically discounted any species that was native in the Demonstration Site's
bioregion. It included any introduced species assigned to the bioregion of the Demonstration Site
since, as discussed above, the Demonstration Site was assumed to be free of risk species. This was the
default position of the project-standard BWRA15.
The risk species coefficient for each source port is therefore calculated by firstly summing the number
of non-indigenous species (NIS) in that port's bioregion which have no suspected or known harmful
status. This provides a measure of the low level `weedy' and sometimes cosmopolitan species which,
although having no acknowledged harmful status, have proven transfer credentials that could enable
their establishment in another port with probably low but nevertheless unpredictable biological or
economic consequences. This number is then added to the sums of suspected and known harmful
14 At the outset of the project, species capable of transfer only by ballast water were planned to be added to
the database. However many species may be introduced by hull fouling as well as BW, with the principal
vector for many of these remaining unclear. Group C scientists in all Pilot Countries were unanimous in
their preference for including all species introduced by BW and/or hull fouling or possibly aquaculture in
the project standard BWRA database. For future BWRAs a `vector status' value could be assigned to each
species in the database, so that risk assessments could be focussed on specific shipping-mediated vectors.
15 When the taxonomic identifications of the recent port biological baseline surveys are completed, risk
species confirmed as already present at a Demonstration Site may be identified for the BWRA database
maintained for that site. Their deletion would reduce the size of the risk species coefficients obtained by the
`first-pass' BWRA such as reported here for Odessa, but the revised database should not be copied to
develop other port BWRAs.
21
Ballast Water Risk Assessment, Port of Odessa, Ukraine, October 2003: Final Report
species in the same bioregion (these include any native species identified as such by Group C local
scientists). The default calculation for the risk species coefficient for each source port (C) is thus:
CSource Port = (NIS + [Suspected Harmfuls x 3] + [Known Harmfuls x 10] ) / Total SumAll Source Ports
The C values lie between 0-1 and represent an objective measure of the relative total species threat,
since the only subjective components within the project standard BWRA database were the
`universal' assignments of species to particular levels of threat, plus the weightings attached to these
levels. Note that the C values for source ports inside the same bioregion will be the same, and that the
Total Sum divisor does not represent all species in the database, but only those assigned to bioregions
containing source port/s that actually trade with the Demonstration Site. It should also be noted there
are several limitations from incorporating a risk species coefficient into the default calculation of the
`first-pass' BWRAs. These included:
· Use of an incomplete list of species that were assigned to one of the three levels of threat
(introductions, suspected harmful species, known invaders).
· Significant knowledge gaps on the global distribution of many native, cryptogenic and
introduced species (as a consequence of the limited number of species surveys that remain
geographically biased to parts of North America, Europe and Australian/New Zealand).
· Gaps and constraints in the taxonomy and reliable identifications for many aquatic species
groups.
Such limitations must be taken into account when considering the weighting of the risk species
coefficient relative to the other risk factors such as environmental matching.
3.10 Risk assessment
Approach
The database employed the BW discharge, port environmental matching and bioregion species
distribution/threat data to calculate, as objectively as possible, the relative risk of a harmful species
introduction to a Demonstration Site, as posed by discharges of BW and associated organisms that
had been ballasted at each of its identified source ports. A GUI enabling convenient alteration of the
risk calculations and weighting values (Figure 9), plus use of ArcView to geographically the display
results, improves the system's value as an exploratory utility and demonstration tool.
The semi-quantitative method aims to identify the riskiest tank discharges with respect to a
Demonstration Site's present pattern of trade. Unlike a fully quantitative approach, it does not attempt
to predict the specific risk posed by each intended tank discharge of individual vessels, nor the level
of confidence attached to such predictions. However, by helping a Demonstration Site to determine its
riskiest trading routes, exploring the semi-quantitative BWRA provides a coherent method for
identifying which BW sources deserve more vessel monitoring and management efforts than others,
plus the significance of local, regional and distant trading routes and associated vessel types.
Risk coefficients and risk reduction factors
For each source port, the database used four coefficients of risk (C1-C4) and two risk reduction
factors (R1, R2) to produce a relative overall measure of the risk of a harmful species introduction at
the Demonstration Site. The database GUI shown in Figure 9 can be used to remove one or more of
these components, or alter the way they are treated, from the default `project-standard' formula which
was used for the first-pass BWRA. The four risk coefficients calculated for each source port were:
C1 proportion of the total number of ballast tank discharges made at the Demonstration Site,
C2 proportion of the total volume of BW discharged at the Demonstration Site,
C3 port-to-port environmental similarity, as expressed by the matching coefficient,
C4 source port's contribution to the total risk species threat to the Demonstration Site, as posed
by the contemporary pattern of trade (1999-2002).
22
3 Methods
In biological terms, C1 and C2 represent the frequency and size of organism `inoculations'
respectively. C3 provides a measure of the likely survivability of these inoculated organisms, and C4
the relative threat posed by the organisms within each inoculation. Each coefficient has values
between 0-1 except C3, where the lowest value was set to 0.01 (it is unsafe to assume a port
environment can be sufficiently hostile to prevent survival/establishment of every transferred
introduced species; Section 3.8).
The two risk reduction factors calculated by the database were R1 (effect of ballast tank size on C2)
and R2 (effect of tank storage time on C4). R1 represents the effect of tank size on the number and
viability of organisms that survive the voyage, since water quality typically deteriorates more rapidly
in small tanks than large tanks (owing to the volume/tank wall ratio and other effects such as more
rapid temperature change, with mortality rates generally higher in small tanks). As described below,
no risk reduction was applied to any source port dispatching vessels with tank volumes greater than
1000 tonnes.
R2 represents the effect of tank storage time on the range and viability of discharged organisms.
Survival of most phytoplankton and aerobic biota inside any tank decreases with time, with relatively
high survival rates reported for voyages less than 5 days (as shown below, this was adopted as the cut-
off point for any risk reduction due to in-tank mortality). If the focus is only on long-lived anaerobes,
dinoflagellate cysts or pathogens (all of which have long tank survival rates), then R2 can be deleted
from the BWRA calculation, using the GUI shown in Figure 9 (details are in the GloBallast BWRA
User Guide).
Figure 9. Database GUI used for manipulating the BWRA calculation and weightings
23
Ballast Water Risk Assessment, Port of Odessa, Ukraine, October 2003: Final Report
The database calculates the tank storage time by subtracting the reported tank discharge date from the
ballast uptake date. For incomplete BWRFs with missing discharge or uptake dates, the vessel arrival
date plus a standard voyage duration at 14 knots16 were used to estimate the BW uptake date for
adding to the database. The database automatically provides values for R1 and R2 using a log
rhythmic approach17, with the project-standard BWRAs applying the following default (but
adjustable) R1 and R2 risk-reduction weightings to C2 and C4 respectively:
R1
Maximum tank volume discharged (tonnes) in
<100
100-500
500-1000
>1000
the database record for each source port
W4
Default risk-reduction weighting applied to C2
0.4
0.6
0.8
1
R2
Minimum tank storage time (days) in the
<5
5-10
10-20
20-50
>50
database record for each source port
W5
Default risk-reduction weighting applied to C4
1
0.8
0.6
0.4
0.2
Although all information reported in the ballast tank exchange section of the BWRFs was entered into
the database, the `first-pass' BWRA did not use these data to apply a risk reduction factor for each
source port route for the following reasons:
· implementation of the BWRFs at the Demonstration Sites was relatively recent, and the tank
exchange did not provide a sufficiently consistent or reliable sample of ballast importation
(Section 3.4);
· although BWRFs were introduced at Odessa in early 2001 under an order of the State
Department of Marine and Inland Water Transport to implement IMO Resolution A.868(20),
there was no formal mechanism compelling all vessels to submit fully completed forms;
· insufficient vessel log inspections and tank monitoring data were available for checking
claimed exchanges and reported locations;
· discounting whether or not effective BW exchange/s were taking place (a) removed the need
to predict the size of the risk reduction, and (b) was precautionary with respect to the ability
of exchanges to remove all organisms taken up at the time of ballasting.
BWRA calculation
As shown in Figure 9 and described in the GloBallast BWRA User Guide, the database GUI allows the
six components of the BWRA calculation and the five weighting factors to be altered from the default,
`project-standard' setting. The GUI can therefore be used to explore how particular risk components
and their treatment influence the final result, and also improves the demonstration value of the system.
One example is the way the environmental matching coefficient (C3) is treated by the BWRA
calculation. For scientists who consider that C3 should be treated as an independent coefficient of risk
(see below), then the formula for calculating the relative overall risk (ROR) posed by a source port is:
(1)
ROR = ( C1 + [C2 x R1W4] + C3 + [C4 x R2W5] ) / 4
Equation (1) is the default setting used for the project-standard BWRA for each Demonstration Site.
In this case, ROR is the combined measure of the proportional `inoculation' frequency (C1) and size
(C2), the relative similarity of the source port/Demonstration Site environmental conditions (C3), and
the relative level threat posed by the status of species assigned to the source port's bioregion (C4).
The division by 4 keeps the result in the 0-1 range to allow the convenient expression of the ROR as a
ratio or percentage of the total risk posed by all the source ports.
16 The voyage duration between ports for particular vessel speeds are tabled in many maritime guides and
atlases, such as the Lloyds Maritime Atlas of World Ports and Shipping Places and the 2001 Fairplay Port
Directory.
17 As with the risk species threat level weightings, a log rhythmic approach is appropriate for risk reduction
factors in biological risk assessments.
24
3 Methods
For those who consider the proportional risk species threat (C4) should provide the focal point of the
risk calculation, they may prefer to treat C3 as a risk reduction factor for influencing the size of C4,
rather than using it as an independent `surrogate' coefficient to help cover unidentified or unknown
species. The GUI allows the formula to be changed to reflect this approach, in which case C3 would
be applied as follows:
(2)
ROR = ( C1 + [C2 x R1W4] + [C3 x C4 x R2W5] ) / 3
[divisor is now 3 because of the reduced number of summed coefficients].
For a source port in a bioregion with a large number of risk species (eg. a relatively high C4 of 0.2)
but with an environment very dissimilar to the Demonstration Site (e.g. C3 = 0.2), then Equation (2)
would reduce C4 to 0.04 (i.e. an 80% reduction). If the minimum tank storage time was relatively
long (e.g. R2 was between 10-20 days for the quickest voyages, so W5 = 0.6), then C4 would be
further reduced to 0.024 (i.e. an 88% reduction to its initial value).
Equation (2) is logical provided the database contains an accurate distribution of appropriately
weighted risk species in the various source port bioregions (including native species considered
potentially harmful if they established in other areas). However Equation (2) is less conservative than
Equation (1), particularly if there are doubts that C4 provides a true picture of potential risk species
threat. As shown in Table 2, Equation (1) produces higher ROR values, unless a single source port
accounts for over 50% of the frequency (C1) and volume (C2) of the total discharges at a
Demonstration Site (this is highly unlikely). The database also allows users to increase the influence
of C4 on the ROR by increasing the default value of the overall W3 weighting factor from 1 (but see
the caution in Section 3.10). Increasing the size of C4 has more affect in Equation (1) because C3 has
no direct influence on the size of C4.
Table 2. Examples showing how Equation (1) provides more conservative outcomes than (2) for typical
situations*
Relative Proportion of Proportion of Enviro-
Relative
Overall
discharge
discharge
mental
Risk species
(*when C1 and C2 are less than 50%)
Risk
Frequency
Volume
matching
threat
ROR
C1
C2
C3
C4
ROR
= [C1 + C2 + C3 + C4] / 4 Equation (1)
0.150
0.1
0.1
0.2
0.2
ROR
= [C1 + C2 + (C3 x C4) ] / 3 Equation (2)
0.080
0.1
0.1
0.2
0.2
ROR
= [C1 + C2 + C3 + C4] / 4 Equation (1)
0.200
0.2
0.2
0.2
0.2
ROR
= [C1 + C2 + (C3 x C4) ] / 3 Equation (2)
0.147
0.2
0.2
0.2
0.2
ROR
= [C1 + C2 + C3 + C4] / 4 Equation (1)
0.350
0.5
0.5
0.2
0.2
ROR
= [C1 + C2 + (C3 x C4) ] / 3 Equation (2)
0.347
0.5
0.5
0.2
0.2
ROR
= [C1 + C2 + C3 + C4] / 4 Equation (1)
0.400
0.6
0.6
0.2
0.2
ROR
= [C1 + C2 + (C3 x C4) ] / 3 Equation (2)
0.413
0.6
0.6
0.2
0.2
ROR
= [C1 + C2 + C3 + C4] / 4 Equation (1)
0.450
0.7
0.7
0.2
0.2
ROR
= [C1 + C2 + (C3 x C4) ] / 3 Equation (2)
0.480
0.7
0.7
0.2
0.2
ROR
= [C1 + C2 + C3 + C4] / 4 Equation (1)
0.550
0.9
0.9
0.2
0.2
ROR
= [C1 + C2 + (C3 x C4) ] / 3 Equation (2)
0.613
0.9
0.9
0.2
0.2
Managing and displaying the results
When the database is requested to calculate the BWRA, it generates a large output table that lists all
sources of tank discharges recorded at the Demonstration Site, as entered from the BWRFs and/or
derived from the port's shipping records. The table shows the ROR values plus their component
coefficients and reduction factors. Because the Demonstration Sites have a large number of source
ports (80-160), trends are difficult to see within long columns of tabled values.
25
Ballast Water Risk Assessment, Port of Odessa, Ukraine, October 2003: Final Report
The ROR results are therefore further manipulated by the database to provide additional columns
showing:
· the risk category of each source port, as placed in one of five levels of risk for displaying on
the GIS world map;
· a standardised distribution of the ROR results, i.e. from 1 (highest ROR value) to 0 (lowest
value).
The five risk categories are labelled `highest', `high', `moderate', `low' or `lowest', with their
boundaries set at equal linear intervals along the 0-100% scale of cumulative percentage risk (i.e. at
80%, 60%, 40% and 20% intervals). This is the default setting used for the project-standard BWRAs.
The database GUI (Figure 9) allows users to shift one or more of these boundaries to any point on the
scale. For example, a logbased distribution of the five risk categories may be preferred and is easy to
produce using the GUI.
In the case of the standardisation, the database applies the following simple manipulation to expand
the distribution of ROR values to occupy the 0-1 range, where 1 represents the maximum ROR value
and 0 the minimum value:
RORSTANDARDISED = (ROR RORMINIMUM) x 1/ (RORMAXIMUM RORMINIMUM)
This facilitates comparisons between BWRA results from other sites, as well as from different
treatments of the ROR formula and/or the weightings. As with the ArcView GIS, the database was
designed to optimise the user-friendliness, flexibility and management utility of the system.
Rationale for undertaking `Project Standard' BWRAs
The flexibility provided by the database allows users to investigate and demonstrate various
permutations and avenues without requiring specialised knowledge in database construction and
editing. However it was important to apply a consistent, straightforward approach to the `first-pass'
BWRA for each Demonstration Site, so their outcomes could be compared and contrasted to help (a)
evaluate the system and approach, and (b) identify areas where changes could improve future use.
Each Demonstration Site has a particular trade profile and associated pattern of
deballasting/ballasting. Their divergent geographic locations further contributes to their possession of
unique sets of BW source ports which have relatively limited overlap. Thus if results from any two or
more Demonstration Sites are to be compared, all of their shared and non-shared source ports and
bioregions need to be combined for calculating the environmental matching and risk species threat
coefficients.
It was therefore decided that, because the six sites effectively span the globe, the `project-standard'
BWRAs undertaken for each site should use the same global set of source port environment and risk
species data. This ensures the port-to-port similarities and risk species threats were based on the
widest possible range of port conditions and species distributions, thereby reducing the potential for
spurious results resulting from overly narrow regional approaches (Section 3.8).
26
3 Methods
3.11 Training and capacity building
Members of the consultants team worked with their Odessa counterparts to provide BWRA guidance,
training, software and associated materials on the following occasions:
Occasion/ Date
Location and
BWA Activity Tasks
Consultants
[working days]
Counterparts*
Activity Kick-Off Presentation, briefing and logistics meetings to:
NIO Offices in Goa.
January 2002
Identify equipment and counterpart requirements
R Hilliard
CFP:/CFPAs from
[1.5 days]
Develop provisional pilot country visit schedule
all Pilot Countries
1st Country Visit
Introductory half-day seminar
CSPO offices,
February 2002
Install and check computer software
Odessa
[5 days]
Commence training and capacity building
Begin GIS mapping of port and resources
R Healy
Group A
counterparts
Port familiarisation tour
T Hayes
Group B
Review BWRFs and Port Shipping Records
R Hilliard
counterparts
Commence BWRF database development &
Group C
training
counterparts
Review port environmental data and identify
sources
Seminar & tutorials on multivariate similarity
analysis
Identify data collation/input tasks before 2nd visit
2nd Country Visit
Update Database GUIs, add-ins & make ODBC
CSPO offices,
Nov-Dec 2002
links
Odessa.
[12 days]
Continue training and capacity building
Complete GIS mapping of port and resources
C Clarke
Group A
Complete BWRF database development and
counterparts
J Polglaze
training
Group B
R Hilliard
Complete port environmental data
counterparts
assembly/training
Group C
Complete environmental similarity analysis
counterparts
training
Generate environmental matching coefficients
Add risk species data to database, refine bioregions
Complete BWRA training and undertake first
analysis
Hold seminar to review and discuss results
Discuss pilot country needs for future BWRA
3rd `Wrap-up'
Provide Database containing all port environmental
IACSS, Odessa.
Visit
and risk species data obtained for the six sites
February 2003
Group A leader
Provide updated BWRA User Guide and final
C. Clarke
[2.5 days]
training on BWRA system operation
Group B leader+
CFP & CFP-A.
Review and discuss updated BWRA results
* refer Appendix 2 for project team structure and counterpart details.
At the kick-off meeting in January 2001, CFP/CFPAs were briefed on the nature, objectives and
requirements of the activity. An introductory PowerPoint presentation describing the BWRA system
proposed for achieving the BWRF objectives was made, and logistics meetings with individual Pilot
Countries subsequently held. A project check-list and briefing document were distributed listing the
computer hardware and peripherals required at each Demonstration Site plus the proposed structure of
27
Ballast Water Risk Assessment, Port of Odessa, Ukraine, October 2003: Final Report
the joint Pilot Country-consultants project team (see Appendices 2 and 3). Appropriate experience of
Pilot Country counterparts for the three groups forming the team was emphasised during the kick-off
meetings.
During the subsequent in-country visits by the consultants, the main BWRA training and capacity-
building components provided were as follows:
· Supply of software licences and User Guide and installation of ESRI ArcView 3.2 and
PRIMER 5.
· Guidance and `hands-on' training and in GIS mapping of marine resources.
· Supply of 2001 CD-ROM edition of the Lloyds Ship Register, and customised Excel
spreadsheet file for convenient collation of vessel identification and DWT data and reliable
estimation of BW discharges from port shipping records, for the pre-BWRF period and
BWRF checking.
· Guidance, `hands-on' training and assistance with the Access database and BWRF
management;
· Guidance, `hands-on' training and glossaries of terminology on the collation, checking, gap-
filling and computerisation of BWRFs and principles of database management.
· Guidance and assistance on (a) search, collation and computer entry of environmental data for
important BW source and destination ports, and (b) the terminology, networking, data
collation and management requirements for species information used for the risk species
threat coefficient.
· Tutorial, `hands-on' training and assistance on theory, requirements and mechanics of
multivariate similarity analyses of port and coastal environmental data.
· Tutorial, guidance, `hands-on' training, seminars and PowerPoint material on BWRA
approaches, methods and results evaluation.
· Supply of electronic BWRA User Guide with glossaries and technical appendices.
To promote collaboration, understanding and continuity among the three groups, the consultants
arranged for group counterparts to provide presentations and guidance to other group members during
the 2nd visit.
3.12 Identification of information gaps
This was a critical part of the activities undertaken during the first in-country visit by the consultants,
with attention focussed on locating and checking the following BWRA information input
components:
· Completeness of BWRFs submitted by vessels arriving at the Demonstration Site.
· Gaps, legibility and authenticity of information reported in the returned BWRFs.
· Sources and availability of shipping records for BWRF gap-filling.
· Existence of electronic and paper charts, topographic and coastal resource maps, atlases,
aerial photographs and publications for GIS port map.
· Sources, reliability and extent of port environmental data and coastal resource information for
Demonstration Site and its trading ports in the Pilot Country and region.
· Sources and extent of marine species records, information and researchers on introduced
species in and near the Pilot Country.
At the end of the first country visit, the status of the above were reviewed and a list of gap-filling
tasks, as allocated to the Pilot Country groups or consultants and to be undertaken by the second visit,
were agreed upon and minuted. Follow-up gap-filling tasks were also conducted during and after the
second visit.
28
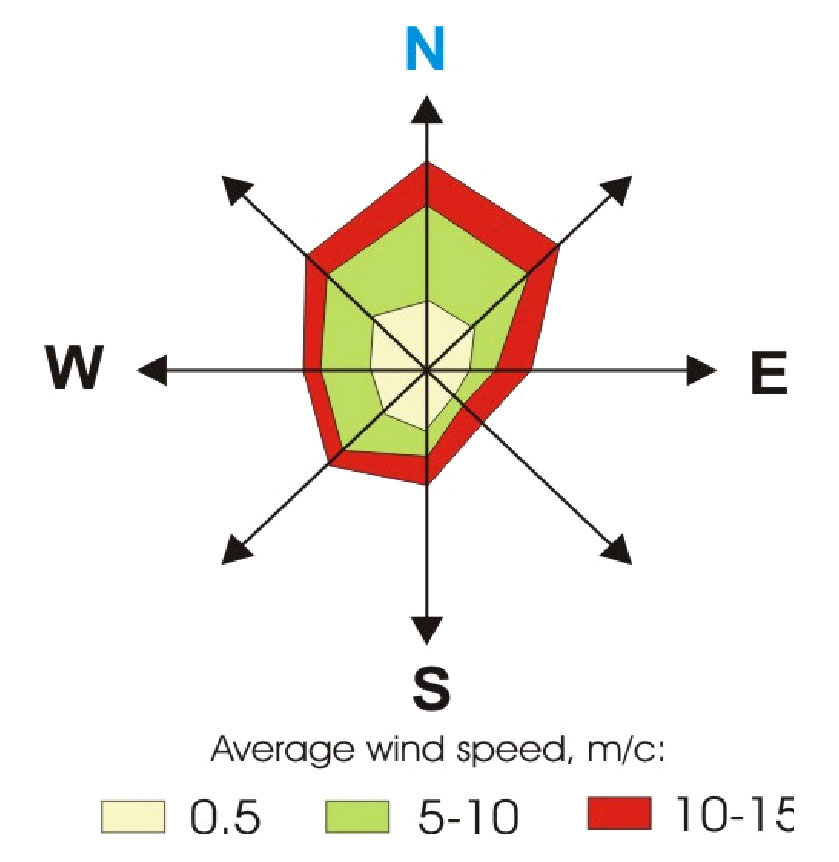
4 Results
4.1 Description of port
General features
The port is located in Odessa Bay (Odesskiy Zaliv; Odes'ka Zatoka) near the north-west corner of the
Black Sea at 46o 32'N 30o 54'E (Figures 2,11). The first harbour was developed during the late 1790's
to provide merchant and military berths close to the fortress of Hajibey (Khadjibey). The port was
heavily damaged during World War II and was steadily rebuilt during the 1950s-1970s to become a
fully commercial port by 1980. The container terminal was subsequently developed on port land
reclaimed during the 1980s. Trade reached an annual peak of 11 million tonnes of dry cargo and 20
million tonnes of oil products in 1989, but was subsequently halved following the end of the Soviet
Union. By 1994 the port management structure had been changed and joint-activity companies had
been developed to accelerate port and cargo-handling modernisation. Odessa steadily rebuilt its trade
during the 1990s to remain the largest port in Ukraine, with oil and petroleum products, metals, grain
and fertilizer forming the most important components of its trade. In 2001 its trade in liquid (18.9
million tonnes) and dry cargos (10.1 million tonnes) reached 29 million tonnes, increasing further in
2002 to 32.6 million tonnes, which is approximately one third of Ukraine's total port trade. After
entering the relatively shallow coastal waters more than 40 km south-east of the port, ships approach
the port along a marked channel where depths gradually shoal from ~20 m until the final 3 km
approach, where dredging is required to maintain navigable depths of 12.5 m below chart datum.
Climate and weather
The temperate climate of the southern Ukraine region is characterised by mild to warm summers with
variable sea breezes and cold, dry winters dominated by northerly winds. Mean day-time temperatures
regularly exceed 20oC during summer (maxima to ~37oC), while winter night-time temperatures
usually fall below 0oC (minima to -27oC). Coastal sea ice typically develops in late December/early
January and may extend for 4-8 weeks depending on the severity of the winter. Annual rainfall is low
(390 mm) and occurs mostly between spring and autumn. A wind rose showing the predominance of
the seasonal northerly winds and summer sea breezes is shown in Figure 10.
Figure 10. Wind rose typical of the Odessa Bay region
29
Ballast Water Risk Assessment, Port of Odessa, Ukraine, October 2003: Final Report
Hydrodynamic conditions
Tidal currents are virtually non-existent owing to the relatively small astronomical tidal range, which
is only 0.1 m during springs and virtually 0 m during neaps. Water levels and currents in and near the
port are generated by local surface winds, which generate sea level changes in the order of 0.6 m
(maximum 1 m between seasons). The general pattern of water circulation in this region of the Black
Sea is shown in Figure 11. Because of the lack of tides and river mouth at Odessa, there are no tidal
water movement plots. However there is a weak but relatively persistent south-westerly long-shore
drift across Odessa Bay. Figure 11 shows how the circulation in the relatively shallow north-west
corner of the Black Sea is slow but influenced by the western gyre plus freshwater discharges from
the four major rivers systems (particularly the large the Dnepr system east of Odessa during spring
and summer). Relatively weak water exchange inside the port's main breakwaters indicates that BW
plumes are not rapidly dispersed out of the harbour, which often contains very brackish water in
spring and summer (5-14) owing to the river discharges near Odessa, particularly the 51.2 m3 of
freshwater released annually by the Dnepr18.
Figure 11. Regional surface water circulation in the Black Sea
18 The Dnepr rises in the Valdai Hills southwest of Moscow and is Europe's third longest river (2,285 km). It is navigable
throughout its course and ice-free for eight months of the year, making it an important shipping artery from Ukraine to
Russia and Belarus, particularly for grain, timber and metals. The total catchment of the Dnepr, Yuzhny-Bug, Dniestr,
Danube and other smaller rivers draining into the north-west gulf near Odessa is six times larger than the 415,000 km2
Black Sea. The Danube Delta (Europe's largest) forms 5,650 km2 of marshland while the 14 estuaries between this delta
and the mouth of the Dnepr River occupy a further ~2000 km2.
30
4 Results
Port development and maintenance
The harbour is sheltered by three detached breakwaters and covers an area of 2.8 km2 with an average
depth of 9.5 m. Mean annual temperature and salinity of the 0.03 km3 of water occupying the harbour
basin is 11.0ş_ and 14.4 respectively. Since the completion of the new container terminal in 1989
on land reclaimed by dredging and back-fill, CPSO has been operating six main terminal areas plus
the ship repair yard and a small vessel harbour. These are shown in the GIS Port Map (Figure 12) and
described from north to south as follows:
· Oil terminal: This terminal is located on the north side of the harbour and contains six berths,
the deepest (12.5 m) on its T-jetty and capable of receiving up to 250 m long crude oil and
products tankers for oil, fuel and chemical products from the nearby oil storage tanks and
refinery (which receives crude by pipeline). The gas tanker berth is on the south-facing wharf
west of the T-jetty.
· Grain terminal: Two jetties south of the oil terminal provide berths for general bulk carriers
and are equipped for the export and import of cereals and other grain, with the port's silos
providing temporary storage for 60,000 tonnes.
· Ship repair yard: This area is located between the grain terminal and the small vessel
harbour and contains several slipways, floating cranes and heavy lift gantries. It is owned by
the City of Odessa and not managed by CPSO.
· Passenger terminal and small boat harbour: The passenger terminal jetty is located in the
centre of the harbour and is closest to the city centre. It has five berths and can accommodate
passenger ferries and cruise liners up to 240 m long and 11 m draft. The small boat harbour
contains marina facilities as well as servicing line boats and other work vessels.
· Dry bulk/general cargo terminal: This terminal provides 17 berths located north and south
of the passenger terminal, which are serviced by road and rail spurs and backed by 215,000
m2 of open yardage and 78,000 m2 of warehouse space. A wide variety of bulk, break-bulk,
pallet, boxed, bagged and Ro-Ro cargos are handled at these berths, including scrap iron,
rolled steel, non-ferrous metals, raw sugar, vegetable oil, paper, fertilizer, machinery, packed
cereals, fruits and other foodstuffs.
· Refrigerated cargo terminal: Following the opening of the container terminal, reefer trade
has been declining following the increased use of refrigerated containers for storing and
transporting fruit, vegetables and other perishables. While 23 reefers continued to visit the
port during 2001-2002 (the majority Ukraine flagged), most of the refrigerated warehouses
which once provided up to 13,500 tonnes of chilled or frozen storage capacity near the two
reefer berths had been mothballed by 2001.
· Container terminal: Two berths equipped with container gantries and stackers in 1989-91
can service ships up to 240 m long and 12 m draft, and have a capacity to handle 100,000
TEU per year.
Beyond the harbour, the roadstead to the north-east of the main entrance channel provides a safe
anchorage where some cargo transhipments occur from general cargo ships and bulk carriers into
river vessels and barges, most frequently between spring and autumn. No BWRFs were collected
from vessels anchoring in this area, as these ships are either unloading cargo and/or receiving small
cargo top-ups following departure from the harbour.
31
Ballast Water Risk Assessment, Port of Odessa, Ukraine, October 2003: Final Report
Figure 12. Part of the GIS Port Map showing the navigation and active berth layers.
32
4 Results
4.2 Resource
mapping
The habitat layer of the GIS port map shows how the subtidal seafloor habitats in and beyond Odessa
Bay are dominated by soft muddy sediments (Figure 13). Subtidal sand banks are located east of
Odessa and near the wide entrance to the Dnepr River estuary (Figure 13).
Seagrass beds in the Odessa region are restricted to a sheltered sublittoral area containing Zostera
marina and Zostera noltii south of the port and close to the narrow stony beach which extends
southward until the sand dunes and beaches near Illichivsk (Figure 13). There is also a small area of
Phyllophora brown algae in the eastern part of Karkinitsky Bay. The closest sand beaches extend
northward from the harbour around the bay (Figure 14). The stony beaches are backed by erosive
breccia and soil low cliffs and there is only one natural rocky headland near Odess which delineates
the north-east boundary of the bay (Figure 14). Prior to the appearance of eutrophication events in
Odessa Bay, the low intertidal and subtidal rocky areas were dominated by the brown macroalgae
Cystoseira barbata. During the late 1960s-early 1970s, the rocky shore communities became
colonised by filamentous and turfing green algae, blue mussels (Mytilus galloprovincalis) and the NW
Europe bay barnacle (Balanus improvisus; first introduced in the Black Sea during the middle and late
19th Century via hull fouling; Zaitsev & Öztürk 2001). The port breakwaters and berths provide over
15 km of artificial intertidal and subtidal hard substrate that are dominated by rocky walls (Figure 13),
followed by smooth walls and partially submerged wooden fender work and pilings.
The GIS port map also shows the location of the Odessa PBBS sampling sites on a separate layer
(Figure 13), so that the final results from each sampling station can be readily added from the final
PBBS report. Because of the scale of the map and the extent of the urbanised area surrounding the
port, features such as post offices, churches and radio masts were not added. No historical wreck-sites
of archaeological significance or cultural-heritage value were identified in the area covered by the GIS
port map.
The GIS Port Map does not portray the major ecological changes that have occurred in Odessa Bay
and other parts of the north-west gulf over the past 40 years as a result of a significant decline in
flushing riverine discharges due to increased industry and irrigation extractions, plus an associated
rapid increase in nutrient inputs and eutrophication. This has led to the regular development of major
phytoplankton blooms which collapse over summer and decompose to cause major hypoxic zones and
mass mortalities to benthic invertebrates and fish stocks.
The first of these shallow water deoxygenation events was discovered in August 1973 occupying
3,500 km2 of the north-west gulf. These hypoxic events became regular summer phenomena that
caused an estimated total biomass loss of 60 million tonnes between 1973-1990, including 5 million
tonnes of commercial and non-commercial fish species (Zaitsev & Öztürk 2001). Typical summer
average density of surface water phytoplankton in the north-west gulf is now 2,500 mg/m3 versus 150
mg/m3 for the central Black Sea.
Over the same period, increased commercial fishing pressure across the Black Sea led to a collapse of
native fish stocks (from 26 in the 1950s to five by the early 1980s). Stock augmentation by deliberate
introduction of Mugil soiuy from Japan helped maintain large commercial catches until their 1985
peak of ~700,000 tonnes. This was followed by a rapid crash exacerbated by the inadvertent BW-
mediated introduction of the comb jellyfish Mnemiopsis leidyi from the NE American seaboard. By
the late 1990s, accidental but fortuitous introduction of two further comb jellyfish which predate on
Mnemiopsis (Beroe cucumis and B. ovata) have decreased the abundance of the latter population and
appear to be facilitating a limited recovery of some fish catches. However the future of much of the
Black Sea's native biodiversity, ecological processes and fish stocks remains uncertain, particularly in
the eutrophic and hypoxia-prone north-west gulf region.
33
Ballast Water Risk Assessment, Port of Odessa, Ukraine, October 2003: Final Report
Figure 13. Part of the GIS Port Map showing the marine habitat layer.
4.3 De-ballasting/ballasting
pattern
During meetings with the Harbour Master and SPSIP officials in February and November 2002, the
port navigational rules and State licensing requirements that influence deballasting and ballasting
practises at Odessa were discussed. Pilotage is compulsory, with boarding occurring some 5 km
outside the harbour. Because of the lack of swells, vessels in ballast approaching the port are often
containing approximately 75-85% of their normal ballast, and are encouraged to undertake offshore
BW exchanges, which under SIPBS regulations are required to be completed before they enter the 12
nautical mile territorial limits (i.e. more than 20 km off the coast). As in other ports, the port and
pilotage rules require all empty ships to retain sufficient ballast on board to maintain adequate
propulsion and steerage control, and to minimise windage until berthing is completed. Windage
becomes a significant feature of the port during autumnal gales and spells of strong northerly winds in
winter and early spring.
It was straightforward to identify which dry bulk carriers and tankers arriving at the oil and grain
terminals were discharging BW, and this was also true for general cargo vessels and container ships
berthing at the Dry bulk/general cargo berths and container terminal (i.e. from the 2001-2002
submitted BWRFs and CPSO's paper record for 1999-2000). However many ships using at the
general purpose and container berths were either fully or part discharging cargo, and it was not clear
which vessels had departed with BW taken up at the port. In fact many of the general cargo ships,
bulk carriers, ro-ro vessels and container ships which visit the port are either:
· completely or part unloading (i.e. possible ballast water uptake);
· retaining cargo on board (i.e. taking a top-up cargo and requiring no BW uptake or
discharge); or
· both (i.e. operations requiring some vessels to uptake/discharge BW to maintain trim during
their cargo unloading/loading cycle).
34
4 Results
Owing to the lack of information concerning the amount of cargo already on board, it was not
possible to estimate what BW may have been taken up, even for vessels which submitted reasonably
complete BWRFs. For incomplete BWRFs, it was very time consuming and sometimes impossible to
interpret from these or the port shipping records how much BW was probably discharged, let alone
ascertain how much was taken up for trimming purposes. It also became apparent that many ships had
not reported exactly how much BW was discharged, particularly those which had not undertaken an
exchange and were thus liable to the polluted water discharge penalty, as negotiated with SIPBS
(Section 3.3).
Of the total of 2297 vessel visits that had been added to the database by the end of the second
consultants visit, approximately 80% of these originated from BWRFs submitted between January
2001 and July 2002, the rest being expanded from the 1999-2000 BW discharge records collated by
CSPO. The database stores the amounts and sources of BW discharged from the arrivals at each
terminal. Connection of the database to the active berth layer of the GIS Port Map allowed tables
summarising the BW discharge statistics to be conveniently displayed for each terminal. Examples of
these tables displayed by the GIS Port Map are shown in Figures 14-17 for the four terminals where
reported BW discharges were made.
The following vessel discharge statistics for the six terminals were extracted from the database as
follows:
· For the 1003 visits entered for the oil terminal for the period 19 November 1999 4 July
2002, these included 234 visits by crude oil tankers, 247 visits by products tankers, 31 by
ore/bulk oil tankers (OBOs), 48 by gas tankers and 12 by chemical tankers. The database
records a total of 10,842,360 tonnes of BW discharged at Odessa by these ships, including
one of the largest vessels to visit the port (the crude oil tanker Genmar Macedon of 155,547
DWT, which reported a discharge of 39,900 tonnes during its part-loading of crude oil in
November 2001). Large tankers cannot fully load at Odessa owing to the depth restrictions at
the berth and approach channel.
· For the 21 visits involving cereal exports from the grain terminal over the same period, these
comprised 19 bulk carriers and 2 general cargo ships up to 60,158 DWT, which discharged a
total of 179,691 tonnes of BW (Figure 15).
· For the ferries and cruise liners which visited the passenger terminal during 2001 and 2002,
BWRFs were received for 11 of them, and none reported any BW discharge. The largest
cruise ship visiting in this period was the Rotterdam (59,652 GT; 6,932 DWT), operated by
the Holland America Line.
· For the 17 berths forming CPSO's dry bulk/general cargo terminal, details were entered into
the database for 637 visits involving 509 general cargo ships (55,501-693 DWT), 89 bulk
carriers (75,681-14,030 DWT) and four ro-ro cargo ships (5,536-1,377 DWT) arriving
between 19 November 1999 and 4 July 2002. These ships accounted for a total of 135
discharges amounting to 1,019,006 tonnes of BW, the major proportion being reported by
bulk carriers arriving in ballast to load scrap metal, steel and non-ferrous metals (917,000
MT). None of the ro-ro vessels reported a need to discharge BW during their visits.
· Between November 1999 and June 2002, 23 refrigerated vessels (9,970-844 DWT) made 48
visits to the reefer berths, most arriving between spring and autumn to part unload tropical
and sub-tropical fruits from Caribbean and southern Mediterranean ports, and to load local
fruits and vegetables for transportation to other ports in the Black Sea. Only one arrival
reported a need to discharge BW (152 tonnes) to maintain trim whilst alongside the reefer
terminal. This was added to the dry bulk/cargo berth statistics as the reefer berths are close to
the centre of this area (Figure 12).
· Of the 397 arrivals to the container terminal berths which submitted BWRFs between early
2001 and July 2002, the vast majority were dedicated (railed) container ships (241) and
general cargo ships (131) capable of handling containers with their own gear. Of all arrivals,
35
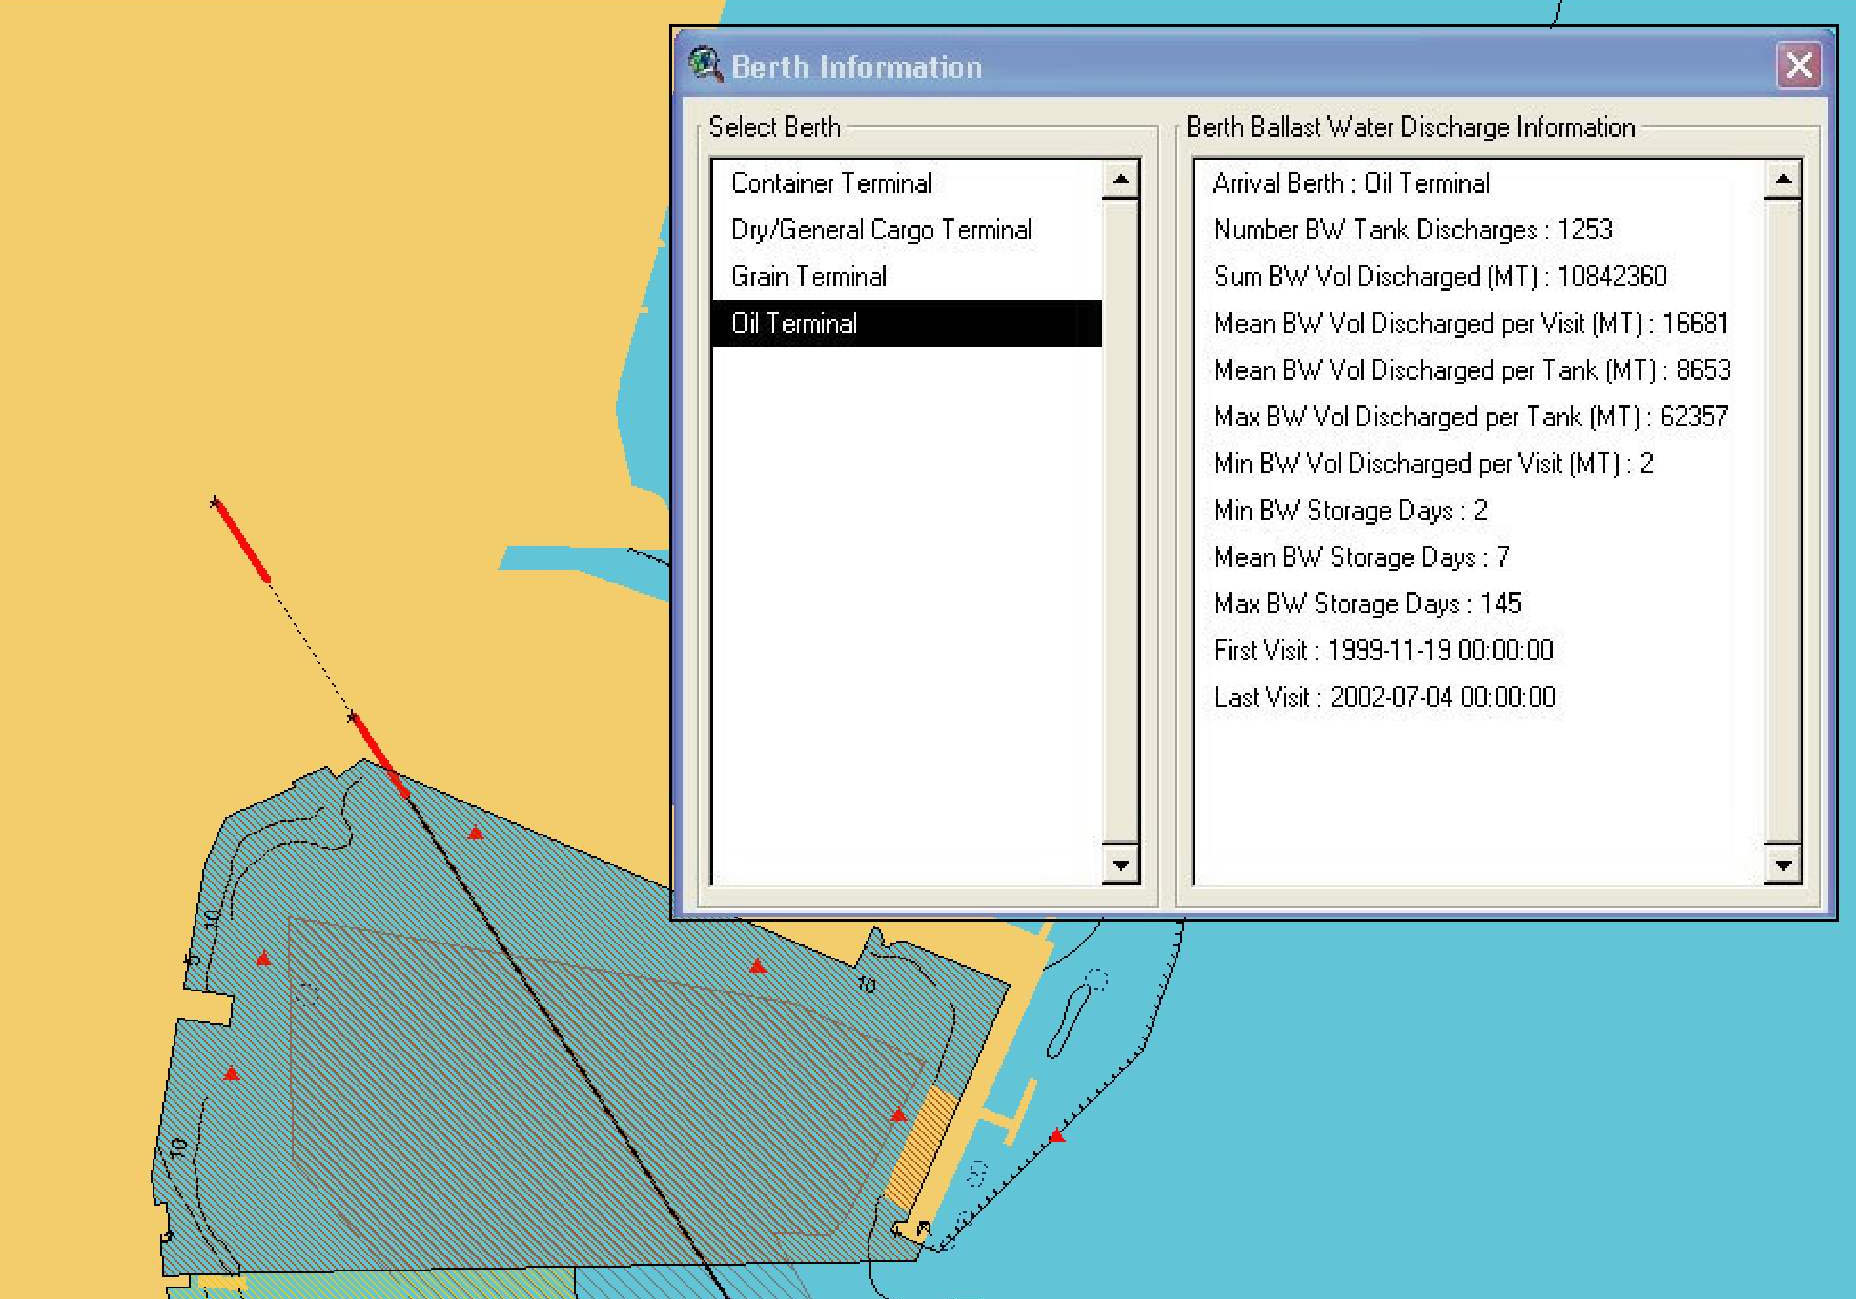
Ballast Water Risk Assessment, Port of Odessa, Ukraine, October 2003: Final Report
only 14 reported a need to make BW discharge to maintain vessel trim during container
unloading/loading, with an average discharge of 1,124 tonnes. However the container
terminal statistics are distorted by the reception of the 42,035 DWT bulk carrier You Mei in
May 2001, which discharged 7,121 tonnes sourced from Ancona (Italy) whilst loading a cargo
believed to comprise disassembled gantry work, old containers, vehicles, machinery and scrap
steel.
Because the database must accept and manage individual tank discharges as discrete units (as
recorded in IMO-standard BWRFs; Appendix 1), the need to treat each BW tank as a single entity for
all vessels arriving prior to BWRF use (or which submitted incomplete BWRFs; Section 3.6)
markedly reduces the number of individual tank discharges actually made between November 1999
and July 2002, whilst inflating the mean and maximum tank discharge volumes. Thus the latter
typically reflect the total ballast water capacity of the largest vessels visiting the terminals at Odessa
(Figures 14-17), and this causes a more conservative outcome in terms of the BWRA results. It is
therefore worth emphasising that a database containing individual tank data collated from, say, a 12
month set of fully completed BWRFs, will generate far more precise BW source port values for the
C1, C2 and R1 components (Section 3.10).
Figure 14. BW discharge statistics displayed by GIS Port Map for the oil terminal.
36
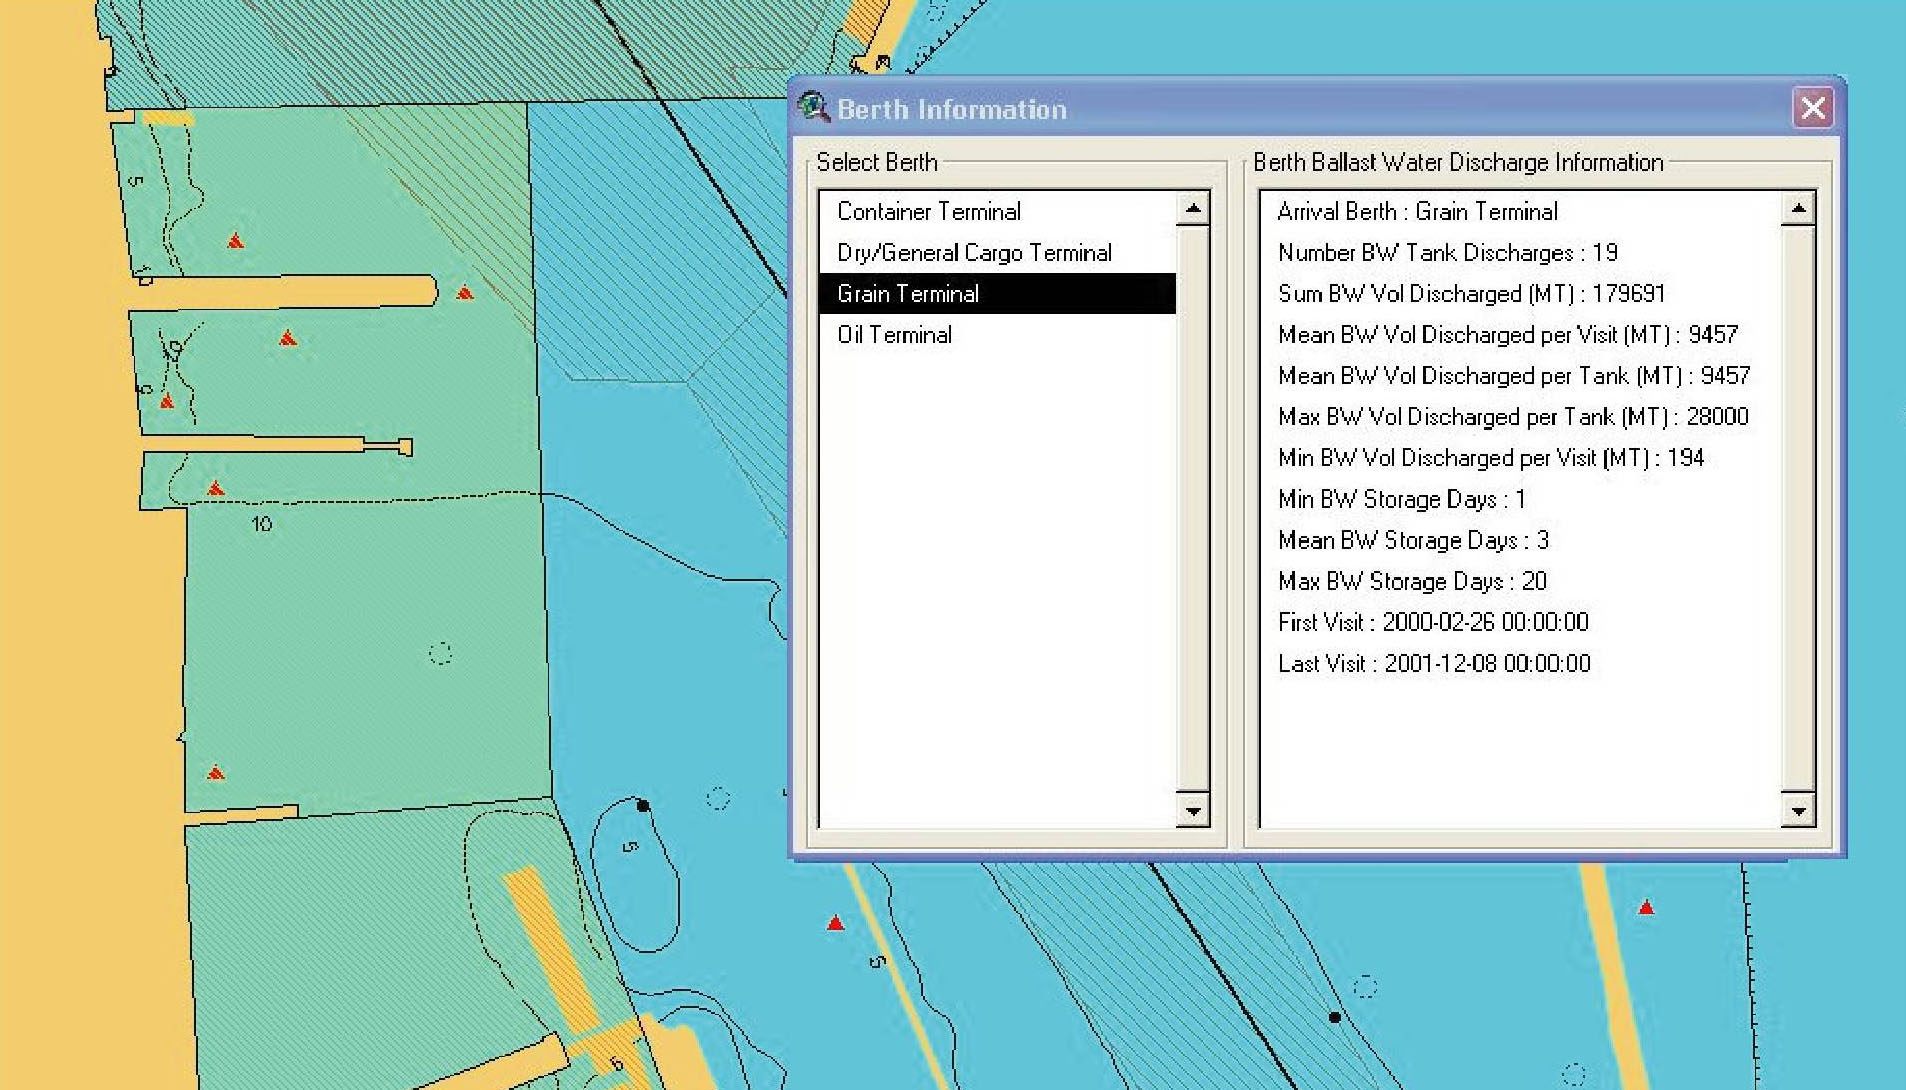
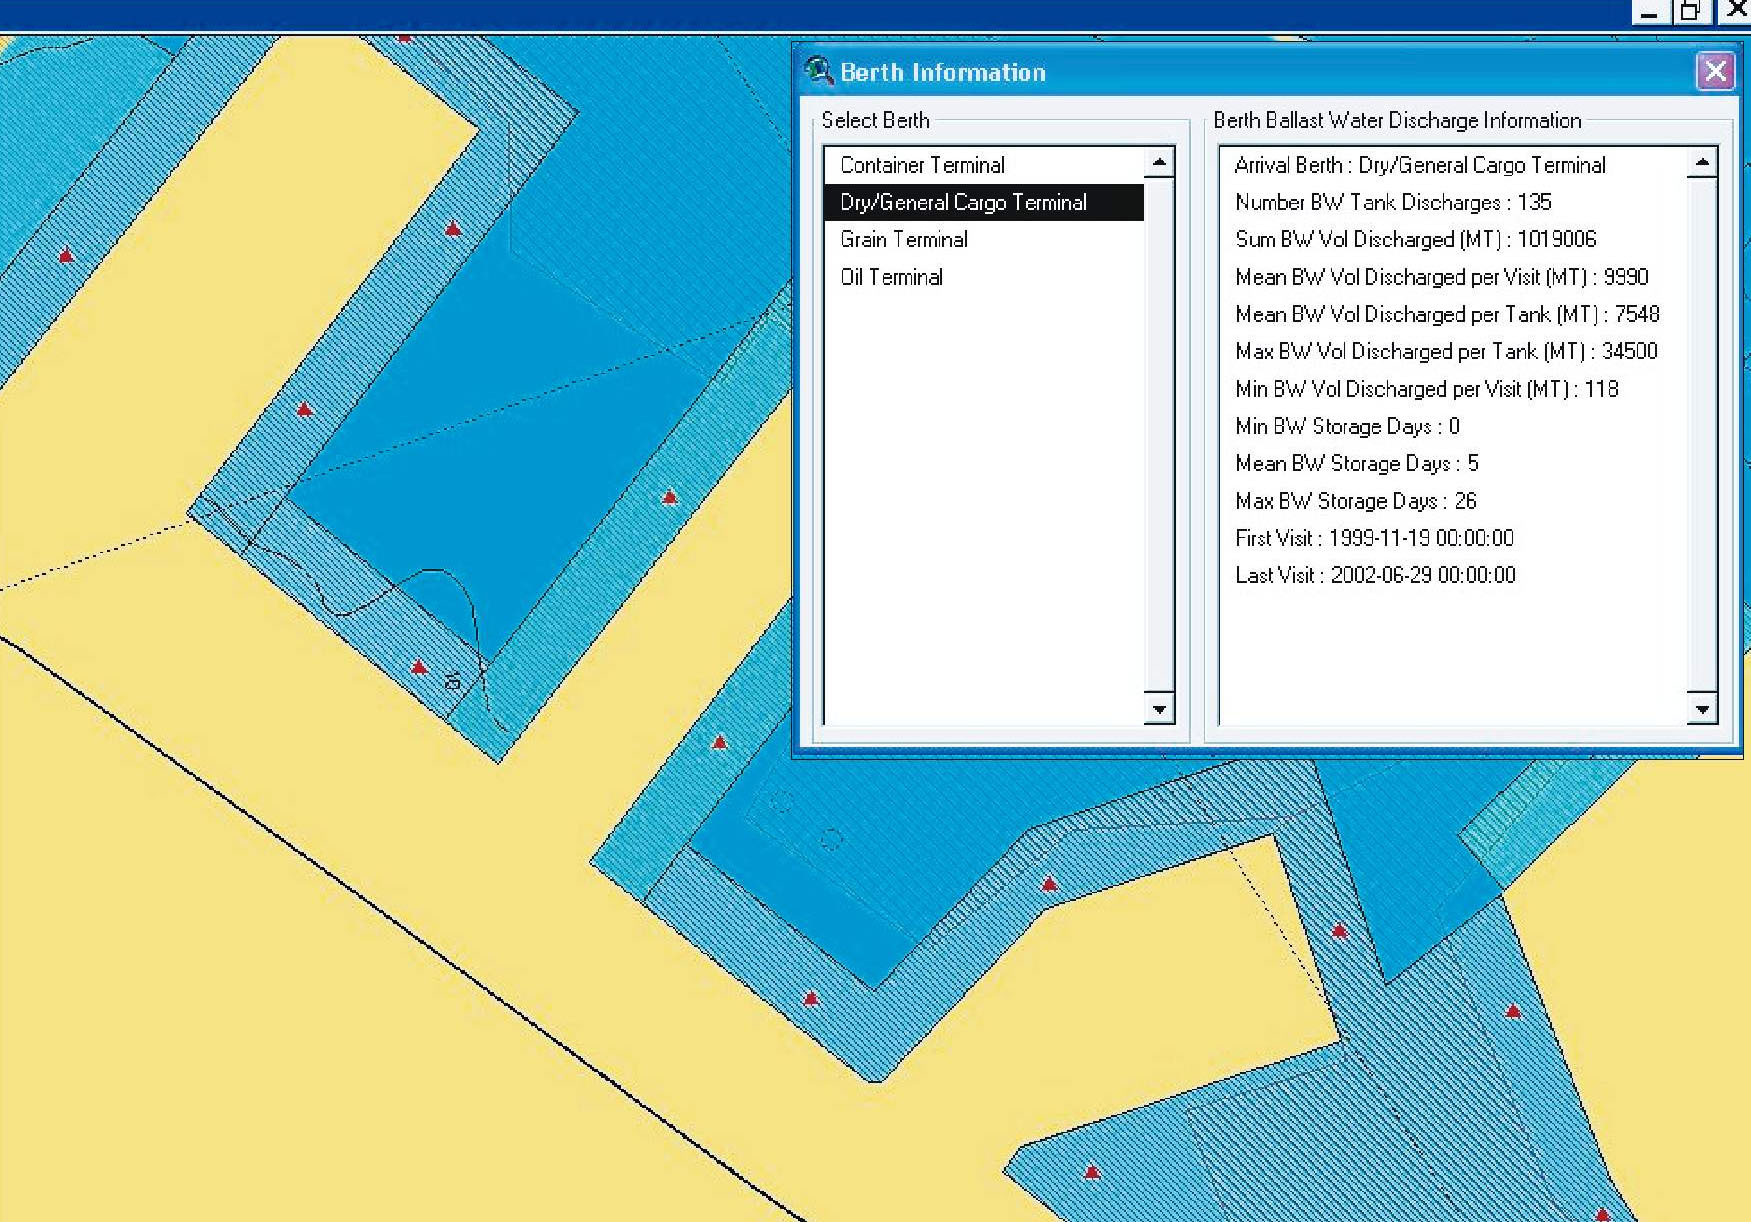
4 Results
Figure 15. BW discharge statistics displayed by GIS Port Map for the grain terminal
Figure 16. BW discharge statistics displayed for the dry bulk/general cargo terminal
37
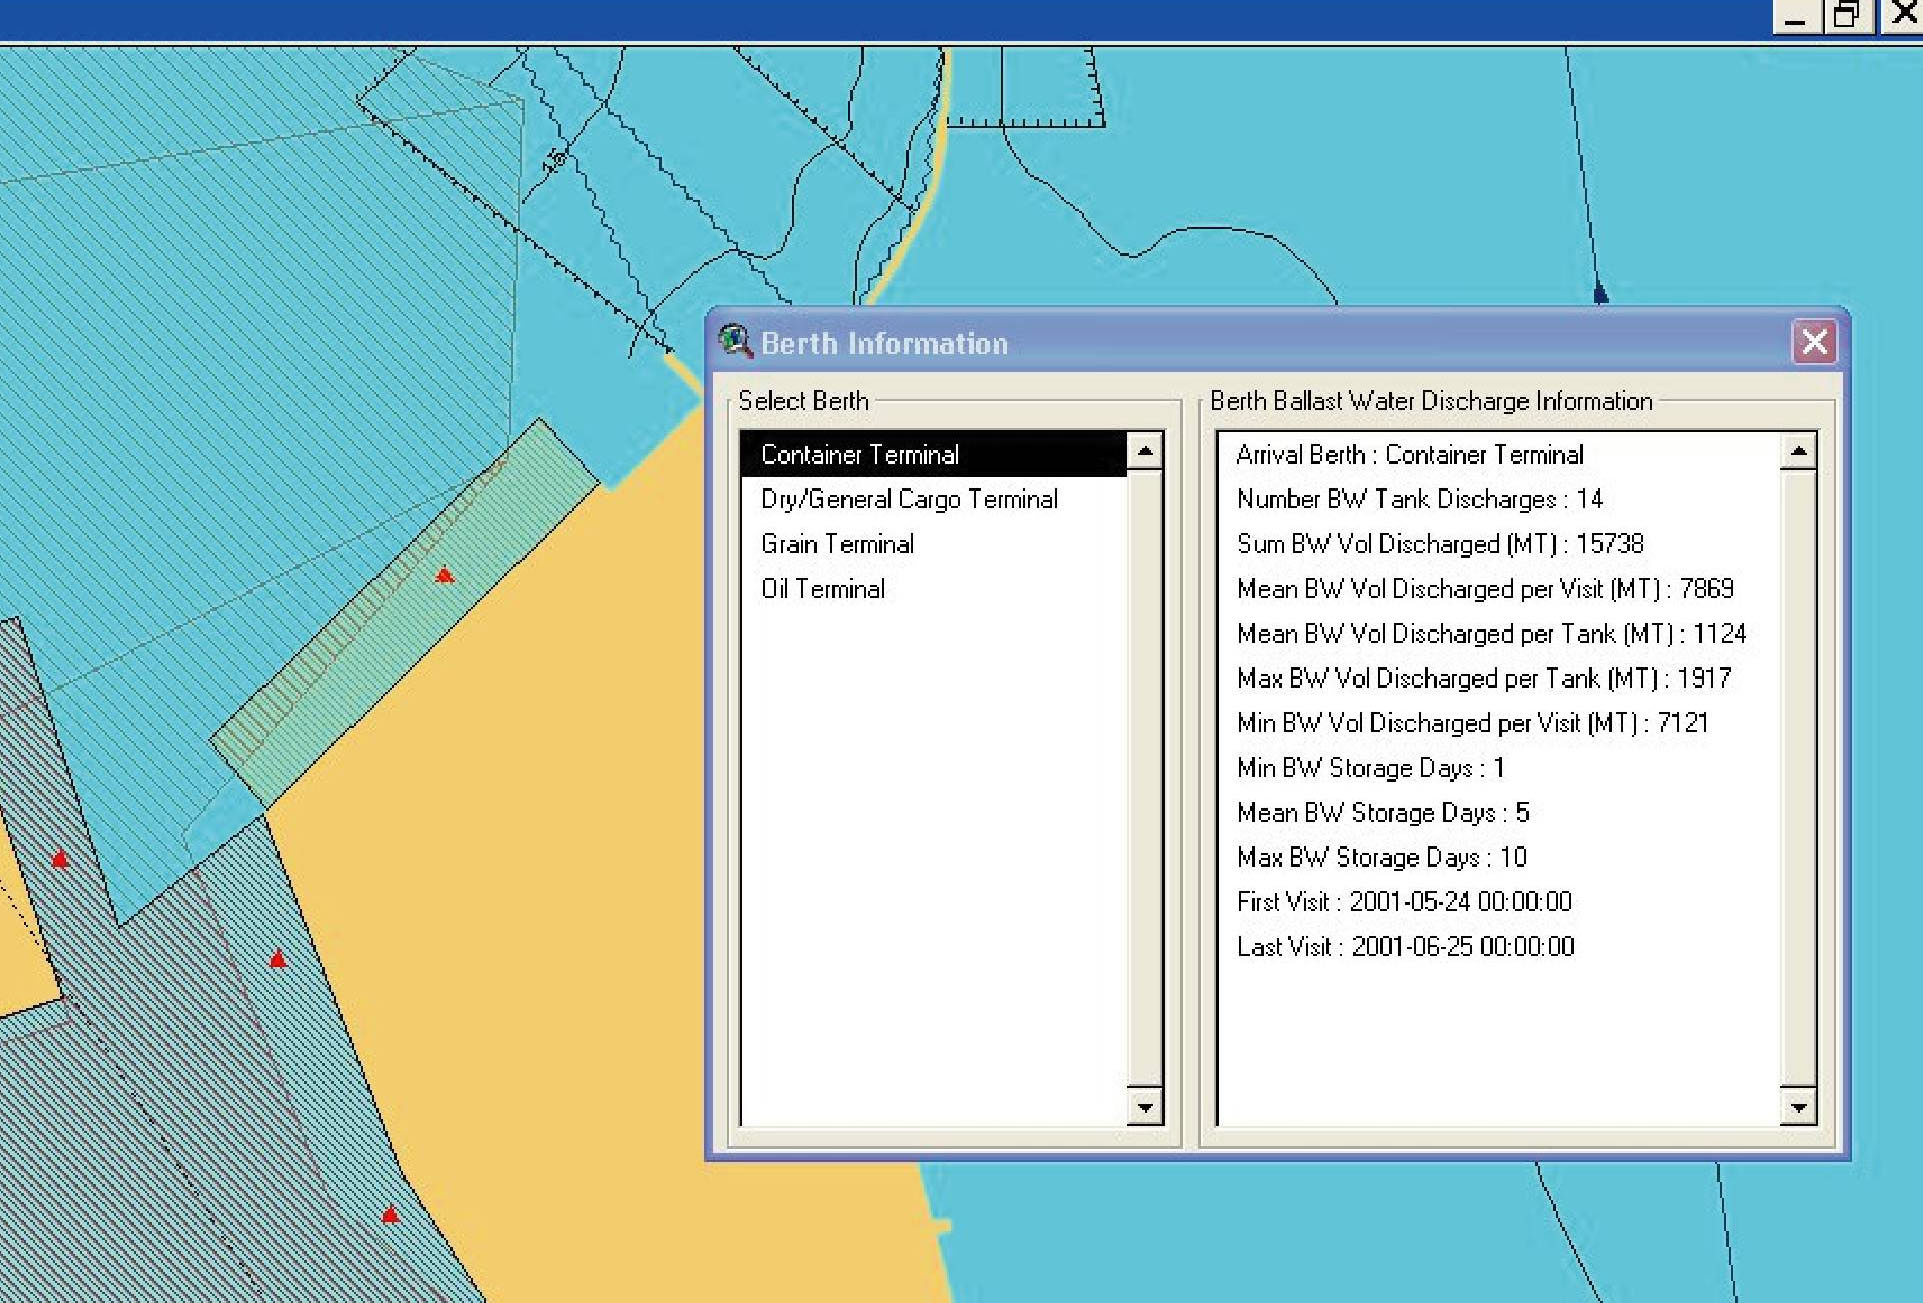
Ballast Water Risk Assessment, Port of Odessa, Ukraine, October 2003: Final Report
Figure 17. BW discharge statistics displayed by the GIS Port Map for the container terminal
4.4 Identification of source ports
From the 2297 vessel visit and 3387 associated ballast tank records in the Odessa database, the total
number of identified BW source ports was 122 (Table 3). Figure 18 shows output from the GIS world
bioregion map depicting the location and relative importance of these source ports with respect to C1
(BW discharge frequency). As with all GIS outputs, the map is `zoomable' to allow all ports and
symbols to be clearly delineated at smaller scales.
The discharge frequency values listed for the identified source ports in Table 3 are the C1 coefficients
used to calculate the relative overall risk (Section 3.10). The source port `supplying' the highest
frequency of BW discharges at Odessa was the Bulgarian Black Sea port of Bourgas (14.4%). This
was followed by the Italian Adriatic port of Trieste (7.7%), then the Black Sea port of Constanta
(Romania; 5.6%), the East Mediterranean port of Piraeus (Greece; 4.9%), the north-west Atlantic port
of Fos sur Mer (France; 4.1%) and the Adriatic port of Omisalj (Croatia; 3.6%) (Table 3).
The first port in the C1 ranking beyond the Euro-Mediterranean region was the east Russian port of
Nakhodka (Sea of Japan), which at 0.73% was ranked 32nd. Of the 122 identified source ports, the top
10 provided >50% of the recorded discharges at Odessa, while the next 19 ports contributed a further
25%, i.e. only 29 of the 122 source ports (24%) accounted for >75% of all source-identified BW
discharges (Table 3). The last 38 source ports in the C1 list each accounted for only one arrival that
made a recorded BW discharge in the 1999-2002 database. As noted earlier, there is a relatively low
number of individual tank records (3387) compared to vessel visits (2297) and this is due to (a) the
need to include port shipping records prior to the regular use of BWRFs (all tanks combined), (b)
some vessels submitting a single discharge volume on the BWRF covering all discharged tanks, many
vessels submitting a BWRF showing that no BW was either on board or intended for discharge.
Of the 2297 visit records, 933 of these contained 1396 tank records showing a total of 12,439,796
tonnes of BW discharged at Odessa, with source ports identified for all but 156 tanks that contributed
5.5% of the volume. The various discharged volume percentages for each source port shown in Table
3 and Figure 19 provide the C2 values used in the risk calculation (Section 3.10). The source port
38
4 Results
rankings for C2 (proportion of total volume) were very similar but not exactly same as those for C1
(i.e. the discharge frequency, as ranked in Table 3). Thus the source ports providing the largest
volume of BW discharged at Odessa were also Bourgas (17.3%), Trieste (9%), Constanta (7.5%) and
Piraeus (6.7%), but then followed by the Italian port of Ravenna (3.4%) before Fos sur Mer (3.1%;
Table 3). The highest non-European port in the C2 ranking was Hanoi in Vietnam (0.26%), ranked
87th on the C2 scale.
Seven identified source ports provided >50% of the total discharged volume, and another 14 ports a
further 25%. Thus only 21 of the 122 ports (17%) accounted for 75% of the source-identified total
volume discharged at Odessa. Of the top 20 ports in terms of BW discharge volume, seven were in the
Black Sea, seven in the Adriatic Sea, two in the Aegean Sea, three in the Eastern Mediterranean and
one on the NW Atlantic Coast of France. There were no recorded tank discharges sourced from the
Caspian Sea or from the transhipment ports in the Azov Sea or Don River which facilitate this trade
via the Volga-Don canal.
Figure 18. GIS output showing the location and relative importance of BW source ports with respect to frequency
of tank discharges (C1) at the Port of Odessa.
Figure 19. GIS output showing location and relative importance of the source ports with respect to the volume of
tank discharges (C2) at the Port of Odessa.
39
Ballast Water Risk Assessment, Port of Odessa, Ukraine, October 2003: Final Report
Table 3. List of identified source ports in the Port of Odessa database, showing proportions of recorded ballast
tank discharges (C1*) and volumes (C2*)
UN Port
BW vol.
Source Port Name
Country
C1*
C2
Code
(tonnes)
1
BGBOJ
Bourgas
Bulgaria
14.42%
2,149,733
17.28%
2
ITTRS
Trieste
Italy
7.70%
1,112,922
8.95%
3
ROCND
Constanta
Romania
5.59%
930,851
7.48%
4
GRPIR
Piraeus
Greece
4.86%
826,964
6.65%
5
FRFOS
Fos sur Mer
France
4.05%
382,255
3.07%
6
HROMI
Omisalj
Croatia
3.57%
258,000
2.07%
7
GREEU
Eleusis
Greece
3.32%
342,459
2.75%
8
ITRAN
Ravenna
Italy
2.76%
425,643
3.42%
9
TRALI
Aliaga
Turkey
2.59%
318,340
2.56%
10
TRIZT
Izmit
Turkey
2.59%
210,103
1.69%
11
BGVAR
Varna
Bulgaria
2.51%
249,049
2.00%
12
TRIST
Istanbul
Turkey
1.94%
167,976
1.35%
13
CYLMS
Limassol
Cyprus
1.94%
92,630
0.74%
14
ILAKL
Ashkelon
Israel
1.62%
245,202
1.97%
15
GRSKG
Thessaloniki
Greece
1.62%
242,278
1.95%
16
ITSPA
Santa Panagia
Italy
1.46%
191,114
1.54%
17
ITGOA
Genoa
Italy
1.38%
362,276
2.91%
18
ITGEA
Gela
Italy
1.22%
155,879
1.25%
19
UASVP
Sevastopol
Ukraine
1.13%
22,548
0.18%
20
PTLEI
Leixoes
Portugal
1.05%
68,370
0.55%
21
SYTTS
Tartous
Syrian Arab Republic
1.05%
36,965
0.30%
22
TRMER
Mersin
Turkey
0.97%
221,897
1.78%
23
ITPFX
Porto Foxi (Sarroch)
Italy
0.97%
178,091
1.43%
24
ITVCE
Venezia (=Fusina)
Italy
0.97%
81,302
0.65%
25
EGALY
Alexandria (El Iskandariya)
Egypt
0.97%
79,779
0.64%
26
ESCAS
Castellon de la Plana
Spain
0.97%
43,918
0.35%
27
ITPIO
Piombino
Italy
0.81%
23,277
0.19%
28
ESTAR
Tarragona
Spain
0.73%
204,196
1.64%
29
ROMAG
Mangalia
Romania
0.73%
201,864
1.62%
30
ITMLZ
Milazzo
Italy
0.73%
99,195
0.80%
31
ITPVE
Porto Vesme (Portoscuso)
Italy
0.73%
39,730
0.32%
32
RUNJK
Nakhodka
Russian Federation
0.73%
20,138
0.16%
33
TRSSX
Samsun
Turkey
0.73%
1,179
0.01%
34
GRAGT
Agioi Theodoroi
Greece
0.65%
183,288
1.47%
35
ITFAL
Falconara
Italy
0.65%
115,886
0.93%
36
MANDR
Nador
Morocco
0.65%
33,650
0.27%
37
ITPMA
Porto Marghera
Italy
0.65%
13,006
0.10%
38
ITAUG
Augusta/Priolo
Italy
0.57%
156,860
1.26%
39
ITSVN
Savona
Italy
0.57%
143,348
1.15%
40
RUNVS
Novorossiysk
Russian Federation
0.57%
57,298
0.46%
41
TRNEM
Nemrut Bay
Turkey
0.57%
38,394
0.31%
42
ILASH
Ashdod
Israel
0.57%
36,558
0.29%
43
ESLPA
Las Palmas
Spain
0.57%
24,271
0.20%
44
SYBAN
Baniyas
Syrian Arab Republic
0.57%
12,377
0.10%
45
ITFCO
Fiumicino
Italy
0.49%
118,263
0.95%
46
TNBIZ
Bizerte
Tunisia
0.49%
32,764
0.26%
47
TRAYT
Antalya
Turkey
0.49%
11,433
0.09%
48
ITAOI
Ancona
Italy
0.49%
7,588
0.06%
49
UAILK
Ilyichevsk
Ukraine
0.41%
68,520
0.55%
50
TRIZM
Izmir (Smyrna)
Turkey
0.41%
66,435
0.53%
51
TRISK
Iskenderun
Turkey
0.41%
46,355
0.37%
52
GRASS
Aspropyrgos
Greece
0.41%
20,370
0.16%
53
SNDKR
Dakar
Senegal
0.41%
10,030
0.08%
54
GEPTI
Poti
Georgia
0.41%
9,964
0.08%
55
ITCRV
Crotone
Italy
0.41%
7,529
0.06%
56
ILHFA
Haifa
Israel
0.32%
69,469
0.56%
57
ESCAR
Cartagena
Spain
0.32%
63,467
0.51%
58
GIGIB
Gibraltar
Gibraltar
0.32%
63,405
0.51%
59
ITLIV
Livorno
Italy
0.32%
59,462
0.48%
60
CYLCA
Larnaca
Cyprus
0.32%
42,794
0.34%
61
HRRJK
Rijeka Bakar
Croatia
0.32%
32,555
0.26%
*C1 = proportion of all discharges (% of 3387 records); C2 = proportion of total BW discharged (% of reported discharge volume)
40
4 Results
Table 3 (cont'd). List of identified source ports in the Port of Odessa database, showing proportions of recorded
ballast tank discharges (C1*) and volumes (C2)
UN Port
BW vol.
Source Port Name
Country
C1*
C2
Code
(tonnes)
62
TRCEY
Botas-Ceyhan
Turkey
0.32%
20,886
0.17%
63
LBBEY
Beirut
Lebanon
0.32%
17,246
0.14%
64
NGLOS
Lagos
Nigeria
0.32%
12,780
0.10%
65
MTMAR
Marsaxlokk
Malta
0.32%
11,746
0.09%
66
YEHOD
Hodeidah
Yemen
0.32%
7,033
0.06%
67
GRLAV
Lavrion (Laurium)
Greece
0.32%
2,815
0.02%
68
TRERE
Eregli
Turkey
0.24%
28,026
0.23%
69
ITSIR
Siracusa
Italy
0.24%
27,658
0.22%
70
UADNB
Dnepro-Bugsky
Ukraine
0.24%
24,533
0.20%
71
MTMLA
Malta (Valetta)
Malta
0.24%
24,190
0.19%
72
TNGAE
Gabes
Tunisia
0.24%
18,265
0.15%
73
ITPTO
Porto Torres
Italy
0.24%
9,725
0.08%
74
TRAMB
Ambali/Kumport
Turkey
0.24%
369
0.00%
75
NLRTM
Rotterdam
Netherlands
0.16%
58,610
0.47%
76
ESALG
Algeciras
Spain
0.16%
40,447
0.33%
77
ITPMO
Palermo
Italy
0.16%
29,411
0.24%
78
GEBUS
Batumi
Georgia
0.16%
26,481
0.21%
79
DZALG
Alger
Algeria
0.16%
15,984
0.13%
80
MACAS
Casablanca
Morocco
0.16%
13,320
0.11%
81
SYLTK
Latakia
Syrian Arab Republic
0.16%
10,955
0.09%
82
UAFEO
Feodosiya
Ukraine
0.16%
3,907
0.03%
83
SIKOP
Koper
Slovenia
0.16%
3,463
0.03%
84
ITBDS
Brindisi
Italy
0.08%
37,459
0.30%
85
PTFAO
Faro
Portugal
0.08%
34,100
0.27%
86
TRTUT
Tutuncifilik
Turkey
0.08%
34,100
0.27%
87
VNHAN
Hanoi
Viet Nam
0.08%
31,969
0.26%
88
PTLIS
Lisboa
Portugal
0.08%
30,370
0.24%
89
ITTAR
Taranto
Italy
0.08%
29,305
0.24%
90
BRSSZ
Santos
Brazil
0.08%
26,641
0.21%
91
SGSIN
Singapore
Singapore
0.08%
22,378
0.18%
92
ROMID
Midia
Romania
0.08%
21,435
0.17%
93
USBOS
Boston Massachusetts
United States
0.08%
17,050
0.14%
94
LBKYE
Tripoli
Lebanon
0.08%
15,984
0.13%
95
EGEDK
El Dekheila
Egypt
0.08%
15,665
0.13%
96
EGDAM
Damietta
Egypt
0.08%
14,556
0.12%
97
TRDYL
Dortyol Oil Terminal
Turkey
0.08%
12,468
0.10%
98
BRMCZ
Maceio
Brazil
0.08%
12,042
0.10%
99
RUTUA
Tuapse
Russian Federation
0.08%
11,722
0.09%
100
DZORN
Oran
Algeria
0.08%
11,162
0.09%
101
CNSHA
Shanghai (Shihu) Shanghai
China
0.08%
10,656
0.09%
102
TRTOR
Toros
Turkey
0.08%
10,635
0.09%
103
FRLAV
Lavera
France
0.08%
9,644
0.08%
104
GRKGS
Kos
Greece
0.08%
9,591
0.08%
105
MYKBA
Kuala Baram
Malaysia
0.08%
9,591
0.08%
106
BRPNG
Paranagua
Brazil
0.08%
8,589
0.07%
107
DEBRE
Bremen
Germany
0.08%
8,525
0.07%
108
GRMGR
Megara Oil Terminal (Agia Trias)
Greece
0.08%
8,525
0.07%
109
MRNKC
Nouakchott
Mauritania
0.08%
8,388
0.07%
110
ESBCN
Barcelona
Spain
0.08%
6,394
0.05%
111
UAKEH
Kerch
Ukraine
0.08%
6,394
0.05%
112
GRNPL
Nauplia (Nafplion)
Greece
0.08%
4,369
0.04%
113
ESBIO
Bilbao
Spain
0.08%
4,263
0.03%
114
GRANI
Aghios Nikolaos
Greece
0.08%
4,263
0.03%
115
ITMNF
Monfalcone
Italy
0.08%
4,263
0.03%
116
MYPKG
Port Kelang
Malaysia
0.08%
3,517
0.03%
117
TRTUZ
Tuzla
Turkey
0.08%
1,598
0.01%
118
UANIK
Nikolayev
Ukraine
0.08%
1,279
0.01%
119
IDDUM
Dumai Sumatra
Indonesia
0.08%
853
0.01%
120
TRYAR
Yarimca
Turkey
0.08%
320
0.003%
121
ROGAZ
Galatz
Romania
0.08%
213
0.002%
122
TRBDM
Bandirma
Turkey
0.08%
213
0.002%
*C1 = proportion of all discharges (% of 3387 records); C2 = proportion of total BW discharged (% of reported discharge volume)
41
Ballast Water Risk Assessment, Port of Odessa, Ukraine, October 2003: Final Report
4.5 Identification of destination ports
As discussed in Section 3.5, identification of destination ports for BW taken up at a Demonstration
Site is confounded by the lack specific questions on the BWRF, and the uncertainty of knowing if the
Next port of Call recorded on a BWRF (or in a shipping record) is where BW is actually discharged.
Thus there is no reporting mechanism enabling a `reverse BWRA' to be undertaken reliably. This
posed a significant constraint on objective 4 for Odessa (Section 2), since a significant portion of
general cargo ships and some bulk carriers departing the dry bulk/general cargo terminal had probably
uplifted at least some BW when alongside these berths (e.g. for trimming purposes when unloading
then loading cargo).
Of the 145 potential BW destination ports in the 1999-2002 database (i.e. Next Ports of Call), their
location and proportional frequency are shown in Figure 20. Table 4 lists the top 62 `BW destination'
ports that accounted for 90% of all reported the Next Ports of Call. This shows that the Romanian
Black Sea port of Constanta stood out as the most frequent destination port, with 16% of Next Ports of
Call attributed to this one port, which was a frequent destination for ships departing the container and
oil terminals, and some from the dry bulk/general cargo terminal.
Constanta was followed a group of ports in the 6-10% range, namely the nearby Ukrainian port of
Ilyichevsk (9.3%), which is deeper and often visited for top-up cargos, followed by the Bulgarian
Black Sea port of Bourgas (8.9%; much of this traffic comprising a shuttle export service involving
three Bulgarian flagged crude oil tankers Osam, Khan Asparukh and Mesta plus a few product
tankers), the roadstead off Odessa (7.0%; used for cargo top-ups and transhipments with small vessels
trading from river ports in the Denpr and Yuzhny-Bug systems) and then Istanbul (6.6%). Istanbul
may also not represent an important BW destination port since it was found that some bulk carriers
and tankers departing Odessa had sailing instructions to proceed to Istanbul only for the purpose of
entering the Turkish Straits (Bosphorus then Dardanelles) to visit a unknown Mediterranean port.
Table 4 shows that, of the top 20 ports which accounted for the destinations of 72% of the vessel
departures from Odessa, nine were located in the Black Sea, six were in the Eastern Mediterranean,
four in the Marmara and Aegean Seas and two in the Adriatic Sea. The highest ranked destination port
lying beyond the Black Sea-Mediterranean was Singapore, ranked 24th as the destination of 0.68% of
all departures. No vessel reported it was sailing to a Caspian Sea port, and only a few reported to be
bound for Azov Sea staging ports (where transhipments can also be made to vessels using the Volga-
Don canal). These comprised small general cargo ships departing for the Ukrainian port of Kerch (1
departure) and the Russian ports of Azov (1), Taganrog (1) and Rostov-on-Don (3 departures)
(Figures 2, 20; Table 4).
Figure 20. GIS output showing the location and frequency of destination ports, recorded as the Next Port of Call
in the Port of Odessa BWRFs and shipping records.
42
4 Results
Table 4. Destination ports accounting for 90% of all vessel departures during November 1999-July 2002
(recorded as Next Ports of Call).
Destination Port
% Proportion of
UN Port Code
Country
Cumulative %
(Next Port of Call)
Departures
1
ROCND
Constanta
Romania
16.08
16.1
2
UAILK
Ilyichevsk
Ukraine
9.26
25.3
3
BGBOJ
Bourgas
Bulgaria
8.87
34.2
4
UAODS
Odessa
Ukraine
7.02
41.2
5
TRIST
Istanbul
Turkey
6.63
47.9
6
BGVAR
Varna
Bulgaria
4.39
52.3
7
ROMID
Midia
Romania
2.34
54.6
8
ILASH
Ashdod
Israel
2.24
56.8
9
RUNVS
Novorossiysk
Russian Federation
1.95
58.8
10
EGALY
Alexandria (El Iskandariya)
Egypt
1.85
60.6
11
GREEU
Eleusis
Greece
1.75
62.4
12
ITRAN
Ravenna
Italy
1.66
64.0
13
ITTRS
Trieste
Italy
1.36
65.4
14
GRPIR
Piraeus
Greece
1.07
66.5
15
TRYAR
Yarimca
Turkey
1.07
67.5
16
ILHFA
Haifa
Israel
0.97
68.5
17
CYLMS
Limassol
Cyprus
0.88
69.4
18
SYTTS
Tartous
Syrian Arab Republic
0.88
70.3
19
TRALI
Aliaga
Turkey
0.88
71.2
20
TRDYL
Dortyol Oil Terminal
Turkey
0.78
71.9
21
TRIZM
Izmir (Smyrna)
Turkey
0.78
72.7
22
DZALG
Alger
Algeria
0.68
73.4
23
LBBEY
Beirut
Lebanon
0.68
74.1
24
SGSIN
Singapore
Singapore
0.68
74.8
25
TRAMB
Ambali/Kumport
Turkey
0.68
75.4
26
DZSKI
Skikda/Phillippeville
Algeria
0.58
76.0
27
GRSKG
Thessaloniki
Greece
0.58
76.6
28
ITAUG
Augusta/Priolo
Italy
0.58
77.2
29
ITGOA
Genoa
Italy
0.58
77.8
30
ITPFX
Porto Foxi (Sarroch)
Italy
0.58
78.3
31
ITSPA
Santa Panagia
Italy
0.58
78.9
32
MACAS
Casablanca
Morocco
0.58
79.5
33
TRERE
Eregli
Turkey
0.58
80.1
34
TRISK
Iskenderun
Turkey
0.58
80.6
35
ALDRZ
Durres
Albania
0.49
81.1
36
HROMI
Omisalj
Croatia
0.49
81.6
37
IDJKT
Jakarta Java
Indonesia
0.49
82.1
38
THBKK
Bangkok
Thailand
0.49
82.6
39
TNSUS
Sousse
Tunisia
0.49
83.1
40
TRMER
Mersin
Turkey
0.49
83.6
41
FRFOS
Fos sur Mer
France
0.39
84.0
42
ESALG
Algeciras
Spain
0.39
84.4
43
TRSSX
Samsun
Turkey
0.39
84.8
44
UAKHE
Kherson
Ukraine
0.39
85.1
45
DZORN
Oran
Algeria
0.29
85.4
46
CNHUA
Huangpu (Xinzao) Guangdong
China
0.29
85.7
47
FRLAV
Lavera
France
0.29
86.0
48
ITFAL
Falconara
Italy
0.29
86.3
49
ITMLZ
Milazzo
Italy
0.29
86.6
50
ITPMA
Porto Marghera
Italy
0.29
86.9
51
ITVCE
Venezia (=Fusina)
Italy
0.29
87.2
52
RUROS
Rostov-on-Don
Russian Federation
0.29
87.5
53
TNSFA
Sfax
Tunisia
0.29
87.8
54
TRIZT
Izmit
Turkey
0.29
88.0
55
TRMRM
Marmaris
Turkey
0.29
88.3
56
UAIZM
Izmail
Ukraine
0.29
88.6
57
USHOU
Houston Texas
United States
0.29
88.9
58
YUBAR
Bar
Yugoslavia (Fed Rep Of)
0.29
89.2
59
DJJIB
Djibouti
Djibouti
0.19
89.4
60
GRASS
Aspropyrgos
Greece
0.19
89.6
61
GRJKH
Chios
Greece
0.19
89.8
62
INMUN
Mundra
India
0.19
90.0
43
Ballast Water Risk Assessment, Port of Odessa, Ukraine, October 2003: Final Report
4.6
Environmental similarity analysis
Of the identified 122 BW source ports and 145 potential destination ports, sufficient port
environmental data were obtained to include 53% of the former and 50% of the latter in the
multivariate similarity analysis by PRIMER. These ports accounted for 75% of all recorded tank
discharges and 82% of all recorded departures respectively (Tables 5, 6). Details of the 357 ports
included in the multivariate analysis carried out for Odessa and the other Demonstration Site BWRAs
are listed in Appendix 6 (this list is ordered alphabetically using the UN port identification code, in
which the first two letters represent the country).
To allow all identified BW source and next ports of Odessa to be part of the `first-pass' risk
assessment, those ports not included in the multivariate analysis were provided with environment
matching coefficient estimates, and are noted as such in the database. The C3 estimates were based on
their port type (Section 3.7) and geographic location with respect to the nearest comparable ports for
which C3 had been calculated. A precautionary approach was adopted (i.e. the estimated values were
higher than the calculated C3s of the comparable ports). Providing C3 estimates allowed the database
to include all of Odessa source ports and next ports when calculating the ROR values and displaying
the BWRA results.
The GIS world map outputs displaying the C3 values of the Odessa source and destination ports are
shown in Figures 21 and 22 respectively. These figures and Tables 5-6 reveal that Odessa has a
relatively high environmental similarity to the majority of its regular trading ports (i.e. source and
destination ports with C3s greater than 0.6 accounted for >40% of all BW discharges and >50% of all
vessel departures respectively). This can be related to the regional proximity of Odessa's most
regular trading ports plus its relatively wide seasonal temperature/salinity ranges.
It is not surprising that the most environmentally similar port to Odessa was Illyichevsk (C3 = 0.819)
with 21 other BW source ports in the Black Sea and Adriatic Sea having calculated or estimated C3
values above 0.6 (Table 5). The most environmentally similar source ports beyond the Black Sea-
Mediterranean region were Nakhodka in the Sea of Japan (C3 estimated at 0.65 based on the
calculated values for comparable Japanese and Korean ports), followed by Boston on the NE
American seaboard (calculated C3 of 0.592), Fos sur Mer and Lavera on France's NW Atlantic coast
(0.588; 0.585) and Rotterdam (0.582; Table 5). The most environmentally dissimilar ports trading
with Odessa in the 1999-2002 database (i.e. C3s below 0.3) were the two wet tropics Malaysian ports
of Port Kelang and Kuala Baram plus the warm water/high salinity port of Dubai in the arid Gulf
(Tables 5-6; Figures 21, 22).
As discussed in Section 4.5 and shown in Table 4 and Figure 20, the most frequent potential BW
destination port was Constanta (i.e. the Next Port of Call for 16% of all departures). This port also has
a relatively high calculated environmental matching of 0.797 (Table 6), and is located down-current
of Odessa owing to the direction of the western surface water gyre in the Black Sea. While
Illyichivesk had the highest match (0.819), it is not a frequent BW source port (0.41% of reported
discharges; Table 3) but the second-most common destination port (9.6% of departures; Table 4).
How many of these departures may have been carrying at least some BW uplifted from Odessa and
required to be discharged in this port could not be ascertained. However, since voyage durations and
BW storage times of ships trading between Odessa and all other Black Sea ports are relatively short
(<5 days and potentially less than 24 hours for Illyichevsk), any sessile benthic species introduced to
Odessa from beyond the Black Sea may have many opportunities to be spread faster and wider via
BW-mediated `port-hopping' than by its natural dispersal means. The latter will be limited by the
longevity and salinity tolerances of its dispersal stages and the speed and direction of prevailing
currents extending south-west from Odessa (Figure 11).
44
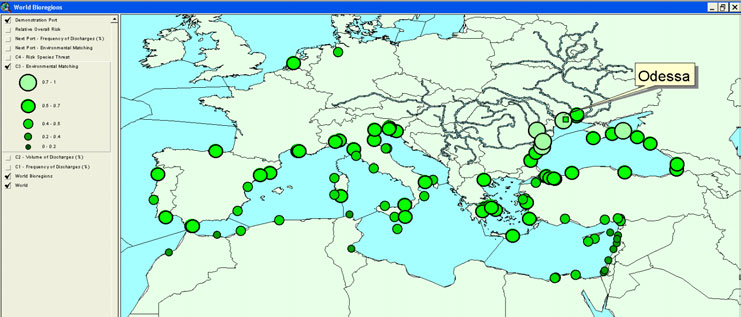
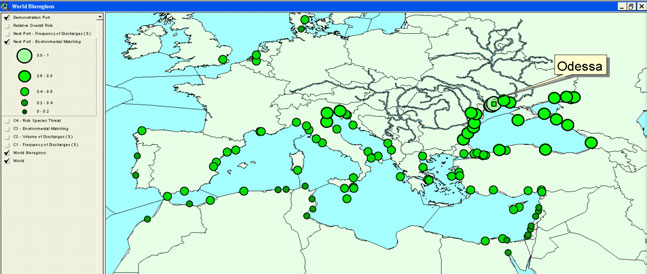
4 Results
Figure 21. GIS output showing the location and environmental matching coefficients (C3) of BW source ports
identified for the Port of Odessa.
Figure 22. GIS output showing the location and environmental matching coefficients (C3) of the destination ports
identified for the Port of Odessa.
45
Ballast Water Risk Assessment, Port of Odessa, Ukraine, October 2003: Final Report
Table 5. Source ports identified for Port of Odessa, as ranked according to size of their environmental matching
coefficient (C3)
Proportion of BW
Environmental
UN Port Code Port Name
Country
C3 Estimated
discharged
Matching (C3)
UAILK
Ilyichevsk
Ukraine
0.41%
0.8193
UAKEH
Kerch
Ukraine
0.08%
0.7500
Y
ROMID
Midia
Romania
0.08%
0.7386
ROCND
Constanta
Romania
5.73%
0.7375
ROMAG
Mangalia
Romania
0.75%
0.7286
ROGAZ
Galatz
Romania
0.08%
0.7000
Y
TRERE
Eregli
Turkey
0.25%
0.6895
BGVAR
Varna
Bulgaria
2.57%
0.6866
TRSSX
Samsun
Turkey
0.75%
0.6805
RUNVS
Novorossiysk
Russian Federation
0.58%
0.6731
RUTUA
Tuapse
Russian Federation
0.08%
0.6716
GEBUS
Batumi
Georgia
0.17%
0.6644
RUNJK
Nakhodka
Russian Federation
0.75%
0.6500
Y
GEPTI
Poti
Georgia
0.00%
0.6452
UASVP
Sevastopol
Ukraine
1.16%
0.6446
BGBOJ
Bourgas
Bulgaria
14.77%
0.6382
UADNB
Dnepro-Bugsky
Ukraine
0.25%
0.6298
SIKOP
Koper
Slovenia
0.17%
0.6273
ITVCE
Venezia (=Fusina)
Italy
1.00%
0.6242
ITTRS
Trieste
Italy
7.88%
0.6219
ITRAN
Ravenna
Italy
2.82%
0.6130
UAFEO
Feodosiya
Ukraine
0.17%
0.6000
Y
USBOS
Boston Massachusetts
United States
0.08%
0.5924
FRFOS
Fos sur Mer
France
4.15%
0.5880
FRLAV
Lavera
France
0.08%
0.5853
NLRTM
Rotterdam
Netherlands
0.17%
0.5816
ITLIV
Livorno
Italy
0.33%
0.5775
GRSKG
Thessaloniki
Greece
1.66%
0.5641
TRIST
Istanbul
Turkey
1.99%
0.5632
UANIK
Nikolayev
Ukraine
0.08%
0.5572
ITTAR
Taranto
Italy
0.08%
0.5547
TRTUT
Tutuncifilik
Turkey
0.08%
0.5500
Y
TRTUZ
Tuzla
Turkey
0.08%
0.5500
Y
GREEU
Eleusis
Greece
3.40%
0.5339
TRYAR
Yarimca
Turkey
0.08%
0.5334
ESTAR
Tarragona
Spain
0.75%
0.5320
PTFAO
Faro
Portugal
0.08%
0.5297
GIGIB
Gibraltar
Gibraltar
0.33%
0.5287
ESBCN
Barcelona
Spain
0.08%
0.5242
ITGOA
Genoa
Italy
1.41%
0.5211
ESBIO
Bilbao
Spain
0.08%
0.5207
ESALG
Algeciras
Spain
0.17%
0.5200
GRASS
Aspropyrgos
Greece
0.41%
0.5145
ITPFX
Porto Foxi (Sarroch)
Italy
1.00%
0.5104
TRIZM
Izmir (Smyrna)
Turkey
0.41%
0.5070
GRPIR
Piraeus
Greece
4.98%
0.5053
GRAGT
Agioi Theodoroi
Greece
0.66%
0.5000
Y
GRANI
Aghios Nikolaos
Greece
0.08%
0.5000
Y
GRKGS
Kos
Greece
0.08%
0.5000
Y
GRLAV
Lavrion (Laurium)
Greece
0.33%
0.5000
Y
GRMGR
Megara Oil Terminal (Agia Trias)
Greece
0.08%
0.5000
Y
GRNPL
Nauplia (Nafplion)
Greece
0.08%
0.5000
Y
HRRJK
Rijeka Bakar
Croatia
0.33%
0.5000
Y
ITMLZ
Milazzo
Italy
0.75%
0.5000
Y
ITSIR
Siracusa
Italy
0.25%
0.5000
Y
ITSPA
Santa Panagia
Italy
1.49%
0.5000
Y
ITSVN
Savona
Italy
0.58%
0.5000
Y
TRMER
Mersin
Turkey
1.00%
0.4858
EGEDK
El Dekheila
Egypt
0.08%
0.4796
EGALY
Alexandria (El Iskandariya)
Egypt
1.00%
0.4789
46
4 Results
Table 5 (cont'd). Source ports identified for Port of Odessa, ranked according to the size of their environmental
matching coefficient (C3)
Proportion of BW
Environmental
UN Port Code Port Name
Country
C3 Estimated
discharged
Matching (C3)
TRIZT
Izmit
Turkey
2.66%
0.4771
PTLIS
Lisboa
Portugal
0.08%
0.4729
ESLPA
Las Palmas
Spain
0.58%
0.4602
CYLCA
Larnaca
Cyprus
0.33%
0.4550
CNSHA
Shanghai (Shihu) Shanghai
China
0.08%
0.4536
ESCAR
Cartagena
Spain
0.33%
0.4500
Y
ESCAS
Castellon de la Plana
Spain
1.00%
0.4500
Y
ITAOI
Ancona
Italy
0.50%
0.4500
Y
ITAUG
Augusta/Priolo
Italy
0.58%
0.4500
Y
ITBDS
Brindisi
Italy
0.08%
0.4500
Y
ITCRV
Crotone
Italy
0.41%
0.4500
Y
ITFAL
Falconara
Italy
0.66%
0.4500
Y
ITFCO
Fiumicino
Italy
0.50%
0.4500
Y
ITGEA
Gela
Italy
1.24%
0.4500
Y
ITMNF
Monfalcone
Italy
0.08%
0.4500
Y
ITPIO
Piombino
Italy
0.83%
0.4500
Y
ITPMA
Porto Marghera
Italy
0.66%
0.4500
Y
ITPTO
Porto Torres
Italy
0.25%
0.4500
Y
ITPVE
Porto Vesme (Portoscuso)
Italy
0.75%
0.4500
Y
DEBRE
Bremen
Germany
0.08%
0.4464
HROMI
Omisalj
Croatia
3.65%
0.4462
CYLMS
Limassol
Cyprus
1.99%
0.4438
TRDYL
Dortyol Oil Terminal
Turkey
0.08%
0.4420
BRPNG
Paranagua
Brazil
0.08%
0.4418
EGDAM
Damietta
Egypt
0.08%
0.4268
BRSSZ
Santos
Brazil
0.08%
0.4097
MTMLA
Malta (Valletta)
Malta
0.25%
0.4066
BRMCZ
Maceio
Brazil
0.08%
0.4000
Y
DZALG
Alger
Algeria
0.17%
0.4000
Y
DZORN
Oran
Algeria
0.08%
0.4000
Y
ITPMO
Palermo
Italy
0.17%
0.4000
Y
TRALI
Aliaga
Turkey
2.66%
0.4000
Y
TRAMB
Ambali/Kumport
Turkey
0.25%
0.4000
Y
TRAYT
Antalya
Turkey
0.50%
0.4000
Y
TRBDM
Bandirma
Turkey
0.08%
0.4000
Y
TRCEY
Botas-Ceyhan
Turkey
0.33%
0.4000
Y
TRISK
Iskenderun
Turkey
0.41%
0.4000
Y
TRNEM
Nemrut Bay
Turkey
0.58%
0.4000
Y
TRTOR
Toros
Turkey
0.08%
0.4000
Y
YEHOD
Hodeidah
Yemen
0.33%
0.3940
NGLOS
Lagos
Nigeria
0.33%
0.3770
ILASH
Ashdod
Israel
0.58%
0.3761
SNDKR
Dakar
Senegal
0.00%
0.3697
LBBEY
Beirut
Lebanon
0.33%
0.3500
Y
LBKYE
Tripoli
Lebanon
0.08%
0.3500
Y
MACAS
Casablanca
Morocco
0.17%
0.3500
Y
MANDR
Nador
Morocco
0.66%
0.3500
Y
MRNKC
Nouakchott
Mauritania
0.08%
0.3500
Y
MTMAR
Marsaxlokk
Malta
0.33%
0.3500
Y
SYBAN
Baniyas
Syrian Arab Republic
0.58%
0.3500
Y
SYLTK
Latakia
Syrian Arab Republic
0.17%
0.3500
Y
SYTTS
Tartous
Syrian Arab Republic
1.08%
0.3500
Y
TNGAE
Gabes
Tunisia
0.25%
0.3500
Y
SGSIN
Singapore
Singapore
0.08%
0.3387
IDDUM
Dumai Sumatra
Indonesia
0.08%
0.3054
ILAKL
Ashkelon
Israel
1.66%
0.3000
Y
ILHFA
Haifa
Israel
0.33%
0.3000
Y
VNHAN
Hanoi
Viet Nam
0.08%
0.3000
Y
MYPKG
Port Kelang
Malaysia
0.08%
0.2763
MYKBA
Kuala Baram
Malaysia
0.08%
0.2500
Y
47
Ballast Water Risk Assessment, Port of Odessa, Ukraine, October 2003: Final Report
Table 6. Destination ports identified for Port of Odessa, ranked according to the size of their environmental
matching coefficient (C3)*
Proportion of
Environmental
UN Port Code
Port Name
Country
C3 Estimated
Departures
Matching (C3)
UAILK
Ilyichevsk
Ukraine
9.26
0.819
UAKHE
Kherson
Ukraine
0.39
0.750
Y
UAIZM
Izmail
Ukraine
0.29
0.750
Y
UAOKT
Oktyabrsky
Ukraine
0.19
0.750
Y
UAKEH
Kerch
Ukraine
0.10
0.750
Y
UAMPW
Mariupol (=Azovstal/Zhdanov)
Ukraine
0.10
0.750
Y
UARNI
Reni
Ukraine
0.19
0.740
ROMID
Midia
Romania
2.34
0.739
ROCND
Constanta
Romania
16.08
0.737
ROMAG
Mangalia
Romania
0.10
0.729
TRERE
Eregli
Turkey
0.58
0.690
BGVAR
Varna
Bulgaria
4.39
0.687
TRSSX
Samsun
Turkey
0.39
0.680
RUNVS
Novorossiysk
Russian Federation
1.95
0.673
RUTUA
Tuapse
Russian Federation
0.10
0.672
RUROS
Rostov-on-Don
Russian Federation
0.29
0.650
Y
RUAZO
Azov
Russian Federation
0.10
0.650
Y
RUTAG
Taganrog
Russian Federation
0.10
0.650
Y
GEPTI
Poti
Georgia
0.10
0.645
UASVP
Sevastopol
Ukraine
0.19
0.645
BGBOJ
Bourgas
Bulgaria
8.87
0.638
ITVCE
Venezia (=Fusina)
Italy
0.29
0.624
ITTRS
Trieste
Italy
1.36
0.622
ITRAN
Ravenna
Italy
1.66
0.613
UABGD
Belgorod-Dnestrovskiy
Ukraine
0.10
0.600
Y
FRFOS
Fos sur Mer
France
0.39
0.588
FRLAV
Lavera
France
0.29
0.585
NLRTM
Rotterdam
Netherlands
0.10
0.582
ITLIV
Livorno
Italy
0.10
0.578
CNNGB
Ningbo Zhejiang
China
0.10
0.565
GRSKG
Thessaloniki
Greece
0.58
0.564
TRIST
Istanbul
Turkey
6.63
0.563
GRVOL
Volos
Greece
0.10
0.559
UANIK
Nikolayev
Ukraine
0.19
0.557
ITTAR
Taranto
Italy
0.10
0.555
YUBAR
Bar
Yugoslavia (Fed Rep Of)
0.29
0.550
Y
NOSVG
Stavanger
Norway
0.10
0.550
Y
ESVLC
Valencia
Spain
0.10
0.545
GREEU
Eleusis
Greece
1.75
0.534
TRYAR
Yarimca
Turkey
1.07
0.533
ESTAR
Tarragona
Spain
0.10
0.532
ESBCN
Barcelona
Spain
0.19
0.524
ITGOA
Genoa
Italy
0.58
0.521
ESALG
Algeciras
Spain
0.39
0.520
KRPUS
Pusan
Korea Republic of
0.10
0.516
GRASS
Aspropyrgos
Greece
0.19
0.515
USHOU
Houston Texas
United States
0.29
0.511
ITPFX
Porto Foxi (Sarroch)
Italy
0.58
0.510
TRIZM
Izmir (Smyrna)
Turkey
0.78
0.507
GRPIR
Piraeus
Greece
1.07
0.505
GRJKH
Chios
Greece
0.19
0.504
ITSPA
Santa Panagia
Italy
0.58
0.500
Y
ALDRZ
Durres
Albania
0.49
0.500
Y
ITMLZ
Milazzo
Italy
0.29
0.500
Y
GBQUB
Queenborough
United Kingdom
0.19
0.500
Y
CNBAY
Bayuquan Liaoning
China
0.10
0.500
Y
DKHOR
Horsens
Denmark
0.10
0.500
Y
GRSTA
Stavros/Vathi
Greece
0.10
0.500
Y
HRRJK
Rijeka Bakar
Croatia
0.10
0.500
Y
HRZAD
Zadar
Croatia
0.10
0.500
Y
ITMDC
Marina di Carrara
Italy
0.10
0.500
Y
ITSIR
Siracusa
Italy
0.10
0.500
Y
ITTAL
Talamone
Italy
0.10
0.500
Y
48
4 Results
Table 6 (cont'd). Destination ports identified for Port of Odessa, ranked according to the size of their
environmental matching coefficient (C3)
Proportion of
Environmental
UN Port Code
Port Name
Country
C3 Estimated
Departures
Matching (C3)
BEANR
Antwerpen
Belgium
0.10
0.499
PECLL
Callao
Peru
0.10
0.493
TRMER
Mersin
Turkey
0.49
0.486
EGALY
Alexandria (El Iskandariya)
Egypt
1.85
0.479
TRIZT
Izmit
Turkey
0.29
0.477
CYLCA
Larnaca
Cyprus
0.10
0.455
CNSHA
Shanghai (Shihu) Shanghai
China
0.10
0.454
ITAUG
Augusta/Priolo
Italy
0.58
0.450
Y
ESCAS
Castellon de la Plana
Spain
0.10
0.450
Y
ESFER
Ferrol/Laxe
Spain
0.10
0.450
Y
ESMOT
Motril
Spain
0.10
0.450
Y
ITBDS
Brindisi
Italy
0.10
0.450
Y
ITBRI
Bari
Italy
0.10
0.450
Y
ITCVV
Civitavecchia
Italy
0.10
0.450
Y
HROMI
Omisalj
Croatia
0.49
0.446
CYLMS
Limassol
Cyprus
0.88
0.444
TRDYL
Dortyol Oil Terminal
Turkey
0.78
0.442
BRRIO
Rio de Janeiro
Brazil
0.10
0.429
EGDAM
Damietta
Egypt
0.10
0.427
CNHUA
Huangpu (Xinzao) Guangdong
China
0.29
0.414
THBKK
Bangkok
Thailand
0.49
0.414
MTMLA
Malta (Valetta)
Malta
0.10
0.407
TRALI
Aliaga
Turkey
0.88
0.400
Y
DZALG
Alger
Algeria
0.68
0.400
Y
TRAMB
Ambali/Kumport
Turkey
0.68
0.400
Y
TRISK
Iskenderun
Turkey
0.58
0.400
Y
DZORN
Oran
Algeria
0.29
0.400
Y
TRMRM
Marmaris
Turkey
0.29
0.400
Y
TRGEB
Gebze
Turkey
0.19
0.400
Y
CNJIA
Jiangyin Jiangsu
China
0.10
0.400
Y
CNXMN
Xiamen (Weitou) Fujian
China
0.10
0.400
Y
CUHAV
Habana
Cuba
0.10
0.400
Y
TRTEK
Tekirdag
Turkey
0.10
0.400
Y
AEFJR
Fujairah (Al-Fujairah)
United Arab Emirates
0.19
0.396
TWKHH
Kaohsiung
Taiwan Province of China
0.19
0.388
IDJKT
Jakarta Java
Indonesia
0.49
0.386
NGTIN
Tin Can Island
Nigeria
0.19
0.383
NGLOS
Lagos
Nigeria
0.10
0.377
ILASH
Ashdod
Israel
2.24
0.376
EGPSD
Port Said
Egypt
0.10
0.375
SNDKR
Dakar
Senegal
0.10
0.370
DJJIB
Djibouti
Djibouti
0.19
0.361
USMSY
New Orleans
United States
0.10
0.361
DEFLF
Flensburg
Germany Federal Republic Of
0.10
0.360
Y
SDPZU
Port Sudan
Sudan
0.10
0.354
SYTTS
Tartous
Syrian Arab Republic
0.88
0.350
Y
LBBEY
Beirut
Lebanon
0.68
0.350
Y
DZSKI
Skikda/Phillippeville
Algeria
0.58
0.350
Y
MACAS
Casablanca
Morocco
0.58
0.350
Y
LBKYE
Tripoli
Lebanon
0.10
0.350
Y
MANDR
Nador
Morocco
0.10
0.350
Y
PTAVE
Aveiro
Portugal
0.10
0.350
Y
PTSET
Setubal
Portugal
0.10
0.350
Y
TNBIZ
Bizerte
Tunisia
0.10
0.350
Y
PHMNL
Manila
Philippines
0.19
0.349
SGSIN
Singapore
Singapore
0.68
0.339
MYLUM
Lumut
Malaysia
0.10
0.332
INMUN
Mundra
India
0.19
0.331
INTUT
Tuticorin (New Tuticorin)
India
0.10
0.330
ILHFA
Haifa
Israel
0.97
0.300
Y
ILAKL
Ashkelon
Israel
0.19
0.300
Y
THKSI
Koh Sichang
Thailand
0.19
0.300
Y
AOLOB
Lobito
Angola
0.10
0.300
Y
GHTEM
Tema
Ghana
0.10
0.300
Y
ILHAD
Hadera
Israel
0.10
0.300
Y
VNVUT
Vung Tau
Viet Nam
0.10
0.300
Y
AEDXB
Dubai
United Arab Emirates
0.10
0.268
49
Ballast Water Risk Assessment, Port of Odessa, Ukraine, October 2003: Final Report
4.7
Risk species
The risk species threat from a source port depends on the number of introduced and native species in
its bioregion, and their categorisations as unlikely, suspected or known harmful species (Section 3.9).
The risk species threat coefficient (C4) of the BW source ports identified for Odessa are shown in
Figure 23 and listed in Table 7. Table 7 also lists the scores for the introduced, suspected and known
harmful species of the source port bioregions, as had been added and assigned to the database's
species tables by March 2003. As noted in Section 3.9, these tables and their associated Excel species
reference file do not give a complete global list, but provide a working resource enabling convenient
update and improvement for each bioregion. Similarly, the 204 bioregions on the GIS world map
should not be considered unalterable. Regional resolution of species-presence records is steadily
improving in several areas, and this will allow many bioregions to become divided into increasingly
smaller units (ultimately approaching the scale of local port waters).
It should also be recognised that the distribution of risk species in the database also contains a
regional bias due to the level of aquatic sampling and taxonomic effort in the Black Sea and other
parts of Europe, plus Australia/New Zealand and North America.
The species in Table 8 include preliminary from the Odessa PBBS, plus those listed in published and
unpublished reports collated by Group C members (Section 3.9 and Appendix 5). It also lists recent
final identifications (i.e. not included in the C4 calculation).
Many of the species listed for the bioregions with source ports trading with Odessa can be related to
their history of transfer via aquaculture, hull fouling on sailing vessels and the canal/river-link
invasions of the east Mediterranean (Suez Canal, 1899), east Europe (Ponto-Caspian rivers and
Volga-Don canal that opened in 1952) and the Great Lakes (St Lawrence River seaway). The regional
and often patchy sampling bias needs to be remembered when comparing C4 values between different
bioregions, and is a further reason why the independent treatment of C3 for calculating the ROR
values is a safer approach (Section 3.10).
Because of the different historical vectors (hull fouling, canal links, aquaculture, dry ballast, water
ballast, etc), a future version of the BWRA system could provide more accurate C4 values for BW-
mediated introduction threats if vector weightings are added to the database for the C4 calculation.
Figure 23. GIS output showing the location and risk species threat coefficients (C4) of the BW source ports
identified for the Port of Odessa
50
4 Results
Table 7. Ranking of BW source ports identified for Port of Odessa, according to the size of their risk species
threat (C4).
No. of
Suspected
Knwn
Total
Relative Risk
Port Code
Source Port
Country
Bio-Region
Introduced
Harmful
Harmful
Threat
Species Threat
Species
Species
Species
Value
(C4)
CNSHA Shanghai (Shihu) Shanghai
China
NWP-3a
11
10
11
151
0.572
BRPNG Paranagua
Brazil
SA-IIB
20
6
11
148
0.561
BRSSZ Santos
Brazil
SA-IIB
20
6
11
148
0.561
RUNJK Nakhodka
Russian Federation
NWP-4a
8
10
11
148
0.561
ESBIO Bilbao
Spain
NEA-V
20
8
8
124
0.470
PTFAO Faro
Portugal
NEA-V
20
8
8
124
0.470
PTLEI Leixoes
Portugal
NEA-V
20
8
8
124
0.470
PTLIS
Lisboa
Portugal
NEA-V
20
8
8
124
0.470
DEBRE Bremen
Germany
NEA-II
22
7
8
123
0.466
NLRTM Rotterdam
Netherlands
NEA-II
22
7
8
123
0.466
DZALG Alger
Algeria
MED-II
18
3
8
107
0.405
ESBCN Barcelona
Spain
MED-II
18
3
8
107
0.405
ESCAR Cartagena
Spain
MED-II
18
3
8
107
0.405
ESCAS Castellon de la Plana
Spain
MED-II
18
3
8
107
0.405
ESTAR Tarragona
Spain
MED-II
18
3
8
107
0.405
FRFOS Fos sur Mer
France
MED-II
18
3
8
107
0.405
FRLAV Lavera
France
MED-II
18
3
8
107
0.405
ITBDS Brindisi
Italy
MED-VII
18
3
8
107
0.405
ITFAL Falconara
Italy
MED-VII
18
3
8
107
0.405
ITGOA Genoa
Italy
MED-II
18
3
8
107
0.405
ITLIV
Livorno
Italy
MED-II
18
3
8
107
0.405
ITMLZ Milazzo
Italy
MED-III
18
3
8
107
0.405
ITPIO
Piombino
Italy
MED-III
18
3
8
107
0.405
ITPVE Porto Vesme (Portoscuso)
Italy
MED-II
18
3
8
107
0.405
ITRAN Ravenna
Italy
MED-VII
18
3
8
107
0.405
ITSIR
Siracusa
Italy
MED-IV
18
3
8
107
0.405
ITSPA Santa Panagia
Italy
MED-IV
18
3
8
107
0.405
ITSVN Savona
Italy
MED-II
18
3
8
107
0.405
ITTAR Taranto
Italy
MED-IV
18
3
8
107
0.405
MTMAR Marsaxlokk
Malta
MED-IV
18
3
8
107
0.405
MTMLA Malta (Valetta)
Malta
MED-IV
18
3
8
107
0.405
TNGAE Gabes
Tunisia
MED-IV
18
3
8
107
0.405
ITGEA Gela
Italy
MED-IV
17
3
8
106
0.402
ITMNF Monfalcone
Italy
MED-VII
17
3
8
106
0.402
ITPMA Porto Marghera
Italy
MED-VII
17
3
8
106
0.402
ITPTO Porto Torres
Italy
MED-II
17
3
8
106
0.402
TNBIZ Bizerte
Tunisia
MED-III
17
3
8
106
0.402
CYLCA Larnaca
Cyprus
MED-V
18
3
7
97
0.367
CYLMS Limassol
Cyprus
MED-V
18
3
7
97
0.367
EGALY Alexandria (El Iskandariya)
Egypt
MED-V
18
3
7
97
0.367
EGDAM Damietta
Egypt
MED-V
18
3
7
97
0.367
EGEDK El Dekheila
Egypt
MED-V
18
3
7
97
0.367
ILASH Ashdod
Israel
MED-V
18
3
7
97
0.367
ILHFA Haifa
Israel
MED-V
18
3
7
97
0.367
ITAOI Ancona
Italy
MED-VII
18
3
7
97
0.367
LBBEY Beirut
Lebanon
MED-V
18
3
7
97
0.367
LBKYE Tripoli
Lebanon
MED-V
18
3
7
97
0.367
SYBAN Baniyas
Syrian Arab Republic
MED-V
18
3
7
97
0.367
SYLTK Latakia
Syrian Arab Republic
MED-V
18
3
7
97
0.367
SYTTS Tartous
Syrian Arab Republic
MED-V
18
3
7
97
0.367
TRAYT Antalya
Turkey
MED-V
18
3
7
97
0.367
TRCEY Botas-Ceyhan
Turkey
MED-V
18
3
7
97
0.367
TRDYL Dortyol Oil Terminal
Turkey
MED-V
18
3
7
97
0.367
TRISK Iskenderun
Turkey
MED-V
18
3
7
97
0.367
TRMER Mersin
Turkey
MED-V
18
3
7
97
0.367
TRTOR Toros
Turkey
MED-V
18
3
7
97
0.367
DZORN Oran
Algeria
MED-I
17
3
7
96
0.364
ESALG Algeciras
Spain
MED-I
17
3
7
96
0.364
GIGIB Gibraltar
Gibraltar
MED-I
17
3
7
96
0.364
GRAGT Agioi Theodoroi
Greece
MED-VI
17
3
7
96
0.364
GRANI Aghios Nikolaos
Greece
MED-VI
17
3
7
96
0.364
51
Ballast Water Risk Assessment, Port of Odessa, Ukraine, October 2003: Final Report
Table 7 (cont'd). Ranking of BW source ports identified for Port of Odessa, according to the size of their risk
species threat (C4).
No. of
Suspected
Knwn
Total
Relative Risk
Port Code
Source Port
Country
Bio-Region
Introduced
Harmful
Harmful
Threat
Species Threat
Species
Species
Species
Value
(C4)
GRASS Aspropyrgos
Greece
MED-VI
17
3
7
96
0.364
GREEU Eleusis
Greece
MED-VI
17
3
7
96
0.364
GRKGS Kos
Greece
MED-VI
17
3
7
96
0.364
GRLAV Lavrion (Laurium)
Greece
MED-VI
17
3
7
96
0.364
GRMGR Megara Oil Terminal
Greece
MED-VI
17
3
7
96
0.364
GRNPL Nauplia (Nafplion)
Greece
MED-VI
17
3
7
96
0.364
GRPIR Piraeus
Greece
MED-VI
17
3
7
96
0.364
GRSKG Thessaloniki
Greece
MED-VI
17
3
7
96
0.364
HROMI Omisalj
Croatia
MED-VII
17
3
7
96
0.364
HRRJK Rijeka Bakar
Croatia
MED-VII
17
3
7
96
0.364
ITAUG Augusta/Priolo
Italy
MED-IV
17
3
7
96
0.364
ITCRV Crotone
Italy
MED-IV
17
3
7
96
0.364
ITFCO Fiumicino
Italy
MED-III
17
3
7
96
0.364
ITPFX Porto Foxi (Sarroch)
Italy
MED-II
17
3
7
96
0.364
ITPMO Palermo
Italy
MED-III
17
3
7
96
0.364
ILAKL Ashkelon
Israel
MED-V
17
3
7
96
0.364
ITTRS Trieste
Italy
MED-VII
17
3
7
96
0.364
ITVCE Venezia (=Fusina)
Italy
MED-VII
17
3
7
96
0.364
MANDR Nador
Morocco
MED-I
17
3
7
96
0.364
SIKOP Koper
Slovenia
MED-VII
17
3
7
96
0.364
TRALI Aliaga
Turkey
MED-VI
17
3
7
96
0.364
TRAMB Ambali/Kumport
Turkey
MED-VIII
17
3
7
96
0.364
TRBDM Bandirma
Turkey
MED-VIII
17
3
7
96
0.364
TRIST Istanbul
Turkey
MED-VIII
17
3
7
96
0.364
TRIZM Izmir (Smyrna)
Turkey
MED-VI
17
3
7
96
0.364
TRIZT Izmit
Turkey
MED-VIII
17
3
7
96
0.364
TRNEM Nemrut Bay
Turkey
MED-VI
17
3
7
96
0.364
TRTUT Tutuncifilik
Turkey
MED-VIII
17
3
7
96
0.364
TRTUZ Tuzla
Turkey
MED-VIII
17
3
7
96
0.364
TRYAR Yarimca
Turkey
MED-VIII
17
3
7
96
0.364
USBOS Boston Massachusetts
United States
NA-ET2
9
2
6
75
0.284
ROCND Constanta
Romania
MED-IXB
15
3
5
74
0.280
ROGAZ Galatz
Romania
MED-IXB
15
3
5
74
0.280
ROMAG Mangalia
Romania
MED-IXB
15
3
5
74
0.280
ROMID Midia
Romania
MED-IXB
15
3
5
74
0.280
UADNB Dnepro-Bugsky
Ukraine
MED-IXB
15
3
5
74
0.280
UAILK Ilyichevsk
Ukraine
MED-IXB
15
3
5
74
0.280
UANIK Nikolayev
Ukraine
MED-IXB
15
3
5
74
0.280
IDDUM Dumai Sumatra
Indonesia
EAS-VI
5
6
5
73
0.277
MYKBA Kuala Baram
Malaysia
EAS-I
5
6
5
73
0.277
MYPKG Port Kelang
Malaysia
EAS-VI
5
6
5
73
0.277
SGSIN Singapore
Singapore
EAS-VI
5
6
5
73
0.277
VNHAN Hanoi
Viet Nam
EAS-I
5
6
5
73
0.277
BGBOJ Bourgas
Bulgaria
MED-IXA
14
3
4
63
0.239
BGVAR Varna
Bulgaria
MED-IXA
14
3
4
63
0.239
GEBUS Batumi
Georgia
MED-IXA
14
3
4
63
0.239
GEPTI Poti
Georgia
MED-IXA
14
3
4
63
0.239
RUNVS Novorossiysk
Russian Federation
MED-IXA
14
3
4
63
0.239
RUTUA Tuapse
Russian Federation
MED-IXA
14
3
4
63
0.239
TRERE Eregli
Turkey
MED-IXA
14
3
4
63
0.239
TRSSX Samsun
Turkey
MED-IXA
14
3
4
63
0.239
UAFEO Feodosiya
Ukraine
MED-IXA
14
3
4
63
0.239
UASVP Sevastopol
Ukraine
MED-IXA
14
3
4
63
0.239
BRMCZ Maceio
Brazil
SA-III
6
5
4
61
0.231
UAKEH Kerch
Ukraine
MED-X
11
1
4
54
0.205
YEHOD Hodeidah
Yemen
RS-1
4
2
1
20
0.076
ESLPA Las Palmas
Spain
WA-I
0
0
0
0
0.000
MACAS Casablanca
Morocco
WA-I
0
0
0
0
0.000
MRNKC Nouakchott
Mauritania
WA-I
0
0
0
0
0.000
NGLOS Lagos
Nigeria
WA-II
0
0
0
0
0.000
SNDKR Dakar
Senegal
WA-I
0
0
0
0
0.000
52
4 Results
Finally, it is worth noting the database cannot produce `reverse' C4 values for BW destination ports
(i.e. measures of relative threat posed by BW exported from Odessa). This requires knowing the
sources of all the other BW discharged at each destination port. What can be extracted from the
database to assist a `reverse' BWRA is the list of species assigned to the bioregion of Odessa (MED-
IXB; Figure 7, Table 8).
Table 8. Status of risk species assigned to the bioregion of Odessa (MED-IXB)
Regional
Group
Common Name
Species Name
Threat Status
Status
Pyrrophyta/Dinophycae
Toxic dinoflagellate
Alexandrium tamarense*
Introduced
Known harmful species
Pyrrophyta/Dinophycae
Toxic dinoflagellate
Alexandrium affine*
Introduced
Suspected harmful species
Pyrrophyta/Dinophycae
Toxic dinoflagellate
Alexandrium catenella*
Introduced
Known harmful species
Pyrrophyta/Dinophycae
Toxic dinoflagellate
Alexandrium pseudogonyaulax*
Introduced
Suspected harmful species
Pyrrophyta/Dinophycae
Toxic dinoflagellate
Cochlodinium polykrikoides*
Introduced
Suspected harmful species
Pyrrophyta/Dinophycae
Toxic dinoflagellate
Gyrodinium cf. aureolum*
Introduced
Suspected harmful species
Pyrrophyta/Dinophycae
Toxic dinoflagellate
Gymnodinium catenatum
Introduced
Known harmful species
Pyrrophyta/Dinophycae
Freshwater dinoflagellate
Gymondinium uberrimum
Introduced
Suspected harmful species
Pyrrophyta/Dinophycae
Dinoflagellate
Spatulodinium pseudonoctiluca*
Introduced
Not suspected
Pyrrophyta/Dinophycae
Dinoflagellate
Pyramimonas longicauda*
Introduced
Not suspected
Bacillariophyta/Centricae
Centric diatom
Thalassiotrix mediterraneae*
Introduced
Not suspected
Bacillariophyta/Centricae
Centric diatom
Rhizosolenia calcar-avis
Introduced
Suspected harmful species
Phaeophyta
Soft sour weed
Desmarestia viridis (Fucus viridis)
Introduced
Suspected harmful species
Phaeophyta
Brown alga
Striaria attenuata
Native
Not suspected
Hyphomyceta
Marine fungi
Savoryella lignicola*
Cryptogenic Not suspected
Hyphomyceta
Marine fungi
Cirrenalia basiminuta*
Cryptogenic Not suspected
Cnidaria, Scyphomedusae
Moon Jellyfish
Aurelia aurita
Native
Suspected harmful species
Ctenophora, Lobata
Beroe comb jellyfish
Beroe ovata
Introduced
Not suspected
Ctenophora, Lobata
Comb jellyfish
Mnemiopsis leidyi
Introduced
Known harmful species
Annelida, Polychaeta
Hesionid errant bristle worm
Hesionides arenarius
Introduced
Not suspected
Ficopomatous enigmaticus (syn.
Annelida, Polychaeta
Introduced
Suspected harmful species
Reef-building serpulid tube worm*
Mercierella enigmatica)*
Annelida, Polychaeta
Tube worm
Tubificoides benedii*
Introduced
Not suspected
Annelida, Polychaeta
Sedentary spionid worm
Polydora ciliata limicola
Native
Not suspected
Crustacea, Copepoda
Black Sea copepod
Acartia clausi
Native
Suspected harmful species
Crustacea, Cirripedia
Ivory barnacle
Balanus eburneus
Introduced
Not suspected
Stripoed barnacle
Balanus amphitrite*
Introduced
Not suspected
Crustacea, Cirripedia
Bay barnacle
Balanus improvisus
Introduced
Not suspected
Crustacea, Amphipoda
Sea flea
Corophium acherusicum
Native
Not suspected
Crustacea, Amphipoda
Sea flea
Corophium volutator
Native
Not suspected
Crustacea, Isopoda
Sea Lice
Dynamene bidentata
Native
Not suspected
Crustacea, Isopoda
Sea Lice
Sphaeroma serratum
Native
Not suspected
Crustacea, Decapoda
Chinese mitten crab
Eriocheir sinensis
Introduced
Known harmful species
Crustacea, Decapoda
Burrowing xanthid crab
Rithropanopaeus harrisii tridentatus
Introduced
Not suspected
Mollusca, Gastropoda
New Zealand periwinkle
Potamopyrgus jenkinsi
Introduced
Not suspected
Mollusca, Thaididae
Veined rapa whelk
Rapana venosa (= R. thomasiana)
Introduced
Suspected harmful species
Mollusc, Arcidae
Ark shell
Anadara inaequivalis
Introduced
Suspected harmful species
Mollusca, Cardiidae
European Cockle
Hypanis colorata
Native
Not suspected
Mollusca, Mytilidae
Mediterranean blue mussel
Mytilus galloprovincialis
Native
Known harmful species
Mollusca, Mytilidae
NW European blue mussel
Mytilus edulis*
Introduced
Not suspected
Mollusca, Mytilidae
Baltic sea blue mussel
Mytilus trossulus*
Introduced
Not suspected
Mollusca, Myidae
Soft-shell clam
Mya arenaria
Introduced
Suspected harmful species
Mollusca, Terididae
Ship worm
Teredo navalis
Introduced
Known harmful species
Mollusca, Ophistobranchia
Nudibranch
Ercolania funerea*
Introduced
Not suspected
Mollusca, Ophistobranchia
Dorid nudibranch
Doridella obscura*
Introduced
Not suspected
Entoprocta
Kamptozoan nodding heads
Barentsia benedeni
Native
Not suspected
Ectoprocta/Ctenostomata
Marine sea moss (Bryozoan)
Bowerbankia imbricata
Native
Not suspected
Ectoprocta/Cheilostomata
Marine sea moss (Bryozoan)
Conopeum seurati
Native
Not suspected
Ectoprocta/Cheilostomata
Marine sea moss (Bryozoan)
Cryptosula pallasiana
Native
Suspected harmful species
Ectoprocta/Cheilostomata
Nth American FW sea moss
Urnatella gracilis
Introduced
Not suspected
Urochordata
Colonial sea squirt (tunicate)
Botryllus schlosseri
Native
Not suspected
Pisces, Mugilidae
Amur sea mullet
Mugil soiuy
Introduced
Not suspected
Pisces, Perciformes
N American pumpkin-seed fish
Lepomis gibbosus
Introduced
Known harmful species
*species identified from the Odessa PBBS after February 2003 (not included by C4 calculation)
53
Ballast Water Risk Assessment, Port of Odessa, Ukraine, October 2003: Final Report
Spatial patterns of introduced species found inside port of Odessa harbour
Recent research work by Group C counterparts at IBSS has used results from the PBBS survey and
BWRA database to investigate the numbers of both recently-discovered and all introduced species
sampled from harbour substrates within each terminal, and to see if higher numbers are associated
with the harbour areas that receive most BW discharge. Recently-discovered species are those
believed to have arrived in the past 15-25 years as a result of increasing port trade (Section 4.1). The
aim was to see if there was any link between the volumes and sources of BW discharged within the
different terminals at Odessa, and the abundance of these species on nearby wharf piles, harbour walls
and seafloor substrates.
The results are shown in Figure 24. The plots indicate there is no strong relationship between volumes
of BW discharged and the number of recently-discovered and all introduced species. However,
numbers of the recently-discovered species were almost twice as high at the two terminals which
receive the largest individual BW tank discharges (i.e. from large oil tankers and bulk carriers visiting
the oil and grain terminals respectively).
Analysis of the BWRA database to determine which regions were the most common source of BW at
Odessa showed that Italian source ports (most on the Adriatic coast) contributed the largest proportion
of the total discharged volumes, as shown in Figure 25.
Figure 24. Plots showing numbers of all and recently-introduced species in the four terminal areas that receive
almost all BW discharged in the Port of Odessa.
54
4 Results
Figure 25. Comparison of BW volumes discharged at the Odessa terminals from all source ports (A) and from
the Italian source ports (B).
Value of specific production and trophic status as predictors of risk species threat
IBSS scientists in Group C have also been investigating the effect of the widespread eutrophication of
the NW shelf of the Black Sea with respect to the functional activity of the most dominant
introductions. Severe eutrophication of the coastal water in the Odessa region occurred in the 1960s-
1980s as a result of widespread increased use of mineral fertilisers in the river catchments, plus
reduced flushing owing to the decreased freshwater inputs due to major river damming projects (e.g.
Alexandrov & Zaitsev 1998, Zaitsev Yu P & V Mamaev (1997).
Eutrophication led to a major increase in both pelagic and benthic zone primary production (the
former also becoming >200 times that of the latter). Marked changes to the predominant planktonic
and benthic species led to major modifications of community composition, with the new dominant
taxa showing a doubling of functional activity (Table 9). Introduced species characterized by maximal
values of specific production were at the forefront of these mass-predominant taxa19. The increased
trophic conditions also caused a marked decline in biodiversity, which in turn led to ecosystem
instability and created niches now occupied by highly productive species more adapted to the new
conditions. Thus the increased BW transportation into the Black Sea over the same period (1970s-
present; both volume and frequency) had enhanced the number of successful introductions, with the
most invasive being highly-productive and hence `pre-adapted'taxa which could acclimatize and
expand rapidly in the recently-formed niches.
If the coastal waters of the Black Sea maintain their elevated trophic status, then it seems possible to
predict the invasiveness (and hence threat) of newly-discovered or potential introductions using the
criteria in Table 9 (as summarised from Appendix 7). Thus the calculation of C4 could be improved if
specific production coefficients can be added to reflect the functional activity of the predominant
pelagic and benthic native species inhabiting the receival port's bioregion. These coefficients would
behave and could be treated as a `species similarity' index for BW source ports. Similarly, C3 could
be improved by adding appropriate parameter/s reflecting the trophic status of the ports. Such
parameters could be selected from those used in the OECD or TRIX trophic classification methods,
19 Specific production is the ratio of a species productivity (P; biomass increase per unit of time) and its standing biomass
(B; same mass unit), and is useful for measuring and comparing a species functional activity. The specific production
ratio (P/B) is based on different time intervals for different groups of organisms. Accepted units of measurements for
phytoplankton, seaweeds (macrophytes) and macrobenthic animals are day-1, month-1 and year-1 respectively (refer
Appendix 7 for the P/B calculation methods of the major groups).
55
Ballast Water Risk Assessment, Port of Odessa, Ukraine, October 2003: Final Report
i.e. chlorophyll a (yearly average and peak), O2 saturation, dissolved inorganic N (DIN), total P, Secci
transparency.
Table 9. Increase in the average specific production (d-1) of predominant taxa (by biomass) in the Black Sea*.
Past
Present
Criteria for predicting
Group
(pre-eutrophication)
(post-eutrophication)
invasion success
Phytoplankton
1.828
2.967
>2.4
Zooplankton
0.484
1.042
>1.2
Seaweeds
0.008
0.017
>0.012
Macrobenthic animals
0.011
0.017
>0.022#
*averaged from tables of native and introduced taxa listed in Appendix 7. # = less certain.
4.8
Risk assessment results
The database calculates the relative overall risk (ROR) of a potentially harmful introduction for all
source ports that have C1-C4 coefficients and R1-R2 factors. The ROR value for each source port
represents a proportion of the threat posed to the Demonstration Site as result of its contemporary
trading pattern (1999-2002).
After calculating the RORs the database generates a large output table listing the source ports and
their coefficients, risk-reduction factors and ROR value, plus the five ROR categories used for the
GIS plot and the standardised ROR values (S-ROR; Section 3.10). Results from the project-standard
BWRA for the Port of Odessa are listed in Table 9, and GIS plots of the ROR categories are shown in
Figure 26.
From the tank discharge records in the Odessa database, the project standard calculation identified 19
of the 122 source ports (15.6%) as representing the highest risk group (in terms of their BW source
frequency, volume, environmental similarity and assigned risk species). These ports provided the top
20% of the total ROR, with individual values in the 0.24 0.31 range (i.e. 1 - 1.25% of the total
relative risk; Table 9). The highest risk ports were led by Nakhodka in the Sea of Japan, followed by
the Bulgarian Black Sea port of Bourgas then the Italian Adriatic port of Trieste (Table 9). Of the 19
highest risk ports, 8 were in Black Sea, 9 were in the Adriatic and Eastern Mediterranean and two
were beyond this region. Thus after Nakhodka, the other non-Mediterranean/Black Sea port in the
highest risk group was the French Atlantic port of Fos sur Mer (ranked 12th; Table 9).
The number of BW source ports in the medium, low and lowest risk categories were 23 (19%), 25
(21%) and 34 (28%) respectively (Table 9). The vast majority of ports in the lowest risk category
were subtropical or tropical, with four exceptions being the ports of Bremen (Germany), Rijeka Bakar
(Croatia) and Piombino and Ancone (Italy). The source port with the lowest ROR (0.087; 0.36% of
total risk) was the Mauritanian port of Nouakchott on the West African coast (Table 9).
Based on the current pattern of shipping trade (1999-2002), the plot of the ROR results in Figure 26
implies that BW from vessels arriving from the temperate to warm temperate ports of southern Europe
provide the highest risk, together with the eastern Russian port of Nakhodka which is located beside
the Sea of Japan. These results are logical given Odessa's biogeographic location and current pattern
of trade. The results also suggest that the project standard `first-pass' treatment of the risk coefficients
provides a useful benchmark for any investigative manipulations of the risk formula or database
management.
The recent history of invasions to and from the NE American seaboard and the Black Sea, both
directly and via Western Europe stepping stones, also match the first-pass C1-C4 and ROR results,
which indicate that Odessa has not been the key entry or exit point for these introductions. The picture
is less certain for introductions into the Caspian Sea, since Odessa does trade with ports in and beside
the Azov Sea and Don River mouth, which leads to the Volga-Don canal (Section 4.5).
56
4 Results
The project standard results also imply that any species which establishes in a Black Sea or northern
Mediterranean port can be readily spread to Odessa, Illyichivesk or other ports in the MED-IXB
bioregion via the current pattern of shipping trade. It therefore would be worth obtaining further port
environmental data to increase the proportion of calculated C3 coefficients for ports in the Adriatic,
Aegean, Marmara and Black Sea regions.
Figure 27 shows the frequency distribution of the standardised ROR values. This plot shows that five
BW source ports form a small `highest-risk' group (i.e. Nakhodka, Bourgas, Trieste, Constanta and
Ilyichevsk). These are followed by a relatively steep grade of highest, high and medium risk source
ports, which in turn lead into a long tail of low and lowest risk ports on the left side of the plot.
Figure 26. GIS world map outputs (two scales) showing the location and categories of relative overall risk (ROR)
of the BW source ports identified for Odessa.
Distribution of Standardised ROR values (S-RORs)
20
18
16
14
12
10
8
Frequency
6
4
2
0
0.00
0.10
0.20
0.30
0.40
0.50
0.60
0.70
0.80
0.90
1.00
S-ROR Value
Figure 27. Frequency distribution of the standardised ROR values
57
Ballast Water Risk Assessment, Port of Odessa, Ukraine, October 2003: Final Report
Table 9. BW source ports reported for the Port of Odessa, ranked according to their Relative Overall Risk (ROR)
Min.
Relative
C1 BW
C2 BW Max. Tank
Tank
C3 Env.
C4 Risk
% of Total
Port Code
Source Port
Country
R1
R2
Overall Risk
Freq
Vol
Disch (MT)
Stor.
Match
Spp.
Risk
(ROR)
(d)
Estimated
Cumulative
Percentage
Risk Category
Standrdisd
ROR
RUNJK
Nakhodka
Russian Federation
0.73%
0.16%
4,384 1.0
3
1.0
0.650
Y
0.561
0.305
1.24
1.24
Highest
1.00
BGBOJ
Bourgas
Bulgaria
14.42%
17.28%
37,000 1.0
0
1.0
0.638
0.239
0.298
1.22
2.46
Highest
0.97
ITTRS
Trieste
Italy
7.70%
8.95%
45,000 1.0
0
1.0
0.622
0.364
0.288
1.17
3.63
Highest
0.92
ROCND Constanta
Romania
5.59%
7.48%
36,000 1.0
1
1.0
0.737
0.280
0.287
1.17
4.80
Highest
0.92
UAILK
Ilyichevsk
Ukraine
0.41%
0.55%
28,000 1.0
0
1.0
0.819
0.280
0.277
1.13
5.93
Highest
0.87
ITRAN
Ravenna
Italy
2.76%
3.42%
36,000 1.0
4
1.0
0.613
0.364
0.260
1.06
6.98
Highest
0.79
ROMAG Mangalia
Romania
0.73%
1.62%
38,500 1.0
0
1.0
0.729
0.280
0.258
1.05
8.04
Highest
0.78
ROMID Midia
Romania
0.08%
0.17%
20,115 1.0
0
1.0
0.739
0.280
0.255
1.04
9.07
Highest
0.77
ITVCE
Venezia (=Fusina)
Italy
0.97%
0.65%
31,000 1.0
4
1.0
0.624
0.364
0.251
1.02
10.10
Highest
0.75
SIKOP
Koper
Slovenia
0.16%
0.03%
2,000 1.0
4
1.0
0.627
0.364
0.248
1.01
11.11
Highest
0.74
GRPIR
Piraeus
Greece
4.86%
6.65%
32,500 1.0
2
1.0
0.505
0.364
0.246
1.00
12.11
Highest
0.73
FRFOS
Fos sur Mer
France
4.05%
3.07%
35,000 1.0
5
0.8
0.588
0.405
0.246
1.00
13.11
Highest
0.73
ROGAZ Galatz
Romania
0.08%
0.00%
200 0.6
1
1.0
0.700
Y
0.280
0.245
1.00
14.11
Highest
0.73
BGVAR Varna
Bulgaria
2.51%
2.00%
20,000 1.0
1
1.0
0.687
0.239
0.243
0.99
15.10
Highest
0.71
GRSKG Thessaloniki
Greece
1.62%
1.95%
32,000 1.0
2
1.0
0.564
0.364
0.241
0.98
16.08
Highest
0.70
ITTAR
Taranto
Italy
0.08%
0.24%
27,500 1.0
3
1.0
0.555
0.405
0.241
0.98
17.06
Highest
0.70
TRIST
Istanbul
Turkey
1.94%
1.35%
33,000 1.0
0
1.0
0.563
0.364
0.240
0.98
18.03
Highest
0.70
GREEU Eleusis
Greece
3.32%
2.75%
36,749 1.0
1
1.0
0.534
0.364
0.240
0.98
19.01
Highest
0.70
UAKEH Kerch
Ukraine
0.08%
0.05%
6,000 1.0
1
1.0
0.750
Y
0.205
0.239
0.97
19.98
Highest
0.70
ITPFX
Porto Foxi (Sarroch)
Italy
0.97%
1.43%
37,530 1.0
4
1.0
0.510
0.405
0.235
0.96
20.94
High
0.68
ITSPA
Santa Panagia
Italy
1.46%
1.54%
34,500 1.0
3
1.0
0.500
Y
0.405
0.234
0.95
21.89
High
0.67
TRERE
Eregli
Turkey
0.24%
0.23%
11,800 1.0
1
1.0
0.690
0.239
0.233
0.95
22.84
High
0.67
PTLEI
Leixoes
Portugal
1.05%
0.55%
8,124 1.0
8
0.8
0.540
Y
0.470
0.233
0.95
23.79
High
0.67
TRSSX
Samsun
Turkey
0.73%
0.01%
146 0.6
2
1.0
0.680
0.239
0.232
0.94
24.73
High
0.66
RUNVS Novorossiysk
Russian Federation
0.57%
0.46%
14,000 1.0
1
1.0
0.673
0.239
0.231
0.94
25.67
High
0.66
TRTUT Tutuncifilik
Turkey
0.08%
0.27%
32,000 1.0
1
1.0
0.550
Y
0.364
0.229
0.93
26.60
High
0.65
TRTUZ Tuzla
Turkey
0.08%
0.01%
1,500 1.0
1
1.0
0.550
Y
0.364
0.229
0.93
27.54
High
0.65
UADNB Dnepro-Bugsky
Ukraine
0.24%
0.20%
9,000 1.0
1
1.0
0.630
0.280
0.229
0.93
28.47
High
0.65
RUTUA Tuapse
Russian Federation
0.08%
0.09%
11,000 1.0
1
1.0
0.672
0.239
0.228
0.93
29.39
High
0.65
FRLAV Lavera
France
0.08%
0.08%
9,050 1.0
5
0.8
0.585
0.405
0.228
0.93
30.32
High
0.64
ITLIV
Livorno
Italy
0.32%
0.48%
34,500 1.0
5
0.8
0.578
0.405
0.227
0.93
31.25
High
0.64
PTFAO
Faro
Portugal
0.08%
0.27%
32,000 1.0
7
0.8
0.530
0.470
0.227
0.93
32.17
High
0.64
GEBUS Batumi
Georgia
0.16%
0.21%
24,500 1.0
2
1.0
0.664
0.239
0.227
0.92
33.10
High
0.64
TRYAR Yarimca
Turkey
0.08%
0.00%
300 0.6
1
1.0
0.533
0.364
0.224
0.91
34.01
High
0.63
ESBIO
Bilbao
Spain
0.08%
0.03%
4,000 1.0
9
0.8
0.521
0.470
0.224
0.91
34.92
High
0.63
UASVP Sevastopol
Ukraine
1.13%
0.18%
1,951 1.0
0
1.0
0.645
0.239
0.224
0.91
35.84
High
0.63
GEPTI
Poti
Georgia
0.41%
0.08%
2,987 1.0
4
1.0
0.645
0.239
0.222
0.90
36.74
High
0.62
ITGOA
Genoa
Italy
1.38%
2.91%
34,500 1.0
5
0.8
0.521
0.405
0.222
0.90
37.64
High
0.62
GRAGT Agioi Theodoroi
Greece
0.65%
1.47%
33,000 1.0
3
1.0
0.500
Y
0.364
0.221
0.90
38.55
High
0.61
GRASS Aspropyrgos
Greece
0.41%
0.16%
15,000 1.0
4
1.0
0.515
0.364
0.221
0.90
39.45
High
0.61
TRIZT
Izmit
Turkey
2.59%
1.69%
34,887 1.0
1
1.0
0.477
0.364
0.221
0.90
40.34
Medium
0.61
TRIZM
Izmir (Smyrna)
Turkey
0.41%
0.53%
24,000 1.0
1
1.0
0.507
0.364
0.220
0.90
41.24
Medium
0.61
ITGEA
Gela
Italy
1.22%
1.25%
24,000 1.0
4
1.0
0.450
Y
0.405
0.220
0.90
42.14
Medium
0.61
ESTAR
Tarragona
Spain
0.73%
1.64%
38,500 1.0
5
0.8
0.532
0.405
0.220
0.90
43.03
Medium
0.61
ITAUG
Augusta/Priolo
Italy
0.57%
1.26%
36,000 1.0
3
1.0
0.450
Y
0.405
0.218
0.89
43.92
Medium
0.60
NLRTM Rotterdam
Netherlands
0.16%
0.47%
35,000 1.0
10
0.6
0.582
0.466
0.217
0.88
44.80
Medium
0.59
GRLAV Lavrion (Laurium)
Greece
0.32%
0.02%
660 0.8
3
1.0
0.500
Y
0.364
0.217
0.88
45.69
Medium
0.59
HROMI Omisalj
Croatia
3.57%
2.07%
35,000 1.0
4
1.0
0.446
0.364
0.217
0.88
46.57
Medium
0.59
ITFCO
Fiumicino
Italy
0.49%
0.95%
38,000 1.0
4
1.0
0.450
Y
0.402
0.216
0.88
47.45
Medium
0.59
ITPVE
Porto Vesme (Portoscu Italy
0.73%
0.32%
12,500 1.0
4
1.0
0.450
Y
0.405
0.216
0.88
48.33
Medium
0.59
GRKGS Kos
Greece
0.08%
0.08%
9,000 1.0
2
1.0
0.500
Y
0.364
0.216
0.88
49.21
Medium
0.59
GRMGR Megara Oil Terminal (AGreece
0.08%
0.07%
8,000 1.0
2
1.0
0.500
Y
0.364
0.216
0.88
50.09
Medium
0.59
GRNPL Nauplia (Nafplion)
Greece
0.08%
0.04%
4,100 1.0
2
1.0
0.500
Y
0.364
0.216
0.88
50.97
Medium
0.59
GRANI
Aghios Nikolaos
Greece
0.08%
0.03%
4,000 1.0
2
1.0
0.500
Y
0.364
0.216
0.88
51.85
Medium
0.59
ITPTO
Porto Torres
Italy
0.24%
0.08%
3,800 1.0
4
1.0
0.450
Y
0.405
0.215
0.87
52.73
Medium
0.58
PTLIS
Lisboa
Portugal
0.08%
0.24%
28,500 1.0
7
0.8
0.473
0.470
0.213
0.87
53.59
Medium
0.58
ESBCN
Barcelona
Spain
0.08%
0.05%
6,000 1.0
5
0.8
0.524
0.405
0.212
0.86
54.46
Medium
0.57
EGEDK El Dekheila
Egypt
0.08%
0.13%
14,700 1.0
3
1.0
0.480
0.367
0.212
0.86
55.32
Medium
0.57
ITSVN
Savona
Italy
0.57%
1.15%
40,000 1.0
5
0.8
0.500
Y
0.405
0.210
0.86
56.18
Medium
0.56
UAFEO Feodosiya
Ukraine
0.16%
0.03%
2,500 1.0
1
1.0
0.600
Y
0.239
0.210
0.86
57.03
Medium
0.56
UANIK Nikolayev
Ukraine
0.08%
0.01%
1,200 1.0
1
1.0
0.557
0.280
0.210
0.85
57.89
Medium
0.56
CYLMS Limassol
Cyprus
1.94%
0.74%
34,500 1.0
3
1.0
0.444
0.367
0.210
0.85
58.74
Medium
0.56
ITMLZ
Milazzo
Italy
0.73%
0.80%
19,174 1.0
9
0.8
0.500
Y
0.402
0.209
0.85
59.59
Medium
0.56
58
4 Results
Table 9 (cont'd)
Min.
Relative
C1 BW
C2 BW Max. Tank
Tank
C3 Env.
C4 Risk
% of Total
Port Code
Source Port
Country
R1
R2
Overall Risk
Freq
Vol
Disch (MT)
Stor.
Match
Spp.
Risk
(ROR)
(d)
Estimated
Cumulative
Percentage
Risk Category
Standrdisd
ROR
CYLCA Larnaca
Cyprus
0.32%
0.344%
22,177 1.0
3
1.0
0.455
0.367
0.207
0.84
60.44
Low
0.55
ITSIR
Siracusa
Italy
0.24%
0.22%
8,743 1.0
5
0.8
0.500
Y
0.405
0.207
0.84
61.28
Low
0.55
GIGIB
Gibraltar
Gibraltar
0.32%
0.51%
25,000 1.0
6
0.8
0.529
0.364
0.207
0.84
62.12
Low
0.55
MTMLA Malta (Valetta)
Malta
0.24%
0.19%
9,500 1.0
3
1.0
0.407
0.405
0.204
0.83
62.95
Low
0.54
ESALG Algeciras
Spain
0.16%
0.33%
31,956 1.0
6
0.8
0.520
0.364
0.204
0.83
63.78
Low
0.53
TRALI
Aliaga
Turkey
2.59%
2.56%
33,000 1.0
3
1.0
0.400
Y
0.364
0.204
0.83
64.61
Low
0.53
ITMNF
Monfalcone
Italy
0.08%
0.03%
4,000 1.0
4
1.0
0.450
Y
0.364
0.204
0.83
65.44
Low
0.53
TRDYL Dortyol Oil Terminal Turkey
0.08%
0.10%
11,700 1.0
3
1.0
0.442
0.367
0.203
0.83
66.27
Low
0.53
TRMER Mersin
Turkey
0.97%
1.78%
35,000 1.0
6
0.8
0.486
0.367
0.202
0.82
67.09
Low
0.53
ITPMO
Palermo
Italy
0.16%
0.24%
14,000 1.0
4
1.0
0.400
Y
0.402
0.201
0.82
67.91
Low
0.52
EGDAM Damietta
Egypt
0.08%
0.12%
13,660 1.0
3
1.0
0.427
0.367
0.199
0.81
68.72
Low
0.51
EGALY Alexandria (El Iskanda Egypt
0.97%
0.64%
16,000 1.0
5
0.8
0.479
0.367
0.197
0.80
69.52
Low
0.50
ESCAS
Castellon de la Plana Spain
0.97%
0.35%
12,200 1.0
7
0.8
0.450
Y
0.405
0.197
0.80
70.33
Low
0.50
ESCAR
Cartagena
Spain
0.32%
0.51%
38,000 1.0
8
0.8
0.450
Y
0.405
0.196
0.80
71.12
Low
0.50
TRISK
Iskenderun
Turkey
0.41%
0.37%
14,200 1.0
3
1.0
0.400
Y
0.367
0.194
0.79
71.91
Low
0.49
TRAYT Antalya
Turkey
0.49%
0.09%
2,663 1.0
1
1.0
0.400
Y
0.367
0.193
0.79
72.70
Low
0.49
TRNEM Nemrut Bay
Turkey
0.57%
0.31%
15,000 1.0
2
1.0
0.400
Y
0.364
0.193
0.79
73.48
Low
0.48
TRTOR Toros
Turkey
0.08%
0.09%
9,980 1.0
4
1.0
0.400
Y
0.367
0.192
0.78
74.27
Low
0.48
TRAMB Ambali/Kumport
Turkey
0.24%
0.00%
137 0.6
3
1.0
0.400
Y
0.364
0.192
0.78
75.05
Low
0.48
USBOS
Boston Massachusetts United States
0.08%
0.14%
16,000 1.0
16
0.6
0.592
0.284
0.191
0.78
75.83
Low
0.48
TRBDM Bandirma
Turkey
0.08%
0.00%
200 0.6
1
1.0
0.400
Y
0.364
0.191
0.78
76.60
Low
0.48
MTMAR Marsaxlokk
Malta
0.32%
0.09%
6,000 1.0
3
1.0
0.350
Y
0.405
0.190
0.77
77.38
Low
0.47
ITFAL
Falconara
Italy
0.65%
0.93%
30,000 1.0
6
0.8
0.450
Y
0.364
0.189
0.77
78.15
Low
0.47
ITPMA
Porto Marghera
Italy
0.65%
0.10%
2,686 1.0
9
0.8
0.450
Y
0.364
0.187
0.76
78.91
Low
0.46
ITBDS
Brindisi
Italy
0.08%
0.30%
35,152 1.0
8
0.8
0.450
Y
0.364
0.186
0.76
79.67
Low
0.45
SYTTS
Tartous
Syrian Arab Republic
1.05%
0.30%
10,900 1.0
3
1.0
0.350
Y
0.367
0.183
0.74
80.41
Lowest
0.44
DEBRE
Bremen
Germany
0.08%
0.07%
8,000 1.0
11
0.6
0.446
0.466
0.182
0.74
81.15
Lowest
0.43
DZALG Alger
Algeria
0.16%
0.13%
8,000 1.0
5
0.8
0.400
Y
0.405
0.182
0.74
81.89
Lowest
0.43
HRRJK
Rijeka Bakar
Croatia
0.32%
0.26%
7,776 1.0
15
0.6
0.500
Y
0.364
0.181
0.74
82.63
Lowest
0.43
SYLTK Latakia
Syrian Arab Republic
0.16%
0.09%
9,000 1.0
3
1.0
0.350
Y
0.367
0.180
0.73
83.36
Lowest
0.42
LBKYE Tripoli
Lebanon
0.08%
0.13%
15,000 1.0
4
1.0
0.350
Y
0.367
0.180
0.73
84.09
Lowest
0.42
ITPIO
Piombino
Italy
0.81%
0.19%
3,150 1.0
11
0.6
0.450
Y
0.402
0.175
0.71
84.81
Lowest
0.40
ITCRV
Crotone
Italy
0.41%
0.06%
1,689 1.0
19
0.6
0.450
Y
0.405
0.174
0.71
85.52
Lowest
0.40
DZORN Oran
Algeria
0.08%
0.09%
10,475 1.0
6
0.8
0.400
Y
0.364
0.173
0.70
86.22
Lowest
0.39
CNSHA Shanghai (Shihu) Shan China
0.08%
0.09%
10,000 1.0
26
0.4
0.454
0.572
0.171
0.70
86.92
Lowest
0.38
TNBIZ
Bizerte
Tunisia
0.49%
0.26%
7,882 1.0
8
0.8
0.350
Y
0.402
0.170
0.69
87.61
Lowest
0.38
ILASH
Ashdod
Israel
0.57%
0.29%
9,000 1.0
8
0.8
0.376
0.367
0.170
0.69
88.30
Lowest
0.38
ILHFA
Haifa
Israel
0.32%
0.56%
20,000 1.0
4
1.0
0.300
Y
0.367
0.169
0.69
88.99
Lowest
0.37
ITAOI
Ancona
Italy
0.49%
0.06%
1,669 1.0
10
0.6
0.450
Y
0.364
0.168
0.69
89.67
Lowest
0.37
BRPNG Paranagua
Brazil
0.08%
0.07%
8,060 1.0
20
0.4
0.442
0.561
0.167
0.68
90.35
Lowest
0.36
SYBAN Baniyas
Syrian Arab Republic
0.57%
0.10%
3,019 1.0
9
0.8
0.350
Y
0.367
0.163
0.66
91.02
Lowest
0.34
LBBEY Beirut
Lebanon
0.32%
0.14%
9,200 1.0
5
0.8
0.350
Y
0.367
0.162
0.66
91.68
Lowest
0.34
BRSSZ
Santos
Brazil
0.08%
0.21%
25,000 1.0
20
0.4
0.410
0.561
0.159
0.65
92.33
Lowest
0.33
ILAKL
Ashkelon
Israel
1.62%
1.97%
20,000 1.0
5
0.8
0.300
Y
0.367
0.157
0.64
92.97
Lowest
0.32
TRCEY Botas-Ceyhan
Turkey
0.32%
0.17%
6,178 1.0
18
0.6
0.400
Y
0.367
0.156
0.64
93.60
Lowest
0.32
TNGAE Gabes
Tunisia
0.24%
0.15%
15,000 1.0
12
0.6
0.350
Y
0.405
0.149
0.61
94.21
Lowest
0.28
MANDR Nador
Morocco
0.65%
0.27%
10,000 1.0
13
0.6
0.350
Y
0.364
0.144
0.59
94.80
Lowest
0.26
BRMCZ Maceio
Brazil
0.08%
0.10%
11,300 1.0
16
0.6
0.400
Y
0.231
0.135
0.55
95.35
Lowest
0.22
SGSIN
Singapore
Singapore
0.08%
0.18%
21,000 1.0
19
0.6
0.339
0.277
0.127
0.52
95.86
Lowest
0.18
IDDUM Dumai Sumatra
Indonesia
0.08%
0.01%
800 0.8
19
0.6
0.305
0.277
0.118
0.48
96.35
Lowest
0.14
ESLPA
Las Palmas
Spain
0.57%
0.20%
3,607 1.0
12
0.6
0.460
0.000
0.117
0.48
96.82
Lowest
0.13
YEHOD Hodeidah
Yemen
0.32%
0.06%
2,650 1.0
16
0.6
0.394
0.076
0.111
0.45
97.27
Lowest
0.11
MYPKG Port Kelang
Malaysia
0.08%
0.03%
3,300 1.0
18
0.6
0.276
0.277
0.111
0.45
97.72
Lowest
0.11
VNHAN Hanoi
Viet Nam
0.08%
0.26%
30,000 1.0
22
0.4
0.300
Y
0.277
0.103
0.42
98.15
Lowest
0.07
NGLOS Lagos
Nigeria
0.32%
0.10%
5,400 1.0
16
0.6
0.377
0.000
0.095
0.39
98.53
Lowest
0.03
SNDKR Dakar
Senegal
0.41%
0.08%
2,580 1.0
15
0.6
0.370
0.000
0.094
0.38
98.91
Lowest
0.03
MYKBA Kuala Baram
Malaysia
0.08%
0.08%
9,000 1.0
21
0.4
0.250
Y
0.277
0.091
0.37
99.28
Lowest
0.01
MACAS Casablanca
Morocco
0.16%
0.11%
8,500 1.0
7
0.8
0.350
Y
0.000
0.088
0.36
99.64
Lowest
0.001
MRNKC Nouakchott
Mauritania
0.08%
0.07%
7,871 1.0
15
0.6
0.350
Y
0.000
0.088
0.36
100.00
Lowest
0.000
59
Ballast Water Risk Assessment, Port of Odessa, Ukraine, October 2003: Final Report
Reverse BWRA
It is not clear how much BW is `exported' from Odessa. The largest volumes of exported BW were
identified to occur in the ships departing the dry bulk/general cargo terminal, and some from the
container terminal. While the three most important Next Ports of Call are Bourgas, Constanta and
Illyichevsk (i.e. possible BW destination ports; Section 4.5), much of the trade to these ports are ships
departing either fully-loaded with oil or other liquid bulk cargo, or are visiting for top-up cargos (both
types having zero or very little BW onboard). It should also be noted these ports are in `down-
current' locations from Odessa, in terms of the western gyre and overall southward flow of surface
waters in the Black Sea (Figure 11).
Any harmful species that establishes in Odessa therefore has a chance to disperse south-westward by
the prevailing current regime, provided its dispersive and adult stages are sufficiently euryhaline to
tolerate the increased salinity beyond the north-west Black Sea bioregion (MED-IXB).
In the case of the risk species currently assigned to Odessa's bioregion, several have achieved
extensive populations in this direction (i.e. west side of bioregion MED-IXA; Figure 7), while some
of these and other species have appeared in the Caspian Sea. As noted above, the current database
indicates that Odessa cannot be ruled out as a potentially significant source of shipping-mediated
introductions to the Azov Sea, Volga-Don system and Caspian region.
4.9 Training and capacity building
The computer hardware and software provided by the GloBallast Programme for the BWRA activity
was successfully installed and is currently maintained at the Information and Analytical Centre for
Shipping Safety (IACSS), which is located in the Odessa offices of the State Department of Maritime
and Inland Water Transport (Ministry of Transport of Ukraine). This PC proved reliable and adequate
for running the database, undertaking the similarity analyses, displaying the GIS maps and results and
providing other project needs. A copy of the database is also maintained on the PC at the CPSO
Ecology Department in the port offices. BWRFs are continuing to be collected and stored by Ecology
Department offices, with the aim of entering these in large batches, rather than on a daily basis due to
the workload of staff duties and requirements.
Three of the Group B counterparts, including two Ecology Department officers, had previous
experience with PCs and Windows applications, so learned the data entry method and use of the
Access database GUIs for editing the records, with little difficulty. For two Ecology Department
officers it was their first experience of using a computer. The value of these officers for any data entry
requirements will be boosted if a basic PC training course for staff members can be organised by
CPSO (as the port is gradually adopting more computers for improved information management).
The mapping work was conducted at the port offices on the PC provided for the BWRA project. One
of the counterparts (Dr Mykola Berlinskyy) had experience with Mapinfo applications and also
provided some marine habitat data files for translation to Arcview for Group C. The two other Group
A counterparts had no previous experience with GIS or ESRI products, so required considerable
initial guidance to master basic use of ArcView. Both of them readily grasped the structure and
management of the layers recommended for the port map, but were hindered in obtaining regular
practise between consultants visits by their other duties and locations compared to the site and use of
the project PC for database entries. Two members of Group B also received basic training in GIS map
development and file management, and two members of Group A and two from Group C were
provided a comparable level of advice and guidance from Group B members. This helped ensure there
was adequate interchange of understanding about BWRA system operation and data management.
As noted in Section 3.6, the most easily-trained and efficient BWRF database operators are those with
substantial port and maritime work experience, plus previous hands-on experience with Windows
60
4 Results
applications. Group B were moderately strong in both areas (more so in database management due to
presence of Mr Viktor Khmelevskyy, plus the interest of Mr Roman Bashtannyy from Group A ). It is
likely that the Group A team would need at least some limited assistance from an ESRI-familiar
person if they were asked to develop a port map for another Black Sea. Certainly they could provide
useful guidance and continuity to any future BW or other management projects involving GIS
applications (Section 3.11; Appendix 2).
Group B worked hard to expand CPSO Ecology Department's paper record of BW discharges
recorded from November 1999 to December 2000, particularly the key requirements for developing a
record useable by the database, including estimated BW uptake (source) dates from standard voyage
times, source port data, vessel ID, vessel type, DWT and berth location (by vessel and cargo type).
However much work was also focussed on gap-filling BWRFs and for fixing discrepancies and errors
(most being ship-entry related than computer-entry related). Many checking and fixing tasks were
undertaken at the point of data entry, including the need to replace non-standard or illogical date
formats, making spelling checks of port and vessel names and identifying port UN codes, lat/longs
and vessel IMO numbers. Considering the necessity to translate many Russian entries into English,
considerable progress was made by Group B both between the consultants visits and during the
second visit. By the 2nd visit most Group B members and one Group A member had also become
proficient in using port shipping records and other databases for BWRF checking and gap-filling (e.g.
Fairplay Ports Guide, the Lloyds Ship Register and the consultants Excel spreadsheet for estimating
BW discharge volumes). Because of the translation requirements and lack of spare PCs, there was
little time to undertake a formal error analysis of the BWRFs. However, Group B developed a record
of commonly occurring errors, blanks and data-entry issues as part of the project team's information
gap identifications.
Of the three groups, Group C contained the highest number of senior scientists who brought to the
project team a high level of local expertise in coastal ecology and introduced species of the Black Sea
region (Appendix 2). Group C members were already familiar with multivariate methods, and
required little instruction to be able use the PRIMER package to conduct environmental similarity
analysis, and this extended to one of the Group A members (Dr Mykola Berlinskyy) which promoted
further integration of the team. All Group C counterparts contributed to the collation and assembly of
port environmental data for important ports around the Black Sea, while two members (Dr Boris
Alexandrov and Professor Zaitsev of IBSS) focussed on the provision of risk species distribution data
for the Aegean-Black Sea-Caspian region (including a preliminary list of species arising from the
Odessa PBBS), the expansion and refinement of bioregions for the Black Sea area (Section 3.9), and
the delineation of natural and artificial habitats for the GIS port map (Section 3.7).
4.10 Identification of information gaps
Ballast Water Reporting Forms
Because of the compulsory nature of the BWRFs collection system, as established under a port Order
via Ukrainian State regulations, return rates were high and most forms were sufficiently completed to
provided a working record. Thus the number and status of the BWRFs collected at Odessa during
2001 showed a rapid rise from January to April to a relatively steady monthly plateau, with the initial
period matching the March 2001 application of Order No. 62 of the State Department of Maritime and
Inland Water Transport. Nevertheless considerable work was still required to `salvage' many of the
forms, particularly with respect to claimed or missing BW tank volumes intended for discharge, and
the need to perform cross-checking estimations using the Excel spreadsheet. The most common key
omissions in the Odessa BWRFs (in terms of key records required by the BWRA) were principally:
· `Next Port of Call' often left blank by tankers and some bulk carriers, because the Next Port
is frequently unknown until near or after completion of cargo loading. Since the BWRF is
normally completed and submitted just after arrival, this is essentially a matter of timing
61
Ballast Water Risk Assessment, Port of Odessa, Ukraine, October 2003: Final Report
although not critical to determining BW destinations since the tankers were not uplifting local
BW20;
· Failure to complete the BW Discharge column or provide realistic values for each tank (in
Section 4 of the BWRF);
· Lack of entries for BW Source/s and Uptake Date/s.
The SIPBS is empowered to test all unexchanged (or suspected unexchanged) BW prior to giving
written permission for discharge through the Harbour Master's Office. These samples are tested for
oil, iron and sediment21. If the sample exceeds these limits, the ship has the option of proceeding
beyond territorial limits (~20 kms offshore) to exchange and return with cleaner tank waters, or else
paying a penalty licence for permission to discharge polluted water into the port. The penalty appears
to be based on quantity of BW intended for discharge and its degree of non-compliance. It is very
likely this pollution tax system may be discouraging ship officers to record reliable values for
intended tank discharges on the BWRF, especially if the BWRF is provided prior to the ship
undergoing SIPBS formalities and approval to discharge BW for the purposes of loading cargo.
The following list summarises other omissions or mistakes that are not uncommon in submitted
BWRFs as informally observed at Odessa and also noted at other Demonstration Sites:
· No exchange data in the BW exchange field (Part 4 of the BWRF; Appendix 1), or no reason
given for not undertaking an exchange.
· BWRFS showing BW exchange data contained empty BW source cells (it is important to
enter the source port/location details because exchanges are often well below 95% effective
and never 100%).
· Salinity units sometimes provided in gram/litre but often without unit clarification (e.g. pro-
mil 0, 1%). The need for salinity units was clarified in Ukraine BWRFs produced and
circulated after March 2002.
· Water depth provided in the universally confusing sea height field (actually means wave
height), as a result of the first edition of Ukraine's translated BWRF form requesting sea
depth. This was corrected in BWRFs produced and circulated after March 2002.
· Last country of call provided instead of last port of call (correctable for some cases where the
same error had not occurred in the port's shipping records).
· BW Discharge field left empty or provided with a small number, even by ships loading a full
cargo and therefore discharging most of their ballast.
The above lists highlight the items that port officers should immediately check when collecting or
receiving any BWRF. Unless BWRF guidance is provided and errors corrected, ships' officers,
shipping agents and port officers will not become familiar with and effectively use the BWRF
process. Unless BWRFs are completed accurately and fully by vessels visiting Odessa, a significant
percentage of BW sources and discharge volumes will remain unclear, especially for the Dry
bulk/General Cargo terminal and the Container terminal.
Apart from lack of BWRF familiarity, the time provided for a ships' officer to complete a BWRF is
another factor that can influence the number of mistakes and omissions. BWRFs provided to ships
during their berthing or departure phases cannot be expected to receive the same level attention as
forms already onboard the ship and completed prior to arrival. Thus reporting can be improved if
shipping agents are requested to supply BWRF reminders (and blank forms where necessary) to ships
1-2 days prior to arrival, or to allow time for BWRF reporting after the ship has berthed and obtained
20 Since the tankers were departing with cargo, the high omission rate actually prevented further distortion of the picture of
potential (but unlikely) BW destination ports, as caused by the tankers engaged on regular shuttle runs.
21 To check penalisable ezceedence of the following limits: Oil <0.05mg/l; Iron < 0.05mg/l; Total Suspended Solids
<2mg/l.
62
4 Results
permission to discharge. The former option will reduce the number of completed Next Port of Call
entries, the latter option prevents use of the collected BWRF as an instrument to help assess BW
discharge permission, and/or tank sampling and monitoring.
Even with correctly completed forms, it is often impossible to identify the ultimate destination of any
BW uplifted by a port that receives and analyses BWRFs (Section 3.5). This is important given the
objective of the GloBallast BWRA to identify the destinations of BW uplifted at each Demonstration
Site. In fact some of the GloBallast BWRA objectives required considerable effort searching and/or
deducing the following information, which is not available from the standard BWRFs:
· Destination Port/s where either BW will be discharged or cargo actually offloaded (not
necessarily the Next Port of Call).
· Berth number/location at the reception port (obtained for each Demonstration Site by
laborious cross-checking with port records);
· Deadweight tonnage (DWT). This is very useful for checking claimed BW discharge volumes
(DWTs were eventually obtained for most ships from the Lloyds Ship Register, but this is a
time-consuming task, particularly for ships that had entered a new name, incorrect IMO
number or Call Sign on the BWRF).
It is therefore recommended that IMO Marine Environment Protection Committee (MEPC) review the
standard BWRF with a view to improving its global application under the new BW convention (see
Section 5).
Port environmental and risk species data
It was particularly difficult to obtain reliable environmental information for a port's waters,
particularly for the seasonal water temperature and salinity averages and extrema. This was true for
ports in developed regions (e.g. North America, Europe and Japan) as it was for less developed areas
or where considerable marine research has been undertaken. Most of Odessa's ports are not
exceptions to this finding.
In the case of risk species distribution and status data, many national and regional data sets remain
incomplete and/or unpublished, the former being the case for the Black Sea Mediterranean region
(although the status of knowledge of risk species in the Black Sea is much higher than for most
regions of the world). Many web sites containing list species for North American, Caribbean,
European, Asian or Australasian regions do not clearly separate or identify which species are
historical introductions (e.g. by the oyster aquaculture, fisheries, aquarium industry, sailing ship hulls)
and which are recent (e.g. by ballast water and/or modern hull fouling vectors). Many lists not identify
the most likely vector/s of their listed species.
The problem of obtaining reliable data for port environment comparisons and presence of risk species
needs to remembered when considering the inclusion of more port environment parameters or risk
species factors to provide more sophisticated BWRA calculations. Until regional databases are
established that allow collation and exchange of reliable information, it will be difficult to optimise
the use of trophic condition and specific production coefficients for enhancing the calculation of port
environmental similarity and risk species threat (Section 4.7). Nevertheless, the current overall
situation should not deter further investigations into the use of these parameters for future
assessments, particularly in regions such as the Black Sea where a considerable amount of relevant
data has already been collated.
63
5
Conclusions and Recommendations
The main objectives of the BWRA Activity were successfully completed during the course of this
project, which took 14 months (i.e. between the initial briefing in January 2002 and the final
consultants visit in February 2003). The level of maritime, marine biological and port experience
brought to the project by the Ukrainian counterparts from IACSS, IBSS and members of the CPSO
Ecology Department, facilitated effective instruction and familiarisation of the BWRA system. In
addition, some senior members of the team are hoping the exercise can be repeated for other Ukraine
ports such as Illyichvesk and Yuzhny.
If Ukraine continues to make good progress in the coordinated and strategic use of its agencies which
have expertise and complimenting roles in the various maritime, port, ecological and environmental
health aspects of ballast water management, there is no doubt it can maintain its present regional
leading role in advancing ballast water management. Continuing such projects will enable Ukraine to
provide assistance, technical advice, guidance and encouragement to other port States in the Black
Sea and Ponto-Caspian region, which has become one of the most heavily impacted areas of Europe
in terms of harmful aquatic species introductions, as well as a source of similarly unwelcome and
economically damaging species invasions to parts of Western Europe and a large part of North
America (i.e. the zebra mussel and round goby).
The Regional Strategic Action Plan (SAP) being developed by GloBallast for coordinating BW
management activities in the region provides the best mechanism for replicating the collation analysis
of BWRF data. Important items requiring attention for any future BWRA and BW management
activity in the Black Sea region comprise:
· promotion and dissemination of guidelines and instructions about purpose, value and method
of BWRF reporting to ship's officers, shipping agents and port officers;
· need for more species surveys (PBBSs);
· a lack of reliable harbour water temperature and salinity data for many ports in the region
· provision of a regional web-based database capable of exchanging and updating species and
port survey information.
Apart from port State governments, regional organisations, port authorities and major national
shipping companies in the region should be encouraged to support efforts in the above areas.
Recommendations
· The Ukrainian translation of the BW Reporting Form should be revised in Section 4 column
10 to read "sea height (m)" and column 14 to clarify the choice of salinity units, such as
specific gravity [SG], mg/L and the Ukraine term `pro mil' []).
· To identify the locations where BW is discharged within a port, a more useful BWRF should
include an entry for the berth or terminal name/number (instead of simply `Port' and/or
geographic coordinates, which is usually left blank).
· Modifying the "Last Port of Call" field to provide a "Last Three (3) Ports of Call" question
would assist BWRF verification checking and analysis for part-loaded vessels visiting multi-
use terminals.
· To help decipher and interpret poorly written, incomplete or suspect BWRFs, port and BW
database entry officers should have access to up-to-date copies of the Lloyds Ship Register,
the Fairplay Ports Guide, Lloyd's Maritime Atlas of World Ports or equivalent publications.
For any port using the GloBallast BWRA system, a copy of the world bioregions map should
also be provided to the data-entry officers so that the bioregion of any new port added to the
database can be quickly identified.
64
5 Conclusions and Recommendations
· Any port officer whose duties include collecting or receiving BWRFs should be instructed to
check that all relevant fields have been completed in legible script. A short BWRF
information kit and training course provided to port officers and local shipping agents could
be developed for Ukraine and other Black Sea ports, particularly during the implementation
of any active BW management activity at a port.
· Owing to the large number of possible errors and misinterpretations that can be made with the
existing BWRFs (both IMO and Ukrainian), it must always be remembered that people with a
practical knowledge and good background in port and shipping operations will be far more
easier and cost effective to train for the implementation of BW monitoring and management
activities.
BWRA recommendations and plans by Pilot Country (Ukraine)
· A special BWRF database officer should be appointed by CSPO to work in the port's Ecology
Department, with a specific job duty to orderly check and enter BW records data into the
Access database, from BWRFs collected and collated by Ecology Department personnel. The
experience of the BWRA project at Odessa shows that one officer will be sufficient for this
task, provided this is the main and priority duty. Associated duties should include (a)
occasional BWRF data summaries and reporting to IACSS and CSPO (including error/s
analysis and advice), and (b) BWRF briefing, training and guidance to Ecology Department
Officers, so that they can brief ships' officers and shipping agents with up to date instructions
and guidance on the port's BW reporting requirements.
· A similar staffing position should be provided at any other Ukraine port which implements a
BWRF database and reporting system.
· Because C1 and C2 rely on the accuracy of BWRFs which can be difficult to verify, Ukraine
will promote the development, installation and use by ships of automatic BW monitoring
systems that fix and record the time, place (coordinates) and volume of BW inputs and
outputs, plus the water temperature and salinity.
· The GloBallast BWRA database should be used to help investigate and improve methods for
calculating risk assessment coefficients for BW source ports, including the value and
practicality of (a) obtaining reliable indicators to determine trophic status of port waters, and
(b) adding `specific production' to the risk species descriptions and status factors, as used by
the database for calculating relative species threat.
· To help ensure that any BWRA system can highlight known sources of a previously
introduced harmful species (i.e. a source port or bioregion already established as the definitive
source of an unwanted invader), its procedure and calculations should automatically rank that
port to the highest risk level, irrespective of the influence of C1 and C2.
· Ukraine will encourage and assist all countries in the Black Sea region to organize port
biological baseline surveys and exchange information about introduced species and port
environmental data.
· Ukraine will support the development of a regional database centre for biological invasion
and port environmental and water quality data, as part of a network of centres stemming from
the GloBallast programme. A key task of these centres should be the regular update of
existing information on introduced species in port areas and their impacts, for improving risk
assessment calculations and invasion predictions.
65
6
Location and maintenance of the BWRA System
The GloBallast BWRF hardware and software packages in Odessa are presently maintained at the
Country Focal Point's office in IACSS, which is at the Odessa offices of the State Department of
Maritime and Inland Water Transport (Ukraine Ministry of Transport). The following people are
currently responsible for maintaining and updating the following features of the Odessa BWRA
system in Ukraine:
Port resource mapping and GIS display requirements:
Name:
Mr Roman Bashtannyy
Organisation:
Information and Analytical Centre for Shipping Safety,
State Department of Maritime and Inland Water Transport,
Ministry of Transport of Ukraine
Address:
Post Box 44, Post Office 58, 65058 Odessa, Ukraine
Tel:
+38 (0482) 219 488
Fax:
+38 (0482) 219 483
Email: rabotn@te.net.ua
Web:
www.globallast.od.ua
Ballast water reporting form database at CPSO, Odessa:
Contact person:
Mr Igor Borovskyy
Organization:
Sea Commercial Port of Odessa
Address:
1, Tamozhennaya Sq. 65026 Odessa, Ukraine
Tel:
+380 482 729 46 77
Fax:
+380 482 729 46 77
Port environmental and risk species data:
Name:
Dr Boris Aleksandrov (risk species and biological habitats)
Organisation:
Institute of Biology of Southern Seas Odessa Branch
Address:
37, Pushkinska Str. 65011 Odessa, Ukraine
Tel:
+380 482 25 09 18
Fax:
+380 482 25 09 18
Email: alexandrov@paco.net
Name:
Dr Nikolay Pavlenko (water quality data)
Organisation:
Ukrainian Scientific Centre of Sea Ecology (USCSE)
Address:
89, Frantsuzskyy Blvd, 65009 Odessa, Ukraine.
Tel:
+380 482 63 72 04
Fax:
+380 482 63 72 00
Email: svm47@yandex.ru
66
References
Alexandrov, B.G. & Zaitsev, Yu. P. 1998. Black Sea biodiversity in eutrophication conditions. In:
Conservation of the Biological Diversity as a prerequisite for Sustainable Development in the Black
Sea Region. Kluwer Academic Publ., pp.221-234.
Carlton, J.T. 1985. Transoceanic and interoceanic dispersal of coastal marine organisms: the biology
of ballast water. Oceanography and Marine Biology Annual Review 23: 313-371.
Carlton, J.T. 1996. Biological invasions and cryptogenic species. Ecology 77: 1653-1655.
Carlton, J.T. 2002. Bioinvasion ecology: assessing impact and scale. In: Invasive aquatic species of
Europe: Distribution, impacts and management. (E Leppäkoski, S Gollasch & S Olenin eds). Kluwer
Academic Publishers, Dordrecht, Netherlands, pp. 7-19..
Cohen, A .& Carlton, J.T. 1995. Non-indigenous aquatic species in a United States estuary: a case
study of the biological invasions of the San Francisco Bay and delta. Report to the US Fish &
Wildlife Service (Washington) and the National Sea Grant College Program Connecticut Sea Grant,
December 1995, 211 pp. (from http://nas.nfreg.gov/sfinvade.htm).
Hilliard, R.W., Hutchings, P.A. & Raaymakers, S. 1997a. Ballast water risk assessment for twelve
Queensland ports:, Stage 4: Review of candidate risk biota. Ecoports Monograph Series No. 13. Ports
Corporation of Queensland, Brisbane.
Hilliard, R.W., Walker, S., Vogt, F., Belbin, L. & Raaymakers, S. 1997b. Ballast water risk
assessment for twelve Queensland ports, Stage 3B: Environmental similarity analyses. EcoPorts
Monograph Series No. 12. Ports Corporation of Queensland, Brisbane (two volumes).
Kelleher, G., Bleakley, C. & Wells, S. 1995. A Global representative system of marine protected
areas. The World Bank, Washington DC, USA.
Leppäkoski, E., Gollasch, S. & Olenin, S. 2002. Invasive aquatic apecies of Europe: Distribution,
impacts and management. Kluwer Academic Publishers, Dordrecht, Netherlands. 583 pp.
Williamson, A.T., Bax, N.J., Gonzalez, E. & Geeves, W. 2002. Development of a regional risk
management framework for APEC economies for use in the control and prevention of introduced
marine pests. Final report of APEC Marine Resource Conservation Working Group (MRCWG),
produced by Environment Australia, Canberra. 182 pp.
Zaitsev, Yu. P. & Öztürk, B. 2001. Exotic Species in the Aegean, Marmara, Black, Azov and Caspian
Seas. Publication. No.8, Turkish Marine Foundation, Istanbul. Turk Deniz Arastirmalari Vakfi.
Istanbul.
Zaitsev, Yu. P. & Mamaev, V. 1997. Biological diversity in the Black Sea: A study of change and
decline. UN Publications, New York, 208 pp.
67
APPENDIX 1
Copy of
IMO Ballast Water Reporting Form
from Resolution A.868(20) Appendix 1
(Can be downloaded from http://globallast.imo.org/guidelines)
Appendix 1: Copy of IMO Ballast Water Reporting Form
1
APPENDIX 2
Risk Assessment Team for the
Port of Odessa, Ukraine
Appendix 2: Risk Assessment Team for the Port of Odessa, Ukraine
The BWRA team contained three groups which undertook the GIS mapping (Group A), database
development (Group B) and environmental matching/risk species (Group C) components of the
Activity. The training activities and logistical requirements of the three groups were coordinated by
Mr Igor Borovskyy (Head, Ecology Department, Sea Commercial Port of Odessa), Mr Vladimir
Rabotnyov (Head, Information and Analytical Centre for Shipping Safety (in State Department of
Maritime and Inland Water Transport) and Dr Rob Hilliard (URS Australia Pty Ltd).
Group A (GIS mapping)
Person:
Mr Roman Bashtannyy
Position:
Group A Leader GIS files and BWRA computer system manager
Organization:
Information and Analytical Centre for Shipping Safety, State Department of Maritime
and Inland Water Transport (Ministry of Transport), Odessa.
Email:
rabotn@te.net.ua
Person:
Mr Chris Clarke
Position:
Group A Counterpart Trainer
Organization: Meridian GIS Pty Ltd
Email: chris@meridian-gis.com.au
Person:
Dr Mykola Berlinskyy
Position:
Group A GIS data compilation and cartographer
Organization:
Institute of Biology of Southern Seas, Odessa Branch
Email:
berlinsky@paco.net
Person:
Ms Anna Sukhodolskaya
Position:
Group A GIS data compilation and trainee cartographer
Organization:
Institute of Biology of Southern Seas, Odessa Branch
Group B
Person:
Mr Igor Borovskyy
Position:
Group B Leader BWRF data entry and database management
Organization:
Ecology Department, Commercial Sea Port of Odessa.
Person:
Mr Viktor Khmelevskyy
Position:
Group B Leader BWRF data entry and database management
Organization:
Ecology Department, Commercial Sea Port of Odessa.
Person:
Mr Terry Hayes
Position:
Group B Counterpart Trainer
Organization:
URS Australia Pty Ltd
Email:
perth@urscorp.com
Person:
Mr Sergey Perfiliev
Position:
Group B Port records, port shipping data extraction, BW report forms
Organization: Ecology Department, Commercial Sea Port of Odessa
Person:
Mr Anatoliy Shpakov
Position:
Group B Port records, port shipping data extraction, BW report forms.
Organization: Ecology Department, Commercial Sea Port of Odessa
Person:
Mr Anatoliy Matushko
Position:
Group B Port records, port shipping data extraction, BW report forms.
Organization: Ecology Department, Commercial Sea Port of Odessa
1
Ballast Water Risk Assessment, Port of Odessa, Ukraine, October 2003: Final Report
Group C
Person:
Dr Boris Aleksandrov
Position:
Group C Leader (risk species data collation, regional networking and similarity
analysis)
Organization:
Institute of Biology of Southern Seas, Odessa Branch
Email:
alexandrov@paco.net
Person:
Dr Robert Hilliard
Position:
Group C Counterpart Trainer
Organization:
URS Australia Pty Ltd
Email:
robert_hilliard@urscorp.com.au
Person:
Dr Nikolay Pavlenko
Position:
Group C port environment data collation, environmental similarity analysis
Organisation:
Ukrainian Marine Environment Scientific Centre, Odessa
Email:
svm47@yandex.ru
Person:
Dr Vladimir Sidenko
Position:
Group C planktonic risk species data collation
Organisation:
Institute of Transport Medicine, Ministry of Public Health of Ukraine, Odessa
Email:
med_trans@paco.net
Person:
Prof Yuvenaly Zaitsev
Position:
Group C habitats description in port and adjacent areas, risk species data collection
Organisation:
Institute of Biology of Southern Seas, Odessa Branch
Email:
yu.zaitsev@paco.net
Project Manager
Steve Raaymakers
Programme Coordination Unit
International Maritime Organization
sraaymak@imo.org
http://globallast.imo.org
2
.
APPENDIX 3
Check-list of project requirements
circulated at initial briefings in January 2001
(during 3rd GPTF meeting, Goa)
Appendix 3: Check-list of project requirements circulated at initial briefings in January 2001 (during 3rd GPTF meeting, Goa)
PROJECT REQUIREMENTS AND PROVISIONAL SCHEDULE
REMINDER AND CHECK LIST FOR CFP/CFP-A
(1)
Confirm your availability of adequate PC hardware, + Windows, Access & peripherals
At least one PC with sufficient processor speed, memory, Windows software and peripherals must be
dedicated to the project (plus full-time use during the two visits by the URS Team).
PC Capability: - at least 600 MHz Processor speed
- at least 10 GB of Hard Disk capacity
- at least 128 MB RAM
- 3D Graphics Card with 16 MB of RAM
- x24 speed CD-ROM drive
- 21" 16-bit high-colour Monitor (XVGA or higher)
- a 10/100 base Network Card and 56k modem.
PC Software: OS: at least MS Windows 98 (preferably higher).
MS Access: This database program is usually bundled inside MS Office 97 (Business
Edition), Office Pro; Office 2000; etc. Please check with your IT people if unsure.
MS Word, MS Excel, MS PowerPoint.
PC Peripherals: Convenient access to following peripherals for convenient data inputs and outputs:
- B/W laser printer (>8 pages per minute);
- A3 or A4 colour printer;
- CD Burner
- Flatbed scanner and digitising board
- Semi-auto or auto-archiving system, such as external Zip-Drive, Tape Drive or
LAN servers. This is essential for protecting databases from accidental erasures,
hard drive crashes, system failures, office fire, burglary, etc.
(2)
Identify Your BWRA Project Team (10 people recommended):
Required Pilot Country Counterparts
PCU Consultants
BWRA project team leader
Consultants team leader
PC system and GIS operator (x2)
GIS and database specialist
MS Access database operator (x2)
BWRF and shipping record manager (x2)
Shipping record & port data specialist
Port environmental data searcher (x2)
Environmental similarity analyst (x2)
BWRA specialist
Risk species networker / biologist
NB: when selecting team members, please note training will be conducted in English.
1
Ballast Water Risk Assessment, Port of Odessa, Ukraine, October 2003: Final Report
(3)
Check all existing Port GIS, Coastal Resource Atlas, Electronic Charts/Digital
Databases [refer to Briefing Paper - GTPF Agenda Item 4 [BWRA Action Required], and the
consultants questionnaire provided at Goa (please complete and return a copy)
(4)
Confirm Dates and Local Arrangements for first consultants visit.
Provisional Dates for 1st Visit (5 working days)
Monday 25 February- Friday 1 March 2002
Odessa, Ukraine
Saturday 2 March- Thursday 7 March 2002
Tehran/Khark Is, I.R. Iran
Monday 11 March- Friday 15 March 2002
Mumbai/Goa, India
Monday 25 March - Friday 29 March 2002
Saldahna, South Africa
Monday 1 April- Friday 5 April 2002
Sepetiba, Brazil
Tuesday 9 April- Saturday 14 April 2002
Dalian, China
Logistics:
Assistance required for visa applications?
Customs clearance required for importation of computer software?
Local transport / work location / office facilities / accommodation
1st Visit Activities:
·
Install and test the ArcView 3.2 GIS package, and the Primer 5 statistical package;
·
Commence GIS training by digitising the port map (from any existing digital files, paper charts,
maps, habitat information, articles, publications, aerial photos, etc);
·
Review all data collated by Country Project Team, including existing databases. Set up the Access
database for ship arrival records and the IMO BWRF. Commence training on the Graphic User
Interfaces for BWRF inputs
·
Collate and review pre-IMO BWRF shipping records to determine source and destination ports,
vessel types and trading patterns.
·
Review available port environmental data and potential sources of same (see Attachment)
·
Commence assembling the risk species list (locate and commence networking with marine
biologists in your country and region).
·
Identify the critical information gaps.
·
Identify the data collating and input work to be completed before the 2nd Visit.
·
Agree on a provisional date for start of 2nd Visit (10 working days).
2nd Visits (10 work days). Complete port map digitising; install bioregional map; complete and add
risk species to database; perform environmental similarity analysis; undertake risk assessment;
evaluate results; review and reporting.
Environmental Data Requirements - see next page, attached.
2
Appendix 3: Check-list of project requirements circulated at initial briefings in January 2001 (during 3rd GPTF meeting, Goa)
ATTACHMENT
TYPES OF ENVIRONMENTAL DATA FOR PORT SIMILARITY ANALYSIS
The project requires two types of port environmental data:
(A) Charts and marine habitat and resources data are required for the GIS Port Map, and
(B) A range of parameters (measured in or near port) for the Environmental Similarity Analysis.
In the case of the quantitative parameters, these include:
·
Mean water temperature during the summer [monsoon] season (oC)
·
Maximum water temperature at the hottest time of the summer [monsoon] season (oC)
·
Mean water temperature during the winter [dry] season (oC)
·
Minimum water temperature at the coldest time of the winter [dry] season (oC)
·
Mean day-time air temperature recorded in summer [monsoon] season (oC)
·
Maximum day-time air temperature recorded in summer [monsoon] season (oC)
·
Mean night-time air temperature recorded in winter [dry] season (oC)
·
Minimum night-time air temperature recorded in winter [dry] season (oC)
·
Mean water salinity during the wettest period of the year (grams/litre; ppt)
·
Lowest water salinity at the wettest time of the year (grams/litre; ppt)
·
Mean water salinity during the driest period of the year (grams/litre; ppt).
·
Highest water salinity at the driest time of the year (grams/litre; ppt).
·
Mean Spring Tidal range (metres)
·
Mean Neap Tide range (metres)
·
Total rainfall in the port's driest 6 months season (millimetres)
·
Total rainfall in the port's wettest 6 months season (millimetres)
·
Number of months accounting for 75% of total annual rainfall (=duration of peak discharges)
·
Number of kilometres from the berths to the nearest river mouth (negative value if upstream)
·
Size of this river's catchment (square kilometres)
[Categorical variables are also required, but these are easy to obtain from charts, maps, articles,
etc]
3
.
APPENDIX 4
Information sources used for collating
Port Environmental Data
Appendix 4: Information sources used for collating Port Environmental Data
Continued over...
1
Ballast Water Risk Assessment, Port of Odessa, Ukraine, October 2003: Final Report
2
APPENDIX 5
Sources and references of
Risk Species information
Appendix 5: Sources and references of Risk Species information
1
Furlani, D (1996). Guide to Introduced Species, CSIRO Marine Research, Hobart, Tasmania (folder-file
format).
2
McClary DJ & Nelligan RJ, 2001. Alternate Biosecurity Maangement Tools for Vector Threats: Technical
guidelines for Acceptable Hull Cleaning Facilities. Research Report No. ZBS 2000/03, prepared by Kingett
Mitchell & Associates for New Zealand Ministry of Fisheries, September 2001. 29 pp.
2a M. Shaffelke, cited in McClary DJ & Nelligan RJ (2001). [see reference 2]
3
Cohen AN & Carlton JT (1995). Biological study: Non-indigenous aquatic species in a united States
estuary: a case study of the biological invasions of the San Francisco Bay and Delta. US Fisheries &
Wildlife National Sea Grant College Program Report PB96-168525. Springfield Virginia, USA.
http://nas.er.usgs.gov/publications/sfinvade.htm
4
Pollard DA & PA Hutchings (1990a,b). A review of exotic marine organisms introduced to the Australian
region. I. Fishes (a); and II. Invertebrates and Algae (b). Asian Fisheries Science 3: 205-222 (a) and 223-
250 (b).
4a Wallaston 1968 and Wommersley 1981, cited in Pollard D & Hutchings PA (1990). [see reference 4]
4b Skinner & Womersley 1983, cited in Pollard D & Hutchings PA (1990). [see reference 4]
4c Allen (1953) - cited in Pollard D & Hutchings PA (1990). [see reference 4]
5
Australian NIS lists compiled by CSIRO-CRIMP (1997); CCIMPE (2001); SSC/SCFA (2000)[see reference
23]
6
Hutchings PM, Van Der Velde J & S Keable (1989). Baseline survey of the benthic macrofauna of Twofold
Bay, NSW, with a discussion of the marine species introduced into the bay. Proceedings of the Linnaean
Society of New South Wales 110 (4): 339-367.
6a Baker, cited by Hutchings et al (1989). [see reference 6]
7
Australian Coral Reef Society (1993). A Coral Reef Handbook (3rd Edition). Surrey Beatty & Sons Pty Ltd,
Chipping Norton NSW, 264 pp.
8
Coles SL, DeFelice RC, Eldredge LG and JT Carlton (1997) Biodiversity of marine communities in Pearl
Harbor, Oahu, Hawaii with observations on introduced exotic species. Bernice Pauahi Bishop Museum
Technical Report No. 10: 1-76
9
Dakin WJ (1976). Australian Seashores (Australian Natural Science Library Edition). Angus & Robertson,
Sydney, 372 pp.
10 Carlton JT (1985). Transoceanic and Interoceanic Dispersal of Coastal Marine Organisms: The Biology of
Ballast Water. Oceanogr. Mar. Biol. Ann. Rev. 23: 313-371.
11 Boyd S, Poore GCB & RS Wilson (1996). Macrobenthic invertebrates of soft sediments in Port Phillip Bay:
Introduced Species. Unpubl. report to CSIRO-CRIMP by Museum of Victoria, Melbourne, 7-96. 122 pp.
12 Gosliner TM, Behrens DW & Williams GC (1996). Coral Reef Animals of the Indo-Pacific - Animal life from
Africa to Hawaii exclusive of vertebrates. Sea Challengers, Monterey CA, 314 pp.
13 Wells FE & C Bryce (1988). Seashells of Western Australia (Revised Edition). Western Australian
Museum, Perth. 207 pp.
14 Tan LWH & PKL Ng (1988). A guide to the seashore of Singapore. Singapore Science Centre, Singapore,
159 pp.
15 Wells FE & RN Kilburn, 1986. Three temperate-water species of South African gastropods recorded for the
first time in southwestern Australia. Veliger 28(4): 453-456.
16 Gosliner TM (1987). Guide to the nudibranchs (opisthobranch molluscs) of Southern Africa. Sea
Challengers and Jeff Hamann. Monterey.
17 Wasson & Shepherd (1995): cited in Cohen & Carlton (1995) [see reference 3].
18 Middleton MJ (1982). The oriental goby, Acanthogobius flavimanus (Temminck and Schlegel), an
introducedfish in the coastal waters of New South Wales, Australia. J. Fish Biology 21: 513-523.
19 In: Leppäkoski E, Gollasch S. & S Olenin (eds) (2002). Invasive aquatic apecies of Europe: Distribution,
impacts and management. Kluwer Academic Publishers, Dordrecht. 583 pp.
20 Morton, B (1981). Biology and functional morphology of Mytilopsis sallei (Recluz) (Bivalvia: Dreissenacea)
fouling Visakhapatnam Harbour, Andra Pradesh, India. Journal of Molluscan Studies 47: 25-42.
21 Gollasch, S (2002). Importance of ship hull fouling as a vector of species introductions into the North Sea.
Biofouling 18: 105-121.
22 Hass CG & DS Jones (1999). Marine introductions to western Australia, with a focus on crustaceans. In:
Kesby JA, Stanley JM, McLen RF & Olive LJ (eds). Geodiversity: Readings in Australian Geography at the
close of the 20th Century. Special Publication Series No. 6, School of Geography & Oceanography,
University College, Australian Defence Force Academy, Canberra ACT. pp. 37-44.
23 Environment Australia (2000). Joint SCC-SCFA Report of the National Taskforce on the Prevention and
Management of Marine Pest Incursions (October 2000 edition). Environment Australia, Canberra,
Australia.
24 Domingues Rodrigues M & AI Brossi Garcia (1989). New records of Pachygrapsus gracilis (Saussure,
1858) in the Brazilian Littoral. Ciene Cult San Paulo 41: 63-66.
1
Ballast Water Risk Assessment, Port of Odessa, Ukraine, October 2003: Final Report
25 Dadon JR (1984). Distribution and abundance of Pteropoda: Thecostomata (Gastropoda) in the
Southwestern Atlantic. Physis (Buenos Aires) 42: 25-38.
26 Christeffersen ML (1980). Is Alpheus heterochaelis Say (Crustacea, Decapoda, Alpheidae) found along the
Brazilian coasts? Review Nordestina Biology 3: 236-237.
27 Galil B & C Golani (1990). Two new migrant decapods from the Eastern Mediterranean. Crusteceana 58:
229-236.
28 Hanna GD (1966). Introduced molluscs of western North America. Occasional Papers of Californian
Academy of Science 48: 1-108.
29 Yoloye V (1976). The ecology of the West African Bloody cockle, Anadara (Senilia) senilis (L.). Bulletin of
the Institute Portdam Africique Noire (Series A) 38: 25-56.
30 Jones DS (1992). A review of Australian fouling barnacles. Asian Marine Biology 9: 89-100.
31 Wang JJ & ZG Huang (1993). Fouling polychaetes of Hong Kong and adjacent waters. Asian Marine
Biology 10: 1-12.
32 Arakawa KY (1980). On alien immigration of marine sessile invertebrates into Japanese waters. Marine
Fouling 2: 29-33.
33 Carlton J (1999). Molluscan invasions in marine and estuarine communities. Malacologia 41(2): 439-454.
34 Griffiths CL, Hockey PAR, Van Erkom Shurink C & PJ Le Roux (1992). Marine invasive aliens on South
Africa's shores: implications for community structure and trophic functioning. South African Journal of
Marine Science 12: 713-722.
35 Wang C (1995). Some introduced molluscas [sic] in China. Sinozoologia 12: 181-191 (in Chinese).
36 Cranfield HJ, et al (1998). Adventive marine species in New Zealand. National Institute of Water and Air
Research (NIWA) Technical Report 34, Auckland, New Zealand, 48 pp.
37 Dineen J, 2001. Exotic species reports for Indian River Lagoon, Florida. Smithsonian Fort Pierce website:
http://www.serc.si.edu
38 J Mackie, 2001. Bryozoans at Port of Geraldton, with notes on taxonomy and distribution. In: Geraldton
Port Survey. Unpublished report to Geraldton Port Authority by the Western Australian Museum, Perth,
August 2001.
39 Wonham MJ, Carlton JT, Ruiz GM & LD Smith (2000). Fish and ships: relating dispersal frequency to
success in biological invasions. Marine Biology 136: 1111-1121.
40 NIS data for Angola; supplied by Adnan Adawad (GloBallast Programme, Cape Town, South Africa:
adawad@mcm.wcape.gov.za).
41 Dr Tamara Robertson, University of Cape Town (pers. comm.; August 2002).
42 Gollasch, S. & Griffiths, C (2000). Case studies of introduced species in South African waters prepared for
the GloBallast Programme. Report prepared for Globallast Programme; available from Adnan Adawad
(GloBallast Programme, Cape Town, South Africa: adawad@mcm.wcape.gov.za).
43 Draft provisional species list (9/02) from the Saldanha Bay Port Baseline Biological Survey (supplied by
Adan Adawad (GloBallast Programme, Cape Town, South Africa): adawad@mcm.wcape.gov.za)
44 NIS data for Tanzania; supplied by Adnan Adawad (GloBallast Programme, Cape Town, South Africa:
adawad@mcm.wcape.gov.za).
45 NIS data for Mauritius; supplied by Adnan Adawad (GloBallast Programme, Cape Town, South Africa:
adawad@mcm.wcape.gov.za).
46 NIS data for Mozambique; supplied by Adnan Adawad (GloBallast Programme, Cape Town, South Africa:
adawad@mcm.wcape.gov.za).
47 GloBallast Programme (2002). List of Alien Species. http://www.globallast.org
48 Williamson AT, Bax NJ, Gonzalez E & W Geeves (2002). Development of a regional risk management
framework for APEC economies for use in the control and prevention of introduced marine pests. Final
report of APEC Marine Resource Conservation Working Group, produced by Environment Australia,
Canberra. 182 pp.
49 Walters S, 1996. Ballast water, hull fouling and exotic marine organism introductions via ships - a Victorian
study. Environment Protection Authority of Victoria, Publication 494 (May 1996).
50 Pitcher, G (1998). Harmful algal blooms of the Benguela current. Colour publication available from Sea
Fisheries Research Institute (Private Bag X2, Rogge Bay 8012), Cape Town, Republic of South Africa (20
pp).
51 Benson AJ, Williams JD, Marelli DC, Frischer ME & Danforth JM, 2002. Establishment of the green
mussel, Perna viridis, on the West Coast of Florida. In: Proceedings of 11th International Conference of
Aquatic Invasive species (Feb 25 to March 1, 2002, Washington DC). nvironment Department, US Army
Engineer & Research Development Laboratory, US.
52 Platvoet D, Dick JTA & DW Kelly (2002). Comparative morphometrics of mouthparts and antennae in the
invasive Dikerogammeros villosus and the native Gammarus duebeni (Crustacea, Amphipoda). In:
Proceedings of 11th International Conference of Aquatic Invasive species (Feb 25 to March 1, 2002,
Washington DC). Environment Department, US Army Engineer & Research Development Laboratory, US.
2
Appendix 5: Sources and references of Risk Species information
53 Strong JA (2002). Faunal and habitat comparisons from under and outside canopies of Sargassum
muticum. In: Proceedings of 11th International Conference of Aquatic Invasive species (Feb 25 to March
1, 2002, Washington DC). Hosted by Environment Department, US Army Engineer & Research
Development Laboratory.
54 Verween A (2002). Economic impact of biofouling control of an exotic bivalve, Mytilopsis leucophaeta, in
the harbour of Antwerp, Belgium. In: Proceedings of 11th International Conference of Aquatic Invasive
species (Feb 25 to March 1, 2002, Washington DC). Environment Department, US Army Engineer &
Research Development Laboratory, US.
55 Perry HM, Lukens R, et al, 2002. Invasive species and implications for fisheries sustainability in the Gulf of
Mexico. In: Proceedings of 11th International Conference of Aquatic Invasive species (Feb 25 to March 1,
2002, Washington DC). Environment Department, US Army Engineer & Research Development
Laboratory, US.
56 Makarewicz, JC (2002). Distribution, fecundity, genetics and invasion routes of Cercopafis pengoi
(Ostroumov) - a new exotic zooplankter in the Great Lakes Basin. In: Proceedings of 11th International
Conference of Aquatic Invasive species (Feb 25 to March 1, 2002, Washington DC). Hosted by
Environment Department, US Army Engineer & Research Development Laboratory.
57 Bauer CR & Lamberti GA (2002). Potential interactions between Eurasian Ruffe and Round Gobies in the
Great Lakes: Prey and habitat differences. In: Proceedings of 11th International Conference of Aquatic
Invasive species (Feb 25 to March 1, 2002, Washington DC). Environment Department, US Army Engineer
& Research Development Laboratory. US.
58 Darrigran G et al (2002). Abundance and distribution of golden mussel (Limnoperna fortunei) larvae in a
hydroelectric plant in South America. In: Proceedings of 11th International Conference of Aquatic Invasive
species (Feb 25 to March 1, 2002, Washington DC). Environment Department, US Army Engineer &
Research Development Laboratory, US.
59 Personal communications and manuscripts supplied by Dr Andrea Junqueira, Dr Flavio Fernandes, Dr
Luciano Felicio Fernandes , Dr Luis Proenca during BWRA workshop at FEEMA, Rio de Janeiro (30
August 2002).
60 Fernandes, LF et al (2001). The recently established diatom Coscinodiscus wailesii in Brazilian waters:
taxonomy and distribution. Phycological Research 2001.
61 Paula, A,F (2002). Spatial abundance and distribution of invading coral Tubastraea in Ilha Grande Bay
(RJ) and record of T. tagusensis and T. coccinea in Brazil. M.Sc thesis, State University of Rio de Janeiro,
May 2002.
62 Translated material provided by Assoc Prof. (Biol.) Wang Lijun and Mr Jiang Yuewen (National Marine
Environment Protection & Monitoring Centre, State Administration of Oceanography (Dalian Office), China
(including preliminary lists of identified species sampled by Port Baseline Biological Survey for Dalian
(GloBallast Programme); September 2002).
63 Anil AC, Venkat K, Sawant SS, Dileepkumar M, Dhargalkar VK, Ramaiah N, Harkantra SN & ZA Ansari
(2002). Marine bioinvasions: Concern for ecology and shipping. Current Science 83(3): 214-218.
64 K Satyanarya Rao (2002). Proceedings of 1st R&D Seminar, Global Ballast Water Management
Programme. National Institute of Oceanography, Goa, India. June 2002.
65 National Institute of Oceanography (2001). Report released to mass-media (from Dr AC Anil, NIO, Goa).
66 Xu, CY (1982). Surveys on the causal organisms of red tides in Dalian Bay. Journal of Fisheries, China
6(2): 173-180 (in Chinese).
67 Iizuka S (1976). Succession of red tide organisms in Omura Bay with relation to water pollution. Bulletin of
the Plankton Society of Japan 23(1): 31-43 (in Japanese).
68 Kuriakose PS (1980). Mussels (Genus Perna) of the Indian coast. In: Coastal aquaculture of mussels -
Progress and Prospects. Central Marine Research Fisheries Institute (Cochin, India).
69 Thompson MF (1994). Recent developments in biofouling control. Oxford & IBH Publishing Co, Pty Ltd,
UK.
70 National Institute of Oceanography: Bryozoan Identifications (volume provided by Dr AC Anil, NIO, Goa,
India)
71 Zaitsev Y & B Ozturk (2001). Exotic Species in the Aegean, Marmara, Black, Azov and Caspian Seas.
Publication No.8, Turkish Marine Foundation, Istanbul. Turk Deniz Arastirmalari Vakfi. Istanbul.
72 CIESM Atlas of Introduced Species in Mediterranean Sea (2002). http://www.ciesm.org/atlas
73 McMinn, A (1990). Recent dinoflagellate cyst distribution in eastern Australia. Review of Paleobotany and
Palynology 65: 305-310.
74 Karunasagar I, Gowda HSV, Subburaj M, Venugopal MN & I Karunasagar (1984). Outbreak of paralytic
shellfish poisoning in Mangalore, west coast of India. Current Science 53(5): 247-249.
75 Yoon YH et al (1991). Red tide organisms in the coastal waters of Cheju Island, southern Korea. Bulletin of
Marine Research Institute, Cheju National University 15: 1-14.
76 Pillai CSG & Jasmine S (1991). Life cycle of Perna indica. In: Symposium on tropical marine living
resources, Cochin, Kerala (india), 12-16 January 1988. J. Mar Biol. Association India 33(1-2): 159-165.
3
Ballast Water Risk Assessment, Port of Odessa, Ukraine, October 2003: Final Report
77 Coles SL, DeFelice RC & LG Eldredge (1999). Nonindigenous marine species introductions in the harbors
of the south and west shores of Oahu, Hawaii. Bishop Museum Technical Report No. 15 (Bernice Pauahi
Bishop Museum, Honolulu, Hawaii).
78 Coles SL, DeFelice RC, Eldredge LG & JT Carlton (1999). Historical and recent introductions of non-
indigenous marine species into Pearl Harbor, Oahu, Hawaiian Islands. Marine Biology 135:147-158.
79 Coles SL, DeFelice RC & D Minton (2001). Marine species survey of Johnston Atoll, Central Pacific
Ocean, June 2000. Bishop Museum Technical Report No. 19 (Bernice Pauahi Bishop Museum, Honolulu,
Hawaii).
80 DeFelice RC, Coles SL, Muir D & LG Eldredge (1998). Investigation of marine communities at Midway
Harbor and adjacent lagoon, Midway Atoll, north western Hawaiian Islands. Bishop Museum Hawaiian
Biological Survey Contribution No. 1998-014 (Bernice Pauahi Bishop Museum, Honolulu, Hawaii).
81 Hewitt C (2002). Distribution and biodiversity of Australian tropical marine bioinvasions. Pacific Science
56(2): 213-222.
82 Coles SL & LG Eldredge (2002). Nonindigenous species introductions on coral reefs: a need for more
information. Pacific Science 56(2): 191-209.
83 Hoedt FE, Choat JH, Collins J & JJ Cruz (2000). Mourilyan Harbour and Abbot Point surveys: Port
baseline surveys for introduced marine pests. Unpubl. report to Ports Corporation of Queensland
(Brisbane). School of Marine Biology & Aquaculture, James Cook University, Townsville
84 Choo PS, 1994. A Review on Red Tide Occurrences in Malaysia. Department of Fisheries, Ministry of
Agriculture, Kuala Lumpur, Malaysia.
85 Southward AJ, Burton RS, Coles SL, Dando PR, DeFelice R, Hoover J, Newman WA, Parnel E,
Yamaguchi (1998). Invasion of Hawaiian inner shores by an Atlantic barnacle. Marine Ecology Progress
Series 165:119-126.
86 Nichols FH, Thompson JK & LE Schemel (1990). Remarkable invasion of San Francisco Bay (California,
USA) by the Asian clam Potamocorbula amurensis. II. Displacement of a former community. Marine
Ecology Progress Series 66: 95-101.
87 Pyne R (1999). The black-striped mussel (Mytilopsis sallei) infestation in Darwin: clean-up strategy. In:
EcoPorts Monograph Series No.19 (77-83). Ports Corporation of Queensland, Brisbane.
88 Culver, CS (2000). Apparent eradication of a locally established introduced marine pest. Biological
Invasions 2 (3): 245-253.
89 Fofonoff PW, Ruiz GM, Hines AH & L McCann (1999). Overview of biological invasions in the Chesapeake
Bay region: summary of impacts on coonservation of biological diversity: a key to the restoration of the
Chesapeake Bay and beyond. Monograph. Maryland Department of Natural Resources, pp.168-180.
90 Veldhuizen TC & S Stanish (1999). Overview of the Life History, Distribution, Abundance, and Impacts of
the Chinese mitten crab, Eriocheir sinensis. Environmental Studies Office, California Department of Water
Resources, Sacramento, CA 95816. March 1999.
91 NTMAG & CSIRO, 2000. Port survey of introduced marine species., Port of Darwin. Unpublished report
provided by Dr Barry Russel, Museum & Art Gallery of the Northern Territory, Darwin, Northern Territory,
Australia.
92 Faunce CH and Lorenz JJ (2000) Reproductive biology of the introduced Mayan cichlid, Cichlasoma
urophthalmus, within an estuarine mangrove habitat of southern Florida. Environmental Biology of Fishes
58: 215225.
93 Zhang F & M Dickman (1999). Mid-ocean exchange of container vessel ballast water. 1: Seasonal factors
affecting the transport of harmful diatoms and dinoflagellates. Marine Ecology Progress Series 176:243-
251.
94 Harris LG & MC Tyrell (2001). Changing Community States in the Gulf of Maine: Synergism Between
Invaders, Overfishing and Climate Change. Biological Invasions 3 (1): 9-21.
95 Crooks JA & CA Jolla (2001). Assessing invader roles within changing ecosystems: historical and
experimental perspectives on an exotic mussel in an urbanized lagoon. Biological Invasions 3 (1): 23-36.
96 In: Raaymakers S (Ed.) (2002). Baltic regional workshop on ballast water management, Tallinn, Estonia.,
22-24 October 2001: Workshop report. GloBallast Monograph Series No.2. IMO, London.
97 Gosling EM (1992). Systematics and geographic distribution of Mytilus. In: Gosling EM (Ed.) The Mussel
Mytilus: Ecology, Physiology, Genetics and Culture. Elsevier Press, Netherlands.
98 In: Raaymakers S & C Gregory (Eds) (2002). 1st East Asia regional workshop on ballast water control and
management, Beijing, China. 31 Oct 2 Nov 2002: Workshop report. GloBallast Monograph Series No.6.
IMO, London.
99 Eno NC, Clark RA & Sanderson WG (Eds). Directory of non-native marine species in British waters.
http://www.jncc.gov.uk/marine/dns/default.htm
100 Oderbrecht et al (2002).
101 Ports & Shipping Organisation (2002). Species tables. In: Draft report of seasonal Port Baseline
Biological Surveys for Port of Khark Island. Unpublished manuscript provided by PSO, Tehran, I.R. Iran.
4
Appendix 5: Sources and references of Risk Species information
102 Introduction to non-indigenous species of the Gulf of Mexico (2002). Website:
http://www.gsmfc.org/nis/nis/Perna_perna.html
103 Erkki Leppäkoski E & S Olenin (2000). Non-native species and rates of spread: Lessons from the brackish
Baltic Sea. Biological Invasions 2 (2):151-163.
104 Ambrogi AO (2000). Biotic invasions in a Mediterranean lagoon. Biological Invasions 2 (2): 165-176
105 Galil BS (2000). A sea under siege alien species in the Mediterranean. Biological Invasions 2 (2):177-
186
106 Mann, R (2000). Invasion of the North American atlantic coast by a large predatory Asian mollusc
Biological Invasions 2(1): 7-22
107 Lohrer AM, Whitlatch RB, Wada K & Y Fukui (2000). Home and away: comparisons of resource utilization
by a marine species in native and invaded habitats. Biological Invasions 2 (1):41-57
108 Wasson, K & B Von Holle (2000). Detecting invasions of marine organisms: Kamptozoan case histories.
Biological Invasions 2(1): 59-74.
109 Rivest BR, Coyer J, Haren AA & S Tyler (1999). The first known invasion of a free-living marine flatworm.
Biological Invasions 1(4): 393-394
110 E x o t i c s p e c i e s l i s t o f t h e M o n t e r e y B a y N a t i o n a l M a r i n e S a n c t u a r y .
http://bonita.mbnms.nos.noaa.gov/sitechar/spex.html
111 F A O d a t a b a s e o n a q u a t i c s p e c i e s i n t r o d u c t i o n s :
http://www.fao.org/waicent/faoinfo/fishery/statist/fisoft/dias/index.htm
112 Global Invasive Species Program (GISP): http://jasper.stanford.edu/GISP/ and GISP Database:
http://www.issg.org/database/welcome/
113 Group on Aquatic Alien Species (GAAS) (Russia): http://www.zin.ru/projects/invasions/index.html
114 Gulf of Maine Ballast Water and Exotic Species Web Sites: http://www.gulfofmaine.org/library/exotic.htm
115 Gulf of Mexico Program Nonindigenous Species Information: http://pelican.gmpo.gov/nonindig.html
116 Smithsonian Environmental Research Center (SERC marine invasions lab): http://invasions.si.edu/
117 Ecological Society of Japan (Ed.) (2002). Handbook of alien species in Japan. (published 9/02).
Chijinchokan Ltd, Tokyo (in Japanese). 390pp. http://www.chijinshokan.co.jp
118 Fine M, Zibrowius H & Y Loya (2001). Oculina patagonica: a non-lessepsian scleractinian coral invading
the Mediterranean Sea. Springer-Verlag (New York):
http://linl.springer-ny.com/link/service/journals/00227/contents/01/00539/
119 Schaffelke B, Murphy N & S Uthicke (2002). Using genetic techniques to investigate the sources of the
invasive alga Caulerpa taxifolia in three new locations in Australia. Mar Poll Bull 44: 204-210.
120 Washington State Sea Grant Program: Non-indigenous aquatic species:
http://www.wsg.washington.edu/outreach/mas/nis/nis.html
121 Baltic Research Network on invasions and introductions (NEMO). Website:
http://www.ku.lt/nemo/mainnemo.htm
122 US Geological Service non-indigenous aquatic species (NIAS) website:
http://nas.er.usgs.gov/
123 National aquatic nuisance species clearing house - Seagrant Program:
http://www.entryway.com/seagrant/
124 Esmaili Sari A, Khodabandeh S, Abtahi B, Sifabadi J & H Arshad (2001). Invasive comb jelly Mnemiopsis
leidyi and the future of the Caspian Sea. Faculty of Natural Resources and Marine Sciences, University of
Tarbiat Modarres. Kor, Mazandaran, IR Iran. ISBN: 964-91086-2-9. (+95 pp; non-English). Obtainable
from: yavarivahid@hotmail.com ; yavari@ir-pso.com .
125 Cohen BF, Heislers S, Parry GD, Asplin MD, Werner GF & JE Restall (2002). Exotic marine pests in the
outer harbour of the Port of Adelaide. Marine and Freshwater Resources Institute of Victoria (Report No.
40), MAFRE, Queenscliffe, Victoria, Australia. (9/02; 86pp.).
5
APPENDIX 6
Name, UN code, coordinates and environmental
parameters of the 357 ports used for the multivariate
similarity analyses for all Demonstration Sites
Appendix 6: Name, UN code, coordinates and environmental parameters
1
Ballast Water Risk Assessment, Port of Odessa, Ukraine, October 2003: Final Report
2
Appendix 6: Name, UN code, coordinates and environmental parameters
3
Ballast Water Risk Assessment, Port of Odessa, Ukraine, October 2003: Final Report
4
Appendix 6: Name, UN code, coordinates and environmental parameters
5
Ballast Water Risk Assessment, Port of Odessa, Ukraine, October 2003: Final Report
6
Appendix 6: Name, UN code, coordinates and environmental parameters
7
Ballast Water Risk Assessment, Port of Odessa, Ukraine, October 2003: Final Report
8
Appendix 6: Name, UN code, coordinates and environmental parameters
9
Ballast Water Risk Assessment, Port of Odessa, Ukraine, October 2003: Final Report
10
Appendix 6: Name, UN code, coordinates and environmental parameters
11
Ballast Water Risk Assessment, Port of Odessa, Ukraine, October 2003: Final Report
12
Appendix 6: Name, UN code, coordinates and environmental parameters
13
Ballast Water Risk Assessment, Port of Odessa, Ukraine, October 2003: Final Report
14
APPENDIX 7
Consultants' Terms of Reference
Appendix 7: Consultants' Terms of Reference
Consultants' Terms of Reference
Activity 3.1: Ballast Water Risk Assessments
6 Demonstration Sites
1. Introduction & Background
The International Maritime Organization (IMO), with funding provided by the Global Environment
Facility (GEF) through the United Nations Development Programme (UNDP), has initiated the Global
Ballast Water Management Programme (GloBallast).
This programme is aimed at reducing the transfer of harmful marine species in ships' ballast water, by
assisting developing countries to implement existing IMO voluntary guidelines on ballast water
management (IMO Assembly Resolution A.868(20)), and to prepare for the anticipated introduction
of an international legal instrument regulating ballast water management currently being developed by
IMO member countries.
The programme aims to achieve this by providing technical assistance, capacity building and
institutional strengthening to remove barriers to effective ballast water management arrangements in
six initial demonstration sites. These six sites are Sepetiba, Brazil; Dalian, China; Mumbai, India;
Kharg Island, Iran; Saldanha, South Africa and Odessa, Ukraine. The initial demonstration sites are
intended to be representative of the six main developing regions of the world, as defined by GEF.
These are respectively, South America, East Asia, South Asia, Middle East, Africa and Eastern
Europe. As the programme proceeds it is intended to replicate these initial demonstration sites
throughout each region.
2. The Need for the Risk Assessments
The development objectives of the programme are to assist countries to implement the existing IMO
voluntary ballast water management guidelines and to prepare for the introduction of a new
international legal instrument on ballast water.
The current IMO ballast water management guidelines offer states significant flexibility in
determining the nature and extent of their national ballast water management regimes. This flexibility
is warranted given that nations are still experimenting with approaches. A port state may wish to
apply its regime uniformly to all vessels which visit, or it may wish to attempt to assess the relative
risk of vessels to valuable resources and apply the regime selectively to those which are deemed of
highest risk.
The uniform application option offers the advantages of simplified programme administration in that
there are no "judgement calls" to be made or justified by the port state regarding which vessels must
1
Ballast Water Risk Assessment, Port of Odessa, Ukraine, October 2003: Final Report
participate and which need not. In addition, the system requires substantially less information
management demands. Finally, it offers more protection from unanticipated invaders, and overall
protection is not dependent upon the quality of a decision support system which may not be complete.
The primary disadvantages of this approach are: 1) additional overall cost to vessels which otherwise
might not need to take action, and 2) more vessels will be involved in undertaking the measures, and
therefore the port state will need to monitor compliance from a greater number of vessels.
Some nations are experimenting with systems to allow more selective applicability based upon
voyage-specific risk assessments because this approach offers to reduce the numbers of vessels
subject to ballast water controls and monitoring. The prospect of reducing the numbers of ships to
which the program applies is especially attractive to nations that wish to eliminate introductions of
target organisms such as toxic dinoflagellates. More rigorous measures can be justified on ships
deemed to be of `high risk' if fewer restrictions are placed on low risk vessels. However, this
approach places commensurate information technology and management burdens on port state and its
effectiveness depends on the quality of the information supporting it. The approach may also leave the
country/port vulnerable to unknown risks from non-target organisms.
For countries/ports which choose the selective approach, it will be essential to establish an organized
means of evaluating the potential risk posed by each vessel entering their port, through a Decision
Support System (DSS). Only in this way can they take the most appropriate decision regarding any
required action concerning that vessels' ballast water discharge. The DSS is a management system
that provides a mechanism for assessing all available information relating to individual vessels and
their individual management of ballast water so that, based upon assessed risk, the appropriate course
of action can be taken.
Before a pilot country decides on whether to adopt the `blanket' (i.e. all vessels) approach or to target
specific, identified high risk vessels only, a general, first-past risk assessment needs to be carried out.
This should look at shipping arrival patterns and identify the source ports from which ballast water is
imported. Once these are identified, source port/discharge port environmental comparisons should be
carried out to give a preliminary indication of overall risk. This will greatly assist the port state to
assess which approach to take.
The GloBallast programme, under Activity 3.1; will support these initial , `first-past' risk assessments
as a consultancy on contract to the PCU. This is important for establishing the level and types of risks
of introductions that each port faces, as well as the most sensitive resources and values that might be
threatened. These will differ from site to site, and will determine the types of management responses
that are required.
The PCU risk assessment consultants, in conducting the risk assessment in each pilot country, will
work with and train country counterpart(s) and include them in the study process as part of the
capacity building objectives of the programme, so as to allow each country to undertake its own risk
assessments in future.
3. Scope of the Risk Assessments
A Risk Assessment will be undertaken for each of the ports of:
· Sepetiba, Brazil;
· Dalian, China;
· Mumbai, India;
· Kharg Island, Iran;
· Saldanha, South Africa and
· Odessa, Ukraine.
2
Appendix 7: Consultants' Terms of Reference
The Risk Assessments will apply to all ship movements into and out of these ports based on shipping
data for the last 10 years (or longer if available).
4. Services Required & Tasks to be Undertaken
The GloBallast PCU requires a suitably qualified and experienced consultancy team to undertake the
ballast water risk assessments. The consultancy team will undertake the following Tasks, for each
demonstration site:
Task 1: Resource Mapping
Identify, describe and map on Geographic Information System (GIS) all coastal and marine resources
(biological, social/cultural and commercial) in and around the demonstration site that might be
impacted by introduced marine species.
Task 2: De-ballasting/Ballasting Patterns
Characterise, describe and map (on GIS) de-ballasting and ballasting patterns in and around the ports
including locations, times, frequencies and volumes of ballast water discharges and uptakes.
Task 3: Identify Source Ports
Identify all ports/locations from which ballast water is imported (source ports).
Task 4: Identify Destination Ports
Identify all ports/locations to which ballast water is exported (destination ports).
Task 5: Database - IMO Ballast Water Reporting Form
Establish a database at the nominated in-country agency for the efficient ongoing collection,
management and analysis of the data collected at the demonstration site according to the standard
IMO Ballast Water Reporting Form, and the data referred to under Tasks 2, 3 and 4.
Task 6: Environmental Parameters
Characterise as far as possible from existing data, the physical, chemical and biological environments
for both the demonstration site and each of its source and destination ports.
Task 7: Environmental Similarity Analysis
Using the data from Task 6 and an appropriate multivariate environmental similarity analysis
programme, develop environmental similarity matrices and indices to compare each demonstration
site with each of its source ports and destination ports, as the basis for the risk assessment.
Task 8: High Risk Species
Identify as far as possible from existing data, any high risk species present at the source ports that
might pose a threat of introduction to the demonstration site, and any high risk species present at the
demonstration site that might be exported to a destination port.
3
Ballast Water Risk Assessment, Port of Odessa, Ukraine, October 2003: Final Report
Task 9: Risk Assessment
For each demonstration site, assess and describe as far as possible, the risk profile for invasive marine
species being both introduced from its set of source ports and exported to its set of destination ports,
and identify the highest risk source and destination ports, using the outputs of Tasks 1 to 8 and based
on the environmental similarity indices developed under Task 7.
Task 10: Training & Capacity Building
While undertaking the risk assessment, provide training and capacity building to the in-country risk
assessment team (up to 10 people) in the risk assessment methodology, including use of database
established under Task 5 and the multivariate environmental similarity analysis programme
established under Task 7.
Task 11: Information Gaps
Identify any information gaps that limit the ability to undertake these Tasks and recommend
management actions to address these gaps.
5. Methods to be Used
The consultants should clearly outline in their Tender how each Task will be achieved. These should
comply with but are not necessarily restricted to the following:
Site Visits:
The consultants will undertake an initial one week (5 working days) visit to each demonstration site to
hold discussions with the CFP, CFP-A, port authority, maritime administration, environment
administration, fisheries/marine resources administration, marine science community and shipping
industry, to identify and obtain information and data for the various Tasks, establish a working
relationship with the in-country risk assessment team, conduct a site familiarisation to the
demonstration site (port) and to identify information gaps.
The consultants will undertake second 8 to 10 working day visit to each demonstration to install the
GIS, database and multivariate environmental similarity analysis programme and to provide training
and capacity building in their use and the overall risk assessment methodology to the in-country risk
assessment team.
Coordination:
The consultants will maintain close consultation and cooperation with the PCU Technical Adviser
(TA), who will manage this consultancy, and with the Country Focal Point (CFP) and CFP Assistant
(CFP-A) in each pilot country, who provide the primary contact point for all in-country activities and
for accessing in-country information and data.
Tasks 1& 2:
This will be restricted existing data only, field surveys are not provided for in the budget. The CFP
and/or CFP-A will compile as much existing information as possible in relation to Tasks 1 and 2 to
provide to the consultants.
The consultants should identify and evaluate any existing in-country databases and GIS for use in
these Tasks. The GIS should be tailored to suit the country's circumstances while ensuring user-
friendliness and consistency across all sites.
4
Appendix 7: Consultants' Terms of Reference
Tasks 3 & 4:
This will be restricted to existing data only. The CFP and/or CFP-A will compile as much existing
information as possible in relation to Tasks 3 and 4 to provide to the consultants. However, the
consultants should identify potential additional sources of data for these two tasks, including records
held by port authorities, shipping agents, customs agencies and similar, that may not have been
identified/compiled by the CFP/CFP-A.
Task 5:
The consultants should identify and evaluate any existing in-country databases for use in this Task.
The database should be tailored to suit the country's circumstances while ensuring user-friendliness,
consistency with the IMO Ballast Water Record Form and consistency across all sites.
Task 6:
This will be based on existing data only. The consultants should clearly outline in their Tender what
parameters will be used, and how the data for these parameters will be collected from the source and
destination ports.
Task 7:
The consultants should clearly outline in their Tender what multivariate environmental similarity
analysis programme will be used, and how it will be used.
Task 8:
The consultants should clearly outline in their Tender how this Task will be achieved, including how
relevant national and international invasive marine species records and databases will be accessed.
Task 9:
The consultants should clearly outline in their Tender how the outputs of Tasks 1 to 8, and in
particular Task 4, will be used to produce the risk profiles for each demonstration site, and what form
these will take.
Task 10 & 11:
The consultants should clearly outline in their Tender how these Tasks will be achieved.
6. Time Frame, End Product and Reporting Procedure
· The risk assessments will be conducted for each of the six demonstration sites in the second half
of 2001 and into the first half of 2002. A detailed workplan and timeline will be proposed by the
consultant in their Tender and the precise timing for each site will be refined through consultation
with each country, once the contract is awarded.
· The end product of this consultancy will be the establishment of the databases, GIS's, multivariate
environmental similarity analysis programmes and risk assessment outputs at each demonstration
site, including training in their use.
· There will also be a report for each demonstration site which addresses as fully as possible all of
the Tasks under section 4, consistent with all parts of these Terms of Reference and the
5
Ballast Water Risk Assessment, Port of Odessa, Ukraine, October 2003: Final Report
consultancy contract. Results presented should be supported by maps, figures, diagrams and
tables here useful.
· Each report should be submitted to the PCU in draft form first, for review by the PCU and the
demonstration site risk assessment team. The final report for each site will be submitted to the
PCU within one month of the consultants receiving review comments.
· The PCU may arrange for peer review of the draft reports, to ensure scientific credibility and
quality control.
· The final reports should be submitted to the PCU in both hard-copy and electronic form, including
figures, images and data, ready for publication. The PCU will publish each final report in both
English and the main language of the pilot country (if different).
7. Selection Criteria
· Cost effectiveness.
· Demonstrated record of meeting deadlines and completing tasks within budget.
· Extensive experience with the issue of introduced marine species.
· Extensive experience with the issue of ballast water.
· Extensive experience with risk assessment in relation to introduced marine species and ballast
water.
· Demonstrated abilities in literature search and review and in identifying and obtaining reports,
publications, information and data from sometimes obscure and difficult sources.
· Demonstrated skills in information analysis and synthesis.
· Experience in working in developing countries.
· Experience in training and capacity building in developing countries.
· Ability of the proposed methods and workplan to complete all Tasks satisfactorally.
8. Content of Tenders
The Tender should include the following:
· Total lump-sum price in US$D.
· Detailed cost break-down for all Tasks in US$ (NB. Total budget must not exceed US$250,000
and cost-effectiveness and competitiveness within this budget forms a primary selection criteria).
· Detailed workplan and provisional timeline for all Tasks outlined under section 4 above.
· Details of the methods proposed to achieve all Tasks, framed against each Task under section 4
above and consistent with section 5 above.
6
Appendix 7: Consultants' Terms of Reference
· CV's of each consultancy team member (maximum of 3 pages per person) (consultancy teams
should be kept as small as possible).
· Details of the consultancy's professional indemnity and liability insurance and quality assurance
procedures.
Further Information
Steve Raaymakers
Technical Adviser
Programme Coordination Unit
Tel +44 (0)20 7587 3251
Fax +44 (0)20 7587 3261
Email sraaymak@imo.org
7


Ballast W
a
ter Risk Assessment
Global Ballast Water
Management Programme
G L O B A L L A S T M O N O G R A P H S E R I E S N O . 1 0
Port of Odessa, Ukraine
Ballast Water Risk Assessment
Port of Odessa
Ukraine
Final Report
OCTOBER 2003
Final Report
.dwa.uk.com
B. Alexandrov, R. Bashtannyy,
C. Clarke, T. Hayes, R. Hilliard,
J. Polglaze, V. Rabotnyov
GLOBALLAST MONOGRAPH SERIES
& S. Raaymakers
More Information?
el (+44) 020 7928 5888 www
Programme Coordination Unit
Global Ballast Water Management Programme
International Maritime Organization
4 Albert Embankment
London SE1 7SR United Kingdom
Tel: +44 (0)20 7587 3247 or 3251
est & Associates, London. T
Fax: +44 (0)20 7587 3261
Web: http://globallast.imo.org
NO.10
A cooperative initiative of the Global Environment Facility,
United Nations Development Programme and International Maritime Organization.
Cover designed by Daniel W