


Ballast W
a
ter Risk Assessment
Global Ballast Water
Management Programme
G L O B A L L A S T M O N O G R A P H S E R I E S N O . 8
Port of Khark Island, Islamic Republic of Iran
Ballast Water Risk Assessment
Port of Khark Island
Islamic Republic of Iran
Final Report
AUGUST 2003
Final Report
C. Clarke, T. Hayes, R. Hilliard,
.dwa.uk.com
N. Kayvanrad, A. Parhizi,
H. Taymourtash, V. Yavari,
GLOBALLAST MONOGRAPH SERIES
& S. Raaymakers
More Information?
el (+44) 020 7928 5888 www
Programme Coordination Unit
Global Ballast Water Management Programme
International Maritime Organization
4 Albert Embankment
London SE1 7SR United Kingdom
Tel: +44 (0)20 7587 3247 or 3251
est & Associates, London. T
Fax: +44 (0)20 7587 3261
Web: http://globallast.imo.org
NO.8
A cooperative initiative of the Global Environment Facility,
United Nations Development Programme and International Maritime Organization.
Cover designed by Daniel W
GloBallast Monograph Series No. 8
Ballast Water Risk Assessment
Port of Khark Island
Islamic Republic of Iran
August 2003
Final Report
Chris Clarke*, Terry Hayes*, Rob Hilliard*,
Nasser Kayvanrad+, Hassan Taymourtash+,
Ahmad Parhizi+, Vahid Yavari+ and
Steve Raaymakers#
*Meridian GIS Pty Ltd, Perth, Western Australia
+Ports & Shipping Organisation, Ministry of Road and Transportation, Islamic Republic of Iran
#Programme Coordination Unit, GEF/UNDP/IMO Global Ballast Water Management Programme, International
Maritime Organization
International Maritime Organization
ISSN 1680-3078
Published in September 2003 by the
Programme Coordination Unit
Global Ballast Water Management Programme
International Maritime Organization
4 Albert Embankment, London SE1 7SR, UK
Tel +44 (0)20 7587 3251
Fax +44 (0)20 7587 3261
Email sraaymak@imo.org
Web http://globallast.imo.org
The correct citation of this report is:
Clarke, C., Hayes, T., Hilliard, R., Kayvanrad, N., Taymourtash, H., Parhizi, A., Yavari, V. & Raaymakers, S. 2003. Ballast
Water Risk Assessment, Port of Khark Island, Islamic Republic of Iran, August 2003: Final Report. GloBallast Monograph
Series No. 8. IMO London.
The Global Ballast Water Management Programme (GloBallast) is a cooperative initiative of the Global Environment Facility (GEF),
United Nations Development Programme (UNDP) and International Maritime Organization (IMO) to assist developing countries to reduce
the transfer of harmful organisms in ships' ballast water.
The GloBallast Monograph Series is published to disseminate information about and results from the programme, as part of the
programme's global information clearing-house functions.
The opinions expressed in this document are not necessarily those of GEF, UNDP or IMO.
Ballast Water Risk Assessment, Port of Khark Island, Islamic Republic of Iran, August 2003: Final Report
Acknowledgements
The Ballast Water Risk Assessment for the Port of Khark Island was undertaken during 2002 and
funded by the GEF/UNDP/IMO Global Ballast Water Management Programme and the Government
of the Islamic Republic of Iran. The study team (Appendix 2) thanks the following for their help and
assistance:
Captain Gholam Abbas Hafezi
National Iranian Oil Exportation Terminal Harbour Master
Captain A. Fallahi
Ports & Shipping Organization, Port of Khark Island
Mr Amir Houshang Ghafourian National Cartographic Centre, Tehran
Ms Faezeh Salami
National Cartographic Centre, Tehran
Ms Atiyeh Mojtahedi
National Cartographic Centre, Tehran
Dr Gustaaf Hallegraeff
University of Tasmania, Hobart
Dr Keith Hayes
CSIRO Centre for Research on Introduced Marine Pests, Hobart
Dr Graeme Hubbert
Global Environmental Modelling Systems (GEMS), Melbourne.
Dr Chad Hewitt
Biosecurity Unit, New Zealand Ministry of Fisheries
Dr Fred Wells
Western Australian Museum, Perth, Western Australia.
The report was formatted and prepared for print by Leonard Webster.
Ballast Water Risk Assessment, Port of Khark Island, Islamic Republic of Iran, August 2003: Final Report
Acronyms
BW
Ballast water
BWM
Ballast water management
BWRA
Ballast Water Risk Assessment
BWRF
Ballast Water Reporting Form (the standard IMO BWRF is shown in Appendix 1)
CFP
Country Focal Point (of the GloBallast Programme in each Pilot Country)
CFP/A
Country Focal Point Assistant
CRIMP Centre
for
Research
on
Introduced
Marine
Pests
(now
part
of
CSIRO
Marine
Research, Hobart, Tasmania)
CSIRO
Commonwealth Scientific and Industrial Research Organisation (Australia)
DSS
Decision support system (for BW management)
DWT
Deadweight tonnage (typically reported in metric tonnes)
GCC
Gulf Cooperation Council
GIS
Geographic information system
GISP
Global Invasive Species Programme
GloBallast
GEF/UNDP/IMO Global Ballast Water Management Programme
GT
Gross tonnage (usually recorded in metric tonnes)
GUI
Graphic User Interface
IALA
International Association of Lighthouse Authorities
IHO
International Hydrographic Organization
IMO
International Maritime Organization
I.R.
Islamic Republic of
IUCN
The World Nature Conservation Union
LAT
Lowest Astronomical Tide
MESA
Multivariate environmental similarity analysis
MEPC
Marine Environment Protection Committee (of the IMO)
NCC
National Cartographic Centre (I.R. Iran)
NIMPIS
National Introduced Marine Pests Information System (managed by CSIRO,
Australia)
NIS
Non-indigenous species
OS
Operating System (of any personal or mainframe computer)
PCU
Programme Coordination Unit (of the GloBallast Programme based at IMO London)
PRIMER
Plymouth Routines In Marine Environmental Research
PBBS
Port Biological Baseline Survey
PSO
Ports & Shipping Organisation, Ministry of Roads & Transportation (I.R. Iran)
ROPME
Regional Organization for the Protection of the Marine Environment (the ROPME
Sea Area comprises the coastal and marine waters of Bahrain, Iraq, Islamic Republic
of Iran, Kuwait, Oman, Qatar, Saudi Arabia and United Arab Emirates)
ROR
Relative overall risk
RSA
ROPME Sea Area
SAP
(Regional) Strategic Action Plan
SERC
Smithsonian Environmental Research Center (Washington DC, United States)
VLCC
Very large crude carrier (200,000 � 300,000 DWT)
ULCC
Ultra large crude carrier (over 300,000 DWT)
ii
Ballast Water Risk Assessment, Port of Khark Island, Islamic Republic of Iran, August 2003: Final Report
Glossary of Terms and Definitions
The following terms and definitions are summarised from various sources including Carlton (1985,
1996, 2002), Cohen & Carlton (1995), Hilliard et al. (1997a), Lepp�koski et al. (2002), Williamson et
al. (2002) and the GloBallast BWRA User Guide. The latter document contains more detailed
definitions with explanatory notes, plus a glossary of maritime terms.
Ballast water
Any water and associated sediment used to manipulate the trim and
stability of a vessel.
Baseline port survey
A biological survey to identify the types of introduced marine species
in a port.
Bioinvasion
A broad based term that refers to both human-assisted introductions
and natural range expansions.
Border
The first entrance point into an economy's jurisdiction.
Cost benefit analysis
Analysis of the cost and benefits of a course of action to determine
whether it should be undertaken.
Cryptogenic
A species that is not demonstrably native or introduced.
Disease
Clinical or non-clinical infection with an aetiological agent.
Domestic
Intra-national coastal voyages (between domestic ports).
routes/shipping
Established
A non-indigenous species that has produced at least one self-sustaining
introduction
population in its introduced range.
Foreign routes/shipping
International voyages (between countries).
Fouling organism
Any plant or animal that attaches to natural and man-made substrates
such as piers, navigation buoys or hull of ship, such as seaweed,
barnacles or mussels.
Harmful marine species
A non-indigenous species that threatens human health, economic or
environmental values.
Hazard
A situation that under certain conditions will cause harm. The
likelihood of these conditions and the magnitude of the subsequent
harm is a measure of the risk.
Indigenous/native
A species with a long natural presence that extends into the pre-historic
species
record.
Inoculation
Any partial or complete discharge of ballast tank water that contains
organisms which are not native to the bioregion of the receiving waters
(analogous to the potentially harmful introduction of disease � causing
agents into a body � as the outcome depends on inoculum strength and
exposure incidence).
Intentional introduction
The purposeful transfer or deliberate release of a non-indigenous
species into a natural or semi-natural habitat located beyond its natural
range.
Introduced species
A species that has been intentionally or unintentionally transferred by
human activity into a region beyond its natural range.
Invasive species
An established introduced species that spreads rapidly through a range
of natural or semi-natural habitats and ecosystems, mostly by its own
means.
iii
Ballast Water Risk Assessment, Port of Khark Island, Islamic Republic of Iran, August 2003: Final Report
Marine pest
A harmful introduced species (i.e. an introduced species that threatens
human health, economic or environmental values).
Non-invasive
An established introduced species that remains localised within its new
environment and shows minimal ability to spread despite several
decades of opportunity.
Pathogen
A virus, bacteria or other agent that causes disease or illness.
Pathway (Route)
The geographic route or corridor from point A to point B (see Vector).
Risk
The likelihood and magnitude of a harmful event.
Risk assessment
Undertaking the tasks required to determine the level of risk.
Risk analysis
Evaluating a risk to determine if, and what type of, actions are worth
taking to reduce the risk.
Risk management
The organisational framework and activities that are directed towards
identifying and reducing risks.
Risk species
A species deemed likely to become a harmful species if it is introduced
to a region beyond its natural range, as based on inductive evaluation
of available evidence.
Translocation
The transfer of an organism or its propagules into a location outside its
natural range by a human activity.
Unintentional
An unwitting (and typically unknowing) introduction resulting from a
introduction
human activity unrelated to the introduced species involved (e.g. via
water used for ballasting a ship or for transferring an aquaculture
species).
Vector
The physical means or agent by which a species is transferred from one
place to another (e.g. BW, a ship's hull, or inside a shipment of
commercial oysters)
iv
Ballast Water Risk Assessment, Port of Khark Island, Islamic Republic of Iran, August 2003: Final Report
Lead agencies
Lead Agency for BW Issues in the Islamic Republic of Iran:
Contact person:
Mr Hassan Taymourtash
Position:
Director General of Safety and Maritime Protection Department and
GloBallast Country Focal Point
Organization:
Ports and Shipping Organization, Ministry of Road and Transportation
Address:
No 751 Enghelab Avenue
Tehran 1599661464
ISLAMIC REPUBLIC OF IRAN
Tel:
+98 21 8809555
Fax:
+98 21 8809367
Email: taymourtash@ir-pso.com
Web:
www.ir-pso.com
v
Ballast Water Risk Assessment, Port of Khark Island, Islamic Republic of Iran, August 2003: Final Report
Executive Summary
The introduction of harmful aquatic organisms and pathogens to new environments via ships' ballast
water (BW) and other vectors has been identified as one of the four greatest threats to the world's
oceans. The International Maritime Organization (IMO) is working to address the BW vector through
various initiatives. One initiative has been the provision of technical assistance to developing
countries through the GEF/UNDP/IMO Global Ballast Water Management Programme (GloBallast).
Core activities of the GloBallast Programme are being undertaken at Demonstration Sites in six Pilot
Countries. These sites are the ports at Khark Island (I.R. Iran), Dalian (China), Mumbai (India),
Odessa (Ukraine), Saldanha (South Africa) and Sepetiba (Brazil). One of these activities (Activity
3.1) has been to trial a standardised method of BW risk assessment (BWRA) at each of the six
Demonstration Sites. Risk assessment is a fundamental starting point for any country contemplating
implementing a formal system to manage the transfer and introduction of harmful aquatic organisms
and pathogens in ships' BW, whether under existing IMO Ballast Water Guidelines (A.868(20)) or a
new international Convention.
To maximise certainty while seeking cost-effectiveness and a relatively simple, widely applicable
system, a semi-quantitative approach was followed, using widely-supported computer software. The
semi-quantitative method aims to minimise subjectivity by using as much quantitative data as possible
to identify the riskiest ballast tank discharges with respect to a Demonstration Site's current pattern of
trade. Unlike a fully quantitative approach, it does not attempt to predict the specific risk posed by
each intended tank discharge of individual vessels, nor the level of certainty attached to such
predictions. However, by helping a Demonstration Site to determine its riskiest trading routes,
exploring the semi-quantitative BWRA provides a coherent method for identifying which BW sources
deserve more vessel monitoring and management efforts than others.
This report describes the BWRA activity undertaken for the Port of Khark Island, which is the
Demonstration Site managed by the Ports & Shipping Organisation (PSO) of the Islamic Republic of
Iran. This capacity-building activity commenced in January 2002, with Meridian GIS Pty Ltd
(Meridian) contracted to the GloBallast Programme Coordination Unit (PCU) to provide BWRA
training and software. Under the terms of reference, the consultants worked closely with their in-
country counterparts in a project team co-managed by Meridian and PSO for completing all required
tasks. These tasks required two in-country visits by the consultants (in May and December 2002) to
install the BWRA software and provide `hands-on' instruction and guidance. Most of the data
collation tasks were undertaken before, between and during these visits, with gap-filling work
undertaken by the consultants prior to a short `project wrap-up' visit in February 2003.
The first step was to collate data from IMO Ballast Water Reporting Forms (BWRFs) submitted by
arriving ships to identify the source ports from which BW is imported to the Demonstration Site.. For
periods or vessel arrivals where BWRFs were not collected or were incomplete, gap-filling data were
extracted from the port shipping records held at Khark Island by PSO. These records also help
establish which next ports of call may have been a destination port for any BW taken up at Khark
Island.
A multivariate procedure was then used to identify the environmental similarity between the
Demonstration Site and each of its BW source and destination ports. Comparing port-to-port
environmental similarities provides a relative measure of the risk of organism survival, establishment
and potential spread. This is the basis of the `environmental matching' method, and it facilitates
estimating the risk of BW introductions when the range and types of potentially harmful species that
could be introduced from a particular source port are poorly known.
Another objective of the BWRA Activity was to identify `high-risk' species that may be transferred to
and/or from the Demonstration Site. The customised Access database therefore contained tables and
interfaces for storing and managing the names, distribution and other information on risk species.
vi
Ballast Water Risk Assessment, Port of Khark Island, Islamic Republic of Iran, August 2003: Final Report
Thus the taxonomic details, bioregional distribution, native/introduced status and level of threat
assigned to a species were stored in the database for display, review and update as well as for the
BWRA analysis. For the purposes of the BWRA and its `first-pass' risk assessment, a risk species was
considered to be any introduced, cryptogenic or native species that might pose a threat to marine
ecological, social and/or commercial resources and values if successfully transferred to or from a
Demonstration Site.
During each visit the consultants worked alongside their Pilot Country counterparts to provide skills-
transfer as part of the capacity building objectives of the programme, with the project team divided
into three groups. Group A mapped the port and its resources using ArcView GIS. This group
included counterparts from I.R. Iran's National Cartographic Centre (Tehran) who provided much of
the required GIS data in digital format. Group B was responsible for managing the customised Access
database supplied by the consultants, and for entering, checking and managing the BW discharge data,
as recorded on the BWRFs voluntarily submitted by arriving ships and/or derived from the port's
shipping records. Group B used the database to identify BW source and destination ports, and it is
designed for ongoing input and management of BWRFs. Group C undertook the environmental
matching and risk species components of the Activity, using the PRIMER package to perform the
multivariate analyses for determining the environmental distances between Khark Island and its
source and destination ports.
The various BW discharge, environmental matching and risk species data described above were then
processed by the database with other risk factors, including voyage duration and tank size, to provide
preliminary indication of:
(a) the relative overall risk posed by each BW source port, and
(b) which destination ports appeared most at risk from any BW uplifted at the Demonstration
Site.
This was achieved using a project standard approach, although the database also facilitates instant
modifications of the calculations for exploratory and demonstration purposes. The GloBallast BWRA
also adopted a `whole-of-port' approach to compare the subject port (Demonstration Site) with all of
its BW source and destination ports. The project therefore established in Tehran an integrated
database and geographic information system (GIS) that manages and displays:
� ballast water data obtained from arriving ship BWRFs and port shipping records;
� information on the Demonstration Site's navigational, physical and environmental conditions
and aquatic resources,
� port-to-port environmental matching data,
� risk species data, and
� risk coefficients and graphical categories of risk for ballast discharges.
The results, which were graphically displayed on user-friendly GIS port and world maps as well as in
ranked output tables, help determine the types of management responses. Seventeen source ports
provided the top 20% of the total cumulative threat for the Port of Khark Island (in terms of their BW
source frequency, volume, environmental similarity and assigned risk species). They were led by
Kaohsiung in Taiwan Province (ROR = 0.229; S-ROR = 1.0), followed by five Middle East ports
(Jebel Ali, Doha, Umm Said, Fujairah, and the Red Sea oil reception terminal at Ain Sukhana).
Highest risk ports beyond the Middle East were Okinawa and Chiba (Japan) and Ulsan (Korea). The
majority of ports in the next group were located in South and East Asia, including ports in India (2),
Sri Lanka (1), Japan (7), China (1), Taiwan Province (1), Korea (2) and Philippines (1). Only one
European port attained a `high risk' category (Eleusis in Greece).
Low risk source ports were in north Europe, North America and South Africa, plus some in South and
East Asia. The lowest risk port was the Port of Come by Chance, located in Newfoundland (Canada).
The generally much higher threat of introductions posed by BW sources in the Middle East and Asia
vii
Ballast Water Risk Assessment, Port of Khark Island, Islamic Republic of Iran, August 2003: Final Report
than in north America and Europe (an order of magnitude difference) is logical with respect to Khark
Island's geographic location and current pattern of trade. The results also implied that any introduced
species which establishes in a port in the ROPME Sea Area, or nearby Red Sea and west Arabian Sea,
could be readily spread by local ship movements involving shuttle services, bunkering and/or part-
loading of cargo.
Of the various BWRA objectives and tasks, reliable identification of destination ports that may
receive BW from the Demonstration Site was confounded by the lack of specific questions on the
IMO-standard BWRFs, and the uncertainty of knowing if the Next of Port Call recorded on a BWRF
is where Ballast Water is actually discharged. Thus presently there is no mechanism enabling a
`reverse BWRA' to be undertaken reliably. In the case of the RSA, Next and Last Port of Call
involving bunkering, crew-change or cargo top-up visits added to the problem. In the case of the Port
of Khark Island, this was not a issue since almost all visiting ships arrive to collect liquid or dry bulk
cargo. However, if more reliable, forward-looking BWRAs are to be undertaken to identify
destination ports in the future, supplementary questions will need to be added to the present BWRF,
including the names of the three last ports of call as well as the port where discharges from each
partially or completely ballasted tank are predicted.
The main objectives of the BWRA Activity were successfully completed during the 13 month course
of this project, with the various tasks and exploratory/demonstration software providing a foundation
enabling the regional promulgation of further BW management activities by I.R. Iran. Project outputs
included a trained in-country risk assessment team, and an operational BWRA system and User Guide
for use as a demonstration tool in the region of the Port of Khark Island. This places the Islamic
Republic of Iran in a strong position to provide assistance, technical advice, guidance and
encouragement to other port States of the ROPME Sea Area.
viii
Ballast Water Risk Assessment, Port of Khark Island, Islamic Republic of Iran, August 2003: Final Report
Table of Contents
Acknowledgements......................................................................................................................................i
Acronyms......................................................................................................................................................ii
Glossary of Terms and Definitions ..........................................................................................................iii
Lead agencies ..............................................................................................................................................v
Executive Summary ...................................................................................................................................vi
1
Introduction and Background .........................................................................................................1
2
Aims & Objectives.............................................................................................................................5
3
Methods ..............................................................................................................................................6
3.1
Overview and work schedule...................................................................................................................6
3.2
Resource mapping of the demonstration port.........................................................................................8
3.3
De-ballasting/ballasting patterns ...........................................................................................................10
3.4
Identification of source ports..................................................................................................................10
3.5
Identification of destination ports...........................................................................................................12
3.6
BWRF database.....................................................................................................................................13
3.7
Environmental parameters....................................................................................................................15
3.8
Environmental similarity analysis ..........................................................................................................16
3.9
Risk species ...........................................................................................................................................17
3.10
Risk assessment ....................................................................................................................................21
3.11
Training and capacity building ...............................................................................................................26
4
Results ............................................................................................................................................. 29
4.1 Description
of port ..................................................................................................................................29
4.2 Resource mapping .................................................................................................................................33
4.3 De-ballasting/ballasting pattern .............................................................................................................34
4.4 Identification
of source ports..................................................................................................................36
4.5 Identification
of destination ports ...........................................................................................................40
4.6
Environmental similarity analysis ..........................................................................................................41
4.7
Risk species ...........................................................................................................................................46
4.8
Risk assessment results ........................................................................................................................49
4.9
Training and capacity building ...............................................................................................................53
4.10
Identification of information gaps...........................................................................................................54
5
Conclusions and Recommendations .......................................................................................... 57
Recommendations.............................................................................................................................................57
BWRA recommendations and plans by Pilot Country (IR Iran).......................................................................57
6
Location and Maintenance of the BWRA System...................................................................... 59
Port resource mapping and GIS display requirements: ...................................................................................59
Ballast water reporting form database:.............................................................................................................59
Port environmental and risk species data: .......................................................................................................59
References................................................................................................................................................. 60
APPENDIX 1:
Copy of IMO Ballast Water Reporting Form
APPENDIX 2:
Risk Assessment Team for the Port of Khark Island
APPENDIX 3:
Check-list of project requirements
APPENDIX 4:
Information sources used for collating Port Environmental Data
APPENDIX 5:
Sources and references of Risk Species information
APPENDIX 6:
Name, UN code, coordinates and environmental parameters of the 357 ports
used for the multivariate similarity analyses for all Demonstration Sites
ix
Ballast Water Risk Assessment, Port of Khark Island, Islamic Republic of Iran, August 2003: Final Report
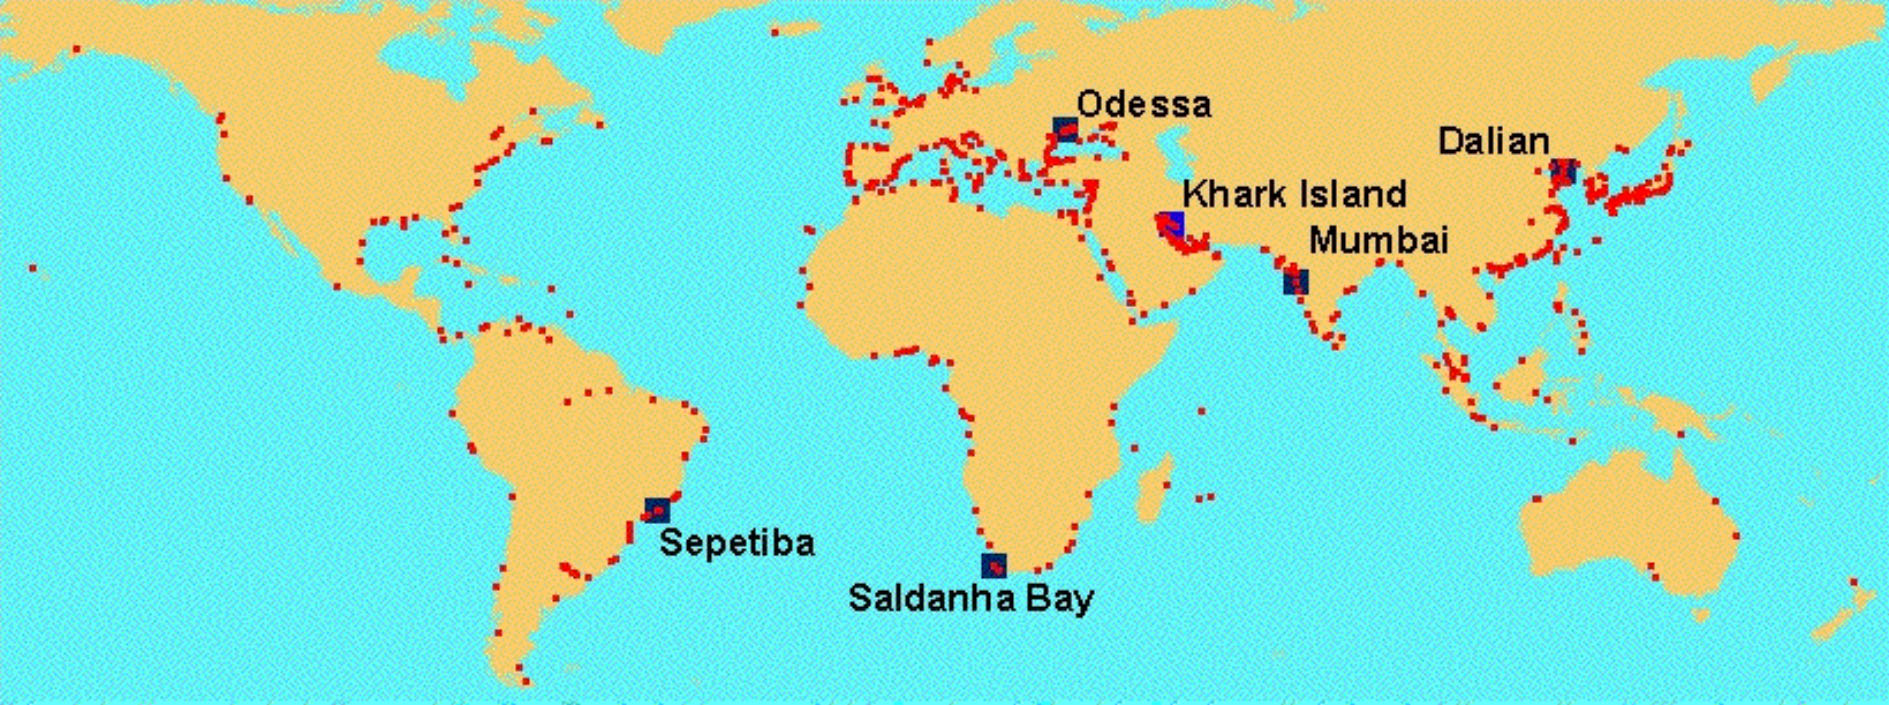
Figure 1.
Locations of the six GloBallast Demonstration Sites and their various ballast water source
and destination ports. .............................................................................................................................. 3
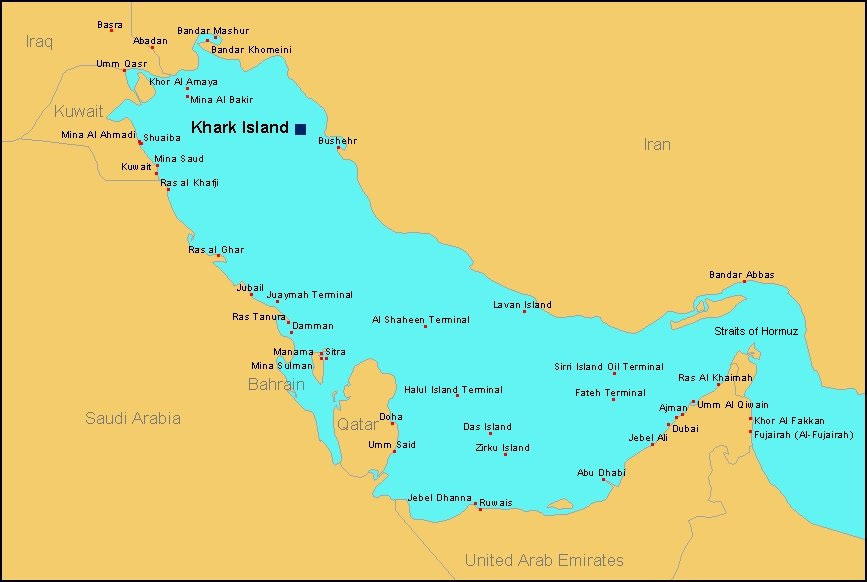
Figure 2.
Location of Khark Island and other ports in the ROPME Sea Area....................................................... 4
Figure 3.
Schematic of the GloBallast BWRA system ........................................................................................... 6
Figure 4.
Thematic layers used for the Port Map GIS............................................................................................ 9
Figure 5.
Working page of the Excel spreadsheet used to estimate BW discharges ......................................... 11
Figure 6.
The three tabs of the GUI used for entering the BWRF data............................................................... 14
Figure 7.
Part of the GIS world map of marine bioregions, showing the code names of the regions in
and near the ROPME Sea Area............................................................................................................ 18
Figure 8.
Complete GIS world map showing the marine bioregions [to improve clarity, not all bioregion
codes are shown in this example] ......................................................................................................... 19
Figure 9.
Database GUI used for manipulating the BWRA calculation and weightings ..................................... 23
Figure 10.
Annual wind rose typical of the RSA region (supplied by GEMS) ...................................................... 29
Figure 11.
GCOM3D predictions of wind- and tidal-driven surface currents during strong northerly winds and
spring tides, showing the complex circulation pattern and model verification locations in the RSA.
Bottom plot shows the opposing tidal phase (supplied by GEMS, Melbourne)................................... 30
Figure 12.
GCOM3 output for neap tide currents and weak northerly winds, plus red arrows depicting
start of anti-clockwise gyre (supplied by GEMS, Melbourne). ............................................................. 31
Figure 13. Part of the GIS Port Map showing navigation, infrastructure and the active berth layer for
Khark Island. .......................................................................................................................................... 32
Figure 14. Part of the GIS Port Map showing the marine habitat layer................................................................. 33
Figure 15. BW discharge statistics displayed by the GIS Port Map for the T-Jetty .............................................. 35
Figure 16. BW discharge statistics displayed by the GIS Port Map for the Sea Island Terminal at
Khark Island. .......................................................................................................................................... 35
Figure 17. BW discharge statistics displayed by the GIS Port Map for the Chemical Jetty at Khark Island........ 36
Figure 18. GIS output showing the location and relative importance of BW source ports with respect to
frequency of tank discharges (C1) at Port of Khark Island................................................................... 36
Figure 19. GIS output showing the location and relative importance of the source ports with respect to the
volume of tank discharges (C2) at Port of Khark Island....................................................................... 39
Figure 20. GIS output showing the location and frequency of destination ports, recorded as the Next
Port of Call in the Port of Khark Island BWRFs and shipping records................................................. 40
Figure 21. GIS output showing the location and environmental matching coefficients (C3) of BW source
ports identified for the Port of Khark Island........................................................................................... 42
Figure 22. GIS output showing the location and environmental matching coefficients (C3) of the destination
ports identified for the Port of Khark Island........................................................................................... 46
Figure 23. GIS output showing the location and risk species threat coefficients (C4) of the BW source
ports identified for the Port of Khark Island........................................................................................... 46
Figure 24. GIS output showing the location and categories of relative overall risk (ROR-cat) of source
ports identified for the Port of Khark Island........................................................................................... 50
Figure 25. Frequency distribution of the standardised ROR values...................................................................... 53
x
1
Introduction and Background
The introduction of harmful aquatic organisms and pathogens to new environments via ships' ballast
water (BW) and other vectors, has been identified as one of the four greatest threats to the world's
oceans. The International Maritime Organization (IMO) is working to address the BW vector through
a number of initiatives, including:
� adoption of the IMO Guidelines for the control and management of ships' ballast water to
minimize the transfer of harmful aquatic organisms and pathogens (A.868(20));
� developing a new international legal instrument (Draft International Convention for the
Control and Management of Ships' Ballast Water and Sediment),, as currently scheduled to
be considered for adoption by an IMO Diplomatic Conference in February 2004; and
� providing technical assistance to developing countries through the GEF/UNDP/IMO Global
Ballast Water Management Programme (GloBallast).
Core activities of the GloBallast Programme are being undertaken at Demonstration Sites in six Pilot
Countries. These sites are the ports at Khark Island (I.R. Iran), Dalian (China), Mumbai (India),
Odessa (Ukraine), Saldanha (South Africa) and Sepetiba (Brazil). Activities carried out at the
Demonstration Sites will be replicated at additional sites in each region as the programme progresses
(further information http://globallast.imo.org).
One of GloBallast's core activities (Activity 3.1) has been to trial a standardised method of BW risk
assessment (BWRA) at each of the six Demonstration Sites. Risk assessment is a fundamental starting
point for any country contemplating implementing a formal system to manage the transfer and
introduction of harmful aquatic organisms and pathogens in ships' BW, whether under the existing
IMO Ballast Water Guidelines (A.868(20)) or the forthcoming Convention.
A port State may wish to apply its BW management regime uniformly to all vessels that call at its
ports, or it may wish to assess the relative risk of vessels to its coastal marine resources and apply its
regime selectively. Uniform application or the `blanket' approach offers the advantages of simplified
administration and no requirement for `judgement calls' to be made. This approach also requires
substantially less information management effort. If applied strictly, the uniform approach offers
greater protection from unanticipated bio-invaders, as it does not depend on the reliability of a
decision support system that may not be complete. However, the key disadvantage of the strict blanket
approach are the BW management costs imposed on vessels which otherwise might not be forced to
take action. It also requires a substantial vessel monitoring and crew education effort to ensure all
foreign and domestic flagged ships are properly complying with the required BW management
actions.
A few nations have started to develop and test systems that allow more selective application of BW
management requirements, based on voyage-specific risk assessments. This `selective' approach
offers to reduce the numbers of vessels subject to BW controls and monitoring, and is amenable to
nations that wish to reduce the introduction, and/or domestic spread, of `targeted' marine species only.
More rigorous measures can be justified on ships deemed to be of high risk if fewer restrictions are
placed on low risk vessels.
For countries/ports that choose the selective approach, it is essential to establish an organized means
of evaluating the potential risk posed by each arriving vessel, through a `Decision Support System'
(DSS). However, this approach places commensurate information technology and management
burdens on the port State, and its effectiveness depends on the quality of the information and database
systems that support it. A selective approach that is based on a group of targeted species may also
leave the country/port vulnerable to unknown risks from non-targeted species.
1
Ballast Water Risk Assessment, Port of Khark Island, Islamic Republic of Iran, August 2003: Final Report
Before a port State decides on whether to adopt the blanket or the selective approach, it needs to carry
out some form of risk assessment for each port under consideration. Ballast water risk assessments
(BWRAs) can be grouped into three categories1:
� Qualitative Risk Identification: this is the simplest approach, and is based on subjective
parameters drawn from previous experience, established principals and relationships and
expert opinion, resulting in simple allocations of `low', `medium' and `high' risk. However it
is often the case that subjective assessments tend to overestimate low probability/high
consequence events and underestimate higher probability/lower consequence events (e.g.
Haugom et al, in Lepp�koski et al 2002).
� Semi-Quantitative Ranking of Risk: this `middle' approach seeks to increase objectivity and
minimise the need for subjective opinions by using quantitative data and ranking of
proportional results wherever possible. The aim is to improve clarity of process and results,
thereby avoiding the subjective risk-perception issues that can arise in qualitative approaches.
� Quantitative Risk Assessment: this is the most comprehensive approach which aims to
achieve a full probablistic analysis of the risk of BW introductions, including measures of
confidence. It requires significant collation and analysis of physico-chemical, biological and
voyage-specific data, including key lifecycle and tolerance data for every pre-designated
species of risk (`target species'), port environmental conditions, ship/voyage characteristics,
the BW management measures applied, and input and evaluation of all uncertainties. The
approach requires a high level of resourcing, computer networking and sophisticated
techniques that are still being developed1.
The purpose of GloBallast Activity 3.1 has been to conduct initial, first-pass BWRAs for each
Demonstration Site. To maximise certainty while seeking cost-effectiveness and a relatively simple,
widely applicable system, the middle (semi-quantitative) approach was selected.
The first step of the GloBallast method is to collate data from IMO Ballast Water Reporting Forms
(BWRFs) (as contained in Resolution A.868(20); see Appendix 1) to identify the source ports from
which BW is imported to the demonstration port. For periods or vessel arrivals where BWRFs were
not collected or are incomplete, gap-filling data can be extracted from port shipping records.
Source port/discharge port environmental comparisons are then carried out and combined with other
risk factors, including voyage duration and risk species profiles, to give a preliminary indication of
overall risk posed by each source port. The results help determine the types of management responses
required, while the BWRA process provides a foundation block enabling application of more
sophisticated BW management DSSs by Pilot Countries.
The GloBallast approach is not the only one available but is considered to combine the best elements
of the semi-quantitative method to provide useful results within the available budget (US$250,000
spread across the six pilot countries). It has also taken a `whole-of-port' approach which compares the
subject port (Demonstration Site) with all of its BW source and destination ports. The outputs include
published reports, trained in-country risk assessment teams and an operational BWRA system for use
as demonstration tools in each of the six main developing regions of the world, plus a platform and
database to facilitate further DSS development. The GloBallast BWRA activity has therefore
established an integrated database and information system to manage and display:
� ballast water data from arriving ship BWRFs and port shipping records;
� data on the demonstration port's physical and environmental conditions and aquatic
resources,
� port-to-port environmental matching data,
� risk species data, and
� ballast water discharge risk coefficients.
1 for further details see the GloBallast BWRA User Guide.
2
1 Introduction and Background
The results provide a knowledge base that will help the Pilot Countries and other port States to
evaluate the risks currently posed by BW introductions, identify high priority areas for action, and
decide whether to apply a blanket or selective BW management regime. If a selective regime is
adopted, vessel and voyage-specific risk assessments can then be applied using systems such as those
being developed and trialled by the Australian Quarantine & Inspection Service (AQIS Decision
Support System), Det Norsk Veritas in Norway (EMBLA system) and the Cawthron Institute in New
Zealand (SHIPEXPLORER system), and/or by further development of the GloBallast system. If a
uniform approach is adopted, the results help identify which routes and vessel types warrant the most
vigilance in terms of BW management compliance checking and verification monitoring, including
ship inspections and ballast tank sampling.
The geographical spread and broad representativeness of the six Demonstration Sites also mean that
the results help plug a very large gap in the existing global knowledge base. Figure 1 indicates the
broad global spread of the GloBallast risk assessment activity. As a result of this activity,
comprehensive data are now available on source port and destination port linkages, environmental
parameters, environmental matching coefficients, risk species and relative overall risk of BW
transfers for the six GloBallast Demonstration Sites and a total of 723 ports around the world. Project
outcomes will therefore place governments, scientists, the shipping industry and the general public in
a stronger, more enlightened position to deal with the BW problem.
Figure 1. Locations of the six GloBallast Demonstration Sites and their various ballast water source and
destination ports.
This report describes and presents the results of the first Ballast Water Risk Assessment (BWRA)
carried out for the Port of Khark Island, Islamic Republic of Iran, during 2002. This GloBallast
Demonstrate Site is a major oil export terminal which is located in the north-west part of the ROPME
Sea Area (Figure 2).
3
Ballast Water Risk Assessment, Port of Khark Island, Islamic Republic of Iran, August 2003: Final Report
Figure 2. Location of Khark Island and other ports in the ROPME Sea Area
4
2 Aims & Objectives
The aims of the GloBallast BWRA for the Port of Khark Island were to:
1. Assess and describe as far as possible from available data, the risk profile of invasive aquatic
species being both introduced to and exported from Khark Island in ships' BW, and to identify the
source ports and destination ports posing the highest risk for such introductions.
2. Help determine the types of management responses that are required, and provide the foundation
blocks for implementing a more sophisticated BW management system for the Port of Khark
Island.
3. Provide training and capacity building to in-country personnel, resulting in a fully trained risk
assessment team and operational risk assessment system, for ongoing use by the Pilot Country,
replication at additional ports and use as a demonstration tool in the region.
The specific objectives of the BWRA for the Port of Khark Island were to:
1. Identify, describe and map on a Geographic Information System (GIS) all coastal and marine
resources (biological, social/cultural and commercial) in and around the port that might be
impacted by introduced marine species.
2. Characterise, describe and map (on GIS) de-ballasting and ballasting patterns in and around the
port including locations, times, frequencies and volumes of BW discharges and uptakes.
3. Identify all ports/locations from which BW is imported (source ports).
4. Identify all ports/locations to which BW is exported (destination ports).
5. Establish a database at the nominated in-country agency for the efficient ongoing collection,
management and analysis of the data collected at the Port of Khark Island via standard IMO
BWRFs.
6. Characterise as far as possible from existing data, the physical, chemical and biological
environments for both Khark Island and each of its source and destination ports.
7. Develop environmental similarity matrices and indices to compare the Port of Khark Island with
each of its source ports and destination ports, as a key basis of the risk assessment.
8. Identify as far as possible from existing data, any high-risk species present at the source ports that
might pose a threat of introduction to the Port of Khark Island, and any high-risk species present
at this port that might be exported to a destination port.
9. Identify any information gaps that limit the ability to undertake the aims and objectives and
recommend management actions to address these gaps.
5
3
Methods
3.1
Overview and work schedule
The BWRA Activity for the Port of Khark Island was conducted by Meridian GIS Pty Ltd (Meridian),
under contract to the GloBallast Programme Coordination Unit (PCU). The consultants worked
alongside their Pilot Country counterparts during the country visits to provide training and skills-
transfer as part of the capacity building objectives of the programme. Structure and membership of the
joint project team is shown in Appendix 2.
The consultants adopted an innovative, modular approach that integrated three widely used computer
software packages to provide a user-friendly tool for conducting, exploring and demonstrating semi-
quantitative BWRAs. As shown in Figure 3, the key software comprised:
� Microsoft Access - for the main database;
� PRIMER 5 [Plymouth Routines In Marine Environmental Research] - a versatile multivariate
analysis package from the United Kingdom enabling convenient multivariate analysis of the
port environmental data; and
� ESRI ArcView 3.2 Geographic Information System (GIS) - to graphically display the results
in a convenient, readily interpretable format using port and world maps.
The work schedule commenced with project briefing meetings with personnel from all six
Demonstration Sites to arrange logistics and resource needs, during the third meeting of the
GloBallast Programme's Global Task Force, held in Goa, India on 16-18 January 2002. The majority
of tasks subsequently undertaken for the Port Khark Island were completed during two in-country
visits by the consultants (2-9 May and 7-23 December 2002), with information searches and data
collation undertaken by both consultant and pilot country team members between and after these
visits. A two-day `project wrap-up' visit was subsequently made by one of the consultants in February
2003.
Figure 3. Schematic of the GloBallast BWRA system
6
3 Methods
The specific tasks of the week-long first visit were to:
� Install and test the Access, ArcView and PRIMER software and the functionality of the
computer system at the Ports & Shipping Organisation (PSO) head offices in Tehran.
� Familiarise the project team with the GloBallast BWRA method by seminar and work-
shopping.
� Commence GIS training and developing the port map for the Demonstration Site.
� Commence training on the use of the various Graphic User Interfaces (GUI) of the Access
Database for inputting and editing BW discharge data.
� Visit Khark Island to obtain port shipping records, tour the port facilities and obtain habitat
and coastal resource information.
� Review the port shipping records and available BWRFs to identify trading patterns, vessel
types, key BW source ports and likely destination ports.
� Check available port environmental data and identify potential in-country and regional
sources of same.
� Commence listing risk species and identifying potential in-country or regional sources of
same.
� Identify critical information gaps and the data assembly work required before the second visit.
During the longer second visit by the consultants, the environmental and risk species data were added
to the database, more vessel arrival, BW and voyage data were entered and checked, the first BWRA
was undertaken, and a workshop was held to review the initial results and identify future actions.
During the third visit on 16-17 February 2003, the consultants supplied PSO with updated versions of
the database and BWRA User Guide on CD-ROM, which included additional source port environment
and risk species data (as obtained from the BWRA Activities conducted at the other five
Demonstration Sites). The results of the February 2003 version are reported here.
Throughout the schedule, the joint project team was divided into three groups to facilitate training and
progress (Appendix 2). Group A was responsible for developing the port map and graphically
displaying results via the GIS. All coastal and marine resources (biological, social/cultural and
commercial) in and around the port that might be impacted by aquatic bio-invasions were mapped
using the ArcView GIS, using specific layers to show the bathymetry, navigation aids, port
infrastructure and tables of the port's de-ballasting/ballasting patterns (including frequencies and
volumes of discharges and uptakes for the berth locations).
Group B was responsible for managing the customised Access database supplied by the consultants,
and for entering, checking and managing the BW data, as collated from the BWRFs submitted by
arriving ships (and/or derived from shipping records for periods or arrivals when BWRFs were not
obtained or incomplete). This database was used to identify source and destination ports, and was
designed for ongoing input and management of future BWRFs.
NB. The requirement for arriving ships to submit IMO-style BWRFs (Appendix 1 and down-
loadable from http://globallast.imo.org/guidelines) to the relevant port State authorities is a
fundamental and essential first basic step for any port State wishing to commence a ballast
water management programme2.
Group C was responsible for collating the port environmental and risk species data, undertaking port-
to-port environmental similarity analyses and performing the BWRA. Thirty four environmental
2 Several port States (e.g. Australia) and Demonstration Sites (e.g. Dalian, Odessa) have produced their own
BWRFs, the latter using a translated format to permit improved BWRF understanding and completion by
local shipping. Such BWRFs need to include all questions of the IMO standard form. Problems arising from
voluntary submission of BWRFs are described in Section 4.12.
7
Ballast Water Risk Assessment, Port of Khark Island, Islamic Republic of Iran, August 2003: Final Report
variables were collated for the Demonstration Site and the majority of its source and destination
ports3, including sea water and air temperatures, salinities, seasonal rainfall, tidal regimes and
proximity to a standardised set of intertidal and subtidal habitats. Where water temperature data or
salinity data could not be found for a source or destination port, values were derived for the riverine,
estuarine or coastal location of the port with respect to the temperature and salinity data ranges of its
IUCN marine bioregion, plus ocean maps depicting sea surface temperature/salinity contours at
quarter degree and degree scales (as obtained from CRIMP [now CSIRO Marine Research], URS
Australia Pty Ltd and other sources; Appendix 3).
The multivariate analysis of the port environmental data was undertaken using PRIMER 5, with the
similarity values between the Port of Khark Island and its source and destination ports converted into
environmental matching coefficients then added to the database. Species in or near source ports that
were deemed to pose a threat if introduced to the Demonstration Site, together with species at the
Demonstration Site that might be exported to a destination port, were identified from all available
sources found by the project team. These sources included preliminary results from the Port
Biological Baseline Surveys (PBBS); as recently completed at each Demonstration Site by another
GloBallast Activity, plus searches of `on-line' databases such as those under ongoing development by
the Smithsonian Environmental Research Center (SERC), the Australian Centre for Research on
Introduced Marine Pests (CRIMP), the Baltic Regional Marine Invasions Database and the Global
Invasive Species Programme (GISP). The species taxonomic information and bioregional
distributions were also added to the Access database. The combined BW discharge, environmental
matching and risk species coefficients provided the basis of the semi-quantitative risk assessment.
Graphic User Interfaces (GUIs) customised by the consultants for the Access database and ArcView
GIS were used to generate results tables and graphical outputs that were displayed on interactive maps
of the Demonstration Site and World bioregions. The various BWRA outputs can be printed, exported
to other software, or viewed interactively to enhance the user-friendliness and management utility of
the system.
The methods used to attain each objective of the BWRA Activity are summarised in the following
sections, with technical details of the risk assessment procedures provided in the GloBallast BWRA
User Guide. This manual was developed by the consultants to facilitate BWRA training and
demonstrations for all six GloBallast Pilot Countries. The BWRA User Guide comprises a separate
document that accompanies this report, and is available from the GloBallast PCU
(http://globallast.imo.org).
3.2
Resource mapping of the demonstration port
The port resources were mapped using ArcView GIS to display the bathymetric, navigational and
infrastructure features, including habitats and social-cultural features.
The National Cartographic Centre (NCC) in Tehran did not have an electronic chart covering Khark
Island in digital format at the time of the first visit, but indicated a detailed hydrographic survey had
recently been completed and that electronic bathymetric data would be available before December
2002. Thus the bathymetry and some navigational data were acquired digitally from a CARIS
electronic chart provided by the NCC during the consultant's second visit.
3 The complete set of source and destination ports identified for the six Demonstration Sites (723) remained
unknown until the end of the BWRF/port record data collation, database entry and checking phases (i.e. end of
the second round of in-country visits; 22 December 2002). A gap-filling effort was made by the consultants to
obtain the environmental parameters during January 2003, but this had to focus on the most frequently
recorded of these ports, since there was insufficient time or resources to order charts and search for the
environmental data for all of them (the majority of which were associated with few or only single vessel
arrivals). For these ports, their environmental matching values were provided by a comparison method
described in Section 4.6.
8
3 Methods
NCC also supplied two 1:25,000 topographic sheets (6048 II NW and 6048 I SW) covering Khark
Island, and these were acquired from a Microstation DGN format file, together with two 1:25,000
nautical charts of the neighbouring coast (Bandar Rig and Bandar Genaveh) in the same format. A
small scale chart of the northern ROPME Sea Area (RSA) was also acquired. The topographic sheets
were imported into ArcView and combined, and relevant data for the port map was also extracted
from the other files. Features taken included the major roads, large buildings, tanks and cultural sites.
The Iranian nautical chart showing the port and its approaches (I.R. Iran Series No. 11; Jazireh-Ye
Khark to Ganaveh) was also scanned for digital capture at 300 dpi. This chart also shows the nearby
mainland coast and has small-scale insets showing the export terminals and small boat harbours at
Khark Island. The images were registered in ArcView enabling extraction of relevant data including
annotated habitat details collected during the team's port visit in May 2002. The latter comprised the
boundaries of certain intertidal, subtidal and artificial marine habitats that were annotated to this chart
during the port visit.
The scope of the port map therefore includes the rocky Khark Island and its nearby sand cay, the
port's approaches and anchorage areas, and part of the adjacent mainland coastline. Symbols based on
the international IHO/IALA system were used to depict navigational features. For clarity and
convenience of data management and display, each `theme' of information was added as a separate
layer that were standardised as shown in Figure 4.
Figure 4. Thematic layers used for the Port Map GIS
The protocol for each layer is described in the GloBallast BWRA User Guide and summarised below:
Base Layer: The base layer includes important planimetric features such as depth contours, jetties,
important channels and other permanent or at least semi-permanent `reference' features that are
unlikely to change or move. The key features of the base layer for the Port of Khark Island comprised:
� The island and mainland coastlines (as depicted by the high tide mark on the nautical charts).
� The low tide mark (i.e. the 0 metre bathymetric contour of hydrographic charts).
� 5 metre isobath (often the first continuous contour below the low tide mark).
� 10 metre, 20 metre and 30 metre isobaths.
� Edges of the main shipping channels (often blue or purple lines showing the boundary of
depths maintained by port dredging programs).
Some key land features, including main roads, hill tops, towers and other prominent structures, were
also added to the base layer. The colour scheme of this layer closely followed that of standard nautical
charts to maintain the familiar depth effect.
Navigational Layer: The standard navigational symbols of the IHO/IALA system were followed as
closely as possible. ArcView's symbol libraries do not contain these international navigation symbols,
9
Ballast Water Risk Assessment, Port of Khark Island, Islamic Republic of Iran, August 2003: Final Report
and convenient third-party symbology could not be found despite extensive searches of public domain
web resources. Closest-match symbols were therefore developed for this purpose, using the UK
Hydrographic Office Chart No. 5011 (= IHO INT 1) as the main source for all point and pattern
symbols.
Habitat Layer: This layer used a standardised, logical colour scheme to facilitate recognition of the
main intertidal and subtidal habitat types in and near the port. It contains all habitat information
obtained from the field observations and benthic sampling data from the PBBS, together with the
annotations made by the BWRA team during the port tour. The latter was undertaken by launch, on
foot and snorkelling during 6-7 May 2002, with the boat inspection including a full circumnavigation
of the island. Colour 35 mm photographs and a 45 minute VHS video were obtained to record
significant features. Delineation of some boundaries for the habitat layer was supplemented from
features displayed by the nautical charts. These included the upper and lower boundaries of sand
beaches, rocky shores, cliff lines, high tidal lagoons and marsh areas, and fringing coral reef. Symbols
on the same charts that denoted the presence of sand, mud or rocky seafloor also helped fill in gaps.
Infrastructure Layer: This shows the key components of the port and its surrounding accommodation
and petroleum processing and export facilities, including the main tank farms, small boat harbour,
large buildings and other visually dominant structures on Khark Island.
Social-Cultural Layer: Features added to this layer included the urban and accommodation area used
by the port and oil terminal workers, mosques and significant shipwrecks that have been essentially
left undisturbed and respected as war grave sites. There is no dedicated fishing port on Khark Island,
nor any recreational, commercial or mariculture fishery areas, so these type of social resources were
not present for adding to this layer.
Berth Layer: An `active' berth layer was added to show the principal berthing and anchoring areas at
the Port of Khark Island. Their names and numbering system were supplied by PSO island staff. The
same nomenclature was also used for the berthing area information stored in the Access database, to
allow display of statistical summaries of the BW source and discharge data on the correct locations of
the GIS port map (the GloBallast BWRA User Guide shows how the database-GIS link is established).
3.3
De-ballasting/ballasting patterns
The deballasting/ballasting patterns at Khark Island were ascertained during the port visit (6-7 May
2002) where a meeting was held with the PSO Harbour Master to confirm the range of overseas and
domestic trade, pilotage and draft requirements, anchorage areas and deballasting/ballasting practises
and locations. Port shipping records were also inspected during this visit, and batches of these were
identified for photocopying to enable data verification and extraction at the PSO offices in Tehran.
Further information was obtained from the BWRFs that PSO had introduced to the Port of Khark
Island in April 2000, plus analysis of the port shipping records for periods/visits where BWRFs were
unavailable or incomplete4. It was relatively simple to determine where and which vessels probably
discharged BW by identifying their type and berthing location, because the port has dedicated liquid
and dry bulk export terminals plus a small vessel harbour where the various supplies and construction
materials for operating the terminals and onshore facilities are imported. Most of the latter cargo
arrives in coastal craft which have no ballasting requirement when unloading.
3.4
Identification of source ports
To provide confidence as to which ports are the predominant sources of BW discharged at Khark
Island, a sample of approximately 1500 vessel visits was generated by collating information on as
many ship visits as possible over the previous three years (March 1999 - November 2002) and adding
4 These records listed the vessel name, arrival and departure dates, berth, last and next ports of call, and cargo details.
10
3 Methods
the details to the Access database. Source ports were therefore identified from the BWRFs, and from
batches of photocopied shipping record sheets obtained from PSO's Khark Island office for March
1999 and subsequent months.
BWRFs were first collected from arriving ships by PSO staff at Khark Island in April 2000, and the
number of ships voluntarily submitting these forms was close to 40 per month in the first year (i.e.
approximately 60% of total arrivals). The forms were initially sorted by source port and country then
entered into the database. Before a new port was added to the database, the port and country name
spelling, its location coordinates, bioregion and unique UN Port Code number were checked using the
Lloyds Fairplay World Ports Guide and world bioregion list in the database (port data input is
detailed in the GloBallast BWRA User Guide).
Completed BWRFs for April and May 2000 (85) were cross-referenced with the port shipping records
for the same period (140 visits). Of the 55 visits where ships had not (or incorrectly) completed a
BWRF, 25 were mostly product and gas tankers shuttling between the Bandar Abbas refinery in
southern I.R. Iran and Khark Island. The remaining 30 were crude oil tankers and two bulk carriers
loading sulphur (Section 4.3).
For vessels arriving before BWRFs were requested by PSO, or which submitted incomplete or did not
submit forms, details were obtained from the PSO port shipping records. However these records show
only the Last Port of Call, which may not be the BW source. To confirm which last ports of call were
probable BW sources (and avoid allocating a bunkering, crew-change or maintenance port as such),
cross-checks were made of the source ports and last ports of call reported in other BWRFs. The
Lloyds Fairplay Port Guide and Lloyds Ship Register5 were also used to confirm source port trade
and the vessel's IMO identification number, vessel type and DWT of arriving ships respectively.
Many gaps in the port shipping records or BWRFs could therefore be filled by checking, for any
arrival, the vessel name, type and DWT, its previous visit history, last port/s of call and apparent
charter/liner trade, and by using a customised Excel spreadsheet supplied by the consultants to
estimate the amount BW discharged or taken up6 (Figure 5).
Figure 5. Working page of the Excel spreadsheet used to estimate BW discharges
The BWRFs were also analysed for completeness and accuracy. In the case of unusual (or missing)
BW values, these were checked using the same Excel spreadsheet to determine likely volumes based
on vessel type, DWT, last port/source port and loading record. This BWRF checking and gap-filling
5 A CD-ROM version of the 2001 Lloyds Ship Register was supplied to each Demonstration Site by PCU. These are much
faster to use than the large `directory style' hard-copy volumes.
6 The BW spreadsheet contains coefficients of ballast water taken up or discharged when loading or discharging
cargo (as percentages of DWT for each vessel type), based on ballast water capacity and discharge data from
other studies, BWRFs and Lloyds Ship Register.
11
Ballast Water Risk Assessment, Port of Khark Island, Islamic Republic of Iran, August 2003: Final Report
exercise was undertaken by Group B team members working in Tehran and Khark Island before and
during the second in-country visit, with the database of almost 1500 vessel visits constructed by:
� entering visit details from the port shipping records for the pre-BWRF period (March 1999-
April 2000) on the Excel spreadsheet, and using the Fairplay Port Guide and Lloyds Ship
Register to add or correct port details, vessel names, IMO ship numbers, types and DWTs;
and
� cross-checking incomplete, unusual or missing BWRFs with port shipping records, using the
Lloyds Ship Register, Fairplay Port Guide and the Excel spreadsheet to correct errors or add
missing data4,5.
3.5
Identification of destination ports
Since `prevention is better than cure', it is usually most effective to address environmental problems
as close to their source as possible. In the case of ballast-mediated aquatic bio-invasions, actions to
help ships prevent the uptake of organisms from ballasting areas may be more effective than trying to
treat the organisms once they are inside the tanks, or trying to manage the problem at the discharge
port. To date, however, the majority of actions addressing ballast-mediated introductions have been
driven and undertaken by ports and port States that receive BW, with little activity occurring at the
locations of BW uptake. The GloBallast programme has therefore been attempting to shift some of
the focus from shipboard/point-of-discharge measures towards reducing the uptake of organisms in
the first place.
Knowing the destinations where departing vessels will discharge their BW is an important step in
helping port States to reduce the spread of unwanted and potentially harmful species (either
introduced or native to their own ports) to their trading partners. It is also critical for preventing
unwanted species translocations between a State's domestic ports and/or its neighbouring foreign
ports. Determining the destinations of BW exported from the Demonstration Site was therefore an
objective of the GloBallast BWRA (Section 2).
Both the BWRFs and port shipping records for Khark Island list the Next Port of Call of all departing
vessels, and these were added to the database for analysis. However the next port of call may not be
where BW carried by a departing ship is discharged, either fully or partly. For example, the next port
may be a bunkering, crew-change or maintenance port, a port where a `top-up' or other minor cargo is
loaded, or a convenient regional `hub' port where ships anchor and wait for new sailing instructions.
To overcome this problem, a supplementary question needs to be added to the present IMO BWRF,
i.e. requesting the name of the port where discharge from each ballast tank is predicted. These ports
can be predicted by ships engaged on a regular liner service (e.g. most container ships, vehicle
carriers, Ro-Ro ships, LNG carriers and some bulk carriers). However for other ship types (and
occasionally the former) ship officers cannot reliably anticipate where BW discharges will be
necessary. For example, for bulk carriers, general cargo ships and tankers engaged in spot charter
work (or when completing a charter period), these vessels may often depart in ballast having received
a general sailing order to proceed towards a strategic location until further instructions.
In the case of the Port of Khark Island, there is little import of bulk cargo except for some fuel
products brought by a shuttle tanker from the Bandar Abbas refinery. Although the vast majority of
ships departing Khark Island have no or very little BW on board, the next ports of call were added to
the vessel visit data and examined, so that the Pilot Country team could gain experience for BWRAs
undertaken for a more cargo import/BW export-oriented port.
Adding the next port of call also improves the trading history for each vessel, and these can be useful
when trouble-shooting missing or incorrect BWRF data. As with the source ports, any new next port
of call added to the database was provided with its country name, UN Port Code, world bioregion and
location coordinates to enable its frequency of use by departing vessels to be displayed on the GIS
world map (port input details are in the GloBallast BWRA User Guide).
12
3 Methods
3.6
BWRF database
The Access database developed by the consultants manages all items on the IMO standard BWRF.
Entry, editing and management of the BWRF records are undertaken using a series of GUIs, as
described in Section 2 of the BWRA User Guide. The three `tab' pages of the GUI used for general
BWRF data and the individual ballast tank inputs are shown in Figure 6.
Items not listed on the BWRF but required by the database to run the risk analysis and display the
results on the GIS include the geographic coordinates, bioregion and UN code (a unique five letter
identifier) of every source and destination port, plus the DWT and berthing location of every arrival at
the Demonstration Site.
Many berthing locations had to be identified from the port's shipping records because the BWRA
objectives include identifying the locations within a Demonstration Site where deballasting/ballasting
occurs (Section 2). After the consultants first in-country visit (May 2002), PSO officers at Khark
Island began annotating the berthing location to submitted BWRFs to help reduce the data-entry
workload. Another item requiring frequent look-up was the vessel's deadweight tonnage (DWT)since
the BWRF requests only the gross tonnage (GT). As noted in Section 3.4, adding the DWT (present in
the Lloyds Ship Register) enables convenient checks of reported volumes and gap-filling of missing
values (see below).
Not all of the BWRF question fields need to be completed by a ship's officer to provide a visit record
that can be saved to the database and later included in the risk analysis. A basic visit record can be
established if three key items are entered. These are outlined in red on the input GUIs (Figure 6) and
are:
� Vessel identification - a unique 7 digit IMO number that remains the same for the life of the
ship, irrespective of any name changes;.
� Arrival date.
� A ballast tank code (which appears on the `Add Tank' sheet and provides an `All Tanks'
option for BWRFs that were submitted without individual tank details).
Without these items the database cannot save a visit / tank record or any other associated information.
Whether or not a saved record is included by the database for the risk analysis depends on which other
BWRF fields were completed or gap-filled. Key items are the source port and volume for each (or all)
ballast tanks discharged, and the berthing location. As described in Sections 3.4 and 3.5, important
BWRF information that is missing or incorrect can usually be substituted or corrected by cross-
checking with port shipping records, the Lloyds Ship Register and a comprehensive port directory
such as the Fairplay guide. However this is time-consuming, and it is far more efficient and reliable
for port officers to ensure the BWRF has been filled in correctly and completely at the time of
submission (Section 4.12).
The database contains reference tables to hold the checked details of every vessel and port previously
added. A new visit record is therefore made by entering the arrival date then using a series of drop-
down lists to select the vessel, source port, last port, next port, destination port and tank details
(Figure 6). This avoids the need to re-enter the same information over and over again, as well as the
risk of generating false, `replicate' vessel, port or tank names due to spelling mistakes on the BWRF.
Spelling mistakes on BWRFs were very common. All data-entry and database managers therefore
need to understand how to avoid transcribing such errors by carefully checking all names and ID
numbers using the database drop-down lists and, where necessary, by referring to a reliable ship
registry or port directory when entering the details of a new vessel or port respectively.
The most easily-trained and efficient database operators are those with previous port and maritime
experience since they (a) bring knowledge of the local shipping trade, (b) are familiar with the
problems of searching for vessel names (e.g. Tokyo Maru 2, Tokyo Maru II , Tokyo Maru No. 11 etc),
13
Ballast Water Risk Assessment, Port of Khark Island, Islamic Republic of Iran, August 2003: Final Report
and (c) are aware that the official name of many ports in Europe, Africa and South America may be
quite different from the English name (e.g. Vlissingen versus Flushing).
Figure 6. The three tabs of the GUI used for entering the BWRF data
14
3 Methods
3.7
Environmental parameters
During the briefing meetings in January 2002, the consultants provided a preliminary list of
environmental parameters that would be used to generate the environmental matching coefficients
between the Demonstration Sites and their main BW source ports and destination ports (Appendix 3).
The provisional list was based on review of previous port-to-port environmental analyses undertaken
for twelve trading ports in northeast Australia (Hilliard et al. 1997b). The final list of 34 parameters
used for the six Pilot Countries (Table 1) was selected in February 2002, during a joint review of the
provisional list by the consultants and scientists of the Institute of Biology of the Southern Seas
(IBSS) in Odessa7.
Table 1. Port environmental parameters used by the Environmental Similarity Analysis
Name
Variable Type
1.
Port type8
Categorical (1-6)
2.
Mean water temperature during warmest season (oC)
Scalable
3.
Maximum water temperature at warmest time of year (oC)
"
4.
Mean water temperature during coolest season (oC)
"
5.
Minimum water temperature at coolest time of year (oC)
"
6.
Mean day-time air temperature recorded in warmest season (oC)
"
7.
Maximum day-time air temperature recorded in warmest season (oC)
"
8.
Mean night-time air temperature recorded in coolest season(oC)
"
9.
Minimum night-time air temperature recorded in coolest season (oC)
"
10.
Mean water salinity during wettest period of the year (ppt)
"
11.
Lowest water salinity at wettest time of the year (ppt)
"
12.
Mean water salinity during driest period of year (ppt).
"
13.
Maximum water salinity at driest time of year (ppt).
"
14.
Mean spring tidal range (metres)
"
15.
Mean neap tidal Range (metres)
"
16.
Total rainfall during driest 6 months (millimetres)
"
17.
Total rainfall during wettest 6 months (millimetres)
"
18.
Fewest months accounting for 75% of total annual rainfall
Integer
19.
Distance to nearest river mouth (kilometres; negative value if upstream)
Scalable
20.
Catchment size of nearest river with significant flow (square kilometres)
"
Logarithmic distance categories (0-5): From the closest BW discharge location to nearest:
21.
Smooth artificial wall
Categorical
22.
Rocky artificial wall
"
23.
Wooden pilings
"
24.
High tide salt marsh/lagoon, saline flats or sabkah
"
25.
Sand beach
"
26.
Shingle, stony or cobble beach
"
27.
Low tide mud flat
"
28.
Mangrove fringe/mangrove forest
"
29.
Natural rocky shore or cliff
"
30.
Subtidal firm sandy sediments
"
31.
Subtidal soft muddy sediments
"
32.
Seagrass meadow9
"
33.
Rocky reef or pavement
"
34.
Coral reef (with carbonate framework)
"
The 34 parameters were steadily collated during course of BWRA activities for all Demonstration
Sites. They were taken or derived from data and information culled from a wide range of government,
7 Distance categories from the berthing area/s to the nearest rocky artificial wall, smooth artificial wall and
wooden artificial substrate were suggested by IBSS as they provide different types of hard port habitat.
8 Offshore terminal or mooring / Natural bay / Breakwater harbour / Tidal creek / Estuary / River port.
9 Kelp forest/macroalgae bank was not included but should be considered for future analysis.
15
Ballast Water Risk Assessment, Port of Khark Island, Islamic Republic of Iran, August 2003: Final Report
port and scientific publications, internet web sites, port survey reports and sampling records, SST and
salinity charts, climate databases, atlases, national tide-tables, nautical charts, coastal sensitivity and
oil spill habitat maps, oil spill contingency plans, aerial photographs, national habitat databases and
local expert advice (Appendix 4). The most difficult to find were reliable water temperature and
salinity data, particularly for identifying the averages, maxima and minima for ports in or near
estuaries (Section 3.12).
A preliminary list of frequently recorded BW source ports and destination ports for the Port of Khark
Island was made at the end of the first in-country visit in May 2002 (the complete list did not become
available until near the end of the second in-country visit; Section 3.1). It was agreed that the
environmental parameters for these ports should be sought between the first and second consultants'
visits, with PSO's Group C members focussing on ports in and near I.R. Iran, and the consultants
focussing on more distant ports in Asia, Europe, etc. To facilitate this task the consultants provided a
customised Excel spreadsheet for collating the environmental data, which included guidance and
reminder notes plus a format enabling direct export to PRIMER (Section 3.8).
Near the end of the second in-country visit, sufficient port environmental data had been collated to
generate environmental matching coefficients for approximately 40% of all ports identified as trading
with the Port of Khark Island, with estimates provided for ports where unobtained/incomplete data
prevented their inclusion in the multivariate similarity analysis (Section 4.6). The percentage of ports
with calculated environmental coefficients was subsequently expanded by a gap-filling exercise
undertaken by the consultants between 22 December 2002 and 31 January 2003. These were added to
the updated BWRA provided at the third meeting with PSO in February 2003 (Section 3.1) and
reported here.
3.8
Environmental similarity analysis
The more a BW receival port is environmentally similar to a ballast water source port, the greater the
chance that organisms discharged with arriving BW can tolerate and remain in their new environment
in sufficient numbers to grow, reproduce and develop a viable population. Comparing port-to-port
environmental similarities therefore provides a relative measure of the risk of organism survival and
establishment. This is the basis of the `environmental matching' method, and it facilitates estimating
the risk of ballast water introductions when the range and types of potentially harmful species that
could be introduced from a particular source port or its bioregion are poorly known. A limitation of
the environmental matching approach relates to the fact that some harmful species may have the
ability to tolerate a relatively wide range of temperature and salinity regimes. 10
As discussed, other risk factors include the frequency of ship visits/BW discharges, the volume of BW
discharged, voyage times and ballast tank size and any management measures applied during the
voyage. While environmental matching alone does not provide a complete measure of risk, an
analysis of `real world' invasions indicates that if any one factor is to be used alone, environmental
matching is probably the best single indicator of risk.
Classic examples include the two-way transfer and relatively rapid spread of harmful and other
unwanted species between the Ponto-Caspian and North American watersheds (some via stepping
stones in western Europe), and northern Australian ports that have extremely high risk factors in
terms of frequency and volumes of BW discharges (the very large bulk export ports of Port Headland,
Dampier and Hay Point and smaller bulk export ports like Weipa and Abbot Point), but which have
not experienced any significant harmful invasions (due to a low environmental matching with their
source ports). Conversely, in southern Australia and in particular Tasmania, ports which have
relatively low risk factors in terms of frequency and volumes of BW discharges, have been the entry
points of the most harmful aquatic bio-invasions (due to a high environmental matching with their
source ports).
10 For example, the Asian date mussel (Musculista senhousia) has been reported from Vladivostok to Singapore.
16
3 Methods
The environmental distances between the Port of Khark Island and its source and destination ports
were determined using a multivariate method in the PRIMER package. Of the various distance
measures available in PRIMER, the normalised Euclidean distance is the most appropriate.
Normalisation of the various input parameters removes the problem of scale differences, and the
method can manage a mix of scalable, integer and even categorical values provided the latter reflect a
logical sequence of intensity or distance/location steps. Individual variables cannot be weighted but
the predominance of temperature variables (8) and salinity/salinity-related parameters (8; see Table 1)
ensured they exert a strong influence on the results. Air temperature extrema, rainfall and tidal
parameters were included owing to their influence on the survivorship of intertidal and shallow
subtidal organisms11. The similarity values produced by PRIMER were examined using its clustering
and ordination modules, then exported back to the Excel file for conversion into environmental
matching coefficients before insertion into the database12.
To provide consistent and comparable results, the similarity analysis was conducted on a wide
geographical range of ports; i.e. from cold water ports in high latitude areas to warm water ports in
tropical regions, as well as from up-river terminals to those located in relatively exposed offshore
waters. This avoids the possibility of generating spurious patterns among a set of ports located in
neighbouring and/or relatively similar regions. Collating the environmental parameters for the
frequent source and destination ports of all six Demonstration Sites into a single Excel spreadsheet
achieved this, as well as permitting direct comparisons between the results from these sites13.
The Excel file used for collating the port environmental data also contains linked spreadsheets used
for their export to PRIMER, as well as for re-importing the results and converting them into
environmental matching coefficients. In fact the database can import any type of environment
matching value obtained by any method, provided the values are placed in an Excel spreadsheet in the
format expected by the database's import feature. Details on the treatment of the environmental
variables and the production, checking, conversion and import of the similarity measures are given in
the BWRA User Guide.
3.9
Risk species
One of the BWRA objectives was to identify `high-risk' species that may be transferred to and/or
from the Demonstration Sites (Section 2). The Access database was therefore provided with tables for
storing the names, distribution and other information on risk species. For the purposes of the BWRA
and its `first-pass' risk assessment, a risk species was considered to be any introduced, cryptogenic or
native species that might pose a threat if transferred from a source port to a Demonstration Site. The
taxonomic details, bioregion distribution, native/introduced status and level of threat assigned to a
species are also stored in the database and can be displayed for review, edit and update.
The database manages the bioregional locations and status of each entered species using the same
bioregions displayed on the GIS world map (Figures 7, 8). This map is used as a backdrop for
displaying the source and destination ports and associated BWRA results, and was compiled from a
bioregion map provided by the Australian Centre for Research on Introduced Marine Pests (CRIMP).
The boundaries of some bioregions were subsequently modified according to advice provided by
Group C marine scientists in five of the six Pilot Countries. The modifications included adding new
11 While ecosystem disturbance, pollution, eutrophication and other impacts on habitats and water quality can
increase the `invisibility' of port environments (particularly for r-selected species), these were not included
owing to the problem of obtaining reliable measures of their spatial extent and temporal nature at each port.
12 As described in the BWRA User Guide, a simple proportional conversion of the similarity values was made
so that each matching coefficient lay between 1 (a perfect environmental match) and 0.01 (least matching),
since it is unsafe to assume a port environment can be totally hostile no matter how distant.
13 The total number of ports with a complete set of environmental parameters obtained by the end of the data
collation phase was 357. These were provided to all Demonstration Sites during the third consultant's visit
in February-March 2003 and used for this report.
17
Ballast Water Risk Assessment, Port of Khark Island, Islamic Republic of Iran, August 2003: Final Report
bioregions for several large river systems to accommodate some important river ports that trade with
one or more of the Demonstration Sites. The map presently displays 204 discrete bioregions which are
coded in similar fashion as those in the IUCN scheme of marine bioregions from which they were
derived (Kelleher et al. 1995; see Appendix 3 of the GloBallast BWRA User Guide for details).
Figure 7. Part of the GIS world map of marine bioregions,
showing the code names of the regions in and near the ROPME Sea Area
Bioregions serve multiple purposes and are required for several reasons. Many marine regions of the
world remain poorly surveyed and have a limited marine taxonomy literature. This causes a patchy
and essentially artificial distribution of recorded marine species distributions. Few marine species
surveys have been undertaken in port environments and there are very few bioregions which contain
more than one port that has undertaken a PBBS.
Bioregions represent environmentally similar geographic areas. Thus if a species is found established
in one part of a bioregion, there is a good chance it can spread via natural or human-mediated
processes to other sites in the same bioregion. A conservative approach was therefore adopted for the
GloBallast BWRA, whereby a risk species, if recorded in at least one location of a bioregion, is
assumed potentially present at all source ports within the same bioregion. This type of approach will
remain necessary until a lot more PBBSs are conducted and published. Because taxonomic analyses
of the PBBS samples of the Demonstration Sites had not been completed by the consultants second
visits, the reverse stance was adopted for these ports (i.e. it was assumed they did not contain any risk
species recorded at other location/s in their bioregion).
The corresponding set of bioregions stored in the database has particular sets of risk species assigned
to them. The species and associated data added to the database over the course of the Activity were
collated from a wide range of sources. These included preliminary lists of molluscs and dinoflagellate
cysts found by the recent GloBallast PBBS of Khark Island (which became available during the
second consultants visit). Some of the provisional dinoflagellate identifications and one gastropod
identification (Cavolinia tridentate) represent range extensions into the northern RSA. PSO members
of Group C also investigated the possible existence of introduced species lists held by marine
biologists in agencies and universities in the RSA and Arabian Sea regions but none could be found.
18
3 Methods
Figure 8. Complete GIS world map showing the marine bioregions
[to improve clarity, not all bioregion codes are shown in this example]
Sources used for developing the risk species database are listed in Appendix 5 and included a range of
literature plus international and regional internet databases, including those being developed by the
19
Ballast Water Risk Assessment, Port of Khark Island, Islamic Republic of Iran, August 2003: Final Report
Smithsonian Environmental Research Center (SERC), CSIRO's National Introduced Marine Pests
Information System (NIMPIS), the Global Invasive Species Programme's (GISP) Global Invasive
Species Database, and the Baltic, Nordic and Gulf of Mexico web sites. The database used for the
`first-pass' risk assessments and provided to the Demonstration Sites during the consultants last visit
(February 2003) contains 421 species, but these do not represent a complete or definitive global list.
Thus the database tables and their associated Excel reference file represent a working source and
convenient utility of risk species information that can be readily updated and improved.
To provide a measure of the risk species threat posed by each source port, the database analyses the
status of each species assigned to each bioregion and generates a set of coefficients that are added to
the project-standard calculation of relative overall risk (Section 3.10). The following description is
summarised from Section 6 of the GloBallast BWRA User Guide, which describes how the species
data are managed and used by the BWRA system.
The database allows each species to be assigned to one of three levels of threat, with each level
weighted in log rhythmic fashion as follows:
� Lowest threat level: This is assigned to species with no special status other than their
reported or strongly suspected introduction by BW and/or hull fouling14 in at least one
bioregion (i.e. population/s with demonstrated genetic ability to survive transfer and establish
in regions beyond their native range). A fixed weighting (1) is applied to each of these species
when present in bioregions outside their native range. This was also the default level assigned
to any new species when first added to the database.
� Intermediate threat level: This level is assigned to any species suspected to be a harmful
species or invasive pest. Risk species assigned to this level receive a default weighting value
of 3 in both their native and introduced bioregions.
� Highest threat level: This level is assigned to known harmful invasive species, as reported in
institutional or government lists of aquatic nuisance species and pests, and/or in peer-
reviewed scientific journals. The default weighting value applied to these species is 10.
The database allows users to change the threat status level assigned to each species, as well as the size
of the second and third level default weighting values. A third type of risk species weighting option is
also available. This can be used to proportionally increase the weight of all source port threat
coefficients by increasing its default value of 1. The four default values (1, 3, 10 and 1) provided a
`project standard' result to permit unbiased comparisons between the `first-pass' BWRA results for
each Demonstration Site.
The database calculated the coefficient of `risk species threat' posed by each source port, with each
port value representing a proportion of the total risk species threat. The latter was the sum of all
weighted risk species assigned to the bioregion of all source ports that export BW to the
Demonstration Site. Species assigned to more than one bioregion are summed only once, and the
algorhythm automatically discounted any species that was native in the Demonstration Site's
bioregion. It included any introduced species assigned to the bioregion of the Demonstration Site
since, as discussed above, the Demonstration Site was assumed to be free of risk species. This was the
default position of the project-standard BWRA15.
14 At the outset of the project, species capable of transfer only by ballast water were planned to be added to
the database. However many species may be introduced by hull fouling as well as BW, with the principal
vector for many of these remaining unclear. Group C scientists in all Pilot Countries were unanimous in
their preference for including all species introduced by ballast water and/or hull fouling in the project
standard BWRA database. For future BWRAs a `vector status' value could be assigned to each species in
the database, so that risk assessments could be focussed on either or both of these shipping-mediated
vectors.
15 When the taxonomic identifications of the recent port biological baseline surveys are completed, risk
species confirmed as already present at a Demonstration Site may be identified for the BWRA database
maintained for that site. Their deletion would reduce the size of the risk species coefficients obtained by the
20
3 Methods
The risk species coefficient for each source port is therefore calculated by firstly summing the number
of non-indigenous species (NIS) in that port's bioregion which have no suspected or known harmful
status. This provides a measure of the low level `weedy' and sometimes cosmopolitan species which,
although having no acknowledged harmful status, have proven transfer credentials that could enable
their establishment in another port with probably low but nevertheless unpredictable biological or
economic consequences. This number is then added to the sums of suspected and known harmful
species in the same bioregion (these include any native species identified as such by Group C local
scientists). The default calculation for the risk species coefficient for each source port (C) is thus:
CSource Port = (NIS + [Suspected Harmfuls x 3] + [Known Harmfuls x 10] ) / Total SumAll Source Ports
The C values lie between 0-1 and represent an objective measure of the relative total species threat,
since the only subjective components within the BWRA are the `universal' assignments of species to
particular levels of threat, plus the weightings attached to these levels. Note that the C values for
source ports inside the same bioregion will be the same, and that the Total Sum divisor does not
represent all species in the database, but only those assigned to bioregions containing source port/s
that actually trade with the Demonstration Site.
It should also be noted there are several limitations from incorporating a risk species coefficient into
the default calculation of the `first-pass' BWRAs. These included, inter alia :
� Use of an incomplete list of species that were assigned to one of the three levels of threat
(introductions, suspected harmful species, known invaders).
� Significant knowledge gaps on the global distribution of many native, cryptogenic and
introduced species (as a consequence of the limited number of species surveys that remain
geographically biased to parts of North America, Europe and Australian/New Zealand).
� Reliance on a restricted list of `target' species that are known to be invaders in certain areas,
but ignoring the possibly huge number of native species and unknown introduced species
potentially present in source ports that may well be potential invaders at the receival port.
� Reliance on an extremely restricted knowledge of the distribution (both native and
introduced) of the `target' species, derived from extremely limited and restricted (both
spatially and temporally) survey and monitoring efforts.
� Severe limitations in global understanding of general marine taxonomy, biodiversity,
biogeography and environmental tolerance ranges of marine species.
� Gaps and constraints in the taxonomy and reliable identifications for many aquatic species
groups.
Such limitations must be taken into account when considering the weighting of the risk species
coefficient relative to the other risk factors such as environmental matching.
3.10 Risk assessment
Approach
The database employed the ballast discharge, environmental matching and species distribution/threat
data to calculate, as objectively as possible, the relative risk of a harmful species introduction to a
Demonstration Site, as posed by the discharges of water and associated organisms that had been
ballasted at each source port. A GUI enabling convenient alteration of the risk calculations and
weighting values, plus use of ArcView to geographically display results, improves the system's value
as an exploratory utility and demonstration tool.
`first-pass' BWRA such as reported here for Khark Island, but the revised database should not be copied for
other port BWRAs.
21
Ballast Water Risk Assessment, Port of Khark Island, Islamic Republic of Iran, August 2003: Final Report
The semi-quantitative method aims to identify the riskiest tank discharges with respect to a
Demonstration Site's present pattern of trade. Unlike a fully quantitative approach, it does not attempt
to predict the specific risk posed by each intended tank discharge of individual vessels, nor the level
of confidence attached to such predictions. However, by helping a Demonstration Site to determine
its riskiest trading routes, exploring the semi-quantitative BWRA provides a coherent method for
identifying which BW sources deserve more vessel monitoring and management efforts than others.
Risk coefficients and risk reduction factors
For each source port, the database uses four coefficients of risk (C1-C4) and two risk reduction factors
(R1, R2) to produce a relative overall measure of the risk of a harmful species introduction at the
Demonstration Site. The database GUI shown in Figure 9 can be used to remove one or more of these
components, or alter the way they are treated, from the default `project-standard' formula used for the
first-pass BWRA. The four risk coefficients calculated for each source port by the database are:
C1 � proportion of the total number of ballast tank discharges made at the Demonstration Site,
C2 � proportion of the total volume of BW discharged at the Demonstration Site,
C3 � port-to-port environmental similarity, as expressed by the matching coefficient,
C4 � source port's contribution to the total risk species threat to the Demonstration Site, as posed
by the contemporary pattern of trade (1999-2002).
In biological terms, C1 and C2 represent the frequency and size of organism `inoculations'
respectively. C3 provides a measure of the likely survivability of these inoculated organisms, and C4
the relative threat posed by the organisms that comprise each inoculation. Each coefficient has values
between 0-1 except C3, where the lowest value was set to 0.01 (it is unsafe to assume a port
environment can be sufficiently hostile to prevent survival/establishment of every transferred
introduced species; Section 3.8).
The two risk reduction factors calculated by the database are R1 (effect of ballast tank size on C2) and
R2 (effect of tank storage time on C4). R1 represents the effect of tank size on the number and
viability of organisms that survive the voyage, since water quality typically deteriorates more rapidly
in small tanks than large tanks (owing to the volume/tank wall ratio and other effects such as more
rapid temperature change, with mortality rates generally higher in small tanks). As shown below, no
risk reduction was applied to any source port dispatching vessels with tank volumes greater than 1000
tonnes.
R2 represents the effect of tank storage time on the range and viability of discharged organisms.
Survival of most phytoplankton and aerobic biota inside any tank decreases with time, with relatively
high survival rates reported for voyages less than 5 days (as shown below, this was adopted as the cut-
off point for any risk reduction due to in-tank mortality). If the focus is only on long-lived anaerobes,
dinoflagellate cysts or pathogens (all of which have long tank survival rates), then R2 can be deleted
from the BWRA calculation, using the GUI shown in Figure 9 (details are in the GloBallast BWRA
User Guide).
The database calculates the tank storage time by subtracting the reported tank discharge date from the
ballast uptake date. For incomplete BWRFs with missing discharge or uptake dates, the vessel arrival
date plus a standard voyage duration at 14 knots16 were used to estimate the BW uptake date for
adding to the database.
16 The voyage duration between ports for particular vessel speeds are tabled in many maritime guides and
atlases, such as the Lloyds Maritime Atlas of World Ports and Shipping Places and the 2001 Fairplay Port
Directory.
22
3 Methods
Figure 9. Database GUI used for manipulating the BWRA calculation and weightings
The database automatically provides values for R1 and R2 using a log rhythmic approach17, with the
project-standard BWRAs applying the following default (but adjustable) R1 and R2 risk-reduction
weightings to C2 and C4 respectively:
R1
Maximum tank volume discharged (tonnes) in
<100
100-500
500-1000
>1000
the database record for each source port
W4
Default risk-reduction weighting applied to C2
0.4
0.6
0.8
1
R2
Minimum tank storage time (days) in the
<5
5-10
10-20
20-50
>50
database record for each source port
W5
Default risk-reduction weighting applied to C4
1
0.8
0.6
0.4
0.2
Although all information reported in the ballast tank exchange section of the BWRFs was entered into
the database, the `first-pass' BWRA did not use these data to apply a risk reduction factor for each
source port route for the following reasons:
� implementation of the BWRFs at the Demonstration Sites has been relatively recent, and the
tank exchange did not provide a sufficiently consistent or reliable sample of ballast
importation for most sites (Section 3.4);
17 As with the risk species threat level weightings, a log rhythmic approach is appropriate for risk reduction
factors in biological risk assessments.
23
Ballast Water Risk Assessment, Port of Khark Island, Islamic Republic of Iran, August 2003: Final Report
� BWRF implementation was generally on a voluntary basis, with no formal mechanism
compelling all vessels to submit fully completed forms at Khark Island;
� insufficient vessel inspection/ tank monitoring data were available for checking claimed
exchanges and their locations (often unrecorded);
� discounting whether or not effective exchange/s were taking place (a) removed the need to
predict the size of the risk reduction, and (b) was precautionary with respect to the ability of
exchanges to remove all organisms taken up at the time of ballasting.
BWRA Calculation
As shown in Figure 9 and described in the GloBallast BWRA User Guide, the database GUI allows the
six components of the BWRA calculation and the five weighting factors to be altered from the default,
`project-standard' setting. The GUI can therefore be used to explore how particular risk components
and their treatment influence the final result, and also improves the demonstration value of the system.
One example is the way the environmental matching coefficient (C3) is treated by the BWRA
calculation. For scientists who consider that C3 should be treated as an independent coefficient of risk
(see below), then the formula for calculating the relative overall risk (ROR) posed by a source port is:
(1) ROR = ( C1 + [C2 x R1W4] + C3 + [C4 x R2W5] ) / 4
Equation (1) is the default setting used for the project-standard BWRA for each Demonstration Site.
In this case, ROR is the combined measure of the proportional `inoculation' frequency (C1) and size
(C2), the relative similarity of the source port/Demonstration Site environmental conditions (C3), and
the relative level threat posed by the status of species assigned to the source port's bioregion (C4).
The division by 4 keeps the result in the 0-1 range to allow the convenient expression of the ROR as a
ratio or percentage of the total risk posed by all the source ports.
For those who consider that the proportional risk species threat (C4) should provide the focal point of
the risk calculation, they may prefer to treat C3 as a risk reduction factor for influencing the size of
C4, rather than using it as an independent `surrogate' coefficient to help cover unidentified or
unknown species. The GUI allows the formula to be changed to reflect this approach, in which case
C3 would be applied as follows:
(2) ROR = ( C1 + [C2 x R1W4] + [C3 x C4 x R2W5] ) / 3
[divisor is now 3 because of the reduced number of summed coefficients].
For a source port in a bioregion with a large number of risk species (i.e. at relatively high C4 such as
0.2) but with an environment very dissimilar to the Demonstration Site (e.g. C3 = 0.2), then Equation
(2) would reduce C4 by 0.04 (i.e. an 80% reduction). If the minimum tank storage time was relatively
long (e.g. R2 was between 10-20 days for the quickest voyages, so W5 = 0.6), then C4 would be
further reduced to 0.024 (i.e. an 88% reduction to its initial value).
Equation (2) is logical provided the database contains an accurate distribution of appropriately
weighted risk species in the various bioregions (including native species considered potentially
harmful if they established in other areas). However Equation (2) is less conservative than Equation
(1), particularly if there are doubts that C4 provides a true picture of potential risk species threat. As
shown in Table 2, Equation (1) produces higher ROR values, unless a single source port accounts for
over 50% of the frequency (C1) and volume (C2) of the total discharges at a Demonstration Site (this
is highly unlikely).
The database also allows users to increase the influence of C4 on the ROR by increasing the default
value of the overall W3 weighting factor from 1 (but see the caution in Section 3.10). Increasing the
size of C4 has more affect in Equation (1) because C3 has less influence on the size of C4.
24
3 Methods
Table 2. Examples showing how Equation (1) provides more conservative outcomes than (2) for typical
situations*
Relative Proportion of Proportion of
Enviro-
Relative
Overall
discharge
discharge
mental
Risk species
(*when C1 and C2 are less than 50%)
Risk
Frequency
Volume
matching
threat
ROR
C1
C2
C3
C4
ROR
= [C1 + C2 + C3 + C4] / 4 Equation (1)
0.150
0.1
0.1
0.2
0.2
ROR = [C1 + C2 + (C3 x C4) ] / 3 Equation (2)
0.080
0.1
0.1
0.2
0.2
ROR
= [C1 + C2 + C3 + C4] / 4 Equation (1)
0.200
0.2
0.2
0.2
0.2
ROR = [C1 + C2 + (C3 x C4) ] / 3 Equation (2)
0.147
0.2
0.2
0.2
0.2
ROR
= [C1 + C2 + C3 + C4] / 4 Equation (1)
0.350
0.5
0.5
0.2
0.2
ROR = [C1 + C2 + (C3 x C4) ] / 3 Equation (2)
0.347
0.5
0.5
0.2
0.2
ROR
= [C1 + C2 + C3 + C4] / 4 Equation (1)
0.400
0.6
0.6
0.2
0.2
ROR = [C1 + C2 + (C3 x C4) ] / 3 Equation (2)
0.413
0.6
0.6
0.2
0.2
ROR
= [C1 + C2 + C3 + C4] / 4 Equation (1)
0.450
0.7
0.7
0.2
0.2
ROR = [C1 + C2 + (C3 x C4) ] / 3 Equation (2)
0.480
0.7
0.7
0.2
0.2
ROR
= [C1 + C2 + C3 + C4] / 4 Equation (1)
0.550
0.9
0.9
0.2
0.2
ROR = [C1 + C2 + (C3 x C4) ] / 3 Equation (2)
0.613
0.9
0.9
0.2
0.2
Managing and displaying the results
When the database is requested to calculate the BWRA, it generates a large output table that lists all
sources of tank discharges recorded at the Demonstration Site, as entered from the BWRFs and/or
derived from the port's shipping records. The table shows the ROR values plus their component
coefficients and reduction factors. Because the Demonstration Sites have a large number of source
ports (80-160), trends are difficult to see within long columns of tabled values. The ROR results are
therefore further manipulated by the database to provide additional columns showing:
� the risk category of each source port, as placed in one of five levels of risk for displaying on
the GIS world map;
� a standardised distribution of the ROR results, i.e. from 1 (highest ROR value) to 0 (lowest
value).
The five risk categories are labelled `highest', `high', `moderate', `low' or `lowest', with their
boundaries set at equal linear intervals along the 0-100% scale of cumulative percentage risk (i.e. at
80%, 60%, 40% and 20% intervals). This is the default setting used for the project-standard BWRAs.
The database GUI (Figure 9) allows users to shift one or more of these boundaries to any point on the
scale. For example, a log�based distribution of the five risk categories may be preferred and is easy to
produce using this GUI.
In the case of the standardisation, the database applies the following simple manipulation to expand
the distribution of ROR values to occupy the 0-1 range, where 1 represents the maximum ROR value
and 0 the minimum value:
RORSTANDARDISED = (ROR � RORMINIMUM) x 1/ (RORMAXIMUM � RORMINIMUM)
This facilitates comparisons between BWRA results from other sites, as well as from different
treatments of the ROR formula and/or the weightings. As with the ArcView GIS, the database was
designed to optimise the user-friendliness, flexibility and management utility of the system.
Rationale for undertaking `Project Standard' BWRAs
The flexibility provided by the database allows users to investigate and demonstrate various
permutations and avenues without requiring specialised knowledge in database construction and
editing. However it was important to apply a consistent, straightforward approach to the `first-pass'
25
Ballast Water Risk Assessment, Port of Khark Island, Islamic Republic of Iran, August 2003: Final Report
BWRA for each Demonstration Site, so their outcomes could be compared and contrasted to help (a)
evaluate the system and approach, and (b) identify areas where changes could improve future use.
Each Demonstration Site has a particular trade profile and associated pattern of
deballasting/ballasting. Their divergent geographic locations further contributes to their possession of
unique sets of BW source ports which have relatively limited overlap.
Thus if results from any two or more Demonstration Sites are to be compared, all of their shared and
non-shared source ports and bioregions need to be combined for calculating the environmental
matching and risk species threat coefficients. It was therefore decided that, because the six sites
effectively span the globe, the `project-standard' BWRAs undertaken for each site should use the
same global set of source port environment and risk species data. This ensures the port-to-port
similarities and risk species threats were based on the widest possible range of port conditions and
species distributions, thereby reducing the potential for spurious results resulting from overly narrow
regional approaches (Section 3.8).
3.11 Training and capacity building
Members of the consultants team worked with their Iranian counterparts to provide BWRA guidance,
training, software and associated materials on the following occasions:
Occasion/ Date
BWA Activity Tasks
Consultants
Location and
[working days]
Counterparts*
Activity Kick-
Presentation, briefing and logistics meetings
R Hilliard
NIO Offices
Off
to:
in Goa.
January 2002
� Identify equipment and counterpart
CFP/CFPAs from
[1.5 days]
requirements
all Pilot Countries
� Develop provisional pilot country visit
schedule
1st Country Visit � Introductory half-day seminar
C Clarke
PSO offices at
May 2002
� Install and check computer software
T Hayes
Tehran and Khark
[7 days]
�
R Hilliard
Island.
Commence training and capacity building
Group A
� Begin GIS mapping of port and resources
counterparts
� Port familiarisation tour
Group B
� Review BWRFs and Port Shipping
counterparts
Records
Group C
�
counterparts
Commence BWRF database development
& training
� Review port environmental data and
identify sources
� Seminar & tutorials on multivariate
similarity analysis
� Identify data collation/input tasks before
2nd visit
26
3 Methods
2nd Country
� Update Database GUIs, add-ins & make
C Clarke
PSO Offices,
Visit
ODBC links
T Hayes
Tehran
December 2002
�
R Hilliard
Group A
Continue training and capacity building
[12 days]
counterparts
� Complete GIS mapping of port and
Group B
resources
counterparts
� Complete BWRF database development
Group C
and training
counterparts
� Complete port environmental data
assembly/training
� Complete environmental similarity
analysis training
� Generate environmental matching
coefficients
� Add risk species data to database, refine
bioregions
� Complete BWRA training and undertake
first analysis
� Hold seminar to review and discuss results
� Discuss pilot country needs for future
BWRA
3rd `Wrap-up'
� Provide Database containing all port
C. Clarke
PSO office,
Visit
environmental and risk species data obtained
Kish Is.
February 2003
for the six sites
Group A leader
[2 days]
� Provide updated BWRA User Guide and
Group B leader
final training on BWRA system operation
Group C leader
� Review and discuss updated BWRA
results
* refer Appendix 2 for project team structure and counterpart details.
At the kick-off meeting in January 2001, CFP/CFPAs were briefed on the nature, objectives and
requirements of the activity. An introductory PowerPoint presentation describing the BWRA system
proposed for achieving the BWRF objectives was made, and logistics meetings with individual Pilot
Countries subsequently held. A project check-list and briefing document were distributed listing the
computer hardware and peripherals required at each Demonstration Site plus the proposed structure of
the joint Pilot Country-consultants project team (see Appendices 2 and 3). Appropriate experience of
Pilot Country counterparts for the three groups forming the team was emphasised during the kick-off
meetings.
During the subsequent in-country visits by the consultants, the main BWRA training and capacity-
building components provided were as follows:
� Supply of software licences and User Guide and installation of ESRI ArcView 3.2 and
PRIMER 5.
� Guidance and `hands-on' training and in GIS mapping of marine resources.
� Supply of 2001 CD-ROM edition of the Lloyds Ship Register, and customised Excel
spreadsheet file for convenient collation of vessel identification and DWT data and reliable
estimation of BW discharges from port shipping records, for the pre-BWRF period and
BWRF checking.
� Guidance, `hands-on' training and assistance with the Access database and BWRF
management.
27
Ballast Water Risk Assessment, Port of Khark Island, Islamic Republic of Iran, August 2003: Final Report
� Guidance, `hands-on' training and glossaries of terminology on the collation, checking, gap-
filling and computerisation of BWRFs and principles of database management.
� Guidance and assistance on (a) search, collation and computer entry of environmental data for
important BW source and destination ports, and (b) the terminology, networking, data
collation and management requirements for species information used for the risk species
threat coefficient.
� Tutorial, `hands-on' training and assistance on theory, requirements and mechanics of
multivariate similarity analyses of port and coastal environmental data.
� Tutorial, guidance, `hands-on' training, seminars and PowerPoint material on BWRA
approaches, methods and results evaluation.
� Supply of electronic BWRA User Guide with glossaries and technical appendices.
To promote collaboration, understanding and continuity among the three groups, the consultants
arranged for group counterparts to provide presentations and guidance to other group members during
the 2nd visit.
During the first consultant's visit, the PSO leader of Group B arranged a demonstration of a prototype
BWRF database that had been developed in Tehran. This was a self-extracting Delphi application
using a `flat-sheet' binary code database to facilitate the import, edit, management and export of
BWRF data. The prototype did not use the tank discharges as the principal unit and had few features
for accelerating data input, checking and protection, and was therefore not used. However some of its
output features had user-friendly data selection and export/printing features and these were emulated
in the revised database. The prototype was also revised and subsequently circulated to the other Pilot
Countries by the PCU.
3.12
Identification of information gaps
This was a critical part of the activities undertaken during the first in-country visit by the consultants,
with attention focussed on locating, collating and checking the following BWRA components:
� Completeness of BWRFs submitted by vessels arriving at the Demonstration Site.
� Gaps, legibility and authenticity of information reported in the returned BWRFs.
� Sources and availability of shipping records for BWRF gap-filling.
� Existence of electronic and paper charts, topographic and coastal resource maps, atlases,
aerial photographs and publications for GIS port map.
� Sources, reliability and extent of port environmental data and coastal resource information for
Demonstration Site and its trading ports in the Pilot Country and region.
� Sources and extent of marine species records, information and researchers on introduced
species in and near the Pilot Country.
At the end of the first country visit, the status of the above were reviewed and a list of gap-filling
tasks, as allocated to the Pilot Country groups or consultants and to be undertaken by the second visit,
were agreed upon and minuted. Follow-up gap-filling tasks were also conducted during and after the
second visit.
28
4 Results
4.1 Description of port
General features
The Port of Khark Island is located in the north-western end of the ROPME Sea Area (RSA) at 29o
14.0' N and 50o 19.0' E, and approximately 20 km to the nearest parts of I.R. Iran's mainland coast
(Figures 2,11). It is a relatively small limestone rocky island (~50 km2) with an undulating central
escarpment and steep terraces. The latter terminate at the shoreline to form rocky ledges separated by
narrow sand beaches. Much of the immediate sublittoral zone is a generally narrow and shallow
platform (0-2 m LAT) which terminates at a fringing reef that slopes steeply into deeper waters (10-
20 m LAT). Immediately north of the island is a low-lying, elongate and uninhabited sand cay
supporting a partly vegetated ridge and surrounded by a fringing coral reef (see Section 4.2 for habitat
details and maps).
The majority of Khark Island is occupied by infrastructure and facilities for the reception, processing
and export of petroleum products and dry bulk sulphur and rock. Development of Khark Island
commenced in the late 1950s and 1960s. The port is now one of the world's largest crude oil export
terminals, with exports typically exceeding 75 million tonnes per annum.
Climate and weather
The divergent seasonal climate comprises very hot, arid summers with variable sea breezes and cool
and generally dry winters dominated by cool northerly winds. Mean day-time temperatures regularly
exceed 32oC during summer (maxima to 47oC) while night-time temperatures regularly fall below
17oC in winter (minima to 7oC). Rainfall is low, with over 75% of the annual average (156 mm)
occurring in late winter-early spring (January-April). An annual wind rose showing the dominance of
the northerly winds, which is typical of the RSA, is shown in Figure 10.
Figure 10. Annual wind rose typical of the RSA region (supplied by GEMS)
29
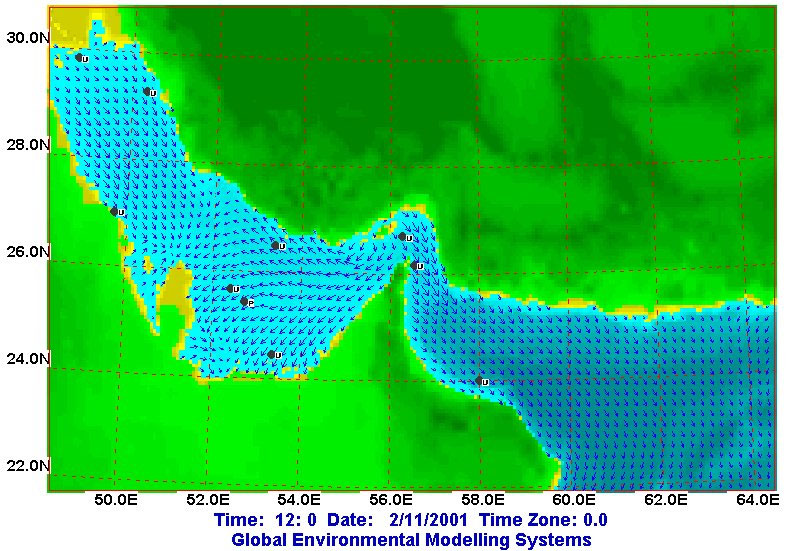
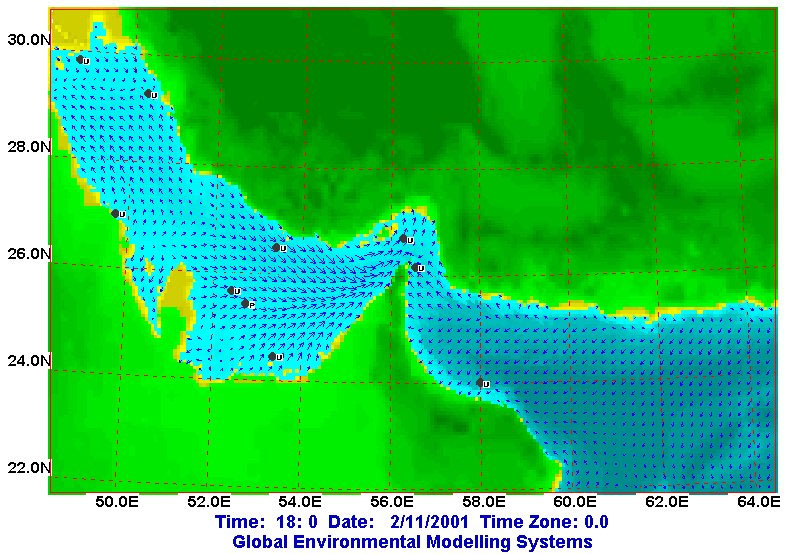
Ballast Water Risk Assessment, Port of Khark Island, Islamic Republic of Iran, August 2003: Final Report
Hydrodynamic conditions
There has been no local hydrodynamic study at Khark Island that provides detailed water movement
plots suitable for adding to the port map as a special layer. However the consultants were able to
obtain broad-scale tidal plots for the RSA from Dr G. Hubbert (Global Environmental Modelling
Systems (GEMS), Melbourne). Plots of the spring tide cycle are shown in Figure 11. These were
generated by the GEMS three-dimensional Coastal-Ocean Model (GCOM3D) in a collaborative study
with the US Navy Research Laboratory. The model is calibrated to local tide gauge data (sites are
shown on Figure 11, including Khark Island) and it reveals the complexity of tidal-driven water
movements in the RSA owing to the presence of amphidromic points (i.e. locations with zero tidal
rise and fall).
Khark
Khark
Figure 11. GCOM3D predictions of wind- and tidal-driven surface currents during strong northerly winds and
spring tides, showing the complex circulation pattern and model verification locations in the RSA. Bottom plot
shows the opposing tidal phase (supplied by GEMS, Melbourne).
Tidal currents at Khark Island are not particularly strong owing to the relatively small tidal range,
which is close to 1.0 m during springs and 0.3 m during neaps. Strongest flows can be expected off
the northern and southern tips of the island during spring flood and ebb tides, in directions past Khark
Island that are generally parallel to the mainland coast.
30
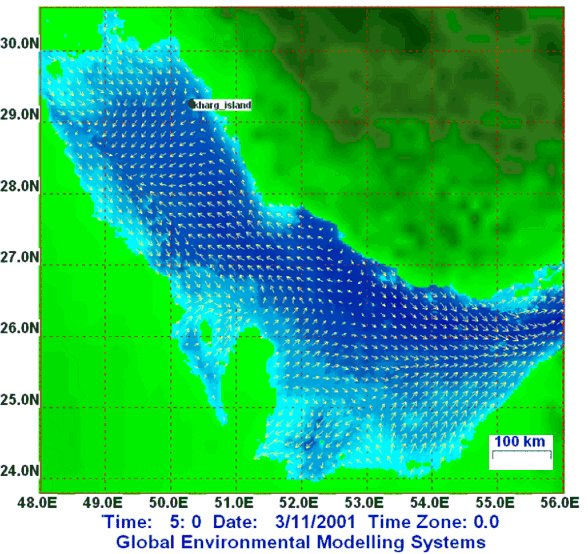
4 Results
During periods of strong north-westerly winds (as in the model outputs shown in Figure 11), the
spring tidal flows provide little evidence of any net residual or `background' surface water drift to the
north-west or west in the Khark Island region. The latter is associated with a generally anti-clockwise
surface current gyre which has been reported to frequently operate in the northern sector of the Gulf.
This gyre is linked to both wind- and density-driven flows, including the movement of lower density
surface waters from the Tigris and Euphrates rivers to the north, and from the oceanic waters moving
into the RSA from the Straits of Hormuz and along the Iranian coast. The latter inward flow is linked
to the significant evaporation losses within the RSA plus the underlying outward flow of dense
hypersaline waters.
As shown in Figure 12, the shore-parallel flows past Khark Island are diminished when winds weaken
or shift to the north and north-east (most frequent from winter to late spring /early summer). At these
times there can be a significant offshore drift at Khark Island that is almost perpendicular to the coast,
and forms part of the gyre that develops in the northern half of the RSA. The path of the gyre is
depicted by the red arrows in Figure 12, which also shows how tidal currents can contribute to the
gyre. The plots in Figures 11 and 12 therefore indicate that the majority of planktonic organisms
deballasted at Khark Island, plus any locally produced planktonic eggs, larvae or other propagules,
will tend to drift either parallel or away from I.R. Iran's mainland coast under most metocean
conditions. The same pattern of movement is also known to have caused oil historically spilled near
the Iranian coastline to eventually become deposited along parts of the central Saudi Arabian
coastline.
Figure 12. GCOM3 output for neap tide currents and weak northerly winds, plus red arrows depicting start of
anti-clockwise gyre (supplied by GEMS, Melbourne).
Port development and maintenance
The Port of Khark Island contains the following three berthing areas and small vessel harbours:
� Sea Island Terminal: this is located just beyond the 20 m depth contour (iso-bath) on the
west side of the island, and handles the deepest draft crude oil carriers, including the ULCCs
and most VLCCs.
31
Ballast Water Risk Assessment, Port of Khark Island, Islamic Republic of Iran, August 2003: Final Report
� T Jetty: Located on the east side of the island, berths on the T Jetty handle the smaller crude
oil carriers and product tankers.
� Chemical Jetty: Located south of the T-Jetty, these berths plus the nearby gas mooring
handle the chemical tankers, dry bulk carriers and gas tankers.
� Small vessel harbours: Local supply vessels are handled in the small harbour on the north-
east corner of the island. The other small harbours are located near the base of the T Jetty, and
these handle the tugs, line boats, patrol boats and port authority launches.
The three terminals and small vessel harbours of the port are shown in Figures 13.
Because of the naturally deep and open waters near the island, no significant capital dredging was
required for developing the export berths, their approaches or the turning areas. Thus no routine
maintenance dredging of the berths and approaches has been required. The basins of the small vessel
harbours were developed by excavation and back fill, and they are protected by small, shore parallel
rocky breakwaters.
Figure 13. Part of the GIS Port Map showing navigation, infrastructure and the active berth layer for Khark
Island.
32
4 Results
4.2 Resource
mapping
The subtidal habitats displayed on the GIS Port Map (Figure 14) show the following:
� Fringing coral reef slope (= with carbonate reef structure from corals and coralline algae).
� Sandy seafloor (= sands, muddy sands, shelly sands) � occurs in shallower areas off the base
of fringing reef slopes.
� Muddy seafloor (= muds, sandy muds, shelly muds) � occurs in the deeper offshore areas.
There are no locally significant seagrass or seaweed beds (e.g.Halodule, Laminaria, Dictyotis, etc),
although small patches of Halodule seagrasses are scattered along parts of the sandy reef platforms
that skirt Khark Island and its neighbouring sand cay. The intertidal habitats of Khark Island comprise
the following:
� Narrow rocky shore, reinforced in some areas with additional rock, masonry and concrete.
� Very narrow linear and pocket sand beaches which rim the top edge of the intertidal reef
platform.
� Rocky breakwaters of the small vessel harbours.
� Intertidal reef platform with sandy veneers (most widely exposed during extreme low spring
tides).
There are no high tidal salt flats, marsh areas or mangrove forests at the port. Muddy shorelines
supporting mangroves fringe the nearby mainland coast, and this habitat is included on the GIS port
map (it can be seen when the map is zoomed out or moved to the north-east). There are no gazetted or
officially declared wildlife reserves, nature sanctuaries, seabird breeding sites or fish nursery areas,
although the uninhabited island immediately north of Khark Island (Figures 13a, 14) is recognised by
PSO as a relatively undisturbed area with coral reef, fish and wildlife conservation values.
Figure 14. Part of the GIS Port Map showing the marine habitat layer.
33
Ballast Water Risk Assessment, Port of Khark Island, Islamic Republic of Iran, August 2003: Final Report
The GIS port map shows the locations of the PBBS sampling sites (red triangle symbols; Figures 13,
14), so that results from the final survey report can be connected to these points at a later stage. The
map also depicts the key navigational and offshore production features around the port, including the
undersea production and export pipelines and the onshore pipelines (red lines). There are no
geological or hydrological onshore features such as significant hilltops, local streams or tidal creeks,
but the excavated areas containing groundwater seep/rainfall ponds and process water evaporation
traps have been marked. The location of the roads, petroleum processing facilities and urban
accommodation areas on Khark Island are shown, including the post offices and main mosque (Figure
13a).
4.3 De-ballasting/ballasting
pattern
It was not difficult to establish the deballasting/ballasting pattern for the Port of Khark Island because
it contains bulk export facilities and terminals only. The small vessel harbour where the various
supplies and construction materials are received for operating the processing facilities and terminals is
serviced by small coastal craft which do not have a ballasting requirement when unloading. Import of
any bulk quantity of fuel is occasionally undertaken by the NITC (National Iranian tanker Company)
tankers that shuttle between the refinery at Bandar Abbas and the T Jetty. It was therefore relatively
straightforward to check which arrivals might have taken up BW and where this occurred (i.e. the T
Jetty).
During the port meeting with the harbour master and chief pilot in May 2002, the deballasting
practises of the arriving crude oil and dry bulk carriers were discussed. Because of the lack of swells
in the enclosed RSA, vessels entering the RSA through the Straits of Hormuz (Figure 2) have usually
already discharged any additional heavy weather ballast they may have required in the Indian Ocean.
By the time vessels reach Khark Island, they typically contain between 80-100% of normal ballast,
unless they have already visited another terminal in the region for part-loading of cargo. The latter is
not a common practise owing to the increased costs of making two port visits to load, and is generally
restricted to the large, deepest draft carriers that can achieve a full load only at the deepest berths such
as the Sea Island terminal at Khark Island.
As in other ports, the PSO port rules require arriving ships to retain sufficient ballast on board to
maintain stability and steerage control and minimise windage until berthing is completed. Windage is
very significant in the winter and spring months due to the strong northerly winds.
Over the March 1999 - November 2002 period covered by the shipping record and BWRF collation
exercise, there were a total of 1489 vessel visits, with only a tiny percentage needing to uptake as
opposed to discharge BW (i.e. a few of the product tanker visits from Bandar Abbas which delivered
fuel and did not load crude oil in other tanks for the return journey). Of the 1489 visits, 444 were
mostly ULCCs (ultra large crude carriers; >300,000 DWT) and VLCCs (very large crude carriers;
200,000 - 300,000 DWT) visiting the Sea Island terminal. Visits to the T-Jetty by some of the VLCCs
and the smaller crude carriers totalled 946. Chemical tankers, LPG tankers and dry bulk carrier visits
to the Chemical Jetty totalled 99 (the majority were chemical tankers).
The largest crude oil carrier visiting the port in 1999-2002 was the ULCC Sea Giant (555,051 DWT),
with 52 other ULCCs making one or more visits. Over the same period the number of different
VLCCs and smaller crude carriers which made at least one visit was 221 and 107 respectively. The
number of different product tankers and chemical tankers visiting the port in this period was 16 and
32 respectively.
The database records the amount and sources of the BW of these arrivals, as taken from the BWRFs
(2000-2002) and/or derived from the port shipping records (1999-2000). Connection of the active
berth layer of the GIS Port Map to the database allowed tables summarising the BW discharge
statistics to be conveniently displayed for each terminal. Examples of these tables, as displayed by the
GIS Port Map, are shown for each of the three terminals in Figures 15-17.
34


4 Results
Because the database must accept and manage individual tank discharges as discrete units (as
recorded in IMO standard BWRFs), the need to treat all BW tanks as a single entity for vessels
arriving prior to the introduction of BWRFs at Khark Island, or which submitted incomplete BWRFs
(Section 3.6), reduces the number of individual tank discharges actually made in 1999-2002 whilst
inflating the mean and maximum tank discharge volumes. Thus the latter reflect the total ballast water
capacity of the largest visiting vessels (Figures 15-17). This causes a more conservative outcome in
terms of the BWRA results, but it is worth recognising that a database containing individual tank data
collated from, say, a 12 month set of fully completed BWRFs will produce more precise BW source
port values for the C1, C2 and R1 components (Section 3.10).
Figure 15. BW discharge statistics displayed by the GIS Port Map for the T-Jetty
Figure 16. BW discharge statistics displayed by the GIS Port Map for the Sea Island Terminal at Khark Island.
35
Ballast Water Risk Assessment, Port of Khark Island, Islamic Republic of Iran, August 2003: Final Report
Figure 17. BW discharge statistics displayed by the GIS Port Map for the Chemical Jetty at Khark Island.
4.4
Identification of source ports
Of the 1489 vessel visit records and their associated 2421 tank discharges identified in the 1999-2002
database, the total number of identified BW source ports was 126, with two of these reported as
sources of tank discharges but with no identifiable volumes (Table 3).
Figure 18 shows output from the GIS world bioregion map depicting the location and relative
importance of the 126 BW source ports with respect to C1. As with all GIS outputs, it is `zoomable'
to allow all ports and symbols to be clearly delineated at smaller scales.
Figure 18. GIS output showing the location and relative importance of BW source ports with respect to
frequency of tank discharges (C1) at Port of Khark Island.
36
4 Results
Table 3. List of identified source ports in the Port of Khark Island database, showing proportions of recorded
ballast tank discharges (C1) and volumes (C2)*
UN Port
BW vol.
Source Port Name
Country
C1*
C2
Code
(tonnes)
1
IRBND
Bandar Abbas
IR Iran
7.47%
3,009,951
3.4%
2
EGAIS
Ain Sukhana
Egypt
6.57%
7,350,531
8.2%
3
INIXE
Mangalore (New Mangalore)
India
5.06%
1,521,080
1.7%
4
JPCHB
Chiba Chiba
Japan
4.87%
3,905,179
4.4%
5
SGSIN
Singapore
Singapore
4.82%
4,149,467
4.6%
6
KRUSN
Ulsan
Rep Korea
4.11%
2,816,604
3.1%
7
TWKHH
Kaohsiung
Taiwan Province
4.02%
2,327,661
2.6%
8
JPMIZ
Mizushima Okayama
Japan
3.97%
2,297,129
2.6%
9
INSIK
Sikka (Jamnagar)
India
3.73%
2,451,769
2.7%
10
JPYKK
Yokkaichi Mie
Japan
2.79%
1,823,371
2.0%
11
KRYOS
Yosu
Rep Korea
2.60%
1,221,438
1.4%
12
ZADUR
Durban
South Africa
2.36%
1,918,468
2.1%
13
JPKSM
Kashima Ibaraki
Japan
2.08%
1,233,373
1.4%
14
AEFJR
Fujairah (Al-Fujairah)
UAE
1.94%
1,645,495
1.8%
15
KRTSN
Taesan
Rep Korea
1.94%
2,139,407
2.4%
16
JPKWS
Kawasaki Kanagawa
Japan
1.89%
1,481,745
1.7%
17
INCOK
Cochin
India
1.61%
568,770
0.6%
18
SARTA
Ras Tanura
Saudi Arabia
1.51%
2,431,908
2.7%
19
AEJED
Jebel Dhanna
UAE
1.47%
2,094,932
2.3%
20
JPKII
Kiire Kagoshima
Japan
1.47%
975,245
1.1%
21
THMAT
Mab Tapud
Thailand
1.37%
1,372,239
1.5%
22
KRONS
Onsan
Rep Korea
1.32%
1,184,046
1.3%
23
JPNGO
Nagoya Aichi
Japan
1.23%
1,308,554
1.5%
24
JPSAK
Sakai Osaka
Japan
1.18%
993,698
1.1%
25
CNNGB
Ningbo Zhejiang
China
1.13%
1,050,066
1.2%
26
JPOIT
Oita Oita
Japan
1.13%
855,513
1.0%
27
AEDXB
Dubai
UAE
1.04%
1,225,724
1.4%
28
JPSKD
Sakaide Kagawa
Japan
1.04%
656,748
0.73%
29
CNSDG
Shui Dong
China
0.99%
715,188
0.80%
30
TWMAI
Mailiao
Taiwan Province
0.99%
358,811
0.40%
31
JPUBJ
Ube Yamaguchi
Japan
0.95%
594,804
0.66%
32
TWKEL
Keelung (Sha Lung & Tanshoei)
Taiwan Province
0.85%
474,809
0.53%
33
JPYOK
Yokohama Kanagawa
Japan
0.80%
498,520
0.56%
34
GREEU
Eleusis
Greece
0.76%
305,191
0.34%
35
AEKLF
Khor Al Fakkan
UAE
0.71%
396,915
0.44%
36
IDCXP
Cilacap Java
Indonesia
0.71%
406,576
0.45%
37
PKKHI
Karachi
Pakistan
0.71%
334,494
0.37%
38
JPSEN
Sendai Kagoshima
Japan
0.57%
552,512
0.62%
39
THSRI
Sriracha
Thailand
0.57%
420,406
0.47%
40
LKCMB
Colombo
Sri Lanka
0.52%
252,612
0.28%
41
NLRTM
Rotterdam
Netherlands
0.52%
830,944
0.93%
42
PHBLG
Tabanga
Philippines
0.52%
411,560
0.46%
43
PHBTG
Batangas Luzon
Philippines
0.52%
458,956
0.51%
44
CNTAO
Qingdao (Longgang) Shandong
China
0.47%
805,077
0.90%
45
JPNGI
Negishi
Japan
0.47%
303,121
0.34%
46
JPTKY
Tokuyama Yamaguchi
Japan
0.47%
570,280
0.64%
47
KRCHA
Cheju
Rep Korea
0.47%
180,466
0.20%
48
FRDON
Donges
France
0.43%
877,740
1.0%
49
INVAD
Vadinar
India
0.43%
351,174
0.39%
50
IRBKM
Bandar Khomeini
IR Iran
0.43%
20,231
0.02%
51
JPTMK
Tomakomai Hokkaido
Japan
0.43%
450,527
0.50%
52
KWMEA
Mina Al Ahmadi
Kuwait
0.43%
516,448
0.58%
53
PHBTN
Bataan Mariveles
Philippines
0.43%
456,419
0.51%
54
INIXY
Kandla (Muldwarka)
India
0.38%
24,561
0.03%
55
SAJUB
Jubail
Saudi Arabia
0.38%
77,087
0.09%
56
AEJEA
Jebel Ali
UAE
0.33%
348,734
0.39%
57
JPMUR
Muroran Hokkaido
Japan
0.33%
304,866
0.34%
58
QAUMS
Umm Said
Qatar
0.33%
94,179
0.11%
59
CNQZJ
Quanzhou (Jinjiang) Fujian
China
0.28%
87,916
0.10%
60
ESBIO
Bilbao
Spain
0.28%
560,796
0.63%
61
IDBPN
Balikpapan Kalimantan
Indonesia
0.28%
31,185
0.03%
62
INBOM
Mumbai (Ex Bombay)
India
0.28%
228,983
0.26%
63
INHAL
Haldia
India
0.28%
136,799
0.15%
*C1 = proportion of all discharges (% of 2421 discharges); C2 = proportion of total discharge volume (%)
37
Ballast Water Risk Assessment, Port of Khark Island, Islamic Republic of Iran, August 2003: Final Report
Table 3 cont. List of identified source ports in the Port of Khark Island database, showing proportions of
recorded ballast tank discharges (C1) and volumes (C2)*
UN Port
BW vol.
Source Port Name
Country
C1*
C2
Code
(tonnes)
64
IRSXI
Sirri Island Oil Terminal
IR Iran
0.28%
491,696
0.55%
65
PKBQM
Muhammad Bin Qasim
Pakistan
0.28%
48,964
0.05%
66
AEZIR
Zirku Island
UAE
0.24%
458,341
0.51%
67
GRPAC
Pachi
Greece
0.24%
134,495
0.15%
68
JPSAE
Saiki Oita
Japan
0.24%
40,984
0.05%
69
PAAML
Puerto Armuelles
Panama
0.24%
87,351
0.10%
70
INMAA
Chennai (Ex Madras)
India
0.19%
151,718
0.17%
71
ITPFX
Porto Foxi (Sarroch)
Italy
0.19%
107,557
0.12%
72
JPHIM
Himeji Hyogo
Japan
0.19%
196,184
0.22%
73
MYMKZ
Malacca
Malaysia
0.19%
340,872
0.38%
74
AESHJ
Sharjah
UAE
0.14%
19,327
0.02%
75
HKHKG
Hong Kong
Hong Kong
0.14%
168,500
0.19%
76
KWMIS
Mina Saud
Kuwait
0.14%
268,645
0.30%
77
OMMFH
Min-Al-Fahal
Oman
0.14%
202,871
0.23%
78
SADMN
Damman
Saudi Arabia
0.14%
15,837
0.02%
79
SARAR
Ras al Khafji
Saudi Arabia
0.14%
262,067
0.29%
80
USLOP
LOOP Terminal
United States
0.14%
289,130
0.32%
81
CNDLC
Dalian Liaoning
China
0.09%
75,088
0.08%
82
CNMEZ
Xiuyu (Meizhou)
China
0.09%
46,647
0.05%
83
CNZHE
Zhenjiang Zhejiang
China
0.09%
35,650
0.04%
84
CNZOS
Zhousan (Dinghai)
China
0.09%
140,634
0.16%
85
GRPIR
Piraeus
Greece
0.09%
41,543
0.05%
86
JPNGS
Nagasaki Nagasaki
Japan
0.09%
186,206
0.21%
87
JPSAI
Saijo
Japan
0.09%
38,647
0.04%
88
KROKP
Okpo
Rep Korea
0.09%
94,030
0.10%
89
QADOH
Doha
Qatar
0.09%
197,929
0.22%
90
SEBRO
Brofjorden
Sweden
0.09%
200,153
0.22%
91
SGJUR
Jurong
Singapore
0.09%
156,273
0.17%
92
SGTPG
Tanjong Pagar
Singapore
0.09%
37,588
0.04%
93
THRTT
Rayong TPI Terminal
Thailand
0.09%
59,899
0.07%
94
YEHOD
Hodeidah
Yemen
0.09%
42,430
0.05%
95
AUPST
Port Stanvac
Australia
0.05%
92,334
0.10%
96
BDCGP
Chittagong
Bangladesh
0.05%
47,309
0.05%
97
CACBC
Come By Chance
Canada
0.05%
142,247
0.16%
98
CNJIA
Jiangyin Jiangsu
China
0.05%
19,500
0.02%
99
EGPSD
Port Said
Egypt
0.05%
104,556
0.12%
100
EGSUZ
Suez (El Suweis)
Egypt
0.05%
94,472
0.11%
101
FRLAV
Lavera
France
0.05%
104,556
0.12%
102
FRLEH
Le Havre
France
0.05%
93,000
0.10%
103
IDPDG
Teluk Bajur/Padang Sumatra
Indonesia
0.05%
128,200
0.14%
104
INSAL
Salaya
India
0.05%
27,105
0.03%
105
IQBSR
Basra
Iraq
0.05%
92,943
0.10%
106
IQMAB
Mina Al Bakir
Iraq
0.05%
105,976
0.12%
107
IRLVP
Lavan Island
IR Iran
0.05%
28,898
0.03%
108
JPINS
Inoshima Hiroshima
Japan
0.05%
90,295
0.10%
109
JPKCZ
Kochi Kochi
Japan
0.05%
101,380
0.11%
110
JPOKA
Okinawa Okinawa
Japan
0.05%
85,900
0.10%
111
JPSMT
Shimotsu Wakayama
Japan
0.05%
99,920
0.11%
112
JPSMZ
Shimizu Shizuoka
Japan
0.05%
85,348
0.10%
113
JPTAM
Tamano Okayama
Japan
0.05%
19,000
0.02%
114
KRINC
Inchon
Rep Korea
0.05%
105,103
0.12%
115
KWSAA
Shuaiba
Kuwait
0.05%
3,385
0.00%
116
MAMOH
Mohammedia
Morocco
0.05%
35,000
0.04%
117
MGTMM
Tamatave (Toamasina)
Madagascar
0.05%
37,436
0.04%
118
MYJHB
Johor Bahru
Malaysia
0.05%
94,199
0.11%
119
NGABO
Abonnema
Nigeria
0.05%
32,226
0.04%
120
SEHAD
Halmstad
Sweden
0.05%
90,000
0.10%
121
SGKEP
Keppel Wharves
Singapore
0.05%
108,491
0.12%
122
USHNL
Honolulu Hawaii
United States
0.05%
37,181
0.04%
123
USSAB
Sabine
United States
0.05%
83,512
0.09%
124
VNVUT
Vung Tau
Viet Nam
0.05%
1,284
0.001%
125
AEDAS
Das Island
UAE
0.05%
<500
0.001%
126
IRBMR
Bandar Mashur
IR Iran
0.05%
<500
0.001%
*C1 = proportion of all discharges (% of 2421 discharges); C2 = proportion of total discharge volume (%)
38
4 Results
The frequency data for the 126 source ports shown in Table 3 form the C1 values used in the
calculation of relative overall risk (Section 3.10). The southern Iranian port of Bandar Abbas
(Figure 2) was the most frequent source port in the BWRF and derived shipping records (i.e. 7.5% of
all tank discharges). This was followed by Ain Sukhana (6.6%), which is the Egyptian terminal at the
north end of the Red Sea (Figure 18). This transfer terminal receives crude oil for transferring to the
Mediterranean coast by overland pipeline. The third most frequent source port was New Mangalore in
India (5.1%), followed closely by Chiba (the large petrochemical and heavy industry region just north
of Tokyo; 4.9%) and Singapore (4.8%; Table 3; Figure 18).
The total volume of BW discharged from the identified source ports was 76,277,003 tonnes. The
various subtotal discharges for each source port shown in Table 3 and Figure 19 provide the C2 values
used in the risk calculation (Section 3.10). The source port providing the largest volume of BW
discharged at Khark Island was Ain Sukhana (8.2%). This was followed by Singapore (4.6%), Chiba
(4.4%), Bandar Abbas (3.4%), Ulsan (Korea; 3.1%) and Sikka (Jamnagar) in India (2.7%).
Figure 19. GIS output showing the location and relative importance of the source ports with respect to the
volume of tank discharges (C2) at Port of Khark Island.
A further 13,322,507 tonnes was estimated to have been discharged from tanks for which no source
port could be identified, and these visit records are not used by the database for the BWRA. However
they indicate that the actual volume discharged at Khark Island in 1999-2002 was close to 90,000,000
tonnes.
The low number of individual tank discharges (2421) compared to the number of visits (1489), is due
to (a) the need to include port shipping records prior to the regular use of BWRFs (all tanks
combined), and (b) many vessels submitted a single, total discharge volume covering all their tanks on
the BWRF.
Of the 126 identified source ports, the top 13 provided 50% of the source-identified volume and the
next 16 ports a further 25% (i.e. 29 ports accounted for 75% of the 76,277,003 tonnes of source-
identified BW; Table 3). Of the 5% of source ports located in or near the RSA, some such as Ras
Tanura and Al Shaheen are oil terminals with few other facilities, while several are large bunkering,
supply or maintenance ports (e.g. Fujairah, Dubai, Sharjah; Khor al Fakkan; see Figure 2). Because
some VLCCs initially anchor and/or partly load at these ports before moving to Khark Island and
were providing insufficient ballast tank information on the BWRFs, it could not be confirmed which
of these ports may have been true BW source ports.
39
Ballast Water Risk Assessment, Port of Khark Island, Islamic Republic of Iran, August 2003: Final Report
4.5
Identification of destination ports
As discussed in Section 3.5, identification of destination ports for any BW taken up at a
Demonstration Site is confounded by the lack specific questions on the BWRF, and the uncertainty of
knowing if the Next of Port Call recorded on a BWRF (or in a shipping record) is where BW is
actually discharged. Thus presently there is no reporting mechanism enabling a `reverse BWRA' to be
undertaken reliably. However this is not an issue for Khark Island since almost all ships depart loaded with
liquid or dry bulk cargo.
Of the 119 destination ports in the 1999-2002 database, their location and proportional frequency
reported next ports of call are shown Figure 20. The top 21 destination ports that accounted for >80%
of the reported Next Ports of Call by all 1489 vessel departures are listed in Table 4. Most of these
represent the destination of the petroleum, sulphur and rock cargoes exported from Khark Island.
Exceptions were bunkering/crew change ports in the region plus Bandar Abbas, the latter almost
certainly being the only destination port which actually receives BW taken up at Khark Island (i.e. by
a few of the shuttle tankers that departed in ballast, having delivered fuel to Khark Island from the
Bandar Abbas refinery and not loading for the return journey). The amount of BW uplifted at Khark
Island by product tankers and taken to Bandar Abbas during 1999-2002 appears to be less than
<50,000 tonnes.
Figure 20. GIS output showing the location and frequency of destination ports, recorded as the Next Port of
Call in the Port of Khark Island BWRFs and shipping records.
Table 4 shows that the refinery port of Bandar Abbas registered 17.2% of all destination port records,
followed by the Egyptian oil reception terminal at Ain Sukhana in the Red Sea (12.5%), then Ras
Tanura (7.1%), which has a deepwater artificial island oil terminal off the Saudi Arabian coast (Figure
2). The former ports plus the refinery terminals at Mangalore (India), Durban (South Africa), Taesan
(Korea) and Ningbo (north-east China) accounted for over 50% of all recorded destination ports
(Table 4). The sea island terminal at Ras Tanura has few facilities so the 1999-2000 records indicate
that large crude carriers move both to and away from Khark Island for top-up cargo before departing
the RSA.
40
4 Results
Table 4. Destination ports accounting for >80% of all vessel departures from Khark Island in 1999-2002
(recorded as Next Ports of Call).
UN Port
Destination Port (Next Port of
Proportion of
Cumulative
Country
Code
Call)
Departures
Percentage
IRBND
Bandar Abbas
Iran Islamic Republic of
17.2%
17.2%
EGAIS
Ain Sukhana
Egypt
12.5%
29.7%
SARTA
Ras Tanura
Saudi Arabia
7.1%
36.8%
INIXE
Mangalore (New Mangalore)
India
5.0%
41.8%
ZADUR
Durban
South Africa
3.4%
45.1%
KRTSN
Taesan
Korea Republic of
3.1%
48.2%
CNNGB
Ningbo Zhejiang
China
2.9%
51.1%
JPYKK
Yokkaichi Mie
Japan
2.7%
53.8%
JPKWS
Kawasaki Kanagawa
Japan
2.5%
56.3%
JPKII
Kiire Kagoshima
Japan
2.2%
58.6%
JPCHB
Chiba Chiba
Japan
2.2%
60.7%
AEFJR
Fujairah (Al-Fujairah)
United Arab Emirates
2.1%
62.8%
JPNGO
Nagoya Aichi
Japan
2.1%
64.9%
TWKHH
Kaohsiung
Taiwan Province of China
1.8%
66.7%
KRUSN
Ulsan
Korea Republic of
1.6%
68.3%
JPOIT
Oita Oita
Japan
1.5%
69.8%
INCOK
Cochin
India
1.4%
71.2%
AEZIR
Zirku Island
United Arab Emirates
1.3%
72.5%
INSIK
Sikka (Jamnagar)
India
1.2%
73.7%
LKCMB
Colombo
Sri Lanka
1.1%
74.8%
NLRTM
Rotterdam
Netherlands
1.1%
76.0%
PHBLG
Tabanga
Philippines
1.1%
77.1%
INVAD
Vadinar
India
1.1%
78.2%
PKKHI
Karachi
Pakistan
1.1%
79.3%
ESBIO
Bilbao
Spain
1.0%
80.3%
ITGOA
Genoa
Italy
1.0%
81.3%
OMMFH
Min-Al-Fahal
Oman
0.9%
82.2%
4.6
Environmental similarity analysis
Of the identified 126 source ports and 119 destination ports, sufficient port environmental data were
obtained to include 75% of the former and 72% of the latter in the multivariate similarity analysis by
PRIMER. These ports accounted for over 90% of the recorded tank discharges and 89% of all
recorded departures respectively (Tables 5-6). Details of the 357 ports included in the multivariate
analysis carried out for Khark Island and the other Demonstration Site BWRAs are listed in Appendix
6 (this list is ordered alphabetically using the UN port identification code, in which the first two letters
represent the country code).
To allow all identified BW source and next ports of Khark Island to be part of the `first-pass' risk
assessment, those ports not included in the multivariate analysis were provided with environment
matching coefficient estimates, and are noted as such in the database. The C3 estimates were based on
their port type (Section 3.7) and geographic location with respect to the nearest comparable ports for
which C3 had been calculated. A precautionary approach was adopted (i.e. the estimated values were
made higher than the calculated C3s of the comparable ports). Providing C3 estimates allowed the
database to include all Khark Island source ports and next ports when calculating the ROR values and
displaying the BWRA results.
The GIS world map outputs that display the C3 values of the Port of Khark Island source and
destination ports are in Figures 21 and 22 respectively. These plots and Tables 5-6 confirm the
relatively high level of similarity between the Port of Khark Island and the majority of ports in the
RSA and neighbouring Middle East regions (i.e. C3s in the 0.6 - 0.8 range).
The nearest similar source port beyond the Middle East was the tropical Japanese port of Okinawa
(C3 of 0.581), while the nearest North American and European source ports were Sabine in Texas
(0.560) and Piraeus in Greece (0.536). Unsurprisingly, the most environmentally dissimilar ports
(<0.2) were in Iceland Canada, North-West Europe and Korea, plus some monsoonal ports in India,
Sri Lanka and Bangladesh (Tables 5-6).
41
Ballast Water Risk Assessment, Port of Khark Island, Islamic Republic of Iran, August 2003: Final Report
Figure 21. GIS output showing the location and environmental matching coefficients (C3) of BW source ports
identified for the Port of Khark Island.
Table 5. Source ports identified for Port of Khark Island, as ranked according to size of their environmental
matching coefficient (C3)
42
4 Results
Table 5 cont. Source ports identified for Port of Khark Island, ranked according to the size of their
environmental matching coefficient (C3)
As discussed in Section 4.6 and highlighted in Table 6, there is probably only one destination that
occasionally may receive BW from Khark Island (i.e. Bandar Abbas on the south coast of I.R. Iran;
Figure 2).
43
Ballast Water Risk Assessment, Port of Khark Island, Islamic Republic of Iran, August 2003: Final Report
Bandar Abbas' environmental matching coefficient with Khark Island is 0.574, which places it 24th in
the list of 119 next ports (Table 6). Thus Bandar Abbas is on the boundary of the top 20% of
destination ports which have the closest environmental matching to Khark Island.
Table 6. Destination ports identified for Port of Khark Island, ranked according to the size of their
environmental matching coefficient (C3)*
Destination Port
Proportion of
Environmental Matching
UN Port Code
Country
C3 Estimated
(Next Port of Call)
Departures
(C3)
AEJEA
Jebel Ali
United Arab Emirates
0.2%
0.757
QADOH
Doha
Qatar
0.1%
0.754
QAHAL
Halul Island Terminal
Qatar
0.5%
0.750
Estimated
QAUMS
Umm Said
Qatar
0.2%
0.750
SAJUB
Jubail
Saudi Arabia
0.7%
0.731
EGADA
Adabiya
Egypt
0.1%
0.700
Estimated
QASHT
Al Shaheen Terminal
Qatar
0.4%
0.678
Estimated
AEFJR
Fujairah (Al-Fujairah)
United Arab Emirates
2.1%
0.674
KWSAA
Shuaiba
Kuwait
0.2%
0.666
KWMEA
Mina Al Ahmadi
Kuwait
0.3%
0.655
AEKLF
Khor Al Fakkan
United Arab Emirates
0.3%
0.651
EGSUZ
Suez (El Suweis)
Egypt
0.1%
0.649
YERAI
Ras Isa Marine Terminal
Yemen
0.1%
0.646
AEZIR
Zirku Island
United Arab Emirates
1.3%
0.637
EGAIS
Ain Sukhana
Egypt
12.5%
0.637
SARTA
Ras Tanura
Saudi Arabia
7.1%
0.631
SARAR
Ras al Khafji
Saudi Arabia
0.2%
0.631
Estimated
AEDAS
Das Island
United Arab Emirates
0.6%
0.630
AEJED
Jebel Dhanna
United Arab Emirates
0.3%
0.624
AERUW
Ruwais
United Arab Emirates
0.1%
0.624
SAYNB
Yanbu
Saudi Arabia
0.1%
0.623
AEAJM
Ajman
United Arab Emirates
0.1%
0.600
Estimated
JPOKA
Okinawa Okinawa
Japan
0.1%
0.581
IRBND
Bandar Abbas
Iran Islamic Republic of
17.2%
0.574
TWKHH
Kaohsiung
Taiwan Province of China
1.8%
0.572
PHLIM
Limay/Bataan
Philippines
0.1%
0.564
IRSXI
Sirri Island Oil Terminal
Iran Islamic Republic of
0.2%
0.556
IDMJU
Mamuju
Indonesia
0.1%
0.553
Estimated
AEDXB
Dubai
United Arab Emirates
0.2%
0.551
FRANT
Antibes
France
0.1%
0.550
Estimated
VNVUT
Vung Tau
Viet Nam
0.1%
0.550
Estimated
IRBUZ
Bushehr
Iran Islamic Republic of
0.2%
0.548
PHBTG
Batangas Luzon
Philippines
0.2%
0.544
PHBLG
Tabanga
Philippines
1.1%
0.540
Estimated
LKCMB
Colombo
Sri Lanka
1.1%
0.539
PHTAC
Tacloban Leyte
Philippines
0.1%
0.529
PHBTN
Bataan Mariveles
Philippines
0.1%
0.527
ITTAR
Taranto
Italy
0.2%
0.527
GREEU
Eleusis
Greece
0.7%
0.527
INVTZ
Visakhapatnam
India
0.1%
0.515
ESALG
Algeciras
Spain
0.1%
0.500
THMAT
Mab Tapud
Thailand
0.1%
0.486
Estimated
GRPAC
Pachi
Greece
0.8%
0.472
JPKII
Kiire Kagoshima
Japan
2.2%
0.470
ITGOA
Genoa
Italy
1.0%
0.469
ITPFX
Porto Foxi (Sarroch)
Italy
0.1%
0.468
JPGAM
Gamagori Aichi
Japan
0.1%
0.467
Estimated
PKKHI
Karachi
Pakistan
1.1%
0.467
INVAD
Vadinar
India
1.1%
0.464
ITVCE
Venezia (=Fusina)
Italy
0.2%
0.463
JPHIM
Himeji Hyogo
Japan
0.2%
0.460
JPTOY
Toyama Toyama
Japan
0.1%
0.454
EGSKH
Sokhna
Egypt
0.1%
0.450
Estimated
MYMKZ
Malacca
Malaysia
0.2%
0.438
Estimated
JPKSM
Kashima Ibaraki
Japan
0.5%
0.436
AEFAT
Fateh Terminal
United Arab Emirates
0.5%
0.430
FRFOS
Fos sur Mer
France
0.2%
0.428
INMAA
Chennai (Ex Madras)
India
0.2%
0.428
PKBQM
Muhammad Bin Qasim
Pakistan
0.2%
0.427
PHBXU
Butuan Bay/Masao
Philippines
0.1%
0.427
Estimated
HKHKG
Hong Kong
Hong Kong
0.1%
0.426
SGSIN
Singapore
Singapore
0.6%
0.425
*
Bandar Abbas (highlighted in yellow) is almost certainly the only port receiving any regular import of BW from Khark Island, and
only on an occasional basis (see Section 4.6).
44
4 Results
Table 6 cont. Destination ports identified for Port of Khark Island, ranked according to the size of their
environmental matching coefficient (C3)
Destination Port
Proportion of
Environmental Matching
UN Port Code
Country
C3 Estimated
(Next Port of Call)
Departures
(C3)
SAJUT
Juaymah Terminal
Saudi Arabia
0.3%
0.425
JPCHB
Chiba Chiba
Japan
2.2%
0.421
JPYOK
Yokohama Kanagawa
Japan
0.2%
0.419
ZADUR
Durban
South Africa
3.4%
0.418
JPSAK
Sakai Osaka
Japan
0.1%
0.412
JPOBM
Obama Fukui
Japan
0.1%
0.410
Estimated
JPNGO
Nagoya Aichi
Japan
2.1%
0.410
JPNGS
Nagasaki Nagasaki
Japan
0.1%
0.409
PTSIE
Sines
Portugal
0.2%
0.408
INIXE
Mangalore (New Mangalore)
India
5.0%
0.408
JPYKK
Yokkaichi Mie
Japan
2.7%
0.403
CNTAO
Qingdao (Longgang) Shandong
China
0.2%
0.401
JPKWS
Kawasaki Kanagawa
Japan
2.5%
0.401
INSIK
Sikka (Jamnagar)
India
1.2%
0.396
CNTSN
Tianjin Tianjin
China
0.1%
0.395
JPOIT
Oita Oita
Japan
1.5%
0.388
CNZHE
Zhenjiang Zhejiang
China
0.1%
0.382
Estimated
JPKRE
Kure Hiroshima
Japan
0.1%
0.380
Estimated
MAMOH
Mohammedia
Morocco
0.1%
0.368
Estimated
KRTSN
Taesan
Korea Republic of
3.1%
0.363
Estimated
CNHUI
Huizhou
China
0.5%
0.360
KRSHO
Sokcho
Korea Republic of
0.1%
0.357
Estimated
OMMFH
Min-Al-Fahal
Oman
0.9%
0.356
Estimated
KRONS
Onsan
Korea Republic of
0.4%
0.355
KRYOS
Yosu
Korea Republic of
0.2%
0.350
Estimated
KRUSN
Ulsan
Korea Republic of
1.6%
0.348
Estimated
ESBIO
Bilbao
Spain
1.0%
0.346
THSRI
Sriracha
Thailand
0.2%
0.345
Estimated
JPTYO
Tokyo Tokyo
Japan
0.1%
0.344
JPUBJ
Ube Yamaguchi
Japan
0.2%
0.340
JPMIZ
Mizushima Okayama
Japan
0.2%
0.338
USLOP
LOOP Terminal
United States
0.1%
0.337
MGTMM
Tamatave (Toamasina)
Madagascar
0.2%
0.333
Estimated
CNNGB
Ningbo Zhejiang
China
2.9%
0.333
CNNBO
Beilun
China
0.1%
0.333
JPCTA
Chita Aichi
Japan
0.1%
0.330
Estimated
CNSDG
Shui Dong
China
0.6%
0.330
Estimated
CNSWA
Shantou (Chaoyang) Guandong
China
0.1%
0.330
Estimated
CNZOS
Zhousan (Dinghai)
China
0.1%
0.330
Estimated
JPTKY
Tokuyama Yamaguchi
Japan
0.4%
0.323
EGAKI
Abu Qir
Egypt
0.1%
0.321
Estimated
INBOM
Mumbai (Ex Bombay)
India
0.6%
0.309
IRABD
Abadan
Iran Islamic Republic of
0.1%
0.300
Estimated
TWKEL
Keelung (Sha Lung & Tanshoei)
Taiwan Province of China
0.1%
0.293
IQMAB
Mina Al Bakir
Iraq
0.2%
0.290
Estimated
IRBMR
Bandar Mashur
Iran Islamic Republic of
0.2%
0.278
FRDON
Donges
France
0.2%
0.257
IDCXP
Cilacap Java
Indonesia
0.2%
0.247
JPTMK
Tomakomai Hokkaido
Japan
0.1%
0.225
INCOK
Cochin
India
1.4%
0.217
FRLEH
Le Havre
France
0.2%
0.217
SEBRO
Brofjorden
Sweden
0.2%
0.200
Estimated
INIXY
Kandla (Muldwarka)
India
0.2%
0.158
BDCGP
Chittagong
Bangladesh
0.1%
0.125
NLRTM
Rotterdam
Netherlands
1.1%
0.095
CACBC
Come By Chance
Canada
0.1%
0.061
ISSTR
Straumsvik
Iceland
0.1%
0.010
45
Ballast Water Risk Assessment, Port of Khark Island, Islamic Republic of Iran, August 2003: Final Report
NB: Port of Bandar Abbas (yellow highlight) appears to be the only port receiving BW uplifted at Khark Island on any regular
basis.
Figure 22. GIS output showing the location and environmental matching coefficients (C3) of the destination
ports identified for the Port of Khark Island.
4.7
Risk species
The risk species threat from a source port depends on the number of introduced and native species in
its bioregion, and their categorisations as unlikely, suspected or known harmful species (Section 3.9).
The risk species threat coefficient (C4) of each BW source port identified for the Port of Khark Island
are listed in Table 7 and shown in Figure 23. Table 7 also lists the scores for the introduced, suspected
and known harmful species of the source port bioregions, as had been added and assigned to the
database's species tables by February 2003. As noted in Section 3.9, these tables and their associated
Excel species reference file do not give a complete global list, but provide a working resource
enabling convenient update and improvement for each bioregion. Similarly, the 204 bioregions on the
GIS world map should not be considered unalterable. Regional resolution of species-presence records
is steadily improving in several areas, and this will allow many bioregions to become divided into
increasingly smaller units (ultimately approaching the scale of local port waters).
It should also be recognised that the distribution of risk species in the database has a regional bias due
to the level of aquatic sampling and taxonomic effort in Australia/New Zealand, Europe and North
America.
Figure 23. GIS output showing the location and risk species threat coefficients (C4) of the BW source ports
identified for the Port of Khark Island
46
4 Results
Table 7. Ranking of BW source ports identified for Port of Khark Island, according to the size of their risk
species threat (C4).
No. of Introduced
Suspected
Knwn Harmful Total Threat
Relative Risk Species
Port Code
Source Port
Country
Bio-Region
Species
Harmful Species
Species
Value
Threat (C4)
AUPST
Port Stanvac
Australia
AUS-VII
39
4
14
191
0.538
CNJIA
Jiangyin Jiangsu
China
NWP-3a
15
11
12
168
0.473
CNMEZ
Xiuyu (Meizhou)
China
NWP-3a
15
11
12
168
0.473
CNNGB
Ningbo Zhejiang
China
NWP-3a
15
11
12
168
0.473
CNQZJ
Quanzhou (Jinjiang) Fujian
China
NWP-3a
15
11
12
168
0.473
CNZHE
Zhenjiang Zhejiang
China
NWP-3a
15
11
12
168
0.473
CNZOS
Zhousan (Dinghai)
China
NWP-3a
15
11
12
168
0.473
JPNGS
Nagasaki Nagasaki
Japan
NWP-3a
15
11
12
168
0.473
KRCHA
Cheju
Rep Korea
NWP-3a
15
11
12
168
0.473
KROKP
Okpo
Rep Korea
NWP-3a
15
11
12
168
0.473
KRYOS
Yosu
Rep Korea
NWP-3a
15
11
12
168
0.473
TWKEL
Keelung (Sha Lung & Tanshoei)
Taiwan Province of China
NWP-3a
15
11
12
168
0.473
TWMAI
Mailiao
Taiwan Province Of China
NWP-3a
15
11
12
168
0.473
CNDLC
Dalian Liaoning
China
NWP-4c
15
11
12
168
0.473
CNTAO
Qingdao (Longgang) Shandong
China
NWP-4c
15
11
12
168
0.473
KRINC
Inchon
Rep Korea
NWP-4c
15
11
12
168
0.473
KRTSN
Taesan
Rep Korea
NWP-4c
15
11
12
168
0.473
JPCHB
Chiba Chiba
Japan
NWP-3b
13
11
12
166
0.468
JPHIM
Himeji Hyogo
Japan
NWP-3b
13
11
12
166
0.468
JPINS
Inoshima Hiroshima
Japan
NWP-3b
13
11
12
166
0.468
JPKCZ
Kochi Kochi
Japan
NWP-3b
13
11
12
166
0.468
JPKII
Kiire Kagoshima
Japan
NWP-3b
13
11
12
166
0.468
JPKWS
Kawasaki Kanagawa
Japan
NWP-3b
13
11
12
166
0.468
JPMIZ
Mizushima Okayama
Japan
NWP-3b
13
11
12
166
0.468
JPNGI
Negishi
Japan
NWP-3b
13
11
12
166
0.468
JPNGO
Nagoya Aichi
Japan
NWP-3b
13
11
12
166
0.468
JPOIT
Oita Oita
Japan
NWP-3b
13
11
12
166
0.468
JPSAE
Saiki Oita
Japan
NWP-3b
13
11
12
166
0.468
JPSAI
Saijo
Japan
NWP-3b
13
11
12
166
0.468
JPSAK
Sakai Osaka
Japan
NWP-3b
13
11
12
166
0.468
JPSKD
Sakaide Kagawa
Japan
NWP-3b
13
11
12
166
0.468
JPSMT
Shimotsu Wakayama
Japan
NWP-3b
13
11
12
166
0.468
JPSMZ
Shimizu Shizuoka
Japan
NWP-3b
13
11
12
166
0.468
JPTAM
Tamano Okayama
Japan
NWP-3b
13
11
12
166
0.468
JPTKY
Tokuyama Yamaguchi
Japan
NWP-3b
13
11
12
166
0.468
JPUBJ
Ube Yamaguchi
Japan
NWP-3b
13
11
12
166
0.468
JPYKK
Yokkaichi Mie
Japan
NWP-3b
13
11
12
166
0.468
JPYOK
Yokohama Kanagawa
Japan
NWP-3b
13
11
12
166
0.468
KRONS
Onsan
Rep Korea
NWP-4a
11
11
12
164
0.462
KRUSN
Ulsan
Rep Korea
NWP-4a
11
11
12
164
0.462
CNSDG
Shui Dong
China
NWP-2
11
10
12
161
0.454
HKHKG
Hong Kong
Hong Kong
NWP-2
11
10
12
161
0.454
JPOKA
Okinawa Okinawa
Japan
NWP-2
11
10
12
161
0.454
TWKHH
Kaohsiung
Taiwan Province of China
NWP-2
11
10
12
161
0.454
JPKSM
Kashima Ibaraki
Japan
NWP-4b
11
10
12
161
0.454
JPMUR
Muroran Hokkaido
Japan
NWP-4b
11
10
12
161
0.454
JPSEN
Sendai Kagoshima
Japan
NWP-4b
11
10
12
161
0.454
JPTMK
Tomakomai Hokkaido
Japan
NWP-4b
11
10
12
161
0.454
FRDON
Donges
France
NEA-IV
21
9
10
148
0.417
ESBIO
Bilbao
Spain
NEA-V
20
9
10
147
0.414
SEBRO
Brofjorden
Sweden
B-I
22
8
10
146
0.411
SEHAD
Halmstad
Sweden
B-II
22
8
10
146
0.411
FRLEH
Le Havre
France
NEA-II
22
8
10
146
0.411
NLRTM
Rotterdam
Netherlands
NEA-II
22
8
10
146
0.411
FRLAV
Lavera
France
MED-II
17
5
11
142
0.400
ITPFX
Porto Foxi (Sarroch)
Italy
MED-II
17
5
11
142
0.400
EGPSD
Port Said
Egypt
MED-V
16
5
10
131
0.369
GREEU
Eleusis
Greece
MED-VI
16
5
10
131
0.369
GRPAC
Pachi
Greece
MED-VI
16
5
10
131
0.369
GRPIR
Piraeus
Greece
MED-VI
16
5
10
131
0.369
ZADUR
Durban
South Africa
WA-V
13
3
9
112
0.315
PAAML
Puerto Armuelles
Panama
SEP-H
34
5
6
109
0.307
47
Ballast Water Risk Assessment, Port of Khark Island, Islamic Republic of Iran, August 2003: Final Report
Table 7 cont. Ranking of BW source ports identified for Port of Khark Island, according to the size of their risk
species threat (C4).
No. of Introduced
Suspected
Knwn Harmful Total Threat
Relative Risk Species
Port Code
Source Port
Country
Bio-Region
Species
Harmful Species
Species
Value
Threat (C4)
INBOM
Mumbai (Ex Bombay)
India
CIO-I
8
13
5
97
0.273
INCOK
Cochin
India
CIO-I
8
13
5
97
0.273
INIXE
Mangalore (New Mangalore)
India
CIO-I
8
13
5
97
0.273
INIXY
Kandla (Muldwarka)
India
CIO-I
8
13
5
97
0.273
INSAL
Salaya
India
CIO-I
8
13
5
97
0.273
INSIK
Sikka (Jamnagar)
India
CIO-I
8
13
5
97
0.273
INVAD
Vadinar
India
CIO-I
8
13
5
97
0.273
INMAA
Chennai (Ex Madras)
India
CIO-II
8
13
5
97
0.273
LKCMB
Colombo
Sri Lanka
CIO-II
8
13
5
97
0.273
BDCGP
Chittagong
Bangladesh
CIO-III
8
13
5
97
0.273
INHAL
Haldia
India
CIO-III
8
13
5
97
0.273
USHNL
Honolulu Hawaii
United States
SP-XXI
27
7
4
88
0.248
CACBC
Come By Chance
Canada
NA-S2
10
3
6
79
0.223
PHBLG
Tabanga
Philippines
EAS-I
6
6
5
74
0.208
PHBTG
Batangas Luzon
Philippines
EAS-I
6
6
5
74
0.208
PHBTN
Bataan Mariveles
Philippines
EAS-I
6
6
5
74
0.208
THMAT
Mab Tapud
Thailand
EAS-I
6
6
5
74
0.208
THRTT
Rayong TPI Terminal
Thailand
EAS-I
6
6
5
74
0.208
THSRI
Sriracha
Thailand
EAS-I
6
6
5
74
0.208
VNVUT
Vung Tau
Viet Nam
EAS-I
6
6
5
74
0.208
MYJHB
Johor Bahru
Malaysia
EAS-VI
6
6
5
74
0.208
MYMKZ
Malacca
Malaysia
EAS-VI
6
6
5
74
0.208
SGJUR
Jurong
Singapore
EAS-VI
6
6
5
74
0.208
SGKEP
Keppel Wharves
Singapore
EAS-VI
6
6
5
74
0.208
SGSIN
Singapore
Singapore
EAS-VI
6
6
5
74
0.208
SGTPG
Tanjong Pagar
Singapore
EAS-VI
6
6
5
74
0.208
IDPDG
Teluk Bajur/Padang Sumatra
Indonesia
EAS-VII
6
6
5
74
0.208
IDCXP
Cilacap Java
Indonesia
EAS-VIII
6
6
5
74
0.208
AEFJR
Fujairah (Al-Fujairah)
UAE
IP-1
8
3
4
57
0.161
AEKLF
Khor Al Fakkan
UAE
IP-1
8
3
4
57
0.161
OMMFH
Min-Al-Fahal
Oman
IP-1
8
3
4
57
0.161
PKBQM
Muhammad Bin Qasim
Pakistan
IP-1
8
3
4
57
0.161
PKKHI
Karachi
Pakistan
IP-1
8
3
4
57
0.161
IRBND
Bandar Abbas
IR Iran
AG-1
4
5
3
49
0.138
IRLVP
Lavan Island
IR Iran
AG-1
4
5
3
49
0.138
IRSXI
Sirri Island Oil Terminal
IR Iran
AG-1
4
5
3
49
0.138
IQBSR
Basra
Iraq
AG-2
4
5
3
49
0.138
IRBKM
Bandar Khomeini
IR Iran
AG-2
4
5
3
49
0.138
IRBMR
Bandar Mashur
IR Iran
AG-2
4
5
3
49
0.138
IQMAB
Mina Al Bakir
Iraq
AG-3
1
5
3
46
0.130
KWMEA
Mina Al Ahmadi
Kuwait
AG-3
1
5
3
46
0.130
KWMIS
Mina Saud
Kuwait
AG-3
1
5
3
46
0.130
KWSAA
Shuaiba
Kuwait
AG-3
1
5
3
46
0.130
SAJUB
Jubail
Saudi Arabia
AG-3
1
5
3
46
0.130
AEDAS
Das Island
UAE
AG-5
1
5
3
46
0.130
AEDXB
Dubai
UAE
AG-5
1
5
3
46
0.130
AEJEA
Jebel Ali
UAE
AG-5
1
5
3
46
0.130
AEJED
Jebel Dhanna
UAE
AG-5
1
5
3
46
0.130
AESHJ
Sharjah
UAE
AG-5
1
5
3
46
0.130
AEZIR
Zirku Island
UAE
AG-5
1
5
3
46
0.130
QADOH
Doha
Qatar
AG-5
1
5
3
46
0.130
QAUMS
Umm Said
Qatar
AG-5
1
5
3
46
0.130
SADMN
Damman
Saudi Arabia
AG-5
1
5
3
46
0.130
SARAR
Ras al Khafji
Saudi Arabia
AG-5
1
5
3
46
0.130
SARTA
Ras Tanura
Saudi Arabia
AG-5
1
5
3
46
0.130
USLOP
LOOP Terminal
United States
CAR-I
4
4
2
36
0.101
USSAB
Sabine
United States
CAR-I
4
4
2
36
0.101
EGAIS
Ain Sukhana
Egypt
RS-3
6
2
2
32
0.090
EGSUZ
Suez (El Suweis)
Egypt
RS-3
6
2
2
32
0.090
MGTMM
Tamatave (Toamasina)
Madagascar
EA-III
6
2
0
12
0.034
IDBPN
Balikpapan Kalimantan
Indonesia
EAS-II
2
3
0
11
0.031
YEHOD
Hodeidah
Yemen
RS-1
4
2
0
10
0.028
48
4 Results
Many of the species listed for these areas can be related to their history of species transfers for
aquaculture, plus hull fouling on sailing vessels and the canal-caused invasions of the east
Mediterranean (Suez), north-east Europe (Ponto-Caspian river canal links) and Great Lakes (St
Lawrence River seaway).
The regional bias needs to be remembered when comparing C4 values between different bioregions,
and is a further reason why the independent treatment of C3 for calculating the ROR values is a safer
approach (Section 3.10). Because of the different historical vectors (hull fouling, canals, aquaculture,
dry ballast, water ballast, etc), a future version of the BWRA system could provide more accurate C4
values for BW-mediated introduction threats if vector weightings are added to the database for the C4
calculation.
Finally, it is worth noting the database cannot produce `reverse' C4 values for destination ports (i.e.
measures of the relative threat posed by any BW exported from Khark Island). This requires knowing
the sources of all the other BW discharged at each destination port. What can be extracted from the
database to assist a `reverse' BWRA is the list of species assigned to the bioregion of Khark Island
(which is located on the boundary of bioregions AG1 and AG2; Figure 7, Table 8).
Table 8. Status of risk species assigned to the bioregions of Khark Island (AG-1, AG-2)
Regional
Group
Common Name
Species Name
Threat Status
Status
Pyrrophyta/Dinophycae
Toxic dinoflagellate
Alexandrium minutum
Cryptogenic
Known harmful species
Pyrrophyta/Dinophycae
Toxic dinoflagellate
Alexandrium tamarense
Cryptogenic
Known harmful species
Pyrrophyta/Dinophycae
Toxic dinoflagellate
Cochlodinium polykrikoides
Native
Suspected harmful species
Pyrrophyta/Dinophycae
Toxic dinoflagellate
Gymnodinium catenatum
Introduced
Known harmful species
Pyrrophyta/Dinophycae
Toxic dinoflagellate
Gyrodinium impudicum
Introduced
Suspected harmful species
Pyrrophyta/Dinophycae
Toxic dinoflagellate
Gyrodinium instriatum
Introduced
Suspected harmful species
Pyrrophyta/Dinophycae
Toxic dinoflagellate
Peridinium pentagonum (Gran) Balech
Introduced
Suspected harmful species
Cnidaria
Moon Jellyfish
Aurelia aurita
Cryptogenic
Suspected harmful species
Cnidaria
Sea jelly
Phyllorhiza punctata
Native
Not suspected
Arthropoda - Cirrepedia
Striped barnacle
Balanus amphitrite amphitrite
Cryptogenic
Not suspected
Arthropoda - Cirrepedia
Striped barnacle
Balanus amphitrite cirratus
Native
Not suspected
Arthropoda - Cirrepedia
Striped barnacle
Balanus amphitrite hawaiiensis
Cryptogenic
Not suspected
Arthropoda - Cirrepedia
Rosy barnacle
Balanus trigonus
Cryptogenic
Not suspected
Arthropoda - Isopoda
Sea lice
Cilicaea lateraillei
Native
Not suspected
Arthropoda - Decapoda
Crab
Ashtoret lunaris
Native
Not suspected
Arthropoda - Decapoda
Swimmer crab
Charybdis hellerii
Native
Known harmful species
Mollusc - bivalve
Red Sea cup oyster
Chama elatensis
Native
Not suspected
Mollusc - bivalve
Indo-Pacific rock oyster
Saccostrea cucullata
Native
Not suspected
Mollusc - gastropod
Indo-Pacific marine snail
Cavolinia tridentate (Neibuhr 1775)
Cryptogenic
Not suspected
Chordata - Pisces
Sleeper goby
Butis koilomatodon
Native
Not suspected
Chordata - Pisces
Combtooth blenny
Ornobranchus punctatus
Native
Not suspected
Chordata - Pisces
Sobaity sea bream
Sparidenrax hasta
Native
Not suspected
The species in Table 8 include preliminary identifications from the Khark Island PBBS, plus those
listed in published and unpublished reports from the RSA (mostly the west side; AG-3, AG-5; Figure
7). Bandar Abbas (the only port identified to receive BW uplifted at Khark Island) is also in bioregion
AG-1 , and the same species were also assigned to AG-3 and AG-5 because of the small size, circular
water movements and lack of specific distribution data for the RSA (Figures 2, 7, 11-12).
4.8
Risk assessment results
The database calculates the relative overall risk (ROR) of a potentially harmful introduction for all
source ports that have C1-C4 coefficients and R1-R2 factors. The ROR value for each source port
represents a proportion of the threat posed to the Demonstration Site as result of its contemporary
trading pattern (1999-2002).
After calculating the RORs the database generates a large output table listing the source ports and
their coefficients, risk-reduction factors and ROR value, plus the five ROR categories used for the
GIS plot and the standardised ROR values (S-ROR; Section 3.10). Results from the project-standard
49
Ballast Water Risk Assessment, Port of Khark Island, Islamic Republic of Iran, August 2003: Final Report
BWRA for the Port of Khark Island are listed in Table 9, and the GIS plot of the ROR categories is
shown in Figure 24.
Seventeen source ports provided the top 20% of the total cumulative threat for the Port of Khark
Island, with ROR values in the 0.23-0.20 range (Table 9). These highest risk ports (in terms of their
BW source frequency, volume, environmental similarity and assigned risk species) were led by
Kaohsiung in Taiwan Province (ROR = 0.229; S-ROR = 1.0), followed by four RSA ports (Jebel Ali,
Doha, Umm Said and Fujairah) and the Red Sea oil reception terminal at Ain Sukhana (ROR = 0.218;
S-ROR = 0.95). Highest risk ports beyond the Middle East were Okinawa and Chiba (Japan) and
Ulsan (Korea)(Table 9).
Of the 22 source ports in the high risk category, the majority were located in South Asia and East
Asia, including ports in India (2), Sri Lanka (1), Japan (7), China (1), Taiwan Province (1), Korea (2)
and Philippines (1). Only one European port attained the high risk category (Eleusis in Greece; ROR
= 0.19; S-ROR = 0.81). Six ports in the RSA also attained this category but the frequency and
amounts of BW actually sourced from these ports (as indicated in the BWRFs) are questionable.
Figure 24. GIS output showing the location and categories of relative overall risk (ROR-cat) of source ports
identified for the Port of Khark Island
The 64 source ports in the low (27) and lowest (37) risk categories include those in north Europe,
North America and South Africa, plus a mixture of South and East Asian ports. These ports have
relatively low environmental similarities (6-56%) and BW source frequencies (<2.5%). The source
port with the lowest ROR (0.027) was the Port of Come by Chance (Newfoundland, Canada).
Based on the current pattern of shipping trade (1999-2002), the ROR results imply BW discharges by
vessels arriving from north-east America represent a threat to Khark Island that is an order of
magnitude less than many Asian and Middle East ports such as Kaohsiung, Jebel Ali and Ain Sukahna
(Table 9).
The generally much higher threat of BW-mediated introductions posed by BW sources in the Middle
East and Asia than in north America and Europe is logical with respect to Khark Island's geographic
location and pattern of trade. It also implies that any introduced species which establishes in a port in
the RSA or nearby Red Sea and west Arabian Sea could be readily spread by local ship movements
involving shuttle services, bunkering and/or part-loading of cargo.
While the high temperature and salinity ranges experienced by the majority RSA ports no doubt help
constrain the establishment of many unwanted marine plants and animals from the subtropical and
tropical regions of East Asia and the Americas, the number of introduced and cryptogenic toxic
dinoflagellates in Table 9 shows this region is not immune to the spread of harmful species. These
could increase the severity of red tides in eutrophic coastal bays and lagoons beside rapidly-
developing urban centres (a growing problem recognised by several GCC countries).
50
4 Results
Table 9. BW source ports reported for the Port of Khark Island, ranked according to their Relative Overall Risk
(ROR)
Min.
Relative
% of total
C1 BW
C2 BW Max. Tank
C3 Env.
C4 Risk
Port Code
Source Port
Country
R1
Tank
R2
Overall Risk risk (ROR
Freq
Vol
Disch (MT)
Match.
Spp.
Stor. (d)
(ROR)
sum)
Estimated
Cumulative
Percentage
Risk Category
Standrdisd
ROR
TWKHH Kaohsiung
Taiwan Province
0.040
0.031
102,259
1.0
15
0.6
0.572
0.4535
0.229
1.15
1.15
Highest
1.00
AEJEA
Jebel Ali
UAE
0.003
0.005
111,238
1.0
2
1.0
0.757
0.1296
0.224
1.12
2.27
Highest
0.97
QADOH Doha
Qatar
0.001
0.003
105,410
1.0
1
1.0
0.754
0.1296
0.222
1.11
3.38
Highest
0.97
QAUMS Umm Said
Qatar
0.003
0.001
17,761
1.0
2
1.0
0.750
0.1296
0.221
1.11
4.49
Highest
0.96
AEFJR
Fujairah (Al-Fujairah)
UAE
0.019
0.022
147,588
1.0
2
1.0
0.674
0.1606
0.219
1.10
5.59
Highest
0.95
EGAIS
Ain Sukhana
Egypt
0.066
0.097
144,845
1.0
5
0.8
0.637
0.0901
0.218
1.09
6.68
Highest
0.95
SAJUB
Jubail
Saudi Arabia
0.004
0.001
35,791
1.0
1
1.0
0.731
0.1296
0.216
1.09
7.77
Highest
0.94
JPOKA
Okinawa Okinawa
Japan
0.000
0.001
85,900
1.0
19
0.6
0.581
0.4535
0.214
1.07
9.93
Highest
0.93
IRBND
Bandar Abbas
IR Iran
0.075
0.040
135,815
1.0
1
1.0
0.574
0.1380
0.207
1.04
10.97
Highest
0.89
AEKLF
Khor Al Fakkan
UAE
0.007
0.005
94,472
1.0
1
1.0
0.651
0.1606
0.206
1.03
12.00
Highest
0.89
SADMN Damman
Saudi Arabia
0.001
0.000
11,044
1.0
1
1.0
0.678
0.1296
0.202
1.02
13.02
Highest
0.87
SARTA
Ras Tanura
Saudi Arabia
0.015
0.032
108,950
1.0
1
1.0
0.631
0.1296
0.202
1.01
14.03
Highest
0.87
JPCHB
Chiba Chiba
Japan
0.049
0.051
107,191
1.0
15
0.6
0.421
0.4676
0.200
1.01
15.04
Highest
0.86
JPSEN
Sendai Kagoshima
Japan
0.006
0.007
103,622
1.0
19
0.6
0.515
E
0.4535
0.200
1.00
16.04
Highest
0.86
KRUSN
Ulsan
Rep Korea
0.041
0.037
156,162
1.0
7
0.8
0.348
0.4620
0.199
1.00
17.04
Highest
0.85
KWSAA Shuaiba
Kuwait
0.000
0.000
3,385
1.0
2
1.0
0.666
0.1296
0.199
1.00
18.04
Highest
0.85
KWMEA Mina Al Ahmadi
Kuwait
0.004
0.007
104,995
1.0
1
1.0
0.655
0.1296
0.199
1.00
19.04
Highest
0.85
AEJED
Jebel Dhanna
UAE
0.015
0.028
109,164
1.0
1
1.0
0.624
0.1296
0.199
1.00
20.03
High
0.85
KWMIS
Mina Saud
Kuwait
0.001
0.004
94,362
1.0
1
1.0
0.658
0.1296
0.198
0.99
21.03
High
0.85
KRTSN
Taesan
Rep Korea
0.019
0.028
109,276
1.0
8
0.8
0.363
E
0.4732
0.197
0.99
22.02
High
0.84
JPKII
Kiire Kagoshima
Japan
0.015
0.013
100,057
1.0
16
0.6
0.470
0.4676
0.194
0.98
22.99
High
0.83
AEZIR
Zirku Island
UAE
0.002
0.006
101,742
1.0
2
1.0
0.637
0.1296
0.194
0.97
23.97
High
0.83
CNSDG
Shui Dong
China
0.010
0.009
84,200
1.0
6
0.8
0.390
E
0.4535
0.193
0.97
24.94
High
0.82
LKCMB Colombo
Sri Lanka
0.005
0.003
34,500
1.0
7
0.8
0.539
0.2732
0.192
0.96
25.90
High
0.82
GREEU
Eleusis
Greece
0.008
0.004
80,625
1.0
13
0.6
0.527
0.3690
0.190
0.95
26.85
High
0.81
AEDAS
Das Island
UAE
0.000
0.000
0
0.4
1
1.0
0.630
0.1296
0.190
0.95
27.81
High
0.81
Taiwan Province Of
TWMAI Mailiao
0.010
0.005
55,000
1.0
9
0.8
0.362
E
0.4732
0.189
0.95
28.75
High
0.80
China
INVAD
Vadinar
India
0.004
0.005
100,231
1.0
4
1.0
0.464
0.2732
0.187
0.94
29.69
High
0.79
JPKSM
Kashima Ibaraki
Japan
0.021
0.015
95,600
1.0
17
0.6
0.436
0.4535
0.186
0.93
30.62
High
0.79
INSIK
Sikka (Jamnagar)
India
0.037
0.032
121,600
1.0
4
1.0
0.396
0.2732
0.185
0.93
31.55
High
0.78
KRCHA
Cheju
Rep Korea
0.005
0.002
102,123
1.0
12
0.6
0.446
E
0.4732
0.184
0.92
32.48
High
0.78
JPYKK
Yokkaichi Mie
Japan
0.028
0.024
100,514
1.0
17
0.6
0.403
0.4676
0.184
0.92
33.40
High
0.78
JPKWS
Kawasaki Kanagawa
Japan
0.019
0.019
97,038
1.0
17
0.6
0.401
0.4676
0.180
0.90
34.30
High
0.76
JPNGO
Nagoya Aichi
Japan
0.012
0.017
104,882
1.0
18
0.6
0.410
0.4676
0.180
0.90
35.20
High
0.76
JPSAK
Sakai Osaka
Japan
0.012
0.013
96,166
1.0
18
0.6
0.412
0.4676
0.179
0.90
36.11
High
0.76
PHBLG
Tabanga
Philippines
0.005
0.005
115,402
1.0
9
0.8
0.540
E
0.2085
0.179
0.90
37.01
High
0.76
JPYOK
Yokohama Kanagawa
Japan
0.008
0.007
94,779
1.0
17
0.6
0.419
0.4676
0.178
0.90
37.90
High
0.75
AESHJ
Sharjah
UAE
0.001
0.000
9,736
1.0
3
1.0
0.581
0.1296
0.178
0.89
38.80
High
0.75
YEHOD
Hodeidah
Yemen
0.001
0.001
39,030
1.0
25
0.4
0.699
0.0282
0.178
0.89
39.69
High
0.75
ITPFX
Porto Foxi (Sarroch)
Italy
0.002
0.001
53,273
1.0
17
0.6
0.468
0.4000
0.178
0.89
40.58
Medium
0.75
JPNGI
Negishi
Japan
0.005
0.004
94,032
1.0
15
0.6
0.419
0.4676
0.177
0.89
41.47
Medium
0.74
AEDXB
Dubai
UAE
0.010
0.016
144,845
1.0
2
1.0
0.551
0.1296
0.177
0.89
42.36
Medium
0.74
EGSUZ
Suez (El Suweis)
Egypt
0.000
0.001
94,472
1.0
10
0.6
0.649
0.0901
0.176
0.88
43.24
Medium
0.74
IRSXI
Sirri Island Oil Terminal
IR Iran
0.003
0.006
104,999
1.0
1
1.0
0.556
0.1380
0.176
0.88
44.13
Medium
0.74
HKHKG Hong Kong
Hong Kong
0.001
0.002
99,809
1.0
16
0.6
0.426
0.4535
0.175
0.88
45.01
Medium
0.74
CNTAO
Qingdao (Longgang) Shandong
China
0.005
0.011
100,933
1.0
19
0.6
0.401
0.4732
0.175
0.88
45.88
Medium
0.73
GRPAC
Pachi
Greece
0.002
0.002
38,700
1.0
15
0.6
0.472
0.3690
0.174
0.88
46.76
Medium
0.73
INIXE
Mangalore (New Mangalore)
India
0.051
0.020
44,457
1.0
5
0.8
0.408
0.2732
0.174
0.88
47.64
Medium
0.73
JPNGS
Nagasaki Nagasaki
Japan
0.001
0.002
97,401
1.0
18
0.6
0.409
0.4732
0.174
0.87
48.51
Medium
0.73
IRLVP
Lavan Island
IR Iran
0.000
0.000
28,898
1.0
2
1.0
0.556
0.1380
0.174
0.87
49.38
Medium
0.73
SGSIN
Singapore
Singapore
0.048
0.055
106,981
1.0
5
0.8
0.425
0.2085
0.174
0.87
50.25
Medium
0.73
KROKP
Okpo
Rep Korea
0.001
0.001
90,702
1.0
19
0.6
0.407
E
0.4732
0.173
0.87
51.12
Medium
0.73
JPOIT
Oita Oita
Japan
0.011
0.010
104,578
1.0
17
0.6
0.388
0.4676
0.173
0.87
51.99
Medium
0.72
JPMIZ
Mizushima Okayama
Japan
0.040
0.030
104,200
1.0
17
0.6
0.338
0.4676
0.172
0.86
52.85
Medium
0.72
AUPST
Port Stanvac
Australia
0.000
0.001
92,334
1.0
20
0.4
0.471
0.5380
0.172
0.86
53.72
Medium
0.72
GRPIR
Piraeus
Greece
0.001
0.001
35,152
1.0
47
0.4
0.536
0.3690
0.171
0.86
54.58
Medium
0.72
PHBTG
Batangas Luzon
Philippines
0.005
0.006
95,000
1.0
13
0.6
0.544
0.2085
0.170
0.85
55.43
Medium
0.71
CNZOS
Zhousan (Dinghai)
China
0.001
0.002
101,376
1.0
15
0.6
0.390
E
0.4732
0.169
0.85
56.28
Medium
0.71
KRYOS
Yosu
Rep Korea
0.026
0.016
104,603
1.0
18
0.6
0.350
E
0.4732
0.169
0.85
57.13
Medium
0.70
CNZHE
Zhenjiang Zhejiang
China
0.001
0.000
34,989
1.0
15
0.6
0.390
E
0.4732
0.169
0.85
57.98
Medium
0.70
FRLAV
Lavera
France
0.000
0.001
104,556
1.0
15
0.6
0.431
0.4000
0.168
0.84
58.82
Medium
0.70
PHBTN
Bataan Mariveles
Philippines
0.004
0.006
101,870
1.0
18
0.6
0.527
0.2085
0.166
0.83
59.65
Medium
0.69
51
Ballast Water Risk Assessment, Port of Khark Island, Islamic Republic of Iran, August 2003: Final Report
Table 9 cont. Source ports identified for the Port of Khark Island, as ranked according to their Relative Overall
Risk (ROR)
Min.
Relative
% of Total
Max. Tank
C3 Env.
C4 Risk
Port Code
Source Port
Country
C1 Freq
C2 Vol
R1
Tank
R2
Overall Risk Risk (Sum
Disch (MT)
Match.
Spp.
Stor. (d)
(ROR)
of ROR)
Estimated
Cumulative
Percentage
Risk Category
Standard
Results
KRONS
Onsan
Rep Korea
0.013
0.016
103,602
1.0
13
0.6
0.355
0.4620
0.165
0.83
60.48
Low
0.69
JPSKD
Sakaide Kagawa
Japan
0.010
0.009
98,414
1.0
18
0.6
0.359
0.4676
0.165
0.83
61.31
Low
0.68
ZADUR
Durban
South Africa
0.024
0.025
141,588
1.0
12
0.6
0.418
0.3155
0.164
0.82
62.13
Low
0.68
JPHIM
Himeji Hyogo
Japan
0.002
0.003
83,088
1.0
22
0.4
0.460
0.4676
0.163
0.82
62.95
Low
0.67
INMAA
Chennai (Ex Madras)
India
0.002
0.002
51,911
1.0
7
0.8
0.428
0.2732
0.163
0.82
63.76
Low
0.67
JPSMT
Shimotsu Wakayama
Japan
0.000
0.001
99,920
1.0
21
0.4
0.458
0.4676
0.162
0.81
64.58
Low
0.67
THMAT Mab Tapud
Thailand
0.014
0.018
102,568
1.0
12
0.6
0.486
E
0.2085
0.161
0.81
65.38
Low
0.66
CNNGB
Ningbo Zhejiang
China
0.011
0.014
106,651
1.0
17
0.6
0.333
0.4732
0.161
0.81
66.19
Low
0.66
PKKHI
Karachi
Pakistan
0.007
0.004
32,000
1.0
3
1.0
0.467
0.1606
0.160
0.80
66.99
Low
0.66
JPUBJ
Ube Yamaguchi
Japan
0.009
0.008
109,295
1.0
17
0.6
0.340
0.4676
0.160
0.80
67.79
Low
0.66
VNVUT
Vung Tau
Viet Nam
0.000
0.000
1,284
1.0
35
0.4
0.550
E
0.2085
0.158
0.80
68.59
Low
0.65
JPSMZ
Shimizu Shizuoka
Japan
0.000
0.001
85,348
1.0
21
0.4
0.445
0.4676
0.158
0.79
69.38
Low
0.65
INSAL
Salaya
India
0.000
0.000
27,105
1.0
11
0.6
0.468
0.2732
0.158
0.79
70.18
Low
0.65
JPTAM
Tamano Okayama
Japan
0.000
0.000
19,000
1.0
21
0.4
0.429
0.4676
0.154
0.77
70.95
Low
0.63
JPTKY
Tokuyama Yamaguchi
Japan
0.005
0.007
106,341
1.0
17
0.6
0.323
0.4676
0.154
0.77
71.72
Low
0.63
JPINS
Inoshima Hiroshima
Japan
0.000
0.001
90,295
1.0
20
0.4
0.424
0.4676
0.153
0.77
72.49
Low
0.63
ESBIO
Bilbao
Spain
0.003
0.007
98,000
1.0
19
0.6
0.346
E
0.4141
0.151
0.76
73.25
Low
0.62
USSAB
Sabine
United States
0.000
0.001
83,512
1.0
41
0.4
0.560
0.1014
0.151
0.76
74.01
Low
0.61
Taiwan Province of
TWKEL
Keelung (Sha Lung & Tanshoei)
0.009
0.006
96,828
1.0
12
0.6
0.293
0.4732
0.148
0.74
74.75
Low
0.60
China
INBOM
Mumbai (Ex Bombay)
India
0.003
0.003
93,312
1.0
3
1.0
0.309
0.2732
0.147
0.74
75.49
Low
0.60
JPKCZ
Kochi Kochi
Japan
0.000
0.001
101,380
1.0
21
0.4
0.397
0.4676
0.147
0.74
76.22
Low
0.59
JPSAE
Saiki Oita
Japan
0.002
0.001
10,801
1.0
22
0.4
0.394
0.4676
0.146
0.74
76.14
Low
0.59
CNQZJ
Quanzhou (Jinjiang) Fujian
China
0.003
0.001
24,228
1.0
21
0.4
0.390
E
0.4732
0.146
0.73
76.95
Low
0.59
CNMEZ
Xiuyu (Meizhou)
China
0.001
0.001
24,000
1.0
22
0.4
0.390
E
0.4732
0.145
0.73
77.68
Low
0.59
CNJIA
Jiangyin Jiangsu
China
0.000
0.000
19,500
1.0
23
0.4
0.390
E
0.4732
0.145
0.73
78.41
Low
0.59
THRTT
Rayong TPI Terminal
Thailand
0.001
0.001
39,717
1.0
24
0.4
0.486
E
0.2085
0.143
0.72
79.13
Low
0.57
MYMKZ Malacca
Malaysia
0.002
0.004
95,168
1.0
11
0.6
0.438
E
0.2085
0.142
0.71
79.84
Low
0.57
SARAR
Ras al Khafji
Saudi Arabia
0.001
0.003
98,000
1.0
1
1.0
0.425
E
0.1296
0.140
0.70
80.54
Lowest
0.56
PKBQM
Muhammad Bin Qasim
Pakistan
0.003
0.001
26,630
1.0
5
0.8
0.427
0.1606
0.140
0.70
81.25
Lowest
0.56
SGJUR
Jurong
Singapore
0.001
0.002
87,440
1.0
10
0.6
0.425
0.2085
0.138
0.69
81.94
Lowest
0.55
CNDLC
Dalian Liaoning
China
0.001
0.001
51,856
1.0
30
0.4
0.360
0.4732
0.138
0.69
82.63
Lowest
0.55
EGPSD
Port Said
Egypt
0.000
0.001
104,556
1.0
10
0.6
0.321
0.3690
0.136
0.68
83.32
Lowest
0.54
JPMUR
Muroran Hokkaido
Japan
0.003
0.004
92,397
1.0
18
0.6
0.264
0.4535
0.136
0.68
84.00
Lowest
0.54
FRDON
Donges
France
0.004
0.012
104,961
1.0
18
0.6
0.257
0.4169
0.131
0.66
84.65
Lowest
0.51
OMMFH Min-Al-Fahal
Oman
0.001
0.003
90,996
1.0
2
1.0
0.356
E
0.1606
0.130
0.65
85.31
Lowest
0.51
SGTPG
Tanjong Pagar
Singapore
0.001
0.000
36,888
1.0
11
0.6
0.390
0.2085
0.129
0.65
85.96
Lowest
0.51
SGKEP
Keppel Wharves
Singapore
0.000
0.001
108,491
1.0
22
0.4
0.425
0.2085
0.128
0.64
86.60
Lowest
0.50
JPTMK
Tomakomai Hokkaido
Japan
0.004
0.006
94,366
1.0
19
0.6
0.225
0.4535
0.127
0.64
87.23
Lowest
0.50
USHNL
Honolulu Hawaii
United States
0.000
0.000
37,181
1.0
32
0.4
0.400
E
0.2479
0.125
0.63
87.86
Lowest
0.49
MYJHB
Johor Bahru
Malaysia
0.000
0.001
94,199
1.0
12
0.6
0.365
E
0.2085
0.123
0.62
88.48
Lowest
0.48
INHAL
Haldia
India
0.003
0.002
31,309
1.0
8
0.8
0.264
0.2732
0.122
0.61
89.09
Lowest
0.47
JPSAI
Saijo
Japan
0.001
0.001
35,972
1.0
56
0.2
0.390
E
0.4676
0.121
0.61
89.70
Lowest
0.47
THSRI
Sriracha
Thailand
0.006
0.006
96,356
1.0
12
0.6
0.345
E
0.2085
0.120
0.60
90.30
Lowest
0.46
FRLEH
Le Havre
France
0.000
0.001
93,000
1.0
19
0.6
0.217
0.4113
0.116
0.58
90.89
Lowest
0.44
INCOK
Cochin
India
0.016
0.007
37,000
1.0
6
0.8
0.217
0.2732
0.115
0.58
91.46
Lowest
0.44
IRBKM
Bandar Khomeini
IR Iran
0.004
0.000
3,430
1.0
1
1.0
0.293
0.1380
0.109
0.55
92.01
Lowest
0.41
IQBSR
Basra
Iraq
0.000
0.001
92,943
1.0
1
1.0
0.290
E
0.1380
0.107
0.54
92.55
Lowest
0.40
IDPDG
Teluk Bajur/Padang Sumatra
Indonesia
0.000
0.002
128,200
1.0
16
0.6
0.300
E
0.2085
0.107
0.54
93.09
Lowest
0.40
IDCXP
Cilacap Java
Indonesia
0.007
0.005
59,740
1.0
8
0.8
0.247
0.2085
0.107
0.54
93.62
Lowest
0.39
IQMAB
Mina Al Bakir
Iraq
0.000
0.001
105,976
1.0
1
1.0
0.290
E
0.1296
0.105
0.53
94.15
Lowest
0.39
IRBMR
Bandar Mashur
IR Iran
0.000
0.000
0
0.4
1
1.0
0.278
0.1380
0.104
0.52
94.67
Lowest
0.38
PAAML Puerto Armuelles
Panama
0.002
0.001
26,547
1.0
54
0.2
0.328
E
0.3070
0.098
0.49
95.16
Lowest
0.35
USLOP
LOOP Terminal
United States
0.001
0.004
130,519
1.0
34
0.4
0.337
0.1014
0.096
0.48
95.65
Lowest
0.34
INIXY
Kandla (Muldwarka)
India
0.004
0.000
21,357
1.0
6
0.8
0.158
0.2732
0.095
0.48
96.12
Lowest
0.34
MAMOH Mohammedia
Morocco
0.000
0.000
35,000
1.0
21
0.4
0.368
E
0.0000
0.092
0.46
96.59
Lowest
0.32
SEBRO
Brofjorden
Sweden
0.001
0.003
100,077
1.0
22
0.4
0.200
E
0.4113
0.092
0.46
97.05
Lowest
0.32
SEHAD
Halmstad
Sweden
0.000
0.001
90,000
1.0
26
0.4
0.200
E
0.4113
0.092
0.46
97.51
Lowest
0.32
MGTMM Tamatave (Toamasina)
Madagascar
0.000
0.000
37,436
1.0
23
0.4
0.333
E
0.0338
0.087
0.44
97.94
Lowest
0.30
KRINC
Inchon
Rep Korea
0.000
0.001
105,103
1.0
20
0.4
0.137
0.4732
0.082
0.41
98.36
Lowest
0.27
NGABO Abonnema
Nigeria
0.000
0.000
32,226
1.0
23
0.4
0.326
E
0.0000
0.082
0.41
98.77
Lowest
0.27
IDBPN
Balikpapan Kalimantan
Indonesia
0.003
0.000
17,469
1.0
71
0.2
0.300
E
0.0310
0.077
0.39
99.15
Lowest
0.25
BDCGP
Chittagong
Bangladesh
0.000
0.001
47,309
1.0
11
0.6
0.125
0.2732
0.073
0.36
99.52
Lowest
0.23
NLRTM
Rotterdam
Netherlands
0.005
0.011
114,835
1.0
20
0.4
0.095
0.4113
0.069
0.35
99.86
Lowest
0.21
CACBC
Come By Chance
Canada
0.000
0.002
142,247
1.0
91
0.2
0.061
0.2225
0.027
0.14
100.0
Lowest
0.00
Figure 25 shows the distribution of the standardised ROR values. The relatively wide spread of this
plot reflects the large number of ports with similar BW source frequencies and environmental
matching coefficients (e.g. 39 of the 126 source ports (31%) represent 40% of the cumulative threat;
Table 9).
52
4 Results
25
Distribution of S-RORs
20
15
Frequency 10
5
0
0.00
0.05
0.10
0.15
0.20
0.25
0.30
0.35
0.40
0.45
0.50
0.55
0.60
0.65
0.70
0.75
0.80
0.85
0.90
0.95
1.00
Standardised ROR value
Figure 25. Frequency distribution of the standardised ROR values
Reverse BWRA
In the case of the cargo export-oriented Port of Khark Island, the only destination port reliably
identified to receive BW from this Demonstration Site was Bandar Abbas (Section 4.5). The
environmental similarity of Bandar Abbas is moderately high (C3 = 0.574) and this large coastal port
is in the same bioregion that borders Khark Island (AG-1; Figures 2, 7). This suggests any harmful
species that establishes a viable population at Khark Island has a reasonable chance of spreading to
Bandar Abbas via BW-mediated transfers. In the case of the risk species assigned to bioregions AG-
1/AG-2, the dinoflagellates capable of producing poisonous red tides in eutrophic coastal waters
would pose a serious threat to the inshore waters of Bandar Abbas (Table 8).
4.9
Training and capacity building
The computer hardware and software provided by the GloBallast Programme for the BWRA activity
was installed and is maintained at PSO's head office in Tehran. This PC, plus others made available
by PSO for BWRF data entries and database management, proved reliable and adequate for
developing the port map, displaying the results and providing other GIS and database needs.
All PSO counterparts were suitably experienced in the use of MS Windows applications and received
basic training in map development using ArcView GIS. Because the PSO has a close working
relationship with the National Cartographic Centre (NCC) in Tehran, which produces digital
navigation charts of Iranian coastal waters using the CARIS system, the NCC provided several
counterparts and information to help Group A develop the port map (Section 3.11; Appendix 2).
There is no doubt that the PSO and NCC are capable of producing similar resource maps for future
BWRA demonstration and training activities in the region.
As noted in Section 3.6, the most easily-trained and efficient database operators are those with port
and maritime work experience, plus previous hands-on experience with Windows applications. This
was the case for the PSO Group B counterparts, who had little difficulty in learning how to use the
database efficiently, and who demonstrated a good ability to recognise and fix incorrect or missing
ship, port and BW information on the BWRFs. Thus all Group B counterparts gained a good
understanding of the reporting requirements and became proficient in using port shipping records and
other databases for BWRF checking and gap-filling, including using the Fairplay Ports Guide, the
Lloyds Ship Register and the Excel spreadsheet for estimating BW discharge volumes. PSO officers
responsible for collecting BWRFs at Khark Island also received training and guidance to improve
53
Ballast Water Risk Assessment, Port of Khark Island, Islamic Republic of Iran, August 2003: Final Report
BWRF return rates, completeness and reduced error rates. Group B members also undertook an error
analysis of BWRF forms covering 16 month period (Section 4.10).
Of the three counterpart groups, Group C was the smallest (Appendix 2). Group C received
instruction in the approach and methods of the environmental similarity analysis using the PRIMER
package during the in-country visits by the consultants, with intensive `hands-on' training provided in
the second visit. The lead counterpart of Group B (Mr Nasser K Rad) also received training and
advice and became equally adept at generating the C3 coefficients and importing them to the
database. Collation of risk species information and regional networking with other marine scientists
was undertaken by Dr Vahid Yavari (PSO's BWRA team leader and leading counterpart of Group C).
4.10 Identification of information gaps
Ballast Water Reporting Forms
BWRFs containing many empty or incorrect entries for BW source/s, uptake date/s and tank volumes
intended to be discharged were not uncommon (as was the case for other Demonstration Sites where
BWRF submission was voluntary). Some ships submitted a copy of their Ballast Water Management
Plan instead of the BWRF. To determine trends among the BWRFs collected at the Port of Khark
Island, an error analysis of submitted BWRFs was undertaken by Group B, and the results are shown
in Table 10. The analysis covered three periods between April 2000 (month of BWRF inception at
Khark Island) and October 2002.
Table 12. Errors in BWRFs submitted to Port of Khark Island - results from three periods of BWRF analysis*
IMO
Arrival
Last
Next
BW on
BW
No of
BW
Exchange
Reason Disch
No
Total No
GT
Mnth
No.
Date
Port
Port
board
capacity Tanks Source
details
given
vol
Sign
BWRFs
Apr
3
3
5
4
6
5
5
8
22
26
28
23
15
42
May
7
5
6
3
5
5
4
6
13
30
29
17
9
43
Jul
5
3
4
1
3
3
8
7
11
30
26
26
8
42
Aug
6
5
11
2
2
3
5
3
4
38
40
19
23
55
Sep
2
2
6
1
0
3
5
5
6
17
16
13
5
41
Oct
0
0
6
2
1
0
1
1
2
19
26
11
8
30
Nov
3
1
4
0
3
2
4
4
2
15
9
13
3
40
Dec
3
1
2
0
0
0
0
0
1
7
3
3
1
12
Jan
4
0
2
1
2
1
1
1
1
18
17
8
4
38
Feb
0
0
0
0
0
0
0
0
0
4
7
2
3
10
Mar
3
2
4
2
4
5
6
2
5
26
15
13
6
39
Sep
0
0
1
1
1
0
1
1
0
14
16
6
4
43
Oct
0
0
0
0
0
0
0
0
1
11
12
5
1
26
Total
36
22
61
17
27
27
40
38
68
257
244
169
90
461
%
8%
5%
13%
4%
6%
6%
9%
8%
15%
56%
53%
37%
20%
%
*April - December 2000 (excluding June); January - March 2002; September - October 2002.
The following list summarises the most common omissions or mistakes in submitted BWRFs:
� BW uptake date, source port/location and/or discharge volume were provided for none, only
one, or just a few of the total number of tanks probably discharged.
� The BW exchange field (Part 4 of the BWRF; Appendix 1) was another problem area, with no
exchange data (or no reason given for not undertaking an exchange being a common
occurrence. Reasons typically provided for not undertaking a BW exchange were as follows
(comments by Group B are in italics):
- Severe weather conditions prevented exchange;
- Concern over the ship's stability and strength;
- Not a statutory/enforceable requirement of the port or national administration;
54
4 Results
- Ballast had been taken on at an offshore terminal (`clear water' was considered safe?);
- Ballast had been taken up in the same sea area (perceptive remark);
- Sea was clean (presumably did not want to cause oil and/or species pollution?);
- Vessel had segregated ballast tanks (presumably thinking of oil pollution control?);
- Ballast had been visually checked (characteristics checked for were not stated).
� Many vessels providing BW exchange data did not provide its original source details. It
seems the ship officers were assuming that exchanges are virtually 100% effective, so the
source details are not required. However it is important to enter the source port/location
details because even the most effective exchanges are probably in the 90-95% range.
� The BW Discharge field of the BWRF (also in Part 4) was also a problem area, with ships
appearing reluctant to enter this information although most were loading a full cargo and
therefore must have discharged all or most of their ballast. Of the few entries which entered
the salinity of the discharged ballast, all appeared to presume it was standard seawater (
1.025 specific gravity).
� Some ships did not appear to understand the difference between the arrival port and next port
(entering Khark Island in both boxes).
Table 12 and the above summary provide a useful guide as to which items port officers should
immediately check when collecting or receiving any BWRF. Table 12 also shows there was an
improvement in the error rate over the three periods of analysis. This was not unexpected since ships'
officers, shipping agents and the port officers were gradually becoming familiar with the BWRF
process following its inception at Khark Island and other ports around the world.
Apart from lack of BWRF familiarity, it was also recognised that the time available for a ships'
officer to complete the form is another factor influencing the number of mistakes and omissions.
BWRFs provided to ships during their berthing or departure phases cannot be expected to receive the
same level attention as forms already onboard the ship and completed prior to arrival. Thus reporting
can be improved if shipping agents send BWRF reminders (and blank forms where necessary) to ships
1-2 days prior to arrival.
The BWRF analysis revealed two other issues more specific to the RSA. The first stems from the
frequent bunkering, provisioning and crew change operations undertaken by the majority of ships
when entering or leaving the RSA (e.g. at Fujairah, Khor Fakkan). Such ports are frequently entered
as the last or next port of call, although ballast discharges related to bunkering will not be large.
Secondly, the last and next ports of call recorded on BWRFs and in port shipping records indicate that
many tankers appear to temporarily anchor and/or load part of their cargo at a number of RSA oil
terminals, both before or after visiting Khark Island. While this must decrease the amount of BW
discharged at the final loading terminal, BW sources and volumes written in BWRFs collected at
Khark Island were often contradictory (or omitted), indicating the BWRF had not been completed by
an experienced senior officer. Unless BWRFs are completed accurately and fully by tankers visiting
the RSA, a significant percentage of BW sources and discharge volumes will remain unclear.
Even with correctly completed forms, it is often impossible to identify the ultimate destination of any
BW uplifted by a port that receives and analyses BWRFs (Section 3.5). This is important given the
objective of the GloBallast BWRA to identify the destinations of BW uplifted at each Demonstration
Site. In fact some of the GloBallast BWRA objectives required considerable effort searching and/or
deducing the following information which is not available from the BWRFs:
� Destination Port/s where either BW will be discharged or cargo actually offloaded (not
necessarily the Next Port of Call - especially in the RSA).
� Berth number/location at the Demonstration Site (obtained by laborious cross-checking with
port records).
55
Ballast Water Risk Assessment, Port of Khark Island, Islamic Republic of Iran, August 2003: Final Report
� Deadweight tonnage (DWT). This is very useful for checking claimed BW discharge volumes
(DWTs were eventually obtained for most ships from the Lloyds Ship Register, but this is a
time-consuming task, particularly for ships that had entered a new name, incorrect IMO
number or Call Sign on the BWRF).
It is therefore recommended that the IMO Marine Environment Protection Committee (MEPC) review
the standard BWRF with a view to improving its global application under the new BW convention
(see Section 5).
Port environmental and risk species data
It was particularly difficult to obtain reliable environmental information for a port's waters,
particularly for the seasonal water temperature and salinity averages and extrema. This was true for
ports in very developed regions (e.g. North America, Europe and Japan) as it was for less developed
areas.
In the case of species data, many national and regional data sets remain incomplete and/or
unpublished, and there are none for the RSA or wider Middle East and African regions (except for the
CIESM lists for the Mediterranean, which are not publicly listed on the web). Many sites list species
which were historically introduced by the aquaculture, fisheries, aquarium industry or hull fouling
vectors, while others do not provide the likely vector/s of their listed species.
56
5
Conclusions and Recommendations
The main objectives of the BWRA Activity were successfully completed during the course of this
project, which took 13 months (i.e. between the initial briefing in January 2002 and the final
consultants visit in February 2003). The level of port and maritime experience brought to the project
by the PSO counterparts, together with the GIS expertise of the NCC counterparts, facilitated
effective instruction and familiarisation of the BWRA system. This places I.R. Iran in a strong
position to provide assistance, technical advice, guidance and encouragement to other port States of
the RSA.
The Regional Strategic Action Plan (SAP) being developed by GloBallast and ROPME for
coordinating BW management activities in the region provides the best mechanism for replicating the
BWRF at other ports and oil terminals in the RSA.
Important items requiring attention for any future BW management activity in the RSA region
comprise:
� availability of guidelines and instructions about BWRF reporting to ship's officers, shipping
agents and port officers;
� relative lack of species surveys (PBBSs) in the RSA;
� lack of a regional web-based database for sharing and exchanging species survey information.
Organisations such as the Gulf Cooperation Council (GCC), ROPME and the major national oil
producers and tanker companies in this region should be encouraged to support efforts in the above
areas.
Recommendations
� To identify the locations where BW is discharged within a port, a more useful BWRF should
include an entry for the berth or terminal name/number (instead of simply `Port' and/or
geographic coordinates, which was usually left blank).
� Owing to the number of bunkering/provisioning and part-loading calls made by tankers in the
RSA, port States in this region should modify the "Last Port of Call" field to provide a "Last
Three (3) Ports of Call" question.
� To help decipher and interpret poorly written, incomplete or suspect BWRFs, port and BW
database entry officers should have access to up-to-date copies of the Lloyds Ship Register,
the Fairplay Ports Guide, Lloyd's Maritime Atlas of World Ports or equivalent publications.
For any port using the GloBallast BWRA system, a copy of the world bioregions map should
also be provided to the data-entry officers so that the bioregion of any new port added to the
database can be quickly identified.
� Any port officer whose duties include collecting or receiving BWRFs should be instructed to
check that all relevant fields have been completed in legible script, and to decline any Ballast
Water Management Plan offered by the vessel in lieu of a BWRF. A short BWRF
information kit and training course provided to port officers and local shipping agents is
strongly recommended, particularly during the implementation of the BWRF system at any
port.
BWRA recommendations and plans by Pilot Country (IR Iran)
� More detailed training is required for the in-country teams in order to facilitate completely
independent transfer of technics to other ports at national and regional level.
57
Ballast Water Risk Assessment, Port of Khark Island, Islamic Republic of Iran, August 2003: Final Report
� More detailed BWRA User Guide should be provided to the pilot countries.
� Review of BWRF and inclusion of entries such as name/number of berths, last three ports of
call and next ports of call and action taken regarding ballast water is highly recommended.
� BWRA results obtained should be verified by a detailed ballast water sampling and analysis
programme. I.R. Iran has commenced working on a BW sampling and analysis proposal.
� Collection of BWRF is extended to other major Iranian Ports.
BWRA has been placed in the priority list of the principal actions of the ROPME Sea Area Regional
Action Plan for ballast water control and management.
58
6
Location and Maintenance of the BWRA System
The GloBallast BWRF hardware and software packages in I.R. Iran are presently maintained at the
PSO head offices in Tehran. The following people are currently responsible for maintaining and
updating the following features of the BWRA system in I.R. Iran:
Port resource mapping and GIS display requirements:
Name:
Mr Ahmed Parhizi
Position:
Group A Team Leader and Head of Country Project Task Force
Organisation:
Ports and Shipping Organization, Ministry of Road and Transportation
Address:
No 751 Enghelab Avenue
Tehran 1599661464
ISLAMIC REPUBLIC OF IRAN
Tel:
+98 21 880 9326
Fax:
+98 21 880 9555
Email: parhizi@ir-pso.com
Ballast water reporting form database:
Name:
Mr Nasser Kayvanrad
Position:
Group B Team Leader
Organisation:
Ports and Shipping Organization, Ministry of Road and Transportation
Address:
No 751 Enghelab Avenue
Tehran 1599661464
ISLAMIC REPUBLIC OF IRAN
Tel:
+98 21 880 9326
Fax:
+98 21 880 9555
Email: kayvanrad@ir-pso.com
Port environmental and risk species data:
Contact person:
Dr Vahid Yavari
Position:
Group C Team Leader and Country Focal Point Assistant
Organization:
C/o Ports and Shipping Organization, Ministry of Road and Transportation
Address:
No 751 Enghelab Avenue
Tehran 1599661464
ISLAMIC REPUBLIC OF IRAN
Tel:
+98 63 242 30550
Fax:
+98 63 242 30551
Email:
yavarivahid@hotmail.com
Yavari@ir-pso.com
59
References
Carlton, J.T. 1985. Transoceanic and interoceanic dispersal of coastal marine organisms: the biology
of ballast water. Oceanography and Marine Biology Annual Review 23: pp. 313-371.
Carlton, J.T. 1996. Biological invasions and cryptogenic species. Ecology 77: pp. 1653-1655.
Carlton, J.T. 2002. Bioinvasion ecology: assessing impact and scale. In: Invasive aquatic species of
Europe: Distribution, impacts and management. (E Lepp�koski, S Gollasch & S Olenin eds). Kluwer
Academic Publishers, Dordrecht, Netherlands, pp. 7-19.
Cohen, A. & Carlton, J.T. 1995. Non-indigenous aquatic species in a United States estuary: a case
study of the biological invasions of the San Francisco Bay and delta. Report to the US Fish &
Wildlife Service (Washington) and the National Sea Grant College Program Connecticut Sea Grant,
December 1995, 211 pp. (from http://nas.nfreg.gov/sfinvade.htm).
Hilliard, R.W., Hutchings, P.A. & Raaymakers, S. 1997a. Ballast water risk assessment for twelve
Queensland ports:, Stage 4: Review of candidate risk biota. Ecoports Monograph Series No. 13. Ports
Corporation of Queensland, Brisbane.
Hilliard, R.W., Walker, S., Vogt, F., Belbin, L. & Raaymakers, S. 1997b. Ballast water risk
assessment for twelve Queensland ports, Stage 3B: Environmental similarity analyses. EcoPorts
Monograph Series No. 12. Ports Corporation of Queensland, Brisbane (two volumes).
Kelleher, G., Bleakley, C. & Wells, S. 1995. A Global representative system of marine protected
areas. The World Bank, Washington DC, USA.
Lepp�koski, E., Gollasch, S. & Olenin, S. 2002. Invasive aquatic apecies of Europe: Distribution,
impacts and management. Kluwer Academic Publishers, Dordrecht, Netherlands. 583 pp.
Williamson, A.T., Bax, N.J., Gonzalez, E. & Geeves, W. 2002. Development of a regional risk
management framework for APEC economies for use in the control and prevention of introduced
marine pests. Final report of APEC Marine Resource Conservation Working Group (MRCWG),
produced by Environment Australia, Canberra. 182 pp.
60
APPENDIX 1
Copy of
IMO Ballast Water Reporting Form
from Resolution A.868(20) Appendix 1
(Can be downloaded from http://globallast.imo.org/guidelines)
Appendix 1: Copy of IMO Ballast Water Reporting Form
1
APPENDIX 2
Risk Assessment Team for the
Port of Khark Island,
Islamic Republic of Iran
Appendix 2: Risk Assessment Team for the Port of Khark Island, Islamic Republic of Iran
The BWRA team contained three groups which undertook the GIS mapping (Group A), database
development (Group B) and environmental matching/risk species (Group C) components of the
Activity.
The activities of the three groups were coordinated by Dr Vahid Yavari (GloBallast Country Focal
Point Assistant, Ports & Shipping Organisation) and Mr Chris Clarke (Meridian GIS Pty Ltd), under
the directorship of Mr Hassan Taymourtash (GloBallast Country Focal Point, Ports & Shipping
Organisation) with assistance of Mr Ahmad Parhizi (Ports & Shipping Organisation, Tehran).
Group A (GIS mapping)
Person:
Mr Ahmad Parhizi
Position:
Group A Leader
Organization:
Ports & Shipping Organisation, Safety and Marine Protection Department
Email:
parhizi@ir-pso.com
Person:
Mr Chris Clarke
Position:
Group A Counterpart Trainer
Organization:
Meridian GIS Pty Ltd
Email: chris@meridian-gis.com.au
Person:
Mr Hamid Reza Akrami
Position:
Ports & Shipping Organisation Computer Network Administrator
Organization:
Ports & Shipping Organisation, Administration
Email:
akrami@ir-pso.com
Person:
Mr Mohammad Hassan Khodammohmmad
Position:
Group A - GIS cartographer
Organisation:
National Cartographic Centre, Tehran
Email:
Person:
Mr Mohammad Hossien Moshiri
Position:
Group A - GIS cartographer
Organisation:
National Cartographic Centre, Tehran
Email:
Person:
Mr Houman Shirzadi
Position:
Group A - GIS Computing and Port Map support
Organization:
Ports & Shipping Organisation, Safety and Marine Protection Department
Email:
houman_shirzadi@hotmail.com
Group B (BWRF & Access database)
Person:
Mr Nasser Kayvanrad
Position:
Group B Leader
Organization:
Ports & Shipping Organisation, Safety and Marine Protection Department
Email:
naseer@ir-pso.com
Person:
Commander Terry Hayes
Position:
Group B Counterpart Trainer
Organization:
Meridian GIS Pty Ltd
Email:
faydee@cqnet.com.au
1
Ballast Water Risk Assessment, Port of Khark Island, Islamic Republic of Iran, August 2003: Final Report
Person:
Mr Ebrahim Mosavi
Position:
Group B � Port records, BW Report Forms and Port Shipping Records data extraction
Organization:
PSO, Port of Khark Island
Person:
Mr Abdolkarim Rezazadeh
Position:
Group B � Port records, BW Report Forms and Port Shipping Records data extraction
Organization:
PSO, Port of Khark Island
Person:
Mr Abdolreza Jazebi
Position:
Group B � BW Report Form and Port Shipping Record checking and database entry
Organization:
PSO, Port of Khark Island
Person:
Ms Roya Imam
Position:
Group B � BW Report Form data checking and database entry
Organisation:
PSO, Marine Protection Department, Tehran Office
Person:
Mr Mostafa Zaredoost
Position:
Group B - BW Report Forms checking and database management
Organization:
PSO, Port of Bandar Il Khomeini
Person:
Mr Morteza Dehghan
Position:
Group B � BW Report Form data checking and database entry
Organization:
PSO, Port of Bandar Il Khomeni.
Group C (Environmental & risk species data, ESM and BRWF)
Person:
Dr Vahid Yavari
Position:
Group C Leader � Risk Species Database
Organization:
Ports & Shipping Organisation, Safety and Marine Protection Department
Email:
yavari@ir-pso.com or yavarivahid@hotmail.com
Person:
Dr Robert Hilliard
Position:
Group C Counterpart Trainer
Organization:
Meridian GIS Pty Ltd
Email:
atsrob@iinet.net.au
Person:
Mr Jamal Pakravan
Position:
Group C - Port environmental data and environmental similarity analyses
Organization:
Ports & Shipping Organisation, Marine Protection Department, Port of Bandar Abbas
Email:
pakravan@ir-pso.com
Project Manager
Steve Raaymakers
Programme Coordination Unit
GEF/UNDP/IMO Global Ballast Water Management Programme
Marine Environment Division
International Maritime Organization
4 Albert Embankment, London SE1 7SR
United Kingdom
Ph +44 (0)20 7587 3251
Fax +44 (0)20 7587 3261
Email: sraaymak@imo.org
Web: http://globallast.imo.org
2
.
APPENDIX 3
Check-list of project requirements
circulated at initial briefings in January 2001
(during 3rd GPTF meeting, Goa)
Appendix 3: Check-list of project requirements circulated at initial briefings in January 2001 (during 3rd GPTF meeting, Goa)
PROJECT REQUIREMENTS AND PROVISIONAL SCHEDULE
REMINDER AND CHECK LIST FOR CFP/CFP-A
(1)
Confirm your availability of adequate PC hardware, + Windows, Access & peripherals
At least one PC with sufficient processor speed, memory, Windows software and peripherals must be
dedicated to the project (plus full-time use during the two visits by the URS Team).
PC Capability: -
at least 600 MHz Processor speed
- at least 10 GB of Hard Disk capacity
- at least 128 MB RAM
-
3D Graphics Card with 16 MB of RAM
- x24 speed CD-ROM drive
-
21" 16-bit high-colour Monitor (XVGA or higher)
-
a 10/100 base Network Card and 56k modem.
PC Software: OS: at least MS Windows 98 (preferably higher).
MS Access: This database program is usually bundled inside MS Office 97 (Business
Edition), Office Pro; Office 2000; etc. Please check with your IT people if unsure.
MS Word, MS Excel, MS Powerpoint.
PC Peripherals: Convenient access to following peripherals for convenient data inputs and outputs:
-
B/W laser printer (>8 pages per minute);
-
A3 or A4 colour printer;
-
CD Burner
-
Flatbed scanner and digitising board
-
Semi-auto or auto-archiving system, such as external Zip-Drive, Tape Drive or
LAN servers. This is essential for protecting databases from accidental erasures,
hard drive crashes, system failures, office fire, burglary, etc.
(2)
Identify Your BWRA Project Team (10 people recommended):
Required Pilot Country Counterparts
PCU Consultants
BWRA project team leader
Consultants team leader
PC system and GIS operator (x2)
GIS and database specialist
MS Access database operator (x2)
BWRF and shipping record manager (x2)
Shipping record & port data specialist
Port environmental data searcher (x2)
Environmental similarity analyst (x2)
BWRA specialist
Risk species networker / biologist
NB: when selecting team members, please note training will be conducted in English.
1
Ballast Water Risk Assessment, Port of Khark Island, Islamic Republic of Iran, August 2003: Final Report
(3)
Check all existing Port GIS, Coastal Resource Atlas, Electronic Charts/Digital
Databases [refer to Briefing Paper - GTPF Agenda Item 4 [BWRA Action Required], and the
consultants questionnaire provided at Goa (please complete and return a copy)
(4)
Confirm Dates and Local Arrangements for first consultants visit.
Provisional Dates for 1st Visit (5 working days)
Monday 25 February- Friday 1 March 2002
Odessa, Ukraine
Saturday 2 March- Thursday 7 March 2002
Tehran/Khark Is, I.R. Iran
Monday 11 March- Friday 15 March 2002
Mumbai/Goa, India
Monday 25 March - Friday 29 March 2002
Saldahna, South Africa
Monday 1 April- Friday 5 April 2002
Sepetiba, Brazil
Tuesday 9 April- Saturday 14 April 2002
Dalian, China
Logistics:
Assistance required for visa applications?
Customs clearance required for importation of computer software?
Local transport / work location / office facilities / accommodation
1st Visit Activities:
� Install and test the ArcView 3.2 GIS package, and the Primer 5 statistical package;
� Commence GIS training by digitising the port map (from any existing digital files, paper charts,
maps, habitat information, articles, publications, aerial photos, etc);
� Review all data collated by Country Project Team, including existing databases. Set up the Access
database for ship arrival records and the IMO BWRF. Commence training on the Graphic User
Interfaces for BWRF inputs
� Collate and review pre-IMO BWRF shipping records to determine source and destination ports,
vessel types and trading patterns.
� Review available port environmental data and potential sources of same (see Attachment)
� Commence assembling the risk species list (locate and commence networking with marine
biologists in your country and region).
� Identify the critical information gaps.
� Identify the data collating and input work to be completed before the 2nd Visit.
� Agree on a provisional date for start of 2nd Visit (10 working days).
2nd Visits (10 work days). Complete port map digitising; install bioregional map; complete and add
risk species to database; perform environmental similarity analysis; undertake risk assessment;
evaluate results; review and reporting.
Environmental Data Requirements - see next page, attached.
2
Appendix 3: Check-list of project requirements circulated at initial briefings in January 2001 (during 3rd GPTF meeting, Goa)
ATTACHMENT
TYPES OF ENVIRONMENTAL DATA FOR PORT SIMILARITY ANALYSIS
The project requires two types of port environmental data:
(A) Charts and marine habitat and resources data are required for the GIS Port Map, and
(B) A range of parameters (measured in or near port) for the Environmental Similarity Analysis.
In the case of the quantitative parameters, these include:
� Mean water temperature during the summer [monsoon] season (oC)
� Maximum water temperature at the hottest time of the summer [monsoon] season (oC)
� Mean water temperature during the winter [dry] season (oC)
� Minimum water temperature at the coldest time of the winter [dry] season (oC)
� Mean day-time air temperature recorded in summer [monsoon] season (oC)
� Maximum day-time air temperature recorded in summer [monsoon] season (oC)
� Mean night-time air temperature recorded in winter [dry] season (oC)
� Minimum night-time air temperature recorded in winter [dry] season (oC)
� Mean water salinity during the wettest period of the year (grams/litre; ppt)
� Lowest water salinity at the wettest time of the year (grams/litre; ppt)
� Mean water salinity during the driest period of the year (grams/litre; ppt).
� Highest water salinity at the driest time of the year (grams/litre; ppt).
� Mean Spring Tidal range (metres)
� Mean Neap Tide range (metres)
� Total rainfall in the port's driest 6 months season (millimetres)
� Total rainfall in the port's wettest 6 months season (millimetres)
�
Number of months accounting for 75% of total annual rainfall (=duration of peak discharges)
� Number of kilometres from the berths to the nearest river mouth (negative value if upstream)
� Size of this river's catchment (square kilometres)
[Categorical variables are also required, but these are easy to obtain from charts, maps, articles,
etc]
3
.
APPENDIX 4
Information sources used for collating
Port Environmental Data
Appendix 4: Information sources used for collating Port Environmental Data
Continued over...
1
Ballast Water Risk Assessment, Port of Khark Island, Islamic Republic of Iran, August 2003: Final Report
2
APPENDIX 5
Sources and references of
Risk Species information
Appendix 5: Sources and references of Risk Species information
1
Furlani, D (1996). Guide to Introduced Species, CSIRO Marine Research, Hobart, Tasmania (folder-file
format).
2
McClary DJ & Nelligan RJ, 2001. Alternate Biosecurity Maangement Tools for Vector Threats: Technical
guidelines for Acceptable Hull Cleaning Facilities. Research Report No. ZBS 2000/03, prepared by Kingett
Mitchell & Associates for New Zealand Ministry of Fisheries, September 2001. 29 pp.
2a M. Shaffelke, cited in McClary DJ & Nelligan RJ (2001). [see reference 2]
3
Cohen AN & Carlton JT (1995). Biological study: Non-indigenous aquatic species in a united States
estuary: a case study of the biological invasions of the San Francisco Bay and Delta. US Fisheries &
Wildlife National Sea Grant College Program Report PB96-168525. Springfield Virginia, USA.
http://nas.er.usgs.gov/publications/sfinvade.htm
4
Pollard DA & PA Hutchings (1990a,b). A review of exotic marine organisms introduced to the Australian
region. I. Fishes (a); and II. Invertebrates and Algae (b). Asian Fisheries Science 3: 205-222 (a) and 223-
250 (b).
4a Wallaston 1968 and Wommersley 1981, cited in Pollard D & Hutchings PA (1990). [see reference 4]
4b Skinner & Womersley 1983, cited in Pollard D & Hutchings PA (1990). [see reference 4]
4c Allen (1953) - cited in Pollard D & Hutchings PA (1990). [see reference 4]
5
Australian NIS lists compiled by CSIRO-CRIMP (1997); CCIMPE (2001); SSC/SCFA (2000)[see reference
23]
6
Hutchings PM, Van Der Velde J & S Keable (1989). Baseline survey of the benthic macrofauna of Twofold
Bay, NSW, with a discussion of the marine species introduced into the bay. Proceedings of the Linnaean
Society of New South Wales 110 (4): 339-367.
6a Baker, cited by Hutchings et al (1989). [see reference 6]
7
Australian Coral Reef Society (1993). A Coral Reef Handbook (3rd Edition). Surrey Beatty & Sons Pty Ltd,
Chipping Norton NSW, 264 pp.
8
Coles SL, DeFelice RC, Eldredge LG and JT Carlton (1997) Biodiversity of marine communities in Pearl
Harbor, Oahu, Hawaii with observations on introduced exotic species. Bernice Pauahi Bishop Museum
Technical Report No. 10: 1-76
9
Dakin WJ (1976). Australian Seashores (Australian Natural Science Library Edition). Angus & Robertson,
Sydney, 372 pp.
10 Carlton JT (1985). Transoceanic and Interoceanic Dispersal of Coastal Marine Organisms: The Biology of
Ballast Water. Oceanogr. Mar. Biol. Ann. Rev. 23: 313-371.
11 Boyd S, Poore GCB & RS Wilson (1996). Macrobenthic invertebrates of soft sediments in Port Phillip Bay:
Introduced Species. Unpubl. report to CSIRO-CRIMP by Museum of Victoria, Melbourne, 7-96. 122 pp.
12 Gosliner TM, Behrens DW & Williams GC (1996). Coral Reef Animals of the Indo-Pacific - Animal life from
Africa to Hawaii exclusive of vertebrates. Sea Challengers, Monterey CA, 314 pp.
13 Wells FE & C Bryce (1988). Seashells of Western Australia (Revised Edition). Western Australian
Museum, Perth. 207 pp.
14 Tan LWH & PKL Ng (1988). A guide to the seashore of Singapore. Singapore Science Centre, Singapore,
159 pp.
15 Wells FE & RN Kilburn, 1986. Three temperate-water species of South African gastropods recorded for the
first time in southwestern Australia. Veliger 28(4): 453-456.
16 Gosliner TM (1987). Guide to the nudibranchs (opisthobranch molluscs) of Southern Africa. Sea
Challengers and Jeff Hamann. Monterey.
17 Wasson & Shepherd (1995): cited in Cohen & Carlton (1995) [see reference 3].
18 Middleton MJ (1982). The oriental goby, Acanthogobius flavimanus (Temminck and Schlegel), an
introducedfish in the coastal waters of New South Wales, Australia. J. Fish Biology 21: 513-523.
19 In: Lepp�koski E, Gollasch S. & S Olenin (eds) (2002). Invasive aquatic apecies of Europe: Distribution,
impacts and management. Kluwer Academic Publishers, Dordrecht. 583 pp.
20 Morton, B (1981). Biology and functional morphology of Mytilopsis sallei (Recluz) (Bivalvia: Dreissenacea)
fouling Visakhapatnam Harbour, Andra Pradesh, India. Journal of Molluscan Studies 47: 25-42.
21 Gollasch, S (2002). Importance of ship hull fouling as a vector of species introductions into the North Sea.
Biofouling 18: 105-121.
22 Hass CG & DS Jones (1999). Marine introductions to western Australia, with a focus on crustaceans. In:
Kesby JA, Stanley JM, McLen RF & Olive LJ (eds). Geodiversity: Readings in Australian Geography at the
close of the 20th Century. Special Publication Series No. 6, School of Geography & Oceanography,
University College, Australian Defence Force Academy, Canberra ACT. pp. 37-44.
23 Environment Australia (2000). Joint SCC-SCFA Report of the National Taskforce on the Prevention and
Management of Marine Pest Incursions (October 2000 edition). Environment Australia, Canberra,
Australia.
24 Domingues Rodrigues M & AI Brossi Garcia (1989). New records of Pachygrapsus gracilis (Saussure,
1858) in the Brazilian Littoral. Ciene Cult San Paulo 41: 63-66.
1
Ballast Water Risk Assessment, Port of Khark Island, Islamic Republic of Iran, August 2003: Final Report
25 Dadon JR (1984). Distribution and abundance of Pteropoda: Thecostomata (Gastropoda) in the
Southwestern Atlantic. Physis (Buenos Aires) 42: 25-38.
26 Christeffersen ML (1980). Is Alpheus heterochaelis Say (Crustacea, Decapoda, Alpheidae) found along the
Brazilian coasts? Review Nordestina Biology 3: 236-237.
27 Galil B & C Golani (1990). Two new migrant decapods from the Eastern Mediterranean. Crusteceana 58:
229-236.
28 Hanna GD (1966). Introduced molluscs of western North America. Occasional Papers of Californian
Academy of Science 48: 1-108.
29 Yoloye V (1976). The ecology of the West African Bloody cockle, Anadara (Senilia) senilis (L.). Bulletin of
the Institute Portdam Africique Noire (Series A) 38: 25-56.
30 Jones DS (1992). A review of Australian fouling barnacles. Asian Marine Biology 9: 89-100.
31 Wang JJ & ZG Huang (1993). Fouling polychaetes of Hong Kong and adjacent waters. Asian Marine
Biology 10: 1-12.
32 Arakawa KY (1980). On alien immigration of marine sessile invertebrates into Japanese waters. Marine
Fouling 2: 29-33.
33 Carlton J (1999). Molluscan invasions in marine and estuarine communities. Malacologia 41(2): 439-454.
34 Griffiths CL, Hockey PAR, Van Erkom Shurink C & PJ Le Roux (1992). Marine invasive aliens on South
Africa's shores: implications for community structure and trophic functioning. South African Journal of
Marine Science 12: 713-722.
35 Wang C (1995). Some introduced molluscas [sic] in China. Sinozoologia 12: 181-191 (in Chinese).
36 Cranfield HJ, et al (1998). Adventive marine species in New Zealand. National Institute of Water and Air
Research (NIWA) Technical Report 34, Auckland, New Zealand, 48 pp.
37 Dineen J, 2001. Exotic species reports for Indian River Lagoon, Florida. Smithsonian Fort Pierce website:
http://www.serc.si.edu
38 J Mackie, 2001. Bryozoans at Port of Geraldton, with notes on taxonomy and distribution. In: Geraldton
Port Survey. Unpublished report to Geraldton Port Authority by the Western Australian Museum, Perth,
August 2001.
39 Wonham MJ, Carlton JT, Ruiz GM & LD Smith (2000). Fish and ships: relating dispersal frequency to
success in biological invasions. Marine Biology 136: 1111-1121.
40 NIS data for Angola; supplied by Adnan Adawad (GloBallast Programme, Cape Town, South Africa:
adawad@mcm.wcape.gov.za).
41 Dr Tamara Robertson, University of Cape Town (pers. comm.; August 2002).
42 Gollasch, S. & Griffiths, C (2000). Case studies of introduced species in South African waters prepared for
the GloBallast Programme. Report prepared for Globallast Programme; available from Adnan Adawad
(GloBallast Programme, Cape Town, South Africa: adawad@mcm.wcape.gov.za).
43 Draft provisional species list (9/02) from the Saldanha Bay Port Baseline Biological Survey (supplied by
Adan Adawad (GloBallast Programme, Cape Town, South Africa): adawad@mcm.wcape.gov.za)
44 NIS data for Tanzania; supplied by Adnan Adawad (GloBallast Programme, Cape Town, South Africa:
adawad@mcm.wcape.gov.za).
45 NIS data for Mauritius; supplied by Adnan Adawad (GloBallast Programme, Cape Town, South Africa:
adawad@mcm.wcape.gov.za).
46 NIS data for Mozambique; supplied by Adnan Adawad (GloBallast Programme, Cape Town, South Africa:
adawad@mcm.wcape.gov.za).
47 GloBallast Programme (2002). List of Alien Species. http://www.globallast.org
48 Williamson AT, Bax NJ, Gonzalez E & W Geeves (2002). Development of a regional risk management
framework for APEC economies for use in the control and prevention of introduced marine pests. Final
report of APEC Marine Resource Conservation Working Group, produced by Environment Australia,
Canberra. 182 pp.
49 Walters S, 1996. Ballast water, hull fouling and exotic marine organism introductions via ships - a Victorian
study. Environment Protection Authority of Victoria, Publication 494 (May 1996).
50 Pitcher, G (1998). Harmful algal blooms of the Benguela current. Colour publication available from Sea
Fisheries Research Institute (Private Bag X2, Rogge Bay 8012), Cape Town, Republic of South Africa (20
pp).
51 Benson AJ, Williams JD, Marelli DC, Frischer ME & Danforth JM, 2002. Establishment of the green
mussel, Perna viridis, on the West Coast of Florida. In: Proceedings of 11th International Conference of
Aquatic Invasive species (Feb 25 to March 1, 2002, Washington DC). nvironment Department, US Army
Engineer & Research Development Laboratory, US.
52 Platvoet D, Dick JTA & DW Kelly (2002). Comparative morphometrics of mouthparts and antennae in the
invasive Dikerogammeros villosus and the native Gammarus duebeni (Crustacea, Amphipoda). In:
Proceedings of 11th International Conference of Aquatic Invasive species (Feb 25 to March 1, 2002,
Washington DC). Environment Department, US Army Engineer & Research Development Laboratory, US.
2
Appendix 5: Sources and references of Risk Species information
53 Strong JA (2002). Faunal and habitat comparisons from under and outside canopies of Sargassum
muticum. In: Proceedings of 11th International Conference of Aquatic Invasive species (Feb 25 to March
1, 2002, Washington DC). Hosted by Environment Department, US Army Engineer & Research
Development Laboratory.
54 Verween A (2002). Economic impact of biofouling control of an exotic bivalve, Mytilopsis leucophaeta, in
the harbour of Antwerp, Belgium. In: Proceedings of 11th International Conference of Aquatic Invasive
species (Feb 25 to March 1, 2002, Washington DC). Environment Department, US Army Engineer &
Research Development Laboratory, US.
55 Perry HM, Lukens R, et al, 2002. Invasive species and implications for fisheries sustainability in the Gulf of
Mexico. In: Proceedings of 11th International Conference of Aquatic Invasive species (Feb 25 to March 1,
2002, Washington DC). Environment Department, US Army Engineer & Research Development
Laboratory, US.
56 Makarewicz, JC (2002). Distribution, fecundity, genetics and invasion routes of Cercopafis pengoi
(Ostroumov) - a new exotic zooplankter in the Great Lakes Basin. In: Proceedings of 11th International
Conference of Aquatic Invasive species (Feb 25 to March 1, 2002, Washington DC). Hosted by
Environment Department, US Army Engineer & Research Development Laboratory.
57 Bauer CR & Lamberti GA (2002). Potential interactions between Eurasian Ruffe and Round Gobies in the
Great Lakes: Prey and habitat differences. In: Proceedings of 11th International Conference of Aquatic
Invasive species (Feb 25 to March 1, 2002, Washington DC). Environment Department, US Army Engineer
& Research Development Laboratory. US.
58 Darrigran G et al (2002). Abundance and distribution of golden mussel (Limnoperna fortunei) larvae in a
hydroelectric plant in South America. In: Proceedings of 11th International Conference of Aquatic Invasive
species (Feb 25 to March 1, 2002, Washington DC). Environment Department, US Army Engineer &
Research Development Laboratory, US.
59 Personal communications and manuscripts supplied by Dr Andrea Junqueira, Dr Flavio Fernandes, Dr
Luciano Felicio Fernandes , Dr Luis Proenca during BWRA workshop at FEEMA, Rio de Janeiro (30
August 2002).
60 Fernandes, LF et al (2001). The recently established diatom Coscinodiscus wailesii in Brazilian waters:
taxonomy and distribution. Phycological Research 2001.
61 Paula, A,F (2002). Spatial abundance and distribution of invading coral Tubastraea in Ilha Grande Bay
(RJ) and record of T. tagusensis and T. coccinea in Brazil. M.Sc thesis, State University of Rio de Janeiro,
May 2002.
62 Translated material provided by Assoc Prof. (Biol.) Wang Lijun and Mr Jiang Yuewen (National Marine
Environment Protection & Monitoring Centre, State Administration of Oceanography (Dalian Office), China
(including preliminary lists of identified species sampled by Port Baseline Biological Survey for Dalian
(GloBallast Programme); September 2002).
63 Anil AC, Venkat K, Sawant SS, Dileepkumar M, Dhargalkar VK, Ramaiah N, Harkantra SN & ZA Ansari
(2002). Marine bioinvasions: Concern for ecology and shipping. Current Science 83(3): 214-218.
64 K Satyanarya Rao (2002). Proceedings of 1st R&D Seminar, Global Ballast Water Management
Programme. National Institute of Oceanography, Goa, India. June 2002.
65 National Institute of Oceanography (2001). Report released to mass-media (from Dr AC Anil, NIO, Goa).
66 Xu, CY (1982). Surveys on the causal organisms of red tides in Dalian Bay. Journal of Fisheries, China
6(2): 173-180 (in Chinese).
67 Iizuka S (1976). Succession of red tide organisms in Omura Bay with relation to water pollution. Bulletin of
the Plankton Society of Japan 23(1): 31-43 (in Japanese).
68 Kuriakose PS (1980). Mussels (Genus Perna) of the Indian coast. In: Coastal aquaculture of mussels -
Progress and Prospects. Central Marine Research Fisheries Institute (Cochin, India).
69 Thompson MF (1994). Recent developments in biofouling control. Oxford & IBH Publishing Co, Pty Ltd,
UK.
70 National Institute of Oceanography: Bryozoan Identifications (volume provided by Dr AC Anil, NIO, Goa,
India)
71 Zaitsev Y & B Ozturk (2001). Exotic Species in the Aegean, Marmara, Black, Azov and Caspian Seas.
Publication No.8, Turkish Marine Foundation, Istanbul. Turk Deniz Arastirmalari Vakfi. Istanbul.
72 CIESM Atlas of Introduced Species in Mediterranean Sea (2002). http://www.ciesm.org/atlas
73 McMinn, A (1990). Recent dinoflagellate cyst distribution in eastern Australia. Review of Paleobotany and
Palynology 65: 305-310.
74 Karunasagar I, Gowda HSV, Subburaj M, Venugopal MN & I Karunasagar (1984). Outbreak of paralytic
shellfish poisoning in Mangalore, west coast of India. Current Science 53(5): 247-249.
75 Yoon YH et al (1991). Red tide organisms in the coastal waters of Cheju Island, southern Korea. Bulletin of
Marine Research Institute, Cheju National University 15: 1-14.
76 Pillai CSG & Jasmine S (1991). Life cycle of Perna indica. In: Symposium on tropical marine living
resources, Cochin, Kerala (india), 12-16 January 1988. J. Mar Biol. Association India 33(1-2): 159-165.
3
Ballast Water Risk Assessment, Port of Khark Island, Islamic Republic of Iran, August 2003: Final Report
77 Coles SL, DeFelice RC & LG Eldredge (1999). Nonindigenous marine species introductions in the harbors
of the south and west shores of Oahu, Hawaii. Bishop Museum Technical Report No. 15 (Bernice Pauahi
Bishop Museum, Honolulu, Hawaii).
78 Coles SL, DeFelice RC, Eldredge LG & JT Carlton (1999). Historical and recent introductions of non-
indigenous marine species into Pearl Harbor, Oahu, Hawaiian Islands. Marine Biology 135:147-158.
79 Coles SL, DeFelice RC & D Minton (2001). Marine species survey of Johnston Atoll, Central Pacific
Ocean, June 2000. Bishop Museum Technical Report No. 19 (Bernice Pauahi Bishop Museum, Honolulu,
Hawaii).
80 DeFelice RC, Coles SL, Muir D & LG Eldredge (1998). Investigation of marine communities at Midway
Harbor and adjacent lagoon, Midway Atoll, north western Hawaiian Islands. Bishop Museum Hawaiian
Biological Survey Contribution No. 1998-014 (Bernice Pauahi Bishop Museum, Honolulu, Hawaii).
81 Hewitt C (2002). Distribution and biodiversity of Australian tropical marine bioinvasions. Pacific Science
56(2): 213-222.
82 Coles SL & LG Eldredge (2002). Nonindigenous species introductions on coral reefs: a need for more
information. Pacific Science 56(2): 191-209.
83 Hoedt FE, Choat JH, Collins J & JJ Cruz (2000). Mourilyan Harbour and Abbot Point surveys: Port
baseline surveys for introduced marine pests. Unpubl. report to Ports Corporation of Queensland
(Brisbane). School of Marine Biology & Aquaculture, James Cook University, Townsville
84 Choo PS, 1994. A Review on Red Tide Occurrences in Malaysia. Department of Fisheries, Ministry of
Agriculture, Kuala Lumpur, Malaysia.
85 Southward AJ, Burton RS, Coles SL, Dando PR, DeFelice R, Hoover J, Newman WA, Parnel E,
Yamaguchi (1998). Invasion of Hawaiian inner shores by an Atlantic barnacle. Marine Ecology Progress
Series 165:119-126.
86 Nichols FH, Thompson JK & LE Schemel (1990). Remarkable invasion of San Francisco Bay (California,
USA) by the Asian clam Potamocorbula amurensis. II. Displacement of a former community. Marine
Ecology Progress Series 66: 95-101.
87 Pyne R (1999). The black-striped mussel (Mytilopsis sallei) infestation in Darwin: clean-up strategy. In:
EcoPorts Monograph Series No.19 (77-83). Ports Corporation of Queensland, Brisbane.
88 Culver, CS (2000). Apparent eradication of a locally established introduced marine pest. Biological
Invasions 2 (3): 245-253.
89 Fofonoff PW, Ruiz GM, Hines AH & L McCann (1999). Overview of biological invasions in the Chesapeake
Bay region: summary of impacts on coonservation of biological diversity: a key to the restoration of the
Chesapeake Bay and beyond. Monograph. Maryland Department of Natural Resources, pp.168-180.
90 Veldhuizen TC & S Stanish (1999). Overview of the Life History, Distribution, Abundance, and Impacts of
the Chinese mitten crab, Eriocheir sinensis. Environmental Studies Office, California Department of Water
Resources, Sacramento, CA 95816. March 1999.
91 NTMAG & CSIRO, 2000. Port survey of introduced marine species., Port of Darwin. Unpublished report
provided by Dr Barry Russel, Museum & Art Gallery of the Northern Territory, Darwin, Northern Territory,
Australia.
92 Faunce CH and Lorenz JJ (2000) Reproductive biology of the introduced Mayan cichlid, Cichlasoma
urophthalmus, within an estuarine mangrove habitat of southern Florida. Environmental Biology of Fishes
58: 215�225.
93 Zhang F & M Dickman (1999). Mid-ocean exchange of container vessel ballast water. 1: Seasonal factors
affecting the transport of harmful diatoms and dinoflagellates. Marine Ecology Progress Series 176:243-
251.
94 Harris LG & MC Tyrell (2001). Changing Community States in the Gulf of Maine: Synergism Between
Invaders, Overfishing and Climate Change. Biological Invasions 3 (1): 9-21.
95 Crooks JA & CA Jolla (2001). Assessing invader roles within changing ecosystems: historical and
experimental perspectives on an exotic mussel in an urbanized lagoon. Biological Invasions 3 (1): 23-36.
96 In: Raaymakers S (Ed.) (2002). Baltic regional workshop on ballast water management, Tallinn, Estonia.,
22-24 October 2001: Workshop report. GloBallast Monograph Series No.2. IMO, London.
97 Gosling EM (1992). Systematics and geographic distribution of Mytilus. In: Gosling EM (Ed.) The Mussel
Mytilus: Ecology, Physiology, Genetics and Culture. Elsevier Press, Netherlands.
98 In: Raaymakers S & C Gregory (Eds) (2002). 1st East Asia regional workshop on ballast water control and
management, Beijing, China. 31 Oct � 2 Nov 2002: Workshop report. GloBallast Monograph Series No.6.
IMO, London.
99 Eno NC, Clark RA & sanderson WG (Eds). Directory of non-native marine species in British waters.
http://www.jncc.gov.uk/marine/dns/default.htm
100 Oderbrecht et al (2002).
101 Ports & Shipping Organisation (2002). Species tables. In: Draft report of seasonal Port Baseline
Biological Surveys for Port of Khark Island. Unpublished manuscript provided by PSO, Tehran, I.R. Iran.
4
Appendix 5: Sources and references of Risk Species information
102 Introduction to non-indigenous species of the Gulf of Mexico (2002). Website:
http://www.gsmfc.org/nis/nis/Perna_perna.html
103 Erkki Lepp�koski E & S Olenin (2000). Non-native species and rates of spread: Lessons from the brackish
Baltic Sea. Biological Invasions 2 (2):151-163.
104 Ambrogi AO (2000). Biotic invasions in a Mediterranean lagoon. Biological Invasions 2 (2): 165-176
105 Galil BS (2000). A sea under siege � alien species in the Mediterranean. Biological Invasions 2 (2):177-
186
106 Mann, R (2000). Invasion of the North American atlantic coast by a large predatory Asian mollusc
Biological Invasions 2(1): 7-22
107 Lohrer AM, Whitlatch RB, Wada K & Y Fukui (2000). Home and away: comparisons of resource utilization
by a marine species in native and invaded habitats. Biological Invasions 2 (1):41-57
108 Wasson, K & B Von Holle (2000). Detecting invasions of marine organisms: Kamptozoan case histories.
Biological Invasions 2(1): 59-74.
109 Rivest BR, Coyer J, Haren AA & S Tyler (1999). The first known invasion of a free-living marine flatworm.
Biological Invasions 1(4): 393-394
110 E x o t i c s p e c i e s l i s t o f t h e M o n t e r e y B a y N a t i o n a l M a r i n e S a n c t u a r y .
http://bonita.mbnms.nos.noaa.gov/sitechar/spex.html
111 F A O d a t a b a s e o n a q u a t i c s p e c i e s i n t r o d u c t i o n s :
http://www.fao.org/waicent/faoinfo/fishery/statist/fisoft/dias/index.htm
112 Global Invasive Species Program (GISP): http://jasper.stanford.edu/GISP/ and GISP Database:
http://www.issg.org/database/welcome/
113 Group on Aquatic Alien Species (GAAS) (Russia): http://www.zin.ru/projects/invasions/index.html
114 Gulf of Maine Ballast Water and Exotic Species Web Sites: http://www.gulfofmaine.org/library/exotic.htm
115 Gulf of Mexico Program Nonindigenous Species Information: http://pelican.gmpo.gov/nonindig.html
116 Smithsonian Environmental Research Center (SERC marine invasions lab): http://invasions.si.edu/
117 Ecological Society of Japan (Ed.) (2002). Handbook of alien species in Japan. (published 9/02).
Chijinchokan Ltd, Tokyo (in Japanese). 390pp. http://www.chijinshokan.co.jp
118 Fine M, Zibrowius H & Y Loya (2001). Oculina patagonica: a non-lessepsian scleractinian coral invading
the Mediterranean Sea. Springer-Verlag (New York):
http://linl.springer-ny.com/link/service/journals/00227/contents/01/00539/
119 Schaffelke B, Murphy N & S Uthicke (2002). Using genetic techniques to investigate the sources of the
invasive alga Caulerpa taxifolia in three new locations in Australia. Mar Poll Bull 44: 204-210.
120 Washington State Sea Grant Program: Non-indigenous aquatic species:
http://www.wsg.washington.edu/outreach/mas/nis/nis.html
121 Baltic Research Network on invasions and introductions (NEMO). Website:
http://www.ku.lt/nemo/mainnemo.htm
122 US Geological Service non-indigenous aquatic species (NIAS) website:
http://nas.er.usgs.gov/
123 National aquatic nuisance species clearing house - Seagrant Program:
http://www.entryway.com/seagrant/
124 Esmaili Sari A, Khodabandeh S, Abtahi B, Sifabadi J & H Arshad (2001). Invasive comb jelly Mnemiopsis
leidyi and the future of the Caspian Sea. Faculty of Natural Resources and Marine Sciences, University of
Tarbiat Modarres. Kor, Mazandaran, IR Iran. ISBN: 964-91086-2-9. (+95 pp; non-English). Obtainable
from: yavarivahid@hotmail.com ; yavari@ir-pso.com .
125 Cohen BF, Heislers S, Parry GD, Asplin MD, Werner GF & JE Restall (2002). Exotic marine pests in the
outer harbour of the Port of Adelaide. Marine and Freshwater Resources Institute of Victoria (Report No.
40), MAFRE, Queenscliffe, Victoria, Australia. (9/02; 86pp.).
5
APPENDIX 6
Name, UN code, coordinates and environmental
parameters of the 357 ports used for the multivariate
similarity analyses for all Demonstration Sites
Appendix 6: Name, UN code, coordinates and environmental parameters
1
Ballast Water Risk Assessment, Port of Khark Island, Islamic Republic of Iran, August 2003: Final Report
2
Appendix 6: Name, UN code, coordinates and environmental parameters
3
Ballast Water Risk Assessment, Port of Khark Island, Islamic Republic of Iran, August 2003: Final Report
4
Appendix 6: Name, UN code, coordinates and environmental parameters
5
Ballast Water Risk Assessment, Port of Khark Island, Islamic Republic of Iran, August 2003: Final Report
6
Appendix 6: Name, UN code, coordinates and environmental parameters
7
Ballast Water Risk Assessment, Port of Khark Island, Islamic Republic of Iran, August 2003: Final Report
8
Appendix 6: Name, UN code, coordinates and environmental parameters
9
Ballast Water Risk Assessment, Port of Khark Island, Islamic Republic of Iran, August 2003: Final Report
10
Appendix 6: Name, UN code, coordinates and environmental parameters
11
Ballast Water Risk Assessment, Port of Khark Island, Islamic Republic of Iran, August 2003: Final Report
12
Appendix 6: Name, UN code, coordinates and environmental parameters
13
Ballast Water Risk Assessment, Port of Khark Island, Islamic Republic of Iran, August 2003: Final Report
14


Ballast W
a
ter Risk Assessment
Global Ballast Water
Management Programme
G L O B A L L A S T M O N O G R A P H S E R I E S N O . 8
Port of Khark Island, Islamic Republic of Iran
Ballast Water Risk Assessment
Port of Khark Island
Islamic Republic of Iran
Final Report
AUGUST 2003
Final Report
C. Clarke, T. Hayes, R. Hilliard,
.dwa.uk.com
N. Kayvanrad, A. Parhizi,
H. Taymourtash, V. Yavari,
GLOBALLAST MONOGRAPH SERIES
& S. Raaymakers
More Information?
el (+44) 020 7928 5888 www
Programme Coordination Unit
Global Ballast Water Management Programme
International Maritime Organization
4 Albert Embankment
London SE1 7SR United Kingdom
Tel: +44 (0)20 7587 3247 or 3251
est & Associates, London. T
Fax: +44 (0)20 7587 3261
Web: http://globallast.imo.org
NO.8
A cooperative initiative of the Global Environment Facility,
United Nations Development Programme and International Maritime Organization.
Cover designed by Daniel W