Project: Management of hydrogeological risks
in the Iullemeden Aquifer System
A COMMON DATABASE OF THE IULLEMEDEN AQUIFER SYSTEM (IAS)
December 2007
CONTENTS
PREAMBULE.................................................................................................................................. 7
1- INTRODUCTION ...................................................................................................................... 10
1.1- Project context and historical background....................................................................................... 10
1.2- The SASS project experience ......................................................................................................... 13
2- DESIGN AND IMPLEMENTATION OF THE IAS INFORMATION SYSTEM.......................... 13
2.1- Approach presentation .................................................................................................................... 13
2.2- Analysis of the current situation in the three countries and collected data review.......................... 14
2.2.1- Mali data ..................................................................................................................... 15
2.2.2- Niger data ................................................................................................................... 17
2.2.3- Nigeria data ................................................................................................................ 19
2.3- Additional information collected during the project.......................................................................... 20
2.3.1- Geological data........................................................................................................... 21
2.3.2- Other data from study documents.............................................................................. 21
2.3.3- Inconsistencies and shortcomings ............................................................................. 21
2.3.3.1- Abstractions......................................................................................................... 21
2.3.3.2- Uninformed important Fields ............................................................................... 21
2.4- Common geographic data ............................................................................................................... 23
2.4.1- Topography and basic maps...................................................................................... 23
2.4.3- Hydrogeology (Aquifers)............................................................................................. 25
2.4.4- Geology ...................................................................................................................... 28
3- DESCRIPTION OF ISIAS......................................................................................................... 30
3.1.1- Technical choices and computer tools control........................................................... 32
3.1- IASIS general architecture............................................................................................................... 34
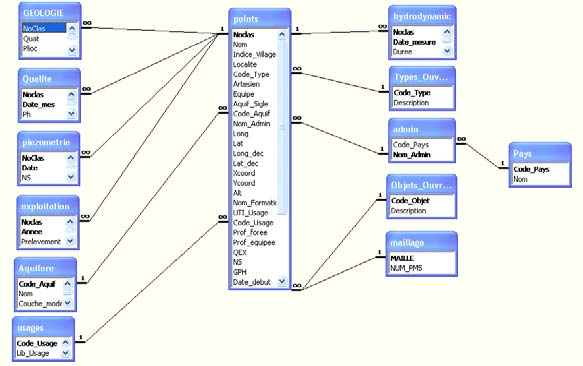
3.2- Database description....................................................................................................................... 35
3.2.1- DB Schema................................................................................................................. 36
3.2.2- Relationel model........................................................................................................ 37
3.2.3- Tables ......................................................................................................................... 39
3.2.4- Forms.......................................................................................................................... 42
3.2- Interface description ........................................................................................................................ 44
3.2.1- Data updating ............................................................................................................. 44
3.2.1.1- Water point features ............................................................................................ 44
3.2.1.1.1- The `characteristics 'tab................................................................................. 46
3.2.1.1.2- `File history' tab.............................................................................................. 48
3.2.1.1.3- `Level history' tab ........................................................................................... 49
3.2.1.1.4- `Quality history file' tab................................................................................... 50
3.2.1.2- Excel import......................................................................................................... 51
3.2.1.2.1- Import of abstraction time series files............................................................ 52
3.2.1.2.2- Level history import........................................................................................ 53
3.2.1.3- Measurement campaigns.................................................................................... 53
3.2.2- Data display................................................................................................................ 55
3.2.2.1- The explorer ........................................................................................................ 55
3.2.2.1.1- Tabular mode................................................................................................. 55
3.2.2.1.2- Cartographic mode ........................................................................................ 56
3.2.2.2- ArcView Project ................................................................................................... 58
3.2.3- Links with the PM5 simulation model......................................................................... 58
3.2.3.1- DB GIS Model interface ................................................................................ 58
oss
2
3.2.3.1.1- Gridding generation ....................................................................................... 59
3.2.3.1.2- Allocation of gridding numbers ...................................................................... 61
3.2.3.1.3- Checking tasks .............................................................................................. 61
3.2.3.2- Recharge entry .................................................................................................... 62
3.2.3.3- Transfer to PM5................................................................................................... 64
4- Content synthesis (DB and GIS) .............................................................................................. 67
4.1- The common database.................................................................................................................... 68
4.1.1- Water point characteristics ......................................................................................... 68
4.1.1.1- Distribution by administrative unit ....................................................................... 69
4.1.1.2- Distribution by type.............................................................................................. 71
4.3.1.3- Water points with a history .................................................................................. 72
4.3.2- Withdrawals ................................................................................................................ 72
4.3.2.1- Withdrawal distribution per aquifer and administrative unit ................................ 74
4.3.2.2- Total withdrawals per administrative unit............................................................ 75
4.3.2.3- Withdrawals history per water point .................................................................... 76
4.3.2.4- Withdrawals by type of usage ............................................................................. 76
4.3.3- Piezometry.................................................................................................................. 77
4.3.3.1- Distribution by data origin.................................................................................... 77
4.3.3.2- Level series ......................................................................................................... 77
4.3.4- Geology ...................................................................................................................... 80
4.3.5- Hydrodynamic parameters ......................................................................................... 81
4.4- Geographical Information System (GIS) ......................................................................................... 82
4.4.1- Projection system ....................................................................................................... 83
4.4.2- Layers added for the purposes of the study .............................................................. 85
4.4.2.1- Administrative limits............................................................................................. 85
4.4.2.2- Gridding ............................................................................................................... 86
4.4.2.3- The water point layer........................................................................................... 87
CONCLUSION AND RECOMMENDATIONS .............................................................................. 90
BIBLIOGRAPHY ........................................................................................................................... 92
ANNEXE : STRUCTURE DETAILLEE DES TABLES DE LA BDD ............................................. 93
oss
3
LIST OF TABLES
Tableau 1: Gradual establishment of ISIAS and its role in the evaluation of hydrogeological risks
30
Tableau 2: List of IASIS_DATA tables
39
Tableau 3: list of requests
41
Tableau 4: List of forms
43
Tableau 5: Form for water point feature entry
44
Tableau 6: Type of Excel model document for abstractions
52
Tableau 7: Filling rates of key fields
69
Tableau 8: Water points by administrative unit
70
Tableau 9: Water point by aquifer
71
Tableau 10: Water points by type
71
Tableau 11: Number of water points with at least a history
72
Tableau 12: Samples per aquifer and administrative unit
74
Tableau 13: Total withdrawals per administrative unit (year 2000)
75
Tableau 14: Operation history per water point (in m3) 76
Tableau 15: Distribution of measurement levels by data source
77
Tableau 16: Points with at least two-level measurements: series length and distribution by
administrative unit
77
Tableau 17: Points with at least two level measurements: Series length and distribution per
aquifer 78
Tableau 18: Distribution of points with a transmissivity value
81
Tableau 19: Distribution of points with chemical analytical values
82
Tableau 20: Parameters of the three Lambert zones covering Niger
83
oss
4
LIST OF FIGURES
Figure 1: Topographic map of IAS at 1/1000000 ........................................................................ 23
Figure 2: DEM in the IAS zone ..................................................................................................... 25
Figure 3: CI initial piezometry ....................................................................................................... 26
Figure 4: Initial piezometry of CT.................................................................................................. 27
Figure 5: SAI geological map ....................................................................................................... 28
Figure 6: Total organisational solution of the IAS database ........................................................ 31
Figure 7: IAS Data base architecture ........................................................................................... 37
Figure 8: Water point search dialog box....................................................................................... 45
Figure 9: Withdrawal data entry form ........................................................................................... 48
Figure 10: Operation graph .......................................................................................................... 49
Figure 11: Level entry form........................................................................................................... 50
Figure 12: Quality data entry form................................................................................................ 50
Figure 13: Excel data import form ................................................................................................ 52
Figure 14: Display and entry of a flow measurement campaign.................................................. 53
Figure 15: fenętre d'exploration (mode tabulaire) ........................................................................ 55
Figure 16: Exploration window (cartographic mode).................................................................... 56
Figure 17: Dialog box for layer control ......................................................................................... 57
Figure 18: Form for generating gridding and `points'-`model' link................................................ 59
Figure 19: Form for entering the parameters of a new gridding .................................................. 60
Figure 20: Form for recharge graphic entry ................................................................................. 63
Figure 21: PM5 data transfer form ............................................................................................... 65
Figure 22: Spatial CI point distribution with two or more level measurements............................ 78
Figure 23: Spatial CT point distribution with two or more level measurements .......................... 79
Figure 24: The three Lambert zones of the Niger territory........................................................... 84
Figure 25: Layers of administrative units...................................................................................... 85
Figure 26: PM5 gridding ............................................................................................................... 86
Figure 27: Digital Elevation Model at 90-meters .......................................................................... 88
oss
5
LIST OF ACRONYMS AND ABBREVIATIONS
TDA
Transboundary Diagnostic Analysis
DWS
Drinking Water Supply
IAEA
International Atomic Energy Agency
DB
Database
IC Intercalary
Continental
TC
Terminal
Complex
DRE
Water Resource Department (Niger)
DRHE
Regional Water and Energy Department (Mali)
ESRI
Environmental
Science
Research
Institute
GEF
Global
Environmental
Facility
IRH
Water Resource Inventory (department related to DRE)
CDM
Conceptual
Data
Model
DTM
Digital
Terrain
Model
DAT
Decision
Aid
Tool
ODBC
Open Database Connectivity
OSS
Observatory of Sahara and Sahel
PM5
Processing Modflow Version 5
UNEP
United Nations Environment Programme
DAI
Decision
Aid
System
IAS
Illumeden
Aquifer
System
SAP
Strategic
Action
Plan
NWSAS
North-Western Sahara Aquifer System
DBMS
Database Management System
SI Information
System
SIG
Geographic Information System
SRTM
Shuttle Radar Topography Mission
UNESCO
United Nations Educational, Scientific and Cultural Organization
oss
6
PREAMBULE
In the case of original information and diversified formats, the hydrogeological data represent a
means of systematic harmonization. This is particularly the case of transboundary aquifer
systems whose data are collected in countries sharing the same aquifer system. In this sense,
the Illumeden Aquifer System (IAS) is a typical case to establish a common hydrogeological
database.
The document aims at recording the undertaken activities within the framework of the project on
`Management of Hydrogeological Risks in the Iullemden Aquifer System' (IAS), initiated by
UNEP (GEF), UNESCO, the basin-sharing countries, i.e. Mali, Niger, and Nigeria, to establish a
common database that can be used to elaborate an IAS hydrodynamic model. This specific
activity has been translated into many workshops, with the contribution of the project's national
teams, as well as the international consultants involved in elaborating the database and the
hydrodynamic model in question.
Drafted by a restricted team made up of A. Mamou, M. Baba Sy, B. Abdous and A. Dodo, the
report has the duty of reflecting the extended contribution of the mobilised team during the data
preparatory phase for the IAS aquifer system modelling, through data collection, the drafting of
specific reports, and participation in the meetings and the workshops on the aspects processed
by the modelling.
Meetings and workshops dedicated to Databases or having led to data collection:
-
- OSS-IAEA (2004): Workshop on elaborating a common database for the three countries
(Mali, Niger, Nigeria), Tunis, from 26 to 30 April 2004 at OSS, with the participation of
experts from the three countries (two per country), the CITET Centr-Tunis, OSS, and an
international consultant in charge of database structure design.
- OSS- IAEA (2005): Training workshop on elaborating the IAS Database, Niamey. 26
April - 06 May 2007 at the AGRHYMET Regional Centre (CRA), with the participation of
country experts (two per country), AGRHYMET Centre, and OSS.
- OSS (2006): Meeting of the IAS Project Steering Committee (Abuja-Nigeria, 25-26
February 2006) in which it was decided to entrust OSS with the task of elaborating a
common database, knowing that AGRHYMET had been late in developing the database.
- OSS (2006): Training workshop on modelling and the required data collection: Mastering
the IAS modelling tool. Tunis, 18-28 April 2006. Participation of experts from the three
countries (two per country).
- OSS (2006): Workshop on Model Analysis: Data analysis and discussion of the
preliminary model's results. Tunis, 29 November - 08 December 2006. Participation of
experts from the three countries (two per country).
- OSS (2007): Workshop on model validation and the establishment of links between the
common database and the IAS mathematical model, with an analysis of the model's
results. Tunis, 01 to 10 March 2007. Participation of international consultants in
improving the database structure as built by the OSS team, and establishment of links
with the model.
oss
7
Produced intermediate technical documents:
- Maďga S. & Bouaré D., (2006) : Collecte des données hydrogéologiques du Systčme
aquifčre d'Iullemeden dans la partie malienne. OSS, décembre 2006, tableaux,
annexes.
- Moumouni Moussa A. & Rabé S., (Janvier 2007)
: Collecte des données
hydrogéologiques du Systčme Aquifčre d'Iullemeden dans la partie nigérienne. OSS,
Janvier 2007, 12 p., tableaux, annexes.
- OSS (2004) : Rapport de l'atelier sur l'élaboration d'une Base de Données commune
aux trois pays (Mali, Niger, Nigeria) ; Tunis, du 26 au 30 avril 2004 ŕ l'OSS.
- OSS-AIEA (2005): Rapport de l'atelier de formation sur l'élaboration de la Base de
Données du SAI ; Niamey, du 26 avril au 06 mai 2005 au Centre Régional AGRHYMET
(CRA).
Expanded team participating in the IAS database elaboration:
- Malian national team: Damassa Bouaré (In charge of the database at the National
Hydraulic Department & Seďdou Maďga (National focal point at the National Hydraulic
Department).
- National team of Niger: Abdou Moumouni Moussa (National focal point and Head of the
Hydrogeological Department at the Water Resources Department) & Seidou Maiga
(National focal point at the National Hydraulic Department).
- Nigerian national team: John Chabo (Federal Director of Hydrology and Hydrogeology at
the Federal Ministry of Water Resources) & Stephane Jabo (Federal Director Assistant).
- OSS team: A. Mamou (Expert hydrogeologist), M. Baba Sy (Expert hydrogeologist); and
A. Dodo (Project coordinator).
- International consultants: B. Abdous (Database consultant) and G. Pizzi
(Hydrogeological model consultant).
oss
8
Some definitions
Information system (IS): A set of elements that are dynamically interacting and organised in relation to an objective.
Information system database (DB): A structured and computer-managed collection of information relating to a specific
domain. A database is governed by a model and should meet a number of specificities:
·
Full independence between data and processing.
·
No redundant information.
·
Data integrity and coherence
DBMS: Software for manipulating, managing and using a database. Most of the DBMSs available on the market are
relational, i.e. based on the set theory and consisting of all the relational algebraic operations (union, join, intersection...)
Design approach: The database design process is generally subdivided in three stages: the design stage leading to the
data model definition, the logical implementation stage and the operation stage with a machine and the selected DBMS.
Design tools: The generalisation of relational databases led to devising design methodological tools which make it
possible to set up performing and long-lasting systems since they are based on the mastery of basic information. These
tools have operation rules, a formalism and sometimes even support software to facilitate data model elaboration.
Data model (conceptual model): A highly intellectual tool used for the representation of the real world through managed
information and interrelated links. Such tools provide a graphic schematisation to better symbolise the representation.
Relational model: Developed by the end of the 1970s to secure:
·
Total independence between data and processing: sustainable and open systems.
·
Data access through high-level nonprocedural languages.
· User views may differ from the established ones. Each user may have his own view of the database
objects.
Entity: This is an information system object with features. It is also referred to as an individual or an object. In our case a
water point is an entity.
Relation: (or Association): A link which may exist between two entities and reflects the management rules into force.
Property or (attribute): Elementary information run by the information system. It is linked to an entity and sometimes to
a relation. The name, the altitude and the coordinates of a water point are properties.
Identifier:particular property which makes it possible to identify in a single way an entity. The number of classification of
a water point is an identifier.
Table: data referring to a particular subject. A table represents an essential object of a data base ACCESS where the
data are stored. The table "points " contains the characteristics of the water points. A well informed table contains
several recordings (lines).
Request: it is the object of a base ACCESS which is used for posting, modifying or analyzing the data coming from one
or more tables.
Form: a form is before a whole tool making it possible to seize with the keyboard of the data which are immediately
introduced into one or more tables. The form is thus related to one or several tables, and it inherits their properties: types
of data, properties of the fields.
Linked table (or attached): table being in another data base (that it is of type ACCESS or other).
Field: element of a table being used to contain information. A table comprises one or more fields (columns).
Primary key: single identifier of each line of a table. A key can be either a field, or a concatenation of several fields.
Referential integrity: it is the mechanism which preserves the relations defined between several tables when
recordings are modified or erased. The referential integrity guarantees the coherence of the values of keys between the
tables.
oss
9
1- INTRODUCTION
1.1- Project context and historical background
The `Management of Hydrogeological Risks in the lullemeden Aquifer System' project (IAS),
mainly initiated by UNEP (GEF) and UNESCO in the basin-sharing countries (Mali, Niger and
Nigeria) adopted the `Transboundary Diagnostic Analysis' (TDA) to investigate the state of
aquifers and the hydrogeological risks they are confronted with. Such analysis led to the
establishment of a `Strategic Action Programme' (SAP).
From the outset, the analysis of aquifer water resources and usage environments proved to be
highly dependent on the available knowledge in the three countries about the aquifer
hydrogeological functioning and the way it is used. Yet, so far this knowledge has been the
business of the countries. It is presented according to a large national vision marked by
shortcomings and gaps resulting from targeted interest and modest allotted means. .
The project itself pays little attention to this aspect which is related to the activity that should be
led by IAEA for a better knowledge of the IAS transboundary zones. However, the IAEA activity
could not develop as planned to accompany the TDA in its progress towards a SAP. In addition,
the IAEA vision of the database to be set up is rather intimately linked to the usage which we
are expected to make of the data, in the isotopic data interpretation, in order to explain the
hydrogeological risks that aquifers face. Indeed, the hydrogeological information on the IAS
aquifers, as it appeared, in light of the TDA initial evaluations, should be more extended and
profound to account for the work of the aquifer system as well as its reactions to the recharge
conditions or operation, and the climate changes (regular droughts) recorded in the region.
On the basis of the TDA initial evaluations (Steering Committee meeting in Abuja, 25-26
February 2006), it was decided to substantially reinforce the hydrogeological knowledge of the
IAS aquifers, with the aim of securing a better quantitative evaluation - if possible - of the
various hydrogeological risks which the SAI aquifers face. Such reinforcement is planned
through establishing an integrated geographic information system including an exhaustive
database and a specific hydrogeological modelling to evaluate the water system balance and
better quantify the exchanges.
Since then, the OSS, the project implementation agency, started, with the contribution of the
teams of the three countries associated to the project, to carry out these two closely related
tasks (Database and Hydrogeological Model) with the objective of developing decision aid tools
(DAT) so as to facilitate the consultation mechanism for a an optimal management of the IAS
water resources.
In fact, it is clear that tools are necessary for a shared evaluation of the IAS water resources.
Such tools should include the following basic items:
· A Transboundary mapping of the entire aquifer system.
· A database of all the completed, processed and harmonised information as
provided by the three countries.
· A modelling using the same hypotheses relating to the aquifer system operation
design.
oss
10
These decision-making tools essentially rely on a perfect control of the aquifer system
information:
· Database architecture amenable to updating and visualising.
· Tools of regular updating and data control.
· Decentralised system of new information collection: modules set up in the
countries.
The realisation of the IAS mathematical model requires the collection, organisation and
homogenisation of available data within the project's three countries. The establishment of the
IAS database is an activity whose objectives are spaced out over time. At the start, the need for
a water resource evaluation as recognised by the three countries made this database a
supporting element for decision aid and enabled the building of the overall model.
Subsequently, feeding this database with the information required for a follow-up of the aquifer
and the threatening risks turned it into a cooperation facilitating tool and made it more rational. It
is, then, an ongoing activity which is planned as a component of the information integrated
system. After the project comes to an end in the three concerned countries, it is expected to
continue cooperation on the basis of an optimal management of the IAS water resources.
In fact, it is about the gradual development of an information system that is strongly inspired by
the SASS experience.
Since the project inception, the control of the new data management technologies is presented
as a priority to secure a good Transboundary Diagnostic Analysis of the hydrogeological risks in
the Iullemeden Aquifer System. For this reason, the first organised workshop (OSS-Tunis, 26-30
April 2004) dealt with the elaboration of a database common to the three basin-sharing
countries. The organisation of this workshop, as part of the IAEA activity, was implemented by
OSS with the objective of bringing in its database management and GIS experience to federate
the different objectives of the partners contributing to the analysis of the IAS transboundary
hydrogeological risks. To this end, we relied on the database management experts in the
countries as well as AGRHYMET experience, as a regional body called upon to host the IAS
information system. The workshop made it possible to:
- Identify the set of entities which should make up the information system structure
including the spatial-type information.
- Adopt a common codification for the IAS database, compatible with the codification
used by the countries.
- Suggest
various
development solutions according to the modelling software which
will be selected.
- Elaborate
a
strategy for existing file transfer and manual data entry: old history
files, information in study reports...
A second workshop was also organised on the elaboration of the IAS common database by
the International Atomic Energy Agency (IAEA) at AGRHYMET (Niger-Niamey, 26 April 06
May 2005), with the aim of completing the work initiated by the national experts to control the
management of the IAS information system. During this workshop, the focus was on:
· Initiating the common Database Management System: ACCESS software.
· Designing the organisation of the common database.
· Harmonising the three countries' data: Mali, Niger and Nigeria.
oss
11
By approaching the common database implementation through real IAS aquifer data, the
country representatives felt the need to harmonise information to better depict the hydrodynamic
behaviour of the aquifer set (Intercalary Continental, Continental Terminal and water tables).
Initially planned for six months (up to November 2005) at AGRHYMET, the collection and
harmonisation of country data in the IAS database could not be done because the computer
scientist of that organisation left. The country data were left as received.
Given the project's timeframe for completing the other activities, and during the Steering
Committee meeting (Nigeria-Abuja, 25-26 February 2006), the OSS took the responsibility of
establishing the IAS information system with its own means.
The realisation of the information system generally requires three stages:
- Phase I: Analysis of the existing information in the three countries and selection
of the organisational solution in light of the project objectives, country specific needs,
and the current technological tendency (equipment and software).
- Phase II: Information system design and description of the computing solution
chosen in collaboration with the countries: common database architecture,
identification of GIS layers, codification harmonisation, definition of processing
modes.
- Phase III: Database and GIS implementation with equipment and software
installation in the countries, database and GIS implementation, transfer of existing
heterogeneous data in the three countries, and team training (DBMS, GIS, spatial
analysis utilities).
In its Abuja meeting, the project's Steering Committee tackled the three stages, thus allowing for
the collection of considerable information brought together into one relational, uniform,
coherent and scalable database. The database design has been made in close collaboration
with the country experts associated with this activity on the basis of the required information and
the storing and processing facilities available in these countries. For such purpose, the choice
was mainly geared to the available tools (software) or the public sector (Excel, Access,
ArcView...) or acquired within the project's framework (Processing Modflow PM5). By focusing
on the involvement of the national technical experts in charge of managing the collected data, it
was relatively easy to better initiate/improve data management. The collected data in the
countries come from archives or databases of the national offices in charge of water resources.
A major part of these data was collected in the framework of previous national or regional
studies. Their integration in the IAS common database went through a long collection-entry-
validation process that the national experts mastered following the two launching workshops
and a regular contact with the OSS team in charge of the operation. The parallel elaboration of
the IAS common database and the hydrogeological model made it possible to ensure
information validity, fill the gaps as the two activities progressed, and better target the searched
information.
The established geographical information system is completed with user-friendly exploration
and entry tools, synthesis requests, and procedures of new information additions.
Data analysis tools were also elaborated in order to facilitate anomaly and incoherence
detection and provide relevant valid information to the digital model. These tools allow the
elaboration of processed information in request form, statistical processing and geo-referenced
thematic analyses thanks to digital maps elaborated in the framework of the project and
covering the whole basin.
The operation of the developed tools constitutes a good storage media for the IAS project
information. Similarly these can be later used as information sharing and decision aid tools.
oss
12
Contrary to previous studies focused on the part of the basin in the country limits, this IAS study
has many data sources which were used to feed the common databases.
The database resorted to different data processing types `to secure its coherence'. By means
of well-defined procedures, the processing is made in the same manner and, therefore, with a
good level of reliability. The elaborated database facilitates the use of information in the
framework of the project and ensures a greater flexibility of use, making the handling of such
an important information volume plausible and easier.
1.2- The SASS project experience
Thanks to the experience acquired from the elaboration of the SASS database, the time
allocated to developing the IAS common database was relatively short. In fact:
- All the conceptual part was unnecessary: the Conceptual Data Model (CDM)
elaborated during the SASS project was adopted.
- The data collection formats have been harmonised among countries since the
beginning.
- The processing tools (entry and display interfaces, link modules with PM5, DB
model links) were just adapted and enriched.
- The control of tools at the OSS level made significant time gains.
The advantage is reinforced by the fact that the used software platform, i.e. MS ACCESS and
ARCVIEW is well-controlled by OSS which transmitted the knowledge to the three countries'
experts.
The most important task was then essentially accomplished on the proper data:
- File formatting and codification.
- Entry of additional data not available in the country databases.
- Devising transfer requests to the database (DB).
- Formatting
GIS
layers.
2- DESIGN AND IMPLEMENTATION OF THE IAS INFORMATION SYSTEM
2.1- Approach presentation
The development of the IAS information system required the following stages:
- Diagnosis phase: A diagnosis of what is available and development orientations.
- Design phase: The results are the Data Conceptual Model (DCM) and the best
adapted organisational and technical solution.
- Realisation phase: The translation of DCM into a physical model depending on the
Database Management System (DBMS) selected according to the previously chosen
technical solution.
- Implementation phase: Implementation in the adopted organisational environment
after available data transfer.
oss
13
The conceptual phase is the most important and determines the success of the other phases.
During such phase, efforts were focused on properly understanding the field, elaborating a
representative data model, and defining the best possible development solution.
Given the nature of the required processing, which is particularly geared towrads the
representation of hydrogeological, hydrological and climatological data, the geo-referenced
information system to be developed in the IAS case should be capable of mainstreaming
several information categories:
- Descriptive digital data.
- Spatial-referencing
type
of
information.
- History file of measures in chronic series, with heterogeneous extension and
continuity.
The system functionalities have been designed to facilitate the use of the modelling software,
establish dynamic links between digital and spatial information, and automate pre-model and
post-model operations to enable the team in charge of the model to multiply simulations and
recuperate results.
2.2- Analysis of the current situation in the three countries and collected data review
The collected and analysed climatic, hydrological and hydrogeological data in the three
countries allowed identifying inconsistencies from the beginning and which were corrected
thanks to the data processing (ArcView, Rockworks...). The fact that the major part of these
data is without any geographical attachment (coordinates) highly limited their direct
mainstreaming in the database. The identification of the water points coordinates is a tedious
operation, requiring extensive cross-checking and interpretation.
The collected data used to elaborate the IAS common database is done with the objective of
ensuring a hydrological synthesis to explain the hydrological functioning of the aquifer system
and develop a hydrodynamic simulation model on the basis of which one can infer the system's
water balance with the specification of each component.
- IAS geology and specifically the lithostratigraphic boreholes.
- Climatology, especially the recorded rainfall at the different basin stations, used to
measure the aquifer system recharge (inflow).
- Hydrology, especially the history files of the Niger River flow, which constitutes a part
of the aquifer system outflow.
- Hydrology of the water points capturing the different IAS aquifer system leayers
(piezometry, drawdown, operation flow, water salinity, transmissivity, storage
coefficient...) and the history files of the measurements of different hydrogeological
variables (piezometry and operation) which are used to restore the system's
hydrodynamic operation in the simulation model.
This common database is likely to be extended to include other data relating to pedological,
environmental, geographic and agricultural aspects insofar as it proved necessary to extend the
IAS study to other specific aspects of water resources use and its impact on the environment.
The data collection of this database was made in reference to the information available to the
administrations in charge of the water resources management in the three concerned countries.
One section of this information is equally extracted by the project team from the studies related
to the different basin's parts.
oss
14
The links established between this common database and the geographic information system,
on the one hand, and the IAS hydrogeological simulation system, on the other, is a further
peculiarity which turns the database into a tool to integrate, process and represent information
graphically and cartographically. In fact, these links are materialized by specific links operating
from and to the common DB and spare efforts relating to data entry, formatting and processing
at the level of IASIS and the hydrogeological model.
2.2.1- Mali data
In 1985, the National Hydraulics and Energy Department (NHED) of Mali developed SIGMA, a
national database, within the framework of the UNDP Mali 84/005 project. The database was
used to elaborate the hydrogeological synthesis of Mali and the Master Plan for valorising
groundwater resources (1991).
At the beginning, SIGMA1 was developed with software in the DOS environment: dBase IV for
archiving, and digital and statistical processing. Atlas*Draw and Atlas*GIS for cartographic
representations, and LOTUS-123 for the graphic presentations of chronological data.
Between 1986 and 2001, SIGMA1 general architecture and management programmes evolved
little, notably at the level of the information technology environment, which remained under
DOS. The need to add new fields in the original files and create new files with fragmentary data
has gradually destroyed the database structure to the extent that they no longer meet the
Administration's needs for hydraulic planning.
In 2001, a development project of the database made it possible to have SIGMA2 in its current
format by:
- Changing the information technology environment with the transition from the dBase IV
management system (under DOS) to ACCESS (under Windows).
- Giving attention given to the new administrative division of the country.
- Restructuring the old database files into new ones.
- Entering the inventory results of the modern water points.
- Installing the last version of the database, SIGMA2, in the Regional Departments of
Hydraulics and Energy (RDHE).
In 2003, the new version made it possible to elaborate the water map of Mali, which is
considered as a decision aid tool, providing information on water supply to the population and
the functionality of hydraulic infrastructures by region, circle, area and village/fractions. This
decision aid tool was put at the disposal of local authorities and the different agents of the water
sector in Mali.
Now, with the effort of the National Hydraulics Department (NHD), and in spite of some
difficulties, DRHE (National Directorate of Hydraulics and Energy) updates SIGMA2 in collaboration
with the regional structures and the Documentation and Computer Centre (DCC) of NHD. The
last updating goes back to July 2006.
Thanks to its management software (ACCESS), the database allows for an easy passage from
the data to the IAS common database. However, at the graphic level, it is still run by software
which does not allow for the geo-referenced digitisation of information. It is, then, possible to
partly recover the data which are archived, but to pool the data in a graphic form, it is necessary
to use other software (ArcView, Rockworks...).
The database includes tables which are mainly centred on the management structures of water
resources and not those specific to the analysis of physical (hydrology and hydrogeology) and
oss
15
climatological (rain, infiltration, evaporation) data. As a result, it requires a full restructuring to
streamline new data specific tables.
The hydro geological data necessary for the modelling of the SAI system are compiled in the
synthesis studies. Their extraction was mainly done by the OSS project team
File format and description, used codification, content analysis (missing information,
inconsistencies...) and peculiarities:
The format of the obtained files is heterogeneous and of three types: Excel, Word and
ACCESS. The Excel files include hydrogeological information relating to water points,
piezometric levels, hydrodynamic parameters and other operation flow values of underground
water. These files include many gaps, notably missing coordinates, water points without
identifier, non-informed altitudes...
The ACCESS files are four three of which are empty of data and the fourth does not open. The
Word files are 16 and include descriptions of drilling logs.
The Excel files are described as follows:
File name
Description
Line number
ANNEXE II.1
Water point characteristics
1071
ANNEXE II.2
Characteristics of dag wells
455
ANNEXE II.3
Characteristics of dag wells
455
CLIMSTA
Characteristics of climatological stations
5
HYDSTA
Characteristics of hydrological stations
89
IRHFOR
Water point characteristics
388
IRHPTM
Caractéristiques des points d'eau
988
IRHPZO
Data on piezometric levels
61
Puits-
Well characteristics
802
Iullemeden_Mali
IRHAEP Well
characteristics
14
IRHCHI
Data on water chemistry
11
IRHEss
Data on static levels
26
IRHPOM
Data on types of works
208
VILLAGES
Water point inventory
453
Villages-
Water point inventory
349
Illiulemeden
oss
16
Tous ces fichiers, en particulier ceux nommés caractéristiques des points d'eau peuvent
contenir, en plus des informations sur leur identification, les données sur les coordonnées,
les types d'ouvrage, les captages, la piézométrie et la qualité chimique de l'eau (résidu
sec).
All these files, in particular those referred to as water point characteristics, may include, in
addition to their identification information, data on coordinates, works types, water catchment
areas, piezometry, and water chemical quality (TDS:Total dissolved salts).
2.2.2- Niger data
The Ministry of Hydraulics, Environment and Desertification Combating hosts the Water
Resources Directorate (WRD), the institution in charge of the resources inventory and
management. The Hydraulic Resources Inventory Department (IRH) manages the water
resources database within the Water Resources Directorate.
The database, known as SIGNER, was elaborated in conditions similar to those of Mali.
Following the same pattern, it offers an architecture which is based on the same processing
software. Here also, since the mid 1990s, the structure proved to be limited given that it was
mainly oriented towards water usages and sanitation. It presents a statistical approach to
highlight the serviced towns and the services system.
Quickly it underwent local modifications and was attached to the GIS to serve as storage media
to SIGNER.
It lists the set of water points in Niger but does not give sufficient details on underground water
hydrogeology nor the characteristics of water point outside the reached depth, flow and water
table level. The database lacks history files of piezometry, operation and water table quality.
The management system initially installed on Dbase III quickly proved to be limited as a
software storage medium and there was migration to ACCESS1 a year ago. Its main current gap
is the lack of data geo-referencing, an aspect which is in the process of being reviewed for
improvement.
Thus, for structural considerations, the IRH database gradually shifted from a tool for the
management of the DB water resources to a tool for the management of water at a national
level with links with the IRH, without, nevertheless, being in a position to ensure the
representation of the hydrogeological aspect. The IRH has a database (21708 water points)
whose GIS is run by AtlasGIS. Staff training sessions are planned in order to transfer the GIS to
ArcView. On its side, SIGNER processes data of the HRID database, but for applications other
than the WRD ones. It has been operational since 1989. It gives value to the IRH base and
allows, among other things, for grouping resources and needs. It serves as a support to the
Poverty Reduction Strategy (PRS) and the Community Action Programme (CAP). As long as it
is structurally dissociated from the HRID, it is difficult to conceive it as a tool capable of looking
into the water resources monitoring problems.
The data review available in the IRH database shows that these are mainly hydrogeological and
specifically deal with the modern water points (shaft lined wells and drillings) developed in the
framework of the communal Water supply programmes. For these water points, the available
information concerns rather the uses and the users and does not address the aspects relating to
1 According to Mr. BAKO Maman, a computer and GIS specialist, and a hydraulicist in charge of SIGNER
management, the migration was made within the framework of the International Decade of Potable Water and
Sanitation (DIEPA).
oss
17
basic hydrogeological characteristics (data provided at the time of creation, history file of
piezometric levels, operation and chemical composition).
As for the `historical' aspect, the compilation of the different synthetic studies had to be made to
extract the searched data and ensure its entry - a task tackled by the IAS project OSS team.
File format and description, used codification, content analysis (missing information,
distortions...) and peculiarities
The file format is heterogeneous: Excel, Word, pdf, Dbase and jpg pictures. It brings together
geological and hydrogeological data relating to water points, piezometric level history,
hydrodynamic parameters, and some water table operation flow values. The identified gaps
noted are of the following type: missing coordinates, water points without an identifier, missing
altitudes, missing dates, and unknown hydrodynamic parameters.
The files are described as follows:
File name
Description
Line number
PEM ULLEMEDEN BASIN.xls Water point characteristics
13431
Geology Format 2 Revised.xls Drilling stratigraphic logs
531
Niger_CI_CT1 aquifers
Water point characteristics
125
North and South Niger rainfall Monthly rainfall data (6 stations)
180
data.xls
Hydrochemical data of Italian
Hydrochemical and piezometric data
604
drillings (Il Nuovo Castoro).xls
NER009 CHEMICAL DATA
Chemical data
32
FIRST CAMPAIGN.xls
NER Sample point maps.doc & Location map of chemical analysis
RAF
points.
038 Map of installed recorders
RAF 038 CHEMICAL DATA
List of water samples withdrawn in the
46
1st Campaign.
project zone
Drillings AFD Maradi.xls
Chemical data
241
All works AFD Maradi.xls
Waterhole characteristics
302
BASE-CH.XLS
CI aquifer geometric and hydrodynamic
50
BASE CH. XLS
data
BASECT1.XLS
CT1 aquifer geometric and
76
hydrodynamic data
BASECT1B.XLS
CT1 aquifer geometric and
67
hydrodynamic data
BASE-CT2.XLS
CT2 aquifer geometric and
91
hydrodynamic data
BASE-CT3.XLS
CT3 aquifer geometric and
148
hydrodynamic data
oss
18
File name
Description
Line number
DALMA1.xls
Piezometric fluctuations level of Dallo
33
Maouri water table
DALMA2.xls
Piezometric fluctuations level of Dallo
33
Maouri unconfined aquifer
DALMA3.xls
Piezometric fluctuations level of Dallol
33
Bosso alluvial aquifer
korama.xls
Piezometric fluctuations level of
35
Koramas aquifer
MachayaKOR.xls
Piezometric fluctuations level of
445
Machaya alluvial aquifer
PiézoDANTIANDOU.xls
Piezometric fluctuations level of
62
Dantiandou aquifer
PiézoMaradi.xls
Piezometric fluctuations level of Goulbi
140
de Maradi alluvial aquifer
PiézoTELOUA.xls
Piezometric fluctuations level of
301
Talloua alluvial aquifer
piézozinder1.xls Piezometric records of GOGO Zinder
451
catchment area
piézozinder.xls
Piezometric records of GOGO Zinder
156
catchment area
Water withdrawals statistics.xls Withdrawals statistics (2001-2005)
185
December 2005 production.xls Drilling operation parameters:
179
December 2005
Operation problems of the 43
Description of the current situation in
103
centres.xls
the 43 centres
SAI_Niamey.xls Wate
point
characteristics
984
IAS_Hapex Sahel Data.xls
Water point characteristics
572
IAS_General File _Niger.xls
Water point characteristics
7725
IAS_General File Tillabery
Water point characteristics
3800
Dept.xls
IAS_General File Dasso
Water point characteristics
2765
Dept.xls
IAS_General File Tahoua
Water point characteristics
2502
Dept.xls
IAS_General File Niger_1.xls
Water point characteristics
427
IAS_General File _Niger_2.xls Water point characteristics
2684
IAS_General File _Niger_3.xls Water point characteristics
2418
IAS_General File _Works.xls
Water point characteristics
9067
IAS_Confined aquifer
Type of tapped aquifer
1519
drillings_Dosso Dept.xls
IAS_Confined aquifer
Type of tapped aquifer
1880
drillings_Tahoua Dept.xls
IAS_Confined aquifer
Type of tapped aquifer
1246
drillings_Tillabéry Dept.xls
IAS _Tillabéry.xls
Type of tapped aquifer
110
2.2.3- Nigeria data
oss
19
Contrary to Mali and Niger, we were not aware of the existence of a national database. We have
very little information on the part of the basin in the country. The collected information comes
from the national archives. The operation histories are obtained by formulating hypotheses and
using the 2004 population census data of the main areas located in the basin.
File format and description, used codification, content analysis (missing information,
inconsistencies...) and peculiarities
The file format is heterogeneous. It brings together geological and hydrogeological data relating
to water points, piezometric level history, hydrodynamic parameters, and some water table
operation flow values. The identified gaps noted are of the following type: missing coordinates,
water points without an identifier, missing altitudes, missing dates, and unknown hydrodynamic
parameters.
The files are described as follows:
File name
Description
Line number
SAI_Nigeria_Boreh Hydrogeological and hydrochemical data on
153
oles.xls
waterholes
JICA Coordinates
Hydrochemical boreholes data.
95
seeking.xls
JICA Sokoto
Piezometry 1988-1989; some hydrodynamic
64
1990.xls
parameters; some withdrawals data.
Nigeria Data
Isotopic data and boreholes characteristics.
25
Boreholes IAS.xls
SAI_Nigeria_Boreh Boreholes characteristics; some piezometric
30
oles.xls
values.
It is, then, clear that the water resources data of the three countries is found on information
supports within their respective offices. Such information is inadequate to the tasks expected
from the IAS project. The major part of these data is not streamlined in the national database.
When data are available, they include only one part of the information whose formatting is only
partially exploitable. The other data, essentially in the form of graphic documents, require some
compilation, entry and verification before streamlining them in the IAS common database. The
archived data are heterogeneous, incomplete, and mostly inadaptable. The supports of these
databases do not at all facilitate the exhaustive information recovery and streamlining in the
common database. An updating operation of the supports should be made prior to developing
new data in view of having perfectly operational information.
2.3- Additional information collected during the project
The hydrogeological data required for modelling the IAS aquifer system are compiled in the
synthesis studies. The OSS project team mainly extracted the information.
Several sources of information were used for data collection:
-
National DB of boreholes characteristics (DB-HRID in Niger and SIGMA2 in Mali)
oss
20
-
Excel files containing data deriving from the compilation of national data by the country experts involved
in the task of data collection (2).
-
Manual entry of archival data (notes, reports, published scientific work, new academic work, technical
documents, etc.) by the national experts and the OSS team, specifically in relation to operation history,
piezometry, water chemistry as well as hydrodynamic characteristics and geological data related to oil
drilling and boreholes, which are missing in the DB of these countries.
2.3.1- Geological data
Several published logs and borehole cross-sections were used to contribute to the definition of
aquifer geometry and system design.
2.3.2- Other data from study documents
These are hydrogeological data that are essentially related to water level, operation, chemistry
and hydrodynamic parameters (transmissivity, storage coefficient, permeability).
2.3.3- Inconsistencies and shortcomings
2.3.3.1- Abstractions
The `Abstractions' table could not be sufficiently fed with specific data (yield, date) as expected.
This was due to the lack of a history of flow measurements or the volumes used for a specific
usage (water supply, irrigation, livestock, and industry). The main inconsistency in monitoring
the IAS aquifers makes model levelling relatively tedious, given that we have to use cross-
checking methods to evaluate the operation.
It is then a cross-checking based on size (population or animals) and sectoral 'demand' (water
needs/inhabitant/day, water needs/Total needs, water needs/ irrigated ha, etc.), or the size of `water
production' (daily production of communal centres). Operation is approached in a sketchy manner. Other
hypotheses are taken into consideration in such evaluation when new appreciation elements are available
with a view to presenting the most plausible operation estimates per aquifer and country.
2.3.3.2- Uninformed important Fields
Since it is an initialisation stage of the information system, the gathered data come from diverse
sources:
· Formats are different.
· Codification - when it exists - is heterogeneous.
· The information level differs from one country to another.
· Many data are extracted from study documents (they are not then databases).
For all these reasons, the collected data are not always compatible with the database structure.
Consequently, some Fields remain uniformed.
Water point characteristics
Fields are defined to describe the borehole and the adopted solutions to characterise them.
Field Description
Adopted
solution
NoClas
Water point identification number
Manual codification
Code_aquif
Code of the aquifer captured by water point
GIS usage and request
2 This is the case of the teams of Mali and Niger whose contribution is synthesised in two documents specifically
produced for the IAS aquifer modelling purposes, i.e.
-
Moumouni Moussa A. & Rabé S. (Janvier 2007) : Collecte des données hydrogéologiques du Systčme
aquifčre d'Iullemeden dans la partie nigérienne. OSS, Janvier 2007, 12 p et tableaux annexes
-
Maďga S. & Bouaré D. : Collecte des données hydrogéologiques du Systčme Aquifčre d'Iullemeden dans la
partie malienne. OSS, décembre 2006, tableaux annexes
oss
21
Nom_admin
Administrative unit
GIS usage
Code_usage Water point use
Transformation request
Code_etat
Water point status
Artesien Artesian
drilling or not
Request
Alt
Water point altitude in meters
DEM better resolution 90 meters
Coordinates
· Many boreholes with a withdrawal history have no coordinates. This excludes them from
the PM5 model, since they cannot have a grid number.
· There are duplicates by coordinates: boreholes with different characteristics (identifier,
name,..) but with similar coordinates.
oss
22
2.4- Common geographic data
2.4.1- Topography and basic maps
Since the launching of the IAS project, we were confronted with the need to have a topographic
fund common to the entire lullemeden basin. This proved necessary to determine the system,
especially that the hydrological limits are not necessarily uniform everywhere in the aquifer
limits. The OSS developed the topographic map at 1/000000 (Fig.1)
The topographic fund adopted in this map is NGI. Thanks to it, a DEM was designed bringing
together the topographical data of the Digital Word Chart (DWC) (Fig.2). The designed
topographic map goes beyond the limits of the lullemeden basin. It extends between the
standard parallels 0 degree and 15 degree E and the standard parallels 10 degree and 22
degree N. This voluntarily chosen extension is adopted to examine all the hypotheses on the
aquifer hydraulic links of the lullemeden basin and the other adjacent basins like Lake Chad.
Figure 1: Topographic map of IAS at 1/1000000
oss
23
The geographic information related to this topographic map is as follows:
- Hydrographic network: permanent water stream, temporary water stream, permanent
wetlands, temporary wetlands, lake.
- Contour line: main and secondary with a 100-m contour interval.
- Spot
height:
- Main agglomerations: capital, county-town, main town of a department, main town in a
subdivision, secondary town.
- Roadway: main, secondary, railways, track.
- Other signs: palm-tree, boreholes, halophytic vegetation, sea vegetation.
These layers are listed in the table below:
Shp file name
Description
Type
Origin
Hydrography.shp Hydrographic
network
Line
DCW
Fleuve_niger.shp
The Niger River
Polygon
DCW
Villes_principales Main
agglomerations
Point
DCW
Cnv_50_1-int.shp
Contour line (50m equidistance)
Line
Topographic maps
Water_bodies.shp Lakes
Polygon Topographic
maps
Dallols.shp
Polygon
Topographic
maps
Humide.shp
wet lands
Polygon
Topographic maps
Limite_zone
Limits of the IAS zone
Polygon
OSS
Routes.shp
Main roads
Line
Topographic maps
Pcote.shp Spot
height
point
Topographic
maps
2.4.2 Digital Elevation Model (DEM)
It is a file with an EsriGrid format made from GTOP030. It has a resolution of 30'' arc. The
kilometric resolution, then, varies according to the latitude. The system of original coordinates is
in decimal degrees on WGS84 ellipsoide. The altitude is expressed in meters from the sea
average level.
oss
24
Figure 2: DEM in the IAS zone
This resolution does not allow for a very accurate terrain representation. The reconstitution of
the boreholes altitudes, which are essential to piezometric processing, can provide exploitable
results.
2.4.3- Hydrogeology (Aquifers)
The hydrogeological layers displayed on the IAS maps are mainly:
- The
`boreholes' which are directly linked to the DB and appear on the map following
a specific configuration at the point of geographic streamlining.
- The `the aquifer systems boundaries' and mainly the two aquifer layers of the
Continental Intercalaire (CI) and Continental Terminal Continental (CT). These
boundaries are established on the basis of a structural analysis which refers to data
relating to surface geology, drillings, and geophysical studies.
- The `faults' or `major tectonic accidents' are configured on map, on the basis of the
available documentation, particularly the tectonic map of Africa (3). This configuration
is later validated by a location survey correlations between the mechanical drillings,
- Initial piezometric map: The map brings together all the previous piezometric
measures or those made in 1970. They are brought back to this date in order to
represent the initial piezometric status. This piezometry is related to the Sea General
(3) Add map reference
oss
25
Level (NGM) by referring to the levelling of borehole altitude or the DTM in case local
altitude measures are not available.
Figure 3: CI initial piezometry
oss
26
Figure 4: Initial piezometry of CT
List of layers:
File name
Description
Type
Source
Faults.shp Faults
Ligne
Geological
maps
Extension_ic_ias.shp CI
limits
Polygon
OSS
Extension_tc_ias.shp CT
limits
Polygon
OSS
Rechargezones_ic CI
recharge
areas
Polygon OSS
Rechargezones_tc CT
recharge
areas
Polygon OSS
Piezo_set-ic.shp
CI initial piezometry
Line
OSS
Piezo_set-tc.shp
CI initial piezometry
Line
OSS
Transmissivities_ic_curv CI Transmissivity
Line
OSS
oss
27
2.4.4- Geology
The geological map of the IAS zone is designed at 1/ 2.000.000 by reference to different
available geological documents; especially the geological map of Niger at ˝ M and 1/1M, the
geological map of Nigeria at 1/0.5M and at other sheets of the geological map of Mali and
Algeria at 1/0.5M.
The map (Fig.5) was made in the framework of the project. It is a synthesis of the set of
geological information on the outcrop of the different layers. It was useful to keep the maximum
information, which is specific to the consulted documents (nomenclature of formations and
sets), and make the required homogenisation in order to have a common legend.
Figure 5: SAI geological map
oss
28
List of layers for the geology theme
Shp file
Type Source
Description
Geol_iullumenden IAS
geology
Polygone OSS
Polygon
Affl_ci_sai CI
outcrop
Polygone
OSS
Polygon
Affl_ct_sai CT
outcrop
Polygone
OSS
Polygon
Affl_plio-quat Plio-quaternary
outcrop
Polygone
OSS
Polygon
Cretace-sup Upper
Cretaceous
outcrop Polygone
OSS
Polygon
Failles Faults
Ligne
Geological maps
Line
The geological information set served to elucidate the IAS subsoil structure and identify the
different aquifer levels within the system. Thus, we could delimit, with a great deal of accuracy,
the geographic extension of the layers and their distribution among the three aquifer-sharing
countries. Similarly, the information was used for the accuracy of the vertical evolution of the
layer thickness, which is a key datum for the hydrogeological model. The faults geographic
localisation within IAS allowed the delimitation of the different layers as well as the lateral
discontinuities they experience.
oss
29
3- DESCRIPTION OF ISIAS
The global organisational solution, which was defined to carry out the common information
system, is represented in the figure, below, describing collection process and data formatting.
The process is based on the contribution of national teams to the data collection and selection
required for the project so that it can be later shared by the three countries. The adoption of
specific formats in the IAS common database requires the harmonisation and validation of these
data. It is at this level that the OSS team intervenes to bring in its `know-how' in light of the
expected objectives and for the use of this information in the aquifer monitoring, design, and
evaluation, and in underlying specific trends in the evolution of some climatic, hydrological or
hydrogeological parameters. The IAS common database is hence designed as an element in a
process of available information analysis and also as a tool to generate results for the
Transboundary Diagnostic Analysis (TDA). Such objectives imposed the active participation of
the countries' technical teams in charge of the IAS water resources. This choice meant in turn
that there was a need to provide training for these teams so as to enable them to take the
responsibility of establishing and maintaining the system, and adapting it to national needs. The
strategy of the gradual establishment of the IAS common information system is found in table 1:
Tableau 1: Gradual establishment of ISIAS and its role in the evaluation of hydrogeological risks
Phase Regional
level
National
level
-
Transboundary
- Aquifer monitoring improvement (new
Diagnostic Analysis
- Establishment of the common boreholes, piezometry, operation, and
(TDA) :
georeferenced system (digital
hydrochemistry)
Database
maps, DB and GIS)
Database consolidation and GIS
Modelling
(management performance,
Indicators
Simulation model of the
recovery of archival data and
aquifer system operation
acquisition of new data)
For the Action
- Consultation framework
-Development of water resources
Strategic Programme (controlled management)
strategy
- cooperation
mechanism
- IAS monitoring network
- Better response to water demand
- Monitoring network
(decision aid)
- Concerted planning
- Conservation of aquifers and water
-Monitoring indicators
usage areas
oss
30
Figure 6: Total organisational solution of the IAS database
Mali data
Niger
Nigeria data
data
Common data
Common data
Common data
Specific data
Specific data
Specific data
Updating mechanism
Common DB
This schema is an organisational solution of the common database instruction, as jointly
approved with the national teams. It constitutes the basis for harmonising the national
databases specific to the management and the follow up of water resources and is reflected by
a broad similar architecture in three countries. On such basis, the task of the IAS underground
water management becomes more controllable. This database structure meets the needs of the
basin's management and can be easily adapted at the level of countries for monitoring purposes
and more local and sector-oriented management.
The conceptual model of the IAS common database (CMDB) responds to the following
objectives in the first place :
- Harmonisation of data in the three countries with the aim of ensuring a better
understanding of the hydrodynamic functioning of the aquifer system whose one of the
first applications is TDA.
- Collection of all the climatological, geological, hydraulic and hydrogeological
data allowing for the design of a simulation model of the system which restores
functioning, water results and exchanges according to the entries, exits and the
incurred transformations.
- Collection of overall planning schemes, water demand by sector and vision of needs
evolution in order to set up forward-looking simulations, translated into the system
future reactions according to pressures to which aquifers are subject, and hence
concretise the SAP.
These objectives are translated into a set of `tables', gathering the required information for the
construction of a model representing the IAS aquifers, functioning and the different operating
conditions. These tables should be interlinked on the basis of some identification codification to
enable inter-table exchanges as well as the recovery of results and their grouping or
superposition in thematic layers. The links between the `Information System' (GIS and common
database) and the aquifer simulation model will be subsequently examined within the framework
of using the database information to generate hydrogeological models.
oss
31
For such information system to be adopted as a decision aid tool, and for the IAS short-term
and medium-term management, information updating procedures are defined at the same time
as the access and privilege protocol of the different common database users.
Given that the immediate purpose of this information system is processing data to design a
digital model, simulating the IAS operation, and to design water assessment report, the common
database was produced and validated with the countries, on the basis of an overall conceptual
model that meets the objectives and approves hypotheses, conditions and rules, as agreed with
the three countries (geographical extension, structural configuration, link with a hydrographic
network...)
At the structural level, the countries opted for:
- Designing an IAS common database in view of an agreed management of the shared
water resources.
- Adopting a structural schema of the common database in view of its mainstreaming
in the national DB to ensure water resources management and monitoring, given that
this schema is specific to tasks and tolerates additions and modifications to meet the
country's needs. In fact, on the basis of the rules of `rational bases', this system is
extendable and adaptable and allows for data harmonisation and ensures its
updating,
- lDefining clear data updating procedures between partners.
- Setting up a data securisation mechanism.
Each time the structure of the IAS information system or its content is improved; the three
countries benefit from them and are associated to them. They have plenty of scope to carry out
the expected extensions at the national level in order to use the system as a water resources
management tool. They are not called upon to bring uniformity to data which they judge to be
necessary to achieve the project objectives.
In case of any modification, the adopted data updating mechanisms are based on the principle
of replication which is provided in most of the DBMSs available on the market. During this
project phase, it was thought to be more practical not to impose a given system securisation
mechanism on the common database, but to opt for a mutual information exchange with
reference to the OSS-run database copy until completing all the information implementation
operations and their processing for the purposes of the hydrogeological model.
3.1.1- Technical choices and computer tools control
The technical solution for operating the IAS information system software is adopted by
accounting for the following points:
- Availability in the three countries' public sector.
- Implementation simplicity of control by the project national teams.
- Formats and data exchange mode with the digital model.
- Current technological trends.
It is highly important that the used tools are easily accessible to water resources
administrations technicians in charge of the IAS aquifer management. Since such new software
is not available in the public sector, it would be very difficult for the IAS information system
managers to obtain the required equipment and control its use at the appropriate time. There is
oss
32
no use to add new technological tools to the ones which proved little efficient after a few years
(the case of Mali and Niger).
Implementation simplicity and control of information system management tools are two
prerequisite conditions which facilitate its mainstreaming in the countries' underground water
management tools. For the project as well, it is highly important that this tool control is done
over a long training period to be able to move to the planned applications.
The information system links with other applications, particularly the aquifers simulation
model, are not negligible. Given the available data heterogeneity, exhaustive volume and the
need for its geo-referenced processing, it is practically very difficult to ensure its analysis by
modelising and resorting to manual data entry methods only. The information geo-referenced
processing is a means to validate and process it.
The information technology context at the project start (2004) was characterised by the growing
strength of DBMS (office automation), thus bringing them closer to the real DBMS. This trend
should not, therefore, be neglected to avoid being rapidly overtaken by technological evolution
and make it then possible for the newly adopted software to migrate to other more performing
storage media. For such reason, ACCESS was the right choice, and whose most recent version
has interesting functionalities.
In its 2000 version, ACCESS has characteristics that allow it to manage databases whose
volume is fairly important (up to 2 Go) in a network environment and even intranet.
- Replication allows for a central database update by regional databases. The data
update by the country teams or the IAS project team is made with the help of a
mechanism which synchronizes the content of all databases and maintains data
coherence.
- Concurrent data access in a multi-user environment
- An enhanced data securisation with the possibility of creating several groups with
separate authorisations and access rights.
- Easy migration possibility to other more important systems such as SQL/SERVER
by means of a simple utility programme delivered with the product.
ACCESS was then chosen because the processing nature and the data volume managed by
the IAS project do not require a more important DBMS. ACCESS is a component of OFFICE
management system and largely used in administrations. The three country teams have
sufficient control of it to operate and administer the database it has generated. The selection of
the other IAS information management software was made on the same grounds.
The selected IAS information management applications are:
- DBMS: ACCESS is selected for its use and control in the three countries, and its GIS
interface. In addition, the 2000 version allows for an easy migration to SQL-SERVER, as
planned by Niger whose WRI database evolved from Dbase III to ACCESS, about a year now.
- SIG software: ARCVIEW was selected for easy use, power, perfect compatibility with
ACCESS and fairly general use in the water resources field. Endowed with a strong
development language, it allows for the writing of customised utility programmes which are
required by GIS links-mathematical models. The software is used in the water resources
administration in the three countries participating in the project. The GIS ensuring the DB WRI
graphic interface (of Niger) is Atlas GIS. The needs for geo-referenced cartographic documents
oss
33
highlighted the limits of the tool. Training sessions on ArcView are now in progress at the Water
Resource Department (Niger) to get the WRI Base users acquainted with this tool, with the aim
of migrating from Atlas GIS to ArcView.
- SPATIAL ANALYST extension under ArcView, aquired for carrying out interpolation
and elaboration operations of iso-value maps.
- Extension of IMAGE ANALYSIS under ArcView, for processing of scanned maps and
their digitisation.
With the help of these tools, the IAS information system is a performing data processing and
management system. It lives on for several years on the basis of an exhaustive inventory of the
processing procedures and the selected organisational mode.
3.1- IASIS general architecture
One of the characteristics of the adopted approach for establishing an IAS common database is
the separation between data structure and data processing. Put differently, to obtain an open
and scalable information system, one should first forget about the processing procedures, which
are subject to changes. The stress should then be put on the most stable data part by
accurately understanding:
- Information
sets
(entities).
- The nature of the existing links between these sets.
- The management guidelines associated with these entities.
Such approach allows for designing the closest possible representation of the perceived reality.
It aims at producing a Data Conceptual Model (DCM) which synthesises the entities and the
relations with the help of a formalism derived from the following planned rules:
- A borehole can pick up 1 or many aquifers.
- A borehole at a given date provides a given yield.
- A borehole can serve many users.
- A user can be supplied by many boreholes.
- A borehole has a grid number within a space gridding.
The identification of relations between the different elements of the data model requires the
greatest attention so that the applications deriving from it can meet the needs of the expected
information.
The separation between data and processing is also reflected in establishing two distinct
physical files:
· `SAI_DATA.MDB': data-only tables.
· And SISAI.MDB': programmes with interface and processing modules.
This structure offers the following advantages:
· The possibility of use in a multi-user environment: `SAI_DATA.MDB' on a server and
`SISAI.MDB' on a workstation.
· A better system stability to guarantee openness and evolutivity.
oss
34
3.2- Database description
On the basis of a relational database and considering the need to have a database to design a
hydrogeological model and stimulate the operation of the lullemeden aquifer system, the
database design is done with a structure where boreholes are a major key to access
information. The general database schema is designed in several interrelated `tables' by
univocal and multiple relations to process specific information. (Piezometry, rainfall,
implementation...) A set of requests was designed to answer specific questions on the spatio-
temporal distribution of information, in view of responding to a given application (ex: operation in
a country from a water table during a certain period).
Forms have been used to enter the relevant information in the common DB in a format that
allows for its adequate processing. These forms are also used to add or check information.
These forms are required for harmonising information with different stored and processed
origins. By referring to the options adopted by the representatives of the countries during the
two workshops dedicated to the IAS common information system, it was convened that the IAS
Database covered the following five thematic domains:
Les eaux souterraines ;
groundwater resources
Surface water resources (and hydraulic infrastructures)
Climatology
Administrative units
Groundwater resources users
The underground water field includes the data which describe:
· Hydraulic infrastructure implemented in the basin.
· Aquifer characteristics (name, identifier, area, direction, transmissivity, permeability,
storage coefficient, and so on).
· Measured piezometric data.
· Aquifer
withdrawals.
· Recorded hydrochemical data.
· Completed
isotope
analyses
· Hydrodynamic
parameters
· Zone geological information
· Geophysical
data
The surface water field includes the following data which describe:
· Hydraulic infrastructure (dams) implemented in the basin.
· Description of the aquifer watershed (name, identifier, area drainage density, runoff
coefficient, slope)
· Water
streams.
oss
35
· Lakes.
· List of hydrometric stations.
· Solid
and
liquid
flows.
· Recorded hydrochemical data.
· Completed
isotope
analyses.
The climatology field includes the data which describe:
· Climatological
stations.
· Rainfall.
· Temperatures
· Evapotranspiration
The administrative units field includes data which describe:
· Administrative
subdivisions.
· Growth rate by period.
· Localities
The water users field includes data relating to:
· Populations
· Irrigated
areas.
· Industrial
zones.
· Domestic drinking water consumption.
· Agricultural consumption (Irrigation and livestock).
· Industrial
consumption
Thus, an exhaustive list of the different entities, which should appear in the information system,
was designed in collaboration with the country teams. This list takes into consideration:
- Immediate needs for the model.
- Information
evolution
possibilities.
- Establishment of links between GIS and the database for data transfer and result
restitution.
3.2.1- DB Schema
The database schema is a conceptual model of data (CMD) during the design phase. This
schema shows the central role of the `points' table, which is linked to the identification table
(country, hydrodynamic aspects, works type, Admin, etc.) and variable tables (geology, quality,
piezometry, exploitation, Aquifers, usages, and so on). The relations which link the `points' table
to the other tables can be univocal (1 to 1) or multiple (1 to many).
oss
36
Figure 7: IAS Data base architecture
Figure
6:
Basic
data
schema
The detailed structure of tables is provided in appendix 1
3.2.2- Relationel model
The relational model is based on the principle that the DBMS is structured on a set of `tables',
each one of which includes a set of `fields', and that the whole set is run by defined relations
without any confusion or ambiguity. The accomplishment of the relational model is a phase
which paves the way for implementing a CDM on SGBD. According to the nature of relations,
and on the basis of the cardinalities originating from the management guidelines, transit
procedures are applied (OSS 2003). The relational model is tested, in each table and for the set
of tables, in view of defining the different relations between the `field' and the tables enabling
combination and data processing.
The nature of relations linking the two entities can be summed up as follows:
oss
37
Case n°1: relation « 1-1 » to « 0-n »
Region
admin.
Point
d'
1-1
0-n
Point_Id
Code_region
Name
Name
The relation shows the fact that administrative regions have zero or many boreholes.
Consequently, a borehole forcibly belongs to one administrative region.
Cas n°2: Relation « 0-n » ŕ « 1-n »
Borehole
User
Uses
1-n
0-n
Point_Id
Id_user
Name
Name
Between the `Borehole' and `User' entities, the link can be formulated as follows:
The same borehole can be supplied by one or many boreholes. As for the user, he can be
supplied by one or many boreholes.
Case n°3: Relation « 0-n » ŕ « 0-n »
Borehole
Aquifer
captures
0-n
0-n
Borehole_Id
Id_Aquifer
Name
Prof_start
Name
Prof_end
Here the relation `captures' itself includes attributes or properties.
The rules which govern a DBMS meet the following requirements:
-
1. All the entities become tables and their attributes fields.
-
2. For the associations of the type `1-n', the identifier of the major entity migrates to the
secondary entity.
If we take the example illustrating case n°1, the transition to a relational model leads to
establishing two tables: `borehole' and `Region Admin'. The `borehole' table must include a
supplementary field i.e. `code_region' in order to establish the relation between the two tables.
oss
38
3. The associations such as `1-n', `1-n' (case n°2) are processed as follows:
Apply rule 1
Set up a third table including as an attribute the keys of the two other tables.
The example of the case number 3 shows that in addition to the setting up of tables `water point'
and `users', a third table `use' including the identifiers of the first two is is set.
4. The association bringing in information (case number 3) is processed the following way:
The associations derive from the tables.
For the keys, apply the previous rules.
The result is identical to case number n°2, except that the resulting intermediary table includes
the attributes `prof_deb' and `prof_fin' in addition to the identifier.
3.2.3- Tables
In this type of database organisation, the tables are grouped according to specific similarities
(piezometry, exploitation, rainfall, and so on). They are the means to bring together the
countries' data under one section to ensure critical analysis, harmonisation and use or
exchange, through the established links. The tables are basic entities for data updating and
processing. They must respond to specific formats in which data and the searched aspects can
be displayed.
The IAS common database tables consist of two parts:
- An identification part which includes data allocation to a geographical origin or an
aquifer level (country, administration, CI or CT...).
- A variable part which allows one to assess the timely values of the considered
variable (operation, piezometry...) in space and time.
The combination of certain fields or columns of two or many tables makes it possible to extract a
new table to refer to these common keys. The following table provides the main hydrogeological
tables of the IAS common DB.
Tableau 2: List of IASIS_DATA tables
Name
Significance
Type
Admin
First-level administrative unit (department, province) of some
Attached
significance for the distribution of different thematic variables
(population, livestock, boreholes, operation...)
Inflow
Includes the supply values in m3/s by grid. It completes the
Attached
`operation' table for computing flow by grid.
Aquifer
Natural entity (aquifer, groundwater Bering) delimited in space and
Attached
according to hydrogeological criteria. This is an evaluation and
resource management unit.
Topographic
Geographical reference of spatial localisation corresponding to a
Attached
map
sheet in delimiting the map, on which the inventoried borehole is
located according to its geographic coordinates. The identifier of this
oss
39
entity consists of the scale and the map number.
Config
Table including the application configuration parameters
Local
GIS layers
List of attributes of GIS layers used by the application
Local
States
Different states of a borehole (operated, non-operated).
Attached
exp_tmp
TTemporary table used for Excel data import
Local
Operation
Withdrawals history. The access key is made up of the borehole
Attached
identifier followed by the measurement date.
Hydrodynamics History of borehole hydrodynamic parameters
Attached
Geology
Geological description of the formations tapped by a borehole
Attached
Gridding
Model grid attributes
Attached
Objet_works
Borehole object at the realisation time (reconnaissance, operation...) Attached
Country
List of countries which share the SAI aquifer system
Attached
Piezometry
History of piezometric levels. The access key is made up of the
Attached
borehole identifier followed by the measurement date.
Points
Goundwater catchment works which can be a borehole, a well, a
conter-well, a spring, a piezometer.
Attached
Quality
Records of chemical analysis results. The access key is made up of Attached
the borehole identifier followed by the measurement date.
Tmp_Measure
Temporary table used by the form accompanying the flow
Local
ments
measurements.
Tmp_Piezo
Temporary table used by the form accompanying the level
Local
measurement.
Types_works
List of works type (borehole, well, spring...)
Attached
Uses
List of possible borehole uses (domestic supply, irrigation,
Attached
tourism,...)
3.2.3- Requests
Requests constitute a stage in the data processing which allows the generation of new tables
with data processed or formatted on the basis of two or many tables. They are divided into two
categories:
- System requests which are requests used by the application, either by other
requests or by modules or forms. They should not, then, in any case be deleted or
modified
- Information requests which translate the spatio-temporal distribution of the various
variables
By combining data with requests, one can extract information which would be difficult to obtain
by manual processing. Similarly, it is easier to represent information in a graphic or geo-
referenced way for correlation or comparison purposes. Requests are answers to elementary
questions on general data or parts of it. Saving request results facilitates their use in new
requests or representations.
oss
40
Table 2 gives examples of requests which were made in the framework of the IAS data
processing to answer certain questions relating to operation and piezometry.
Tableau 3: list of requests
Name
Nature
Description
Verif_history operation horizontal
Withdrawals by borehole and year for a given aquifer
Depth statistics
Minimal, average, and maximum borehole depth by
aquifer
Sum of withdrawals by country
Total withdrawals by country for a given year
Sum of withdrawals by country in 1970
Withdrawals by model grid in 1970 (reference year)
Total withdrawals by administrative unit and
Withdrawals two-way frequency table by
year
administrative unit and year.
Total annual withdrawals by administrative unit
Table providing for a given year withdrawals and
borehole number by aquifer.
Withdrawals by works type and aquifer
Table providing, by aquifer and by given year, the
withdrawals distributed by borehole type.
Withdrawals by administratie unit and works
Table providing, by administrative unit and for a given
type
year, the withdrawals distributed by water point type
Points with coordinates
List of water points with coordinates
Points without operation
List of water points with an operation history
Points with at least two piezo measurements
List of water points with at least two level
measurements
The longest piezometric series
Table by administrative unit providing the number of
points with at least two level measurements, and a
year interval between the measurements.
pm5_observ
System List of water points and their piezometry. Used for
PM5
pm5 boreholes
System List of water points with an aquifer code, coordinates
and number of level measurements. Used by PM5
Piezometers by cell
Piezometers list of by PM5 grid. Extracts the columns:
aquifer, line, column and number of water points
piezo distinct
System List of piezometers (water points with at least a level
measurement)
Number of points by aquifer
Table providing the number of water points by aquifer
Number of points with operation
Table providing, by administrative unit, the number of
water points with a withdrawal history
Withdrawals history
Two-way frequency table of withdrawals by water
point over the period (1956- current year)
System List of PM5 grid with the sum of annual withdrawals.
Records of withdrawals by cell
Used for the preparation of PM5 files
records of withdrawals by aquifer
Two-way frequency table of withdrawals by aquifer for
each year. Used for the period (1965-current year)
Piezometry history
Two-way frequency table providing the piezometry list
by aquifer with the level value for the period (1959-
current year)
Two-way frequency table of the levels by water point
Piezometric level records
on the period (1959-current year)
oss
41
Requests (follows)
Nom
Nature
Description
Operation history by grid
System Two-way frequency table providing year, number of
PM5 layer, grid (line and column). Used for PM5
preparation
NP Altitude history
Two-way frequency table of the piezometric altitudes
by water point for the period (1959-current year)
histo_Withdrawals
System List of water points grouped by aquifer with
coordinates and the annual withdrawals value. Used
at the time of flow measurements entry.
histo_Withdrawals_by_aquifer
System Same with preceding request, but the user must enter
the aquifer system. The list concerns the given aquifer
only. Used for the entry of a set of flow measurements
histo_Piezo
System List of water points grouped by aquifer with
coordinates and the annual value level. Used at the
time of entry of a set of level measurements
histo_Piezo_by_water table
System Ibid, but the list concerns the aquifer code provided by
the user. Used at the time of entry of a set of level
measurements
Operation distinct
System List of water points with at least one withdrawal
measure
operation without_coord
List of water points with at least two withdrawal
measurements
Withdrawals evolution by administrative unit
Two-way frequency table providing withdrawals by
and aquifer.
administrative unit for the period (1956-current year)
two piezo measurements
Two-way frequency table providing water points with
the number of measurements by period (before and
after 1990)
aquifer_piezo
List of water points with at least a piezometric
measure with an aquifer code and measure year
aquifer_operation
List of water points with at least a withdrawal
measurement with an aquifer code and measurement
year
supply by grid
System Two-way frequency table providing the aquifer, grid
(line and column) and the supply value. Used at the
time of the PM5 files preparation.
field information rate
Table showing the information rate of the most
important fields of the `points' table
The requests whose nature is `system' are requests used for the application, either by other
requests, or by modules or forms. They should not, therefore, be deleted or modified in any
case.
3.2.4- Forms
Forms are used to harmonise the data formatting to be included in the database. They are
elaborated according to formats which facilitate entry, data processing and the display of results
with the aim of securing its validation without any error risk. The prior docking of field formats for
the introduction of data and the formatting of the various fields offers a fairly complete graphic
vision of the whole data entry process and information processing.
Forms should not under any circumstance be modified or deleted. They constitute the formal
aspect of data or information formatting design, thus allowing data sorting and formatting.
oss
42
Tableau 4: List of forms
Name Description
Welcome
Welcome screen which appears at the opening of the application.
DB_SgIG Modal
Main form connecting DB, GIS and PM5. It mainly allocates a grid number to
the water point.
Layer control
A form allowing the display and the operation of the parameters relevant to the
cartographic display in the `Main' form.
General data
A form meant to display and modify the information set concerning a water
point.
Operation chart
Meant to display the chart of a set of samples. Referred to as the `General
Data' form.
NS chart
Meant to display the chart of a set of static levels. Referred to as the `General
data' form.
Piezometric graph
Meant to display the chart of a set of piezometric levels. Referred to as
`General data' form
Import_flow_without
A form allowing the choice of an Excel file containing flows and importing them
interpolation
to DB.
Import_levels
A form allowing the choice of an Excel file including levels and importing them
to DB.
Measures_of yield
Display, modification and creation of a run of extracted flows.
Piezo_measures
Display, modification and creation of a run of levels.
parm_gridding
A form meant to enter the parameters and create a PM5 gridding. Referred to
as the `DB GIS Model' form.
Pre-model
Used for the preparation of the necessary files for the PM5 model (for the
permanent and the transitory)
Main
An explorer allowing the display of the DB contents. In addition to the display
in list view mode, it allows the cartographic display without exiting the
ACCESS environment.
Recharge
A form for entering the recharge values on a map. These values are stored in
the DB and used at the time of PM5 files preparation.
Search by Noclas
Dialog box allowing the selection of a water point with its own number. If a
selection is made, the `General data' form displays the data of that point.
Piezometric sub-form
Sub-form attached to the `General data' form allowing the display of the history
of current water points levels.
P run_ subform
Sub-form dependent on `Piezo Measurements'.
D run_ subform
Sub-form dependent on `Flow measures'.
Exploit sub-form
Sub-form attached to the `General data' form allowing the display of the history
of the current water point levels.
Hydro sub-form
Sub-form attached to the `General data' form allowing the display of
hydrodynamic data of the current water point.
Quality sub-form
Quality data sub-form
oss
43
3.2- Interface description
The application has a general menu which calls on the available functions:
* Data updating: entry, modification of relevant water point information and
associated
histories
* Display: surfing through the database contents and GIS
* Links with PM5: access to the pre-model processing functions (entry file preparation
and their transfer to PM5).
The menu looks like the following:
3.2.1- Data updating
This option is meant to give access to the functions of data entry and updating: integrating new
data, correcting existing data... It concerns the set of basic water point information:
- General
features:
identification,
localisation, hydraulic features
- File history of annual water point samples.
- File history of water point levels.
- File history of water quality data.
Three submenus are available for this option:
3.2.1.1- Water point features
This option calls on a form which clusters the set of information on a given water point.
Tableau 5: Form for water point feature entry
oss
44
This form consists of a header area with tabs with each corresponding to an information
category. The header area is used to:
- Select the water point for which we wish to display data or modify them.
- Enter the code and the name of the water point to be created.
a/ In the case of display/modification, the pink-coloured text area allows the display of the water
point number on which the anchor, which browses the table `points', is set. The keys located at
the bottom of the form allow for moving from one record to another according to the ascending
order of water point identification numbers.
If the user wishes to have access to a water point whose identification number he knows, he just
clicks on the key which displays a dialogue box allowing the selection of the water point
identification number (fig .8)
Figure 8: Water point search dialog box
The scrolling list displays all the numbers and names of the existing water points in the
database to select one of them. We can also type one or many characters that make up the
water point key. Each time a character is provided, the system searches and sets on the key
which starts with the typed character(s).
In order to validate the selection and set the selected water point, click on OK. Otherwise, click
on the `Cancel' key. In this case, the cursor remains on the position preceding the display of the
dialog box.
b/ In the case of the creation of a new point, the procedure is as follows:
- Click on the key to set it on creation mode. At this moment, the text field is
empty.
- Type the new water point code to be integrated.
- Complete the remaining information concerning this water point.
oss
45
Data save is automatic. There is no need to look for a key or a menu option to save the
modifications. Nevertheless, to cancel a modification, click on the `Esc' key.
3.2.1.1.1- The `characteristics 'tab
It consists of basic information such as water point identification or localisation.
Work types: Scrolling list which provides the content of the `Work_types' table. i.e. the following
values:
If one wants to include an inexistent value (new value), one should add it to the `types_works'
table. The scrolling list will automatically propose it at the next activation.
Country: The scrolling list displays the country where the water point is located (Niger, Mali or
Nigeria). Similarly, if one wants to incorporate another country (in case the IAS project is
extended to other countries), just add it to the `Country' table.
Administrative unit: The scrolling list provides the list of departments or provinces located in the
IAS zone. Only the administrative units belonging to the selected countries are shown
(preceding field).
The list of available administrative units is the following: (`Admin'table)
oss
46
Ma = Mali
Ng = Nigeria
Ni = Niger
Location: locality or place where the water point is located. It is a free text.
Realisation year: Year of realisation of the water point on the basis of four positions. A control is
being entered to validate the value. The validity condition is the following:
«
Year 1900 and current year »
Altitude: water point altitude in meters.
Drilled depth: drilled depth of the works in meters.
Equipped: tick the box to show if the water point is equipped or not.
Equipped depth: refers to the equipped depth in meters, if the water point is equipped
(preceding field).
Aquifer: a scrolling list allows for the selection of the aquifer captured by the water point. The
possible values derive from the `Aquifer table' whose content is the following (`Name' column)
Status: water point status. The possible values of the scrolling list are extracted from the `Status'
table
The list can be extended by the addition of other items to the `Status' table. This operation,
however, should be done by the DB administrator only.
Exploitable maximum quantity: maximum exploitable water point flow in l/s.
Artesian: box to tick showing whether a water point is artesian or not.
Usage: scrolling list allowing the selection of the category of water point users. The values are
extracted from the `Usages' table'.
oss
47
SL: Static level in meters at the time of water point creation.
Geological formation: name of the captured formation by the water point. In this version, it
consists of a free text.
Remarks: miscellaneous comments on the water point. The maximum length is 60 letters.
Longitude: water point longitude in decimal points. The decimal part should have at least 5
numbers.
Latitude: water point latitude in decimal points. The decimal part should have at least 5
numbers.
X_Lambert: X in meters, in the Niger zone II Lambert system.
Y_Lambert: Y in meters, in the Niger zone II Lambert system.
The Lambert geographic conversion procedure is described in the chapter on SIG.
3.2.1.1.2- `File history' tab
This tab is devoted to the display, modification or creation of set of annual samples related to a
water point. It is a sub-form made up of three columns.
Figure 9: Withdrawal data entry form
Description des colonnes :
o Année : année oů le prélčvement est observé. Un contrôle est effectué ŕ l'aide
de la condition « année comprise entre l'année de réalisation du point d'eau
et l'année courante ».
oss
48
o Vol.
Annuel : prélčvement total annuel exprimé en m3.
o Origine_Info : source de l'information
Description of columns: · Year: year when the withdrawal was observed. A control is made
thanks to the condition: `year included between the year of the
water point realisation and the current year'.
· Annual
vol.: total annual withdrawal in m3.
· Information
origin: Information source.
One can display the chart showing the set by clicking on the Graph key. This leads to the
display of the following window:
Figure 10: Operation graph
By double clicking on the graph
, it is possible to modify the latter's attributes: graph
type, titles, colours, and so on.
Closing the graph window is done by clicking on the CLOSE key.
3.2.1.1.3- `Level history' tab
This tab is used for the display, the modification or the creation of a set of levels attached to the
current water point (the one which is displayed in the header). It is also a sub-form which
includes the following columns:
· Year of measurement (YM): year of measurement
oss
49
· Static level (SL): Static level in meters (negative sign if artesian)
*P
Alt : piezometric altitude in meters. This column is calculated either with the help
of the water point Z and NS, or directly entered.
* Information Origin: source of information
Figure 11: Level entry form
It is possible display the PL graphics (piezometric levels) and SL (static levels) by clicking on the
keys `NP Graph' or `SL Graph'.
3.2.1.1.4- `Quality history file' tab
This page contains quality data.
Figure 12: Quality data entry form
oss
50
This is also a sub-form containing the following columns:
Date :
Analysis date
pH:
pH
values
EC:
Electrical conductivity (Us/cm) at 250° c
Temp:
Temperature in C.
Ca:
Calcium
in
mg/l
Mg:
Magnesium
mg/l
K: Potassium
mg/l
Fe++:
Iron
Mn:
Manganese
mg/l
Na:
Sodium
mg/l
HCO32: Bicarbonates
CO3:
Carbonates
CI:
Chlorine
NO3:
Nitrates
in
mg/l
SO4:
Sulphate in mg/l
14C:
Carbon 14 (pmc)
13C:
Carbon 13 (pmc)
File-Name-source: file name from which data are imported.
3.2.1.2- Excel import
This option allows the automatic import of available data into Excel format. This concerns the
withdrawal and level data.
For each of the two cases, an Excel spreadsheet (model document) is developed. These
models should be observed so that the system can read the data.
oss
51
3.2.1.2.1- Import of abstraction time series files
By selecting the `Withdrawal history file' option, the following form (Fig.13) prompts:
Figure 13: Excel data import form
By clicking on the `Start' key, data importing from the selected file starts. A gauge shows the
evolution rate of the procedure which terminates with an end of processing message.
The Excel document must absolutely have the following format:
Tableau 6: Type of Excel model document for abstractions
Code_
Code_ Code_
Nom_
Pays Noclas Nom
Type Aquif Long_dec Lat_dec Admin
19551956 .... 2004
Country code: `Ma', `Ni' or `Ng'
Noclas: water point identification number
Name: water point name
Code_Type: water point type code (see table `Works _Types)
Aquif code: aquifer code (see table `aquifer')
oss
52
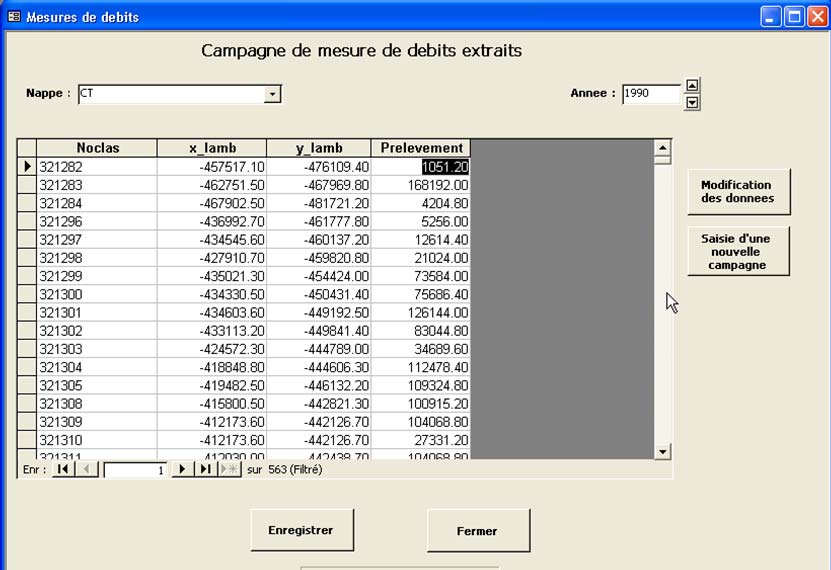
Dec long: longitude in decimal degrees (5 decimal numbers at least)
Dec lat: latitude in decimal degrees (5 decimal numbers at least)
Admin name: administrative unit
The following columns should include the withdrawal values, the column headers being years of
measurement.
The import procedure follows this rule:
· If the water point exists in the DB, its data are replaced by the ones found in the
Excel document (`points' and `tables')
· Otherwise, a new water point is created in the `points' table with the attributes read
in the Excel file. The file history is added to the `operation' table.
3.2.1.2.2- Level history import
The procedure relating to the import of the level history file is similar to the one for the
abstractions. The Excel file format is also similar to the withdrawals ones.
3.2.1.3- Measurement campaigns
It is a functionality (Fig.14) developed in the framework of the `Djeffara1' project which will
facilitate periodic data updating without going through the Excel files. This option is particularly
useful when a measurement network is set up. Flows (withdrawals) and levels are submitted to
the same processing.
Figure 14: Display and entry of a flow measurement campaign
oss
53
By selecting the water table, the application extracts the set of water points capturing the
groundwater, with coordinates and withdrawal values for the first year of available measures in
the DB.
The user can extract data for the set of available years:
· Either by using the Spin key with which can increment or decrement the year.
· Or by typing the year in the text zone.
The `Data Modification' key a allows access to the withdrawal data to
correct them.
The cursor is set on the withdrawal values so that it can ultimately modify them. When the
corrections are completed, the user can:
· save the modifications by clicking on the `Save' key.
· cancel them by clicking on the `Close' key.
It is possible to enter a new campaign (New Year) by clicking on the `Entry of new campaign' key
oss
54
In this case, the application requests the user to enter the year for which he wishes to introduce
the flows.
Note that the application displays a value by default in the text zone. This value is equal to the
current year incremented to 1.
3.2.2- Data display
Data display is secured in the IAS common database, thanks to the explorer, either by tabular
mode, or cartographic mode.
3.2.2.1- The explorer
It allows for water point data display and search, according to various criteria. Two display
modes are possible:
3.2.2.1.1- Tabular mode
The displayed data are digital values presented in the form of a listview (Fig.15)
Figure 15: fenętre d'exploration (mode tabulaire)
oss
55
One can choose to sort data:
· by country and administrative unit
· by aquifer and water point type
This is done by scrolling the choice list of the browsing key to select one of the two criteria.
The by-default display is done by administrative unit.
3.2.2.1.2- Cartographic mode
In this mode, the listview is replaced by a cartographic window which displays the GIS ground
layers on which the water points are superposed. The data representation of the latter is done
from the `points' table; that is to say, the potential modifications of the water point coordinates
automatically affect the window card.
Figure 16: Exploration window (cartographic mode)
oss
56
The toolbar allows for performing the following basic GIS software tasks:
Customized zoom (rectangle with the help of the mouse)
1.5 highlighted zoom. Select the key and click once on the card window.
0.5 highlighted zoom. Select the key and click once on the card window.
Panning (moving and re-centring on a zone). Works when a zoom-in has been made
Full extension: 100% zoom (display of all the layers in the card window)
Water point identification. By clicking on a water point, the `General Data' form is loaded
with information on the selected water point.
Control of layers (change the layer display attributes). By clicking on this key, the
following form is displayed:
Figure 17: Dialog box for layer control
The `Visible' box to tick allows for displaying the selected layer or not.
The `Label' box to tick is used to display or not the labels concerning the selected layer. The
displayed text depends on the configuration (see table `GIS layers'). To change the text which
appears as a label, this table should be opened and the `chp-label' value should be modified.
oss
57
Caution: The field should first be available in the allotted table linked to the layer.
The `colour' key allows for modifying the display colour of the selected layer. By clicking on the
key, the dialog box of colour choice prompts and one can choose the display colour of the
selected layer.
Important: These changes are valid only during the session and are not then saved.
3.2.2.2- ArcView Project
The key allows for loading ArcView and the main project containing the set of layers in
order to possibly modify them or do layouts.
3.2.3- Links with the PM5 simulation model
This option is used to perform the data preparation tasks for the PM5 hydro-geological
simulation model:
- Allocating a grid number to all the water points inside the zone.
- Recharge
entry.
- Creation of PM5 documents for keying and simulations.
3.2.3.1- DB GIS Model interface
The advantage of resorting to specific databases in the case of aquifer systems shared by two
or more countries is to use this tool as an elementary means to harmonise and homogenise
data. Through the links established between this database and the models, the required data for
model setting and operation are directly channelled from the DB to the model. In addition, the
model processing results can be directly restored to the DB without any risk of alteration or
distortion. On the other hand, the links between the DB and GIS make it possible to recover
data from the database as well as the model results to secure exits and graphic or cartographic
representations. The elaboration of these links is the shared task of the IASIS computer
oss
58
manager and the aquifer system modelling engineer. These links meet the requirements of the
different functionalities in both digital systems and facilitate establishing an integrated data
processing and management system, leading to the development of decision aid products for
aquifer system managers.
3.2.3.1.1- Gridding generation
The module (Fig.18) is used to make the following processing operations:
- generate a gridding.
- allot a gridding number to the water point.
- check withdrawals per gridding.
Figure 18: Form for generating gridding and `points'-`model' link
Procedure
When we select an aquifer, the programme displays the corresponding GIS layer, followed by
the set of points belonging to the aquifer.
Secondly, we display the model gridding. We can open an existent gridding (search for it in the
\lullemeden\GIS\ document) or create a new one.
oss
59
Ouvrir un maillage existant
Créer un nouveau maillage
enlever le maillage de la fenętre carte
Renseigner le champ n° de maille la table
points (tous les points situés dans l'aquifčre
choisi).
If we click on the `New gridding' option, the key is activated. This key is used to load a dialog
box in order to enter the new parameters for the gridding to be created.
Figure 19: Form for entering the parameters of a new gridding
Significance of the form fields
X origin:
X of the origin of gridding in the Lambert south coordinate system.
Y origin:
Y of the origin of gridding in the Lambert south coordinate system.
X nb of
griddings:
Gridding number by X axes (lines)
Y nb of
oss
60
griddings:
Gridding number by Y axes (columns)
Angle:
Gridding orientation angle
Size:
Gridding size in meters
Gridding limits:
Polygon-type extension if we want to cut off the gridding (optional).
SHP file:
SHP file access path and name which will be developed (`grd_map' by
default). We can, however, provide another name). Note that the name
used in the programmes is `gridding'.
We can enter the file access path and name in the text zone or click on the key
which
displays the file saving dialog box.
The `Start' key triggers the gridding generation module execution.
3.2.3.1.2- Allocation of gridding numbers
This functionality is used to update the `points' table by entering information in the `grid' column.
This is done by clicking on the key `Updating grid numbers '.
A geographical processing is therefore launched which affects at each water point the grid
number in which it is located.
3.2.3.1.3- Checking tasks
In addition to the usual functionalities of the GIS software (Zoom, Pan,), the toolbar has
additional keys whose task is to help the user with data control during the model keying stage.
oss
61
The key activates the grid selection on the drawing. By clicking on a grid, its colour
changes.
Its grid number and the corresponding PM5 number are displayed at the same time as the water
point list located in the grid:
Grid sequential number. This is the value that
identifies the grid.
List of water points belonging to the selected grid.
By double-clicking on a point, the `General Data'
prompts and one can consult or edit the data.
One can also select a grid if one knows its PM5 number by clicking on the key.
The following dialog box prompts:
By clicking on `OK', one obtains the same result as a selection on the card window (grid colour
change and list of the included points).
3.2.3.2- Recharge entry
The `Recharge Entry' option launches the following form (Fig. 20):
oss
62
Figure 20: Form for recharge graphic entry
At the launch of the form, the zone hydrographical stream is displayed.
Procedure:
- Choose an aquifer. At this moment, the corresponding layer is loaded then added to the
card window.
- Open
the
gridding.
- Enter the values:
- By point (one single grid).
- By line (set of cell intersecting with the line).
- By polygon (set of grids touching the polygon).
-
Toolbar
Displays the selected cell number (PM5 number)
Creates a point. The cell is highlighted. To enter its recharge value, click right. A dialog
box prompts.
oss
63
Enter the recharge value in the text zone and click on `OK' to validate or `cancel'.
This value is allocated to the grid that was clicked. The point is also added to the GIS layer.
Creates a line by moving the mouse and clicking to add a vertex. To end, double click.
At this moment, all the grids which intersect with this line are highlighted (magenta colour)
Draws a polygon: each click adds a vertex. To end, double click.
Allows for selecting a set of points by drawing a polygon. Once the polygon is drawn with
the help of some vertexes, all the recharge points are highlighted (in magenta.)
Allows for selecting a recharge point. This point is displayed in magenta.
In performing one of these selections, two keys are displayed in the right part of the form:
Displays a dialog box. The text zone contains the old value
that can be modified.
Deletes the point and the corresponding saving in the
`recharge' table.
3.2.3.3- Transfer to PM5
This last option allows for automatically generating the WEL and OBS documents in order to
start PM5 by using the information stored in the DB (Fig. 21).
oss
64
Figure 21: PM5 data transfer form
The form displays the list of water points having at least two-level values, so that they can
ultimately be transferred to the `PMWIN5000_BOR_FILE' file' (This will make it possible to
compare the two observed levels and those quantified by PM5).
Displayed columns
NoClass:
Water point identification number.
Name:
Water point names.
X Lamb:
X Lambert in meters.
Y Lamb:
Y Lambert in meters.
Aquifer:
Aquifer code where the water point is located.
Nobs:
Number of measure levels made on the water point.
By clicking on the key the application launches a request which allows for
listing the model grids and the set of water point flows which they contain.
oss
65
Signification des colonnes affichées :
Année :
Année de la mesure
Couche :
numéro de couche (CT = 1 ; CI = 2)
Ligne :
numéro de ligne de la maille
Colonne :
numéro de colonne de la maille
Débit :
valeur du débit (somme des débits des points d'eau)
Dčs que la liste est affichée, les zones de texte « Année début » et « An fin » sont activées.
Une fois renseignée la période (années début et fin) et en cliquant sur Ok, l'application fait
apparaître la boîte de dialogue d'enregistrement de fichier
Significance of the displayed columns
Year:
Year of measurement
Layer:
Layer number (TC=1; IC=2)
Line:
Grid
line
number
Column:
Grid column number
Flow:
Flow value (sum of water point flows)
oss
66
As soon as the list is displayed, the `Staring year' and `Ending year' text zones are activated.
Once informed about the period (starting and ending years) and by clicking on `OK', the
application shows a file saving dialog box.
The user enters a new file name or selects an existing file (Caution: the one which is going to be
crashed). By clicking on `Open', the application starts to generate a file containing the flow
values by grid. These values constitute the algebraic sum `Recharge-Withdrawal'.
4- CONTENT SYNTHESIS (DB AND GIS)
The project has made it possible to collect, format and homogenise the set of existing IAS
information. In fact, a relational, coherent, and scalable database structure allowing for an easy
data processing was set up at the level of the three countries.
Among the most important benefits of the established system, one can cite:
- A common database for the whole basin: structure, codification, processing procedures.
- The country experts properly master the operational tools, thus facilitating the continuous
system updating and modernising.
- A common geographic reference shared by the three countries: projection system, basic
layers, DEM, ....
For once, the set of information specific to the IAS aquifer is harmonised and shared by the
three administrations managing the basin water resources. This information is accessible in
forms facilitating direct exploitation and is adapted to modelling. This information is thus used to
help with decision making on basin water resource development planning. Its adaptation to
oss
67
mapping at the catchment area scale, as well as the possibilities of its processing for the IAS
aquifer hydrodynamic operation simulation, provides it with an added value in relation to its
status in the three countries' national databases.
4.1- The common database
The IAS common database is the central element of the information system of this
hydrogeological entity. Thus, it is a link in the components of the decision aid system for
consultations between the three countries with a view to securing the best management and
planning of the basin water resources. After describing in detail the structure in the previous
chapter, we shall now deal with the contents, i.e. the set of data collected either by the country
teams or the OSS team.
4.1.1- Water point characteristics
The building up of a common IAS database structure on the `water point' is justified by the
importance and the information diversity to which it is attached. The `water point' in its most
general sense (climatologic station, gauging sites, catchment area or groundwater exploitation)
is an essential key in accessing information in its spatiotemporal reference. Special significance
is given, according to data tables, to the water points related to underground water, given that
the IAS aquifers are the subject matter of a major analysis targeted by hydrogeological risks.
These water points (wells, drillings, boreholes, sources, etc.) are the access point to the
physical and hydraulic knowledge on these aquifers. The other water points specific to the
identification of climate or hydrologic data enable us to better grasp the water exchanges
between the aquifer system and its environment.
The total number of water points collected and included in the `points' table of the IAS common
DB is 17171. This number mainly deals with:
Drillings and wells collected by the three administrations managing basin water resources.
Drillings having served for geological treatment whose major part is gathered in the
countries and the additional part is drawn from the available studies.
Other developed water points, such as oil boreholes, because they provide useful
information to aquifer knowledge like transmissivity, water quality data, data on the
piezometric level of water tables and water points...
The accumulation of such information does not miss reflecting some redundancies resulting
from the diverse data collection sources. This is the price to pay to have all the available data
and useful information in the DB. One of the tasks of information updating, implemented within
the project's framework, is to analyse and process data with the aim of avoiding redundancies
and harmonising the proper presentation formats.
oss
68
Tableau 7: Filling rates of key fields
Informed
%
Informed
%
Field
recordings
Field
recordings
Name
16151
94.06
State
0
0
Type
17171
100
Artesian
17171
100
Aquifer
2671
15.56
Equip.
17171
100
17135
99.79
14898
86.76
Admin
Drilled_depth
Longitude
17170
99.99
Equip_depth
13782
80.26
Latitude
17170
99.99
QEX
13302
77.47
Altitude
7860
45.77
NS
14855
86.51
Usage
12572
73.22
Grid
2609 15.19
Year
5089
29.64
The entry systematisation and data harmonisation meant that several common DB fields were
informed:
Automatically: administrative unit (by GIS), grid...
By request: usage code, country, sce_year
This resulted in duplicating identified water points under different codes while referring to the
same geographical areas. It is only through an extended information analysis that it becomes
possible to identify such duplication and limit the attached errors.
4.1.1.1- Distribution by administrative unit
The geographical information distribution is a basic option which allows its subsequent
identification given that this approach is the one used by the administration to classify water
points and follow up water resources in these aquifers. The choice of the basic administrative
unit is dictated by the country's adopted administrative classification, while bearing in mind the
need for scale harmonisation among countries to avoid providing too many details or lacking
accuracy in the data restitution for the different applications used within the project's framework.
Given the basin size, it was decided to use the department as a basic administrative
subdivision.
Table 4, below, provides the water point numbers, all types included, by administrative unit, for
the three countries.
oss
69
Tableau 8: Water points by administrative unit
Country
Administrative Unit
Number of points
Non-identified
Non-identified
36
Mali
Gao
734
Niger
Agadez
95
Dosso
3635
Maradi
4039
Niamey
4138
Tahoua
3046
Zinder
1148
Nigeria
Katsina
26
Kebbi
95
Sokoto
179
IAS Total
17171
This situation shows only one state of the database at a given date (January 2007). It is
scalable depending on the countries teams' new data contribution. This state is considered as
the culmination of an effort made over a period of more than two years to collect data in these
countries. Such data have been used for elaborating the hydrogeological simulation model.
The number of water points not attached to a given country among the three IAS sharing
countries is relatively reduced in relation to the total number of water points (2%o). It translates
the effort to identify these water points whose number is relatively high. The distribution of these
water points among the three countries should be taken with great care given that the basin
area proper to each country and the significance of aquifers varies from one country to another.
It is not, then, expected that a certain correlation between the number of water points and the
geographical extension of the basin by country exists. Similarly, the three countries are not
expected to have relatively comparable water point density. But it is evident that Niger, where
more than 80% of the IAS basin is located, includes the largest number of identified water points
(93.7%).
Distribution by aquifer
Water point aquifer codes were allocated by OSS in the presence of experts from the countries
because some work was done to homogenise the local litho-stratigraphic formations. This field
is essential for water points with a withdrawal history.
The following table shows that about 85% of the basin water points are not attached to a given
aquifer. This is because the entry of water points included in the database was systematically
done (water resource card) on the basis of sources not taking into account the key significance
of this specification. For modelling purposes, the allocation of water points by aquifer was done
on the basis of geographical location, intersecting formations and the reached depth.
oss
70
Tableau 9: Water point by aquifer
Aquifer Code
Aquifer name
Number of points
CI
Continental Intercalaire
275
CT
Continental Terminal
2396
Unknown
14500
IAS Total
17171
4.1.1.2- Distribution by type
The water point type is a characteristic essentially used for purely statistical purposes to qualify
the hydraulic infrastructure of the IAS groundwater mobilisation. In this case, we note the
absence of springs which are natural appearances in underground water. This can be explained
by the confined aquifer feature and the reduced role of tectonic accidents in the emergence of
water of the basin different aquifers.
The predominance of surface wells (60.1%) in the number of identified points (Table 8) is due to
the fact that they constitute the hydraulic infrastructure that is best adapted to the basin's
operating conditions. In fact, since drillings are more costly and less mastered as a water
mobilization technique in a good part of the basin, their percentage is relatively low (25.3%).
The drilling groups are a device used when it is hard to have a representation of a large number
of drillings and to the extent that these water points are not properly identifiable on the map.
This was the case with drillings in Nigeria where the specific relevant information does not
include the geographical details to locale them. It is for this reason that they were included in the
form of drilling groups linked to the local area whose name they bear (usage destination).
Tableau 10: Water points by type
Point Type
Number of points
Non-identified (14%)
2463
Drilling
4346
Drilling group
12
Piezometer
20
Wells (60.1%)
10330
IAS Total
17171
oss
71
4.3.1.3- Water points with a history
The historical data (series) on piezometry, operation and water chemical quality are basic
information for the setting of the hydrogeological simulation models. It is then important to
identify the water points with some history in relation to these three variables. The historical
background relevant to the hydrodynamic features underlines the hydraulic test frequency of
these water points.
Table 7, below, provides, for each aquifer, the number of points having at least one recording in
each of the tables. If we take the example of piezometry levels, we have:
· 42 water points, whose aquifer code is not available, and which
have at least one level observation.
· 200 water points in CI and 296 in CT, which have at least one
level measurement.
Tableau 11: Number of water points with at least a history
Aquifer
Operation
Piezometry
Hydrodynamics
Quality
Unknown
0
42
2
24
CI
162
200
81 0
CT
629
296
15 0
We note that as far water quality is concerned, none of the 24 water points with measures is
informed by the `aquif _ code' field.
The data in this table show a main gap in the implementation of the IAS common database. In
fact, out of the 17,171 identified water points, only 8% are likely to serve in following up the
historical backgrounds of piezometric levels or the required implementation for levelling the
hydrodynamic simulation in transitory mode. This big gap suggests that the information
collected in this way can only be used for levelling the model in permanent mode. The
quantitative indicators on the operation development or the piezometric decline of the different
aquifer levels are reduced and show that hypotheses referring to variables indirectly related to
water usage (population, livestock, and irrigated areas) are required to trace exploitation
evolution or the piezometric decline over time.
4.3.2- Withdrawals
The withdrawals from the aquifers reserves or operation are a key element of the required
information for operating the hydrogeological simulation model of the IAS dynamic operation.
The relevant data are complex and require an accurate identification of the exploited water
points, type of exploitation (by artesian pressure or pumping), and operation duration (by day,
season, or during the works lifetime). Such identification can only be secured with the help of a
well-structured management, which allots the necessary means for a proper follow-up in order
to make regular or periodic measurements - which is not the case in the three IAS-sharing
countries. In fact, the information relevant to exploitation evaluation in the IAS framework has
never been the subject of a detailed and exhaustive quantitative analysis. It has always been
superficial and partial. The obtained specific data are rudimentary, fragmentary and insufficient
to ensure a satisfactory evaluation. Thus, the common database suffers from specific gaps and
oss
72
requires a better analysis of the existing data in the three countries to deduce information
capable of partially overcoming the flagrant measurement gaps.
The database structure requires that withdrawals are attached to water points. However, the
little available information on this variable is rather provided in a synthetic way (annual volume
by usage sector) and differs from one country to another.
· For Nigeria, the global withdrawals are provided by province and usage (domestic
usage, animal husbandry)
· For Mali, the global withdrawals are given by usage (livestock, nomads, sedentary)
· For Niger, the operation volumes are provided by water point, but it is not necessarily the
instant withdrawal flow. In many cases, the filing numbers as well as the captured
aquifers have not been sufficiently informed to identify the operation unitary flows.
The aim of this processing is to establish an operation history file (1970-2004) by water point on
the basis of the collected information. For such reason, the following approach was adopted:
· Distribute the total withdrawals by water point for Mali and Nigeria, thus supposing that
the `aquifer' and `unite_admin' fields `are informed.
· Allocate an annual withdrawal value to the water points in Niger on the basis of the
operation flow and an average uniform operation duration of 4 hours per day.
The `Operation' table was produced according to the following approach:
· Acquisition of the `Code_Admin' field from the GIS.
· Allocation of the aquifer code (CI or CT) to the water points, according to the field value
`Aquif_CI-CT:
- If
`Quat',
· If the points are inside the intersection CI-CT, the value of CODE_AQUIF=CT
- Otherwise,
· If the holes are in CI, the value of CODE_AQUIF=CI
· Otherwise the value of the CODE_AQUIF=TC
If `Palz' or `BASE' or `Aquitard', the value of the CODE_AQUIF=Null
· Distribution of total withdrawals by water point with the help of an ACCESS request, for
the Nigerian and Malian parties.
· For Niger, we applied the following rule:
- A request calculating the annual withdrawal from the operation rate
on the basis of usage duration of 8 hours per day. This calculation only affected
the water points whose realisation year is known. In the absence of the
unit, we considered that the flow is expressed in litres/seconds.
- Filling up the `operation' table from an `Addition' request after conversion in
m3/year.
After processing, the `operation' table is filled in the manner required by the DB structure
oss
73
4.3.2.1- Withdrawal distribution per aquifer and administrative unit
The request aimed at presenting the withdrawals on the IAS water reserves per country and
aquifer shows an identification gap of some water points which could not be allocated to a given
aquifer level. The withdrawals amounting to 1.55 hm3/year (1.4% of total withdrawals) are
relatively negligible and the indeterminacy of their allocation to one of the three countries does
not seem to alter the significance of the findings especially that this volume was allocated to the
TC aquifers.
On the whole, CI operation (65.31 hm3 /year) in the three countries is only 62% of CT operation
(105 hm3/year). Such observation confirms a greater accessibility of the TC aquifers to
operation than the CI ones, which is in relation with the most extended type of mobilization
works (wells).
The CI water table operation is more extended in Nigeria (57.39 hm3/year) than in the other two
countries. Here, the required groundwater mobilisation works are less deep (drillings of less
than 100 m depth). The same applies to the CT groundwater (Nigeria: 60.21 hm3/year). But in
this case, the Niger operation is equally important (42.68 hm3/year). The IAS operation in Mali is
relatively negligible and needs to be further checked.
The percentages included in Table 8, below, on IAS aquifer operation in the three countries can
be explained by two parameters:
· Greater accessibility of CT aquifers in Niger and CI aquifers in Nigeria, given that the
depth of catchment works is relatively weak.
· Demographic density and various usages (Water supply, irrigation, livestock and
industry) are more developed in Nigeria and Niger.
Tableau 12: Samples per aquifer and administrative unit
Administrative
Aquifer
Country
unit
Vol (hm3/year)
Mali Gao
0.03
Katsina 7.67
Kebbi 19.14
Nigeria
Sokoto 30.58
Total Nigeria
57.39
CI
Dosso 0.57
Niger
Maradi 0.21
Tahoua 7.10
Zinder 0.01
Total Niger
7.89
IC Total
65.31
CT
Inconnu Inconnue
1.55
Mali Gao
0.56
Kebbi 24.17
Nigeria
Sokoto 36.04
Total Nigeria
60.21
Niger
Dosso 29.34
oss
74
Niamey 1.84
Tahoua 11.53
Total Niger
42.68
Total CT
105.0
Total CI+CT (hm3/year) 170.31
We note that some water points totalling up a withdrawal of 1.55 hm3 do not belong to
any administrative unit.
4.3.2.2- Total withdrawals per administrative unit
These are total CI and CT withdrawals per administrative unit in each country. The number of
points providing this volume is equally displayed, as well as the ratio of `withdrawals/number of
points'. This ratio is deduced from withdrawal distribution and the number of water points and
shows a significant variation from one country to another and from one administrative
subdivision to another (Table 11). The ratio values range from 0.01 hm3/year and per point in
Mali, to 0.50 hm3/year and by water point in Nigeria, and to 0.103 hm3/year and by water point in
Niger. These values can be used as checking `standards' for the water point withdrawals in the
three countries insofar as we consider the sample of 781 identified water points representative
of the withdrawals distribution within the IAS.
Tableau 13: Total withdrawals per administrative unit (year 2000)
Withdrawals
Ratio
Country
Administrative Unit
Nb
points
Hm3/year
Mali
Gao
54
0.60
0.01
Sokoto
122
66.61
0.55
Kebbi
86
43.31
0.50
Nigeria
Katsina
26
7.67
0.30
Total Nigeria
234
117.59
0.50
Dosso
343
29.91
0.09
Tahoua
135
18.62
0.14
Niger
Niamey
11
1.84
0.17
Maradi
3
0.21
0.07
Zinder
1
0.01
0.01
Total Niger
493
50.59
0.103
Total IAS (CI+CT))
781
168.78
0.216
As far as Mali is concerned, and given that one administrative subdivision is considered (Gao
with 54 water points), we have no reference enabling us to deduce the spatial variation of this
ratio. We consider the 0.01 hm3/year value per water point as representative of this part of the
basin
In the case of Nigeria, we have three values of this ratio relating to the three administrative
subdivisions (Sokoto, Kebbi and Katsina). These values range from 0.30 to 0.55 hm3/year and
by water point. They provide an average value representative of this portion of the basin, which
is 0.5 hm3/year and by water point.
oss
75
In the case of Niger, the department where the number of water points is relatively weak (one
water point in Zinder) is excluded. For the remaining departments, the ratio varies between 0.07
and 0.17 hm3/year and by water point. The average value is 0.10 hm3/year.
By considering all the departments in the basin in the three countries and the sample of 781
water points, the average operation ratio per water point is 0.22 hm3/year (6.8l/s in a continuous
fictitious flow). It results that the unitary operation per work is the strongest in Nigeria (0.5
hm3/year) and the weakest in Mali (0.01 hm3/year)
4.3.2.3- Withdrawals history per water point
This crossed request is meant to check the withdrawals data:
- Data
availability
period
-
Evolution of values in time
Tableau 14: Operation history per water point (in m3)
Noclas
1956 ...
1988
1999
2000
2001
2002
2003
2004
0ulit Erajoun 219.819 ... 1048.147 3091.056 3226.209 3399.933 3462.902 3429.897 3678.123
321282
...
1051.2
1051.2
1051.2
1051.2
1051.2
1051.2
1051.2
321283
168192 168192
168192
168192
168192 168192 168192
321284
4204.8
4204.8
4204.8
4204.8
4204.8
4204.8
4204.8
321296
...
5256
5256
5256
5256
5256
5256
5256
4.3.2.4- Withdrawals by type of usage
The two-way frequency table provides the volumes in hm3/year by administrative unit and
usage. If the sum of volumes does not correspond to the global IAS volume, it is because the
`code_usage' field is not informed for all the water points. (`points 'table)
Table 11: Withdrawals by administrative unit and usage (year 2000)
Administrative
Country
Urban AEP
Rural AEP
Unused
Irrigation Pastoralism
unit
Dosso
0.67
28.96
0.18
Maradi
0.02
Niger
Niamey
1.28
0.56
Tahoua
1.23
16.87
0.53
Zinder
0.01
Katsina
3.24
4.42
Nigéria
Kebbi
8.56
1.01
Sokoto
11.47
8.19
oss
76
4.3.3- Piezometry
In the absence of a network of piezometric follow up, the information on the levels was collected
from diverse sources:
· Country teams during the workshops.
· Use of existent study documents.
4.3.3.1- Distribution by data origin
The origin of piezometric level information is very important during the data control and
validation stage.
Tableau 15: Distribution of measurement levels by data source
Total per
Source
Mali
Nigeria
Niger
source
Non-informed 6
10
133
149
FAO Project, 1970
4
18
44
66
Workshop-November 2006
5
53
58
BCEOM-EC, 1988 and 2000
34
34
Greigert, 1978
8
8
K.F. SAAD, 1971
17
28
45
MHE-1983
5
5
JICA_Sokoto_Report 1990 and 1991
242
4
246
Total per pays
32
270
309
611
4.3.3.2- Level series
No spatiotemporal follow-up of the IAS different aquifer piezometry is secured in the three concerned countries. The
piezometric measurements collected and exploited for the purposes of the study emanate from the water point
characteristics identified during the establishment of the reconnaissance or operation works, or other accompanying
measures made when the synthesis studies were made by the countries. It is also found out that no piezometric
history is available and that the few validated measurements represent very insufficient distant milestones in their
spatial distribution to ensure a clear vision of piezometry over time.
The water points having at least two measurement levels are not many (68 for the two aquifers). The gap between
these measurements is, for the majority, 1 year (which is insufficient to analyse the level variations). No single point
has three measurements at least.
Tableau 16: Points with at least two-level measurements: series length
and distribution by administrative unit
Number of points with more
MAX
Pays
Administrative Unit
The longest
period (years)
than two measurements
Number
Mali
Gao
0
0
2
Kebbi
1
19
2
Nigeria
Sokoto
1
36
2
Niger
Dosso
28
7
2
Maradi
1
1
2
Niamey
13
1
2
oss
77
Number of points with more
MAX
Pays
Administrative Unit
The longest
period (years)
than two measurements
Number
Tahoua
8
4
2
We notice that no water point in Mali benefits from two level measurements or more.
If we examine the distribution of these series by aquifer (Table 16), we notice that for the TC the
number of water points with two measurements is only 12.
Tableau 17: Points with at least two level measurements: Series length and distribution
per aquifer
Number of points with
Aquifer
The longest period (years)
more than two
measurements
Unknown
1
3
IC
28
53
TC
12
12
The spatial CI point distribution shows that (Fig. 22):
· Their number is high in Nigeria, but the longest period is only 1
year.
· There are no points in Mali.
· Only 3 points have a period longer than 3 years. They are all in
Niger.
Figure 22: Spatial CI point distribution with two or more level measurements
oss
78
The spatial CT point distribution is illustrated in the map, below (Fig.23)
Figure 23: Spatial CT point distribution with two or more level measurements
There are three CT points with a period 10 years. They are located in the Dosso zone,
as shown in the fol owing table:
Conclusion on piezometry
The basin-shaped IAS made the interpretation of the piezometric data on the different aquifers
relatively easy, particularly that the main part of the aquifer system is located in Niger and
secondarily in Nigeria. The previous hydrogeological studies carried out in Mali (K.F Saad,
1971), Niger (FAO, 1970; BCEM, 1978; MHE, 1983) and Nigeria (JICA, 1991) put forward some
basic hypotheses for the interpretation of the whole piezometric outlook. As the operation of the
aquifer system has recently evolved in a relatively balanced manner in Mali and Niger, and as
the strongest operation was witnessed in Nigeria (an IAS outlet), the general outlook of the
pressure-surface contours does not seem to be too distorted by such operation. Levelling the
system in permanent mode was obtained on the basis of the available data that was judged to
be acceptable.
oss
79
Levelling the model in transitory mode is judged to be more random with the absence of a viable
and representative peizometric file history. The few well-spaced measurements are precious
yardsticks which made it possible to guide model levelling, knowing that the evolution of the
aquifer system operation has more or less remained within the limits of its unsustainable
resources. It is only during the recent years that the operation seems to overtake the annual
recharge.
4.3.4- Geology
The geological data introduced in the IAS common DB correspond to the drilling data from the
basin. These are presented in the form of a lithostratigraphic description of the drilled layers.
Stratigraphic subdivisions were adopted before securing the processing of this information with
the help of `Rockworks', a software used for establishing correlations between drillings
according to preferential directions making it possible to highlight the peculiarities of the
geological structure associated with each correlation.
With the help of this information, mapping the walls, ceilings and thickness of each aquifer
formation was made with maximum accuracy, given the good density of the considered points
and the refined adopted stratigraphic division.
Through this work of geological analysis, the conceptualisation of the IAS structural
configuration was made with more accuracy and harmonisation. This approach has much
helped the representatives of the three countries to:
· Opt for a shared conception of the IAS structure in each part of the basin.
· Adopt harmonised subdivisions to draw the major IAS aquifer levels and share the
decision on the number of layers to adopt in the model,
· Adopt layer thickness (aquifer or aquiclude) by referring to the harmonised data of
the three countries.
Thus, the geological data were at the origin of the information which made it possible to come
up with the conceptual schema of the aquifer structure. It is the elaboration of structural maps
(ceiling, wal and thickness) for the considered formation which largely facilitated this operation.
The thickness maps constitute a vital element in model levelling through transmissivity
distribution4. In light of such maps, the physical data relating to each layer's thickness were
better grasped and the structure of the aquifer system simulated with much accuracy.
The `geology' table consists of 690 points, but only 89 have the informed `code_aquif' (CI or
CT). Attaching a water point to one of the two IAS aquifers is an accessory operation in this data
use framework, given that most of the points, which have not been attached, integrate the
information relating to the two aquifers.
Aquifer
Number of points
Uninformed
509
IC
31
TC
58
4 T=K*E ; T : Transmissivité, K: Perméabilité et E : épaisseur de la couche aquifčre ou aquiclude
oss
80
4.3.5- Hydrodynamic parameters
The `Hydrodynamic' table brings together the data relating to the hydrodynamic characteristics
of the IAS aquifers (transmissivity and storage coefficient) in particular the transmissivity values
deduced from the interpretation of the pumping test. These values, coupled with those of the
aquifers submerged thickness, allow us to assess the total aquifer system's reserves. Adopted
in the hydrodynamic model, they served to put the aquifer system in a balanced state.
The absence of data on the hydrodynamic characteristics of the two aquifers in Mali and
Nigeria, in January 2007, meant that this collected information for the sake of the model could
not be integrated in time in the database (Table 17).
Tableau 18: Distribution of points with a transmissivity value
Aquifer
Country
Admin
Number of points
Dosso
11
Maradi
CI
7
Niger
Niamey
3
Tahoua
24
Zinder
3
Dosso
12
CT
Niger
Niamey
2
Tahoua
1
We notice that there are no data on the hydrodynamic parameters of Mali and Nigeria.
oss
81
Quality
The hydrochemical and isotopic data were very useful in guiding the conceptualisation of the
IAS hydrodynamic functioning. The data on these two aspects were only secondarily considered
during the data collection for the common database, given that the national teams did not have
time to take care of it. In fact, this aspect is not accounted for in the elaboration of the IAS
hydrodynamic model, the reason for which it could not be developed on time in the database.
The existing `quality' table in the IAS common DB includes only 24 recordings all of them
from Mali.
Tableau 19: Distribution of points with chemical analytical values
Country
Name_Admin
Number of points
Mali
Gao
24
Katsina
0
Nigeria
Kebbi
0
Sokoto
0
Agadez
0
Dosso
0
Maradi
0
Niger
Niamey
0
Tahoua
0
Zinder
0
The set of points with quality data is found in Mali.
4.4- Geographical Information System (GIS)
The IAS geographical information system is a set of software to produce a cartographic
representation of existing data in the common database. The support for the required digitized
maps for this representation was developed as a separate activity in the project framework.
The GIS used to represent the IAS is designed as an integrated part of the overall Information
System (designed for very large needs), insofar as all the descriptive information of
geographical objects is planned in the database structure. The primary aim is to store each
piece of information in one area (no redundancy).
The second objective concerns the links between the Database and the model, on the one
hand, and GIS and the model, on the other. The links must be established automatically and
transparently for the user. These links can be set up at a later stage, after establishing the
database, but before feeding the model with specific data. The IAS Information System consists
of two major parts: the Database and GIS. This set is coupled with a model grid, which is at the
same time a DB table and a GIS layer, thus securing the link between the DB model and GIS.
oss
82
4.4.1- Projection system
To have a common cartographic reference in the three countries and automatically produce the
grid of the hydrodynamic model, which requires a system of projected coordinates, the Lambert
projection was adopted.
In the IAS region, Niger, which occupies most of the basin, is covered by three Lambert zones,
as shown in the following table:
Tableau 20: Parameters of the three Lambert zones covering Niger
Name Zone
N°
I II
III
Ellipsoid
Clarke 1880
Clarke 1880
Clarke 1880
Reference
International 1900 International
1900 International
1900
spheroid
central meridian
8.08
8.08
8.08
Reference
22,00 18.00
14.00
parallel
(latitude
reference)
South latitude
20.66 16.66
12.66
(Standard
parallel 1)
North Latitude
23.33 20.33
16.33
(Standard
parallel 2)
False easting
0
0
0
False northing
0
0
0
The three concerned zones are (Fig. 24):
· North, latitude > 20°
· Centre, latitude ranging between 16° and 20°
· The south, latitude < 16°
oss
83
Figure 24: The three Lambert zones of the Niger territory
Le systčme de projection : paramčtres, intégration dans ArcView, transformations géo
Lambert
Les couches rajoutées : agglomérations, unités administratives, le maillage
La géologie : traitement sur les classes
The common system chosen for the IAS corresponds to zone II whose parameters are:
- Central
meridian:
8.08
- Latitude
ref.:
18
- Parallel
1:
16.66
- Parallel
2:
20.33
- False
Easting:
0
- False
Northing:
0
In order to facilitate the process of converting geographic layers to Lambert, the
abovementioned parameters were integrated in ArcView `Default.prj' file. The set of layers
mentioned in Chapter 2 were converted to Lambert.
oss
84
4.4.2- Layers added for the purposes of the study
At the time of devising the links between the IAS common database and GIS, the following
layers were added:
4.4.2.1- Administrative limits
It is a layer used in GIS and DB: see statistical requests on the number of water points and
withdrawals. It was extracted from the ESRI data.
Figure 25: Layers of administrative units
oss
85
4.4.2.2- Gridding
Gridding is generated from the DB by automatic processing (`Db_Sig_model' form), but this
processing generates the `gridding' layer in the same projection system as the others. This layer
is required for the hydrodynamic model. It ensures the link between the DB and the model.
Figure 26: PM5 gridding
The allotted table of the `gridding' layer and the `gridding' table of the database have a common
field which is the grid number. This allotted table is automatically attached to the DB.
oss
86
4.4.2.3- The water point layer
The water point layer is not static. It is automatically generated from the `points' table when the
explorer is started. Thus, any change in the coordinates impacts on this layer without any
manual intervention.
We can, on the basis of ArcView, display the water points layer by using SQL Connect. The
procedure is as follows:
- Make a request at the level of the `IASIS database, using the `points' table with
possibly another related table. This request must include at least these fields
`NoClas', `Xcoord' and `Ycoord. Save the request.
- Under ArcView, make `Project', `SQL Connect'. Choose the `MS access database'
driver, then click on `connect' to locate `IASIS.MDB' which should be found by default
in the `C:\lullemeden\DB\' file
- Select the request which has just been made and finish by clicking on `Query'
- In a view, make `View', `Add event theme' and give the name of the `Xcoord' and
`Ycoord' fields.
oss
87
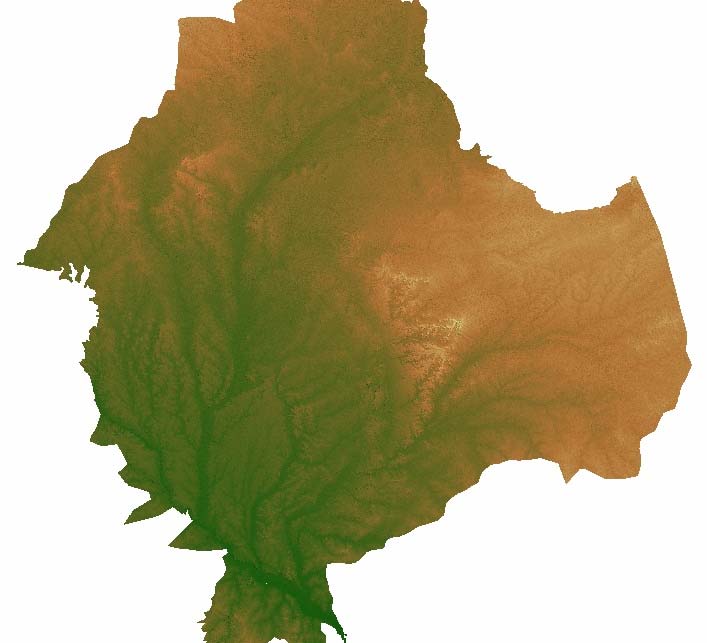
Digital Elevation Model (DEM) 90 meters
Ce MNT a été constitué au mois de Septembre 2007. Il a une résolution de 90 mčtres et il est
issu d'un traitement sur des fichiers téléchargés gratuitement ŕ l'adresse suivante :
(ftp://e0mss21u.ecs.nasa.gov/srtm/Africa/). Contrairement ŕ la premičre version, la version 2
propose des données corrigées exploitables.
The DTM was established in September 2007. It has a 90-meter resolution and it is the outcome
of processing free-downloaded files from the following address:
ftp://e0mss21u.ecs.nasa.gov/srtm/Africa/). Contrary to the first version, Version 2 proposes
operational corrected data.
Figure 27: Digital Elevation Model at 90-meters
Traitement des fichiers SRTM
oss
88
These are SRTM format files covering 1 square degree whose name has the following structure:
NxxExx.hgt, where xx represents the longitude and the latitude in degrees.
The IAS zone is covered by 60 files, as shown in the following table:
File
number
N10E02 to N10E04
03
N11E02 to N11E04
03
N12E01 to N12E08
08
N13E01 to N13E08
08
N14E01 to N14E09
09
N15E00 to N15E09
10
N16E00 to N16E08
09
N17E01 to N17E06
06
N18E02 to N18E05
04
N19E03 to N19E05
03
TOTAL 60
The processing took place as follows:
- Reading of hgt files by an avenue programme and conversion to ESRI grid.
- Gridding mosaic (Grid Analyst extension).
- Partitioning with the IAS extension.
- Lambert grid projection, with the help of Grid Analyst.
oss
89
CONCLUSION AND RECOMMENDATIONS
The setting up of an IAS common database made it possible to bring in the set of available
hydrogeological data on the system aquifers together and to make them more homogeneous
and coherent at the levels of:
- Codification
- Format
- Processing
mode
However, given that it is the first time that the contents of the different DB files are issued from
diverse sources before adapting them to a common structure, these should be subjected to a
more thorough test, be validated and directly made amenable to processing. This will be the
most urgent task of the national teams, assisted by OSS at first.
The major project contribution at this level lies in the fact that the common database as well as
the accompanying tools are capable of updates (corrections, new data additions...) in a
standard format shared by the three country teams. This will facilitate a periodic updating of the
common base and data exchange among the different partners.
At the level of contents, many things were done, but certain faults still persist:
- A good number of water points are still without an identifier or without coordinates.
- There is much duplication which needs to be deleted.
- For all the water points, the withdrawals have been estimated because the
information was not available.
- There are still many uninformed fields.
The establishment of the DB and GIS within the three countries, the training of the teams in
operation, including the administration of tools developed for the project, have to be anticipated
so as to allow for the system's regular updating.
This will facilitate the establishment of an information system which will secure regular updating
and the gradual development of a decision aid system. This system should be accompanied by
an exchange mechanism between the countries and the establishment of the data
administration function in these countries and within the IAS concerted management organ.
The two workshops organised within the project framework for the benefit of the experts of the
three countries who will be in charge of the DB common management are considered as a step
to facilitate management responsibility and the countries' involvement in content
conceptualisation and selection. These workshops have also served for accommodating these
teams to GIS during the gradual elaboration of the hydrodynamic model.
Feeding the database with the new information that the national teams keep collecting, with the
perspective of updating its history, is planned until the end of the project (March 2008). The
establishment of the database in the countries is the last stage which should crown the IASIS
establishment.
This database is designed according to a gradual and extendable scheme to secure its
sustainability in the management of IAS water resources data. If, at this stage, the information
oss
90
which is stored there is mainly oriented towards the hydrogeological aspect, it is necessary to
pay attention to:
- Completing the IAS hydrogeology data entry, adding the recently collected data, and
allowing for history updating.
- Completing the hydrogeological data with hydrological, climatological and hydro-
agricultural data to further consolidate the model's hydrodynamic results, make them
more capable of forecast simulations (medium and short terms), and secure the IAS
water resources management.
- Enriching the database structure and content with other aspects to make it a
monitoring tool for the IAS water resources within the framework of a cooperation
structure between the three countries for the optimal planning of the basin water
resources, hence reducing the hydrogeological risks and ensuring development.
For this purpose, it is recommended to make the specialists feel more responsible so that they
own the common DB and the IASIS. This ownership cannot be realised without an additional
training of the designated technicians and a reinforcement of the computing abilities of the
concerned structures.
In its current state, the database includes a precious piece of information which could not have
been collected before. This information requires more specific processing for validating,
processing and generating further results. Such effort is the responsibility of the national teams
in the first place, but it can also be used with other OSS applications in the framework of
monitoring member countries' water resources. Similarly, the methodology developed by the
project team for validating and harmonising data can be an example for developing similar
activities for other aquifer systems.
oss
91
BIBLIOGRAPHY
FAO (1970) : Etudes en vue de la mise en valeur du Dallol Maouri, Niger : les eaux
souterraines. Rome, Italie - 162p. ; cart., graph.. PROJET FAO/SF: 281/NIR 8, 1970.
GREIGERT J. (1978) : Atlas des eaux souterraines de la République du Niger. Etat des
connaissances. Rapport BRGM, 79 AGE001. Orléans, France.
JICA (1990) et (1991) : The Study Groundwater Development in Sokoto State.
Maďga S. & Bouaré D., (2006) : Collecte des données hydrogéologiques du Systčme aquifčre d'Iullemeden dans
la partie malienne. OSS, décembre 2006, tableaux annexes.
Moumouni Moussa A. & Rabé S., (Janvier 2007) : Collecte des données hydrogéologiques du Systčme aquifčre
d'Iullemeden dans la partie nigérienne. OSS, Janvier 2007, 12 p et tableaux annexes.
OSS (2003) : Rapport Base de Données du projet Systčme Aquifčre du Sahara
Septentrional (SASS). OSS, Tunis.
OSS (2004) : Rapport de l'atelier sur l'élaboration d'une Base de données commune aux
trois pays (Mali, Niger, Nigeria) ; Tunis, du 26 au 30 avril 2004 ŕ l'OSS.
OSS-AIEA (2005) : Rapport de l'atelier de formation sur l'élaboration de la base de données
du SAI ; Niamey, du 26 avril au 06 mai 2005 au Centre Régional AGRHYMET (CRA).
OSS (2006) : Deuxičme Session de Renforcement des capacités des représentants des
pays en modélisation mathématique. Systčme Aquifčre d'Iullemeden (SAI). Atelier ; OSS-
Tunis, Novembre-Décembre 2006, 16p.
oss
92
APPENDIX: DETAILED STRUCTURE OF THE DATABASE TABLES
Database : C:\Iullemeden\BDD\SAI_DATA.mdb
Table: Admin (administrative units)
Propriety
Date of creation: 05/03/2007 09:41:49
last update:
05/03/2007 12:39:24
GUID:
Binary data
NameMap:
Donnée binaire
Orientation:
0
RecordCount:
10
TriActif:
False
Updatable:
true
Colums
Name
Type
Description
Size
Code_Pays
Texte
Code pays (Ma = Mali, Ni = Niger, Ng = Nigeria)
2
Nom_Admin
Texte
Complete name of the country
20
Table: agglomerations (principal agglomerations )
Proprety
Date of creation: 05/03/2007 09:42:01
Last update:
03/04/2007 20:35:07
NameMap:
Binary data
Orientation:
0
RecordCount:
249
TriActif:
False
Updatable:
true
Colums
Nom
Type
Description
size
AGGLOM_ID
Réel double
Agglomeration Identifiant
8
NOM
Texte
Nom de l'agglomération
30
CODE_ADMIN
Texte
Code de l'unité administrative oů se situe l'agglomération 30
Table: aliment (valeurs d'alimentation par maille)
Proprety
Date of creation: 06/03/2007 16:17:20
last update:
06/03/2007 16:17:23
GUID:
Binary data
NameMap:
Binary data
RecordCount:
9
TriActif:
true
Updatable:
true
oss
93
Colums
Nom
Type
Description
size
NOCLAS
Texte
identification number (similar to that of water points
22
couche
Texte
Number of the layer in PM5 software
1
aquif
Texte
aquifer name
30
X
Réel double
X of the cell center
8
Y
Réel double
Y of the cell center
8
Alim
Réel double
recharge value l/s
8
MAILLE
Texte
Cell Identifiant
10
NOM
Texte
Name of the recharge point
100
Table: Aquifer (list of IAS aquifers)
Propriety
Date of creation: 05/03/2007 10:01:25
last update:
05/03/2007 10:20:58
GUID:
Binary data
NameMap:
Binary data
Orientation:
0
RecordCount:
2
TriActif:
False
Updatable:
True
Colums
Nom
Type
Description
Size
Code_Aquif
Texte
aquifer Code (CT = Complexe terminal, CI = continental 2
intercalaire
Nom
Texte
Aquifer Name
30
Couche_modele Texte
Number of the layer in PM5 software
1
Shape_file
Texte
Nom du fichier Shp correspondant
30
Table: etats (list of states of the water point)
Propriety
Date of creation: 06/03/2007 10:01:59
Last update:
06/03/2007 10:02:24
GUID:
Binary data
NameMap:
Binary data
Orientation:
0
RecordCount:
4
TriActif:
False
Updatable:
True
Colums
Nom
Type
Description
Size
Code_Etat
Texte
State Code of a water point
2
Description
Texte
Wording of the state
30
Table: Exploitation (Time series of the annual abstractions)
Propriety
Date of creation: 06/03/2007 08:48:04
last update:
27/03/2007 22:47:24
GUID:
Binary Data
NameMap:
Binary data
Orientation:
0
RecordCount:
20242
TriActif:
False
Updatable:
True
oss
94
Colums
Nom
Type
Description
Size
Noclas
Texte
identification number of the water point
22
Annee
Entier
Year of measurement
2
Prelevement
Simple Real
Abstraction value in m3
4
Origine
Text
Source of the information
50
Date_Maj
Date/Hour
Record update date
8
Table: GEOLOGIE (Geological description of the water point)
Propriétés
AffichParDéfaut: Data sheet
Date of creation: 07/10/2006 09:42:00
Last update :
03/04/2007 21:54:22
GUID:
Binary data
NameMap:
Binary data
Orientation:
0
RecordCount:
598
TriActif:
False
Updatable:
True
Colums
Nom
Type
Description
Size
NoClas
Texte
identification number of the water point
22
Quat
double real
Altitude in meter of the Quaternary
8
Plioc
double real
Altitude in meter of Pliocene
8
Mioc
double real
Altitude in meter of Miocene
8
Olig
double real
Altitude in meter of l'Oligocene
8
Eoc
double real
Altitude in meter of l'Eocčne
8
Pal
double real
Altitude in meter of Paléocene
8
Sen
double real
Altitude in meter of Senonian
8
Tur
double real
Altitude in meter of Turonien
8
Cen
double real
Altitude in meter of Cenomanian
8
CI
double real
Altitude in meter of CI
8
Jur
double real
Altitude in meter of Jurassic
8
Trias
double real
Altitude in meter of Triassic
8
Palz
double real
Altitude in meter of Paleozoic
8
TD
double real
Total depth in meter
8
Date_Maj
Date/Hour
Record update date
8
Table: hydrodynamic (hydrodynamic parameters)
Propriety
AffichParDéfaut: Data sheet
Date of creation: 19/07/2006 11:06:02
last update:
08/03/2007 16:07:15
GUID:
Binary data
NameMap:
Binary data
Orientation:
0
RecordCount:
98
TriActif:
False
Updatable:
True
oss
95
Coloums
Nom
Type
Description
Size
Noclas
Text
identification number of the water point
14
Date_mesure Date/Hour
Pumping test date
8
Duree
Octet
Pumping test duration in hours
1
NS
simple real
Static level in meter
4
Debit
simple real
Pumping test yield in l/s
4
Rabattement simple real
Drawdown in meter
4
Méthod_interp Octet
interpretation Method of the pumping test
1
Type_essai
Octet
Type of pomping test
1
Transmis
double real
Transmissivity m2/s
8
Permeab
double real
permeability 8
Coeff_emmag double real
Storage Coefficient
8
Source
Text
Origine of the informations
50
Fichier
Text
Name of the file used to import data
50
date_maj
Date/Hour
Record update date
8
Observations Text
Observations (comment)
50
Table: Grid (cells of the model)
Propriety
Date of creation: 06/03/2007 15:38:32
last update:
06/03/2007 15:58:16
GUID:
Binary data
NameMap:
Binary data
Orientation:
0
RecordCount:
9700
TriActif:
False
Updatable:
false
Colums
Nom
Type
Description
Size
MAILLE
Texte
Number of the cell
10
NUM_PM5
Texte
corresponding PM5 number (line Colum)
16
Table: Objets_Ouvrage
Propriety
Date of creation: 02/03/2007 16:30:05
last update:
05/03/2007 12:24:33
NameMap:
Binary data
Orientation:
0
RecordCount:
5
TriActif:
False
Updatable:
True
Colums
Nom
Type
Description
Size
Code_Objet
Octet
1
Description
Text
30
Table: Pays
oss
96
Propriety
Date of creation: 02/03/2007 12:23:48
Dernier mis ŕ jour: 05/03/2007 18:16:59
GUID:
Donnée binaire
NameMap:
Donnée binaire
Orientation:
0
RecordCount:
3
TriActif:
Faux
Updatable:
Vrai
Colums
Nom
Type
Description
Size
Code_Pays
Text
2
Nom
Text
255
Table: PIEZOMETRIE (Piezometric time series des niveaux)
Propriety
AffichParDéfaut: Data sheet
date of creation: 08/10/2006 16:06:22
Last updating:
06/03/2007 15:23:42
GUID:
Binary data
NameMap:
Binary data
Orientation:
0
RecordCount:
611
TriActif:
False
Updatable:
True
Colums
Nom
Type
Description
Size
NoClas
Text
identification number of the water point
22
Date
Entier
Measurement date
2
NS
Entier long
Static level in meter
4
NP
Entier long
piezometric level
4
Observations Text
comment 50
Source
Text
Origine of the information
50
Fichier
Text
Name of the file used to import data
50
Date_maj
Date/hour
record updating date
8
Table: QUALITE
Proprety
Date of creation: 03/03/2007 17:40:12
last update:
08/03/2007 14:27:19
GUID:
Binary data
NameMap:
Binary data
Orientation:
0
RecordCount:
24
TriActif:
False
Updatable:
True
oss
97
Colums
Nom
Type
Description
Size
Noclas
Texte
identification number of the water point
22
Date_mes
Date/Hour
Measurement date
8
Ph
simple real
4
EC
simple real
4
TEMP
simple real
4
Ca2+
simple real
4
Mg2+
simple real
4
K+
simple real
4
Fe2+
simple real
4
Mn
simple real
4
Na+
simple real
4
HCO32-
simple real
4
CO32-
simple real
4
Cl-
simple real
4
NO3-
simple real
4
SO42-
simple real
4
d18O
simple real
4
d2H
simple real
4
d3HTU
simple real
4
14C
simple real
4
13C
simple real
4
Nom_Fichier_ Text
Name of the file used to import data
50
Source
Table: POINTS (Water point characteristics)
Proprety
AffichParDéfaut: Data sheet
Date of creation: 11/07/2005 12:28:36
Last update:
03/04/2007 21:25:28
GUID:
Binary data
NameMap:
Binary data
Orientation:
0
RecordCount:
17171
TriActif:
True
Updatable:
True
Colums
Nom
Type
Description
Size
Noclas
Text
identification name of the water point
22
Nom
Text
Name of the water point
50
Indice_Village Text
Village (for the malian water points)
7
Localite
Text
locality name of the water point
50
Code_Type
Octet
Type of point
1
Artesien
Oui/Non
Artésien (yes ou no)
1
Equipe
Oui/Non
taped (yes ou no)
1
Code_Aquif
Text
Code of the taped aquifer (see table « aquifere »)
2
Nom_Admin
Text
administrative Unit
20
Long
Text
longitude 20
Lat
Text
latitude 20
oss
98
Long_dec
simple real
Longitude in decimal degrees
4
Lat_dec
simple real
Latitude in decimal degrees
4
Xcoord
simple real
X lambert
4
Ycoord
simple real
Y lambert
4
Alt
simple real
Altitude 4
Nom_Formati Text
Name of the taped formation
50
on_Geol
Code_Usage
Octet
Use Code of the water points (table "usages")
1
Prof_foree
simple real
total depth in m
4
Prof_equipee simple real
taping depth
4
QEX
simple real
exploitattion yield at the creation
4
NS
simple real
static level at the creation
4
GPH
Text
1
Date_debut
simple real
starting date of the work
8
Date_fin
simple real
date of the end of the work
8
Annee_sce
Entier
Starting date
2
Code_Objet
Octet
object Code of the water point (objective)
1
Code_Etat
Entier long
Water point state Code (table « etats »)
4
Observations Text
comment 60
Source_Info
Text
Origine of the information
50
Nom_Fichier_ Text
Name of origine file
50
Origine
Date_maj
Date/Hour
record update date
8
Maille
Text
cell number
10
Table: Types_Ouvrage (list of the water point type)
Proprety
Date of creation: 02/03/2007 11:52:48
Last update:
05/03/2007 12:22:16
GUID:
Binary data
NameMap:
Binary data
Orientation:
0
RecordCount:
6
TriActif:
False
Updatable:
True
Colums
Nom
Type
Description
Size
Code_Type
Octet
Type of water point Code
1
Description
Texte
working type
30
Table: Usages (list of functions of the water point)
Proprety
Date of creation: 02/03/2007 12:18:34
last update:
05/03/2007 12:22:34
GUID:
Binary data
NameMap:
Binary data
Orientation:
0
RecordCount:
6
TriActif:
False
Updatable:
True
oss
99
Colums
Nom
Type
Description
Size
Code_Usage
Octet
Use Code
1
Lib_Usage
Text
Working use
30
Categorie
Text
Category (AEP, IRR, ...)
3
oss
100