NUTRIENTS IN DANUBE RIVER
BASIN
Christoph Lampert, Helmut Kroiss, Matthias Zessner
many results from the project "Nutrient management in the
Danube Basin and its impact on the Black Sea ("daNUbs")
EU-5th Framework Programme
Duration 1.2.2001 Ł 31.1.2005
Coordination: Institute for Water Quality and Waste Management,
Vienna University of Technology.
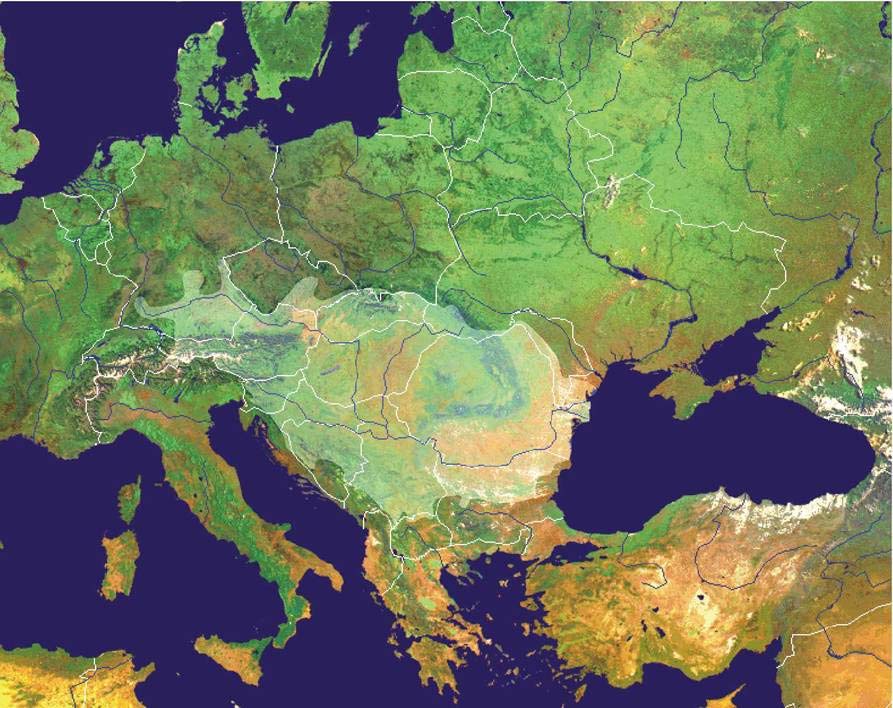
DANUBE RIVER
2.857 km long
catchment: 817.000 km2
map catchmentPopulation within: 85 million
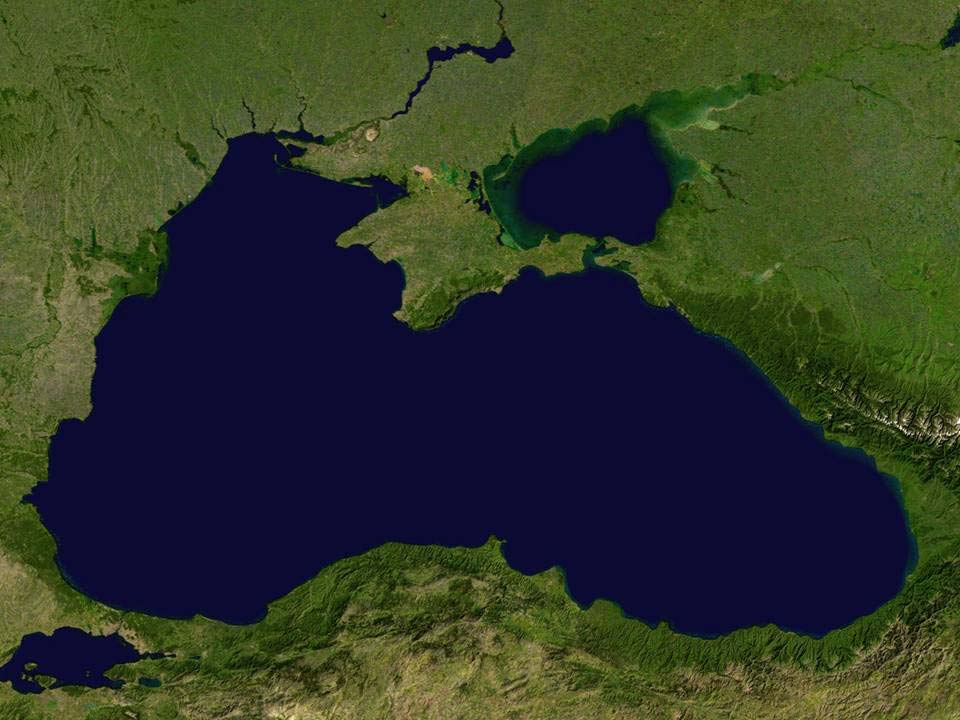
BLACK SEA
Total catchment: 2.300.000 km2
population within: 190 million
surface area of 461.000 km2,
average depth 1.240 m.
Czech
Germany
Republic
WESTERN BLACK SEA
Ukraine
Slovakia
surface area: 30.000 km2
average depth shelf: 140 m
Austria D Hungary
a
Moldova
nu
Slovenia
be
Romania
ca
Croatia
tchment
Bosnia-
area
Herce- Serbia-
govina Montenegro Bulgaria
13 Danubian countries (with area >2000 km▓)
1
Areas impacted by the Danube river
1 - North-western Shelf
2 - Area of direct Danube river-
water influence
3 - Western and southern Shelf
4 - Central Western Black Sea
more-or less closed Sea
=> vulnerable to Eutrophication
Results from Danubs research project
The situation in WBSC has improved significantly since
the late eighties and early nineties.
Ę reduced eutrophication (algae production),
Ę Bottom hypoxia has disappeared since 1997
Ę regeneration of zoo-benthos and
Ę regeneration of phytoplankton.
P-loads in 2000: about 24 kt P Ł as in the 1960ies
P is the limiting nutrient now in the Western
Black Sea.
2
Main reasons for the decrease of
nutrient discharges
Ę Economic Crises
Reduced fertilizer production
Closure of large animal farms
Reduced fertilizer application
Ę Introduction P-free detergents esp. in A and D
Ę P and N removal at treatment plants (A, D,CZ)
Ę favourable weather conditions (e.g. wind
directions)?
Chlorophyll a in the WBS
Satellite (SeaWiFS =
Sea-viewing Wide Field-
of-view Sensor )
obtained, 5 years
summarised (1998-
2002), chlorophyll a data
and zones of moderate
and intense summer
phytoplankton blooms in
the 1980ies in the
western Black Sea (after
Zaitsev and Mamaev, 1997)
3
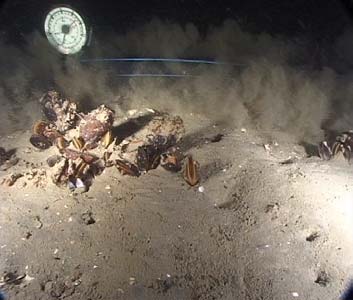
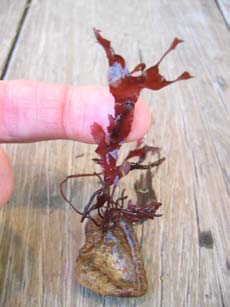
Diappeareance of anoxic conditions
September 2002: Mytilus
September 2004: Red
galloprovincialis, in front of the
algea Philophora in front
Danube Delta (Horstmann, 2002)
of the Ukrainian coast
(Horstmann, 2004)
P-emissions in the Danube catchment
and discharge to the Black Sea
diffuse emissions
industrial and agricultural point sources
]
municipal point sources
140
(adopted from
/a
0
t
P
Danube river load
Behrendt et
120
0
0
al., 2004)
100
80
s
s
i
ons [10
60
d emi
an
40
ads
20
r
i
ver lo
0
1955 1960 1965 1970 1975 1980 1985 1990 1995 2000
Decrease since 1990: N: minus 25%, P: minus 50%
(mainly dissolved forms).
4
Main risks for not reaching good ecological status in
respect to Western Black Sea eutrophication:
Ę Development of sewerage systems without
nutrient removal at treatment plants (fulfilling EU
Urban Waste Water Directive!)
Ę Recovery of the economic situation in the
Eastern Danubian Countries (EDC) in the future
(of agriculture and industry)
A "stand-still" scenario can only be related to the
nutrient load to the Black Sea but not to the
economic development.
Economic development in these countries is desired
even it leads to an increase of nutrient emissions
e.g. from agriculture in some regions (mainly N).
Management of nutrient emissions
in the whole catchment of Danube
is required even the quality of the
Western Black Sea has improved!
5
Main assumptions for scenarios
Ę emission per inhabitant: 1,65 g P/d
Ę 4 detergent-consumption scenarios
Ł 0.3 / 1.0 / 1.75 / 2.5 g Pdet.inh.d
Ę Implementation of the UWWD: all
agglomerations > 2000 inhabitants are
sewered (about 16% resp. 12 Mio. not
connected to sewer system)
Ę all areas are considered as sensitive areas
Ę > 10.000 inhabitants: P-precipitation
Ę emissions of industry: as in 2000
Development of the worst case
scenario
consumption of P-containing detergents
3,5
Outlier ?
3
2,5
d
2
D
SK
/
i
nh.
worst case ?
1,5
HU
g P
1
0,5
0
1955 1960 1965 1970 1975 1980 1985 1990 1995 2000 2004 2010 2015
6
Emissions to surface waters via wwtps
Var. 3: 80% red. in A, B, low infiltration rate,
biol. treatment in C, D
40000
35000
30000
/
a
discharge 2000
P
t 25000
i
n
20000
a
r
ge
h 15000
c
s
di 10000
5000
0
> 100.000 inh.
10.000 - 100.000
2000 - 10.000
< 2000 inh.
total
0.3 gPdet/inh.d
1 gPdet/inh.d
1,75 gP/inh.d
2.5 gPdet/inh.d
Variante Urban Waste Water Directive (UWWD)
(A,B,C: 100% connected, D not connected (ca. 12 Mio inh. not connected)
Emissions to surface waters via large
wwtps
settlements >100.000 inh., different requirements
7000
6000
5000
/a
P 4000
in t
r
ge
a
h 3000
c
dis
2000
1000
0
1 mgP/l, low s.i.r.
1 mgP/l, high s.i.r.
80% removal
0,3 g P/inh.d
1 g P/inh.d
1,75 g P/inh.d
2.5 gPdet/inh.d
UWWD: ,,One or both parameters may be applied depending on the local situation.
The values for concentration or for the percentage of reduction shal apply"
7
Resource Potential
Resource Potential of waste water implementing UWWD
80000
70000
60000
50000
/
a 40000
t P
30000
20000
10000
0
not conn.; em. to env.
em.point sources
P load sludge
fertilizer consumption
Austria 2004
0,3 g P det
1,0 g P det
1,75 g P det
2,5 g Pdet
15.000 - 48.000 tP consumption of laundry detergents
P-fertilizer use in Austria 2004: 15.800 t P
sludge has a considerable resource potential Ł question of quality
Additional sludge dry matter production
due to Zeolite and P-precipitation
additional dm of sludge
Sludge produced
350000
without P-removal:
1.6 mio t dry matter
300000
annually
250000
4,5 g/
inh.d
200000
e
s
The amounts
t
onn 150000
increase due to the
use of detergents
100000
up to 20%.
50000
The costs of sludge
0
Zeolite
0,3 g P/inh.d 1 g P/inh.d
1,75 g
2,5 gP/inh.d Zeolite+0,3 g
management are
P/inh.d
P/inh.d
similar.
8
Consumption of precipitants
Additional need for precipitants in %
(base: 0,3 g P/inh.d)
A switch from
P-containing
120
detergents to
100
alternative
80
%
60
detergents
40
reduce the
20
0
amount of
1(2) mgP/l 100 l
1(2) mgP/l 200l s.i.r.
80% removal
s.i.r.
precipitants
1 g P/inh.d
1,75 g P/inh.d
2,5 gP/inh.d
up to 100%.
Costs of P-precipitation
The additional costs of precipitation due to the use
of P-containing laundry detergents amount
Ę in the scenario 1,0 g P/inh.d to 1 Ł 3% (7 Ł 14 Mio
/year) of the operation costs,
Ę in the scenario 2.5 g P/inh.d to 4 Ł 8% (21 Ł 43
Mio ) of the operation costs.
Costs in Austria: 1,5 Ł 3 /kg P removed (excluding
sludge disposal)
operation costs: about 40% of annual costs of wwtp
9
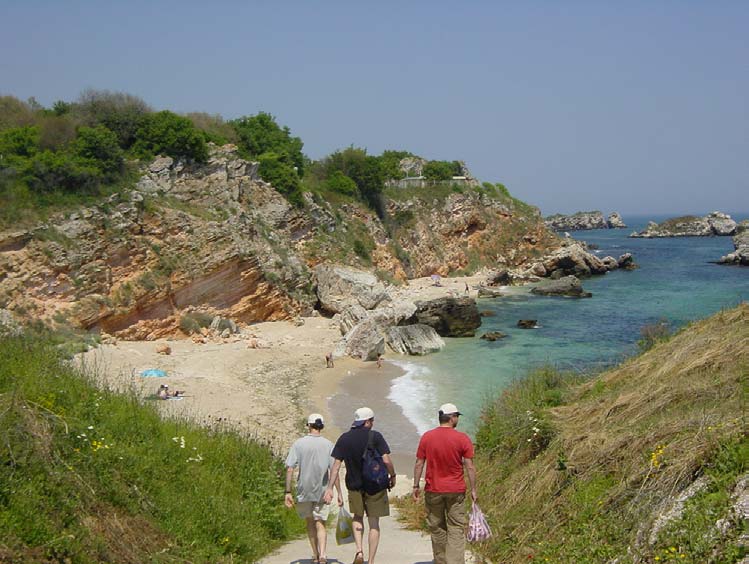
Seaside tourism in RO and BG
Romania: 4.5 mio stayings overnight
about 20.000 employees
Bulgaria: about 10 mio stayings overnight
about 50.000 employees
Summary
Ę The ecological situation in the Western Black Sea
has improved considerably Ł to a minor part due to
environmental policy.
Ę The improvement is due to the reduction of nutrient
emissions via the Danube esp. of dissolved P
Ę The Western Black Sea is P-limited.
The improvement is endangered by:
Ę Recovery of the economic situation in the Eastern
Danubian Countries (EDC) in the future (of
agriculture and industry)
Ę Development of sewerage systems without nutrient
removal at all treatment plants (fulfilling EU UWWD)
10
Summary
Ę Main contributors to P-emissions will be settlements
between 2000 and 10000 inhabitants (ca. 50% of the
emissions).
Ę wwtp-emissions can be kept on the level of 2000 if:
Ł all areas in the catchment are "sensitive areas"
Ł in areas 2000 -10000 inhabitants P-removal is
applied or a ban (limitation?) of P-containing laundry
detergents
Ę Sewage sludge represents a considerable P-resource.
Ę The costs of P-precipitation compared to the operation
costs are small.
The Black Sea catchment
provides the unique
opportunity for proactive
environmental policy on a
large scale.
WE SHOULD USE IT!
NOW!
11
N- and P-emissions into the Danube
river system by pathways
12
Emission of P in scenarios in
2015
120
Point sources
100
Urban areas
Groundwater
80
Erosion
Tile drainage
[kt/y]
60
Overland flow
Atm.Depos.
issions
40
Em
20
0
BAU
WC
BAT
Sc4
PS
pe in mio
nu.plants
annual costs
A
36,6
200000
183
448
B
32,0
75000
426
863
C
38,7
7500
5155
3609
D
2,7
1500
1802
541
5460
addit. costs due to detergents (base 0,3) in mio
1,0 g P det
7
14
2,5 g Pdet
23
45
addit. costs due to detergents (base 0,3) in %
1,0 g P det
1,3
2,6
2,5 g Pdet
4,1
8,1
13
0,2
PO4
PIP
POP
0,15
/l
)
P
0,1
g
(m
0,05
0
2000
2001
2002
2003
14