
Danube River Basin
Updated Transboundary Diagnostic
Analysis (2006)
Based on EU Water Framework Directive
Analysis Report
Danube Transboundary Analysis
page 1
CONTENTS
1. Summary ...................................................................................................................... 7
2. Introduction ................................................................................................................. 10
2.1. Background to Danube Basin interventions ................................................................. 10
2.2. The need for this updated TDA.................................................................................. 11
2.3. UNDP/GEF Danube Regional Project........................................................................... 12
2.4. GEF Danube Ł Black Sea Strategic Partnership............................................................ 13
2.5. Structure of the updated Transboundary Diagnostic Analysis Report. ............................. 14
3. Methodology ................................................................................................................. 15
3.1. Introduction............................................................................................................ 15
3.2. Guidance on TDA..................................................................................................... 15
3.3. Preparation of the EU WFD Danube Basin Analysis....................................................... 16
3.3.1. Background to IRBM in the Danube Basin........................................................ 16
3.3.2. The EU Water Framework Directive ................................................................ 16
3.3.3. Activities undertaken .................................................................................... 17
3.4. Identification of priority transboundary concerns ......................................................... 18
3.4.1. Water-related Environmental Monitoring ......................................................... 18
3.4.2. `Risk of failure' to meet good status................................................................ 18
3.4.3. Priority Transboundary Concerns.................................................................... 18
3.5. Pressure and Impact Assessment / Causal chain analysis ............................................. 19
3.6. Governance analysis ................................................................................................ 20
4. Description of Danube River Basin................................................................................ 21
4.1. Introduction............................................................................................................ 21
4.2. Physical and geographic characterisation.................................................................... 21
4.2.1. Climate and hydrology .................................................................................. 21
4.2.2. The Danube River and its main tributaries ....................................................... 24
4.2.3. Important lakes in the Danube River Basin ...................................................... 25
4.2.4. Major wetlands and other Protected Areas in the Danube River Basin District....... 25
4.2.5. Groundwater in the Danube River Basin District ............................................... 27
4.3. Ecological status ..................................................................................................... 27
4.4. Socio-economic situation.......................................................................................... 28
4.4.1. Social Economic Indicators ............................................................................ 28
4.5. Climate Change....................................................................................................... 28
4.6. Institutional setting ................................................................................................. 29
5. Priority Transboundary Concerns.................................................................................. 31
5.1. Introduction............................................................................................................ 31
5.2. Significant Point Sources of Pollution ......................................................................... 36
5.3. Contribution of sub-basins to the total point source pollution of the Danube ................... 39
5.4. Nutrient Pollution .................................................................................................... 40
5.4.1. Introduction ................................................................................................ 40
5.4.2. Transboundary importance of nutrients in the Danube River Basin ..................... 41
5.4.3. Drivers and Pressures for Nutrient Pollution.................................................... 42
5.4.3.1. Historical development of the diffuse source nutrient pollution into the
Danube River system.................................................................................... 42
5.4.3.2. Point Source Pressures ................................................................... 45
5.4.3.3. Diffuse source pressures ................................................................. 46
5.4.4. Environmental Impacts of Nutrient Pollution in the Danube River Basin............... 49
page 2
5.4.5. Knowledge gaps........................................................................................... 51
5.5. Organic Pollution ..................................................................................................... 51
5.5.1. Introduction ................................................................................................ 51
5.5.2. Drivers and Pressures of Organic Pollution....................................................... 52
5.5.3. Environmental impact ................................................................................... 52
5.5.3.1. Dissolved Oxygen........................................................................... 53
5.5.3.2. Biochemical Oxygen Demand (BOD5)................................................ 53
5.5.3.3. Impact assessment (Saprobic index) ................................................ 53
5.5.4. Knowledge gaps........................................................................................... 54
5.6. Contamination with hazardous substances.................................................................. 54
5.6.1. Introduction ................................................................................................ 54
5.6.2. Drivers and Pressures of Hazardous Substance pollution ................................... 55
5.6.3. Environmental impacts of hazardous substances .............................................. 56
5.6.3.1. Heavy metals................................................................................. 56
5.6.3.2. Organic micro-pollutants ................................................................. 60
5.6.4. Knowledge gaps........................................................................................... 61
5.7. Hydromorphological alterations ................................................................................. 61
5.7.1. Introduction ................................................................................................ 61
5.7.2. Drivers and Pressures of Hydromorphological Alterations .................................. 62
5.7.3. Environmental impacts (stresses) from hydromorphological alterations............... 62
5.7.4. Knowledge gaps........................................................................................... 66
5.8. Transboundary impacts on the Black Sea ................................................................... 66
5.8.1. Introduction ................................................................................................ 66
6. Stakeholder Involvement in the Danube River Basin .................................................... 71
7. Analysis of Institutions, Legislation and investment needs within the Danube
River Basin ................................................................................................................... 72
7.1. Analysis of Institutions and Legislation....................................................................... 72
7.2. Summary of investments identified............................................................................ 78
List of Figures
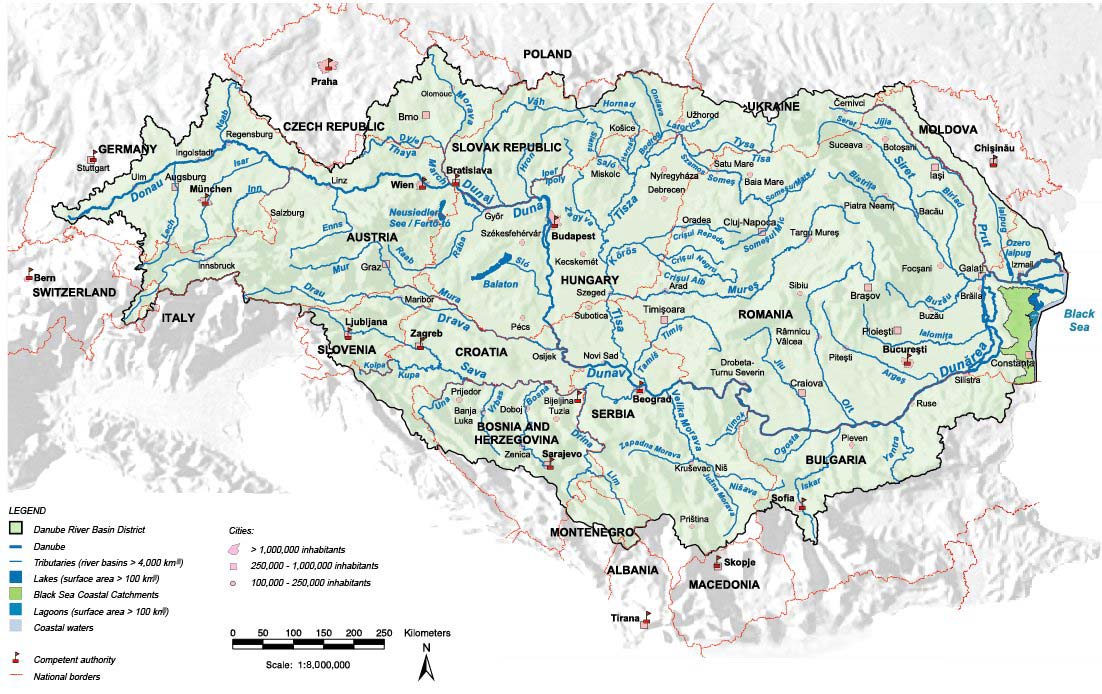
Figure 1:
Location of the Danube River Basin ........................................................................ 22
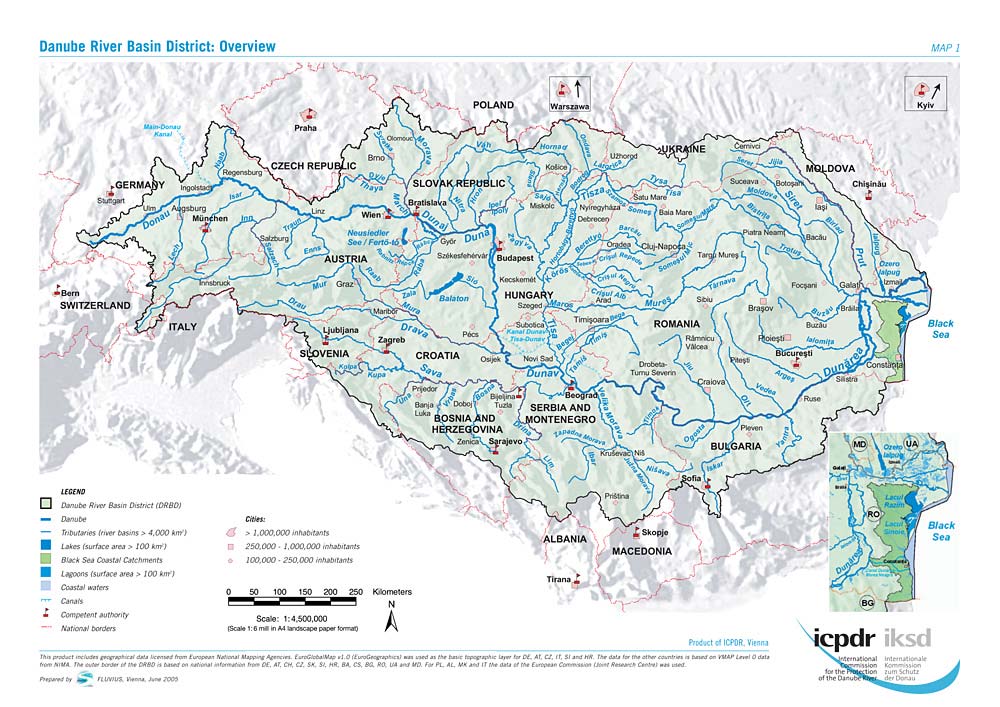
Figure 2:
The Danube River Basin........................................................................................ 23
Figure 3:
Longitudinal profile of the Danube River and contribution of water from each
country (in %) to the cumulative discharge of the Danube (in millions
m3/year), based on data for 1994-1997 using the Danube Water Quality Model .......... 24
Figure 4:
Major Protected Areas within the Danube River Basin ............................................... 26
Figure 5:
Risk of Failure to Reach Environment Objectives Ł Organic Pollution .......................... 32
Figure 6:
Risk of Failure to reach Environmental Objectives Ł Nutrient Pollution ........................ 33
Figure 7:
Risk of failure to reach Environmental Objectives ŁHazardous Substances .................. 34
Figure 8:
Risk of failure to reach Environmental Objectives Ł Hydromorphological
Alterations .......................................................................................................... 35
Figure 9:
Risk classification of the Danube, disaggregated into risk categories. Each full
band represents the assessment for one risk category (hydromorphological
alterations, hazardous substances, nutrient pollution, organic pollution).
Colours indicate the risk classes. * SK territory. ...................................................... 36
Figure 10:
Significant Point Source of Pollution ....................................................................... 38
Danube Transboundary Analysis
page 3
Figure 11:
Temporal changes of the nitrogen emissions into the total Danube river system
for the years 1955 to 2000 (MONERIS) .................................................................. 44
Figure 12:
Temporal changes of the phosphorus emissions into the total Danube river
system for the years 1955 to 2000 (MONERIS) ....................................................... 45
Figure 13:
Total estimated nutrient emissions for the Danube river basin in the period
1998-2000; result of the MONERIS application for the WFD Danube River Basin
Analysis Report ................................................................................................... 45
Figure 14:
Estimated diffuse nutrient pollution by pathways for the total Danube river
systems for the period 1998 to 2000 from the MONERIS model for the WFD
Danube River Basin Analysis Report ....................................................................... 46
Figure 15:
Mean total Phosphorus emissions into the analytical units of the Danube Basin
River District ....................................................................................................... 47
Figure 16:
Mean total Nitrogen emissions into the analytical units of the Danube Basin
River District ....................................................................................................... 48
Figure 17:
River load profiles of nitrogen (a) and phosphorus (b), subdivided over
countries of origin Ł derived from simulations with the Danube Water Quality
Model (DWQM) during the GEF-UNDP Danube Pollution Reduction Programme,
1999 UNDP/GEF (1999a) ...................................................................................... 50
Figure 18:
Information related to the concentrations of chlorophyll- in the Danube and its
large tributaries, on the basis of TNMN field data from 2003 ..................................... 50
Figure 19:
Concentrations of chlorophyll- [Ąg/l] in the Danube River on the basis of field
data collected during the JDS ................................................................................ 51
Figure 20:
TNMN Water quality classes for cadmium and for mercury in 2001............................. 57
Figure 21:
Potential Accident Risk Spots................................................................................. 58
Figure 22:
Old Contaminated Sites in Potentially Flooded Areas ................................................ 59
Figure 23:
TNMN Water quality classes for Atrazine in 2001 ..................................................... 60
Figure 24:
Danube River annual nutrient loads and flows to the Black Sea (1988-2005)............... 68
Figure 25:
Number of macrozoobenthos species near Constanta, Romania (1960s-2003)............. 69
Figure 26:
Long-term dynamic of phytoplankton abundance and biomass in the western
Black Sea coastal area (Galata transect): A) Average phytoplankton abundance
[cells/l] and biomass [mg/m3] by periods (1961-2005); B) Average biomass
[mg/m3] in September [1999-2005]...................................................................... 69
Figure 27:
Long-term dynamics of Copepoda and Cladocera abundance (log transformed)
at 3 miles station off cape Galata (Western Black Sea) during summer of the
period 1967-2005 (the data 1967-2003 by Kamburska et al. 2006). .......................... 70
Figure 28:
Organisation Structure under the Danube River Protection Convention ....................... 72
page 4
List of Tables
Table 1:
General socio-economic indicators ......................................................................... 28
Table 2:
Definition of significant point source pollution on the basin-wide level ........................ 37
Table 3:
Significant point sources of pollution in the Danube River Basin District
according to the criteria defined in Table 2.............................................................. 37
Table 4:
Municipal, industrial and agricultural point source discharges of COD, BOD,
total nitrogen and phosphorus from significant sources according the criteria of
Table 2 (based on ICPDR Emission Inventory data of 2002) ...................................... 39
Table 5:
Consumption of pesticides (in t/a) in some Danube countries and specific
pesticide consumption (kg per ha agric. area and year) in 2001 according to
the FAO database on agriculture ............................................................................ 56
Table 6:
Status of water-related policy, programmes and National Environmental Action
Plans in the DRB countries .................................................................................... 77
Table 7:
Summary of investments and project nutrient reductions. ........................................ 78
Table 8:
Overview of implementation of EU Directives .......................................................... 79
Danube Transboundary Analysis
page 5
GLOSSARY
AQC
Analytical Quality Control
AT Austria
BAP Best
Agricultural
Practice
BAT
Best Available Technique
BEP
Best Environmental Practice
BG Bulgaria
BH
Bosnia and Herzegovina
BOD Biological
Oxygen
Demand
BSERP
(UNDP/GEF) Black Sea Ecosystem Recovery Project
CAP
EU Common Agricultural Policy
CARDS
European Commission assistance for former Yugoslavia
CCA
Causal Chain Analysis
COD Chemical
Oxygen
Demand
CS
Serbia and Montenegro (now two countries)
CZ Czech
Republic
DE Germany
DEF Danube
Environmental
Forum
DPRP
UNDP/GEF Danube Pollution Reduction Programme
DPSIR Drivers-Pressures-State-Impact-Response
DRB
Danube River Basin
DRP
(UNDP/GEF) Danube River Project
DRPC
Danube River Protection Convention
EBRD
European Bank for Reconstruction and Development
EC European
Commission
EEA
European Environment Agency
EG
ICPDR Expert Group
EIB European
Investment Bank
EU European
Union
FAO
Food and Agricultural Organisation
GDP
Gross Domestic Product
GEF
Global Environment Facility
GIS Geographical
Information
System
HMWB
Heavily Modified Water Bodies
HR Croatia
HU Hungry
ICPDR
International Commission for the Protection of the Danube River
page 6
IRBM
Integrated River Basin Management
JAP
ICPDR Joint Action Plan
JDS
Joint Danube Survey
MD Moldova
MONERIS
Modelling Nutrient Emissions in River Systems
MS
Member State of the EU
N Nitrogen
NGO Non-Governmental
Organisation
NW Northwest
P
Phosphorus
Phare European
Commission
assistance programme for Eastern Europe
RBM River
Basin
Management
RBM
River Basin Management
RBMP
River Basin Management Plan
rkm
River kilometre (for the Danube 0 rkm is the mouth of the river)
RO Romania
RR
Roof Report Ł Danube Basin Analysis Report completed for EU WFD
RS
Serbia (previously Serbia and Montenegro)
SAP
Strategic Action Plan
SAP Strategic
Action
Plan
SI Slovenia
SIP SAP
Implementation
Plan
SK Slovakia
t/a Tonnes
per
year
TDA
Transboundary Diagnostic Analysis
TNMN Trans-National
Monitoring
Network (water quality programme of ICPDR)
UA Ukraine
UNDP
United Nations Development Program
UNECE
United Nations Economic Commission for Europe
UNEP
United Nations Environment Program
WB World
Bank
WFD
EU Water Framework Directive
WWTW Wastewater
Treatment
Work
Danube Transboundary Analysis
page 7
1. SUMMARY
As the `most international river basin in the world', the Danube River Basin has been subjected to
considerable environmental pollution over many years. Whilst the main problems associated with this
pollution were observed in the Black Sea northwest shelf, seen through the frequent anoxic events as
resulting from nutrient and organic pollution, the majority of the Danube Basin has also been
impacted, by nutrients, organic pollution, hazardous substance pollution and hydromorphological
alterations (resulting in the loss of wetlands/floodplains and interrupting fish migration).
The Danube River Basin has also been the subject of many investigations and studies funded by a wide
range of organisations, with the GEF and the European Commission providing the most sustained
inputs. In addition the countries of the Danube River Basin have actively supported and contributed to
these investigations. These previous studies have resulted in a number of key assessments and
recommendations, in particular a Strategic Action Plan (1994), Transboundary Diagnostic Analysis
(1999), a Joint Action Plan (2000) and most recently in compliance with the EU Water Framework
Directive, a Danube River Basin Analysis (2005). This updated Transboundary Diagnostic Analysis
(2006) is based on the results of the UNDP/GEF Danube Regional Project and these previous
assessments, most significantly, the 2005 Danube Basin Analysis/
The collapse of the former Eastern economies had a beneficial impact on the environment of the
Danube and the Black Sea as industry and agriculture declined. However the region was left with a
legacy of poor infrastructure (for example municipal wastewater treatment works and low connectivity
of the population in some areas to sewer networks) and out-dated environmentally unfriendly
agricultural practices. Efforts to improve the situation have been underway for a number of years.
Wastewater treatment plants are under construction and the upper Danube (the new EU Member
States) improvements in nutrient concentrations and loads are starting to be observed. The situation in
the lower Danube is still to show signs of improvements in the nutrient loads, but the processes are
being introduced for investments, changes in legislation and EU accession that can be expected to
show benefits in a number of years.
Improvements in the environment of the Northwest Black Sea have been observed in recent years
showing positive signs of recovery from the historical pollution. Dissolved oxygen has improved and
the diversity and number of benthic organisms have increased.
The Danube Basin still has many environmental problems, but a mechanism exists through the
International Commission for the Protection of the Danube River (ICPDR) to discuss these issues and
to collectively define the priorities. The EU and the accession process have undoubtedly assisted the
implementation of IRBM throughout the Danube Basin in the form of the EU Water Framework
Directive (WFD). But the contribution of UNDP/GEF and other donors should not be underestimated in
assisting with the accession process.
The implementation of the EU WFD and the strict time-line required by this legislation to achieve `good
status' should be seen as a catalyst to the future improvement of the Danube River and the reduction
of impacts on the Black Sea. In 2009 a River Basin Management Plan will be submitted by the ICPDR
covering transboundary issues and by each country addressing national issues. These plans will contain
concrete specifications to reduce the pollution and the European Commission will be monitor the
implementation of the plan. Failure to follow the agreed plans will result in EC legal actions against the
Member State.
Not all countries of the Danube Basin are EU Member States. The non-EU countries still have many
challenges. Importantly, all the countries have agreed to adopt and implement the WFD, but it would
page 8
be unrealistic to assume that this implementation will be to the same level in the non-EU countries due
to obvious financial limitations.
This updated Transboundary Analysis (based largely on the findings of the 2005 Danube River
Analysis) identified four key concerns that are a priority for the Danube River Basin and the impact of
the Danube River on the Black Sea.
Ę
Nutrient Pollution Ł potentially leading to over enrichment by nutrients and eutrophic
conditions. The main sources were identified as point emissions (both municipal wastewater
and industrial discharges) and diffuse sources, predominately from agriculture.
Ę
Organic Pollution Ł potentially leading to low dissolved oxygen levels in the receiving water.
The main sources were identified as inadequate wastewater treatment from municipalities and
from diffuse sources.
Ę
Hazardous substances Ł potentially leading to environmentally toxic conditions. The main
sources were identified as industrial (both active and from previous industrial sites) and
accidental pollution from shipping or mining activities.
Ę
Hydromorphological Alterations Ł that have led to a loss of wetlands, impact on natural
aquatic conditions and present migration barriers for fish. Hydromorphological alterations are
the result of engineering works in rivers and lakes for navigation, hydropower generation, flood
prevention, etc.
The main focus of the GEF interventions in the Danube River Basin have been directed towards
nutrient pollution and its reduction. This is reflected in the level of information on this specific topic in
this updated Transboundary Diagnostic Analysis.
The future priorities to be addressed in the Danube River Basin with respect to nutrient pollution can
be summarised as:
The decrease of the Danube River nutrient loads in the last decade is partly a positive side
effect of the economic crisis in the middle and lower Danube Basin. The ongoing economic
recovery will potentially result in increasing nutrient loads to the Black Sea. However, the
economic development in these countries is a social necessity, even if an increase in the level
of production probably will lead to an increase of nutrient emissions to the environment in the
future. Therefore, the challenge is to compensate these possible increases by a decrease of
emissions from point and diffuse sources and to level the increase of emissions.
From the present state of knowledge we can derive that future emission control efforts can
best be concentrated on phosphorus (being the limiting nutrient). Furthermore, measures
directed at dissolved P-compounds, which are easily available for algae growth, are most
effective.
The introduction of P-free detergents, P-removal at municipal and industrial wastewater
treatment plants and the avoidance of agricultural point sources are such measures. In the
same time, nitrogen removal from point sources (treatment plants) will play an important role
in nitrogen management, as diffuse sources from agriculture in the Eastern Danubian countries
are bound to increase as a result of the expected economic growth.
The ICPDR and the UNDP/GEF have been actively supporting actions to address diffuse nutrient
sources through a range of interventions including the introduction and piloting of Best
Agricultural Practice in the lower Danube Basin and the promotion of wetlands for nutrient
retention (together with the other benefits of flood mitigation, groundwater recharge and
biodiversity). In addition the DRP has also been supporting activities addressing reduction of P
in washing detergents. This has recently led to a recommendation by the ICPDR for the
Danube Transboundary Analysis
page 9
introduction of P-free detergents across the Danube River Basin and that this will be initiated in
Romania.
Under the EC DABLAS programme a priority list of projects has been identified that would lead
to nutrient reduction from municipal, industrial and land-use sources. The implementation of
these projects seeking investments would have a positive impact on the nutrient pollution.
An agreement has been reached between the International Commissions of the Danube and
the Black Sea for the reversal of nutrient loads to those in 1996 as a long-term objective and
to achieve the mid-1990s levels in the short term. Based on recent work by the MONERIS
model it is expected that full implementation of the EU UWWT Directive (including nutrient
removal in all WWTW larger than 10,000 pe) will result in acceptable loads of phosphorus
being discharged to the Black Se. However this estimate does not take account of any
increases from agricultural sources that can be expected as economic conditions improve. The
model also indicated that additional measures (above those required by the EU directives) may
be needed to ensure that nitrogen loads return to the 1996s levels.
page 10
2. INTRODUCTION
The Danube River Basin is the second largest basin in Europe and the most international in the world
with 181,2 countries within the basin. The last fifteen to twenty years have seen significant changes in
the regions, with the collapse of the former eastern economies and the accession of some of these of
these countries to the European Union. GEF assistance has been provided to the region since 1991 and
together with the EU accession process has significantly assisted with the implementation of Integrated
River Basin Management. An important additional driver for the considerable interest in the Danube
Basin has been the concern on the impact of the Danube River on the northwest Black Sea shelf in the
last decades.
The Danube Countries have had a long history of collaboration and co-operation on the Danube River.
From the Danube Navigation Convention signed in Belgrade in 1948 (which had its roots in the Paris
conferences in 1856 and 1921), the recognition of the importance of water management with the
signing of the Bucharest Declaration (1984), the UNECE Transboundary Water Convention (Helsinki
Convention), the establishment of the Danube River Protection Convention (DRPC) to the latest
European Union water directive Ł the Water Framework Directive (WFD). The principles enshrined in
the UNECE Convention and the DRPC clearly established the importance of Integrated River Basin
Management (IRBM) within the Danube basin.
The Danube Basin has been a story of unique co-operation between UNDP/GEF IRBM support and the
EU accession process. The EU accession (and in particular the EU WFD) has greatly assisted in
accelerating the implementation of IRBM within the basin supported by all the Danube countries. The
support provided by UNDP/GEF has complemented the overall accession process by providing
strengthening of institutions and experts involved in IRBM necessary for EU membership.
This document provides a current assessment of the main issues that are considered to be a threat to
the Danube Basin environment based on extensive work undertaken by the countries in meeting the
EU WFD with support from the UNDP/GEF Danube Regional Project.
2.1.
Background to Danube Basin interventions
The Danube River Basin has been the subject of extensive investments, research and capacity building
initiatives from a wide range of international donors (and basin national governments) over the last 15
years, and is now at a stage of comparative maturity with respect to understanding the issues
affecting the basin. Complementing this international assistance there has been the development and
implementation of a clear legal basis for co-operation in the region (the DRPC) and the establishment
of a strong, mature and sustainable International Commission (the ICPDR).
GEF through UNDP has been heavily involved in the Danube Basin since 1991. Together with the
European Commissions PHARE programme (and other donors) they created the Danube Programme
Co-ordination Unit that focussed on the implementation of the Environmental Programme for the
Protection of the Danube Basin (EPDRB). These interventions led to the preparation in 1994 of the
Strategic Action Plan (SAP) for the Danube River that was then transformed into an operational
implementation plan. The understanding of the key pollution issues within the basin was further
1 Austria, Bosnia and Herzegovina, Croatia, Czech Republic, Slovenia, Slovakia, Serbia and Montenegro, Germany,
Hungary, Romania, Moldova, Ukraine, Bulgaria, Albania, Italy, Macedonia, Poland, Switzerland
2 Recently Serbia & Montenegro have elected to split into two countries. The total number of the countries in the
Danube Basin is now 19.
Danube Transboundary Analysis
page 11
refined under the UNDP/GEF Danube Pollution Reduction Programme that identified the significant
`hotspots' in the basin and prepared a detailed Transboundary Diagnostic Analysis in 1999. The
findings of the TDA were instrumental in developing the objectives of the current UNDP/GEF Danube
Regional Project. Linked to these activities, the newly (1998) ratified Danube Convention, through the
ICPDR, prepared an update of the 1994 SAP in the form of the Joint Action Plan (2000) which
contained the findings of the TDA and pollution `hot-spots' within the basin and provided
recommendations for their mitigation. These outputs were transformed into a prioritised list of
pollution reduction investment opportunities, aimed at a range of funding institutions, covering
municipal, industrial, land use and wetland restorations focused on nutrient and organic pollution
reduction. With the implementation of the EU WFD in 2000 the ICPDR, with significant support from
the UNDP/GEF Danube Regional Project, prepared an Analysis Report (or characterisation assessment)
for the whole basin. This Analysis Report is an important precursor to the development of a legally
binding river basin management plan for the Danube Basin.
In summary the key successes within the Danube River Basin include:
> The support of the EPDRB jointly by GEF and EC PHARE;
> The development of the Strategic Action Plan and it implementation;
> The preparation and signing of the Danube River Protection Convention;
> The establishment of a strong and sustainable Commission for the Danube Basin;
> The preparation of a TDA;
> The preparation of the Joint Action Plan;
> The prioritisation of investments needed to reduce pollution in the basin (DABLAS);
> Support of the Countries and the ICPDR by UNDP/GEF Danube Regional Project in a wide
range of pollution reduction activities;
> Preparation and submission of the EU WFD Danube Basin Analysis report.
These (and other) successes have contributed to the current situation of a well-understood and
characterised river basin within an International Convention agreement and supported by a well
developed and mature Commission. The ICPDR's Joint Action Plan, with support from the EC DABLAS
initiative, has prepared a prioritised list of investments that, when implemented, would address many
of the pollution issues within the basin, including those that are transboundary in nature. The
estimated total costs of these projects are in excess of 4,000 M USD which is expected to result in a
reduction of nitrogen emissions > 50 kt/a and of phosphorus emissions of 9 kt/a. To date (end of
2005) estimates for projects completed or underway are expected to result in a nutrient reduction of
25 kt/a of nitrogen and 4 kt/a of phosphorus. (To put these figures in context: the total emissions to
the Danube Basin are estimated as 758 kt/a for nitrogen and 70 kt/a for phosphorus, with the
measured loads to the Black Sea estimated as 400 kt/a for nitrogen and 12 kt/a for phosphorus.
Within the EU WFD there is a clear timescale where these remaining pollution issues have to be
addressed. The detail of the investments and the actions needed to achieve the `good status' required
by the WFD will be developed over the next two years as a `Programme of Measures' to be included in
the River Basin Management Plan to be submitted to the European Commission as a binding intention
of action in 2009.
2.2.
The need for this updated TDA
The Danube River Basin and the activities that have been undertaken are of interest to a broader
audience Ł particularly outside the region. Whilst the Danube is the `most international basin in the
page 12
world' it has benefited in recent years from the cohesive influence, and financing not only from GEF but
also from the European Union. A key environmental driver in Europe has been the introduction of the
Water Framework Directive that imposes legal requirements on the EU Member States to achieve `good
ecological status' in its water bodies by 2015.
The WFD Analysis Report has many similarities to the GEF Transboundary Diagnostic Analysis as a
stepping-stone to the development of an agreed Strategic Action Plan (or its EU WFD equivalent - the
River Basin Management Plan). This similarity includes the objectives, methodology and outputs of the
assessment. In addition, the objectives of the WFD are analogous to the more widely adopted concepts
of IRBM, and the tools used to implement the WFD (e.g. the Danube Basin Analysis and River Basin
Management Plan) are comparable with those used by GEF International Waters (TDA and SAP). The
common ground between these two policy approaches also includes the requirement for a continuous
process of adaptive management to review and refine the management plans on a five or six year
cycle.
Although these conditions (EU accession) in the Danube make the region unique, there are many
lessons that can be learnt for International Waters programmes elsewhere and this document aims at
portraying the Danube Analysis report in the more familiar global TDA format as the `Danube River
Basin updated TDA (2006).
The Danube Basin Analysis has been a significant achievement by the countries of the basin
coordinated by the ICPDR and, technically and financially assisted by the UNDP/GEF Danube Regional
Project. A detailed assessment of the basin has been completed, endorsed at a senior national level
and submitted as a legal requirement to the European Commission, providing the first detailed
overview of issues of transboundary importance. Whilst not all countries within the Danube River Basin
are EU Member States or in the process of acceding to the EU (nine out of the thirteen3,4 countries of
the Danube River Basin will be EU members) all the Contracting Parties to the ICPDR (all thirteen
countries) asserted that the implementation of the WFD would have the highest priority within the
ICPDR. In 2006, all the environment ministers of the Danube River Basin reaffirmed this in writing.
This updated TDA does not offer a comprehensive assessment of the Danube Basin as a stand-alone
document. It builds on the previous many studies and makes reference to them (including TDA, SAP
and more recent action plans by the ICPDR) but utilises the WFD Danube Analysis to express the
analysis in a GEF International Waters context.
2.3.
UNDP/GEF Danube Regional Project
In 2001, GEF launched their final basin-wide intervention to support the activities of the Danube
countries and the ICPDR with a particular focus on IRBM, nutrient reduction and transboundary co-
operation in the basin, consistent with implementing the Danube River Basin SAP. The project was
implemented by UNDP and co-executed by UNOPS and the ICPDR. The UNDP/GEF Danube Regional
Project (DRP) has provided considerable support to the countries and the ICPDR for the preparation of
the Danube Basin Analysis. An overview of the main activities and achievements of the UNDP/GEF
DRP is provided on data DVD, containing all the project activities.
3 Austria, Bosnia and Herzegovina, Croatia, Czech Republic, Slovenia, Slovakia, Serbia and Montenegro, Germany,
Hungary, Romania, Moldova, Ukraine, Bulgaria.
4 Five of the Danube Basin countries (Poland, Italy, Switzerland Albania and Macedonia) are not Contracting Parties
to the ICPDR as the area of the Danube Basin on their territory is less than 2000 km2
Danube Transboundary Analysis
page 13
2.4.
GEF Danube Ł Black Sea Strategic Partnership
Until the 1960s, the Black Sea was known for its productive fishery, scenic beauty, and as a resort
destination for millions of people. Since that time, as with other water bodies around the world,
massive over fertilisation of the sea by nitrogen and phosphorus from agriculture, municipal, and
industrial sources has seriously degraded the ecosystem, disrupted the fisheries, reduced biodiversity,
posed health threats to humans, and resulted in billions of dollars of economic losses to the economies
of the 6 countries.
The Danube River as one of the main sources of nutrients flowing to the Black Sea is also facing a
problem of pollution by nutrients and toxic substances due to industrial activities, extensive
agriculture, growing municipal communities that have a negative impact on the river including its,
water quality, water uses (e.g. water supplies for inhabitants), aquatic life, etc.
Pollution from the Danube Basin countries has created this transboundary water quality problem. Since
1992, efforts have been underway with European Union and GEF support to gradually reverse the
situation in the Danube and the Black Sea Basin.
Through its Operational Strategy the GEF identified that there is a need to: (a) build the capacity of
countries to work together, (b) jointly understand and set priorities based on the environmental status
of their water body, (c) identify actions and develop the political commitment to address the top
priority transboundary problems, and then (d) to implement the agreed policy, legal, and institutional
reforms and investments needed to address them.
Following the previous GEF assistance and building on the achieved results and efforts of the
participating countries in the Danube Black Sea Region, a Strategic Partnership was developed, with
aim to accelerate implementation of nutrient reduction measures and policy/legal/institutional reforms
in the basin.
GEF and its Implementing Agencies are implementing the Strategic Partnership consisting of capital
investments, economic instruments, development and enforcement of environmental law and policy,
strengthening of public participation, and monitoring of trends and compliance over the period of
2001-2007 for the countries of the Danube/Black Sea basin.
This Partnership is composed of three complementary parts:
1.
The Black Sea Ecosystems Recovery Project - a GEF Black Sea Regional capacity building and
technical assistance element implemented (in cooperation with the Black Sea Commission
under the leadership of UNDP and with the assistance of UNEP for defined components;
2.
The Danube Regional Project - a GEF Danube River basin regional capacity building and
technical assistance element implemented (in cooperation with the ICPDR) under the
leadership of UNDP;
3.
The GEF/World Bank Partnership Investment Fund - a GEF / World Bank supported Investment
Fund for Nutrient Reduction focused on single country nutrient reduction investments.
In addition, activities of the countries, EC, EBRD, EIB, and bilateral support aimed at similar objectives
targeting reduction of nutrients and toxic pollutants, as well as the ongoing Dnipro project, are
considered as contribution to the Strategic Partnership.
Both, the Danube Regional Project and its sister project based in Istanbul - the Black Sea Ecosystems
Recovery Project will strengthen the respective Commissions and will assist countries in their efforts to
adopt necessary policy, legal and institutional reforms and enforcement of environmental regulations
(with particular attention to the reduction of nutrients and toxic substances). The GEF/World Bank
Nutrient Reduction Investment Fund is entailing direct investments aimed at concrete reductions in
page 14
pollution, primarily nutrients, at the national level that can then be replicated throughout the Danube
and Black Sea region.
2.5.
Structure of the updated Transboundary Diagnostic Analysis
Report.
This updated TDA is largely based on the EU Water Framework Directive `Danube River Basin Analysis'
report that was prepared by the countries of the basin and submitted to the European Commission as
a legal obligation in 2005. As there has been an initial TDA (1999, prepared by the UNDP/GEF Danube
Pollution Reduction Programme), this document updates the most critical parts of this initial TDA with
information available from the Danube River Basin Analysis report. In addition the approach adopted
for this update has been to follow as closely as possible the terminology and conclusions accepted by
the Danube countries for the Danube Basin Analysis Report, but attempts to present these conclusions
within the structure of a TDA.
There are a number of `gaps' in this report as compared to a traditional TDA. For example, a full
stakeholder analysis is not presented (although as a requirement for the EU WFD, full stakeholder
engagement and public participation has been an integral part of the Danube Basin Analysis). Limited
socio-economic information has also been collected in the region for the WFD report (this only
addressed socio-economic aspects of water and water use in the basin).
The most important aspect of this report is that it is based on reports that have been prepared and
endorsed by the countries, under the guidance of the ICPDR, and consequently the information it
contains has a high level of national acceptance.
The structure of this report follows that recommended for a TDA as:
> Methodology: This section provides an understanding of the process (political, institutional
and technical) leading to the submission of the EU WFD Danube Basin Analysis to the European
Commission. The considerable support that was provided by the UNDP/GEF DRP is
summarised. The four key transboundary concerns (nutrient pollution, organic pollution,
hazardous substance pollution and hydromorphological alterations) are covered.
> Description of the Danube River Basin: This section provides an introduction to the basin
characteristics including the environmental status and institutional arrangements within the
basin.
> Priority Transboundary Concerns: The section begins with an assessment of the whole
basin in terms of the `risk' of failing to meet the WFD expectations of `good ecological status'
by 2015. Each of the four issues is addressed in detail, based on the information collected for
the Danube Basin Analysis. An important component of the work of the ICPDR and the
UNDP/GEF DRP has been an assessment of the impact of the Danube on the Black Sea. A
recent report, prepared for the GEF Council is used to supplement the information available in
the Danube Basin Analysis report.
> Stakeholder Involvement in the Danube River Basin: As explained above, a full
stakeholder analysis as expected within a TDA is not reported. However the key activities that
have been undertaken in the basin involving a wide range of stakeholders including the
broader public are summarised in this update.
> Analysis of Institutions, Legislation and Investments: This section provides an
introduction to the water and environmental management within the Danube River Basin, both
at a national and at the transboundary levels to identify causes of the transboundary concerns.
Danube Transboundary Analysis
page 15
3. METHODOLOGY
3.1. Introduction
This updated TDA has been developed using material developed in previous and on-going programmes
including:
> SAP (1994) Ł Strategic Action Plan developed under the Environmental Programme for the
Danube River Basin (EPDRB) managed by the Danube Programme Co-ordination Unit (PCU)
and funded by UNDP/GEF and the EC Phare environment programme;
> SIP (1995) - SAP Implementation Plan;
> UNDP/GEF Danube Nutrient Reduction Programme (1997 Ł1999)
> TDA prepared under UNDP/GEF Danube Nutrient Reduction Programme (1999),
> ICPDR Joint Action Plan 2000- 2005,
> EU WFD submissions co-ordinated by the ICPDR and in particular the `Danube Basin Analysis'
approved by the ICPDR in December 2004 and submitted to the EC in March 2005;
> EC supported DABLAS programme (specific reports in 2002 and 2004),
> UNDP/GEF Danube Regional Project (2001 Ł 2006)
The key source for this TDA has been the EU WFD Danube River Analysis (the full report is available on
the DRP data DVD and is also available to download from www.icpdr.org).
This section of the Transboundary Analysis Report provides a brief description of the process that led
to the submission of the EU WFD Danube River Analysis together with a synthesis of this report with
other sources to provide an understanding of the key transboundary issues.
3.2. Guidance
on
TDA
A Transboundary Diagnostic Analysis (TDA) is an objective, non-negotiated analysis using best
available verified scientific information that identifies key transboundary concerns and their root causes
. It provides the factual basis for the formulation of a Strategic Action Programme (SAP), which will
embody specific actions (policy, legal, institutional reforms or investments) that can be adopted
nationally, usually within a harmonised multinational context, to address the major priority
transboundary concerns identified in the TDA, and over the longer term enable the sustainable
development and environmental protection of the specific transboundary system.
Historically, advice on TDA and SAP approaches given by GEF has been rather limited. However, the
experiences of senior IA portfolio managers, IW Chief Technical Advisors and practitioners from a
number of IW projects, together with GEF IW Focal Area Programme Study, provided an opportunity to
develop more formal guidelines to assist with the preparation of TDAs and to ensure inter-regional
comparability.
Consequently a GEF guidance document was developed to provide a road map for best practice in
formulating a TDA and a SAP as part of a GEF IW project. It was prepared on the basis of discussions
between specialists from UNDP, UNEP and the GEF Secretariat, together with practitioners who had
completed the process in freshwater and marine systems. The final document reflected the experience
obtained in developing TDA/SAPs between 1996 and 2003 but was not intended as a prescriptive
page 16
formula, merely a guide that should be adapted to the cultural socio-economic and political realities of
each region.
The GEF IW TDA/SAP "best practice" approach consists of the following steps:
> Identification and initial prioritisation of transboundary concerns;
> Gathering and interpreting information on environmental and water resources impacts
and socio-economic consequences of each priority concern;
> Causal chain analysis (including root causes)
> Completion of an analysis of institutions, laws, policies and projected investments
It focuses on transboundary concerns without ignoring national ones, sets priorities and identifies
information gaps, policy distortions and institutional deficiencies. The analysis is cross-sectoral and
examines national economic development plans, civil society (including private sector) awareness and
participation, the regulatory and institutional framework and sectoral economic policies.
This TDA update, based on the EU WFD analysis, attempts to follow the overall concept for a TDA but
clearly the source material and the objectives within the ICPDR and the UNDP/GEF DRP have some
differences.
3.3.
Preparation of the EU WFD Danube Basin Analysis
3.3.1. Background to IRBM in the Danube Basin
The Danube River Protection Convention forms the overall legal instrument for cooperation and
transboundary water management in the Danube River Basin. The main objectives of the Convention
are to ensure that surface waters and groundwater are sustainably and equitably used, and that the
basin's riverine ecosystems are conserved and restored. (See sections 4.6 on Institutional setting and
ng and Governance Analysis respectively.)
3.3.2. The EU Water Framework Directive
The EU Water Framework Directive (WFD) is the legislative framework for water management in
Europe (all EU member states are legally bound by this legislation). It sets clear objectives that a good
water quality status must be achieved by 2015 and that sustainable water use is ensured throughout
Europe. Specifically, the WFD
> Sets uniform standards in water policy throughout the European Union and integrates
different policy areas involving water issues,
> Introduces the river basin approach for the development of integrated and coordinated river
basin management for all European river systems,
> Stipulates a defined time-frame for the achievement of the good status of surface water and
groundwater,
> Introduces the economic analysis of water use in order to estimate the most cost-effective
combination of measures in respect to water uses,
> Includes public participation in the development of river basin management plans
encouraging active involvement of interested parties including stakeholders, non-
governmental organisations and citizens.
Danube Transboundary Analysis
page 17
The EU WFD requires Member States to individually comply with the Directive and to actively co-
ordinate their compliance with other countries (both members and non-members) within a river basin.
3.3.3. Activities
undertaken
To prepare the Danube Basin Analysis the ICPDR created a River Basin Management Expert Group
(RBM EG) to lead and co-ordinate the inputs from a number of other ICPDR Expert Groups (see Figure
28). The RBM EG requested technical assistance from a range of national and international experts to
assist with the analysis of basin and to develop new methodologies for assessing the pressures and
their impacts on the aquatic environment.
The preparation and submission of the WFD analysis (in accordance with Article V of this directive) was
divided into two sections.
> Part `A' Ł Issues of basin-wide or transboundary importance co-ordinated by the ICPDR
(referred to as a `Roof Report'); and
> Part `B' Ł National reports prepared and submitted by each country to the EC.
The Danube Basin Analysis (and this TDA update) is associated with Part A, reporting on issues of
transboundary importance.
The UNDP/GEF Danube Regional Project provided significant resources to assist with this work,
including the provision of experts, workshops and meetings. The main technical assignments
conducted by the DRP in the preparation of the Danube Basin Analysis includes:
> Identification of heavily modified water bodies (HMWB);
> Hydromorphological pressures, impacts and risk assessment;
> Characterisation of groundwaters;
> Nutrient loads and eutrophication;
> Significant point and diffuse sources of pollution;
> Identification and characterisation of water bodies;
> Preparation of maps;
> Economic analysis on water use;
> Agrochemical inventories.
In addition the DRP supported a wide range of technical meetings and workshops leading to the final
agreement of the Danube Analysis Report.
The WFD and the first main output (Danube Basin Analysis report) provide considerable broadening of
the information traditionally assembled for a TDA. Significantly the WFD is a legal requirement for the
majority of the Danube Basin countries that places clear obligations on the implementation of the
actions identified to reduce pollution. In addition the WFD requires the countries to periodically review
and update their plans in process similar to the `adaptive management' framework recommended by
the GEF.
page 18
3.4. Identification
of
priority transboundary concerns
The key tools used in the identification of the priority transboundary concerns included:
> Results of environmental and water monitoring programmes;
> Risk assessment of meeting the required good status of the WFD
> Expert judgement in the absence of appropriate data.
3.4.1. Water-related Environmental Monitoring
The ICPDR has created a monitoring network that was designed to detect changes of transboundary
significance. The Trans-National Monitoring Network (TNMN) is a monitoring programme for chemical
and biological variables at 79 monitoring sites on the Danube and its major tributaries. The TNMN was
established in 1996 and all countries contribute data to this programme. An analytical quality control
(AQC) system (for chemical determinands) is in place to ensure the comparability of results. In
addition to the in-laboratory routine AQC, a programme of inter-laboratory check-samples is operated
covering all the main determinands
In 2001 the ICPDR initiated an integrated river survey Ł the Joint Danube Survey (JDS). This exercise,
which will be repeated every 5 Ł 6 years, has contributed a significant data set that was utilised in the
preparation of the Danube Basin Analysis report. In particular, it provided considerable data on
biological determinands.
3.4.2. `Risk of failure' to meet good status
The WFD requires Member States to carry out an assessment of the likelihood that water bodies will
fail to meet the environmental quality objectives by 2015. The objectives include both the overall
objective to achieve good status by 2015, and additional specific objectives that apply to protected
areas as defined by other legislation. The objectives also depend on the current status of the water
body, since Member States must generally prevent any deterioration in the status.
Failure to achieve the objectives on surface waters may be the result from a very wide range of
pressures, including point source discharges, diffuse source discharges, water abstractions, water flow
regulation and morphological alterations. These and other pressures5 that could affect the status of
aquatic ecosystems must be considered in the analysis. The risk assessment is therefore based on
information collected in the pressure and impact analysis.
3.4.3. Priority Transboundary Concerns
On the basis of the data from the TNMN, the risk assessment and expert judgement, the ICPDR's River
Basin Management Expert Group (RBM EG) identified the main pressures (immediate causes) in the
Danube River Basin as:
> Point source pollution (e.g. from urban and industrial wastewater treatment plants or
management sites). Impacts on water bodies can result from the input of nutrients, organic
substances and hazardous substances;
5 The equivalent GEF terminology would be `stresses' rather than `pressures'.
Danube Transboundary Analysis
page 19
> Diffuse source pollution (e.g. from agriculture and urban use activities). Impacts on water
bodies can result from the input of nutrients (e.g. fertilisers), organic substances (e.g. from
manure) and hazardous substances (e.g. pesticides and herbicides).
> Hydrological alterations (e.g. water abstraction, hydro-peaking, flow regulation). Impacts
on water bodies can result from changes to the hydrological conditions and the impact of this
on, for example, biological communities;
> Morphological alterations (e.g. impoundments, weirs, bank reinforcements, channelling).
Impacts on water bodies can result from hydraulic engineering measures altering the
structural characteristics of the water body, for example restricting fish migration due to
dams.
From these main pressures (or stresses) on the Danube River Basin the RMB EG identified the four
priority transboundary concerns as:
> Nutrient pollution Ł from diffuse (e.g. agriculture) and point sources (e.g. municipal
wastewater);
> Organic pollution - from diffuse (e.g. agriculture) and point sources (e.g. municipal
wastewater);
> Hazardous substances Ł from point sources (e.g. industry) or diffuse sources (e.g.
agriculture or contaminated sites); and
> Hydromorphological alterations Ł from flood defences, hydropower, navigation etc.
3.5.
Pressure and Impact Assessment / Causal chain analysis
The approach used in the Danube Analysis followed the `DPSIR' Ł Drivers, Pressures, State, Impact
and Response6 that is used extensively by the EC and EEA to assess the performance of policy
initiatives. This has much similarity to the Causal Chain Analysis (CCA) more usually undertaken in a
TDA. The approach adopted in the Danube (to establish the pressures on the environment and their
impact on the ecology) has been accepted by all the countries and is an important precursor to the
river basin management plan and the `programme of measures', where the issues identified in the
Danube Basin Analysis are mitigated. This mitigation will require significant policy reforms and
investments from the countries endorsing the Danube Basin Analysis report.
The Danube Basin Analysis identified gaps in the existing information in the assessment of pressures
and their impacts. The Danube countries are currently working to address these gaps prior to the
submission of the WFD River Basin Management Plan in 2009. This plan, through the agreed
`Programme of Measures' will detail the activities that will be undertaken by the countries to achieve
the required `good status' for the Danube Basin water bodies.
The pressures and impacts assessment adopted for the preparation of the Danube River Analysis
followed a four-step process:
1.
Describing the driving forces, especially land use, urban development, industry, agriculture
and other activities which lead to pressures, without regard to their actual impacts;
2.
Identifying pressures with possible impacts on the water body and on water uses, by
considering the magnitude of the pressures and the susceptibility of the water body;
3.
Assessing the impacts resulting from the pressures; and
6 In GEF terminology, drivers equate to underlying causes, pressures to immediate causes, status to environmental
impacts and impacts to socio-economic impacts
page 20
4.
Evaluating the likelihood of failing to meet the objective.
While pressures from sources resulting from a large number of human activities (e.g. households,
industrial activity, power generation, agriculture, forestry, fish farming, mining, navigation, dredging,
etc.) have an impact, only those pressures that have significant impacts on the basin-wide level were
addressed in the `Roof Report' of the Danube River Analysis.
3.6. Governance
analysis
The overall management and co-ordination of the Danube River Basin is the responsibility of the
ICPDR. The ICPDR is composed of the countries of the Danube Basin and the structure of this
institution is described later. A number of studies have been conducted over the last 15 years that
describe the progress of the Danube countries in migrating their environment legal and policy
instruments to be compliant with EU and other international obligations.
The UNDP/GEF DRP, within the period 2002-2006, conducted a thorough analysis of institutional and
policy frameworks in all Danube countries, which enabled policy reform recommendations to be
developed addressing overall water governance.
Specific analytical studies on inter-ministerial coordination and government decision-making
mechanisms, on policy, legislation and institutional set-ups have been carried out with focus on
agricultural and industrial pollution and wetland management. The analysis of existing situation,
capacities and structures, and policy reform recommendations for economic analysis of water
resources and further development of public water infrastructure were also developed.
The UNDP/GEF DRP and the ICPDR studies and analysis addressed policy development and
implementation, legislative reforms and environmental laws enforcement as well as mechanisms and
conditions for resource allocation and investment needs for elimination of major transboundary
environmental issues by the main stakeholders.
Danube Transboundary Analysis
page 21
4.
DESCRIPTION OF DANUBE RIVER BASIN
4.1. Introduction
This section provides an overview of the Danube River Basin, covering the physical characteristics of
the basin, a summary of the status of the main water bodies and an introduction to the institutional
arrangements within the basin.
4.2.
Physical and geographic characterisation
The Danube River Basin7 is the second largest river basin in Europe after the Volga covering 801,463
km▓. It lies to the west of the Black Sea in Central and South-eastern Europe (see Figure 1, Figure 2).
Due to its geologic and geographic conditions the Danube River Basin can be divided into 3 main parts.
> The Upper Danube Basin is from the sources in the Black Forest Mountains to the Gate of
DevĒn, to the east of Vienna.
> The Middle Danube Basin is from the Gate of DevĒn to the impressive gorge of the Danube at
the Iron Gate, which divides the Southern Carpathian Mountains in the north and the Balkan
Mountains in the south.
> The Lower Danube Basin covers the Romanian-Bulgarian Danube sub-basins downstream of
Cazane Gorge and extends to the Danube Delta and the Black Sea.
The Danube River Basin shows a tremendous diversity of habitats through which rivers and stream
flow including glaciated high-gradient mountains, forested midland mountains and hills, upland
plateaus and through plains and wet lowlands near sea level.
4.2.1. Climate and hydrology
Due to its large extension from west to east, and diverse relief, the Danube River Basin also shows
great differences in climate. The upper regions in the west show strong influence from the Atlantic
climate with high precipitation, whereas the eastern regions are affected by Continental climate with
lower precipitation and typical cold winters. In the area of the Drava and Sava, influences from the
Mediterranean climate, can also be detected. The precipitation ranges from < 500 mm to > 2000 mm
in the region.
7 The area of the DRB was determined digitally with GIS. If other sources are consulted this value may vary slightly,
because other methods of calculation have been used.
page 22
Figure 1: Location of the Danube River Basin
The hydrologic regime of the Danube River is distinctly influenced by the regional precipitation
patterns. This is well illustrated in Figure 3, which shows the surface water contribution from each
country to the cumulative discharge of the Danube. Austria shows by far the largest contribution (22.1
%) followed by Romania (17.6 %). This reflects the high precipitation in the Alps and in the Carpathian
mountains. In the upper part of the Danube the Inn contributes the main water volume adding more
water to the Danube than it has itself at the point of confluence of the two. In the middle reach it is
the Drava, Tisza and Sava, which together contribute almost half of the total discharge that finally
reaches the Black Sea.
Danube Transboundary Analysis
page 23
Figure 2: The Danube River Basin
page 24
Altitude
Discharge
Discharge
in m a.s.l.
Upper Danube
Middle Danube
Lower Danube
in m3/s
per country:
700
7000
m3/s
%
Ukraine
Moldova
279
4,3
Romania
49
0,7
600
6000
Bulgaria
Bosnia i Herzegovina
1151
17,6
Serbia and Montenegro
Croatia
500
5000
Slovenia
243
3,7
Hungary
Slovak Republic
574
8,8
400
Czech Republic
4000
Austria
741
11,3
Germany
Elevation
421
6,4
202
3,1
300
3000
283
4,3
125
1,9
81
1,2
200
2000
1448
22,1
100
1000
952
14,5
0
0
2800 2600 2400 2200 2000 1800 1600 1400 1200 1000 800
600
400
200
0
6551
100,0
Distance from the
Inn
Drava
Sava
Delta
Black Sea in km
735 m3/s
577 m3/s
1564 m3/s
6550 m3/s
Tisza
Iron Gates
794 m3/s
5520 m3/s
Figure 3: Longitudinal profile of the Danube River and contribution of water from each country (in
%) to the cumulative discharge of the Danube (in millions m3/year), based on data for 1994-1997
using the Danube Water Quality Model8
4.2.2. The Danube River and its main tributaries
The Danube rises in the Black Forest (Schwarzwald) in Germany at an altitude of about 1,000 m. The
Danube river and receives its name at the confluence of Brigach and Breg in Donaueschingen. The
Danube flows predominantly to the south-east and reaches the Black Sea after 2,780 km where it
divides into 3 main branches, the Chilia, the Sulina, and the Sf. Gheorghe Branch. At its mouth the
Danube has an average discharge of about 6,500 m3/s. The Danube Delta lies in Romania and partly in
Ukraine and is a unique "World Nature Heritage". The entire protected area covers 675,000 ha
including floodplains, and more than 600 natural lakes larger than one hectare, and marine areas. The
Danube is the largest tributary into the Black Sea.
The most significant tributaries of the Danube River include:
> The Tysa/Tisza/Tisa River basin is the largest sub-basin in the Danube River Basin
(157,186 km▓). It is also the longest tributary (966 km) of the Danube. By flow volume it is
second largest after the Sava River.
> The Sava River is the largest Danube tributary by discharge (average 1,564 m│/s) and the
second largest by catchment area (95,419 km▓).
> The Prut River is the second longest (950 km) and the last tributary of the Danube, with its
mouth just upstream of the Danube Delta.
8 Developed during the Danube River Pollution Reduction Programme in 1999, UNDP/GEF (1999b).
Danube Transboundary Analysis
page 25
A list of the main tributaries and their characteristics are presented in the WFD Danube River Basin
Analysis.
4.2.3. Important lakes in the Danube River Basin
In the Danube River Basin there are a multitude of natural lakes. Most of them are small, but some are
also very large, with areas of several square kilometres. The middle Danube region shows some
characteristic steppe lakes, of which the most prominent ones are Neusiedlersee / Fert-t¾ and Lake
Balaton.
4.2.4. Major wetlands and other Protected Areas in the Danube River Basin
District
Floodplain forests, marshlands, deltas, floodplain corridors, lake shores and other wetlands are
essential components in the Danube River Basin's biodiversity and hydrology. Many of the larger
wetland areas are transboundary in nature. The wetlands in the Alps and Carpathians also represent
valuable drinking water reserves for millions of people.
The current extent of wetlands in the DRB is only a remnant of the former wetland systems and it is
estimated that over 80% of former wetlands and floodplains have been lost. The main wetland and
protected areas of transboundary importance are shown in Figure 4.
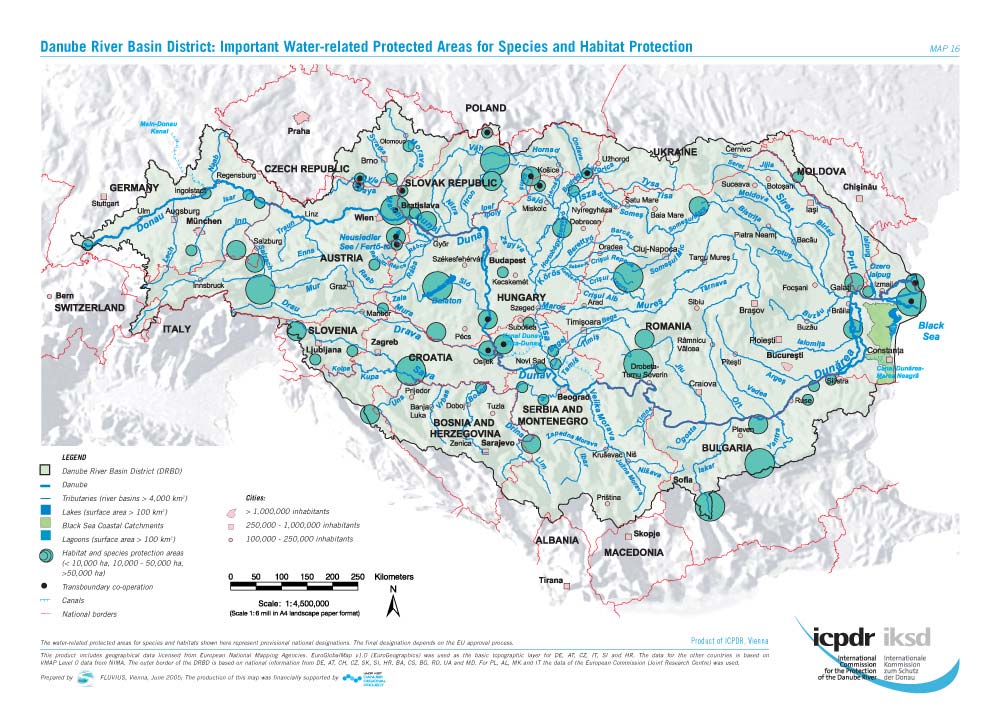
page 26
Figure 4: Major Protected Areas within the Danube River Basin
Danube Transboundary Analysis
page 27
4.2.5. Groundwater in the Danube River Basin District
Besides porous aquifers there are many karstic aquifers in the DRB. Due to their high permeability
karstic aquifers are highly vulnerable to contamination. The percolation time for contaminants is very
short and therefore natural purification processes are very limited. For selected countries such as
Bulgaria, Croatia, and Serbia and Montenegro, groundwater resources represent as much as 30 % of
total internal renewable water resources.
A large number of transboundary aquifers exist in the region. Not much is known at present about the
availability of groundwater or potential extraction capacity in many countries, although aquifers are the
main sources for drinking and industrial water.
4.3. Ecological
status
Some sections of the Danube River are still rather untouched ecosystems and, despite possible
pollution problems, constitute a unique heritage to be preserved. In addition, the Danube River Basin
still hosts many species and habitats of outstanding ecological value and unique importance for
biodiversity. In particular the Danube Delta is of global significance. The future management of the
river basin needs to ensure that the focus of measures is not only the restoration of affected water
bodies but equally important is the preservation of those few areas that are still ecologically intact.
The current analysis shows that, in the last two decades, considerable improvements in environmental
conditions in the Danube basin have been made. Where investments, e.g. in wastewater treatment,
have taken place, the improvement of the water quality is visible. However, a major part of pollution
reduction can be attributed to the decline of industries and agricultural activities in the middle and
lower parts of the basin since 1989. In these areas investments for a sustainable reduction of pollution
levels has just started and will have to continue for another 10 to 20 years.
The Danube River Basin contains a large number of wetlands offering unique habitats for a rich and
diverse aquatic community. Many of these areas have high protection status such as the large wetland
complexes protected under international conventions, others still deserve to be designated as
protected areas, but have not been granted such status. 80 % of the historical floodplain on the large
rivers has been lost during the last 150 years mainly from significant hydromorphological alterations,
and many already protected areas deteriorate due to new human interventions. Still today, many
wetlands are under pressure (stress) from navigation, hydropower plants, intensive agriculture and
forestry as well as from new infrastructure projects. Wetland restoration can bring many benefits, in
particular for flood protection. As a first step, an inventory of the most important water-related
protected areas for species and habitat protection has been established for the Danube River Basin.
The Danube Delta has suffered significant impacts from anthropogenic activities in the last 50 years.
These were caused in part by high nutrient loads and heavy metals from the Danube. Nutrient inflow
has led to eutrophication of the delta arms and its lakes; elevated concentrations of heavy metals
occur especially in the delta lakes. In addition, severe hydromorphological alterations and intensive
agriculture and forestry have led to the loss and deterioration of large areas of land formerly unused
and interconnected within the delta. As a consequence species and habitat diversity has declined. The
large number of hydraulic structures on the Danube and its tributaries has also considerably reduced
the sediment transport thereby bringing the growth of the Danube Delta into the Black Sea in parts to
a halt.
page 28
Although considerable restoration measures have been undertaken in the last decade new canalisation
projects are still being planned and implemented. Sound environmental impact assessments need to
be carried out and alternative solutions found in order to protect this unique natural heritage of global
importance.
4.4.
Socio-economic situation
4.4.1. Social
Economic
Indicators
There are significant differences in the GDP between the western Danube Basin (Austria and Germany)
and the eastern region (Moldova and Ukraine). These historic differences have an obvious impact on
the country's ability to address the environmental issues identified in the Danube Basin Analysis
report.
Table 1: General
socio-economic
indicators
GDP
Total
GDP per capita
GDP per capita
population
(in million EUR)
(million )
(in EUR per capita) (in PPP EUR per capita)
Albania 14
<0.01
1,390
na
Austria
198,611
7.7
25,795
25,521
Bosnia i Herzegovina
3,493
2.9
1,204
na
Bulgaria
7,266
3.5
2,076
8,010
Croatia
12,942
3.1
4,175
7,460
Czech Republic
15,247
2.8
5,461
13,226
Germany
285,075
9.4
30,321
29,215
Hungary
50,663
10.1
5,016
11,243
Italy
403
0.02
20,225
22,457
Macedonia 19
<0.01
1,921
6,020
Moldova 394
1.1
358
na
Poland
187
0.04
4,672
9,230
Romania
38,908
21.7
1,795
5,264
Serbia and Montenegro
8,628
9.0
959
na
Slovak Republic
21,077
5.2
4,059
11,157
Slovenia
17,182
1.7
9,892
14,696
Switzerland
739
0.02
37,258
na
Ukraine
1,840
2.7
686
3,706
4.5. Climate
Change
To date there relatively limited assessments of the potential scenarios of climate change linked the
Danube River Basin. However the suggestion from hydrological and climate modelling (globally) is that
the probability and extent of extreme drought events during summer and extreme rain events in
winter is expected to increase. This is believed to also apply to the Danube River Basin and in response
the ICPDR initiated the development of a Flood Action Programme9.
There is also need for a better understanding, for example, of the impacts of climate change on the
nutrient loads within the Danube Basin. It is well known that under high discharge conditions as a
9 ICPDR 2004: Flood Action Programme Ł Action programme for sustainable flood protection in the Danube River
Basin.
Danube Transboundary Analysis
page 29
result of floods, sediment transport increases significantly (an issue in itself) and that phosphorus is
often associated with the particulates in sediments. More data is required in flood events on nutrient
loads to provide better estimates of the likely impacts on the Black Sea as a result of these extreme
events.
Climate change could be a contributory factor in increasing nutrient concentrations in the Black Sea,
with internal loading of nutrients in the NW Shelf appearing to be linked to wind speed, direction and
duration. This may be a direct effect of physical mixing at the sediment-water interface and/or a
indirect effect caused through changes to the dissolved oxygen status of shallow benthic areas: at
higher dissolved oxygen levels less phosphate is released from sediments, nitrification is promoted and
dentrification is inhibited.
All countries of the Danube Basin are committed to the issue of climate change and are signatories to
the UN Framework Convention on Climate Change.
4.6. Institutional
setting
The interest of Danube countries in improving basin-wide cooperation in water management began in
the 1980s. The first important agreement, the `Bucharest Declaration on Water Management of
the Danube River', was signed in 1985. Danube countries agreed to coordinate water management
activities on an international level and to protect the Danube and its tributaries from pollution. The
goals were ambitious but the political and economic situation in the region at the time hindered
effective implementation. One key outcome was the establishment of an international monitoring
system for water quality.
After 1989, massive regional political changes in Central and Eastern Europe (CEE) opened the door for
new opportunities including regional environmental cooperation. In June 1991, the idea to create a
`Danube River Protection Convention (DRPC)' was supported by countries at the first UNECE
`Environment for Europe' conference held at the Dobris Castle in the Czech Republic.
The need for a DRPC was further driven by Danube countries becoming Parties to the new UNECE
Convention on the Protection of Trans-boundary Rivers and Lakes signed in Helsinki in March
1992. It obliged Parties to take action to prevent trans-boundary impacts on watercourses and
encouraged them to cooperate through river basin management agreements. In effect, the Helsinki
Convention became the framework for the DRPC.
In 1992, the first GEF Danube River Basin project was funded. Two years later, on June 29, 1994 in
Sofia, Bulgaria, 11 Danube countries and the EU signed the DRPC. It became the overall legal
framework and instrument for cooperation in protecting and sustainable use of water and other shared
ecological resources.
The DRPC came into force on October 22, 1998. The first subsequent formal meeting on October 27 in
Vienna led to the establishment of the International Commission for the Protection of the
Danube River (ICPDR) and its Permanent Secretariat. The ICPDR became the legally responsible
institution for further development of Danube water management and related international laws, and
for regional cooperation in Danube IRBM.
The EU formally adopted the Water Framework Directive (WFD) in 2000. The WFD is the
operational tool of a thoroughly restructured European Water Policy. Setting the objectives for water
protection well into the 21st century, it covers surface and ground waters and aims to achieve "good
status" for all waters by 2015.
page 30
It obliges Member States and accession countries to fulfil the WFD and use a river basin approach for
managing water resources. It requires cross-border cooperation and encourages multi-stakeholder
cooperation including from NGOs and local citizens. It aims to ensure both good water quality and
ecosystem health.
It obliges every EU river basin, including the Danube, to develop a `River Basin Analysis' by 2004,
followed by a `River Basin Management Plan (RBMP)' by 2009 which specifies the `Programme of
Measures' required to meet the 2015 WFD objectives.
At its 3rd Ordinary Meeting on November 27-28, 2000 in Sofia the ICPDR made the following
resolutions:
> The ICPDR will provide the platform for the coordination necessary to develop and establish
the River Basin Management Plan for the Danube River Basin.
> The Contracting Parties ensure to make all efforts to arrive at a coordinated international
River Basin Management Plan for the Danube River Basin in line with the requirements of the
WFD.
These resolutions were supported by both EU and non-EU members of the ICPDR. In addition countries
that are in the Danube Basin but not formally Contracting Parties of the ICPDR due to the area of the
Danube within their countries (Poland, Switzerland, Macedonia, Italy and Albania) have also agreed to
co-operate on the development and implementation of the EU WFD with the ICPDR. These resolutions
made by the Heads of Delegation to the ICPDR was reconfirmed in writing by ministers of environment
/ water management from all countries.
Danube Transboundary Analysis
page 31
5. PRIORITY
TRANSBOUNDARY
CONCERNS
5.1. Introduction
This section provides an overview of the four agreed priority concerns of transboundary importance in
the Danube River Basin, viz. Nutrient pollution, organic pollution, pollution from hazardous substances
and hydromorphological alterations. An important source of information for this identification has been
the TNMN Ł the Trans-National Monitoring Network (see Section 3.4.1). An additional source of
information for this priority setting has been the estimation of water bodies `failing to meet the
objectives of the WFD by 2015'. The procedure adopted in these risk estimations is briefly described in
Section 3.4.2.
The evaluations of the risk analysis for the Danube are based on the length of the water bodies that
have been identified. The information about the risk of failure is presented in disaggregated form, i.e.
evaluation of the single risk categories.
The following summary of the results can be made:
> The upper Danube, where chains of hydropower plants exist, is mainly impacted by
hydromorphological alterations.
> The Middle Danube is classified as "possibly at risk" due to hazardous substances for the
largest part.
> The Danube section shared by Slovakia and Hungary is classified as "at risk" due to
hydromorphological alterations.
> The part of the Danube shared by Croatia, and Serbia and Montenegro is "possibly at
risk" in all categories since not enough data is available for a sure assessment.
> The lower Danube is "at risk" due to nutrient pollution and hazardous substances, and in
large parts due to hydromorphological alterations. It is "possibly at risk" due to organic
pollution.
Based on the analysis the percentages of river length were calculated that are "at risk", "possibly at
risk" and "not at risk".
> 58 % of the Danube is "at risk" or "possibly at risk" due to organic pollution (Figure 5);
> 65 % of the Danube is "at risk" or "possibly at risk" due to nutrient pollution (Figure 6);
> 74 % of the Danube is "at risk" or "possibly at risk" due to hazardous substances (Figure 7);
> 93 % of the Danube is "at risk" or "possibly at risk" due to hydromorphological alterations
(Figure 8).
This summary is shown on the following maps (figures 5 Ł 8) and represented graphically for the main
Danube River in Figure 9.
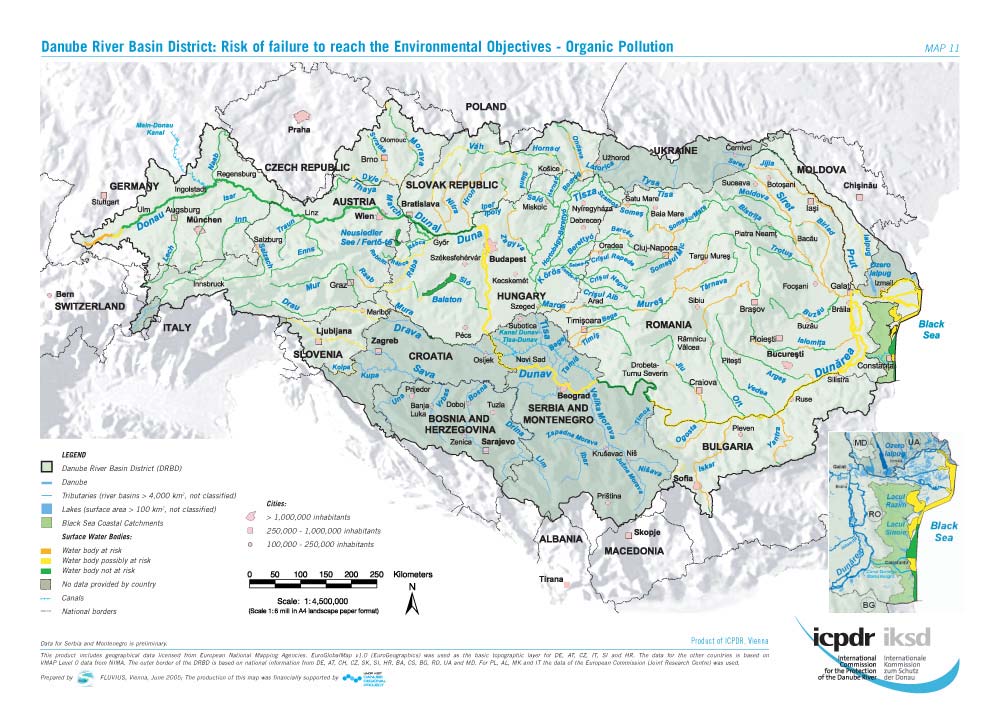
page 32
Figure 5: Risk of Failure to Reach Environment Objectives Ł Organic Pollution
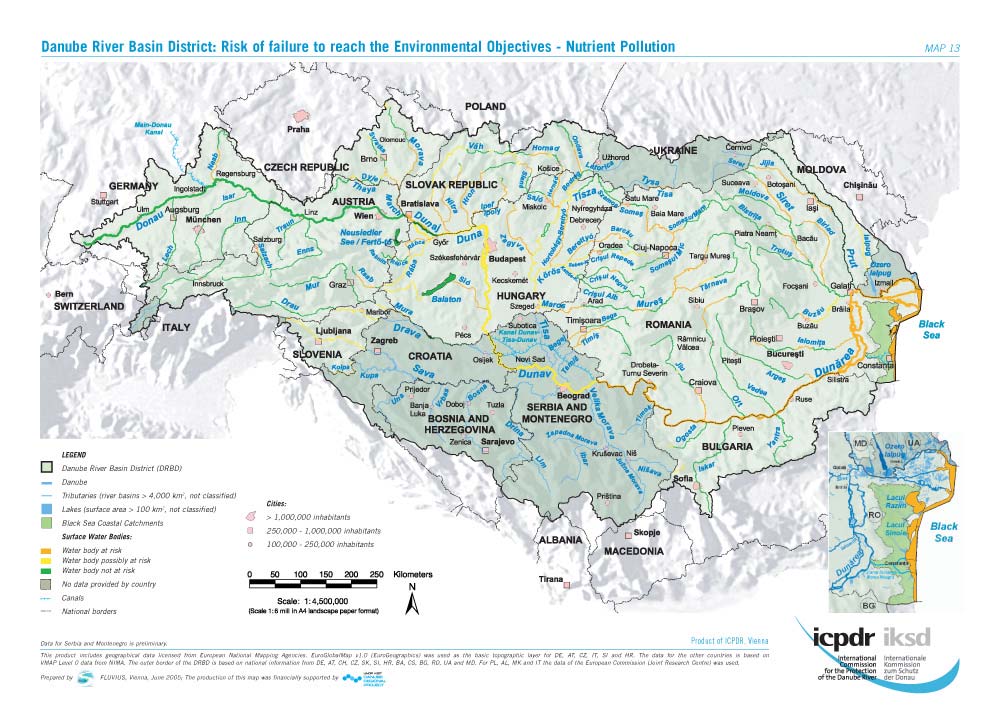
Danube Transboundary Analysis
page 33
Figure 6: Risk of Failure to reach Environmental Objectives Ł Nutrient Pollution
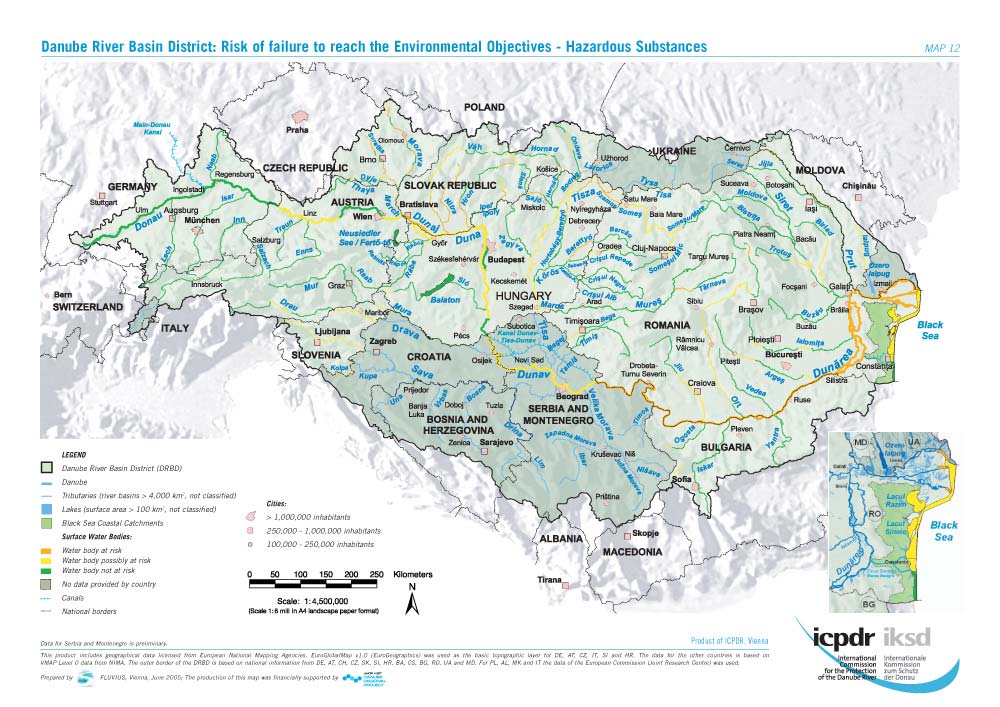
page 34
Figure 7: Risk of failure to reach Environmental Objectives ŁHazardous Substances
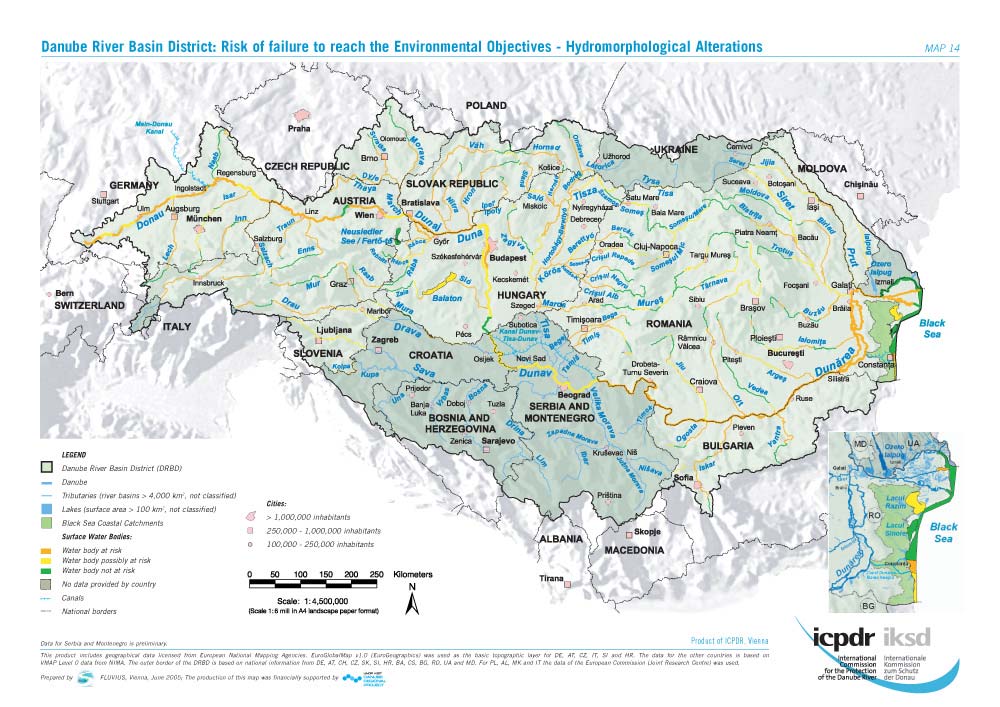
Danube Transboundary Analysis
page 35
Figure 8: Risk of failure to reach Environmental Objectives Ł Hydromorphological Alterations
page 36
Dan
a u
n b
u e
b ris
i k
s cl
k a
cl ssi
a
f
ssi i
f cat
i
i
cat o
i n
o
n b
y
b r
y isk c
i
a
sk c t
a ego
g r
o ies
pr
p essur
essu es
e / /
SK/
SK/
impa
p cts f
a
rom
DE
AT
om
DE
A
om
DE
om
* HU
HU
HR - CS
CS/RO
R
BG/RO
RO
HU
HR - CS
BG/RO
HU
HR - CS
BG/
HU
HR - CS
B
hydr
d om
r
or
o ph.
r
haz.subs
ub t.p.
p
nu
n tr
u i
tr en
e t
n p.
p
or
o gan
r
i
gan c p.
rkm
2780
2
2600
780
24
2600
00
24
2200
00
2
2200
000
2
180
000
0 1
180
600
0 1
140
600
0 1
140
200
0 1
10
200
00
10
800
00
60
800
0
60
400
0
20
400
0
20
0
at risk
s
k po
p s
o s
s i
s bly at
a risk
s
not at risk
s
Figure 9: Risk classification of the Danube, disaggregated into risk categories. Each full band
represents the assessment for one risk category (hydromorphological alterations, hazardous
substances, nutrient pollution, organic pollution). Colours indicate the risk classes. * SK territory.
These results cover about 85 % of the tributaries (based on the length of the tributaries in comparison
to the total length of tributaries). For the other tributaries there was insufficient data available and
these were therefore classified as being "possibly at risk".
The summary statistics for the tributaries (based on overall length) showing the risk of failure are:
> 50% of tributaries are at risk or possibly at risk from nutrient pollution
> 43% of tributaries are at risk or possibly at risk from organic pollution10
> 36% of tributaries are at risk or possibly at risk from hazardous substances;
> 78% of tributaries are at risk or possibly at risk from hydromorphological alterations.
5.2.
Significant Point Sources of Pollution
The analysis of the point source pollution in the Danube River Basin requires the availability of
complete inventories of point sources with data of high and homogenous quality covering the whole
catchment area. This analysis is based on the ICPDR Emission Inventory.
The criteria for the identification of the significant point sources for the basin-wide overview are given
in Table 2. These criteria refer especially to substances mentioned in Annex VIII WFD, to the Urban
10 The upper Danube basin shows a comparatively low percentage of risk due to organic pollution (5 to 20 % of the
length), while in the middle and lower Danube basin the percentage is much higher (ranging between 20 to more
than 90 % of the length
Danube Transboundary Analysis
page 37
Waste Water Treatment Directive (91/271/EEC), to the Integrated Pollution Prevention and Control
Directive (96/61/EC) and to the Dangerous Substances Directive (76/464/EEC).
Within this report the focus of the analysis is on the significant point sources of pollution.
Table 3 gives an overview of the significant point sources identified in the Danube River Basin. The
locations of the significant point sources are shown in Figure 10.
Table 2: Definition of significant point source pollution on the basin-wide level
Discharge of
Assessment of significance
Municipal waste water
any municipal waste water from
not significant
Ę agglomerations with < 10,000 PE
Ę WWTPs with < 10,000 PE
untreated municipal waste water from
significant
Ę agglomerations with > 10,000 PE
only mechanically treated municipal waste
significant
water from
Ę WWTPs with > 10,000 PE
mechanically and biologically treated
significant if at least one parameter is exceeded:
municipal waste water without tertiary
Ł BOD
> 25 mg/l O2
treatment from
Ł COD
> 125 mg/l O2
Ę WWTPs with > 100,000 PE
Ł Ntotal > 10 mg/l N**
Ł Ptotal > 1 mg/l P
Industrial waste water
significant if at least one parameter is exceeded:
Ł COD
> 2 t/d
Ł pesticides > 1 kg/a
Ł heavy metals and compounds:
Ę
Astotal > 5 kg/a
Ę
Cdtotal > 5 kg/a
Ę
Crtotal > 50 kg/a
Ę
Cutotal > 50 kg/a
Ę
Hgtotal > 1 kg/a
Ę
Nitotal > 20 kg/a
Ę
Pbtotal > 20 kg/a
Ę
Zntotal > 100 kg/a
Waste water from agricultural point sources
significant if at least one parameter is exceeded:
(animal farms)
Ntotal > 50,000 kg/a
Ptotal > 5,000 kg/a
Table 3: Significant point sources of pollution in the Danube River Basin District according to the
criteria defined in Table 2.
DE
AT
CZ
SK
HU
SI
HR
BA
CS
BG
RO
MD
UA
Municipal point sources:
Ę WWTPs
2 5 1 9 11 3 10 3 4 6 45 0 1
Ę Untreated
wastewater
0 0 0 2 1 3 16 15 14 31 14 0 0
Industrial
point
sources
5 10 10 6 24 2 10 5 14 4 49 0 5
Agricultural point sources
0
0
0
0
0
1
0
0
0
0
17
0
0
Total
7 15 11 17 36 9 36 23 32 41 125 0 6
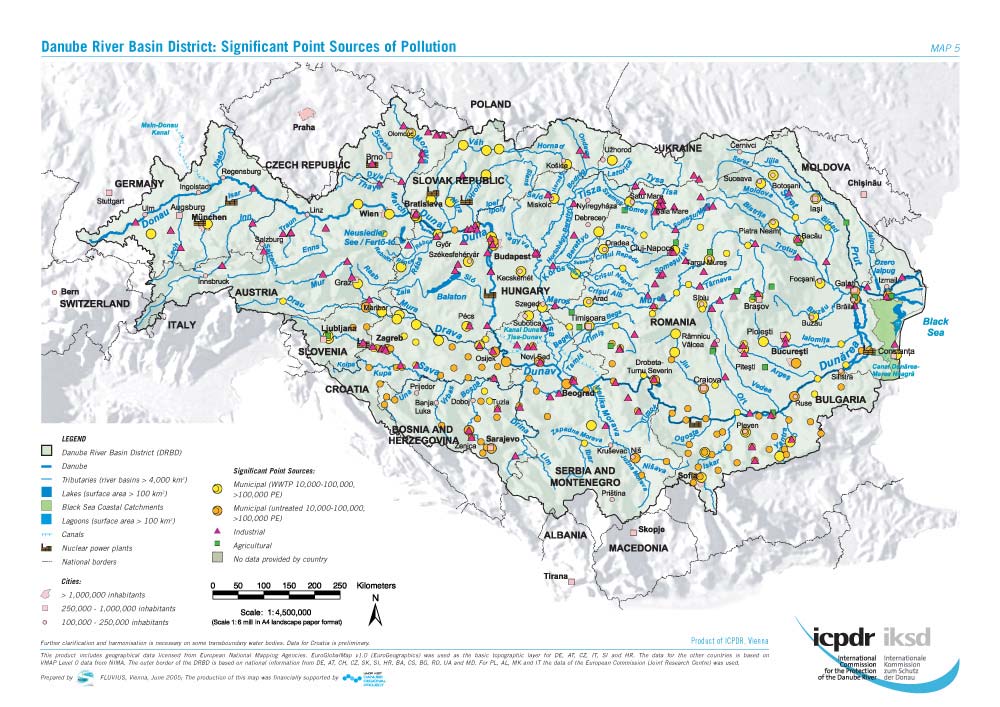
page 38
Figure 10: Significant Point Source of Pollution
Danube Transboundary Analysis
page 39
5.3.
Contribution of sub-basins to the total point source pollution
of the Danube
Table 4 shows the results of the point source inventory for the main sub-catchments of the Danube
river basin district for the year 2000. The selection of the sub-catchments is based on the results of
the Transboundary Analysis within the UNDP/GEF Danube Pollution Reduction Programme (1999) and
is not related to the subdivision of the Danube river basin within the framework of the WFD.
Additionally the table includes the results of the estimated point source discharges for nitrogen and
phosphorus. The base for this study was data on the total point source nutrient emissions from
municipal wastewater treatment plants (WWTPs) of Germany, Austria, Slovak Republic and Hungary.
For the other countries the total point source discharges were estimated from the ICPDR Emission
Inventory and additional data for total national point source emissions.
Table 4: Municipal, industrial and agricultural point source discharges of COD, BOD, total nitrogen
and phosphorus from significant sources according the criteria of Table 2 (based on ICPDR Emission
Inventory data of 2002)
Sub-catchment COD
BOD
N
P
t/a t/a t/a t/a
Municipal sources
01 Upper Danube
3,100
550
2,200
80
02 Inn
1,037
160
288
30
03 Austrian Danube
604
130
248
14
04 Morava
898
100
189
20
05 Vßh-Hron
14,899
4,248
2,102
349
06 Pannonian Central Danube
94,759 32,304 11,618 1,495
07 Drava-Mura
14,970
5,802
2,291
418
08
Sava
83,649
37,102 6,005 1,358
09
Tisza
37,507
14,327 4,883 1,029
10 Banat-Eastern Serbia
13,261
4,247
2,679
619
11
Velika
Morava
na na na na
12
Mizia-Dobrudzha
64,057
29,149 5,064 1,254
13 Muntenia
59,917
29,861
15,602
1,844
14 Prut-Siret
25,314
9,869
2,751
215
15 Delta-Liman
744
272
50
4
16 Romanian Black Sea Coast
10,297
2,801
910
87
Total DRBD
425,013 170,922 56,880
8,816
Industrial sources
01 Upper Danube
7,346
49
20
8
02 Inn
8,469
375
305
20
03 Austrian Danube
4,825
196
12
9
04 Morava
1,911
136
130
19
05 Vßh-Hron
8,294
2,681
96
4
06 Pannonian Central Danube
16,424
3,515
352
13
page 40
Sub-catchment COD
BOD
N
P
t/a t/a t/a t/a
07 Drava-Mura
29,718
6,083
185
52
08
Sava
33,965
6,772 310 374
09 Tisza
16,622
3,315
331
32
10 Banat-Eastern Serbia
1,158
120
20
2
11
Velika
Morava
na na na na
12
Mizia-Dobrudzha
9,244
na na na
13 Muntenia
16,173
5,166
2,312
5
14 Prut-Siret
4,456
903
136
1
15
Delta-Liman
982 na 24 15
16 Romanian Black Sea Coast
842
242
390
na
Total DRBD
160,427
29,555
4,625
555
Agricultural sources
07 Drava-Mura
2
1
na
1
08 Sava
191
41
107
3
09 Tisza
2,263
579
749
na
10 Banat-Eastern Serbia
357
104 57 16
13 Muntenia
2,040
1,085
881
57
14 Prut-Siret
285
1,074
326
5
15
Delta-Liman
901 206
na na
Total DRBD
6,039
3,089
2,121
82
Na Ł not available
5.4. Nutrient
Pollution
5.4.1. Introduction
The most relevant impact of high nutrient loads is eutrophication. This has been defined by the EC `as
the enrichment of water by nutrients, especially compounds of nitrogen and/or phosphorus, causing an
accelerated growth of algae and higher forms of plant life to produce an undesirable disturbance to the
balance of organisms present in the water and to the quality of the water concerned11'. This
accelerated growth of algae can cause depletion of the dissolved oxygen concentration with
consequential impact on other biological species.
The main sources of nutrients within the Danube Basin have been identified as point sources
(principally municipal wastewater treatment works) and diffuse sources (principally agriculture).
Impacts from nutrients can mainly be seen in the receiving coastal waters of the Black Sea but also in
many lakes and groundwater bodies throughout the basin. While in rivers nutrients generally cause
fewer problems due to turbulent flow conditions, some slow flowing river stretches such as the middle
Danube, impounded river sections, the Danube Delta and lakes show effects of eutrophication.
11 EU Council Directive 91/271/EEC of 21 May 1991 concerning urban wastewater treatment (UWWT-Directive).
Danube Transboundary Analysis
page 41
Overall, nutrient loads into the Danube basin have significantly decreased over the past 20 years,
however, they are still well above the levels of 1955. In the future there is a threat that this
improvement in the reduction of nutrient pollution may be lost because of an increase in diffuse
pollution from agriculture.
The economic development in the middle and lower parts of the Danube region will inevitably increase
diffuse nutrient inputs. It should be ensured that best environmental and agricultural practices are
being developed and applied in order to create a sustainable agriculture in the long term. In this
respect, there is still room for reduction of nutrient loads in the upper part of the Danube basin. The
EU Common Agriculture Programme has recently been reformed to provide direct assistance on rural
development issues that are environmentally friendly whilst removing some of the historic
inducements for over production by farms. The impact of this has still to be established.
For the development of the Danube Basin Analysis report a risk assessment approach was adopted to
identify those water bodies at risk of not meeting the WFD's ecological `good status' criteria. It was
not possible to define common criteria for risk assessment for nutrient pollution, on the basin-wide
level, due to the heterogeneity of the surface water types. Almost all countries used chlorophyll a to
define threshold values for the risk assessment. In some countries, threshold values for nutrients
(phosphorus and nitrogen) were used as alone-standing criteria or as a supplement to chlorophyll a
values. Special attention was given to the dislocation effects between the source of pollution and the
impact area. The recognition of past high risk, lower current risk, and potential increase of risk in the
future, was integrated in the analysis.
5.4.2. Transboundary importance of nutrients in the Danube River Basin
The main concern of nutrients as a priority issue within the Danube Basin is the impact (eutrophic
status) on the northwest shelf of the Black Sea. A comparison of the total emissions of N and P in the
Danube River Basin with the river loads to the Black Sea, indicate an apparent loss or storage of the
nutrients in the Danube Basin. Loss processes imply the permanent removal of nutrients from the
hydrosphere, while storage processes are of a temporal nature: remobilisation may be relevant
depending on the time scale under consideration.
Loss and storage processes are concentrated in the small river systems, where there is an intensive
contact between the water and the aquatic sediments and wetlands. In this respect a natural river
system with wetlands and floodplains is more efficient than a strongly canalised (artificial) one. The
River Danube and its main tributaries play a minor role for nitrogen losses due to the significant
hydromorphological alterations that have occurred resulting in the loss of `lateral connectivity' to
wetlands. In respect to phosphorus the Iron Gate backwater area represents a major storage area due
to net sedimentation of P in particles. Recent research indicates that about 1/3 of the incoming load is
semi-permanently stored. It can be expected that this storage function is limited in time (< 100
years).
The losses and storage of nutrients in the small-scale river networks in the Danube Basin show strong
geographical differences. This is the result of the natural morphological and hydrological gradients in
the basin. Generally speaking, areas with a relatively high specific runoff show relatively low losses and
storage and consequently convey a relatively high share of the nutrient emissions downstream.
page 42
5.4.3. Drivers
and
Pressures
12 for Nutrient Pollution
Drivers of Nutrient Pollution
The main drivers for excess nutrients in the Danube River Basin have been identified and assessed in
the TDA prepared in 1999. These can be summarised as:
>
Agriculture;
>
Municipalities;
>
Industry.
Pressures / Stress13 from Nutrient Pollution
These drivers result is pressures or stress on the environment. The pressures are predominately from
diffuse (non-point) sources of nutrients (for example, inappropriate storage of manure) and from point
sources (for example, inadequate treatment of municipal and industrial wastewater).
Extensive use was made of the modelling tool MONERIS during the data assessment for the Danube
Basin Analysis. This model enabled assessments to be made in the absence of sufficient measured data
and allowed an evaluation of both sources and pathways of nutrients to the river environment to be
estimated.
The estimated contribution of phosphorus and nitrogen emissions from all sources (including point and
diffuse sources) is shown in Figure 5. In general, the portion of point sources to the total nutrient
emissions is higher for phosphorus than for nitrogen. The share of background contributions is higher
for phosphorus than for nitrogen. That means that the total human influence on the nutrient pollution
of the Danube is much higher for phosphorus than for nitrogen.
The relation between different human sources/activities to the total emissions is important to
understand. For the Danube basin the share of the different human sources compared to the total
nutrient pollution is shown in Figure 5.
5.4.3.1. Historical development of the diffuse source nutrient pollution into the
Danube River system
A historical look at the development of the Danube nutrient emissions from point and diffuse sources
over the last 50 years has been prepared based on the results of the present situation, and a
reconstruction by means of the model MONERIS. Figure 11 and Figure 12 show the results.
The MONERIS Model
The nutrient emission Model MONERIS (MOdelling Nutrient Emission in RIver Systems) was developed
and applied to estimate nutrient inputs into river basins of Germany by point sources and various diffuse
pathways. MONERIS estimates the different pathways using existing approaches as well as new
conceptual approaches developed especially for modelling at medium and large spatial scales. It also
considers retention of nutrients in rivers basins. Due to the limited and often inconsistent data available for
large-scale modelling, MONERIS was designed to work with information collated from standard monitoring
programs or available from federal bureaus. MONERIS has been applied extensively to river basins in the
Baltic catchment and in all of Germany, and the Danube River Basin
The model is based on:
12 Underlying and immediate causes
13 In GEF terminology
Danube Transboundary Analysis
page 43
Ę data of river flow (from gauging stations)
Ę water quality (nutrient concentrations from monitoring stations)
Ę statistical data about nutrient inputs into the catchment
Ę geographical data (stored and analysed in a Geographic Information System (GIS)
The model is composed of a series of equations that allow the estimation of point sources and diffuse
sources into the stream.
For the catchment defined for a particular application of the model, MONERIS will estimate the loads
emitted through each of the point sources (direct discharges, waste water treatment plant effluents), and
through a series of diffuse pathways (see Fig. 1: MONERIS diagram), including:
Ę atmospheric deposition
Ę erosion
Ę surface runoff
Ę groundwater
Ę tile drainage
Ę paved urban areas
Along each of these pathways from the source of the emission to the river, substances experience
processes of transport, transformation, retention and loss. Knowledge of these processes is necessary to
quantify and predict nutrient emissions into the river. MONERIS encapsulate knowledge of those
processes.
MONERIS produces estimates of annual load through each of the defined point and diffuse pathways. It
estimates nutrient retention and loss within the river system itself (i.e., the stream's self-purification
processes). The final output is an estimate of annual nutrient load in the river at the outlet of the study
catchment, which is equal to the emissions into the river via point and diffuse sources minus the estimated
nutrient retention and loss within the river system.
MONERIS can help managers identify pathways that contribute significantly to nutrient loads and should
be targeted for management practices aimed at nutrient emission reduction. Combined with geographic
information in a GIS, it can help identify hot spots within the catchment -- particular areas that, due to a
combination of high potential emission and a susceptibility to efficient transport, contribute nutrients
significantly more that other areas. Once MONERIS has been calibrated for a particular catchment, it can
be used to develop management scenarios. For example, a manager can ask by how much nutrient
emissions into the river would be reduced under a scenario of erosion control.
According to Figure 11 the diffuse source pollution of nitrogen is about doubled in the period in the
1950s to the mid of 1980s. In the 1990s this pollution is reduced by about 23 % mainly due to the
reduction of the land use intensities as represented by the N-surplus on agricultural areas. The
reduction of the nitrogen surplus is much larger, especially for the countries in the middle and lower
part of the Danube, than the reduction of the diffuse nitrogen sources. This is due to the differences in
the residence time in the groundwater and the different retention rates for nitrogen in the unsaturated
zone and in the groundwater. The large residence times in the groundwater are responsible for the fact
that a further reduction of the diffuse nitrogen emissions can be assumed in the next years if the N-
surplus will remain on the present level.
The present level of the diffuse nitrogen emissions into the Danube river system is about 1.8 times
higher than in the 1950s. One reason for the change of the total nitrogen emissions is the change of
the point source discharges. The increase from the 1950s to the end of the 1980s is approximately a
factor 5 and the decrease within the 1990s is about 20 %. This is due to a decrease in the number of
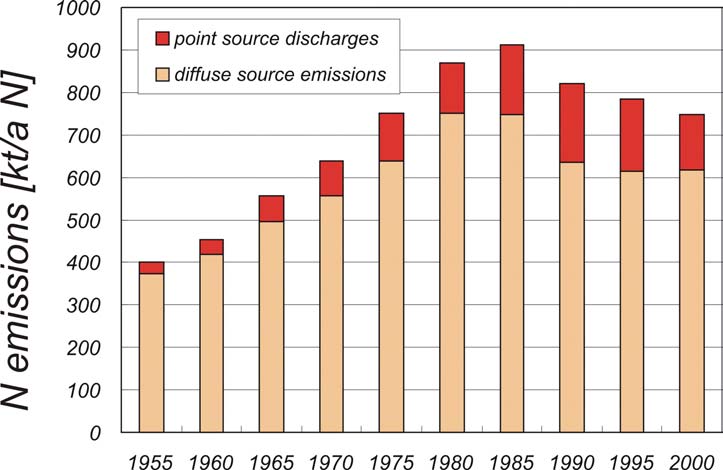
page 44
industrial discharges in the lower Danube countries after the political changes and substantial
improvement of wastewater treatment especially in Germany and Austria.
For total N-emissions, it was found that the present state is a factor of 1.8 higher than in the 1950s
but about 23 % lower than in the late 1980s.
For phosphorus the changes in the amount of diffuse source pollution is much lower than for nitrogen.
This is because, other pathways (erosion and surface runoff) are more responsible for the diffuse P-
emissions into the river system. In addition, the main indicators for the diffuse P emissions as a
portion of arable land were changed in the past to a lesser extent than the N-surplus.
Further it should be noted that important parameters for changes of diffuse P-emissions by erosion
over time, such as the change of the field size in the different regions of the Danube basin, are not
available up to now.
If these uncertainties in the database and for the modelling are taken into account, the present level of
diffuse P emissions into the Danube river system is probably more than 20 % above the level of the
1950s.
Changes in the amount of point source discharges of phosphorus are much higher than for the diffuse
sources. For P, an increase by a factor of 4.6 was estimated from the 1950s to 1990.
This development in the amounts of P from point sources is the result of two overlapping effects -
increase of the use of P in detergents and an increase in connection of population to sewers and
WWTPs. The decrease of the point P emissions is due to the replacement of P in detergents to a high
proportion and the increase of P elimination in WWTPs. The consequence is that the reduction of point
P emissions is more than 50 %. The present level in the upper Danube is already in the range of the
1950s. The change of the total P emissions is larger than for nitrogen. A reduction of about 40 %
during the 1990s was estimated and the present level of the total P emissions is a factor 1.6 higher
than in the 1950s. The reconstruction of the historical changes of the sources of nutrient pollution in
the Danube shows that in the last decade a substantial reduction of nutrient pollution was reached in
the Danube.
Figure 11: Temporal changes of the nitrogen emissions into the total Danube river system for the
years 1955 to 2000 (MONERIS)
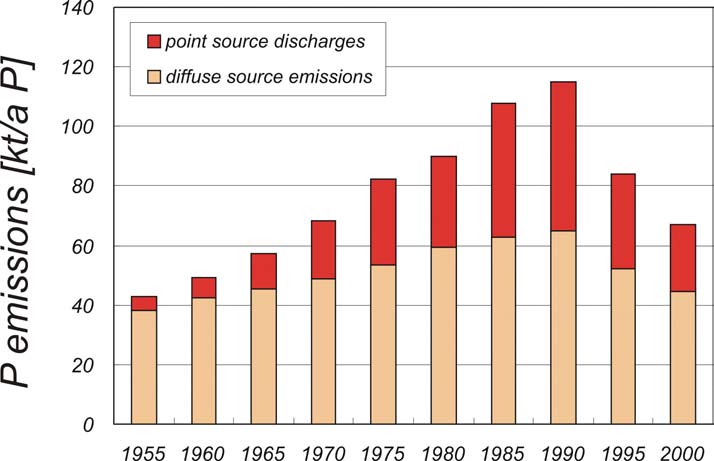
Danube Transboundary Analysis
page 45
Figure 12: Temporal changes of the phosphorus emissions into the total Danube river system for the
years 1955 to 2000 (MONERIS)
Nitrogen
Phosphorus
758 kt/a N
68 kt/a N
5%
10%
26%
27%
53%
8%
32%
39%
Settlements
Agriculture
Background
Other sources
Figure 13: Total estimated nutrient emissions for the Danube river basin in the period 1998-2000;
result of the MONERIS application for the WFD Danube River Basin Analysis Report
5.4.3.2. Point Source Pressures
The ICPDR Emission Inventory is the key database for the assessment of emissions from point sources
on the basin-wide level. It includes the major municipal, industrial and agricultural point sources and
identifies the total population equivalents of the municipal wastewater treatment plants, the industrial
sectors of the industrial wastewater treatment plants, and the types of animal farms for the
page 46
agricultural point sources. In addition, it includes information on the receiving water and data on some
key parameters of the effluent such as BOD, COD, P and N.
The analysis of the point source pollution in the Danube River Basin district requires the availability of
complete inventories of point sources with data of high and homogenous quality covering the whole
catchment area. This analysis is based on the ICPDR Emission Inventory.
From the MONERIS model the main sources of nitrogen and phosphorus are show in Figure 13. For
Nitrogen, the main source is agriculture and settlements are the main source for phosphorus. A
summary of the main point sources of pollution in the Danube River Basin is presented in Table 3.
5.4.3.3. Diffuse source pressures
The main sources of diffuse pollution originate from agriculture. A detailed assessment of the land-use
within the Danube Basin was undertaken in the Danube Basin Analysis report. Whilst intensive
agriculture declined significantly after the collapse of the Eastern European economies in 1989 this
sector is still considered to be the main contributor of nutrients (in particular nitrogen) to the Danube
River. In addition the threat from increasing agriculture as the economies recover together with the EU
CAP and its impact on the environment is a concern.
The model MONERIS was utilised to quantify the pathways of nutrients from diffuse sources. For each
pathway of diffuse sources, the model takes into account the special natural conditions, which
determine the retention and losses from the origin to the point of input into the river systems. As
shown in Figure 6 the total diffuse nutrient pollution into the Danube river system was estimated to be
624 kt/a nitrogen and 45 kt/a phosphorus.
Nitrogen
Phosphorus
624 kt/a N
45 kt/a P
2%
5%
5% 1%
10%
11%
12%
Groundw ater
53%
Urban area
31%
5%
Erosion
Surface runoff
51%
Tile drainage
14%
Atmospheric
deposition
Figure 14: Estimated diffuse nutrient pollution by pathways for the total Danube river systems for the
period 1998 to 2000 from the MONERIS model for the WFD Danube River Basin Analysis Report
Under the DRP the MONERIS model was updated to collect more recent information on nutrients and to
utilise the same catchment boundaries as the countries used for WFD reporting. Preliminary data on
total P and total N emissions within the DRB are shown on Figure 15 and Figure 16. This data could
assist with the future prioritisation of actions within the basin to mitigate emissions of N and P.
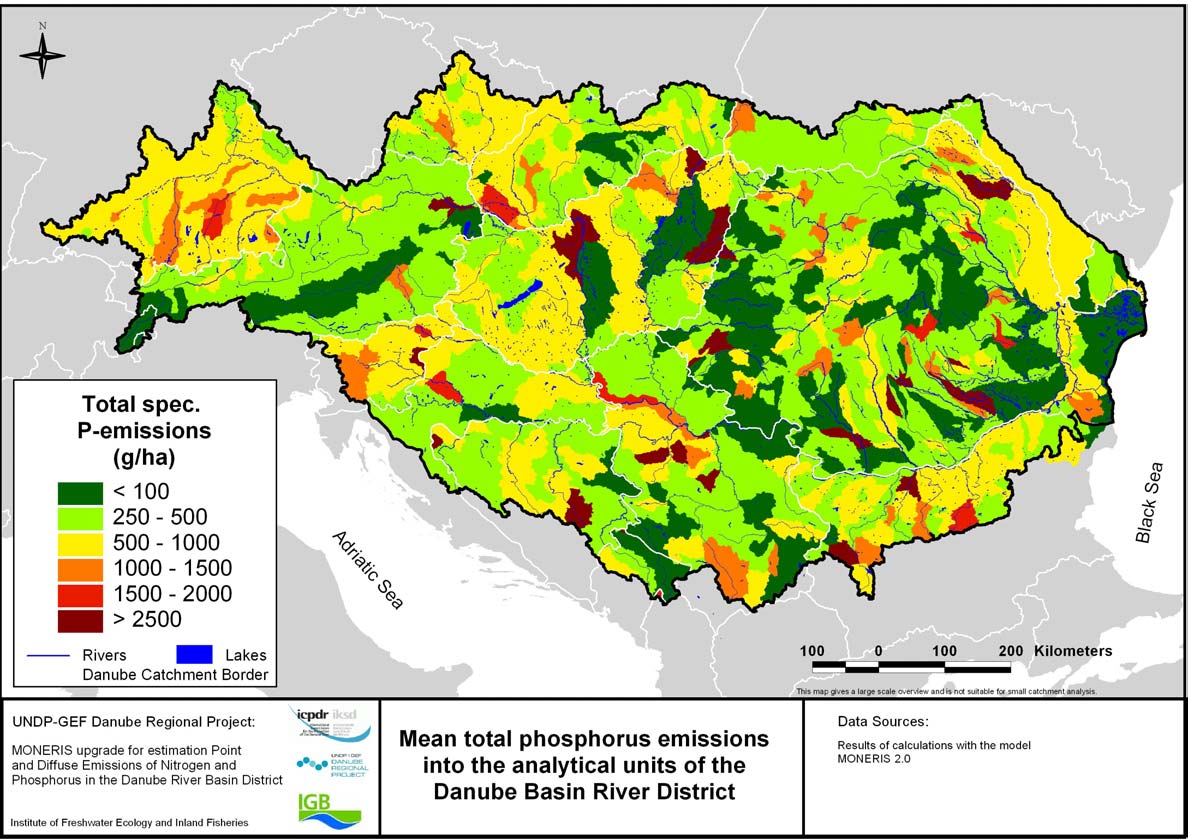
Danube Transboundary Analysis
page 47
Figure 15: Mean total Phosphorus emissions into the analytical units of the Danube Basin River District
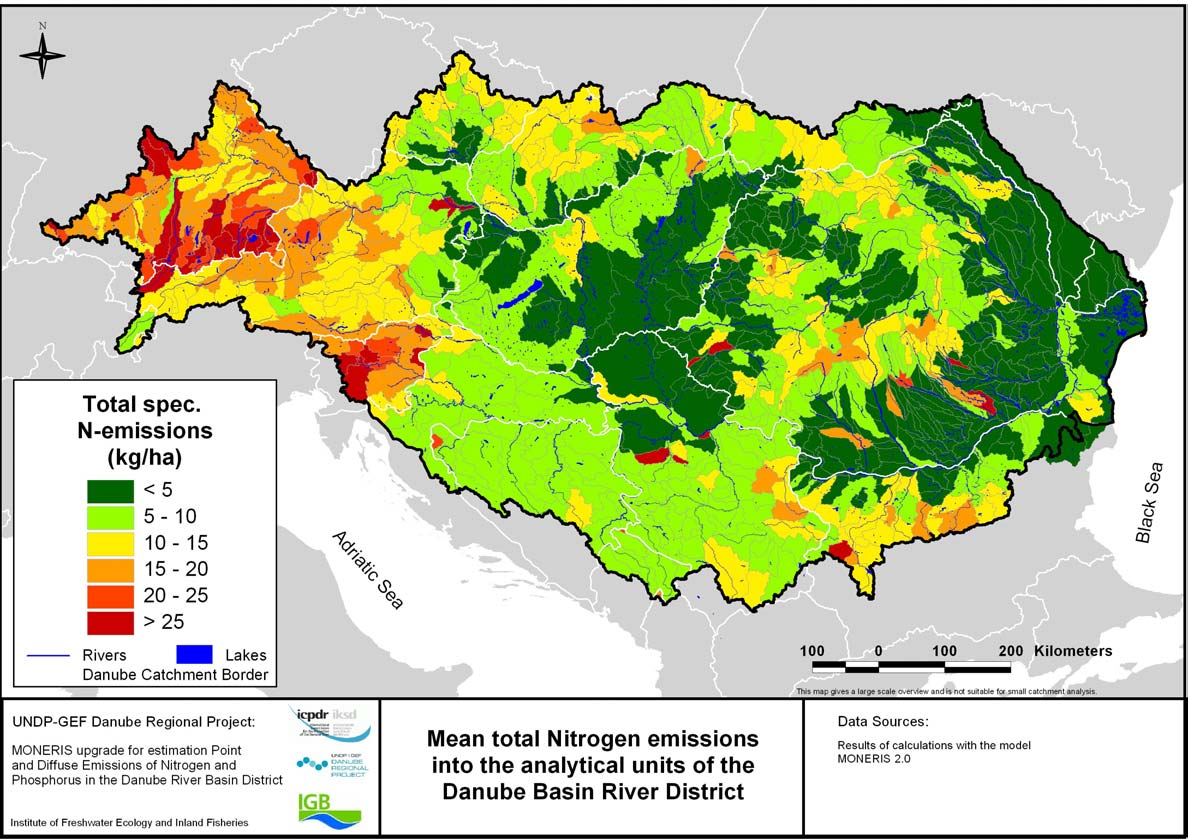
page 48
Figure 16: Mean total Nitrogen emissions into the analytical units of the Danube Basin River District
Danube Transboundary Analysis
page 49
5.4.4. Environmental Impacts of Nutrient Pollution in the Danube River Basin
The main impact of nutrients from the Danube River Basin is on the northwest shelf of the Black Sea
(see section 5.8). Within the basin the environmental impacts are evaluated through the use of
environmental indicators or surrogates that are measured (e.g. nitrogen, phosphorus, chlorophyll a
etc.) and these are used to provide an analysis of the status and an estimation of likely impacts on the
Black Sea.
The initial Danube TDA (prepared by the UNDP/GEF Danube Pollution Reduction Programme, 1999) on
nitrogen and phosphorus loads provided longitudinal profile along the River Danube of the in-stream
load of N and P. The results (Figure 7) show that certain countries contribute relatively strongly to the
annual water volume: as a result of the basin morphology and of the climatic conditions, the area
specific run-off is high in those countries (e.g. Austria, Germany, Slovenia and Bosnia i Herzegovina).
Other countries have a low area specific run-off (e.g. Hungary). These natural variations are reflected
in the river load profiles for N and P. The areas with a high specific run-off have a relatively high
contribution, while the areas with a low specific run-off have a relatively low contribution. The load
profile for P shows a strong decrease in the Iron Gates area as the sediment-associated P is deposited
at this location.
(a)
river load of N (kt/y)
600
N
(kt/y)
%
Ukraine
Moldova
28.3
5.1%
Romania
500
8.2
1.5%
Bulgaria
Bosnia i Herz.
121.3
22.0%
Serbia and Mont.
400
Croatia
22.8
4.1%
Slovenia
35.7
6.5%
Hungary
Slovak Rep.
72.3
13.1%
300
Czech Rep.
22.6
4.1%
Austria
19.5
3.5%
Germany
200
30.8
5.6%
29.7
5.4%
100
15.2
2.8%
76.8
13.9%
67.9
12.3%
0
e
551.0
100.0%
v
a
a
Inn
a
v
a
l
t
a
Tis
s
ourc
Dr
Sa
De
page 50
(b)
river load of P (kt/y)
60
Ukraine
P
Moldova
(kt/y)
%
50
Romania
Bulgaria
4.0
8.1%
Bosnia i Herz.
1.4
2.9%
40
Serbia and Mont.
12.7
26.0%
Croatia
4.0
8.1%
Slovenia
2.2
4.6%
30
Hungary
7.0
14.4%
Slovak Rep.
2.2
4.5%
Czech Rep.
20
Austria
1.3
2.7%
Germany
3.8
7.7%
1.7
3.5%
10
1.1
2.2%
3.8
7.7%
3.7
7.6%
0
e
48.9
100.0%
Inn
v
a
a
s
a
va
on
l
t
a
Ti
Ir
Sa
Gates
De
s
ourc
Dr
Figure 17: River load profiles of nitrogen (a) and phosphorus (b), subdivided over countries of origin Ł
derived from simulations with the Danube Water Quality Model (DWQM) during the GEF-UNDP Danube
Pollution Reduction Programme, 1999 UNDP/GEF (1999a)
The 2003 TNMN Yearbook assesses the concentrations of chlorophyll-. This parameter represents the
amount of live phytoplankton in the surface water and is generally considered to be an indicator for
eutrophication. The Yearbook presents the most recent information on impacts (2003) in an
aggregated form, indicating the classification of the observed concentrations of chlorophyll- in 5
classes. Class I represents the lowest concentrations and Class V represents the highest values. The
summary chart is presented in Figure 18. This graph indicates that there is a large data availability
problem: more than 60 % of the stations are classified as "no data". The available data indicate
eutrophication problems in the slow-flowing and relatively shallow reaches of the Middle Danube (in
Hungary). The Joint Danube Survey results also point in this direction (see Figure 19). This survey in
August-September 2001 indicated a strong algae bloom in the Hungarian part of the Danube and to a
lesser extent in the upper part (DE-AT) of the basin.
Figure 18: Information related to the
concentrations of chlorophyll- in the Danube
and its large tributaries, on the basis of TNMN
field data from 2003
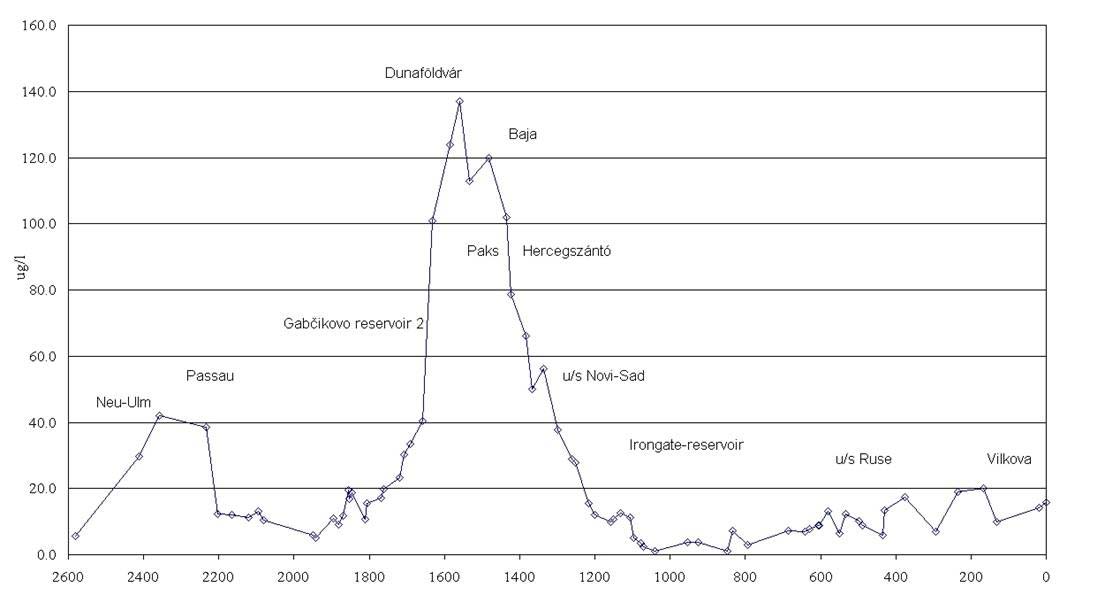
Danube Transboundary Analysis
page 51
Figure 19: Concentrations of chlorophyll- [Ąg/l] in the Danube River on the basis of field data
collected during the JDS
5.4.5. Knowledge
gaps
The key issues that should be addressed in the future include:
>
Improved monitoring of concentrations and loads of nutrients (including the routine
measurement of all forms of nitrogen and chlorophyll a);
>
Enhancing the performance of the MONERIS model;
>
Providing estimates on the timescales for recovery of the basin Ł in particular associated
with nitrogen in groundwaters;
5.5. Organic
Pollution
5.5.1. Introduction
Organic pollution refers to species that create a demand on oxygen to degrade these species.
Typically, these arise from human and animal waste, and industrial processes such as food industry.
The main impact of `organic pollution' is the consequential depletion of the dissolved oxygen
concentration in water and the impact this has on biological species.
The absence of wastewater treatment plants or the failure of these to operate effectively is the main
reason for `organic pollution' being identified as one of the four key issues within the Danube Basin
Analysis. The reduction of this pollution is mainly an issue of investments and the construction or
upgrading of wastewater treatment plants. Under the EC DABLAS programme the ICPDR has
developed a list of priority needs for investments throughout the basin.
In surface waters, the loads of organic pollution are still unacceptably high in most of the Danube
tributaries and in some parts of the Danube River. The discharge of untreated or insufficiently treated
wastewater from municipal, industrial and agricultural sources are widespread, in particular in the
page 52
middle and lower part of the basin. The indicators for impact from organic pollution show that the
water quality is significantly affected, the major cause being insufficient treatment of wastewater from
municipalities.
The Danube shows an increase in organic pollution (expressed as BOD5 and COD-Cr) from upstream to
downstream, reaching its maximum between Danube-Dunafoldvar (rkm 1560, below Budapest) and
Danube-Pristol/Novo Selo (rkm 834, just below the border of Serbia and Montenegro, and Bulgaria).
Here the target values are frequently exceeded. In parallel, the dissolved oxygen concentrations show
a decrease from the upper to the lower Danube, showing also clearly the influence of the two major
reservoirs, Gabcikovo and the Iron Gates. The biological impact assessment is mainly based on the
Saprobic System to detect biodegradable organic pollution. According to the Saprobic System, the
Danube is classified as "moderately polluted" (Class II) to "critically polluted" (Class II-III).
The tributaries are in part highly polluted. This can be seen from highly elevated values for degradable
organic matter (expressed as BOD5) and for organic matter with low degradability (expressed by COD-
Cr). In some tributaries also the oxygen content is significantly lower than in the main course of the
Danube, e.g. in the Arges River (see Figure 5: Risk of Failure to Reach Environment Objectives Ł
Organic Pollution).
5.5.2. Drivers and Pressures of Organic Pollution14
Drivers of Organic Pollution
The main drivers for organic pollution are:
>
Municipalities;
>
Agriculture;
>
Industry (predominately food processing)
Pressures from Organic Pollution
The main sources of organic pollution are inadequate municipal and industrial wastewater treatment
and poor agriculture practices (for example, manure handling and storage for diffuse sources, and no
treatment for intensive animal farms as point sources).
5.5.3. Environmental impact
The impact of organic pollution is to cause depletion in the dissolved oxygen concentration with
consequential impact on biological species. In the absence of routine measurements on biological
species it is common to monitor key indicator species that provide an estimation of organic pollution.
The main indicators of the impact of organic pollution are:
>
Dissolved oxygen concentrations (and percent saturation)
>
BOD5 and COD measurements;
>
A measure of biological quality parameters or impact assessment (e.g. Saprobic index).
The implementation of the WFD monitoring requirements (2007 onwards) will result in a better
understanding of the ecological quality of water bodies providing a more direct estimation of the
impact of organic (and other) pollution.
14 Underlying and immediate causes
Danube Transboundary Analysis
page 53
5.5.3.1. Dissolved Oxygen
Summarizing the spatial distribution of the mean values of DO the following observations are
presented:
>
A decreasing tendency of the dissolved oxygen content downstream the Danube River was
recorded.
>
In the upper Danube section, the dissolved oxygen values increase from Danube-Neu Ulm
(rkm 2581) to Danube-Wien-Nussdorf (rkm 1935). In this stretch, all concentrations are
above 8.5 mg/l and no value is below the target limit which indicates a positive situation;
>
In the middle stretch, the oxygen concentrations are slightly lowers then those in the
upper part. A uniform pattern is present along this stretch, with no value below the target
limit;
>
Decreased concentrations appeared in the areas influenced by the two major reservoirs
(Gabcikovo Ł slight decrease at rkm 1806 and Iron Gates Ł a significant decrease
downstream of rkm 1071);
>
In the lower part only three values were below the target value at rkm 834;
>
In the tributaries, the dissolved oxygen content generally decreases from those located in
the upper area to those located in the lower part;
5.5.3.2. Biochemical Oxygen Demand (BOD5)
BOD5 characterizes the oxygen demand arising from biological activities. High BOD5 values are usually
a result of organic pollution caused by discharges of untreated wastewaters from treatment plants,
industrial effluents and agricultural run-off. Generally, it can be said that BOD concentrations less than
2 mg/l O2 are indicative of relatively clean rivers and concentrations higher than 5 mg/l O2 are signs
of relatively polluted rivers.
According to TNMN data, BOD5 values varied during 1996 Ł 2000 in a range of 1.4 Ł 8.2 mg/l O2 in
the Danube River and 1.8 Ł 60.5 mg/l O2 in the major tributaries. This means that 13.3% of values
were above the target value (5 mg/l O2) in the Danube River (mainly in the middle and in the lower
sections) and 35.9% in the major tributaries.
The spatial distribution of the mean values of BOD5 in the Danube River shows that the profile is
relatively scattered, with a concentration maximum located in the middle stretch of the Danube. In the
tributaries, the BOD5 values indicate a higher content of biodegradable organic matter occurring in the
Morava, Dyje and Sio in the upper and middle Danube section and in the Yantra, Russenski Lom, Arges
and Siret in the lower Danube.
5.5.3.3. Impact assessment (Saprobic index)
As the benthic invertebrates are sensitive to the presence of the organic compounds in water, the
analysis of macrozoobenthos in the aquatic ecosystem provides useful information on the impacts of
organic pollution.
The results of the macrozoobenthos analysis presented in this chapter are based on the biomonitoring
procedures agreed within the ICPDR. The Saprobic index system is based on a classification of water
quality using seven biological quality classes. Similar to the chemical water classes, water quality class
II (moderately polluted) indicates the general quality objective.
page 54
Macrozoobenthos was analysed also during the Joint Danube Survey (2001) and the results obtained
showed that:
>
The saprobity of the Danube varied between water quality class II (moderately polluted)
and II/III (critically polluted). Taking into account that the saprobic index is also influenced
by the habitat structure (for example, comparison of free-flowing stretches to impounded
areas), the Danube showed good water quality (class II) all the way to Budapest.
>
Downstream of Budapest, where the Danube passes through the Hungarian Lowlands,
water quality often decreased to class II-III, indicating significant organic pollution. Taking
into account the high chlorophyll-a values as well as the extreme over-saturation with
oxygen in this reach, secondary pollution caused by an elevated phytoplankton biomass,
which usually leads to an increase in saprobity, was clearly recognisable.
>
Downstream of Belgrade to the Iron Gate reservoir, water quality varied between class II
and II-III. Signs of pollution began to appear, and there were significant differences in the
saprobity of the samples collected from the left and right banks of the Danube, which
seemed to be due to the pollution effects of the discharging tributaries. Only the
impounded reach upstream of the Iron Gate Dam showed saprobity values below the limit
for water quality class II.
>
In the Lower Danube reach, especially down-stream of big cities, discharges seemed to
result in an increase in the level of bacteria and detritus feeders. Comparing the Upper and
Lower Danube in terms of the sum of abundances, the lower section of the Danube was
clearly marked by a significant decrease in biodiversity. Arms and tributaries of the Danube
were found to be more polluted than the River itself and even reached water quality class
III (strongly polluted) or higher.
Almost the same pattern of water quality assessment is provided by the Joint Danube Survey data.
Thus, the results obtained show that the saprobity of the Danube varied between water quality class II
(moderated polluted) or II/III (critically polluted).
5.5.4. Knowledge
gaps
There are relatively few gaps in information from organic sources within the basin. It is clear that
organic pollution originating via point sources (and diffuse sources) from human settlements and
intensive farms are a problem.
Additional steps should focus on the improvement of the Analytical Quality Control System and the
development of ecological classification systems.
At present the methods for biological assessment are not sufficient to provide a detailed assessment of
the ecological quality of water bodies.
5.6.
Contamination with hazardous substances
5.6.1. Introduction
The EU Water Framework Directive defines the term `hazardous substances' as substances or groups of
substances that are toxic, persistent and liable to bio-accumulate; and other substances or groups of
substances that give rise to an equivalent level of concern. Exposure to excessive loads of hazardous
Danube Transboundary Analysis
page 55
substances can result in a series of undesirable effects to the riverine ecology and to the health of the
human population. Hazardous substances may affect organisms by inhibition of vital physiological
processes (acute toxicity), or they may cause effects threatening population on a long-term basis
(chronic toxicity).
Hundreds of hazardous substances are being used and released into the Danube River Basin. Pollution
from hazardous substances is significant although the full extent cannot be evaluated to date. There
are only few data available for some hazardous substances such as heavy metals and pesticides, which
indicate the transboundary scale of the problem. Cadmium and lead can be considered as the most
serious heavy metals exceeding the target values considerably in many locations on the lower Danube.
Also, pesticides show alarming concentrations in some tributaries and in the lower Danube. It will be
necessary to improve the data base on pressures and impacts from hazardous substances, e.g.
through further development of the existing inventories such as the European Pollutant Emission
Register to a comprehensive European Pollutant Release and Transfer Register. Despite the
"knowledge gap" it is essential that measures for the introduction of "best available techniques" and
"best environmental practices" are being developed without delay, otherwise it will be impossible to
achieve "good ecological" and "good chemical status". Altogether 33 priority substances are listed by
the WFD, which has been accepted by the ICPDR as a basis for establishing the Danube List of Priority
Substances.
5.6.2. Drivers
and
Pressures15 of Hazardous Substance pollution
Drivers of Hazardous Substance Pollution
The main drivers resulting in hazardous substance pollution are:
>
Industry
>
Agriculture
>
Transport.
Pressures / or Stress from Hazardous Substance Pollution
The pressures/stresses from hazardous substance pollution derive from both point and diffuse sources.
These can be summarised as:
>
The inappropriate use or storage of agro-chemicals;
>
Industrial processes with inadequate wastewater treatment;
>
Accidental spills of leakages of chemicals;
The data on releases of hazardous substances in the Danube River Basin is relatively scarce, the
Emission Inventories provide only very limited information. According to the Inventory of Agricultural
Pesticide Use, performed in 2003 within the UNDP/GEF DRP, the use of pesticides has declined
significantly in most of the countries of DRB. Data from the FAO database (Table 5) show a strong
decline in pesticide use in the CEE countries to about 40% of 1989 levels compared to a relatively
small decrease in EU Member States during the same period. The most applied pesticides are Atrazine,
2,4-D, Alachlor, Trifluralin, Chlorpyrifos and copper containing compounds. There are indications,
however, that the use of pesticides in the CEE region increases again and that this tendency might be
accelerated after the enlargement of the EU.
15 Underlying and immediate causes
page 56
Table 5: Consumption of pesticides (in t/a) in some Danube countries and specific pesticide
consumption (kg per ha agric. area and year) in 2001 according to the FAO database on agriculture
DE AT CZ SK HU SI RO
Pesticide category
t/a t/a T/a t/a t/a t/a t/a
Fungicides
and
bactericides
7,912 1,336 1,050 537 1,637 921 2,802
Herbicides
14,942
1,436 2,590 2,136 3,149 362 3,960
Inorganics
1,959
99 272 0
684 504 0
Insecticides
1,255
0
157 175 298 81 1,110
Rodenticides
80 1 162
34 20 19 0
Total
26,148
2,872 4,231 2,882 5,788 1,887 7,872
Pesticide consumption
kg/haĘa kg/haĘa kg/haĘa kg/haĘa kg/haĘa kg/haĘa kg/haĘa
Specific pesticide consumption
1.53 0.82 0.99 1.18 0.94 3.77 0.53
per ha agricultural area and year
Figure 21 and Figure 22 indicate Accident Risk Spots (based on industrial activities) and contaminated
sites in flood risk areas respectively.
5.6.3. Environmental impacts of hazardous substances
The environmental impacts of hazardous substance pollution are on the aquatic life and potentially in
the drinking water supply and human food chain. In the absence of effective impact assessment on
biological communities environmental impacts of hazardous substances are estimated through the
measurement of specific chemical species in water, sediment and biota.
5.6.3.1. Heavy metals
For most of the monitored heavy metals the general pattern of their occurrence is an increase from the
upper to the lower part of the Danube. Many of the tributaries have elevated levels of heavy metals,
particularly in the lower Danube.
Based on the evaluation of TNMN data from years 1996 Ł 2000 using the interim classification the
following conclusions can be drawn on the content of the total heavy metals:
>
The content of lead, copper and cadmium in the Danube mainstream is rather high having
57 % of the results for lead and copper and 47 % of the results for cadmium above the
target limit; the situation in the tributaries is slightly better - 53% results exceeded the
target value for lead, 22 % for copper and 32 % for cadmium (target value for total Cu is
20 Ąg/l, for total Pb is 5 Ąg/l and for total Cd is 1 Ąg/l).
>
Due to the lack of data for mercury in the lower Danube a comprehensive picture cannot
be given, however, it is worth mentioning that altogether 63 % of the results from
tributaries were above the ICPDR limit of 0.1 Ąg/l.
>
Pollution of the Danube mainstream and its tributaries by arsenic, chromium, nickel and
zinc can be considered as low. However, the lack of data for these heavy metals in the
lower Danube section has to be mentioned.
The overview of classification of the TNMN results from the year 2001 for cadmium and mercury is
shown in Figure 20.
Danube Transboundary Analysis
page 57
Figure 20: TNMN Water quality classes for cadmium and for mercury in 2001
Reviewing the 1996 Ł 2000 TNMN data the assessment of the risk separates the heavy metals into
several groups.
> Cadmium and lead can be considered as the most serious inorganic micro-contaminants in
the Danube River Basin. Their target values are slightly exceeded in several locations in the
middle Danube and seriously exceeded in most of the sampling sites of the lower Danube.
The situation in the case of cadmium is critical. The target value is substantial exceeded in
many locations downstream rkm 1071 (values mostly 2-10 times higher than the target
value). The pollution of the lower Danube by cadmium and lead can be regarded as a
significant impact.
> For mercury the data is missing from more than 40 % of locations. Moreover, from almost
half of monitoring sites reporting the results no quality class indication was possible because
the limit of detection of the analytical method used was higher that the target limit. So, the
overall picture on mercury is incomplete focusing predominantly on the upper and middle
Danube. Elevated concentrations of mercury in the Danube mainstream and its tributaries in
the upper and middle section are quite frequent. Mercury is the only heavy metal for which
the target limit was exceeded even in the upper Danube section.
> Copper is a very common element naturally occurring in the environment. Its concentration
increases significantly downstream the Danube. Most of the exceeding values (up to several
times the target value) were detected in the lower section of the river (including tributaries).
In the middle part the only significant occurrence of copper was detected in the Tisza River.
> The pollution of the Danube River and its major tributaries by nickel, zinc and arsenic is low
with the elevated profile only in the lower section. The problem is the lack of the data from
the lower Danube, where elevated concentrations were observed. In general, the risk
stemming from these three elements can be looked upon as low. .
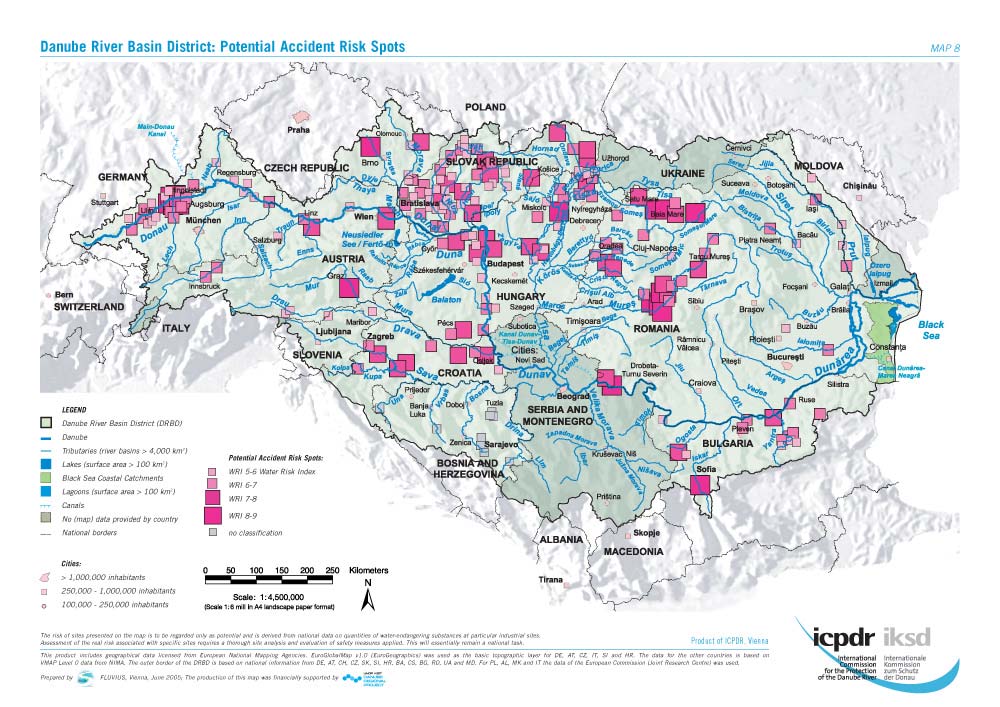
page 58
Figure 21: Potential Accident Risk Spots
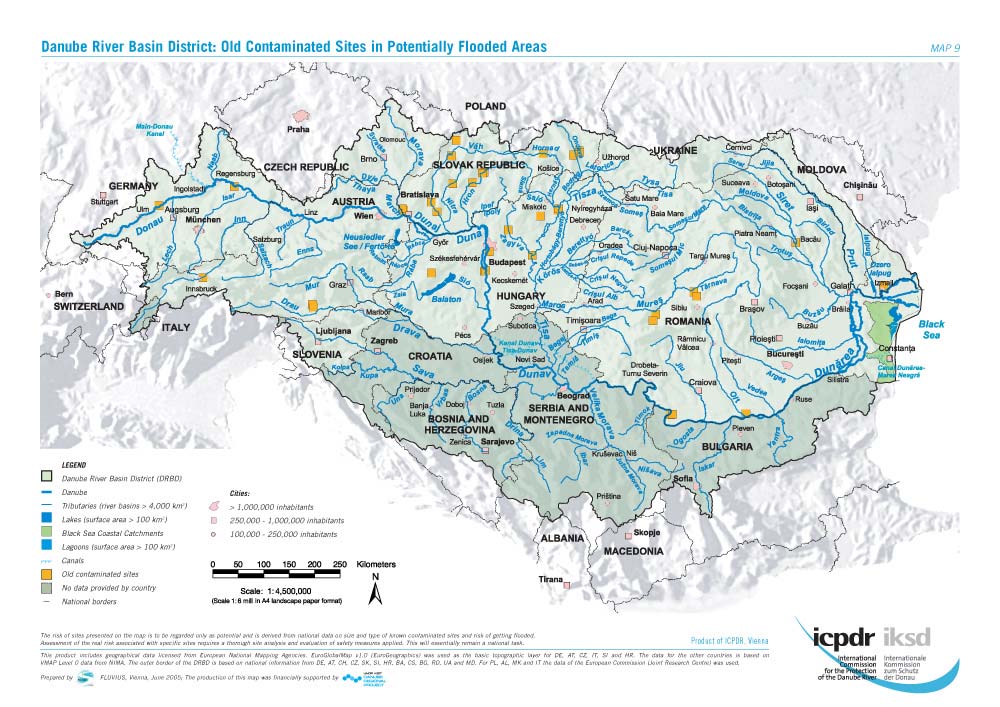
Danube Transboundary Analysis
page 59
Figure 22: Old Contaminated Sites in Potentially Flooded Areas
page 60
5.6.3.2. Organic micro-pollutants
Lindane, pp'-DDT, Atrazine, chloroform, carbon tetrachloride, trichloroethylene and tetrachloroethylene
are the organic micropollutants regularly monitored in water in the frame of the TNMN programme. In
general, the data collected so far exhibit rather large variation due to big differences between reported
limits of detection in various Danube countries. The following conclusions can be drawn:
> The organochlorine pesticides (Lindane and pp'-DDT) show an increasing profile from the
upper to the lower Danube. In case of Lindane the limit value of 0.1 Ąg/l was exceeded in 24
% of the Danube samples and in 9 % of the samples from tributaries. Despite a high
uncertainty the level of pollution by p,p'-DDT is significant and gives a strong indication of
potential risk of failure to achieve a good status. An important fact in this case is that p,p'-
DDT is a pesticide banned in Europe and it is likely that the contamination stems from the
past loads. However, the Inventory of Agricultural Pesticide Use (UNDP/GEF DRP) reports on
uncontrolled and illegal trade of pesticide products leading to the use of banned pesticides
(e.g. DDT) by farmers so this pollution source should be checked if possible.
> From 1996 to 2000 the concentrations of the polar pesticide atrazine were found below the
detection limits at most of the monitoring sites along the Danube River. Despite its banning in
the upper Danube area, atrazine belongs to the most applied pesticides in the Danube River
Basin.The target limit of 0.1 Ąg/l was exceeded in 13 % of the Danube samples. The
tributaries were more contaminated with atrazine with approx. 30 % of values above the
quality target. The highest concentrations of atrazine during that five-year period were found
in the tributaries Sio and Sajo. The elevated concentration of atrazine in the Sava triggered
the alarm in the ICPDR Accident Emergency Warning System in 2003.The overview of
classification of the TNMN results for atrazine in the year 2001 is shown in Figure 23.
Figure 23: TNMN Water quality classes for Atrazine in 2001
For the volatile organic compounds (VOCs), data are available for the upper and middle Danube only.
Chloroform was the most often detected VOC in the Danube River Basin during 1996-2000. It
exceeded the interim target of 0.6 Ąg/l in about one third of the collected samples. Significantly lower
contamination was recorded for tetrachloroethylene Ł only about one tenth of the samples were
above the target value of 1 Ąg/l. The situation was even better in the case of tetrachloromethane
and trichloroethylene. Only in 2% of the samples from the tributaries the target value of 1 Ąg/l was
Danube Transboundary Analysis
page 61
exceeded. In the Danube mainstream no elevated concentrations of tetrachloromethane and
trichloroethylene were observed during 1996-2000.
5.6.4. Knowledge
gaps
The main gaps in knowledge are associated with the lack of data (both from the TNMN monitoring
programme and on emissions of hazardous substances) and the quality of the analytical data.
Specifically for heavy metals and organic micro-pollutants the issues are:
> Heavy Metals: A necessary issue still to be clarified in the future is the determination of
natural background concentrations to be used for setting of region-specific quality standards.
Due to the geomorphologic conditions the natural occurrence of heavy metals in the Danube
River Basin varies.
> The major problems in assessing the results on organic micro-pollutants are the lack of the
data (especially from the lower section), high detection limits not matching with the
environmental quality standards and a high uncertainty of analytical results. These all factors
must be taken into account when formulating any statements on existing risk.
5.7. Hydromorphological
alterations
5.7.1. Introduction
Hydromorphological alterations have a significant impact on the ecosystems of a river. These can
include, the disruption of fish migration due to the construction of dams, the prevention of floods
reaching natural wetlands or the creation of artificial channels with the loss of natural bank habitats.
The extent of the hydromorphological alterations in the Danube basin has been significant over the
past centuries. Such alterations include, inter alia, the building of dams, weirs and sluices, the
canalisation of rivers and subsequent disconnection of their floodplains and old arms, erosion (incision)
of the river bed and lowering of water tables with consequently higher flood risks. Some of these
changes are irreversible, however, there is a potential for rehabilitation, which should be explored to
the fullest extent. This is particularly the case, where floodplains could be reconnected with the main
river thereby improving natural flood retention and enhancing fish migration to their natural habitats.
In addition, migration path-ways would be needed on barriers on the Danube and most of its
tributaries.
The most important hydromorphological pressures are related to hydropower use, navigation and flood
defence measures. In the upper parts of the Danube chains of hydropower plants and navigation
sluices interrupt the continuity of the river with the effect that only few free-flowing sections on the
Danube remain, e.g. in the Austrian Wachau, a World Cultural Heritage Site. Also on the tributaries
many dams and weirs have been constructed. Resulting impacts especially affect the migratory fish
species that cannot reach their spawning grounds, feeding or refuge grounds in other parts of the
river-floodplain system.
Iron Gates I and II on the middle Danube shared by Serbia and Romania have dams 60 and 30 m high
and backwaters reaching 310 km upstream on the Danube. Also the tributaries are strongly affected
by backwaters reaching 100 km upstream on the Sava and 60 km upstream on the Tisza River, and
also on many smaller tributaries. The Iron Gates have multiple effects on the Danube ecosystem. The
page 62
Iron Gates function in particular as sinks for nutrients and sediments with subsequent impacts on the
Lower Danube and the Black Sea. Also, the groundwater tables are elevated considerably in the
backwater areas endangering settlements, municipal and industrial facilities and agricultural activities,
particularly in the Serbian lowlands.
Navigation occurs on nearly all parts of the Danube and the lower parts of its major tributaries.
Construction and maintenance of the navigation channel, sluices and harbours have significant
negative effects on the aquatic environment. The Lower Danube and many tributaries are also affected
by hydromorphological alterations based on flood defence measures.
Although a number of studies have been carried out on individual river stretches and special aspects of
river degradation, a comprehensive assessment of the direct and indirect effects of hydromorphological
alterations in the DRB countries does not yet exist. Therefore, it is not possible to give an overview of
the situation for the whole Danube basin. Instead examples will be given, which highlight the kind of
impacts from hydromorphological changes that have occurred and allow the assumption that similar
impacts have taken place in other parts of the basin where similar pressures from hydromorphological
alterations exist.
5.7.2. Drivers and Pressures of Hydromorphological Alterations16
Drivers of Hydromorphological Alterations
The main drivers for hydromorphological alterations are:
> Hydropower generation
> Navigation
> Flood control
Pressures from Hydromorphological Alterations
The main pressures caused by hydromorphological alterations are:
> Longitudinal continuity interruptions;
> Lateral connectivity interruptions
> Hydrological alterations.
5.7.3. Environmental
impacts
(stresses) from hydromorphological alterations
The most significant impacts from the pressure of hydrological alterations are on:
> Fish migration
> Disconnection of wetlands
> Sediment transport and trapping
> River regulation (changes in flow regime and impact on ecology)
The following provides specific impacts from different forms of river engineering programmes in the
Danube Basin.
16 Underlying and immediate causes
Danube Transboundary Analysis
page 63
Impacts from river regulation works
The Danube regulation works of the 19th century (since 1870 in the Austrian Ł Hungarian Monarchy,
since 1895 in districts of the present Serbia and Montenegro) together with the nearly complete loss of
sediment supply from the Upper Danube catchment in the 20th century (retained by a series of dams
from the Alps down to Gabcikovo Hydropower Dam), increased the sediment deficit for the entire
Danube up to the Iron Gate and even beyond. The result is an ongoing channel incision for long
stretches of the Danube, e.g. on the Hungarian Danube of about 1 - 3 cm/a. On the Austrian Danube
downstream Vienna, the river bed is eroding at a rate of 2.0 Ł 3.5 cm/a. Connected water tables in the
alluvial flood plain are reduced as well, sometimes in a magnitude of several meters. An example can
be seen in parts of the upper Danube in Baden-W³rttemberg (rkm 2,670- 2,655).
The meander cut-offs carried out to improve the navigation route (e.g. the Hungarian Danube was
shortened from 472 km to 417 km) have changed the water table and resulted in a progressive silting
of the many cut-off side-channels and oxbows. Most important floodplain areas, such as the protected
areas of Gemenc-Bķda Karapancsa are slowly drying out. The local nature and water management
authorities have started to halt this erosion and improve the water exchange by re-connecting the
Gemenc floodplain area with the main channel and retaining more water in the side-arm system. The
formerly rich fisheries can only thrive by restoring the migration routes and spawning areas in the
floodplain.
During the last ten years the war and post-war impacts in former Yugoslavia inhibited the maintenance
and reconstruction works in many areas of the Danube River. Between Baja (HU) and Belgrade
numerous ecologically valuable bank segments and islands were therefore preserved or have even
self-restored themselves over these past ten years.
Pronounced sediment accumulations occur behind the Iron Gate dams. Between 1972 and 1994, about
325 million tons of sediment were deposited, taking up 10 percent of the entire reservoir and resulting
in a much reduced transport of suspended solids and soil sediments downstream of the Iron Gate. In
the backwater of the Iron Gate, stretching upstream over 310 km (up to Novi Sad), the effects of the
increased inner and outer colmation (clogging) have led to problems with the supply of drinking water
in communities located along the impoundment.
Downstream of Bratislava from the impounded Danube 80 % of waters are diverted into the sealed
Gabcikovo power side-canal. The remaining 20 % for the 40 km long section of the main river bed are
too small to balance various effects: A drop of 2 - 4 m of the surface and groundwater table and
resulting desiccation of bank forests; a loss of hydro-dynamics in the disconnected, artificially irrigated
and impounded side-arm systems (altogether 8,000 ha on both sides of the river); absence of former
morphological processes resulting in a disappearing of pioneer species, a reduced water quality and an
overgrowing of former open or periodically inundated habitats.
Specific impacts from dams and weirs (disruption of river continuity)
Impoundments lead to an alteration of the hydraulic characteristics of a river. A major problem
associated with the interruption of the river continuum is the decrease of velocity and retention of
sediment in the impounded stretches. As a consequence of reduced slope and current velocity, fine
sediments cover the natural habitats of the bottom-dwelling organisms and clog the interstices in the
bed sediments. This leads to a diminished flow of oxygen into the bed sediments and to a reduced
recharge of the groundwater. These changes in flow and substrate composition affect the benthic
invertebrates and the spawning grounds for fish. Typical rheophilic fish species, dependent on gravel
and cobble as spawning habitats, such as Thymallus thymallus, Chondrostoma nasus, Barbus barbus,
or Hucho hucho are especially affected during their spawning and larval phase. Another impact of
reduced current velocity and changes in sediment composition in mountain streams is the loss of
page 64
habitat for algae. Hydrurus foetidus, a typical winter species, is one of the most densely colonised
habitats for benthic invertebrates. Bottom-dwelling, rheophilic species feeding on algal and bacteria
disappear and species typical for fine sediments can occur in masses (for example Tubificidae). As a
result, typical benthic invertebrate communities are absent and the ecological integrity of such rivers is
disturbed.
Due to all these effects the self-purification capacity of the river may also be reduced. As an example,
monitoring results on the Bavarian Danube show a change in water quality from class II to II/III after
completion of the impoundments Straubing and Geisling in 1999, although discharge of wastewater
has been minimised. The impoundment changes the living conditions for all organisms Ł e.g. slower
current velocity Ł and results in a change in river water quality due to intensified secondary
production.
Migratory species are impacted by dams and impoundments that disrupt the longitudinal connectivity
of rivers and streams. In-channel structures that exceed a certain height prevent or severely reduce
the migration of certain aquatic species. Particularly some of the migratory fish species such as the
sturgeon or the sterlet can no longer reach their spawning grounds, feeding and shelter areas.
One of the well-known impacts of the Iron Gate dams has been the extinction of sturgeons migrating
in the middle and upper Danube basin after its construction. The construction of the Iron Gate dams
has changed the distribution of fish species. The migration path was cut for anadromous species
coming from the Black Sea into the Danube for spawning. Now, in Serbia and Montenegro, Acipenser
gueldenstaedti (Danube or Russian sturgeon), Acipenser ruthenus (sterlet), Acipenser stellatus
(stellate or starred sturgeon), Huso huso (beluga), and Acipenser nudiventris are present only
downstream from the Iron Gate II. Acipenser ruthenus (sterlet) is present in all Serbian parts of the
Danube, as well as its tributaries, such as the Sava, the Tisza and the Morava River.
Another example is known from the Inn River in Germany, where over 30 fish species were originally
present. After the construction of the first impoundment at Jettenbach in 1921, professional fisheries
on the river collapsed. Today, only two fish species are able to maintain their stocks by natural
reproduction in this part of the river.
Effects of intermittent hydropower generation (hydropeaking)
Intermittent hydropower generation (hydropeaking) causes special downstream effects on the aquatic
fauna. Water is released by pulses several times per day, which causes tremendous water level
changes. These "artificial floods" damage the aquatic fauna, by sweeping them away during pulses and
drying out in periods of retention. In the Austrian part of River Drau/Drava for example a reduction of
50 % of the fish stock, and 80 % of the benthic invertebrate community, has been attributed to peak
operation in the M÷ll tributary and the impoundment of the Malta tributary.
Effects on riverine wetlands (disruption of the lateral connectivity)
Wetland habitats in the Danube river basin have been drastically altered in the last two centuries. The
main causes of wetland destruction have been the expansion of agriculture uses and river engineering
works mainly for flood control, navigation and power production. Drainage and irrigation are also
responsible for the drop in water levels and the loss of wetland and floodplain forests, leaving only a
few natural forests. Compared to the 19th century less than 19 % of the former floodplains (7,845 km▓
out of once 41,605 km▓) are left in the entire Danube basin.
Since the 1950s, altogether 15-20,000 km▓ of the Danube floodplains were cut off from the river by
engineering works. In the large plains of the middle and lower Danube (Hungary, Serbia and
Montenegro, and Romania) extensive flood protection dike systems and drainage/irrigation networks
were built up since the 16th century, but especially in the 19th and 20th century, and have caused a
huge loss. For instance, in Hungary, 3.7 million ha were diked in and in Romania 435,000 ha.
Danube Transboundary Analysis
page 65
In the Danube section between Romania and Bulgaria, dikes are usually only 200 to 300 m away from
the main stream. Through this process, starting in the 16th century, the formerly extended floodplains
along the Danube have been reduced drastically. Outside the dikes, natural succession processes from
reed and marsh vegetation towards dry meadows but also forestation measures alter the habitat
structure of the dynamic floodplain. These habitats, which are disconnected and partly far away from
the Danube, are lost as spawning grounds for fish (pike, carp, etc.). Their loss contributed to the
decline of fisheries in the lower Danube.
The complex system of riverine flood plains with its typical aquatic communities is dependent on
constant changes in the duration, frequency and amount of floods. Elimination of these fluctuations
inhibits regeneration of these habitats and siltation of backwaters cannot be reversed. Impacts on
fauna and flora are significant. Typical fish fauna dependent on different habitat types during their life
cycle (i.e. areas of refuge during floods and specific spawning and larval habitats) suffer from loss of
habitats. Studies on the Middle Danube have shown that following the construction of flood control
measures commercial fisheries have lost their importance. This factor is also apparently responsible for
the decrease of fish catches in the Rajka and Budapest section of the Danube during the last two
decades from over 300 tons in 1976 to approximately 50 tons in 1996. In the lower Danube the
number of fish species has declined from 28 species before 1980 to 19 species today. Dominant
species like the carp have been replaced by species of value for fisheries and have resulted in a
decrease of fish catch from 6,000 t/a down to 2,500 t/a presently.
Impacts from navigation
Impacts from navigation often overlap with those of hydropower generation and flood defence, and are
not very well studied. Special measures for maintenance of the navigation channel such as dredging
affect the vertical connectivity. Benthic invertebrates inhabiting the river bottom and fish eggs are
directly affected in areas of gravel extraction. Studies in Germany have shown that after the
termination of gravel extraction typical benthic invertebrate communities re-establish themselves
within two to three years. From the mechanical point of view, regular ship traffic causes waves
resulting in artificial changes of water level along the riparian zones. Consequences are the disturbance
of reproduction habitats for fish and benthic invertebrates as well as de-rooting of aquatic plants. Fish
larvae and young fish are affected by the wash of the waves. Another negative effect of ships' engines
is the unnatural suspension of fine sediments that increases turbidity and reduces the incidence of light
needed for plant and algae growth. Construction of harbours especially those with steep, artificial
banks have adverse effects on the aquatic fauna and cannot be used as habitats. German studies have
shown that only half of the original species numbers and only 1/10 of the expected abundance can be
demonstrated in such artificial surfaces.
Exploitation of sand and gravel and other activities leading to changes of gravel-dominated river bed
can significantly affect the sturgeon population, which requires deep gravel-dominated habitats with a
high water velocity during the spawning period. In addition, water pollution can impact negatively the
functionality of spawning sites, the development of embryos and reduce the abundance of benthic
invertebrates found in the diet of most sturgeons. And the increase of waves disturbs the biota on the
riverbanks.
page 66
5.7.4. Knowledge
gaps
Follow-up should be initiated regarding the following points:
>
Methods for the assessment of significant hydromorphological alterations need to be
harmonised. A type-specific approach would be advisable.
>
Further research is needed on the link between hydromorphological pressures and the
response of the biota. Ecological classification systems should be developed in a way to
also assess hydromorphological degradation. Common methods would be needed (e.g.
common sampling method, common approach for the analysis and interpretation of results,
stressor specific multi-metric classification systems).
>
Future monitoring networks need to include sites that are "at risk" of failing to reach the
environmental objectives due to impacts from hydromorphological pressures.
>
Migration pathways are needed on many barriers along the Danube and its tributaries.
Species concerned are e.g. Vimba vimba, Chondrostoma nasus, Lota lota, Alosa pontica
and A. caspia normanni as well as the sturgeons.
>
Restoration of fish habitats should be carried out making best use of experience gained
from previous restoration projects with similar measures in other parts of the Danube
basin.
5.8.
Transboundary impacts on the Black Sea
5.8.1. Introduction
During the 1970s and 1980s, the trophic status of the Black Sea, and particularly the northwest Shelf
increased dramatically, resulting in extended and extensive periods of hypoxia, with severely damaged
pelagic (water column) and benthic (sediment) ecosystems. The following short- and long-term
nutrient-related targets have been agreed upon for the recovery of the Sea:
Short-term:
to avoid exceeding loads of nutrients discharged into the Sea beyond those
that existed in 1997.
Long-term:
to reduce the loads of nutrients discharged to levels allowing Black Sea
ecosystems to recover to conditions similar to those of the 1960s.
Trophic status is determined by nutrient and organic loads/concentrations. Organic matter in the Sea
can be derived from external sources (River flows and discharges from land) or can be generated
within the sea itself via photosynthesis, predominantly by phytoplankton, the growth of which are
stimulated by elevated nutrient concentrations. Thus, both nutrient and organic loads/concentrations
need to be considered in assessing the recovery of Black Sea ecosystems.
A detailed assessment of the impact of the Danube on the Black Sea prepared by the UNDP/GEF DRP
and the BSERP is included in the DRP's final DVD. A summary of the key issues and observations is
presented below.
> While the emphasis of the DRP and BSERP projects has been (and remains) on nutrient
source reduction, some of the best indicators of the trophic status of the receiving waterbody
(the Black Sea and, more specifically, the North West Shelf) are at least as closely allied to
organic enrichment as they are to nutrient enrichment. Further emphasis on reducing organic
loading to the Danube and the Black Sea could, therefore, contribute to improvements in the
Danube Transboundary Analysis
page 67
ecological status of the Black Sea. However, no studies are known to have been undertaken
comparing the importance of riverine and coastal anthropogenic organic carbon discharges
with organic loads produced by primary production in shallow, coastal waters.
> River loads of nitrogen and phosphorus increase with the river discharge. The large variability
in annual flow rates makes it difficult to undertake statistics on short time-series of loads.
The increasing trend of the annual water volume during the past 15 years may (partly)
obscure any river load trends as a result of anthropogenic emissions. Also, even after
excluding statistical "fliers" the error margin in measured nutrient concentrations is in the
region of 10-20%, a fact which may obscure (weak) trends.
> Short-term nutrient concentration data (2000-2003) show an improving trend (i.e.
concentrations are decreasing) in the upper and middle reaches of the Danube. More recent
(2003-2005) data suggests that this improvement is now being reflected in reducing nitrate
loads to the Black Sea.
> In absolute terms, there appears to have been a trend of decreasing total phosphorus and
increasing inorganic nitrogen loads between 1988 and 2005. However, when the trend of
increasing river flow over the same period is accounted for, there is actually a marginal
decrease in inorganic nitrogen loads and a more substantial decrease in total phosphorus
loads, albeit that flow-corrected data over the period 1996-2001 suggest no real
improvement . The large increase in annual total phosphorus load during 2005 can be
explained in full by the high flows during that year.
> To date, the emphasis on nutrient control has focused primarily on point source reduction.
The benefits of capital investment in nutrient-stripping technology to date have been rather
small, and there is an apparent need to re-focus attention on diffuse sources. However, the
benefits of major reductions in livestock numbers and inorganic fertilizer usage since 1988
almost certainly have not yet been fully realized. When they are (and agriculture-derived
nutrient loads fall substantially), capital investment in wastewater treatment plants will
become progressively more important.
> The longer-term trends in inorganic nitrogen loads, while initially appearing to be
disappointing, should be taken in context, since recent (2003-2005) data suggest that real
improvements are beginning to occur. There is a widely acknowledged lag phase for nutrient
source reduction being reflected in reduced water level concentrations and loads. There are
two main reasons for this: (i) for diffuse sources-derived nutrients, the time taken to flush
historically accumulated nutrients from soils and groundwaters to surface waters (ii) internal
loading in water bodies (in this case referring to both the Danube and the Black Sea) from
historically-enriched sediments until new sediment-water equilibria can be established.
> The reducing nutrient concentrations (2000-2003) in upper and middle reaches of the
Danube suggest that this lag period may be nearing an end, a hypothesis supported by 2003-
2005 nitrate data from Reni (see Figure 24). The pattern of improvements being shown first
in upstream sections of the river is fully consistent with what would be expected as the lag
phase begins to end.
> Nutrient data for a coastal water site near to Constanta showed a decrease in nitrate levels
during the late 1970s, which has been maintained since (albeit with 2005 being a year of
unexpectedly high concentrations, corresponding to relatively high flows in the Danube
River). Phosphate levels at the same site showed a substantial fall during the early-mid
1990s, with a lower level being maintained since the late 1990s .
> The situation and trends (since 1990) in nutrient levels throughout the NW Shelf as a whole
remains unclear because of the paucity of available data, perhaps the fairest interpretation of
which is either an increase or no change in nutrient concentrations (data not shown).
page 68
Amalgamated marine average annual nutrient concentrations show wide variability, so
timescale is critical when assessing trends. The inclusion or exclusion of a couple of years of
annual average values could dramatically change this assessment. However, for the
Romanian part of the NW Shelf, while nitrate concentrations show an increasing trend (1990-
2004), phosphate levels have shown a decreasing trend.
1000
10000
100
10000
800
8000
80
8000
)
/s
y
)
)
) 600
3
t/
6000
60
6000
(k
/s3
t
/
y
m
k
(
m
w
l
P
400
4000
o
ta
40
o
4000
ow (
DIN (
Fl
T
Fl
200
2000
20
2000
0
0
0
0
9
88
89
90
91
92
93
94
95
96
97
98
99
00
01
02
03
04
05
9
8
9
0
1
2
3
4
5
6
7
8
9
0
1
2
3
4
5
-
1
95
19
19
19
19
19
19
19
19
19
19
19
19
20
20
20
20
20
20
-
195
198
198
199
199
199
199
199
199
199
199
199
199
200
200
200
200
200
200
48
DIN kt/y TNMN/Buch.Decl.
DIN kt/y Almazow
48
19
P kt/y TNMN/Buch.Decl.
P kt/y Almazow
Danube discharge m3
19
linear trend
Danube discharge m3
linear trend
Data source: Trans-National Monitoring Network database; Romanian Waters National Administration
Figure 24: Danube River annual nutrient loads and flows to the Black Sea (1988-2005)
> Despite data suggesting that the nutrient status of the NW Shelf has not yet improved
substantially, and may even have worsened at some sites during the last 15 years, there is
clear and compelling evidence of improving biological status. Causes underlying this biological
recovery are not fully understood, but the most likely influencing factors are: (i) climate
change; (ii) over-fishing; and (iii) the invasive combjelly Mnemiopsis leydyi, a planktonic
organism that first appeared in the Black Sea in the early 1980s. Mnemiopsis feeds "actively"
on zooplankton and fish larvae, but only "passively" on phytoplankton.
> Over-fishing may have resulted in decreased grazing pressure on zooplankton and, therefore,
increased grazing pressure on phytoplankton. However, available historical commercial
fishing data for the Black Sea Region are (in general terms) sparse and incomparable. BSERP
has funded a number of workshops and studies on fish stock assessment methodologies to
promote regional harmonization in the future, but these will not help re-build historical
datasets.
> Phytoplankton results strongly suggest an improving situation throughout the 1990s, and
continuing improvements since then. This conclusion is supported by remote sensing data of
chlorophyll-like substances, available since the late 1990s.
> The Danube continues to have an impact on zoobenthos populations just offshore of the
delta, but further north the Dniester River is almost certainly an additional cause of
disturbance to zoobenthos communities. However, zoobenthos biodiversity nears to
Constanta has increased greatly since the late 1980s, suggesting that the impact of the
Danube has reduced substantially since then. (see Figure 25)
> Dissolved oxygen concentrations in the 1970s showed a huge deterioration in environmental
conditions / trophic status of the NW shelf in the 1970s and early 1980s. However, by the
mid 1990s substantial improvements had been recorded. The overall situation appears to
have improved further since then, albeit with a temporary return to eutrophic conditions in
2001. A further return of hypoxic conditions was also reported off the coast of Constanta
(Romania) and in the Ukrainian part of the NW Shelf during 2005, but the extent and severity
of this event remains unclear.
Danube Transboundary Analysis
page 69
60
a
x
a
40
f
T
e
r
o
b 20
m
u
N
0
1960s
1988
1996
1998
1999
2000
2001
2002
2003
Data source: Dr C. Dumitrache, National Institute for Marine Research and Development, Constanta, Romania
Figure 25: Number of macrozoobenthos species near Constanta, Romania (1960s-2003)
As evident from the long-term estimate during the recent period (1998-2005) the trend of falling
phytoplankton levels observed during the 1990s (both abundance and biomass) has been maintained
during the first half of the 2000s. However, the two parameters (particularly biomass Ł the more
important indicator of productivity) still remain at substantially higher levels than those observed
during the early 1960s (Figure 26 A). Inter-annual variability in average biomass levels has continued
to remain at a high level (Figure 26 B).
A
B
6000000
6000
B[mg/m3]
5000000
5000
2000
/l] 4000000
4000
3000000
3000
1500
c
e
lls
[ 2000000
2000
N
1000
1000000
1000
500
0
0
1961-1963* 1983-1990
1995-1997
1998-2005
0
1999
2000
2001
2004
2005
Periods
N[cel s/l]
B[mg/m3]
B[mg/m3] 434.502
1733.55
381.374 840.56082 1314.8633
Figure 26: Long-term dynamic of phytoplankton abundance and biomass in the western Black Sea
coastal area (Galata transect): A) Average phytoplankton abundance [cells/l] and biomass [mg/m3] by
periods (1961-2005); B) Average biomass [mg/m3] in September [1999-2005].
In the context of long-term investigations, zooplankton community dynamics and structure reveal
significant year to year alterations. Long-term summer dynamics of the dominant Copepods and
Cladocera [ind.m-3] demonstrated large inter-annual fluctuations (Figure 27). Critically low
zooplankton abundance was registered in the middle of 1980s after M. leidyi introduction (Kamburska
et al., 2003, Kamburska et al., 2006). The combination of eutrophication (provoking an increase of
primary production), top-down control by aliens (M. leidyi) and small pelagic fishes resulted in large
variations in the density of the major taxonomic groups. The average abundance of both taxonomic
groups sustained at a lower level during the 1980s in contrast to the period 1967-1980. This level was
again reduced in the middle 1990s due to the enhanced amount of M. leidyi, before its predator Beroe
appeared (Kamburska et al., 2006). The large inter-annual fluctuations still could suggest instability of
page 70
the recent trend especially in summer, although of signs of relatively recovery of the zooplankton
community expressed in increasing of species richness and decreasing of dominance.
5.0
4.5
4.0
e
r
a
]
3.5
3.0
l
a
doc
2.5
,
C
2.0
poda 1.5
ope 1.0
C 0.5
l
og [ 0.0
1967
1969
1971
1973
1975
1977
1979
1981
1983
1985
1987
1991
1994
1996
1998
2000
2002
years
Figure 27: Long-term dynamics of Copepoda and Cladocera abundance (log transformed) at 3 miles
station off cape Galata (Western Black Sea) during summer of the period 1967-2005 (the data 1967-
2003 by Kamburska et al. 2006).
Danube Transboundary Analysis
page 71
6.
STAKEHOLDER INVOLVEMENT IN THE DANUBE RIVER
BASIN
The active involvement of interested stakeholders and the broader public is a core principle of
sustainable water management. This need was recognised in the establishment of the Danube River
Protection Convention signed in 1994. The inclusion of organised public and stakeholders is a
requirement of the DRPC and to-date 12 organisations have taken the opportunity to have `observer
status' at the ICPDR.
This approach of involving the public and stakeholder organisations has been further enhanced under
the requirements of the EU WFD. Whilst this is a responsibility directed at EU Member States, the
ICPDR has taken the initiative, as the co-ordinating body for the implementation of the WFD, to
address public involvement on a transboundary scale. The ICPDR has an active process defining a
Danube River Basin Strategy for Public Participation in River Basin Management Planning 2003 Ł 2009,
which is being implemented by the countries under the guidance of a expert group within the ICPDR.
The activities in the basin are aimed at:
> Raising awareness on water management within the Danube River Basin;
> Informing the stakeholders (including the public and NGOs) on the requirements of river basin
management and their possibilities to be involved;
> Involvement of the appropriate stakeholder groups;
> Developing a network for public participation experts throughout the Danube Basin;
> Developing an effective media network to ensure contact with the wider public.
Specific activities have included:
> The on-going publication of Danube Watch Ł a quarterly magazine on Danube actions, activities;
> Preparing brochures and other publications on river basin management in local languages;
> Providing an accessible web information system;
> Accessing a wide range of local journalists;
> Undertaking a stakeholder analysis at a basin-wide level;
> Providing guidance and assistance with a workshop on public participation;
> Initiating Danube Day (June 29 Ł the date of the Convention signing) to celebrate the Danube
throughout the region;
> Promoting stakeholder workshops. These have included topic specific (e.g. agriculture,
navigation hydropower, etc.) and more general issues;
> Supporting the development and growth of the NGO community through Danube Environmental
Forum (DEF). With the support of the UNDP/GEF DRP the membership of DEF has risen from
about 50 to over 160 organisations throughout the Danube Basin;
> NGO support has been provided to enable over 150 projects aimed at pollution reduction to be
undertaken through a UNDP/GEF DRP small grant scheme;
> Public participation and access to information under the Aarhus convention has been supported.
The UNDP/GEF DRP has provided considerable resources (approximately 45% of its overall budget) to
supporting the above and other activities to assist the ICPDR and the countries of the Danube Basin
meet the needs of both the Danube River Protection Convention and the EU WFD.

page 72
7. ANALYSIS
OF
INSTITUTIONS, LEGISLATION AND
INVESTMENT NEEDS WITHIN THE DANUBE RIVER
BASIN
7.1.
Analysis of Institutions and Legislation
The legal frame for cooperation of the Danube Countries to assure environmental protection of ground
and surface waters and ecological resources in the Danube River Basin is the Danube River Protection
Convention (DRPC), which came into force in October 1998.
The ICPDR is the institutional frame not only for pollution control and the protection of water bodies
but it sets also a common platform for sustainable use of ecological resources and coherent and
integrated river basin management.
Objectives of the Danube River Protection Convention:
>
Ensure sustainable and equitable water management;
>
Conservation, improvement and the rational use of surface waters and ground water;
>
Control discharge of waste waters, inputs of nutrients and hazardous substances from point
and non-point sources of emissions;
>
Control floods and ice hazard;
>
Control hazards originating from accidents (warning and preventive measures);
>
Reduce pollution loads of the Black Sea from sources in the Danube catchment area.
Organisational Structure under the Danube River Protection Convention
CONFERENCE OF THE PARTIES
Standing Working
International Commission for the Protection
Group
of the Danube River (ICPDR)
Ł co-ord inate the IC PDR
Ł Imple mentatio n of Danube River Protecti on C onventi on (DRPC)
work between meetings
UNDP/GEF
Ł Decision makin g, ma nage ment an d co ordi nation of regi onal coo peration
Ł prepare ma in strategic
Ł Approval of the bud get and ann ual work pro gram me
Danube Regional Proj ect
issues for the ICPDR
Ł Fol low up of activ ities a nd eva luati on of resu lts fro m Expert Grou ps
Ł gu ide the activ ity of the
Ł Creation of sustainable ecological condi-
Ł Joint Acti on Pro gram me
Expert Gr oups
tions for land use and water mgm t
Ł Capacity building and reinforcemen t o f
trans-boundary cooperation
Ł Strengthen ing public involvement in
Legal and
Permanent Secretariat (PS)
environmental decision making
Admi nistrative issues
Ł Reinforcement o f monitoring , evalua tion
(ad-hoc S E G )
Ł Supporting the ICPDR sessions
and In formation Syste m
Ł Supporting the Expert Groups
Ł Legal issues
Ł Coordinating the work programme
Ł Adminis trative issues
Ł Supporting project developmen t and imp lemen tation
Ł Financial issues
Ł Maintenance o f the Informa tion System
River Basi n Ma nage ment
Ecol ogy
Emissi ons
Monito rin g, Laboratory
Accident Preventi on
Floo d Protection
( RBM E G )
( ECO EG )
( EM IS E G )
and Infor mation M gmt
and Contro l
( FP EG )
Ł Integrated river basin
Ł E missions from point
( MLI M EG )
( APC EG )
management
Ł Habitats and species
sources
Ł Trans-National
Ł Acciddental pol lution
Ł Preparation and imp le-
Ł Imple menta tion o f the
protection areas
Ł Emissions fro m di f use
Monitoring Network
incidents
mentat ion o f Action Plan
EU Water Framework
Ł Management of
sources
Ł Laboratory Quali ty
Ł AEW S opera tion
for Sus tainable Flood
Directive
wetlands and floodplains
Ł Guidelines on B AT
Assurance
Ł Accident prevention
Protection
Cartography a nd
GIS
( RBM / G IS E SG )
Danube Ł Black Sea
Joint Techn ical
Working Gro up
Econo mic
Analysis
( RBM / ECON E SG )
Figure 28: Organisation Structure under the Danube River Protection Convention
Danube Transboundary Analysis
page 73
Since its creation, the ICPDR has been effective in reaching agreed policy among countries on priorities
and strategies for improving the Danube and implementing the DRPC. This includes improving tools to
manage the basin such as the Accident Emergency Warning System, the Trans-National Monitoring
Network for water quality and the information system for the Danube (DANUBIS). In effect, it has done
much to promote trans-boundary cooperation among numerous countries in a highly complex
European region.
Danube countries face substantial challenges in establishing and strengthening the policy and
institutional framework required for functioning market-based and democratic societies. Today,
progress can be reported with all Danube countries in redesigning policies, programs and regulations,
in establishing appropriate incentive structures, redefining partnerships with stakeholders, and
strengthening financial sustainability of environmental services. Following a challenging and
demanding period of transition, all DRB countries have in the last years developed a comprehensive
hierarchic system of short, medium and long-term environmental policy objectives, strategies and
principles which reflect the political context of each country, key country-specific environmental
problems and the sector priorities on national and regional levels.
Still the key challenge Danube countries face in the policy field is to identify the most effective ways of
transposing EU environmental directives. Country's choice on how to achieve compliance with EU
directives will have a significant influence on compliance costs.
In all DRB countries the legal framework for environmental management of water resources and
ecosystems consists of a hierarchic system of decrees, laws, directives, ordinances, regulations and
standards on different administrative levels. In addition to the WFD, there has been a high level of
transposition of the EU Directives into the national legislations of the DB countries. All DRB countries
currently have a more or less comprehensive system of environmental and water sector-related
policies and strategies, which usually reflects:
>
The capability of the country to contribute to the solution of transboundary problems;
>
The significance and evidence of country-specific environmental problems;
>
The significance and evidence of environment-related health hazards;
>
The economic development and potential of the country.
Despite the diversity of problems, interests and priorities across the basin, the Danube countries share
certain values and principles relating to the environment and the conservation of natural resources.
The key principles for water management and water pollution that have formed the basis for the
revision of legal and institutional arrangements adopted by Danube countries include:
>
Consider water as a finite and vulnerable resource, a social and economic good
>
Use of the integrated river basin management approach
>
Implement precautionary principle
>
Introduction and use of BAT, BAP and BEP
>
Control of pollution at the source and creation of cleaner production centres
>
Apply polluter pays principle and the beneficiary pays principle
>
Implement principle of shared responsibilities, respectively the principle of subsidiarity
>
Use market based instruments
>
Implement good international practices in managing environmental expenditures
>
Strengthen international partnership and transboundary cooperation
>
Long-term objectives of water policies in the DRB countries mainly focus on:
page 74
>
Preservation of a sound environment for the future generations;
>
Protection of biological diversity;
>
Protection of drinking water resources.
Countries in the DRB have increasingly recognized that developing and implementing regulation (at the
national, regional and local level) is a precondition for effectively responding to a range of key
challenges. Further assistance and efforts are still needed to building institutional capacity at central
and local government level to address the broad challenges of legal reforms.
The water legislation was amended, or is under revision, according to the EU Directives in most of the
countries. The water sector-related policies and strategies reflect:
>
Country's commitment to respond to EU requirements and international agreements
obligations
>
The need to incorporate general principles for sustainable development, environmental,
economic and social concerns into the national development strategies
>
Capability of the country to contribute to the solution of transboundary problems
>
The significance and evidence of country-specific environmental problems.
A fundamental objective of regulatory reforms in the Danube countries is to foster high quality
regulation that will improve the efficiency of national economies and environmental actions, and will
eliminate the substantial compliance costs generated by low quality regulations. By helping countries
to revise their legal and institutional arrangement, the ICPDR has contributed to long-term economic
prosperity and increased opportunities for investments to reduce pollution and protect natural
resources.
Most of the Danube countries still need to pay attention to adequate coordination and implementation
of policies, legislation and projects for nutrient reduction and pollution control through establishment
or strengthening of their inter-ministerial coordinating mechanisms ("Inter-Ministerial Committees") at
the national level involving all technical, administrative and financial departments. This will help them
effectively address pollution prevention and control issues which require decisions and activities in
more than one government ministry in order to reinforce the development and implementation of and
compliance with national policies and legislation for nutrient reduction, pollution control and
sustainable water management.
In general terms, the 13 DRB countries can be categorized and characterized as follows: Germany
and Austria have substantially reformed their regulatory regimes to assure the functioning of their
democracies and market-based economies, with all legislation in compliance with the "highest
environmental standards". Significant efforts are also required for EU member states for reaching an
acceptable level of implementation.
The German water management and protection policy is in compliance with EU water policy, aiming at
achieving of good water status for all waters by 2015. With the elimination of biological and chemical
pollutions from municipal and industrial sources the most important conditions for further continuous
improvements of the water ecology are already met.
The core of water legislation in Austria is the Water Right Act, which was revised in 2003 to
accommodate the EU Directives principles. Austria is currently engaged in developing an Ordinance
defining water quality objectives for rivers as well as for lakes. Primary goal of water policy is to
ensure sustainable water management through a prudent human interference into waters. Main
principles are: (i) minimizing impacts on water quantity and quality via a stringent system of permits
and control, (ii) protection of population and its living pace and goods against floods, and (iii) public
awareness on the value of water and for it rational use. The WFD implementation is regarded as an
Danube Transboundary Analysis
page 75
important supporting tool to achieve the primary goal of water policy in Austria. In response to the
disastrous floods 2002 activities for the protection against floods are intensified taking into account
developments on the international level. Federal Ministry of Agriculture and Forestry Environment and
Water Management is the competent authorities responsible for preparation and implementation of the
Flood Action Plans.
The experience of the new Member States having joined EU in May 2004 is important information for
other Danube countries.
In March 2004, the Ministry of Environment of Czech Republic prepared the updated State
Environmental Policy for 2004 Ł 2010. Considerable attention is paid to wetland ecosystems, to
rehabilitation of aquatic biotopes, to effective and sustainable protection of surface and ground water
bodies, to harmful contaminants, to integrated water protection and management. Through river basin
management plans, measures to protect wetlands and floodplains shall be implemented. The use of
wetlands and water resources should be sustainable in view of economic pressures and global changes,
and this includes principles referring to landscape and environmentally sound agricultural practice,
wetland and floodplain uniqueness, restoration, remediation and rehabilitation of damaged wetlands
areas. The Water Act considers the whole water policy such as protection of water, water use,
management of water and protection of water depending ecosystems.
The National Environmental Programme of Hungary includes substantial provisions and measures for
the conservation and management of surface and groundwater resources. Some of the key targets and
approved policy directions are: regulation development to encourage sustainable and economical water
use; improvement of water quality for the main water bodies; gradual increase (to a level of 65%) of
the number of settlements with sewers; at least biological treatment of wastewater from sewers;
nitrate and phosphorus load reductions for highly protected and sensitive waters. By 2003 the
Hungarian legislation on water quality protection was fully harmonized with the EU regulations,
including the appropriate institutional set-up.
The implementation of the water management and protection policy of Slovakia is in compliance with
EU water policy, i.e. the WFD, aiming at achieving of good water status for all waters by 2015. The
legislative tools for achieving policy objectives have been prepared. All EC directives have been
transposed into the national law system. The transposition was finished in 2004 through an updated
version of the Water Act. Main priority in relevant sectors (urban wastewater, industrial wastewater,
land use, wetlands) is the implementation of EC directives' requirements (urban and industrial
wastewater during the transition periods), namely reduction of nutrients and priority substances and
creation of effective water management that will be able to promote sustainable water use based on
long - term protection of available resources.
The need to implement a unified policy on the environment and the use of natural resources, which
integrates environmental requirements into the process of national economic reform, along with the
political desire for European integration, has resulted in the review of the existing environmental
legislation in Moldova. The current priorities for water management include the strengthening of
institutional and management capability through improvement of economic mechanisms for
environmental protection and the use of natural resources, setting internal environmental performance
targets and controls, self-monitoring, review of current legislation in line with European Union
legislation, and the adjustment or elaboration on a case-by-case basis.
Bosnia and Herzegovina is faced with major challenges in the environmental and water
management area. Among specific objectives for environment is the development of an environmental
framework in Bosnia and Herzegovina based on the Acquis. The most important issues in the
environment sector will be identified in the Environmental Action Plan, which is being developed with
World Bank support. The EU is supporting a Water Institutional Strengthening Programme, which is
page 76
complemented by two Memoranda of Understanding (2000, 2004) between both Entities and the EC.
Since the WFD was adopted, numerous and diverse activities were initiated to further implement the
Directive.
The water management in Serbia and Montenegro17 is faced with serious tasks that require, above
all: (i) the creation of a system of stable financing for water management, (ii) the reorganization of
water management sector, and (iii) the revision of water legislation and related regulations, in
compliance with requirements of European legislation.
The remaining accession countries Romania, Bulgaria, Croatia as well as those non-accession countries
are experiencing the historic opportunity of European integration, which is the most important driver of
reforms but brings great challenges at the same time:
The adoption in 1999 of the Strategy for the Integrated Water Management marked the beginning of
the reforms in the water sector in Bulgaria in line with the WFD and assumed obligations under
international instruments. Several other programs such as Environmental Strategy to implement the
ISPA objectives, the Program for the UWWT Directive implementation or the National Strategy for
Management and Development of the Water Sector until 2015 complete the picture of on going efforts
in Bulgaria towards complying with EU legislation.
In Croatia, the current basic environmental and water legislation and regulations (such as the Water
Act, Water Management Financing Act, State Water Protection Plan) will be revised to meet the EU
directives requirements within the frame of two EC CARDS projects expected to start at the end of
2004.
In Romania basic water legislation (Water Law) and implementing regulations, standards and
ordinances regulations have already been fully harmonized with the EU directives.
Ukraine has not yet updated the environmental policy act (the Principal Direction, 1998). The update
version of the Sustainable Development Strategy, however, has been recently submitted for approval
by the Parliament. The Program of the Development of Water Economy is in force but still specific
legislation on water management is missing. The current Governmental Action Plan is a comprehensive
document, which integrates economic, social and environmental concerns. The Water Code of Ukraine
harmonized with EU Directives is submitted as well for approval.
The high cost of achieving EU environmental compliance is a formidable challenge for the new member
states, Bulgaria and Romania, and several Balkan countries that have negotiated Stabilisation and
Association Agreements (SAAs) with the EU to bring their countries closer to EU standards.
Since the beginning of accession negotiations, the EU has stressed that at least 90% of the cost of
environmental compliance must be borne from countries' own sources, representing 2-3% of GDP for
many years to come.
17 Serbia and Montenegro have recently formed two states. However an update of the internal structures has yet to
be prepared
Danube Transboundary Analysis
page 77
Table 6: Status of water-related policy, programmes and National Environmental Action Plans in the
DRB countries
Country Explicitly formulated policy objectives Programmes especially dealing with water
Programmes dealing with
for water management and pollution management and pollution control
WFD implementation
control
DE
Appropriate system of policy
Action Programs
Strategy for WFD
objectives completely in line with the Environmental Statute Book
implementation
requirements of the relevant EU
Directives
AT
Appropriate system of policy
Action Programme to control diffuse pollution
Strategy for WFD
objectives completely in line with the Austrian Programme of Environmental Friendly
implementation
requirements of the relevant EU
Agriculture
Directives
Austrian Water Protection Policy
Water Right Act
CZ
Appropriate system of policy
Program for adequate implementation of
The State Environmental
objectives
municipal WWTPs
Policy 2004 Ł 2010
Resolution 339, 2004
SK
Satisfactory system of policy
National Environmental Action Program Codex of Strategy for WFD
objectives in the Strategy for
Good Agricultural Practices
implementation
National Environmental Action
State Water Protection Plan
Inter sectoral Strategic
Program, 1993; National Strategy for Action Plan for the protection of biological and
Group
Sustainable Development, 2000 and
landscape diversity
Coordinating office
Water Management policy
Working Groups
HU
Appropriate system of policy
National Environmental Program
Strategy for WFD
objectives
National waste water collection and treatment
implementation
programs
National agro-environm. protection program
Other programmes (lake, oxbow lake, low land,
etc.)
SI
Satisfactory system of policy
National Environmental Action Plan, 1999
Strategy for WFD
objectives
New Environmental Action Plan in preparation
implementation
Operative program for wastewater collection and
treatment
HR
Satisfactory system of policy
State Water Protection Plan
Strategy for WFD
objectives in the current legislation:
Strategy and Action Plan
implementation
National Strategy for Environmental
Protection, 2002
State Water Protection Plan, 1999
Environmental protection Plan
Nature Protection Act, 1999
Water Act, 1995
BA
Limited number of policy objectives EU
CARDS
Program
New Water Law in line
USAID, WB, GEF programmes
with WFD, expected 2005
National Environmental Action Plan, 2003
CS
Insufficient system of policy
No explicit programmes
Harmonisation with EU
objectives and focussed programs
legislation
BG
Satisfactory system of policy
Environmental Strategy to implement ISPA
Strategy for WFD
objectives
objectives
implementation
Program for UWWT Directive implementation
National Strategy for Management and
development of the water sector until 2015
Programme for construction of munic WWTPs
RO
Satisfactory system of policy
National Environmental Action Plan
Strategy for WFD
objectives
Strategy for environmental protection
implementation
Strategy for water resources management
Series of nutrient-related programmes to be
carried out during the forthcoming period
Action program for reduction of pollution due to
dangerous substances
MD
Reduced policy objectives.
National Water resources management Strategy, Strategy for WFD
National Strategy for sustainable
2003
implementation
development, 2000
Water Supply and Sewage program, 2002
Concept of the Environmental Policy, National Action Plan on Health and Environment,
2001
1995
UA
Under the revision system of policy
Program of the Development of Water Economy Water Code of Ukraine
objectives within the frame of the
Governmental Action Plan
harmonized with EU
update version of the Sustainable
Directives (expecting
Development Strategy
approval)
page 78
7.2.
Summary of investments identified
Under the ICPDR Joint Action Plan and the EC DABLAS programme over 4,000 M USD of required
investments in municipal, agricultural, industrial and wetland restoration were identified. These needs
have been incorporated into the monitoring of the performance indicators for the GEF Danube ŁBlack
Sea Strategic Partnership. A mid-term report on the activities undertaken of the Partnership has been
provided to GEF Council in October 2005. The summary below represents the conditions at that date
and indicates the fully-financed projects that were underway or had been completed recently.
Table 7: Summary of investments and project nutrient reductions.
No. of
Total Investment Nutrient Removal, t/a
Timeframe
Projects
MUSD
N P
Completed by Dec 2003
56
803
5,351
1,013
Completed in 2004 and 2005
35
475
4,552
836
Completed after 2005 (full financed)
106
1440
>10,013
>1,839
World Bank-GEF NRIF
14
576
5,936
443
TOTAL 211
3,294
>25,852
>4,131
Among the 211 fully financed projects, 128 are situated within the DRB EU member countries: Austria,
Germany Czech Republic, Hungary, Slovakia, and Slovenia. Municipal sector projects account for the
majority of the fully financed projects, and national co-financing provided more than 50% of total
municipal investments. Most GEF-WB investments are instead concentrated on non-EU countries and
in the agricultural sector.
Danube Transboundary Analysis
page 79
Table 8: Overview of implementation of EU Directives
Country/
Water Framework
Dangerous Substances
Integrated Prevention and Seveso Environmental
Impact
Environmental
Directive
Pollution Control
Assessment
Management and Audit
Schemes
Bosnia &
Not implemented and
Not implemented and
Not implemented and
Not implemented and
Not implemented and
Not implemented and
Herzegovina changes not planned to
changes not planned to
changes not planned to
changes not planned to
changes not planned to
changes not planned to
transpose the EU directive transpose the EU directive transpose the EU directive transpose the EU
transpose the EU
transpose the EU directive
directive
directive
Bulgaria Partially
implemented Transposed and
Partially implemented
Partially implemented
Fully implemented in
Partially implemented
using as future framework substantially implemented using as future framework using as future
National Legislation
using as future framework
for national legislation
in National Legislation
for national legislation
framework for national
for national legislation
legislation
Croatia* Not
implemented
and Not implemented and
Not implemented and
Not implemented and
Not implemented and
Not implemented and
changes not planned to
changes not planned to
changes not planned to
changes not planned to
changes not planned to
changes not planned to
transpose the EU directive transpose the EU directive transpose the EU directive transpose the EU
transpose the EU
transpose the EU directive
directive
directive
Czech
Transposed and
Fully implemented in
Fully implemented in
Fully implemented in
Fully implemented in
Fully implemented in
Republic
substantially implemented National Legislation
National Legislation
National Legislation
National Legislation
National Legislation
in National Legislation
Hungary Transposed
and
Fully implemented in
Transposed and
Fully implemented in
Fully implemented in
Fully implemented in
substantially implemented National Legislation
substantially implemented National Legislation
National Legislation
National Legislation
in National Legislation
in National Legislation
Moldova Not
implemented
and Not implemented and
Not implemented and
Not implemented and
Not implemented and
Not implemented and
changes not planned to
changes not planned to
changes not planned to
changes not planned to
changes not planned to
changes not planned to
transpose the EU directive transpose the EU directive transpose the EU directive transpose the EU
transpose the EU
transpose the EU directive
directive
directive
Romania Partially
implemented Partially implemented
Partially implemented
Partially implemented
Transposed and
Partially implemented
using as future framework using as future framework using as future framework using as future
substantially
using as future framework
for national legislation
for national legislation
for national legislation
framework for national
implemented in National for national legislation
legislation
Legislation
Serbia Ł
Not implemented and
Not implemented and
Not implemented and
Not implemented and
Not implemented and
Not implemented and
Montenegro changes not planned to
changes not planned to
changes not planned to
changes not planned to
changes not planned to
changes not planned to
transpose the EU directive transpose the EU directive transpose the EU directive transpose the EU
transpose the EU
transpose the EU directive
directive
directive
Slovakia Transposed
and
Fully implemented in
Fully implemented in
Fully implemented in
Fully implemented in
Fully implemented in
substantially implemented National Legislation
National Legislation
National Legislation
National Legislation
National Legislation
in National Legislation
Slovenia Transposed
and
Fully implemented in
Fully implemented in
Fully implemented in
Fully implemented in
Fully implemented in
substantially implemented National Legislation
National Legislation
National Legislation
National Legislation
National Legislation
in National Legislation
Ukraine Not
implemented
and Not implemented and
Not implemented and
Not implemented and
Not implemented and
Not implemented and
changes not planned to
changes not planned to
changes not planned to
changes not planned to
changes not planned to
changes not planned to
transpose the EU directive transpose the EU directive transpose the EU directive transpose the EU
transpose the EU
transpose the EU directive
directive
directive