


Month Year
A case study for Monitoring and Assessment of
Nutrient Removal Capacities of Riverine
Wetlands
Restoration of Katlabuh Lake - Danube Delta,
Ukraine
AUTHORS
PREPARED BY:
Project management: WWF Danube - Carpathian Programme
Project implementation: Odessa Oblast State Water Management Board (WMB)
AUTHORS:
Mikhail Nesterenko
A case study for Monitoring and Assessment of Nutrient Removal Capacities of Riverine Wetlands
page 1
TABLE OF CONTENTS
1. Background ................................................................................................................3
1.1. Project area: ......................................................................................................3
2. Physiography of the lake...............................................................................................4
2.1. Climate..............................................................................................................4
2.2. Hydrology ..........................................................................................................4
2.3. Biota .................................................................................................................6
2.4. Land Use ...........................................................................................................7
2.5. Fishery ..............................................................................................................7
2.6. Agricultural water supply and agricultural usage of water ..........................................7
3. Short History of wetland ...............................................................................................9
3.1. Embankment and it's consequences.......................................................................9
4. Main problems...........................................................................................................10
5. Status of the wetland .................................................................................................11
5.1. Protection status:..............................................................................................11
5.2. Restoration works: ............................................................................................11
5.3. Management of the wetland................................................................................12
6. Project description .....................................................................................................13
6.1. Project outline and objectives .............................................................................13
6.2. Nutrient monitoring scheme................................................................................13
6.3. Monitoring results .............................................................................................17
6.3.1.
Biological Oxygen Consumption. ................................................................... 17
6.3.2.
Chemical Oxygen Consumption .................................................................... 19
6.3.3.
Nitrogen ................................................................................................... 19
6.3.4.
Chlorides and sulfates ................................................................................. 22
6.3.5.
Mineral phosphorus (phosphates) ................................................................. 25
6.3.6.
Total salt................................................................................................... 26
7. Conclusions ..............................................................................................................27
7.1. Influence of the catchment and small rivers ..........................................................27
7.2. Influence of the Danube.....................................................................................27
7.3. Expected changes after restoration ......................................................................28
8. Lessons learned and Outlook .......................................................................................29
9. Database..................................................................................................................30
References and key bibliography for the region..................................................................... 31
ANNEX 1: Results of chemical analyses of water samples form Katlabuh lake under the project. .. 33
UNDP/GEF DANUBE REGIONAL PROJECT
Restoration of Katlabuh Lake - Danube Delta, Ukraine
page 2
ACRONYMS AND ABBREVIATIONS
BOC:
Biological
oxygen
consumption
COC:
Chemical oxygen consumption
WWF:
World Wide Fund for Nature
WWF � DCP:
World Wide Fund for Nature � Danube Carpathian Programme
WMB:
Odessa Oblast State Water Management Board
SSU:
State Standard of Ukraine
WWF DCP & OOSWMB / MIKHAIL NESTERENKO
A case study for Monitoring and Assessment of Nutrient Removal Capacities of Riverine Wetlands
page 3
1. BACKGROUND
1.1. Project area:
Wetland name: Katlabuh Lake
Coordinates: Latitude:450 25' N, Longitude: 280 59' E
Country: Ukraine
Region: Danube Delta
Neighboring river: The River Danube
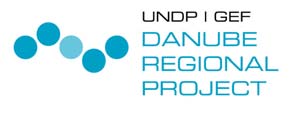
Fig 1. Project area
Project area
UNDP/GEF DANUBE REGIONAL PROJECT
Restoration of Katlabuh Lake - Danube Delta, Ukraine
page 4
2. PHYSIOGRAPHY OF THE LAKE
Katlabuh lake is situated in Ukrainian Danube Delta, ten kilometers north-east from Izmail town. It
occupies the territory of 68 square km, its average width is of 2 km, and maximum one is of 6 km.
Katlabuh has steep cliff banks which that become gentle on the south descending to wetlands.
Under natural conditions (before embankment) the lake was a part of a larger wetland complex
including reedbeds and smaller lakes of Safyiany.
The modern catchments of the Katlabuh lake is 1290 km, including the catchments of the small
rivers of Tashbunal, Enika and Bolshoy Katlabuh with the total area of 1035 km.
According to Ramsar wetland classification it's type O - Permanent freshwater lakes (over 8 ha).
2.1. Climate
Katlabuh lake is situated in the moderate continental climate zone. The Black Sea, large lakes
nearby and marshes mitigate the climate. Winter is short and mild with unsettled frosts, summer is
continuous and hot, and autumn is warm.
Rare cyclones is a principal reason of relatively small quantity of precipitation. It is about 380...410
mm a year. Evaporation exceeds 800 mm. Most of precipitation (65...45% of a year norm) occurs
in a warm year period as showers.
The area is characterized by high heat and a considerable deficit of water.
2.2. Hydrology
The Katlabuh lake consists of 4 parts: central part bordering on the Danube River and 3 narrow tips
� the valleys of small rivers: Tashbunar. Bolshoy Katlabuh and Enika.
Central part of the lake is the deepest with the minimum depth of 1,0 m, while the upper tips are
rather shallow with maximum depth of 0,5 m.
Before 1957 water regime of the lake was completely natural and depended on the exchange with
the Danube and run-off of the small rivers. However, hydrological regime of the lake depends
entirely on the Danube and the influence of the rivers is minor.
There were no hydrological observations of the lake under natural conditions.
In the 60's the dyke was built between the Katlabuh lake and the Danube River as well as the
sluices at the canals connecting the lake to the Danube river. Thus, the lake was converted into a
water reservoir, which resulted in a significant change of the water regime of the lake.
Under artificial regulation the water levels are maintained according to the main normative levels:
�
normal affluent level (NAL),
�
forced affluent level (FAL),
�
dead storage level (DSL).
Hydrological and level regimes of the lake depend on the following factors:
WWF DCP & OOSWMB / MIKHAIL NESTERENKO
A case study for Monitoring and Assessment of Nutrient Removal Capacities of Riverine Wetlands
page 5
�
water inflow and outflow form the Danube;
�
water inflow from the catchment area;
�
precipitations
�
evaporation
�
morphology of the lake pan;
�
hydraulic characteristics of the regulatory constructions.
The main principals of exploitation water management of the lake is to follow the natural water
regime as much as possible with compulsory implementation of the requirements of the main water
users and water consumers.
The main water regime provisions are:
filling in the lake in spring to NAL;
maintenance of the water level at NAL during summer and autumn in order to provide requested
quality and quantity of the water to the water extractions;
discharge of the water to DSL in autumn;
maximum filling-in in autumn � winter but not higher than NAL;
discharge of the water to DSL before spring for water exchange;
to accommodate high floods, FAL level may be used that enables accommodation of high floods up
to 1% probability.
Morphological measurements of the Katlabuh lake are listed below in the table I.
Table I. Morphology of the Katlabuh Lake
e
v
erage
ic
g
m
Balt
t
ora
th, km
ng
idth
rface area km2
u
otal volume
Le
Max width/average
w
Max depth/a
depth
S
at NAL
Shallow water
areas (up to 2 m)
at NAL km2
T
million m3
Net storage volume
million m3
Length of the
banks km
Normal affluent
level (NAL) m Baltic
s
y
stem
Dead Storage level
(DSL) m
s
y
stem
Forced S
Level (FSL)
Baltic system
1
2 3 4 5 6
7 8 9 10
11
21 6,0 2,7
68,5 29,0 131
68,5 75,4 1,70 0,70 3,00
3,3
1,92
1%
Actual water levels do not always correspond to the normative levels due to technical reasons.
Average long-term water level in the lake is 1,35 m, maximum � 1, 83 m, minimum � 0,91 m.
Table II below presents average monthly levels in the Katlabuh lake.
UNDP/GEF DANUBE REGIONAL PROJECT
Restoration of Katlabuh Lake - Danube Delta, Ukraine
page 6
According to the table NAL and DSL levels could not be reached each year which did not enable
normal water exchange.
Table II. Average monthly water levels in the Katlabuh lake.
Year/mon
I
II
III
IV
V
VI
VII
VIII
IX
X
XI
XII
year
th.
1985
130 137 159
183
172
157
165
161
153
130
102
107
151
1990
107 108 107
112
119
128
120
117
125
136
129
132
124
1979
115 123 132
146
169
149
139
122
119
129
132
140
139
1985 � high water year
1990 � low water year
1979 � average year
To improve the lake water quality it is necessary to increase filling with the Danube water. When
solving problem it was taken into account that embankment also plays a positive role protecting
ecosystems from pollutants flowing from the upper Danube.
2.3. Biota
Katlabuh lake is a typical floodplain wetland. As most of the central Danube lakes it has a large
open water area with very narrow stretches of emerged aquatic vegetation dominated by reed
Phragmites australis (Cav.) along the shores with somewhat larger reed-beds in the upper parts.
The former extensive reed-beds of Katlabuh in the downstream part were cut-off from the lake in
the 60's by the dam.
As most of the coast line is rather steep hills with clay cliffs in central parts of the lake, the main
habitat types along the shores is the steppe vegetation. Steppe habitats are rather degraded due
to intensive grazing.
Most of the slopes were planted with hedgerows of various tree species. The areas between the
slopes and the water are largely covered with meadows. Most of the meadows are also degraded
due to intensive grazing. In many places meadow turned into transition communities towards salt
marshes and Artemisia communities. The Artemisia communities are probably secondary habitats
replacing freshwater meadows due to intensive grazing pressure.
The most valuable areas in Katlabuh lake are the reed-beds along the Danube between the
Katlabuh and Safiany lake. Central part of these reed-beds is a protected area of local importance.
This is a mosaic marsh with many open water areas with abundant aquatic macrophytes: Nuphar
lutea, Nymphaea alba, Salvinia natans, Hydrocharis morsus-lutea, and rare birds, such as the
Pygmy Cormorant, Glossy Ibis, Squacco Heron, White-tailed Eagle, and other rare species of flora
and fauna listed in the Red Data Book of Ukraine.
Reconnection of this marsh with Katlabuh lake is envisaged under the follow up of Katlabuh
restoration project.
WWF DCP & OOSWMB / MIKHAIL NESTERENKO
A case study for Monitoring and Assessment of Nutrient Removal Capacities of Riverine Wetlands
page 7
2.4. Land Use
The main economic activities in the area are fishery and agriculture.
There are several villages around the lake Izamil, Suvorovo, Utkonosovka, Pershotravnevoe,
Bogatoe, Kislitsa. Population of these villages mostly uses the lands in the catchments of the lake
and outside. However, the local people use the meadow and steppe communities on the shores of
the lake for grazing of the livestock. The lake itself is rented by a fishery-agricultural enterprise
"Pridunayskaya Niva". This company also owns the fish ponds downstream of the Katlabuh lake
and stocks the lake. Moreover, this company is the only user of all the living resources on this
wetland.
2.5. Fishery
Katlabuh is one of the most important water bodies for fishery industry in Odessa region. Though
Katlabuh takes only 3.5% of the area of inner water bodies in the region its share in fish yield is
from 13% to 21%. Fish catches in Katlabuh fluctuate from 263.3 t to 1,366.4 tons.
In 1950s before regulation of the water regime the lake fish fauna included almost all fish species
which inhabited the lower Danube. The commercial catches registered Cyprinus carpio L,
Lucioperca lucioperca L., Abramis brama L., Carassius carassius L., arassius auratus gebelio L.,
Vimba vimba L., Aspius aspius L., Tinca tinca L., Leuciscus cephalus L., Rutilus rutilus L.,
Scandinius erythrophalmus L., Silurus glanis L., Exox lusius L., Perca fluviatilis L. and Blicca
bjoerkna L.
In early 1970s in Katlabuh and other Danube lakes the fish stocking started. There were
herbivorous fishes: Hypophtalmichthys molitris Val, Aristichthys nobilis Rich and in less degree
Ctenopharyngodon idella L.
Over the last 25 years the silver carp is the main commercial fish species. Its average annual yield
in 1980s was 800 tons. In 2003 In Katlabuh there were caught 150.8 tons of the silver carp, 63.8
tons of the bream, 87.8 tons of the crucian, 5.2 tons of the sander, 0.1 tons of the pike and 0.1
tons of the redeye.
An important commercial object in 1950-1970s in Katlabuh was the crayfish Pontoastacus cubanius
daucsnus (Pontoastacus leptodactylus natio danubialis Brodsky, 1967). In 1970s Katlabuh gave up
to 39% of the total yield of this crayfish in Ukraine and near 24% of the total yield of the former
USSR. Over the period 1959-1977 in Katlabuh there were caught 2,673.4 tons of the crayfish. It
means 133.7 tons a year in average. At present Katlabuh population of the crayfish is depressed,
and no commercial trade of it is taken.
Restoration of the constant water exchange between Katlabuh and the Danube will favor increase
of the species diversity of the lake fish fauna and improvement of spawning conditions for
indigenous fish species. It also will assist returning huge yields of the crayfish.
2.6. Agricultural water supply and agricultural usage of water
Nearby to Katlabuh there are such localities as Izamil, Suvorovo, Utkonosovka, Pershotravnevoe,
Bogatoe, Kislitsa. The resources of the storage lake are mainly used for irrigation, fishery and
agriculture.
An important factor for functioning and socio-economical development of the searched area is
supply of the economic complex with water.
UNDP/GEF DANUBE REGIONAL PROJECT
Restoration of Katlabuh Lake - Danube Delta, Ukraine
page 8
This region is a zone of intensive land development with irrigation. The concentration of irrigated
lands directly influences on the structure of cultivated areas of different agricultural enterprises.
Cultivation of agricultural plants on the irrigated lands is a leading branch in the region. The area of
the irrigated lands in the Katlabuh basin is 16,894 ha. From them 15,560 ha are state irrigation
systems, and 1,334 ha are irrigated with local systems. During recent years the quantity of the
water taken for irrigation decreased. It is related to reforms in an agrarian branch of economics
(including land laws), and imperfect and unstable policy of taxation, credits and prices. So in 1980
54.5 mln m3 was taken from Katlabuh, in 2002 it was 2.81 mln m3, and in 2003 only 1.97 mln m3
of water.
Land drainage for agriculture resulted in reducing species of local flora and fauna. Apart from this
fact fields often border with the water edge without any buffer zones. From villages situated near
the lake the untreated domestic sewage water and wastewater from cattle farms flow into water
bodies. Such an impact worsens ecological state of the lake. It also affects social environment of
the residents.
The floodplain areas are almost completely used for fish-breeding ponds with regulated water
supply and artificial water exchange.
At present on the polder area there are agricultural territories of different kinds � fields, fallows,
recultivated pastures and haylands, useless lands, field buildings, canals.
Agricultural enterprises use about 60% of all land resources of the area. Share of the arable land
around the Katlabuh lake is the highest in the region. It is near 90%.
WWF DCP & OOSWMB / MIKHAIL NESTERENKO
A case study for Monitoring and Assessment of Nutrient Removal Capacities of Riverine Wetlands
page 9
3. SHORT HISTORY OF WETLAND
3.1. Embankment and it's consequences
Before the embankment, the Katlabuh lake and adjacent areas were regularly flooded by the
Danube following the seasonal dynamics of the river. After embankment only a narrow strip of the
floodplain along the Danube is inundated. The lake was totally embanked in 1957. But because of
the filtration under dykes the level of underground water raised and sometimes it caused death of
agricultural crops and soil salinization.
The embankment protected about 2,500 ha of the lands from inundation but had dramatic
consequences:
�
Break of the complex ecological balance; natural meadows disappeared, spawning grounds
and natural forests decreased;
�
Floodplain development stopped;
�
Foreshore is eroded by water;
�
Vast reedbeds stopped filtering sediments and nutrients from the Danube water;
�
Accumulation of salt and growth of mineralization and pollution of the water due to limited
water exchange;
�
Decline of the natural fish stock and a need for artificial stocking.
�
Volumes of the annual water exchange decreased; the water quality deteriorated.
Embankment, removal of natural channels and construction of artificial canals changed natural
hydrological processes in the lake. Before embankment the process was the following: while the
water level in the Danube exceeded the level of the lake the water filled in the Katlabuh. When the
water level in the Danube fell the water from Katlabuh gradually drained into the river. So the
higher aquatic vegetation at marshes served as a natural filter, accumulating considerable part of
silts.
UNDP/GEF DANUBE REGIONAL PROJECT
Restoration of Katlabuh Lake - Danube Delta, Ukraine
page 10
4. MAIN
PROBLEMS
Altered water regime led to significant deterioration of water quality and ecosystem of the lake.
Because of growing salinity, water consumption that provides 16.000 people with drinking and
irrigation water has dropped 5 times from 1995 to 2001. High water level throughout the year has
contributed to heavy bank erosion and part of the riverbank has been lost.
In collaboration with the Odessa Oblast State Water Management Board and local organisations, a
restoration of natural connection of the Lake and the Danube River was initiated in order to revive
fluctuation of water levels in the lake and natural fish stocks in the lake.
Water-salt balance calculations for Katlabuh indicate that in order to maintain mineralization of
water at the natural level of 1-1,6 g/l in 75% water probability year and with minimum water
extraction, water exchange at the peak of flood (Aipril) must be up to 80 m3 per second or 71
million m3 in total.
Restoration of the old channel between the lake and the Danube nearby Kislitsy village that would
discharge 50-60 m3 per second will bring 50-60 million m3 of water, which will significantly
improve water quality and water exchange.
Restoration of natural water exchange in expected to lead to a significant decline in salt contents of
the lake to the levels close to the Danube water. However, on the short term after the opening of
the lake some negative effects are possible for both the Katlabuh lake and the Danube river. These
effects relate first of all to washing out bottom deposits and return of chemical substances,
especially such as nutrients to the Katlabuh lake and thus the Danube river. As historical data on
water quality show, Katlabuh lake should still play a significant role in reducing nitrites and nitrates
for the Danube. However, concentrations or ammonium and other chemicals are expected to
increase at least on the short term. On the long though, the effect of restoration on nitrogen
transport needs to be further investigated as after reopening of the lake, positive changes are
expected in the ecosystem of the lake related to development of aquatic vegetation and thus
increase of removal capacity of the lake for the nutrients.
Nutrient pollutions is the second problem after mineralization for most of the Danube lakes that are
artificially managed. Water eutrophication along with altered natural connection has significantly
changed the aquatic communities of the lake. These changes mainly relate to decline of emerged
aquatic vegetation and valuable habitats as well as to decline and change of the natural fish
communities.
Moreover, Katlabuh lake as well as most of the floodplain wetlands, played an important role in
processing of nutrient loads form the catchments as well as in removal of nutrients from the
Danube water. Flood water entering the Katlabuh lake would loose nutrient loads in the wetlands
and filtered water returned to the Danube after flooding. This important process was stopped as a
result of embankment of the almost entire floodplain on Ukrainian section of the Danube, which
has contributed to pollution of the Danube river, and thus the Black Sea.
Therefore, this project aims to the first experience in returning the floodplain functions to large
lakes along the Danube and assess the role of these wetlands in transport and removal of nutrients
from the Danube.
WWF DCP & OOSWMB / MIKHAIL NESTERENKO
A case study for Monitoring and Assessment of Nutrient Removal Capacities of Riverine Wetlands
page 11
5. STATUS OF THE WETLAND
5.1. Protection status:
None; protected area of the local importance is located at the marsh area downstream of the
Katlabuh lake, which used to be a part of Katlabuh. Further restoration plans aim to reconnect this
marsh system to the Katlabuh lake.
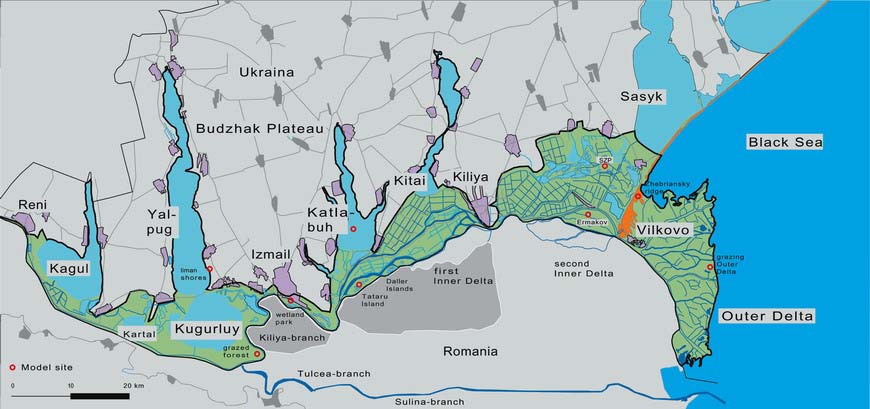
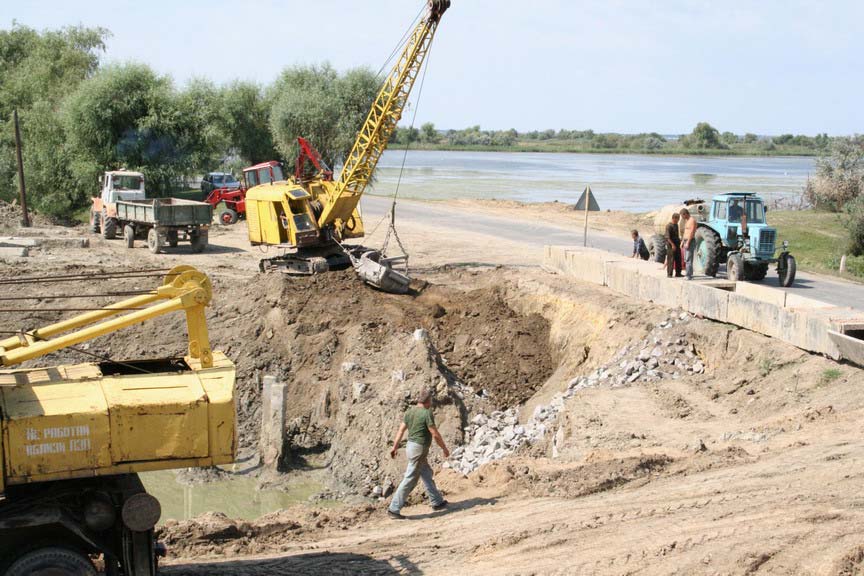
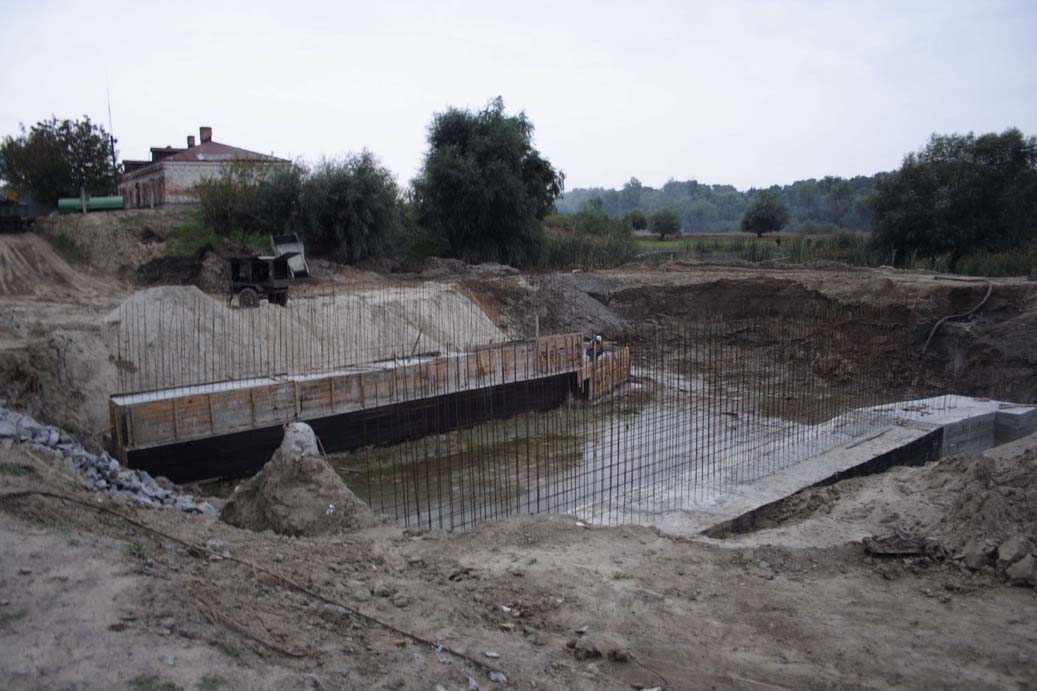
5.2. Restoration works:
The ongoing restoration works include reopening of the old channel between the Katlabuh lake and
the Danube. (Fig 2 and 3).
Fig. 2. Start of restoration works: construction of opening to the Danube with a bridge
Fig. 3. Ongoing restoration works
UNDP/GEF DANUBE REGIONAL PROJECT
Restoration of Katlabuh Lake - Danube Delta, Ukraine
page 12
Overall restoration objectives:
1. to implement the restoration of natural connection of the Katlabuh lake and the
Danube river for improvement of water quality, especially salt contents in the lake
2. to develop and introduce a new water regime and use of the lake under the
conditions close to the natural water exchange between the reservoir and the river
3. to develop and introduce water protection regime within water protection zone
4. to develop and introduce monitoring scheme based on the current monitoring scheme
of WMB.
The restoration activities were started in spring 2006. The first phase of restoration � reopening of
the old channel and connection of the lake to the Danube River � should be finalized in spring
2007.
After reopening of the lake the first visible results will be available with the first flooding in spring �
autumn 2007.
Total cost of restoration is about 400,000 USD. Percent of total cost of project used for nutrient
control measurements about 22 000 USD or 8% of the total project costs.
5.3. Management of the wetland
The Katlabuh lake as most of the wetlands along the Danube is managed by Odessa Regional State
Water Management Board who is a representative of the Ukrainian State Water Management
Committee at the county or province level.
The management of the lake is aimed to fulfill the requirements of the main water users and water
consumers in the area.
Management will change after restoration to adopt water uses (fishery and water extraction for
irrigation and drinking) to dynamic water levels.
The Katlabuh lake borders several other wetlands: Lung � Safiany lake system (former reedbeds of
Katlabuh lake), 3 small rivers discharging to Katlabuh form the catchment: Enika, Tashbunar and
Bolshoy Katlabuh as well as Danube river.
Entire lake as well as the adjacent agricultural lands and fishponds are used and a property of a
fishery-agricultural enterprise "Pridunayskaya Niva".
The main economic activities this company runs in the area are fishery and agriculture. However,
the lake also plays an important role in water supply to 5 villages around the lake including
drinking water supply and irrigation. Yet, as all the large wetlands under artificial management,
Katlabuh lake is used as a water reservoir for accommodation of flooding especially in cases of high
floods with respective management prescriptions descried in a chapter on hydrology of the lake.
WWF DCP & OOSWMB / MIKHAIL NESTERENKO
A case study for Monitoring and Assessment of Nutrient Removal Capacities of Riverine Wetlands
page 13
6. PROJECT
DESCRIPTION
6.1. Project outline and objectives
Katlabuh restoration model project is an important step towards a large-scale implementation of A
VISION FOR UKRINIAN DANUBE DELTA (a vision document may be downloaded from
www.panda.org/dcpo), that was developed together with the key partners and stakeholders in
Ukraine) and a contribution to the Lower Danube Green Corridor agreement.
Restoration of the old channel between the lake and the Danube nearby Kislitsy village will
significantly improve water quality and water exchange. Moreover, this option is the most feasible
and cost effective as the dam between the lake and the Danube river is used as an important road
between large towns in the region and thus any restoration would include expensive construction of
bridges to maintain this road access.
The water quality monitoring data will be used firstly to investigate the impact of wetland
restoration on nutrient loads secondly to further advocate wetland restoration in Ukraine (through
cooperation with WMB) and in the Danube basin (trough WWF DCP).
Experience gained as a result of this project will enable substantially revise water management
practices in Ukrainian Danube Delta and be a foundation for a large-scale wetland restoration and
change of wetland management policies in the region.
Regular observations of water quality in the lake prior and after the restoration efforts form an
essential component of the project. This data should prove and give first experience in mitigation
and removal of harmful impact of water control to the ecosystem of the lake. It's expected that
restoration of the natural connection of the lake to the Danube river will significantly improve water
quality, especially the mineralization of the water. Influence of the restoration efforts on nutrient
loads in the lake will be monitored to see how the restoration efforts on large lakes in Ukrainian
Danube delta may revitalize water purification capacities of the Danube wetlands.
However, for a better understanding of the role of Katlabuh lake in transport and utilization of
nutrients as well as spatial and temporal distribution of nutrients additional sampling needs to be
done after completion of restoration works.
6.2. Nutrient monitoring scheme
Analyses of the historical data still cannot fully demonstrate mutual influence of the Danube and
the Katlabuh lake in terms of nutrient transport and utilization. The main reason for that is the fact
that sampling was made only at a few points and does not demonstrate the spatial variation of
nutrient loads in the Katlabuh lake.
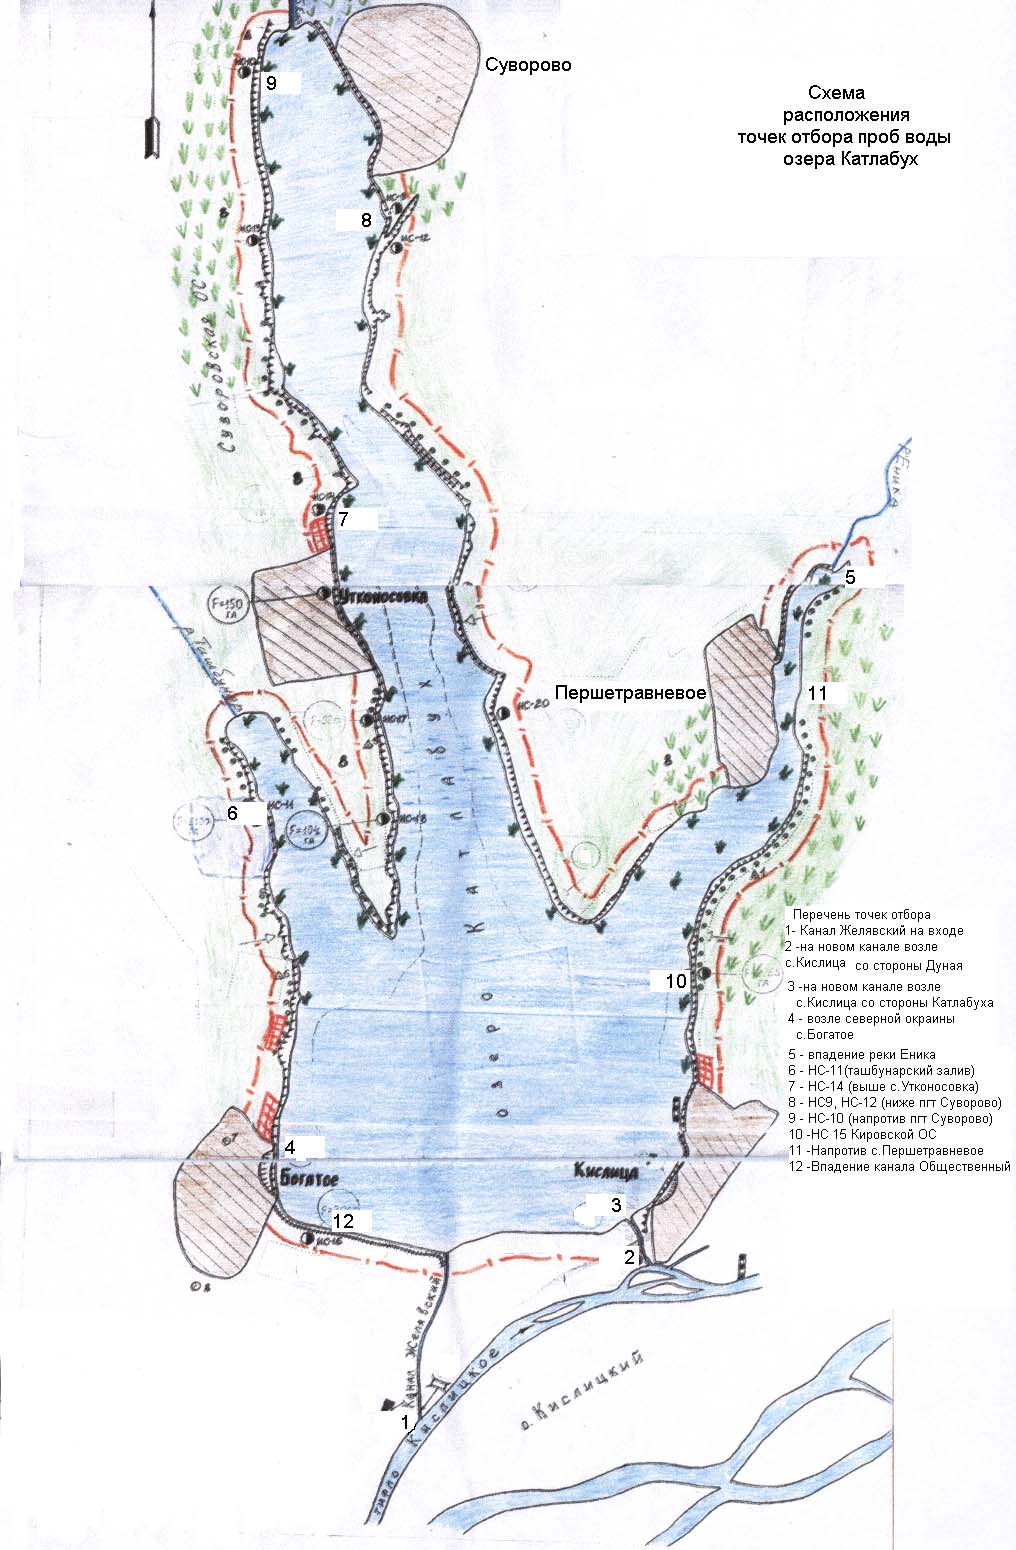
Therefore, it was suggested to make additional sampling at 13 points around the lake (Fig. 4) in
order to get a full understanding of spatial and temporal distribution of nutrients in the Katlabuh
lake as well as mutual influence of the Danube River and the Katlabuh Lake.
UNDP/GEF DANUBE REGIONAL PROJECT
Restoration of Katlabuh Lake - Danube Delta, Ukraine
page 14
Objectives for nutrient monitoring:
1. to assess the impact of restoration measures on nutrient loads in Katlabuh and the
role of the lake in transport of nutrients to the Danube river on short and long term;
2. to develop recommendations on the role of floodplain wetlands in transport and
utilization of nutrient loads for TGD and advocacy further wetland restoration
projects in Ukrainian Danube delta.
Fig. 4. Scheme of water sampling points at Katlabuh lake for nutrient monitoring.
WWF DCP & OOSWMB / MIKHAIL NESTERENKO
A case study for Monitoring and Assessment of Nutrient Removal Capacities of Riverine Wetlands
page 15
Monitoring of the water quality in the lake was done on the basis of the Ukrainian State Monitoring
Programme for surface waters. This programme stipulates taking samples on monthly basis for
various indexes including the nutrients.
Table III. Water quality indexes covered by state monitoring programme.
pH
Surface active anions
Chlorides
COC
Phosphates
Nitrite ions
Ca & Mg
Nitrates
Sulfates
Total Fe
Dissolved oxygen
Cu
BOC
Suspended matter
H2S and sulfides
Hydrocarbonates
Total phosphorus
Nitrogen total
Phenols
Al
Color
Hardness
Ammonium
Smell
Mn
Cd
Dry substance
K, Li and NA
Cr and Zn
Alkalinizes
Sampling was done in the autumn � winter 2006. The first sampling at 7 points was already
performed in October 2006 at the beginning of the autumn flooding. Additional sampling at 13
points was done in November and December at peak and after the autumn flooding on the Danube.
Thus there were 52 water samples processed under this project (each sample is take 2 times
according to the Ukrainian standard methods).
The results of sampling are presented in Annex 1.
Water sampling in Katlabuh lake was done according to the national standards of Ukraine "Water
quality, part 4" (state standard of Ukraine (SSU) ISO 5667-4:2003) at the points indicated at the
scheme above and according to the methods listed below (Table IV.)
Samples were taken from the shore from the layer right under the surface of water.
The samples were delivered in clean hermetic and light-proof plastic bottles to the hydrographical
laboratory in Odessa.
Samples were processed instantly or conserved by standard methods for later analyses.
During the sampling, special forms were filled in indicating temperature and transparency of water
as well as physical-chemical parameters, which may change during transportation.
UNDP/GEF DANUBE REGIONAL PROJECT
Restoration of Katlabuh Lake - Danube Delta, Ukraine
page 16
Special emphasis was paid to nutrients, which are the substances important for living organisms or
the products of living organisms. These are the nitrogen and phosphorus substances.
Table IV. Samples processing methods.
Parameter
Measurement method
Comment
(ISO 10523:1994, MOD) SSU 4077-2001
At sampling
Chlorides
Argentometry titration 081/12-0004-01
In the lab
Mercurrometry 211.1.4.037-95
Phosphates
Photometry 081/12-0005-01
In the lab
Ca and Mg
Titration 081/12-0006-01
In the lab
Sulphates
Gravimetry 081/12-0007-01
In the lab
Dissolved oxygen
Iodometric titration 081/12-0008-01
At sampling
BOC BOC5 measurement 081/12-0014-01
In the lab
BOC measurement 211.1.4.024-95
H2S and Sulfides
Photometry 081/12-0017-01
In the lab
Total phosphorus
With persulfate oxidation 081/12-0018-01
In the lab
Phenols
With aminoantipirine 081/12-0119-03
In the lab
Colour
Photometery 081/12-0020-01
In the lab
Ammonium ions
Photocolormetry with Nesler reagent 081/12-0106-03
In the lab
Mn
Photocolormetry with persulfate of ammonium 081/12-
In the lab
0107-03
Dry leftover
Gravimetery 081/12-0109-03
In the lab
Gravimetery 11.1.4.042-95
Cr (VI) and Cr (III)
Extraction � phtocolormetry with definile carbazide
In the lab
081/12-0114-03
Zn Photocolormetry
081/12-0173-05
In the lab
Anion surfactives
Extraction photometry with methylene blue 211.1.4.017-95 In the lab
COC
COC measurement 211.1.4.020-95
In the lab
Nitrite ions
Photometry with Grise reagent 211.1.4.023-95
In the lab
Nitrates
Photometry with salicylic acid 211.1.4.027-95
In the lab
Total Fe
Photometry 211.1.4.034-95
In the lab
Cu Extraction
photometry
211.1.4.035-95
In the lab
Suspended matter
Gravimetery 211.1.4.039-95
In the lab
Hydro carbonate
Potentiometer titration 52.24.24-86
In the lab
ions
Total nitrogen
Oxidations with persulfate of potassium 52.24.13-84
In the lab
Al
Photometry
In the lab
Hardness
Chelatometry
In the lab
Smell
Organoleptic evaluation
In the lab
Cd
Photometry
In the lab
K
Flame photometry
In the lab
Li
Flame photometry
In the lab
Na
Flame photometry
In the lab
Alkalinizes
Volume measurement
In the lab
WWF DCP & OOSWMB / MIKHAIL NESTERENKO
A case study for Monitoring and Assessment of Nutrient Removal Capacities of Riverine Wetlands
page 17
The background historical data on water quality in Katlabuh lake and adjacent wetlands was done
under the Ukrainian State Monitoring Programme, with the following frequency:
�
Katlabuh Lake � 7 times per year
�
Danube river (at Izmail town) � 7 times per year
�
Rivers Bolshoy Katlabuh, Maly Katlabuh, Enika and Tashbunar � 4 times per year.
6.3. Monitoring results
6.3.1. Biological
Oxygen
Consumption.
BOC index used in this study is BOC5 which is consumption of the oxygen during 5 days.
In the surface waters BOC5 normally varies from 0,5 to 4,0 mg/dm3 and depends on the season.
Seasonal changes depend mainly on the temperature variations and on the original concentration
of dissolved oxygen. Diurnal changes are determined by concentration of dissolved oxygen and
may vary by 2,5 mg/dm during a day. Significant changes of BOC5 occur in polluted wetlands.
According to [2,3] water quality indexes for various uses, limits should not exceed 5 mg2/dm3,
while the limits for fishery waters should not exceed 3 mg2/dm3.
In the samples taken at Katlabuh lake BOC5 varied from 2,26 to 7,93, at the average oxygen
concentration of 8,9 mg2/dm3, which is on average 3 times of the limits for fishery wetlands
varying from 1 to 4. At the sampling point 11 (Fig. 4) near Perhsotravneve village BOC5 exceeded
the 23 and 20 times in November and December respectively. This is probably a result of
embankment and drying out of this part of the lake. During the sampling there was also high fish
mortality at this section.
At sampling points 1,3,12,13 (Fig. 4) BOC5 varied from 2,34 to 10,9 mg2/dm3, with the average
of 5 mg2/dm3. These points are located outside of the lake at inflows and outflows and at the
mouth of Enika river.
UNDP/GEF DANUBE REGIONAL PROJECT
Restoration of Katlabuh Lake - Danube Delta, Ukraine
page 18
Fig. 5. BOC and its relation to other factors in Katlabuh lake in 2003-2006.
According to historical data in the upstream part of the lake (points 8 and 9), BOC5 has cyclic
dynamics depending on the temperature, precipitation and water regime of the lake. Moreover
BOC5 index for the Katlabuh lake in influenced by the small rivers discharging into the lake, which
should be taken into account in further monitoring works.
WWF DCP & OOSWMB / MIKHAIL NESTERENKO
A case study for Monitoring and Assessment of Nutrient Removal Capacities of Riverine Wetlands
page 19
Fig. 6. Long-term changes of BOC in Katlabuh lake and the Danube river.
16,000
BOC 5 Danube
BOC 5 Katlabuh
14,000
12,000
10,000
m3
/
d
8,000
,
mg
5
C
O
B
6,000
4,000
2,000
0,000
1
2
3
4
5
0
1
0
2
0
3
0
4
0
5
0
6
001
001
001
001
002
002
002
002
003
003
003
003
004
004
004
004
005
005
005
005
006
006
006
006
a
r
2
o
v
200
a
r
2
o
v
200
a
r
2
o
v
200
a
r
2
o
v
200
a
r
2
o
v
200
a
r
2
J
a
n 20
a
y
2
ep 2
a
y
2
ep 2
a
y
2
ep 2
a
y
2
ep 2
a
y
2
ep 2
a
y
2
ep 2
M
M
J
u
l
y
2
S
N
J
a
n 20
M
M
J
u
l
y
2
S
N
J
a
n 20
M
M
J
u
l
y
2
S
N
J
a
n 20
M
M
J
u
l
y
2
S
N
J
a
n 20
M
M
J
u
l
y
2
S
N
J
a
n 20
M
M
J
u
l
y
2
S
Month, year
6.3.2. Chemical
Oxygen
Consumption
Chemical oxygen consumption is used as an indicator of organic substances in the waters.
According to UA standards, COC should not exceed 25mg/dm 3.
In the Katlabuh lake COC varied from 34 to 326 mg/dm3 with the average of 140-187 mg/dm3.
Maximum values were stably registered at point 11 near Pershotravneve village exceeding the limit
13 times with average values 5,6 -7,5 times of the limit.
At points 1,3,12,13 COC varied from 8,6 to 193 mg/dm3, with the average of 90 mg/dm3.
Minimum values were registered at point 1 (inflow canal form the Danube), while the maximum
was registered at point 13 at the mouth of Enika river.
6.3.3. Nitrogen
In the natural wetlands inorganic nitrogen occurs is ammonium ions (NH +
-
4 ), nitrites (NO2 ) and
nitrates (NO -
3 ). These chemicals have common origin and easily transform from one to another.
Therefore they are normally combined into one group. In the natural environment ammonium ions
are the very unstable transforms into other nitrogen forms. Bacteria transform ammonium ions to
nitrites provided enough oxygen content in the water. Nitrification than normally goes further and
bacteria transform nitrite ions further to nitrate ions (NO -
3 ). Thus nitrate ion is an end product of
the complex mineralization process of the organic matter.
Ammonium content in the water is an important environmental index and depends on water
temperature and .
UNDP/GEF DANUBE REGIONAL PROJECT
Restoration of Katlabuh Lake - Danube Delta, Ukraine
page 20
Concentrations of NH +
4 normally increase during die out of the aquatic organisms.
Ammonium ions may be produced in anaerobic conditions as a result of reduction of nitrates and
nitrites. Most of ammonium comes with surface run-off and precipitation. High ammonium
concentrations are usual for sewage especially form settlements and indicate deterioration of
sanitary conditions of the waterbodies.
Nitrites usually indicate faecal pollution of waters. Concentrations of nitrites tend to grow during
summer stagnations as a result of either reduction of nitrates or activity of phytoplankton. High
concentrations of nitrogen chemicals indicate pollution of a waterbody with the organic substances.
Fig. 7. Ammonium and nitrite dynamics in Katlabuh lake in 2003-2006.
Official limits in UA for fishery wetlands for ammonium (NH +
-
-
4 ), nitrites (NO2 ) and nitrates (NO3 )
should not exceed 0,5, 0,02 and 45 mg/dm3 respectively.
In Katlabuh lake concentrations of ammonium varied from 0,24-1,00, with the average of 0,53
mg/dm3, which is slightly over the limit. The highest concentrations were registered at point 5 in
November and December exceeding the limits 4,7 and 5,4 times respectively.
At points 1,3,12,13 content of ammonium varied from 0,00 to 4,00 mg/dm3, with the average of
0,8 mg/dm3.
WWF DCP & OOSWMB / MIKHAIL NESTERENKO
A case study for Monitoring and Assessment of Nutrient Removal Capacities of Riverine Wetlands
page 21
Fig. 8. Long-term changes of ammonium in Katlabuh lake and the Danube river.
0,800
Nitrogen ammonium mg/dm3 Danube
Nitrogen ammonium mg/dm3 Katlabuh
0,700
0,600
3
m
/
d
g 0,500
m
um
ni
o 0,400
m
m
a
n 0,300
i
t
r
oge
N
0,200
0,100
0,000
1
1
2
2
3
3
4
4
5
5
6
6
001
001
002
002
003
003
004
004
005
005
006
a
r 2001
o
v
2
a
r 2002
o
v
2
a
r 2003
o
v
2
a
r 2004
o
v
2
a
r 2005
o
v
2
a
r 2006
J
an 200
a
y
2001
e
p
2
a
y
2002
e
p
2
a
y
2003
e
p
2
a
y
2004
e
p
2
a
y
2005
e
p
2
a
y
2006
e
p
2
M
M
J
u
l
y
200
S
N
J
an 200
M
M
J
u
l
y
200
S
N
J
an 200
M
M
J
u
l
y
200
S
N
J
an 200
M
M
J
u
l
y
200
S
N
J
an 200
M
M
J
u
l
y
200
S
N
J
an 200
M
M
J
u
l
y
200
S
Month, year
Content of nitrites (NO -
2 ) varied from 0,00 to 0,90, with the average of 0,058 mg/dm3, which is 2,9
times of the limit varying from 3,5 to 4,5 times of the limit. At point 11 concentrations exceeded
the limit 5,5-9,3 times.
At points 1,3,12,13 content of NO -
2 varied from 0,00 to 0,08 mg/dm3, with the average of 0,027
mg/dm3. At point 12 (inflow canal) content of nitrites was stably high from 0,150 to 0,174
mg/dm3, which is 7,5-8,7 times of the limit.
Fig. 9. Long-term changes of nitrites in Katlabuh lake and the Danube river.
0,140
Nitrogen nitrites mg/dm3 Danube
Nitrogen nitrites mg/dm3 Katlabuh
0,120
0,100
3
m
/
d
g
0,080
t
r
i
t
e
s
m
ni
0,060
i
t
r
ogen,
N
0,040
0,020
0,000
1
1
1
01
2
2
2
02
3
3
3
03
4
4
4
04
5
5
5
05
6
6
6
001
001
002
002
003
003
004
004
005
005
006
006
a
r
200
o
v
20
a
r
200
o
v
20
a
r
200
o
v
20
a
r
200
o
v
20
a
r
200
o
v
20
a
r
200
J
a
n 2
a
y
200
a
y
200
a
y
200
a
y
200
a
y
200
a
y
200
M
M
J
u
l
y
2
Sep 200
N
J
a
n 2
M
M
J
u
l
y
2
Sep 200
N
J
a
n 2
M
M
J
u
l
y
2
Sep 200
N
J
a
n 2
M
M
J
u
l
y
2
Sep 200
N
J
a
n 2
M
M
J
u
l
y
2
Sep 200
N
J
a
n 2
M
M
J
u
l
y
2
Sep 200
Month, year
UNDP/GEF DANUBE REGIONAL PROJECT
Restoration of Katlabuh Lake - Danube Delta, Ukraine
page 22
Content of nitrates (NO -
3 ) varied from 0 to 17 mg/dm3, which is much lower than official limits.
At points 1,3,12,13 content of nitrates varied from 0-8,2 mg/dm3.
Fig. 10. Long-term changes of nitrates in Katlabuh lake and the Danube river.
3,500
Nitrogen nitrates, mg/dm3 Danube
Nitrogen nitrates mg/dm3 Katlabuh
3,000
2,500
3
m
/
d
g
m
2,000
es
t
r
at
1,500
i
t
r
ogen ni
N
1,000
0,500
0,000
a
r
2001
o
v
2001
a
r
2002
o
v
2002
a
r
2003
o
v
2003
a
r
2004
o
v
2004
a
r
2005
o
v
2005
a
r
2006
J
an 2001
a
y
2001
ep 2001
a
y
2002
ep 2002
a
y
2003
ep 2003
a
y
2004
ep 2004
a
y
2005
ep 2005
a
y
2006
ep 2006
M
M
J
u
l
y
2001
S
N
J
an 2002
M
M
J
u
l
y
2002
S
N
J
an 2003
M
M
J
u
l
y
2003
S
N
J
an 2004
M
M
J
u
l
y
2004
S
N
J
an 2005
M
M
J
u
l
y
2005
S
N
J
an 2006
M
M
J
u
l
y
2006
S
Month, year
6.3.4. Chlorides
and
sulfates
Chlorides occur in surface waters as anions. Most of the chlorides come from the atmosphere as
well as from sewage waters. Concentrations of chlorides have distinct seasonal dynamics and
depend on the total water mineralization.
Concentrations of chlorides and their dynamics especially diurnal may serve as one of the
indicators of sewage pollution.
Sulfates the most common anions in all surface water and also prevail in Katlabuh lake.
Concentration of sulfates also depends on the total mineralization of the water.
Sources of drinking water supply and domestic supply should have not more than 350 mg/dm3 of
chlorides and 500 mg/dm 3 of sulfates.
WWF DCP & OOSWMB / MIKHAIL NESTERENKO
A case study for Monitoring and Assessment of Nutrient Removal Capacities of Riverine Wetlands
page 23
Fig. 11. Content of sulfates and chlorides in Katlabuh lake in 2003-2006.
Content of chlorides and sulfates in Katlabuh lake varied from 230 to 798 mg/dm3 and 104-2340
mg/dm3 respectively. Average values were 450 and 779 mg/dm3 varying from 439 to 461 mg/dm3
for chlorides and from 762 to 805 mg/dm3 for sulfates. Similar concentrations were registered
during the last 3 years.
UNDP/GEF DANUBE REGIONAL PROJECT
Restoration of Katlabuh Lake - Danube Delta, Ukraine
page 24
Fig. 12. Long-term changes of sulfates in Katlabuh lake and the Danube river.
1400,000
Sulfates mg/dm3 Danube
Sulfates mg/dm3 Katlabuh
1200,000
1000,000
3
m
800,000
/
d
g
es m
600,000
l
f
at
u
S
400,000
200,000
0,000
1
2
3
4
5
01
01
01
01
01
02
02
02
02
02
03
03
03
03
03
04
04
04
04
04
05
05
05
05
05
06
06
06
06
06
a
r
20
o
v
200
a
r
20
o
v
200
a
r
20
o
v
200
a
r
20
o
v
200
a
r
20
o
v
200
a
r
20
J
a
n 20
a
y
20
e
p 20
a
y
20
e
p 20
a
y
20
e
p 20
a
y
20
e
p 20
a
y
20
e
p 20
a
y
20
e
p 20
M
M
J
u
l
y
20
S
N
J
a
n 20
M
M
J
u
l
y
20
S
N
J
a
n 20
M
M
J
u
l
y
20
S
N
J
a
n 20
M
M
J
u
l
y
20
S
N
J
a
n 20
M
M
J
u
l
y
20
S
N
J
a
n 20
M
M
J
u
l
y
20
S
Month, year
Fig. 13 . Long-term changes of chlorides in Katlabuh lake and the Danube river.
600,000
Chlorides mg/dm3 Danube
Chlorides mg/dm3 Katlabuh
500,000
400,000
3
m
/d
g
300,000
e
s
m
r
i
d
lo
c
h
200,000
100,000
0,000
01
02
03
04
05
001
01
01
01
01
002
02
02
02
02
003
03
03
03
03
004
04
04
04
04
005
05
05
05
05
006
06
06
06
06
a
r
20
o
v
20
a
r
20
o
v
20
a
r
20
o
v
20
a
r
20
o
v
20
a
r
20
o
v
20
a
r
20
J
a
n 2
a
y
20
e
p
20
a
y
20
e
p
20
a
y
20
e
p
20
a
y
20
e
p
20
a
y
20
e
p
20
a
y
20
e
p
20
M
M
J
u
l
y
20
S
N
J
a
n 2
M
M
J
u
l
y
20
S
N
J
a
n 2
M
M
J
u
l
y
20
S
N
J
a
n 2
M
M
J
u
l
y
20
S
N
J
a
n 2
M
M
J
u
l
y
20
S
N
J
a
n 2
M
M
J
u
l
y
20
S
month, year
At points 1,3,12 content of chlorides and sulfates hardly exceeded official limits and varied from 35
to 283 and from 6 to 445 mg/dm3 respectively. Content of chlorides and sulfates at point 13
(mouth of Enika river) was over the limit, which qualified the water as chloride-sulfate type. Long-
term observations showed the same situations. Thus Katlabuh lake receives considerable loads of
chlorides and sulfates from the discharge of small rivers.
WWF DCP & OOSWMB / MIKHAIL NESTERENKO
A case study for Monitoring and Assessment of Nutrient Removal Capacities of Riverine Wetlands
page 25
6.3.5. Mineral phosphorus (phosphates)
Phosphorus is one of he main nutrients affecting productivity of the wetlands. Phosphate pollution
is usually a result of intensive use of phosphorus fertilizers in agriculture. Organic phosphorus
substances are the products of biological reduction of organisms as well as the biological treatment
of domestic and industrial sewage.
Content of phosphorus has a clear seasonal dynamics and depends on photosynthesis and
biological reduction of organic matter.
Minimum concentrations of phosphates occur in spring and summer, while the maximum in autumn
and winter. Official UA limits for phosphates is 0,2 mg/dm3 and 0,5 mg/dm3 for total phosphorus.
Fig. 14. Content of phosphorus in Katlabuh lake in 2003 � 2006.
UNDP/GEF DANUBE REGIONAL PROJECT
Restoration of Katlabuh Lake - Danube Delta, Ukraine
page 26
In the samples taken at Katlabuh only the total phosphorus was measured. Its content varied form
0,047 to 0,390 mg/dm3 with the average of 0,087 - 0,112 mg/dm3. Maximum concentrations were
registered at points 11 and 5 (0,660 and 1,490 mg/dm3).
At inflow canals and small rivers (points1,3,12 and 13) content of phosphorus varied from 0,056 to
1,780 mg/dm3 with the average monthly values of 0,250 - 0,502 mg/dm3.
Long term data for the points 8 and 9 are similar to seasonal changes.
Fig. 15. Long-term changes of phosphorus in Katlabuh lake and the Danube river.
0,200
Phosphorus total, mg/dm3 Danube
Phosphorus total, mg/dm3 Katlabuh
0,180
0,160
0,140
0,120
3
m
/d
g
0,100
, m
0,080
0,060
0,040
0,020
0,000
01
02
03
04
05
001
01
01
001
01
002
02
02
002
02
003
03
03
003
03
004
04
04
004
04
005
05
05
005
05
006
06
06
006
06
a
r
20
p
20
o
v
20
a
r
20
p
20
o
v
20
a
r
20
p
20
o
v
20
a
r
20
p
20
o
v
20
a
r
20
p
20
o
v
20
a
r
20
p
20
J
an 2
a
y
20
a
y
20
a
y
20
a
y
20
a
y
20
a
y
20
M
M
J
u
l
y
2
Se
N
J
an 2
M
M
J
u
l
y
2
Se
N
J
an 2
M
M
J
u
l
y
2
Se
N
J
an 2
M
M
J
u
l
y
2
Se
N
J
an 2
M
M
J
u
l
y
2
Se
N
J
an 2
M
M
J
u
l
y
2
Se
Month, year
6.3.6. Total
salt
Total content of different salts in the chemical analyses of the water is called mineralization of the
water. Mineralization is important for the sources of drinking and domestic water supply and should
not exceed 1000 mg/dm3. Monitoring results showed all the samples at all points have high
mineralization varying from 1,11 to 4,97 g/dm3 with average values 2,22 � 2,27 g/dm3.
At points 1 and 12 mineralization was within the limits on average 0,47 and 0,94 g/dm3
respectively. Mineralization at the mouth of Enika river was stably high from 2,75 to 2,81 g/dm3.
Similar values for this point are indicated in the long-term database.
WWF DCP & OOSWMB / MIKHAIL NESTERENKO
A case study for Monitoring and Assessment of Nutrient Removal Capacities of Riverine Wetlands
page 27
7. CONCLUSIONS
Hydrological regime of Katlabuh lake depends entirely on the influence of the Danube River. The
Danube floods are of big duration: about 4 months on the average. Before protective dykes were
built, the floodplain had been inundated during floods, and the water level in the lake increased to
2.5 m. While water level in the river came down, the water drained from the lake. Continuous and
regular floods cleaned the lake ecosystem and washed out salt, which concentrated because of
evaporation from water and soil during hot summer. Likewise, ecosystem of Katlabuh lake was
processing the chemicals coming from the Danube with flood. Under the natural conditions,
nutrients and some other chemicals were removed from the water by living organisms.
To conclude the results mentioned above, we should say that content of nutrients in Katlabuh lake
depends on a number of different factors, which need further clarification.
7.1. Influence of the catchment and small rivers
This is first of all the human influence on the catchment of the Katlabuh lake and the small rivers
(dump sites, illegal mining, ploughing and use of mineral fertilizers, sewage inflows form the
villages etc.) as well as climate conditions, hydrological regime, influence of the small rivers.
Growing content of pollutants in the lake is caused by inflow from the Danube and small rivers such
as Big Katlabuh, Tashbunar, Enika. Analyses of the long-term data shows seasonal dynamics, i.e.
water quality improves in spring and summer with flooding and worsens in autumn winter with the
minimum water levels in the lake. Apart form embankment of Katlabuh lake itself, the small rivers
were seriously modified as well: increase of arable lands and deforestation, dredging and
regulation of their drainage caused decrease of water discharges, increase of evaporation from the
water surface and thus deterioration of water quality in small rivers. Their surface water is
naturally hyper-mineralized from 2.2 to 7.5 g/l.
7.2. Influence of the Danube
Water quality in the Danube is different to Katlabuh lake according to several indexes.
General water mineralization in the Danube is significantly lower then in the lake and does not
exceed 0,5 mg/dm3 varying form 0,27 to 0,44 mg/dm3.
Content of sulfates and chlorides 10 times less than in the lake with the average of 39,6 and 28,8
mg/dm3.
The situation with other components is similar: content of NO2 in the Danube varied form 0,012 to
0,064 mg/dm3 with the average of 0,026 mg/dm3. Content of NH4 in the Danube varied form
0,065 to 0,35 0,026 mg/dm3 with the average of 0,18 mg/dm3. BOC5 in the Danube varied from
0,7 to 6,0 mgO2/dm3 with the average of 2,58 mgO2/dm3.
Removal capacities of the Katlabuh lake for the phosphorus are still not clear and the historical
data do not show yet any trends or mutual dependence of the Katlabuh lake and the Danube.
Although at some small rivers discharging into the lake, content of phosphorus is higher than
official limit, but by and large it hardly affects the general phosphorus concentration in the
Katlabuh water.
UNDP/GEF DANUBE REGIONAL PROJECT
Restoration of Katlabuh Lake - Danube Delta, Ukraine
page 28
Serious exceeding of the limits for a number of indexes in Katlabuh lake (BOC5, COC, NO2-, l-.
SO42-,PO4- etc.) may result in drastic changes of the aquatic ecosystem of the lake.
Therefore, it's clear that in order to improve water quality in Katlabuh lake, a natural extend of
water exchange with the Danube River needs to be restored.
7.3. Expected changes after restoration
Restoration of natural water exchange in expected to lead to a significant decline in salt contents of
the lake to the levels close to the Danube water. However, on the short term after the opening of
the lake some negative effects are possible for both the Katlabuh lake and the Danube river. These
effects relate first of all to washing out bottom deposits and return of chemical substances,
especially such as nutrients to the Katlabuh lake and thus the Danube river. As historical data on
water quality show, Katlabuh lake should still play a significant role in reducing nitrites and nitrates
for the Danube. However, concentrations or ammonium and other chemicals are expected to
increase at least on the short term.
On the long though, the effect of restoration on nitrogen transport needs to be further investigated
as after reopening of the lake, positive changes are expected in the ecosystem of the lake related
to development of aquatic vegetation and thus increase of removal capacity of the lake for the
nutrients.
Moreover, the next phase of restoration works after reopening of the lake to the Danube, implies
re-connection of extensive reedbeds in the downstream part of the lake. These reedbeds played an
important role in filtering the Danube water flowing into the lake as well as Katlabuh water flowing
into the Danube.
Therefore in order to fully assess the mutual influence of Katlabuh lake and the Danube river, it's
necessary to continue monitoring works after reopening of the lake and especially on recconection
of the reedbeds to the Katlabuh lake.
WWF DCP & OOSWMB / MIKHAIL NESTERENKO
A case study for Monitoring and Assessment of Nutrient Removal Capacities of Riverine Wetlands
page 29
8. LESSONS LEARNED AND OUTLOOK
The future tasks for restoration under this project include completion of the construction of the
bridge and opening of the lake to the Danube river. These works are expected to finish by spring
2007.
The restoration works will be followed by implementation of the water protection zones around the
lake (100 m. strip according to UA water code). These measures will include removal of the dump
sites, restoration of vegetation and regulation on land use. Thus, this component should include an
important step to control pollution from the catchment of the lake that serves as the main source
of both nutrient loads and salts for the lake.
Future plans expected to start in 2007 include development and implementation of the project to
reconnect Safiany � Lung lake system, a former reedbeds area between the lake and the Danube.
These works are expected to significantly improve hydrological conditions of the Safiany � Lung
lakes as well as to return their filtering capacity for both the Katlabuh lake and the Danube river.
Monitoring of nutrients will continue beyond the timeframe of UNDP-GEF 4.3 project under the
Ukrainian state monitoring programme. Thus, the data to be obtained under the UNDP-GEF project
will serve as a basis for further monitoring of nutrients for evaluation and long-term of impact of
restoration measures on nutrient reduction.
Further monitoring will be performed by WMB in cooperation with hydrographic laboratory as a part
of their regular state duty.
The results of the project will be used by WMB as a necessary experience for planning of water
management practices for other wetlands along the Ukrainian stretch of the Danube as well as
other wetlands in Odessa Oblast.
Moreover, Katlabuh project has been proposed by WMB for restoration and nutrient monitoring as a
pilot model project in advocation for restoring natural regimens of other big lakes in Ukrainian
Danube delta
UNDP/GEF DANUBE REGIONAL PROJECT
Restoration of Katlabuh Lake - Danube Delta, Ukraine
page 30
9. DATABASE
Water Management Board has a long-term database on the key water quality indexes (Table III)
sampled under the State monitoring programme for surface waters.
Such date are also available for adjacent wetlands such as small rivers discharging to Katlabuh lake
as well as the Danube.
Moreover, under the regular hydrological monitoring, the long term data is also available for water
levels and discharges of the Danube and all the large lakes in Ukrainian Danube Delta including the
Katlabuh lake.
All this data exist as internal reports and can be obtained in a Russian language on the request to
Odessa Oblast State Water Management Board.
WWF DCP & OOSWMB / MIKHAIL NESTERENKO
A case study for Monitoring and Assessment of Nutrient Removal Capacities of Riverine Wetlands
page 31
REFERENCES AND KEY BIBLIOGRAPHY FOR THE REGION
1. .., .. .� ....,
: , 1988, 239.
2. , ,
1994, 107.
3. , , 1995, - 1, 202.
4. .., .., .. .� .
. . ., .:1963, 404.
5. .� . -, :.1978, 325.
6. .. . .� .
� �, :.1981, 151.
7. .. .� . , , 1989, 351.
8. - ()
()
.� , :.1990, 45.
9.
.�
, : 1984, 39.
10. ., :.1982, 69.
11. � .
- � 383 (136/1940).�
:. , 1996 21.
12. .., .. .,.:
, -1986, 386.
13. ..,..
.� ., ., . ., ,1958. �
.2, 1: 91-100.
14. .. .
, -
.� 13 . - : ..,
.:1959, .179.
15. .., ..
.� .. ... :
...., .:1956: 4-6.
UNDP/GEF DANUBE REGIONAL PROJECT
Restoration of Katlabuh Lake - Danube Delta, Ukraine
page 32
16. .. . .�
. ..: ..., .:1963: 8-9.
17. ..
.� .
......, , 1981, 23.
18. .. .
.� . . �1985.- 9: .19-20.
WWF DCP & OOSWMB / MIKHAIL NESTERENKO
A case study for Monitoring and Assessment of Nutrient Removal Capacities of Riverine Wetlands
page 33
ANNEX 1: RESULTS OF CHEMICAL ANALYSES OF WATER SAMPLES FORM
KATLABUH LAKE UNDER THE PROJECT.
Date of Sampling: 17.11.2006.
Location:
Katlabuh lake and adjacent wetlands
Sampling point
pH
Measure
Anions
Cations
Cations
Calcul.
Hardness
Cr
Cu mg/L
and anions
Dry
mg-equiv/L
mg/L
remain
CO3
HCO3
SO4
Cl
Ca
Mg
Na
1 9
Mg/l
8.4
366
773.28
407.67
100
139.72
399.97
2195.05
2012.05
pumping station
8.70
Mg-equiv/l
0.28
6
16.11
11.5
5
11.5
17.39
67.78
16.5 0 0
% equiv
1
17.7
47.5
33.9
14.8
33.9
51.3
2 7
Mg/l
18
317.2
720
389.95
120
115.42
374.9
2055.47
1896.87
Utkonosovka
9.25
Mg-equiv/l
0.6
5.2
15
11
6
9.5
16.3
63.6
15.5 0 0
village
% equiv
1.88
16.4
47.2
34.6
18.9
29.9
51.3
3 6
Mg/l
12
329
778.56
354.5
90
133.65
379.96
2078.07
1913.37
Pumping station
9.18
Mg-equiv/l
0.4
5.4
16.22
10
4.5
11
16.52
64.04
15.5 0 0
% equiv
1.25
16.9
50.7
31.2
14.1
34.4
51.6
4 4
Mg/l
0
366
638.4
389.95
130
91.12
374.9
1990.37
1807.37
Bogatoe village
8.06
Mg-equiv/l
0
6
13.3
11
6.5
7.5
16.3
60.6
14.0 0 0
% equiv
0
19.8
43.9
36.3
21.5
24.8
53.8
5 12
Mg/l
0
366
160.8
141.8
100
48.6
100.05
917.25
734.25
canal
8.12
Mg-equiv/l
0
6
3.35
4
5
4
4.35
26.7
9.0 0 0
% equiv
0
44.9
25.1
30
37.5
30
32.6
6 1
Mg/l
0
207.4
198.72
53.17
90
42.52
23.9
615.74
512.04
canal 7.60
Mg-equiv/l
0
3.4
4.14
1.5
4.5
3.5
1.04
18.08
8.0 0 0
% equiv
0
37.6
45.8
16.6
49.8
38.7
11.5
7 3
Mg/l
0
512.4
305.28
148.15
120
91.12
189.98
1466.93
1210.73
canal 8.03
Mg-equiv/l
0
8.4
6.36
7
6
7.5
8.26
43.52
13.5 0 0
% equiv
0
38.6
29.2
32.2
27.6
34.5
38
UNDP/GEF DANUBE REGIONAL PROJECT
Restoration of Katlabuh Lake - Danube Delta, Ukraine
page 34
Date of Sampling: 17.11.2006.
Location:
Katlabuh lake and adjacent wetlands
Sampling point
pH
Measure
Anions
Cations
Cations
Calcul.
Hardness
Cr
Cu mg/L
and anions
Dry
mg-equiv/L
mg/L
remain
CO3
HCO3
SO4
Cl
Ca
Mg
Na
8 2
Mg/l
6
317.2
763.2
372.22
80
139.72
374.9
2053.25
1894.65
Kislytsy village
8.86
Mg-equiv/l
0.2
5.2
15.9
10.5
4
11.5
16.3
63.6
15.5 0 0
% equiv
0.63
16.4
50
33
12.6
36.2
51.3
9 10
Mg/l
24
329.4
925.44
425.4
100
170.1
425.04
2399.38
2234.68
pumping station
9.20
Mg-equiv/l
0.8
5.4
19.28
12
5
14
18.48
74.96
19.0 0 0
% equiv
2.13
14.4
51.4
32
13.3
37.4
49.3
10 Enika
river
Mg/l
6
488
781.44
744.45
220
255.15
310.04
2805.08
2561.08
8.73
Mg-equiv/l
0.2
8
16.28
21
11
21
13.48
90.96
32.0 0 0
% equiv
0.44
17.6
35.8
46.2
24.2
46.2
29.6
11 5
Mg/l
6
488
320.16
797.62
80
273.37
250.01
2215.17
1971.17
Pershetravneve
8.78
Mg-equiv/l
0.2
8
6.67
22.5
4
22.5
10.87
74.74
26.5 0 0
village
% equiv
0.53
21.4
17.8
60.2
10.7
60.2
29.1
12 11
Mg/l
18
329.4
1072.8
531.75
120
157.95
560.05
2789.95
2625.25
Pershetravneve
9.16
Mg-equiv/l
0.6
5.4
22.35
15
6
13
24.35
86.7
19.0 0 0
village
% equiv
1.38
12.5
51.6
34.6
13.8
30
56.2
13 8
Mg/l
24
305
868.32
389.95
80
164.02
399.97
2231.26
2078.76
Pumping station
9.23
Mg-equiv/l
0.8
5
18.09
11
4
13.5
17.39
69.78
17.5 0 0
% equiv
2.29
14.3
51.8
31.5
11.5
38.7
49.8
Sampling point
surfacti
COC
Fe
BOC5
O2
NH4
NO2
NO3
PO4
Color
Susp-d
Mn
Oil
K
ves
matter
produc
Mg/dm3
Mg/dm3
Mg/dm3
Mg/dm3 Mg/dm3
Mg/dm3
Mg/dm3
Mg/dm3
Mg/dm3
Mg/dm3
Mg/dm3
Mg/dm3 Mg/dm3 Mg/dm3
1 9 0.456 137.2 0.00 4.05 5.66 0.96 0.090 0.0 0.390 >100
16 0
0.009
7.8
pumping station
2 7
Utkonosovka
0.656 107.8 0.00 5.95 1.35 0.50 0.035 0.0 0.050 >100
26 0
0.001
8.2
village
3 6 0.672 88.2 0.00 9.60 1.97 0.40 0.030 0.0 0.144 >100
36 0
0.018
8.2
Pumping station
WWF DCP & OOSWMB / MIKHAIL NESTERENKO
A case study for Monitoring and Assessment of Nutrient Removal Capacities of Riverine Wetlands
page 35
Sampling point
surfacti
COC
Fe
BOC5
O2
NH4
NO2
NO3
PO4
Color
Susp-d
Mn
Oil
K
ves
matter
produc
Mg/dm3
Mg/dm3
Mg/dm3
Mg/dm3 Mg/dm3
Mg/dm3
Mg/dm3
Mg/dm3
Mg/dm3
Mg/dm3
Mg/dm3
Mg/dm3 Mg/dm3 Mg/dm3
4 4 0.206 156.8 0.00 9.65 2.09 0.40 0.082 6.0 0.050 85 20 0 0.009 8
Bogatoe village
5 12 0.186 78.4 0.00 7.80 1.72 0.90 0.170 2.0 0.175 >100
46 0
0.006
8.6
canal
6 1 0.126 29.4 0.11 10.90 2.34 0.05 0.030 8.2 0.210 35 18 0 0.001 3.7
canal
7 3 0.327 78.4 0.00 4.58 6.27 1.04 0.075 0.0 0.506 >100
12
0 0.010 8
canal
8 2 0.167 120.6 0.00 7.50 1.60 0.20 0.015 0.0 0.050 >100
12 0
0.010
8.7
Kislytsy village
9 10 0.253 160.5 0.00 13.30 2.71 0.76 0.040 0.0 0.075 >100
28 0
0.010
8.5
pumping station
10 Enika
river 0.376
193.4 0.00 2.75
9.47 0.00 0.010 0.0 0.108 60
18 0 0.009
4.5
11 5
Pershetravneve
0.733 202.2 0.39 68.90 0.12 2.36 0.000 0.0 0.660 >100
150 0
0.002
11.2
village
12 11
Pershetravneve
0.233 198.2 0.00 4.13 4.73 0.60 0.185 8.0 0.060 >100
22 0
0.023
8.7
village
13 8 0.214 267.3 0.00 4.17 6.76 0.70 0.077 4.0 0.047 >100
22
0 0.076 8
Pumping station
UNDP/GEF DANUBE REGIONAL PROJECT
Restoration of Katlabuh Lake - Danube Delta, Ukraine
page 36
Date of Sampling: 12.12.2006.
Location:
Katlabuh lake and adjacent wetlands
Sampling point
pH
Measure
Anions
Cations
Cations
Calcul.
Hardness
Cr
Cu
and anions
Dry
mg-
mg/
mg/L
remain
equiv/L
L
CO3
HCO3
SO4
Cl
Ca
Mg
Na
1 9
Mg/l
0
366
891.36
407.67
100
139.72
450.11
2354.87
2171.87
pumping station
8.20
Mg-equiv/l
0
6
18.57
11.5
5
11.5
19.57
72.14
16.50 0 0
% equiv
0
16.6
51.5
31.9
13.9
31.9
54.3
2 7
Mg/l
24
317.2
768.96
389.95
80
151.87
379.96
2111.94
1953.34
Utkonosovka
9.10
Mg-equiv/l
0.8
5.2
16.02
11
4
12.5
16.52
66.04
16.50 0 0
village
% equiv
2.42
15.7
48.5
33.3
12.1
37.9
50.0
3 6
Mg/l
24
341.6
863.52
372.22
90
157.95
399.97
2249.26
2078.46
Pumping station
9.26
Mg-equiv/l
0.8
5.6
17.99
10.5
4.5
13
17.39
69.78
17.50 0 0
% equiv
2.29
16.1
51.6
30.1
12.9
37.3
49.8
4 4
Mg/l
36
280.6
844.32
389.95
100
145.8
399.97
2196.64
2056.34
Bogatoe village
9.35
Mg-equiv/l
1.2
4.6
17.59
11
5
12
17.39
68.78
17.00 0 0
% equiv
3.49
13.4
51.5
32.0
14.5
34.9
50.6
5 12
Mg/l
0
366
286.08
177.25
100
60.75
160.08
1150.16
967.16
canal 8.23
Mg-equiv/l
0
6
5.96
5
5
5
6.96
33.92
10.00 0 0
% equiv
0
35.4
35.1
29.5
19.5
29.5
41.0
6 1
Mg/l
0
219.6
95.52
53.17
70
30.37
15.07
493.74
383.94
canal
7.70
Mg-equiv/l
0
3.6
1.99
1.5
3.5
2.5
1.09
14.8
6.00 0 0
% equiv
0
50.8
28.1
21.2
49.4
35.3
15.4
7 3
Mg/l
0
488
445.44
265.87
200
60.75
224.94
1685.00
1441.00
canal
8.10
Mg-equiv/l
0
8
9.28
7.5
10
5
9.78
49.56
15.00 0 0
% equiv
0
32.3
37.4
30.3
40.4
20.2
39.5
8 2
Mg/l
36
305
748.8
372.22
100
133.65
374.9
2070.57
1918.07
Kislytsy village
8.50
Mg-equiv/l
1.2
5
15.6
10.5
5
11
16.3
64.6
16.00 0 0
% equiv
3.71
15.5
48.3
32.5
15.5
34.1
50.5
9 10
Mg/l
36
317.2
839.52
425.4
120
151.87
399.97
2289.96
2131.36
pumping station
8.80
Mg-equiv/l
1.2
5.2
17.49
12
6
12.5
17.39
71.78
18.50 0 0
% equiv
3.34
14.5
48.7
33.4
16.7
34.8
48.5
WWF DCP & OOSWMB / MIKHAIL NESTERENKO
A case study for Monitoring and Assessment of Nutrient Removal Capacities of Riverine Wetlands
page 37
Date of Sampling: 12.12.2006.
Location:
Katlabuh lake and adjacent wetlands
Sampling point
pH
Measure
Anions
Cations
Cations
Calcul.
Hardness
Cr
Cu
and anions
Dry
mg-
mg/
mg/L
remain
equiv/L
L
CO3
HCO3
SO4
Cl
Ca
Mg
Na
10 Enika
river
Mg/l
18
488
713.28
762.17
230
261.22
275.08
2747.76
2503.76
8.50
Mg-equiv/l
0.6
8
14.86
21.5
11.5
21.5
11.96
89.92
33.00 0 0
% equiv
1.33
17.8
33.1
47.8
25.6
47.8
26.6
11 5
Mg/l
36
488
104.16
744.45
80
212.62
250.01
1917.24
1671.25
Pershetravneve
9.20
Mg-equiv/l
1.2
8
2.17
21
4
17.5
10.87
64.74
21.50 0 0
village
% equiv
3.707
24.7
6.7
64.9
12.4
54.1
33.6
12 11
Mg/l
24
341.6
1206.7
460.85
110
194.4
529.92
2867.49
2696.69
Pershetravneve
Mg-equiv/l
0.8
5.6
2
13
5.5
16
23.04
89.08
9.05
21.50 0 0
village
% equiv
1.79
12.6
25.14
29.2
12.3
35.9
51.7
56.4
13 8
Mg/l
30
305
978.72
389.95
100
182.25
399.97
2385.89
2233.39
Pumping station
9.20
Mg-equiv/l
1
5
20.39
11
5
15
17.39
74.78
20.00 0 0
% equiv
2.67
13.4
54.5
29.4
13.4
40.1
46.5
UNDP/GEF DANUBE REGIONAL PROJECT
Restoration of Katlabuh Lake - Danube Delta, Ukraine
page 38
Sampling point
surfactiv
COC
Fe
BOC5
O2
NH4
NO2
NO3
PO4
Color
Susp-d
Mn
Oil
K
es
matter
produc
Mg/dm3
Mg/dm3
Mg/dm3
Mg/dm3
Mg/dm3
Mg/dm3
Mg/dm3
Mg/dm3
Mg/dm3
Mg/dm3
Mg/dm3
Mg/dm3
Mg/dm3
Mg/dm3
1 9
0.488 206.4 0.00 55.10 0.98 0.52 0.044 3.0 0.067 >100
30 0
0.026
8.4
pumping station
2 7
Utkonosovka
0.740
137.6 0.00 6.35 7.19 0.56 0.070 12.0 0.080 >100
26 0
0.004
8
village
3 6
0.802
154.8 0.00 4.12 4.49 0.40 0.040 2.2 0.055 >100
26 0
0.008
8.7
Pumping station
4 4
0.253
137.6 0.00 4.87 6.03 0.40 0.050 9.5 0.065 >100
22 0
0.094
8.5
Bogatoe village
5 12
0.253
146.2 0.00 3.41 3.57 0.70 0.150 4.4 0.080 >100
22 0
0.005
5.8
canal
6 1
0.167 43 0.24 59.40 0.12 4.00 0.000 1.8 1.780 >100
38 0
0.016
5.4
canal
7 3
0.380
120.4 0.00 3.59 3.69 1.02 0.080 0.0 0.056 >100
34 0
0.010
7.8
canal
8 2
0.213
137.6 0.00 5.59 7.76 0.60 0.025 0.0 0.180 >100
24 0
0.010
8.5
Kislytsy village
9 10
0.300
154.8 0.00 4.56 4.61 1.00 0.050 0.0 0.095 >100
20 0
0.008
8.8
pumping station
10 Enika
river 0.440
189.2 0.00 3.57 7.69 0.10 0.010 0.00 0.090 60 18
0 0.006 4.8
11 5
Pershetravneve
0.786 223.6 0.33 60.50 0.43 2.70 0.000 6.2 1.490 52 120
0 0.016 12.6
village
12 11
Pershetravneve
0.287
206.4 0.00 3.50 3.81 0.70 0.110 9.4 0.085 >100
18 0
0.026
8.5
village
13 8 0.267 326.8 0.00 7.61 7.87 0.64 0.190 11.0 0.067 >100
20 0
0.046
8.2
Pumping station
WWF DCP & OOSWMB / MIKHAIL NESTERENKO