UNDP-GEF Danube Regional Project
Final Report
for
"Development of Indicators for Project Monitoring
and Impact Evaluation"
April 16, 2004
Dr. J. Dogterom
Drs. J.P.E. van Leeuwen
N. Koopmans
G. Robijn
Oudebildtdijk
1058
Leeuwarden
University
for
9075
NK
Westhoek
Professional
Education
The
Netherlands Tesselschadestraat
12
Tel.:
+31-518-491838
8913
HB
Leeuwarden
Fax:
+31-518-491944
The
Netherlands
Email: j.dogterom@tech.nhl.nl
Tel:
+31-58-2961164
Fax:
+31-58-
2961188
Email: j.p.e.van.leeuwen@ecma.nhl.nl
PREFACE
The long term goal of the DRP is to strengthen capacities of key Danube stakeholders and
institutions to effectively and sustainably manage the Danube River Basin's water resources and
ecosystems for citizens of Danube countries.
River basin managers need to be able to monitor changes, hopefully improvements, but also
deterioration in the river basin ecosystem. Moreover, there is the need to be able understand the
effects of measures (policies, investments etc.) in order to make more informed decisions in the
future. It is clear that the development and use of indicators should be an iterative process. The
more indicators are used, the more precisely they can be developed and utilized.
The objective of this assignment was to develop a system of indicators for two purposes:
i.
to monitor the impact of activities carried out by the UNDP/GEF DRP and
ii.
to establish a system to be able to assess and monitor the changes in the DRB system
due to various interventions. I.e. to establish a system of indicators that will function
long after the end of the DRP as a management tool to both understand the effects of
specific interventions, as well as to provide a basis upon which to decide upon new
interventions.
The assignment was intended to propose a system of indicators that is functionable, multi-purpose
and practical. This is a challenging task as it needs to be relevant for the EU WFD, the GEF
guidelines for monitoring and impact evaluation as well as reliable for monitoring the
implementation of the DRPC.
The efforts in this Phase 1 assignment resulted in a clear strategy for introducing a system of
indicators for the DRB. Nevertheless it is a challenging task to develop a system of indicators that
should meet the relatively short-term needs of demonstrating the results of the DRP, while also (and
perhaps more importantly) showing the conditions of the DRB over a longer (perhaps more relevant)
time period. As the old proverb goes, "a journey of a thousand miles, begins with a single step."
Thus, this assignment and the system it proposes should be seen as the starting point.
The results of this component are intended to be a basis for the ICPDR, with the continued
assistance of the DRP, to implement the proposed system of indicators during Phase 2 of the DRP
from 2004-2007.
The report was prepared under the guidance of Jan Dogterom and associated experts. and reflects
the views of this expert team. The report and its contents remain the property of the UNDP/GEF
DRP and should not be used without providing full credit to the DRP.
For further information about the DRP, objectives, activities, results etc. please visit the DRP
webpage at www.undp-drp.org .
Indicators for Project Monitoiring and Impact Evaluation
page 5
CONTENTS
Contents ............................................................................................................................ 3
List of abbreviations............................................................................................................. 7
Executive summary ............................................................................................................. 9
1.
Introduction and Background Information .................................................................. 11
2.
Objective of this activity .......................................................................................... 12
3.
Problem definition................................................................................................... 12
3.1.
Why a system of indicators................................................................................. 12
4.
Concepts ............................................................................................................... 13
4.1.
General ........................................................................................................... 13
4.2.
Indicators for GEF M & E reporting requirements.................................................... 14
4.3.
Indicators for WFD and EEA reporting requirements ............................................... 15
4.4.
GEF and WFD compared..................................................................................... 15
4.5.
Indicator selection criteria and data and information requirements ........................... 16
4.6.
The problem of the baseline................................................................................ 17
5.
Results ................................................................................................................. 18
5.1.
System of indicators for GEF M & E ...................................................................... 18
5.1.1.
Introduction................................................................................................ 18
5.1.2.
Categories of indicators ................................................................................ 18
5.1.3.
Individual indicators..................................................................................... 19
5.1.4.
Recommendation for the selection of a core list of indicators for GEF M&E............ 21
5.2.
System of indicators for WFD/ EEA ...................................................................... 22
5.2.1.
Introduction................................................................................................ 22
5.2.2.
Categories of indicators ................................................................................ 22
5.2.3.
Individual indicators..................................................................................... 24
5.2.4.
Recommendation for the selection of a core list of indicators for the ICPDR .......... 24
6.
Presentation of indicators ....................................................................................... 26
6.1.
Introduction ..................................................................................................... 26
6.2.
6.2 Examples of individual indicators ................................................................... 26
6.2.1.
6.2.1 Driving force indicators ........................................................................ 26
6.2.2.
Pressure indicators ...................................................................................... 27
6.2.3.
State indicators ........................................................................................... 28
6.2.4.
Impact indicators......................................................................................... 28
6.2.5.
Stress reduction/response indicators .............................................................. 29
6.2.6.
Aggregated indicators: the kite diagram.......................................................... 29
6.3.
Clustering and aggregation of indicators .............................................................. 30
6.3.1.
Introduction................................................................................................ 30
page 6
6.3.2.
Consistent aggregation and filtered consistency ............................................... 30
6.3.3.
An example of clustering and aggregation ....................................................... 31
6.3.4.
The technique of clustering ........................................................................... 33
6.3.5.
Aggregating process indicators ...................................................................... 34
6.4.
Detailed presentation of selected indicators........................................................... 35
6.4.1.
Process indicator: assessment of involvement.................................................. 35
6.4.2.
Stress reduction/response indicator: introduction of BAP and implementation of
Nitrate Directive........................................................................................................ 35
6.4.3.
State indicators: trend analysis of concentrations for 1996-2000 for ammonium and
nitrate at 5 stations in the Danube basin...................................................................... 35
6.4.4.
An Indicator for Legal Reform Processes ......................................................... 38
6.5.
Web site format report....................................................................................... 39
7.
Discussion ............................................................................................................. 40
8.
Literature and websites ........................................................................................... 41
Annexes
ANNEX I: Process indicators ..................................................................................... 43
ANNEX II: Stress reduction and response indicators .................................................... 47
Indicators in bold are proposed for the core set .......................................................... 47
17. Reduction of accidental spills .............................................................................. 47
ANNEX III: State indicators...................................................................................... 49
Indicators in bold are proposed for the core set .......................................................... 49
ANNEX IV: Driving Force indicators ........................................................................... 51
Indicators in bold are proposed for the core set .......................................................... 51
ANNEX V: Pressure indicators................................................................................... 53
ANNEX VI: Impact indicators.................................................................................... 55
Indicators in bold are proposed for the core set .......................................................... 55
Annex VII: Methodology for the assessment of stakeholder involvement......................... 56
Annex VIII: Methodology for the assessment of policy implementation ........................... 63
Annex IX: Descriptive sheet of EEA Indicator: implementation of the EU Nitrate Directive
(AGRI17) .............................................................................................................. 69
Indicators for Project Monitoiring and Impact Evaluation
page 7
LIST OF ABBREVIATIONS
BAP
Best
Agricultural
Practice
BAT
Best Available Technology
BSC
Black
Sea
Commission
BSERP
Black Sea Ecosystem Recovery Project
DABLAS
Danube-Black Sea Task Force
DPSIR
Driving
Force-Pressure-State-Impact-Response
DRP
Danube
Regional
Project
EEA
European
Environmental
Agency
EU
European
Union
GEF
Global Environment Facility
ICPDR
International Commission for the Protection of the Danube River
IWTF
International Waters Task Force
JAP
Joint
Action
Plan
LFM
Logical
Framework
Matrix
M & E
Monitoring and Evaluation
MoU
Memorandum
of
Understanding
OECD
Organization for Economic Cooperation and Development
PCU
Programme
Coordination
Unit
PSR
Pressure-State-Response
RBM
Result
Based
Management
RIVM
Rijksinstituut voor Volksgezondheid en Milieubeheer (National Institute of
Public Health and Environmental Protection)
SAP
Strategic
Action
Plan
SOP
Standard
Operational
Procedure
UNDP
United Nations Development Programme
UNEP
Untied Nations Environment Programme
WFD
Water
Framework
Directive
WB
World
Bank
Indicators for Project Monitoiring and Impact Evaluation
page 9
EXECUTIVE SUMMARY
The United Nations Development Programme/Global Environment Facility (UNDP/GEF) is the main
international donor to support implementation of the Convention for the Protection and Sustainable
Use of the Danube River Basin. Support is provided in the frame of the regional Danube Project
(DRP). The Council of the GEF wants to be informed on an annual basis by all projects, financed by
GEF, on the performance of the projects. The Council considers Monitoring and Evaluation (M & E) of
project outputs and outcomes an indispensable tool for project management. It should serve both as
a corrective function during project implementation and as a guide to structure future projects more
effectively. Actually, all GEF projects must include M & E provisions. In this context, the GEF-DRP
has developed a system of indicators as the basis for reporting to the GEF Council. This indicator
system allows to monitor and evaluate project performance and complies with the reporting
requirements of the GEF Council. The GEF M & E unit has defined the types of indicators to be
applied: process indicators, stress response indicators and state indicators. The GEF reporting
requirements and these definitions were used for the development of the indicator system.
At the same time an indicator system is under development now within DG-Environment (DG-ENV)
and the European Environmental Agency (EEA) of the European Commission to comply with the
reporting requirements of the new EU Water Framework Directive (WFD). According the latest
information, DG-ENV will use the Driving Force-Pressure-Status-Impact-Response cycle as the
concept for indicator development.
This report describes the concept of 2 indicator system for GEF and DG-ENV/WFD and presents a
number of examples of individual indicators and methodologies for quantification and assessments,
including aggregation techniques for clusters of indicators.
For the GEF M & E, 3 categories process indicators were defined on basis of the 4 Objectives, as
described in the Logical Framework Matrix in the project document of the DRP. Individual process
indicators proposed, are directly related to the outputs and outcomes of the DRP also formulated in
the Logical Framework Matrix. Methodologies for quantification and aggregation are recommended.
There are 4 categories of stress reduction indicators proposed and 22 individual indicators. Similarly
there are 4 categories of state indicators proposed and 18 individual indicators. These are
considered long lists. Selection of a core list of individual indicators was done on basis of 3 selection
criteria which resulted in a core list of 20 individual stress reduction and state indicators. A number
of examples are presented together with quantification and presentation techniques.
In the DPSIR concept of DG-ENV/EEA, the state and response indicators are identical to the state
and stress reduction indicators in the GEF methodology. There are 6 categories of driving force
indicators proposed and 19 individual indicators of which 11 at the core list. These indicators are
based on information which is collected by national governments and /or Eurostat and should not
require any activities with regard to raw data collection by the ICPDR. There are 4 categories of
pressure indicators proposed and 12 individual indicators of which 10 at the core list. There are 4
categories of impact indicators proposed and 7 individual indicators of which 4 at the core list.
These indicators are based on information which is collected by the ICPDR through the TNMN and
EMIS.
For both systems, 1996 is recommended to be used as the baseline, since the database of the
ICPDR is considered reliable and complete since that year.
Indicators for Project Monitoiring and Impact Evaluation
page 11
1. INTRODUCTION AND BACKGROUND INFORMATION
The Convention for the Protection and Sustainable Use of the Danube River Basin came into force in
October 1998 and has been signed and ratified now by 12 of the 13 eligible countries and the
European Commission. The Convention is the institutional frame for pollution control and the
protection of water bodies and it sets a platform for sustainable use of ecological resources and
coherent and integrated river basin management. The Danube countries have established the
International Commission for the Protection of the Danube River Basin (ICPDR) to support
implementation of the Danube River Protection Convention. International support is provided by a
number of donors to facilitate the implementation of the Convention. At present, the United Nations
Development Programme/Global Environment Facility (UNDP/GEF) is the major contributor providing
support in the frame of the Danube Regional Project (DRP). Institutional arrangements have been
set up and joint measures for pollution reduction and river basin management have been designed
and are in the process of being implemented in order to achieve the objectives of the Convention.
The process of transboundary cooperation has been further stimulated by the requirements of the
new Water Framework Directive (WFD) of the European Union (EU), which came into force on 22
December 2000.
The Parties to the Convention are EU member, Candidate-Member, or have adopted the EU water
policy into their national water policy. The WFD formulates reporting requirements of Member States
to the EU to facilitate the evaluation by the Commission of the progress towards the achievement of
the WFD objectives. At present methodologies for reporting are being designed and tested. New
analytical frameworks are discussed (see ref. 1, 2 and 3). Also the Danubian countries have to adopt
a streamlined reporting system to monitor and evaluate the efficiency of their policies, institutional
settings, investment decisions etc. In this context, a system of indicators to monitor and evaluate
policy efficiency is needed. The system should comply with the WFD reporting requirements.
The GEF is the main international donor to support implementation of the Convention. The Council of
the GEF wants to be informed on an annual basis by all projects, financed by GEF, on the
performance of the projects. The Council considers Monitoring and Evaluation (M & E) of project
results an indispensable tool for project management. It should serve both as a corrective function
during project implementation and as a guide to structure future projects more effectively. Actually,
all GEF projects must include M & E provisions. In this context, the GEF/UNDP-DRP has to develop a
system of indicators, as the basis for reporting to the GEF Council. This indicator system should
allow to monitor and evaluate project performance, and has to comply with the reporting
requirements of the GEF Council.
The GEF/UNDP-DRP has commissioned a consultant to develop proposals for indicator systems for M
& E of the DRP and to assess policy efficiency by the parties to the Danube Convention. This report
presents the results of this activity.
page 12
2. OBJECTIVE OF THIS ACTIVITY
The objective of this activity is:
"Establishing a system for M&E in using specific indicators for process (legal and institutional frame),
stress reduction (emissions, removal of hot spots) and environmental status (water quality, recovery
of ecosystems) to demonstrate results of program and project implementation and to evaluate
environmental effects of implementation of policies and regulations (nutrient reduction)."
This activity addresses the establishment of two types of indicator systems, which have two different
purposes:
> Indicators to monitor and evaluate Project results
> Indicators to evaluate effects of specific policies and regulations
3. PROBLEM DEFINITION
3.1. Why a system of indicators
The improvement of environmental quality in general, incl. in river basins, requires many measures,
ranging from the establishment of institutional structures to increasing public awareness, or to
investments. The process consists of very many, usually small, steps over a considerable period of
time. Information collection on the process itself and its results, and proper interpretation and use of
this information is crucial for efficient use of scarce resources. A transparent system of information
collection and interpretation is therefore a major activity in river basin management.
The new EU-WFD stipulates this again by putting new and high requirements on the EU Member
States with regard to reporting (art. 15 of WFD). The ICPDR has agreed on a procedure for joint
reporting to the EU, based on national reports of the Parties to the Convention. Issue specific
Working Groups are working on reporting. The products of these working groups have been taken
into account for the development of the proposals for indicators. The proposed system needs also to
support reporting on the efficiency of the Joint Action Programme (JAP) and reporting to the
national governments and the public at large in the Danube Basin.
The efforts of the Danubian countries to protect the Danube river are supported by a series donors
of which GEF/UNDP is the most important one at the moment. In March 2001, Phase 1 of the GEF-
Danube Regional Project started. It is expected, that the Project will continue with Phase 2 per 1
November 2003. According to Objective 4, the Project will support the development of indicators for
project monitoring and evaluation. The development and application of such a system is required by
the donors to the GEF, represented by the GEF Council. The GEF follows its own methodology with
regard to the selection of an indicator system, and the proposed system in this activity should
comply with the requirements of the GEF International Waters Task Force (IWTF, see ref. 4).
In addition, the ICPDR has to report on the implementation of the MoU between the ICPDR and
Black Sea Commission (BSC) on nutrient reduction, which is being supported by the Danube-Black
Sea Joint Technical Working Group.
Indicators for Project Monitoiring and Impact Evaluation
page 13
4. CONCEPTS
4.1. General
Application of environmental indicators became a serious reporting tool in the early nineties with the
Organization for Economic Cooperation and development (OECD) started applying indicators in the
national environmental performance reviews (see ref. 5) and with the United Nations Environment
Programme (UNEP) developing global environmental outlooks (see ref. 6). The concept of indicators
initially included the cycle: pressure- state-response with OECD distinguishing pressure as indirect
pressures (economic activities, demographic developments) and direct pressures (emissions etc).
Indicators according this cycle were proposed for environmental issues like climate change, ozone
depletion, eutrofication, water resources, biological diversity etc. The cycle was extended in 1994
with impact indicators, proposed by RIVM (see ref. 7). The European Environment Agency (EEA)
replaced the OECD definition for pressures in 1999 by 2 distinct indicator types: driving forces and
pressures (see ref. 8). Since then the concept of the cycle: driving force-pressure-state-impact-
response (DPSIR) is widely accepted, eg also by the United Nations Economic Commission for
Europe (UNECE, see ref. 9) and is now being made operational by EEA (see ref. 10).
The EEA is applying this set of indicators for assessment of water resources on the basis of issues:
ecological quality, eutrofication, pollution with hazardous substances and water quantity (see ref. 2).
The use of the DPSIR cycle however shows that the same individual indicator can be relevant in
each issue. This is shown by the latest report of EEA on water (see ref. 2). It is thus questionable
whether the issue approach is the most efficient in terms of transparency. In this report an other
choice has been made: the DPSIR cycle has been applied in an integrated way, not separating the
individual indicators on basis of issues. This approach is considered more appropriate to support
decision making in integrated water resources management. Neither of the concepts mentioned so
far addresses the issue of the baseline. The concept of using a baseline is proposed by the GEF
Waters Program Indicators Steering Group (see ref. 11) and further stressed by the WB GEF
Secretariat (see ref. 4). This concept has been included in the proposals for indicators in this report.
The GEF M & E indicator concept is different from the ones developed by OECD, UNEP and EEA, since
it serves a different purpose. In the following paragraphs a more detailed description of each
concept is presented.
In March 2004, internal reports of EEA showed major potential developments at EEA with regard to
indicator selection and application. An initial list of over 400 indicators may be reduced to a core list
of only 37 indicators of which 3 for biodiversity, 5 for fresh water, 4 for coastal and marine waters, 2
for agriculture and 3 for fisheries. In these internal documents no reference is made to the DPSIR
cycle, not even to the WFD. Since it is not clear how this is coordinated with EU DG-ENV at the
moment and no final decisions are available at this moment, this report will still use the DPSIR cycle
as the main concept.
page 14
4.2. Indicators for GEF M & E reporting requirements
The development of an indicator framework for M & E of GEF International Waters Projects started in
1996 by the former GEF-IWTF. In the 1996 Guidelines for WB-GEF International Water Projects the
distinction was made between performance and process indicators. Performance indicators relate to
the environmental and socio-economic impact of a project. Environmental performance indicators
measure the project's specific contribution to the solution of specific environmental problems. These
indicators use the PSR-framework: for each of the components pressure, state and responses
indicators should be formulated. Socio-economic impact assessments require another set of
indicators, socio-economic indicators.
According to the 1996 Guidelines, in addition to monitoring performance vis-a-vis project objectives,
M&E procedures should also monitor progress in project activities designed to accomplish the stated
project objectives. This is measured by process indicators. Traditionally process indicators relate to
project inputs and project outputs, like procurement and delivery of goods and services. The 1996
Guidelines recognized the increasing importance of capacity-building, human resource development,
and stakeholder involvement for sustainable project outcomes, and recommended that process
indicators for these activities should be developed
The importance of process indicators is stressed even more in the 2002 GEF M&E Indicators (see ref.
12), and in the description of the implementation of the general policy for the International Waters
Projects (see ref. 4). It is recognized that the reversal of environmental degradation in complex
transboundary waters may take decades. Even meaningful commitments to joint management
improvements may take 15-20 years. This means that process indicators are needed to monitor the
actual step-by-step progress toward the adoption of the joint management regimes, country-based
reforms, and priority investments. In addition to these process indicators two other types of
indicators are recommended, i.e. Stress reduction indicators, and Environmental status indicators.
Therefore for M & E of the DRP these 3 indicators are recommended using the following definitions:
Process indicator: process indicators are indicators, that characterize progress in political,
institutional and legal changes (improvements) at regional or national level as the result of a GEF
project intervention. A typical example is the establishment of an interministerial committee to
reduce sectoral stress/pressures on a defined water body by developing sectoral legislation or
regulation or the completion of a Strategic Action Plan (SAP) for a defined water body.
Stress reduction indicator: stress reduction indicators are indicators, that characterize progress in
the implementation of specific measures to reduce stress/pressures on a defined water body as the
result of GEF project intervention. A typical example is a completed investment programme to
reduce pollution loads from point sources in a defined water body or the implementation of a
management plan to protect or restore ecological functions of flood plains, wetlands or fishing zones
in a defined water body.
State indicator: state indicators are indicators, that characterize (quantitatively) the ecological
quality of a defined water body at a specific moment. A typical example is the concentration of
pollutants or the biological characteristics of a specific ecosystem. A state indicator can be related to
a "target value": good ecological status or a water classification system.
Indicators for Project Monitoiring and Impact Evaluation
page 15
4.3. Indicators for WFD and EEA reporting requirements
The reporting requirements for the WFD are described in art. 15. This article refers to articles 5, 8
and 13, incl. annex VII. In these articles, the principles of information and data collection and
assessment (art. 5 and 8) and for the content of the River Basin Management Plan (art. 13 and
annex VII) are laid down. These principles are further elaborated in the Guidance Documents, which
have been produced by the EU to support harmonized implementation of the WFD. These can be
found on the EU website. The purpose of the system of reporting is to evaluate policy performance
of the EU Member States. At present there is general consensus among international organizations
to apply the DPSIR cycle for the assessment of success of environmental policy. The EU-WFD has
accepted this approach as the basis for reporting (see ref. 1). The following definitions apply to
these indicators:
Driving Force indicator: driving force indicators are indicators, that characterize (quantitatively)
the development of anthropogenic activities with an impact on a defined water body. A typical
example is economic growth (eventually per sector: agriculture, transport, etc) or demographic
development.
Pressure indicator: pressure indicators are indicators, that characterize (quantitatively) the
pressure on a defined water body. Pressures are the direct effect of driving forces: the results of
human activities with adverse effects on the environmental quality of a defined water body. A typical
example is the load of toxic pollutants from point or non-point sources or fish catch.
State indicator: state indicators are indicators, that describe the ecological quality of a defined
water body at a specific moment. A typical example is the concentration of pollutants or the
biological characteristics of a specific ecosystem. A state indicator can be related to a "target value":
good ecological status or a water classification system.
Impact indicator: impact indicators are indicators, that characterize (quantitatively) the
environmental consequences of driving forces/pressures. These consequences are the change (loss)
of desired functions of a defined water body. A typical example is the deterioration of an ecosystem
by reducing biodiversity or the loss of water resources for drinking water production.
Response indicator: response indicators are indicators, that characterize the outcome of political,
managerial or economic human interventions to address the impact of pressures or to
improve/restore the environmental status of a defined water body: "the human feed back system".
A typical example is the implementation of an investment programme in waste water treatment
plants or the legal enforcement of best agricultural practices (BAP).
4.4. GEF and WFD compared
Although serving different purposes, there is a relationship between process indicators, stress
reduction indicators and environmental status indicators on the one hand, and the components D, P,
S, I, R in the WFD framework on the other hand.
Process indicators, relating to legislation, institution building etc., are in the present situation in the
Danube basin not real response indicators, in the sense of the DPSIR-cycle. Rather they are
indicators of progress in the pre-response phase. Building up institutions, inter-governmental
cooperation, legislation etc. are necessary pre-conditions for responding. In this sense the GEF-
page 16
project should help the Danube countries to use the WFD-system in the future, by assisting in the
development of different components.
Stress reduction, on the other hand, can be seen as a response in the meaning of the WFD cycle.
For environmental status indicators according to the GEF it seems, that there is no difference with
the status indicators according to the WFD.
In conclusion, there are possibilities for using indicators developed in the GEF-project also for WFD
reporting requirements. Therefore It is important to keep in mind that GEF related indicators should
be compatible with WFD indicators.
4.5. Indicator selection criteria and data and information
requirements
Selection criteria
The OECD (see ref. 5 and 13), UNEP (see ref. 6) and very recently EEA (see ref. 10) have published
criteria for selection of environmental indicators. The lists of these 3 international organizations
show more or less overlap. For the selection of indicators for M & E of the DRP and for reporting by
the ICPDR according WFD-EEA requirements, criteria have been derived from these lists by
combining different criteria from the lists and simplify them for the specific purposes of reporting on
the Danube basin.
For the selection of indicators, the following criteria have been applied:
1. Policy
relevant
Indicators must support policy development and decision making; there should be a relation
with policy priorities and policy objectives and targets as described in policy documents,
conventions, legislation and regulations.
2. Analytically sound and robust
Indicators must be scientifically and technically well founded and robust. They must be
representative, readily available and routinely collected. They must be consistent in space and
time: it must be possible to define a baseline. Data must be collected in Standard Operational
Procedures (SOP) within fixed reporting periods.
3. Communicative
powerful.
Indicators should be communicative powerful. Results have to be communicated in Annual
Reports, websites, press communications and during stakeholder consultations.
4. For process indicators: structural
In the GEF M & E indicator system, process indicators should be connectable to each other, for
instance in an input-output-outcome scheme.
Data and information requirements
Although the indicator systems to be developed will serve the GEF and WFD reporting purposes, it
would be highly preferable if selected indicators use the same data sets or other sources of
Indicators for Project Monitoiring and Impact Evaluation
page 17
information The indicators to be selected will need raw data sets and information, which has been or
will be collected by GEF-DRP and/or the ICDRP Secretariat. The ICPDR has set up, with help of
UNDP/GEF and other donors, an extensive system of data and information collection. Data is
collected in existing reporting procedures. Collecting data is costly, and the collection of new types
of data or information should be avoided, unless it appears, that data or information, critical for
monitoring and evaluating project results and/ or policy compliance by ICDRP members, is missing.
The ICPDR data base has 2 main sub databases: the TNMN database and the EMIS database. These
lists of variables are considered a long lists of variables, which are the basis for the selection of a
core list.
4.6. The problem of the baseline
The indicator system(s) will assess different types of changes: environmental quality, capacity for
waste water treatment, institutional settings, public awareness, biodiversity etc. These changes
need to be assessed in relation to the process of river basin management over time. Therefore, the
situation at the start of the process has to be defined: the baseline. According the GEF International
Waters Program (GEF-IWP) Indicators Steering Group, the definition of the baseline is the following:
"The situation that existed at the beginning of a Project, defined in terms of intergovernmental
institutional arrangements, human activities, which degrade the environment or environment
status."
This definition is related to the specific use of an indicator system for the assessment of the process.
It concerns indicators of the (change of the) institutional arrangements and human activities, which
degrade the environment. It does not include indicators on the (change of the) environment itself. A
number of questions has been considered:
1. Using this definition, is the baseline the situation in the basin at the start of the 1st GEF
Environmental Program for the Danube River Basin (EPDRB) in 1992 or at the beginning of
the present GEF-DRP? This limited interpretation would probably be enough for the GEF
Council.
2. Is it necessary to use a broader definition for the baseline, and to include the environmental
status of the basin at the beginning of the EPDRB or at the moment of signing the Danube
Protection Convention, or the establishment of the ICPRD Secretariat?
In the GEF reporting requirements, the establishment of the baseline is a clear issue. In the WFD
and the recent EEA report (see ref.2), there is no reference to any baseline.
Since the ICPDR has a reliable database on pressures, status and investments (responses) in the
Danube basin since 1996, 1996 is proposed as the baseline for both sets of GEF and EEA-WFD
indicators.
page 18
5. RESULTS
5.1. System of indicators for GEF M & E
5.1.1. Introduction
The proposed selection of categories of indicators and individual indicators for GEF M & E is
presented in this paragraph. The process indicators should have a direct relationship with the
objectives, outputs and outcomes, as presented in the Project Document of the DRP, in particular
with the Logical Framework Matrix (LFM). The stress reduction indicators consist of indicators
related to implementation of policies; this implies development, implementation and enforcement of
policy measures, such as new legislation and regulations, but also investments as a result of policy
implementation. According the GEF M & E definition, loads of pollutants are an environmental stress.
In the DPSIR cycle, loads of pollutants are pressures and policy enforcement and investments are
responses. In the GEF M & E system this distinction cannot be made. Therefore, loads are presented
here under stress reduction indicators. State indicators are clearly defined. The categories proposed
are based on the present structure of the TNMN database.
5.1.2. Categories of indicators
5.1.2.1. Process indicators
The basis for selection of process indicators is found in the DRP Project Document, in particular the
LFM. Ideally the system of process indicators should be part of the LFM of a project. For each
objective outputs, outcomes and the related quantifiable indicators should be formulated and
methods to measure progress and quality should be defined in advance.
In the LFM of the DRP, this is only partly done. In order to be able to apply a consistent set of
indicators, the structure of the project document and the LFM have to be consistent as a start. The
grouping of objectives and the formulation of outputs and outcomes in the Phase I and Phase II
documents and LFMs is not considered consistent. For example: the output 4.4 of Objective 4 would
logically fit better under Objective 2: capacity building etc. and output 2.2 has a strong relationship
with all outputs in Objective 4. Therefore the following rearrangement of outputs under 3 main
Objectives are proposed: see annex I.
1. Consolidation and operation of institutional mechanisms for cooperation under the ICPDR
2. Development of policy guidelines and legal and institutional instruments
3. Strengthening of public participation
5.1.2.2. Stress reduction indicators:
These indicators should measure the result of interventions by the Danube countries, that result in
improvement of the environmental conditions. These interventions are formulated in policy and legal
documents as the Danube River Protection Convention, the JAP, the Danube-Black Sea Task Force
(DABLAS) work programmes and other international and national legal documents and regulations.
Indicators for Project Monitoiring and Impact Evaluation
page 19
Such interventions should be followed by investments, which result in a reduction of pollutant loads
and/or recovery of the ecosystem. Any policy cannot succeed without stakeholder involvement and
sufficient public support. Therefore implementation of programmes for stakeholder involvement and
public awareness raising are considered to contribute to stress reduction. The following categories
are proposed:
1. Implementation and enforcement of regional and national legislation and regulations
2. Investments
3. Reduction of pollutant loads
4. Implementation of stakeholder involvement and public awareness raising programmes
5.1.2.3. State indicators:
The stress reduction interventions should result in improvement of the environmental conditions in
the Danube basin. The state indicators should reflect these conditions. The ICPDR is collecting a
vast amount of data on the Danube status. The categories proposed should be based on the
information collected at one hand; on the other hand the quality of the ecosystem has to be covered
as well. The following categories are therefore proposed:
1. Hydrology
2. Water quality
3. Ecological quality
4. Suspended solids/sediment quality
5.1.3. Individual indicators
5.1.3.1. Process indicators
The GEF has accepted a Result Based Management approach (RBM). This means that the emphasis
should lie on output and outcome indicators, as the overall performance of the process is measured
in these terms. Economy and efficiency are of course necessary, but are in RBM considered mainly
as an internal responsibility of the management of the process, with only limited reporting
requirements. The delivery of outputs as planned (timeliness, quantity etc.) is also the responsibility
of the management of the process, and it should explicitly be held accountable for this. Whether the
outputs will have the desired outcomes, is the joint responsibility of the management and the other
stakeholders. They should assess if the outputs in principle have the desired quality. Even when the
quality is high, the desired outcome can be absent, due to other factors as the political situation,
absence of funding etc.
Framework
The framework used for identification of output and outcome indicators is derived from the Value for
Money Analysis (VMA). One starts a production process with a budget. With the budget inputs are
bought, usually manpower and materials. With the inputs certain outputs are produced: products
and services or activities. The outputs lead to outcomes. In general that is a satisfied customer. In
page 20
this case the customer (the GEF Council) is satisfied when there are observable changes in
development conditions.
Process indicators are indicators, which measure the budget, inputs, outputs and outcomes, or the
relationships between them. The most important relationships are:
(a)
inputs/budget � an indicator for the economy of the process;
(b)
outputs/inputs � an indicator for the efficiency;
(c)
outcome/outputs � an indicator for the effectiveness, or quality;
(d)
outcome/budget � an indicator for the value for money; it is the product of the
aforementioned three indicators. Economy * efficiency * effectiveness = Value for
Money.
The framework is presented in box 5.1.
The Value for Money Framework
The Value for Money framework is often used as a help to analyze how a production process is going.
Take the example of the baking of bread. The baker starts with a Budget; next he buys flour, hire people
to work for him etc. - he buys Inputs. Activities undertaken with help of these inputs lead to Outputs:
bread, cake, cookies etc. Once sold this will lead to Value for Money for the customer, or customer
satisfaction, and to an income for the baker.
Suppose the baker isn't doing as well as he wants to do; then the question arises where he should focus
his attention to improve the situation. Is he, compared to the competition, lacking in Economy, Efficiency
or Effectiveness?
Outputs
Effectiveness
Efficiency
Quality
Outcomes
Inputs
Value for money
Economy
Budget
In the Result Based Management philosophy, the donor acts like a customer. The focus is on the
Outcomes of projects, and the donor compares the Value for Money he gets from different competing
projects. The idea is also that this will force the project management to watch carefully the three E's,
without direct overview in these respects by the donor.
Indicators for Project Monitoiring and Impact Evaluation
page 21
The tables in Annex I present the activities, the related outputs and outcomes and the individual
indicators proposed to measure progress and quality.
In Chapter 6 some examples of individual process indicators will be presented in detail with
proposals for measuring progress and quality.
In the 1st column of the tables in annex I, it can be indicated whether or not a specific activity has
been completed in Phase I. It is possible in principle to do the evaluation of these activities by using
the proposed indicators. For those activities that continue in Phase II, it is recommended to apply
the process indicators for both Phase I and II at the same time, considering Phase I and II as one
project.
5.1.3.2. Stress reduction indicators:
The individual stress reduction indicators, grouped according the 4 defined categories, can be found
in Annex II. This list is considered a long list from which a core list can be selected (see par 5.1.4).
5.1.3.3. State indicators:
The individual state indicators, grouped according the 4 defined categories, can be found in Annex
III. This list is considered a long list from which a core list can be selected (see par 5.1.4).
5.1.4. Recommendation for the selection of a core list of indicators for GEF M&E
Process indicators
Annex I presents the long lists for process indicators. In par 6.3 a methodology is presented for the
aggregation of individual indicators into one aggregated indicator. In principle, an aggregated
indicator for each of the 3 categories, presented in par. 5.1.2.1, which are directly related to the
objectives, outputs and outcomes of the DRP, as presented in the LFM, can be produced. Process
indicators serve the purpose of M & E for the GEF Council and are part of an internal reporting
process. For this purpose, the whole set is necessary and cannot be reduced to a core list. For the
purpose of external reporting, it is questionable, whether the results of process indicators should be
reported. Certainly aggregated indicators will not have strong external communicative power. The
results of a number of activities should be reported externally however. These could include for
instance the revision of protocols, the implementation of a small grants programme, the
development of the DANUBIS, the implementation of EU Directives and maybe others, to be decided
by the GEF team in consultation with the ICPDR Secretariat. This type of external reporting can be
done by a narrative in an annual report.
Recommendation 1: it is advised to distinguish internal and external reporting for process
indicators. For internal reporting 3 aggregated indicators are recommended; for external reporting
narrative reporting is advised for activities to be selected by the GEF Team/ICPDR Secretariat.
Stress reduction indicators
Annex II presents the long lists for stress reduction indicators. There are 22 stress reduction
indicators proposed. It is difficult to see how this number can be reduced for internal reporting. Each
of the indicators proposed has a direct relation with the assessment of compliance with the Danube
River Protection Convention and the JAP and DABLAS. For external use, a core list of indicators with
strong communicative power can be proposed.
page 22
Recommendation 2: the matrix in annex II presents the recommendation for a core list based on
the score for each of the criteria presented in par. 4.5
State indicators
Annex III presents the long lists for state indicators. In this Annex, the full list of the 52 TNMN
determinands for water and 22 for sediment should be presented. For reasons of convenience, the
TNMN determinands have been grouped in such a way that 18 state indicators are proposed. It is
difficult to see how this number can be reduced for internal reporting. Each of the indicators
proposed is agreed within the TNMN. For external use, a core list of indicators with strong
communicative power can be proposed.
Recommendation 3: the matrix in annex III presents the recommendation for a core list based on
the score for each of the criteria presented in par. 4.5.
5.2. System of indicators for WFD/ EEA
5.2.1. Introduction
The proposed selection of categories of indicators and individual indicators for WFD/EEA is presented
in this paragraph. The categories of indicators are presented on basis of the DPSIR cycle. The
driving force indicators consist of categories of indicators, that present the development in sectors of
the economy with pressure on the environment as a result. The pressure indicators present the
consequences of economic activities and human interventions on the river and its ecosystem. State
indicators are clearly defined. The categories proposed are based on the present structure of the
TNMN database. The impact indicators describe the change or loss of functions of the river and its
ecosystem. The response indicators are related to implementation of policies; this implies
development, implementation and enforcement of policy measures, such as new legislation and
regulations, but also investments as a result of policy implementation.
5.2.2. Categories of indicators
5.2.2.1. Driving Force indicators
These categories of indicators should reflect the development in activities in economical sectors,
which potentially result in pressures on the environment. OECD used to call driving forces: indirect
pressures. EEA did not report on driving force indicators in its latest indicator based assessment of
European waters (see ref. 2). Driving forces relate to production and consumption. Traditionally a lot
of statistical information is collected on these subjects, including indicators and indexes. There seem
to be enough possibilities for the DRP to use the existing information. The following categories have
been selected on basis of their direct effects on the environment:
1. Demographic developments
2. Industrial production
3. Agricultural production
4. Transport
Indicators for Project Monitoiring and Impact Evaluation
page 23
5. Energy production
6. Tourism
5.2.2.2. Pressure indicators
These indicators should reflect the environmental consequences for the Danube basin as the result
of economic activities and human interventions in the hydrology of the river. They result from the
use of the river for discharges, water abstraction, shipping, tourism, electricity production etc. The
following categories are proposed:
1. Physical interventions
2. Hazardous pollutant loads
3. Nutrient loads
4. Accidental spills
5. Use of natural resources
5.2.2.3. State indicators
The state indicators should reflect the environmental conditions in the Danube basin. The ICPDR is
collecting a vast amount of data on the Danube status. The categories proposed should be based on
the information collected at one hand; on the other hand the quality of the ecosystem has to be
covered as well. The following categories are the same as proposed for the GEF M & E indicators:
1. Hydrology
2. Water quality
3. Ecological quality
4. Suspended solids/sediment quality
5.2.2.4. Impact indicators
Impact indicators reflect the loss of functions and other damages to the river system. They usually
are the result of synergistic effects from different pressures. Impact indicators provide the real
signals on deterioration of the system, while state indicators should be regarded "intermediate"
indicators. A change of state does not necessarily mean that the ecosystem suffers an impact.
Impact indicators should also have a relation with the desired functions of the river system. The
following categories are proposed:
1. Loss of habitats
2. Loss of biodiversity
3. Loss of fisheries resources
4. Economical damages
5.2.2.5. Response indicators
These indicators should measure the result of interventions by the Danube countries, that result in
reversal of impacts and improvement of the environmental conditions. These interventions are
formulated in policy and legal documents as the Danube River Protection Convention, the JAP,
page 24
DABLAS and other international and national legal documents and regulations. Such interventions
should be followed by investments, which result in a reduction of pollutant loads and/or recovery of
the ecosystem. Any policy cannot succeed without stakeholder involvement and sufficient public
support. Therefore implementation of programmes for stakeholder involvement and public
awareness raising are considered to be responses.
The following categories are proposed:
1. Implementation and enforcement of regional and national legislation and regulations
2. Investments
3. Implementation of stakeholder involvement and public awareness raising programmes
5.2.3. Individual indicators
5.2.3.1. Driving Force indicators
The individual driving force indicators, grouped according the 6 defined categories, can be found in
Annex IV. This list is considered a long list from which a core list can be selected (see par 5.2.4).
5.2.3.2. Pressure indicators
The individual pressure indicators, grouped according the 5 defined categories, can be found in
Annex V. This list is considered a long list from which a core list can be selected (see par 5.2.4).
5.2.3.3. State indicators
The individual state indica tors, grouped according the 4 defined categories, can be found in Annex
III and are the same as for the GEF M & E.
5.2.3.4. Impact indicators
The individual impact indicators, grouped according the 4 defined categories, can be found in Annex
VI. This list is considered a long list from which a core list can be selected (see par 5.2.4).
5.2.3.5. Response indicators
The individual response reduction indicators, grouped according the 3 defined categories, can be
found in Annex II. The list for WFD/EEA is the same as for GEF M & E with the exception of loads,
which are defined as pressures under the DPSIR cycle (see annex V). This list is considered a long
list from which a core list can be selected (see par 5.2.4).
5.2.4. Recommendation for the selection of a core list of indicators for the ICPDR
Driving force indicators
Annex IV presents the long list of 19 driving force indicators. Such indicators relate to general
demographic and economic developments and are usually collected and reported by the
governments in the basin and the EU through Eurostat. There seems no need for the ICPDR to
Indicators for Project Monitoiring and Impact Evaluation
page 25
collect additional information. The long list can be used for internal purposes. For external reporting
a core list is recommended.
Recommendation 4: the matrix in annex IV presents the recommendation for a core list based on
the score for each of the criteria presented in par. 4.5
Pressure indicators
Annex V presents the long lists for pressure indicators. There are 12 pressure indicators proposed. It
is difficult to see how this number can be reduced for internal reporting. Each of the indicators
proposed has a direct relation with the assessment of compliance with the Danube River Protection
Convention and the JAP and DABLAS. For external use, a core list of indicators with strong
communicative power can be proposed.
Recommendation 5: the matrix in annex V presents the recommendation for a core list based on
the score for each of the criteria presented in par. 4.5
State indicators
For the recommendation for a core list of state indicators, see annex III and par. 5.1.4. under state
reduction indicators.
Impact indicators
Annex VI presents the long lists for impact indicators. There are 7 impact indicators proposed. It is
difficult to see how this number can be reduced for internal reporting. Each of the indicators
proposed has a direct relation with the assessment of compliance with the Danube River Protection
Convention and the JAP and DABLAS. For external use, a core list of indicators with strong
communicative power can be proposed.
Recommendation 6: the matrix in annex VI presents the recommendation for a core list based on
the score for each of the criteria presented in par. 4.5
Response indicators
For the recommendation for a core list of response indicators, see annex II and par. 5.1.4. under
stress reduction indicators.
page 26
6. PRESENTATION OF INDICATORS
6.1. Introduction
Selected indicators can be assessed and presented in many ways. In this chapter a number of
examples for assessment and presentation techniques will be presented. In par. 6.4 examples of a
process indicator, a stress reduction/response indicator, pressure indicators and state indicators will
be presented in detail. EEA is working on the application of many indicators which in principle could
be relevant for management in the Danube and the Black Sea. A list has been published of 240 of
such indicators. For many of these indicators "descriptive sheets" have been developed describing
the indicators and the method of assessment and presentation. The indicators have a code, referring
to the issue addressed, and a number. For a number of these EEA indicators, the code and the
number is given in annexes I-VI. The descriptive sheets can be found on the EEA website. However,
EEA is now considering to make a core list of 37 environmental indicators, only some of them for
water (see ref. 10). This list is expected to be published at the end of March 2004. It is not clear
yet, what will happen with the descriptive sheets.
The GEF-DRP and the GEF-BSERP are fully familiar with the well known techniques of assessment
and presentation of many indicators, in particular for pressures, state and impact. They are reported
in the TNMN Yearbooks and in the Black Sea Status and Trend reports. Usually these indicators are
presented by graphs, histograms, pies and maps. There is no need to present these techniques here
again. Other frequently used assessment and presentation techniques are the spider web
presentation, the kite diagram (see ref. 4) and the "mondriaan" (a matrix with colours indicating
scores). It is also possible to present different indicators in one graph, eg loads and concentrations
(see ref. 3).
Many good examples of presentation of indicators can be found in the report: Environmental
indicators in Latvia, 2002 (see ref. 3, and website: www.lva.gov.lv) from which a number of
presentations have been copied.
6.2. 6.2 Examples of individual indicators
6.2.1. 6.2.1 Driving force indicators
Two examples are presented from ref. 3: Water consumption in different sectors, 1991-2000, and
life stock patterns, 1990-2000.
Indicators for Project Monitoiring and Impact Evaluation
page 27
6.2.2.
Pressure indicators
One example is presented from ref. 3: Water abstraction, 1991-2000 and two examples from ref.
15: loads of inorganic nitrogen and phosphorous.
page 28
6.2.3. State indicators
Two examples are presented from ref. 3: Oxygen concentrations in the bottom layer of the Gulf of
Riga, 1973-2000, and mean yearly nitrogen concentration in the Daugava River (at Piedruja, border
with Belarus), 1994-2000
6.2.4. Impact indicators
One example is presented from ref. 3: Saprobiological quality of small rivers, 1998-2000
Indicators for Project Monitoiring and Impact Evaluation
page 29
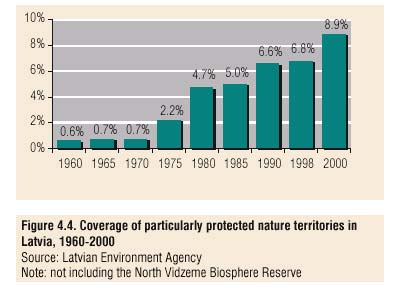
6.2.5. Stress reduction/response indicators
Two examples are given from ref. 3: Number and area of certified biological farms in Latvia and
coverage of particularly protected nature territories in Latvia, 1960-2000.
6.2.6. Aggregated indicators: the kite diagram
An example of an aggregated indicator is found in ref. 14. The figure is copied from this article.
Proposals for aggregated indicators can only be developed after a decision on individual indicators
has been made. This example is on fishery, but similar presentations can be made for other sectors
like agriculture and tourism.
page 30
6.3. Clustering and aggregation of indicators
6.3.1. Introduction
Very often in a project there are so many, and so detailed, indicators available that there is the risk
of losing manageability, overview and clarity. In this case there is a need for simplification. This can
be done by selecting indicators, and by aggregating them. Selection is a common procedure; the
process of reducing the number of indicators in which the EEA is presently involved is a clear
example. The selection of a flagship species as a key indicator is also a well known procedure. The
indicators that finally found their place in this report are also the result of a selection process.
Aggregation of indicators seems to be less common. There are some exceptions: an index as the
saprobiotic index is well known; another example is an indicator as the Biological Oxygen Demand
(BOD) which in fact is the aggregate of a large number of (partly unknown) chains of reactions. One
of the reasons for reluctance to aggregate data seems to be the fear to land in a quagmire of
discussions about assigning weights to variables. However, as will be shown, a correct clustering and
aggregation procedure mainly bypasses the whole issue of weights.
In the social sciences, especially in economics, aggregation is a standard procedure (see ref. 18). No
one can handle for example an input-output model of the size 800*800. Aggregation of sectors till a
6*6 model is reached, or even a one-sector model, is the solution. Other examples of aggregated
quantities are index numbers, the representative firm or consumer, market segments etc.
The purpose of this note is to introduce some concepts and to show how aggregation can work. The
focus is on aggregation as a tool for achieving manageability and clarity, by organizing data in a
hierarchy. Its use thus is mainly one of helping to make management and policy decisions, and as a
tool for reporting.
Aggregation in this case is done ex post, after the data are collected. This means that the procedure
is principle harmless: one can always opt for another procedure if the aggregation doesn't meet its
objective.
6.3.2. Consistent aggregation and filtered consistency
In aggregation micro variables are aggregated by an aggregation function into macro variables. This
is usually done by first grouping or clustering micro variables, and next performing some operation
on these clusters (taking the mean for example) to construct one macro variable for the group. The
aggregation is, loosely defined, called totally consistent if all relations that hold for a set of micro
variables also hold for the corresponding set of macro variables (see ref. 19). The behavior of the
micro system can in that case be completely identified with the behavior of the macro system. A
simple example: if the reduction of emission of 2531 chemical substances is exactly the same, say
34,12% for all 2531, then the aggregation of those 2531 data into one indicator ("reduction of
emission is 34.12%") is totally consistent.
If the consistency is not total, aggregation means loss of information. Each aggregation has a loss
function; generally that aggregation scheme that minimizes the loss function is considered the
optimal scheme.
Total consistency is rare. For policy and management purposes it is also not a very useful concept.
The basic question here is if a decision reached on basis of the aggregated macro system is the
same as the decision based on using the micro system. If that is the case, the aggregation is
Indicators for Project Monitoiring and Impact Evaluation
page 31
partially consistent. More precisely, in this case the aggregation fulfills the conditions of filtered
consistency, where the decision acts like a filtering device.
In fact, taking a decision normally means that the decision maker inevitably will aggregate data,
although most of the time implicitly. The reason is that the decision space normally had far fewer
dimensions than the data space. Take, as an example, the decision whether a new wastewater
treatment plant should be built. On a policy level the decision space has only two dimensions: (1)
Where? and (2) How big? (with a choice for the coordinates {0,0} if the decision is not to build). On
a management level the decision space, about for example the design of the WWTP, will have more
dimensions (Which type?) but it is very unlikely that it will be of the same order as the data space.
For this reason decisions will be very often quite insensitive to the aggregation scheme, or in other
words, robust with respect to it.
6.3.3. An example of clustering and aggregation
To get the flavor of clustering and aggregation, consider the following simple example. Suppose that
in a project loads in a river are reduced. The management of the project wants to inform the
sponsors about the results; there are data about loads of six substances (A-F), during three years,
as summarized in Table 1 and Figure 1.
Table 1: Loads of six substances, in kton/yr
Substance Yr 2000 Yr 2001 Yr 2002
A 100
90
87
B
2000 1760 1700
C
150 138 126
D
50 40 35
E
20 13 19
F
200 156 72
Figure 1: Loads of six substances, in kton/yr
2500
A
2000
B
1500
C
1000
D
E
500
F
0
2000
2001
2002
page 32
The picture that emerges from these data as presented is not very clear; the only conclusion that
can be inferred seems to be "As can be seen in Figure 1, there is in all cases some reduction."
If we normalize the data, by setting the loads in the year 2000 on 100, the picture becomes slightly
more clear (see Figure 2, although we have to look careful.
Figure 2: Loads of six substances, in percentages relative to yr 2000
100
A
80
B
60
C
40
D
E
20
F
0
2001
2002
The conclusion could be: "As can be seen in Figure 2, the loads are reduced till around 80% of the
level of 2000."
However, the moment we express a reduction as an average number we run the risk of getting
swamped in a quagmire of discussions about weights: how should we weight in 2002 a reduction of
1 kton, or 5%, of substance F, to a reduction of 300 kton, or 15% of substance B? Usually there are
as many opinions as participants in the discussion � that ends also usually without any clear
conclusion.
Clustering of the data can help us to get around that quagmire.
As a first step, in Table 2 and Figure 3 the data for reduction are presented.
Table 2: Reduction of loads in per units, base year 2000
Substance
Yr 2001
Yr 2002
A 0.10
0.12
B 0.12
0.15
C 0.08
0.18
D 0.20
0.30
E 0.05
0.35
F
0.22
0.28
Indicators for Project Monitoiring and Impact Evaluation
page 33
Figure 3: Relative reduction of loads for six substances, base year 2000
0.4
A
0.3
B
C
0.2
D
0.1
E
F
0
2000
2001
2002
2003
In this case, a simple visual inspection (see Figure 1) leads to the identification of three groups or
clusters: (1) ABC (2) DF and (3) E. The loss of information if we take averages within the clusters
will be small. Note that the question whether we should take some kind of weighted average is not
very relevant, as the differences within the clusters are quite small. Once clustered, we end up with
Figure 4:
Figure 4: Relative reduction of loads for clusters of substances, base year 2000
0.4
G1 (n=3)
0.3
G2 (n=2)
G3 (n=1)
0.2
0.1
0
2000
2001
2002
2003
Now a clear conclusion can be drawn: "As can be seen in Figure 4, the reduction of the loads is in
most cases in the order of 20%, with a rising trend, with the exception of cluster 3, consisting of the
substance E."
Some policy and management questions now can be answered ("Are the results of the project
satisfactory? Should we do more?"), and other questions can be formulated ("Why is substance E
behaving different from the rest? What's the reason of the difference between cluster ABC and
cluster DF? Where should we concentrate efforts?" Questions, which perhaps can be answered by
going back to the basic data.
6.3.4. The technique of clustering
In the example above, we arrived at three clusters by visual inspection of a scatter diagram. The
case is quite simple: six variables, two dates, one dimension (the relative reduction). In practice
cases will be complicated, involving for example several hundred variables, ten years, and several
page 34
dimensions (add for example quantity and harmfulness as dimensions to take into consideration as
clustering criteria). In such cases it is of course necessary to us a computer program.
A clustering computer program is usually based on a hierarchical clustering procedure. Clusters are
formed stepwise, beginning with pairs of cases that are near to each other, using in general a
squared distance criterion. Next other cases are added. As clusters grow, the loss of information will
become bigger. In Figure 5 this procedure is illustrated with a clustering tree for the example
presented above, using the program ClustanGraphics (see ref. 20).
Figure 5: Clustering tree for reduction of loads for six substances (A-F)
On the vertical axis the substances A-F are shown; going to the right the way they are clustered can
be seen. First A/B and D/F are clustered, next C is added to the cluster AB, etc. The criterion for the
ordering of the steps is minimization of loss of information as a consequence of the formation of the
cluster. That loss is based in this case on the sum of the squared distances of the members of a
cluster to the mean of that cluster. The loss of information is shown horizontally. As can be seen
the formation of first the first two clustering steps (AB and DF), and the second clustering, the
addition of C to AB, barely lead to a loss of information. In the next step - the clustering of ABC and
DF to ABCDF -the loss of information would increase hugely, so it seems wise to stop with three
clusters; ABC, DF and E; for this reason they are shaded blue, while the not performed clustering is
shaded yellow.
6.3.5. Aggregating process indicators
In this report three groups of process indicators are distinguished: (1) Institutional (2) Policy and
(3) Public Participation indicators. As there are at present no data available, it is of course
completely unclear if the indicators will show a cluster like behavior that will conform to this
grouping. One should simply try and see. The only precondition is a normalization of the indicators,
for example on a scale of 0-5 (see also Annex VIII).
Indicators for Project Monitoiring and Impact Evaluation
page 35
6.4. Detailed presentation of selected indicators
6.4.1. Process indicator: assessment of involvement
In annex VII a detailed methodology for the assessment of stakeholder involvement is presented. It
is presented here as a process indicator, which is used in the context of project performance
assessment. However, assessment of stakeholder involvement is equally relevant as a stress
reduction/response indicator in the context of policy development and implementation.
6.4.2. Stress reduction/response indicator: introduction of BAP and
implementation of Nitrate Directive
In annex VIII a detailed methodology for the assessment of a stress reduction/response indicator is
presented, using the implementation of the EU Nitrate Directive as an example. EEA has presented a
methodology in a descriptive sheet: AGRI17 (annex XI). The methodology is based on the structure
of the Directive and the descriptive sheet AGRI17 with some adaptations.
6.4.3. State indicators: trend analysis of concentrations for 1996-2000 for
ammonium and nitrate at 5 stations in the Danube basin
Statistical trend analysis for concentrations result in a quantified assessment of the trends in a state
indicator, eg the concentration of a specific pollutant, over a defined period of time at a specific
location. There are several software packages which in principle are suitable to be used. A number
of examples is presented here, calculated with SPSS. In this procedure data are checked for
seasonal patterns and outliers, and linear regression is calculated. The software calculates on basis
of these fits the probability of trends and gives a value for the significance. Results are presented
for ammonium and nitrate.
As can be seen from Table 3 there is a strong decline of measured ammonium
concentrations for all locations, except L0430-L, with reductions up till 78% in five
years.
Table 3: Results for Ammonium
Total
Average
R-
Probability
Signif F
V-0
V-end
reduction/ reduction/ square
trend for
Location T-0
Period 1
Period 2 year in % year in % (a)
(a)
whole period
L0430-L 1996-1 0,33
0,36
-11%
-2%
0,028
0,6691
-
L1220-L 1999-1 0,24
0,06
73%
36%
(0,451) (0,0005) Very strong
L1290-M 1996-1 0,14
0,03
76%
15%
(0,497) (0,0000) Very strong
L1330-R 1996-2 0,20
0,09
55%
11%
(0,376) (0,0000) Very strong
L1390-L 1996-2 0,16
0,06
60%
12%
(0,439) (0,0000) Very strong
page 36
As calculated for linear regression over the whole period; figures between brackets are for fits for
the whole periods, where the distinction in two periods is more relevant.
The graph for location L0430 is presented in figure 6 and for location L1290 in figure 7.
Figure 6: Ammonium concentration at station L0430 (RO05) for the period 1996-2000
1.20000
L0430_L
TREND
95% LCL
1.00000
95% UCL
0.80000
0.60000
0.40000
0.20000
0.00000
-0.20000
J
A
MA
SEP 1
J
A
MA
SEP
JA
M
SEP 1
J
A
MA
SEP 1
J
A
MA
SEP
N
N
N
AY 1
N
N
1
Y
1
Y
1
1
1
Y
2
Y
2
996
19
19
19
20
9
997
9
9
9
999
9
000
0
96
9
9
9
6
97
9
7
8
9
9
9
0
8
8
99
9
00
0
Date
Figure 7: Ammonium concentration at station L1290 (HR03) for the period 1996-2000
Indicators for Project Monitoiring and Impact Evaluation
page 37
0,25000
L1290_M
FIT_P2
Fit for
L1290_M_O
0,20000
from
CURVEFIT,
MOD_18
LINEAR
0,15000
FIT_P1
0,10000
0,05000
0,00000
JAN APR JUL 1 OCT 1
APR JUL OCT 1
APR JUL OCT 1
APR JUL OCT 1
APR JUL OCT 2
996
996 1996JAN
19 1997 997 1997JAN 19 1998 998 1998JAN 19 1999 999 1999JAN 19 2000 000 2000 20
96
97
98
99
00
Date
L1290_M
As can be seen from Table 4, the concentration of NO3 was reduced for all locations.
Table 4: Results for NO3
Total
Average
reduction/ reduction/
Location T-0
V-0
V-end
year in % year in % R-square Signif F Probability
L0430-L 1996-1
1,79
1,26
30%
6%
0,22
0,097
Strong
L1220-L 1999-1
2,25
1,53
32%
32%
0,18
0,04
Moderate
L1290-M 1997-7
1,53
1,09
29%
8%
0,42
0,0000
Very strong
L1330-R 1996-2
1,52
1,36
11%
3%
0,10
0,02
Moderate
L1390-L 1996-1
1,31
0,96
27%
8%
0,40
0,0014
Very strong
The graph for location L0430 is presented in figure 8.
Figure 8: Nitrate concentration at station L0430 (RO05) for the period 1996-2000
L0430-L
page 38
2,70000
Seas adj ser
for L0430__1
from
SEASON,
2,40000
MOD_48
ADD EQU
12
2,10000
FIT_P1
Fit for
SAS_1 from
CURVEFIT,
1,80000
MOD_49
LINEAR
FIT_P2
1,50000
1,20000
0,90000
JAN AP JUL 19 OCT 19 19JAN AP 1 JUL 19 OCT 19 19JAN AP 1 JUL 19 OCT 19 19JAN AP 1 JUL 19 OCT 19 19JAN AP 1 JUL 20 OCT 20 20
2
996
997
998
999
000
R
96
96 96 R 97 97 97 R 98 98 98 R 99 99 99 R 00 00 00
Date
It should be stressed that the statistical analysis does not give an answer on the reasons for the
trends. It could be a real chnage of water quality; it could also be a (sudden) change in the
analytical techniques used in the laboratory.
6.4.4. An Indicator for Legal Reform Processes
6.4.4.1. Introduction
The purpose of this short note is mainly to draw attention to a technique for measuring stages of the
legal reform process, developed by USAID (ref. 16). The process of reform is broken down in eight
milestone events (see Box 1).
Box 1: Outline of USAID milestone model for legal reform (ref. 16)
Stages in legislation:
1. Interested groups propose that legislation is needed
2. Issue is introduced in the relevant legislative committee or ministry
3. Legislation is drafted by relevant legislative committee or ministry
4. The legislature debates the legislation
5. Legislation is passed fully by full approval process needed in legislature
6. The executive branch approves the legislation (where necessary)
7. Implementing action are taken
8. No immediate need identified for amendments to the law
Indicators for Project Monitoiring and Impact Evaluation
page 39
By simply counting the number of milestones taken one can assess the state of affairs concerning
legislation in a field in a country.
6.4.4.2. Presentation
The presentation of the results can be done in a number of ways, e.g.:
> Spider web for a specific field of legislation, with the countries on the axes, to get an
overview of the situation in this field in the different countries;
> Spider web for a country, with the fields of legislation on the axes, to get an overview of
the situation in a country;
> The same principle as above, but now not the absolute number of milestones taken, but
the extra number of milestones taken since the year before, to get an overview of the
progress made;
> Matrices, with on the rows the fields of legislation and on the columns the countries.
Of course results can be aggregated, by constructing indices or calculating averages.
6.5. Web site format report
The idea we had for the website is that indicators can be kept up to date at all times. This gives a
better idea of the current situations and it is easier to see progress. That's why there was need for a
management tool which could create graphs from input given to the website. This way the
information that the graphs present is always the current one, unlike reports on paper.
The website is created with XHTML, which is the new standard for websites because it gives clean
and correct code. It also has the advantage of working on all web browsers correctly. Used with the
wc3 validator the XHTML is fully bug proof. The code behind the management tool is PHP in use with
a GD library to create the dynamic graphs. Because this website is still only a prototype which needs
to have other functions and more indicators added, we created a way to have it completely dynamic.
In this way modules can be added and removed in an easy way. This is achieved by using a simple
directory structure which divides the whole website in chapters. The way the website looks can be
easily adjusted as well with a cascading style sheet.
In order to change the input for the indicators there is a login page required which will lead to the
management tool. Users with the given rights will be able to login on this page and change or
update the certain indicators and the graphs will dynamically convert this input into a new graph.
page 40
7. DISCUSSION
In this report, a proposal for an indicator system for GEF M & E is presented. The main issues to
discuss have been formulated in chapter 5. Final decisions on a long list and core list depend on
answers to these questions and should primarily be taken by the end users. At the same time, the
use of indicators in water management is topic of an ongoing debate in the EU and the EEA (see ref.
10). Also for GEF M & E this debate is relevant, since indicators systems for either GEF or EU should
preferably be harmonized. It is at present not clear what the outcome of the EU debate will be
although answers are expected in the near future. EEA will probably present methodologies for
quantification and presentation of the selected list of indicators. A beginning has been made already
with the production of these descriptive sheets.
EEA has chosen in its recent report (see ref. 12 and par. 4.1) to use the DPSIR cycle in the context
of issues: eutrofication, pollution with hazardous substances etc. For GEF M & E this question seems
not to be relevant. For policy compliance assessment this approach has advantages. The proposed
system for stress reduction and state indicators in this report could be rearranged on an issue basis.
Many indicators are related to different issues and thus should be reported under a number of
issues. The choice for a yes/no issue related presentation could be taken after the final list of core
indicators has been chosen. Finally, the use of aggregated indicators should be investigated also
after some of these questions have been answered.
Indicators for Project Monitoiring and Impact Evaluation
page 41
8. LITERATURE AND WEBSITES
Literature
1. Guidance for the analysis of pressures and impacts in accordance with the Water Framework
Directive, EU Impress working group, page 15, November 2002.
2. EEA, Europe's water: an indicator based assessment, Topic Report 1/2003, November 2003.
3. Latvian Environment Agency, Environmental indicators in Latvia, 2002
4. Monitoring and Evaluation Indicators for GEF International Waters Project, Monitoring and
Evaluation Working Paper 10, Al Duda, November 2002
5. OECD, OECD Core set of indicators for environmental performance reviews, Environment
Monographs, no. 83, 1993
6. UNEP, An overview of environmental indicators: state of the art and perspectives,
UNEP/EATR.94-01, 1994
7. RIVM, Towards a global environmental outlook II: scanning the global environment, designing a
framework for UNEP's reporting functions, 1994
8. EEA, Environment in the European Union at the turn of the century, 1999
9. Guidelines on Monitoring and Assessment of Transboundary Rivers, UN-ECE Task Force on
Monitoring and Assessment, page 22, March 2000
10. EEA, Internal document, Doc.EEA/BU/32/06, EEA Core set of indicators, 2004
11. Draft for Discussion at the second biennial GEF International Waters Conference, Dalian, China,
September 25-29, 2002, by the GEF International Waters Program Indicators Steering Group
12. GEF, Monitoring and Evaluation Polices and Procedures, Global Environment Facility, Washington
DC, 2002
13. OECD, Environmental Indicators: towards sustainable development, 2001
14. S.M. Garcia et al., The FAO guidelines for the development and use of indicators for sustainable
development of marine capture fisheries and an Australian example of their application, Ocean
and Coastal Management, 43, 537-556, 2000
15. Nutrients as a transboundary Pressure in the DRB, ICPDR-UNDP/GEF, February 2004
16. USAID, Monitoring the Policy Reform Process, Recent Practices in Monitoring and Evaluation
Tips, 2000, Number 14.
17. S.O. Funtowicz et al., Information tools for environmental policy under conditions of complexity,
EEA, 1999
18. W.D. Fisher, Clustering and Aggregation in Economics, The John Hopkins Press, Baltimore, 1969.
19. Y. Ijiri, "Fundamental Queries in Aggregation Theory", Journal of the American Statistical
Association, December 1971, Vol. 66, 766-782.
20. D. Wishart, ClustanGraphics, Edinburgh, 1999 (software package).
page 42
Websites:
BSC: bsc-commission.org
BSERP: blacksea-environment.org
ICPDR: icpdr.org
EEA: eea.eu.int
EU: europe.eu.int
OECD: oecd.org
GEF: gefweb.org
WB: worldbank.org
Latvia: lva.gov.lv
Indicators for Project Monitoiring and Impact Evaluation
page 43
ANNEX I: Process indicators
1. Consolidation and operation of institutional mechanisms for cooperation under the ICPDR
Ph2 Outputs
Indicators
Outcome
Indicators
1.1
Diverse tools and mechanisms for River
Assessment quality by ICPDR ICPDR
capacity Assessment stakeholders
Basin Management
strengthened
2.1
Proposals for reinforcement
Breadth involvement departments,
Coordination national
Scope activities; assessment
Interministerial Committees
local administrations and other
actvities
stakeholders
organzations
2.2
Operational tools for monitoring,
Harmonization standards;
Monitoring in line with
Peer assessment
laboratory and information management
Development EMIS/MLIM andTNMN
EU standards
and for emission analysis
4.1
Proposal for Monitoring Programme
Accordancy to EU requirements
Monitoring programme
Monitoring institutions in all Danube
operational
countries operational; adherence to
QA/QC procedures
4.2
Analysis of sediments in the Iron Gate
Peer assessment quality reporting
Increased
Recommendations for precautionary
reservoir and impact assessment of
understanding
and rehabilitation measures in the
heavy metals and other substances on
period 2006-2015; Assessment
the Danube and the Black Sea
stakeholders of the quality of
ecosystems
measures
4.3
Monitoring and asssessment of nutrient
Assessment in 2 Danube
Agreement on DRB
Assessment stakeholders
removal capacities of riverine wetlands
wetland/floodplain sites;
wetland management
Peer review quality assessment
plan
2.3
Proposals for improvement of procedures Assessment stakeholders.
Swift and coordinated
Results simulation
and tools for accident emergency
reponse to accidents
response with particular attention to
transboundary emergency situations
2.3
Check-list for reduction of risk of
Completeness (peer assessment)
Implementation in 50
Reduction accidents
accidents
industrial
Dissemenation results
locations/companies
2.5
Coordination activities BSERP & DRP
Formulation common management
Common activities
Assessment stakeholders
objectives
2.6
Workshops on nutrient reduction and
Participants: 130 experts, 300
Enhanced capacities
(Self-)assessment
transboundary issues
stakeholder representatives
page 44
2. Development of policy guidelines and legal and institutional instruments
Ph2 Outputs
Indicators
Outcome
Indicators
1.1
Danube River Basin
Accordancy to EU Directives etc ; Acceptance by ICPDR and
Review/approval/ratification;
Management Plan
Involvement governments and
individual governments;
other stakeholders, as assessed
Better understanding of
Self-assessment
by these stakeholders and ICPDR planning approaches as
prescribed by EU-WFD
1.1 Sub-basin
management Accordancy to EU directives
Pilot project Sava started
Assessment by stakeholders
plan for Sava Basin
etc.; Involvement governments
and other stakeholders, as
assessed by these stakeholders
and ICPDR
1.2
Proposals for BAP
Assessment stakeholders;
Adoption BAP in national
Application in basin zones; assessment by stakeholders;
Involvement governments and
policy.
dissemenation results
other stakeholders, as assessed
by these stakeholders and ICPDR
1.3
Pilot project BAP
5 pilot sites selected
100 farmers applying BAP
Dissemenation results (1000 farmers are aware of BAP,
Demonstration BAP
as
Shown by polling.
1.4
Proposals for land use
Scope plan (including legal, and
Start pilot projects land use
See with Pilot projects land use
policy for wetland
economic issues)
rehabilitation
Involvement governments and
other stakeholders, as assessed
by these stakeholders and ICPDR
1.4
Pilot projects land use
3 pilot-sites in 3 countries, 7000
Demonstration land use
Dissemenation results
ha.
Enhanced capacities
(Self-)assessment
stakeholders
1.5
Proposals for BAT in
Assessment stakeholders
Increased awareness of, and Number of experts trained. Selfassessment by
industrial and transport Involvement governments and
knowlede about potentials
participants workshops
sectors according to EU other stakeholders, as assessed
BAT
directives
by these stakeholders and PIU
Indicators for Project Monitoiring and Impact Evaluation
page 45
Ph2 Outputs
Indicators
Outcome
Indicators
1.6 Proposals
for
Assessment stakeholders
Increased awareness of
(1)Policy reforms aimed at improved collection of water
application of economic Involvement governments and
policy options
and wastewater service tariffs and fees considered at
instruments for control
other stakeholders, as assessed
the municipal level in 40 municipalities and adopted at
of nutrients and
by these stakeholders and PIU
the municipal level in 20 municipalities.
dangerous substances
(2) 60 municipal water systems actively consider tariff
reforms aimed at improving sustainable financing; 20
municipalities adopt such reforms.
(3) 100 municipalities water and wastewater utilities
understand the way in which computerized financial
models can be used to assess the financial and service
consequences of policy reforms, budget allocations,
tariff changes, and development plans,40 municipalities
actively use such a model to assess and support new
tariff proposals, budget requests, or investment or
grant applications.
1.7
Proposals of effective
Assessment stakeholders
Implementation
(1) Ministries or affected agencies of 3 DRB countries
systems of water
Involvement governments and
and 6 selected demonstration municipalities have used
pollution charges, fines
other stakeholders, as assessed
financial modeling to test the consequences of possible
and incentives,
by these stakeholders and PIU
reforms in the design of their effluent charges.
focusing on nutrients
(2) Ministries or affected agencies of 3 DRB countries
and dangerous
are actively considering changing their emission charges
substances
to encourage reduction in nutrients and toxics.
Dissemenation results
Demonstration
1.8 Recommendations
for Assessment stakeholders
Agreement on the phase-out 24% reduction of P from point sources of pollution;
the reduction of
Involvement governments and
of phosphates
12% reduction of total P loads from the DRB to the
phosphorus in
other stakeholders, as assessed
Black Sea
detergents
by these stakeholders and PIU
4.4
Workshop on pollution
Participation of policy makers,
Better understanding
Self-assessment participants
trading and
regulators, polluters and
instruments
corresponding
investors
economic instruments
page 46
3.. Strenghening of public participation
Ph2 Outputs
Indicators
Outcome
Indicators
2.4 Reinforcement
DANUBIS Establishment linkages
Enlarged set of users;
8000 hits/month in 2006 for DANUBIS
and project website
Opinion expert users
intensification usage
8000 hits/month in 2006 for project website
Opinion visitors
3.1
Advice for and training of
Persondays, participants
Sustainable DEF secretariat
Expansion network; assessment by NGO's of quality
DEF management
training
DEF
3.1
Support for NGO's by
Particpation in workshps;
Improvement capacities
Enhanded cooperation between governments and
regional consultation
assessment quality by
NGO as assessed by parties; improved capacity for
meetings and stakeholder
participants
fundraising ($$)
training
3.1
Support for NGO
Number, distribution
Increased awarenees with
Public polling
publications
the public
3.2
Small Grants Programme
Number : 120 on nutrient
Increased awareness with
Public polling;
pollution and toxic substance
the public; capacity building
problems and 12, involving 35
with NGO's
NGO's, on transboundary
prblems, scope, activities
3.3 Information
for
mass
Frequency and number of
Increased awarenees with
Public polling; participation organizations in Danube
media; organization
publications/broadcasts; scope the public
Day
Danube Day
subjects
3.4
Proposals for enhancing
Involvement of 100
Access to information
Trial procedures
access to information re
governmental officials and 100 Pollution reduction process
5 pilot sites
hot spots, in accordance
key stakeholders
initiated
with EU WFD and Arhus
convention
Indicators for Project Monitoiring and Impact Evaluation
page 47
ANNEX II: Stress reduction and response indicators
Indicators in bold are proposed for the core set
1. Implementation and enforcement of regional and national legislation and regulations
1. Implementation of Danube River Protection Convention and Joint Action Programme
2. Implementation of EU Water Framework Directive, 2000/60/EC (WEC08)
3. Implementation of EU Nitrates Directive, 91/676/EC (WEC08; AGRI06; AGRI17)
4. Implementation of EU Urban Waste Water Treatment Directive, 91/271/EC (WEU09;
WEU16; WEC08)
5. Implementation of EU IPPC Directive, 96/61/EC
6. Introduction of P-free detergents (unit: % market share detergents)
2. Investments
7. Investments in canalization and municipal waste water treatment plants (WWTP-M)
(WEU09; WEU16)
8. Investments in agricultural point sources
9. Investments in industrial waste water treatment plants (WWTP-I)
10. Investments in clean technology (BAT)
11. Investments in wetland restoration
12. Investments in safe shipping and navigation and pollution abatement equipment
3. Reduction of pollutant loads
13. Reduction of organic pollution loads by sector (WEU08)
14. Reduction of nitrogen loads by sector (WEU06)
15. Reduction of phosphorous loads by sector (WEU06)
16. Reduction of BOD5 loads by sector (WEU05)
17. Reduction of accidental spills
18. Reduction of metal loads by sector (WHS08; WHS09)
19. Reduction of organic micropollutant loads by sector (WHS08; WHS09)
20. Reduction of bacteriological and viral pollution by sector (WEU11)
page 48
4. Implementation of stakeholder involvement and public awareness raising programmes
21. Implementation of Aarhus Convention
22. Implementation of art. 14 of the EU Water Framework Directive, 2000/60/EC (WEC08)
This annex shows the proposed individual response indicators under the DPSIR cycle as well with the
exception of category 3: loads, since loads in the DPSIR cycle are under pressure indicators (see annex
V)
Recommended core list of stress reduction and response indicators
Policy relevant
Analytically sound Strong
Core list
and robust
communicative
power
Indicator
number
1
2
3
YES
4
YES
5
6
YES
7
YES
8
YES
9
YES
10
11
YES
12
YES
13
14
YES
15
YES
16
17
YES
18
19
20
YES
21
22
YES
Strong
Moderate
Weak
Indicators for Project Monitoiring and Impact Evaluation
page 49
ANNEX III: State indicators
Indicators in bold are proposed for the core set
1. Hydrology
1. Flow
2. Water availability by sector (WQ01; WQ04)
2. Water quality (WHS02; WHS03; WEU11; WEU12)
3. Oxygen concentration
4. Organic pollution
5. Bacterial pollution
6. Nutrients
7. Metals
8. Organic micropollutants
9. Oil
10. Chlorophyll-a
3. Ecological quality (WEU12; BDIV02; WEC04; WEC05)
11. Saprobic index
12. Flagship species
13. Protected areas (BDIV06; BDIV12; WEC03, a and b: aquatic habitat quality; TELC05: landscape
diversity)
4. Suspended solids/sediment quality
14. Organic nitrogen
15. Ptot
16. Metals
17. Organic micropollutants
18. Oil
page 50
Recommended core list of state indicators
Policy relevant
Analytically sound Strong
Core list
and robust
communicative
power
Indicator
number
1
YES
2
YES
3
YES
4
5
YES
6
YES
7
8
9
10
11
YES
12
YES
13
YES
14
15
16
17
18
Strong
Moderate
Weak
Indicators for Project Monitoiring and Impact Evaluation
page 51
ANNEX IV: Driving Force indicators
Indicators in bold are proposed for the core set
1. Demographic developments
1. Population growth (unit: %)
2. Water demand (WQ2; unit: volume per capita)
3. Number of households (unit: number)
2. Industrial production
4. Production growth by branch (unit: %)
5. Use of raw materials (unit: tons)
6. Water demand (WQ2; unit: volume per ton produced)
7. Employment and revenue (unit: Euro)
3. Agricultural production
8. Cropping/Livestock patterns (AGRI09; units: areas, numbers)
9. Fertilizer consumption (AGRI07; tons)
10. Pesticides and herbicides consumption (AGRI08; tons active compound)
11. Water demand (WQ2; AGRI01; unit: volume per ton produced)
12. Employment and revenue (unit: Euro)
4. Transport
13. Industrial and agricultural production
14. Employment and revenue (unit: Euro)
15. Road versus rail versus shipping
5. Energy production
16. Water demand (WQ2; unit: volume)
17. Employment and revenue (unit: Euro)
6. Tourism
18. Water demand (WQ2; unit : volume per capita)
19. Employment and revenue (unit: Euro)
page 52
Recommended core list of driving force indicators
Policy relevant
Analytically sound Strong
Core list
and robust
communicative
power
Indicator
number
1
YES
2
YES
3
4
5
6
YES
7
8
YES
9
YES
10
YES
11
YES
12
13
14
15
YES
16
YES
17
18
YES
19
Strong
Moderate
Weak
Indicators for Project Monitoiring and Impact Evaluation
page 53
ANNEX V: Pressure indicators
Indicators in bold are proposed for the core set
1. Physical interventions
1. River corrections
2. Migration barriers/flow impairments (reservoirs, power dams)
2. Hazardous pollutant loads
3. Metal loads by sector (WHS08; WHS09)
4. Organic micropollutant loads by sector (WHS08; WHS09)
5. Bacteriological and viral pollution by sector (WEU11)
3. Nutrient loads
6. Organic pollution loads by sector (WEU08)
7. Nitrogen loads by sector (WEU06)
8. Phosphorous loads by sector (WEU06)
9. BOD5 loads by sector (WEU05)
4. Accidental spills
10. Number of accidental spills
11. Tons of spilled pollutants
5. Use of natural resources
12. Water abstraction by sector (WQ02; AGRI01)
page 54
Recommended core list of pressure indicators
Policy relevant
Analytically sound Strong
Core list
and robust
communicative
power
Indicator
number
1
YES
2
YES
3
4
5
YES
6
YES
7
YES
8
YES
9
YES
10
YES
11
YES
12
YES
Strong
Moderate
Weak
Indicators for Project Monitoiring and Impact Evaluation
page 55
ANNEX VI: Impact indicators
Indicators in bold are proposed for the core set
1. Loss of habitats
1. Areas of wetlands lost (BDIV05; BDIV09)
2. Areas of flood plains lost
2. Loss of biodiversity
3. to be determined
3. Loss of fisheries resources (unit: numbers, biomass, Euro)
4. Decrease of commercial species
4. Economical damages (unit: Euro)
5. Costs of flood control
6. Costs of water treatment
7. Reduced options for aquaculture development
Recommended core list of impact indicators
Policy relevant
Analytically sound Strong
Core list
and robust
communicative
power
Indicator
number
1
YES
2
YES
3
YES
4
5
YES
6
7
Strong
Moderate
Weak
page 56
Annex VII: Methodology for the assessment of stakeholder
involvement
Assessment of Involvement
1.
Introduction
In the list of process indicators, there is mentioned repeatedly Assessment (for example of the quality
of workshops by participants) and Assessment of involvement. An example of the last indicator is
Involvement governments and other stakeholders in the development of proposals for BAP, as
assessed by these stakeholders and the ICPDR.
Whereas the first type of assessment can be done fairly simple, by way of a short questionnaire, the
second type is more complicated. For that reason we elaborate here a (completely fictitious) example.
The way the results are presented can be also of use for the presentation of more simple assessments.
2. Involvement
Involvement refers to the extent that a stakeholder delivers his necessary contribution. It is the
product of two elements: the extent of necessity, or importance, of the fact that the stakeholder
should contribute, and the quality of the contribution.
We define involvement as `importance that the stakeholders contributes' times `quality of the
stakeholders' contribution'.
Assessment of involvement of stakeholders can correspondingly be seen as consisting of two elements:
�
The assessed importance of the fact that a stakeholder contributes;
�
The assessed quality of the contribution, including the contribution to the process (e.g.
cooperativeness, and readiness to share information).
It is of course possible that both elements are interrelated. To take an extreme example: if a
stakeholder thinks that it is completely unimportant that another stakeholder contributes anything,
then it will be unlikely that he will highly value its contribution. But we think that in a lot of cases
stakeholders can, and will in practice, distinguish the importance of the fact that another stakeholder
contributes and the quality of his contribution.
It should be clear that this kind of assessment is not an exam. Rather, it acknowledges the fact that in
a complex multi-actor system there is a plurality of legitimate perspectives. However, it is important
that the different actors know each other's perspectives. Transparency in the process is important.
Assessment can act as an aid to dialogue and decision-making. (See ref. 17).
Indicators for Project Monitoiring and Impact Evaluation
page 57
3. Users
We see the following groups of users:
�
The stakeholders themselves � the most important users. The assessment confronts them with
the opinion of other stakeholders about their own role and the quality of their contribution. It
should raise questions with themselves, and lead to putting questions to others. Precondition
for this is feedback of the results to the stakeholders.
�
The coordinators of the process. It can help them to decide where more effort in facilitating
discussions, helping clarifying roles, and improving quality, is the most urgent.
�
The sponsors of the process. They can see how far involvement of different stakeholders is
progressing, and also in which way the coordinators of the process act with respect to this
issue.
4. Procedure
The assessment is done in the following way:
I.
Distinguish the different (groups of) stakeholders, e.g.
1. Ministry
1
2. Ministry
2
3. Local
authorities
4. ICPDR
5. Experts
6. Farmer
organizations
7. Environmental
NGO's.
II.
Ask the stakeholders to answer the following questions:
�
Rate the importance you attach in principle to the fact that your own organization
and the other stakeholders contribute to the process, on a scale from 1-5. (1 = not
important at all, 2 = fairly unimportant, 3 = relatively important, 4 = fairly important 5
= very important).
�
Rate the quality of the contribution, given the importance you attach to the fact
that they contribute, on a scale of 0-5 (0 = contribution is unknown, 1 = poor, 2 =
fairly poor, 3 = reasonable, 4= fairly good, 5 = good).
For example, if you think that the fact that a stakeholder contributes is in principle
fairly unimportant (you scored here a 2), but that the quality of the (small)
contribution was good, then you score here a 5.
Contribution includes contribution to the process (e.g. cooperativeness, and readiness
to share information).
The procedure as presented presupposes that all stakeholders should be informed about the
contributions of all other stakeholders. If this is clearly not the case (e.g. the work of experts should be
page 58
only known by ICPDR and Ministry 1), then the procedure should be adapted. The design of the
assessment should in principle follow the design of the process.
On the other hand, one should be careful not to preclude the possibility of obtaining information from
the assessment that could lead to redesign of the process. If for instance Ministry 2 rates
Environmental Organizations as fairly important (4) but rates the quality as 0 (because in the process
it was not foreseen that it would see the contribution of Environmental Organizations), then redesign
of the process seems to be called for.
5. Results
The scoring results in three tables:
1. A table for assessment of importance
2. A table for assessment of quality
3. A table with the final scores of involvement
The scoring by an organization is row wise, and the results per organization can be read column wise.
If there is more than one stakeholder in a group, the scoring in a cell is the average of the individual
scores. For instance, in table 1, two experts scored. In cell [5,1], the scoring of the experts of the
importance of Ministry 1, one expert scored 4, the other 5, so the final score is 4,5.
5.1 Importance
Table 1:Assessment of importance of stakeholders by stakeholders
Nr.
1
2
3
4
5
6
7
Ministry 1 Ministry 2 Local Auth ICPDR
Experts
Farmer Org. Envir. Org.
1
Ministry 1
5
3
1
4
1
2
1
2
Ministry 2
4
4
2
3
1
5
4
3
Local Authorities
5
3.3
3
4
2
4
1
4
ICPDR
5
4
3
2
1
5
1
5
Experts
4.5
4
1
5
5
5
1
6
Farmer Organizations 5
4
2
3
1
5
3
7
Environmental Org. 5
2
2
1
1
5
4
Average
4.8
3.5
2.0
3.1
1.7
4.4
2.1
Overall average
3.1
Legenda: The cells are colored according to the following
scheme:
Good
3.5-5.0
Reasonable2.5-3.5
Poor
1.0-2.5
Indicators for Project Monitoiring and Impact Evaluation
page 59
The table can be used in the following ways:
�
The average score per stakeholder gives a quick indication of the importance of a stakeholder,
as assessed by the complete set of stakeholders.
�
From the average score per stakeholder, or group of stakeholders, we can also derive the
relative importance (see figure 1). In this case it is clear that Ministry 1 (nr 1), Ministry 2 (nr
2) and the farmer organizations (nr 6) are seen by the complete group of stakeholders as the
most important. Together they account for nearly 60% of the score.
Figure 1: Relative importance stakeholders
7
1
10%
23%
6
20%
2
5
16%
8%
3
4
9%
14%
Legenda: numbers refer to numbers in row 1 of table 1
�
If the scores vary widely column wise, it is probable that there is some unclearness about the
role of the concerned stakeholder.
�
If the self-score differs significantly from the average score, there is a problem. In this
example the experts attach a maximum of 5 to their own importance, against an average score
of 1,7 (including the self score). What exactly the problem is, is of course not immediately
clear. It could be that the experts don't know that their expertise is also present with the other
stakeholders, or it could be that the other stakeholders don't know what the experts have to
offer, or ... Again: an assessment is not a exam, but should help the dialogue between
stakeholders.
�
Included is also an overall average score. In can help to interpret the average scores per
stakeholder.
�
In the ideal situation, where the role of every stakeholder is completely clear, we can expect
maximal scores in every cell, and a maximal overall overage of 5. The actual overall average
indicates how far we are from this ideal situation.
�
A comparison can be made between the results for different countries. This could act as a
starting point for learning from each other. If farmer organizations score very high in country
A, and very low in country B, it seems likely that there is something to learn from the
experiences in country A.
�
If the process is a multiyear process, comparisons can be made between the results in the
different years.
page 60
5.2 Quality
The scorings on the quality of the inputs of the stakeholders result in a table like table 2.
Table 2: Assessment quality inputs stakeholders by stakeholders
Nr.
1
2
3
4
5
6
7
Ministry 1 Ministry 2 Local Auth ICPDR
Experts
Farmer Org. Envir. Org.
1
Ministry 1
4
5
3
3
3
1
0
2
Ministry 2
2
4
5
2
4
3
0
3
Local Authorities
3
3.3
3
1.5
1
4
1
4
ICPDR
4
3
3
1
3
3
2
5
Experts
4.5
2
4
2
5
2
0
6
Farmer Organizations 3
3
3
2
2
3
0
7
Environmental Org. 2
1
2
1
1
2
3
Average
3.2
3.0
3.3
1.8
2.7
2.6
0.9
Overall average
2.5
Good
3.5-5.0
Legenda: The cells are colored according to the following scheme:
Reasonable 2.5-3.5
Poor
1.0-2.5
The suggestions for interpretation made under table 1 apply mutatis mutandis also here.
Special attention should be given to 0-scores. A 0-score can indicate that communication is serious
lacking. It can also be the consequence of the fact that the design has not followed the design of the
process. If it were planned for example that Environmental Organizations wouldn't communicate with
the Ministries, than it would seem unjustified to include the 0-scores. On the other hand, given the fact
that Ministry 2 qualified Environmental Organizations as fairly important (4), redesign of the process
seems called for. A figure, like the histogram in figure 2, where the average results per stakeholder
are shown, can facilitate interpretation of the results.
Figure 2: Assessed quality of inputs
5.0
4.0
3.0
2.0
1.0
0.0
1
2
3
4
5
6
7
Legenda: numbers refer to numbers in row 1 of table 2
Indicators for Project Monitoiring and Impact Evaluation
page 61
5.3 Involvement
We have defined involvement as `importance that the stakeholders contributes' times `quality of the
stakeholders' contribution'. In table 3 the results for involvement are shown. The entries in the cells
are the geometric mean of the entries in the corresponding cells in tables 1 and 2. A score of 1 in table
1 and 5 in table 2 give as the geometric mean the square root of (1*5), equals 2.2. The means are are
on the same scale of 1-5.
Table 3: Assessment involvement stakeholders by stakeholders
Nr.
1
2
3
4
5
6
7
Ministry 1 Ministry 2 Local Auth ICPDR
Experts
Farmer Org. Envir. Org.
1
Ministry 1
4.5
3.9
1.7
3.5
1.7
1.4
0.0
2
Ministry 2
2.8
4.0
3.2
2.4
2.0
3.9
0.0
3
Local Authorities
3.9
3.3
3.0
2.4
1.4
4.0
1.0
4
ICPDR
4.5
3.5
3.0
1.4
1.7
3.9
1.4
5
Experts
4.5
2.8
2.0
3.2
5.0
3.2
0.0
6
Farmer Organizations 3.9
3.5
2.4
2.4
1.4
3.9
0.0
7
Environmental Org. 3.2
1.4
2.0
1.0
1.0
3.2
3.5
Average
3.9
3.2
2.5
2.3
2.0
3.3
0.8
Overall average
2.6
Legenda: The cells are colored according to the following scheme:
Good
3.5-5.0
Reasonable 2.5-3.5
Poor
0.0-2.5
Note that taking the geometric mean penalizes heavily lack of communication, resulting in absence of
knowledge of the contribution of a stakeholder. In this example, the Environmental Organizations
scored an average of 2.1 on Importance, and an average of 0.9 on Quality, but get an average of 0.8
on Involvement.
The reason is that not the geometric mean of the averages results in the end score, but the average of
the geometric means of the original scores. For example: the score of 4 for Importance from Ministry
2, multiplied with the 0-score for Quality, results in a 0-score for Involvement. In this way the score of
4 for Importance doesn't carry weight any more in the score for Involvement
In itself this penalization of lack of communication seems to be correct: high quality products that are
not communicated don't contribute in the end. But 0-scores should be carefully analyzed, to see if the
cause of the score lies elsewhere. We refer to the remarks made in paragraphs 4 and 5.3.
The use of table 3 will be different from that of tables 1 and 2. These tables should be of interest for all
stakeholders, whereas table 3, and more specific the row with the averages, will be informative in the
first place for the coordinators of the process. This will be especially the case if the averages for
involvement are looked at in conjunction with the averages for importance and quality (see table 4).
page 62
Table 4: Overview assessment importance, quality and involvement stakeholders by stakeholders
Ministry 1 Ministry 2 Local Auth ICPDR
Experts
Farmer Org. Envir. Org.
Average importance 4.8
3.5
2.0
3.1
1.7
4.4
2.1
Average quality
3.2
3.0
3.3
1.8
2.7
2.6
0.9
Average involvement 3.9
3.2
2.5
2.3
2.0
3.3
0.8
Legenda: The cells are colored according to the following scheme:
Good
3.5-5.0
Reasonable 2.5-3.5
Poor
0.0-2.5
What policy decisions the coordinators should take is of course not immediately clear. Should efforts
be concentrated on improving quality of the most important players, as this will have the biggest
impact on the overall result? Or are the involvement scores of these players, as they are by far the
highest, satisfactory, and should efforts be concentrated on the weakest performers? Is it likely that
stimulation of dialogue and clarification of roles will be an easy way to improve bad results for
importance? Or is it likely that help of experts can improve the scores for quality easily? Or should first
of all the experts be trained to fulfill their tasks in a different way?
Measuring doesn't tell what the right measures to take are � but it surely can help.
6. Conclusion
The example elaborated here is not more than that: an example. Probably it will be necessary to adopt
it from case to case.
It should be kept simple, and oriented towards its goal: to support dialogue and decision-making.
Complex political processes, with a lot of actors, have a reflective character. The opinions of actors
about each other role and contribution, and about what they think others think about them, influence
the process. Clarifying those opinions will stimulate progress.
Complete agreement cannot always be expected. Sometimes the best possible result, as in all political
processes, will be the agreement to disagree.
Indicators for Project Monitoiring and Impact Evaluation
page 63
Annex VIII: Methodology for the assessment of policy implementation
Indicators for
Introduction of Best Agricultural Practices
and
Implementation of the EC Nitrate Directive
1. Introduction
The introduction of Best Agricultural Practices (BAP) in vulnerable areas serves to reduce the nutrient
loads (pressure) from the agricultural sector. In the terminology of GEF, this is stress reduction. In the
WFD terminology, it is Response. Reduction of pressure should lead to a better State, and ultimately to
reduce negative Impact, and to restore the ecosystem.
In this chapter we propose a series of indicators, which could serve both (GEF and WFD) purposes.
At the same time, the indicators can be used to monitor the implementation of the Nitrate Directive of
the EC. In this way, the proposal can also serve as an example for developing series of indicators to
monitor the implementation of other directives.
2.
The Nitrate Directive
The Nitrate Directive of the EC stipulates that all Member States should implement good agricultural
practices. Annexes II and III of the directive describe what good agricultural practices are. Further on,
we will equate BAP with these practices.
The directive contains a number of obligations. We will use these as a guideline for developing
indicators for monitoring the introduction of BAP.
3.
The framework for the indicators
Following the spirit of the Directive, we distinguish the following steps for the introduction of BAP:
1. Designation as vulnerable zones of all known areas, which drain into the waters vulnerable to
pollution.
2. The development of proposals for BAP;
3. The setting up of a programme promoting the application of these code(s), including the
provision of training and information for farmers;
4. The development of action programmes for vulnerable zones;
5. The implementation of the action programmes;
6. The drawing up of monitoring programmes;
7. The implementation of monitoring programmes
8. The bringing into force of the necessary laws, regulations and administrative provisions.
The Directive doesn't in some cases distinguish between drawing up plans and implementing them.
Given the situation in a lot of the countries of the DRP en BSERP, we think the distinction useful.
page 64
4. Methodology
Depending on the character of the step, we propose for each step of the process of introduction of BAP
one or more indicators, which cover the following dimensions:
�
Quantity, e.g. percentage of zones for which proposals for an action programme is developed;
�
Quality, in most cases the measure into which the requirements of Annexes II and III of the
Nitrate Directive are met;
�
Involvement of stakeholders.
It is possible to aggregate these into one. The simplest way to do this is to use the same scale, for
example a scale of 0-5. Some indicators can be scored directly on this scale; others should be
reconverted.
Most scores can be obtained with a quick scan. Moreover, the majority of the indicators follow the
same pattern.
Quantity
In most cases this indicator speaks for itself. If the indicator is a percentage, dividing by 20 gives the
score on a scale of 0-5 (for example, 50% gives a score of 2.5).
Quality
The EEA has developed a system for assessing the performance of the implementation of measures
required by the Nitrate Directive (see Annex 7). Scores are given for 12 different aspects in action
programmes, e.g. Period of prohibition of fertilizer application, Restrictions for application on sloped
soils, etc. Each aspect is scored on a 5-point scale, ranging from 0 (no measure) to 2 (fully satisfactory
measure).
We propose a slightly simplified form to assess the quality of proposals, implementation etc. in the
form of a 3 point scale, ranging from 0 to 5:
0
= absent;
2,5
= in development or partly satisfactory, depending on the context;
5 =
developed or fully satisfactory, depending on the context;
We will refer henceforth to this method as Adapted EEA method
Involvement
Involvement refers to the extent that a stakeholder delivers his necessary contribution. It is the
product of two elements: the extent of necessity, or importance, of the fact that the stakeholder
should contribute, and the quality of the contribution.
Stakeholders, by rating, assess the involvement of stakeholder:
�
The assessed importance of the fact that a stakeholder contributes; scoring is on a scale of 1-5
(1 = not important at all, 5 = very important).
�
The assessed quality of the contribution, including the contribution to the process (e.g.
cooperativeness, and readiness to share information); scoring is on a scale of 0-5 (0 =
contribution unknown, 1 = poor, 5 = good).
For more detailed information we refer to Annex QX, where an example is elaborated.
We will henceforth refer to this method as Assessment by stakeholders
Indicators for Project Monitoiring and Impact Evaluation
page 65
Results
When the scores are known, we end up for each indicator with a box like the following:
Previous
Score
Score Progress
Indicator X:
Development of proposals for BAP
3.0
4.0
33%
quantity :
-
quality
:
adapted
EEA
method
2
.5
3,5
40%
involvement
: assessment by stakeholders 3.5
4,5
29%
There is not a quantity dimension in this indicator, so no score on this dimension. The end score for
the indicator is (3,5+4,5)/2 = 4.0.
We have added, merely as a suggestion, a score for Progress. It is calculated here as the percentage
extra on basis of the previous score. It could be useful to keep track of this. It could also be a more or
less pedagogical instrument to bolster the self-confidence of slow starters: "we started slow, but we
progress fast!". An assessment isn't an exam, but nevertheless it is nice to finish first sometimes!
For suggestions on the presentation we refer to other parts of this report. We suggest that it could be
useful to present also the scorings for progress
5. The
indicators
In this paragraph the indicators are presented. The scoring is always on a scale of 0-5. When Area as
percentage, Adapted EEA method or Assessment by stakeholders are mentioned, the remarks made
under the headings Quantity, Quality and Involvement in paragraph 4 apply.
1. Designation of vulnerable zones
The indicator here is area of actual designated vulnerable zones as a percentage of the potential areas
that could qualify. The percentage can grow, as more zones are designated, or as more potential areas
turn, closer looked at, out not to qualify.
Indicator 1: Designation of vulnerable zones
quantity
: area designated as percentage of potential area
quality
: -
involvement
: -
page 66
2. Proposals for BAP
The development of Establishment of a code for BAP, or the development of proposals for BAP (output
DRP 1.2) has the dimension quality and involvement.
The proposals should cover the items mentioned in Annex 2 of the Nitrate Directive (see Annex 7).
The proposals should be developed in an interactive process, where all the stakeholders are involved.
Indicator 2: Development of proposals for BAP
quantity :
-
quality
: adapted EEA method
involvement
: assessment by stakeholders
3. Programme for promotion of BAP
In the DRP output 1.3 foresees in the establishment of 5 pilot sites for BAP, the
application of BAP by 100 farmers, and the dissemination of the results: at least 1000 farmers should
be aware of the results. These are quantity indicators. We can add the quality dimension: to which
extent are the different items of the code covered in the pilot sites and in the application by the
farmers, and to what extent are farmers aware of these different items? In the last case, the adapted
EEA method probably should be simplified. And we can add in all three cases the involvement
dimension.
Indicator 3: Programme for promotion of BAP
Subindicator 3.1:
Pilot sites
quantity
: number (scale 0-5; 5 = target)
quality
: adapted EEA method
involvement
: assessment by stakeholders
Subindicator 3.2:
Number of farmers applicating BAP
quantity
: number (scale 0-5; 100 = target)
quality
: adapted EEA method
involvement
: assessment by stakeholders
Subindicator 3.1:
Disseminiation
quantity
: number (scale 0-5; 1000 = target)
quality
: adapted EEA method (simplified)
involvement
: assessment by stakeholders
Indicators for Project Monitoiring and Impact Evaluation
page 67
4. Development of action programmes for BAP
With the establishment of action programmes three questions seem to be important:
�
For which part of the designated vulnerable zones action plans are established?
�
To which extent do the plans cover all the elements of BAP?
�
To which extent are the stakeholders involved in the development?
Indicator 4: Development of action programmes for BAP
quantity
: area with programmes in development as % of designated areas
quality
: adapted EEA method
involvement
: assessment by stakeholders
5. Implementation of BAP
With the implementation of BAP four questions are important:
�
In which part of the vulnerable zones implementation has started?
�
What is the quality of the implementation?
�
What is the involvement of the stakeholders?
�
In how far have the loads diminished (in % of the loads at the beginning of implementation)?
The last question should be answered by setting up a careful monitoring system.
Indicator 5: Implementation of BAP
quantity
: area with programmes implemented as % of designated areas
quality
: adapted EEA method
: reduction of loads (scale of 0-5; target to be established)
involvement
: assessment by stakeholders
6. Drawing up monitoring programmes
Again two questions:
�
For which part of the vulnerable zones monitoring programmes are established?
�
What is the quality of the plans?
The second question has two dimensions. The first is the coverage of the different items, for which the
adapted EEA method once again can be used. The second question is to which extent the methods
used meet the technical requirements as laid down Annex IV of the Nitrate Directive. This could be
done by way of a review by an expert, or by peer review.
If different stakeholders would turn out to be important, assessment by stakeholders is also an option.
Indicator 6: Drawing up monitoring programmes
quantity
: area with programmes in development as % of designated areas
quality
: adapted EEA method
: technical quality (0-5; review by expert, or peer review)
involvement
: assessment by stakeholders (optional)
page 68
7. Implementation of monitoring programmes
Again two questions:
�
For which part of the vulnerable zones the implementation of monitoring programmes has
started?
�
What is the quality of the monitoring?
Assessment by stakeholders is optional, depending on the situation.
Indicator 7: Implementation of monitoring programmes
quantity
: area with implemented programmes as % of designated areas
quality
: adapted EEA method
: technical requirements (0-5; review by expert or peer review)
involvement
: assessment by stakeholders (optional)
8. Laws, regulations and administrative provisions.
The adapted EEA method can once again be used to rate the state of affairs regarding Laws,
regulations and administrative provisions. Measuring stakeholder involvement is important; in this case
it seems more suitable not to include the score on this dimension in the end score. Here only the
quality of the product counts.
Indicator 8: Laws, regulations and administrative provisions
quantity :
-
quality
: adapted EEA method
involvement
: assessment by stakeholders (not counting in end score)
6. Conclusion
In this chapter we have presented a series of indicators to monitor the introduction of BAP and the
implementation of the Nitrate Directive. Important characteristics are the distinguishing of the several
dimensions of the indicators, and the fact that for the majority the method used is more or less
identical. We suggest that these characteristics should be kept intact, when series of indicators for
other processes are developed.
Indicators for Project Monitoiring and Impact Evaluation
page 69
Annex IX: Descriptive sheet of EEA Indicator: implementation of the
EU Nitrate Directive (AGRI17)
Indicator Fact Sheet Signals 2002 � Chapter Agriculture
YIR02AG13 - Nitrate Vulnerable Zones and related Action Programmes
Nitrate Vulnerable Zones in the EU
Note: The Commission assessment is based on a (non-exhaustive) review of available information on
waters with excessive nitrate concentrations threatened with eutrophication.
The total area of Nitrate Vulnerable Zones (NVZs), as designated by the Member States
in June 2001, covers currently 38% (1.2 million km2) of the EU 15 area. Based on the EC
assessment, this area should increase to at least 46% (1.5 million km2). Designation and
revision of nitrate vulnerable zones is still in progress in Ireland, Greece, Belgium and UK.
page 70
United Kingdom
Sweden
Finland
Portugal
Austria
Netherlands
Luxemburg
Italy
France
Spain
Greece
Germany
Denmark
Belgium - Wallonie
Belgium - Flanders
0
0,5
1
1,5
2
Adequacy of national Action Plans under the EU Nitrates Directive.
Mean compliance score for 12 aspects of the Action Plans.
0 = unsatisfactory
1 = partly satisfactory
Considerable progress has been made in all Member States in developing action programmes for
nitrate vulnerable zones (except Ireland which until 2001 had not designated any NVZ). However,
none of the action plans fully comply with the obligations that are specified in the `Nitrates Directive'.
Only five countries reach a mean score higher than 1 (partly satisfactory).
Indicators for Project Monitoiring and Impact Evaluation
page 71
Results and assessment
Policy Relevance
Pollution of surface- and groundwater by excess nutrients from agriculture is a major cause of concern
in Europe. In the period 1950-2000 the use of mineral nitrogen increased about tenfold, while total
nitrogen in animal manure rose by about 9 million tons. This input far exceeds the uptake by crops and
vegetation and poses a threat to surface- and groundwater quality. The nitrogen surplus in 1997
ranged from 24 kg/ ha in Portugal to 256 kg/ha in The Netherlands (Eurostat, 2000). Groundwater
aquifers are the source of drinking water for X % of the EU population. Nitrogen input from agricultural
sources is also an important contributor to disturbance of aquatic ecosystems, whether inland or
marine, by eutrophication, leading to a decline in species diversity, coastal algal blooms, impacts on
fish populations etc.
Policy Context
To address the above issue, in 1991 the EU Member States adopted the Council Directive 91/676/EEC
concerning the protection of waters against pollution caused by nitrates from agricultural sources (The
`Nitrates Directive'). This Directive requires Member States to designate nitrate vulnerable zones and
to establish action plans for the minimisation of agricultural nitrate leaching in these zones. These
plans should cover aspects of agricultural nutrient management and application that are particularly
relevant for nitrate leaching. Annexes II and III of the Nitrates Directive spell out the main types of
actions to be taken by the Member States. These include measures such as periods of prohibition of
fertiliser application, restrictions for application of manure on sloped or frozen soils, manure storage,
crop rotation, buffer strips etc (for a list of 12 key actions see Table 1).
Assessment
The first indicator compares the vulnerable zones as actually designated and drafted by the Member
States by June 2001, with the potential areas that would qualify according to a preliminary assessment
by the European Commission (J. Duchemin, 2001).
For the second indicator, scores were given for 12 different aspects in the action programmes of each
Member State for the first Action Plan period (including actions taken up to 1999/2000; except for
Ireland which had no such programme during that period). These scores relate to the Commission
assessment (J. Duchemin, 2001) as follows:
Commission assessment:
Score:
Grim smiley
=
0
(no measure)
Grim + neutral smiley
=
0.5
Neutral smiley
=
1
(partly satisfactory measure)
Neutral and happy smiley
=
1.5
Happy smiley
=
2
(fully satisfactory measure)
page 72
From the individual scores for each assessed type of action a mean was calculated, yielding an average
score between 0 (unsatisfactory) to 2 (fully satisfactory). See Table 1 for a full list of aspects included
in this assessment.
Interpretation
Considerable progress has been made in all Member States in developing action programmes for
nitrate vulnerable zones during the first action plan period (except Ireland which until 2001 had not
designated any NVZ). However, none of the action plans fully comply with the obligations that are
specified in the `Nitrates Directive'. Only five countries reach a mean score higher than 1 (partly
satisfactory). This shows that considerable further action is required to ensure effective protection of
surface and ground waters from agricultural nitrate pollution in a clear majority of EU Member States.
It should be stressed, that the country scores reflect the formal compliance with the Nitrate Directive,
as defined in the preliminary assessment of the European Commission. This interpretation of
obligations is still a matter of discussion with the Member States. Nitrate pollution issues can also be
tackled by measures that fall outside the immediate framework of the Nitrates Directive. Examples of
such approaches are the MINAS programme and the buy-out programme for reducing pig production
capacity in The Netherlands, or the extensive agri-environment measures under Regulation 1257/1999
in Sweden. While such additional measures are not necessarily sufficient to achieve a satisfactory
protection of surface and ground waters from agricultural nitrate pollution, they can also contribute
significantly towards achieving the ultimate objective of the Nitrates Directive.
In general, there appears to be a growing awareness of the urgency to prevent water pollution by the
introduction of more environmentally friendly farming practices and systems. A close interaction
between research activities, government actions, agricultural policy measures and farmers is needed
for successful implementation of instruments to reduce nitrogen inputs in agriculture, improve
agricultural manure management thus decrease the resulting nitrate leaching.
Meta data
Technical information
Data source: J. Duchemin, 2001. Implementation of elements of the Nitrates Directive. European
Commission, DG Environment.
European Commission - DG Environment (2001): Assessment of Action Programmes Established by
Member States. Report by Environmental Resources Management (ERM) to DG Environment
Description of data: Geographical map 1:12 500 000, legend units: Designated zones; Zones drafted
by Member States; Potential Vulnerable zones (EC assessment).
Table: Qualitative adequacy assessment of 12 Action Plan aspects on a 5-point scale (0 - 0,5 � 1 - 1,5
- 2).
Geographical coverage: EU15
Temporal coverage: status as in June 2001
Methodology and frequency of data collection: Preliminary analysis of the European Commission of
Year 2000 Member State reports on the First Action programme (1996-2000) under the Nitrates
Directive. The 2nd Action Programme will be evaluated in 2004.
Methodology of data manipulation: No manipulation for map of NVZs. Table on Action programmes:
Calculation of mean score for each Member State (value 0-2). Bar-graph presentation.
Indicators for Project Monitoiring and Impact Evaluation
page 73
Strength and weakness (at data level): The adequacy scores for the Member State measures under
the Nitrates Directive are based on semi-quantitative criteria that are open to interpretation. The draft
report of the Commission has not yet been fully discussed with the Member States.
Reliability, accuracy, robustness, uncertainty (at data level): subjective adequacy scores.
Overall scoring (give 1 to 3 points: 1=no major problems, 3=major reservations):
�
Relevancy: 1
�
Accuracy: 2
�
Comparability over time: Map = 1; Table = 2
�
Comparability over space: Map = 1; Table = 2
�
Further work required (for data level and indicator level): -
Table 1: Implementation of Measures required in Annexes II + III of the Nitrates Directive by the
Member States in the first Action Programmes for Nitrate Vulnerable Zones. Scores given on the basis
of an assessment carried out by the European Commission.
Measure B-Flan.
B-Wal.
DK
D
EL
E
F
Period of prohibition of fertiliser
/
/
/
/
/
application
1.5
0.5
1.5
0.5
1.0
0.0
0.5
Restrictions for application on sloped
/
/
/
/
/
soils
1.5
0.5
0.5
0.5
0.0
0.0
1.5
Restrictions for application on soaked,
/
/
/
/
frozen or snow-covered soils
2.0
0.5
0.5
2.0
1.5
0.0
1.5
Restrictions for application near water
/
/
/
/
/
courses (buffer strips)
1.5
2.0
0.5
0.5
0.0
0.5
1.5
Effluent storage works
0.0
2.0
0.0
0.0
0.0
0.0
0.0
Capacity of manure storage
/
/
/
/
/
0.5
1.5
2.0
0.5
2.0
1.5
0.5
Rational fertilisation (e.g. splitting
/
/
fertilisation, limitations)
2.0
1.5
2.0
2.0
1.0
1.5
2.0
Crop rotation, permanent crop
/
maintenance
0.0
2.0
0.0
0.5
0.0
0.0
0.0
Vegetation cover in rainy periods,
/
winter
1.0
0.0
2.0
0.0
0.0
0.0
1.5
Fertilisation plans, spreading records
/
/
1.0
0.0
2.0
1.5
0.0
2.0
1.5
Other measures
/
/
/
2.0
2.0
1.5
1.5
1.5
2.0
2.0
Date for application limits:
/
210 / 170 kg N/ha.year
2.0
2.0
2.0
0.5
2.0
2.0
2.0
Total points scored
15
14.5
14.5
10
9
9.5
14.5
Average
score
1.25 1.2 1.2 0.83 0.75 0.79 1.2
page 74
Measure
I LUX
NL
A P FIN
S UK
Period of prohibition of
/
/
/
fertiliser application
0.0
1.0
1.0
0.5
0.5
2.0
1.5
1.0
Restrictions for
/
application on sloped
1.0
0.5
0.0
0.0
2.0
1.0
0.0
0.0
soils
Restrictions for
/
/
/
/
application on soaked,
2.0
1.0
1.0
0.5
1.5
2.0
1.5
1.5
frozen or snow-covered
soils
Restrictions for
/
/
/
/
/
application near water
1.0
0.5
0.5
0.5
1.5
1.5
0.0
1.0
courses (buffer strips)
Effluent storage works
0.0
0.0
0.0
0.0
0.0
2.0
0.0
0.0
Capacity of manure
/
/
/
/
/
storage
1.5
1.5
0.5
0.0
2.0
2.0
1.5
0.5
Rational fertilisation (e.g.
/
splitting fertilisation,
0.0
1.0
1.0
2.0
1.0
2.0
1.0
1.5
limitations)
Crop rotation, permanent
crop maintenance
0.0
0.0
0.0
0.0
0.0
0.0
0.0
2.0
Vegetation cover in rainy
/
/
periods, winter
0.0
0.5
0.5
0.0
2.0
1.0
1.0
2.0
Fertilisation plans,
/
spreading records
0.0
1.5
2.0
2.0
2.0
2.0
0.0
0.0
Other measures
/
1.0
1.5
2.0
1.0
2.0
2.0
2.0
1.0
Date for application
limits:
/
210 kg N/ha.year
1.0
2.0
0.0
2.0
2.0
2.0
0.0
1.5
170 kg N/ha.year
Total
points
scored
7.5 11 8.5 8.5 16.5
19.5
8.5 12
Average
score
0.625
0.92 0.71 0.71 1.375
1.625
0.71 1.0
Updated 2002-05-14