


April 2007
RIVER BASIN MANAGEMENT TOOLS:
INTERCALIBRATION
Technical Implementation and Communication of
the WFD Intercalibration Exercise in the Danube
River Basin

AUTHOR
Dipl.-Umweltwiss. Sebastian Birk (environmental scientist)
Department of Applied Zoology/Hydrobiology
University of Duisburg-Essen
Essen, Germany
Implementation and communication of the WFD intercalibration exercise in the DRB
page 3
TABLE OF CONTENTS
1. INTRODUCTION
7
2. TECHNICAL IMPLEMENTATION OF THE WFD INTERCALIBRATION EXERCISE IN THE
8
DANUBE RIVER BASIN
3. COMMUNICATION OF THE WFD INTERCALIBRATION EXERCISE IN THE DANUBE RIVER
11
BASIN
4. OVERVIEW OF RIVER TYPES, REFERENCE CONDITIONS AND WATER BODIES IN THE
13
TISZA RIVER BASIN
5. DISCUSSION AND OUTLOOK
15
LIST OF TABLES
Table 1: National assessment methods
8
Table 2: Common intercalibration types of the Eastern Continental GIG
8
Table 3: Overview of attended meetings and workshops
9
LIST OF ANNEXES
ANNEX 1: Milestone 6 Report of the Eastern Continental GIG to the European
Commission
19
ANNEX 2: Check list of WFD compliant biological assessment methods
73
ANNEX 3: Communication paper on general principles, aims and methods of the WFD
intercalibration exercise
79
ANNEX 4: Contribution to the Tisza River Basin Management Plan 2009: "River types,
reference conditions and water bodies in the TRB"
87
UNDP/GEF DANUBE REGIONAL PROJECT
page 4
ABBREVIATIONS
CIS
WFD Common Implementation Strategy
DRB
Danube River Basin
EC GIG
Eastern Continental Geographical Intercalibration Group
ECOSTAT
CIS Working Group on Ecological Status and Intercalibration
EU European
Union
IC Intercalibration
MA EG
Monitoring and Assessment Expert Group
RBM EG
River Basin Management Expert Group
WFD Water
Framework
Directive
ACKNOWLEDGEMENTS
The author is grateful to Birgit Vogel, Igor Liska, Philip Weller, Peter Whalley, Ivan Zavadski,
Sylvia Koch and Viennelyn Baba for their kind support.
SEBASTIAN BIRK UNIVERSITY OF DUISBURG-ESSEN
Implementation and communication of the WFD intercalibration exercise in the DRB
page 5
EXECUTIVE SUMMARY
Outcomes of this assignment include the three main tasks: Technical implementation of the
WFD intercalibration exercise in the Danube River Basin, Communication of the WFD
intercalibration exercise and Overview of river types, reference conditions and water bodies in
the Tisza River Basin.
The technical implementation of the WFD intercalibration exercise in the Danube River Basin
comprised the comparison and harmonisation of national assessment methods for benthic
macroinvertebrates of six countries participating in the Eastern Continental GIG: Austria,
Bulgaria, Czech Republic, Hungary, Romania and Slovak Republic. The intercalibration of
national assessment methods was carried out for five common intercalibration stream types.
Methods and results of the exercise are presented in the Milestone 6 Report addressed to the
European Commission.
Intercalibration of Austrian and Slovak river assessment methods using macrophytes and
phytobenthos are currently in progress. Results are expected by mid June 2007.
For the intercalibration to be a transparent exercise both the technical process of boundary
setting and the outcome of the exercise (the final "good ecological status" for biological quality
elements) should be properly informed. A "communication paper" provides clear information
about general objectives, principles and methods of the WFD intercalibration exercise and its
implication for the national water quality monitoring.
Within the assignment information about national river typologies, reference conditions and
water bodies were collected from the Ukrainian, Romanian, Hungarian, Slovakian and Serbian
parts of the Tisza catchment. Data were evaluated concerning type characteristics, design of
reference conditions and share of water bodies. Results were compiled in an overview report
contributing to the Tisza River Basin Management Plan.
This work assignment was in support of the overall intercalibration process carried out by the
EU Member States and the European Commission. Intercalibration is an ongoing process beyond
the duration of this contract. Therefore, several upcoming tasks can not be fulfilled within this
mission. Among these are intercalibration of national assessment methods currently under
development, further biological quality elements and intercalibration types.
UNDP/GEF DANUBE REGIONAL PROJECT
Introduction
page 6
1. INTRODUCTION
A main environmental objective of the EU Water Framework Directive (WFD) is to achieve "good
ecological status" of all surface waters in the European Union by the year 2015. Status
monitoring of water bodies is done by individual Member States using methods for biological
quality assessment. Comparability of monitoring results is ensured by means of the
intercalibration exercise.
The intercalibration exercise is a legally binding demand of the WFD. European Member States
are obliged to compare the results of biological assessment for rivers, lakes, transitional and
coastal waters. For rivers, methods using macrophytes and phytobenthos, benthic
invertebrates, and fish fauna are currently intercalibrated. Activities are carried out among
countries sharing common stream types in similar biogeographical regions. The aim of the
process is to ensure consistency in quality classification despite the diverse assessment
methods countries are applying.
The work undertaken in this project assisted the ICPDR's River Basin Monitoring and
Assessment Expert Group (MA EG) with intercalibration in the Eastern Continental Geographical
Intercalibration Group (EC GIG). This assignment supported two activities (River Basin
Management Tools and MA EG support) within the UNDP/GEF Danube Regional Project's
Objective 1 (Creation of sustainable ecological conditions for land and water management) and
Objective 2 (Capacity building and reinforcement of transboundary co-operation for the
improvement of water quality and environmental standards in the DRB).
In this report the principal project outcomes are summarised in the three chapters: Technical
implementation of the WFD intercalibration exercise in the Danube River Basin, Communication
of the WFD intercalibration exercise and Overview of river types, reference conditions and water
bodies in the Tisza River Basin. For each part the main deliverables are annexed to this report.
This work assignment was in support of the overall intercalibration process carried out by the
EU Member States and the European Commission. Intercalibration is an ongoing process beyond
the duration of this contract. Therefore, several upcoming tasks can not be fulfilled within this
mission. Among these are intercalibration of national assessment methods currently under
development, further biological quality elements and intercalibration types.
SEBASTIAN BIRK UNIVERSITY OF DUISBURG-ESSEN
Implementation and communication of the WFD intercalibration exercise in the DRB
page 7
2. TECHNICAL IMPLEMENTATION OF THE WFD
INTERCALIBRATION EXERCISE IN THE DANUBE RIVER
BASIN
The technical implementation of the WFD intercalibration exercise in the Danube River Basin
comprised the comparison and harmonisation of national assessment methods for benthic
macroinvertebrates of countries participating in the Eastern Continental GIG: Austria, Bulgaria,
Czech Republic, Hungary, Romania and Slovak Republic (Table 1). The intercalibration of
national assessment methods was carried out for five common intercalibration stream types
(Table 2).
Table 1: National assessment methods
country
name
category
Austria
Austrian System for Ecological River Status Assessment
Multimetric Index
Bulgaria
Bulgarian Biotic Index for River Quality Assessment (Q-Scheme)
Biotic Index
Czech Republic
Czech Saprobic Index following Zelinka & Marvan (1961)
Saprobic Index
Hungary
Hungarian Average Score Per Taxon
Biotic Index
Romania
Romanian Saprobic Index following Pantle & Buck (1955)
Saprobic Index
Slovak Republic
Slovak System for Ecological River Status Assessment
Multimetric Index
Table 2: Common intercalibration types of the Eastern Continental GIG
abbreviation
type-name
ecoregion
catchment
altitude
geology
substrate
Carpathians: small to medium,
gravel and
R-E1
10
10 - 1000
500 - 800
siliceous
mid-altitude
boulder
R-E2
Plains: medium-sized, lowland
11 and 12
100 - 1000
< 200
mixed
sand and silt
Plains: large and very large,
sand, silt and
R-E3
11 and 12
> 1000
< 200
mixed
lowland
gravel
Plains: medium-sized, mid-
sand and
R-E4
11 and 12
100 - 1000
200-500
mixed
altitude
gravel
Danube River: middle and
gravel and
R-E6
11 and 12
> 131000
< 134
mixed
downstream
sand
Within the intercalibration exercise the definition of reference conditions is of major importance
for the comparison of national quality assessment methods. In this regard, two problems were
obvious in the EC GIG: Either existing reference sites were not available (esp. lowland types) or
reference criteria to screen for existing reference sites differed among countries. The EC GIG
therefore agreed to follow an alternative approach to resolve these issues by defining IC type
specific, harmonised quality criteria. In general, common high-good resp. good-moderate
quality class boundaries were set for the national biological assessment methods using existing
data assembled within the EC GIG intercalibration exercise. The main idea was to overcome the
difficulties of lacking (near-natural) references by defining an alternative reference, i.e. common
agreement on a certain level of impairment.
The main tasks carried out within the project assignment were collection of national data,
setting up and administration of a central database, elaboration of a conceptual framework,
analysis of data and proposal of harmonised quality class boundaries of national assessment
methods. Furthermore, the work included presentation and extensive discussion of the
UNDP/GEF DANUBE REGIONAL PROJECT
page 8
intercalibration approach and results with national experts, and communication of the results to
coordinating bodies at DRB and EU level (Table 3).
Table 3: Overview of attended meetings and workshops
No occasion
from (date)
to (date)
venue
country
1
EC GIG preparatory meeting 18.04.2005
18.04.2005
Vienna
Austria
2
EC GIG meeting
23.05.2005
24.05.2005
Bratislava
Slovakia
3
EC GIG preparatory meeting 05.09.2005
05.09.2005
Vienna
Austria
4
EC GIG meeting
12.09.2005
13.09.2005
Sofia
Bulgaria
5 EU
Enlargement
Workshop 09.01.2006
09.01.2006
Bucharest
Romania
6
EC GIG meeting
10.01.2006
11.01.2006
Bucharest
Romania
7
MA EG meeting
02.03.2006
03.03.2006
Prague
Czech Republic
8
EC GIG meeting
19.04.2006
20.04.2006
Budapest
Hungary
9 ECOSTAT
meeting
03.07.2006
04.07.2006
Stresa
Italy
10 EC GIG meeting
04.09.2006
04.09.2006
Vienna
Austria
11 RBM EG meeting
10.10.2006
10.10.2006
Chisinau
Moldova
12 ICPDR
workshop
11.10.2006
11.10.2006
Chisinau
Moldova
13 ICPDR
workshop
09.11.2006
10.11.2006
Kiev
Ukraine
14 Rivers IC workshop
04.12.2006
05.12.2006
Ispra
Italy
15 MA EG meeting
01.02.2007
02.02.2007
Vienna
Austria
16 EC GIG meeting
11.04.2007
12.04.2007
Vienna
Austria
Details on methods and results of the EC GIG intercalibration exercise are explained in the
Milestone 6 report that is included as ANNEX 1 to this report. Moreover, ANNEX 2 includes a
check list for WFD compliant biological assessment methods as a guideline for DRB countries.
SEBASTIAN BIRK UNIVERSITY OF DUISBURG-ESSEN
Implementation and communication of the WFD intercalibration exercise in the DRB
page 9
3. COMMUNICATION OF THE WFD INTERCALIBRATION
EXERCISE IN THE DANUBE RIVER BASIN
According to ECOSTAT1 the communication of the intercalibration exercise has been identified as
an issue of concern. On one hand, the intercalibration is an unprecedented highly technical and
complex task. On the other, its outcome is seen as a crucial step towards enabling the
achievement of the environmental objectives of the WFD to be assessed, and therefore it is
seen as politically relevant. Several stakeholders have raised their concerns about the on-going
work, showing misunderstandings about the process, the role of the intercalibration register and
the expected outcome.
For the intercalibration to be a transparent exercise both the technical process of boundary
setting and the outcome of the exercise (the final "good ecological status" for biological quality
elements) should be properly informed. The publication of the following elements is considered
crucial to provide a complete overview of the intercalibration:
- On the general objectives, principles and methods of the WFD intercalibration exercise and
its implication for the national water quality monitoring.
- On the technical process, the filled boundary setting protocol explaining how the boundaries
have been identified and the dataset or datasets that have been used.
- On the outcome of the exercise, the national methods that have been intercalibrated, the
final boundaries, a selection of sites to illustrate those, and biological and pressure data for
each site.
Within this project task a "communication paper" on general principles, aims and methods of
the WFD intercalibration exercise has been prepared (ANNEX 3).
1 Heiskanen, A.-S., U. Irmer, J. Rodriguez-Romero, D. Jowett, S. Poikane, P. Pollard & W. van de Bund,
2005. Improving the communication of the intercalibration exercise. 19 October 2005.
UNDP/GEF DANUBE REGIONAL PROJECT
"Table of harmonisation" - comparative tables of national stream types in the DRBD
page 10
4. OVERVIEW OF RIVER TYPES, REFERENCE CONDITIONS
AND WATER BODIES IN THE TISZA RIVER BASIN
Within the assignment information about national river typologies, reference conditions and
water bodies were collected from the Ukrainian, Romanian, Hungarian, Slovakian and Serbian
parts of the Tisza catchment. Data were evaluated concerning type characteristics, design of
reference conditions and share of water bodies. Results were compiled in an overview report
(ANNEX 4) contributing to the Tisza River Basin Management Plan.
SEBASTIAN BIRK UNIVERSITY OF DUISBURG-ESSEN
Implementation and communication of the WFD intercalibration exercise in the DRB
page 11
5. DISCUSSION AND OUTLOOK
The intercalibration forms an obligatory step in the implementation of the WFD. Furthermore, it
represents a platform for a pan-European dialogue on environmental objectives and the quality
assessment of ecological surface water status. The WFD stipulated both the finalisation of the
intercalibration exercise and the start of national quality monitoring programmes by end of
2006. Due to this tight schedule national development of assessment methods and international
comparison of quality class boundaries currently run in parallel.
The intercalibration of methods using benthic macroinvertebrates in rivers holds a leading role
in the overall technical implementation. These methods have a long tradition in European water
quality assessment and are thus based on sound principles, validated techniques and a large
quantity of existing data. For other Biological Quality Elements (phytoplankton, macrophytes
and phytobenthos, fish fauna) or water categories (lakes, transitional and coastal waters)
intercalibration enables international cooperation in the early stages of method development,
aiming at harmonised definition of good ecological status. Nevertheless, the intercalibration
process itself still allows for tailor-made assessment methods satisfying the individual needs of
the Member States.
With regard to the EC GIG intercalibration is only partly finalised. Many countries are
currently lacking WFD compliant biological assessment methods. In addition, data availability on
certain Biological Quality Elements (phytoplankton, macrophytes and phytobenthos, fish fauna)
is generally scarce. In this project the formal - and legally binding - completion of
intercalibration has only been achieved for the invertebrate-based river assessment methods of
Austria and Slovak Republic. Intercalibration of macrophytic and phytobenthic methods between
these countries is in progress with results expected by mid June 2007. However, the
intercalibration approach developed within this assignment allows for future integration of
additional Member States as soon as national methods and appropriate data are available.
In European water policy the entire intercalibration process represents a thematic and
organisational novelty. Its extension to end of 2007 is decided in order to ensure proper
fulfilment. Furthermore, it is considered to start a second round of intercalibration beyond 2007
to overcome current difficulties such as data gaps and lacking assessment methods.
UNDP/GEF DANUBE REGIONAL PROJECT
Implementation and communication of the WFD intercalibration exercise in the DRB Annexes
page 13
ANNEXES
ANNEX 1
Milestone 6 Report of the Eastern Continental GIG to the European
Commission
ANNEX 2
Check list of WFD compliant biological assessment methods
ANNEX 3
Communication paper on general principles, aims and methods of the
WFD intercalibration exercise
ANNEX 4
Contribution to the Tisza River Basin Management Plan 2009: "River
types, reference conditions and water bodies in the TRB"
UNDP/GEF DANUBE REGIONAL PROJECT
Implementation and communication of the WFD intercalibration exercise in the DRB Annexes
page 15
ANNEX 1
MILESTONE 6 REPORT OF THE EASTERN
CONTINENTAL GIG TO THE EUROPEAN
COMMISSION
UNDP/GEF DANUBE REGIONAL PROJECT
page 16
EUROPEAN COMMISSION
DIRECTORATE GENERAL JRC
JOINT RESEARCH CENTRE
Institute of Environment and Sustainability
Milestone 6 Report River GIGs
GIG
Eastern Continental
Information
Birgit Vogel (ICPDR) and
provided by
Sebastian Birk
A General approach
1. Describe the common intercalibration types, specifying the countries participating for each
type and the biological quality elements/ pressures that are intercalibrated (update `types
manual' tables)
The Eastern Continental Geographical Intercalibration Group (EC GIG) includes the following
countries: Austria (AT), Bulgaria (BG), Czech Republic (CZ), Hungary (HU), Slovak Republic
(SK) and Romania (RO). In this GIG five common intercalibration types were defined based on
the typological factors ecoregion, catchment area, altitude, geology and channel substrate
(see table below).
tbl_common-ic-type
IC type
IC type
IC type
IC type
IC type
IC type
participating
IC type name
abbrev.
ecoregion catchment
altitude
geology
substrate
countries
Carpathians: small to
gravel and
R-E1
10
10 - 1000
500 - 800 siliceous
CZ, SK, HU, RO
medium, mid-altitude
boulder
Plains: medium-sized,
R-E2
11 and 12
100 - 1000
< 200
mixed
sand and silt RO, SK, HU
lowland
Plains: large and very
sand, silt and
R-E3
11 and 12
> 1000
< 200
mixed
BG, HU
large, lowland
gravel
Plains: medium-sized,
sand and
R-E4
11 and 12
100 - 1000
200-500
mixed
AT, HU, SK, RO
mid-altitude
gravel
Danube River: middle
gravel and
AT, SK, HU,
R-E6
11 and 12
> 131000
< 134
mixed
and downstream
sand
RO, BG
SEBASTIAN BIRK UNIVERSITY OF DUISBURG-ESSEN
Implementation and communication of the WFD intercalibration exercise in the DRB Annexes
page 17
Within the EC GIG intercalibration exercise national assessment methods using benthic
invertebrates are intercalibrated. The exercise includes the pressures: organic pollution,
general and hydromorphological degradation.
The following table specifies the number of sites involved in intercalibration exercise per
intercalibration type (except R-E6) and country.
The intercalibration of type R-E6 (Danube River) was performed between the countries
Austria, Bulgaria, Hungary, Slovak Republic and Romania.
IC type
AT
BG
CZ
HU
RO
SK
R-E1
-
-
12
18
52
39
R-E2
-
-
-
95
24
11
R-E3
-
32
-
189
-
-
R-E4
46
-
-
43
18
18
2. Describe the general intercalibration approach
- Approach for comparison (e.g. ICMi using common reference criteria), including
statistical procedures
- Approach for harmonisation (if applicable, e.g. use of common benchmark)
- Specify which data was used to set the boundaries applying the BSP (e.g. common
benchmark data [option 2], all MS data [option 3]
R-E1, 2, 3, 4:
Within the intercalibration exercise the definition of reference conditions is of major
importance for the comparison of national quality assessment methods. In this regard, two
problems became obvious in the EC GIG:
o Either existing reference site are not available (esp. for lowland river types) or
o reference criteria to screen for existing reference sites differ among countries.
Therefore, the EC GIG agreed to follow an alternative approach to resolve these issues by
defining IC type specific, harmonised quality criteria. In general, the GIG set common high-
good resp. good-moderate quality class boundaries for the national biological assessment
methods using existing data assembled within the EC GIG intercalibration exercise. The main
idea of using this approach is to overcome the difficulties of lacking (near-natural) references
by defining an alternative reference, i.e. common agreement on a certain level of impairment
specified by threshold values of selected biotic and abiotic criteria.
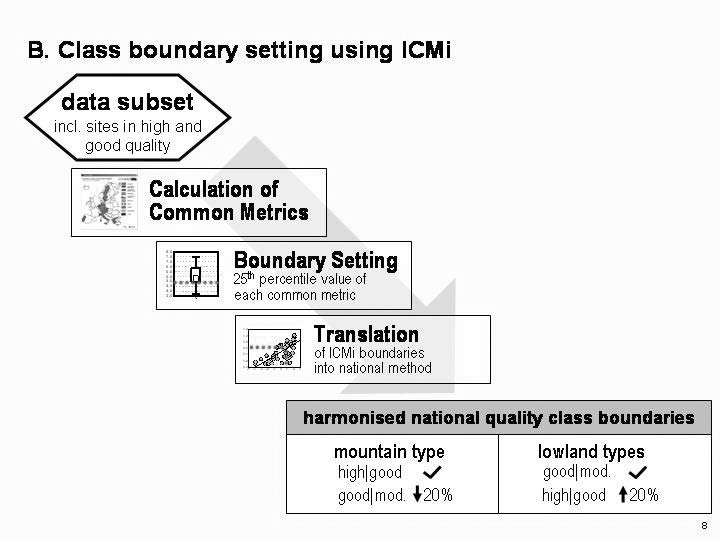
This practical approach comprises two steps, which are also described in detail:
A.
Harmonised definition of quality criteria/thresholds for the high and good
ecological
status
B. Class boundary setting based on 25th percentile value of common metrics using all
sampling sites meeting the criteria defined in section A
A. Harmonised definition of quality criteria/thresholds for the high and good ecological
status
Based on criteria for saprobiological quality - commonly agreed for monitoring purposes in the
UNDP/GEF DANUBE REGIONAL PROJECT
page 18
Danube River Basin - biological threshold values are derived using the common metric ASPT
(Average Score Per Taxon). Sites with samples showing ASPT values above these thresholds
are screened by additional chemical, morphological and land use parameters. The set of sites
complying with all criteria/thresholds are regarded as of being in a commonly agreed,
ecologically high resp. high and good status.
B. Class boundary setting based on 25th percentile value of common metrics using all sampling
sites meeting the criteria defined in section A
The ecological quality class boundaries are expressed in ICMi-EC scale (see MS6 report Part C)
to comply with the normative definitions of the WFD. These boundaries are derived by
selecting the 25th percentile values of each common metric from the set of sites in high resp.
high and good status. By means of regression analysis the boundary values are translated into
values of the national assessment method.
See Annex C for a more detailed description of the approach.
SEBASTIAN BIRK UNIVERSITY OF DUISBURG-ESSEN
Implementation and communication of the WFD intercalibration exercise in the DRB Annexes
page 19
Additional specification for R-E1: Common reference criteria have been established and
applied to sites of the intercalibration type R-E1 (see MS6 report Part B). The results of the
screening procedure were used to validate the intercalibration approach (especially the
harmonised class boundary setting procedure) that was chosen by the EC GIG for
intercalibration (as specified above). See Annex C for results of the validation procedure.
R-E6 (Danube River):
Biological assessment of the Danube River on the basis of the benthic macroinvertebrate
community is limited to the application of Saprobic Systems or Biotic Indices to evaluate the
degree of organic water pollution. Currently, no WFD compliant classification method to assess
the ecological status of the Danube River using benthic macroinvertebrates is applied by the
EC GIG countries. Therefore, the intercalibration exercise performed for the Danube River (R-
E6) focused on the comparison of national methods used in regular water quality monitoring of
the Danube River. Results of this intercalibration exercise are presented in Annex D.
UNDP/GEF DANUBE REGIONAL PROJECT
page 20
3. Identify the national methods that were intercalibrated (for all countries, if available);
provide detailed description in Annex A
Except for Austria and the Slovak Republic none of the other countries in the EC GIG hold
biological assessment methods that are fully compliant with the requirements of the EU-
WFD. WFD compliant methods are currently being developed in those countries. Therefore,
intercalibration of EQR class boundary values was only fully completed for the methods of
Austria and Slovak Republic. The results of the intercalibration exercise for these two
assessment methods are listed in MS6 Report Part E. However, the IC exercise was also
performed for the non-WFD compliant methods. These results including intercalibrated
boundary values are described in Annex C.
The following table presents the methods used in the intercalibration exercise.
country
name
category
WFD compliant
Slovak System for Ecological
Austria1
Multimetric Index
yes
River Status Assessment
Austrian System for Ecological
Slovak Republic1
Multimetric Index
yes
River Status Assessment
Czech Saprobic Index following
Czech Republic
Saprobic Index
no
Zelinka & Marvan (1961)
Hungarian Average Score Per
Hungary
Biotic Index
no
Taxon
Romanian Saprobic Index
Romania
Saprobic Index
no
following Pantle & Buck (1955)
Bulgarian Biotic Index for River
Bulgaria
Biotic Index
no
Quality Assessment (Q-Scheme)
1 For the intercalibration of R-E6 the national Saprobic Indices were used instead of the
methods listed in this table.
B Setting of Reference conditions
Summarize the common approach for setting of reference conditions. Give a more detailed
description of procedure and criteria, and identify reference sites for each country and type
according to those criteria in Annex B
Reference sites were chosen by the GIG countries using the REFCOND guidance. Following
the work done in the Central-Baltic GIG, a list of more detailed criteria and type-specific
concentrations of key chemical parameters were agreed by the EC GIG. Countries were
asked to screen selected reference sites against agreed chemical, hydromorphological and
catchment landuse threshold limits. Countries were also asked to complete a check list to
SEBASTIAN BIRK UNIVERSITY OF DUISBURG-ESSEN
Implementation and communication of the WFD intercalibration exercise in the DRB Annexes
page 21
indicate which reference criteria - defined in the GIG - were used for the screening exercise.
An overview of the criteria and the number of sites complying with the criteria are given in
Annex B.
Note: Reference sites were described for the common stream type R-E1. For all other IC
types, reference sites are currently not available.
The table below shows the number of R-E1 reference sites identified for the different
countries:
country
number of reference sites
number of samples at reference sites
CZ 3
10
HU 16
41
RO 20
42
SK 22
48
C Setting of Boundaries
1. Summarize how boundaries were set following the framework of the BSP for the HG
and GM boundaries, demonstrating that this was done in accordance to WFD Annex V,
normative definitions
a. For the benchmark (if applicable)
b. For the national methods (obligatory if no benchmark is used; also
recommended if benchmark is used);
Provide a descritption of the full procedure in Annex C
The EC GIG realizes that methods used by the GIG countries differ in compliance and state
of development in relation to WFD normative definitions. The GIG therefore agreed on the
construction of a common metric (Intercalibration Common Metric index (ICMi)) which is
intrinsically compliant with the normative definitions so that the countries' data can be
converted to ICMi.
The ICMi-EC developed for the Eastern Continental GIG consists of four common metrics
combined to a common multimetric index by using the average of normalised metric values.
The following table specifies the common metrics, WFD indicative parameters addressed and
pressures indicated (based on pressure analysis of EC GIG dataset):
Common Metric
WFD indicative parameter
Indicated Pressure
Average Score Per
Organic Pollution, General
Sensitive Taxa
Taxon (ASPT)
Degradation
Austrian Structure Index
Structural and General
Sensitive Taxa
(family level)
Degradation
Total Number of Families Taxonomic composition, diversity
General Degradation
Taxonomic composition, abundance,
Organic Pollution, Structural and
[%] EPT Abundance
major taxonomic groups
General Degradation
UNDP/GEF DANUBE REGIONAL PROJECT
page 22
Class boundaries were set in terms of ICMi values derived from data-subsets complying
with the criteria for a certain quality status. These criteria cover various aspects of human
impacts on rivers including general and structural degradation and organic pollution. More
details on the boundary setting procedure are given in Annex C.
2. Point out where the data underlying the analysis is available (e.g. through EEWAI
CIRCA or other)
Data will be made available on DANUBIS, the database of the International Commission
for the Protection of the Danube River (ICPDR), which is coordinating the work of the EC
GIG. The database is accessible via the Internet.
D Results of comparison and harmonisation of boundaries between countries
1. Present the results of the comparison demonstrating comparability of class boundaries
between the countries within the GIG for all types (if applicable)
In the Eastern Continenal GIG harmonised class boundaries were defined within a GIG-wide
agreed framework. The GIG decided that national class boundaries will be adjusted
according to the results of the intercalibration analysis. Therefore, national class boundaries
were not compared between countries but against the boundary values obtained in the
intercalibration analysis. These boundaries are presented in MS6 part E.
2. Point out where the data underlying the analysis is available (e.g. through EEWAI CIRCA or
other)
Data will be made available on DANUBIS, the database of the ICPDR accessible via the
Internet.
E Boundary EQR values
Provide a table with HG and GM boundary EQR values for the national methods and the
common metrics (where applicable) for each type as a table
The table below presents the results of the EC GIG intercalibration exercise for the
national assessment methods of Austria and Slovak Republic (WFD compliant) regarding
the common intercalibration types R-E1, R-E2 and R-E4. Results of further country/type
combinations (based on non-WFD compliant methods) are described in Annex C.
Boundary values of the national methods have been derived using common metric values
of data subsets complying with criteria defined for high ecological status sites (R-E1), and
high and good ecological status sites (R-E2 and R-E4; see Annex C). Therefore, EQR
values for the common metrics (as relative deviation from reference state) do not apply.
Confidence intervals are specified as the 5 percent deviation from the respective boundary
value.
SEBASTIAN BIRK UNIVERSITY OF DUISBURG-ESSEN
Implementation and communication of the WFD intercalibration exercise in the DRB Annexes
page 23
common
country
boundary type boundary value confidence limit
stream type
common
high
-good 0,74
lower
0,69
uppe
0,79r
stream ty
R-E1
pe
Slovak
Republic good-moderate 0,54 0,49 0,59
high-good 0,74
0,69 0,79
R-E2 Slovak
Republic good-moderate 0,54 0,49 0,59
high-good 0,72
0,67 0,77
good-moderate 0,52 0,47 0,57
high-good 0,79
0,74 0,84
good-moderate 0,59 0,54 0,64
F Indicative work plan for the continuation of the intercalibration
Indicate plans and appropriate timing for continuation of the intercalibration for types and
quality elements not currently included
The intercalibration exercise performed within the Eastern Continental GIG and co-ordinated
by the ICPDR PS addresses exclusively the biological quality element (BQE)
macroinvertebrates. This results from the fact that data availability for the other BQEs within
the Danube River Basin is currently scarce. However, as Austria and Slovakia are already
using WFD compliant methods and do have data on macrophytes as well as on phytobenthos
available, the intercalibration of these two parameters will be performed and additionally
reported by June 2007.
The analysis of the EC GIG are primarily based on data which have not been assessed with
WFD compliant methods - only AT and SK are currently using WFD compliant methods
whereas the other countries are developing their methods. Due to this fact most of the
analysis' results are part of this report's Annex C. As soon as data based on WFD compliant
methods - will be available the analysis will be improved. This improvement will very likely be
performed by the end of 2008 and can further be included in the updated version of the
Technical IC Report (JRC) by 2011 (see Draft Mandate of Working Group A/ECOSTAT).
Regarding the continuation of the intercalibration exercise within the EC GIG the following
issues will be addressed:
o Filling of existing data (see Annex C) by June 2007.
o Intercalibration using the other BQEs: Improvement related to information on other BQEs is
expected during the upcoming years. Increasing data sets will be available from
assessments of the WFD compliant monitoring networks (by mid 2008) and should be used
for the improvement of the intercalibration exercise results.
o The intecalibration between AT and SK regarding the BQEs macrophytes and
phytobenthos will be performed by and reported by June 2007.
o Improvement of the intercalibration analysis for the types RE-2, 3 and 4: Currently an
adapted approach had to be chosen due to the lack of reference sites. Further, not all
countries are using WFD compliant sampling/assessment methods. The integration of
expected results from the WFD compliant monitoring networks will be integrated.
o Intercalibration of type RE-6 (Danube River): The results regarding the intercalibration of
the Danube River (Type RE-6) have to be considered preliminary and will have to be revised.
The ICPDR is organising Joint Danube Survey2 (JDS2), which will be performed during
summer 2007. All BQEs will be addressed, sampled and assessed using WFD compliant
methods for the entire Danube River and the main tributaries. The results of this
homogenous data set will be used to supplement the current intercalibration of the Danube
UNDP/GEF DANUBE REGIONAL PROJECT
page 24
River. The improvement of the current IC results should be improved by mid/end 2008.
The ICPDR and therefore the countries of the Eastern Continental GIG intend to continue the
intercalibration exercise after 2006 and will soon discuss and develop a relevant
workprogramme (end of 2006).
The above-mentioned issues should be the objectives of this continued intercalibration
exercise. The inclusion of additional countries of the Eastern Continental Region (currently only
the EU MS (AT, HU, SK, CZ) and EU Accession Countries (BG, RO) are participating) is
intended.
E Comments and remarks
none
Annexes
Annex A:
Description of national classification methods included in the intercalibration;
please provide the reference to the method, the status of the method (officially accepted,
finalized, under development), describe the metrics and approach.
Annex B:
Reference criteria and reference sites
Annex C:
Class boundary setting procedure (including results using non-WFD compliant
methods)
Annex D:
Intercalibration of the Danube River (R-E6)
SEBASTIAN BIRK UNIVERSITY OF DUISBURG-ESSEN
Implementation and communication of the WFD intercalibration exercise in the DRB Annexes
page 25
Index of Annexes
Annex A:
Description of national classification methods
Annex B:
Reference criteria and reference sites (electronically attached excel file)
Annex C:
Class boundary setting procedure and intercalibration results of types
based on non-WFD compliant methods
Annex D:
Intercalibration of the Danube River (R-E6)
UNDP/GEF DANUBE REGIONAL PROJECT
page 26
ANNEX A
Description of national classification methods
included in the IC exercise
SEBASTIAN BIRK UNIVERSITY OF DUISBURG-ESSEN
Implementation and communication of the WFD intercalibration exercise in the DRB Annexes
page 27
ANNEX A1: WFD COMPLIANT National Method - AUSTRIA
Country
AT
Classification System:
Austrian Quality Assessment System
General Description
Selection of reference sites according to REFCOND Guidance, National Strategy paper ("Criteria for the
identification of potential reference sites") and criteria used by AQEM/STAR.
The Austrian classification scheme consists of three modules (figure 1):
1. Module "Organic Pollution" (Saprobic Index in relation to stream type specific reference value)
2. Module "General Degradation" consisting of two sub-modules (2 multimetric indices)
3. Module "acidification" index (Braukmann & Biss, 2004; applied only in bioregions at risk of acidification)
Metrics used for the multimetric indices are standardised in relation to the 95th percentile of metric values under
stream type specific reference conditions. These standardized values are termed as "scores". Indices are
calculated by averaging these scores.
The benchmark value between reference (High) and good status conditions is defined as the 25th percentile of
index values under reference conditions and set to a value of 0.8. That means, observed index values are divided
by the benchmark value and multiplied by 0.8. Values > 1 are set to 1.
Class boundaries for the ecological quality classes are defined as follows:
Quality Class 1: 0.8
Quality Class 2: 0.6 < 0.8
Quality Class 3: 0.4 < 0.6
Quality Class 2: 0.2 < 0.4
Quality Class 2: < 0.2
UNDP/GEF DANUBE REGIONAL PROJECT
page 28
The Final Ecological Quality Class is determined by the worst case applying all relevant modules.
Mo
M dul Or
O ganic P
o
P llut
u ion
Saprob
r
ic
i In
I dex (Z
dex ( e
Z liln
i ka & Ma
M rv
r an)
Mo
M dul Ge
l G neral D
l e
D grada
d tion
Ma
M in F
n ocus
cu : ,,Div
D ersity / Rh
R it
h hr
h alis
al ation"
ion
# Total
t Taxa
# EPT-T
- axa
Multitme
m tric
Diver
i
si
ver t
si y
t In
I dex (
dex M
( ar
M g
ar ale
l f)
f
Ind
In ex I
x
Degrad
r
ati
at o
i n - In
I dex
wors
r t
s
case
Ma
M in Fo
n
cus
u : ,,Nu
N t
u rients
n / Potama
m lisation"
on
Ecol
c og
ol ical Qu
Q a
u lity C
y lass
# Tota
Tot l Taxa
# EPT-T
- axa
Diver
i
si
ver t
si y
t In
I dex (M
dex ( ar
M g
ar ale
l f)
f
Degra
r dati
at o
i n - Ind
I
ex
Multitme
m tric
ex
% Ol
O ilgoc
i
haeta
t & Dipt
i e
pt ra
r Taxa
Ind
In ex II
a
x
a
RETI
TI (F
( eedin
di g Type In
I dex)
% Lit
i o
t ra
r l
Mo
M dul A
dul c
A idif
id ication
Acidificat
a iton -
n Ind
n e
d x
Figure 1: Scheme for the evaluation of ecological quality classes
SEBASTIAN BIRK UNIVERSITY OF DUISBURG-ESSEN
Implementation and communication of the WFD intercalibration exercise in the DRB Annexes
page 29
Criteria for Boundary
High/Good boundary
Good/Moderate boundary
Setting
Taxonomic composition and
25th percentile of reference sites
25% deviation (of indices) from reference
abundance
taxonomic composition represented in indices by: # taxa, %
conditions
Oligochaeta and Diptera taxa, # EPT
comment: Major taxonomic groups (defined at the
Abundance included in Saprobic Index (# Individuals/m˛) and
level of order - cannot be used for setting
RETI
good/moderate boundary see
Appendix!): no groups missing
Ratio of disturbance
25th percentile of reference sites
25% deviation (of indices) from reference sites
sensitive to insensitive taxa
sensitive to insensitive represented in MMI by: # EPT, %
Oligochaeta and Diptera taxa, RETI, % litoral, degradation
comment: crossover points sensitive/insensitive
index, acidification index
taxa were not used for setting
good/moderate boundary (depending too
much on which taxa are selected as
sensitive/insensitive)
Level of diversity
25th percentile of reference sites
25% deviation (of indices) from reference sites
diversity is represented in indices by: Margalef diversity index,
# taxa
UNDP/GEF DANUBE REGIONAL PROJECT
page 30
ANNEX A2: WFD COMPLIANT National Method - SLOVAKIA
Country
SK
Classification System:
Slovak System for Ecological River Status Assessment
General Description
Selection of reference sites according to REFCOND Guidance, National Strategy paper ("Criteria for the
identification of potential reference sites") and criteria used by AQEM/STAR.
The Slovak System for Ecological River Status Assessment is composed of a multimetric index composed of a
stream type specific combination of single metrics (Table 1). These metrics are normalised using stream type
specific reference values and combined by averaging,
Table 1: List of single metrics used in the Slovak multimetric index for the ecological assessment of common
stream types relevant in the EC GIG intercalibration exercise. The national systems subdivides R-E1 in small (10-
100km2) and medium (100-1000km2) sized streams.
common type
R-E1
R-E1
R-E2
R-E4
(small-sized)
(medium-sized)
SI
(Zelinka
&
Marvan) x x x x
oligo
[%]
x x x x
BMWP
x x x x
Rhithron
Typie
Index x x x x
Index
of
Biocoenotic
Region
x x x x
Rheoindex
x
[%]
Type
Aka+Lit+Psa x x x x
[%]
metarhithral
x x x
Diversity
(Margalef
Index)
x x x
SEBASTIAN BIRK UNIVERSITY OF DUISBURG-ESSEN
Implementation and communication of the WFD intercalibration exercise in the DRB Annexes
page 31
[%]
Shredders
x x x
[%]
Gatherers/Collectors x x x
EPT
taxa
x x x x
Number of families
x
x
x
Class boundaries for the ecological quality classes are defined as follows:
Quality Class 1 (high): 0.8
Quality Class 2 (good): 0.6 < 0.8
Quality Class 3 (moderate): 0.4 < 0.6
Quality Class 4 (poor): 0.2 < 0.4
Quality Class 5 (bad): < 0.2
UNDP/GEF DANUBE REGIONAL PROJECT
page 32
ANNEX A2: NON-WFD COMPLIANT National Method SLOVAKIA
(used for Danube River Intercalibration)
Country
Slovakia
Region
entire Slovakia
Altitude range
0 - 800 m
Stream range
applied to all stream types
Elements
Benthic Invertebrates, Macrophytes, Phytobenthos, Phytoplankton, Zooplankton
Name of method National Surface Water Quality Monitoring System
Stressors
Organic Pol ution, Eutrophication
detected
Status of method in current usage
The method
field sampling, lab procedure, calculation, presentation
covers
It is combined
with the
under development
following
methods
General Description
Biomonitoring of Slovakian watercourses comprises investigations of Benthic Invertebrates, Phytobenthos,
and Phyto- and Zooplankton. Qualitative (diversity) and (semi-) quantitative (abundance) parameters are
taken into account. Macrophytes are investigated as part of the 'Macrophyte Inventory Danube - Corridor
Brief description
and Catchment
The degree of Organic Pollution is separately assessed by determination of the Saprobic Index (SLOVAK
NATIONAL STANDARD 757221 1989) based on taxa lists of Benthic Invertebrates and Phytobenthos, and
Bioseston (all planktonic organisms). In addition, chlorophyll-a concentration is used to assess water quality.
· STN (Slovenská Technická Norma) 83 0532 1 to 8 (1978/79): Biologický rozbor
References
povrchovej vody. (Biological analysis of surface water quality). Úrad pro Normalizaci a
Mereni, Praha.
Sampling
Multi habitat sampling is carried out for Benthic Invertebrates, Phytobenthos and Macrophytes:
All major habitats are sampled proportionally according to their presence within a sampling
Sampling
reach.
procedure
Sampling of Benthic Invertebrates is done in accordance with the European Standard EN 27
828. Kick-sampling is performed not exceeding 10 to 15 minutes. Whole sample is preserved in
the field and organisms are picked out in the laboratory. Prior to sorting and identification
SEBASTIAN BIRK UNIVERSITY OF DUISBURG-ESSEN
Implementation and communication of the WFD intercalibration exercise in the DRB Annexes
page 33
samples are sieved through 300 µm meshes.
Macrophytes are sampled according to the protocol of the Macrophyte Inventory Danube.
lenght of sampling site:
15 to 20 m
width of sampling site:
littoral
Sampling site
rationale of the selection of sampling sites:
depending on point sources of pollution;
Danube specification:
depending on point sources of pollution;
Benthic Invertebrates and Phytobenthos: spring, summer and autumn
Sampling season Phyto- and Zooplankton: monthly
Benthic Invertebrates:
hand net - mesh-size: 500 µm; net-opening: 25 * 25 cm˛
Phytobenthos and Heterotrophic Periphyton:
Sampling device brushes and knives - scraped area: 10 * 10 cm˛
Plankton:
plankton net - mesh-size: 10 µm (Phytoplankton) and 60 µm (Zooplankton); net-opening: 30 cm
in diameter
Fixative used
formaldehyde
· EN 27 828. Water Quality - Methods for biological sampling - Guidance on handnet
sampling of aquatic benthic macroinvertebrates. (ISO 7828: 1985)
· JANAUER, G.A. (2002): Macrophyte Inventory Danube - Corridor and Catchment.
Guidance on the Assessment of Aquatic Macrophytes in the river Danube, in waterbodies
of the fluvial corridor, and in its tributaries. -
Sampling
http://www.midcc.at/Methodology/fluvial/methodology_kohler_en_V4.pdf
reference
· KNOBEN, R.A.E; BIJLMAKERS, L. & P. VAN MEENEN (1999):
Classification/characterisation of water quality, Water Quality Enhancement in the Danube
River Basin, Phare Contract No. 98-0399.00. Brussels (IWACO).
· KOHLER, A. (1978): Methoden der Kartierung von Flora und Vegetation von
Süßwasserbiotopen. Landschaft und Stadt 10: 73-85.
· STN (Slovenská Technická Norma) 83 0532 (1978/79)
Record of
abundance
number of individuals, abundance classes, percent coverage, number of cells
abundance class (Phytobenthos)
description
1
single
2
rare
Abundance
3
rare to common
specification
4
common
5
common to abundant
6
abundant
7
very abundant
UNDP/GEF DANUBE REGIONAL PROJECT
page 34
Benthic Invertebrates: number of individuals
Phytoplankton, Zooplankton: number of cells
Macrophytes: plant mass estimates
Level of
determination
species, species groups, genus, family
Determination
In some cases Benthic Invertebrates are determined to genus or family level (e.g. Oligochaeta,
specification
Chironomidae, juvenile organisms).
fieldwork: approx. 60 5 persons
Expenditures per
laboratory: approx. 100 7 persons
sample
additional costs for consumables and equipment
ecoregion, geology, channel form, bank and bed fixation, riparian vegetation, land use, temperature,
Additional
discharge, pH, conductivity, dissolved oxygen content, oxygen saturation, COD (Chemical Oxygen
environmental data Demand), BOD (Biological Oxygen Demand), nitrite, nitrate, ammonium, phosphorus, salinity, odour,
mineral substrates, biotic microhabitats, water colour,
Assessment: calculation, classification, presentation
· assessment is not related to the reference state concept (with regard to smaller
Specifications
watercourses, reference concept has been implemented in 2003)
single metric(s): SI = sum of (si*hi*Ii) / sum of (hi*II)
SI: Saprobic Index
Calculation method Si: individual saprobic index of species i (si = (0*xi + 2*bi + 3*ai + 4*pi) / 10)
hI: abundance of species i
Ii: individual indicator weight of species i
To which spatial
scale do metrics
reach
refere?
Number of quality
classes
5
Saprobic
Saprobic Index of
Saprobic Index of Chlorophyll-a
Class
Index of
Benthic
Phytobenthos
(µg/l)
Bioseston
Invertebrates
I
< 1.80
< 1.80
< 1.50
< 10
Conversion into
classes
II
1.80 - 2.30
1.80 - 2.30
1.50 - 2.00
10 - 35
III
> 2.30 - 2.70
> 2.30 - 2.70
> 2.00 - 2.50
> 35 - 75
IV
> 2.70 - 3.20
> 2.70 - 3.20
> 2.50 - 3.00
> 75 - 180
V
> 3.20
> 3.20
> 3.00
> 180
· STN (Slovenská Technická Norma) 83 0532-6 (1979): Biologický rozbor povrchovej vody.
Species lists used
to calculate index
Stanovenie sapróbneho indexu pod'a Pantleho a Bucka. (Determination of Saprobic Index
according to PANTLE and BUCK). Úrad pro Normalizaci a Mereni, Praha.
SEBASTIAN BIRK UNIVERSITY OF DUISBURG-ESSEN
Implementation and communication of the WFD intercalibration exercise in the DRB Annexes
page 35
calculation:
· STN (Slovenská Technická Norma) 83 0532 (1978/79)
Reference on
classification:
calculation
· STN (Slovenská Technická Norma) (1989): Klasifikace jakosti povrchovych vod. Vyd. Úrad
pro Normalizaci a Mereni, Praha.
Presentation
reports (paper)
Monitoring and Database
Status of
monitoring
in current usage
program
Name of
National Surface Water Monitoring System
monitoring
program
Transboundary Programs: Slovakia-Hungary; Slovakia-Austria; TransNational Monitoring Network (TNMN)
since 1963
at the Danube:
Period of
Benthic Invertebrates since 1996
monitoring
Macrophytes since 2003
Phytobenthos since 1998
Phyto- and Zooplankton since 1992
Geographical
coverage
entire Slovakia
Coverage of
National Surface Water Monitoring System: 250 sites; Transboundary Programs on the Danube: 11 sites;
monitoring
TNMN: 4 sites
Monitoring interval monthly; three times per year; once a year
Name of database
OAV
Type of database
multi-user client-server database; desktop-database; non-digital protocols
Program used
MAGIC
Organisation
responsible
Slovak Hydrometeorological Institute, Bratislava
Place of database
storage
Slovak Hydrometeorological Institute, Bratislava
UNDP/GEF DANUBE REGIONAL PROJECT
page 36
ANNEX A3: Non-WFD Compliant National Method - BULGARIA
Country
Bulgaria
Region
entire Bulgaria
Altitude range
0 - >800 m
Stream range
applied to all stream types
Elements
Benthic Invertebrates, Macrophytes
Name of method Biotic Index based on 'Quality Rating System'
Stressors
detected
Organic Pol ution, General Degradation (stressor not specified)
Status of method in current usage since 1993
The method
covers
field sampling, lab procedure, calculation, presentation
General Description
In the national monitoring network of Bulgarian watercourses a Biotic Index is in use which is
adapted from the Irish `Quality Rating System'. The index relates the relative abundance of five
key groups of macroinvertebrates (sensitive forms to most tolerant forms) to water quality. The
scheme uses five basic water quality classes (Q-values).
Brief description Saprobity is determined by PANTLE & BUCK (1955) Index for the eight Bulgarian
Transnational Monitoring Network (TNMN) sites only. The German DIN norm is used to
calculate the Saprobic Index.
Macrophytes are not part of the assessment procedure, only species occurrence and percent
coverage are recorded.
· MCGARRIGLE, M.L.; LUCEY, J.; CLABBY, K.C. (1992): Biological assessment of river
water quality in Ireland. In: NEWMAN, P.J.; PIAVAUX, M.A.; SWEETING, R.A. (eds.):
River Water Quality. Ecological Assessment and Control. Brussels (Commission of the
European Community): 371-385.
References
· MINISTRY OF ENVIRONMENT AND WATER (since 1985): Annual report on the state of
the environment - The Green Book. Sofia (MOEW). (in Bulgarian and English)
· PANTLE, R. & H. BUCK (1955): Die biologische Überwachung der Gewässer und die
Darstellung der Ergebnisse. Gas- und Wasserfach 96: 604.
SEBASTIAN BIRK UNIVERSITY OF DUISBURG-ESSEN
Implementation and communication of the WFD intercalibration exercise in the DRB Annexes
page 37
Sampling
Samples are taken from all major habitats proportionally according to their presence within a
sampling reach. Where possible, preference is given to riffled sites with turbulent flow
conditions. Hand-net sampling is carried out according to ISO Standard 7828 (1985).
Sampling
procedure
Substratum is kicked for approx. 2 to 5 minutes.
Organisms are are separated from other materials at sampling site by sieving through meshes
of 8 mm, 2 mm, 500 µm and 200 µm in size. Organisms are picked from sieved material and
preserved.
lenght of sampling site:
10 to 20 m (up to 50 m)
width of sampling site:
depending on width of watercourse
Danube specification:
Sampling site
10 to 20 m
rationale of the selection of sampling sites:
accessibility; location of pollution sources; presence of riffle sites
Danube specification:
accessibility; location of pollution sources; presence of riffle sites
each season excluding spring (high water level)
Sampling season Danube specification:
period of lowest water level (usually August to September)
Benthic Invertebrates:
Sampling device hand-net - mesh-size: 500 µm; net-opening: 30 * 30 cm˛
Fixative used
formaldehyde (4 - 10 %)
Sampling
· ISO 7828 (1985): Water Quality - Methods for biological sampling - Guidance on handnet
reference
sampling of aquatic benthic macroinvertebrates.
Record of
abundance
abundance classes, percent coverage
Benthic Invertebrates
abundance class
number of individuals
I
1-5
II
6-20
III
21-50
Abundance
IV
51-100
specification
V
>100
Macrophytes
abundance class
percent coverage
1
< 1
2
1 - 5
3
6 - 15
UNDP/GEF DANUBE REGIONAL PROJECT
page 38
4
16 - 25
5
26 - 50
6
> 50
Level of
determination
species, species groups, genus, family
Benthic Invertebrates are identified to different taxonomic levels depending on organism group.
Determination
specification
For example, Ephemeroptera are identified to species groups and genus level, Diptera to family
level.
fieldwork: 30 to 40 minutes 3 2 persons , laboratory: 2 hours 4 1 person
Expenditures per
sample
additional costs: consumables - 1 to 2 per sample; travel and accommodation - depending on
sampling region
Assessment: calculation, classification, presentation
· assessment is related to reference conditions based on existing sites and expert
Specifications
judgement
Calculation
single metric(s): decision tables representing five groups of macroinvertebrates and their
method
relative abundances
To which spatial
scale do metrics catchment, river
refere?
Number of
quality classes
5
Bulgarian Classification
EC Classification
Quality
Q-
Colour
Quality
Colour
Description
Description
Class
Value
Code
Class
Code
5; 4-5;
I
unpolluted
blue
I
high
blue
4
Conversion into
classes
II
3-4
slightly polluted
green
II
good
green
III
moderate
yellow
moderately
III
3; 2-3
yellow
polluted
IV
poor
orange
2; 1-2;
IV
heavily polluted
red
V
bad
red
1
Species lists
used to calculate
· MINISTRY OF ENVIRONMENT AND WATER (since 1985) - comprises about 400 taxa
index
Comments on
Bulgarian Classification will soon be adapted to the EC recommendations.
SEBASTIAN BIRK UNIVERSITY OF DUISBURG-ESSEN
Implementation and communication of the WFD intercalibration exercise in the DRB Annexes
page 39
calculation
Presentation
reports (paper); maps (paper and digital); internet (http://nfp-bg.eionet.eu.int\)
Monitoring and Database
Status of
monitoring
in current usage
program
Name of
monitoring
National Environmental Monitoring Program of Bulgaria
program
Period of
monitoring
since 1993 (in some river basins)
Geographical
coverage
entire Bulgaria
Coverage of
about 18 to 20 sampling sites per 1000 km˛ - 1200 sampling points, located along rivers at a
monitoring
distance of 5 to 10 km
Monitoring
interval
annual for representative sites and biannual for reference sites
Name of
National Automated System for Environment Monitoring / NASEM / Subsytem "Water" -
database
functional subsystem "Surface water biological monitoring"
Type of database desktop-database
Program used
MS Word; MS Access; paper format
Organisation
responsible
Ministry of Environment and Water, Executive Environmental Agency
Place of
database storage Ministry of Environment and Water, Executive Environmental Agency
UNDP/GEF DANUBE REGIONAL PROJECT
page 40
ANNEX A4: Non-WFD Compliant National Method CZECH REPUBLIC
Country
Czech Republic
Region
entire Czech Republic
Altitude range
0 - > 800 m
Stream range
applied to all stream types
Elements
Benthic Invertebrates
Name of method Saprobiological Monitoring
Stressors
detected
Organic Pollution
Status of method in current usage
The method
covers
field sampling, lab procedure, calculation, presentation
It is combined
combination of results (5 quality classes) including PERLA and the Czech version of AQEM is
with the
under development (all outputs should be based on standard samples and measurements
following
methods
according to the AQEM/PERLA methodologies)
General Description
The method is used for standard assessment of organic pollution in Czech rivers. It is applied in a
large monitoring network and evaluates the degree of pollution according to PANTLE and BUCK
Brief description (1955), modified by MARVAN (1969). Results are expressed in 8 grades, which are converted into 5
different classes.
· CSN 757716 (1998): Water quality, biological analysis, determination of saprobic index. -
Czech Technical State Standard. Czech Standards Institute, Prague, 174 pp.
· SLADECEK, V. (1973): System of Water Quality from the Biological Point of View. Arch.
Hydrobiol. Beih.; Ergeb. Limnol. 7: 1-218.
References
· MARVAN, P. (1969): Notes to the application of statistical methods in evaluation of
saprobiology. Symposium SMEA on Questions of Saprobity: 19-43.
· PANTLE, R.; BUCK, H. (1955): Die biologische Überwachung der Gewässer und die
Darstellung der Ergebnisse. Gas- und Wasserfach 96: 604.
SEBASTIAN BIRK UNIVERSITY OF DUISBURG-ESSEN
Implementation and communication of the WFD intercalibration exercise in the DRB Annexes
page 41
Sampling
Sampling is done in accordance with the European standard EN 27 828. Samples are taken at a
homogenous stretch, preferably in a riffle section. Each sample comprises a fixed distance and a
defined sampling time. In flowing shallow water hand-sampling is carried out disturbing the
Sampling
procedure
substratum by hand and picking organisms from stones. Deeper but wadable streams are kick-
sampled. In slow flowing waters sweep-sampling is applied: Substratum is disturbed with the feet and
the dislodged fauna is caught by repeated sweeps of the net through the water above the disturbed
area. All different types of sampling are made by utilisation of a hand-net (mesh-size: 500 µm).
· EN 27 828 (1994): Water Quality - Methods for biological sampling - Guidance on handnet
sampling of aquatic benthic macroinvertebrates. (ISO 7828: 1985)
· MRAZEK, K. et al. (1995): Zacleneni saprobiologického monitoringu SVHB do systemu
Sampling
sledovani a hodnoceni jacosti vody. 1. cast: Prirucka saprobiologickeho monitoringu SVHB;
reference
2. cast: Prakticky determinacni klic. ('An integration of saprobiological monitoring into water
quality monitoring and assessment. Part 1: Handbook of saprobiological monitoring of
water quality balance system; part 2: Practical identification key of benthic invertebrates.')
Brno (T.G.M. Water Research Institute Prague). (in Czech)
Record of
abundance
number of individuals
Level of
determination
species, species groups, genus
Expenditures per
sample
80
Additional
environmental
physiographic characteristics,
data
Assessment: calculation, classification, presentation
Specifications
· assessment is not related to a reference condition
single metric(s): SI = sum of (si*hi*Ii) / sum of (hi*II)
SI: Saprobic Index
Calculation
S
method
i: individual saprobic index of species i (si = (0*xi + 2*bi + 3*ai + 4*pi) / 10)
hI: abundance of species i
Ii: individual indicator weight of species i
To which spatial
scale do metrics reach
refere?
Number of
quality classes
5
UNDP/GEF DANUBE REGIONAL PROJECT
page 42
Saprobic Grades according to Water Quality Balance System
grade
Saprobic Index
1
0 - 1.0
2
1.01 - 1.50
3
1.51 - 2.00
4
2.01 - 2.50
5
2.51 - 3.00
6
3.01 - 3.50
7
3.51 - 4.00
Conversion
into classes
8
> 4.00
Approximative Conversion to Classes according to Czech State Norm 757221
grade
class
Saprobic Index
1 - 2
I
< 1.5
3 - (4)
II
1.51 - 2.19
(4) - 5
III
2.20 - 2.99
6
IV
3.00 - 3.49
7 - 8
V
>= 3.5
Reference
· CSN 757221 (1998): Water quality - Classification of surface water quality. Czech Technical
on
calculation
State Standard, Czech Standards Institute, Prague, 10 pp.
Presentation reports (paper); maps (paper)
Monitoring and Database
Status of
monitoring
existent
program
Name of
(1) Water Quality Balance System; (2) Monitoring Program of the Czech Hydrometeorological
monitoring
program
Institute
Geographical
entire Czech Republic
SEBASTIAN BIRK UNIVERSITY OF DUISBURG-ESSEN
Implementation and communication of the WFD intercalibration exercise in the DRB Annexes
page 43
coverage
Coverage of
monitoring
(1) 1200 sites; (2) 250 important sites
Monitoring interval (1) repeated every five years; (2) two times per year in spring and autumn
Name of database BROUCI
Type of database
desktop-database; data older than 10 years: only hard copy
Program used
FoxPro
Organisation
responsible
Water Research Institute Prague, branch Brno
Place of database
storage
Water Research Institute Prague, branch Brno
UNDP/GEF DANUBE REGIONAL PROJECT
page 44
ANNEX A5: Non-WFD Compliant National Method HUNGARY
Country
Hungary
Region
entire Hungary
Altitude range
0 - 800 m
Stream range
applied to all stream types
Elements
Benthic Invertebrates
Name of method BMWP - HU (adapted to Hungarian conditions)
Stressors
detected
Organic Pollution
Status of method in current usage and under development to be finished in December 2004
The method
covers
field sampling, calculation, presentation
It is combined
with the
under development
following
methods
General Description
For years Hungarian watercourse biomonitoring has solely been based on biomass and chlorophyll-a
examinations of the planktonic river community. Since 2002 a modification of the British BMWP/ASPT score
system is applied featuring newly included taxa and modified scores (see score table). Combination of total
Brief description
score and average score per taxon results in a Quality Index (QI) value which is assigned to one of five
classes of watercourse quality.
The method is in preliminary phase and practical experience and taxonomic expertise are advancing.
· ARMITAGE, P.D.; MOSS, D. et al. (1983): The performance of a new biological water
quality score system based on macroinvertebrates over a wide range of unpolluted
running-water sites. Water Research 17: 333-347.
· BIOLOGICAL MONITORING WORKING PARTY (1978, unpublished report): Final report of
the Biological Monitoring Working Party: assessment and presentation of the biological
quality of rivers in Great Britain. London (Department of the Environment Water Data Unit).
References
· CSÁNYI in NÉMETH, J. (1998): A biológiai vízminosítés módszerei (Methods of biological
water quality assessment). Vízi Természet- és Környezetvédelem sorozat 7. Bp.:
Környezetgazdálkodási Intézet: 1-304. (in Hungarian)
· JUST, I.; SCHÖLL, F. & T. TITTIZER (1998): Versuch einer Harmonisierung nationaler
Methoden zur Bewertung der Gewässergüte im Donauraum am Beispiel der Abwässer der
Stadt Budapest. UBA-Texte 53-98. Berlin (UBA).
SEBASTIAN BIRK UNIVERSITY OF DUISBURG-ESSEN
Implementation and communication of the WFD intercalibration exercise in the DRB Annexes
page 45
Sampling
Kick-Sampling:
Multi habitat sampling is carried out: proportional sampling of all major habitats according to
their presence within a sampling reach. In total, a five meter section is sampled for approx. 15
minutes time. In addition, organisms are picked from hard surfaces using pincers.
"Turbo-kicking" method (Danube):
One driver stands in water of 2 to 2.5 m depth and makes mixing up movements with his fins
above the bottom. In the mean time eight sweeping movements are carried out by the hand net
close to the bottom. Even large crayfishes can be moved out from heavily stony substrate by
this way.
Diving:
special way of collecting mussels from the bottom because large surface area is under
Sampling
investigation. Using only fins and mask the bottom is touched continuously by hands and
procedure
mussels are picked up.
Dredging method (Danube):
Dredging is done from a motorboat moving downstream direction slowly in order to allow the
forks of the dredge to take the surface area of the bottom. Several meters are dredged pulling
the sampler on rope and keeping it by hands in order to feel the roughness and the carving of
the instrument. Two sizes of the dredge are in usage: 25 cm and 40 cm opening on a triangle
shaped and forked surface. The dredge has an inside net with the mesh size of 500 µm. It can
also be operated without this net. In this case an iron grid with mesh size of 150 mm collects
rough sized bed material (e.g. mussel species are collected by this way).
Whole sample is preserved in the field and organisms are picked out in the laboratory. Samples
are sieved through a net of 950 µm prior to sorting and identification. If the volume of the
sample exceeds 2 litres, a smal er part is taken to identify organisms (max. 500 ml).
rationale of the selection of sampling sites:
identical to former monitoring network; representativeness
Sampling site
Danube specification:
identical to former monitoring network; representativeness
Benthic Invertebrates:
hand net - mesh-size: 950 µm; net-opening: 25 * 20 cm˛
Sampling device Danube specification:
custom-made dredge - mesh-size: 950 µm or 150 mm; sampled area: 25 or 40 cm * few meters
Fixative used
ethyl alcohol (70 %)
Record of
abundance
number of individuals, abundance classes
abundance class
percentage of individuals in sample (5 m ŕ 15 min)
Abundance
5
> 50
specification
4
25 - 50
UNDP/GEF DANUBE REGIONAL PROJECT
page 46
3
12.5 - 25
2
6.25 - 12.5
1
< 6.25
Level of
determination
species, genus, family, higher taxonomical level
Determination
specification
Chironomids are identified to family level, Oligochaets to higher taxonomical level.
Expenditures per fieldwork: 1 to 2 hours 40 to 80 1 person
sample
laboratory: 1 to 3 hours 40 to 120 1 person
Additional
environmental
chemical/physical water quality,
data
Assessment: calculation, classification, presentation
· assessment is not related to a reference condition
Specifications
Calculation method single metric(s): sum of BMWP scores and calculation of the Average Score Per Taxon
To which spatial
scale do metrics
habitat
refere?
Number of quality
classes
5
Assignment of Quality Index according to BMWP score and ASPT of riffle and
Scoring System for Riffles
Scoring System for Pools
BMWP
ASPT
Quality Index
BMWP
ASPT
Quality Index
> 150
> 6.0
7
> 120
> 5.0
7
121 - 150
5.5 -
6
101 - 120
4.5 -
6
Conversion into
91 - 120
5.1 -
5
81 - 100
4.1 -
5
classes
61 - 90
4.6 -
4
51 - 80
3.6 -
4
31 - 60
3.6 -
3
25 - 50
3.1 -
3
SEBASTIAN BIRK UNIVERSITY OF DUISBURG-ESSEN
Implementation and communication of the WFD intercalibration exercise in the DRB Annexes
page 47
4.5
3.5
2.6 -
2.1 -
15 - 30
2
10 - 24
2
3.5
3.0
0.0 -
0.0 -
0 - 14
1
0 - 9
1
2.5
2.0
Quality classification of watercourses based on Quality Index
mean Quality Index according to Total Score
quality class description
and ASPT of riffle and pool section
I
high
> 5.0
II
good
> 4.0 - 5.0
III
moderate
> 3.0 - 4.0
IV
poor
> 2.0 - 3.0
V
bad
<= 2.0
Species lists used to
· score table
calculate index
Reference on calculation
· CSÁNYI in NÉMETH, J. (1998)
Presentation
reports (paper and digital)
UNDP/GEF DANUBE REGIONAL PROJECT
page 48
ANNEX A6: Non-WFD Compliant National Method ROMANIA
Country
Romania
Region
entire Romania
Altitude range
0 - >800 m
Stream range
applied to large watercourses
Elements
Benthic Invertebrates, Phytobenthos, Phytoplankton, Zooplankton
Determination of Saprobic Index according to PANTLE & BUCK
Name of method (1955)
Stressors
detected
Organic Pollution
Status of method in current usage
The method
covers
field sampling, lab procedure, calculation, presentation
General Description
To assess the biological quality of watercourses in Romania the Saprobic Index according to
Brief description PANTLE & BUCK (1955) is determined and classified in a five-fold scheme.
· MALACEA, I. (1969): Biologia apelor impurificate (biology of polluted waters). Bucharest
(Romanian Academy). (in Romanian)
References
· MARCOCI, I. (1984): Analiza biologica a apelor (biological analysis of waters). Bucharest
(Romanian Academy). (in Romanian)
Sampling
When sampling Benthic Invertebrates by hand-net 'kick and sweep' technique is applied. If possible, all
major habitats are sampled proportionally according to their presence within a sampling reach (multi-habitat
Sampling
sampling).
procedure
Whole sample is preserved in the field and organisms are picked out in the laboratory.
Plankton samples are concentrated by means of sedimentation, membran filtration or centrifugation. Benthic
Invertebrates are sieved through 475 µm meshes prior to sorting and identification.
width of sampling site:
5 to 30 m
Danube specification:
Sampling site
500 to 900 m
rationale of the selection of sampling sites:
representativeness; availability of data on flow dynamics; requirements of international conventions
Sampling season
Phytoplankton, Zooplankton, Benthic Invertebrates: each season; Phytobenthos: summer
SEBASTIAN BIRK UNIVERSITY OF DUISBURG-ESSEN
Implementation and communication of the WFD intercalibration exercise in the DRB Annexes
page 49
Danube specification:
Phytoplankton: monthly; Zooplankton: each season; Phytobenthos: summer
Benthic Invertebrates:
Surber sampler - mesh-size: 475 µm; sampled area: 35x35 cm˛
Ponar Grab - sampled area: 22x22 cm˛
Marinescu Dredge (Romanian version of Ekman type Dredge) - sampled area: 17x17 cm˛
Danube specification:
Ponar Grab - sampled area: 22x22 cm˛
Marinescu Dredge (Romanian version of Ekman type Dredge) - sampled area: 17x17 cm˛
Sampling device
Phytobenthos and Heterotrophic Periphyton:
scraping tool: spatula; scraped area: 6 to 20 cm˛;
petri dish and spatula for collecting soft sediment
Plankton:
plankton net - mesh-size: 126.5 µm; net-opening (diameter): 20 to 25 cm; sampling depth: 10 to 15 cm
Phytoplankton: 1 litre plastic bottle and 'Kemmerer Water Sampler' (2 to 3 litres); Zooplankton: 5 buckets
(10 litres each)
Fixative used
90 % alcohol
· SR-ISO - 5667-1: 1998 Water quality Sampling Part 1: Guidance on the design of
sampling programs.
· SR-ISO 5667-2: 1998 Water quality Sampling Part 2: Guidance on sampling
techniques.
· SR-ISO 5667-6: 1997 Water quality Sampling Part 6: Guidance on sampling of rivers
Sampling reference
and streams.
· SR-ISO 5667-12: 2001 Water quality Sampling Part 12: Guidance on sampling of
bottom sediments.
· SR-EN 27828 (ISO 7828: 1985) Water quality - Method of biological sampling: Guidance
on handnet sampling of aquatic benthic macro-invertebrate.
· MARCOCI (1984)
Record of
abundance
number of individuals
Abundance
specification
Benthic Invertebrates, Phytobenthos, Phytoplankton, Zooplankton: number of individuals
Level of
determination
species, genus
Determination
Benthic Invertebrates, Phytobenthos, Phytoplankton, Zooplankton: species level represents the most
specification
common level of identification in biological monitoring; some groups are identified to genus level
fieldwork: 1 hour 5 US Dollar 1 biologist; 1 lab technician
Expenditures per
laboratory: 16 hours 30 US Dollar 2 persons
sample
costs of transport: 10 US Dol ar
All costs refer to sampling of Benthic Invertebrates.
height of source, distance from source, stream order, slope, altitude, catchment area, geology, river
Additional
continuity (passability), cross section of the river bed and/or floodplain, land use, temperature, current
environmental data velocity, discharge, pH, conductivity, dissolved oxygen content, oxygen saturation, COD (Chemical Oxygen
UNDP/GEF DANUBE REGIONAL PROJECT
page 50
Demand), BOD (Biological Oxygen Demand), nitrite, nitrate, ammonium, phosphorus, water colour, type
and intensity of human impact,
Assessment: calculation, classification, presentation
· Within the classification scheme 'class I' represents the reference condition.
Specifications
· Stream type-specific assessment is not existing. The establishment of a national stream
typology is expected to be finished in June 2004.
single metric(s):
SI = Sum of (si*hi) / Sum of hi
Calculation method SI: saprobic index
si: saprobial valence of the i-th taxon
hi: abundance of the i-th taxon
To which spatial
scale do metrics
habitat
refere?
Number of quality
classes
5 (classification according to EU Water Framework Directive will be applied in 2004)
class
Saprobic Index based on Benthic Invertebrates
colour code
I
<= 1.8
blue
II
1.81 - 2.3
green
Conversion into
classes
III
2.31 - 2.7
yellow
IV
2.71 - 3.2
orange
V
> 3.2
red
· MARVAN, P.; ROTHSCHEIN, J.; ZELINKA, M. (1980): Der diagnostische Wert
saprobiologischer Methoden. Limnologica 12(2): 299-312.
Species lists used
· SLÁDECEK, V. (ed.) (1977): Symposium on Saprobiology. Stuttgart (Schweizerbart).
to calculate index
· SLÁDECEK, V. (1981): Biologický rozbor povrchové vody: komentár k CSN 83 0532, cásti
6 : stanovení saprobního indexu. Praha: Vydavatelství Úradu pro normalizaci a merení:
186 p.
· PANTLE & BUCK (1955): Die biologische Überwachung der Gewässer und die Darstellung
Reference on
der Ergebnisse. Gas- und Wasserfach 96: 604.
calculation
Presentation
reports (paper and digital), maps (paper)
Monitoring and Database
Status of
in current usage
monitoring
SEBASTIAN BIRK UNIVERSITY OF DUISBURG-ESSEN
Implementation and communication of the WFD intercalibration exercise in the DRB Annexes
page 51
program
Name of
monitoring
National Water Monitoring System
program
Period of
monitoring
since 1978
Geographical
coverage
entire Romania
Coverage of
monitoring
approx. 1 site per 1000 km˛
Monitoring interval 4 times per year
Name of database
Water Quality Component of the National Water Monitoring System
Type of database
desktop-database
Program used
River Quality
Organisation
responsible
National Administration 'Apele Romane'
Place of database
storage
National Administration 'Apele Romane'
UNDP/GEF DANUBE REGIONAL PROJECT
page 52
ANNEX B
Reference criteria and reference sites
(refer to
http://forum.europa.eu.int/Public/irc/jrc/jrc_eewai/library?l=/milestone_r
eports/milestone_september_1/rivers&vm=detailed&sb=Title)
SEBASTIAN BIRK UNIVERSITY OF DUISBURG-ESSEN
Implementation and communication of the WFD intercalibration exercise in the DRB Annexes
page 53
ANNEX C
Class Boundary setting procedure and
intercalibration results for IC types based on
non-WFD compliant methods
UNDP/GEF DANUBE REGIONAL PROJECT
page 54
Explanation of harmonised quality class boundary setting procedure and
intercalibration results for types based on non-WFD compliant methods
Introduction
Within the intercalibration exercise the definition of reference conditions is of major
importance for the comparison of national quality assessment methods. In this regard, two
problems were obvious in the Eastern Continental GIG: Either existing reference site were
not available (esp. lowland types) or reference criteria to screen for existing reference sites
differed among countries. In the Eastern Continental GIG we agreed to follow an alternative
approach to resolve these issues by defining IC type specific, harmonised quality criteria. In
general, we set common high-good resp. good-moderate quality class boundaries for the
national biological assessment methods using existing data assembled within the EC GIG
intercalibration exercise. The main idea was to overcome the difficulties of lacking (near-
natural) references by defining an alternative reference, i.e. common agreement on a certain
level of impairment.
Data basis
Basis for the intercalibration analyses were national data derived from sampling sites at
rivers belonging to common intercalibration types. The data included information about
composition and abundance of macrozoobenthic fauna, selected chemical parameters,
classification of hydromorphological quality and land use in the catchment. Table 1
specifies the scope of environmental data collected for each sampling site. Values for the
chemical parameters were given as annual averages except for most of the Hungarian and
some Czech samples. For these samples the means of at least two single measurements were
provided.
Since no common method for the evaluation of the structural status of the sampling sites
was available, a classification scheme to assess the hydromorphological quality was
developed. According to the degree anthropogenic modification one of three classes was
allocated to each site by expert judgement following the descriptions presented in Table 1.
Based on CORINE land cover data the shares of artificial, agricultural and forest land use
in the catchment were surveyed. These data were used to calculate the Land Use Index
(Böhmer et al., 20042): 4 * artificial land use + 2 * intensive agriculture (e.g. cropland) +
non-intensive agriculture (e.g. pasture).
Outline of the harmonisation approach
Harmonised definition of quality criteria/thresholds for the high and good ecological
status
2 Böhmer, J., C. Rawer-Jost, A. Zenker, C. Meier, C. K. Feld, R. Biss & D. Hering, 2004. Assessing
streams in Germany with benthic invertebrates: Development of a multimetric invertebrate based
assessment system. Limnologica 34: 416-432.
SEBASTIAN BIRK UNIVERSITY OF DUISBURG-ESSEN
Implementation and communication of the WFD intercalibration exercise in the DRB Annexes
page 55
Based on criteria for saprobiological quality commonly agreed for monitoring purposes in
the Danube River Basin, biological threshold values were derived using the common metric
ASPT (Average Score Per Taxon). Sites with samples showing ASPT values above these
thresholds were screened by additional chemical, morphological and land use parameters.
The set of sites complying with all criteria/thresholds were regarded as of being in a
commonly agreed, ecologically high resp. high and good status.
Class boundary setting based on 25th percentile value of common metrics using all
sampling sites meeting the criteria defined in section A (high status sites high-good
boundary, high and good status sites good-moderate boundary)
The ecological quality class boundaries were expressed in ICMi-EC scale (see MS6
part C) to comply with the normative definitions of the WFD. These boundaries were
derived by selecting the 25th percentile values of each common metric from the set of sites
in high resp. high and good status (=subset). By means of regression analysis the boundary
values were translated into values of the national assessment method.
Setting of boundaries not defined by subset
The good-moderate boundary of R-E1 and the high-good boundary of R-E2, R-E3 and R-
E4 were not directly derived by the procedure described above. For the Austrian and Slovak
method these boundaries were defined by adopting the 0,2 unit steps of the national
classification schemes, i.e. increasing or decreasing the boundary derived from the subset
by 0,2 units. This approach was supported by the intercalibration results of Slovak method:
Derived from the data subsets the difference between the high-good boundary of R-E1 and
the good-moderate boundary of R-E2 amounts to 0,2 units. Boundaries of the non-WFD
compliant methods have been set by increasing or decreasing the value obtained by the
subset-procedure by 20 percent.
Table 1: Environmental data collected per sampling site
chemical parameters
Conductivity, pH, Alkalinity, Dissolved Oxygen, Oxygen Saturation, Biological Oxygen Demand (5
day), Total Phosphorus, Ortho-Phosphate, Nitrate, Ammonium
hydromorphological quality classification
class 1 unaltered hydromorphological conditions (= in near-natural state)
- stream type specific variability of channel depth and channel width, shallow profile, close
connectivity of the stream and the floodplain
- natural channel substrate conditions (composition and variability), presence of dead wood
- bank profile and bank structure unmodified
- presence of natural riparian vegetation (in most Eastern Continental GIG regions: forest)
- natural hydromorphological dynamic is maintained
- low degree of anthropogenic land use in the floodplain
class 2 moderately altered hydromorphological conditions
- decreased variability of channel depth and channel width
- minor changes to bank morphologies, or only one bank is fixed with "soft works"
- riparian vegetation altered
UNDP/GEF DANUBE REGIONAL PROJECT
page 56
- loss of stream length, longitudinal profile is altered by man
class 3 severely altered hydromorphological conditions
- obvious presence of hard engineering
- severe modifications of instream structures, bed and bank fixation and artificial substrates
- no or only minor variability of channel substrate
- no riparian zone between river and land use
- channelised, straightened and/or deep-cut river
- disconnection of river and floodplain
land use in catchment
% artificial land use
% intensive agriculture
% non-intensive agriculture
% forest
A. Harmonised definition of quality criteria/thresholds for the high and good
ecological status
Step 1: Setting biological screening thresholds using TNMN quality criteria for the
saprobiological status Table 2
Table 2: Proposal for classification of Austrian Saprobic Index in two types of natural
rivers in the Danube basin according to Knoben et al. (1999)3
a= fast flowing/mountainous rivers
b= slow flowing/lowland rivers
Class
I
II
III
IV
V
ecological status
high
good
moderate
Poor
bad
Saprobic Index (a)
1.80
1.81-2.30 2.31-2.70 2.71-3.20 >
3.20
Saprobic Index (b)
2.20
2.21-2.50 2.51-2.90 2.91-3.50 >
3.50
Step 2: Translation of the Austrian Saprobic Index SI (AT) into ASPT values based on
regression analyses using Austrian, Czech, Hungarian and Slovak data of R-E1, R-E2, R-E3
and R-E4 Figure 1 and Table 3
3 Knoben, R. A. E., L. Bijlmakers & P. van Meenen, 1999. Water Quality Enhancement in the Danube
River Basin; subaction 2A: Waterquality classification/characterisation. IWACO, 's-Hertogenbosch.
SEBASTIAN BIRK UNIVERSITY OF DUISBURG-ESSEN
Implementation and communication of the WFD intercalibration exercise in the DRB Annexes
page 57
9
ASPT = 9,8353-1,8877*x
8
7
6
PT 5
AS
4
3
HU
2
SK
AT
CZ
r2 = 0,5178; r = -0,7195
1
1,0
1,2
1,4
1,6
1,8
2,0
2,2
2,4
2,6
2,8
3,0
3,2
3,4
3,6
SI_AT
Figure 1: Regression of Austrian Saprobic Index against ASPT using samples derived from multi-habitat
sampling technique of Austria, Czech Republic, Hungary (Ecosurv project data) and Slovak
Republic (n=302)
Table 3: ASPT values corresponding to SI (AT) quality class boundaries.
high-good
good-moderate
SI (AT)
ASPT
SI (AT)
ASPT
fast flowing/mountainous rivers
1.8 6.4 2.3 5.5
slow flowing, lowland rivers
2.2 5.7 2.5 5.1
UNDP/GEF DANUBE REGIONAL PROJECT
page 58
Step 3: Site screening using ASPT thresholds and additional criteria according to Table 4
to define subset of sites in high (R-E1) resp. high and good (R-E2, R-E3, R-E4) ecological
status.
Table 4: Criteria used for the definition of sampling sites showing high and/or good quality status
R-E1
R-E2
R-E3
R-E4
defined
high and good
high and good
high and good
quality
high status
status
status
status
range
ASPT 6.4
ASPT 5.1
ASPT 5.1
ASPT 5.1
additional criteria
additional criteria
additional criteria
additional criteria
quality
· class 1: unaltered
· class 1: unaltered or
· class 1: unaltered or
· unaltered or
criteria and
hydromorphology
class 2: moderately
class 2: moderately
moderately altered
· mean BOD 2,5mg/l
altered
altered
hydromorphology
thresholds
· Land Use Index
hydromorphology
hydromorphology
· mean BOD 5mg/l
50
· mean BOD 5mg/l
· mean BOD 5mg/l
· mean conductivity3
· mean conductivity4
· mean conductivity3
<1000µS/cm
< 1000µS/cm
<1000µS/cm
· Land Use Index
· Land Use Index
· Land Use Index
140
140
140
B. Class boundary setting based on 25th percentile value of common metrics
using all sampling sites meeting common criteria
Step 4: Calculation of 25th percentile values of common metrics for each country/IC type
combination to set common high-good (R-E1) or good-moderate boundary (R-E2, R-E3,
R-E4) Table 5
4 only when available
SEBASTIAN BIRK UNIVERSITY OF DUISBURG-ESSEN
Implementation and communication of the WFD intercalibration exercise in the DRB Annexes
page 59
Table 5: 25th percentile common metric values per IC type and country
IC
quality
#
Struct-
%_EPT
country
# sampl #_fam
ASPT
type
range
sites
Index_fam
_fam
Czech R.
high
3
6
26
6,63
68,5
19,27
Hungary high 6 21 8 6,29 20,0 28,07
R-E1 Romania high 13 22 9 6,80 28,8 61,12
Slovak R.
high
11
31
23,5
6,85
74,5
25,49
Hungary high+good 13 13
14
6,90
25,0
21,68
R-E2 Romania high+good 6
11
12
5,44
18,5
20,39
Slovak
R.
high+good
3
8
12
5,74 27,5 8,54
Bulgaria high+good 5
8
16
5,43
15,3
32,00
R-E3 Hungary high+good 11 11 13 5,94
7,0
15,51
Austria
high+good
7
10
23,5
6,38 51,5 9,33
Hungary high+good 6
9
14
6,92
20,0
43,57
R-E4 Romania high+good 3 4 6 5,08
12,0
25,28
Slovak R.
high+good
4
11
19
6,05
46,0
15,97
Step 4a: Plausibility check of R-E1 high-good boundary values by comparion with
median values of common metrics derived from samples at R-E1 reference sites (Table 6)
Based on samples of R-E1 reference sites the median value of common metrics per
country was calculated following the procedure to define type specific reference values for
intercalibration in the Central-Baltic GIG. Analysis of reference values revealed the
following outcomes:
In general, country specific median values are only slightly exceeding the 25th percentile
boundary values.
Simple set of screening criteria seems more strict compared to extensive catalogue for
defining reference sites.
ASPT differences of reference sites between countries are low compared to other common
metrics (more robust with regard to sampling differences).
Argument for using the common ASPT threshold values as biological screening
criterion.
Similar sampling design of Czech and Slovak Republic is reflected by similar values.
Argument for direct comparison in the intercalibration of R-E1.
UNDP/GEF DANUBE REGIONAL PROJECT
page 60
Table 6: Median values of common metrics of samples at R-E1 reference sites
Struct-
country
# sites
# samples
#_fam
ASPT
%_EPT_fam
Index_fam
Czech Republic
3
10
28
6,64
67,0
26,00
Hungary 16
41
9
6,75
24,0
33,33
Romania
20 42 11
6,53 33,5 58,09
Slovak Republic
22
48
22,5
6,84
68,0
37,80
Step 5: Normalisation of common metrics using 25th percentile values, composition of
ICMi-EC (reflecting boundary value; see Table 5) and translation into national index values
via regression analyses Table 7 and Table 8
Table 7: Coefficients of determination gained in regression analyses of ICMi-EC against national
assessment methods
coefficient of
IC type
country
comment
determination
Slovak Republic
0,67
non-linear regression
Czech Republic
0,61
direct comparison of Slovak and Czech index
R-E1
Hungary
0,78
regression of ASPT against Hungarian ASPT
Romania 0,53
-
Hungary 0,44
-
R-E2
Romania 0,49
-
Slovak Republic
0,51
non-linear regression
Bulgaria 0,66
-
R-E3
low coefficient of determination in regression of
Hungary 0,31
ICMi against national index
Hungary 0,59
-
low coefficient of determination in regression of
Romania 0,25
ICMi against national index
R-E4
Austria 0,57
non-linear
regression
Slovak Republic
0,60
non-linear regression
SEBASTIAN BIRK UNIVERSITY OF DUISBURG-ESSEN
Implementation and communication of the WFD intercalibration exercise in the DRB Annexes
page 61
Table 8: Harmonised class boundary values of national assessment methods derived by applying common
boundary setting criteria
Boundary values are specified within a range of accepted variation of +/- 5% (lower and upper
confidence limit). This interval takes into account the systematic error and confidence bands of
the regression analysis.
confidence limit
IC type
country
boundary type
boundary value
lower
upper
high-good 0,74
0,69 0,79
Slovak Republic
good-moderate 0,54 0,49 0,59
high-good 1,33
1,26 1,40
Czech Republic
good-moderate 1,84 1,77 1,91
R-E1
high-good 6,39
6,79 5,99
Hungary
good-moderate 5,11 5,51 4,71
high-good 1,78
1,69 1,87
Romania
good-moderate 2,14 2,05 2,22
high-good 6,3
5,91 6,69
Hungary
good-moderate 5,25 4,86 5,64
high-good 1,81
1,72 1,90
R-E2
Romania
good-moderate 2,26 2,17 2,35
high-good 0,74
0,69 0,79
Slovak Republic
good-moderate 0,54 0,49 0,59
high-good 4-5
4-5 4-5
Bulgaria
good-moderate 3-4 3-4 3-4
R-E3
high-good 6,07
5,69 6,45
Hungary
good-moderate 5,06 4,68 5,44
high-good 7,79
7,30 8,28
Hungary
good-moderate 6,49 6,00 6,98
high-good 1,66
1,58 1,74
Romania
good-moderate 2,08 2,00 2,16
R-E4
high-good 0,79
0,74 0,84
Austria
good-moderate 0,59 0,54 0,64
high-good 0,72
0,67 0,77
Slovak Republic
good-moderate 0,52 0,47 0,57
Step 5a: Validation of intercalibration results of Austrian and Slovak assessment methods
using direct comparison of national indices Table 9 and Figure 2
Direct comparison of the Austrian and Slovak assessment methods for R-E4 was
performed to validate the results of indirect comparison using ICMi-EC. In Table 9 the
UNDP/GEF DANUBE REGIONAL PROJECT
page 62
Slovak boundaries that correspond to the Austrian boundaries derived from the common
boundary setting procedure are presented. The results show high agreement with the
outcomes of the indirect comparison.
Table 9: Slovak boundary values derived from regression analysis of direct comparison using Austrian
class boundaries derived from common boundary setting
high-good good-moderate
Slovak Republic
0,67 0,53
95% conf-interval
0,03 0,02
1,0
0,9
r2 = 0,784
0,8
0,7
0,6
I_SK 0,5
MM 0,4
0,3
0,2
0,1
MMI_SK = 0,1355+0,6752*x; 0,95 Conf.Int.
0,00,0 0,1 0,2 0,3 0,4 0,5 0,6 0,7 0,8 0,9 1,0
MMI_AT
Figure 2: Regression plot showing direct comparison of Austrian and Slovak assessment indices based on
Slovak data of stream type R-E4 (n=94)
Data gaps
The intercalibration of national assessment methods is strongly related to the quality of
datasets underlying the analysis. In this respect, great efforts were put into the selection
process of suitable data by the GIG countries. Nevertheless, some data gaps remained.
These gaps and alternative data handling are specified in Table 10.
SEBASTIAN BIRK UNIVERSITY OF DUISBURG-ESSEN
Implementation and communication of the WFD intercalibration exercise in the DRB Annexes
page 63
Table 10: Data gaps and alternative data handling in EC GIG analysis procedure
IC type
country comment
CZ
only 6 samples in subset
R-E1
HU
subset includes sites selected without "BOD5" criterion (missing data)
HU
subset was defined based on "land use index" criterion only (threshold <=50)
RO
subset includes 2 sites in hydromorphological quality class 3
R-E2
Only sites in severely altered hydromorphological conditions, therefore good-moderate
SK
boundary was derived by using 75th percentile value of common metrics.
R-E3
BG
subset includes 4 sites without "BOD5" data (missing data)
HU
subset includes sites selected without land use criterion (missing data)
R-E4
RO
only 4 samples in subset
SK
subset includes 3 sites selected without "BOD5" criterion (missing data)
UNDP/GEF DANUBE REGIONAL PROJECT
page 64
ANNEX D
Intercalibration of the Danube River (R-E6)
SEBASTIAN BIRK UNIVERSITY OF DUISBURG-ESSEN
Implementation and communication of the WFD intercalibration exercise in the DRB Annexes
page 65
Intercalibration of biological assessment methods for the Danube
River
Outline of general approach and presentation of preliminary results June 2006
Introduction
Biological assessment of the Danube River on the basis of the benthic
macroinvertebrate community is limited to the application of Saprobic Systems or Biotic
Indices to evaluate the degree of organic water pollution. Currently, no WFD compliant
classification method to assess the ecological status of the Danube River using benthic
macroinvertebrates is applied by the EC GIG countries. In general, two shortcomings
impede completed WFD compliant ecological assessment for the Danube River: (1) lack
of data derived from techniques to acquire representative samples of the
macroinvertebrate community from the different river habitats; (2) lack of near-natural
reference conditions.
Therefore, the intercalibration exercise performed for the Danube River (R-E6) focuses
on the comparison of national assessment indices used in regular water quality
monitoring of the Danube River. For the 5 countries participating in the EC GIG
intercalibration exercise these indices are listed in Table 1.
Table 1: National bioassessment methods to evaluate the water quality of the Danube River
country
assessment method
abbreviation
Austria
Austrian Saprobic Index
SI (AT)
Slovakia
Slovak Saprobic Index
SI (SK)
Hungary
Hungarian ASPT
ASPT (HU)
Romania
Romanian Saprobic Index
SI (RO)
Bulgaria
Bulgarian Biotic Index
BI (BG)
Methods
Based on analyses of the JDS 1 dataset, Stubauer and Moog (2003) proposed a basic
saprobic condition (=reference value) of SI (AT) = 2,00 for the Danube River below 200
m altitude, arguing against a section type specific differentiation of the basic saprobic
condition of the Danube River. Knoben et al. (1999) suggested a harmonised
saprobiological classification scheme for the Danube River (see class boundaries of the
Austrian Saprobic Index in Table 3). These recommendations formed the basis for the
intercalibration exercise of the Danube River.
Intercalibration of quality class boundaries was performed by direct comparison of
national assessment indices. Data from samples taken at the Danube River covered a
relatively short saprobiological gradient (difference between 25th and 75th percentile
values of Austrian SI: 0,11). Thus, direct index comparison was carried out analysing
data of all types included in the intercalibration exercise. In particular, the index
comparison covered pair-wise analyses of x: SI (AT) against y: SI (SK), x: SI (AT)
UNDP/GEF DANUBE REGIONAL PROJECT
page 66
against y: ASPT (HU), x: ASPT (HU) against y: SI (RO) and x: ASPT (HU) against y:
BI (BG). Via modelling using linear regression the reference value and the
saprobiological class boundary values were translated from the Austrian Saprobic Index
and the Hungarian ASPT into the national index values, respectively.
Results
Table 2 reveals the main descriptors of the correlation and regression analysis. In
Table 3 the harmonised class boundary values for the national assessment methods are
listed.
Table 2: Main statistics of the correlation and regression analyses
x-axis
SI (AT)
ASPT (HU)
n 360
SI (SK)
R square
0,91
regression equ.
y=1,22*x-0,56
n 360
ASPT (HU)
R square
0,43
y-
regression equ.
y=-1,81*x+9,55
axis
n
179
SI (RO)
R square
0,53
regression equ.
y=-0,26*x+3,38
n
32
BI (BG)
R square
0,73
regression equ.
y=1,77*x-2,80
Table 3: Harmonised national class boundary values for biological water quality assessment
of the Danube River
lower quality class boundary values
Reference
national index
high-good
good-moderate
moderate-poor
poor-bad
value
SI (AT)5 2,00
2,20 2,50 2,90 3,50
SI
(SK) 1,90
2,10 2,50 3,00 3,70
ASPT
(HU)
5,95
5,60 5,00 4,30 3,20
BI (BG)
4 to 5
4
3 to 4
3
2
SI
(RO) 1,80
1,90 2,10 2,30 2,65
5 Reference value acc. to Stubauer and Moog (2003); class boundary values acc. to Knoben et al.
(1999)
SEBASTIAN BIRK UNIVERSITY OF DUISBURG-ESSEN
Implementation and communication of the WFD intercalibration exercise in the DRB Annexes
page 67
Literature
Stubauer, I. & O. Moog, 2003. Integration of the Saprobic System into the assessment
approach of the WFD - a proposal for the Danube River. In Sommerhäuser, M., S.
Robert, S. Birk, D. Hering, O. Moog, I. Stubauer & T. Ofenböck (eds), Final Report of
the Activity 1.1.7 "Implementing ecological status assessment in line with requirements
of the EU Water Framework Directive using specific bio-indicators". University of
Duisburg-Essen, Essen and Vienna: 29-39.
Knoben, R. A. E., L. Bijlmakers & P. van Meenen, 1999. Water Quality Enhancement
in the Danube River Basin; subaction 2A: Waterquality classification/characterisation.
IWACO, 's-Hertogenbosch: 105 pp.
UNDP/GEF DANUBE REGIONAL PROJECT
Implementation and communication of the WFD intercalibration exercise in the DRB Annexes
page 69
ANNEX 2
CHECK LIST OF WFD COMPLIANT BIOLOGICAL
ASSESSMENT METHODS
UNDP/GEF DANUBE REGIONAL PROJECT
Implementation and communication of the WFD intercalibration exercise in the DRB Annexes
page 71
Check list of WFD compliant biological assessment methods
The EU Water Framework Directive (WFD) stipulates to monitor the ecological status
of surface waters using Biological Quality Elements (BQE). Quality classification is
done by biological assessment methods meeting specific requirements. This document
outlines the obligatory components of assessment methods complying with the demands
of the WFD.
0. Check List
Consideration of certain BQE parameters.
Ecological status assessment independent of pressures.
`Ecological Quality Ratio' based on type specific reference values.
5 classes of ecological quality.
`Good status' boundaries derived from intercalibration.
Worst BQE determines ecological status of water body (one out-all out).
Classification includes measure of uncertainty.
1. Indicative Parameters
For the different water categories (rivers, lakes, transitional and coastal waters) a
certain set of BQEs has to be monitored6. Ecological status classification is based on
particular parameters indicative of the BQE. The biological assessment methods must
include all these indicative parameters in the classification of ecological status. In
Table 1 indicative parameters are specified per surface water category and BQE.
6 surveillance monitoring: all BQEs; operational monitoring: BQEs most sensitive to specific pressures
UNDP/GEF DANUBE REGIONAL PROJECT
page 72
Table 1: Indicative parameters to be included in biological assessment methods for certain
surface water categories and BQEs (a undesirable disturbance to the balance of
organisms or water quality, b only lakes, c only Macroalgae)
ion
s
ity
ten
a
posit
n
r
Surface
t
o
o
ps
of
m
cts
fe
ou
Water
Biological Quality Element
tive
nd i
ms
ure
fts
f
maj
tive
Category
oo
mic co
nce
ct
tive taxa
u
ary ef
n
d
ss
ce o
mic gr
dica
no
e
ncy a
nda
gal bl
no
tio
Taxo
Abu
Ratio sensi
insensi
Diversity
Age str
Frequ
of al
Secon
Bacterial tu
Bioma
Absen
taxo
Taxa in
pollu
Phytoplankton
x
x
x
x
xb
Macrophytes and
x
x
x
x
Rivers and Phytobenthos
Lakes
Benthic invertebrate fauna
x
x
x
x
x
Fish fauna
x
x
x
x
Phytoplankton
x
x
x
x
x
Macroalgae and Angiosperms
x
x
xc
Transitional
Waters
Benthic invertebrate fauna
x
x
x
x
Fish fauna
x
x
x
Phytoplankton
x
x
x
x
x
Coastal
Macroalgae und Angiosperms
x
x
x
Waters
Benthic invertebrate fauna
x
x
x
x
2. Ecological Quality Assessment, Ecological Quality Ratio and Classification
The WFD concept of ecological status requires an assessment independent of
pressure. "Ecosystem health" has to be in the focus of biological monitoring. In practice,
this can be achieved by using multimetric indices combining the results of several
pressure specific indices. Multimetric indices provide multi-level outputs: The overall
results appraise ecological quality, while single indices inform about causes of
degradation. A "cook book" for the development of multimetric indices is provided by
Hering et al. (2006)7.
The biological assessment results need to be expressed using a numerical scale
between zero and one, the `Ecological Quality Ratio' (EQR). The EQR value one
represents (type specific) reference conditions and values close to zero bad ecological
status (Figure 1).
Ecological quality is classified by one of five classes (high, good, moderate, poor and
bad). To ensure comparability of the results of biological assessment methods the
7 Hering, D., Feld, C.K., Moog, O. and Ofenböck, T., 2006. Cook book for the development of a
Multimetric Index for biological condition of aquatic ecosystems: Experiences from the European
AQEM and STAR projects and related initiatives. Hydrobiologia 566, 311-324.
SEBASTIAN BIRK UNIVERSITY OF DUISBURG-ESSEN
Implementation and communication of the WFD intercalibration exercise in the DRB Annexes
page 73
boundaries of the good ecological quality status are harmonised by the intercalibration
exercise.
The WFD requires classification of water bodies at the level of the Quality Element.
The worst of the relevant Quality Elements determines the final classification ("One out,
all out" principle).
1
Hig
Hi h
g
Good
Para
Par m
a e
m t
e e
t r
e valu
val e
u
EQR
EQR
=
Modera
Moder te
a
Reference value
Poor
Bad
Ba
0
Biological
Biological
quality
quality
elements
elements
Figure 1: Graphical representation of the concept of the Ecological Quality Ratio (from van
de Bund and Solimini, 20068)
3. Type specific reference conditions
The natural conditions of a surface water body type define the reference of ecological
status assessment. Within types similar biotic communities are expected due to
homogeneous environmental conditions. Type specific assessment reduces the natural
variability and thus detects the anthropogenic influence on the biology more precisely.
Therefore, surface water types shall reflect biotic types, and it may be necessary to
establish different biotic typologies for the various BQEs. Channel substrate, for
instance, is an important factor for macrozoobenthic communities. Water alkalinity is
decisive for macrophytes and phytobenthos.
Type specific reference conditions can be derived by different methods:
1. Investigation of existing sites that are not or only minimally influenced by
human activity. General criteria for the selection of reference sites are given by
8 van de Bund, W. and Solimini, A.G., 2006. Ecological Quality Ratios for ecological quality
assessment in inland and marine waters. REBECCA Deliverable 10. JRC IES, Ispra. -
http://www.rbm-toolbox.net/docstore/docs/3.0.Deliverable_D10.doc
UNDP/GEF DANUBE REGIONAL PROJECT
page 74
the REFCOND guidance (CIS WG 2.3, 20039), more specific criteria and
threshold values have been elaborated within the intercalibration exercise (e.g.
Olsauskyte and van de Bund, 200710).
2. Modelling of reference conditions by prediction and historical data. Long-
lasting, ubiquitous anthropogenic activity especially in European lowland areas
limits the presence of existing reference sites. Knowledge about how indicative
parameters react to human pressure enables prediction of parameter values at the
absence of human influence. Historical records (e.g. old scientific literature, lake
sediments, historical maps) dating from times of low industrial and agricultural
intensity (usually end of 19th century and earlier) give information about natural
conditions.
3. Definition of reference conditions by expert judgment. In this option
information from a range of sources (e.g. monitoring data, relevant information
on background levels) shall be used to confidently derive reference values for
different Biological Quality Elements. This approach is only feasible if
references cannot be established using existing sites or modelling.
4. Confidence and Precision
The use of ecological data in environmental monitoring and assessment bears various
sources of uncertainty due to natural and/or methodological variability. The WFD
demands an "adequate confidence and precision" of biological assessment methods to
avoid misclassification of ecological status. Tools for the estimation of uncertainty are,
for instance, given by Clark (2004)11 and Brown and Heuvelink (2005)12.
9 CIS WG 2.3, 2003. Guidance on establishing reference conditions and ecological status class
boundaries for inland surface water. - http://www.minenv.gr/pinios/00/odhgia/7th_draft_refcond_final.pdf
10 Olsauskyte, V. and van de Bund, W., 2007. WFD intercalibration technical report. Joint Research
Centre, Ispra. -
http://forum.europa.eu.int/Public/irc/jrc/jrc_eewai/library?l=/intercalibration_2&vm=detailed&sb=Title
11 Clark, R.T., 2004. Error/uncertainty module software STARBUGS. User manual. CEH, Dorchester.
- http://www.ceh.ac.uk/products/software/software_starbugs.html
12 Brown, J.D. and Heuvelink, G.B.M., 2005. Data Uncertainty Engine (DUE) - User's Manual.
University of Amsterdam and Wageningen University and Research Centre, Amsterdam and
Wageningen. - http://161.67.10.126/harmonirib/download/WP2/DUE_MANUAL_V3.0.pdf
SEBASTIAN BIRK UNIVERSITY OF DUISBURG-ESSEN
Implementation and communication of the WFD intercalibration exercise in the DRB Annexes
page 75
ANNEX 3
COMMUNICATION PAPER ON GENERAL
PRINCIPLES, AIMS AND METHODS OF THE WFD
INTERCALIBRATION EXERCISE
UNDP/GEF DANUBE REGIONAL PROJECT

Implementation and communication of the WFD intercalibration exercise in the DRB Annexes
page 77
Communicating the intercalibration exercise in the Danube River
Basin general principles and methods of intercalibration
A. Background
A main environmental objective of the EU Water Framework Directive (WFD) is to
achieve "good ecological status" of all surface waters by 201513. Status monitoring of
water bodies is done by individual Member States using biological quality assessment
methods. Comparability of monitoring results is ensured by means of the intercalibration
exercise. Aim of intercalibration is the Europe-wide harmonised definition of "good
ecological status" according to Annex V of the WFD for all surface water categories
(rivers, lakes, transitional and coastal waters) and Biological Quality Elements.
B. Characteristics of national methods to monitor ecological water body
status
The Water Framework Directive provides the basis for water body monitoring:
Distinct groups of aquatic plants and animals (Biological Quality Elements) have to be
monitored. These groups are able to indicate various pressures on water bodies like man-
made modification, pollution or acidification.
The classification of the ecological water body status is based on biological assessment
methods using certain indicative parameters of the Biological Quality Elements (e.g.
taxa composition and abundance, taxa diversity, ratio sensitive to insensitive taxa etc.;
Table 1). The water body status not influenced by anthropogenic activity (=reference
state) is the benchmark for assessment. For each water body type individual reference
states are defined. Quality assessment results in Ecological Quality Ratios - numerical
values representing relative agreement with the reference state. Depending on the degree
of agreement ecological status is classified as "high", "good", "moderate", "poor" or
"bad" (Figure 1).
1
high
good
Observed Status
EQR =
moderate
Reference Status
poor
bad
0
13 European Commission, 2000. Directive 2000/60/EC. Establishing a framework for community
action in the field of water policy. European Commission PE-CONS 3639/1/100 Rev 1,
Luxembourg.
UNDP/GEF DANUBE REGIONAL PROJECT
page 78
Figure 1: Ecological Quality Ratio (EQR) and quality status classification
National methods to monitor the ecological status of the Biological Quality Elements
differ between Member States. These differences are due to the specific environmental
conditions of a country, the diverse types of pressure acting at water bodies, as well as
the non-uniform techniques of sampling and data analysis. While for the medium term
harmonisation of sampling and data analysis is planned by the European Standardisation
Committee (CEN)14, a general standardisation of biological assessment methods is not
foreseen. Therefore, the intercalibration exercise is required.
Table 1: Indicative parameters to be included in biological assessment methods for certain
surface water categories and BQEs (a undesirable disturbance to the balance of
organisms or water quality, b only lakes, c only Macroalgae)
ion
s
ity
ten
a
posit
n
r
Surface
t
o
o
ps
of
m
cts
fe
ou
Water
Biological Quality Element
tive
nd i
ms
ure
fts
f
maj
tive
Category
oo
mic co
nce
ct
tive taxa
u
ary ef
n
d
ss
ce o
mic gr
dica
no
e
ncy a
nda
gal bl
no
tio
Taxo
Abu
Ratio sensi
insensi
Diversity
Age str
Frequ
of al
Secon
Bacterial tu
Bioma
Absen
taxo
Taxa in
pollu
Phytoplankton
x
x
x
x
xb
Macrophytes and
x
x
x
x
Rivers and Phytobenthos
Lakes
Benthic invertebrate fauna
x
x
x
x
x
Fish fauna
x
x
x
x
Phytoplankton
x
x
x
x
x
Macroalgae and Angiosperms
x
x
xc
Transitional
Waters
Benthic invertebrate fauna
x
x
x
x
Fish fauna
x
x
x
Phytoplankton
x
x
x
x
x
Coastal
Macroalgae und Angiosperms
x
x
x
Waters
Benthic invertebrate fauna
x
x
x
x
C. Organisation of the intercalibration exercise
The intercalibration exercise is carried out by the EU Member States and facilitated by
the European Commission. As part of the Common Implementation Strategy (CIS)
endorsed by the Water Directors the intercalibration is part of the international working
group ECOSTAT (Ecological Status). To coordinate the scientific implementation of the
intercalibration exercise, the "European Centre for Ecological Water Quality and
Intercalibration (EEWAI)" of the Joint Research Centre in Ispra (Italy) has been
established.
14 Cardoso, A. C., A. G. Solimini, G. Premazzi, S. Birk, P. Hale, T. Rafael & M. L. Serrano, 2005.
Report on Harmonisation of freshwater biological methods. EUR 21769 EN. European
Communities, Ispra.
SEBASTIAN BIRK UNIVERSITY OF DUISBURG-ESSEN
Implementation and communication of the WFD intercalibration exercise in the DRB Annexes
page 79
Currently, intercalibration is conducted for rivers, lakes, coastal and transitional
waters, but only for selected water body types (intercalibration types), types of pressure
and Biological Quality Elements. Intercalibration is carried out in so called Geographical
Intercalibration Groups (GIGs) larger geographical units including Member States with
similar water body types.
D. Intercalibration types
Water bodies of comparable size, elevation, morphology and physico-chemistry in the
same region show similar biological communities. This enables grouping of individual
water bodies to water body types. The reference state - as benchmark of biological
assessment - is specified by the biological, chemical and hydromorphological
characteristics of the water body type.
Intercalibration types encompass water bodies of similar characteristics that can be
found in different Member States (e.g. small sandy rivers of the Hungarian Lowlands,
shallow mesohaline coastal waters of the Black Sea). The delineation of intercalibration
types is based on parameters like ecoregion, size, altitude, geology or salinity (Table 2).
In general, the intercalibration typology does not cover the complete national water
body typology. Several national types can possibly belong to a single intercalibration
type, or one intercalibration type is related to only a part of a national type.
Intercalibration of biological assessment methods is taking place among Member
States belonging to the same Geographical Intercalibration Group that share a common
intercalibration type.
Table 2: Common intercalibration types of the Eastern Continental GIG
abbreviation
type-name
ecoregion catchment
altitude
geology
substrate
Carpathians: small to medium,
gravel and
R-E1
10
10 - 1000
500 - 800
siliceous
mid-altitude
boulder
R-E2
Plains: medium-sized, lowland
11 and 12 100 - 1000
< 200
mixed
sand and silt
Plains: large and very large,
sand, silt and
R-E3
11 and 12
> 1000
< 200
mixed
lowland
gravel
Plains: medium-sized, mid-
sand and
R-E4
11 and 12 100 - 1000
200-500
mixed
altitude
gravel
Danube River: middle and
gravel and
R-E6
11 and 12
> 131000
< 134
mixed
downstream
sand
E. Intercalibration network
The Water Framework Directive stipulates to establish an intercalibration network. For
each intercalibration type Member States were asked to nominate two sites representing
the upper ("high-good") and lower ("good-moderate") boundary of good ecological
status according to the national assessment method. These intercalibration sites are
UNDP/GEF DANUBE REGIONAL PROJECT
page 80
compiled in the intercalibration register that has been published as a Commission
Decision15.
Although prescribed by the WFD the intercalibration sites are of limited benefit for the
actual intercalibration exercise. On the one hand intercalibration makes use of statistical
approaches that require extensive environmental data from sites in different ecological
status. On the other hand the intercalibration register has been designed in the year 2003
when most Member States held neither WFD compliant assessment methods nor
sufficient data to precisely evaluate the ecological status of the denominated
intercalibration sites.
F. Intercalibration approaches
Purpose of intercalibration is to ensure Europe-wide harmonised classification of good
ecological status by the national assessment methods. Put simply, intercalibration shall
assure that, for instance, a Romanian water body in good status according to the
Romanian assessment method would be classified as "good" by the Slovak or Bulgarian
method, if the same water body would be located at a Slovak or Bulgarian river.
By setting normative definitions for ecological status classification the WFD
establishes a basis for harmonised assessment. In the intercalibration exercise these
definitions are specified for the individual Biological Quality Elements and their
indicative parameters.
In general, intercalibration is carried out in a two-step approach:
1. Comparison of good quality status boundaries of national assessment methods
The ecological status is delimited by an upper ("high-good") and lower ("good-
moderate") boundary. Within the intercalibration exercise these boundaries are
compared among national assessment methods. Three different options are applied:
Option 1: Use of identical assessment methods. If countries are using the same
assessment method in quality monitoring, the quality boundaries can be compared
directly between countries.
Option 2: Use of common metrics. The purpose of common metrics is to translate the
results of national assessment methods into a general, thus comparable format. By means
of statistical methods national boundary values are transformed into common metric
values (Figure 2)16. Unlike nationally adapted methods common metrics are not designed
for quality monitoring due to their unspecific character.
15 European Commission, 2005: Commission Decision of 17 August 2005 on the establishment of a
register of sites to form the intercalibration network in accordance with Directive 2000/60/EC of the
European Parliament and of the Council.
16 Buffagni, A., S. Erba, S. Birk, M. Cazzola, C. Feld, T. Ofenböck, J. Murray-Bligh, M. T. Furse, R.
T. Clark, D. Hering, H. Soszka & W. v. d. Bund, 2005. Towards European Inter-calibration for the
Water Framework Directive: Procedures and examples for different river types from the E.C. project
STAR. 11th STAR deliverable. STAR Contract No: EVK1-CT 2001-00089. Quad. Ist. Ric. Acque
123: 1-468.
SEBASTIAN BIRK UNIVERSITY OF DUISBURG-ESSEN


Implementation and communication of the WFD intercalibration exercise in the DRB Annexes
page 81
Option 3: Direct comparison of national class boundaries at intercalibration sites.
Under certain conditions the application of different national assessment methods to the
same sampling site enables direct boundary comparison. For statistical reasons this
option encompasses more data than those included in the official intercalibration
register17.
0.83
0.75
0.68
MS C
x
Intercalibration-Index
MS B
-Inde
IC
National Index
MS A
Figure 2: Translation of Member States' (MS) class boundary values into Intercalibration
Index (common metric) using linear regression analysis.
2. Adaptation of national class boundaries to international requirements
In the intercalibration process threshold values for individual parameters of the
Biological Quality Elements are defined, mostly backed by up-to-date knowledge on
structural and functional aspects of aquatic ecosystems influenced by human activity.
For example: Nutrient enrichment caused by farming leads to accelerated growth of
phytoplankton in a lake. Water transparency becomes reduced and results in a loss of
macrophytes growing on the lake bottom. The maximum phytoplankton concentration
that has no effect on the lake's macrophyte composition can be defined as an
ecologically derived threshold value.
Within the Geographical Intercalibration Groups the agreement on threshold values for
the biological parameters establishes international benchmarks used in intercalibration.
With reference to these harmonised values the national class boundary settings are
compared. If significant deviations of national boundaries from the benchmark are
identified, Member States are asked to adjust to the international specifications.
17 Birk, S. & D. Hering, 2006. Direct comparison of assessment methods using benthic
macroinvertebrates: a contribution to the EU Water Framework Directive intercalibration exercise.
Hydrobiologia 566: 401-415.
UNDP/GEF DANUBE REGIONAL PROJECT
page 82
Methods and results of intercalibration for the individual Biological Quality Elements
are documented in the Intercalibration Technical Reports18. In general, Intercalibration
Option 2: Use of common metrics is most frequently used.
G. Conclusions and Outlook
The intercalibration forms an obligatory step in the implementation of the WFD.
Moremore, it represents a platform for a pan-European dialogue on environmental
objectives and the quality assessment of ecological surface water status. The WFD
required both the finalisation of the intercalibration exercise and the start of quality
monitoring programmes by end of 2006. Due to this tight schedule national development
of assessment methods and international comparison of quality class boundaries
currently run in parallel.
The intercalibration of methods using benthic macroinvertebrates in rivers holds a
leading role in the overall technical implementation. These methods have a long tradition
in European water quality assessment and are thus based on sound principles, validated
techniques and a large quantity of existing data. For other Biological Quality Elements
(phytoplankton, macrophytes and phytobenthos, fish fauna) or water categories (lakes,
transitional and coastal waters) intercalibration enables international cooperation in the
early stages of method development aiming at harmonised definition of good ecological
status. Nevertheless, the intercalibration process itself still allows for tailor-made
assessment methods following the individual requirements of the Member States.
In European water policy the entire intercalibration process represents a thematic and
organisational novelty. Its extension to end of 2007 is decided in order to ensure proper
fulfilment. Furthermore, it is considered to start a second round of intercalibration
beyond 2007 to overcome current difficulties such as data gaps and lacking national
assessment methods.
18 Olsauskyte, V. & W. van de Bund, 2007. WFD intercalibration technical report. Joint Research
Centre, Ispra. - http://forum.europa.eu.int/Public/irc/jrc/jrc_eewai/library
SEBASTIAN BIRK UNIVERSITY OF DUISBURG-ESSEN
Implementation and communication of the WFD intercalibration exercise in the DRB Annexes
page 83
ANNEX 4
CONTRIBUTION TO THE TISZA RIVER BASIN
MANAGEMENT PLAN 2009: "RIVER TYPES,
REFERENCE CONDITIONS AND WATER BODIES IN
THE TRB"
UNDP/GEF DANUBE REGIONAL PROJECT
Implementation and communication of the WFD intercalibration exercise in the DRB Annexes
page 85
THE TISZA RIVER AND ITS MAIN TRIBUTARIES
With 966 km the Tisza River is the longest tributary of the Danube, and the
second largest by flow, after the Sava River. The Tisza River Basin drains an
area of 157,186 km˛ in five countries: Ukraine, Romania, Hungary, Slovak
Republic, Serbia. The drainage basin encompasses 24 main tributaries, 17 2nd
order tributaries and 10 3rd order tributaries.
The Tisza can be divided into three main sections:
· the mountainous Upper Tisza in Ukraine, upstream of the Ukrainian-
Hungarian border (Vilok Tiszabecs),
· the Middle Tisza in Hungary and partly in Ukraine, which is joined by large
tributaries including the Bodrog and the Slaná/Sajó (both fed by water
from the Carpathian Mountains in Slovakia and Ukraine), as well as the
Somes/Szamos, the Crisul/Körös River System and the Mures/Maros from
Transylvania,
· the Lower Tisza downstream of the Hungarian-Serbian border, fed directly
by the Bega/Begej, and indirectly by other tributaries via the Danube
Tisza Danube Canal System.
UNDP/GEF DANUBE REGIONAL PROJECT
page 86
CHARACTERISATION OF SURFACE WATERS
1 Ecoregions in the Tisza River Basin
The Tisza River Basin (TRB) covers two ecoregions or parts thereof (see
Table 1). Ukraine, Romania and Slovak Republic have territories in both
ecoregions. Hungarian and Serbian parts of the TRB belong to ecoregion 11
(Hungarian Lowland).
Table 1 Ecoregions in the TRB
Ecoregion
Countries with territories in the TRB
10 The Carpathians
Ukraine, Romania, Slovak Republic
11 Hungarian Lowlands
Ukraine, Romania, Hungary, Slovak Republic, Serbia
In three countries (Hungary, Ukraine and Romania) the ecoregions were
divided into smaller geographical regions to address differences in river types
based on different landscape features or differences in the natural vegetation
or aquatic communities.
Hungary subdivided ecoregion 11 (Hungarian Lowland) into five sub-
ecoregions based on the topography and the (hydro-)geochemical character of
the region. The definition of Ukrainian sub-ecoregions based on geographic
and natural vegetation is under development. For the eastern part of the
ecoregion 10 (The Carpathians) the sub-ecoregion "Eastern-Carpathian
biogeographical sub-province, Zakarpattya district" was described. For the
ecoregion 11 (Hungarian Lowland) the sub-ecoregion "Forest-step province,
Zakarpattya lowlands" was delineated. Romania introduced a new sub-
ecoregion within ecoregion 10, the Carpathians. This sub-ecoregion is the
Transylvania Plateau, an inner mountain area that shows differences in
altitude, geomorphology and in the macroinvertebrate communities. For this
reason three sub-ecoregions or bio-ecoregions were delineated for the
ecoregion 10 and six for the ecoregion 11 (see Table 2).
SEBASTIAN BIRK UNIVERSITY OF DUISBURG-ESSEN
Implementation and communication of the WFD intercalibration exercise in the DRB Annexes
page 87
Table 2 Sub-ecoregions or bio-ecoregions in the TRB
Ecoregion
Country
Sub-ecoregions or bio-ecoregions
Eastern-Carpathian biogeographical sub-province, Zakarpattya
Ukraine
10
district
Romania
Carpathian Intramountain area
Ukraine
Zakarpattya lowlands / Forest-steppe province
Mountainous regions with calcareous character
Mountainous regions with siliceous character
11
Hungary
Hilly regions with calcareous covering layers
Plains with calcareous covering layers
Peaty areas
2 Typology of the Rivers in the Tisza River Basin
2.1 Typology Systems used in the TRB
Most countries in the Tisza River Basin (Ukraine, Romania, Hungary and
Serbia) applied System B according to Annex II of the WFD. Only the Slovak
Republic used System A.
The common factors used in all TRB typologies are the obligatory factors of
System A: ecoregion, altitude, catchment area and geology (see Table 3). But
most of the countries amended the classification according to their national
requirements. Their use in the TRB is described below.
Table 3 Obligatory factors used in river typologies
Descriptor
Country
Class boundaries
WFD
0-200 m
200-800 m
>800 m
Ukraine
0-200 m
200-800 m
>800 m
Romania
0-200 m
200-500 m
500-800 m
>800 m
altitude
Hungary
0-100 m
100-200 m
200-500 m
>500 m
Slovak Republic
0-200 m
200-500 m
500-800 m
>800 m
Serbia
0-200 m
200-500 m
500-800 m
>800 m
catchment
1,000-10,000
>10,000
WFD
10-100 km2
100-1,000 km2
area
km˛
km˛
1,000-10,000
>10,000
Ukraine
10-100 km2
100-1,000 km2 km˛
km˛
UNDP/GEF DANUBE REGIONAL PROJECT
page 88
1,000-10,000
>10,000
Romania
10-100 km2
100-1,000 km2 km˛
km˛
1000 -12,000
>10,000
Hungary
10-200 km2
100-2,000 km2 km2
km2
Slovak Republic
10-100 km2
100-1,000 km2 >1,000 km˛
100-
10-100
1,000-4,000
4,000-
>10,000
Serbia
1,000
km2
km˛
10,000 km˛ km2
km2
WFD siliceous
calcareous
organic
Ukraine siliceous
calcareous
organic
Romania siliceous
calcareous
organic
geology
Hungary siliceous
calcareous
organic
Slovak Republic
mixed
Serbia siliceous
calcareous
organic
Altitude
Ukraine applied the size-classes according to Annex II of the WFD. The other
countries set an additional class boundary at 500 m. Since most of the
Hungarian territory is located in the lowlands, class boundaries were adapted
in this regard.
Catchment area
In general, the size classes of System A were applied. Hungary, Slovak
Republic and Serbia introduced other class boundaries than those suggested in
the WFD. Hungary established overlapping class boundaries accounting for the
continuous changes observed in natural systems. Large rivers were not
differentiated into several size classes in the Slovak Republic. All rivers >
1.000 km˛ were pooled in one size-class. Serbia defined an additional
catchment area boundary at 4000 km˛.
Geology
The Directive delineates three main categories for geology: siliceous,
calcareous and organic. These categories were refined by most of the
countries. The Slovak Republic only used the category "mixed" in their
typology system.
Optional factors
Countries using System B used different optional factors to further describe
the river types. With six descriptors Romania employed the highest number of
optional factors (mean water slope, river discharge category, mean
substratum composition, mean air temperature, precipitation and yearly
SEBASTIAN BIRK UNIVERSITY OF DUISBURG-ESSEN
Implementation and communication of the WFD intercalibration exercise in the DRB Annexes
page 89
minimum specific monthly flow with 95% probability). All other countries used
mean substrate composition as the only optional factor within their System B
typology (see Table 4).
Channel substrate is differently defined by the countries. Both Ukraine and
Romania specified the substrate diameter (d) to differentiate size classes, but
boundaries were different: Romania defined blocks with d >200 mm, boulders
with d = 70 to 200 mm, gravel with d = 2 to 70 mm, sand with d = 0.05 to
2 mm, silt with d = 0.05 to 0.005 mm and clay with d <0.005 mm. Ukraine
delineated gravel and pebble with d < 70 mm, pebble and boulder with d = 70
to 150 mm and boulder with d > 150 mm. Hungary and Serbia differentiated
the substrate size classes "fine", "medium" and "coarse". For the Hungarian
system fine substrates are "mud", medium substrates are "sand" and coarse
substrates are "cobbles and pebbles". In Serbia a mixture of clay, silt, sand
and gravel is fine substrate, a mixture of sand, gravel and cobbles is medium
substrate and gravel, cobbles and boulders constitute coarse substrates.
Table 4 Optional factors used in the river typologies by countries using
System B
Descriptor
Country
Class boundaries
mean water slope
Romania
<10 p.m.
10-40 p.m.
>40 p.m.
high:
average:
minimum:
river discharge
Romania
>30 l/s km˛
3-30 l/s km˛
<3 l/s km˛
Ukraine gravel-pebble
pebble-boulder
boulder
Romania blocks
boulders
gravel
sand
silt clay
mean substratum
composition
Hungary fine
medium
coarse
Serbia fine
medium
coarse
mean air temperature
Romania
high: >8 °C
average: 0-8 °C
low: <0 °C
abundant:
average:
reduced:
precipitation
Romania
>800 mm
500-800 mm
<500 mm
yearly minimum specific
high:
average:
minimum:
monthly flow with 95%
Romania
>2 l/s km˛
0.3-2 l/s km˛
<1 l/s km˛
probability
UNDP/GEF DANUBE REGIONAL PROJECT
page 90
2.2 Typology of the Tisza River
The Tisza flows through or borders on territories of five countries (Ukraine,
Romania, Hungary, Slovak Republic and Serbia). These countries divided the
Tisza River into eight types altogether (see Table 5). The typologies of the
Tisza River were individually developed by the countries. Adjustment or
harmonisation on international level has not yet been completed. Therefore, 5
types were identified for the Upper Tisza: the Ukraine delineated three types
and both Romania and Slovak Republic one type. For the Middle Tisza two
types of the Hungarian typology were delineated, and for the Lower Tisza one
type by Serbia.
Table 5 Stream types defined for the Tisza River
Country
No
Name of the types
UA_2C: Large rivers, low mountains, calcareous
Ukraine
3
UA_1C: Large rivers, lowland
UA_1D: Very large river, lowland
Romania
1
RO_06: Stream sector with wetlands in hilly or plateau area
HU_14: Very large calcareous lowland stream
Hungary
2
HU_20: Very large calcareous lowland river
Slovak Republic
1
P1V_B1Large streams in Hungarian lowland
CS_Typ1.1: Very large rivers, lowland, siliceous, fine
Serbia
1
sediments
SEBASTIAN BIRK UNIVERSITY OF DUISBURG-ESSEN
Implementation and communication of the WFD intercalibration exercise in the DRB Annexes
page 91
2.3 Typology of the relevant tributaries in the TRB
In total, 40 stream types have been defined at relevant rivers of the Tisza
River Basin with catchment size >1,000 km˛ (see Table 6). In Annex xy all
stream types at relevant rivers are listed. This includes the eight types for the
Tisza River itself.
Table 6 Number of stream types defined in the TRB
Number of stream types defined
Country
for the relevant rivers in the TRB
Ukraine
7
Romania
12
Hungary
11
Slovak Republic
7
Serbia
3
Total number of types
40
The types of the TRB are evenly distributed on both ecoregions (see Table 7).
Only three types were delineated for the altitude class >800 m. The other
types were described for the low and medium altitude range. For each small,
medium and large rivers approximately the same number of types was
defined, considering that small and medium-sized rivers are merged in the
Romanian typology. For the very large rivers only 4 types were differentiated.
The ratio siliceous to calcareous stream types is approximately 1:1, only a few
types were described as being of mixed geology.
UNDP/GEF DANUBE REGIONAL PROJECT
page 92
Table 7 Number of types per ecoregion, altitude, catchment size and geology
class
Countries
Slovak
Total
Ukraine
Romania
Hungary
Serbia
Republic
number
Ecoregion
Ecoregion 10
5 7 - 6 -
18
Ecoregion 11
2 5 11
1 3
22
Altitude
<200 m
2 5 8 1 3
19
200-800 m
3 6 3 6 -
18
>800 m
2 1 - - -
3
Catchment size
small rivers
2 3
2
-
5
20
medium-sized rivers
2
3 2 1
large rivers
2 7 3 3 1
16
very large rivers
1 - 2 - 1
4
Geology
siliceous
- 12
- - 3
15
calcareous
7 - 11
- -
18
organic
- - - - -
0
mixed
- - - 7 -
7
SEBASTIAN BIRK UNIVERSITY OF DUISBURG-ESSEN
Implementation and communication of the WFD intercalibration exercise in the DRB Annexes
page 93
3 Reference conditions
Annex II 1.3 (i) WFD prescribes, that for each surface water type, type-
specific hydromorphological and physico-chemical conditions shall be
established representing the values of the hydromorphological and physico-
chemical quality elements specified for that surface water type at high
ecological status. Type-specific biological reference conditions shall be
established, representing the values of the biological quality elements for that
surface water type at high ecological status.
On the level of the Danube River Basin countries have agreed on general
criteria as a common base for the definition of reference conditions (see Table
8). These have then been further developed by the countries of the TRB on
the national level into type-specific reference conditions.
The definition of reference conditions was based on the following approaches:
· spatially based approach using data from monitoring sites, or
· approach based on predictive modelling, or
· definition of temporally based reference conditions using either
historical data or palaeo-reconstruction, or
· use of expert judgement (where none of the above methods was
possible).
Spatially based reference conditions and expert judgement were the two
methods predominantly used in the TRB. Methods were also combined to
derive reference conditions.
Use of spatially based data from monitoring sites
The method is based on the use of existing sites of high ecological status. In
the TRB (as in other European river basins) only few reference sites are
available, which fulfil all criteria mentioned in Table 8. Especially in the
lowlands, and for large rivers, undisturbed reference sites do not exist
anymore. Therefore, the description of reference conditions was based on best
available sites for these types. This method was used by all countries to
describe the reference conditions for benthic invertebrates, phytoplankton and
the fish fauna.
Use of expert judgement
In addition to spatially based reference sites, most countries applied expert
judgement for deriving reference conditions for respective biological quality
elements and the physico-chemical and hydromorphological elements.
UNDP/GEF DANUBE REGIONAL PROJECT
page 94
Historical reconstruction
Historical data were frequently applied to define reference conditions for
benthic invertebrate communities, the fish fauna and hydromorphology.
Predictive modelling
Predictive modelling was used to define macrozoobenthos and phytobenthos
reference conditions in the Slovak Republic. Ukraine and Serbia applied this
approach for defining the physico-chemical aspect of the references.
SEBASTIAN BIRK UNIVERSITY OF DUISBURG-ESSEN
Implementation and communication of the WFD intercalibration exercise in the DRB Annexes
page 95
Table 8 Basic criteria for defining reference conditions (harmonised basin-wide)
Basic statements
Reference conditions must be reasonable and politically acceptable.
Reference sites have to include important aspects of "natural" conditions.
Reference conditions should reflect no or minimum stress.
Land use in catchment area
Influence of urbanisation, land use and forest management should be as low as possible.
Stream and habitats
Reference sites should be covered by natural climax vegetation or unmanaged forests.
No removal of coarse woody debris.
No bed or bank fixation.
No obstructions that hinder the migration of organisms or the transport of bed material.
Only minor influence due to flood protection measures.
Bank and floodplain vegetation
Bank and floodplain vegetation should be present to allow lateral migration.
Hydrology and water management
No alteration of natural discharge regime.
No or only minor alteration of hydrology by dams, reservoirs, weirs, or sediment retaining structures
affecting the site.
No or only minor alteration of hydrology by dams, reservoirs, weirs, or sediment retaining structures
affecting the site.
No alteration of regime due to water diversion, abstraction, and no pulse releases.
Physico-chemistry
No point source of organic pollution.
No point source of nutrient pollution.
No sign of diffuse pollution inputs.
No acidification.
No liming.
No alteration of natural thermal regime.
No salinisation.
Biology
No significant impairment of the indigenous biota by introduction of animals and plants (e.g. in the
frame of fish farming).
Stream morphology
Morphological alterations do not influence biodiversity and ecological functioning.
Biomanipulation
No biomanipulation (e.g. in lakes).
Recreation uses
No intensive recreational use.
Biological quality elements
The TRB countries defined reference conditions for all relevant biological
quality elements except `macrophytes and phytobenthos' that was not
described by Ukraine (Table 9).
UNDP/GEF DANUBE REGIONAL PROJECT
page 96
The TRB countries used different indicative parameters to describe the
reference conditions for phytoplankton: Taxonomic composition was applied
by all countries. Abundance is considered by all countries except Ukraine. The
Slovak Republic additionally used phytoplankton biomass. The Saprobic Index
applied to phytoplankton taxa is used by Romania for reference definition.
For the biological element `macrophytes and phytobenthos' all countries
(except Ukraine) defined the reference conditions for taxonomic composition
and abundance. Romania defined reference conditions for phytobenthos; the
description of macrophytic references is under development. Hungary used
abundance only for macrophytes, while Serbia defined this parameter only for
phytobenthos. Furthermore, Serbia added the parameter diversity to the
description of reference state.
The variables taxonomic composition, abundance, diversity and the ratio
sensitive to insensitive taxa were used by all countries to define reference
conditions for benthic invertebrates. Romania defined type-specific
reference values for the Saprobic Index and for various other metrics (e.g.
total number of taxa, percent of Plecoptera taxa, Mayfly Average Score).
Reference values for the fish fauna were used by all countries, but different
indicative parameters were applied: Taxonomic composition was defined by all
countries. Age structure was considered by Romania, Hungary and Serbia. In
addition Serbia described fish diversity in reference state. The ratio `sensitive
to insensitive fish taxa' was applied by Ukraine and Romania. In the Slovak
Republic the definition of fish fauna references is in preparation.
The hydromorphological and physico-chemical reference conditions for
rivers were defined by Ukraine, Hungary and Serbia. For both Slovak Republic
and Romania the definition is still under development.
SEBASTIAN BIRK UNIVERSITY OF DUISBURG-ESSEN
Implementation and communication of the WFD intercalibration exercise in the DRB Annexes
page 97
Table 9 Definition of reference conditions for different indicative parameters
of biological quality elements (x parameter applies to quality element)
xa
t
axonomic
c
omposition
abundance
diversity
s
ensitive to
nsensitive ta
age structure
biomass
Phytoplankton
x x
Macrophytes
and
Phytobenthos
Ukraine
Benthic
Invertebrates
x x x x
Fish
Fauna
x x
Phytoplankton
x x
Macrophytes
and
Phytobenthos
x x
Romania
Benthic
Invertebrates
x x x x
Fish
Fauna
x x x x
Phytoplankton
x x
Macrophytes
and
Phytobenthos
x x1
Hungary
Benthic
Invertebrates
x x x
Fish
Fauna
x x x
Phytoplankton
x x x x x
Macrophytes
and
Phytobenthos x x x x
Slovak Republic
Benthic
Invertebrates
x x x x
Fish
Fauna
x x
Phytoplankton
x x x
Macrophytes and Phytobenthos
x
x1
x
Serbia
Benthic
Invertebrates
x x x
Fish
Fauna
x x x x
1 only Macrophytes
UNDP/GEF DANUBE REGIONAL PROJECT
page 98
4 IDENTIFICATION OF SURFACE WATER BODIES
According to Annex II 1.1 WFD "Member States shall identify the location and
boundaries of bodies of surface water ...". "A body of surface water means a
discrete and significant element of surface water such as a lake, a reservoir, a
stream, river or canal, part of a stream, river or canal, a transitional water or
a stretch of coastal water" (Art. 2. 10. WFD).
Water bodies need to be clearly identified. Certain rules apply for their
delineation. For this initial characterisation water bodies may also be
aggregated to form groups of water bodies of similar character. The surface
water categories have been identified in Chapter xy. The water bodies
described here refer to the Tisza River Basin overview map (see Map xy), i.e.
to those relevant on the basin-wide level. All other water bodies are dealt with
in detail in the National Reports (Part B). Ukraine has not finalised the
identification of water bodies.
16 water bodies were identified on the Tisza River. The number of water
bodies on the Tisza varied per country, e.g. on the Hungarian part of the Tisza
7 water body were delineated, on the Romanian and Slovakian part only one.
This means that the size of the water bodies also varies significantly. The
smallest water body on the Tisza is only 5 km long (Slovak Republic), the
longest is 159 km (Hungary). Table 10 and 11 give an overview of the
number of water bodies identified on rivers. So far, 203 water bodies have
been identified on the tributaries on the overview scale. Romania has the
largest number of water bodies but also the largest part of the basin. The
mean length of water bodies is 37 km on the tributaries, on the Tisza it is 62
km.
Table 10 Number and lengths of water bodies at the Tisza River
country
number
mean length [km]
min [km]
max [km]
Ukraine
5 35,5
13
75
Romania
1 61
-
-
Hungary
7 83,5
21
159
Slovak Republic
1 5
-
-
Serbia
2 80,5
63 98
16
SEBASTIAN BIRK UNIVERSITY OF DUISBURG-ESSEN
Implementation and communication of the WFD intercalibration exercise in the DRB Annexes
page 99
Table 11 Number and lengths of water bodies at tributaries of the TRB
country
number
mean length [km]
min [km]
max [km]
Ukraine
17 34
6
65
Romania
100 38,5
1
142
Hungary
43 39,5
7
94
Slovak Republic
30 34
5
91
Serbia
13 39,5
13
81
203
Table 12 and 13 give an overview of the main pressures at water bodies of
the Tisza and tributaries. For the Tisza water bodies various pressures were
determined. Morphological degradation is the most frequently specified for
water bodies at tributaries.
In summary, Ukraine, Romania, Slovak Republic and Serbia identified
morphological degradation and pollution at most of the tributary water bodies
(both 30 %), followed by alteration of hydrological regime (24 %) and
fishing/angling (16 %).
Table 12 Main pressures at water bodies of the Tisza River
country
total number of WBs
main pressure (named most frequently)
Ukraine
5
pollution, flood protection, fishing/angling
Romania
1
mining (UA), flood protection, fishing/angling
Hungary
7
no information
Slovak Republic
1
pollution, structural degradation
agricultural, urban and industrial land use, damming,
Serbia
2
navigation
Table 13 Main pressures at water bodies of tributaries in the TRB
country
total number of WBs
main pressure (named most frequently)
Ukraine
17
fishing/angling
Romania
100
morphological degradation
Hungary
43
no information
Slovak Republic
30
morphological degradation
Serbia
13
alteration of hydrological regime
UNDP/GEF DANUBE REGIONAL PROJECT
page 100
An overview of the number of Heavily Modified and Artificial Water Bodies in
the TRB is given in Table 14 and 15. Nearly half of the water bodies at the
Tisza River were provisionally identified as Heavily Modified Water Bodies
(HMWB). At the tributaries 53 % of water bodies are provisionally designated
HMWB. One-third of these water bodies are possible candidates for HMWB. At
the Tisza no Artificial Water Bodies (AWB) are reported. 17 AWB were
delineated at tributaries: 6 for Romania and 11 for Serbia.
Table 14 Number of Heavily Modified Water Body candidates (cand. HMWB)
and Artificial Water Bodies (AWB) at the Tisza River
country
total number of WBs
cand. HMWB
AWB
Ukraine
5 0
0
Romania
1
1 0
Hungary
7
3 0
Slovak Republic
1
0 0
Serbia
2
2 0
Table 15 Number of Heavily Modified Water Body candidates (cand. HMWB)
and Artificial Water Bodies (AWB) at tributaries in the TRB
country
total number of WBs
cand. HMWB
AWB
Ukraine
17
1
0
Romania
100
33 (plus 29 "possibly")
6
Hungary
43
7 (plus 10 "possibly")
0
Slovak Republic
30
4 (plus 21 "possibly")
0
Serbia
13
2 11
SEBASTIAN BIRK UNIVERSITY OF DUISBURG-ESSEN
Implementation and communication of the WFD intercalibration exercise in the DRB Annexes
page 101
ANNEX
Overview of all types for relevant rivers with catchment size >1,000 km˛ in the Tisza
River Basin
Country
Code
Name of river type
UA_ 2A
Small rivers, calcareous, low-mountain
UA_ 3A
Small rivers, calcareous, mid-mountain
UA_ 2B
Medium rivers, calcareous, low-mountain
Ukraine
UA_ 3B
Medium rivers, calcareous, mid-mountain
UA_ 1C
Large rivers, lowland
UA_ 2C
Large rivers, low-mountain
UA_ 1D
Very large river, lowland
RO_01
Mountain stream - Ecoregion 10
RO_02
High plateau or piedmonts stream - Ecoregion 10
RO_03
Stream sector in piedmont or high plateau area - Ecoregion 10
RO_04
Stream sector in hilly or plateau area - Ecoregion 10
RO_05
Stream sectors in intramountain depression - Ecoregion 10
Stream sector with wetlands in hilly or plateau area - Ecoregion
RO_06
10
Romania
RO_08
Stream sector in hilly or plateau area - Ecoregion 10
RO_10
Stream in plain area - Ecoregion 11
RO_11
Stream sector in plain area (1,000-3,000 km˛) - Ecoregion 11
RO_12
Stream sector in plain area (>3,000 km˛) - Ecoregion 11
RO_13
Stream sector with wetlands in plain area - Ecoregion 11
RO_32
Temporary stream in plain area - Ecoregion 11
Hungary
HU-Type 2
Small calcareous mountainous stream
HU-Type 5
Medium calcareous hilly stream
HU-Type 6
Large calcareous hilly stream
HU-Type 13
Large calcareous lowland stream
HU-Type 14
Very large calcareous lowland stream
HU-Type 15
Small calcareous lowland brook
HU- Type 16
Small with low slope calcareous lowland stream
HU- Type 17
Medium with low slope calcareous lowland stream
HU-Type 18
Middle calcareous lowland stream
HU-Type 19
Large calcareous lowland streams
UNDP/GEF DANUBE REGIONAL PROJECT
page 102
HU-Type 20
Very large calcareous lowland river
P1V - B1
Large streams, < 200 m, in Hungarian lowland
K2V - H1
Large streams, 200-500 m, Carpathians
K2V - H2
Large streams, 200-500 m, Carpathians
Slovak Republic K2M
Small streams, 200-500 m, Carpathians
K3M
Small streams, 500-800 m, Carpathians
K2S
Middle size streams, 200-500 m, Carpathians
K3S
Middle size streams, 500-800 m, Carpathians
CS_Typ1.1
Very large rivers, lowland, siliceous, fine sediments
Serbia
CS_V1_P4_SIL Large rivers, lowland, siliceous
CS_V1_P3_SIL Medium rivers, lowland, siliceous
SEBASTIAN BIRK UNIVERSITY OF DUISBURG-ESSEN