


May 2006
DEVELOPMENT OF OPERATIONAL TOOLS FOR
MONITORING, LABORATORY AND
INFORMATION MANAGEMENT
Objective 3: Options for developing WFD
type-specific quality nutrient standards in the
Danube River
Draft final report


AUTHORS
PREPARED BY:
Environmental Institute, s.r.o.
AUTHOR:
Paul Buijs
Environmental Institute, s.r.o.,
Okruzna 784/42, 972 41 Kos,
Slovak Republic
ei@ei.sk
DEVELOPMENT OF OPERATIONAL TOOLS FOR MONITORING, LABORATORY AND INFORMATION MANAGEMENT
Developing WFD type-specific quality standards for nutrients Ł Draft Final Report
page 1
TABLE OF CONTENTS
Executive summary .....................................................................................................5
1.
Introduction ..........................................................................................................6
1.1.
Departure points..................................................................................................6
1.2.
Report outline .....................................................................................................6
2.
Conceptual framework ............................................................................................7
2.1.
Positioning nutrients in the WFD ............................................................................7
2.1.1.
Some relevant WFD quotations ........................................................................7
2.1.2.
Nutrients and Ecological status.........................................................................7
2.1.3.
WFD normative definitions for nutrients.............................................................9
2.1.4.
How many classes? ........................................................................................9
2.1.5.
Type-specific criteria .................................................................................... 10
2.1.6.
One out, all out............................................................................................ 11
2.2.
...ensure the functioning of the ecosystem... ........................................................... 11
2.2.1.
Eutrophication ............................................................................................. 12
3.
Inventory of methods and approaches..................................................................... 13
3.1.
Austria ............................................................................................................. 13
3.2.
The Netherlands ................................................................................................ 13
3.3.
REBECCA.......................................................................................................... 13
3.3.1.
Lakes ......................................................................................................... 13
3.3.2.
Rivers ........................................................................................................ 15
3.4.
CIS Eutrophication Guidance ............................................................................... 16
3.5.
US-EPA ............................................................................................................ 16
4.
Summary of the 1st proposed Austrian guidelines for type-specific assessment of
general physico-chemical parameters in running waters............................................. 18
4.1.
Bioregions/ water bodies..................................................................................... 18
4.2.
Classification of high, good and moderate status based upon Saprobic Index .............. 19
4.3.
Derivation of type-specific quality standards for the physico-chemical parameters ....... 19
4.4.
The `class boundary - 0.125' criterion ................................................................... 20
4.5.
Cluster analysis ................................................................................................. 20
4.6.
Proposed type-specific quality standards for nutrients in Austrian running waters ........ 21
5.
Application of the Austrian proposed 1st draft method ................................................ 23
5.1.
Departure points: basic requirements ................................................................... 23
5.1.1.
Typology of the Danube River Basin; water bodies ............................................ 23
5.1.2.
WFD-compliant criteria for the assigning the biological status ............................. 25
5.1.3.
Monitoring data ........................................................................................... 26
5.2.
Applying the Austrian proposed 1st draft method: general requirements..................... 27
5.2.1.
Combining data sets ..................................................................................... 27
5.2.2.
Averaging data per cross section .................................................................... 28
5.3.
Applying the Austrian proposed 1st draft method for the year 2001 (Joint Danube
Survey) ...................................................................................................................... 28
5.3.1.
Descriptive findings: benthic invertebrate fauna ............................................... 28
5.3.2.
Combining data sets ..................................................................................... 30
5.3.3.
Selecting locations in accordance with the `class boundary - 0.125'
criterion...................................................................................................... 30
5.3.4.
Nitrate (NO3)............................................................................................... 32
5.3.5.
Ptot and PO4................................................................................................. 34
5.4.
Applying the Austrian proposed 1st draft method for the year 2004 (Aquaterra) .......... 36
UNDP/GEF DANUBE REGIONAL PROJECT
page 2
5.4.1.
Descriptive findings: benthic invertebrate fauna ............................................... 36
5.4.2.
Combining data sets ..................................................................................... 38
5.4.3.
Selecting locations in accordance with the `class boundary - 0.125'
criterion...................................................................................................... 38
5.4.4.
NO3............................................................................................................ 38
5.4.5.
Ptot and PO4................................................................................................. 39
5.5.
Preliminary synthesis: first lessons-learned from applying the Austrian 1st
proposed draft method ................................................................................................. 40
5.5.1.
General applicability to the mainstream of the Danube ...................................... 41
5.5.2.
Extensions and/or deviations from the Austrian 1st proposed draft
method ...................................................................................................... 41
5.5.3.
The calculated results ................................................................................... 43
5.6.
Black Sea perspective......................................................................................... 44
5.6.1.
Summary of the daNUbs final report ............................................................... 44
5.6.2.
Critical loads ............................................................................................... 46
5.6.3.
Nitrogen ..................................................................................................... 46
5.6.4.
Phosphorous ............................................................................................... 50
5.6.5.
Critical loads versus 90%-ile concentrations..................................................... 50
6.
Discussion........................................................................................................... 51
6.1.
Benthic invertebrate fauna .................................................................................. 51
6.1.1.
Data availability ........................................................................................... 51
6.1.2.
Quality status: metrics & index ...................................................................... 51
6.1.3.
The `class boundary Ł 0.125' criterion ............................................................. 51
6.2.
Physico-chemical data ........................................................................................ 52
6.2.1.
Physico-chemical `finger-printing' of the Danube Section Types........................... 52
6.2.2.
Different monitoring results between countries ................................................. 53
6.3.
The calculated 90%-iles...................................................................................... 53
6.3.1.
Robustness of the results .............................................................................. 53
6.3.2.
Type-specific features? ................................................................................. 53
6.4.
Black Sea perspective......................................................................................... 54
6.5.
Closing remarks................................................................................................. 54
7.
Conclusions and recommendations ......................................................................... 55
7.1.
Conclusions....................................................................................................... 55
7.2.
Recommendations ............................................................................................. 55
REFERENCES ............................................................................................................ 56
ANNEX 1: Overview of TNMN, JDS and AQUATERRA sampling sites within
Danube's Section Types ................................................................................ 59
ANNEX 2: Overview of selected JDS and AQUATERRA sampling sites for further
data processing for the underlying report ........................................................ 63
ANNEX 3: 90%-ile concentrations for the years 2001 and 2004 ....................................... 65
ANNEX 4: Summary statistics for pooled data at TNMN stations ....................................... 71
LIST OF TABLES
Table 1
Saprobic ground states (`high status') and corresponding definitions of good-
and moderate status (in: Deutsch & Kreuzinger, 2005) ........................................ 19
Table 2
Definition of Danube section types (from Table 11 in [ICPDR, 2005]) ..................... 23
Table 3
Number of water bodies on rivers on the DRBD overview scale (table 20 in
[ICPDR, 2005]) .............................................................................................. 24
ENVIRONMENTAL INSTITUTE
DEVELOPMENT OF OPERATIONAL TOOLS FOR MONITORING, LABORATORY AND INFORMATION MANAGEMENT
Developing WFD type-specific quality standards for nutrients Ł Draft Final Report
page 3
Table 4
WFD compliant assessment scheme with Saprobic indices for benthic
invertebrate fauna (in: Stubauer & Moog, 2003).................................................. 25
Table 5
Definition of `eligible SI values' with a SI ground state 2.00 ............................... 25
Table 6
Comparison of TNMN versus JDS macozoobenthos results..................................... 29
Table 7
Overview of selected sites: quality status according to the SI of the JDS................. 30
Table 8
NO3 concentrations (90%-ile values) at TNMN stations meeting the `class
boundary Ł 0.125' criterion in 2001 .................................................................. 32
Table 9
Ptot concentrations (90%-ile values) at TNMN stations meeting the `class
boundary Ł 0.125' criterion (2001)................................................................... 35
Table 10
PO4 concentrations (90%-ile values) at TNMN stations meeting the `class
boundary Ł 0.125' criterion (2001)................................................................... 35
Table 11
Quality status of AQUATERRA sites according to different calculation
methods [total = 30]....................................................................................... 36
Table 12
Comparison of TNMN 2004 versus Aquaterra macozoobenthos results .................... 37
Table 13
Overview of selected sites: quality status according to the SI of Aquaterra.............. 38
Table 14
NO3 concentrations (90%-ile values) at TNMN stations meeting the `class
boundary Ł 0.125' criterion in 2004 .................................................................. 38
Table 15
Ptot concentrations (90%-ile values) at TNMN stations meeting the `class
boundary Ł 0.125' criterion (2004).................................................................... 39
Table 16
PO4 concentrations (90%-ile values) at TNMN stations meeting the `class
boundary Ł 0.125' criterion (2004).................................................................... 40
Table 17
90%-values calculated for the Austrian bioregion FH, ground state SI
2.00; compared to study finding ....................................................................... 43
Table 18
2001 annual mean organic nitrogen concentrations.............................................. 49
Table 19
2004 annual mean organic nitrogen concentrations.............................................. 49
LIST OF FIGURES
Figure 1
Indication of the relative roles of biological, hydromorphological and physico-
chemical quality elements in ecological status classification (REFCOND
Guidance document, figure 3).............................................................................8
Figure 2
Overview of the 15 bioregions in Austria ............................................................ 18
Figure 3
Example of clustering of BOD5 values in the different bioregions............................ 21
Figure 4
Danube section types; the dividing lines refer only to the Danube River itself
(from Figure 8 in [ICPDR, 2005]) ...................................................................... 24
Figure 5
Longitudinal profile of the macrozoobenthos findings of the Joint Danube
Survey .......................................................................................................... 29
Figure 6
90%-ile nitrate concentrations at all TNMN stations in the year 2001...................... 34
Figure 7
90%-ile nitrate concentrations in the various section types for 2001 and
2004............................................................................................................. 34
Figure 8
Ptot concentrations (90%-ile values) along the Danube in 2001 and 2004............... 35
Figure 9
SI results of the AQUATERRA survey.................................................................. 36
Figure 10 Overview of average SI's in the overlapping stretch of Aquaterra and JDS............... 37
Figure 11 NO3 concentrations at TNMN stations in 2001 and 2004 (90%-ile values) ............... 39
UNDP/GEF DANUBE REGIONAL PROJECT
page 4
Figure 12 Longitudinal profile of Ptot and PO4 along the Danube in 2004 .............................. 40
Figure 13 Example of dispersion of substances in the Danube river:
Bulgarian/Romanian stretch 1991 ..................................................................... 42
Figure 14 Longitudinal profile of NH4 concentrations (90%-ile values) along the
Danube in 2001 and 2004. ............................................................................... 47
Figure 15 Average ratio of NO3, NO2 and NH4 in DIN along the Danube in the year
2001............................................................................................................. 48
Figure 16 DIN concentrations (NO3+NO2+NH4) along the Danube in the year 2004............... 48
Figure 17 Mean and 90%-ile NO3 concentrations along the Danube in 2001 .......................... 50
ABBREVIATIONS, ACRONYMS, DEFINITIONS
BLFUW
Bundesministerium f³r Land- und Forstwirtschaft, Umwelt und Wasserwirtschaft
(Federal Ministry of Agriculture, Forestry, Environment and Water Management)
DIN
dissolved inorganic nitrogen (NH4, NO2, NO3)
DIP
dissolved inorganic phosphorous
EQS
Environmental Quality Standard
L left
MZB
macrozoobenthos
N nitrogen
NH3
ammonia
NH
+
4
NH4 , ammonium
NL
The
Netherlands
NO
-
2
NO2 , nitrite
NO
-
3
NO3 , nitrate
NOEL
No Observed Effect Level
Ntot
total
nitrogen
P phosphorous
PO
3-
4
PO4 , ortho-phosphate
Ptot
total
phosphorous
Ptot(fil)
total phosphorous, after filtration
R right
rkm
river
kilometre
SI Saprobic
Index
TNMN
Transnational Monitoring Network
US-EPA
United States Environmental Protection Agency
ENVIRONMENTAL INSTITUTE
DEVELOPMENT OF OPERATIONAL TOOLS FOR MONITORING, LABORATORY AND INFORMATION MANAGEMENT
Developing WFD type-specific quality standards for nutrients Ł Draft Final Report
page 5
EXECUTIVE SUMMARY
The EU Water Framework Directive (WFD) expects Member States to define type-specific water
quality standards for quality elements like nutrients. An inventory of the current state in a number
of Member States as well as in international initiatives like REBECCA showed that no `ready and
easily applicable' methods for doing so are available yet, maybe with exception of a 1st draft
method developed in Austria in 2005.
This Austrian proposed 1st draft method essentially uses the following approach. The physico-
chemical monitoring data of (different types of) water bodies are combined with their (WFD-
compatible) quality status according to the Saprobic Index of the benthic invertebrate fauna. By
pooling the actual physico-chemical monitoring data per (type of) water body and quality class
(`high', `good', `moderate'), the resulting 90th percentile statistical values are proposed to represent
the boundaries between high/good either good/moderate status. Therewith serving the purpose of
providing WFD-compliant type-specific water quality standards.
The principles of the Austrian proposed 1st draft method have been applied to the mainstream of
the Danube River. Several gaps were identified during this exercise, among others: benthic
invertebrate fauna are not yet routinely monitored at all Transnational Monitoring Network (TNMN)
stations; no WFD-compliant metrics have been agreed yet like type-specific Ecological Quality
Ratios based upon benthic invertebrate fauna.
Being two important pillars of the Austrian proposed 1st draft method, a proper basis was lacking
for the underlying study for extending on its results in terms of proposing actual quality standards.
Statistics for instance could be associated with `high' as well as `good' status conditions, which of
course makes quite a difference. The table below therefore merely provides an indication for the
possible concentrations ranges one might be dealing with (with the TNMN data representing either
high/good or good/moderate class boundaries).
90%-values calculated for the Austrian bioregion FH, ground state SI 2.00; compared with study
findings
Austrian bioregion FH
Austrian bioregion FH TNMN
2001
TNMN 2004
high status
good status
min Ł max
min Ł max
90%-ile
90%-ile
90%-ile
90%-ile
NO3 [mg N/l]
4
5.5
1.3 Ł 3.7
1.3 Ł 3.8
PO4 [mg P/l]
0.1
0.2
0.03- 0.68
0.04 Ł 0.19
Ptot(fil) [mg P/l] 0.2
0.25
Pto
0.1 Ł 0.4
0.1 Ł 0.3
t
The underlying study indicated differences for several quality elements along the mainstream of
the Danube, with for instance apparently higher nitrate (NO3) concentrations in the upper half
reaches (with riverkilometer 1300 -possibly: the Iron Gates- seeming to be a pivotal area). Such
observations support the type-specific approach.
In order to be able to elaborate upon methods for defining type-specific quality standards, at least
some basic requirements will have to be met, including:
>
routine monitoring of biological quality elements at all TNMN monitoring, comprising at
least: benthic invertebrate fauna and phytoplankton (minimally: chlorophyll-a)
>
development of Danube Section Type metrics for biological quality elements, at least
comprising indices for benthic invertebrate fauna.
Since few basin-wide data are available so far, the coming 2007 Joint Danube Survey preferably
should be designed in such a way, that also data relevant for further establishing of type-specific
quality standards will be obtained.
UNDP/GEF DANUBE REGIONAL PROJECT
Chapter 1: Introduction
page 6
1. INTRODUCTION
Among the reports prepared under Phase 1 of the UNDP/GEF Regional Project, the report
"Orientation on environmental quality standards for nutrients and other Danube specific priority
substances" has been published [Buijs, 2003]. This report included a first exercise in formulating
Environmental Quality Standards (EQS) for nutrients in line with the WFD. While the report
adhered to the WFD denominators for "high" and "good" status, it did not apply a type-specific
approach. For instance: the proposed EQS for nutrients were derived from a rather generic pool of
water quality standards that also mixed standards for lakes and rivers. Not having applied the
type-specific approach was considered the major comment on the study.
The underlying report pursues the issue of developing type-specific nutrient standards for the
Danube. This study is part of the "Danube Regional Project - Component 2.2: Development of
operational tools for monitoring, laboratory and information management": Task 4: Development
of Water Quality Standards.
1.1. Departure points
In February 2006, an Interim Report has been prepared and its major findings presented during
the 1st Monitoring and Assessment Expert Group (MA EG) in Prague, 2-3 March 2006. The MA EG
encouraged the UNDP/GEF consultants to further elaborate on the EQS using the Austrian
approach. Accordingly, the activities after issuing the Interim Report focussed on elaborating this
approach. For the sake of completeness, the major findings of the Interim Report have been
incorporated in the underlying report, thus making this report a stand-alone version.
1.2. Report outline
The remainder of this report is structured in the following way.
>
Chapter 2 describes the conceptual framework for this study, elaborating two major
components: a) an overview of relevant Water Framework Directive text relating to
type-specific water quality standards and b) the more specific issues when dealing with
nutrients.
>
Chapter 3 includes the results as reported in the Interim Report of February 2006 with
a brief synthesis.
>
Chapter 4 describes the major features of the 1st proposal of the Austrian method:
"Leitfaden zur typspezifischen Bewertung der allgemeinen chemisch/physikalischen
Parameter in Flie▀gewõsser. 1. Vorschlag September 2005".
>
Chapter 5 contains the results of applying the 1st proposal of the Austrian method to
the mainstream of the Danube. This chapter also will reflect the findings in the
perspective of pollution of the Black Sea by the discharge of the Danube.
>
Chapter 6 discusses and evaluates the major findings of this study.
>
Chapter 7 is used for summarising the major conclusions and recommendations.
ENVIRONMENTAL INSTITUTE
DEVELOPMENT OF OPERATIONAL TOOLS FOR MONITORING, LABORATORY AND INFORMATION MANAGEMENT
Developing WFD type-specific quality standards for nutrients Ł Draft Final Report
page 7
2. CONCEPTUAL
FRAMEWORK
2.1. Positioning nutrients in the WFD
2.1.1. Some relevant WFD quotations
WFD Article 2.18 contains the following definition: `Good surface water status' means the status
achieved by a surface water body when both its ecological status and its chemical status are at
least `good'.
Following Article 2.21: `Ecological status' is an expression of the quality of the structure and
functioning of aquatic ecosystems associated with surface waters, classified in accordance with
Annex V1.
WFD Annex V.1.4.2.(i) mentions that "For surface water categories, the ecological status
classification for the body of water shall be represented by the lower of the values for the biological
and physico-chemical monitoring results for the relevant quality elements classified in accordance
with the first column of the table set out below." This table lists the five possible statuses (high,
good, moderate, poor, bad and their corresponding colour codes).
The definition of chemical status is defined in Article 2.24: `Good surface water chemical status'
means the chemical status required to meet the environmental objectives for surface waters
established in Article 4(1)(a), that is the chemical status achieved by a body of surface water in
which concentrations of pollutants do not exceed the environmental quality standards established
in Annex IX and under Article 16(7), and under other relevant Community legislation setting
environmental quality standards at Community level.
Annex V.1.4.3 further mentions "Where a body of water achieves compliance with all the
environmental quality standards established in Annex IX, Article 16 and under other relevant
Community legislation setting environmental quality standards it shall be recorded as achieving
good chemical status. If not, the body shall be recorded as failing to achieve good chemical status."
Nutrients are explicitly referred to in WFD Annex VIII.12: "Substances which contribute to
eutrophication (in particular, nitrates and phosphates)".
2.1.2. Nutrients and Ecological status
A popular figure often presented when dealing with the WFD's status classification is included in the
REFCOND Guidance Document [REFCOND, 2003] and shown below.
1 When mentioning `ecological status' in the underlying report also `ecological potential' (in relation with Artificial Water
Bodies and Heavily Modified Water Bodies) is refered to, unless mentioned otherwise.
UNDP/GEF DANUBE REGIONAL PROJECT
Chapter 2: Conceptual Framework
page 8
Figure 1
Indication of the relative roles of biological, hydromorphological and physico-
chemical quality elements in ecological status classification (REFCOND Guidance
document, figure 3)
WFD Annex V.1 distinguishes the group of `Chemical and physico-chemical elements supporting the
biological elements', consisting of:
> General
o Thermal conditions
o Oxygenation conditions
o Salinity
o Acidification status
o Nutrient conditions
> Specific pollutants
o Pollution by all priority substances identified as being discharged into the body of
water
o Pollution by other substances identified as being discharged in significant quantities
into the body of water
While the priority substances can be linked to the chemical status, the WFD is less explicit about
where to consider the other substances of the specific pollutants (compare the boxout below). The
general conditions, including nutrients, straight forwarded can be considered as belonging to the
physical-chemical conditions within the ecological status.
ENVIRONMENTAL INSTITUTE
DEVELOPMENT OF OPERATIONAL TOOLS FOR MONITORING, LABORATORY AND INFORMATION MANAGEMENT
Developing WFD type-specific quality standards for nutrients Ł Draft Final Report
page 9
Intermezzo:
Physico-chemical quality elements, general conditions, specific synthetic pollutants,
specific non-synthetic pollutants
The grouping of the physico-chemical quality elements in WFD Annex V (comprising general conditions, specific
synthetic pollutants, and specific non-synthetic pollutants) easily can lead to confusion. The RECOND Guidance
Document mentions the following in its section 2.6 Classification of ecological status [REFCOND, 2003].
(Author's note: figure 3 of the REFCOND Guidance document is Figure 1 of the underlying report.)
"There is a clear distinction between the role of general physico-chemical quality elements and specific
pollutants in classification of ecological status. In good ecological status, general physico-chemical quality
elements should not reach levels outside the range established to ensure ecosystem functioning and the
achievement of the values specified for the biological quality elements ((a) in the middle box in Figure 3) and
specific pollutants should meet the Environmental Quality Standards (EQS) set in accordance with section 1.2.6
in the Directive ((b) in the middle box in Figure 3).
Once European EQS have been established, priority substances are not included in the ecological status, but are
relevant for assessment of chemical status (Article 2, Annex X and Article 16(7) dealing with priority
substances). For the purpose of assessing ecological status the quality elements for specific pollutants listed in
Annex V, 1.1 and 1.2 ("specific synthetic pollutants" and "specific non-synthetic pollutants") must be
considered and their national quality standards must be met. Shifting of priority substances for which EU-wide
quality standards have been set from ecological to chemical state assessment does not compromise the good
status of a water body because for good status, both ecological and chemical status must be good."
2.1.3. WFD normative definitions for nutrients
Nutrients are addressed in the definitions of ecological status (WFD Annex V, table 1.2, physico-
chemical quality status) as follows:
>
High status: nutrient concentrations remain within range normally associated with
undisturbed conditions.
>
Good status: nutrient concentrations do not exceed the levels established as to ensure
the functioning of the ecosystem and the achievement of the values specified above
(author: this is a reference to table 1.1 in WFD Annex V) for the biological quality
elements.
>
Moderate status: Conditions consistent with the achievement of the values specified
above for the biological quality elements.
2.1.4. How many classes?
The way WFD Annex V.1.4.2.(i) is formulated implies that not only for the biological quality
elements, but also for the physico-chemical quality elements five status classes are to be
distinguished. On the other hand, Figure 1 suggests an explicit role of the physico-chemical quality
elements in the assessment for `high' and `good' status only.
Working Group 2 A Ecological Status (ECOSTAT) mentions the following [ECOSTAT 2003, Chapter
2, 2.6) "The values of the physico-chemical quality elements must be taken into account when
assigning water bodies to the high and good ecological status classes and to the maximum and
good ecological potential classes (i.e. when downgrading from high status/maximum ecological
potential to good ecological status/potential as well as from good to moderate ecological
status/potential). This is discussed in detail in Section 4. For the other status/potential classes the
physico-chemical elements are required to have conditions consistent with the achievement of the
values specified [in Tables 1.2.1 - 1.2.5] for the biological quality elements. Therefore, the
assignment of water bodies to moderate, poor or bad ecological status/ecological potential may be
made on the basis of the monitoring results for the biological quality elements. This is because if
the biological quality element values relevant to moderate, poor or bad status/potential are
achieved, then by definition the condition of the physico-chemical quality elements must be
UNDP/GEF DANUBE REGIONAL PROJECT
Chapter 2: Conceptual Framework
page 10
consistent with that achievement and would not affect the classification of ecological
status/potential."
Chapter 4 in [ECOSTAT, 2003] furthermore mentions "If the monitoring results for both the
biological quality elements and the general and specific physico-chemical quality elements in a
water body meet the conditions required for good ecological status/potential, the overall ecological
status/potential of the water body will be good. However, if one or more of the general physico-
chemical quality elements or specific pollutants do not meet the conditions required for good
ecological status/potential but the biological quality elements do, the overall ecological
status/potential will be moderate."
From the above it may be assumed that when dealing with nutrients (as part of the general
conditions) it suffices to establish criteria which allow for distinguishing `high', `good' and
`moderate' status. The latter follows when the `good' conditions criteria are not met. So, of major
interest will the values for the boundary between high and good status and the boundary between
good and moderate status.
2.1.5. Type-specific
criteria
The concept of type-specific conditions is introduced in WFD Annex II.1.3: Establishment of type-
specific reference conditions for surface water body types: "(i) For each surface water body type
characterised in accordance with section 1.1, type-specific hydromorphological and
physicochemical conditions shall be established representing the values of the hydromorphological
and physicochemical quality elements specified in point 1.1 in Annex V for that surface water body
type at high ecological status as defined in the relevant table in point 1.2 in Annex V. Type-specific
biological reference conditions shall be established, representing the values of the biological quality
elements specified in point 1.1 in Annex V for that surface water body type at high ecological status
as defined in the relevant table in section 1.2 in Annex V".
The conditions are to represent the values of a.o. physicochemical quality elements at high
ecological status for each surface water body type characterised in accordance with WFD Annex
II.1.1. The WFD does not explicitly mention establishing type-specific criteria for e.g. good or
moderate status. However, reasons to have to do so basically follow from the context of the (type-
specific) reference conditions. The "Overall Approach to the Classification of Ecological Status and
Ecological Potential" ECOSTAT, 2003] describes the necessity for type-specific `good status' levels
of physico-chemical quality elements as follows: "(4.2) The ranges and levels established for the
general physico-chemical quality elements must support the achievement of the values required for
the biological quality elements at good status or good potential, as relevant. Since the values for
the biological quality elements at good status will be type-specific, it is reasonable to assume that
the ranges and levels established for the general physico-chemical quality elements should also be
type-specific. Several types may share the same ranges or levels for some or all of the general
physico-chemical quality elements".
ENVIRONMENTAL INSTITUTE
DEVELOPMENT OF OPERATIONAL TOOLS FOR MONITORING, LABORATORY AND INFORMATION MANAGEMENT
Developing WFD type-specific quality standards for nutrients Ł Draft Final Report
page 11
Intermezzo: a more flexible definition for nutrients?
There seems to be an intriguing difference in the way WFD Annex 1.2.1 has formulated the normative
definitions for good status of the general conditions (bold typeface added by the author):
Temperature, oxygen balance, pH, acid neutralising capacity and salinity do not reach levels outside the range
established so as to ensure the functioning of the type specific ecosystem and the achievement of the values
specified above for the biological quality elements.
Nutrient concentrations do not exceed the levels established so as to ensure the functioning of the ecosystem
and the achievement of the values specified above for the biological quality elements.
For some reason, the normative definition for nutrients does not explicitly contain the words type specific. This
notice does not seem to imply that type specific characteristics are not to be taken into account at all when
setting quality standards for nutrients. Nevertheless, it may be interpreted as implying a bit more slack for the
nutrients than for the other general conditions quality elements.
2.1.6. One out, all out
The WFD expects all quality elements to comply with the criteria for good status in order for a
water body indeed to be qualified as such. Implying, that if just one of the quality elements is of
less than good status, the water body as such has to be qualified of no good status (hence
moderate or worse).
The quotations in section 2.1.3 once more illustrate this important principle: "...if one or more of
the general physico-chemical quality elements or specific pollutants do not meet the conditions
required for good ecological status/potential but the biological quality elements do, the overall
ecological status/potential will be moderate" [ECOSTAT, 2003].
The implications are obvious: setting too stringent nutrient standards might result in wrongly
qualifying waters as being of not good status. On the other hand: setting the standards too loose
might result in unfavourable conditions such that biological quality elements would not comply with
good status.
Intermezzo: adjusting quality standards
Guidance Document 13 on the Overall Approach to the Classification of Ecological Status and Ecological
Potential [ECOSTAT, 2003] addresses this topic in the following way: "4.4 The following sections outline a
checking procedure designed to ensure that the type-specific values established for the general physico-
chemical quality elements are no more or no less stringent than required by the WFD, and hence do not cause
water bodies to be wrongly downgraded to moderate ecological status or potential. The checking procedures
apply only in relation to values for the good-moderate status/potential boundaries. They apply where Member
States are confident that there is a real mismatch between the monitoring results for the biological and general
physico-chemical quality elements, and not just a mismatch resulting from uncertainties from monitoring. For
example, this will usually require evidence that there is a consistent mismatch from a significant number of
water bodies in the type. In checking whether the physico-chemical ranges are valid, there is a balance
between the scale of the discrepancy that can be demonstrated and the number of sites where the physico-
chemical data and the biological data are not compatible. For example, where there are only a few sites
monitored, it will be possible only to confirm large discrepancies. Even where the checking procedure applies, it
may not be appropriate to revise the level or ranges using the checking procedures if the established levels or
ranges are being exceeded because of temporary alterations to the values for the general physico-chemical
conditions due to unusual natural conditions, such as prolonged droughts or flooding."
2.2. ...ensure the functioning of the ecosystem...
While developing type-specific criteria for nutrients it has to be recognised that the WFD considers
nutrients as quality elements supporting the biological quality elements. As described in WFD
Annex V.1.2 under good status "Nutrient concentrations do not exceed the levels established so as
UNDP/GEF DANUBE REGIONAL PROJECT
Chapter 2: Conceptual Framework
page 12
to ensure the functioning of the ecosystem and the achievement of the values specified above for
the biological quality elements".
Levels of general conditions associated with e.g. good status are not an objective by themselves,
but expected to allow for a good status of the biological quality elements. Within the context of this
report, this can be converted into two (admittedly: a bit simplified) questions, looking at the same
problem from two different angles:
a) It is possible to predict the (high, good, moderate, poor, bad) status of the biological
quality elements from defined nutrient concentrations?
b) Is it possible to derive/predict quality standards for (high, good, moderate status for)
nutrients when the conditions of (high, good, moderate status for) the biological quality
elements are known?
Unfortunately, the answer to both questions is "no"; or at least "not really".
A good illustration to illustrate this situation is the notice included in one of the reports published
under the REBECCA project: "Although the impact of nutrient pressures on biological quality is
relatively well understood for lakes in qualitative terms, there has been very limited development
of quantitative dose response relationships, classification tools or models" [Heiskanen et. al.,
2005]. Even if for a certain lake (-type) validated quantitative relations have been established,
they cannot simply be transferred to any other lake, indeed because of the type-specific (and
sometimes also: site-specific) differences.
2.2.1. Eutrophication
Besides the ecotoxicological potential of ammonium (NH3), ammonium (NH4) and/or nitrite (NO2),
there seems to be consensus to regard nutrients under the WFD dominantly in the perspective of
eutrophication [DG Environment, 2005]. For all WFD biological quality elements eutrophication
phenomena can be distinguished, but often different (combinations of) conditions and mechanisms
will lead to the expression of eutrophication characteristics for each of them (compare also the
boxout below).
Intermezzo: eutrophication and the individual biological quality elements [in : DG Environment,
2005]
63.
As a general rule, aquatic flora quality elements will have an earlier response to nutrient conditions
than benthic invertebrates or fish fauna. The relative `sensitivity' of different aquatic flora to nutrient
enrichment may vary, depending on local circumstances, e.g. water category, surface water body type and the
nature of the pressure and transport of nutrient loading.
64.
For instance: phytoplankton, phytobenthos and macroalgae derive their nutrients from the water
column and, under the right conditions, can colonise, grow and reproduce quickly. As a consequence, they tend
to respond rapidly to changes in nutrient concentrations. However, these quality elements can also be
characteristically highly variable. This may make reliable assessments of their condition difficult.
65.
Rooted macrophytes and angiosperms derive their nutrients from sediments or from a combination of
sediments and the water column. Their response to nutrient enrichment tends to be slower than that of
phytoplankton, phytobenthos and macroalgae, and therefore may enable reliable assessments to be achieved
more easily. On the other hand, this relative `stability' means that assessments based solely on macrophytes
and angiosperms may in some situations fail to detect the early onset of eutrophication.
For instance. A commonly used indicator for eutrophication is phytoplankton (or its proxy:
chlorophyll-a). It already is a challenge by itself to establish nutrient concentrations levels
(thresholds) for the different types of water bodies with respect to phytoplankton. Having defined
such nutrient criteria for phytoplankton not automatically means that the conditions for the other
biological quality elements are also warranted. Chapter 3 contains more examples of complications
when dealing with the setting of (type-specific) water quality standards for nutrients.
ENVIRONMENTAL INSTITUTE
DEVELOPMENT OF OPERATIONAL TOOLS FOR MONITORING, LABORATORY AND INFORMATION MANAGEMENT
Developing WFD type-specific quality standards for nutrients Ł Draft Final Report
page 13
3.
INVENTORY OF METHODS AND APPROACHES
This chapter summarises the status as also has been reported in the Interim Report of February
2006.
3.1. Austria
Basically, only one method could be identified that deals with setting of type-specific criteria in line
with WFD-requirements and in such a way that the methodology could be `relatively easily'
replicated by others. In 2005, the Bundesministerium f³r Land- und Fortwirtschaft, Umwelt und
Wasserwirtschaft published a first proposal for guidelines for type-specific assessment of general
physico-chemical parameters in running waters [Deutsch & Kreuzinger, 2005]. This method will be
discussed into more detail in the next chapter.
3.2. The Netherlands
In the Netherlands, preliminary steps to setting differentiated nutrient criteria have been
undertaken several years ago. The related documents concerning differentiated nutrient criteria
definitely contain useful ideas and considerations for the purposes of setting WFD-compliant type-
specific criteria.
For example: at low discharge and stagnant sections, high algal biomass can occur in the River
Rhine. At present, these algal concentrations though are not experienced as a problem.
Nevertheless, target values for the River Rhine have been calculated in order to protect vulnerable
waters in downstream lakes of its delta, including coastal waters [Liere et.al. , 2002; several texts
sections have been translated into English; CIW, 2002]. Similar considerations can be expected to
be applicable for the Danube River, like in relation to the Black Sea. The type-specific context of
the WFD as such would not indicate formulating standards from this point of view.
However, contrary to what has been assumed when writing the Technical Proposal, no actual
method has yet been developed that already specifically deals with setting water quality standards
for nutrients in line with the type-specific requirements of the WFD. A working group for this task
became just operational during the last quarter of the year 2005. Outputs (made publicly available)
are not expected within the first half year of 2006.
3.3. REBECCA
The objective of the EU-funded research programme named REBECCA ("Relationships between
ecological and chemical status of surface waters") is to provide underpinning for one of the key
scientific principles on which the Water Framework Directive (WFD) is based, i.e. that relationships
between the biological state and physical and chemical properties of surface waters are sufficiently
well understood to enable the management of catchments and surface waters to achieve ecological
objectives. The outputs of this project are expected to present tools and/or methods supporting the
formulation of type-specific nutrient criteria. The current status is summarised in the following
subsections.
3.3.1. Lakes
In 2005, the report "Reference Conditions of European Lakes" has been published [Solheim, 2005].
The objective of this report is to present the state-of-the-art practice on methods used to assess
UNDP/GEF DANUBE REGIONAL PROJECT
Chapter 3: Inventory of methods and approaches
page 14
reference conditions in lakes, and to give a region- and type-specific overview of typical flora and
fauna for all the biological elements required in the Annex V of the Directive, as well as providing
reference values for the most relevant physico-chemical elements.
Although the report still is a draft, there seems to be no ground to expect some `ultimate solutions'
from the final report. This can be illustrated by the examples in the boxout below.
Intermezzo: Regression models for reference total phosphorus and chlorophyll(text quotes from
[Solheim, 2005])
(section 2.4.1)
The Morpho-Edaphic Index (MEI) model ... predicts reference total phosphorus concentrations (TP) resulting
from natural background loading in undisturbed watersheds, from the ratio of alkalinity or conductivity in lake
water to the lake mean depth. The model was originally based on data from of 53 cool-temperate lakes of
North America and Europe. However, the model has not been calibrated and tested for a wider variety of lakes.
In REBECCA the model has been recalibrated and tested with large regional reference lake data sets.
(section 4.1.4) Conclusions
Ę The MEI Model results strongly depend on data used. They would suffer very much upon an inaccurate
identification of reference lakes are true reference (sensu WFD) lakes.
Ę The data set is very much skewed towards Northern lakes. The results are probably robust only for lakes in
this geographic area and not for the other regions.
Ę The results that different GIG regions have different MEIalk models should be taken with care because of the
very low number of lakes from region other than Nordic.
Ę A validation run on a more robust dataset, especially including Central Baltic, Atlantic and possibly Alpine
lakes is needed before generalizing those conclusions.
Reference conditions for selected physicochemical elements
(section 4.1) Phosphorus
The analysis of the dataset (see point 2.1.5) has led to preliminary reference conditions for different GIG lake
types (table 4.2). The analysis revealed that reference conditions in most countries were relatively comparable
for a particular GIG lake. Some of the Central-Baltic types had substantially higher reference conditions than
other GIGs (Fig. 5), highlighting probably also differences in their criteria for selecting reference sites.
(section 4.2) Chlorophyll
The population approach cannot be used for all European lakes. In particular, there appear to be very few deep
and very shallow high alkalinity reference lakes in Europe. Of those lakes that Member States have designated
as reference, most are shallow or deep low alkalinity lakes. Most Northern GIG lake types and L-CB1 Central-
Baltic GIG type do, however, have sufficient data to have reasonable confidence in the results.
The analysis shows in particular that chlorophyll reference conditions appear to increase with decreasing depth,
decreasing altitude and increasing alkalinity. This is readily explained in terms of increasing light availability
throughout the growth season in shallower lakes, warmer waters (and less UV) in low altitude lakes and
naturally higher nutrient concentrations in more alkaline lakes ...
For the Northern GIG, there are sufficient data to compare reference conditions within a GIG type by country
(Fig. 5). This highlights that there are country-specific differences, for example median values (reference
conditions) for Finland were consistently higher than those of Norway for the same GIG type. The most likely
reason for this is more stringent criteria for selection of reference lakes in Norway, rather than Finland having
naturally more fertile waters within a lake type. Data from Sweden and the UK were more limited and showed
no consistent pattern of being lower or higher compared with Norway and Finland, but had median and 75th
percentile values broadly in agreement with each other and the other GIG countries. Ireland showed lower
median values than even Norway but only had data from 3 lakes.
The quotes once more show the general problem when dealing with the definition of type-specific
criteria: being that conditions indeed seem to be type-specific. Even when for a certain region and
or type of lakes relationships could be developed and validated, they not simply can be transferred
to other parts of Europe or other lake types. Furthermore, from the quoted examples one can infer
that to develop, use and/or calibrate a model, either to derive general principles otherwise, on
needs field data, either through dedicated investigations or from the routine monitoring
programmes.
ENVIRONMENTAL INSTITUTE
DEVELOPMENT OF OPERATIONAL TOOLS FOR MONITORING, LABORATORY AND INFORMATION MANAGEMENT
Developing WFD type-specific quality standards for nutrients Ł Draft Final Report
page 15
The report quoted above is limited to reference conditions. No outputs have yet been obtained
dealing with setting class boundaries for high/good and good/moderate status. A report entitled
"Current knowledge on indicators and methods for Water Framework Directive Ecological Status
Assessment." has been finished by the end of the year 2005 and should be published publicly
during the first half of the year 2006. When made available in time, the relevant information from
this report will be incorporated in the underlying study.
3.3.2. Rivers
The boxout below contains several quotes from the "Report on existing methods and relationships
linking pressures, chemistry and biology in rivers" (Andersen et. al., 2004). To a certain extent, the
overall pictures share several resemblances as summarised for lakes in the previous paragraph.
Notices like "It is usually assumed that phosphorus is the limiting nutrient for autotroph growth.
Now, this idea has to be reconsidered due to the number of cases where nitrogen has been found
limiting." seem to aggravate the situation.
Intermezzo: Excerpts from "Report on existing methods and relationships linking pressures,
chemistry and biology in rivers" [Andersen et. al., 2004]
4. Nutrients causing eutrophication
4.6 General conclusions
Qualitative effects of inorganic nutrient enrichment on autotrophs are well understood. ... Knowledge of
quantitative effects of nutrient enrichment is more variable. ... Quantitative relations between inorganic
concentrations and autotrophs have usually been carried out for biomass, a few times on indices. ... When
assessing species assemblages, nutrients may be included but their relative effect is masked by the other
habitat variables also included in the analysis. ... And few papers actually consider the nutrients from sediments
whereas macrophytes can uptake a significant amount of nutrients from their roots and phytobenthos can be
directly in contact with them.
In term of assemblages, most of the scientific efforts have focussed on diatoms and macrophytes; little work
has been done on phytoplankton assemblages. From these studies, indices, and classifications based on these
indices, have been developed for diatoms and macrophytes. They all have in common the fact that they
integrate the relative abundance of each species and their respective tolerance to nutrients.
Phytoplankton is considered to be a good indicator of eutrophication in slow-flowing deep lowland rivers
whereas phytobenthos would be a good one for all other types of rivers. The position of macrophytes is not so
clear. Indeed, link between macrophytes and inorganic nutrients is not as strong as for phytoplankton and
phytobenthos and macrophytes' biomass and composition would be mainly driven by the hydromorphology
characteristics of each site along the river. Macroinvertebrates and fish can be influenced by nutrient
enrichments. However, they are rarely directly influenced by nutrient concentrations but more through
repercussion of changes in the food web and the habitat.
Modelling of biomass of phytoplankton is the most developed modelling. Some models of diatoms' and
macrophytes' biomass have also been developed. However, there are very few models for the species
composition, especially for phytobenthos other than diatoms and phytoplankton. And the models developed
may apply only to restricted areas. Their validity when upscaling should be tested.
It is usually assumed that phosphorus is the limiting nutrient for autotroph growth. Now, this idea has to be
reconsidered due to the number of cases where nitrogen has been found limiting. The effects of the different
forms of nitrogen and phosphorus and the relative effects of sediments and water column on macrophytes and
phytobenthos have received little attention.
When determining species preferences or when analysing the effects of water quality on biota, effects of
inorganic nutrients and organic pollution are usually confounded. Distinguishing between these two pressures
would be fundamental in determining what to do to achieve a good status.
Few studies have focussed on the recovery of the river after reduction in either phosphorus or nitrogen (or
both) sources. This aspect should be considered fundamental in determining the measures Members of State
need to implement to achieve a good status.
UNDP/GEF DANUBE REGIONAL PROJECT
Chapter 3: Inventory of methods and approaches
page 16
The report quoted in this subsection was published in the year 2004. The General conclusions
mention, "The next task of the REBECCA WP4 work on rivers is to analyse and describe these
relationships based on information found in literature and especially from available monitoring
results from rivers covering both biological and chemical/physical quality elements. With the very
large number of possible biological quality metrics, the large number of different river types in EU
and the different types of pressures this is still a very ambitious task." Implying, that some
relevant outputs can be expected from the REBECCA WP4 group. The REBECCA report on "Current
knowledge on indicators and methods for Water Framework Directive Ecological Status
Assessment" (expected to be published publicly during the first half of the year 2006) furthermore
might contain useful additions2.
3.4. CIS Eutrophication Guidance
Version 11 of the draft Eutrophication Guidance (DG Environment, 2005) definitely contains much
useful information, from both a conceptual point of view, as well as addressing relevant points of
consideration. Unfortunately, the final version of this document also is not expected to contain the
`ultimate' recipes and methods for defining type-specific nutrient criteria, like for instance, in the
Danube Basin.
Nevertheless, the current version 11 of the draft document for instance contains a table, entitled:
"Table 4a: Progress in the development of new WFD-compliant assessment systems for
eutrophication in LAKES. Preliminary criteria and values (September 2005)". While being far from
complete, already sometimes figures are included under the columns `good' or `moderate'. Often,
reference is made to -data collected under- the REBECCA project either the GIG (Geographical
Intercalibrate Groups) under the activities of the ECOSTAT WG2.A.
3.5. US-EPA
Previous text sections several times illustrated that obviously one of the big problems when dealing
with the issue of defining WFD compliant type-specific criteria for nutrients indeed turns out to be
the `specific characteristics of water types'. For instance, mechanisms proven for Scandinavian
lakes not just can be transferred to Danubian lakes or -reservoirs.
From this point of view, it therefore does not seem to make much sense to make an outing to the
United States. However: the US-EPA has published a series of reports under the header
"Ecoregional Nutrient Criteria", which at least from a title point of view implies some resemblances
with the underlying settings. A first scan of the related documents3 though seems to indicate that
they contain useful material, if only from conceptual points of view.
For instance (and very in brief), one of the objectives was to define Ecoregional Nutrient Criteria,
which to some extent could be compared to having to define high status/reference conditions
under the WFD. In the overall approach, monitoring data formed an important basis, while
acknowledging the fact that not always (monitoring data of) undisturbed lakes might be available
in the ecoregion concerned. The approach can be illustrated with the following quotes (US-EPA
2000, Chapter 1): "Candidate reference lakes can be determined from compiled data and with the
help of Regional experts familiar with the lake resources of the area. There are two recommended
ways to go about this. One is to select those lakes believed to be minimally impacted by human
activity (e.g., with little or no riparian or watershed development). These lakes should be reviewed
2 While preparing this report in May 2006, the documents were not yet available through the Rebecca website
3 Downloable through the website: http://www.epa.gov/ost/standards/nutrient.html
ENVIRONMENTAL INSTITUTE
DEVELOPMENT OF OPERATIONAL TOOLS FOR MONITORING, LABORATORY AND INFORMATION MANAGEMENT
Developing WFD type-specific quality standards for nutrients Ł Draft Final Report
page 17
and visited to confirm their "natural" status. When satisfied with this list, a median value (adjusted
for seasonal and spatial variation) for TP, TN, chlorophyll a, Secchi depth, and other appropriate
enrichment indicators can be prepared for each lake based on existing and/or new data collections.
The upper 25th percentile of the frequency distribution of these reference lakes can then be
selected as the reference condition for each value (because these lakes represent the best
obtainable and most "natural" condition, some allowance for variation should be made) (Figure
1.4(a)).
Another option is to plot the frequency distribution of all of the lake data presently available by
each variable and selecting percentiles for TP, TN, chlorophyll a, Secchi depth, and other similarly
appropriate variables. The lower 25th percentile, reflecting high nutrient quality can be selected as
the reference condition for each value (because in this instance the pool of information likely
includes lakes of considerably less than "natural" trophic condition) (see Figure 1.4(b))."
The US-EPA documents seem to contain useful ingredients if only from a conceptual point of view.
The approach has been reported in this Interim Report merely at its face value. Nevertheless, what
indeed might be considered as appealing in the approach indicated above is, for instance, the
option to define `reference conditions', even when such kinds of waters actually are not available.
Of course, one might have to discuss refining criteria (like using "upper 90th / lower 10th
percentiles"), either argues the basic principle as such. But, considering the complexity as once
more expressed in for instance the REBECCA reporting series, a pragmatic way out finally might be
the only way to make progress, if only to lay a foundation ...
UNDP/GEF DANUBE REGIONAL PROJECT
Chapter 4: Summary of the 1st proposed Austrian guidelines for type-specific assessment of general physico-
chemical parameters in running waters
page 18
4.
SUMMARY OF THE 1ST PROPOSED AUSTRIAN GUIDELINES
FOR TYPE-SPECIFIC ASSESSMENT OF GENERAL PHYSICO-
CHEMICAL PARAMETERS IN RUNNING WATERS
The 1st proposal for the Austrian method for the type-specific assessment of physico-chemical
quality elements in running waters has been introduced in the previous chapter. This chapter will
go more into detail in the proposed guidelines and methodology. Unless otherwise mentioned, the
major data and information have been derived from [Deutsch & Kreuzinger, 2005; Kreuzinger,
2005]4.
It has not been feasible to contain all details in this report, since that would have implied more or
less an integrated translation of the reports [Deutsch & Kreuzinger, 2005; Kreuzinger, 2005] as
well as the relevant information contained in their supporting reports. Readers who are able to read
German texts are strongly advised to read the original reports in order to get the full picture.
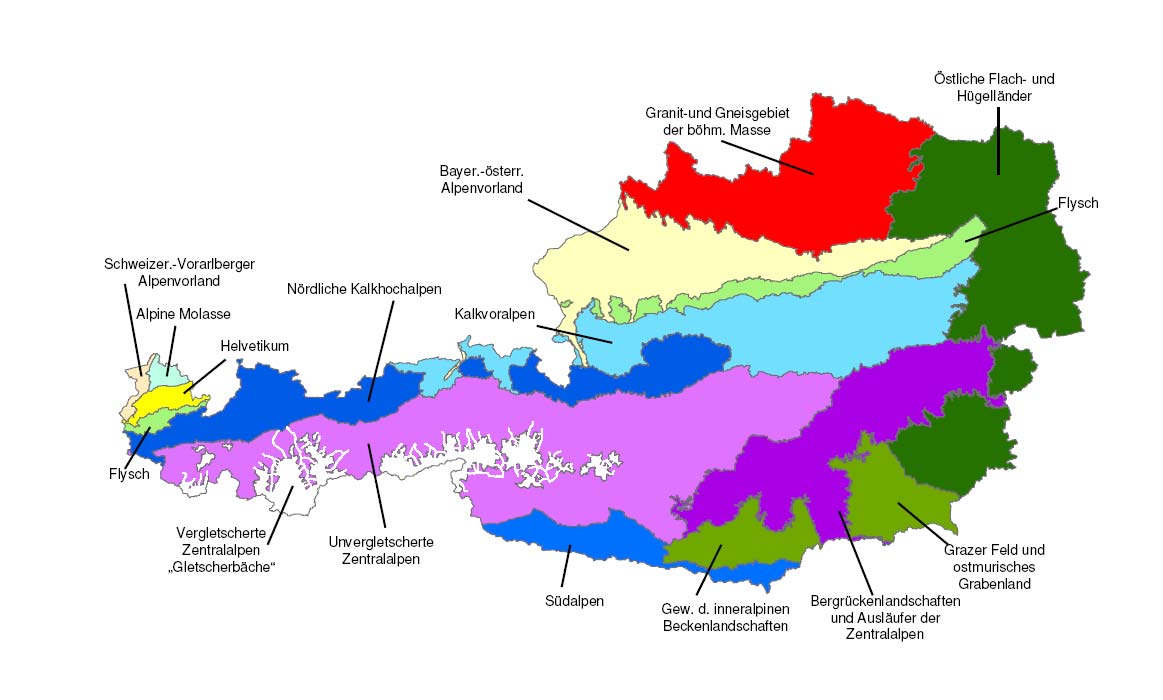
4.1. Bioregions/ water bodies
One of the reasons to elaborate the so-called bioregions for Austria was that the areas assigned in
the WFD as ecoregions were considered too large and broad [Moog, O et. al., 2001]. Furthermore,
the concept of the bioregions has been introduced in order to be able to extend on the abiotic
descriptors and physical/chemical factors underlying the typology according to the Systems A or B
of the WFD (WFD, Annex II).
For Austria, 17 running water type-regions and 9 special types (called "large rivers") have been
established. Building upon this division, 15 bioregions for running waters could be discriminated by
their aquatic biocoenosis; the "large rivers" were summarised into four units: Donau (Danube),
March/Thaya, Rhein (Rhine) and Alpenfl³sse (alpine rivers).
Figure 2
Overview of the 15 bioregions in Austria
4 The text of this chapter has been screened by the authors, with their remarks being incorporated
ENVIRONMENTAL INSTITUTE
DEVELOPMENT OF OPERATIONAL TOOLS FOR MONITORING, LABORATORY AND INFORMATION MANAGEMENT
Developing WFD type-specific quality standards for nutrients Ł Draft Final Report
page 19
Primarily based on macrozoobenthos data, for each of the bioregions the saprobic ground state was
determined. The saprobic ground state can have four values (Saprobic Index): 1.25, 1.5, 1.75 or
2. This saprobic ground state can differ within one bioregion, when further taking into account the
catchment area (size of the surface area) and the altitude. The possible subdivisions of the
bioregions result into a total 45 water types for the whole of Austria5.
It turned out, that the division of the running waters in Austria following physico-chemical
characteristics matched quite well with the bioregions. Because of the more direct links with the
(hydro-)biology, the bioregions with the associated saprobic ground states prevail as the smallest
working units (hence are preferred over a subdivision of nature areas based upon water-chemistry)
also for assessing quality standards for physico-chemical parameters.
4.2. Classification of high, good and moderate status based upon
Saprobic Index
Based upon other research works, for each of the four saprobic ground states criteria have been
formulated which can be used as delimiters for good- and moderate status (the saprobic ground
state itself can be considered equivalent to high status). The Saprobic Indices associated with the
class boundaries between high/good and good/moderate are included in the table below.
Table 1 Saprobic ground states (`high status') and corresponding definitions of good- and
moderate status (in: Deutsch & Kreuzinger, 2005)
SI (saprobity index)
High status
Good status delta
Moderate Status
(saprobic ground state)
1.25
2
+ 0.75 > 2
1.5
2.1
+ 0.6
> 2.1
1.75
2.25
+ 0.5
> 2.25
2
2.4
+ 0.4
> 2.4
4.3. Derivation of type-specific quality standards for the physico-
chemical parameters
The data obtained from the monitoring in the year 2003 formed the basis for the further
calculations. For the whole of Austria, this comprised about 350 measuring points, with monthly
measurements for general physico-chemical parameters. In addition, saprobiological investigations
were conducted at these monitoring locations.
During the data processing, a wide number of parameters were taking into consideration, for
instance using ion-balances for plausibility checks, as well as for chemical verification of the
typology of the bioregions. For nutrient conditions, the following parameters were used:
>
nitrate (NO3_N)
>
ortho-phosphate (PO4_P)
>
total phosphorous (after filtration)
5 The "Summary report of the characterisation, impacts and economics analyses required by Article 5" mentions that for
natural water bodies in Austria, 50 types of rivers and 11 types of lakes were identified (BLFUW, 2006).
UNDP/GEF DANUBE REGIONAL PROJECT
Chapter 4: Summary of the 1st proposed Austrian guidelines for type-specific assessment of general physico-
chemical parameters in running waters
page 20
Other nutrients which have as well a toxical relevance (e.g. Ammonium and Nitrite) are regulated
within the Austrian Regulation of Quality Standards6, which stresses the precautionary principle
and hence is not regulated type specific. Although these parameters were as well included in the
considerations.
Based upon their position and by overlaying the type maps, the related type, i.e. the combination
of bioregion and saprobic ground state, was assigned to each measurement point. The monitoring
locations along the "large rivers" and "other special waters" were not taken into consideration. The
exclusion of the monitoring sites along the "large rivers" is motivated by the fact that the larger
rivers actually represent a mix of different bioregions.
After removing these locations, 246 measurement points remained. Based upon the measured SI
for 2002/2003, the locations were assigned a status in accordance with the values mentioned in
Table 1. 65 locations were of high status, 141 locations of good status, and the remaining 40
locations of moderate status.
4.4. The `class boundary - 0.125' criterion
Since the aim was to formulate quality standards for the class boundaries (high/good,
good/moderate), the remaining 246 locations were furthermore reduced. Only those locations were
selected, where the measured SI deviated not more than -0.125 units (implying a better status)
from the respective class boundaries:
class boundary Ł 0.125 < SI measurement point class boundary
The data from the monitoring sites meeting this `class boundary Ł 0.125' sites were pooled and
general statistics were calculated like total number, minimum, maximum, mean, median, 90%-
percentile and standard deviation.
The 90%-percentile values are chosen for setting the quality standards for good and moderate
status.
4.5. Cluster analysis
Not always for all types and class boundaries measurement data were available. Such gaps were
tried to be solved by means of a cluster analysis. For the cluster analysis of each parameter, the
data were used of those measurement locations whose corresponding quality status was "high",
while taking the bioregions into account. For instance, it turned out that the BOD5 concentrations in
the bioregions GG, KV, FL and BR for the different saprobic ground states were comparable or
showed similar features otherwise (compare Figure 3 below). Under the assumption that such
similarities also will be the case for the other quality classes (good, moderate), then the known
90%-percentile of one bioregion might be used to derive the 90%-percentile value for another
bioregion. In the Austrian study, this approach was used to complete the tables for those
parameters and bioregions without Łsufficient- data (without actually deriving the 90%-percentile
for those types).
6 http://ris1.bka.gv.at/authentic/index.aspx?page=hit&q_datum_von=2006-03-02&q_datum_bis=2006-03-02&sort=bgblnrup
ENVIRONMENTAL INSTITUTE
DEVELOPMENT OF OPERATIONAL TOOLS FOR MONITORING, LABORATORY AND INFORMATION MANAGEMENT
Developing WFD type-specific quality standards for nutrients Ł Draft Final Report
page 21
Figure 3
Example of clustering of BOD5 values in the different bioregions
4.6. Proposed type-specific quality standards for nutrients in
Austrian running waters
The 90%-ile values are chosen for setting the quality standards for good and moderate status. The
final results for the nutrients NO3, PO4 and Ptot(fil) are shown in the tables below. Blank entries in
the tables indicate that this water body type does not exist in Austria.
Bioregion
NO3_N
[mg
N/l]
Saprobic
ground
state
1.25
1.5
1.75
2
high status
good status high status
good status high status
good status high status
good status
90-
90-
90-
90-
90-
90-
90-
90-
percentile
percentile
percentile
percentile
percentile
percentile
percentile
percentile
AV
1.5 2.5 2 3.5
AM 1.5 2.5 2 3.5
BR 1 2.5 1.5 2.5 2 3.5
FH 2 4 3 4.5 4 5.5
FL 0.5
2 1 2
1.5
2.5
GF
1.5 2.5 2 3.5
GG
1 2.5 1.5 3.5 2.5 4
HV 0.5
1.5
1 2
IB 1
2.5
1.5
3
KH 0.5
1.5
1 2
KV 0.5
1.5 1 2 1.5
2.5
SA 0.5
1.5
1 2
UZA 0.5 1.5 1 2 1.5 2.5
VAV 1.5 2.5 2 3.5
VZA 0.5 1.5 1 2 1.5 2.5
UNDP/GEF DANUBE REGIONAL PROJECT
Chapter 4: Summary of the 1st proposed Austrian guidelines for type-specific assessment of general physico-
chemical parameters in running waters
page 22
Bioregion
PO4_P
[mg
P/l]
Saprobic
ground
state
1.25
1.5
1.75
2
high status
good status high status
good status high status
good status high status
good status
90-
90-
90-
90-
90-
90-
90-
90-
percentile
percentile
percentile
percentile
percentile
percentile
percentile
percentile
AV
0.03 0.07 0.03 0.08
AM
0.02 0.05 0.04 0.08
BR
0.02 0.05 0.04 0.1 0.05 0.15
FH
0.05 0.1 0.07 0.15 0.1 0.2
FL
0.01 0.04 0.02 0.05 0.03 0.08
GF
0.04 0.1 0.05 0.1
GG
0.02 0.05 0.03 0.07 0.05 0.1
HV
0.01 0.04 0.02 0.05
IB
0.05
0.1
0.07
0.15
KH
0.01 0.04 0.02 0.05
KV
0.01 0.04 0.02 0.05 0.04 0.08
SA
0.01 0.04 0.02 0.05
UZA 0.01 0.04 0.02 0.05 0.04 0.08
VAV
0.02 0.05 0.03 0.08
VZA 0.01 0.04 0.02 0.05 0.04 0.08
Bioregion
Ptot(fil)
[mg
P/l]
Saprobic
ground
state
1.25
1.5
1.75
2
high status
good status high status
good status high status
good status high status
good status
90-
90-
90-
90-
90-
90-
90-
90-
percentile
percentile
percentile
percentile
percentile
percentile
percentile
percentile
AV
0.04
0.1
0.05
0.15
AM
0.03 0.08 0.05 0.1
BR
0.03 0.07 0.05 0.08 0.07 0.15
FH
0.07 0.15 0.1 0.25 0.2 0.25
FL
0.02 0.05 0.03 0.06 0.05 0.1
GF
0.05
0.1
0.07
0.15
GG
0.03 0.07 0.04 0.1 0.07 0.15
HV
0.02 0.05 0.03 0.06
IB
0.07
0.15
0.1
0.2
KH
0.02 0.05 0.03 0.06
KV
0.02 0.05 0.04 0.07 0.05 0.1
SA
0.02 0.05 0.03 0.06
UZA 0.02 0.05 0.03 0.06 0.05 0.1
VAV
0.03 0.06 0.05 0.1
VZA 0.02 0.05 0.03 0.06 0.05 0.1
ENVIRONMENTAL INSTITUTE
DEVELOPMENT OF OPERATIONAL TOOLS FOR MONITORING, LABORATORY AND INFORMATION MANAGEMENT
Developing WFD type-specific quality standards for nutrients Ł Draft Final Report
page 23
5.
APPLICATION OF THE AUSTRIAN PROPOSED 1ST DRAFT
METHOD
The 1st Monitoring and Assessment Expert Group meeting (Prague, 02 Ł 03 March 2006)
encouraged the underlying study to further elaborate on the Austrian proposed 1st draft method.
The mainstream of the Danube has been selected as study area.
5.1. Departure points: basic requirements
One can distinguish at least three basic requirements for applying the Austrian proposed 1st draft
method:
a)
Water bodies, assigned in line with WFD typology requirements.
b)
WFD-compliant criteria for assigning the biological status.
c)
Monitoring data, at least for:
o benthic invertebrate fauna;
o pshysico-chemical quality elements, notably: nutrients.
5.1.1. Typology of the Danube River Basin; water bodies
Along the mainstream of the Danube River, 10 section types have been identified. For each section
type, morphological and habitat characteristics have been outlined (compare for instance [ICPDR,
2005]). Some of the relevant details are included in the table and figure below.
Table 2 Definition of Danube section types (from Table 11 in [ICPDR, 2005])
Section Type
from Ł to
1: Upper course of the Danube
rkm 2786: confluence of Brigach and Breg Ł rkm 2581: Neu Ulm
2: Western Alpine Foothills Danube
rkm 2581: Neu Ulm Ł rkm 2225: Passau
3: Eastern Alpine Foothills Danube
rkm 2225: Passau Ł rkm 2001: Krems
4: Lower Alpine Foothills Danube
rkm 2001: Krems Ł rkm 1789.5: G÷ny/Klizskß Nemß
5: Hungarian Danube Bend
rkm 1789.5: G÷ny/ Klizskß Nemß Ł rkm 1497: Baja
6: Pannonian Plain Danube
rkm 1497: Baja Ł rkm 1075 : Bazias
7: Iron Gate Danube
rkm 1075: Bazias Ł rkm 943: Turnu Severin
8: Western Pontic Danube
rkm 943: Turnu Severin Ł rkm 375.5: Chiciu/Silistra
9: Eastern Wallachian Danube
rkm 375.5: Chiciu/Silistra Ł rkm 100: Isaccea
10: Danube Delta1
rkm 100: Isaccea Ł rkm 20 on Chilia arm, rkm 19 on Sulina arm and
rkm 7 on Sf. Gheorghe arm
1 Within this section the Danube divides into the three main branches of the Danube Delta. Each arm also has transitional
waters with the following limits: Chilia arm: rkm 20 Ł 0, Sulina arm: rkm 19 Ł 0, Sf. Georghe arm: rkm 7 Ł 0.
UNDP/GEF DANUBE REGIONAL PROJECT
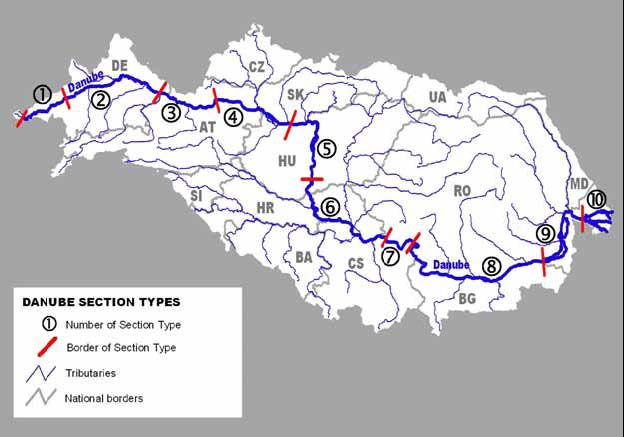
Chapter 5: Application of the Austrian proposed 1st draft method
page 24
Figure 4
Danube section types; the dividing lines refer only to the Danube River itself
(from Figure 8 in [ICPDR, 2005])
Quoting [ICPDR, 2005] "44 water bodies have been identified on the Danube River. Two of these
are shared by the Slovak Republic and by Hungary. The number of water bodies on the Danube
varies per country, e.g. on the German part of the Danube 15 water bodies were delineated, on the
Bulgarian part only one. This means that the size of the water bodies also varies significantly. The
smallest water body on the Danube is only 7 km long, the longest is 487 km."
Table 3 Number of water bodies on rivers on the DRBD overview scale (table 20 in [ICPDR,
2005])
DE AT CZ SK HU SI HR BA CS BG RO MD UA
15
6 - 3*
4* - 2 - 9 1 6 na na
* Two of these water bodies are shared by SK and HU.
No further details about the individual water bodies could be obtained while compiling this report.
Therefore, the processing of data has been grouped per section type. As such, this approach still is
in line with the type-specific requirements for this study, since the major differences in typology
coincide with the section types. Therewith, the main typology of the individual water bodies would
be determined by the section in which they are situated.
ENVIRONMENTAL INSTITUTE
DEVELOPMENT OF OPERATIONAL TOOLS FOR MONITORING, LABORATORY AND INFORMATION MANAGEMENT
Developing WFD type-specific quality standards for nutrients Ł Draft Final Report
page 25
5.1.2. WFD-compliant criteria for the assigning the biological status
Much information already has been compiled with respect to hydrobiological (reference) conditions
in the Danube basin (compare for instance `WFD Roof Report' ANNEX 3: Typology of the Danube
River and its reference conditions [ICPDR, 2005]). Nevertheless, currently no WFD-compliant
metrics yet (officially) have been defined or agreed.
In order to be able to apply the Austrian methodology, the following approach has been selected
for the underlying study. In their report "Integration of the Saprobic System into the Assessment
Approach of the WFD Ł a Proposal for the Danube River", Stubauer & Moog mention the following
[Sommerhõuser et. al., 2003]: "The SI of 2.0 as the highest threshold reference value seems to be
a good estimate not only for the Austrian part of Danube in Ecoregion 11, but also for the Danube
sections downstream. Quite similar saprobic indices around 2.1 have been observed along the
entire stretch of the Danube below the borderline of Ecoregion 9 and 11. Based on these findings, a
saprobic index of 2.0 is recommended as class boundary of the saprobic reference condition." 7
This proposed class boundary value matches with the Austrian classification system as introduced
in chapter 3. In their presentation "Integration of the Saprobic System into the WFD approach - A
proposal for the Danube River" for the 2nd Surface Water Workshop in Zagreb, 4-5 September
2003, Stubauer and Moog showed an extended version of the Austrian assessment scheme that
also includes class boundaries for moderate/poor and poor/bad status [Stubauer & Moog, 2003].
Table 4 WFD compliant assessment scheme with Saprobic indices for benthic invertebrate
fauna (in: Stubauer & Moog, 2003)
Ecological status class Saprobic reference condition (range of Saprobic index)
I Ł High
1.0
1.25
1.50
1.75
2.00
II Ł Good
1.01 Ł 1.75 1.26 Ł 2.00 1.51 Ł 2.10 1.76 Ł 2.25 2.01 Ł 2.40
III Ł Moderate
1.76 Ł 2.25 2.01 Ł 2.50 2.11 Ł 2.60 2.26 Ł 2.75 2.41 Ł 2.90
IV Ł Poor
2.26 Ł 2.75 2.51 Ł 3.00 2.61 Ł 3.10 2.76 Ł 3.25 2.91 Ł 3.40
V
Ł
Bad
>2.75 >3.00 >3.10 >3.25 >3.40
Following the hypothesised `high-status' ground state of SI 2.00, the accompanying class
boundaries (including the `class boundary Ł 0.125' criterion) are the following.
Table 5 Definition of `eligible SI values' with a SI ground state 2.00
Ecological status
Range of Saprobic
Ecological status class
`Eligible ranges' for further data
class
index
boundary
processing
I Ł High
2.00
High / Good
1.875 < SI 2.00
II Ł Good
2.01 Ł 2.40
Good / Moderate
2.275 < SI 2.40
III Ł Moderate
2.41 Ł 2.90
Moderate / Poor
2.775 < SI 2.90
IV Ł Poor
2.91 Ł 3.40
Poor / Bad
3.375 < SI 3.40
V Ł Bad
>3.40
7 ANNEX 2: `Overview of river types in the Danube River Basin District' in the `WFD Roof Report 2004' [ICPDR ,2005] contains the
following details for Austria:
Ę
Code: AT_ST_Large Rivers_Danube_Type d-1,75. Name of river type: River Danube, Saprobiological Basic Condition = 1,75
Ę
Code: AT_ST_Large Rivers_Danube_Type e-2,00. Name of river type: River Danube, Saprobiological Basic Condition = 2,00
UNDP/GEF DANUBE REGIONAL PROJECT
Chapter 5: Application of the Austrian proposed 1st draft method
page 26
Intermezzo: differences with the classification used in the JDS reporting
In the reporting of the Joint Danube Survey of 2001, the transformation of the saprobic indices to biological
water quality classes was established following the Austrian standards ųNORM M 6232, shown below (quoted
from TABLE MZB-1 in [ICPDR, 2002])
Saprobity
Interval of saprobic indices
Saprobiological water quality class
oligosaprobic
< 1.25
I (unpolluted)
oligosaprobic to -mesosaprobic
1.25 to 1.75
I-II (low polluted)
-mesosaprobic
1.76 to 2.25
II (moderately polluted)
-mesosaprobic to -mesosaprobic
2.26 to 2.75
II-III (critically polluted)
-mesosaprobic
2.76 to 3.25
III (strongly polluted)
-mesosaprobic to polysaprobic
3.26 to 3.75
III-IV (very high polluted)
polysaprobic
> 3.75
IV (excessively polluted)
The differences with the classes used for the underlying study are substantial.
5.1.3. Monitoring
data
In order to apply the Austrian proposed 1st draft method, at least two sets of monitoring data are
needed:
a) benthic invertebrate fauna, in order to assign a status quality class to the water bodies
concerned;
b) physico-chemical quality elements (notably nutrients) monitored at the water bodies
concerned8.
With the focus set on the Danube's mainstream, the data collected within the Transnational
Monitoring Network (TNMN) prevail for the purposes of the underlying study. Unfortunately, so far
only few countries have included benthic invertebrate fauna in the routine monitoring of the TNMN
sites along the Danube, being: Germany, Austria, Slovakia and Hungary (status at least as up to
and including 2004).
Two sets of data on macrozoobenthos exist that encompass wider stretches, being the data
collected during:
>
the Joint Danube Survey (JDS) of 2001, comprising data from Neu-Ulm at river
kilometre (rkm) 2581, up to the Sulina arm at rkm 12;
>
the Aquaterra survey of 2004, where samples have been taken between rkm 1942
(Klosterneuburg) and rkm 795 (Calafat).
Therefore, these two years of observations (2001 and 2004) have been selected for the underlying
study. With the JDS and Aquaterra providing the major hydrobiological data, the TNMN data are
the major source for physico-chemical data.
8 As mentioned in the previous subsection, for the underlying study data are grouped per section type.
ENVIRONMENTAL INSTITUTE
DEVELOPMENT OF OPERATIONAL TOOLS FOR MONITORING, LABORATORY AND INFORMATION MANAGEMENT
Developing WFD type-specific quality standards for nutrients Ł Draft Final Report
page 27
5.2. Applying the Austrian proposed 1st draft method: general
requirements
This section is first of all dedicated to recording general experiences gathered while applying the
Austrian proposed 1st draft method. The actual results will be presented and discussed in the next
sections.
5.2.1. Combining data sets
Following the principles of the Austrian proposed 1st draft method, monitoring data will be used
when available for the water bodies concerned. If no monitoring data are available for certain (sets
of) water bodies, they might be inferred by means of cluster-analyses (compare subsection 4.5;
this option has not been substantiated in the underlying study, also because the section types were
selected as the basic units, instead of individual water bodies).
Data on benthic invertebrate fauna data along wider stretches of the Danube currently only are
available via the Joint Danube Survey (JDS) of 2001 and the AQUATERRA survey of 2004. The
reported river kilometres of the JDS and the AQATERRA sampling sites not necessarily coincide
with those of the TNMN stations. In order to link the JDS/AQUATERRA biological (benthic
invertebrate fauna) data with the physico-chemical TNMN data the following criteria has been used
in the present study:
a) TNMN versus JDS/AQUATERRA sampling sites differ no more than 10 rkm. Ten river
kilometres is a rather arbitrary criterion, but has been introduced to emphasise that data
sets should somehow coincide in terms of space and distance. There seems no need to
insist on an exact match. Generally, requirements for sampling sites may differ. While
bridges are quite popular for taking water samples for physico-chemical quality elements,
they are not favourable sites for sampling benthic invertebrate fauna.
b) In case locations were sampled both within 10 rkm upstream and downstream sites, the
upstream sampling/monitoring data are selected. For example: for TNMN L2370, rkm
1258, Novi Sad, two JDS sampling sites are within a reach of 10 rkm, being: JDS51, rkm
1259, upstream Novi Sad and JDS52: rkm 1252, downstream Novi-Sad. In this case, the
data of JDS51 prevailed. Although these also distance-wise are closest, the major
underlying reason has been that the JDS52 site might be impacted by local sources from
Novi Sad (see also below).
c) `Expert judgement'. One set of data that would comply with the criteria above has been
omitted, being the combination TNMN L2170, rkm 1874, Wolfsthal and JDS15: rkm 1881,
upstream Morava (Hainburg) / ADS 3: rkm 1881, upstream Morava (Hainburg). The reason
for doing so is that the tributary Morava discharges in between the JDS/AQUATERRA sites
and the TNMN monitoring station. The TNMN samples at Wolfstahl are taken at the right
bank, so basically no influence of the Morava can be expected in these samples. Since the
overall approach has been to use the average of the left and right bank samples for benthic
invertebrate fauna, nevertheless this combination has been skipped, mainly as an example
for future considerations when elaborating on the underlying study. The underlying idea is
that when selecting combinations of data, it should be verified that there are no local
influences (e.g. discharges of waste water or tributaries) that may affect one of the data
sets (benthic invertebrate fauna or physico-chemical quality elements).
In one case, is has been decided to deviate from the (basically: arbitrary) 10 rkm criterion, namely
for the combination TNMN L0480: rkm 0, Sulina - Sulina arm with JDS97: rkm 12, Sulina arm.
Otherwise, there would have not been `eligible' data for evaluating section type 10.
UNDP/GEF DANUBE REGIONAL PROJECT
Chapter 5: Application of the Austrian proposed 1st draft method
page 28
Intermezzo: `borderline syndrome'
The following case could act as an example of possible complications when combining various monitoring /
sampling locations. According to the Danube's typology, the following river kilometres apply to the Section
Types 8 respectively 9:
8: Western Pontic Danube
rkm 943: Turnu Severin Ł rkm 375.5: Chiciu/Silistra
9: Eastern Wallachian Danube
rkm 375.5: Chiciu/Silistra Ł rkm 100: Isaccea
When for instance using the MS Excel INT() function straightforwardly, =INT(375.5) would return the number
375, which would position the location Chiciu/Silistra inside Type Stretch 9. When using conventional math
conventions, rounding the rkm 375.5 to its nearest integer would become 376, being the nearest even number.
Rkm 376 is `more upstream' than rkm 375.5, so would qualify as belonging to Type Section 8.
In the DANUBIS TNMN station information, the location TNMN L0280 (RO), L0850 (BG): Chiciu/Silistra is
situated at rkm 375, which implies that is has to be positioned in Section Type 9. The nearest Joint Danube
Survey location JDS89: rkm 378, Chiciu/Silistra, would have to be assigned to Type Section 8.
For the underlying study, TNMN Chiciu/Silistra has been put inside Section Type 9, if only that otherwise for this
section only one site would remain downstream at Reni, around rkm 130). Furthermore, section 8 is rather
`overcrowded' anyway (compare Annex 1). No possible significant impacts are known to exist between rkm 378
and 375, so from this point of view the TNMN Chiciu/Silistra and JDS89 can be combined.
While seemingly quite trivial, this example underlines the importance of expert judgements prior to organising
and processing the actual data.
Annex1 contains an overview of the TNMN, JDS and AQUATERRA sites, including the suggested
matching combinations.
5.2.2. Averaging data per cross section
During both the JDS and the AQUATERRA surveys, in most occasions benthic invertebrate fauna
samples have been taken separately at the left and the right bank of the Danube River. In the
TNMN, samples often are taken at three positions: left bank, middle of the river, right bank.
For the underlying study, averaged data per cross section were used. Meaning that TNMN data
firstly were pooled per cross-section before calculating statistics. Please notice that for this reason
statistics in this report can be different from those reported in the TNMN year books, where the
statistics are shown per individual sampling site per cross-section.
5.3. Applying the Austrian proposed 1st draft method for the year
2001 (Joint Danube Survey)
5.3.1. Descriptive findings: benthic invertebrate fauna
A graphic representation of the macrozoobenthos results of the Joint Danube Survey are shown in
the graph below.
ENVIRONMENTAL INSTITUTE
DEVELOPMENT OF OPERATIONAL TOOLS FOR MONITORING, LABORATORY AND INFORMATION MANAGEMENT
Developing WFD type-specific quality standards for nutrients Ł Draft Final Report
page 29
Figure 5
Longitudinal profile of the macrozoobenthos findings of the Joint Danube Survey
Joint Danube Survey 2001: macrozoobenthos, longitudinal
profile
3.4
3.2
3
2.8
x
[
-
]
2.6
nde
c
I
2.4
r
obi
2.2
a
p
S
2
1.8
1.6
2500
2000
1500
1000
500
0
distance to Black Sea [km]
L bank
R bank
Several observations can be derived from the figure above.
a) The SI generally is larger than 2, being the class boundary between `high' and `good' status
as defined for the underlying study (compare subsection 5.1.2).
b) The highest values (SI >2.4) are found in several left bank samples starting from rkm 1107
and further downstream. In the upper reaches, the SI in samples at two cross sections is
higher than 2.4: JDS06, Jochenstein and JDS07, Upstream dam Aschach. Nevertheless,
there does not seem to be a systematic difference overall between left and right bank
samples.
5.3.1.1. Comparison of TNMN macrozoobenthos data with JDS
Some countries have included monitoring macrozoobenthos in their TNMN sites. As shown in the
table below, the JDS and the TNMN data generally compare relatively well. Most intriguing
difference is Neu-Ulm that can be qualified as `high status' with the JDS data, while it would qualify
as `good status' according to the TNMN data9.
Table 6 Comparison of TNMN10 versus JDS macozoobenthos results
JDS
Section Type
TNMN
SI
SI
SI
rkm
name
Mean SI L-bank
middle
R-bank
2 2581
Neu-Ulm
L
2.11
1.89
3
2204
Jochenstein M (AU)
2.15
2.17
2.46
2.17
2204
Jochenstein M (DE)
2.22 2.17 2.46
2.17
2120
Abwinden-Asten
R
2.08
2.25
2.32
4 1935
Wien-Nussdorf
R
2.10
2.11
2.2
1874
Wolfsthal
R 2.01
1869
Bratislava
M 2.16
1.96
2.09
9 Compare the footnote for section 5.1.2, indicating that at least one Austrian water body in the Danube has a saprobic ground
state of SI 1.75. Assuming that this can be applied to upstream locations, then Neu-Ulm would have to be qualified as
being of `good' status.
10 Data derived from the TNMN Yearbook 2001.
UNDP/GEF DANUBE REGIONAL PROJECT
Chapter 5: Application of the Austrian proposed 1st draft method
page 30
JDS
Section Type
TNMN
SI
SI
SI
rkm
name
Mean SI L-bank
middle
R-bank
1806
Medvedov/Medve M (SK)
2.11
2.07
2.11
5 1768
Komarno/Komarom
M
(SK)
2.00
2.00
2.01
6 1429
Batina
M
2.33
2.19
2.27
1337
Borovo
R
2.03
5.3.2. Combining data sets
Following the principles introduced in section 5.2.1, JDS and TNMN sites have been selected. An
overview of these selected sites is included in Annex 2.
5.3.3. Selecting locations in accordance with the `class boundary - 0.125'
criterion
For compilation of the table below, the more restrictive `combine data sets' and `class boundary Ł
0.125' criteria have been applied.
Table 7 Overview of selected sites: quality status according to the SI of the JDS
JDS
TNMN code Name
Section
rkm
SI
SI
SI
complies
code
Type
L-
R-
average status with class
bank bank
boundary
JDS01 L2140
Neu-Ulm
2
2581 1.89
-
1.89
high
high/ good
JDS06 L2130
(DE) Jochenstein
3
2204 2.17 2.46 2.315 good good/
/ L2220
moderate
(AU)
JDS08 L2200
Upstream
dam
2120 2.25 2.32 2.285 good good/
Abwinden-Asten
moderate
JDS12
L2180
Wien-Nussdorf
4 1935
2.11
2.2
2.155
good
no
(Klosterneuburg)
JDS17 L1840
Bratislava
1865 1.96 2.09 2.025 good no
JDS23 L1470
(HU) Medvedov/Medve
1806 2.07 2.11 2.09
good no
/ L1860 (SK)
JDS25 L1475
(HU) Komarno/Komarom 5
1768
2 2.01
2.005
good
no
/ L1870 (SK)
JDS31 L1490
Szob
1708 2.17 2.24 2.205 good no
JDS40 L1520
Dunafoldvar
1560 2.17 2.16 2.165 good no
JDS44 L1540
Hercegszanto
6
1435 2.29 2.3 2.295 good good/
moderate
JDS45 L1315
Batina
1429 2.19 2.27 2.23
good no
JDS48 L2360
Downstream
Drava
1367 2.29 2.32 2.305 good good/
(Erdut/Bogojevo)
moderate
JDS51 L2370
Upstream Novi Sad
1258 -
2.16
2.16
good
no
JDS58 L2390
Downstream
Pancevo
1155 2.18 2.18 2.18
good no
JDS63 L2400
Starapalanka - Ram
1077 2.07
2.09
2.08
good
no
JDS64 L0020
Banatska
7
1077 2.02 2.23 2.125 good no
Palanka/Bazias
ENVIRONMENTAL INSTITUTE
DEVELOPMENT OF OPERATIONAL TOOLS FOR MONITORING, LABORATORY AND INFORMATION MANAGEMENT
Developing WFD type-specific quality standards for nutrients Ł Draft Final Report
page 31
JDS
TNMN code Name
Section
rkm
SI
SI
SI
complies
code
Type
L-
R-
average status with class
bank bank
boundary
JDS66 L2410
Tekija
955 2.17 2.07 2.12
good no
JDS68 L2420
Upstream
Timok
8
851 2.07 2.01 2.04
good no
(Rudujevac/Gruia)
JDS70 L009 (RO) /
Pristol/Novo Selo
834 2.28 2.19 2.235 good no
L0730 (BG)
Harbour
JDS73 L0780
Upstream
Iskar
642 2.18 2.01 2.095 good no
(Bajkal)
JDS80
L0810
Downstream
8
554 2.69 1.83 2.26
?? ??
Zimnicea/Svishtov
JDS83 L0820
Upstream Ruse
503
2.17
-
2.17
good
no
JDS86 L0240
Upstream
Arges
432 2.05 2.06 2.055 good no
JDS89 L0280
(RO) Chiciu/Silistra
9
375 2.12 2.19 2.155 good no
/ L0850
(BG)
JDS95 L0430
Reni - Chilia/Kilia
132
2.6
2.18
2.39
??
??
arm
JDS97
L0480
Sulina
arm
10
12 2.12 2.1 2.11
good no
Several observations can be derived from the table above, among others:
>
There are two sites with relatively big differences between the SI's at their left and
right bank: downstream Zimnicea/Svishtov at rkm 554 and Reni - Chilia/Kilia arm at
rkm 132. As for Zimnicea/Svishtov, the left bank sample indicates a `moderate' status,
while the right bank sample would indicate a `high' status. For the time being, these
two sites are omitted for further specific assessments in the underlying study. The
criterion in section 5.2.1c) has been introduced to avoid such situations where there
seem to be apparent differences between left and right bank.
Intermezzo: Downstream Zimnicea/Svishtov
The author has no knowledge about left bank emissions that might explain the relatively high SI. For the sake
of completeness, the SI's at the left bank of the JDS sampling sites that were not selected (because of no
overlapping TNMN site) are mentioned.
JDS_code rkm name
bank SI
JDS75 629
Downstream
Iskar
L 2.19
JDS76 606
Upstream
Olt
L 2.21
JDS78 602
Downstream
Olt
L 2.18
JDS79 579
Downstream
Turnu-Magurele/Nikopol
L 2.17
One reasonably may assume that the difference in SI at Zimnicea/Svishtov somehow must be due to the
sampling (site) and not so much to some local stress factors.
>
Out of the remaining 24 locations, only one site qualifies as being of `high' status: Neu-
Ulm at rkm 2581. The remaining sites would qualify as being of `good' status (based on
average SI from left and right bank samples).
>
The `class boundary - 0.125' criterion reduces the number of `eligible' sites
considerably. Out of the 24 remaining selected sites, only 5 sites meet the `class-
boundary criterion'. For the following section types, none of the sites meets this
criterion: 4, 5, 7, 8, 9 and 10, implying that for these sites no estimates for type-
UNDP/GEF DANUBE REGIONAL PROJECT
Chapter 5: Application of the Austrian proposed 1st draft method
page 32
specific quality standards could be made. Leaving only the section types 2, 3, and 6
(please notice that there is no TNMN station situated in Section Type 1).
>
For the sake of completeness, calculations nevertheless have been carried out for all
TNMN monitoring stations along the mainstream of the Danube (compare Annex 3 for
results).
5.3.4. Nitrate
(NO3)
5.3.4.1. Applying the method
An overview of all results can be found in annex 3. The table below contains the results of those
sites complying with the methodological criteria.
Table 8
NO3 concentrations (90%-ile values) at TNMN stations meeting the `class
boundary Ł 0.125' criterion in 2001
Section Rkm Country Location
Class
boundary: Class boundary:
high/good
good/moderate
NO3,
90%-ile
NO3, 90%-ile
[mg N/l]
[mg N/l]
2 2581
DE Neu-Ulm/Boefinger
Halde
3.7
3 2204
AT Jochenstein
3.3
DE
Jochenstein
3.1
2120
AT
Abwinden-Asten
2.9
6 1435
HU Hercegszanto
2.9
1367
SC
Bogojevo
3.1
Too few stations (which furthermore are situated in the upper half reach only) comply with the
class boundary criterion in order to be able to draw some more substantiated conclusions. While
acknowledging these limitations, the table above nevertheless implies several interesting
observations, like:
>
The highest 90%-ile nitrate concentration has been found at the only station being
qualified as `high' status according the SI of the Joint Danube Survey: Neu-Ulm /
Boefinger Halde.
>
Within the two remaining section types 3 and 6, the 90%-ile values can differ up to 0.4
mg N/l. Introducing yet another methodological consideration: which data set to use for
representing the associated Section Type?
>
The two data-sets at Jochenstein (from Austria and Germany) furthermore illustrate
that at one location different results can be obtained. Several factors could be
underlying such differences: date, place and/or method of sampling, laboratory
analysis, sampling frequency, et cetera. In this case the difference is minor, but the
boxout below show examples where differences are more substantial. Adding to the
consideration mentioned just above: which data set to use for representing the
associated Section Type?
ENVIRONMENTAL INSTITUTE
DEVELOPMENT OF OPERATIONAL TOOLS FOR MONITORING, LABORATORY AND INFORMATION MANAGEMENT
Developing WFD type-specific quality standards for nutrients Ł Draft Final Report
page 33
Intermezzo: differences between results of countries sampling at the same TNMN site
In the example above, the differences between the Austrian and the German nitrate data at Jochenstein are
rather modest. There are several locations, where differences appear to be more substantially (compare also
Annex 3 for details).
For example in the results at Pristol/Novo Selo at rkm 874 and Chiciu/Silistra at rkm 375, where samples are
taken both by Bulgaria and Romania.
NO3 concentration (90%-ile values), [mg N/l]
rkm 384
rkm 384
rkm 375
rkm 375
country
2001 2004 2001 2004
BG 2.3 2.3 1.9 2.2
RO 2.0 1.3 2.4 2.4
In 2004, the differences between the Bulgarian and Romanian 90%-ile values at Pristol/Novo Selo are 1 mg N/l,
almost one order of magnitude at these levels. At Chiciu/Silistra in 2001 the difference was 0.5 mg N/l.
Similar observations can be made for NH4, although in this case only at Chiciu/Silistra, as shown below.
NH4 concentration (90%-ile values) [mg N/l]
rkm 384
rkm 384
rkm 375
rkm 375
country
2001 2004 2001 2004
BG 0.31 0.29 0.13 0.15
RO 0.40 0.32 1.00 0.79
Another example is the TNMN site at rkm 18, Vilkova-Chilia arm/Kilia arm, where in the year 2004 samples
were taken by both Romania and Ukraine.
NO3 and NH4 concentrations (90%-ile values) in 2004 [mg N/l]
NO3 NH4
RO
2.3 0.86
UA
1.4 0.30
These examples show the importance of general screening of the monitoring data and the derived results prior
to their actual use as like in the exercises of the underlying study.
5.3.4.2. Additional observations
Unfortunately, the 2001 data resulted in a limited number of matching locations when applying the
principles of the Austrian proposed 1st draft method. These locations cannot be considered as
representative for the whole Danube mainstream. As an example, the 90%-ile nitrate
concentrations at all TNMN stations for the year 2001 are shown in the graph below.
UNDP/GEF DANUBE REGIONAL PROJECT
Chapter 5: Application of the Austrian proposed 1st draft method
page 34
Figure 6
90%-ile nitrate concentrations at all TNMN stations in the year 2001
NO3 concentrations at TNMN stations in 2001 (90% -tile values)
4.0
3.5
3.0
2.5
l
]
2.0
N/
g
[m
1.5
1.0
0.5
0.0
2500
2000
1500
1000
500
0
distance to Black Sea [km]
The graph indicates a tendency of decreasing NO3 concentrations in the upstream Ł downstream
direction, implying a rather distinct drop somewhere near rkm 1300. A similar tendency can be
observed in 2004. In the graph below, the nitrate concentrations are pooled in each section type
for the years 2001 and 2004. There seem to be substantial differences between the sections 2-5
versus 7-10. The highest 90%-ile values in the section types 7-10 are lower than the lowest 90%-
ile values in the section types 2-5.
Figure 7
90%-ile nitrate concentrations in the various section types for 2001 and 2004
NO3 concentrations at TNMN stations in 2001 and 2004 (90% -ile
values)
4.5
4.0
3.5
3.0
/l] 2.5
N
2001
g 2.0
2004
[
m
1.5
1.0
0.5
0.0
1
2
3
4
5
6
7
8
9
10
section type number
5.3.5. Ptot and PO4
An overview of all results can be found in annex 3. The tables below contain the results of those
sites complying with the methodological criteria. The few available results do not allow for
substantiated conclusions. The 90%-ile concentrations at the only location being qualified as `high
status' (Neu-Ulm) are not lower than at the other ones.
ENVIRONMENTAL INSTITUTE
DEVELOPMENT OF OPERATIONAL TOOLS FOR MONITORING, LABORATORY AND INFORMATION MANAGEMENT
Developing WFD type-specific quality standards for nutrients Ł Draft Final Report
page 35
Table 9
Ptot concentrations (90%-ile values) at TNMN stations meeting the `class
boundary Ł 0.125' criterion (2001)
Class boundary: Class boundary:
Section Rkm Country Location
high/good
good/moderate
Ptot, 90%-ile
Ptot, 90%-ile
[mg P/l]
[mg P/l]
2 2581
DE Neu-Ulm/Boefinger
Halde
0.15
3 2204
AT Jochenstein
0.12
DE
Jochenstein
0.12
2120
AT
Abwinden-Asten
0.11
6 1435
HU Hercegszanto
0.19
1367
SC
Bogojevo
0.14
Table 10
PO4 concentrations (90%-ile values) at TNMN stations meeting the `class
boundary Ł 0.125' criterion (2001)
Class boundary: Class boundary:
Section Rkm Country Location
high/good
good/moderate
PO4,
90%-ile
PO4, 90%-ile
[mg P/l]
[mg P/l]
2 2581
DE Neu-Ulm/Boefinger
Halde
0.06
3 2204
AT Jochenstein
0.07
DE
Jochenstein
0.05
2120
AT
Abwinden-Asten
0.05
6 1435
HU Hercegszanto
0.09
1367
SC
Bogojevo
0.07
Whether there is a tendency in the longitudinal direction is not so obvious for the year 2001, but in
combination with the 2004 data phosphorous concentration seem to be increasing in a downstream
direction, as indicated in the figure below.
Figure 8
Ptot concentrations (90%-ile values) along the Danube in 2001 and 2004
Ptot concentrations (90%-ile values) along the Danube in 2001 and 2004
0.45
0.40
0.35
0.30
0.25
/l]
P
g
0.20
[
m
0.15
0.10
0.05
0.00
2500
2000
1500
1000
500
0
distance to Black Sea [km]
2001
2004
UNDP/GEF DANUBE REGIONAL PROJECT
Chapter 5: Application of the Austrian proposed 1st draft method
page 36
5.4. Applying the Austrian proposed 1st draft method for the year
2004 (Aquaterra)
5.4.1. Descriptive findings: benthic invertebrate fauna
For the Aquaterra survey Saprobic Indices were calculated through several methods, the results of
three of them shown in the graph below.
Figure 9
SI results of the AQUATERRA survey
Saprobic Index results AQUATERRA
(average of L-R bank samples)
2.5
2.4
2.3
2.2
-
]
2.1
[
SI
2
1.9
1.8
1.7
6
0
2
4
8
0
6
S 2
S 4
S 8
1
1
1
16
1
2
22
28
S 24
S 2
S 30
AD
AD
ADS
AD
ADS
ADS
ADS
ADS
ADS
ADS
ADS
AD
AD
ADS
AD
location code
Aquaterra German SI (old version)
Aquaterra German SI (new version)
Aquaterra SI (Zelinka & Marvan)
With calculating the SI by several different methods, AQUATERRA has introduced a new element in
the exercise. Since the resulting SI's are different, it raises the question; which one to use for a
status assessment?
When comparing the results of the three calculation methods as shown in Figure 9, the following
observations can be made:
>
the results of the SI's calculated with the new version of the German method for the
majority of the sites are higher than the old version (the differences are not
systematic);
>
the results of the SI's calculated with the Zelinka & Marvan method for the majority of
the sites are higher than the new version of the German method (the differences are
not systematic).
The implications are obvious: the SI's calculated with the Zelinka & Marvan method and the new
German method result in a lower quality status than when using the old German method, as
illustrated in the table below.
Table 11
Quality status of AQUATERRA sites according to different calculation methods
[total = 30]
status
German SI (old version) German SI (new version) SI (Zelinka & Marvan)
[n]
[n]
[n]
high 10
6
3
good 20
23
26
moderate 0
1
1
ENVIRONMENTAL INSTITUTE
DEVELOPMENT OF OPERATIONAL TOOLS FOR MONITORING, LABORATORY AND INFORMATION MANAGEMENT
Developing WFD type-specific quality standards for nutrients Ł Draft Final Report
page 37
In order to be able to compare the results of using the AQUATERRA data with those obtained on
basis of the JDS data, the SI's resulting from the old version of the German method have been
selected for further processing.
The longitudinal profile is shown in the figure below. The (averaged) saprobic indices range
between 1.87 to 2.28 and in most cases are lower than at the matching JDS sites.
Figure 10
Overview of average SI's in the overlapping stretch of Aquaterra and JDS
AQUATERRA 2004: benthic invertebrate fauna, longitudinal profile
(average of L/R-bank samples)
3.4
3.2
3
)
[
-
]
n
2.8
o
si
2.6
ver
a
n
2.4
e
r
m
2.2
G
l
d
2
I
(
o
S
1.8
1.6
2500
2000
1500
1000
500
0
distance to Black Sea [km]
AQUATERRA
JDS
5.4.1.1. Comparison of TNMN 2004 macrozoobenthos data with Aquaterra
The table below contains the average SI from the TNMN 2004 data, together with the ones
measured at matching Aquaterra sites. In most matching cases, the TNMN saprobic indices tend to
be a bit higher; none the sites according to the SI of the TNMN would qualify as `high status'
(contrary to several Aquaterra sites).
Table 12
Comparison of TNMN 2004 versus Aquaterra macozoobenthos results
Section Rkm Code Location
TNMN
Aquaterra SI
Aquaterra SI
saprobic index old German index new German index
2 -2581
L2140
Neu-Ulm/Boefinger
Halde
2.06
3 -2204
L2130
Jochenstein:
DE
2.25
L2220
Jochenstein:
AT 2.11
-2120
L2200
Abwinden-Asten 2.04
4 -1935
L2180
Wien-Nussdorf
2.00
1.91
2.08
-1874
L2170
Wolfsthal
2.21
-1869
L1840
Bratislava
2.17
1.92
1.94
-1806
L1470
Medve/Medvedov: HU
2.06
1.95
1.99
L1860
Medvedov/Medve:
SK
2.10
5 -1768
L1475
Komarom/Kedvedov: HU
2.05
1.90
1.98
L1870
Komarno/Komarom:
SK
2.07
-1708
L1490
Szob
2.14
2.02
2.04
-1560
L1520
Dunafoldvar
2.15
1.91
2.05
6 -1435
L1540
Hercegszanto
2.14
2.16
2.08
UNDP/GEF DANUBE REGIONAL PROJECT
Chapter 5: Application of the Austrian proposed 1st draft method
page 38
5.4.2. Combining data sets
The generally matching Aquaterra and TNMN sites (compare section 5.2.1 for the criteria) are
included in Annex 2.
5.4.3. Selecting locations in accordance with the `class boundary - 0.125'
criterion
Out of the fourteen AQUATERRA sites that match with TNMN stations, 7 are of high status and the
other 7 of good status. The seven high status sites comply with the `<0.125 class boundary'
criterion for the high/good class boundary. Unfortunately, none of these sites coincide with any of
the 2001 sites that then complied with the `<0.125 class boundary' criterion.
Table 13
Overview of selected sites: quality status according to the SI of Aquaterra
ADS
TNMN
Name Section
rkm Aquaterra German status complies with
code
code
Type
SI (old version)
class boundary
ADS 1
L2180
Wien-Nussdorf
4
1935 1.91
high
high/good
ADS 4
L1840
Bratislava
1869 1.92
high
high/good
ADS 8
L1860
Medvedov/Medve
1806 1.95
high
high/good
ADS 9
L1870
Komarom/Komarno 5
1768 1.90
high high/good
ADS 10
L1490
Szob
1708 2.02
good
no
ADS 13
L1520
Dunafoldvar
1560 1.91
high
high/good
ADS 14
L1540
Hercegszanto
6
1435 2.16
good
no
ADS 15
L2370
Novi Sad
1258 2.15
good
no
ADS 20
L2390
Pancevo
1155 2.13
good
no
ADS 23
L2400
Bantska Palanka
1077 2.03
good
no
ADS 24
L0020
Bazias
7
1071 2.05
good
no
ADS 26
L2410
Tekija
955
2.10
good
no
ADS 28
L2420
Radujevac
8
851
1.93
high
high/good
ADS 29
Pristol/Novo Selo
834
1.93
high
high/good
L009/L0730
5.4.4. NO3
The results for the calculations for all TNMN stations can be found in Annex 3. In the table below,
the results for the matching sites that comply with the `class boundary Ł 0.125' criterion are
shown.
Table 14
NO3 concentrations (90%-ile values) at TNMN stations meeting the `class
boundary Ł 0.125' criterion in 2004
Section Rkm Country Location
Class
boundary:
high/good NO3, 90%-ile
[mg N/l]
4 1935
AT Wien-Nussdorf
3.3
1869
SK
Bratislava
3.5
1806
HU
Medve/Medvedov 3.1
SK
Medvedov/Medve 2.9
5 1768
HU Komarom/Kedvedov 3.3
SK
Komarno/Komarom 3.1
1560
HU
Dunafoldvar
3.8
8 851
SC Radujevac
2.3
834
BG
Novo Selo Harbour/Pristol 2.3
RO
Pristol/Novo Selo Harbour 1.3
ENVIRONMENTAL INSTITUTE
DEVELOPMENT OF OPERATIONAL TOOLS FOR MONITORING, LABORATORY AND INFORMATION MANAGEMENT
Developing WFD type-specific quality standards for nutrients Ł Draft Final Report
page 39
The results for section type 4 ranges from 2.9 to 3.5, another example indicating that for selecting
data sets that represent the (quality of) section types additional criteria will have to be developed.
As mentioned earlier above: unfortunately there are no sites that comply with the `class boundary
Ł 0.125' criterion in both 2001 and 2004. The 90%-ile values for 2004 generally are slightly higher
than those for 2001. So, with overall lower SI's in 2004 along the joint Aquaterra/JDS stretch, the
90%-ile nitrate concentrations actually tend to be slightly higher.
Figure 11
NO3 concentrations at TNMN stations in 2001 and 2004 (90%-ile values)
NO3 concentrations at TNMN stations in 2001 and 2004 (90%-ile
values)
4.5
4.0
3.5
3.0
2.5
/l]
N
g
2.0
[
m
1.5
1.0
0.5
0.0
2500
2000
1500
1000
500
0
distance to Black Sea [km]
2001
2004
Refer to section 5.3.4 where relevant details are addressed also for the 2004 results, like the
different concentrations found at rkm 834, Pristol/Novo Selo.
5.4.5. Ptot and PO4
The tables below contain the results of those sites complying with the methodological criteria.
For Ptot, values range from 0.06 to 0.34 mg P/l. The different minimum/maximum values in each of
the section types once more underline the issue of how to relate different sets of (TNMN) data to
each section type. The differences between the countries at the TNMN sites Komarom/Kedvedov
and Pristol/Novo Selo furthermore are considerable.
Table 15
Ptot concentrations (90%-ile values) at TNMN stations meeting the `class
boundary Ł 0.125' criterion (2004)
Section rkm Country Location
Class
boundary:
high/good
Ptot, 90%-ile [mg P/l]
4 1935
AT Wien-Nussdorf
0.06
1869
SK
Bratislava
0.13
1806
HU
Medve/Medvedov 0.13
SK
Medvedov/Medve 0.08
5 1768
HU Komarom/Kedvedov 0.20
SK
Komarno/Komarom 0.10
1560
HU
Dunafoldvar
0.16
8 851
SC Radujevac
0.07
834
BG
Novo Selo Harbour/Pristol 0.34
RO
Pristol/Novo Selo Harbour 0.20
UNDP/GEF DANUBE REGIONAL PROJECT
Chapter 5: Application of the Austrian proposed 1st draft method
page 40
The 90%-ile values for PO4 with 0.15 mg P/l are highest at rkm 834 Pristol/Novo Selo, with a good
match of the Bulgarian and Romanian data.
Table 16
PO4 concentrations (90%-ile values) at TNMN stations meeting the `class
boundary Ł 0.125' criterion (2004)
Section rkm Country Location
Class
boundary:
high/good
PO4, 90%-ile [mg P/l]
4 1935
AT Wien-Nussdorf
0.04
1869
SK
Bratislava
0.06
1806
HU
Medve/Medvedov 0.06
SK
Medvedov/Medve 0.05
5 1768
HU Komarom/Kedvedov 0.09
SK
Komarno/Komarom 0.07
1560
HU
Dunafoldvar
0.09
8 851
SC Radujevac
0.06
834
BG
Novo Selo Harbour/Pristol 0.15
RO
Pristol/Novo Selo Harbour 0.14
Contrary to 2001, in 2004 there seems to be a clearer tendency of increasing concentrations in a
downstream direction.
Figure 12
Longitudinal profile of Ptot and PO4 along the Danube in 2004
Longitudional profile of Ptot and PO4 concentrations (90%-ile values)
along the Danube in 2004
0.40
0.35
0.30
0.25
/
l
]
0.20
P
g
[m
0.15
0.10
0.05
0.00
2500
2000
1500
1000
500
0
distance to Black Sea [km]
PO4
Ptot
5.5. Preliminary synthesis: first lessons-learned from applying
the Austrian 1st proposed draft method
This section will be used for a preliminary wrap-up of the findings so far. The discussion in chapter
6 will extend on this.
ENVIRONMENTAL INSTITUTE
DEVELOPMENT OF OPERATIONAL TOOLS FOR MONITORING, LABORATORY AND INFORMATION MANAGEMENT
Developing WFD type-specific quality standards for nutrients Ł Draft Final Report
page 41
5.5.1. General
applicability
to
the mainstream of the Danube
The previous sections generally did not indicate any principle obstacles for applying the Austrian 1st
proposed draft method as such to the mainstream of the Danube. The major lacking ingredients as
experienced so far are considered to be first of all a matter of general implementation:
a)
Benthic invertebrate fauna data covering the whole Danube River (and collected in a
systematic way, in the same year) currently only are available for the year 2001,
thanks to the first Joint Danube Survey. Considering the significance of benthic
invertebrate fauna as a (and maybe even: the most important guiding) WFD quality
element for assessment of the biological status of rivers, it will be merely a matter of
time (and not: if) to expect a Danube-wide coverage.
b)
No metrics for instance for `high, good, moderate' status of the Danube River for -at
least- benthic invertebrate fauna for the Danube River have been formulated and
agreed upon so far. Also this will be merely a matter of time, since with the
implementation of the WFD such (type-specific) metrics will be required anyway.
5.5.2. Extensions and/or deviations from the Austrian 1st proposed draft
method
The underlying study needed to improvise in a number of occasions (read: sometimes extend on
the methodology), which are enumerated and elaborated below.
5.5.2.1. Danube section types water bodies
The underlying study elaborated data and statistics mainly per Danube section type. While
implementing the principles of the Austrian 1st proposed draft method (that uses the typology of
water bodies as a major binding principle) this approach as such did not appear to be
contradictory.
Essentially, the current Danube's typology appears to coincide with a rather linear upstream-
downstream direction (compare section 5.1.1). Therefore, it will first of all be a matter of detail to
situate individual water bodies inside these section types. Finally it will be relevant that one will be
able to distinguish the possible specific features of a water body, including besides its type-specific
features characteristics like being `at risk', `heavily modified', et cetera.
Matching combinations of hydrobiological and physico-chemical quality elements finally only can be
achieved by: a) actually combining monitoring these quality elements, or b) establishing proxy
relationships, showing that selected number of sites/water bodies can be considered representative
for others (e.g. by mean of clustering, compare 4.5).
The designation of TNMN stations that are corresponding with the Danube Section Types may have
to be fine-tuned. An example has been elaborated in section 5.2.1 for the TNMN Chiciu/Silistra at
rkm 375. This station could be positioned in Section Type 9, but seems better to be headed inside
Type Section 8.
Further investigations may be needed in order to determine which TNMN stations can be are
considered as being (most) representative for the quality (status) inside their related Section
Types. Firstly, some sections seem to be rather long compared to others (as mentioned in section
5.1.1, quoting [ICPDR, 2005] "The smallest water body on the Danube is only 7 km long, the
longest is 487 km."). Secondly, at some of the TNMN stations with two countries monitoring,
substantial differences between the results of both countries can be observed.
UNDP/GEF DANUBE REGIONAL PROJECT
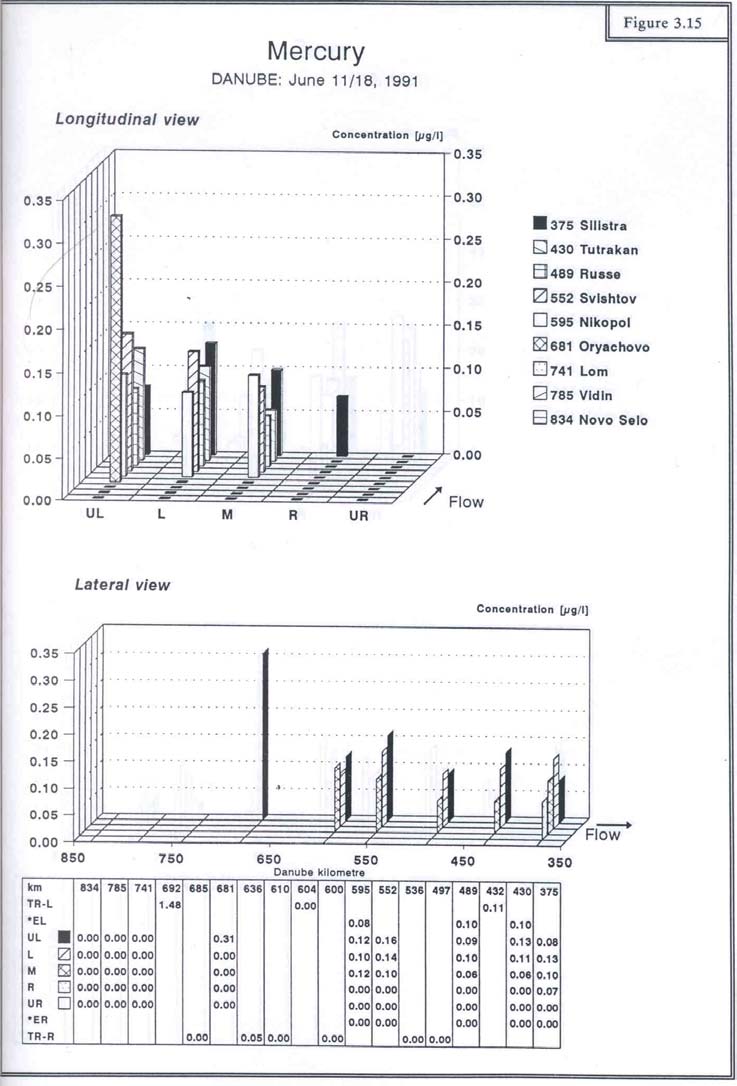
Chapter 5: Application of the Austrian proposed 1st draft method
page 42
5.5.2.2. Homogeneity over cross-sections
Partially extending on the previous subsection: the Danube finally simply becomes a large river,
where emissions will need some time and distance to disperse. The figure below shows the results
of a survey conducted during the year 1991 along the joint Bulgarian/Romanian stretch of the
Danube [Buijs, Uzonov, Tsankov; 1992]. The mercury that apparently was discharged via the Jiul
at rkm 692 on the left bank still could not be determined at right bank samples near Silistra, some
400 rkm's downstream.
Figure 13
Example of dispersion of substances in the Danube river: Bulgarian/Romanian
stretch 1991
ENVIRONMENTAL INSTITUTE
DEVELOPMENT OF OPERATIONAL TOOLS FOR MONITORING, LABORATORY AND INFORMATION MANAGEMENT
Developing WFD type-specific quality standards for nutrients Ł Draft Final Report
page 43
5.5.2.3. Differences between monitoring results of countries
Several examples indicated that when countries are monitoring at the same TNMN cross section,
the results can differ quite significantly (compare e.g. section 5.3.4.1). The underlying study was
not able to go very much beyond noticing this observation. However, implications of course are
more far-reaching than for the purposes of the underlying study only.
To which extent observed differences between countries at those sites where samples are taken
jointly also may apply to other sites (where there is no direct way of comparing data) remains
speculative, but nevertheless may be considered relevant an issue.
5.5.3. The calculated results
With applying the Austrian 1st proposed method to the years 2001 and 2004, some more generic
observations can be made, like:
Few `eligible' sites remained after applying the `class boundary -0.125' criterion.
Although the 2004 Aquaterra SI's tended to be lower than those found during the JDS, no
apparently lower 90%-ile values for NO3, Ptot or PO4 were found.
For Austria, in 2003 only one water type existed with a saprobic ground state of SI 2.00. The
results for this type from the Austrian 1st draft method are summarised in the table below
(compare also section 4.6).
Table 17
90%-values calculated for the Austrian bioregion FH, ground state SI 2.00;
compared to study finding
Austrian
bioregion
FH
Austrian bioregion FH TNMN
2001
TNMN 2004
high status
good status
min Ł max
min Ł max
90%-ile
90%-ile
90%-ile
90%-ile
NO3 [mg N/l] 4
5.5
1.3 Ł 3.7
1.3 Ł 3.8
PO4 [mg P/l]
0.1
0.2
0.03- 0.68*
0.04 Ł 0.19
Ptot(fil) [mg P/l] 0.2 0.25 Ptot 0.1 Ł 0.4**
0.1 Ł 0.3
* excluding rkm 851, SC, Radujevac, with a 90%-ile value of 1.19 mg PO4_P/l
** excluding rkm 851, SC, Radujevac, with a 90%-ile value of 1.04 mg P/l
There is no easy way of comparing results, taking into account that:
>
the results of the Austrian 1st proposed draft method did not include the Danube river
as such ;
>
the years do not match (2001 and 2004 for the underlying study, versus 2003 for the
Austrian study);
>
there seem to be concentration gradients in the longitudinal direction along the
Danube.
Nevertheless, a general observation might be that the underlying study did not seem to have
resulted in substantially higher values than those included in the Austrian proposed 1st draft
method (compare 4.6; for the other ground states, the Austrian study resulted mainly in lower
concentrations).
Since the underlying study results cannot be anchored properly (notably through the SI's), it
remains a matter of speculation whether the calculated values correspond to high/good,
good/moderate, or even moderate/poor quality class conditions.
UNDP/GEF DANUBE REGIONAL PROJECT
Chapter 5: Application of the Austrian proposed 1st draft method
page 44
5.6. Black Sea perspective
From a Danube point of view, the pollution of the Black Sea can be regarded as a `none WFD type-
specific criterion' when dealing with the issue of setting water quality standards. An example for a
similar case has been introduced in section 3.2. At present, algal concentrations are not
experienced as a problem in the Dutch part of the River Rhine. Nevertheless, target values for the
River Rhine have been calculated in order to protect vulnerable waters in downstream lakes of its
delta, including coastal waters [Liere et.al., 2002].
This section will mainly focus on the (complementary) considerations for setting quality standards
for the Danube River when taking the Black Sea into account. This issue as such goes far beyond
the scope and reach of the underlying study. A dedicated programme like the daNUbs Research
Project (within the 5th European Research Frame Work Program) has been dealing with the problem
of eutrophication in coastal zones in regard to the Danube River Basin and the Black Sea coastal
area influenced by the discharge of river Danube.
5.6.1. Summary of the daNUbs final report
This section contains selected text fragments from the Executive Summary of the daNUbs Final
report [daNUbs, 2005] for orientation and reference purposes.
5.6.1.1. Introduction
The Danube is about 2,900 km long, and the river catchment of just over 800,000 km2 covers 33
% of the Black Sea basin. It is the second largest river basin on European territory. Its average
discharge of approximately 6,500 m3/s, contributes 55% to the freshwater discharge to the Black
Sea. The catchment area has a population of 82 Million, which is 43 % of the total population
within the Black Sea basin. ... Mismanagement of nutrients in the Danube Basin has led to severe
ecological problems: the deterioration of groundwater resources and the eutrophication of rivers,
lakes and especially the Black Sea. These problems are directly related to social and economic
issues (e.g. drinking water supply, tourism and fishery as affected sectors; agriculture, nutrition,
industry and waste water management as drivers). In order to recommend proper management for
the protection of the water system in the Danube Basin and the Black Sea, an interdisciplinary
analysis of the Danube catchment area, the Danube River system and the mixing zone of the
Danube River in the North-Western Black Sea needs to be carried out.
5.6.1.2. Objectives:
The main objectives of the daNUbs project are:
>
to improve the knowledge of the sources, pathways, stocks, losses and sinks of
nutrients in a large river catchment,
>
to improve the knowledge of the effects of nutrients (nitrogen, phosphorus and silica)
on the receiving ecosystems with special emphasis on the coastal areas,
>
to develop, improve and combine management tools for nutrients in the Danube Basin;
and
>
to develop scenarios for nutrient management and the effect on water quality and the
consequences on the socio-economic development in the Danubian countries.
..The project concentrates on the Danube as the main contributor to the nutrient pollution of the
Western Black Sea shelf.
ENVIRONMENTAL INSTITUTE
DEVELOPMENT OF OPERATIONAL TOOLS FOR MONITORING, LABORATORY AND INFORMATION MANAGEMENT
Developing WFD type-specific quality standards for nutrients Ł Draft Final Report
page 45
5.6.1.3. Scientific Achievements
... Historic data on water quality were used to calibrate the models. With the help of the models,
data gaps could be closed. A number of indicators were derived from marine ecological data which
can be used for efficient monitoring of the Black Sea coastal area status. The combination of
modelling and ecological assessment of Black Sea coastal waters influenced by the Danube
(including cruise investigations and satellite imaging) allowed the definition of critical loads with a
certain range of uncertainty. The strong variations of nutrient discharges over the last 40 years
caused by severe political and economical changes were essential for this achievement which is of
great importance for management decisions. ...
5.6.1.4. Results
The situation in the North-Western Black Sea shallow waters has improved considerably since the
early 90s due to reduced nutrient inputs, causing:
>
reduced eutrophication, (reduced phytoplankton biomass, frequency of blooms and
extension of high chlorophyll area),
>
considerable increase in water transparency
>
improvement of near bottom oxygen regime,
>
regeneration of phytoplankton species (Diatoms) diversity,
>
regeneration of phytobenthos,
>
regeneration of macrozoobenthos (increase of species number and diversity).
Zooplankton community in the North-western and Western Black Sea is still controlled by the
gelatinous macrozooplankton (Mnemiopsis, Aurelia, Pleurobrachia), with respective consequences
on the recovery of the pelagic fish stocks. The limiting factor for phytoplankton growth in the
eutrophic areas of the N-W-Black Sea is phosphorus (since 1997). In the off shore waters mainly
nitrogen limits the primary productivity. As a consequence, the control of easily available P loads
from Danube Basin directly control algae growth in N-W-Black Sea shallow waters.
The improvement of the coastal area is a result of decreasing nutrient discharges (especially
phosphorus) to this part of the Black Sea. Current low discharges of N and P to the Black Sea by
Danube river are the result of
>
improved nutrient removal from waste water in Germany, Austria and the Czech
Republic
>
reduced phosphate discharges from detergents and
>
the consequence of the economic crisis in central and eastern European countries which
lead to: closure of large animal farms (agricultural point sources, dramatic decrease of
the application of mineral fertilizers and closure of nutrient discharging industries (e.g.
fertilizer industry).
5.6.1.5. Conclusions
For a sustainable development of the Western Black Sea ecosystem the nutrient discharge from the
Danube River should be further reduced but at least kept at its present level. Scenario calculations
clearly show that the economic development in the Danube Basin may reverse the improving
situation of the quality of the North-Western and Western Black Sea ecosystem, if nutrients are not
managed properly. Policy measures have to be proactive and should focus on continuous and long
term control of all anthropogenic point and diffuse sources of nutrients (waste water management,
agriculture, combustion processes). ... Monitoring the effects of nutrient management in the river
UNDP/GEF DANUBE REGIONAL PROJECT
Chapter 5: Application of the Austrian proposed 1st draft method
page 46
Danube and the Black Sea is important but it has to be taken into account that there is a time lag
(up to > 20 years) between cognition of deficiencies, implementation of control measures and
corresponding effects in the river Danube.
5.6.2. Critical
loads
The above summary above introduced the term "critical loads"; more details are included in the
boxout below. For the underlying study the following are considered to be important implications:
>
the critical loads appear to relate to total-nitrogen and total-phosphorous;
>
the critical loads appear annual mean data (concentrations, flows).
Intermezzo:
3.3.2.4. Determination of Critical Loads for Danube Discharges to Western Black
Sea. Excerpts from [daNUbs, 2005]
The determination of the amount of river borne nutrients, which can be disposed to a marine ecosystem
without harm, requires a solid background knowledge about the system questioned. This includes the original
state of the ecosystem before anthropogenic pollution, the kind of pollution in the river and its impact on the
marine environment; the kind and extent of damage to the ecosystem under pollution stress, which in turn
requires a definition of " harm to the ecosystem" as well as the size and location of the ecosystem. In the
Danube - Black Sea system some of these background information exist due to the fact that there has been a
strong increase in pollution since the early 1960s and a decrease in nutrient loads since the early 1990s, a
period from which valuable data series and descriptions of the Black Sea ecosystem exist. In addition in the
frame of the EU-daNUbs project, considerable knowledge of the source, kind and amount of riverine nutrients
and of the status quo of the North-Western Black Sea shallow waters (here considered as the most sensitive
part of the ecosystem) has been obtained.
With this information we can consider the Danube nutrient loads in the early 1960s as tolerable, because there
was no reported damage to the N-W Black Sea shallow water ecosystem. However, we observed a considerable
improvement in the N-W Black Sea shallow waters after the late 1990s (reduced dissolved nutrients off the
Danube Delta, reduced phytoplankton blooms, strongly improved near bottom oxygen regime, considerable
increase in benthic macro fauna). Finally in 2002 and 2004 we observed an extended recovery of epibenthic
flora and fauna in the N-W Black Sea shallow waters which is a proof of the absence of long lasting anoxic
conditions in this region. On the basis of the results in can be concluded that with the present nutrient loads the
N-W Black Sea ecosystem is capable to recover.
When considering hypoxia and its consequences as the main hazard to the marine environment of the N-W
Black Sea, phytoplankton biomass production is the determining factor. Phytoplankton primary productivity in
the river water influenced eutrophic area off the Danube Delta since the late 1990s appears to be phosphorous
limited. Consequently the phosphorous loads determine the "environmental quality" of this region. Therefore
the present Danube phosphorous loads, which are of a similar magnitude as those of the late 1960s, may be
considered as "tolerable loads" to be disposed for a sustainable N-W Black Sea environment.
However, there are several limitations as to this "statement": The Black Sea environment is subject to
continuous alterations as abiotic and biotic factors are concerned. This includes e.g. global warming and
atmospheric changes, introduction of foreign species or over fishing. These factors and their influence on the
ecosystem and consequently on nutrient depending production processes can be hardly predicted.
5.6.3. Nitrogen
The daNUbs project results indicate that both P and N compounds will be relevant for the Black
Sea: "The limiting factor for phytoplankton growth in the eutrophic areas of the N-W-Black Sea is
phosphorus (since 1997). In the off shore waters mainly nitrogen limits the primary productivity"
[daNUbs, 2005; compare also the boxout in the previous section].
ENVIRONMENTAL INSTITUTE
DEVELOPMENT OF OPERATIONAL TOOLS FOR MONITORING, LABORATORY AND INFORMATION MANAGEMENT
Developing WFD type-specific quality standards for nutrients Ł Draft Final Report
page 47
When dealing with nitrogen compounds, one normally deals with Dissolved Inorganic Nitrogen
(DIN) compounds on the one hand (NO3, NO2, NH4), and organic nitrogen at the other hand11, with
total nitrogen supposed to be the sum of DIN + organic N.
For pollution of marine waters by nutrients, nitrogen conditions often are expressed as Dissolved
Organic Nitrogen (DIN), comprising the sum of NO3, NO2 and NH4. The daNUbs reports address
nitrogen compounds in both ways, sometimes discriminating DIN from Ntot.
5.6.3.1. Dissolved Inorganic Nitrogen: NO3, NH4 and NO2
In the Austrian 1st proposed method of 2005, NH4 and NO2 are considered as potentially harmful
(toxic) substances. For this reason, no type-specific standards were calculated as such. For the
mainstream of the Danube (as well as the Danube tributaries) similar arguments could be used,
except for the following: the input of nitrogen compounds into the Black Sea.
In section 5.3.4 the tendency of decreasing NO3 concentrations in the downstream direction has
been mentioned. For NO2 and NH4, the situation actually seems to be pointing into an opposite
direction: concentrations tending to increase in the downstream direction. Compare for instance
the graph below.
Figure 14
Longitudinal profile of NH4 concentrations (90%-ile values) along the Danube in
2001 and 2004.
NH4 concentrations (90%-ile values) along the Danube in 2001 and
2004
1.2
1
0.8
l
]
0.6
N/
g
[m
0.4
0.2
0
2500
2000
1500
1000
500
0
distance to Black Sea [km]
2001
2004
For the graph below, the TNMN data for NO3, NO2 and NH4 have been added together as DIN per
date and site of sampling (in case one of the nitrogen compounds were lacking, the data were
omitted) for the years 2001.
11 Often, Kjeldahl-nitrogen is reported in this context, basically comprising the sum of organic nitrogen plus ammonium
(NH4)
UNDP/GEF DANUBE REGIONAL PROJECT
Chapter 5: Application of the Austrian proposed 1st draft method
page 48
Figure 15
Average ratio of NO3, NO2 and NH4 in DIN along the Danube in the year 2001
NH4
NO2
NO3
100%
90%
80%
70%
60%
50%
40%
30%
20%
10%
0%
n
f
e
r
a s
ol r
s
rm
alde T
rom ob
o ina
ad un
rm m m
evo
kija ac
ov
ar
H
tei
edv edov Sz
dan rovoi S m
zia
ev
usse
ar
tein A Asten lfsthal
nc
Te
arbou isht
atislava
oldva Bat
gojevo
alank
/Prist
Arge
edvedov
/M
oma
gszant Bez
Bo
ZePa
Ba
. R m
/Silistra
Kilia a
Kilia a
ghe
inger chens
en- Nussdor
WoBr M
/Kedv
Bo
Nov
ulina
ka P
Raduj
bour
kar-Bajkal
Svus listra/Chiciu
lia/ rm/hor
chensJo ind ien-
e/ edov
om
Dunaf
Selo H
treaSi Chiciu
-G - S
/BoefJo
W
ar arno/K
Herce
us. Is
-Chilia a ina
Abw
MedvMedv
m
Banats
lo Har
Ups
ghe
Ulm
Kom Ko
wnstream
ReniChi
Sul
o Se
or
Do
a-
Neu-
NovPristol/Novo
Vilkov
Sf. Ghe
The amount of NH4 in the DIN can be more than 20%.
A similar pattern seems to reveal itself in 2004, as shown in the graph below.
Figure 16
DIN concentrations (NO3+NO2+NH4) along the Danube in the year 2004
Annual mean DIN concentrations along the Danube in 2004
3.5
3
2.5
l
]
2
N/
g
1.5
[m
1
0.5
0
n
m
r
a
a
m m
rm
alde
n rf
a
rm
m m
dov ve
vo
ad un
nk ias kija ac
ciu ar ar a
H
stei
fsthal
ed edovaroSzobldvaanto zdan
ev
ristol
ussergesilistrahi
lia
are ar
ensteinAste ol
m
Batinagojevo alank
vi S
Te
arbour ishtov A
ilia
ilia a
edve/Medv
Be
Boro
Zem
PancevoBaz duj
r/Pr-Bajkal. R
/K hi
hilia
ulina
inger chen Nussdo
W Bratislavov /K
nafo
Bo
No
Svus
/C m/K/C
rgh
JochJo nden-
Raelo H ska
iciu/S
ien-
e/Med m
Du rcegsz
rbou
ho
S
. I
stream
ChSilistra/Crm ar rm -G
/Boef
W
dv
aro arno/Ko He
Backa P
natska Pala
Haus ream
Abwi
edv
MeM
m
Ba
o
st
Up
ni-Chilia
lia ahilialia a
Ulm
KomKo
Sel
wn
Re - Ki
Sulina - S
rghe
vo
Do
va - Ki eo
Neu-
Pristol/Novo
No
Renilkova-C Gh
Vi Vilko Sf.
NH4
N02
N03
5.6.3.2. Organic nitrogen
The available data for organic nitrogen for the year 2001 are summarised in the table below.
Please notice that at Medve/Medvedov and Komarom/Kedvedov the Hungarian concentrations are
substantially higher than the Slovakian is and also deviate from those found at the other TNMN
stations.
ENVIRONMENTAL INSTITUTE
DEVELOPMENT OF OPERATIONAL TOOLS FOR MONITORING, LABORATORY AND INFORMATION MANAGEMENT
Developing WFD type-specific quality standards for nutrients Ł Draft Final Report
page 49
Table 18
2001 annual mean organic nitrogen concentrations
section rkm Country Location
organic
nitrogen
[mg N/l]
4 1869
SK Bratislava
0.3
1806
HU
Medve/Medvedov
1.6
1806
SK
Medvedov/Medve
0.4
5 1768
HU Komarom/Kedvedov
1.9
1768
SK
Komarno/Komarom
0.4
1708
HU
Szob
0.2
6 1435
HU Hercegszanto 0.3
1429
HR
Batina
0.3
1337
HR
Borovo
0.2
In 2004, more TNMN monitoring stations included organic nitrogen in their monitoring
programmes.
Table 19
2004 annual mean organic nitrogen concentrations
Section Rkm Country Location
Organic nitrogen [mg N/l]
4 1869
SK Bratislava
0.4
1806
HU
Medve/Medvedov
0.9
SK
Medvedov/Medve
0.3
5 1768
HU Komarom/Kedvedov
0.7
SK
Komarno/Komarom
0.4
1708
HU
Szob
0.0
6 1435
HU Hercegszanto 0.3
1429
HR
Batina
0.3
1427
SC
Bezdan
0.4
1367
SC
Bogojevo
0.5
1337
HR
Borovo
0.3
1287
SC
Backa
Palanka
0.9
1258
SC
Novi
Sad
0.7
1174
SC
Zemun
1.1
1154
SC
Pancevo
1.4
1076
SC
Banatska
Palanka
0.6
7 954
SC Tekija
0.8
8 851
SC Radujevac
0.7
503
BG
us.
Russe
1.4
9 375
BG Silistra/Chiciu 1.6
5.6.3.3. Concluding remarks
There seem to be insufficient data available to evaluate the pollution of the (North-Western shelf)
of the Black Sea in terms of setting water quality objectives, while taking into account the
requirements of setting type-specific quality nutrient standards for the Danube river as well.
Data for DIN for the years 2001 and 2004 indicate NO3 concentrations to decrease and NH4
concentrations to be increasing in an upstream - downstream direction. With organic-nitrogen data
only becoming monitored at more TNMN stations in 2004 (albeit only still up to rkm 375), no
substantiated statements can be formulated here yet.
UNDP/GEF DANUBE REGIONAL PROJECT
Chapter 5: Application of the Austrian proposed 1st draft method
page 50
5.6.4. Phosphorous
For both Ptot and PO4, monitoring data basically already are available through the TMNM network,
including locations near to the Danube's discharge at the Black Sea.
5.6.5. Critical loads versus 90%-ile concentrations
Setting type-specific standards criteria for the Danube River, while taking into account the potential
impact of the Danube on the Black Sea, will not be an exercise that automatically grants both
purposes.
Several methods can be applied for calculating river loads, ranging from using momentary
concentrationŁtimes-flow based observations up to annual averaged concentration-times-flow
based approaches. For the calculation of (critical) loads, one though cannot use 90%-ile
concentrations as such.
The data collected at the most downstream monitoring sites will become most decisive. They will
have to comply with methods like the Austrian 1st proposed method as well as providing a proper
basis for load calculations. Implying that for setting quality objectives for more upstream situated
Danube locations, one may have to take several `downstream factors' into account as well, like
loads expected to be discharged into the Black Sea.
Possible implications can be derived from annex 4, which includes a wider range of statistics for
most nutrients at the TNMMN sites for 2001 and 2004. An example is shown in the graph below;
annual average NO3 concentrations in 2001 can be lower than the associated 90%-ile values as
much as ranging from 0.1 through 0.8 up to 1.2 mg N/l!
Figure 17
Mean and 90%-ile NO3 concentrations along the Danube in 2001
Mean and 90%-ile NO3 concentrations along the Danube in
2001
4
3.5
3
2.5
/
l
]
2
P
g
[m
1.5
1
0.5
0
2500
2000
1500
1000
500
0
distance to Black Sea
mean
90-tile
ENVIRONMENTAL INSTITUTE
DEVELOPMENT OF OPERATIONAL TOOLS FOR MONITORING, LABORATORY AND INFORMATION MANAGEMENT
Developing WFD type-specific quality standards for nutrients Ł Draft Final Report
page 51
6. DISCUSSION
6.1. Benthic invertebrate fauna
The 1st proposed Austrian method heavily depends on data for benthic invertebrate fauna12.
6.1.1. Data
availability
Except for the Joint Danube Survey there are no data encompassing the whole Danube. The TNMN
network includes benthic invertebrate fauna only from rkm 2581 Neu-Ulm/Boefinger Halde up to
1435 Hercegszanto (status in 2004). The Aquaterra survey of 2004 covered a limited stretch
(between rkm 1942, Klosterneuburg and rkm 795, Calafat).
Because of the limited availability of data, it is not yet possible to investigate the possible
differences for instance between years. When comparing the overlapping stretches of JDS and
Aquaterra, the data suggested for instance a better hydrobiological quality in 2004 according to the
SI's but also higher 90%-ile NO3 concentrations. Without more years of observations it will remain
unclear to which extent for instance temporal variations will affect the results.
A good example furthermore is provided with Table 12. For overlapping sites, the status near
several TNMN stations would be qualified as `high' status according to the Aquaterra results (old
version German SI index), while with the TNMN monitoring data the status would qualify as `good'.
6.1.2. Quality status: metrics & index
An important assumption for the underlying study has been to apply a SI of 2.00 as the class
boundary for high status for the whole of the Danube, also since herewith the remaining metrics
(for good, moderate, et cetera) were set. It is obvious that under different baselines also the
related quality classes can be expected to be different. Compare for instance the intermezzo in
section 5.1.2 which shows that under the Austrian standards ųNORM M 6232 quality classes are
essentially quite different
The Aquaterra survey illustrates the importance of the method for calculation of the Saprobic
Index. Calculating the SI according to the `old' and the `new' German versions would lead to a
different status assigned to several of the sampling sites (compare section 5.4.1).
6.1.3. The `class boundary Ł 0.125' criterion
Since it is part of the Austrian 1st proposed method it has been decided not to deviate from the
principle to select only those sites with an SI within 0.125 units for the class boundary, despite the
fact that after applying the criterion relatively few sites remained (compare sections 5.3 and 5.4).
As more general remarks one could raise as a question whether such a strict criterion is suited to
such a dynamic environment like the Danube. From a methodological point of view, the criterion is
considered to be sound and relevant, but as shown in practice can complicate affairs. Only after
having obtained more data sets (especially: more benthic invertebrate fauna data that can be
linked with the TNMN monitoring stations) there could be sufficient material to evaluate and
possibly adjust this criterion.
Meanwhile, by using expert judgements one may consider including the results of the `non-eligible'
sites as well while assessing the overall picture.
12 Exercises using e.g. phytoplankton and fish are under preparation in Austria.
UNDP/GEF DANUBE REGIONAL PROJECT
Chapter 6: Discussion
page 52
6.2. Physico-chemical data
6.2.1. Physico-chemical `finger-printing' of the Danube Section Types
In the preceding study "Einteilung ųsterreichischer Fliessgewõsser nach allgemein-chemischen
Parametern", Kreuzinger and Deutsch combined the phsyco-chemical monitoring data and the
various surface water types as a first step to determining type-specific class boundaries for
physico-chemical quality elements [Kreuzinger, Norbert; Deutsch, Karin, 2003)]. With the Austrian
1st proposed draft method of 2005, the authors mention to have abandoned this approach in favour
of the hydrobiologically based method (compare chapter 4).
It will be useful to conduct a comparable study dedicated to analysing the physico-chemical TNMN
monitoring data (and adding at least quantitative parameters like flow) within the various Danube
Section Types with the purpose of investigating their physico-chemical characteristics.
For example: the 2001 and 2004 data indicate a difference in NO3 concentrations between the
upper and the lower reaches. The figure below shows the data for dissolved oxygen, nitrate and
ammonium for the year 2001. The pattern for dissolved oxygen and nitrate show lower values in
the lower reaches, while the ammonium concentrations there tend to be higher13.
Mean concentrations of dissolved O2, N03 and NH4 along the Danube
in 2001
3.5
12
3
10
2.5
8
/l]
2
/l]2
N
g
6
O
g
1.5
[
m
[m
4
1
0.5
2
0
0
0
2
4
6
8
10
12
section type number [-]
NH4-N
NO3-N
diss oxygen
Whether these phenomena are expressions of accumulated (organic) pollution or indeed from more
type-specific differences partially might be revealed by examining and cross-linking the various
physico-chemical parameters. Information on pollution sources and inflow of tributaries are to be
included in the assessment and interpretation of results.
13 The `turning point' seems to be section type 7, which includes the Iron Gate reservoir.
ENVIRONMENTAL INSTITUTE
DEVELOPMENT OF OPERATIONAL TOOLS FOR MONITORING, LABORATORY AND INFORMATION MANAGEMENT
Developing WFD type-specific quality standards for nutrients Ł Draft Final Report
page 53
6.2.2. Different monitoring results between countries
Several examples indicate that two countries can report quite different results at the same TNMN
cross section (compare for example the intermezzo in section 5.3.4.1). When finding such
differences at one TNMN station, one may wonder how such differences possibly also can affect
data of surrounding stations where there is only one monitoring country. It is obvious that such
differences can have far-reaching implications when assessing the water quality or when
conducting studies like the underlying one. It is not within the reach of the underlying study to go
beyond the mere noticing of the possible existence of such differences.
6.3. The calculated 90%-iles
6.3.1. Robustness of the results
Also taking into account the various remarks in the previous sections and chapters, one has to
conclude that the basis of the exercises of the underlying study has been too fragile to use the
results already in more absolute terms (like as fixed quality standards for nutrients).
As a parallel, the situation could be described like `measuring the water temperature with an
uncallibrated thermometer'. Although one knows that the thermometer as such measures the
temperature, one cannot say exactly how warm or cold the water is since the reference point of the
thermometer is not known and the differences in temperature along the scalar units on the
thermometer are not yet defined.
For example: the tables in Annex 3 contain results under the `high/good' and `good/moderate'
status column for 2001 and under the `high/good' status columns for 2004. By comparison, the
90%-ile values appear to be merely the same. Taking into account the Saprobic Index according to
the TNMN data for 2004 at the matching Aquaterra sites, then these sites would have been
qualified as `good' status, in stead of `high'. The assignment of the status as such again is primarily
based on the assumption of setting the ground state (`high status') at a SI of 2.00. The JDS
report summarises the results of the macrozoobenthos as "The saprobity of the Danube varied
between water quality class II (moderately polluted) and II-III (critically polluted)" [JDS 2003,
section 4.2], using the ųNORM M 6232 as the classification scheme. Which of course makes a
difference with classifying most of the sites as being of `good status'.
6.3.2. Type-specific
features?
As mentioned in section 6.2 and chapter 5, for a parameter like NO3 in 2001 and 2004, but
seemingly also for Ptot and PO4 in the year 2004, there appear to be noteworthy differences
between the upstream and downstream parts (with section type 7 possibly somehow the turning
point). Such observations already justify that for the mainstream of the Danube indeed a type-
specific approach will be required (so, besides external factors like the Water Framework
Directive). It should be added that the JDS 2001 data on benthic invertebrate fauna did not
indicate a certain tendency in the development in the upstream- downstream direction.
Theoretically, the observed NO3 trend in decreasing concentrations in the downstream direction
might be interpreted as allowing for more pollution in the upstream sections. Of course, such
should not be the conclusion. If only that more pollution upstream would imply possible larger
problems in meeting the perceived more stringent conditions in the lower sections.
Even when dissecting the mainstream of the Danube in 10 different typological sections, it stills
remain one continuous river. From this point of view, future derivations of type-specific quality
standards should keep these inter-connections into mind.
UNDP/GEF DANUBE REGIONAL PROJECT
Chapter 6: Discussion
page 54
6.4. Black Sea perspective
Section 5.6 introduced some additional considerations when establishing quality standards for the
Danube River while also taking into account the pollution of the Black Sea. At least it will have to
be verified whether `good' status quality standards for the (lower part of the) Danube river also will
safeguard pollution of the Black Sea. The daNUbs project as such seems to have provided with
most (if not: all) necessary tools for doing so.
6.5. Closing remarks
Although the underlying study has not been able to produce already sound type-specific quality
standards for nutrients in the Danube River, the exercise at least has shown the applicability of the
Austrian 1st proposed method to the Danube.
Basically, the underlying study has not revealed any principle obstacles for applying the Austrian
method, except for the current lack of monitoring benthic invertebrate fauna at a series of TNMN
stations and not yet fully developed and agreed metrics like ecological quality ratios for benthic
invertebrate fauna. Considering that monitoring of macrozoobenthos along the full stretch of the
Danube and the development of metrics will have to be realised anyway, this may be first of all a
matter of time
Meanwhile, in Austria activities are currently undertaken for further development of the method,
including:
>
a second round of the work repeated with data 2003-2005 to sharpen the criteria as
well as to correlate imission data with other biological methods (trophic situation, fish
data); in this round the "large rivers" will be implemented too;
>
publishing of a corresponding project on lakes;
Activities are expected to be completed by summer 2006 [Deutsch & Kreuzinger, 2006].
The second Joint Danube Survey scheduled for 2007 provides an opportunity on short term to
collect additional data that also can be used for the purposes of further development of type-
specific nutrient water quality standards. The findings of the underlying study and the new reports
expected for Austria may trigger inclusion of some additional measurements in the coming Joint
Danube Survey.
ENVIRONMENTAL INSTITUTE
DEVELOPMENT OF OPERATIONAL TOOLS FOR MONITORING, LABORATORY AND INFORMATION MANAGEMENT
Developing WFD type-specific quality standards for nutrients Ł Draft Final Report
page 55
7. CONCLUSIONS
AND
RECOMMENDATIONS
7.1. Conclusions
>
The underlying study has identified the 1st draft method developed in Austria in 2005
as a promising candidate method for developing WFD-compliant, type-specific quality
standards for nutrients in the Danube River. Other angles and/or approaches are
deemed to be too complex to render useful results for the Danube River, at least on
short term.
>
The Austrian 1st draft proposed method as such could be applied to the mainstream of
the Danube as well. Two important gaps though were identified while applying the
Austrian 2005 1st draft method:
o There is no routine monitoring of biological quality elements at all Transnational
Monitoring Network (TNMN) sites. Monitoring for instance benthic invertebrate
fauna so far has not been realised at all TNMN stations (status up to 2004).
o No agreed metrics for assessing a WFD-compliant biological status are available
for the Danube river yet.
>
Because of these gaps, no conclusive type-specific quality standards could be
developed yet, although the basic physico-chemical data as such seem to be available.
>
A type-specific approach for establishing nutrient quality standards for the Danube
River seems to be justified anyway. The 2001 and 2004 monitoring data indicate
different characteristics for the `upper' and `lower' Danube reaches (with riverkilometre
1300, and possibly Iron Gates, seemingly a pivot).
>
Applying the Austrian 1st draft proposed method not automatically will warrant meeting
safeguarding the pollution of the Black Sea from inputs of nutrient via the Danube;
additional checks and calculations will be required.
7.2. Recommendations
>
Monitoring of biological quality elements should be introduced at all TNMN monitoring
stations for at least: benthic invertebrate fauna and phytoplankton (including:
chlorophyll-a).
>
WFD-compliant and Danube Section Type's specific metrics (Ecological Quality Ratios)
for biological quality elements will have to be developed; otherwise a crucial basis for
developing type-specific quality standards is missing.
>
The available TNMN monitoring data should be examined and processed for
`fingerprinting' the current Danube Section Types.
UNDP/GEF DANUBE REGIONAL PROJECT
References
page 56
REFERENCES
Andersen, Jens M°ller; Dunbar, Michael ; Friberg, Nikolai (editors) 2004.
Report on existing
methods and relationships linking pressures, chemistry and biology in rivers. REBECCA WP4 Rivers
Deliverable D6. December 2004. http://www.rbm-
toolbox.net/docstore3/docstore_free.php?service=3&groupid=5
BLFUW, 2006. Summary report of the characterisation, impacts and economics analyses required
by Article 5 - Austrian River Basins. Federal Ministry of Agriculture, Forestry, Environment and
Water Management, Vienna, 2006. http://wasser.lebensministerium.at/article/archive/5659
Buijs, Paul; Uzonov, Yordan; Tsankov, Konstantin; 1992.
Water quality profile of the Danube
river along the Bulgarian-Romanian stretch (June 1991). ICWS-report 92.01. ICWS, Amsterdam,
The Netherlands.
Buijs, Paul, 2003.
Orientation on environmental quality standards for nutrients and other
Danube specific priority substances.
CIW, 2002.
Gedifferentieerde normstelling voor nutriļnten in oppervlaktewateren. Methodiek
voor het afleiden van gedifferentieerde normen voor fosfor en stikstof op stroomgebiedniveau.
Commissie Integraal Waterbeheer, Den Haag, The Netherlands. June, 2002.
http://www.rijkswaterstaat.nl/rws/riza/leidraad/pdf/Gedifferentieerde_normstelling.pdf
daNUbs, 2005. Nutrient Management in the Danube Basin and its Impact on the Black Sea.
daNUbs. Final Report. Section 5: Executive Summary. Section 6: Detailed Report. Institute for
Water Quality and Waste Management, Vienna University of Technology. Wien, Austria.
Deutsch, Karin; Kreuzinger, Norbert, 2005.
Leitfaden zur typspezifischen Bewertung der
allgemeinen chemisch/physikalischen Parameter in Flie▀gewõsser. 1. Vorschlag September 2005.
Bundesministerium f³r Land- und Fortwirtschaft, Umwelt und Wasserwirtschaft Ł Sektion VII.
BMLFUW Ł UW.3.1.2./0013-VII/1/2005. Vienna, September 2005.
http://wasser.lebensministerium.at/article/archive/5659
Deutsch & Kreuzinger, 2006. personal communication
DG Environment, 2005. Eutrophication Guidance (Eutrophication assessment in the context of
European water policies); version 11, November 2005. EC-DG Environment D2 and Steering Group
(DE, FI, NL, UK, EEA and JRC).
ECOSTAT, 2003.
Overall Approach to the Classification of Ecological Status and Ecological
Potential. Working Group 2 A Ecological Status (ECOSTAT), November 2003.
http://forum.europa.eu.int/Public/irc/env/wfd/library?l=/framework_directive/guidance_documents
&vm=detailed&sb=Title
Heiskanen, Anna-Stiina; Solimini, Angelo G. (editors), 2005. Analysis of the current knowledge
gaps for the implementation of the Water Framework Directive. REBECCA project. EUR 21497 EN.
http://www.rbm-toolbox.net/docstore3/docstore_free.php?service=3&groupid=5
ICPDR, 2002. Joint Danube Survey. Technical Report of the International Commission for the
Protection of the Danube River. September 2002. ICPDR, Vienna.
ICPDR, 2005. The Danube River Basin District. River basin characteristics, impact of human
activities and economic analysis required under Article 5, Annex II and Annex III, and inventory of
protected areas required under Article 6, Annex IV of the EU Water Framework Directive
(2000/60/EC). Part A Ł Basin-wide overview. ICPDR, Vienna.
ENVIRONMENTAL INSTITUTE
DEVELOPMENT OF OPERATIONAL TOOLS FOR MONITORING, LABORATORY AND INFORMATION MANAGEMENT
Developing WFD type-specific quality standards for nutrients Ł Draft Final Report
page 57
Kreuzinger, Norbert; Deutsch, Karin (2003)
Einteilung ųsterreichischer Fliessgewõsser nach
allgemein-chemischen Parametern. Wiener Mitteilungen (2003) Band 183, 25-51. Institut f³r
Wasserg³te / TU-Wien
Kreuzinger, Norbert, 2005.
Erarbeitung und Anwendung eines typspezifischen chemischen
Bewertungsschemas f³r Flie▀gewõsser in ųsterreich. Institut f³r Wasserg³te, Technische
Universitõt Wien. Vienna, July 2005. http://wasser.lebensministerium.at/article/archive/5659
Liere, E. van; Jonkers, D.A. (editors), 2002.
"Watertypegerichte normstelling voor nutriļnten in
oppervlaktewater". RIVM rapport 703715005/2002. Bilthoven, the Netherlands, 2002 (in Dutch,
with some parts translated into English; available at
http://www.rivm.nl/bibliotheek/rapporten/703715005.html).
Moog, Otto; Schmidt-Kloiber, Astrid; Ofenb÷ck, Thomas; Gerritsen, Jeroen, 2001.
Aquatische
ųkoregionen und Flie▀gewõsser-Bioregionen ųsterreichs. Bundesministerium f³r Land - und
Forstwirtschaft, Umwelt und Wasserwirtschaft, Wasserwirtschaftskataster. Vienna, 2001.
http://wasser.lebensministerium.at/article/archive/5659
REFCOND, 2003.
Guidance on establishing reference conditions and ecological status class
boundaries for inland surface waters. Produced by Working Group 2.3 Reference conditions for
inland surface waters (REFCOND), 30 April 2003.
http://forum.europa.eu.int/Public/irc/env/wfd/library?l=/framework_directive/guidance_documents
&vm=detailed&sb=Title
Solheim, Anne Lyche (editor), 2005.
Reference Conditions of European Lakes. Indicators and
methods for the Water Framework Directive Assessment of Reference conditions. Draft Version 5;
Dec. 30, 2005. REBECCA D7.
http://www.rbm-toolbox.net/docstore3/docstore_free.php?service=3&groupid=5
Sommerhõuser, Mario; Robert, Sabina; Birk, Sebastian; Hering, Daniel; Moog, Otto; Stubauer,
Ilse; Ofenb÷ck, Thomas, 2003. UNDP/GEF Danube Regional Project "Strengthening the
implementation capacities for nutrient reduction and transboundary cooperation in the Danube
River Basin". Activity 1.1.2 "adapting and implementing common approaches and methodologies
for stress and impact analysis with particular attention to hydromorphological conditions"; Activity
1.1.6 "developing the typology of surface waters and defining the relevant reference conditions";
Activity 1.1.7 "implementing ecological status assessment in line with requirements of EU Water
Framework Directive using specific bioindicators". FINAL REPORT. Vienna, Austria December, 2003.
http://danubis.icpdr.org/undp-drp/
Stubauer, Ilse; Moog, Otto (2003).
Integration of the Saprobic System into the WFD approach
- A proposal for the the Danube River. 2nd Surface Water Workshop, Zagreb, 4-5 September 2003.
http://danubis.icpdr.org/undp-drp/
US-EPA, 2000. Nutrient Criteria. Technical Guidance Manual Lakes and Reservoirs. First Edition.
EPA-822-B00-001, April 2000.
http://www.epa.gov/waterscience/criteria/nutrient/guidance/lakes/index.html
UNDP/GEF DANUBE REGIONAL PROJECT
DEVELOPMENT OF OPERATIONAL TOOLS FOR MONITORING, LABORATORY AND INFORMATION MANAGEMENT
Developing WFD type-specific quality standards for nutrients Ł Draft Final Report
page 59
ANNEX 1: OVERVIEW OF TNMN, JDS AND
AQUATERRA SAMPLING SITES WITHIN DANUBE'S
SECTION TYPES
This annex contains the overview of the various sampling/monitoring sites along the mainstream of
the Danube River included for the purposes of the underlying study. Please refer to section 5.2.1
for details.
The sites with bold printed typeface indicate a match between TNMN and JDS/AQUATERRA
sampling sites.
Section
Reach
TNMN station(s) inside
Nearest JDS sampling
Nearest
Remarks
Type
Section
site(s) [JDS code; rkm;
AQUATERRA
[DEFF code; rkm; name]
name]
sampling site(s)
[AQUATERRA code;
rkm; name]
2
rkm 2581: Neu
TNMN L2140
JDS 01
Ulm Ł rkm
rkm 2581
rkm 2591
2225: Passau
Neu-Ulm
Neu-Ulm
JDS02: rkm 2412,
Kelheim
JDS03: rkm 2358
Upstream dam Geisling
(Regensburg)
JDS04: rkm 2233
Upstream dam Kachlet
tributary Inn at
(Passau)
rkm 2225
3 rkm
2225:
TNMN L2130 (DE) /
two sets of
Passau Ł rkm
TNMN L2220 (AU)
JDS06
TNMN
2001: Krems
rkm 2204
rkm 2204, Jochenstein
monitoring data
Jochenstein
JDS07: rkm 2165,
Upstream dam Aschach
TNMN L2200
JDS08
rkm 2120
rkm 2120
Abwinden-Asten
Upstream dam
Abwinden-Asten
JDS09: rkm 2096,
Wallsee
JDS10: rkm 2061,
Upstream dam Ybbs-
Persenbeug
JDS11: rkm 1950,
Upstream dam
Greifenstein
4 rkm
2001:
TNMN L2180
JDS12
ADS 1
Krems Ł rkm
rkm 1935
rkm 1942,
rkm 1942
1789.5:
Wien-Nussdorf
Klosterneuburg
Klosterneuburg
G÷ny/Klizskß
JDS14: rkm 1895,
ADS 2: rkm 1895,
Nemß
Wildungsmauer
Wildungsmauer
TNMN
L2170 JDS15: rkm 1881,
ADS 3: rkm 1881,
tributary
rkm 1874
Upstream Morava
upstream Morava
Morava at rkm
Wolfsthal
(Hainburg)
(Hainburg)
1880
TNMN L1840
JDS17
ADS 4
rkm 1869
rkm 1869
rkm 1869
Bratislava
Bratislava
Bratislava
JDS18: rkm 1856,
ADS 5: rkm 1856,
Gabcikovo reservoir
Gabcikovo reservoir
entrance
entrance
JDS19: rkm 1852,
ADS 6: rkm 1852,
Gabcikovo reservoir
Gabcikovo reservoir
UNDP/GEF DANUBE REGIONAL PROJECT
Annexes
page 60
Section
Reach
TNMN station(s) inside
Nearest JDS sampling
Nearest
Remarks
Type
Section
site(s) [JDS code; rkm;
AQUATERRA
[DEFF code; rkm; name]
name]
sampling site(s)
[AQUATERRA code;
rkm; name]
JDS20: rkm 1846,
ADS 7: rkm 1846,
Gabcikovo reservoir 2
Gabcikovo reservoir 2
JDS21 rkm 1812, Sap
(Outlet-channel)
JDS22: rkm 1812,
┴svßnyrßr¾ (old
Danube)
TNMN L1470 (HU)
two sets of
TNMN L1860 (SK)
JDS23
ADS 8
TNMN
rkm 1806,
rkm 1806
rkm 1806
monitoring data
Medvedov/Medve
Medvedov/ Medve
Medvedov/Medve
5 rkm
1789.5:
TNMN 1475 (HU)
two sets of
G÷ny/ Klizskß
TNMN L1870 (SK)
JDS25
TNMN
Nemß Ł rkm
rkm 1768
rkm 1768
monitoring
1497: Baja
Komarom/Komarno
Komarno/Komarom
data;
JDS27: rkm 1761,
ADS 9; rkm 1761
tributary: Vah
Iza/Szon
Iza/Szony
at rkm 1766;
JDS28, rkm 1719,
Hron at rkm
Sturovo/Esztergom
1716
TNMN L1490
JDS31
ADS 10
tributary Ipel at
rkm 1708
rkm 1707
rkm 1707
rkm 1708
Szob
Szob
Szob
JDS32: rkm 1691,
Upstream end of
Szentendre Island
JDS34: rkm 1659
ADS 11: rkm 1659,
Budapest upstream
Budapest upstream
JDS37: rkm 1632,
ADS 12: rkm 1632,
Budapest downstream
Budapest downstream
JDS39: rkm 1586, Tass
TNMN L1520
JDS40
ADS 13
rkm 1560
rkm 1560
rkm 1560
Dunafoldvar
Dunafoldvar
Dunafoldvar
JDS41: rkm 1533, Paks
tributary Sio at
JDS43: rkm 1481, Baja
rkm 1497
6
rkm 1497: Baja
TNMN L1540
JDS44
ADS 14
Ł rkm 1075 :
rkm 1435
rkm 1434
rkm 1434
Bazias
Hercegszanto
Hercegszanto
Hercegszanto
TNMN L1315
JDS45
rkm 1429
rkm 1429
Batina
Batina
TNMN L2350: rkm
JDS46: rkm 1384,
tributary Drava
1427, Bezdan
Upstream Drava
at rkm 1379
TNMN L2360
JDS48
rkm 1367
rkm 1367
Bogojevo
Downstream Drava
(Erdut/Bogojevo)
JDS49: rkm 1355 Dalj
TNMN L1320: rkm
JDS50: rkm 1300, Ilak-
1337, Borovo
Backa Palanka
TNMN L2430: rkm
JDS51: rkm 1259,
ADS 15: rkm 1262,
1278, Backa Palanka
Upstream Novi Sad
Upstream Novi-Sad
(2004)
TNMN L2370
JDS51
ADS 15:
rkm 1258
rkm 1259
km 1262
Novi Sad
Upstream Novi Sad
Upstream Novi-Sad
JDS52: rkm 1252,
ADS 16: 1252
Downstream Novi-Sad
Downstream Novi-Sad
JDS53: rkm 1216,
ADS 17: rkm 1216,
tributary Tisza
ENVIRONMENTAL INSTITUTE
DEVELOPMENT OF OPERATIONAL TOOLS FOR MONITORING, LABORATORY AND INFORMATION MANAGEMENT
Developing WFD type-specific quality standards for nutrients Ł Draft Final Report
page 61
Section
Reach
TNMN station(s) inside
Nearest JDS sampling
Nearest
Remarks
Type
Section
site(s) [JDS code; rkm;
AQUATERRA
[DEFF code; rkm; name]
name]
sampling site(s)
[AQUATERRA code;
rkm; name]
Upstream Tisa (Stari
Upstream Tisa (Stari
at rkm 1215
Slankamen)
slankamen)
JDS55: rkm 1202,
ADS 18: rkm 1200,
Downstream Tisa/
Downstream Tisa/
Upstream Sava (Belegis)
Upstream Sava
(Belegis)
TNMN L2380: rkm
JDS57: rkm 1161,
ADS 19: rkm 1159,
tributary Sava
1174, Zemun
Upstream Pancevo/
Upstream Pancevo/
at rkm 1170
Downstream Sava
Downstream Sava
TNMN L2390
JDS58
ADS 20
rkm 1154.8
rkm 1151
rkm 1151
Pancevo
Downstream Pancevo
Downstream
JDS59: rkm 1132,
Pancevo
Grocka
JDS60: rkm 1107,
Upstream Veliko Morava ADS 21: rkm 1107,
tributary Velika
JDS62: rkm 1097,
Upstream Veliko
Morava at rkm
Downstream Veliko
Morava
1103
Morava
ADS 22: rkm 1097,
Downstream Veliko
Morava
TNMN L2400
JDS63
ADS 23
rkm 1076.6
rkm 1077
rkm 1077
Banatska Palanka
Starapalanka Ł Ram
Starapalanka Ł Ram
7 rkm
1075:
TNMN L0020
JDS64
ADS 24
Bazias Ł rkm
rkm 1071
rkm 1071
rkm 1071
943: Turnu
Bazias
Banatska
Banatska Palanka/
Severin
Palanka/Bazias
Bazias
JDS65: rkm 1040
ADS 25: rkm 1040,
Irongate reservoir
Irongate reservoir
(Golubac/Koronin)
(Golubac/ Koronin)
TNMN L2410
JDS66
ADS 26
rkm 954,6
rkm 956
rkm 955
Tekija
Irongate reservoir
Irongate reservoir
(Tekija/Orsova)
(Tekija/Orsova)
ADS 26 C1: rkm 955,
Irongate reservoir
(Tekija/Orsova)
ADS 26 C2: rkm 955,
JDS67: rkm 943,
Irongate reservoir
Vrbica/Simijan
(Tekija/Orsova)
ADS 27; rkm 926,
Vrbica/Simijan
8
rkm 943: Turnu
TNMN L2420
JDS68
ADS 28
tributary Timok
Severin Ł rkm
rkm 851
rkm 849
rkm 849
at rkm 845
375.5:
Radujevac
Upstream Timok
Upstream Timok
Chiciu/Silistra
(Rudujevac/Gruia)
(Rudujevac/Gruia)
TNMN L009 (RO)
two sets of
TNMN L0730 (BG)
JDS70
ADS 29
TNMN
rkm 834
rkm 834
rkm 834
monitoring data
Pristol / Novo Selo
Pristol/ Novo Selo
Pristol/ Novo Selo
Harbour
Harbour
Harbour
JDS71: rkm 795 Calafat
ADS 30: rkm 795,
JDS72: rkm 685,
Calafat
Downstream Kozloduy
TNMN L0780
JDS73
tributary Iskar
rkm 642
rkm 640
at rkm 637
upstream Iskar-Bajkal
Upstream Iskar
Olt at rkm 605
(Bajkal)
UNDP/GEF DANUBE REGIONAL PROJECT
Annexes
page 62
Section
Reach
TNMN station(s) inside
Nearest JDS sampling
Nearest
Remarks
Type
Section
site(s) [JDS code; rkm;
AQUATERRA
[DEFF code; rkm; name]
name]
sampling site(s)
[AQUATERRA code;
rkm; name]
JDS75: rkm 629,
Downstream Iskar
JDS76: km 606,
Upstream Olt
JDS78: rkm 602,
Downstream Olt
JDS79: rkm 579
Downstream Turnu-
Magurele/Nikopol
TNMN L0810
JDS80
rkm 554
rkm 550
downstream Svishtov
Downstream
Zimnicea/Svishtov
JDS82: rkm 532,
tributary Jantra
Downstream Jantra
at rkm 537
TNMN L0820
JDS83
rkm 503
rkm 500
upstream Russe
Upstream Ruse
JDS85: rkm 488,
Russenski Lom
Downstream
at rkm 489
Ruse/Giurgiu
TNMN L0240
JDS86
tributary Arges
rkm 432
rkm 434
at rkm 432
upstream Arges
Upstream Arges
JDS88: rkm 429,
Downstream Arges,
Oltenita
9 rkm
375.5:
TNMN L0280 (RO),
JDS89: rkm 378,
two sets of
Chiciu/Silistra Ł TNMN L0850 (BG)
Chiciu/Silistra
TNMN
rkm 100:
rkm 375
JDS90: rkm 295,
monitoring data
Isaccea
Chiciu/Silistra
Upstream Cernavoda
JDS91: 231, Giurgeni
tributary Siret
JDS92: rkm 167, Braila
at rkm 154
TNMN L0430 (RO)
JDS95
two sets of
TNMN L0630 (UA)
rkm 130
TNMN data,
rkm 132
Reni - Chilia/Kilia arm
one from RO
Reni - Chilia/Kilia arm
and one from
UA
tributary Prut at
rkm 135
10 rkm
100: TNMN L0450 (RO)
JDS96: rkm 56, Kilia
two sets of
Isaccea Ł rkm
TNMN L0690 (UA)
arm
TNMN data,
20 on Chilia
rkm 18
one from RO
arm, rkm 19 on
Vilkova - Chilia
and one from
Sulina arm and
arm/Kilia arm
UA
rkm 7 on Sf.
Gheorghe arm
TNMN L0490: rkm 0, Sf. JDS98: rkm 64, St.
Gheorghe Ł Ghorghe arm George arm
TNMN L0480: rkm 0,
JDS97: rkm 12, Sulina
Sulina - Sulina arm
arm
ENVIRONMENTAL INSTITUTE
DEVELOPMENT OF OPERATIONAL TOOLS FOR MONITORING, LABORATORY AND INFORMATION MANAGEMENT
Developing WFD type-specific quality standards for nutrients Ł Draft Final Report
page 63
ANNEX 2: OVERVIEW OF SELECTED JDS AND
AQUATERRA SAMPLING SITES FOR FURTHER DATA
PROCESSING FOR THE UNDERLYING REPORT
Selected JDS / TNMN stations
JDS_code TNMN_code
Name
rkm Section
Type
JDS01
L2140
Neu-Ulm
2581
2
JDS06
L2130 (DE) / L2220 (AU) Jochenstein
2204 3
JDS08
L2200
Upstream dam Abwinden-Asten
2120
JDS12
L1860
Wien-Nussdorf (JDS: Klosterneuburg) 1935 4
JDS17
L1840
Bratislava
1869
JDS23
L1470 (HU) / L1860 (SK) Medvedov/Medve
1806
JDS25
L1475 (HU) / L1870 (SK) Komarom/Komarno
1768 5
JDS31
L1490
Szob
1708
JDS40
L1520
Dunafoldvar
1560
JDS44
L1540
Hercegszanto
1435
6
JDS45
L1315
Batina
1429
JDS48
L2360
Downstream Drava (Erdut/Bogojevo)
1367
JDS51
L2370
Upstream Novi Sad
1258
JDS58
L2390
Downstream Pancevo
1155
JDS63
L2400
Starapalanka - Ram
1077
JDS64
L0020
Banatska Palanka/Bazias
1071 7
JDS66
L2410
Tekija
955
JDS68
L2420
Upstream Timok (Rudujevac/Gruia)
851
8
JDS70
L009 (RO) / L0730 (BG)
Pristol/Novo Selo Harbour
834
JDS73
L0780
Upstream Iskar (Bajkal)
642
JDS80
L0810
Downstream Zimnicea/Svishtov
554
JDS83
L0820
Upstream Ruse
503
JDS86
L0240
Upstream Arges
432
JDS89
L0280 (RO) / L0850 (BG) Chiciu/Silistra
375 9
JDS95
L0430
Reni - Chilia/Kilia arm
132
JDS97
L0480 (RO)
Sulina arm
12
10
UNDP/GEF DANUBE REGIONAL PROJECT
Annexes
page 64
Selected AQUATERRA / TNMN stations
AQUATERRA
TNMN code
TNMN [rkm] TNMN name
Section Type
code
ADS 1
L2180
1935
Wien-Nussdorf
4
ADS 4
L1840
1869
Bratislava
ADS 8
L1470 (HU) / L1860 (SK) 1806
Medvedov/Medve
ADS 9
L1475 (HU) / L1870 (SK) 1768
Komarom/Komarno 5
ADS 10
L1490
1708
Szob
ADS 13
L1520
1560
Dunafoldvar
ADS 14
L1540
1435
Hercegszanto
6
ADS 15
L2370
1258
Novi Sad
ADS 20
L2390
1155
Pancevo
ADS 23
L2400
1077
Bantska Palanka
ADS 24
L0020
1071
Bazias
7
ADS 26
L2410
955
Tekija
ADS 28
L2420
851
Radujevac
8
ADS 29
L0090 (RO) / L0730 (BG) 834
Pristol/Novo Selo
ENVIRONMENTAL INSTITUTE
DEVELOPMENT OF OPERATIONAL TOOLS FOR MONITORING, LABORATORY AND INFORMATION MANAGEMENT
Developing WFD type-specific quality standards for nutrients Ł Draft Final Report
page 65
ANNEX 3: 90%-ILE CONCENTRATIONS FOR THE
YEARS 2001 AND 2004
90%-ile concentrations for the years 2001 and 2004: NO3 [mg N/l]
2001
2004
Section km
Country Location
high /
good /
nm nmz
high /
good /
nc nmz
good
moderate
good
moderate
2 2581
DE Neu-Ulm/Boefinger
Halde 3.7
3.8
3 2204
AT Jochenstein
3.3
3.8
DE
Jochenstein
3.1
3.0
2120
AT
Abwinden-Asten
2.9
3.5
4 1935
AT Wien-Nussdorf
2.7
3.3
1874
AT
Wolfsthal
3.0
3.3
1869
SK
Bratislava
3.3
3.5
1806
HU
Medve/Medvedov
3.1
3.1
SK
Medvedov/Medve
3.1
2.9
5 1768
HU
Komarom/Kedvedov
3.2
3.3
SK
Komarno/Komarom
3.0
3.1
1708
HU
Szob
2.7
3.6
1560
HU
Dunafoldvar
3.0
3.8
6 1435
HU
Hercegszanto
2.9
2.8
1429
HR
Batina
3.4
2.4
1427
SC
Bezdan
2.9
3.2
1367
SC
Bogojevo
3.1
3.0
1337
HR
Borovo
3.0
3.4
1297
SC
Backa
Palanka
2.9
1258
SC
Novi
Sad
2.7
3.0
1174
SC
Zemun
2.0
2.2
1154.8
SC
Pancevo
2.1
2.5
1076.6
SC
Banatska
Palanka
2.1
2.0
7
1071
RO
Bazias
1.9
1.4
954.6
SC
Tekija
1.3
2.4
8 851
SC Radujevac
1.8
2.3
834
BG
Novo Selo Harbour/Pristol
2.3
2.3
RO
Pristol/Novo Selo Harbour
2.0
1.3
641
BG
us.
Iskar-Bajkal
1.9
2.2
554
BG
Downstream
Svishtov
2.0
1.6
503
BG
us.
Russe
2.0
2.1
432
RO
Upstream
Arges
1.6
1.3
9
375
BG
Silistra/Chiciu
1.9
2.2
RO
Chiciu/Silistra
2.4
2.4
132
RO
Reni-Chilia/Kilia
arm
2.4
2.4
10 18 RO Vilkova-Chilia
arm/Kilia
2.3
2.3
arm
UA
Vilkova - Kilia arm/Chilia
1.4
arm
0
RO
Sf. Gheorghe-Ghorghe arm
2.4
2.3
UA
Sulina - Sulina arm
2.2
2.2
NM= not meeting`class boundary Ł 0.125' criterion; NMZ: no matching JDS or AQUATERRA macrozoobenthos sites
UNDP/GEF DANUBE REGIONAL PROJECT
Annexes
page 66
90%-ile concentrations for the years 2001 and 2004: NH4 [mg N/l]
2001 2004
Section rkm
Country Location
high/good good/moderate nm nmz high/good good/moderate nm nmz
2
2581
DE
Neu-Ulm/Boefinger
Halde
0.11
0.12
3 2204
AT Jochenstein
0.10
0.13
DE
Jochenstein
0.14
0.16
2120
AT
Abwinden-Asten
0.08
0.08
4 1935
AT Wien-Nussdorf
0.06
0.07
1874
AT
Wolfsthal
0.14
0.23
1869
SK
Bratislava
0.21
0.50
1806
HU
Medve/Medvedov
0.12
0.15
SK
Medvedov/Medve
0.12
0.21
5 1768
HU
Komarom/Kedvedov
0.13
0.20
SK
Komarno/Komarom
0.12
0.23
1708
HU
Szob
0.14
0.23
1560
HU
Dunafoldvar
0.20
0.24
6 1435
HU
Hercegszanto
0.17
0.16
1429
HR
Batina
0.17
0.19
1427
SC
Bezdan
0.20
0.26
1367
SC
Bogojevo
0.35
0.26
1337
HR
Borovo
0.19
0.27
1287
SC
Backa
Palanka
0.41
1258
SC
Novi
Sad
0.42
0.30
1174
SC
Zemun
0.42
0.31
1154.8
SC
Pancevo
0.28
0.44
1076.6
SC
Banatska
Palanka
0.29
0.35
7 1071
RO
Bazias
0.62
0.47
954.6
SC
Tekija
0.23
0.14
8 851 SC Radujevac
0.41
0.11
834
BG
Novo Selo Harbour/Pristol
0.31
0.29
RO
Pristol/Novo Selo Harbour
0.40
0.32
641
BG
us.
Iskar-Bajkal
0.29
0.30
554
BG
Downstream
Svishtov
0.14
0.14
503
BG
us.
Russe
0.09
0.12
432
RO
Upstream
Arges
0.34
0.17
9 375 BG
Silistra/Chiciu
0.13
0.15
RO
Chiciu/Silistra
1.00
0.79
132
RO
Reni-Chilia/Kilia
arm
0.65
0.73
10
18
RO
Vilkova-Chilia
arm
0.71
0.86
UA
Vilkova - Kilia arm
0.30
0
RO
Sf. Gheorghe-Ghorghe arm
0.79
0.87
UA
Sulina - Sulina arm
0.87
0.91
NM= not meeting`class boundary Ł 0.125' criterion; NMZ: no matching JDS or AQUATERRA macrozoobenthos sites
ENVIRONMENTAL INSTITUTE
DEVELOPMENT OF OPERATIONAL TOOLS FOR MONITORING, LABORATORY AND INFORMATION MANAGEMENT
Developing WFD type-specific quality standards for nutrients Ł Draft Final Report
page 67
90%-ile concentrations for the years 2001 and 2004: NO2 [mg N/l]
2001 2004
Section Rkm Country Location
high/good good/moderate nm nmz high/good good/moderate nm nmz
2
2581
DE
Neu-Ulm/Boefinger
Halde
0.03
0.03
3 2204
AT Jochenstein
0.01
0.02
DE
Jochenstein
0.03
0.02
2120
AT
Abwinden-Asten
0.02
0.02
4 1935
AT Wien-Nussdorf
0.02
0.03
1874
AT
Wolfsthal
0.03
0.04
1869
SK
Bratislava
0.03
0.03
1806
HU
Medve/Medvedov
0.03
0.03
SK
Medvedov/Medve
0.03
0.03
5 1768
HU
Komarom/Kedvedov
0.04
0.03
SK
Komarno/Komarom
0.03
0.03
1708
HU
Szob
0.03
0.03
1560
HU
Dunafoldvar
0.04
0.04
6 1435
HU
Hercegszanto
0.04
0.03
1429
HR
Batina
0.04
0.04
1427
SC
Bezdan
0.04
0.04
1367
SC
Bogojevo
0.03
0.04
1337
HR
Borovo
0.02
0.02
1287
SC
Backa
Palanka
0.03
1258
SC
Novi
Sad
0.03
0.03
1174
SC
Zemun
0.00
0.07
1154.8
SC
Pancevo
0.03
0.04
1076.6
SC
Banatska
Palanka
0.05
0.03
7
1071
RO
Bazias
0.06
0.04
954.6
SC
Tekija
0.00
0.03
8 851
SC Radujevac
0.00
0.03
834
BG
Novo Selo Harbour/Pristol
0.05
0.03
RO
Pristol/Novo Selo Harbour
0.07
0.04
641
BG
us.
Iskar-Bajkal
0.03
0.03
554
BG
Downstream
Svishtov
0.04
0.01
503
BG
us.
Russe
0.03
0.03
432
RO
Upstream
Arges
0.05
0.03
9
375
BG
Silistra/Chiciu
0.03
0.03
RO
Chiciu/Silistra
0.05
0.12
132
RO
Reni-Chilia/Kilia
arm
0.07
0.13
10
18
RO
Vilkova-Chilia arm/Kilia arm
0.12
0.15
UA
Vilkova - Kilia arm/Chilia arm
0.06
0
RO
Sf. Gheorghe-Ghorghe arm
0.16
0.09
UA
Sulina - Sulina arm
0.12
0.10
NM= not meeting`class boundary Ł 0.125' criterion; NMZ: no matching JDS or AQUATERRA macrozoobenthos sites
UNDP/GEF DANUBE REGIONAL PROJECT
Annexes
page 68
90%-ile concentrations for the years 2001 and 2004: Ptot [mg P/l]
2001 2004
Section Rkm Country Location
high/good good/moderate nm nmz high/good good/moderate nm nmz
2
2581
DE
Neu-Ulm/Boefinger
Halde
0.15
0.10
3 2204
AT Jochenstein
0.12
0.07
DE
Jochenstein
0.12
0.10
2120
AT
Abwinden-Asten
0.11
0.06
4 1935
AT Wien-Nussdorf
0.08
0.06
1874
AT
Wolfsthal
0.12
0.09
1869
SK
Bratislava
0.12
0.13
1806
HU
Medve/Medvedov
0.15
0.13
SK
Medvedov/Medve
0.10
0.08
5 1768
HU
Komarom/Kedvedov
0.16
0.20
SK
Komarno/Komarom
0.11
0.10
1708
HU
Szob
0.22
0.16
1560
HU
Dunafoldvar
0.20
0.16
6 1435
HU
Hercegszanto
0.19
0.12
1429
HR
Batina
0.19
0.14
1427
SC
Bezdan
0.16
0.15
1367
SC
Bogojevo
0.14
0.13
1337
HR
Borovo
0.26
0.31
1287
SC
Backa
Palanka
0.22
1258
SC
Novi
Sad
0.13
0.16
1174
SC
Zemun
0.10
0.09
1154.8
SC
Pancevo
0.12
0.20
1076.6
SC
Banatska
Palanka
0.11
0.17
7
1071
RO
Bazias
0.18
0.22
954.6
SC
Tekija
0.08
0.08
8 851
SC Radujevac
1.04
0.07
834
BG
Novo Selo Harbour/Pristol
0.21
0.34
RO
Pristol/Novo Selo Harbour
0.18
0.20
641
BG
us.
Iskar-Bajkal
0.21
0.19
554
BG
Downstream
Svishtov
0.42
0.32
503
BG
us.
Russe
0.18
0.29
432
RO
Upstream
Arges
0.26
0.16
9
375
BG
Silistra/Chiciu
0.21
0.26
RO
Chiciu/Silistra
0.11
0.23
132
RO
Reni-Chilia/Kilia
arm
0.13
0.18
10
18
RO
Vilkova-Chilia arm/Kilia arm
0.22
0.17
UA
Vilkova - Kilia arm/Chilia
0.19
arm
0
RO
Sf. Gheorghe-Ghorghe arm
0.12
0.23
UA
Sulina - Sulina arm
0.20
0.20
NM= not meeting`class boundary Ł 0.125' criterion; NMZ: no matching JDS or AQUATERRA macrozoobenthos sites
ENVIRONMENTAL INSTITUTE
DEVELOPMENT OF OPERATIONAL TOOLS FOR MONITORING, LABORATORY AND INFORMATION MANAGEMENT
Developing WFD type-specific quality standards for nutrients Ł Draft Final Report
page 69
90%-ile concentrations for the years 2001 and 2004: PO4 [mg P/l]
2001 2004
Section Rkm Country Location
high/good good/moderate nm nmz high/good good/moderate nm nmz
2
2581
DE
Neu-Ulm/Boefinger
Halde
0.06
0.06
3 2204
AT Jochenstein
0.07
0.05
DE
Jochenstein
0.05
0.05
2120
AT
Abwinden-Asten
0.05
0.04
4 1935
AT Wien-Nussdorf
0.05
0.04
1874
AT
Wolfsthal
0.04
0.05
1869
SK
Bratislava
0.06
0.06
1806
HU
Medve/Medvedov
0.07
0.06
SK
Medvedov/Medve
0.05
0.05
5 1768
HU
Komarom/Kedvedov
0.08
0.09
SK
Komarno/Komarom
0.06
0.07
1708
HU
Szob
0.12
0.12
1560
HU
Dunafoldvar
0.09
0.09
6 1435
HU
Hercegszanto
0.09
0.05
1429
HR
Batina
0.03
0.08
1427
SC
Bezdan
0.08
0.08
1367
SC
Bogojevo
0.07
0.08
1337
HR
Borovo
0.05
0.12
1287
SC
Backa
Palanka
0.10
1258
SC
Novi
Sad
0.07
0.08
1174
SC
Zemun
0.06
0.08
1154.8
SC
Pancevo
0.07
0.08
1076.6
SC
Banatska
Palanka
0.08
0.06
7
1071
RO
Bazias
0.13
0.19
954.6
SC
Tekija
0.06
0.04
8 851
SC Radujevac
1.19
0.06
834
BG
Novo Selo Harbour/Pristol
0.12
0.15
RO
Pristol/Novo Selo Harbour
0.16
0.14
641
BG
us.
Iskar-Bajkal
0.68
0.12
554
BG
Downstream
Svishtov
0.28
0.09
503
BG
us.
Russe
0.34
0.13
432
RO
Upstream
Arges
0.14
0.09
9
375
BG
Silistra/Chiciu
0.29
0.11
RO
Chiciu/Silistra
0.04
0.09
132
RO
Reni-Chilia/Kilia
arm
0.05
0.11
10
18
RO
Vilkova-Chilia arm/Kilia arm
0.05
0.13
UA
Vilkova - Kilia arm/Chilia
0.11
arm
0
RO
Sf. Gheorghe-Ghorghe arm
0.07
0.13
UA
Sulina - Sulina arm
0.06
0.12
NM= not meeting`class boundary Ł 0.125' criterion; NMZ: no matching JDS or AQUATERRA macrozoobenthos sites
UNDP/GEF DANUBE REGIONAL PROJECT
DEVELOPMENT OF OPERATIONAL TOOLS FOR MONITORING, LABORATORY AND INFORMATION MANAGEMENT
Developing WFD type-specific quality standards for nutrients Ł Draft Final Report
page 71
ANNEX 4: SUMMARY STATISTICS FOR POOLED
DATA AT TNMN STATIONS
NO3 [mg N/l], year 2001
Section Rkm Country Location
N min 10-
25-
50-
mean 75-
90-
max
tile
ile
tile
ile
tile
2
2581 DE Neu-Ulm/Boefinger
Halde 26
2.2
2.5 2.8 3.1 3.1 3.3 3.7 4.3
3
2204 DE Jochenstein
26
1.2
1.3 1.5 2.3 2.2 2.8 3.1 3.3
3
2204 AT Jochenstein
12
1.2
1.4 1.6 2.2 2.2 2.9 3.3 3.4
3
2120 AT Abwinden-Asten
12
1.2
1.4 1.6 2.1 2.1 2.6 2.9 2.9
4
1935 AT Wien-Nussdorf
12
1.1
1.2 1.5 2.2 2.0 2.7 2.7 2.7
4
1874 AT Wolfsthal
25
1.2
1.3 1.4 2.2 2.1 2.7 3.0 3.1
4
1869 SK Bratislava
25
1.0
1.4 1.5 2.2 2.2 2.7 3.3 3.6
4
1806 HU Medve/Medvedov
26
0.0
1.1 1.4 1.7 1.9 2.6 3.1 3.2
4
1806 SK Medvedov/Medve
12
1.0
1.3 1.4 1.9 2.0 2.7 3.1 3.2
5
1768 HU Komarom/Kedvedov
78
0.8
1.3 1.5 1.9 2.1 2.7 3.2 3.3
5
1768 SK Komarno/Komarom
12
0.8
1.2 1.4 1.9 2.0 2.7 3.0 3.3
5
1708 HU Szob
78
0.8
1.2 1.5 1.8 1.9 2.4 2.7 3.6
5
1560 HU Dunafoldvar
78
0.0
1.1 1.4 2.0 2.0 2.6 3.0 3.4
6
1435 HU Hercegszanto
36
0.5
1.1 1.3 2.0 2.0 2.5 2.9 3.4
6
1429 HR Batina
12
0.5
1.3 1.6 2.1 2.3 3.1 3.4 3.6
6
1427 SC Bezdan
12
0.5
0.9 1.3 2.1 2.0 2.8 2.9 3.0
6
1367 SC Bogojevo
12
0.8
0.9 1.4 1.6 1.9 2.6 3.1 3.2
6
1337 HR Borovo
26
0.7
1.4 1.8 2.3 2.2 2.7 3.0 3.6
6
1258 SC Novi
Sad
12
0.9
1.0 1.3 1.9 1.9 2.5 2.7 2.9
6
1174 SC Zemun
12
0.2
0.6 0.8 1.0 1.2 1.4 2.0 3.1
6
1154.8 SC
Pancevo
10 0.9 0.9
1.0 1.3
1.4 1.7 2.1
2.5
6 1076.6
SC Banatska
Palanka
12
0.7
0.9 1.1 1.5 1.4 1.7 2.1 2.2
7
1071 RO Bazias
60
0.4
0.7 0.9 1.2 1.3 1.6 1.9 3.1
7
954.6 SC
Tekija
9 0.7 0.8 0.8 1.0 1.0 1.2 1.3 1.6
8
851 SC Radujevac
9
0.4
0.6 0.8 0.9 1.1 1.7 1.8 1.8
8
834
RO
Pristol/Novo Selo Harbour
61
0.5
0.8
1.0
1.2
1.3
1.6
2.0
2.6
8
834
BG
Novo Selo Harbour/Pristol
36
0.7
0.9 1.1 1.4 1.6 2.0 2.3 2.9
8
641 BG us.
Iskar-Bajkal
12
0.1
0.1 0.2 0.5 0.7 0.9 1.9 2.0
8
554 BG Downstream
Svishtov
14
0.6
0.7 0.9 1.2 1.3 1.8 2.0 2.1
8
503 BG us.
Russe
12
0.7
1.2 1.3 1.5 1.6 1.8 2.0 3.4
8
432 RO Upstream
Arges
33
0.9
1.0 1.1 1.2 1.5 1.3 1.6 4.8
9 375
RO
Chiciu/Silistra
69
0.6
1.3 1.5 2.0 1.9 2.2 2.4 2.7
9 375
BG
Silistra/Chiciu
36
0.7 0.9 1.1 1.4 1.4 1.7 1.9 2.0
9 132
RO
Reni-Chilia/Kilia
arm 69
0.8 1.3 1.5 1.9 1.8 2.1 2.4 2.9
10 18 RO Vilkova-Chilia
arm/Kilia
36
0.8
1.2 1.3 1.6 1.7 1.9 2.3 2.7
arm
10
0
RO
Sulina - Sulina arm
36
0.7
1.2
1.4
1.6
1.6
1.8
2.2
2.5
10
0
RO
Sf. Gheorghe-Ghorghe arm
36
0.2
1.0
1.4
1.6
1.6
1.9
2.4
2.6
UNDP/GEF DANUBE REGIONAL PROJECT
Annexes
page 72
NH4 [mg N/l], year 2001
Section Rkm Country Location
N min 10-
25-
50-
mean 75-
90-
max
tile
ile
tile
ile
tile
2
2581 DE
Neu-Ulm/Boefinger
Halde 26
0.00
0.01 0.02 0.04 0.05 0.07 0.11 0.15
3
2204 DE
Jochenstein
26
0.03
0.03 0.04 0.07 0.08 0.12 0.14 0.16
3
2204 AT
Jochenstein
12
0.02
0.02 0.03 0.04 0.05 0.07 0.10 0.11
3
2120 AT
Abwinden-Asten
12
0.02
0.03 0.04 0.05 0.05 0.08 0.08 0.11
4
1935 AT
Wien-Nussdorf
12
0.00
0.01 0.02 0.03 0.03 0.05 0.06 0.06
4
1874 AT
Wolfsthal
25
0.00
0.03 0.05 0.07 0.08 0.10 0.14 0.24
4
1869 SK
Bratislava
25
0.05
0.07 0.08 0.11 0.13 0.16 0.21 0.29
4
1806 HU Medve/Medvedov
26
0.00
0.02 0.03 0.05 0.06 0.08 0.12 0.16
4
1806 SK
Medvedov/Medve
12
0.04
0.07 0.07 0.09 0.09 0.09 0.12 0.20
5
1768 HU Komarom/Kedvedov
78
0.02
0.02 0.03 0.05 0.07 0.10 0.13 0.21
5
1768 SK
Komarno/Komarom
12
0.05
0.07 0.07 0.09 0.10 0.11 0.12 0.20
5
1708 HU Szob
78
0.00
0.02 0.02 0.04 0.07 0.09 0.14 0.34
5
1560 HU Dunafoldvar
78
0.02
0.02 0.02 0.07 0.09 0.15 0.20 0.23
6
1435 HU Hercegszanto
36
0.02
0.02 0.03 0.05 0.07 0.09 0.17 0.23
6
1429 HR Batina
12
0.02
0.02 0.03 0.05 0.07 0.12 0.17 0.17
6
1427 SC
Bezdan
12
0.02
0.05 0.07 0.10 0.12 0.15 0.20 0.37
6
1367 SC
Bogojevo
12
0.03
0.03 0.07 0.13 0.15 0.18 0.35 0.45
6
1337 HR Borovo
26
0.00
0.07 0.07 0.07 0.11 0.18 0.19 0.29
6
1258 SC
Novi
Sad
12
0.10
0.14 0.18 0.22 0.26 0.33 0.42 0.44
6
1174 SC
Zemun
12
0.02
0.04 0.10 0.13 0.17 0.17 0.42 0.52
6
1154.8
SC
Pancevo
10
0.00
0.05 0.10 0.19 0.19 0.22 0.28 0.60
6
1076.6 SC
Banatska
Palanka
12 0.10
0.11 0.15 0.21 0.20 0.23 0.29 0.30
7
1071 RO Bazias
60
0.09
0.12 0.17 0.26 0.30 0.37 0.62 0.75
7
954.6 SC
Tekija
9 0.02
0.03 0.04 0.09 0.12 0.16 0.23 0.37
8
851 SC
Radujevac
7 0.04
0.06 0.08 0.16 0.21 0.18 0.41 0.75
8
834 RO Pristol/Novo
Selo
Harbour 61
0.02
0.11 0.17 0.21 0.24 0.30 0.40 0.70
8
834
BG
Novo Selo Harbour/Pristol
36 0.05
0.06 0.08 0.11 0.16 0.20 0.31 0.40
8
641 BG us.
Iskar-Bajkal
12
0.00
0.01 0.06 0.08 0.12 0.17 0.29 0.40
8
554 BG Downstream
Svishtov
14
0.00
0.01 0.02 0.07 0.07 0.10 0.14 0.23
8
503 BG us.
Russe
12
0.00
0.00 0.00 0.06 0.05 0.08 0.09 0.10
8
432 RO Upstream
Arges
33
0.02
0.13 0.17 0.22 0.24 0.29 0.34 0.54
9 375
RO
Chiciu/Silistra
69
0.04
0.18 0.23 0.35 0.44 0.55 1.00 1.36
9 375
BG
Silistra/Chiciu
36
0.00
0.04 0.05 0.06 0.08 0.09 0.13 0.23
9 132
RO
Reni-Chilia/Kilia
arm 69
0.06
0.13 0.18 0.28 0.35 0.41 0.65 1.10
10 18 RO Vilkova-Chilia
arm/Kilia
36
0.05
0.12 0.17 0.31 0.37 0.50 0.71 0.98
arm
10
0
RO
Sulina - Sulina arm
36
0.12
0.14
0.19
0.33
0.44
0.47
0.87
2.12
10
0
RO Sf.
Gheorghe-Ghorghe
arm 36
0.06
0.20 0.25 0.32 0.42 0.50 0.79 1.69
ENVIRONMENTAL INSTITUTE
DEVELOPMENT OF OPERATIONAL TOOLS FOR MONITORING, LABORATORY AND INFORMATION MANAGEMENT
Developing WFD type-specific quality standards for nutrients Ł Draft Final Report
page 73
NO2 [mg N/l], year 2001
Section Rkm Country Location
N min 10-tile 25-ile 50-tile mean 75-ile 90-tile max
2
2581 DE Neu-Ulm/Boefinger
Halde 27
0.01
0.01 0.02 0.02 0.02 0.02 0.03 0.03
3
2204 DE Jochenstein
11
0.00
0.01 0.01 0.01 0.02 0.02 0.03 0.03
3
2204 AT Jochenstein
12
0.00
0.01 0.01 0.01 0.01 0.01 0.01 0.02
3
2120 AT Abwinden-Asten
12
0.01
0.01 0.01 0.01 0.01 0.01 0.02 0.02
4
1935 AT Wien-Nussdorf
12
0.01
0.01 0.01 0.01 0.01 0.01 0.02 0.02
4
1874 AT Wolfsthal
25
0.01
0.01 0.01 0.02 0.02 0.03 0.03 0.04
4
1869 SK
Bratislava
25
0.01
0.01 0.01 0.02 0.02 0.02 0.03 0.04
4
1806 HU Medve/Medvedov
26
0.00
0.01 0.02 0.02 0.02 0.03 0.03 0.05
4
1806 SK
Medvedov/Medve
12
0.01
0.01 0.01 0.02 0.02 0.02 0.03 0.04
5
1768 HU Komarom/Kedvedov
78
0.00
0.01 0.02 0.02 0.02 0.03 0.04 0.07
5
1768 SK
Komarno/Komarom
12
0.00
0.00 0.01 0.02 0.02 0.02 0.03 0.04
5
1708 HU Szob
78
0.00
0.00 0.01 0.02 0.02 0.02 0.03 0.04
5
1560 HU Dunafoldvar
78
0.00
0.01 0.02 0.02 0.02 0.03 0.04 0.06
6
1435 HU Hercegszanto
36
0.00
0.01 0.01 0.02 0.02 0.03 0.04 0.04
6
1429 HR Batina
12
0.01
0.01 0.02 0.02 0.02 0.03 0.04 0.04
6
1427 SC
Bezdan
12
0.01
0.01 0.01 0.02 0.02 0.03 0.04 0.04
6
1367 SC
Bogojevo
12
0.01
0.01 0.01 0.02 0.02 0.02 0.03 0.03
6
1337 HR Borovo
26
0.01
0.01 0.01 0.01 0.01 0.01 0.02 0.07
6
1258 SC
Novi
Sad
12
0.01
0.01 0.02 0.02 0.02 0.03 0.03 0.04
6
1174 SC
Zemun
12
0.00
0.00 0.00 0.00 0.00 0.00 0.00 0.00
6
1154.8
SC
Pancevo
10
0.00
0.01 0.02 0.02 0.02 0.03 0.03 0.04
6 1076.6
SC Banatska
Palanka
12
0.01
0.01 0.02 0.03 0.03 0.03 0.05 0.08
7
1071 RO Bazias
60
0.02
0.02 0.03 0.04 0.04 0.05 0.06 0.21
7
954.6 SC
Tekija
9 0.00
0.00 0.00 0.00 0.00 0.00 0.00 0.00
8
851 SC
Radujevac
9 0.00
0.00 0.00 0.00 0.00 0.00 0.00 0.01
8
834 RO Pristol/Novo
Selo
Harbour 61
0.02
0.03 0.03 0.04 0.04 0.05 0.07 0.09
8
834
BG
Novo Selo Harbour/Pristol
36
0.02
0.02 0.02 0.03 0.03 0.04 0.05 0.07
8
641 BG us.
Iskar-Bajkal
12
0.00
0.01 0.02 0.03 0.02 0.03 0.03 0.04
8
554 BG Downstream
Svishtov
14
0.01
0.02 0.02 0.02 0.03 0.03 0.04 0.11
8
503 BG us.
Russe
12
0.01
0.01 0.01 0.02 0.02 0.03 0.03 0.04
8
432 RO Upstream
Arges
36
0.00
0.01 0.02 0.03 0.03 0.03 0.05 0.09
9 375
RO
Chiciu/Silistra
69
0.01
0.01 0.02 0.03 0.04 0.03 0.05 0.38
9 375
BG
Silistra/Chiciu
36
0.01
0.01 0.01 0.02 0.02 0.03 0.03 0.04
9 132
RO
Reni-Chilia/Kilia
arm 69
0.01
0.01 0.02 0.03 0.04 0.05 0.07 0.19
10
18
RO
Vilkova-Chilia arm/Kilia arm
36 0.00 0.01 0.01 0.03 0.04 0.05 0.12 0.19
10
0
RO
Sulina - Sulina arm
36
0.01
0.01
0.02
0.04
0.07
0.08
0.12
0.44
10
0
RO Sf.
Gheorghe-Ghorghe
arm 36
0.00
0.01 0.02 0.02 0.05 0.05 0.16 0.28
UNDP/GEF DANUBE REGIONAL PROJECT
Annexes
page 74
Ptot [mg P/l], year 2001
Section Rkm Country Location
N min 10-tile 25-ile 50-tile mean 75-ile 90-tile max
2
2581 DE Neu-Ulm/Boefinger
Halde 26 0.04 0.05 0.06 0.07 0.08 0.09 0.15 0.17
3
2204 DE Jochenstein
26 0.04 0.04 0.06 0.07 0.09 0.08 0.12 0.66
3
2204 AT Jochenstein
12 0.04 0.05 0.05 0.07 0.07 0.08 0.12 0.12
3
2120 AT Abwinden-Asten
12 0.04 0.05 0.05 0.06 0.07 0.08 0.11 0.11
4
1935 AT Wien-Nussdorf
12 0.05 0.05 0.05 0.06 0.07 0.07 0.08 0.13
4
1874 AT Wolfsthal
25 0.03 0.04 0.05 0.06 0.07 0.09 0.12 0.16
4
1869 SK
Bratislava
25 0.07 0.07 0.08 0.09 0.10 0.10 0.12 0.20
4
1806 HU Medve/Medvedov
26 0.05 0.08 0.08 0.10 0.11 0.13 0.15 0.16
4
1806 SK
Medvedov/Medve
12 0.06 0.07 0.07 0.08 0.08 0.09 0.10 0.10
5
1768 HU Komarom/Kedvedov
78 0.03 0.09 0.10 0.12 0.12 0.15 0.16 0.19
5
1768 SK
Komarno/Komarom
12 0.00 0.07 0.08 0.08 0.08 0.10 0.11 0.12
5
1708 HU Szob
78 0.02 0.04 0.08 0.11 0.13 0.16 0.22 0.59
5
1560 HU Dunafoldvar
78 0.02 0.12 0.13 0.14 0.15 0.17 0.20 0.26
6
1435 HU Hercegszanto
36 0.03 0.11 0.13 0.15 0.15 0.17 0.19 0.27
6
1429 HR Batina
12 0.03 0.07 0.10 0.12 0.13 0.15 0.19 0.27
6
1427 SC
Bezdan
12 0.08 0.10 0.10 0.11 0.12 0.14 0.16 0.16
6
1367 SC
Bogojevo
12 0.05 0.08 0.10 0.11 0.11 0.13 0.14 0.17
6
1337 HR Borovo
26 0.06 0.08 0.08 0.13 0.15 0.22 0.26 0.33
6
1258 SC
Novi
Sad
12 0.09 0.10 0.10 0.12 0.12 0.13 0.13 0.17
6
1174 SC
Zemun
4 0.07 0.07 0.08 0.09 0.09 0.09 0.10 0.10
6
1154.8
SC
Pancevo
10 0.08 0.09 0.09 0.10 0.11 0.11 0.12 0.17
6 1076.6
SC Banatska
Palanka
12 0.07 0.07 0.08 0.11 0.10 0.11 0.11 0.13
7
1071 RO Bazias
45 0.05 0.07 0.09 0.12 0.12 0.14 0.18 0.23
7
954.6 SC
Tekija
4 0.06 0.06 0.07 0.07 0.07 0.08 0.08 0.09
8
851 SC
Radujevac
4 0.07 0.07 0.07 0.36 0.50 0.79 1.04 1.22
8
834 RO Pristol/Novo
Selo
Harbour 43 0.04 0.07 0.08 0.10 0.11 0.12 0.18 0.20
8
834
BG
Novo Selo Harbour/Pristol
36 0.07 0.07 0.08 0.11 0.13 0.16 0.21 0.38
8
641 BG us.
Iskar-Bajkal
12 0.07 0.08 0.09 0.11 0.13 0.13 0.21 0.30
8
554 BG Downstream
Svishtov
11 0.07 0.08 0.10 0.14 0.17 0.15 0.42 0.46
8
503 BG us.
Russe
12 0.12 0.13 0.14 0.16 0.16 0.18 0.18 0.23
8
432 RO Upstream
Arges
36 0.11 0.13 0.15 0.17 0.18 0.20 0.26 0.29
9 375
RO
Chiciu/Silistra
63 0.01 0.02 0.02 0.04 0.05 0.06 0.11 0.52
9 375
BG
Silistra/Chiciu
36 0.10 0.11 0.14 0.16 0.18 0.18 0.21 0.57
9 132
RO
Reni-Chilia/Kilia
arm 63 0.01 0.02 0.03 0.05 0.06 0.09 0.13 0.20
10
18
RO
Vilkova-Chilia arm/Kilia arm 33 0.01 0.02 0.04 0.05 0.09 0.12 0.22 0.29
10
0
RO
Sulina - Sulina arm
33 0.01 0.02
0.03 0.06
0.08 0.10 0.20
0.25
10
0
RO Sf.
Gheorghe-Ghorghe
arm 33 0.01 0.02 0.03 0.07 0.07 0.09 0.12 0.19
ENVIRONMENTAL INSTITUTE
DEVELOPMENT OF OPERATIONAL TOOLS FOR MONITORING, LABORATORY AND INFORMATION MANAGEMENT
Developing WFD type-specific quality standards for nutrients Ł Draft Final Report
page 75
PO4 [mg P/l], year 2001
Section Rkm Country Location
N min 10-tile 25-ile 50-tile mean 75-ile 90-tile max
2
2581 DE Neu-Ulm/Boefinger
Halde 26
0.02
0.02 0.03 0.04 0.04 0.06 0.06 0.07
3
2204 DE Jochenstein
26
0.00
0.00 0.02 0.03 0.03 0.04 0.05 0.07
3
2204 AT Jochenstein
12
0.00
0.02 0.02 0.03 0.03 0.05 0.07 0.07
3
2120 AT Abwinden-Asten
12
0.00
0.01 0.02 0.03 0.03 0.04 0.05 0.06
4
1935 AT Wien-Nussdorf
12
0.00
0.01 0.02 0.02 0.03 0.04 0.05 0.05
4
1874 AT Wolfsthal
25
0.00
0.01 0.02 0.03 0.03 0.04 0.04 0.07
4
1869 SK
Bratislava
25
0.00
0.01 0.03 0.04 0.04 0.05 0.06 0.07
4
1806 HU Medve/Medvedov
26
0.00
0.00 0.01 0.04 0.04 0.06 0.07 0.07
4
1806 SK
Medvedov/Medve
12
0.00
0.00 0.02 0.03 0.03 0.05 0.05 0.06
5
1768 HU Komarom/Kedvedov
78
0.00
0.00 0.03 0.05 0.05 0.07 0.08 0.10
5
1768 SK
Komarno/Komarom
12
0.00
0.00 0.02 0.04 0.03 0.05 0.06 0.06
5
1708 HU Szob
78
0.00
0.02 0.04 0.06 0.06 0.07 0.12 0.15
5
1560 HU Dunafoldvar
78
0.00
0.00 0.03 0.06 0.05 0.08 0.09 0.11
6
1435 HU Hercegszanto
36
0.00
0.00 0.02 0.06 0.05 0.07 0.09 0.10
6
1429 HR Batina
12
0.00
0.00 0.01 0.01 0.02 0.02 0.03 0.06
6
1427 SC
Bezdan
12
0.01
0.01 0.03 0.04 0.05 0.06 0.08 0.08
6
1367 SC
Bogojevo
12
0.01
0.02 0.02 0.04 0.04 0.07 0.07 0.07
6
1337 HR Borovo
26
0.01
0.01 0.01 0.03 0.03 0.04 0.05 0.07
6
1258 SC
Novi
Sad
12
0.01
0.02 0.04 0.05 0.05 0.06 0.07 0.08
6
1174 SC
Zemun
12
0.01
0.02 0.02 0.03 0.03 0.04 0.06 0.06
6
1154.8
SC
Pancevo
10
0.02
0.02 0.03 0.05 0.04 0.06 0.07 0.07
6 1076.6
SC Banatska
Palanka
12
0.02
0.02 0.03 0.04 0.04 0.05 0.08 0.09
7
1071 RO Bazias
60
0.01
0.05 0.07 0.09 0.09 0.11 0.13 0.23
7
954.6 SC
Tekija
9 0.01
0.02 0.03 0.05 0.04 0.06 0.06 0.07
8
851 SC
Radujevac
9 0.05
0.06 0.08 0.11 0.52 0.60 1.19 2.21
8
834 RO Pristol/Novo
Selo
Harbour 61
0.02
0.05 0.07 0.09 0.10 0.12 0.16 0.19
8
834
BG
Novo Selo Harbour/Pristol
36
0.02
0.04 0.06 0.07 0.08 0.09 0.12 0.24
8
641 BG us.
Iskar-Bajkal
12
0.00
0.07 0.09 0.18 0.29 0.33 0.68 1.00
8
554 BG Downstream
Svishtov
14
0.12
0.13 0.14 0.19 0.20 0.26 0.28 0.29
8
503 BG us.
Russe
12
0.17
0.19 0.21 0.24 0.26 0.32 0.34 0.36
8
432 RO Upstream
Arges
36
0.07
0.08 0.09 0.10 0.10 0.11 0.14 0.16
9 375
RO
Chiciu/Silistra
69
0.00
0.01 0.01 0.02 0.03 0.03 0.04 0.45
9 375
BG
Silistra/Chiciu
36
0.13
0.18 0.20 0.26 0.24 0.28 0.29 0.31
9 132
RO
Reni-Chilia/Kilia
arm 69
0.01
0.01 0.01 0.02 0.03 0.04 0.05 0.10
10
18
RO
Vilkova-Chilia arm/Kilia arm
36 0.00 0.01 0.01 0.03 0.03 0.04 0.05 0.18
10
0
RO
Sulina - Sulina arm
36
0.01
0.01
0.01
0.03
0.03
0.04
0.06
0.11
10
0
RO Sf.
Gheorghe-Ghorghe
arm 36
0.00
0.01 0.01 0.02 0.03 0.05 0.07 0.09
UNDP/GEF DANUBE REGIONAL PROJECT
Annexes
page 76
NO3 [mg N/l], year 2004
Section Km Country Location
N min 10-tile 25-tile 50-tile mean 75-tile 90-tile max
2
2581
DE Neu-Ulm/Boefinger
Halde 26 1.9
2.1 2.3 2.7 2.9 3.5 3.8 4.0
3
2204
DE Jochenstein
26 1.0
1.0 1.2 1.7 2.0 2.6 3.0 4.3
3
2204
AT Jochenstein
12 1.2
1.2 1.2 1.9 2.2 2.8 3.8 4.7
3
2120
AT Abwinden-Asten
12 1.3
1.3 1.4 2.0 2.3 2.8 3.5 4.6
4
1935
AT Wien-Nussdorf
12 1.1
1.1 1.2 1.7 2.1 2.5 3.3 4.8
4
1874
AT Wolfsthal
24 1.0
1.2 1.4 2.0 2.2 2.8 3.3 4.4
4
1869
SK Bratislava
72 1.2
1.2 1.4 1.8 2.2 2.9 3.5 4.2
4
1806
HU Medve/Medvedov
27 0.9
1.1 1.3 1.7 1.9 2.5 3.1 4.3
4
1806
SK Medvedov/Medve
12 1.2
1.2 1.3 1.7 2.0 2.5 2.9 3.5
5
1768
HU Komarom/Kedvedov
79 1.0
1.2 1.4 1.8 2.1 2.7 3.3 4.4
5
1768
SK Komarno/Komarom
12 1.3
1.4 1.4 1.8 2.1 2.7 3.1 3.5
5
1708
HU Szob
63 1.0
1.3 1.6 1.9 2.3 3.0 3.6 4.3
5
1560
HU Dunafoldvar
81 0.8
1.1 1.4 2.0 2.2 2.7 3.8 4.8
6
1435
HU Hercegszanto
26 0.2
0.2 0.2 0.5 1.0 1.8 2.8 3.5
6
1429
HR Batina
12 1.1
1.3 1.4 1.6 1.9 2.2 2.4 4.1
6
1427
SC Bezdan
23 0.7
1.1 1.3 1.8 2.0 2.7 3.2 4.2
6
1367
SC Bogojevo
11 0.8
1.0 1.3 1.9 1.9 2.3 3.0 3.9
6
1337
HR Borovo
26 1.1
2.0 2.3 2.6 2.7 3.1 3.4 4.5
6
1287
SC Backa
Palanka
11 0.9
1.1 1.2 1.7 1.9 2.1 2.9 4.0
6
1258
SC Novi
Sad
23 0.9
1.1 1.2 1.7 1.9 2.6 3.0 4.0
6
1174
SC Zemun
21 1.0
1.1 1.3 1.6 1.6 2.0 2.2 2.7
6
1154
SC Pancevo
11 0.8
1.1 1.3 1.6 1.6 1.8 2.5 2.6
6 1076
SC Banatska
Palanka
12 0.8
1.0 1.1 1.4 1.5 1.6 2.0 2.6
7
1071
RO Bazias
70 0.1
0.3 0.5 0.8 0.8 1.1 1.4 1.9
7
954
SC Tekija
12 0.7
0.8 1.0 1.2 1.4 1.5 2.4 2.8
8
851
SC Radujevac
11 0.9
0.9 0.9 1.2 1.3 1.5 2.3 2.7
8
834
RO Pristol/Novo
Selo
Harbour 70 0.1
0.5 0.7 0.9 0.9 1.1 1.3 2.2
8
834 BG
Novo Selo Harbour/Pristol
34 0.5
0.7 0.8 1.0 1.3 1.8 2.3 3.5
8
641
BG us.
Iskar-Bajkal
12 0.1
0.3 0.5 0.8 1.0 1.2 2.2 2.5
8
554
BG Downstream
Svishtov
13 0.3
0.7 1.0 1.1 1.2 1.5 1.6 2.0
8
503
BG us.
Russe
11 0.7
0.9 1.1 1.3 1.5 1.7 2.1 2.7
8
432
RO Upstream
Arges
36 0.9
1.0 1.0 1.1 1.1 1.2 1.3 1.5
9 375
RO
Chiciu/Silistra
72 0.1
0.6 0.7 1.4 1.5 2.1 2.4 3.2
9 375
BG
Silistra/Chiciu
33 0.7
0.8 0.9 1.2 1.4 1.6 2.2 2.4
9 132
RO
Reni-Chilia/Kilia
arm
72 0.6
0.9 1.0 1.6 1.6 2.1 2.4 3.4
10
18
RO
Vilkova-Chilia arm/Kilia arm 36 0.1
0.4 1.0 1.3 1.4 2.0 2.3 2.5
10
18
UA
Vilkova - Kilia arm/Chilia arm 8
0.8
0.9 1.1 1.3 1.2 1.4 1.4 1.5
10
0
RO
Sulina - Sulina arm
36 0.1 0.8
1.0
1.3
1.4
2.0
2.2
2.9
10 0 RO Sf.
Gheorghe-Ghorghe
arm 36 0.6
0.9 1.0 1.2 1.5 2.1 2.3 2.7
ENVIRONMENTAL INSTITUTE
DEVELOPMENT OF OPERATIONAL TOOLS FOR MONITORING, LABORATORY AND INFORMATION MANAGEMENT
Developing WFD type-specific quality standards for nutrients Ł Draft Final Report
page 77
NH4 [mg N/l], year 2004
Section Km Country Location
N min 10-
25-
50-
mean 75-
90-
max
tile
tile
tile
tile
tile
2
2581
DE
Neu-Ulm/Boefinger
Halde 26
0.00
0.03 0.04 0.06 0.06 0.07 0.12 0.16
3
2204
DE
Jochenstein
26
0.03
0.04 0.04 0.07 0.08 0.09 0.16 0.18
3
2204
AT
Jochenstein
12
0.00
0.02 0.02 0.02 0.05 0.07 0.13 0.14
3
2120
AT
Abwinden-Asten
12
0.00
0.00 0.01 0.04 0.04 0.05 0.08 0.12
4
1935
AT
Wien-Nussdorf
12
0.00
0.00 0.01 0.02 0.03 0.04 0.07 0.10
4
1874
AT
Wolfsthal
24
0.00
0.02 0.03 0.07 0.10 0.10 0.23 0.54
4
1869
SK
Bratislava
72
0.03
0.07 0.11 0.23 0.24 0.33 0.50 0.67
4
1806
HU Medve/Medvedov
27
0.02
0.02 0.02 0.02 0.06 0.07 0.15 0.20
4
1806
SK
Medvedov/Medve
12
0.03
0.04 0.06 0.09 0.11 0.15 0.21 0.22
5
1768
HU Komarom/Kedvedov
79
0.02
0.02 0.02 0.04 0.07 0.10 0.20 0.21
5
1768
SK
Komarno/Komarom
12
0.03
0.09 0.10 0.11 0.13 0.14 0.23 0.26
5
1708
HU Szob
62
0.02
0.03 0.05 0.08 0.11 0.14 0.23 0.37
5
1560
HU Dunafoldvar
81
0.02
0.02 0.02 0.06 0.10 0.16 0.24 0.35
6
1435
HU Hercegszanto
26
0.02
0.03 0.04 0.05 0.08 0.10 0.16 0.33
6
1429
HR Batina
12
0.02
0.03 0.04 0.06 0.09 0.11 0.19 0.31
6
1427
SC
Bezdan
23
0.02
0.04 0.08 0.12 0.13 0.17 0.26 0.30
6
1367
SC
Bogojevo
11
0.05
0.10 0.11 0.14 0.16 0.18 0.26 0.42
6
1337
HR Borovo
26
0.07
0.07 0.10 0.15 0.16 0.19 0.27 0.38
6
1287
SC
Backa
Palanka
11
0.08
0.11 0.13 0.17 0.22 0.28 0.41 0.48
6
1258
SC
Novi
Sad
23
0.10
0.11 0.14 0.19 0.21 0.25 0.30 0.56
6
1174
SC
Zemun
24
0.00
0.00 0.00 0.05 0.12 0.12 0.31 0.80
6
1154
SC
Pancevo
10
0.10
0.11 0.12 0.19 0.24 0.36 0.44 0.46
6
1076 SC
Banatska
Palanka
12 0.10
0.12 0.14 0.20 0.23 0.32 0.35 0.43
7
1071
RO Bazias
70
0.02
0.09 0.19 0.26 0.27 0.35 0.47 0.68
7
954 SC
Tekija
11
0.00
0.00 0.00 0.03 0.04 0.05 0.14 0.16
8
851 SC
Radujevac
11
0.00
0.00 0.00 0.00 0.07 0.08 0.11 0.45
8
834 RO Pristol/Novo
Selo
Harbour 70
0.02
0.04 0.09 0.15 0.18 0.25 0.32 0.68
8
834
BG
Novo Selo Harbour/Pristol
34 0.07
0.10 0.13 0.18 0.19 0.25 0.29 0.31
8
641 BG us.
Iskar-Bajkal
12
0.01
0.02 0.09 0.20 0.18 0.30 0.30 0.40
8
554 BG Downstream
Svishtov
13
0.00
0.00 0.02 0.05 0.06 0.07 0.14 0.17
8
503 BG us.
Russe
11
0.03
0.04 0.04 0.07 0.07 0.08 0.12 0.19
8
432 RO Upstream
Arges
36
0.08
0.09 0.10 0.12 0.13 0.14 0.17 0.21
9 375
RO
Chiciu/Silistra
72
0.02
0.19 0.25 0.41 0.44 0.59 0.79 1.15
9 375
BG
Silistra/Chiciu
33
0.00
0.04 0.05 0.08 0.10 0.14 0.15 0.32
9 132
RO
Reni-Chilia/Kilia
arm 72
0.02
0.05 0.21 0.33 0.38 0.54 0.73 0.95
10
18
RO
Vilkova-Chilia arm/Kilia arm
36
0.02
0.18 0.33 0.58 0.55 0.75 0.86 1.17
10
18
UA
Vilkova - Kilia arm/Chilia 8 0.05
0.10 0.13 0.15 0.18 0.20 0.30 0.36
arm
10
0 RO Sulina
-
Sulina
arm
36
0.02
0.14 0.20 0.30 0.46 0.61 0.91 1.82
10
0 RO Sf.
Gheorghe-Ghorghe
arm 36
0.04
0.15 0.22 0.46 0.47 0.63 0.87 1.20
UNDP/GEF DANUBE REGIONAL PROJECT
Annexes
page 78
NO2 [mg N/l], year 2004
Section Km Country Location
N min 10-tile 25-tile 50-tile mean 75-tile 90-tile max
2
2581
DE Neu-Ulm/Boefinger
Halde 13 0.01 0.02 0.02 0.02 0.02 0.03 0.03 0.03
3
2204
DE Jochenstein
23 0.01 0.01 0.01 0.01 0.01 0.02 0.02 0.03
3
2204
AT Jochenstein
12 0.01 0.01 0.01 0.01 0.01 0.01 0.02 0.03
3
2120
AT Abwinden-Asten
12 0.01 0.01 0.01 0.01 0.01 0.02 0.02 0.02
4
1935
AT Wien-Nussdorf
12 0.00 0.01 0.01 0.01 0.01 0.01 0.03 0.03
4
1874
AT Wolfsthal
24 0.01 0.02 0.02 0.02 0.02 0.03 0.04 0.04
4
1869
SK
Bratislava
72 0.00 0.01 0.01 0.02 0.02 0.03 0.03 0.04
4
1806
HU Medve/Medvedov
27 0.01 0.01 0.01 0.02 0.02 0.03 0.03 0.04
4
1806
SK
Medvedov/Medve
12 0.01 0.01 0.01 0.01 0.02 0.03 0.03 0.03
5
1768
HU Komarom/Kedvedov
79 0.01 0.01 0.01 0.02 0.02 0.03 0.03 0.04
5
1768
SK
Komarno/Komarom
12 0.00 0.01 0.02 0.02 0.02 0.03 0.03 0.03
5
1708
HU Szob
62 0.00 0.01 0.02 0.02 0.02 0.03 0.03 0.08
5
1560
HU Dunafoldvar
81 0.01 0.01 0.01 0.02 0.02 0.03 0.04 0.06
6
1435
HU Hercegszanto
26 0.00 0.00 0.01 0.02 0.02 0.03 0.03 0.07
6
1429
HR Batina
12 0.01 0.01 0.02 0.02 0.02 0.03 0.04 0.04
6
1427
SC
Bezdan
23 0.01 0.01 0.01 0.02 0.02 0.03 0.04 0.04
6
1367
SC
Bogojevo
11 0.01 0.01 0.01 0.02 0.02 0.03 0.04 0.04
6
1337
HR Borovo
26 0.01 0.01 0.01 0.02 0.03 0.02 0.02 0.32
6
1287
SC
Backa
Palanka
11 0.01 0.01 0.01 0.02 0.02 0.02 0.03 0.04
6
1258
SC
Novi
Sad
23 0.01 0.01 0.02 0.02 0.02 0.03 0.03 0.04
6
1174
SC
Zemun
17 0.00 0.02 0.02 0.04 0.04 0.06 0.07 0.10
6
1154
SC
Pancevo
11 0.01 0.02 0.02 0.03 0.03 0.03 0.04 0.05
6 1076
SC Banatska
Palanka
12 0.01 0.01 0.02 0.02 0.02 0.02 0.03 0.04
7
1071
RO Bazias
70 0.01 0.01 0.02 0.03 0.05 0.04 0.04 0.81
7
954 SC
Tekija
12 0.00 0.00 0.00 0.00 0.01 0.01 0.03 0.03
8
851 SC
Radujevac
11 0.00 0.00 0.00 0.00 0.01 0.01 0.03 0.09
8
834 RO Pristol/Novo
Selo
Harbour 70 0.01 0.01 0.02 0.02 0.02 0.03 0.04 0.05
8
834 BG
Novo Selo Harbour/Pristol
34 0.00 0.02 0.02 0.03 0.02 0.03 0.03 0.04
8
641 BG us.
Iskar-Bajkal
12 0.00 0.01 0.02 0.02 0.02 0.02 0.03 0.03
8
554 BG Downstream
Svishtov
13 0.00 0.00 0.00 0.00 0.01 0.01 0.01 0.02
8
503 BG us.
Russe
11 0.01 0.02 0.02 0.02 0.02 0.02 0.03 0.04
8
432 RO Upstream
Arges
36 0.01 0.01 0.01 0.01 0.02 0.02 0.03 0.04
9 375
RO
Chiciu/Silistra
72 0.01 0.01 0.02 0.04 0.06 0.06 0.12 0.41
9 375
BG
Silistra/Chiciu
33 0.01 0.01 0.02 0.02 0.02 0.03 0.03 0.04
9 132
RO
Reni-Chilia/Kilia
arm
72 0.01 0.01 0.01 0.03 0.05 0.08 0.13 0.18
10
18
RO
Vilkova-Chilia arm/Kilia arm 36 0.01 0.01 0.01 0.03 0.09 0.09 0.15 1.51
10
18
UA
Vilkova - Kilia arm/Chilia arm 8 0.02 0.02 0.02 0.03 0.04 0.05 0.06 0.09
10
0 RO Sulina
-
Sulina
arm
36 0.01 0.01 0.01 0.02 0.05 0.07 0.10 0.25
10
0 RO Sf.
Gheorghe-Ghorghe
arm 36 0.01 0.01 0.02 0.02 0.03 0.03 0.09 0.13
ENVIRONMENTAL INSTITUTE
DEVELOPMENT OF OPERATIONAL TOOLS FOR MONITORING, LABORATORY AND INFORMATION MANAGEMENT
Developing WFD type-specific quality standards for nutrients Ł Draft Final Report
page 79
Ptot [mg P/l], year 2004
Section Km Country Location
N minimum 10-tile 25-tile 50-tile mean 75-tile 90-tile max
2
2581
DE Neu-Ulm/Boefinger
Halde 70 0.02
0.06 0.07 0.11 0.12 0.17 0.22 0.30
3
2204
DE Jochenstein
70 0.01
0.04 0.06 0.09 0.11 0.13 0.20 0.36
3
2204
AT Jochenstein
36 0.08
0.11 0.12 0.14 0.13 0.15 0.16 0.19
3
2120
AT Abwinden-Asten
69 0.01
0.03 0.07 0.10 0.26 0.17 0.23 4.07
4
1935
AT Wien-Nussdorf
72 0.01
0.06 0.09 0.12 0.12 0.14 0.18 0.28
4
1874
AT Wolfsthal
36 0.06
0.08 0.10 0.12 0.12 0.14 0.17 0.26
4
1869
SK
Bratislava
36 0.00
0.07 0.09 0.12 0.13 0.14 0.20 0.25
4
1806
HU Medve/Medvedov
37 0.02
0.08 0.09 0.13 0.14 0.14 0.23 0.32
4
1806
SK
Medvedov/Medve
8 0.06
0.08 0.10 0.12 0.13 0.15 0.19 0.19
5
1768
HU Komarom/Kedvedov
34 0.04
0.05 0.09 0.12 0.16 0.16 0.34 0.57
5
1768
SK
Komarno/Komarom
12 0.03
0.04 0.07 0.10 0.10 0.11 0.19 0.21
5
1708
HU Szob
13 0.00
0.06 0.07 0.11 0.14 0.15 0.32 0.43
5
1560
HU Dunafoldvar
11 0.04
0.11 0.12 0.14 0.18 0.23 0.29 0.41
6
1435
HU Hercegszanto
33 0.05
0.12 0.13 0.16 0.17 0.21 0.26 0.28
6
1429
HR Batina
12 0.06
0.10 0.10 0.12 0.12 0.13 0.14 0.15
6
1427
SC
Bezdan
26 0.05
0.08 0.09 0.15 0.24 0.19 0.31 2.05
6
1367
SC
Bogojevo
27 0.05
0.07 0.08 0.09 0.10 0.12 0.13 0.16
6
1337
HR Borovo
79 0.00
0.08 0.09 0.11 0.13 0.16 0.20 0.34
6
1287
SC
Backa
Palanka
63 0.02
0.03 0.05 0.08 0.09 0.12 0.16 0.20
6
1258
SC
Novi
Sad
81 0.09
0.11 0.12 0.13 0.14 0.14 0.16 0.37
6
1174
SC
Zemun
26 0.03
0.05 0.06 0.07 0.07 0.09 0.12 0.14
6
1154
SC
Pancevo
72 0.05
0.06 0.07 0.08 0.09 0.10 0.13 0.18
6 1076
SC Banatska
Palanka
12 0.05
0.05 0.06 0.07 0.07 0.07 0.08 0.10
7
1071
RO Bazias
12 0.06
0.07 0.08 0.09 0.08 0.09 0.10 0.11
7
954 SC
Tekija
26 0.05
0.05 0.06 0.07 0.07 0.07 0.10 0.10
8
851 SC
Radujevac
26 0.04
0.05 0.07 0.08 0.08 0.08 0.10 0.14
8
834 RO Pristol/Novo
Selo
Harbour 24 0.03
0.03 0.03 0.04 0.09 0.06 0.09 0.77
8
834 BG
Novo Selo Harbour/Pristol
12 0.02
0.03 0.04 0.04 0.05 0.05 0.06 0.14
8
641 BG us.
Iskar-Bajkal
12 0.03
0.03 0.04 0.05 0.05 0.06 0.06 0.10
8
554 BG Downstream
Svishtov
12 0.03
0.04 0.04 0.05 0.05 0.06 0.07 0.09
8
503 BG us.
Russe
12 0.09
0.11 0.11 0.12 0.13 0.13 0.15 0.20
8
432 RO Upstream
Arges
10 0.08
0.10 0.10 0.11 0.11 0.12 0.13 0.14
9 375
RO
Chiciu/Silistra
12 0.08 0.08 0.10 0.11 0.12 0.14 0.16 0.22
9 375
BG
Silistra/Chiciu
23 0.02 0.03 0.05 0.06 0.07 0.08 0.09 0.15
9 132
RO
Reni-Chilia/Kilia
arm
11 0.12
0.12 0.13 0.15 0.16 0.18 0.20 0.20
10
18
RO
Vilkova-Chilia arm/Kilia arm 12 0.06 0.08
0.09
0.12
0.12 0.16 0.17 0.19
10
18
UA
Vilkova - Kilia arm/Chilia arm 12 0.03 0.03
0.03
0.04
0.05 0.05 0.08 0.09
10
0 RO Sulina
-
Sulina
arm
11 0.01
0.04 0.05 0.05 0.05 0.06 0.07 0.09
10
0 RO Sf.
Gheorghe-Ghorghe
arm 11 0.11
0.11 0.12 0.13 0.15 0.18 0.22 0.23
UNDP/GEF DANUBE REGIONAL PROJECT
Annexes
page 80
PO4 [mg P/l], year 2004
Section Km Country Location
N minimum 10-
25-
50-
mean 75-
90-
max
tile
tile
tile
tile
tile
2
2581
DE
Neu-Ulm/Boefinger
Halde 26
0.01
0.02 0.03 0.04 0.04 0.06 0.06 0.07
3
2204
DE
Jochenstein
26
0.00
0.01 0.02 0.03 0.03 0.04 0.05 0.06
3
2204
AT
Jochenstein
12
0.01
0.01 0.02 0.03 0.03 0.04 0.05 0.06
3
2120
AT
Abwinden-Asten
12
0.00
0.00 0.02 0.02 0.03 0.04 0.04 0.05
4
1935
AT
Wien-Nussdorf
12
0.00
0.00 0.01 0.02 0.03 0.04 0.04 0.06
4
1874
AT
Wolfsthal
24
0.00
0.00 0.01 0.03 0.03 0.04 0.05 0.06
4
1869
SK
Bratislava
36
0.01
0.02 0.03 0.04 0.04 0.05 0.06 0.07
4
1806
HU
Medve/Medvedov
27
0.01
0.01 0.02 0.03 0.03 0.05 0.06 0.09
4
1806
SK
Medvedov/Medve
12
0.02
0.02 0.03 0.04 0.04 0.05 0.05 0.06
5
1768
HU
Komarom/Kedvedov
79
0.01
0.01 0.03 0.05 0.05 0.07 0.09 0.17
5
1768
SK
Komarno/Komarom
12
0.01
0.02 0.04 0.05 0.05 0.06 0.07 0.07
5
1708
HU
Szob
63
0.01
0.01 0.03 0.05 0.06 0.08 0.12 0.15
5
1560
HU
Dunafoldvar
81
0.00
0.01 0.02 0.04 0.05 0.07 0.09 0.12
6
1435
HU
Hercegszanto
26
0.00
0.01 0.01 0.01 0.02 0.03 0.05 0.07
6
1429
HR
Batina
12
0.01
0.02 0.02 0.05 0.05 0.07 0.08 0.08
6
1427
SC
Bezdan
23
0.00
0.01 0.01 0.04 0.04 0.08 0.08 0.09
6
1367
SC
Bogojevo
11
0.01
0.01 0.01 0.05 0.05 0.08 0.08 0.09
6
1337
HR
Borovo
26
0.02
0.03 0.05 0.06 0.07 0.08 0.12 0.27
6
1287
SC
Backa
Palanka
11
0.01
0.01 0.04 0.06 0.06 0.08 0.10 0.12
6
1258
SC
Novi
Sad
23
0.00
0.01 0.02 0.05 0.05 0.07 0.08 0.11
6
1174
SC
Zemun
23
0.01
0.01 0.03 0.04 0.04 0.05 0.08 0.13
6
1154
SC
Pancevo
11
0.01
0.02 0.02 0.04 0.05 0.07 0.08 0.09
6 1076
SC Banatska
Palanka
11
0.01
0.02 0.02 0.05 0.04 0.06 0.06 0.08
7
1071
RO
Bazias
70
0.02
0.05 0.06 0.09 0.10 0.12 0.19 0.28
7
954 SC
Tekija
12
0.02
0.02 0.02 0.02 0.03 0.03 0.04 0.06
8
851 SC
Radujevac
11
0.01
0.02 0.02 0.03 0.03 0.03 0.06 0.06
8
834 RO
Pristol/Novo
Selo
Harbour 70
0.01
0.04 0.06 0.08 0.09 0.11 0.14 0.30
8
834
BG
Novo Selo Harbour/Pristol
34
0.03
0.04 0.05 0.07 0.09 0.10 0.15 0.35
8
641 BG
us.
Iskar-Bajkal
12
0.00
0.02 0.04 0.05 0.06 0.06 0.12 0.16
8
554 BG
Downstream
Svishtov
13
0.00
0.01 0.03 0.06 0.05 0.08 0.09 0.10
8
503 BG
us.
Russe
11
0.03
0.04 0.06 0.07 0.08 0.09 0.13 0.14
8
432 RO
Upstream
Arges
36
0.05
0.06 0.06 0.07 0.07 0.08 0.09 0.10
9 375
RO
Chiciu/Silistra
72
0.01 0.01 0.01 0.03 0.04 0.07 0.09 0.18
9 375
BG
Silistra/Chiciu
33
0.02 0.04 0.05 0.07 0.07 0.10 0.11 0.15
9 132
RO
Reni-Chilia/Kilia
arm 72
0.01
0.01 0.01 0.05 0.05 0.10 0.11 0.15
10 18
RO Vilkova-Chilia
arm/Kilia
36
0.01
0.01 0.02 0.04 0.08 0.10 0.13 0.82
arm
10
18
UA
Vilkova - Kilia arm/Chilia 8 0.04
0.05 0.05 0.07 0.07 0.10 0.11 0.12
arm
10
0 RO
Sulina
-
Sulina
arm
36
0.01
0.01 0.01 0.05 0.06 0.10 0.12 0.14
10
0 RO
Sf.
Gheorghe-Ghorghe
arm 36
0.01
0.01 0.01 0.03 0.05 0.09 0.13 0.24
ENVIRONMENTAL INSTITUTE