UNDP/GEF Danube Regional Project
Strengthening the Implementation Capacities for Nutrient
Reduction and Transboundary Cooperation
in the Danube River Basin
Development of a methodological concept
for assessment of environment stress and
impacts as a basis for preparation of a
computer-based application for stress-
impact analysis
Project Component 2.2: Development of operational tools for
monitoring, laboratory and information management with
particular attention to nutrients and toxic substances
October 31, 2003
Prepared by: Rodeco Consulting GmbH
Author:
Jan Dogterom
Development of a methodological concept for assessment of environment stress and impacts as a basis
VI 1
for preparation of a computer-based application for stress-impact analysis
Table of contents
Abbreviations
Executive summary
1. The problem .................................................................................................... VI - 5
2. The options ..................................................................................................... VI - 5
2.1 EMIS ........................................................................................................... VI - 5
2.2 MONERIS ................................................................................................... VI - 6
2.3 DBAM......................................................................................................... VI - 6
2.4 DWQM........................................................................................................ VI - 7
3. The conceptual choice...................................................................................... VI - 8
4. Technical approach.......................................................................................... VI - 9
4.1 Data requirements......................................................................................... VI - 10
5. The limits of the application ............................................................................. VI - 10
6. Alternative solution.......................................................................................... VI - 10
VI 2
UNDP/GEF Danube Regional Project
Abbreviations
TNMN
Trans-National Monitoring Network
EMIS
Emission Sources Expert Group
ICPDR
International Commission for the Protection of the Danube River
DBAM
Danube Basin Alarm Model
DWQM Danube Water Quality Model
RODECO Consulting GmbH
Development of a methodological concept for assessment of environment stress and impacts as a basis
VI 3
for preparation of a computer-based application for stress-impact analysis
Executive Summary
In this activity a concept for a computer based application was developed assessing the relation
between a pressure (the emission of a pollutant by a point source) and the downstream increase of the
concentration of a pollutant ("state"). For this concept the use of existing databases (EMIS, TNMN)
and existing models or modules from these models (MONERIS, DBAM, DWQM) was considered.
Assessing different conceptual choices using the abovementioned models/modules three different
functionalities were defined:
Detection of pressure based on observed concentration increase (accidental pollution pressures)
This application would consist of an "inverse DBAM" model. In its simplest form, the application
could be based on a large database of computed pollutant clouds C(t) by DBAM, for different spill and
observation positions, under different hydrological conditions. By comparing the observed cloud of
pollutants with the database of clouds, given the actual hydrologic conditions, potential spill sites can
be observed. Under the assumption that the removal rate of the pollutant is known, the spill mass can
be back-computed.
Detection of pressure based on observed concentration increase (regular pollution pressures)
The application would start from an observed trend-wise increase of the concentration of a given
substance at a given location from one year to another. Upstream point sources which show a
corresponding increase of their emissions could be detected and listed. The decay rate of the substance
in question could be taken into account to eliminate pollution sources too far away for their emitted
pollutants to reach the observation point.
Effects of pollution reduction measures (only regular pollution pressures)
This application could consist of an application like the present DBAM, with some modifications: a
continuous spill should be modelled instead of an accidental spill, average hydrological conditions
should be used rather than actual conditions. To keep things simple, the application should include
only one particular point source for which reduction measures need to be analysed. The background
pollution from the other point sources and from diffuse sources needs to be back-computed for any
selected observation location. The computed concentration from the point source in question before
the reduction is subtracted from the present concentration at the observation point: the difference is the
background concentration. The total concentration after reduction is obtained by adding the computed
concentration from the point source in question after the reduction to the background concentration.
From assessment of practical implications of the three proposed functionalities it was clear, that the
development of the computer based application for stress-impact analysis, which can calculate a
quantitative relation between a point source and downstream changes in concentration levels or vice
versa, will require a major investment in model/software development.
Therefore, a simpler practical concept was proposed as an alternative solution. In this case, the data of
the TNMN would be the starting point for further analysis. If for a pollutant a significant concentration
increase is observed during, e.g., 2-3 months, analysis of more upstream stations should indicate
between which two stations the increase has started. In that stretch of the river the discharge should
occur. At that point, a link with the EMIS database should be made to identify the point source.
Such a solution would require a proper coverage by the TNMN, in particular at the discharge of major
tributaries and small tributaries with relevant point sources. A direct link with the EMIS database can
be made through the geographical codes in both databases. Results should be presented in GIS. This
concept would require adjustments in the TNMN as well as the development of a link between TNMN
and EMIS based on GIS.
Development of a methodological concept for assessment of environment stress and impacts as a basis
VI 5
for preparation of a computer-based application for stress-impact analysis
1. The problem
The initial idea of this activity was to develop a concept for a computer based application to analyse
the relation between upstream pressures (emissions) and downstream impacts, based on the EMIS and
TNMN databases. In the initial approach, impacts were defined as changes in the water quality or
ecosystems. At the start of this activity, the consultant has defined the problem more precise in
consultation with the experts of the combined MLIM and EMIS working groups (see Inception
Report, 12 December 2002, and minutes of the MLIM/EMIS working group meeting on 3 February).
Change of instream water quality is usually defined as change in "state"; ecosystem change is usually
defined as "impact", the loss of a function (UNECE: Guidelines on Monitoring and Assessment of
Transboundary Waters, pp 22-23). The analysis of a relation between pressures and impacts, in casu
ecosystem change, is very complicated. Many variables are included: water quality, water flow,
wetland management, river continuity, reduction of flood plains, shipping, fisherie s etc).
Based on this clarification, it was agreed, that in this activity a concept for a computer based
application will be developed to assess the relation between a pressure: the emission of a pollutant
(nutrients and toxic compounds) by a point source and the downstream increase of the concentration
of a pollutant ("state").
The application should enable to calculate and visualise the quantitative relation between the location
(river kilometre, GIS/map based) of a point source, the discharge load of a pollutant from this source
("pressure") and the distance over which a significant effect on concentration of the pollutant ("state")
can still be expected. The application likewise should enable to trace back a point source based on the
elevated pollutant concentrations measured downstream, in particular in transboundary river stretches.
The concept should include the possibility of assessing the effects of pollution reduction measures.
The use of existing databases (EMIS, TNMN) and existing models or modules from these models
(MONERIS, DBAM, DWQM) is highly preferred.
2. The options
The basic idea for the application is to combine a data base of pressures/point sources/discharge loads
(EMIS) with a model: (1) to calculate downstream changes in pollutant concentrations ("state") and
(2) vice versa: to locate a point source upstream, based on real time measurements of increased
pollutant concentrations (TNMN) downstream. The output of the application should be GIS based and
visualise on a map the relation between locations of point sources of nutrients and toxic compounds
and concentration levels downstream. It should be possible also to calculate the effects of pollution
reduction measures.
The options of using the existing database on pressures (EMIS) or a model to calculate pressures
(MONERIS), and to combine this with (modules of) existing models to calculate concentrations
(MONERIS, DBAM, DWQM), were analysed. The features of these instruments are therefore briefly
summarised and a conceptual choice is motivated subsequently.
2.1
EMIS
EMIS is a database (Excel spreadsheet) of point sources in the Danube Basin. It contains the data on
discharge loads of COD, NH4-N, NO2-N, NO3-N, total-N, PO4-P and total-P from about 500
municipal and 220 industrial point sources in tonnes per year. The database is still under construction.
Data on other compounds of the Danube list of priority substances need to be included. Some
countries have to submit the data yet. Data on agricultural point sources is being collected. The
database is in a continuous process of updating. Discharge points are indicated with a unique AVcode,
the name of the point source and the geographical coordinates. The database can be easily used in
combination with any model.
VI 6
UNDP/GEF Danube Regional Project
2.2
MONERIS
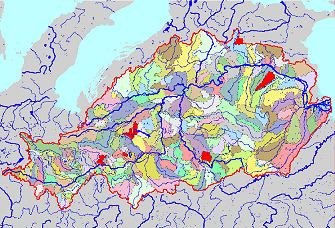
MONERIS is developed as a model to calculate nutrient emissions from point and non-point sources
and to estimate nutrient loads at specific monitoring stations, based on the sum of all inputs from
diffuse and point sources, taking retention in different spheres into account.
The application targets questions in which diffuse and distributed pollution sources play a crucial role.
Geographically, the Danube catchment is subdivided in about 380 sub-catchments (see Figure 1).
These form the basis of the calculations. It should be noted that information about individual point
sources is not used directly: they are lumped per sub-catchment. The time scale of the computations is
large: the solution represents the average conditions during a period of about 5 years. The application
is set up in ArcView and Excell, and is intended for expert users.
Figure 1: Subcatchments in Moneris
2.3
DBAM
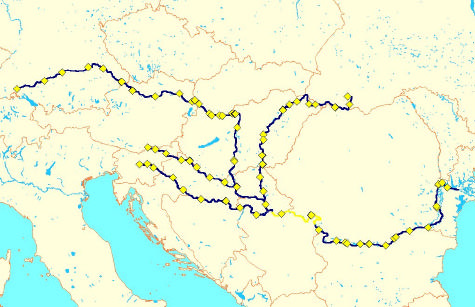
The Danube Basin Alarm Model (DBAM) was designed to support decision-making in relation to
accidental spills with a probable trans-boundary impact (like the January 2000 Baia Mare spill). The
model provides forecasts of the travel time and the expected peak concentrations in the cloud of
pollutants during its travel down the river. The DBAM was designed for use in operational conditions,
to provide a fast and first order assessment of the effects of a spill. It uses limited and readily
available input data. For reasons of computational speed and accuracy, the model uses an analytical
technique to solve the governing mathematical advection- diffusion equation. The DBAM model is
operational in 11 Danube countries. An evaluation of its accuracy has been carried out on the basis of
data collected during the Baia Mare Spill. At present, the ICPDR is considering a full-scale calibration
of the model. The model operates on short time scales (from hours to several weeks). The
schematisation includes the Danube itself and a significant number of trans-boundary tributaries (see
Figure 2).
RODECO Consulting GmbH
Development of a methodological concept for assessment of environment stress and impacts as a basis
VI 7
for preparation of a computer-based application for stress-impact analysis
Figure 2: DBAM-schematisation
2.4
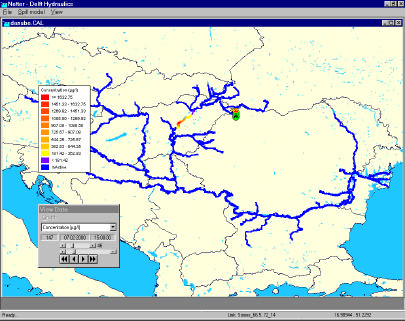
DWQM
DWQM is developed as a model to calculate the transport and transformation and retention processes
of nutrients in the Danube river and its main tributaries.
The first version of the model was developed in 1998-1999 in the framework of the first Danube GEF
project. The gaps in knowle dge and data identified in this project are presently being addressed by the
daNUbs project (EU 5th Framework Programme). This will lead to a new DWQM (to be finished in
June 2003), which operates in conjunction with MONERIS. The specific tasks of the DWQM are: (a)
to allow the modelling of nutrient concentrations on time scales of days over periods of several years,
(b) to allow a distinction of the different nutrient species, and (c) to allow the analysis of retention
processes at river anomalies (Iron Gates, Gabcikovo). Like the DBAM, the DWQM is mathematically
based on the advection-diffusion equation. This time however, the solution technique is numerical, and
the representation of transformation and retention processes is much more elaborate. The
schematisation includes the Danube itself and its major tributaries (see Figure 3). The DWQM is
consists of an application of the generic river modelling software package SOBEK, combined with a
dedicated pre-processing programme written in Fortran. The application is intended for expert users.
VI 8
UNDP/GEF Danube Regional Project
Figure 3: DWQM-schematisation
The selection of the most suitable database(s) and model(s) to be a starting point for the development
of the application, will be discussed below.
3. The conceptual choice
The selection of the appropriate concepts and the databases and models to be used as a starting point is
based on a further analysis of the questions to be answered.
First, we observe that the focus is on individual point sources. This immediately leads to the
conclusion that the use of MONERIS is not very logical, since individual point sources are not
represented within MONERIS. The concept of DBAM and DWQM does allow the analysis of
individual point sources, as long as they are situated on the river branches included in their respective
schematisations.
A second observation is that both accidental and continuous pollution sources are within the scope of
the application to be defined. Therefore, both DBAM and DWQM could form a basis.
A third observation is that the application to be defined is intended for operational use. This makes the
DBAM a much more suitable starting point than the DWQM. The latter requires too much and too
complex input data.
Detection of pressures based on observed concentration increase (both regular and accidental
pollution pressures)
For both regular and accidental pollution, this functionality is possible, but not yet a functionality of
DBAM or DWQM. The technique presumes the accurate detection of the C(t) profile in the field. A
kind of "inverse DBAM" application could be set up based on the existing input data and concepts of
the DBAM. Such an application can indicate potential spill sites and spill masses, as long as these are
situated on the modelled river network. The data needs in regard to the emissions database (EMIS) are
very strict, and may determine the feasibility.
RODECO Consulting GmbH
Development of a methodological concept for assessment of environment stress and impacts as a basis
VI 9
for preparation of a computer-based application for stress-impact analysis
Effects of pollution reduction measures (only regular pollution pressures)
This question can best be addressed by a very much simplified DWQM application, which looks a lot
like DBAM. The application will preferably only include one particular point source for which
reduction measures need to be analysed. The background pollution (from the other point sources and
from diffuse sources) should not be explicitly computed (like MONERIS-DWQM), nor be neglected
(like DBAM) but should be back-computed from the existing situation.
Summarising, the following choice is recommended:
The computer based application should combine the EMIS database with a model, which could
basically be a variant and an extension of the DBAM. EMIS should be completed and contain the
emission loads of all substances on the Danube Priority List. Point sources in EMIS are already
indicated by river kilometre. Adjustment/extension of DBAM should result in the possibility to
calculate the relation between the location of a discharge and elevated concentrations downstream,
both in case of accidental spills and structural upward trends.
4. Technical approach
In line with the conceptual choices discussed above, three different functionalities are defined.
Detection of pressure based on observed concentration increase (accidental pollution pressures)
This application would consist of an "inverse DBAM" model. In its simplest form, the application
could be based on a large database of computed pollutant clouds C(t) by DBAM, for different spill and
observation positions, under different hydrological conditions. By comparing the observed cloud of
pollutants with the database of clouds, given the actual hydrologic conditions, potential spill sites can
be observed. Under the assumption that the removal rate of the pollutant is known, the spill mass can
be back-computed.
There are probably more sophisticated techniques than the one described above. These should be
identified at a later stage.
It should be pointed out that this application is conceptually complex. At this point it is not known if
experience exists with a similar application elsewhere in the world.
Detection of pressure based on observed concentration increase (regular pollution pressures)
The application would start from an observed trend-wise increase of the concentration of a given
substance at a given location from one year to another. Upstream point sources which show a
corresponding increase of their emissions could be detected and listed. The decay rate of the substance
in question could be taken into account to eliminate pollution sources too far away for their emitted
pollutants to reach the observation point. Please note that this functionality presumes the existence of
very accurate emissions data.
Effects of pollution reduction measures (only regular pollution pressures)
This application could consist of an application like the present DBAM, with some modifications: a
continuous spill should be modelled in stead of an accidental spill, average hydrological conditions
should be used rather than actual conditions. To keep things simple, the application should include
only one particular point source for which reduction measures need to be analysed (although the
concept allows for multiple sources). The background pollution from the other point sources and from
VI 10
UNDP/GEF Danube Regional Project
diffuse sources needs to be back-computed for any selected observation location. The computed
concentration from the point source in question before the reduction is subtracted from the present
concentration at the observation point: the difference is the background concentration. The total
concentration after reduction is obtained by adding the computed concentration from the point source
in question after the reduction to the background concentration.
4.1
Data requirements
EMIS: the database should be complete (river kilometre indication, loads per point source, all
compounds of Danube Priority List included) and up to date (each year updated). The recently
completed inventories of sites of high risk for accidental pollution should somehow be included.
For regular pollution issues, sufficient information should be available about the average
concentrations of target substances at target stations as well as about the related trends. This
information is supposed to come from TNMN. The coverage of TNMN (locations, substances,
frequency) is therefore a decisive factor.
For accidental pollution issues measurements should be frequent enough to "capture" the shape of a
clouds of pollutants. Otherwise, the possibility to trace back the pollution source is compromised.
For the detection of regular pollution pressures responsible for an upward concentration trend
downstream, detailed EMIS data should be available. To support this functionality, yearly versions of
EMIS should be issued on a similar time scale as TNMN (1-2 years time lag), with sufficient accuracy
to detect emission changes on a yearly time scale. This may not be feasible.
5. The limits of the application
The application will not be able to:
· Assess impacts on the river system; impact is defined as loss of function (ecosystem, drinking
water supply etc);
· Address pressures located on other river branches than those explicitly included in the model
application.
6. Alternative solution
From the above analysis it is clear, that the development of the computer based application for stress-
impact analysis, which can calculate a quantitative relation between a point source and downstream
changes in concentration levels or vice versa, will require a major investment in model/soft ware
development. It is not known whether such an application exists in any other river basin.
It should be considered, whether a more simple solution can provide the information needed. The
basic question is to locate an increased discharge upstream, based on observed concentration increases
downstream. A more simple solution would be possible if it is acceptable, that the relation is
established only in a qualitative way.
In this case, the data of the TNMN is the starting point for further analysis. If for a pollutant a
significant concentration increase is observed during for example 2-3 months, analysis of more
upstream stations should indicate between which 2 stations the increase has started. In that stretch of
the river the discharge should occur. This could be the point source or a tributary. In the latter case, the
analysis should be repeated at the tributary etc. At that point, a link with the EMIS database should be
made to identify the point source.
Such a solution would require a proper coverage by the TNMN, in particular at the discharge of major
tributaries and small tributaries with relevant point sources. A direct link with the EMIS database can
be made through the geographical codes (river kilometer !!) in both databases.. Results should be
presented in GIS.
RODECO Consulting GmbH
Development of a methodological concept for assessment of environment stress and impacts as a basis
VI 11
for preparation of a computer-based application for stress-impact analysis
There is no doubt, that this solution is feasible. It may require adjustments in the TNMN. It will
require the development of a link between TNMN and EMIS based on GIS.
Acknowledgment: Mr. J. van Gils of Delft Hydraulics has contributed substantially to this document.