UNDP/GEF Danube Regional Project
Strengthening the Implementation Capacities for Nutrient
Reduction and Transboundary Cooperation in the Danube
River Basin
Development and maintenance of the
DBAM
Project Component 2.3-4: Final Report
October 15, 2003
Prepared by:
Jos van Gils, WL | Delft Hydraulics
Development and Maintenance of the DBAM
i
Contents
1
Introduction ................................................................................................................ 1
1.1
UNDP/GEF Danube Regional Project ........................................................... 1
1.2
Development and maintenance of the DBAM ............................................... 2
1.3
The current report............................................................................................ 3
1.4
Acknowledgements......................................................................................... 3
2
Brief description of the model................................................................................... 4
2.1
General ............................................................................................................ 4
2.2
Mathematical description................................................................................ 4
2.3
Implementation ............................................................................................... 6
2.4
The accuracy of the DBAM............................................................................ 7
3
Review of existing information ................................................................................. 9
3.1
The Rhine Alarm Model ................................................................................. 9
3.1.1
The tracer experiments ...................................................................... 9
3.1.2
The model calibration ...................................................................... 12
3.1.3
Further research ............................................................................... 13
3.2
The Danube Basin Alarm Model .................................................................. 14
3.2.1
Set-up and implementation of the AEWS, DBAM pre-study ........ 14
3.2.2
Implementation of the DBAM ........................................................ 14
3.2.3
Methods for calibration experiments ("project AE2") .................... 15
3.2.4
Strengthening the Danube AEWS ................................................... 16
3.3
Experience from the Elbe River ................................................................... 18
3.3.1
The July 1997 tracer experiments in the Elbe River....................... 18
i i
UNDP/GEF Danube Regional Project
3.3.2
The ALAMO model......................................................................... 19
3.4
Advances in transport modelling.................................................................. 20
3.5
Specific conditions in the Danube Basin...................................................... 20
4
Synthesis: Calibration Options ............................................................................... 21
4.1
Integrated "DBAM usability enhancement plan"......................................... 21
4.1.1
Accuracy of the DBAM................................................................... 21
4.1.2
Maintenance of the DBAM ............................................................. 22
4.2
Scope and objectives of the DBAM calibration exercises........................... 22
4.3
Existing data or additional tracer experiments? ........................................... 22
4.4
Set-up of additional tracer experiments........................................................ 24
4.4.1
Selection of tracer substance ........................................................... 24
4.4.2
Sampling and analysis ..................................................................... 24
4.4.3
Selection of stations and observation windows .............................. 25
4.4.4
Collection of hydrology data ........................................................... 26
5
Preparation of the Workshop.................................................................................. 27
6
Recommendations for follow-up (Workshop Report).......................................... 28
6.1
Availability and utilisation of the DBAM .................................................... 28
6.1.1
Current status ................................................................................... 28
6.1.2
Target accuracy of the DBAM ........................................................ 28
6.1.3
Hydrology data ................................................................................ 29
6.1.4
Rating curves and velocity tables.................................................... 30
6.2
Future calibration of the DBAM, supported by tracer experiments ............ 31
6.2.1
Current status ................................................................................... 31
6.2.2
Scope and objectives (including priorities)..................................... 31
6.2.3
Existing data or new experiments?.................................................. 32
6.2.4
Selection of tracers .......................................................................... 32
6.2.5
Sampling and analysis ..................................................................... 32
J. van Gils, WL | Delft Hydraulics
Development and Maintenance of the DBAM
i i i
6.2.6
Density of stations ........................................................................... 32
6.2.7
Frequency of sampling .................................................................... 33
6.2.8
Hydrology data ................................................................................ 33
6.2.9
Organisation and financing.............................................................. 33
7
Epilogue ..................................................................................................................... 34
8
References.................................................................................................................. 35
A
Draft Workshop Agenda....................................................................................... A1
B
Workshop presentations ........................................................................................B1
C
List of attendants to the Workshop ..................................................................... C1
D
Inventory "availability and utilisation of the DBAM" (G. Pinter) .................. D1
E
Draft ToR for maintenance of the DBAM ...........................................................E1
F
Suggested extension of functionality ....................................................................F1
G
Existing data inventory......................................................................................... G1
H
Relevant legislation for tracer experiments ....................................................... H1
I
Guidelines for tracer mass calculation and exceedance of MAC ......................I1
I.1
Estimation of the required mass of tracer.................................................... I1
I.2
Estimation of the distance where concentrations exceed the MAC ........... I2
I.3
General considerations................................................................................. I2
J
Guideline for frequency of sampling.................................................................... J1
K
Outline of Calibration Manual ............................................................................ K1
K.1
Description of available data ..................................................................... K1
K.2
Calibration methodology ........................................................................... K1
K.3
Processing of available data....................................................................... K2
K.4
Calibration process..................................................................................... K2
K.5
Reporting.................................................................................................... K2
K.6
Upgrading the DBAM................................................................................ K2
K.7
References .................................................................................................. K3
i v
UNDP/GEF Danube Regional Project
J. van Gils, WL | Delft Hydraulics
Development and Maintenance of the DBAM
1
1
Introduction
1.1
UNDP/GEF Danube Regional Project
The UNDP/GEF Danube Regional Project started in 2001 with the long-term development objective
to contribute to sustainable human development in the Danube River Basin through reinforcing the
capacities of the participating countries in developing effective mechanisms for regional co-operation
and co-ordination in order to ensure protection of international waters, sustainable management of
natural resources and biodiversity. In this context, the Project supports the ICPDR, its structures and
the participating countries in order to ensure an integrated and coherent implementation of the
Strategic Action Plan 1994 (SAP 1994), the Common Platform and the forthcoming Joint Action Plan
and the related investment programmes in line with the objectives of the Danube River Protection
Convention (DRPC).
The overall objective of the Danube Regional Project is to complement the activities of the
International Commission for the Protection of the Danube River basin (ICPDR) required to provide a
regional approach and global significance to the development of national policies and legislation and
the definition of priority actions for nutrient reduction and pollution control with particular attention to
achieving sustainable trans-boundary ecological effects within the Danube river basin and the Black
Sea area.
One of the immediate objectives is Capacity building and reinforcement of trans-boundary co-
operation for the improvement of water quality and environmental standards in the Danube river basin.
In view of this objective, Phase 1 of the Project comprises a component directed towards the
Improvement of procedures and tools for accidental emergency response with particular attention to
trans-boundary emergency situations (Project Output 2.3).
In the remainder of this document the UNDP/GEF Danube Regional Project will be referred to as "the
Project".
2
UNDP/GEF Danube Regional Project
1.2
Development and maintenance of the DBAM
The Danube Basin Alarm Model (DBAM) is an operational model for the simulation of the transport
and decay of substances that have been released during accidental spills. The model forms an integral
part of the Danube Accident Emergency Warning System (AEWS) in operation in the Danube River
Basin, and supports the assessment of the consequences of accidental spills for the river water users.
See Figure 1-1.
Figure 1-1: Application of the Danube Basin Alarm Model to the cyanide incident in the Tisa river (January 2000).
The DBAM model-system is used by the Principal International Alert Centres (PIACs) of the Danube
AEWS as a tool to evaluate the possible impacts of a trans-boundary water pollution incident. First of
all the DBAM is aimed to assess the expected concentration of a pollution plume and its time of
arrival at a particular river section downstream.
The experience from the last accidental pollution events indicates that the AEWS and in particular
DBAM needs substantial improvement to become a satisfactory tool for adequate management of
trans-boundary contamination from catastrophic events.
In this context, part of the Project Output 2.3: "Improvement of procedures and tools for accident and
emergency response with particular attention to trans-boundary emergency solutions", is focused on
the maintenance and calibration of the Danube Basin Alarm Model (Activity 2.3-4).
J. van Gils, WL | Delft Hydraulics
Development and Maintenance of the DBAM
3
1.3
The current report
A specific Inception Report describes the activities of the International Consultant in relation to the
planned outputs under Activity 2.3-4 of the Project (WL | Delft Hydraulics, 2002). The general
objective for the work done by the International Consultant is:
To provide a technically sound basis for the DBAM calibration (during Phase 2 of the Project)
and for the future use of the model.
The present document constitutes the Final Report of these activities. It starts with a brief description
of the Danube Basin Alarm Model (Chapter 2). Next, a review of existing information is presented
(Chapter 3). Chapter 4 presents a short study, which analyses the different options for the calibration
of the model. This study results in alternative approaches towards the calibration, which are clearly
laid out for discussion with the ICPDR (APC/EG) and the Project staff in a dedicated Work Shop (held
in Ljubljana on 8-9 September 2003). Implications for the use and maintenance of the model are taken
into consideration.
Chapter 5 continues with some information regarding the preparation of the Workshop mentioned
above, while Chapter 6 discusses the results from the Workshop.
Chapter 6 in particular together with the annexes to this report constitute a specification for and
boundary conditions to the activities to be carried out during Phase 2 of the Danube Regional Project.
1.4
Acknowledgements
The Consultant acknowledges the co-operation of the DRP project staff, the ICPDR Secretariat staff as
well as the APC/EG members. Furthermore, we express our appreciation for the contribution of Dipl.-
Ing. Werner Blohm (Institut für Hygiene und Umwelt, Hamburg) to the Workshop, in relation to the
Elbe alarm model ALAMO.
4
UNDP/GEF Danube Regional Project
2
Brief description of the model
2.1
General
The Danube Basin Alarm Model aims at predicting the travel time of and the concentration in a cloud
of pollutants released in the river system as the result of an accidental spill. The focus is on large scale
events of a trans-boundary nature. The model is intended to be used for a first and rapid assessment
under operational conditions: the run-time should be short and the necessary input data should be
limited.
In view of the requirements above, a 1-dimensional approach has been selected: the variation of the
concentration along the Danube and its main tributaries is calculated. The cloud of pollutants is
supposed to be well mixed over the conveying part of the river cross-section.
Following the example of other large European rivers, the so-called "dead zone model" was adopted.
This model includes two major physical phenomena: (1) the transport of the cloud of pollutants as a
whole in a downstream direction by the river flow, and (2) the mixing and dilution of the cloud. An
important aspect of the latter phenomenon is the mixing of water between the main stream of the river
and (semi-)stagnant parts of the river cross-section or "dead zones".
2.2
Mathematical description
The governing mathematical equations of the dead zone model are:
2
C
C
C
+U
- D
= -e C - C
2
(
s )
t
x
x
Cs = e(C -Cs)
t
(1)
Where:
C
concentration in the main stream (g/m3)
Cs
concentration in the dead zone (g/m3)
U
mean flow velocity (over the main stream) (m/s)
D
longitudinal dispersion coefficient in the main stream (m2/s)
e
mass transfer coefficient between the dead zones and the main
stream (/s)
ratio between the cross section of the dead zone and the cross
section of the main stream (-)
J. van Gils, WL | Delft Hydraulics
Development and Maintenance of the DBAM
5
For reasons of efficiency and accuracy, an analytical solution technique is used. This provides a
solution in a closed mathematical formula for a given location x at a given time t, as a result of a spill
of a mass M (g) at location x = 0 at time t = 0:
2
M / Q
( t - x/
u
)
G
t - x/ u
c(x,t)=
× exp
xc
t
xc
[ -
] 1
+
H (
)
3
2
2
2
4 D t/
4 D t/
u
u
6
xc
2 D t/
xc
u xc
(2)
Where:
U
u =
xc
1+
2
2
U W
D = h u*
(Semi-empiric after Fisher)
Q
river discharge (m3/s)
H3(z)
3rd Hermite polynomial (= z3 - 3z)
Gt
skewness coefficient (-)
W
river width (m)
h
river depth (m)
u*
shear stress velocity (m/s)
constant of proportionality (-)
The parameters (longitudinal dispersion) and (dead zones) are the main calibration parameters.
The solution mentioned above is extended with a factor accounting for the decay of the spilt pollutant:
c(x,t)= c
(x,t) × exp -kt
without decay
( )
(3)
Where:
k
decay rate (1/s)
6
UNDP/GEF Danube Regional Project
The "dead zone model" is commonly accepted as a basis for spill models in river systems: the same
mathematical model is used in the Rhine basin, the Elbe basin and for several rivers in France. It
should be noted however, that there are other ways to solve the mathematical equations. The Elbe
model for example uses a numerical approach, whereas in France the so called "mixing cell" method
is used. The different solution techniques do not have significant implications with respect to the
potential model accuracy and the calibration method (supposing that the implementation is done
properly).
2.3
Implementation
The equations (1) and (2) mentioned above are valid for a uniform river stretch with constant flow
characteristics. For the practical application to the Danube river and its main tributaries (see Figure
1-1), the solution has been expanded for confluences and bifurcations, taking into account the spatial
variability of the hydraulic characteristics of the river system.
The actual calculation procedure consists of two steps:
1. The calculation of the hydraulic coefficients (discharge Q(x) and velocity U(x)).
2. The calculation of the concentration C(x,t).
The hydraulic coefficients Q and U are calculated on the basis of actual hydrological input data:
observed values of either the water level or the discharge at selected hydrological stations at the time
of the accident. The DBAM uses tabulated relations between the water level and the discharge ("rating
curves") to calculate the actual discharge. In a similar way, tabulated relations between the
discharge/water level and the velocity are used to calculate the actual velocity.
Strictly speaking, the hydraulic coefficients Q and U are a function of space only. By evaluating them
at the time of the passage of the cloud for every individual river stretch, they are effectively made time
dependent.
The concentrations are computed on the basis of actual spill input data: the location of the spill and
the amount of material spilled.
The output of the DBAM is presented by animations, tables and graphs, showing the temporal and
spatial variation of the pollutant concentration and the variation along the river of the travel time of the
cloud and the peak concentration in the cloud.
The input of data as well as the presentation of the results is supported by a modern Windows-based
Graphical User Interface. (GUI).
J. van Gils, WL | Delft Hydraulics
Development and Maintenance of the DBAM
7
2.4
The accuracy of the DBAM
References: H. Hartong ea. (2000).
In order to explain the notion "accuracy" for the case of the Danube Basin Alarm Model, it is
necessary to explain some backgrounds. We will describe below which are the essential steps in the
calculation method of the DBAM, and which are the potential inaccuracies arising from each step.
Table 2-1 summarises this description .
Phase 1 of the calculation procedure is the collection of the necessary hydrology input data (water
levels and/or river discharges). In order to achieve optimal accuracy it is necessary to have accurate
hydrology and meteorology forecasts for the full duration of the pollution event. For reference, this
period lasted about 4 weeks in case of the Baia Mare spill. It is clear that it is not realistic to assume
accurate hydrology and meteorology forecasts over such a long period. The inaccuracy arising from
this step affects only the operational use of the DBAM, when it is used in a "forecasting mode". In an
analysis in "hind casting mode" with historical hydrology data, there is no inaccuracy as a result of
phase 1. This fact offers a possibility to isolate this source of inaccuracies from the remaining sources.
Phase 2 of the calculation procedure is the computation of discharges from water levels, or vice versa,
by using the built-in rating curves of DBAM. It is well-known that the concept of rating curves has its
limitations and that rating curves are not constant over time. Therefore, the use of rating curves always
adds a certain degree of inaccuracy to the result. The latest version of the DBAM allows the user to
avoid this inaccuracy by supplying both the water level and the discharge (if these data are available).
Again, this fact offers a possibility to isolate this source of inaccuracies from the remaining sources.
Phase 3 of the calculation concerns the computation of the stream flow velocity from the built-in
tables. This step presents an additional source of inaccuracy.
Finally, phase 4 of the calculation concerns the actual computation of the propagation of the cloud of
pollutants (travel time and concentrations). The fact that the DBAM has not yet been calibrated is a
possible source of inaccuracies during this last phase of the computation. It is not immediately
possible to isolate this inaccuracy from the part introduced in phase 3.
A final word needs to be said about the inaccuracy stemming from the assumptions underlying the
concepts of the DBAM. First, there is the fact that the DBAM uses a constant hydrology per river
segment ("quasi-steady"). This aspect is more relevant in hind casting mode, with full hydrology
records available, than it is in forecasting mode, when the hydrology forecasts are absent or inaccurate
anyway. Nevertheless, the current version of the DBAM allows for the input of a fully time dependent
set of hydrology data, so that the inaccuracy on this point can be minimised. A second conceptual
problem may be the assumption of 1-dimensionality, which means that no variations in the river
velocity or the pollutant concentration over the cross-section are taken into account. This problem is
always present, and should be expected to influence the results close to the spill position or close to
confluence points.
8
UNDP/GEF Danube Regional Project
Table 2-1: An overview of the sources of inaccuracy for the operational use of the DBAM.
Phase in the calculation procedure
Potential inaccuracies
1) Collection of hydrology input data during the event
Inaccuracy or even unavailability of long term
meteorological forecasts and hydrology forecasts
2) Computation of discharges from water levels, or vice
Inaccuracy of the rating curves in DBAM
versa, by using rating curves
3) Computation of river stream flow velocity, by using
Inaccuracy of the velocity tables in DBAM
built-in tables and the actual water level or river
discharge
4) Computation of the propagation of the cloud of
Inaccuracy of the calibrated model coefficients
pollutants (travel time, concentration level)
(affecting travel time and concentration) and
(affecting only concentrations)
Overall concept of DBAM
Inaccuracy
of
the
underlying
assumptions,
in
particular:
· 1-dimensional modelling approach (no variations
over the cross-section);
· quasi steady hydrology
J. van Gils, WL | Delft Hydraulics
Development and Maintenance of the DBAM
9
3
Review of existing information
3.1
The Rhine Alarm Model
References: IKSR/KHR Expertengruppe (1993).
3.1.1
The tracer experiments
The Rhine Alarm Model (RAM) performs a similar role as the DBAM in the Rhine Alarm System.
Furthermore, the RAM has the same mathematical foundation as the DBAM. Therefore, the
information with respect to the calibration of the RAM is directly relevant for the calibration of the
DBAM.
The calibration of the RAM was based on 8 large scale tracer experiments with fluorescent tracers
between 1988 and 1991. The organisers claim that tracer experiments on a similar scale had thus far
not been reported. Figure 3-1 provides an overview.
1 0
UNDP/GEF Danube Regional Project
Figure 3-1: Overview of tracer experiments carried out in the Rhine Basin.
The tracer experiments were as much as possible planned to cover a range of discharge conditions.
High flow conditions were to be avoided: they occur infrequently, which makes them less relevant,
while the river transport characteristics may deviate strongly from those under regular conditions.
J. van Gils, WL | Delft Hydraulics
Development and Maintenance of the DBAM
1 1
The tracer experiments focused on dissolved substances, since these were considered to present the
largest threat to the riverine ecosystem. They also focused on the longitudinal transport and spreading
of the tracer. Incomplete vertical and lateral mixing over the conveying part of the cross section was
not a subject of study.
Three different tracer types were considered: salt, radio nuclides and fluorescent tracers. Salt was
rejected because the background levels and the analysis sensitivity would require unrealistically high
amounts inputs. Radio nuclides were rejected because of the legal restrictions for their use.
Consequently fluorescent tracers were chosen.
Fluorescent tracers are suitable because they can be detected in very small concentrations. Three
different substances with different stability were used: Uranine (half-life time 11 h), Acid Red or
Rhodamine WT (half-life time 1300 h = 54.2 d) and Rhodamine B (half-life time 780 h = 32.5 d). For
the large-scale experiments only the latter two were used.
The tracer releases were intended to be momentaneous releases. The real duration of the discharge was
2 to 6 minutes, except for one release of Rhodamine WT where the duration was 70 minutes due to the
formation of a deposit in one of the barrels.
The amounts of tracer released, and the local discharge at the point of release are summarised below.
Experiment
Tracer used
Discharge (m3/s)
Tracer mass (kg)
MV 09/88
Uranine
712 (Rheinfelden)
235
MV 07/89
Uranine
490 (Rheinau)
200
MV 04/89
Rhodamine WT
1170 (Rheinfelden)
100
MV 09/90
Rhodamine WT
663 (Rheinfelden)
100
MV 06/91
Rhodamine WT
1820 (Rheinfelden)
100
MV 11/88
Rhodamine WT
550 (Rheinfelden)
74.5
MV 05/90
Rhodamine B
1008 (Rheinfelden)
80
MV 07/91
Rhodamine B
1722 (Rheinfelden)
80
Most of the concentration measurements were done with automatic samplers. The samples were stored
in brown coloured bottles (to avoid photolysis). Analyses took place in the laboratory, usually with
spectral fluorimeters (UV-spectrometry) following the "Synchronscan" method. This is a cheap
method. The detection limits of this method are 2 ng/l for Uranine and 6 ng/l for Rhodamine WT.
Occasional checks were done with the more accurate but also more time-consuming and expensive
HPLC method. The results of these checks matched well.
Simultaneously, in-situ measurements were carried out from ships in some cases. These did not
provide information to directly support the model calibration, but they did provide useful background
information for data interpretation. Such exercises are particularly useful to get a quick impression of
vertical and lateral concentration gradients.
The selection of the (lateral position of the) sampling sites proved critical. Based on the assumption
that the tracer mixes rapidly in the vertical and lateral direction, one would expect that this is not a
critical factor. Confluences of (large) tributaries without tracers however, may cause substantial lateral
concentration differences. Except for such occasions, the sampling was preferably done in the middle
of the river, for example using bridges or power stations.
1 2
UNDP/GEF Danube Regional Project
The experiments were organised jointly by the different institutes and agencies involved. Each
delivered manpower, sampling and analysis at its own expenses. The results were gathered and
reported in close co-operation.
The report concludes:
·
the data from the tracer experiments were very fit for purpose;
·
it is recommended to simultaneously measure the flow discharge, and especially the variation
of it during the passage of the cloud;
·
the precise determination of the local flows is even more important for river stretches affected
by dams;
·
it is recommended to follow-up the large scale tracer experiments, aimed at catching the
longitudinal dispersion, with smaller scale experiments to study lateral dispersion phenomena,
in the vicinity of the discharge and near confluences;
·
Rhodamine B should not be used anymore, due to the associated environmental risks;
·
It is recommended to carry out all analyses in one laboratory.
3.1.2
The model calibration
The RAM was calibrated on a subset of the available tracer experiments, and verified on the remaining
data.
Target parameters were (effective dead zone parameter) and (longitudinal dispersion parameter).
The parameter affects both the travel speed and the concentration levels, while the parameter only
affects the concentration levels.
The calibration consisted of two stages:
·
estimation of and over reaches between two subsequent observation points by
mathematical formulas from the observed transport time (referring to the passage of the peak
concentration) and the observed overall dispersion;
·
refinement of the estimate by formally minimising the average deviation between the
observed and the computed concentrations (that is: minimising / and /).
The calibration report mentions other sources of inaccuracy than the imperfect calibration of and ,
but no effort is made to quantify them.
The calibration circumvents the estimation of a third parameter , expressing the decay of the tracer by
re-running the model for every river stretch with the locally recovered tracer mass, with the decay of
the tracer set to 0.
J. van Gils, WL | Delft Hydraulics
Development and Maintenance of the DBAM
1 3
At the end the following conclusions are drawn:
·
values of the parameter are in the range of 0 to 0.3;
·
values of the parameter are in the range of 0.002 (for canals), to 0.01 (rivers of moderate
slope) and 0.02 (lowland rivers);
·
incomplete mixing downstream of the release point and of confluences leads to deviations
between the predicted and the observed transport time;
·
except for the first 50 to 100 km, the model reproduces the transport times typically within
5%;
·
due to the fact that the decay of the tracer has not been included in the calibration and
verification process, no estimate could be made as to the accuracy of the predicted
concentrations;
·
the shape of the clouds of pollutants could very well be represented by the model.
3.1.3
Further research
Additional work has been done on the Rhine Alarm Model, based on available records from accidents
and on regular water quality monitoring (Lorenz, 1997 and Vollstedt, 2000).
1 4
UNDP/GEF Danube Regional Project
3.2
The Danube Basin Alarm Model
3.2.1
Set-up and implementation of the AEWS, DBAM pre-study
References: WL | Delft Hydraulics (1994), WL | Delft Hydraulics (1996a), WL | Delft Hydraulics (1996b).
These references present no relevant information in the present context.
3.2.2
Implementation of the DBAM
References: VITUKI Plc, STU, ICIM, NIMH and RIZA (1996).
The first version of the DBAM was completed in 1996. This included the development of the software
and the compilation of the underlying river schematisation as well as the rating curves and the river
velocity tables.
The calibration of the model was not a part of the implementation. The model parameters were given
estimated values, derived from the experience with the RAM. However, a "tracer feasibility study"
was carried out and reported. This study consisted of separate contributions from the different
Consortium members from The Netherlands, Romania, Hungary and Slovakia.
On several occasions the authors mention the possible use of natural tracers. Concentration differences
of certain pollutants between a tributary and the main river can be used to track the lateral dispersion
process. Temporal variations of the concentration of certain parameters can be used to track
longitudinal dispersion. The latter occurs in the Rhine river due to large non-constant brine discharges.
The Hungarian section of the report mentions the possibility to in-situ measure the conductivity of the
water with sounding techniques, which is cheap, fast and reliable.
A distinction is made between large scale experiments to calibrate the longitudinal spreading and small
scale experiments to investigate specific areas (Bös-Gabcikovo, islands near Budapest, Iron Gates,
Delta, etc.) and to investigate lateral mixing. For the former a suggestion is done to cut the Danube in
two: upstream and downstream of the Iron Gates reservoir.
Suggestions are made for the locations for future tracer experiments, but it is not always clear what are
the underlying objectives and conditions.
From the report it shows that substantial experience with small scale tracer experiments exists in
Hungary and, to a lesser extent, in Slovakia. This shows among other things from the detailed
recommendations on the organisational aspects, such as the mobilisation steps listed in the Hungarian
section.
Some creative ideas of the Romanian author are worth mentioning. A suggestion is made to use floats
as an indicator of transport time (like it is routinely done in marine research). Furthermore, the idea is
formulated to use remote sensing images to analyse lateral mixing phenomena downstream of
tributary inflows. It should be investigated if such techniques have been successfully applied
elsewhere.
J. van Gils, WL | Delft Hydraulics
Development and Maintenance of the DBAM
1 5
Other aspects mentioned are:
·
the need for a permit to apply fluorescent tracers;
·
the recommendation to carry out sampling at locations inside the regular water quality
monitoring networks;
·
to treat singularities like locks, dams and barrages with special attention;
·
practical experience with the tracer sodium fluorescine (reported detection limit 0.02 mg/l).
3.2.3
Methods for calibration experiments ("project AE2")
References: Phare Environmental Consortium (1998).
This reference presents an extensive volume of work carried out in preparation to the calibration of the
DBAM. It was mainly based on the sources of information discussed above. Although a lot of valuable
information was presented by the author, this reference does not present a clear and concise synthesis
of the collected information. At present we have used the Executive Summary to identify aspects of
interests and scanned the remaining text for the necessary details.
The report presents the use of Br-82 (radioactive) and Rhodamine WT (fluorescent) tracers as proven
technology. The use of these tracers is supposed to be inhibited or complicated by environmental
legislation (not in a concrete way however, by stating that the use of tracer X violates regulation Y of
country Z). Therefore, alternative techniques are identified based on the injection of "natural tracers"
(suspended matter, biological material), remote sensing images and existing concentration gradients
(WWTP effluents). These techniques are however classified as "experimental", and their application
should be preceded by a pilot project. No clear choice is made.
The report proposes a seven step calibration procedure which is claimed to be realistic and feasible.
This procedure deviates from the one used in the Rhine Basin in the sense that it makes use of
supportive "HD-AD" models. This is motivated by cost considerations (minimizing expensive field
work) and time considerations (implementation time). The use of an alternative procedure is not
supported by an objective comparison in terms of implementation time and implementation costs
between the proven Rhine Basin approach and the suggested alternative approach. In contradiction to
the initial conclusion, the use of the proposed new approach necessitates a pilot project to investigate
the feasibility (!).
Contrary to the Rhine approach, a focus on in-situ measurements is proposed. This is probably based
on costs considerations. Again, no objective comparison is presented.
The role of the proposed supportive "HD-AD" models is twofold: (1) to plan the experiments and (2)
to avoid multiple experiments under different flow conditions.
The cost estimates presented are dominated by investment costs for the tracer experiment equipment,
which is presumably bought for the sole purpose of calibrating the DBAM.
1 6
UNDP/GEF Danube Regional Project
3.2.4
Strengthening the Danube AEWS
References: H. Hartong ea. (2000).
This project did not pay a lot of attention to the calibration aspects of the DBAM. Some preparatory
works were carried out:
·
the verification and (where necessary) correction of the rating curves and the velocity tables of
the DBAM (constituting two sources of model inaccuracy, see par. 2.1);
·
an inventory of existing 1D "HD-AD" models (following the proposed role of such models in
the calibration methodology proposed in the project AE2, Phare Environmental Consortium,
1998).
In the conclusions attention was requested for the maintenance of the rating curves and the velocity
tables of the DBAM as well as the continuous evaluation of the operational availability of the
necessary hydrology input data. Both are intended to minimise the related sources of model
inaccuracy.
Based on data collected during the Baia Mare spill event, some test computations have been carried
out with version 2.00 of the Danube Basin Alarm Model. The observed river stretches are the Somes-
Tisa on Hungarian territory and the Danube on its course along the Romanian border. From these
calculations the following conclusions were drawn:
·
The accuracy of the predicted travel times is good over longer distances: the cumulative error
is 6% for the Somes-Tisa stretch (about 600 km) and 5% for the Danube stretch (about 1000
km).
·
Looking at smaller river stretches of about 100 km, larger errors occur in the predicted travel
times: up to 25% in both the Somes-Tisa and the Danube cases. These errors are not
systematic however, over longer distances they tend to compensate.
·
The error of the predicted peak concentrations along the Tisa is between 26% and 57%. For
the Danube this aspect has not been analysed.
Some additional test computations were carried out based on the Somes-Tisa stretch, in order to get an
insight in the potential improvements from the future calibration of the DBAM. From these
calculations the following conclusions were drawn:
·
It will be possible to improve the predicted travel times drastically, by tuning the space
dependent parameter.
·
If certain river stretches turn out to need values of outside of the expected range without any
physical reason for it, it is necessary to check and if necessary improve the rating curves and
velocity tables in the DBAM.
·
It will be possible to improve the predicted peak concentrations to a large extent, by tuning the
space dependent parameter.
·
Nevertheless, one should not expect a perfect fit with respect to the predicted concentrations,
due to the conceptual limitations of the DBAM.
J. van Gils, WL | Delft Hydraulics
Development and Maintenance of the DBAM
1 7
With respect to the calibration the following recommendations were made:
·
to focus on travel times first;
·
to use as much as possible historical data from recorded spills;
·
to try to find data for different spills under different hydrological conditions;
·
not to forget the inaccuracies stemming from the use of rating curves and velocity tables;
·
to use good quality authentic field data from the responsible authorities to correct the rating
curves and velocity tables.
In addition to this, carefully planned tracer experiments can be used to fill in the gaps.
A question mark was placed at the use of 1D HD-AD models, as suggested by the AE2 project (Phare
Environmental Consortium, 1998). Particular concerns are:
·
a HD-AD model does not have any predictive power with regard to the main calibration
parameters of the DBAM ( and );
·
while a numerical HD-AD model is better in representing the full dynamics of the river flow,
it has a major drawback as compared to the analytical DBAM: it suffers from a fundamental
inaccuracy called "numerical dispersion" which is bound to seriously complicate the
calibration of dispersion-like processes;
·
both the DBAM and any hydrodynamic model are only reliable if the data behind them are
reliable: if a hydrodynamic model is available based on much better data than the DBAM,
these data can be used immediately to improve DBAM, without the intermediate step of
setting up and running the hydrodynamic model.
1 8
UNDP/GEF Danube Regional Project
3.3
Experience from the Elbe River
In the Elbe catchment the Internationalen Alarmmodell Elbe (ALAMO) is used to calculate the
transport and dilution of a cloud of pollutants in the river. To support the calibration and validation of
this model, several tracer experiments have been carried out (ao. in July and December 1997). The text
below provides relevant aspects related to the planning and execution of the July 1997 experiment.
Furthermore, some technical details about the model.
3.3.1
The July 1997 tracer experiments in the Elbe River
Reference: H. Hanisch ea. (1997).
The tracer experiment was carried out along the German part of the Elbe, between Schmilka, at the
Czech-German border and Geesthacht, upstream of Hamburg. The distance is 580 km, the overall
travel time 11 days.
The experiment was done with the tracer substance Amidorhodamine G. It was selected for different
reasons: (1) no toxicological effects were found during specific tests by the German Institut für
Wasser-, Boden- und Lufthygiene, (2) it has suitable physical characteristics (good solubility and
stability, not affected by adsorption to particles), and (3) its fluorescence does not depend on the
temperature and the pH. The literature provides a limit concentration of 100 µg/l.
The amount of tracer applied was determined as 10 kg per 100 m3/s of river discharge. The discharge
of the tracer was made from a ship traversing the river, to obtain as much as possible initial transversal
mixing of the tracer substance. Only in the immediate vicinity of the discharge (7 km downstream)
concentrations just above the limit concentration of 100 µg/l were observed. The use of this tracer was
fully satisfactory.
The density of stations was significant: 28 stations over 580 km of river stretch (average distance
between stations about 20 km).
The experiment was based on sampling and subsequent analysis of the samples. In-situ measurements
at distinct locations were used for timing the "sampling time window" at the stations immediately
downstream. The river discharge turned out to be highly variable during the period preceding and
during the tracer experiment. The estimates for the sampling windows made before the experiment
were inaccurate: the in-situ measurements were used to adapt these estimates during the course of the
experiment.
The operation of the samplers proved to be sensitive to failures and servicing. The samplers from the
upstream stations were transported to a downstream station after the passage of the cloud. This is a
way to optimise the necessary amount of equipment.
The samples were analysed by Spectral Fluorometer (Perkin Elmer) in a central laboratory.
Simultaneous measurements of the river discharge were carried out during the experiment at different
stations.
The experiment was organised within a period of 10 weeks, which was in retrospect too short.
J. van Gils, WL | Delft Hydraulics
Development and Maintenance of the DBAM
1 9
3.3.2
The ALAMO model
Reference: Presentation by W. Blohm (Appendix B).
The ALAMO model is in many respects comparable to the DBAM. The underlying mathematical
concepts are identical (paragraph 2.2). Regarding the implementation some differences exist. These
are listed below.
· The ALAMO solves the governing mathematical equations by a numerical method.
· The ALAMO does not accept an observed time series for the concentration C(t) as input (in stead
of a spill location and a spill mass).
· The ALAMO automatically retrieves its hydrology input data.
· The ALAMO includes a list of substances and relevant alarm levels.
· The ALAMO produces a spill report in ASCI format.
· The error in the predicted travel time was 4% before calibration and decreased to 2% after
calibration. This error is much smaller than that in the Rhine Alarm Model, maybe because of the
relative simplicity of the river system (few tributaries, no weirs).
2 0
UNDP/GEF Danube Regional Project
3.4
Advances in transport modelling
Recent publications indicate that the results from tracer experiments can be treated in such a way that
they can separately assess the accuracy of the velocity tables and the values of the model parameters
and (van Mazijk, pers.comm.). In the terminology of paragraph 2.4, this means that the inaccuracy
corresponding to Phase 3 of the calculation can be separated from the inaccuracy stemming from
Phase 4. This will be further elaborated in the project preparatory documents.
3.5
Specific conditions in the Danube Basin
Although the cases of the rivers Rhine and Elbe and several French rivers present successful examples
of the use of tracer experiments to calibrate models like the DBAM, the specific characteristics of the
Danube Basin should be taken into consideration:
·
natural environment: geometry (2800 km length, at least 2 major international tributaries) and
hydrology (an average of 6000 m3/s);
·
social environment: 13 countries, different languages, large differences in GDP;
·
water management infrastructure: inhomogeneous environmental legislation, possibly varying
quality of institutions and staff to organise and support tracer experiments and to analyse
samples.
J. van Gils, WL | Delft Hydraulics
Development and Maintenance of the DBAM
2 1
4
Synthesis: Calibration Options
4.1
Integrated "DBAM usability enhancement plan"
The objectives for the current project demand a solid base for the DBAM calibration and future use.
This requires that sufficient conditions are created to optimise the accuracy of the DBAM.
Furthermore, this requires that the DBAM is properly maintained.
4.1.1
Accuracy of the DBAM
The accuracy of the DBAM depends on more than just an accurate calibration of the model parameters
and . Table 4-1 lists some conditions to ensure optimal model performance (see also paragraph 2.4).
Table 4-1: An overview of the conditions for optimal accuracy of the DBAM.
Phase in the calculation procedure
Conditions for accuracy
1) Collection of hydrology input data during the event
Actual hydrology data for the stations included in the
DBAM can be obtained under conditions of use.
2) Computation of discharges from water levels, or vice
Rating curves in DBAM are accurate.
versa, by using rating curves
3) Computation of river stream flow velocity, by using
Velocity tables in DBAM are accurate.
built-in tables and the actual water level or river
discharge
4) Computation of the propagation of the cloud of
DBAM is properly calibrated.
pollutants (travel time, concentration level)
Overall concept of DBAM
Underlying assumptions affecting the model accuracy
are well understood, in particular:
· 1-dimensional modelling approach (no variations
over the cross-section);
· quasi steady hydrology
As a part of the present project, the Consultant also intends to make recommendations related to
aspects 1), 2) and 3) from Table 4-1. This implies that somehow arrangements must be made to
periodically verify the operational accessibility of the necessary hydrological input data as well as to
periodically check the DBAM rating curves and velocity tables. The Workshop participants are
requested to provide the necessary input to draft these recommendations.
2 2
UNDP/GEF Danube Regional Project
4.1.2
Maintenance of the DBAM
To ensure the sustainable and efficient use of the DBAM, maintenance provisions should be in place,
which could for example consist of:
· Archiving of software, data and documentation;
· Distribution of software, data and documentation;
· Upgrades of software and documentation for new platforms (Windows 2000, Windows XP).
· Functional upgrades of software.
· Regular upgrades of hydrology stations, rating curves and velocity tables (see 4.1.1).
As a part of the present project, the Consultant intends to make recommendations in this respect. The
Workshop participants are requested to provide the necessary input to draft these recommendations.
4.2
Scope and objectives of the DBAM calibration exercises
Since the Rhine Alarm Model (RAM) is based on identical principles as the DBAM, the calibration of
the RAM presents a very relevant example. For the calibration of the RAM, a hierarchic set of
objectives was defined:
· In view of the trans-boundary use of the model, to first focus on the main river and the large
international tributaries, in order to properly evaluate the longitudinal dispersion.
· To follow up with detail studies, directed towards river anomalies (locks, weirs, dams, reservoirs)
and lateral dispersion phenomena (vicinity of the discharge, confluences).
It should be confirmed by the Workshop participants that this approach is also suitable for the Danube.
As a next step, this should be made more concrete: which international tributaries will be part of the
calibration exercises? In view of the possible budget and time restrictions, different classes of priority
could be distinguished.
4.3
Existing data or additional tracer experiments?
Carrying out tracer experiments on the scale of the Danube River is a costly exercise. A very relevant
question is to what extent existing data can be used to evaluate and calibrate the longitudinal
dispersion of pollutants in the Danube and its main tributaries.
Two types of existing data can be used:
· Records from accidental spills.
· Continuous records of the water quality, related to parameters showing distinct temporal gradients
(see for an example Figure 4-1).
J. van Gils, WL | Delft Hydraulics
Development and Maintenance of the DBAM
2 3
Figure 4-1: Example of continuous concentration records showing strong temporal gradients. The chlorides concentration at
Lobith (Rhine river, border Germany-The Netherlands) shows a strong increase near the end of August 1991.
This increase arrives at Hagestein (Lower Rhine river, about 80 km downstream of Lobith with several weirs
in between) around half of October. This information has been used to calibrate and validate the Rhine Alarm
Model on this particular stretch.
The following information should be available (for both types of data):
· The concentration as a function of time at 2 or more locations.
· The necessary hydrology data as a function of time at all DBAM hydrology stations along the river
stretch of interest. The frequency should be daily at least.
The Consultant needs to be able to judge to what extent existing data could be used for calibration
purposes. The Workshop participants are requested to provide the necessary input. They will have to
do so in the period before the actual workshop, or in the period immediately following the workshop.
2 4
UNDP/GEF Danube Regional Project
4.4
Set-up of additional tracer experiments
4.4.1
Selection of tracer substance
Different (types of) tracers can be considered in regard to the set-up of additional experiments.
Table 4-2 provides some options, with their respective advantages and disadvantages.
Table 4-2: Overview of different types of tracer substances.
Type of tracer
Advantage(s)
Disadvantage(s)
Salt
Low ecological impact
Extremely high dosage required to
significantly exceed background
Low price
level (> 10 mg/l).
Radio nuclides
High sensitivity (detection possible
Legal restrictions (?)
at very low concentrations)
Proven technology (?)
Possibility of in-situ analysis (?)
Fluorescent tracers
Proven technology
Possible adverse ecological
impacts.
Relatively high sensitivity
(detection possible at low
Legal restrictions (?)
concentrations)
Possibility of in-situ analysis
Other natural tracers (suspended
Low or no ecological impact
Experimental (feasibility study
matter, biological material)
required)
The Workshop participants are requested to provide the necessary input for selecting the most
appropriate option. Especially relevant are the relevant legal restrictions which apply in the different
Danube countries.
4.4.2
Sampling and analysis
The tracer experiments in the Elbe and the Rhine rely on the collection of samples and a subsequent
analysis in the laboratory. Two contradicting requirements/recommendations exist with respect to the
sampling and analysis:
· it is necessary to analyse the samples rapidly, in view of the ongoing decay of the tracer material;
· It is recommended to carry out all analyses in one laboratory.
J. van Gils, WL | Delft Hydraulics
Development and Maintenance of the DBAM
2 5
Considering the large size of the Danube and its major trans-boundary tributaries, this may lead to two
alternative approaches:
"Central" approach
"Decentral" approach
Collect samples from the whole experiment and
Collect samples from limited river stretches and
transport to one central laboratory for analysis
transport to several laboratories for analysis (e.g. one
per country)
Transport times tend to become higher (crossing
Transport times will be lower
borders critical)
Comparability of results optimal
Comparability sub-optimal, can be mitigated by
analysing "border samples" in two laboratories
The Workshop participants are requested to provide the necessary input for selecting the most
appropriate option.
4.4.3
Selection of stations and observation windows
From the existing experience it follows that two aspects are very important:
· The stations should not be too close to river anomalies or large tributary inflows.
· For reasons of efficiency the "observation window" should be carefully selected. The DBAM in its
present form could be used for that purpose, allowing for a 10-20% error in the propagation time
of the cloud. In-situ observations could be used to check and possibly correct the observation
windows during the experiments (as in the July 1997 Elbe experiment).
Alternative approaches can be distinguished with respect to the station density:
High density of stations
Low density of stations
Typical distance between subsequent stations << 100
Typical distance between subsequent stations > 100
km
km
Spatial variation of calibration parameters well
Spatial variation of calibration parameters not so well
resolved
resolved
Smaller number of tracer experiments for the same
Higher number of tracer experiments for the same
budget, so less opportunities to check DBAM at
budget, so more opportunities to check DBAM at
different flow regimes
different flow regimes
Smaller number of tracer experiments for the same
Higher number of tracer experiments for the same
budget, so less opportunities to check DBAM along
budget, so more opportunities to check DBAM along
different tributaries
different tributaries
2 6
UNDP/GEF Danube Regional Project
From prior experience we know that the spatial variability of the calibration parameters can well be
derived from general river characteristics. It is probably more effective to check the quality of the
built-in rating curves and velocity tables at different flow regimes or along different tributaries. This is
an argument in favour of the low density of stations approach.
The Workshop participants are requested to provide the necessary additional input for selecting the
most appropriate option.
4.4.4
Collection of hydrology data
A very clear recommendation from earlier exercises is the complete collection of the relevant
hydrology data. The water levels and/or river discharges data should be obtained as a function of time
at all DBAM hydrology stations along the river stretch of interest. The frequency should be daily at
least. It should be emphasised that without this information the execution of tracer experiments is
useless.
The Workshop participants are invited to provide the necessary recommendations to guarantee the
availability of the necessary hydrology data.
J. van Gils, WL | Delft Hydraulics
Development and Maintenance of the DBAM
2 7
5
Preparation of the Workshop
The main questions raised in the Synthesis above have been addressed during a dedicated Workshop.
This workshop has been attended by the APC/EG members, which represent the beneficiaries of
present project: the 13 member countries of the ICPDR (see Appendix C).
The short term objectives of this Workshop were dual: to (1) ensure sufficient understanding of the
DBAM and its calibration procedure with the APC/EG members, and (2) to obtain input from the
participants to complete the preparation of the calibration of the DBAM.
An additional medium term objective is to ascertain the support from the APC/EG members for the
calibration and future use of the DBAM.
The workshop consisted of different parts:
· Explanations: (a) DBAM principles, and (b) factors determining the accuracy of the DBAM;
· Elaborations: (a) DBAM usability enhancement, (b) scope and objectives, (c) existing data vs.
additional experiments, and (d) set-up of additional experiments;
· Evaluations: formulation of conclusions and recommendations of the remainder of the project.
Part 1 was presented by the Consultant, while the parts 2 and 3 have been elaborated by the Workshop
participants, facilitated by the Consultant and the UNDP/GEF project staff.
Appendix A provides the Draft Agenda of the Workshop, which was accepted without modifications
and followed without major changes.
Separately the Consultant has prepared the required Templates for Planning, Organising,
Documentation and Evaluation of Workshops (Nauheimer, 2002).
Appendix B provides the relevant presentations used during the Workshop, prepared by the Consultant
and by Dipl.-Ing. Werner Blohm (Hamburg, Institut für Hygiene und Umwelt), who was invited to
present some aspects of the use of the Elbe alarm model ALAMO.
2 8
UNDP/GEF Danube Regional Project
6
Recommendations for follow-up
(Workshop Report)
The present chapter presents the conclusions and recommendations which were formulated during the
Workshop by the participants. The chapter follows the structure presented in the Calibration Options
Chapter 4. First, the availability and the utilisation of the DBAM will be discussed. This discussion
will provide the necessary conditions (including the necessary maintenance arrangements) for any
calibration exercise to be successful. Next, the specific aspects of a future calibration action will be
outlined.
Since the Workshop followed exactly the same agenda as the lay-out of the present chapter, this
chapter can be read as the Workshop Report.
Although it was not a primary subject of the Workshop, some extensions of the present DBAM
functionality were suggested. For the sake of completeness, they are listed in Appendix F. It should be
noted that these suggestions are not necessary preconditions for the future use of the DBAM.
6.1
Availability and utilisation of the DBAM
6.1.1
Current status
Preceding the workshop, an inventory was made by the APC/EG member György Pinter of the current
status with respect to the availability and utilisation of the DBAM. The inventory is included as
Appendix D to this report.
The inventory reveals that few Principal International Alert Centres (PIACs) are actually using the
DBAM. The reasons for this are:
· Unavailability of the software;
· installation problems;
· running problems.
Both the installation and running problems are caused by the fact that the latest DBAM version
(2.00.02, October 2000) is not suited for use on modern Windows-based platforms like Windows 2000
and Windows XP.
There was agreement between the participants that the first problem should be solved by distribution
of the latest version of the software through Danubis. The latter two problems should be tackled by
making adequate maintenance provisions (Appendix E contains draft ToR for such provisions).
6.1.2
Target accuracy of the DBAM
During the Workshop, the present accuracy of the (uncalibrated) DBAM was discussed, as well as the
factors which determine its accuracy (see paragraph 2.4). A relevant question is how accurate the
DBAM should be, in view of its role in the AEWS.
J. van Gils, WL | Delft Hydraulics
Development and Maintenance of the DBAM
2 9
The Workshop participants agreed that the target accuracy in the prediction of the travel time of a
cloud of pollutants should be a 5% (relative error). This value is equal to the reported accuracy of the
Rhine Alarm Model after calibration. The Elbe model is reported to be more accurate, most probably
due to the fact that the Elbe is a simpler river to model: it is a natural river without bifurcations and
parallel stretches.
No concrete value for the accuracy of the predicted peak concentration was discussed. The Rhine
Alarm Model was not calibrated on this particular aspect. In stead, the calibration targeted at
prediction the right shape of the cloud of pollutants. Of course, this would indirectly guarantee the
correct prediction of the concentrations if the spill mass and the decay rate of the spilt substance are
known. Since it is in practice very hard to obtain reliable estimates of these numbers, it is hard to set
targets for the accuracy of the predicted concentrations. Our expert opinion is that an error by a factor
of 2 is probably the best achievable accuracy under operational conditions.
6.1.3
Hydrology data
The availability of hydrology data under operational conditions is an important factor affecting the
accuracy of the DBAM. During the Workshop different questions were discussed:
· What is current practice in collecting hydrology data?
· Is there any transfer of this information between the countries?
The PIACs mostly use only the hydrology data from their own country. Exchange of data is arranged
on an ad-hoc basis through personal contacts and/or through the AEWS system. The representative of
Slovenia reported this as being unsatisfactory: the travel time of the river demands a faster means of
data exchange.
· Is there an organisation collecting these data on a Danube wide scale?
· To what extent could this information be collected from the Internet?
To the knowledge of the Workshop participants, there is no organisation collecting the data at the
Danube scale. The Internet only provides part of the necessary data.
· Is it possible to use predefined hydrology conditions files for operational use of the DBAM?
(high-low-medium flow situation)
The participants to the Workshop judged that this was definitely a valuable approach. This allows the
PIAC staff to carry out an approximate assessment plus sensitivity analysis without any data at all.
The participants agreed that the ultimate solution will be that all PIACs can access the necessary data
via the internet directly. Where such data are not public, the PIACs should obtain access rights for
AEWS purposes only (all PIACs should be issued passwords to the websites of the
Hydrometeorological Institutes in the basin).
3 0
UNDP/GEF Danube Regional Project
This should be realised in two steps:
· At the technical level it should be formulated exactly what information is needed from what
source. Any technical optimisations should be carried out at this stage.
· At the political level, a request for these data to be made available should be submitted to the
Heads of Delegation.
It should be noted that an effort as specified under (1) has been carried out in 2000 (Hartong, 2000).
6.1.4
Rating curves and velocity tables
The accuracy of the DBAM built-in tables is yet another important factor affecting the accuracy of the
DBAM. Therefore, the maintenance of these tables was jointly recognised as a precondition for the
sustainable use of the DBAM.
The national Hydrometeorological Services in the Danube countries are in most cases the owners of
the data in the DBAM tables. Therefore, these institutions should also maintain them. Table 6-1
provides a brief overview. For details, we refer to (Vituki, 1996).
Table 6-1:
Overview of institutes owning the data supporting the DBAM built-in tables.
Country
Institute
Hungary
Vituki
Croatia
Croatian Waters/ State Hydrometeorological Institute
Serbia and Montenegro
Hydrometeorological Institute
Bulgaria
Institute of Hydrology and Meteorology
Romania
Hydrology and Water Management Institute (Romanian Waters)
Slovakia
Slovak Hydrometeorological Institute
Czech Republic
Czech Hydrometeorological Institute
Slovenia
Environmental Agency of Slovenia
It was agreed that the APC/EG members will have the responsibility to liaise with these services and
obtain updated information on a regular basis. The "central level" (ICPDR/DRP) will be responsible to
archive the data and provide upgrades of the DBAM based on this new data.
The built-in tables from the existing version should be made available on Danubis.
J. van Gils, WL | Delft Hydraulics
Development and Maintenance of the DBAM
3 1
6.2
Future calibration of the DBAM, supported by tracer
experiments
6.2.1
Current status
The pre-calibration accuracy of the DBAM was discussed on the basis of the evaluation of the Baia
Mare incident (Hartong, 2000). The accuracy of the predicted travel time of the cloud over longer
distances is quite satisfactory: a relative error of 5% (500-1000 km). Over shorter distances however,
the errors are significantly larger (up to 25%). This is clearly insufficient.
The participants rightly point at the validity of the underlying model concepts and the reliability of the
data input data as inherent factors limiting the accuracy of the accuracy of the DBAM under
operational conditions. The future calibration efforts will have to be organised in such a way that these
factors are eliminated as much as possible. This will be elaborated below.
6.2.2
Scope and objectives (including priorities)
The Workshop participants discussed the scope and objectives for the future DBAM calibration.
Below, the main conclusions are formulated.
Apparently, the DBAM and therefore also the future calibration focuses on transboundary rivers.
Given the scale of the basin, it is considered infeasible to carry out a basin-wide calibration exercise
initiated from the central level. Such an approach is infeasible both from a technical and from a
political point of view.
In stead, it is advised to carry out the future calibration on the basis of local initiatives by a limited
number of Danube states ("bottom-up" approach).
The prioritisation of the areas for calibration should be based on different considerations. The first
aspect is the presence of hot spots (sites of high potential risk for accidental spills). An inventory of
such sites is already available. A second aspect is the presence of areas with sensitive water uses. An
inventory of such areas is expected to be available at the end of 2004. On the basis of the above
considerations, the Workshop participants agreed on a number of concrete proposals, including a
prioritisation. Table 6-2 gives an overview.
Table 6-2:
Overview of priority areas for model calibration.
Area
Priority
Sava basin (co-operation with Sava initiative)
1
Upper Tisa (Spill in Uh, followed till inflow of Zagyva)
1
Middle Danube (water intake Budapest)
2
Lower Danube (joint Romanian-Bulgarian border stretch)
2
Drava
2
Prut
3
3 2
UNDP/GEF Danube Regional Project
6.2.3
Existing data or new experiments?
The Workshop participants agreed that available existing data should be used in the future calibration
of the DBAM. The following information should be available (for both types of data):
· The concentration as a function of time at 2 or more locations.
· The necessary hydrology data as a function of time at all DBAM hydrology stations along the
river stretch of interest. The frequency should be daily at least.
An inventory of such data based on information provided by the participants is given in Appendix G..
6.2.4
Selection of tracers
Regarding the selection of tracers for possible future experiments in the Danube basin, two guiding
principles were agreed upon during the Workshop:
· Permitting is a major issue. The Phare Environmental Consortium (1998) has made an inventory
of relevant legislation. Appendix H provides an actualised overview.1
· Only proven technology should be used.
The use of salt may be an interesting option for smaller rivers. The Hungarian representative in the
APC/EG indicated that on the Sajo river a planned intermittent large discharge of chlorides can be
used as a tracer experiment.
Appendix I provides guidelines on the tracer mass to be applied for a river with given physical and
hydrological characteristics, in relation to the detection limit of the tracer substance in question and the
maximum allowable concentration (MAC). These guidelines can be used to minimise permitting
problems.
6.2.5
Sampling and analysis
The participants agreed that the selection of a central or decentral sampling and analysis strategy is to
be made separately for every individual experiment. In the case of a decentral approach, a preparatory
intercalibration programme between candidate institutes should be included in the project plan.
The APC/EG experts indicated that the comparability of the results from different laboratories should
not present a major problem in the case of fluorescent tracers, since the analysis is simple.
6.2.6
Density of stations
The participants agreed that the density of stations should be decided separately for every individual
experiment. Small fast flowing rivers need a higher density than larger rivers. Local knowledge should
a decisive factor in this respect.
1 Recently, BASF has conducted tracer experiments in theRhine with Na-24-Acetate, a radio nuclide.
Apparently, there is room for such experiments in the German legislation.
J. van Gils, WL | Delft Hydraulics
Development and Maintenance of the DBAM
3 3
Decisions about the position of sampling in the cross section should be made consciously: either cross
sections where incomplete mixing is expected should be avoided (as during the Rhine experiments), or
samples should be taken at different positions, as in the Transnational Monitoring Network TNMN
(Left-Middle-Right).
It should be noted that during the Elbe tracer experiment, initial lateral mixing was obtained by
releasing the tracer from a ship traversing the river.
6.2.7
Frequency of sampling
The participants agreed that the frequency of sampling should be decided separately for every
individual experiment. Small fast flowing rivers need a higher frequency than larger rivers. Based on
the mathematics of the DBAM a rule of thumb can be established (Appendix J).
6.2.8
Hydrology data
The Workshop participants agreed that the complete collection of the relevant hydrology data is a
necessary condition for every tracer experiment. The water levels and/or river discharges data should
be obtained as a function of time at all DBAM hydrology stations along the river stretch of interest.
The frequency should be daily at least.
6.2.9
Organisation and financing
Regarding the organisation of future tracer experiments, the participants agreed that a decentral
approach is the most appropriate. The necessary activities should as much as possible be carried out
and financed by the participating countries. The central level would have a purely supportive role,
which consists of:
· Initiating activities.
· Organisational support.
· Methodological support.
With respect to the last aspect, Appendix K provides the outline of a calibration manual.
3 4
UNDP/GEF Danube Regional Project
7
Epilogue
The present report describes the conditions and activities which are supposed to provide a technically
sound basis for the DBAM calibration (during Phase 2 of the Danube Regional Project) and for the
future use of the model.
This was achieved by a stepwise approach:
· The formulation of options and alternatives, on the basis of relevant literature and existing practice
from the Danube basin.
· An in-depth discussion with the stakeholders during a Workshop.
· The formulation of conclusions and recommendations.
By following this approach, some necessary preconditions were created to ascertain the support from
the APC/EG members for the calibration and future use of the DBAM. In particular the Workshop
served to ensure sufficient understanding of the DBAM and its calibration procedure from the side of
the APC/EG members, and to make sure that the knowledge and views from the APC/EG members
was optimally used for the formulation of conclusions and recommendations.
Concrete actions need to be taken in order to ascertain the future use of the model. In the first place,
the distribution of the software should be better organised and a provision for maintenance and support
should be created. In the second place, the accuracy of the model should be improved. This should be
achieved in two steps:
1. Data collection step:
the gathering of existing data and the creation of new data by means of tracer experiments.
2. The calibration of the DBAM, based on the collected data.
Chapter 6 provides the necessary guidelines in relation to the distribution and maintenance and support
of the DBAM. Furthermore, Chapter 6 provides guidelines on the collection of data, including a
concrete proposal of "pilot areas" for tracer experiments. Appendix K provides an outline of the
Calibration of the DBAM.
J. van Gils, WL | Delft Hydraulics
Development and Maintenance of the DBAM
3 5
8
References
D. Dimitrov (2000a): Report of the chairman of the AEPWS Expert Group to the 4th Steering Group Meeting of the ICPDR,
March 2000
D. Dimitrov (2000b): Report of the chairman of the AEPWS Expert Group to the 5th Steering Group Meeting of the ICPDR,
August 2000
Expert Unit PIAC-05 (2000): Summary report on the operation of the Danube Accident Emergency Warning System in
Hungary during the cyanide pollution of the Szamos and Tisza rivers, Budapest 16 February, 2000.
H. Hanisch, F. Specht and R. Eidner (1997): Planung und Durcgführung des 1. Tracerversuchs Elbe. Deutsche
Gewässerkundl. Mitt., Bd. 41, Heft 5, pp. 212-215.
H. Hartong and J. van Gils (2000): Strengthening Sustainability of Water Quality Management in the Danube Basin,
Component III: Strengthening the Danube Accident Emergency Warning System. Phare project ZZ-97-25. Final
Report, October 2000.
Holger Nauheimer (2002): Quality Guidelines for Training and Consultation Workshops. UNDP/GEF Danube Regional
Project. November 2002.
IKSR/KHR Expertengruppe (1993): Alarmmodell Rhein: Ein Modell für die operationelle Vorhersage des Transportes von
Schadstoffen im Rhein. Bericht Nr. I-12 der KHR, 1993, ISBN 90-70980-18-5.
Lorenz (1997): Accidental Spill modelling for the weired Lower Rhine, Natalie Lorenz, M.Sc. Thesis, Delft University of
Technology, Civil Engineering Faculty, December 1997 (in Dutch).
Phare Environmental Consortium (1998): Environmental Programme for the Danube River Basin, Project AE2: "Calibration
of DBAM model" Methods for Calibration Experiments, Carl Bro International als. Denmark, Final Report, June
1998. Project No.85.3200.17, OSS No. 97-5278.00.
VITUKI Plc, STU, ICIM, NIMH and RIZA (1996): Applied Research Programme of the Environmental Programme for the
Danube River Basin. Development of a Danube Alarm Model, Version 1.00, Final Report, Project EU/AR/303/91,
Budapest,September 1996. Volumes: Final Theoretical Reference Manual, Final System Reference, Final Users
Manual, Final Data Report.
Vollstedt (2000): Analysis and Evaluation of the 2D module of the Rhine Alarm Module, Bericht Nr. II-16 der KHR, 2000,
ISBN 90-36953-55-3.
WL | Delft Hydraulics (1994): Environmental Programme for the Danube River Basin, Accident Early Warning System, Set-
up of system, Q1683, September 1994.
WL | Delft Hydraulics (1996a): Environmental Programme for the Danube River Basin, Implementation of Danube AEWS ,
Final Report, Delft, The Netherlands, March 1996.
WL | Delft Hydraulics (1996b): Environmental Programme for the Danube River Basin, Danube Basin Alarm Model. Pre-
study. Final Report, Delft, The Netherlands, February 1996.
WL | Delft Hydraulics (2002): UNDP-GEF Danube Regional Project, Development and maintenance of the Danube Basin
Alarm Model (Project Activities 2.3-4), Inception Report, Delft, The Netherlands, December 2002.
Development and Maintenance of the DBAM
A 1
A
Draft Workshop Agenda
Date:
9-10 September 2003.
Place: Ljubljana, back-to-back with a regular APC/EG meeting.
9 September 2003.
14.00h Welcome DRP project staff.
14.15h Introduction to the project \ Workshop agenda Jos van Gils
14.30h Availability and utilisation of the DBAM APC/EG Representative
15.00h Discussion
15.30h Break
16.00h Conclusions and recommendation w.r.t. availability and utilisation of the DBAM, implications
for the DRP APC/EG Representative, DRP Staff
16.30h History and principles of the DBAM Jos van Gils
17.00h The Rhine and Elbe examples Werner Blohm, Jos van Gils
18.00h End of meeting
10 September 2003.
Discussion on specific aspects related to the calibration and future use of the DBAM.
Every item is introduced by Jos van Gils, and subsequently discussed. For every aspect a seperate
chairperson and reporter will be chosen by the group. The reporter will summarise the discussion. Jos
van Gils will draft the Minutes. Coffee breaks will be inserted at an appropriate time. Tentative time
schedule:
9.00h Factors affecting the accuracy of the DBAM, role of calibration (illustrated by the Baia Mare
case)
9.30h
DBAM usability enhancement
9.45h
Scope and objectives of the calibration
10.15h Availability of existing data and need for additional experiments
A 2
UNDP/GEF Danube Regional Project
11.15h Selection of tracers (including possible presentation of IAEA representative)
12.30h Lunch break
14.00h Sampling and analysis
14.45h Density of stations
15.30h Hydrology data
16.00h Closing remarks
16.30h End of meeting
J. van Gils, WL | Delft Hydraulics
Development and Maintenance of the DBAM
B 1
B
Workshop presentations


Development and maintenance of the DBAM
Danube Regional Project, activity 2.3-4
Consultant: Jos van Gils
Delft Hydraulics
Objectives of this project activity
To provide a technically sound basis for
the calibration of the DBAM (during Phase II of the DRP)
and for the future use of the model
1


Activities and products
· Calibration options report
· Preparation of workshop with APC, UNDP-GEF team, ICPDR
representatives and invited guest:
· experiences from other basins (Rhine/Elbe)
· presentation of options for calibration approach
· selection of best alternatives
· Elaboration of preparatory documents along the lines laid
out during the Workshop:
· draft project brief and ToR's for Phase II
· calibration manual
· recommendations
Calibration options report
· Backgrounds, history
· Short description of the DBAM
· Sources of inaccuracy, some reduced by calibration
some not
· Review of existing information
· Rhine
· Elbe
(both cases: calibration based on tracer experiments)
· Specific conditions in the Danube Basin
· Synthesis: main options and decisions to be made
Input for present Workshop
2


Workshop
Objectives
Basic rules
Agenda
Roles and responsibilities
Objectives
· reach agreement about what is necessary to achieve
project goals
(technically sound basis for calibration and future use)
· reach agreement on how this can be done best
3


Basic rules
.. to be agreed ..
Draft Agenda (part 1)
· Welcome, introduction and agenda
· Availability and utilisation of the DBAM:
· summary of input from APC/EG members
· discussion
· conclusions and recommendations
· Introduction to the DBAM and its history
· Experience from Rhine/Elbe basins (external expert)
4


Draft Agenda (part 1I)
· Factors affecting the accuracy of the DBAM
· Specific calibration options
· explanation
· discussion
· conclusions
· Closure
Specific calibration options
· Scope and objectives of the calibration
· Availability of existing data and need for additional
experiments
· Selection of tracers
· Sampling and analysis
· Density of stations
· Hydrology data
· Organisational aspects
Any comments, amendments??
5

This workshop
Role of Consultant:
1. Provide background information before discussions
2. Either record output from the participants
or
Chair the discussions
Not both!
Proposal:
participants will nominate chairpersons or reporters among
themselves
6


Introduction to the DBAM and its history
Consultant: Jos van Gils
Delft Hydraulics
Objectives
predicting the travel time of a cloud of pollutants released in
the river system as the result of an accidental spill
predicting the concentration in this cloud as a function of
space and time
Boundary conditions:
· large scale events of a trans-boundary nature
· first and rapid assessment under operational conditions
(the run-time should be short and the necessary input data
should be limited)
1


Main features
1D approach (suitable for large scale events)
Mathematical "dead zone" model, like Elbe, Rhine, French
rivers, etc.
Tiszasziget
Typical "tail"
1.6
1.4
1.2
1
0.8
0.6
0.4
0.2
0
11/02/2000
12/02/2000
13/02/2000
2


Main features
"Analytical" solution technique is applied (direct expression of
C(x,t))
· efficient
· accurate
Full mathematical description in the Calibration Options
Report (par. 2.2) and references therein
Option to include some 2D effects
· lateral distribution of C
· effect on distribution of mass over bifurcations
Q
Spill
3


1D Analytical solution
C = function of:
· spill mass M
· river discharge Q
· stream velocity V (averaged over cross-section)
· ratio of cross-section in dead zones and cross-section in
main stream
· river width W
· longitudinal dispersion parameter
· decay rate k of pollutant
Hydraulic parameters
Hydraulic parameters: C(x,t) = function (...,Q,V,W,...)
· discharge Q
· velocity V
· width W
Derived from actual hydrological data (gauge readings,
observed discharges) by means of built-in tables:
· Q(H)
· V(H) or V(Q), W(H) or W(Q)
Limited accuracy but a spill event has a duration of many
days, and how accurate are hydrological forecasts?
Constant per river reach (quasi-steady)
4


Main features
Graphical User Interface
· input of data
· presentation of output
· archiving
Input
· spill mass
· spill location
· (optional: position in cross-section L/M/R)
· spill time
· instantaneous
· distributed over certain period
· C(t) at spill location
· (optional) decay rate
· (optional) floating substance
· water level and/or discharge at relevant hydrological
stations
5


Output
· C(t) at predefined stations, graph and table
· animation in map
· C(t) at location selected from the map, graph and table
(resolution about 5 km)
· Cmax along the river, graph and table
· time of Cmax along the river, graph and table
History
Pre-study (1996):
· specifications
Implementation (1996):
· first version of software
· model parameters were given estimated values
· "tracer feasibility study"
Phare Environmental Consortium (1998):
· Methods for Calibration Experiments
6

History
Strengthening the Danube AEWS (2000):
· second version of software
· verification of built-in tables
· inventory of 1d HD/AD models (as recommended in
"Methods for Calibration Experiments")
· evaluation of accuracy on Baia Mare spill
· recommendations for calibration, maintenance
All these references have been discussed in the Calibration
Options Report
7


Rhine example
· (Much) smaller basin, (much) less countries, different
organisational and economical conditions
but
· Similar "alarm system"
· Similar "alarm model"
· Calibrated on 8 large scale experiments between 1988 and
1991
1


Rhine Alarm Model
Use of the Rhine Alarm Model
· User Group, which meets regularly (low frequency)
· permanent Support Group (representatives of member
states), which provides
· user support
· technical supervision
· specific modifications and upgrades by consultant
2


Tracer experiments in the Rhine
Scope and objectives
· focus on large spatial scale
· longitudinal transport on the main river
· dissolved substances
· with follow-up studies for details
· tributaries
· locks, weirs, dams, reservoirs
· lateral dispersion phenomena
3


Existing data or new experiments?
Tracer experiments constituted the "backbone" of the
calibration.
Existing data have been used later in a supportive role, to
verify the model and to solve detail questions.
Data used:
· accidental spills
· variable chloride concentration
Tracer
· Different fluorescent substances (salt and radio nuclides
were rejected)
· 75 to 235 kg per experiment
· Dispersed within 2 to 6 minutes
· Preference for Rhodamine WT (stable, relatively low
ecological risk)
4


Sampling and analysis
· automatic samplers
· brown bottles (to avoid photolysis)
· UV-spectrometry (cheap Synchronscan-method)
· Checks with expensive HPLC method
· Different laboratories
Selection of stations / "observation windows"
· Average distance between stations < 100 km
· Determination of "observation window" unknown
· Lateral position of stations importance (confluences!),
usually in the middle of the river from bridges or other
structures
5


Hydrology data
Several experiments under different hydrological conditions
(no floods!)
Recommendation to collect as many discharge data as
possible
Organisation
· jointly by involved institutes and agencies
· all participants paid their own costs for manpower,
sampling and analysis
6


EASE
EASE
Is a Project of
Commissioner
· German Federal
Environmental Agency
Contractor
· Institute for Hygienic
and Environment
Free and Hanseatic City of Hamburg,
Environment and Health Department
· In assistance with the
IKSE
EASE
EASE* (Re-) Introdution
·Project EASE:
"Development of Alarm Criteria
and Detection of Major Incidents
in Monitoring Stations located
in the Elbe Catchment Area for
International Emergency Planing"
* EASE is the short form for the german title of the project. We
want to ease the alarm and trouble recognition!
1
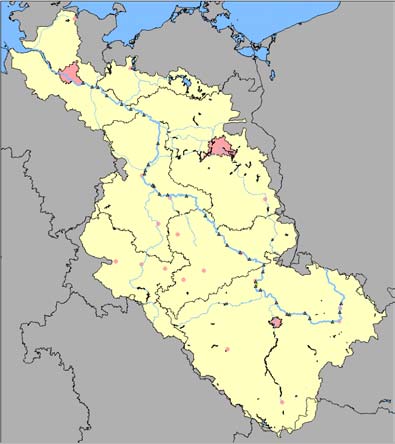
EASE
Alarm model Elbe ALAMO
EASE
Alarm model Elbe ALAMO
Elbe catchment
area
Source
North Sea
Hamburg
Berlin
Praha
2
EASE
Alarm model Elbe ALAMO
· A Simulation software ALAMO
· ALAMO serves as a model for
forecasting the propagation of
pollutants in the Elbe
EASE
Main factor to the course of
the pollutant wave
· Water levels
· Amount of discharge
· Discharge point
· Discharge time
· Next Alamo demonstration ...
3
EASE
ALAMO
Course of the pollutant wave
At different places
EASE
ALAMO
Alarm threshold
Course of the pollutant wave
Maximum concentration
4


EASE
Assessment of major incidents
Agent Discharge *[µg/l] Distance [km]
WRC
56 82 108 154 214 259 290 332 388 454 484 504 536 559 585
discharge
Diethylamin
min 1000
1 mean 1000
10.000
max
1000
Terbutylazin min 50
2 mean
50
1.000
max
50
Atrazin
min 34
2 mean
34
1.000
max
34
Nitrobenzol
min 10
2 mean
10
1.000
max
10
Etrimphos
min 0,4
3 mean
0,4
100
max
0,4
Trichlorfon
min 0,2
3 mean
0,2
100
max
0,2
Dichlorvos
min 0,06
3 mean 0,06
100
max
0,06
* Alert level
EASE
Assessment of major incidents
Alarm thresholds (draft) derived from quality standards according to WFD:
The Alarm threshold for major incidents is calculated using the qualitiy standard (QS)
from the wfd muliplied with a factor. In this example the factor is set to 100
Alarm threshold (= quality standard * 100):
Pollutants with QS > 1 µg/l
: 100 µg/l
Pollutants with QS > 0,1 µg/l
: 10 µg/l
Pollutants with QS > 0,01 µg/l
: 1 µg/l
Pollutants with QS > 0,001 µg/l
: 0,1 µg/l
Pollutants with QS > 0,0001 µg/l
: 0,01 µg/l
Water Discharge
Distance to fall below the alarm threshold
level
quantity
for major incidents
[mł/s] [kg]
[km]
100 µg/l
10 µg/l
1 µg/l
0,1 µg/l
0,01 µg/l
2000 1
< 1
< 1
< 1
ca. 10
ca. 100
2000 10
< 1
< 1
ca. 10
ca. 100
ca. 1.000
2000 100
< 1
ca. 10
ca. 100
ca. 1.000
ca. 10.000
2000
1000
ca. 10
ca. 100
ca. 1.000
ca. 10.000
> 10.000
2000
10.000
ca. 100
ca. 1.000
ca. 10.000
> 10.000
>> 10.000
2000
100.000
ca. 1.000
ca. 10.000
> 10.000
>> 10.000
>> 10.000
2000
1.000.000
ca. 10.000
> 10.000
>> 10.000
>> 10.000
>> 10.000
5


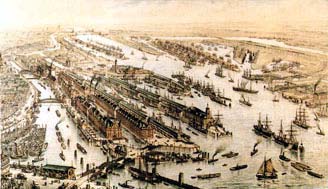
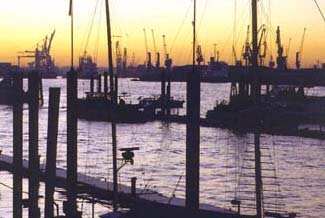
EASE
Assessment of major incidents
Alarm thresholds (draft) derived from IWAE:
The Alarm threshold for major incidents is calculated as fol ows:
Alarm threshold:
Pollutants with WRC 0
: 100 µg/l
Pollutants with WRC 1
: 10 µg/l
Pollutants with WRC 2
: 1 µg/l
Pollutants with WRC 3
: 0,1 µg/l
Water Discharge
Distance to fall below the alarm threshold
level
quantity
for major incidents
[mł/s] [kg]
[km]
WGK ,,0"
WGK 1
WGK 2
WGK 3
100 µg/l
10 µg/l
1 µg/l
0,1 µg/l
2000
100
ca. 10
ca. 100
ca. 1.000
ca. 10.000
2000
1000
ca. 100
ca. 1.000
ca. 10.000
> 10.000
2000
10.000
ca. 1.000
ca. 10.000
> 10.000
>> 10.000
2000
100.000
ca. 10.000
> 10.000
>> 10.000
>> 10.000
EASE
Take a look at the Hamburg Harbour...
Thank you for
your attention
6


(improvement of)
Availability, Utilisation and Accuracy
Consultant: Jos van Gils
Delft Hydraulics
Current status: availability and utilisation
Few PIACs are actually using the DBAM, mostly due to:
· software not available
distribution through Danubis
· software can not be installed
maintenance provisions needed
· running problems
maintenance provisions needed
1


Extension of functionality
· Input of treshold value, and representation of this value in
the output
· Connection to database with substances and treshold
values
· Variable time step in output
Conditions for maximum accuracy
Per "phase":
1. hydrology data available under operational conditions
2. rating curves accurate
3. velocity tables accurate
4. DBAM properly calibrated
2


Accuracy enhancement
How accurate should the DBAM be, in view of its role in the
AEWS?
· the stricter the requirements, the higher the costs
Calibration alone is not enough to guarantee accuracy:
· periodic checks on availability of hydrological data under
operational conditions
· periodic checks on rating curves and velocity tables
Availability of hydrological data
What is current practice in collecting hydrology data?
Is there any transfer of this information between the
countries?
Is there an organisation collecting these data on a Danube
wide scale?
To what extent could this information be collected from the
web site?
Is it possible to use only predefined conditions for operational
use of the DBAM? (high-low-medium)
3

Rating curves and velocity tables
Organisational aspects
· Who "owns" the data?
· Who will be responsible for maintenance
(organisation and finances)?
Technical aspects
· Checks on (recent!) field data? or
· Checks on existing HD models? (and who maintains
those?)
4


Factors affecting the accuracy of the DBAM
Consultant: Jos van Gils
Delft Hydraulics
Overview
Every phase of the calculations has its own inaccuracies:
1. collection of hydrology data
2. calculation of discharges
3. calculation of velocities
4. calculation of concentrations
Inherent inaccuracy from underlying assumptions:
·
1D concept
·
quasi-steady hydraulic coefficients Q and V
1


Phase 1: Hydrology data
· Spill has a duration of many days (Baia Mare: 4 weeks)
· In "forecasting" mode (operational mode) a forecast of
hydrology data is required
· Not available, so
· Hydrology of today = hydrology of coming days/weeks
· Sensitivity analysis
Source of inaccuracy NOT reduced by calibration
(can be checked/eliminated in "hind casting" mode, if
sufficient data are available)
Phase 2: Calculation of discharges
· From built-in rating curves
· Conceptual inaccuracies
· Rating curve can be outdated
Source of inaccuracy NOT reduced by calibration
(can be checked/eliminated in "hind casting" mode, if
sufficient flow data are available)
2


Phase 3: Calculation of velocities
· From built-in tables
· Conceptual inaccuracies
· Tables can be outdated, or inaccurate
Source of inaccuracy REDUCED by calibration
Phase 4: Calculation of concentrations
Uncalibrated model parameters
· dead zone parameter , affects
· travel time
· concentration
· dispersion parameter , affects
· concentration
Source of inaccuracy REDUCED by calibration
3


Example Baia Mare
· Hungarian Tisa
· Inaccuracy due to Phase 1 and Phase 2 eliminated, actual
time-dependent values of H and Q
14
12
Balsa computed
Balsa observed
Kiskore computed
Kiskore observed
10
Tiszasziget computed
Tiszasziget observed
/
l
)
g
m
8
n (
t
i
o
t
r
a
n
e
6
nc
o
C
4
2
0
31-jan
2-feb
4-feb
6-feb
8-feb
10-feb
12-feb
14-feb
4


12
10
computed
observed
8
)
s
a
y
6
Time (d
4
2
0
800
700
600
500
400
300
200
100
0
Distance from the Tisa mouth
35
30
computed
observed
25
/
l
)
g
m
n ( 20
t
i
o
t
r
a
n
e 15
nc
o
C 10
5
0
800
700
600
500
400
300
200
100
0
Distance from the Tisa mouth
5


12
10
beta = 0
8
beta = 0.1
)
s
beta = 0.2
ay
d
observed
(
6
e
m
Ti
4
2
0
800
700
600
500
400
300
200
100
0
Distance from the Tisa mouth
35
30
alfa = 0.002
25
l)
alfa = 0.005
alfa = 0.010
20
on (mg/
observed
ati
15
entr
Conc 10
5
0
800
700
600
500
400
300
200
100
0
Distance from the Tisa mouth
6


Tisa-Somes
Travel time
Peak Conc
Danube
Travel time
river km
rel. error (%)
rel. error (%)
river km
rel. error (%)
Somes,
45.4
1072
Tisa,
558
4 -57 941 -20
433.5 -25 -51 795 -20
340 0 -26 679 25
246 3 -31 597 -4
162.5 -17 -28 495 4
375
5
159
-2
cum. Error (%)
rel. error (%)
total
stretch -6
total
stretch -5
Conclusions
· accuracy of travel time unexpectedly good over longer
distances:
· 5% resp. 6% over Danube and Tisa (similar to Rhine
Model after calibration!)
· accuracy poor (deviations up to 25%) over shorter
stretches
· over longer distances the errors are non-systematic and
tend to compensate each other
7

Conditions for maximum accuracy
Per "phase":
1. hydrology data available under operational conditions
2. rating curves accurate
3. velocity tables accurate
4. DBAM properly calibrated
8


Calibration options
A
Scope and objectives?
B
Existing data or new experiments?
C
Selection of tracers
D
Sampling and analysis
E
Density of stations
F
Hydrology data
G
Organisation
Scope and objectives
Trans-boundary objective of AEWS:
· focus on large spatial scale: Danube and large international
tributaries,
· with follow-up studies for details
· smaller tributaries
· locks, weirs, dams, reservoirs
· lateral dispersion phenomena
1


Scope and objectives
· Is there agreement about the scope and objectives?
· Which international tributaries to include?
· With what prioritisation?
(driven by presence of hot spots??)
2


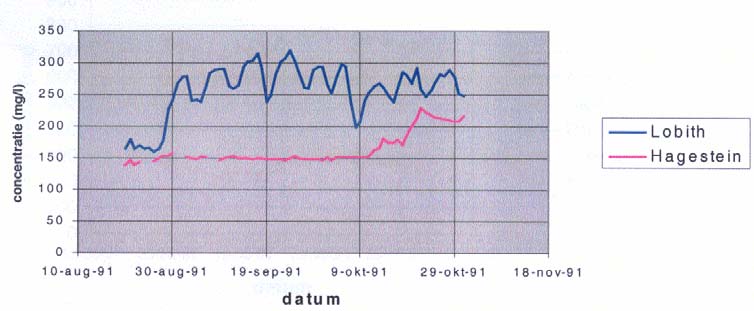
Existing data or new experiments?
·
Tracer experiments are costly, and existing data can present a
cheaper alternative:
· spills from the past
· Baia Mare
· Croatian Danube
· ...
· "normal" parameters showing strong temporal trends
· ...
· existing tracer experiments
· Sava in Slovenia
· ...
Example
3


Existing data
· C(t) at 2 or more stations
· Detailed hydrology data available (space and time)
To what extent are such data available??
Selection of tracers
Salt
Cheap, low impact
Very high dosage
Radio nuclides
Very high sensitivity,
Legal restrictions?
proven technology, in-
situ analysis
Fluorescent tracers
High sensitivity,
Ecological impacts?
(rhodamine etc.)
proven technology, in- Legal restrictions?
situ analysis
"Natural tracers"
Low impact
Experimental technique
(feasibility study first!)
4


Selection of tracers
· Inventory of legislation already available (1998).
Need to verify!
Sampling and analysis
Relying on in-situ observations only not possible (Elbe and
Rhine)
Recommendations laboratory analysis:
· analysis soon after sampling
· analyses in one laboratory
Not feasible in view of the large size of the Danube basin!
5


Sampling and analysis
"Central"
"Decentral"
·
one central laboratory
·
different laboratories
·
long transport time
·
short transport times
·
no consistency problem
·
possible inconsistencies
between lab's
between lab's
Selection of stations and "observation
windows"
· Stations should be carefully selected (recommendations
from Rhine and Elbe)
· High or low density of stations?
6


Density of stations
High density
Low density
·
distance < 100 km
·
distance > 100 km
·
spatial variation of calibration
·
spatial variation of calibration
parameters well-resolved
parameters not so well-
resolved
·
less experiments for same
·
more experiments for same
budget
budget:
· different flow regimes
· different tributaries
Hydrology data
Preferably, several experiments under different hydrological
conditions (no floods!), but anyhow:
· Full daily records at all stations during the experiments
· If possible, simultaneous observation of water level and
discharge!
Any organisational recommendations??
7

Organisation
· national institutes and agencies having equipment and
laboratories should be involved
· important role for MLIM / TNMN
· a central (small) planning and co-ordination group?
Agreement?
Other recommendations?
8
Development and Maintenance of the DBAM
C 1
C
List of attendants to the Workshop
Name
Position
Aurel Varduca
APC/EG member Romania, Chairman
??
APC/EG member Bulgaria
Daniel Geisbacher
APC/EG member Slovakia
Janez Polajnar
APC/EG member Slovenia
Jovanka Ignjatovic
APC/EG member Serbia & Montenegro
György Pinter
APC/EG member Hungary
Beata Pataki
future APC/EG member Hungary
Pavel Biza
APC/EG member Czech Republic
Nena Hak
APC/EG member Croatia
Igor Liska
ICPDR Permanent Secretariat
Ivan Zavadsky
DRP, Project Manager
Alex Hoebart
DRP
Werner Blohm
Institut für Hygiene und Umwelt, Hamburg city
Development and Maintenance of the DBAM
D 1
D
Inventory "availability and utilisation of the
DBAM" (G. Pinter)
QUESTIONNAIRE ON THE AVAILABILITY AND UTILIZATION OF THE DANUBE BASIN
ALARM MODEL
at the PIACs of the Danube AEWS
Final version
Latest
Number of
Operation
Conditions of
PIAC
version
PCs to use
system of PCs USING
Detailed description of
Remarks
No.
of DBAM
DBAM
using DBAM
DBAM
problems
(2.00.02)
in PIAC
in DBAM operation
available
01
No
1
Windows
Not in use
(Version
NT 4.0
1.01
available)
02
No
-
-
Not in use
03
Yes
2
PC 1: P4, 1.7
PC 1:
PC 1:
PC 1: DBAM installed, but
GHz,
Windows
Not working
the mathematical model is
RAM 256 MB,
2000
not working.
HDD 60 GB
Error message: ,,Error while
PC 2: P II,
running the mathematical
400 MHz,
PC 2:
PC 2:
model".
RAM 128 MB,
Windows 98
Working
HDD 16 GB
SE
04
Yes
PC 1: P VI,
PC 1:
PC 1:
PC 1: DBAM installed, but
It seems that
400 MHz,
Windows
Not working
the mathematical model is
problem will be in
RAM512MB,
2000
not working.
system.
HDD 40 GB
Error message: ,,Error while Installation DBAM
( ?? )
running the mathematical
in new PC with
model".
WINDOWS 2000
When DBAM is used under
it
WIN´98 it runs
does not work.
satisfactorily.
05
Yes
2
Windows XP
Problems, not
PC 1-2: Installation of
Interesting to note,
PC 1-2:
Professional
working
DBAM is refused. Error
that on a home
P 4, 2,4 GHz,
message: ,,You can not
computer (Gy.
RAM 512 MB,
install this VB5 application
Pintér) having
HHD 40 GB
without the latest service
WIN98, the
pack first being installed
DBAM is running
onto this computer".
smoothly, installed
This is a strange message,
by the same
because the existing
original CD from
operation system of these
Delft Hydraulics
computers is the latest
(PIII. 860 MHz,
version, updated with all the
256 MB RAM)
possible, and necessary
components !!!
06
Yes
2
Windows
Not in use
Problem of installation: lack Remarks on the
(only the
PC 1-2
2000
of Netter Set-up program
problems of using
old
the older version
version!!)
of DBAM
D 2
UNDP/GEF Danube Regional Project
Latest
Number of
Operation
Conditions of
PIAC
version
PCs to use
system of PCs USING
Detailed description of
Remarks
No.
of DBAM
DBAM
using DBAM
DBAM
problems
(2.00.02)
in PIAC
in DBAM operation
available
has been sent to
Mr. Jos van Gils in
2000.
07
?
No response from Croatia
08
No (just
1
Windows 3.1
Working very
DBAM is installed, but
It is very important
DBAM
Pentium 75
well
since the 2001 Cyanide spill to acquire the new
version
Mhz, 640 kB
accident was not used due
version of DBAM
1.01)
memory (?)
to no any major pollution
(2.00.02) which
recorded on Danube basin,
can work also on
downstream of the inner
Windows 98 or XP
river reservoirs. Anyway,
on the new
still remain the major
acquired PC
problem of DBAM version
(Pentium 4).
1.01, the prognosis of the
pollution plume movement
which is ahead of 24 hours
than the reality.
09
Yes
2
Windows
Problems, not
PC No.1: DBAM installed,
On a computer
Pentium IV, 2,4
2000 Pro
working
but the mathematical model
having WIN98
GHz , 512 RAM
is not working.
(Pentium II 266
Error message: ,,Error while MHz, 64 MB
running the mathematical
RAM), the DBAM
model"
is running without
PC No.2: Installation of
any problem.
DBAM is refused. Error
message: ,,You can not
install this VB5 application
without the latest service
pack first being installed
onto this computer".
10
?
No response from Moldova
11
?
No response from Ukraine
12
?
No response from Ukraine
S&M
No
-
-
Not in use
Original text of the e-mail when the Questionnaire have been first sent to AEP-EG members on
13.05.2003 is as follows:
,,Dear APC-EG members,
Few years ago the revised version of the Danube Basin Alarm Model (DBAM) has been forwarded to
the Expert Units of the PIACs of the Danube AEWS for utilisation in practice. Due to changes in the
meantime in hardware and software facilities at the PIACs, there are some problems with the
installation and running this model-system. Especially we face problems with the operation of the
DBAM at PIAC-05 in Budapest.
Recently the "father" of the revised DBAM, Mr. Jos van Gils visited VITUKI for other purposes, but
we were lucky to have a rather long discussion with him about DBAM-problems. Studying the errors
in the site unfortunately improvement could not be done immediately, but he promised to solve
directly these problems, like what they have done with the similar problems of the Rhine Alert Model.
For this purpose it is necessary to collect all the experiences of the PIACs in the Danube Basin
concerning the operation and problems of the DBAM model-system, which will be the forwarded to
Mr. Jos van Gils. Please forward the enclosed questionnaire to the Expert Unit of your PIAC, asking
them to provide their experiences, and send it back to me within a month, if possible. This action is
made with the agreement of Mr. Igor Liska from ICPDR Secretariat.
J. van Gils, WL | Delft Hydraulics
Development and Maintenance of the DBAM
D 3
Looking forward to your reply, and please do not hesitate to improve the enclosed table, if it seems to
be necessary,
Best regards
György Pintér"
(Date of inserting the latest incoming information is: 12. August 2003.) Compiled by: Gy.
PINTÉR, APC-EG.
Development and Maintenance of the DBAM
E 1
E
Draft ToR for maintenance of the DBAM
(Copied from Hartong (2000).)
Objectives
The maintenance of the Danube Basin Alarm Model (DBAM) needs to be carried out with the
following objectives in mind:
· archiving: to guarantee that all existing and future versions of the software, the data files and the
documentation are at any time available to anyone making a legitimate request;
· support: to provide a so-called "Helpdesk facility" for recognised users of DBAM;
· upgrades: to create periodic upgrades of the software, the data files and the documentation.
The technical and scientific responsibility with respect to the DBAM resides with the AEPWS Expert
Group (APC-EG) under the International Commission for the Protection of the Danube River
(ICPDR). The administrative responsibility in this respect lies with the Permanent Secretariat (PS)
under the ICPDR.2
Tasks
1
Archiving
The Consultant shall keep duplicated electronic records of all existing and future versions of the
software, the data files and the documentation, as well as all other files and documents relevant to
producing versions of the DBAM. The records will be made on CD-ROM. The Consultant shall take
into account the life time of the information holders specified by the manufacturers and will take care
that new copies are made timely.
The archived material will be made available to any of the recognised users of the DBAM and to any
one whose request is approved of by the PS. The latter type of requests are supposed to be very rare.
The Consultant will keep records of all supplied copies.
2
Support
The Consultant will operate a Helpdesk service by email. Questions related to the use or the
functioning of the DBAM software will be answered within a reasonable time. The Consultant will
guarantee the scientific and technical soundness of his answers by consulting experts appointed by the
AEPWS-EG.
The Helpdesk services will be available to any of the recognised users of the DBAM and to any one
whose request is approved of by the PS. The latter type of requests are supposed to be very rare.
The Consultant will keep records of all requests for support and register the amount of time spent on
answering the questions.
3
Upgrades
2 These responsibilities should be precisely defined in the final ToR. The current text should be considered
indicative only.
E 2
UNDP/GEF Danube Regional Project
3.1
Analyse reported shortcomings of the DBAM
If certain shortcomings of the DBAM or its documentation are reported (through the Helpdesk
services or directly through the PS or the AEPWS-EG), the Consultant shall analyse them, shall decide
how they can be removed and shall estimate the costs. The Consultant will guarantee the scientific and
technical soundness of his decisions by consulting experts appointed by the AEPWS-EG.
Depending on the cost estimate either task 3.2 or task 3.3 will follow.
3.2
Carrying out small changes
If the repairs or changes related to certain shortcomings analysed in task 3.1 are small, the Consultant
will carry them out. After every change, the proper functioning of the DBAM will be tested. Tests and
their results will be registered.
The Consultant will keep records of all repairs made and register the amount of time spent on each
action.
3.3
Provide definitions and cost estimates for larger changes
If the repairs or changes related to certain shortcomings analysed in task 3.1 are not small, the
Consultant will provide a formal definition of the repairs or changes, including a test plan, and an
associated cost estimate.
The PS decides if the defined changes need to be carried out (and by whom), and if so, makes
available the necessary finances.
3.4
Formally accept all changes made outside the Maintenance contract.
It is possible that certain changes are carried by other parties than the Consultant carrying out the
Maintenance contract. Such changes always need to be based on an officially archived version of the
DBAM. The updated versions need to be formally accepted by the Consultant carrying out the
Maintenance contract. The Consultant will do so based on written design and test reports and by
explicitly inspecting the changes.
3.5
Integrate all changes into upgrades or releases
The Consultant will create periodic upgrades of the DBAM, by taking the previous release and
integrating all changes made under tasks 3.2, 3.3 or 3.4.
The new release will be tested. The Consultant will write a test report and submit this to the AEPWS-
EG or any person(s) nominated by the EG for approval. Finally, the upgrade is officially distributed to
the users of DBAM.
Inputs
· Existing software, data and documentation.
· List of recognised users.
· Names and addresses of nominated DBAM experts to advise the Maintenance responsible..
Outputs
· Archives of software, data and documentation.
· New releases of software, data and documentation.
J. van Gils, WL | Delft Hydraulics
Development and Maintenance of the DBAM
E 3
· The Consultant will submit 4-monthly reports of activities, and report the costs made for tasks 2,
and task 3.1 to 3.4.
Financial arrangement
It is suggested to arrange the finances of the Maintenance contract as follows:
· The contract is made on a yearly basis.
· For task 1 there is a yearly fixed budget.
· For task 2 there is a yearly budget limit, but the Consultant is paid for the real costs up to the
specified limit. The periodic reports by the Consultant should guarantee that the Maintenance
Services do not have to be stopped unexpectedly due to budget shortages.
· Tasks 3-1 to 3-4 are arranged as task 2.
· For task 3-5 there is an agreement about the number of releases or upgrades (e.g. 1 per year) and
there is a yearly fixed budget.
Development and Maintenance of the DBAM
F 1
F
Suggested extension of functionality
In the present practice of handling accidental spills the notion of a "threshold value" plays an
important role. The DBAM could be tailored to support this practice, by:
· allowing the input of the threshold value;
· representation of this value in the output.
Optionally, a connection could be made to a database with substances and threshold values.
Furthermore, the fact that the present DBAM has a fixed time step in its output is considered a
problem. In the smaller tributaries, the time dimension should be resolved much finer (minutes) than
in the Danube and its main tributaries (hours).
Development and Maintenance of the DBAM
G 1
G
Existing data inventory
Inventory of existing data still needs to be made with input from APC/EG members. The APC/EG
members need to provide written information, including an assessment of the reliability of the data.
Development and Maintenance of the DBAM
H 1
H
Legislative aspects in relation to tracer
experiments
An inventory regarding legal constraints has been made by the Phare Environmental Consortium
(1998). This inventory revealed that for all investigated tracer substances (including salt, fluorescent
tracers and radio nuclides) the application was subject to specific permitting by the responsible
authorities. The conclusion was drawn on the basis of information from Hungary, Slovakia, Czech
Republic and Slovenia. For the remaining countries no information was collected at the time.
Although this information still needs to be checked by the APC/EG members, and relevant additions in
relation to radio nuclides should still be obtained from IAEA representatives, we can safely assume
that a specific permitting step will be necessary for any future tracer experiment.
Given the river geometry and its hydraulic characteristics, a tracer should be selected which is stable
enough, has a sufficiently low detection limit and a sufficiently high MAC. The formulas in Appendix
I can than be used to estimate the required tracer mass, and to quantify the distance of exceedence of
the MAC. Such an analysis can be technical input to the permit request.
Development and Maintenance of the DBAM
I 1
I
Guidelines for tracer mass calculation and
exceedance of MAC
The guidelines presented below are set up assuming that the behaviour of the cloud of pollutants can
be approximated neglecting the dead zone effect. In that case the analytical solution to the governing
equations is given by the Taylor model:
2
M / Q
( t - x/U )
c(x,t)=
× exp [ -
] × exp(-kt)
2
2
4 D t/
4 D t/
U
U
(I.1)
With:
2
2
U W
U g
D =
, u
, = 0.002 - 0.010
*
1/ 6
h u
*
h
25×
0.2
Where:
c
concentration (g/m3)
M
spilt mass (g)
Q
river discharge (m3/s)
U
mean flow velocity (m/s)
D
longitudinal dispersion coefficient (m2/s)
k
decay rate (1/s)
t
time (s)
x
distance from point of discharge (m)
W
river width (m)
h
river depth (m)
g
gravity constant (m/s2)
constant of proportionality
I.1
Estimation of the required mass of tracer
In this case, we use equation (I.1) including the decay factor. The Taylor formula predicts that the
maximum concentration at a position x is obtained at t=x/U, which is equal to the hydraulic travel
time.
I 2
UNDP/GEF Danube Regional Project
Substituting this, we obtain:
M / Q
kx
c
(x)=
×exp -
max
3
4 D x/
U
U
(I.2)
Next, we formulate a condition which ensures that a cloud can be sampled and analysed:
c
(x) > × c
,
with = 10 -100
max
det.lim.
(I.3)
This relation states that the maximum concentration should exceed the detection limit by at least a
factor . By substitution, we can derive the required tracer mass as a function of the river
characteristics, of the detection limit and of the distance x of the experiment:
3
×c
×Q× 4 D x/
det .lim.
U
M =
kx
exp -
U
(I.4)
I.2
Estimation of the distance where concentrations exceed the MAC
If the maximum allowable concentration MAC (g/m3) is known, the distance over which this
concentration is expected to be exceeded can be estimated by solving equation (I.3) for x. For
simplicity reasons, we neglect the decay factor. This is a "worst case" approximation. The result is:
2
3
M U
x
=
c>MAC
2
2
Q MAC 4 D
(I.5)
I.3
General considerations
While using these formulas, the following should be kept in mind:
· While estimating the necessary tracer mass (by formula I.4) in a river with non-homogeneous
characteristics, the river characteristics should be taken from the downstream end of the river
stretch under investigation. Near that position, the dilution is the strongest and the concentrations
are the lowest.
· While estimating the distance where the MAC is exceeded (by formula I.5) in a river with non-
homogeneous characteristics, the river characteristics should be taken from the upstream end of
the river stretch under investigation. Near that position, the dilution is the smallest and the
concentrations are the highest.
J. van Gils, WL | Delft Hydraulics
Development and Maintenance of the DBAM
I 3
· The formulas should anyhow be used with a certain margin (10-30%), since the dead zone effect
was neglected while deriving them.
· Alternatively, the DBAM itself can be used to obtain estimates which take into account the
variable river characteristics and the dead zone effect.
Development and Maintenance of the DBAM
J 1
J
Guideline for frequency of sampling
The guideline presented below is set up assuming that the behaviour of the cloud of pollutants can be
approximated neglecting the dead zone effect. In that case the analytical solution to the governing
equations is given by the Taylor model (equation I.1).
In this case we derive a guideline for the sampling frequency by:
· estimating the length of the cloud by calculating the period of time that a certain threshold
concentration x Cmax is exceeded (e.g. = 0.05 or 0.10);
· establishing the number of samples N necessary to adequately capture the shape of the cloud (e.g.
N = 20).
The result is:
4
Dx
t
=
ln
3
N
U
(J.1)
While using this formula, the following should be kept in mind:
· In a river with non-homogeneous characteristics, the river characteristics should be representative
for the average conditions between the discharge and observation points.
· The formula should anyhow be used with a certain margin (10-30%), since the dead zone effect
was neglected while deriving it.
· Alternatively, the DBAM itself can be used to obtain the estimated time of passage of the cloud,
taking into account the variable river characteristics and the dead zone effect.
Development and Maintenance of the DBAM
K 1
K
Outline of Calibration Manual
The calibration manual should consist of the following elements:
· Description of available data3.
· Calibration methodology.
· Processing of available data.
· Calibration process.
· Reporting.
· Upgrading the DBAM.
These elements will be further explained below.
K.1
Description of available data
The available data can be either:
· A continuous record of the concentration of a "regular" water quality parameter which shows a
strong temporal gradient.
· A concentration record from an accidental spill.
· Concentration records from a tracer experiments.
The data description should include at least the following aspects:
· Introduction.
· Source(s) of information.
· Sampling locations, including an assessment of possible lateral concentration gradients.
· A description of the characteristics of the river stretch in question: geometry, hydrology, structures.
· Sampling frequency, including an assessment of the suitability for full or partial calibration (see
below).
· Availability of complete records of the hydrology data at the relevant DBAM stations, as a
function of time.
· Explicit reporting of all raw data.
K.2
Calibration methodology
The calibration methodology should be based on a sound understanding of the principles of the
DBAM and the sources of inaccuracy of the DBAM, as laid out in Chapter 2. Furthermore, the
calibration methodology should be guided by the quality and amount of the available data.
3 The manual does not include the collection of data.
K 2
UNDP/GEF Danube Regional Project
In some occasions, only information about the travel time of pollutants can be derived from the data.
In that case only a "partial" calibration can be carried out, which uses the space dependent parameter
to tune the travel time. It should be noted that records of the concentration of a "regular" water quality
parameter showing a strong temporal gradient can only be used for this partial calibration.
In other occasions, full information about the precise shape of the cloud can be obtained from the data.
In that case a full calibration can be carried out. Scientific publications (e.g. Schmid, 2002 and van
Mazijk et al. 2003) should be used to derive an approach allowing separately:
· The checking of the average velocity U in the main stream, as derived by DBAM from its built-in
tables.
· The calibration of the space dependent dead zone parameter and the dispersion parameter .
Details of the methodology will depend on the availability of data. It is recommended to use an
objective parameter optimisation method rather than expert judgement alone.
It is of the utmost importance that the methodology is clearly laid out for later reference.
K.3
Processing of available data
The processing of data is done in line with the methodological requirements. Full reporting to ensure
reproducibility is required.
K.4
Calibration process
The calibration process itself is done in line with the methodological requirements. Full reporting to
ensure reproducibility is required.
The process should be carried out using full time dependent hydrology input data. This ensures that the
variation of the hydraulic coefficients Q and U of the DBAM vary correctly along the river during the
propagation of the cloud of pollutants.
The DBAM has a hidden feature which allows the expert user to inspect the resulting hydraulic
coefficients. If a file with the name DODEBUG exists on the MODEL directory, the program writes an
echo of its input as well as intermediate results to a file called DBAM.DBG.
K.5
Reporting
The reporting should include all steps of the calibration. It should contain a clear and complete record
of all data and methods.
K.6
Upgrading the DBAM
The calibration process results in an updated file with numerical coefficients for the DBAM. This file
should be handed over to the person or organisation that is responsible for the maintenance of the
DBAM. A new version should be issued and distributed.
J. van Gils, WL | Delft Hydraulics
Development and Maintenance of the DBAM
K 3
K.7
References
Schmid, 2002: Persistence of Skewness in Longitudinal Dispersion Data: Can the Dead Zone Model Explain it After All?
Bernard H. Schmid, Journal of Hydraulic Engineering, 128, No 9, 2002.
Van Mazijk et al., 2003: Tracer experiments in the Rhine Basin: Evaluation of the skewness of observed concentration
distributions. A. van Mazijk, E.J.M. Veling, in preparation.