


United Nations
Environment Programme
Chemicals
Sub-Sahar
Sub-Saharan Africa
REGIONAL REPORT
an Africa
Regionally
RBA PTS REGIONAL REPOR
Based
Assessment
T
of
Persistent
Available from:
UNEP Chemicals
11-13, chemin des Anémones
CH-1219 Châtelaine, GE
Switzerland
Phone : +41 22 917 1234
Fax : +41 22 797 3460
Substances
E-mail: chemicals@unep.ch
December 2002
http://www.chem.unep.ch
UNEP Chemicals is a part of UNEP's Technology, Industry and
Printed at United Nations, Geneva
Economics Division
GE.03-00151January 2003500
UNEP/CHEMICALS/2003/5
G l o b a l E n v i r o n m e n t F a c i l i t y
UNITED NATIONS
ENVIRONMENT
PROGRAMME
CHEMICALS
Regional y Based Assessment
of Persistent Toxic Substances
Angola, Benin, Botswana, Brunei Darussalam, Burkina Faso, Burundi,
Cameroon, Central African Republic, Chad, Comoros, Congo (Brazzaville), Cote
d'Ivoire, Democratic Republic of Congo, Djibouti, Equatorial Guinea, Eritrea,
Ethiopia, Gabon, Ghana, Guinea-Bissau, Guinea, Kenya, Lesotho, Liberia,
Madagascar, Malawi, Mali, Mauritania, Mauritius, Mozambique, Namibia,
Niger, Nigeria, Rwanda, Sao Tome and Principe, Senegal, Seychelles, Sierra
Leone, Somalia, South Africa, Sudan, Swaziland, Tanzania, Togo, Uganda,
Zambia, Zimbabwe
SUB-SAHARAN
REGIONAL REPORT
DECEMBER 2002
GLOBAL ENVIRONMENT FACILITY
i
This report was financed by the Global Environment Facility (GEF) through a global project with co-
financing from the Governments of Australia, France, Sweden, Switzerland and the United States
of America.
This publication is produced within the framework of the Inter-Organization Programme for the
Sound Management of Chemicals (IOMC).
This publication is intended to serve as a guide. While the information provided is believed to be
accurate, UNEP disclaim any responsibility for the possible inaccuracies or omissions and
consequences, which may flow from them. UNEP nor any individual involved in the preparation of
this report shall be liable for any injury, loss, damage or prejudice of any kind that may be caused
by any persons who have acted based on their understanding of the information contained in this
publication.
The designations employed and the presentation of the material in this report do not imply the
expression of any opinion whatsoever on the part of the Secretariat of the United Nations of UNEP
concerning the legal status of any country, territory, city or area, or of its authorities, or concerning
the delimitation of its frontiers or boundaries.
The Inter-Organization Programme for the Sound Management of Chemicals (IOMC), was
established in 1995 by UNEP, ILO, FAO, WHO, UNIDO and OECD (Participating
Organizations), following recommendations made by the 1992 UN Conference on
Environment and Development to strengthen cooperation and increase coordination in the
field of chemical safety. In January 1998, UNITAR formally joined the IOMC as a
Participating Organization. The purpose of the IOMC is to promote coordination of the
policies and activities pursued by the Participating Organizations, jointly or separately, to
achieve the sound management of chemicals in relation to human health and the
environment.
Material in this publication may be freely quoted or reprinted but acknowledgement is requested
together with a reference to the document. A copy of the publication containing the quotation or
reprint should be sent to UNEP Chemicals.
UNEP
CHEMICALS
Available from:
UNEP Chemicals11-13, chemin des Anémones
CH-1219 Châtelaine, GE
Switzerland
Phone: +41 22 917 1234
Fax:
+41 22 797 3460
E-mail: chemicals@unep.ch
http://www.chem.unep.ch
UNEP Chemicals is a part of UNEP's Technology, Industry and Economics Division
ii
TABLE OF CONTENTS
PREFACE ........................................................................................................................................................V
EXECUTIVE SUMMARY..........................................................................................................................VII
1
INTRODUCTION...............................................................................................................................1
1.1
OVERVIEW OF THE RBA PTS PROJECT...........................................................................................1
1.1.1 Objectives ...............................................................................................................................................1
1.1.2 Results.....................................................................................................................................................1
1.1.3 Methodology ...........................................................................................................................................2
1.1.4 Management Structure ............................................................................................................................2
1.1.5 Data Processing.......................................................................................................................................2
1.1.6 Project Funding.......................................................................................................................................2
1.2
SCOPE OF SUB- SAHARA AFRICA REGIONAL ASSESSMENT.....................................................3
1.2.1 Existing Assessments..............................................................................................................................3
1.2.2 Methodology ...........................................................................................................................................3
1.3
PTS DEFINITIONS AND PROPERTIES...............................................................................................4
1.3.2 Industrial Compounds .............................................................................................................................7
1.3.3 Regional Specific ....................................................................................................................................8
1.4
DEFINITION OF THE SUB-SAHARA AFRICA REGION ................................................................13
1.5
PHYSICAL SETTING ..........................................................................................................................15
1.5.1 Physical/Geographical Description of the Region ................................................................................15
1.5.2 Water Resources ...................................................................................................................................17
1.5.3 Vegetation .............................................................................................................................................19
1.5.4 Wildlife .................................................................................................................................................19
1.5.5 Demography..........................................................................................................................................20
1.6
PATTERNS OF ECONOMIC DEVELOPMENT ................................................................................20
1.6.1 Agriculture ............................................................................................................................................21
1.6.2 Forestry and Fishing..............................................................................................................................21
1.6.3 Industry .................................................................................................................................................21
1.6.4 Energy ...................................................................................................................................................21
1.7
SOCIAL ASPECTS...............................................................................................................................22
1.8
SUMMARY ..........................................................................................................................................22
1.9
REFERENCES......................................................................................................................................23
2
SOURCE CHARACTERISATION.................................................................................................24
2.1
INTRODUCTION.................................................................................................................................24
2.2
PRODUCTION OF PTS PESTICIDES.................................................................................................24
2.3
THE IMPORT OF PTS PESTICIDES...................................................................................................25
2.4
THE USE OF PESTICIDES AND MAJOR AGRICULTURAL AREAS ............................................30
2.5
IDENTIFICATION OF STOCKS AND RESERVOIRS OF PTS PESTICIDES..................................34
2.5.1 Country Ranking According To Agricultural PTS ...............................................................................37
2.6
SOURCES OF INDUSTRIAL ..............................................................................................................38
2.6.1 Country Ranking According to Industrial PTS Production ..................................................................43
2.7
OTHER SOURCES OF PTS .................................................................................................................45
2.8
IMPORT AND EXPORT STATISTICS OF PTS CONTAINING WASTES.......................................49
2.9
COUNTRY RANKING ACCORDING TO PTS SCORES ..................................................................49
2.10 RANKING OF PTS CHEMICALS FROM SOURCES BY COUNTRIES...........................................51
2.11 SUMMARY: SOURCE CHARACTERISATION................................................................................53
2.11.1 Production And Imports........................................................................................................................53
2.11.2 Use Of PTS Pesticides ..........................................................................................................................53
2.11.3 Stocks Of Obsolete Pesticides...............................................................................................................54
2.11.4 Industrial Chemicals, Including PCBS .................................................................................................54
2.11.5 PTS Production From Open Burning....................................................................................................54
iii
2.11.6 REFERENCES..................................................................................................................................... 54
3
ENVIRONMENTAL LEVELS, TOXICOLOGICAL AND ECOTOXICOLOGICAL
CHARACTERISATION.................................................................................................................. 55
3.1
INTRODUCTION ..................................................................................................................................... 55
3.2
CONCENTRATIONS OF PTS IN ABIOTIC COMPARTMENTS.................................................................... 58
3.2.1 Environmental Media: AIR .................................................................................................................. 61
3.2.2 Environmental Media: Water ............................................................................................................... 61
3.2.3 Environmental Media: Marine Water................................................................................................... 62
3.2.4 Environmental Media: River And Lake Sediments.............................................................................. 62
3.2.5 Environmental Media: Marine Sediments............................................................................................ 65
3.2.6 Environmental Media: Soil .................................................................................................................. 65
3.3
CONCENTRATIONS OF PTS IN BIOTIC MEDIA ........................................................................... 67
3.3.1 PTS in Vegetation ................................................................................................................................ 67
3.3.2 PTS in Animals .................................................................................................................................... 70
3.3.3 PTS in Aquatic Animals....................................................................................................................... 70
3.3.4 PTS in Terrestrial Animals................................................................................................................... 73
3.3.5 PTS in Humans..................................................................................................................................... 73
3.4
EVIDENCE OF HARMFUL EFFECTS............................................................................................... 76
3.4.1 Comparison Of Measured Data With Health And Environmental Quality Criteria............................. 76
3.5
ECOTOXICOLOGICAL DATA AND APPROPRIATE TEST SPECIES .......................................... 78
3.6
RANKING OF PTS CHEMICALS ...................................................................................................... 78
3.7
DATA GAPS ........................................................................................................................................ 87
3.8
SUMMARY.......................................................................................................................................... 87
3.9
REFERENCES ......................................................................................................................................... 88
4
ASSESSMENT OF MAJOR PATHWAYS OF CONTAMINANTS TRANSPORT ................. 91
4.1
INTRODUCTION ................................................................................................................................ 91
4.2
OVERVIEW OF EXISTING MODELLING PROGRAMMES........................................................... 91
4.3
ATMOSPHERIC TRANSPORT .......................................................................................................... 92
4.4
COASTAL AND MARINE ENVIRONMENT.................................................................................... 92
4.5
TERRESTRIAL ASPECTS.................................................................................................................. 93
4.6
DATA GAPS ........................................................................................................................................ 95
4.7
SUMMARY.......................................................................................................................................... 95
4.8
REFERENCES ..................................................................................................................................... 95
5
ASSESSEMENT OF THE REGIONAL CAPACITY AND NEEDS TO MANAGE PTS ........ 97
5.1
INTRODUCTION ................................................................................................................................ 97
5.2
MONITORING CAPACITY................................................................................................................ 99
5.3
EXISTING POLICIES, REGULATIONS AND MANAGEMENT OF PTS ....................................... 99
5.4
ALTERNATIVES AND/OR MEASURES FOR REDUCTION OF PTS .......................................... 101
5.5
SOCIO-ECONOMIC INTERVENTIONS ......................................................................................... 102
5.6
THE REGIONAL NEEDS.................................................................................................................. 102
5.7
SUMMARY........................................................................................................................................ 104
5.8
REFERENCES ....................................................................................................................................... 104
6
CONCLUSIONS AND RECOMMENDATIONS ....................................................................... 105
6.1
KEY FINDINGS................................................................................................................................. 105
6.2
SETTING OF PRIORITIES ............................................................................................................... 106
6.3
PRIORITIES AS AGREED UPON BY THE PRIORITY SETTING MEETING.............................. 106
6.3.1 Short Term Priorities (1-2 years)........................................................................................................ 107
6.3.2 Medium Term Priorities (2-5 years)................................................................................................... 112
6.3.3 Long Term Priorities (5 to 10 years) .................................................................................................. 114
6.4
AREAS OF PRIORITY FOCUS ........................................................................................................ 115
6.5
FINAL WORD ................................................................................................................................... 115
ANNEX: ABBREVIATIONS AND ACRONYMS ................................................................................... 116
iv
PREFACE
This report is the product of the collective efforts of the Regional Team Members of the UNEP/GEF
Regionally Based Assessment of Persistent Toxic Substances (RBA PTS) Project for Region V, Sub-Sahara
Africa. It forms part of a global assessment of Persistent Toxic Substances (PTS) as sub-Sahara Africa is one
of the twelve regions designated by the United Nations Environment Programme (UNEP) for this purpose.
Composition of the Regional Team
The Regional Team established within the framework of the project with the following as members prepared
the report:
Regional Coordinator
Prof. Oladele Osibanjo, Director, Federal Ministry Of Environment-University of Ibadan Linkage Centre on
Cleaner Production Technology and Hazardous Waste Management, Department of Chemistry, University of
Ibadan, Ibadan, Nigeria. osibanjo@infoweb.abs.net or oosibanjo@yahoo.com
Team Members
Prof. Henk Bouwman, Professor, University of Potchefstroom, PU for CHE, P. Bag X6001, Potchefstroom
2520, South Africa. drkhb@puknet.puk.ac.za
Prof. Nabil H. H. Bashir. University of Gezira, Prof. of Pesticides and Toxicology, Faculty of Agricultural
Sciences, P O Box 20 Wad Medani, Sudan. bashirnabil@hotmail.com or bashirnabil@yahoo.com
Prof. Jose Okond'Ahoka, Director, Ministere de la Sante / Expert, Ministere de L'environment, B.P.16789
Kinshasa 1, Democratic Republic Of Congo (DRC). okondahuka_fr@yahoo.fr or agcdongd@yahoo.fr
Dr. Robert Choong Kwet Yive, Lecturer, Department of Chemistry Faculty of Science, University of
Mauritius. Robert@uom.ac.mu
Engr. Hosseah A. Onyoyo, Seven-Engine Techse Ltd, P.O. Box 53832, 0020 City Square, Nairobi, Kenya.
haonyoyo@yahoo.com or stephanoson@yahoo.com
Data Collection and Report Preparation
African experts in academia, research institutes government and non-governmental organizations (NGOs)
provided data existing in the region mainly through the completion of dedicated questionnaires designed by
GEF/UNEP for the study. The data collected was supplemented with data from published literature, research
reports, technical reports as well as personal communication from experts in the region.
The draft report prepared by the Regional Team Members was presented and reviewed at the Technical
Workshops on Sources Characterisation, Impact and Transport of PTS, held in Mombasa, Kenya 29 July - 2
August 2002 and attended by the network of regional experts. The revised draft report was presented to the
Regional Priority Setting Meeting held in Nairobi, UNEP, Kenya, during 30 October to 02 November 2002.
The inputs from the workshops and the meeting are reflected in this report.
ACKNOWLEDGEMENT
Several people and organisations contributed immensely towards the preparation of this report. The
invaluable assistance from members of the Regional Network of Experts who provided information on PTS
chemicals within the region is gratefully acknowledged. The invaluable contributions from the participants at
the Regional Technical Workshops and the Regional Priority Setting Meeting are also profoundly
appreciated. Funds for the project were provided by the GEF through UNEP Chemicals without which the
implementation of this important regional study would have been impossible. The provision of enabling
environment and logistic support for the successful completion of the latter stages of the project, including
the finalisation of this regional report, by Mr. Ahmed Djoghlaf, Director Division of GEF Co-ordination,
UNEP, Nairobi; Dr. Walter Jarman, Programme Officer, GEF Coordinating Office, UNEP, Nairobi, Kenya
and his able assistants, Miss Jackline Oduor and Ms. Theresa Lowe are gratefully acknowledged.
The contributions of Mr. Raphael Dakouri Zadi, Coordinateur du Project POPs & PCB, Ministere de
L'environement et du Cadre De Vie, Service Autonome Des Affaires Internationales, (20bp 650 Abidjan 20,
Cote d'Ivoire; zadid@aviso.ci) in coordinating data collection from some countries including assistance
v
during the Technical Workshops, Regional Priority Setting Meeting and finalisation of the report are
acknowledged.
The special contribution of Mr. Paul Whylie, the PTS Project Manager at UNEP, Geneva for rendering total
support towards the success of the project in spite of daunting difficulties is profoundly appreciated.
vi
EXECUTIVE SUMMARY
INTRODUCTION
Forty Seven sub-Saharan African countries including Madagascar and six small island states constitute
Region V, the largest of the twelve regions, for the Regionally Based Assessment (RBA) of Persistent Toxic
Substances (PTS) in a global project funded by GEF/UNEP. This assessment of PTS is a major milestone as
no comprehensive database on hazardous chemicals exists in the region.
PTS SOURCES
The identifiable main sources of PTS in the region are agricultural use of pesticides, production and imports,
vector control, stocks of obsolete and expired pesticides, industrial sources (manufacture, mining and
electricity) and not the least as by-products of combustion including open burning of waste.
Pesticides
Pesticides constitute one of the major sources of PTS in Region V. Except for atrazine produced in South
Africa, PTS pesticides are generally imported and not produced in Region V but pesticide formulation plants
exist in many countries of the region. Sub-Sahara Africa imports less than 5% in terms of value of total
pesticides import of the world. Twenty-two RBA Region V countries each import more than $5 million
worth of pesticides annually.
During the technical workshops, the regional experts identified the most widely used PTS pesticides for
Region V as mainly organochlorine pesticides namely: DDT, Endosulfan, Chlordane, Lindane (HCH),
Heptachlor, Toxaphene, HCB and Aldrin; as well as Atrazine. The workshops also noted the possibility and
likelihood of illegal trade and use of PTS pesticides (including DDT) in the region. Based on pesticide
import data (FAO), South Africa, Nigeria, Cote D'Ivoire, Kenya, Ethiopia, Ghana, Sudan, Tanzania,
Mozambique and Mali are the highest users of pesticides in the region.
A serious problem facing the region now is the issue of stocks and reservoirs of obsolete discarded and
banned PTS pesticides. The FAO estimates that there might be more than 40 000 tons, perhaps even much
more, of these chemicals stocked or discarded over many parts of Africa. Some of these chemicals were
donations from developed countries.
Industrial PTS Chemicals
The major industrial PTS chemicals of concern in the region are adjudged to be the following: PCBs (mainly
from electricity generating industry), HCB (also a PTS pesticide), pentachlorophenol (PCP) and phthalates.
Data is lacking on the use and import of PTS industrial chemicals in the region. This data gap will be
addressed perhaps when most of the countries have carried out "National Chemical Profile" study being
driven by the Intergovernmental Forum on Chemical Safety (IFCS).
Industrial output and electricity generation have been used as criteria to rank countries on the production of
PTS especially PCBs and Dioxins from industrial sources. Accordingly the countries releasing the largest
PTS emissions are South Africa, Nigeria, Zimbabwe, Ghana, Kenya, Democratic Republic of Congo,
Zambia, Cote D'Ivoire, Sudan and Cameroon in that order.
Other Sources Of PTS
The PTS of concern in this category are polyaromatic hydrocarbons and dioxins/furans.
Although not quantified, the main source categories are:
PAHs exhaust emission from combustion of fossil fuels in vehicles and electrical generating sets.
Dioxins and furans Waste (domestic, hospital, industrial) burning is possibly the least known factor in the
production of PCDD/Fs in Africa. A large amount of accidental and deliberate combustion is taking place,
including the burning of rubber tyres as well as stripping insulation of copper wires and cables. Waste
combustion could potentially be the largest source of dioxins and furans in Africa. Moreover, burning of
sugar cane fields, a common practice in sugar producing countries, could also contribute to the formation of
dioxins.
Based on population figures (2001 estimates), waste production (tons/day), air releases (mg TEQ), and
burned residue (mg TEQ) respectively; the largest potential emitters of dioxins into the environment from
vii
waste burning, a common practice in the region, are: Nigeria, Ethiopia, Democratic Republic of Congo
(DRC), South Africa, Tanzania, Sudan, Kenya, Uganda, Ghana, and Mozambique respectively. A daily TEQ
production of around 60g (21360 g TEQ/year) for dioxins and furans for Region V has been estimated. This
would equate to 0.0003 g TEQ/year per capita, but only for uncontrolled domestic waste combustion, not
including industrial or any other anthropogenic or natural sources, which were not taken into consideration.
This lack of information therefore constitutes a major data gap.
Ranking Of PTS Sources By Countries
At the technical workshops, the experts from the countries present were asked to score the PTS as released
from sources according to levels of concern for that specific country. The experts were asked to rank from 0
for no concern, to 3 for major concern. Some country experts did indicate however, that their scoring was
indicative only, but the combined scores from the countries gave a good indication of the overall level of
relative concern. The country experts rated the unintentional production of dioxins/furans as well as the
problem of PCBs, as the highest concern for most countries. DDT, Atrazine, Endosulfan and Lindane were
ranked as the most important PTS pesticides. Organic lead was the organometallic compound that caused the
most concern. For almost all of these compounds, significant data gaps were also indicated.
ENVIRONMENTAL LEVELS, TOXICOLOGICAL AND ECOTOXICOLOGICAL
CHARACTERISATION
Experts from only 16 countries out of 47 of the region provided data concerning PTS (about 3000 filled
questionnaires) in the environment. These data are relative to the levels and trends of PTS in environmental
media and clinical samples. Toxicological data are generally lacking for the region. Moreover, air, as an
environmental compartment was not given the required attention by most of the countries of the region in
general.
Concentrations Of PTS In Abiotic Compartments Of The Environment (Highlight Of Hotspots: Trend
Analysis)
Sub-Sahara is mainly an agricultural continent and it has been using pesticides for pest and disease control
for more than 50 years. Except for South Africa and Zimbabwe, no systematic pesticide monitoring/analysis
exists in all the countries of the region. These two countries account for more than two thirds of the filled
questionnaires gathered for the region. A big data gap therefore exists in the region as far as levels of PTS in
the environment are concerned.
The data gathered have been grouped according to the period of analysis: 1970 - 1979, 1980 - 1989 and 1990
- 2002 respectively for the purpose of trend analysis. During the 1970 - 1979 period, only seven PTS were
reported (DDT, dieldrin, endosulfan, Lindane, toxaphene, PCBs and HCB) whereas in the second period
(1980 - 1989), the period of awareness, banning and/or restriction, this number increased to nine (DDT,
dieldrin, endosulfan, Lindane, toxaphene, PCBs, HCB, heptachlor and atrazine). DDT, Lindane, endosulfan,
dieldrin, PCBs and HCB were common to both periods. During the third period (1990 - 2002) new chemicals
of agricultural, construction and industrial use, viz. endrin, chlordane, PAHs (pyrene), and nonylphenols
were detected in the region. PCBs and HCB were detected since the 1970's in South Africa and Zimbabwe in
water, vegetation and animals at relatively high levels.
Concentrations Of PTS In Biotic Media
From the data gathered through filled questionnaires, the trend of concentration observed in Sub-Sahara
Africa for PTS is DDT> PCBs> toxaphene. These same data apparently indicate that humans were less
directly exposed than animals and vegetation to PTS during the period 1970 - 2002. However the main risk
remains the food-web contamination. The occurrence of relatively high levels of DDT, PCBs and
dioxins/furans in adipose tissues and blood of occupationally exposed persons is of immense concern.
Equally disturbing is the high levels of HCB, Lindane and endosulfan in human breast milk in the region, in
view of WHO's vigorous campaign that mothers breast milk is best for children. It has been established by
studies in South Africa that Organochlorine Pesticides (OCPs) can be transferred to infants via breast milk.
Thus infants are being exposed to these xenobiotics while the toxicological hazards and risks have not been
studied in many sub-Sahara African countries.
viii
Evidence Of Harmful Effects
Many cases of accidental or intentional release of large amounts of PTS (for fishing or hunting) causing
severe stress to the environment and humans have been reported in the region. For example, the accidental
release of organochlorine pesticides (OCPs) in large quantities had caused massive fish kills in many
countries, such as Senegal, Nigeria and Kenya. Cases of people suffering from diseases as a result of
exposure to organochlorine insecticides while selling, mixing or spraying these were reported in Wad
Medani, Sudan. However there is data gap on PTS contaminated sites and hotspots.
RANKING OF PTS CHEMICALS ON ENVIRONMENTAL LEVELS, TOXICOLOGICAL AND
ECOTOXICOLOGICAL CHARACTERISATION BY COUNTRIES
At the technical workshops, the country experts rated dioxins and PCBs of highest concern in regard to their
levels in the environment. Among the PTS pesticides, it was DDT that was of highest concern followed by
endosulfan, atrazine, Lindane, aldrin, dieldrin, chlordane and heptachlor respectively. A similar pattern of
response was obtained for data gaps, that is, dioxins; PCBs and DDT were the chemicals that the experts
considered of highest priority.
DATA GAPS
At the technical workshops, the experts considered the following list as the major data gaps/issues that need
to be addressed:
PTS atmospheric concentrations in the countries of the region
PTS levels in sediments of the major lakes, e.g. Tana, Victoria, Chad, etc. and the marine
environment
Dioxins and furans in environmental compartments and humans (analytical data exist only in
South Africa),
Systematic studies of the food-web contamination and biomagnifications
The effect of burning crop residues, e.g. cotton, sugarcane, etc.
Effect of improper burning of wastes
The long-term effect of the accumulated stocks of obsolete PTS on the environment and health of
the human and animal populations near them
The effect of the emissions from the chimneys of the sugar and cement factories on the human
and animal populations in their areas and the vicinity, at least within 50 km from the sites, where
some eventually deposit
Concentrations of PAHs and organometallics (mercury and tin) in environmental media and biota.
ASSESSMENT OF MAJOR PATHWAYS OF CONTAMINANTS TRANSPORT
Atmospheric Transport
The uniqueness of the African continent in terms of secondary drift and temperature inversions is significant
in determining the environmental fate of PTS. These conditions can influence the behaviour of PTS. For
example air monitoring data in Zimbabwe and Malawi showed that hot temperatures volatilise sprayed DDT
into pockets of hot air and could drift down stream. DDT can condense on the ground when the temperatures
are low. The distillation and condensation of PTS on top of cold mountains, like the Kilimanjaro, could also
take place, although no data from Africa exists to confirm this.
It is not known whether Africa is a source or sink of global PTS. Current thinking is that the presence of the
Inter-Tropical Convergence Zone will prevent atmospheric transport of PTS to the north and vice versa.
However, whether Africa acts as a source of PTS to the Antarctic is not known.
In this context, the Island states are particularly vulnerable to this atmospheric mode of contamination by
PTS. For the region there is big data gap concerning atmospheric transport of PTS and therefore underscores
the importance of modelling here.
ix
Food Web
Monitoring data from Chapter 3 of the report indicate that DDT and PCBs in fish were two of the PTS most
often encountered since 1970s in the region including the marine environment. The data also indicate
widespread PTS contamination of fruits, vegetables, major cereals, foodstuffs of animal origin, as well as
fish and fish products, breast milk and dairy products. Fish that constitutes the major source of animal
protein for coastal, lacustrine and riparian populations of Region V is thus an indirect source of exposure to
PTS for these populations.
Coastal And Marine Environment
Since most of the socio-economic activities of Region V are associated with rivers and other water bodies
apart from land, it is expected that significant amounts of PTS are transported across boundaries and released
into lakes, seas and oceans. The magnitude of this input is unknown for the region, but it is likely to be
significant and therefore constitutes another major data gap.
Terrestrial Aspects
The aspect of the behaviour of PTS in Region V soil types again constitutes a major data gap. Results
obtained from other parts of the world may not be valid for Region V as the soil type and climatic conditions
are very different.
PRELIMINARY ASSESSMENT OF THE REGIONAL CAPACITY AND NEEDS
In Region V, it is regrettable that whereas most of the national legislations are either general or fragmentary
in nature and non-specific to PTS, some countries do not have any laws regarding hazardous chemicals. It
will be important that national legislations are enacted and/or harmonised to deal with hazardous chemicals
in general and PTS in particular.
A major constraint towards the sustainable management of these hazardous chemicals is the lack of and/or
weak enforcement of regulations. For the region to contribute effectively in the global effort to reduce PTS,
there is need to establish and/or strengthen existing institutions and legal framework through capacity
building and putting in place necessary mechanisms for compliance monitoring and enforcement.
Alternatives And/Or Measures For Reduction Of PTS
Due to lack of adequate knowledge about the newly developed alternatives, some farmers undercover are
still using PTS pesticides in the region. This calls for aggressive awareness raising amongst these small-
scale farmers of the innovations and the effects of the PTS in order to convince them of the need to turn to
the alternatives. The development of alternative chemicals to replace PTS has however started, though still
on a small scale in the region. In some East African countries for example, most of the banned PTS
pesticides (organochlorines) have been replaced by pyrethrums; some of which are locally manufactured and
formulated. Some international research institutions in Africa are implementing alternatives to PTS
pesticides in agriculture and vector control. For example, Integrated Pest Management (IPM) and Integrated
Vector Management (IVM) have been developed and are currently being implemented in some parts of
Region V along with the rest of the world. Another example is the potential use of the extract of the Neem
tree to control agricultural pests and some fungal diseases instead of the conventional pesticides.
RECOMMENDATIONS
Existing environmental data gaps should be filled as a matter of priority as meaningful policy interventions
to protect humans and the environment from risk of exposure to PTS cannot be achieved in a data vacuum.
Environmental monitoring of PTS levels at the national level in soils, water, sediments, biota, air, livestock
and human blood/breast milk is essential for identifying all the hot spots for remedial action to reduce health
risks to humans.
The pathways and fate of PTS in the region should be studied, so that the critical pathways can be identified,
followed by the evaluation of the relative impact of processes, estimation of transport fluxes, and assessment
of remedial measures. Information is lacking in this critical area.
Capacity building needs in the region deserve priority action to ensure global success of the recent
Stockholm Convention on POPs and other international regulations for the environmentally sound
management of PTS and other hazardous chemicals. Regionally based research including development of an
ecotoxicological database on the African environment is important. Training African experts in the use of
x
models for sound chemicals management and environmental protection is also advantageous to the region
and the international community.
xi
1 INTRODUCTION
1.1 OVERVIEW OF THE RBA PTS PROJECT
Following the recommendations of the Intergovernmental Forum on Chemical Safety, the UNEP Governing
Council decided in February 1997 (Decision 19/13 C) that immediate international action should be initiated
to protect human health and the environment through measures which will reduce and/or eliminate the
emissions and discharges of an initial set of twelve persistent organic pollutants (POPs). Accordingly an
Intergovernmental Negotiating Committee (INC) was established with a mandate to prepare an international
legally binding instrument for implementing international action on certain persistent organic pollutants.
These series of negotiations have resulted in the adoption of the Stockholm Convention in 2001. The initial 12
substances fitting these categories that have been selected under the Stockholm Convention are: Aldrin,
Endrin, Dieldrin, Chlordane, DDT, Toxaphene, Mirex, Heptachlor, Hexachlorobenzene, PCBs, Dioxins and
Furans. Beside these 12, there are many other substances that satisfy the criteria listed above for which their
sources, environmental concentrations and effects are to be assessed.
Persistent toxic substances can be manufactured substances for use in various sectors of industry, pesticides,
or by-products of industrial processes and combustion. To date, their scientific assessment has largely
concentrated on specific local and/or regional environmental and health effects, in particular "hot spots" such
as the Great Lakes region of North America or the Baltic Sea.
1.1.1 Objectives
There is a need for the scientifically-based assessment of the nature and scale of the threats to the environment
and its resources posed by persistent toxic substances that will provide guidance to the international
community concerning the priorities for future remedial and preventive action. The assessment will lead to the
identification of priorities for intervention, and through application of a root cause analysis will attempt to
identify appropriate measures to control, reduce or eliminate releases of PTS, at national, regional or global
levels.
The objective of the project is to deliver a measure of the nature and comparative severity of damage and
threats posed at national, regional and ultimately at global levels by PTS. This will provide the GEF with a
science-based rationale for assigning priorities for action among and between chemical related environmental
issues, and to determine the extent to which differences in priority exist among regions.
1.1.2 Results
The project relies upon the collection and interpretation of existing data and information as the basis for the
assessment. No research will be undertaken to generate primary data, but projections will be made to fill
data/information gaps, and to predict threats to the environment. The proposed activities are designed to
obtain the following expected results:
Identification of major sources of PTS at the regional level;
Impact of PTS on the environment and human health;
Assessment of transboundary transport of PTS;
Assessment of the root causes of PTS related problems, and regional capacity to manage these
problems;
Identification of regional priority PTS related environmental issues; and
Identification of PTS related priority environmental issues at the global level.
The outcome of this project will be a scientific assessment of the threats posed by persistent toxic substances
to the environment and human health. The activities to be undertaken in this project comprise an evaluation of
the sources of persistent toxic substances, their levels in the environment and consequent impact on biota and
1
humans, their modes of transport over a range of distances, the existing alternatives to their use and
remediation options, as well as the barriers that prevent their good management.
1.1.3 Methodology
To achieve these results, the globe is divided into 12 regions namely: Arctic, North America, Europe,
Mediterranean, Sub-Saharan Africa, Indian Ocean, Central and North East Asia (Western North Pacific),
South East Asia and South Pacific, Pacific Islands, Central America and the Caribbean, Eastern and Western
south America, Antarctica. The twelve regions were selected based on obtaining geographical consistency
while trying to reside within financial constraints.
1.1.4 Management Structure
The Project Manager who is situated at UNEP Chemicals in Geneva, Switzerland directs the project. A
Steering Group comprising of representatives of other relevant intergovernmental organisations along with
participation from industry and the non-governmental community is established to monitor the progress of the
project and provide direction for the project manager. A Regional Coordinator (RC) assisted by a team of
approximately 4 persons controls each region. The Regional Coordinator and the Regional Team (RT) are
responsible for promoting the project, the collection of data at the national level and to carry out a series of
technical and priority setting workshops for analysing the data on PTS on a regional basis. Besides the 12
POPs from the Stockholm Convention, the regional team selects the chemicals to be assessed for its region
with selection open for review during the various workshops undertaken throughout the assessment process.
Each team writes the regional report for the respective region.
1.1.5 Data Processing
Data is collected on sources, environmental concentrations, human and ecological effects through
questionnaires that are filled at the national level. The results from this data collection along with
presentations from regional experts at the technical workshops are used to develop regional reports on the PTS
selected for analysis. A priority setting workshop with participation from representatives from each country
results in priorities being established regarding the threats and damages of these substances to each region.
The information and conclusions derived from the 12 regional reports will be used to develop a global report
on the state of these PTS in the environment.
The project is not intended to generate new information but to rely on existing data and its assessment to
arrive at priorities for these substances. The establishment of a broad and wide- ranging network of
participants involving all sectors of society was used for data collection and subsequent evaluation. Close
cooperation with other intergovernmental organizations such as UNECE, WHO, FAO, UNPD, World Bank
and others was obtained. Most have representatives on the Steering Group Committee that monitors the
progress of the project and critically reviews its implementation. Contributions were garnered from UNEP
focal points, UNEP POPs focal points, national focal points selected by the regional teams, industry,
government agencies, research scientists and NGOs.
1.1.6 Project Funding
The project costs approximately US$4.2 million funded mainly by the Global Environment Facility (GEF)
with sponsorship from countries including Australia, France, Germany, Sweden, Switzerland and the USA.
The project runs between September 2000 to April 2003 with the intention that the reports be presented to the
first meeting of the Conference of the Parties of the Stockholm Convention projected for 2003/4.
This report provides a regional review of the production, use, environmental impacts and environmental
transport of the group of chemicals known as Persistent Toxic Substances (PTS). The report is based on
existing information only, and did not involve any additional research. The information for the report was
assembled by the Regional Team Members on the basis of information supplied from a wide range of people
throughout the region (the Regional Network) and beyond. The recommendations given in the report on
regional priorities and future needs were developed during the Regional Technical Workshops and the
Regional Priority Setting Meeting.
2
1.2 SCOPE OF SUB- SAHARA AFRICA REGIONAL ASSESSMENT
The chemicals included in this review were the 12 chemicals covered under the Stockholm Convention on
Persistent Organic Pollutants (POPs), plus several other PTS chemicals. The 12 POPs are aldrin, chlordane,
DDT, dieldrin, dioxins, endrin, furans, hexachlorobenzene (HCB), heptachlor, toxaphene, mirex and
polychlorinated biphenyls (PCBs). Information was also obtained on other PTS chemicals: endosulfan,
hexachlorocyclohexane (HCH), phthalate esters, polyaromatic hydrocarbons (PAHs), pentachlorophenol,
organic lead, organic tin and organic mercury. Other chemicals considered for inclusion in the survey were,
atrazine, chlordecone, hexabromobiphenyl, polybrominated biphenyl ethers, chlorinated paraffins,
octylphenols, and nonylphenols.
1.2.1 Existing Assessments
Up to now, there has been no comprehensive regional assessment of organic pollutants in sub-Sahara Africa.
This UNEP/GEF assessment is therefore both a landmark and an important source of regional database on
persistent toxic substances (PTS). A previous sub-regional assessment of POPs (a subset of PTS), excluding
dioxins and furans, in West and Central Africa (WACAF) and East Africa (EAF), had been undertaken in the
past, especially in the early 1980s to the early 1990s. This was done under the aegis of the UNEP Regional
Seas Programme. The assessments, which were limited to selected countries in WACAF and EAF, began with
equipping selected laboratories and training national experts in the countries selected in the analysis of
chlorinated hydrocarbons and heavy metals. The landlocked countries were excluded.
The FAO attempted for the first time in the early 1990s, under the aegis of the Committee of Inland Fisheries
of Africa (CIFA), to collate the levels of chlorinated hydrocarbons (CHCs), specially organochlorine
pesticides (OCPs) and PCBs in water, sediments and biota in Africa, and which was published as a chapter in
the publication " Review of pollution in the African aquatic environment '' (Osibanjo et. al. 1994). This
remains the only existing Regional Assessment of CHCs in the region before this report.
1.2.2 Methodology
Information on the PTS chemicals was obtained through various means. Data on current production and use
was solicited from the relevant government agencies within the region. Heavy reliance was placed on CIA
Fact book, Internet, and where this failed, all other data were obtained from published papers and reports.
Additional information was obtained through searches of the published literature and through direct contacts
with researchers, government agencies and the regional network of experts. All of the information collected
from the above sources were entered into a series of standard questionnaires, which were provided by UNEP
Chemicals for this purpose. The data was also entered into the UNEP PTS database in Geneva (which is
accessible online www.unep.org; password required) to facilitate processing and analysis, and also to allow
for future updating and review.
The regional team members were responsible for promoting the project, collection of data at the national level
and, analysing the data on PTS on a regional basis. Data and information were collected on sources,
environmental concentrations, human and ecological effects through questionnaires that were filled at the
national level in the 47 countries of the region. Each regional team member was responsible for data
collection in at least 6 countries. The regional team held organizational meetings and were responsible for
filling the data from about 3000 questionnaires returned on to the UNEP PTS database.
The data gathering was aimed at obtaining information on all the chemicals mentioned in 1.1above. However,
as can be seen later in Chapter 3, data was not available on some of the chemicals, already indicating a
significant data gap, although this does not preclude their existence within the region. The potential for this
and the need for appropriate regional investigations, are discussed later in this report.
All the collected data, reviewed in the regional report, were analysed for technical accuracy and completeness
during the Regional Technical Workshops and the Regional Priority Setting Meeting. This report incorporates
the inputs from the participants during the Regional Technical Workshops and the Regional Priority Setting
Meeting. The recommendations given in Chapter 6 were based on the earlier comments made during the
3
Regional Technical Workshops, which were further enriched and endorsed by the Regional Priority Setting
Meeting.
1.3 PTS DEFINITIONS AND PROPERTIES
The substances assessed in this report are as follows: aldrin, chlordane, DDT, dieldrin, endrin, heptachlor,
hexachlorobenzene, mirex, toxaphene, PCBs, dioxins, furans, chlordecone, hexabromobiphenyl, HCH (lindane),
PAHs, PBDE, chlorinated paraffins, endosulfan, atrazine, pentachlorophenol, organic mercury compounds,
organic tin compounds, organic lead compounds, phthalates, octylphenols and nonylphenols. All the substances
in the PTS list under study were adopted for the region with the assumption that some or all of the chemicals must
have been used at one time or the other for specific purposes. The regional survey data is meant to be used as
benchmark for identifying PTS existing in the region. The non-identification of a PTS is however considered as a
data gap, rather than non-existence of the chemical in the region as searches were conducted for all the chemicals.
Summary of physico-chemical properties, including eco-toxicological and safety data, on each of the PTS
chemicals is given below.
1.3.1.1 Aldrin
Chemical Name: 1,2,3,4,10,10-Hexachloro-1,4,4a,5,8,8a-hexahydro-1,4-endo,exo-5,8-dimethanonaphthalene
(C12H8Cl6). CAS Number: 309-00-2
Properties: Solubility in water: 27 µg/L at 25°C; vapour pressure: 2.3 x 10⁻⁵ mm Hg at 20°C; log KOW: 5.17-
7.4.
Discovery/Uses: It has been manufactured commercially since 1950, and used throughout the world up to the
early 1970s to control soil pests such as corn rootworm, wireworms, rice water weevil, and grasshoppers. It
has also been used to protect wooden structures from termites.
Persistence/Fate: Readily metabolized to dieldrin by both plants and animals. Biodegradation is expected to
be slow and it binds strongly to soil particles, and is resistant to leaching into groundwater. Aldrin was
classified as moderately persistent with half-life in soil and surface waters ranging from 20 days to 1.6 years.
Toxicity: Aldrin is toxic to humans; the lethal dose for an adult has been estimated to be about 80 mg/kg
body weight. The acute oral LD50 in laboratory animals is in the range of 33 mg/kg body weight for guinea
pigs to 320 mg/kg body weight for hamsters. The toxicity of aldrin to aquatic organisms is quite variable, with
aquatic insects being the most sensitive group of invertebrates. The 96-h LC50 values range from 1-200 µg/L
for insects, and from 2.2-53 µg/L for fish. The maximum residue limits in food recommended by FAO/WHO
varies from 0.006 mg/kg milk fat to 0.2 mg/kg meat fat. Water quality criteria between 0.1 to 180 µg/L have
been published.
1.3.1.2 Dieldrin
Chemical Name: 1,2,3,4,10,10-Hexachloro-6,7-epoxy-1,4,4a,5,6,7,8,8a-octahydroexo-1,4-endo-5,8-
dimethanonaphthalene (C12H8Cl6O). CAS Number: 60-57-1
Properties: Solubility in water: 140 µg/L at 20°C; vapour pressure: 1.78 x 10⁻⁷ mm Hg at 20°C; log KOW:
3.69-6.2.
Discovery/Uses: It appeared in 1948 after World War II and used mainly for the control of soil insects such as
corn rootworms, wireworms and cat worms.
Persistence/Fate: It is highly persistent in soils, with a half-life of 3-4 years in temperate climates, and
bioconcentrates in organisms. The persistence in air has been estimated in 4-40 hrs.
Toxicity: The acute toxicity for fish is high (LC50 between 1.1 and 41 mg/L) and moderate for mammals
(LD50 in mouse and rat ranging from 40 to 70 mg/kg body weight). However, a daily administration of 0.6
mg/kg to rabbits adversely affected the survival rate. Aldrin and dieldrin mainly affect the central nervous
system but there is no direct evidence that they cause cancer in humans. The maximum residue limits in food
recommended by FAO/WHO varies from 0.006 mg/kg milk fat and 0.2 mg/kg poultry fat. Water quality
criteria between 0.1 to 18 µg/L have been published.
4
1.3.1.3 Endrin
Chemical Name: 3,4,5,6,9,9-Hexachloro-1a,2,2a,3,6,6a,7,7a-octahydro-2,7:3,6-dimethanonaphth[2,3-
b]oxirene (C12H8Cl6O). CAS Number: 72-20-8
Properties: Solubility in water: 220-260 µg/L at 25 °C; vapour pressure: 2.7 x 10⁻⁷ mm Hg at 25°C; log KOW:
3.21-5.34
Discovery/Uses: It has been used since the 50s against a wide range of agricultural pests, mostly on cotton
but also on rice, sugar cane, maize and other crops. It has also been used as a rodenticide.
Persistence/Fate: Is highly persistent in soils (half-lives of up to 12 years have been reported in some cases).
Bioconcentration factors of 14 to 18,000 have been recorded in fish, after continuous exposure.
Toxicity: Endrin is very toxic to fish, aquatic invertebrates and phytoplankton; the LC50 values are mostly less
than 1 µg/L. The acute toxicity is high in laboratory animals, with LD50 values of 3-43 mg/kg, and a dermal
LD50 of 5-20 mg/kg in rats. Long-term toxicity in the rat has been studied over two years and a NOEL of 0.05
mg/kg bw/day was found.
1.3.1.4 Chlordane
Chemical Name: 1,2,4,5,6,7,8,8-Octachloro-2,3,3a,4,7,7a-hexahydro-4,7-methanoindene (C10H6Cl8).
CAS Number: 57-74-9
Properties: Solubility in water: 56 µg/L at 25°C; vapour pressure: 0.98 x 10⁻⁵ mm Hg at 25 °C; log KOW:
6.00.
Discovery/Uses: Chlordane appeared in 1945 and was used primarily as an insecticide for control of
cockroaches, ants, termites, and other household pests. Technical chlordane is a mixture of at least 120
compounds. Of these, 60-75% are chlordane isomers, the remainder being related to endo-compounds
including heptachlor, nonachlor, diels-alder adduct of cyclopentadiene and
penta/hexa/octachlorocyclopentadienes.
Persistence/Fate: Chlordane is highly persistent in soils with a half-life of about 4 years. Its persistence and
high partition coefficient promotes binding to aquatic sediments and bioconcentration in organisms.
Toxicity: LC50 from 0.4 mg/L (pink shrimp) to 90 mg/L (rainbow trout) have been reported for aquatic
organisms. The acute toxicity for mammals is moderate with an LD50 in rat of 200-590 mg/kg body weight
(19.1 mg/kg body weight for oxychlordane). The maximum residue limits for chlordane in food are, according
to FAO/WHO between 0.002 mg/kg milk fat and 0.5 mg/kg poultry fat. Water quality criteria of 1.5 to 6 µg/L
have been published. Chlordane has been classified as a substance for which there is evidence of endocrine
disruption in an intact organism and possible carcinogenicity to humans.
1.3.1.5 Heptachlor
Chemical Name: 1,4,5,6,7,8,8-Heptachloro-3a,4,7,7a-tetrahydro-4,7-methanoindene (C10H5Cl7).
CAS Number: 76-44-8
Properties: Sol. in water: 180 µg/L at 25°C; vapour pressure: 0.3 x 10⁻⁵ mm Hg at 20°C; log KOW: 4.4-5.5.
Production/Uses: Heptachlor is used primarily against soil insects and termites, but also against cotton
insects, grasshoppers, and malaria mosquitoes. Heptachlor epoxide is a more stable breakdown product of
heptachlor.
Persistence/Fate: Heptachlor is metabolised in soils, plants and animals to heptachlor epoxide, which is more
stable in biological systems and is carcinogenic. The half-life of heptachlor in soil is in temperate regions 0.75
2 years. Its high partition coefficient provides the necessary conditions for bioconcentrating in organisms.
Toxicity: The acute toxicity of heptachlor to mammals is moderate (LD50 values between 40 and 119 mg/kg
have been published). The toxicity to aquatic organisms is higher and LC50 values down to 0.11 µg/L have
been found for pink shrimp. Limited information is available on the effects in humans and studies are
inconclusive regarding heptachlor and cancer. The maximum residue levels recommended by FAO/WHO are
between 0.006 mg/kg milk fat and 0.2 mg/kg meat or poultry fat.
1.3.1.6 Dichlorodiphenyltrichloroethane (DDT)
Chemical Name: 1,1,1-Trichloro-2,2-bis-(4-chlorophenyl)-ethane (C14H9Cl5). CAS Number: 50-29-3.
Properties: Solubility in water: 1.2-5.5 µg/L at 25°C; vapour pressure: 0.2 x 10⁻⁶ mm Hg at 20°C; log KOW:
6.19 for p,p'-DDT, 5.5 for p,p'-DDD and 5.7 for p,p'-DDE.
5
Discovery/Use: DDT appeared for use during World War II to control insects that spread diseases like
malaria, dengue fever and typhus. Following this, it was widely used on a variety of agricultural crops. The
technical product is a mixture of about 85% p,p'-DDT and 15% o,p'-DDT isomers.
Persistence/Fate: DDT is highly persistent in soils with a half-life of up to 15 years and of 7 days in air. It
also exhibits high bioconcentration factors (in the order of 50000 for fish and 500000 for bivalves). In the
environment, the product is metabolized mainly to DDD and DDE.
Toxicity: The lowest dietary concentration of DDT reported to cause egg shell thinning was 0.6 mg/kg for the
black duck. LC50 of 1.5 mg/L for largemouth bass and 56 mg/L for guppy have been reported. The acute
toxicity of DDT for mammals is moderate with an LD50 in rat of 113-118 mg/kg body weight. DDT has been
shown to have an estrogen-like activity, and possible carcinogenic activity in humans. The maximum residue
level in food recommended by WHO/FAO range from 0.02 mg/kg milk fat to 5 mg/kg meat fat. Maximum
permissible DDT residue levels in drinking water (WHO) is 1.0 µg/L.
1.3.1.7 Toxaphene
Chemical Name: Polychlorinated bornanes and camphenes (C10H10Cl8). CAS Number: 8001-35-2
Properties: Sol. in water: 550 µg/L at 20°C; vapour pressure: 3.3 x 10⁻⁵ mm Hg at 25°C; log KOW : 3.23-5.50.
Discovery/Uses: Toxaphene has been in use since 1949 as a nonsystemic insecticide with some acaricidal
activity, primarily on cotton, cereal grains fruits, nuts and vegetables. It was also used to control livestock
ectoparasites such as lice, flies, ticks, mange, and scab mites. The technical product is a complex mixture of
over 300 congeners, containing 67-69% chlorine by weight.
Persistence/Fate: Toxaphene has a half-life in soil from 100 days up to 12 years. It has been shown to
bioconcentrate in aquatic organisms (BCF of 4247 in mosquito fish and 76000 in brook trout).
Toxicity: Toxaphene is highly toxic in fish, with 96-hour LC50 values in the range of 1.8 µg/L in rainbow
trout to 22 µg/L in bluegill. Long term exposure to 0.5 µg/L reduced egg viability to zero. The acute oral
toxicity is in the range of 49 mg/kg body weight in dogs to 365 mg/kg in guinea pigs. In long term studies
NOEL in rats was 0.35 mg/kg bw/day, LD50 ranging from 60 to 293 mg/kg bw. For toxaphene exists a strong
evidence of the potential for endocrine disruption. Toxaphene is carcinogenic in mice and rats and is of
carcinogenic risk to humans, with a cancer potency factor of 1.1 mg/kg/day for oral exposure.
1.3.1.8 Mirex
Chemical Name: 1,1a,2,2,3,3a,4,5,5a,5b,6-Dodecachloroacta-hydro-1,3,4-metheno-1H-
cyclobuta[cd]pentalene (C10Cl12). CAS Number: 2385-85-5
Properties: Solubility in water: 0.07 µg/L at 25°C; vapour pressure: 3 x 10⁻⁷ mm Hg at 25°C; log KOW: 5.28.
Discovery/Uses: The use in pesticide formulations started in the mid 1950s largely focused on the control of
ants. It is also a fire retardant for plastics, rubber, paint, paper and electrical goods. Technical grade
preparations of mirex contain 95.19% mirex and 2.58% chlordecone, the rest being unspecified. Mirex is also
used to refer to bait comprising corncob grits, soya bean oil, and mirex.
Persistence/Fate: Mirex is considered to be one of the most stable and persistent pesticides, with a half-life is
soils of up to 10 years. Bioconcentration factors of 2600 and 51400 have been observed in pink shrimp and
fathead minnows, respectively. It is capable of undergoing long-range transport due to its relative volatility
(VPL = 4.76 Pa; H = 52 Pa m 3 /mol).
Toxicity: The acute toxicity of Mirex for mammals is moderate with an LD50 in rat of 235 mg/kg and dermal
toxicity in rabbits of 80 mg/kg. Mirex is also toxic to fish and can affect their behaviour (LC50 (96 hr) from 0.2
to 30 mg/L for rainbow trout and bluegill, respectively). Delayed mortality of crustaceans occurred at 1 µg/L
exposure levels. There is evidence of its potential for endocrine disruption and possibly carcinogenic risk to
humans.
1.3.1.9 Hexachlorobenzene (HCB)
Chemical Name: Hexachlorobenzene (C6H6). CAS Number: 118-74-1
Properties: Sol. in water: 50 µg/L at 20°C; vapour pressure: 1.09 x 10⁻⁵ mm Hg at 20°C; log KOW: 3.93-6.42.
Discovery/Uses: It was first introduced in 1945 as fungicide for seed treatments of grain crops, and used to
make fireworks, ammunition, and synthetic rubber. Today it is mainly a by-product in the production of a
large number of chlorinated compounds, particularly lower chlorinated benzenes, solvents and several
6
pesticides. HCB is emitted to the atmosphere in flue gases generated by waste incineration facilities and
metallurgical industries.
Persistence/Fate: HCB has an estimated half-life in soils of 2.7-5.7 years and of 0.5-4.2 years in air. HCB has
a relatively high bioaccumulation potential and long half-life in biota.
Toxicity: LC50 for fish varies between 50 and 200 µg/L. The acute toxicity of HCB is low with LD50 values of
3.5 mg/g for rats. Mild effects of the [rat] liver have been observed at a daily dose of 0.25 mg HCB/kg bw.
HCB is known to cause liver disease in humans (porphyria cutanea tarda) and has been classified as a possible
carcinogen to humans by IARC.
1.3.2 Industrial Compounds
1.3.2.1 Polychlorinated biphenyls (PCBs)
Chemical Name: Polychlorinated biphenyls (C12H(10-n)Cln, where n is within the range of 1-10). CAS
Number: Various (e.g. for Aroclor 1242, CAS No.: 53469-21-9; for Aroclor 1254, CAS No.: 11097-69-1);
Properties: Water solubility decreases with increasing chlorination: 0.01 to 0.0001 µg/L at 25°C; vapour
pressure: 1.6-0.003 x 10⁻⁶ mm Hg at 20°C; log KOW: 4.3-8.26.
Discovery/Uses: PCBs were introduced in 1929 and were manufactured in different countries under various
trade names (e.g., Aroclor, Clophen, Phenoclor). They are chemically stable and heat resistant, and were used
worldwide as transformer and capacitor oils, hydraulic and heat exchange fluids, and lubricating and cutting
oils. Theoretically, a total of 209 possible chlorinated biphenyl congeners exist, but only about 130 of these
are likely to occur in commercial products.
Persistence/Fate: Most PCB congeners, particularly those lacking adjacent unsubstituted positions on the
biphenyl rings (e.g., 2,4,5-, 2,3,5- or 2,3,6-substituted on both rings) are extremely persistent in the
environment. They are estimated to have half-lives ranging from three weeks to two years in air and, with the
exception of mono- and di-chlorobiphenyls, more than six years in aerobic soils and sediments. PCBs also
have extremely long half-lives in adult fish, for example, an eight-year study of eels found that the half-life of
CB153 was more than ten years.
Toxicity: LC50 for the larval stages of rainbow trout is 0.32 µg/L with a NOEL of 0.01 µg/L. The acute
toxicity of PCB in mammals is generally low and LD50 values in rat of 1 g/kg bw. IARC has concluded that
PCB are carcinogenic to laboratory animals and probably also for humans. They have also been classified as
substances for which there is evidence of endocrine disruption in an intact organism.
1.3.2.2 Polychlorinated dibenzo-p-dioxins (PCDDs) and Polychlorinated dibenzofurans (PCDFs)
Chemical Name: PCDDs (C12H(8-n)ClnO2) and PCDFs (C12H(8-n)ClnO) may contain between 1 and 8 chlorine
atoms. Dioxins and furans have 75 and 135 possible positional isomers, respectively. CAS Number: Various
(2,3,7,8-TetraCDD: 1746-01-6; 2,3,7,8-TetraCDF: 51207-31-9).
Properties: Solubility in water: in the range 0.43 0.0002 ng/L at 25°C; vapour pressure: 2 0.007 x 10⁻⁶
mm Hg at 20°C; log KOW: in the range 6.60 8.20 for tetra- to octa-substituted congeners.
Discovery/Uses: They are by-products resulting from the production of other chemicals and from the low-
temperature combustion and incineration processes. They have no known use.
Persistence/Fate: PCDD/Fs are characterized by their lipophilicity, semi-volatility and resistance to
degradation (half life of TCDD in soil of 10-12 years) and to long-range transport. They are also known for
their ability to bio-concentrate and biomagnify under typical environmental conditions.
Toxicity: The toxicological effects reported refers to the 2,3,7,8-substituted compounds (17 congeners) that
are agonist for the AhR. All the 2,3,7,8-substituted PCDDs and PCDFs plus coplanar PCBs (with no chlorine
substitution at the ortho positions) show the same type of biological and toxic response. Possible effects
include dermal toxicity, immunotoxicity, reproductive effects and teratogenicity, endocrine disruption and
carcinogenicity. At the present time, the only persistent effect associated with dioxin exposure in humans is
chloracne. The most sensitive groups are fetus and neonatal infants.
Effects on the immune systems in the mouse have been found at doses of 10 ng/kg bw/day, while reproductive
effects were seen in rhesus monkeys at 1-2 ng/kg bw/day. Biochemical effects have been seen in rats down to
7
0.1 ng/kg bw/day. In a re-evaluation of the TDI for dioxins, furans (and planar PCB), the WHO decided to
recommend a range of 1-4 TEQ pg/kg bw, although more recently the acceptable intake value has been set
monthly at 1-70 TEQ pg/kg bw.
1.3.3 Regional Specific
1.3.3.1 Atrazine
Chemical Name: 2-Chloro-4-(ethlamino)-6-(isopropylamino)-s-triazine (C10H6Cl8).
CAS Number: 19-12-24-9
Properties: Solubility in water: 28 mg/L at 20°C; vapour pressure: 3.0 x 10⁻⁷ mm Hg at 20°C; log Kow: 2.34.
Discovery/Uses: Atrazine is a selective triazine herbicide used to control broadleaf and grassy weeds in corn,
sorghum, sugarcane, pineapple, christmas trees, and other crops, and in conifer reforestation plantings. It was
discovered and introduced in the late 50's. Atrazine is still widely used today because it is economical and
effectively reduces crop losses due to weed interference.
Persistence/Fate: The chemical does not adsorb strongly to soil particles and has a lengthy half-life (60 to >100
days). Atrazine has a high potential for groundwater contamination despite its moderate solubility in water.
Toxicity: The oral LD50 for atrazine is 3090 mg/kg in rats, 1750 mg/kg in mice, 750 mg/kg in rabbits, and 1000
mg/kg in hamsters. The dermal LD50 in rabbits is 7500 mg/kg and greater than 3000 mg/kg in rats. Atrazine is
practically nontoxic to birds. The LD50 is greater than 2000 mg/kg in mallard ducks. Atrazine is slightly toxic to
fish and other aquatic life. Atrazine has a low level of bioaccumulation in fish. Available data regarding atrazine's
carcinogenic potential are inconclusive.
1.3.3.2 Hexachlorocyclohexanes (HCH)
Chemical Name: 1,2,3,4,5,6-Hexachlorocyclohexane (mixed isomers) (C6H6Cl6). CAS Number: 608-73-1
(-HCH, lindane: 58-89-9).
Properties: -HCH: sol. in water: 7 mg/L at 20°C; vapour pressure: 3.3 x 10⁻⁵ mm Hg at 20°C; log KOW: 3.8.
Discovery/Uses: There are two principle formulations: "technical HCH", which is a mixture of various
isomers, including -HCH (55-80%), -HCH (5-14%) and -HCH (8-15%), and "lindane", which is
essentially pure -HCH. Historically, lindane was one of the most widely used insecticides in the world. Its
insecticidal properties were discovered in the early 1940s. It controls a wide range of sucking and chewing
insects and has been used for seed treatment and soil application, in household biocidal products, and as
textile and wood preservatives.
Persistence/Fate: Lindane and other HCH isomers are relatively persistent in soils and water, with half lives
generally greater than 1 and 2 years, respectively. HCH are much less bioaccumulative than other
organochlorines because of their relatively low liphophilicity. On the contrary, their relatively high vapor
pressures, particularly of the -HCH isomer, determine their long-range transport in the atmosphere.
Toxicity: Lindane is moderately toxic for invertebrates and fish, with LC50 values of 20-90 µg/L. The acute
toxicity for mice and rats is moderate with LD50 values in the range of 60-250 mg/kg. Lindane resulted to have
no mutagenic potential in a number of studies but an endocrine disrupting activity.
1.3.3.3 Endosulfan
Chemical Name: 6,7,8,9,10,10-Hexachloro-1,5,5a,6,9,9a-hexahydro-6,9-methano-2,4,3-benzodioxathiepin-3-
oxide (C9H6Cl6O3S). CAS Number: 115-29-7.
Properties: Solubility in water: 320 µg/L at 25°C; vapour pressure: 0.17 x 10⁻⁴ mm Hg at 25°C; log KOW:
2.23-3.62.
Discovery/Uses: Endosulfan was first introduced in 1954. It is used as a contact and stomach insecticide and
acaricide in a great number of food and non-food crops (e.g. tea, vegetables, fruits, tobacco, cotton) and it
controls over 100 different insect pests. Endosulfan formulations are used in commercial agriculture and home
gardening and for wood preservation. The technical product contains at least 94% of two pure isomers, - and
-endosulfan.
Persistence/Fate: It is moderately persistent in the soil environment with a reported average field half-life of
50 days. The two isomers have different degradation times in soil (half-lives of 35 and 150 days for - and -
isomers, respectively, in neutral conditions). It has a moderate capacity to adsorb to soils and it is not likely to
8
leach to groundwater. In plants, endosulfan is rapidly broken down to the corresponding sulfate, on most fruits
and vegetables, 50% of the parent residue is lost within 3 to 7 days.
Toxicity: Endosulfan is highly to moderately toxic to bird species (Mallards: oral LD50 31 - 243 mg/kg) and it
is very toxic to aquatic organisms (96-hour LC50 rainbow trout 1.5 µg/L). It has also shown high toxicity in
rats (oral LD50: 18 - 160 mg/kg, and dermal: 78 - 359 mg/kg). Female rats appear to be 45 times more
sensitive to the lethal effects of technical-grade endosulfan than male rats. The -isomer is considered to be
more toxic than the -isomer. There is a strong evidence of its potential for endocrine disruption.
1.3.3.4 Pentachlorophenol (PCP)
Chemical Name: Pentachlorophenol (C6Cl5OH). CAS Number: 87-86-5.
Properties: Solubility in water: 14 mg/L at 20°C; vapour pressure: 16 x 10-5 mm Hg at 20°C; log KOW: 3.32
5.86.
Discovery/Uses: It is used as insecticide (termiticide), fungicide, non-selective contact herbicide (defoliant)
and, particularly as wood preservative. It is also used in anti-fouling paints and other materials (e.g. textiles,
inks, paints, disinfectants and cleaners) as inhibitor of fermentation. Technical PCP contains trace amounts of
PCDDs and PCDFs
Persistence/Fate: The rate of photodecomposition increases with pH (t1/2 100 hr at pH 3.3 and 3.5 hr at pH
7.3). Complete decomposition in soil suspensions takes >72 days, other authors reports half-life in soils of 23-
178 days. Although enriched through the food chain, it is rapidly eliminated after discontinuing the exposure
(t
1/2 = 10-24 h for fish).
Toxicity: It has been proved to be acutely toxic to aquatic organisms and have certain effects on human
health, at the time that exhibits off-flavour effects at very low concentrations. The 24-h LC50 values for trout
were reported as 0.2 mg/L, and chronic toxicity effects were observed at concentrations down to 3.2 µg/L.
Mammalian acute toxicity of PCP is moderate-high. LD50 oral in rat ranging from 50 to 210 mg/kg bw have
been reported. LC50 ranged from 0.093 mg/L in rainbow trout (48 h) to 0.77-0.97 mg/L for guppy (96 h) and
0.47 mg/L for fathead minnow (48 h).
1.3.3.5 Polycyclic Aromatic Hydrocarbons (PAHs)
Chemical Name: PAHs is a group of compounds consisting of two or more fused aromatic rings. CAS
Number:Various
Properties: Solubility in water: 0.00014 -2.1 mg/L at 25şC; vapour pressure: from 0.0015 x 10⁻⁹ to 0.0051
mmHg at 25°C; log KOW: 4.79-8.20
Discovery/Use: Most of these are formed during incomplete combustion of organic material and the
composition of PAHs mixture vary with the source(s) and also due to selective weathering effects in the
environment.
Persistence/Fate: Persistence of the PAHs varies with their molecular weight. The low molecular weight
PAHs are most easily degraded. The reported half-lives of naphthalene, anthracene and benzo(e)pyrene in
sediment are 9, 43 and 83 hours, respectively, whereas for higher molecular weight PAHs, their half-lives are
up to several years in soils/sediments. The BCFs in aquatic organisms frequently range between 100-2000 and
it increases with increasing molecular size. Due to their wide distribution, the environmental pollution by
PAHs has aroused global concern.
Toxicity: The acute toxicity of low PAHs is moderate with an LD50 of naphthalene and anthracene in rat of
490 and 18000 mg/kg body weight respectively, whereas the higher PAHs exhibit higher toxicity and LD50 of
benzo(a)anthracene in mice is 10mg/kg body weight. In Daphnia pulex, LC50 for naphthalene is 1.0 mg/L, for
phenanthrene 0.1 mg/L and for benzo(a)pyrene is 0.005 mg/L. The critical effect of many PAHs in mammals
is their carcinogenic potential. The metabolic action of these substances produce intermediates that bind
covalently with cellular DNA. IARC has classified benz[a]anthracene, benzo[a]pyrene, and
dibenzo[a,h]anthracene as probable carcinogenic to humans. Benzo[b]fluoranthene and indeno[1,2,3-
c,d]pyrene were classified as possible carcinogens to humans.
1.3.3.6 Organomercury compounds
Chemical Name: The main compound of concern is methyl mercury (HgCH3). CAS Number: 22967-92-6
9
Properties: Solubility in water: 0.1 g/L at 21°C (HgCH3Cl) and 1.0 g/L at 25şC (Hg(CH3)2); vapour pressure:
8.5 x 10⁻³ mm Hg at 25°C (HgCH3Cl); log KOW: 1.6 (HgCH3Cl) and 2.28 (Hg(CH3)2).
Production/Uses: There are many sources of mercury release to the environment, both natural (volcanoes,
mercury deposits, and volatilization from the ocean) and human-related (coal combustion, chlorine alkali
processing, waste incineration, and metal processing). It is also used in thermometers, batteries, lamps,
industrial processes, refining, lubrication oils, and dental amalgams. Methyl mercury has no industrial uses; it
is formed in the environment by methylation of the inorganic mercurial ion mainly by microorganisms in the
water and soil.
Persistence/Fate: Mercury released into the environment can either stay close to its source for long periods,
or be widely dispersed on a regional or even world-wide basis. Not only are methylated mercury compounds
toxic, but highly bioaccumulative as well. The increase in mercury as it rises in the aquatic food chain results
in relatively high levels of mercury in fish consumed by humans. Ingested elemental mercury is only 0.01%
absorbed, but methyl mercury is nearly 100% absorbed from the gastrointestinal tract. The biological half-life
of mercury is 60 days.
Toxicity: Long-term exposure to either inorganic or organic mercury can permanently damage the brain,
kidneys, and developing foetus. The most sensitive target of low level exposure to metallic and organic
mercury following short or long term exposures appears to be the nervous system.
1.3.3.7 Hexabromobiphenyl (HxBB)
Chemical Name: Hexabromobiphenyl (C12H4Br6 ). CAS Number: 59536-65-1
Properties: Solubility in water: 0.6 µg/L at 25°C; vapour pressure: 10-7 mm Hg at 20°C; log KOW: 6.39.
Discovery/Uses: The production of polybrominated biphenyls (PBBs) began in 1970. HxBB was used as a
fire retardant mainly in thermoplastics for constructing business machine housing and industrial (e.g. motor
housing) and electrical (e.g. radio and TV parts) products. Smaller amounts were used as a fire retardant in
coating and lacquers and in polyurethane foam for auto upholstery.
Persistence/Fate: HxBB is strongly adsorbed to soil and sediments and usually persist in the environment.
HxBB resists both chemical and biological degradation. HxBB has been found in several sediment samples
from the estuaries of large rivers and has been identified in edible fish.
Toxicity: Few toxicity data are available from short-term tests on aquatic organisms. The LD50 values of
commercial mixtures show a relatively low order of acute toxicity (LD50 range from > 1 to 21.5 g/kg body
weight in laboratory rodents). Oral exposure of laboratory animals to PBBs produced body weight loss, skin
disorders, and nervous system effects, and birth defects. Humans exposed through contaminated food
developed skin disorders, such as acne and hair loss. PBBs exhibit endocrine disrupting activity and possible
carcinogenicity to humans.
1.3.3.8 Polybrominated diphenyl ethers (PBDEs)
Chemical Name: Polybrominated diphenyl ethers (C12H(10-n)BrnO, where n = 1-10). As in the case of PCBs
the total number of congeners is 209, with a predominance in commercial mixtures of the tetra-, penta- and
octa-substituted isomers. CAS Number: Various (PeBDE: 32534-81-9; OBDE: 32536-52-0; DeBDE: 1163-
19-5)
Properties: Solubility in water: 0.9 ng/L at 25°C (PeBDE); vapour pressure: 3.85 x 10⁻³ to <10-7 mmHg at
20-25 °C; log KOW: 4.28 - 9.9.
Discovery/Uses: Since the 1960s, three commercial PBDE formulations are in production. The
pentabrominated product is used principally to flame retard polyurethane foams in furniture, carpet underlay
and bedding. Commercial octa is a mixture of hexa- (10-12%), hepta- (44-46%), octa- (33-35%) and
nonabromodiphenyl (10-11%) ethers. It is used to flame retard a wide variety of thermoplastics and is
recommended for injection moulding applications such as high impact polystyrene (HIPS). The deca product
(a single congener) is used predominantly for textiles and denser plastics such as housings for a variety of
electrical products in particular TVs and computers.
Persistence/Fate: Data on environmental fate, although limited, suggest that biodegradation is not an
important degradation pathway, but that photodegradation may play a significant role. They have already been
found in high concentrations in marine birds and mammals from remote areas. The half-lives of PBDE
10
components in rat adipose tissue varies between 19 and 119 days, the higher values being for the higher
brominated congeners.
Toxicity: The available data suggest that the lower (tetra- to hexa-) PBDE congeners are likely to be
carcinogens, endocrine disruptors, and/or neurodevelopmental toxicants. Studies in rats with commercial
PeBDE indicate a low acute toxicity via oral and dermal routes of exposure, with LD50 values > 2000 mg/kg
bw. In a 30-day study with rats, effects on the liver could be seen at a dose of 2 mg/kg bw/day, with a NOEL
at 1mg/kg bw/day. The toxicity to Daphnia magna has also been investigated and LC50 was found to be 14
g/L with a NOEC of 4.9 g/L. Although data on toxicology is limited, they have potential endocrine
disrupting properties, and there are concerns over the health effects of exposure.
1.3.3.9 Phthalates
Chemical Name: They encompass a wide family of compounds. Dimethylphthalate (DMP), diethylphthalate
(DEP), dibutylphthalate (DBP), benzylbutylphthalate (BBP), di(2-ethylhexyl)phthalate (DEHP)(C24H38O4)
and dioctylphthalate (DOP) are some of the most common. CAS Nos.: 84-74-2 (DBP), 85-68-7 (BBP), 117-
81-7 (DEHP).
Properties: The physico-chemical properties of phthalic acid esters vary greatly depending on the alcohol
moieties. Solubility in water: 9.9 mg/L (DBP) and 0.3 mg/L (DEHP) at 25°C; vapour pressure: 3.5 x 10⁻⁵
(DBP) and 6.4 x 10⁻⁶ (DEHP) mm Hg at 25°C; log KOW: 1.5 to 7.1.
Discovery/Uses: They are widely used as plasticisers, insect repellents, solvents for cellulose acetate in the
manufacture of varnishes and dopes. Vinyl plastic may contain up to 40% DEHP.
Persistence/fate: They have become ubiquitous pollutants, in marine, estuarine and freshwater sediments,
sewage sludges, soils and food. Degradation (t1/2) values generally range from 1-30 days in soils and
freshwaters.
Toxicity: The acute toxicity of phthalates is usually low: the oral LD50 for DEHP is about 25-34 g/kg,
depending on the species; for DBP reported LD50 values following oral administration to rats range from 8 to
20 g/kg body weight; in mice, values are approximately 5 to 16 g/kg body weight. In general, DEHP is not
toxic for aquatic communities at the low levels usually present. In animals, high levels of DEHP damaged the
liver and kidney and affected the ability to reproduce. There is no evidence that DEHP causes cancer in
humans but they have been reported as endocrine disrupting chemicals. The EPA proposed a Maximum
Admissible Concentration (MAC) of 6 µg/L of DEHP in drinking water.
1.3.3.10 Nonyl- and Octyl-phenols
Chemical Name: NP: C15H24O; OP: C14H22O. CAS Number: 25154-52-3 (NP).
Properties: Solubility in water: 6.3 µg/L (NP) at 25°C; vapour pressure: 7.5 x 10⁻⁴ mm Hg at 20°C (NP); log
KOW: 4.5 (NP) and 5.92 (OP).
Discovery/Uses: NP and OP are the starting material in the synthesis of alkylphenol ethoxylates (APEs), first
used in the 60s. These compounds are highly effective cleaning agents or surfactants that have been widely
used in a number of industrial sectors including textiles, pulp and paper, paints, adhesives, resins and
protective coatings. Alkylphenols can also be used as plasticisers, stabilisers for rubbers, lube oil additives,
and the alkylphenol phosphite derivatives can be used as UV stabilisers in plastics.
Persistence/Fate: NP and OP are the end degradation products of APEs under both aerobic and anaerobic
conditions. Therefore, the major part is released to water and concentrated in sewage sludges. NPs and t-OP
are persistent in the environment with half-lives of 30-60 years in marine sediments, 1-3 weeks in estuarine
waters and 10-48 hours in the atmosphere. Due to their persistence they can bioaccumulate to a significant
extent in aquatic species. However, excretion and metabolism is rapid.
Toxicity: NP and OP have acute toxicity values for fish, invertebrates and algae ranging from 17 to 3000
µg/L. In chronic toxicity tests the lowest NOEC are 6 µg/L in fish and 3.7 µg/L in invertebrates. The threshold
for vitellogenin induction in fish is 10 µg/L for NP and 3 µg/L for OP (similar to the lowest NOEC).
Alkylphenols are endocrine disrupting chemicals also in mammals.
11
1.3.3.11 Organotin compounds
Chemical Name: Organotin compounds comprise mono-, di-, tri- and tetrabutyl and triphenyl tin compounds.
They conform to the following general formula (n-C4H9)nSn-X and (C6H5)3Sn-X, where X is an anion or a
group linked covalently through a hetero-atom. CAS Number: 56-35-9 (TBTO); 76-87-9 (TPTOH)
Properties: Solubility in water: 4 mg/L (TBTO) and 1 mg/L (TPTOH) at 25°C and pH 7; vapour pressure: 7.5
x 10-7 mm Hg at 20°C (TBTO) 3.5 x 10⁻⁸ mmHg at 50şC (TPTOH); log KOW: 3.19 - 3.84. In sea water and
under normal conditions, TBT exists as three species in seawater (hydroxide, chloride, and carbonate).
Discovery/Uses: They are mainly used as antifouling paints (tributyl and triphenyl tin) for underwater
structures and ships. Minor identified applications are as antiseptic or disinfecting agents in textiles and
industrial water systems, such as cooling tower and refrigeration water systems, wood pulp and paper mill
systems, and breweries. They are also used as stabilisers in plastics and as catalytic agents in soft foam
production. It is also used to control the shistosomiasis in various parts of the world.
Persistence/Fate: Under aerobic conditions, TBT takes 1 to 3 months to degrade, but in anaerobic soils may
persist for more than 2 years. Because of the low water solubility it binds strongly to suspended material and
sediments. TBT is lipophilic and tends to accumulate in aquatic organisms. Oysters exposed to very low
concentrations exhibit BCF values from 1000 to 6000.
Toxicity: TBT is moderately toxic and all breakdown products are even less toxic. Its impact on the
environment was discovered in the early 1980s in France with harmful effects in aquatic organisms, such as
shell malformations of oysters, imposex in marine snails and reduced resistance to infection (e.g. in flounder).
Molluscs react adversely to very low levels of TBT (0.06-2.3 ug/L). Lobster larvae show a nearly complete
cessation of growth at just 1.0 ug/L TBT. In laboratory tests, reproduction was inhibited when female snails
exposed to 0.05-0.003 ug/L of TBT developed male characteristics. Large doses of TBT have been shown to
damage the reproductive and central nervous systems, bone structure, and the liver bile duct of mammals.
1.3.3.12 Chlorinated Paraffins (CPs)
Chemical Name: Polychlorinated alkanes (CxH(2x-y+2)Cly). They are manufactured by chlorination of liquid n-
alkanes or paraffin wax and contain from 30 to 70% chlorine. The products are often divided in three groups
depending on chain length: short chain (C10 C13), medium (C14 C17) and long (C18 C30) chain lengths.
CAS Number: 108171-26-2
Properties: They are largely depending on the chlorine content. Solubility in water: 1.7 to 236 µg/L at 25°C;
vapour pressure: 6.78 x 10⁻² to 8.47 x 10⁻⁹ mm Hg at 20°C; log KOW: in the range from 5.06 to 8.12.
Discovery/Uses: The largest application is as a plasticiser, generally in conjunction with primary plasticisers
such as certain phthalates in flexible PVC. The chlorinated paraffins also impart a number of technical
benefits, of which the most significant is the enhancement of flame retardant properties and extreme pressure
lubrication.
Persistence/Fate: CPs may be released into the environment from improperly disposed metal-working fluids
or polymers containing chlorinated paraffins. Loss of chlorinated paraffins by leaching from paints and
coatings may also contribute to environmental contamination. Short chain CPs with less than 50 % chlorine
content seem to be degraded under aerobic conditions. The medium and long chain products are degraded
more slowly. CPs are bioaccumulated and both uptake and elimination are faster for the substances with low
chlorine content.
Toxicity: The acute toxicity of CPs in mammals is low with reported oral LD50 values ranging from 4 - 50
g/kg bw, although in repeated dose experiments, effects on the liver have been seen at doses of 10 100
mg/kg bw/day. Short-chain and mid-chain grades have been shown, in laboratory tests, to show toxic effects
on fish and other forms of aquatic life after long-term exposure. The NOEL appears to be in the range of 25
µg/L for the most sensitive aquatic species tested.
1.3.3.13 Chlordecone
Chemical Name: Decachlorooctahydro-1,3,4-metheno-2H-cyclobuta(cd)pentalen-2-one (C10Cl10O). Also
known as Kepone. CAS Number: 143-50-0
Properties: Solubility in water: 7.6 mg/L at 25°C; vapour pressure: < 3 x 10⁻⁵ mmHg at 25°C; log KOW: 4.50.
Discovery/Uses: Chlordecone is released to the atmosphere as a result of its manufacture and use as an
insecticide. Chlordecone also occurs as a degradation product of the insecticide Mirex. As a fungicide against
12
apple scab and powdery mildew former use and to control the colorado potato beetle, rust mite on non-bearing
citrus, and potato and tobacco were worm on gladioli and other plants. Chlordecone was formerly registered
for the control of rootborers on bananas. Non-food uses included wireworm control in tobacco fields and bait
to control ants and other insects in indoor and outdoor areas.
Persistence/Fate: The estimated half-life in soils is between 1-2 years, whereas in air it is much higher, up to
50 years. It will not be expected to hydrolyse, or biodegrade in the environment. Also direct photodegradation
is not significant similarly as evaporation from water. General population exposure to chlordecone occurs
mainly through the consumption of contaminated fish and seafood.
Toxicity: Workers who were exposed to high levels of chlordecone over a long period (more than one year)
showed harmful effects on the nervous system, skin, liver, and male reproductive system. These workers were
probably exposed mainly through touching chlordecone, although they may have inhaled or ingested some as
well. Animal studies with chlordecone have shown effects similar to those seen in people, as well as harmful
kidney effects, developmental effects, and effects on the ability of females to reproduce. There are no studies
available on whether chlordecone is carcinogenic in people. However, studies in mice and rats have shown
that ingesting chlordecone can cause liver, adrenal gland, and kidney tumors. Very highly toxic for some
species such as Atlantic menhaden, sheepshead minnow or donaldson trout with LC50 between 21.4 56.9
µg/L.
1.3.3.14 Organolead compounds
Chemical Name: Alkyllead compounds may be confined to tetramethyllead (TML, Pb(CH3)4) and
tetraethyllead (TEL, Pb(C2H5)4). CAS Number: 75-74-1 (TML) and 78-00-2 (TEL).
Properties: Solubility in water: 17.9 mg/L (TML) and 0.29 mg/L (TEL) at 25°C; vapour pressure: 22.5 and
0.15 mm Hg at 20°C for TML and TEL, respectively.
Discovery/Uses: Tetramethyl and tetraethyllead are widely used as "anti-knocking" additives in gasoline. The
release of TML and TEL are drastically reduced with the introduction of unleaded gasoline in late 70's in
USA and followed by other parts of the world. However, leaded gasoline is still available which contribute to
the emission of TEL and to a less extent TML to the environment.
Persistence/Fate: Under environmental conditions such as in air or in aqueous solution, dealkylation occurs
to produce the less alkylated forms and finally to inorganic lead. However, there is limited evidence that
under some circumstances, natural methylation of lead salts may occur. Minimal bioaccumulations were
observed for TEL in shrimps (650x), mussels (120x) and plaice (130x) and for TML in shrimps (20x) ,
mussels (170x), and plaice (60x).
Toxicity: Lead and lead compounds has been found to cause cancer in the respiratory and digestive systems
of workers in lead battery and smelter plants. However, tetra-alkyllead compounds have not been sufficiently
tested for the evidence of carcinogenicity. Acute toxicity of TEL and TML are moderate in mammals and high
for aquatic biota. LD50 (rat, oral) for TEL is 35 mg Pb/kg and 108 mg Pb/kg for TML. LC50 (fish, 96hrs) for
TEL is 0.02 mg/kg and for TML is 0.11 mg/kg.
1.4 DEFINITION OF THE SUB-SAHARA AFRICA REGION
Sub-Sahara Africa is the second largest of the earth's seven continents, and with the adjacent islands covers
about 21,787, 284 sq. km, or about 20% of the world's total land area. It is also the largest of the 12 regions in
the UNEP PTS project, comprising about 47 independent African countries. A map of Sub-Sahara Africa is
shown Figure 1.1. Algeria, Egypt, Libya and Morocco are excluded as these countries belong to the
Mediterranean Region under the project. For the purposes of this project, the region was considered to
include the following countries and island states: Angola, Benin, Botswana, Burkina Faso, Burundi,
Cameroon, Central African Republic, Chad, Comoros, Congo (Brazzaville), Cote d'Ivoire, Democratic
Republic of Congo, Djibouti, Equatorial Guinea, Eritrea, Ethiopia, Gabon, Ghana, Guinea-Bissau, Guinea,
Kenya, Lesotho, Liberia, Madagascar, Malawi, Mali, Mauritania, Mauritius, Mozambique, Namibia, Niger,
Nigeria, Rwanda, Sao Tome and Principe, Senegal, Seychelles, Sierra Leone, Somalia, South Africa, Sudan,
Swaziland, Tanzania, Togo, Uganda, Zambia and Zimbabwe.
13
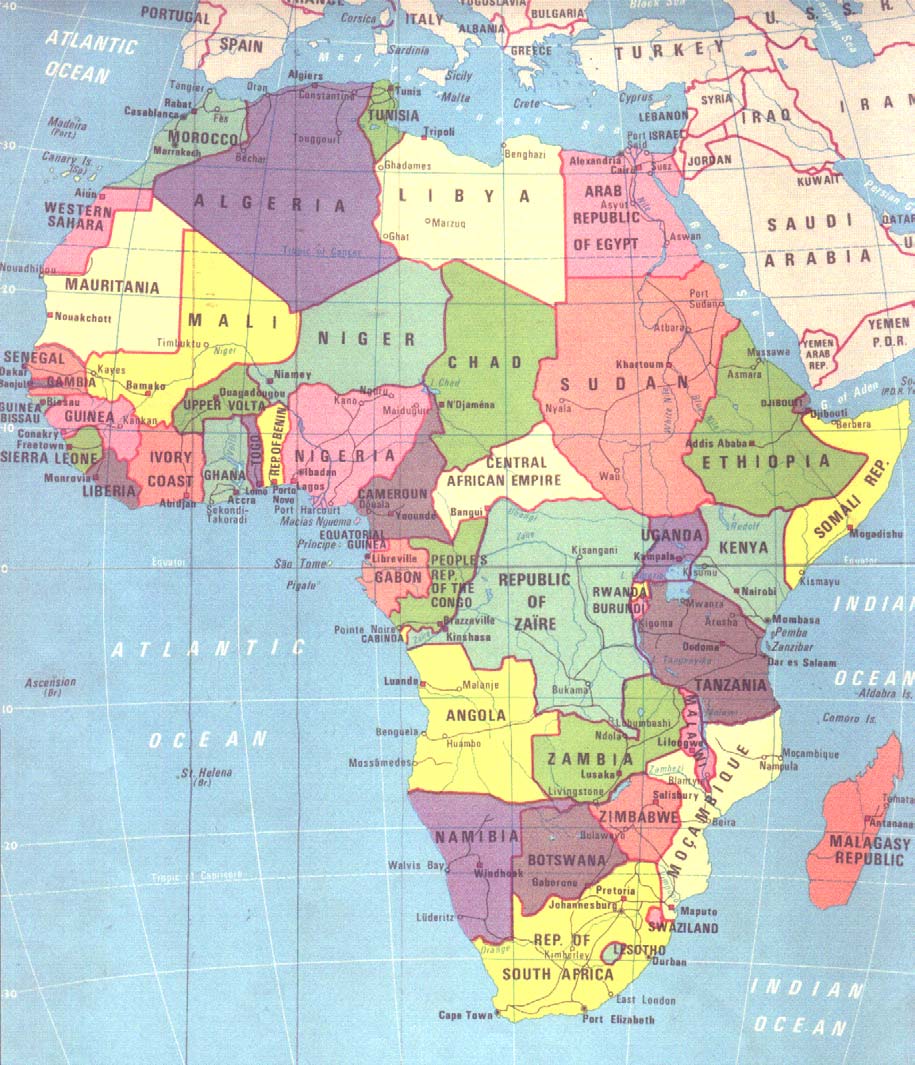
Fig 1.1:
Map showing countries of Sub-Sahara Africa, Region V; excluding Algeria, Egypt, Libya and
Morocco, which belong to the Mediterranean Region.
14
Straddling the equator, Sub-Sahara Africa stretches about 6500 km from its northern most part in Mauritania,
to its southernmost tip, Cape Agulhas in South Africa. The maximum width of the continent measured from
the tip of the Cape Vert in Senegal, in the west, to Cape Xaafuun (Ras Hafun) in Somalia, in the east, is about
7,560 km. The highest point on the continent is the perpetually snow-capped Mount Kilimanjaro (5,895 m) in
Tanzania; the lowest is Lake `Asal (153 m below sea level) in Djibouti.
The coastal and marine environment of sub-Saharan Africa embodies 32 countries including the small island
states. The coastline is characterised by few indentations with total length of about 25,000 km, which in
proportion to its area is less than that of any other continent. Population density is about 30 persons per sq km.
However, the coastal areas are the most densely populated and industrialised parts of almost every sub-
Saharan country, with about 50% of the population residing within 100 km of coastline. The coastal areas are
also the location of the main import and export centres and provide food supplies for the landlocked countries
of the region. PTS pesticide imports enter the countries through the ports mainly while land borders are
important with respect to transboundary movements of PTS within the sub-regions.
The main islands associated with a combined area of some 621,600 sq km, are Madagascar, Zanzibar, Pemba,
Mauritius, Reunion, the Seychelles, and the Comoro Islands in the Indian Ocean; Săo Tomé, Principe, and
Bioko in the Gulf of Guinea; St Helena, Ascension, and the Bijagós Archipelago in the Atlantic; and the Cape
Verde Islands, the Canary Islands, and the Madeira Islands in the North Atlantic. Although considered
geographically part of Africa, St Helena, Ascension, the Bijagós Archipelago, the Canary Islands, and the
Madeira Islands have few, if any, economic, political, or cultural links with the continent. Their ties are rather
with western Europe: St Helena and Ascension are dependencies of the United Kingdom; the Canary and
Madeira islands are an integral part of metropolitan Spain and Portugal, respectively.
1.5 PHYSICAL SETTING
Since the initiative taken on POPs (the Stockholm Convention) was part of the driving force behind this PTS
project, and part of the concern regarding POPs deals with long distance transport, other geological,
geographical issues and exposure of humans and biota, knowledge regarding these aspects is required for a
better understanding of PTS in Africa. In the following sections, relevant geographical, topographical,
biological and social aspects of the region will be discussed.
1.5.1 Physical/Geographical Description of the Region
Africa may be divided into three major regions: the Northern Plateau, the Central and Southern Plateau, and
the Eastern Highlands. In general, elevations increase across the continent from northwest to southeast, the
average being about 560 m. The coastal plains, with the exception of the Mediterranean and the Guinea
coasts, are generally narrow.
The Eastern Highlands, the highest part of the continent, lie near the eastern coast, extending from the Red
Sea south to the Zambezi along the fault line of the Rift Valley. The region has an average elevation of more
than 1,500 m, and in the Ethiopian Plateau it rises in stages to about 3,000 m. Ras Dashan (4,620 m in
northern Ethiopia) is the highest point of the plateau. South of the Ethiopian Plateau are a number of towering
volcanic peaks, including Mount Kilimanjaro, Mount Kenya, and Mount Elgon. The most distinctive feature
of the Eastern Highlands is the Rift Valley, the vast geologic fault system that begins in Anatolia, in eastern
Turkey, stretches through the Jordan Valley and the Dead Sea, and then follows down the length of the Red
Sea to Lake Turkana (formerly Lake Rudolph). At the southern end of Lake Turkana, the rift divides around
Lake Victoria, but joins again at the head of Lake Malawi (Lake Nyasa), from where it runs down the Shire
and Zambezi rivers, and finally out to sea. Altogether, the Rift Valley extends around almost one-fifth of the
Earth, and contains some of its deepest lakes. West of the Rift Valley is the Ruwenzori Range, which rises up
to 5,119 m above sea level. The topography of the island of Madagascar features a rugged central highland
extending in a generally north-south direction near the eastern coast.
15
1.5.1.1 Soils
Africa has been a land area since Precambrian times, except for a few incursions from the sea. Its soils have,
therefore, developed locally, chiefly by weathering. A few areas have alluvial soils laid down by rivers or
ocean currents. African soils, for the most part, have irregular drainage and no definite water tables. Being
typical tropical soils, most are relatively infertile, lacking humus and subject to mineral leaching from heavy
rainfall and high temperatures. These factors could contribute to higher leaching and volatilisation with
shorter persistence of certain chemicals including PTS. Desert soils (arid sols and entisols), which have the
least organic content, cover large areas. The most fertile soils include the mollisols, also known as
chernozems and black soils, of eastern Africa, and the alfisols, or podzolic soils, of parts of western and
southern Africa.
1.5.1.2 Climate
Since climatic conditions affect the fate and behaviour of PTS, this aspect needs further expansion, for a
better understanding thereof. Eight main African climatic zones can be distinguished:
The central portion of the continent and, the eastern coast of Madagascar, has a tropical rainforest
climate. Here the average annual temperature is about 26.7° C, and the average annual rainfall is
about 1,780 mm.
The climate of the Guinea coast resembles the equatorial climate, except that rainfall is
concentrated in one season; no months, however, are rainless.
To the north and south of the rainforest a tropical savannah climate zone encompasses about one-
fifth of Africa's climate. Here the climate is characterised by a wet season during the summer
months, and a dry season during the winter months. Total annual rainfall varies from 550 mm to
more than 1,550 mm.
Away from the equator, to the north and south, the savannah climate zone grades into the drier
steppe climate zone. Average annual rainfall varies between 250 and 500 mm, and is concentrated
in one season.
Africa has a proportionately larger area in arid, or desert, climate zones than any continent, except
Australia. Each of these areas - the Sahara in the north, the Horn of Africa in the east, and the
Kalahari and Namibia deserts in the southwest - has less than 250 mm of rainfall annually. In the
Sahara, daily and seasonal extremes of temperatures are great; the average July temperature is
more than 32.2° C; during the cold season the night-time temperature often drops below freezing.
Mediterranean climate zones are found in the extreme northwest of Africa and in the extreme
southwest. These regions are characterised by mild, wet winters and warm, dry summers.
In the highlands of eastern Africa, particularly in Kenya and Uganda, rainfall is well distributed
throughout the year, and temperatures are equable.
The climate on the high plateau of southern Africa is temperate.
The climate of Africa is the most generally uniform of any of the continents. This results from the position
of the continent in the Tropical Zone, the impact of cool ocean currents, and the general absence, within the
continental plateau, of mountain chains serving as climatic barriers. The equatorial belt generally has
rainfall, whereas northern and southern Africa countries, and those in the Horn of Africa, are typically arid
or semi-arid (Figs1.2a and 1. 2b).
This variability in climatic zones in different parts of the region has implications for the transport and fate of
PTS. It implies that the various sub-regions will experience differences in PTS contamination, exposure and
transport in and out of that specific region.
16
1.5.2 Water Resources
Water can be regarded as the most precious resource in Africa. Since most of all development occurs close
to water bodies (fresh, estuarine and coastal), water resources require serious consideration in terms of PTS
contamination, exposure and long distance transport.
1.5.2.1 Drainage and Water Resources
Africa contains some of the world's greatest rivers, which has implications for the transboundary transport of
PTS. In all, six major networks drain Africa. With the exception of those draining into the Lake Chad basin,
and those surrounding the Kalahari, all have outlets to the sea.
The River Nile drains northeastern Africa, and, at 6,650 km, is the longest river in the world. It is
formed from the Blue Nile, which originates at Lake Tana in Ethiopia, and the White Nile, which
originates at Lake Victoria. The two converge at Khartoum in Sudan, from where the Nile flows
west and north before emptying into the Mediterranean Sea in Egypt.
The River Congo, some 4,670 km long, drains much of central Africa. It originates in Zambia, in
southern Africa, and flows north, west, and south to empty into the Atlantic Ocean in the
Democratic Republic of Congo.
The third longest African river, the Niger in West Africa, is about 4,180 km long; its upper
portions are navigable only during rainy seasons. The Niger rises in the highlands of the Fouta
Djallon and flows north and east before turning south to empty into the Gulf of Guinea.
The River Zambezi, about 3,540 km long, originates from tributaries that begin in Zambia and
Angola, and converge in Zambia; it then flows south and east to empty into the Indian Ocean in
Mozambique. Numerous rapids cut the Zambezi, the most spectacular being the Victoria Falls.
Draining southern Africa are the Limpopo and Orange rivers. The Orange River, with its
tributary, the River Vaal, has a length of about 2,100 km. It rises in the Drakensberg and flows
west to the Atlantic.
Lake Chad, a shallow freshwater lake with an average depth of only about 1.2 m, drains nearby
rivers and constitutes the largest inland drainage system on the continent.
17
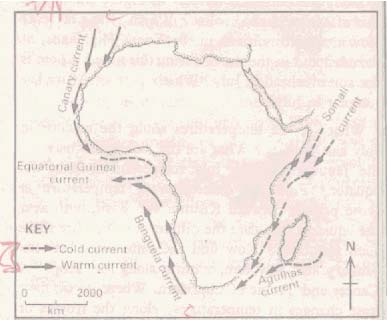
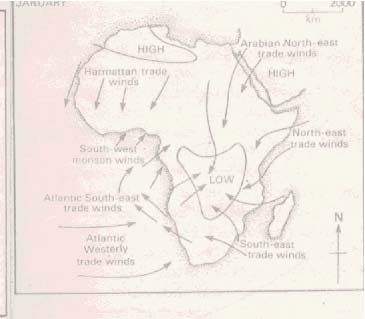
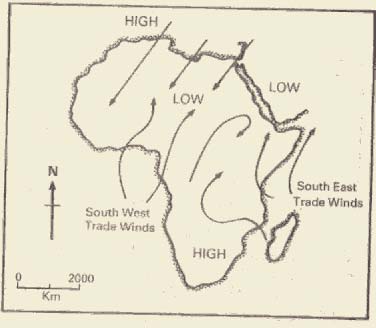
anary current
Canary current
C
current
18
The Rift Valley contains a series of great lakes. This equatorial lake system includes lakes Turkana, Albert,
Tanganyika, and Malawi. Lake Victoria, the largest lake in Africa and the third largest in the world, is,
however, not part of this system; it occupies a shallow depression in the Eastern Highlands. The River
Limpopo originates in South Africa and runs 1,610 km, east and south to drain into the Indian Ocean in
southern Mozambique. Achieving effective control of water supplies is a major problem in Africa. Vast
areas suffer low rainfall; still larger areas receive only irregular rainfall and must store water as insurance
against drought or poor rains. Other areas have an over-abundance of water: there are great swamps, like the
Sudd of southern Sudan, and large areas suffer from periodic flooding.
The above discussion on water systems in Africa highlights that the limited fresh water resources are shared
between a number of nations. Therefore, any pollution will in most cases have a cross-boundary implication,
especially where persistent toxic substances are concerned. The large rivers aforementioned also constitute
major pathway of PTS from land-based sources to the coastal and marine environment.
1.5.3 Vegetation
African vegetation can be classified according to rainfall and climate zones.
The tropical rainforest zone, where the average annual rainfall is more than 1,270 mm, has a
dense surface covering of shrubs, ferns, and mosses, above which tower evergreens, oil palms,
and numerous species of tropical hardwood trees.
A mountain forest zone, with average annual rainfall only slightly less than in the tropical
rainforest, is found in the high mountains of Cameroon, Angola, eastern Africa, and parts of
Ethiopia. Here a ground covering of shrubs gives way to oil palms, hardwood trees, and primitive
conifers.
A savannah woodland zone, with annual rainfall of 890 to 1,400 mm, covers vast areas with a
layer of grass and fire-resistant shrubs, above which are found deciduous and leguminous fire-
resistant trees.
A savannah grassland zone, with annual rainfall of about 500 to 890 mm, is covered by low
grasses and shrubs, and scattered, small deciduous trees. The thorn bush zone, steppe vegetation,
with an annual rainfall of about 300 to 510 mm, has a thinner grass covering and a scattering of
succulent or semi- succulent trees.
The sub desert scrub zone, with an annual rainfall of 130 to 300 mm, has a covering of grasses
and scattered low shrubs.
The zone of desert vegetation, found in areas with an annual rainfall of less than 130 mm, has
sparse vegetation or none at all.
The rich diversity of vegetation has implication for PTS levels in the atmosphere as they have been proven
to be bio-indicators of PTS with ability to absorb them from air. Utilisation of plants for medicinal, food and
other purposes, constitute pathways of exposure to PTS in this regard.
1.5.4 Wildlife
Sub-Sahara Africa is famous for its great variety of distinctive animals and birds, although many of these are
now under threat of extinction from loss of habitat and poaching. The woodland and grassland areas are the
traditional habitats of numerous species of antelope and deer, of zebra, giraffe, buffalo, the African elephant,
rhinoceros, and the baboon and various monkeys. Carnivores, or meat-eating animals, include the lion,
leopard, cheetah, hyena, jackal, and mongoose. The hippopotamus is found in the rivers, emerging at night
to graze. The gorilla, the largest ape in the world, inhabits the rainforests of equatorial Africa, as do
monkeys, flying squirrels, bats, and lemurs. However, many of these species, notably the elephant,
rhinoceros, leopard, lion, and gorilla, are now found only in specially delineated game reserves.
Most bird life belongs to Old World groups. The guinea fowl is a leading game bird. Water birds, notably
pelicans, goliath herons, flamingos, storks, and egrets, congregate in great numbers. The ibis is common in
19
the Nile region, and the ostrich is found in eastern and southern Africa. Reptiles are also mainly having Old
World origin and include lizards, crocodiles, and tortoises. A variety of venomous snakes, including the
mamba, are encountered throughout the Ethiopian zone. Among the constricting snakes, pythons are found
throughout Africa. Freshwater fish abound, with more than 2,000 known species. The continent has a variety
of highly destructive insects, notably mosquitoes, driver ants, termites, locusts, and tsetse flies. The tsetse
flies transmit sleeping sickness to humans and animals.
The consumption of wildlife meat as food and their use in traditional medicine also constitute this as a
pathway of human exposure to PTS due to ingestion of PTS contaminated wildlife. By itself, wildlife can
also be threatened by exposure, as will be seen in Chapter 3.
1.5.5 Demography
Human health and welfare are specifically considered under the various international agreements on
chemicals. Therefore, good knowledge about the characteristics of demography, culture and geography of
the region is needed to understand PTS exposure and pathways.
Although the region is about one-fifth the total world land surface, it has only about 10 % of its population.
When the population living on arable or productive land is calculated, the average density could be 139
people per sq km. The most densely settled areas of the continent are those along the northern and western
coasts; in the Nile, Niger, Congo, and Senegal River basins; and in the eastern African plateau. Nigeria, with
a population of approximately 126 million, is the most populous nation in Africa.
Sub-Sahara Africa's rate of population growth averages about 3 per cent a year; in contrast the growth rate in
Europe is about 0.4, and in Latin America is 2 per cent. The spread of medical services since World War II
has been responsible for a sharp decrease in the death rate, which averages about 15 per 1,000, but varies
considerably between countries. The age distribution is weighted heavily towards the young. In most African
countries, about half the population is 15 years of age or younger.
Africa's population remains predominantly rural, with only about one-fifth of the population living in towns
of more than 20,000 inhabitants. But there are individual countries with high levels of urbanization, such as
Zambia (50 per cent urbanized), and major cities are located in every part of the continent. Cities in the
region with populations of more than 1 million include Lagos, Nigeria; Addis Ababa, Ethiopia; Abidjan,
Côte d'Ivoire; Kinshasa, Democratic Republic of the Congo; Johannesburg, Cape Town, and Soweto in
South Africa, Khartoum in Sudan. The urban centres act as magnets, attracting large numbers of rural
migrants who come either as permanent settlers or as short-term workers. Urban growth has been
particularly rapid since the 1950s. A substantial international labour migration has also developed,
particularly of Africans from central Africa to the mines and factories of Zambia, Zimbabwe, and South
Africa, and of North and West Africans to France and Italy, and, more recently, to the European Union as a
whole. Civil wars in a number of countries in recent years--notably Angola, Mozambique, Ethiopia, Sudan,
Liberia, and most recently Rwanda--have led to a massive displacement of population, as have droughts and
famines. Africa has the world's largest concentration of refugees, including people displaced within their
own countries, as well as people who have fled across borders in search of safety. An increasing population
implies greater demand for food with concomitant demand in use of PTS pesticides to boost food production
and vector disease control.
1.6 PATTERNS OF ECONOMIC DEVELOPMENT
Traditionally, the vast majority of Africans have been farmers and herders who raised crops and livestock for
subsistence. Manufacturing and crafts were generally carried on as part-time activities. Modern processing
industries developed, as did new ports and administrative centres. A variety of consumer industries sprang
up to fill newly created local consumer needs. A feature of the African economy is the side-by-side existence
of both subsistence and modern exchange economies. Future growth depends on the availability of
investment funds, the world demand for local raw materials, fair world prices for these raw materials, the
availability of energy sources, the size of local markets, a solution to the foreign debt problem, which is
20
crippling so many African economies, and the willingness of the industrialized economies to reduce trade
barriers to processed and manufactured African goods.
1.6.1 Agriculture
Despite the expansion of commerce and industry, most Africans remain farmers and herders. PTS pesticides
therefore remain an important parameter in agricultural production for food security in the region. The
majority of these farmers are producing for the local market, at least in a small way, but some are highly
commercialised. Although some 60 per cent of all cultivated land is in subsistence or semi subsistence
agriculture, commercial or cash-crop farming is common in all parts of the continent. Foodstuffs are grown
for local urban markets, but cloves, coffee, pineapples, cotton, cacao, sugar, tea, maize, rubber, sisal,
groundnuts (peanuts), palm oil, vegetables, pulses, cereals, citruses, mangoes, bananas, gum Arabic and
tobacco are among the long-established crops grown by Africans for export. In the past 15 years, there has
been significant development of new export crops, aimed at the high-value end of the Western, primarily
European market, including green beans, roses and other flowers, and kiwi fruit. For certain traditional
African agricultural exports, such as cacao, groundnuts, cloves, and sisal, the continent produces the
majority of the world supply. Large-scale plantations and farms, often owned by foreign companies or
farmers of European descent, and found mainly in eastern and southern Africa, concentrate on citrus,
tobacco, tea, and other export crops. The high residue levels of PTS, for example Lindane in cocoa and other
cash crops has caused severe economic losses to African countries, which are dependent on agricultural
produce.
1.6.2 Forestry and Fishing
Although about one-quarter of Africa is covered by forest, much of the timber has little value, except as local
fuel. Gabon is a major producer of okoume, a wood used in making plywood; Côte d'Ivoire, Liberia (before
the civil war), Ghana, and Nigeria are major exporters of hardwoods. The Sudan is a major producer of gum
Arabic, a product of Acacia trees. Inland fishing is concentrated in the Rift Valley lakes and rivers (viz. the
Nile and its tributaries) and in the increasing numbers of fish farms. Ocean fishing is widespread for local
consumption; it is commercially important off Morocco, Mauritania, Namibia, Mozambique, and South
Africa. The Red Sea is a major source of fish for the Sudan, Eritrea, Somalia and Djibouti.
1.6.3 Industry
Stemming from mineral and oil extraction are processing industries, such as refining and smelting, which are
located in most mineral-rich countries with adequate energy. South Africa is the most industrialized of
Africa's countries, but virtually all other countries have developed a manufacturing base of some sort;
Zimbabwe and Nigeria have very sizeable industrial sectors. Heavy industry, such as metal producing,
machine making, and transport equipment, is concentrated in South Africa and Nigeria. Significant industrial
centres have also developed in Kenya, Sudan, and Ghana amongst others. Mineral-related industries are well
developed in the Democratic Republic of the Congo and Zambia; Kenya, and Côte d'Ivoire have developed
primarily in textiles, light industry, and building materials. The manufacturing industry sector is a potential
source of environmental release of PTS (e.g. dioxins and furans) and PAHs into the environment.
1.6.4 Energy
Nigeria, Libya, Algeria, and Angola are major world producers of oil, and several other African countries are
also oil exporters, including Gabon, Sudan and Chad. Africa's natural-gas exports are centred in Algeria and
Nigeria.
Coal production is concentrated mainly in Zimbabwe and South Africa, although many other countries have
sizeable reserves (such as Botswana), which await development because of a lack of markets. The bulk of
African coal production is used internally. Most African countries must import fuels, especially petroleum
and oil. The oil price rises of the 1970s were disastrous for many of them, precipitating many of the balance
of payments and debt problems, which have undermined their economies in the 1980s and early 1990s.
Although Africa has some 40 per cent of the world's hydroelectric power potential, only a relatively small
21
portion has been developed owing to high construction costs, inaccessibility of sites, and their distance from
markets. The energy sector may be considered a major source of PTS (PCBs, dioxins and furans and PAHs)
release into the environment.
1.7 SOCIAL ASPECTS
Recently, expectations in African nations for a better living standard have increased. However, while the
prices of imported consumer and other manufactured goods have risen steadily, the world prices of most
African primary products have lagged behind. A worldwide recession in the early 1980s multiplied
difficulties that were initiated by the oil-price increases of the 1970s. Serious foreign-exchange problems and
the burden of foreign debt have aggravated public discontent. Famine and drought plagued the northern and
central regions of the continent in the 1980s, and millions of refugees left their homes in search of food,
increasing the problems of the countries to which they fled. Medical resources, already inadequate, were
overwhelmed by epidemics of acquired immune deficiency syndrome (AIDS), cholera, and other diseases. In
the late 1980s and the first half of the 1990s protracted local conflicts in Chad, Somalia, Sudan, the Saharan
area, southern Africa, and elsewhere on the continent destabilized governments, halted economic progress,
and cost the lives of thousands of Africans.
Another major problem has been Africa's inability to project an effective voice in international affairs. Most
African states regard themselves as part of the developing world and the non-aligned nations. Because of
their lack of financial, technological and political power, however, the views of African nations rarely appear
to be taken into account.
Nevertheless, as the 21st century dawned, Africa remained a continent of sharp contrasts and paradoxes.
Low levels of education, poverty and malnutrition, augmented by natural disasters continue to be major
issues for Africa. In addition, the search continues to find an appropriate response to the AIDS epidemic,
which continues to devastate the population, and is likely to be the most important issue for Africa for the
foreseeable future. Approximately 10 per cent of adults on the continent have HIV/AIDS, and the disease
will increasingly strain the economic and labour resources of African nations. Medical services are already
struggling to cope and vast numbers of people removed from the work force owing to illness or looking after
sick relatives, and this will have a devastating impact on productivity. According to the United Nations
Environment Programme (UNEP), Africa is the only region in the world where poverty is expected to
increase in the 21st century. Other problems include a further loss of agricultural land because of
desertification and other factors; deforestation; and the increasing scarcity of freshwater supplies.
In line with the above-mentioned problems, the lack awareness of PTS and the consequences of their uses
may confound these issues, as many are inter-related. DDT and malaria, as well as the use of other
pesticides, the release of PCDD/Fs and PCBs, and the exposure profiles that the human population and biota
are experiencing due to these compounds, are some of the examples that need to be urgently addressed in
Africa. The New Partnership for Africa's Development (NEPAD) with active support from GEF/UNEP and
other international donor agencies provide hope for improved health and poverty alleviation among the
people in the region, including PTS issues.
1.8 SUMMARY
The region has a wide diversity of bio-geographical, cultural, language, demographic and natural resource
features. It comprises several mainland African countries as well as small island states in the West Indian
Ocean and the Gulf of Guinea. It has some of the longest rivers and largest lakes in the world. Indian Ocean
surrounds the continent on the eastern side and the Atlantic Ocean on the western side. Rivers and oceans,
including migratory fish and birds, as well as winds ocean currents, therefore constitute pathways of PTS in
and out of the region. Because the soils of the region have low organic matter content, and the region
experiences temperature extremes, these variable conditions will inter alia affect the persistence and
behaviour of PTS.
22
The African economy is fragile and largely agricultural with huge debt burdens crippling the national
economies and impoverishing the population, which has limited access to health care. The new NEPAD
initiative is expected to promote economic development in the region, with improvement in health care and
alleviation of poverty among the people.
1.9 REFERENCES
Europa (1999): Africa South of the Sahara. Regional Surveys of the World. Europa
Publications. 28th Edition.
Tarver James D. (1994): Urbanisation in Africa. A Handbook. Greenwood Press.
CIA (2001): Central Intelligence of America (CIA) Factbook 2001.
23
2 SOURCE CHARACTERISATION
2.1 INTRODUCTION
As can be seen from Chapter 1, the conditions and circumstances of the countries involved in Sub-Saharan
Africa Region V of the RBA project are varied and complex in nature. Even though some, or perhaps even
most, of the individual country's PTS releases into the environment may be little, the problem may however
become significant after aggregating the releases for the region. This bio-geographical aspect combined with
the social and economic developing nature of the continent, therefore results in a wide variety of sources of
PTS.
In this chapter, a general categorization and brief description of anthropogenic and natural sources of PTS
will be presented, highlighting those that differ from developed regions. The RBA project brief lists the
following as information to be collected on sources during the country contribution phase, particularly from
the questionnaires for source identification:
Production and use of PTS pesticides, as well as the identification of major agricultural areas;
Sources of industrial chemicals and identification of major industrial centres or specific
production sites;
Sources of unintentional PTS by-products (including identification of point sources and diffuse
sources and information on industries potentially releasing PTS);
Import and export statistics of PTS and PTS containing wastes;
Identification of stocks and reservoirs of PTS;
Data gaps;
Summary of most significant regional sources.
The identifiable main sources of PTS in the region are production, agriculture, vector control, stocks of
obsolete and expired pesticides, and not the least as by-products of combustion. These sources are discussed
individually and/or in groups while an attempt is also made of the relative ranking of the source categories
based on knowledge of the region.
2.2 PRODUCTION OF PTS PESTICIDES
Generally PTS pesticides are not produced in Africa. Only atrazine seems to be currently produced (only in
South Africa), but previous production of compounds such as DDT (at least in South Africa) is known. The
current production of the other PTS pesticides (no. 1, 2, 3, 4, 5, 6, 7, 8, 9, 13, 14, 15, 19, and carbaryl,
chlorpyrifos and herbicides in general under number 28 of the "Common names of PTS" in the Listing of
Questions) is not done in Africa, but are imported from elsewhere. However, pesticide formulation plants
exist in many countries (Table 2.1). Where PTS are being produced or formulated in this region, there is
likely to be little data available on production, as well as on current and past releases to the environment.
Production waste is also likely to be not well quantified, and there are unconfirmed reports of major polluted
areas of past production waste associated with such production and formulation activities.
24
Table 2.1
Known formulation plants in Region V (RBA Workshop information).
Country PTS
Pesticide
PTS Pesticide Estimated
Specific Sites
Estimated
Produced
formulated
annual
Production
amount
Waste
South Africa Atrazine
Atrazine
2000 tons
Berlin Plant Data Gap
DDT
East London
South Africa
Endosulfan
129 tons
Canelands
Data Gap
Lindane
55 tons
Chloorkop
Data Gap
(gamma BHC)
Chlordane
45
tons
Data Gap
Zimbabwe1
Chlordane 12 tons
Bulawayo
Data Gap
Lindane
2,5 tons
Harare
Atrazine
160 tons
Endosulfan
33 tons
Nigeria
Lindane
Data Gap
Ibadan
Data Gap
Ethiopia
Endosulfan
40
tons
Data
Gap
Kenya2
No PTS
Data Gap
Data Gap
Data Gap
Sudan3
Non currently Data Gap
Data Gap
Data Gap
Madagascar
Data Gap
Data Gap
Antananarivo
Data Gap
Senegal
Data Gap
Data Gap
Data Gap
Data Gap
Ghana
Lindane 900
000l
Tema Data
Gap
It is unsure which compounds are formulated at the Zimbabwe plants.
The plant in Kenya does not formulate PTS pesticides.
The formulation plants referred to in Sudan are currently in the process of being licensed.
Production and formulation sites, due to the water requirements of this industry, are likely to be closely
associated with freshwater sites such as rivers, lakes or lagoons and estuaries in coastal areas, which
increases the potential for pollution and long-distance transport via water.
2.3 THE IMPORT OF PTS PESTICIDES
Due to the bio-geographical and the social and economic developing nature of the continent in general,
Africa (RBA Region V) uses very little on a global basis in terms of pesticide use. In 1994 it was estimated
that Africa used only 5% of the world total of pesticides produced (Wiktelius & Edwards1997). The data
from the FAO supports this (Table 2.2) and indicates that in the past eight years, imports never rose above
the 5% levels on a global comparison. Industry data however, indicates the percentage to be between 2-3%.
The difference is likely accounted for by foreign aid contributions, which might not be taken into account by
the industry.
25
Table 2.2: Imports of pesticides into Africa compared with world trade figures ($1000). Export figures
are not included. (FAO data)
Year
1992 1993 1994 1995 1996 1997 1998 1999
Africa 378907 392850 429797 465450
499387
526667
571647
504344
World 8135455 8070441 8639721 10232080 11125033 11103189 11634888 11730915
% 4.66
4.87
4.97
4.55
4.49
4.74
4.91
4.30
Due to the lack of data on PTS use in Africa, an approximation of PTS use could be obtained from information on
pesticide importation figures (Table 2.3). Most of these pesticides will not be PTS. The RBA Technical workshop
that included representatives from industry derived a figure of 18% of the total pesticides to be PTS for Region V,
from various calculations and estimates. This represents $211 million in value terms. In general it should also be
taken into account that low value pesticides (including most of the PTS pesticides) could be applied at higher rates
than higher value products.
Table 2.3 does indicate however, which countries have major agricultural activities using pesticides. Table 2.3
shows that 22 RBA Region V countries each imported more than $5 million worth of pesticides. Although these
figures do not include local production and export, it can be safely assumed that these countries use the majority
of pesticides (80.8% in value terms) in this region. Table 2.3 also shows that only four countries imported more
than $20 million worth of pesticides during 2001. These four countries (Ghana, Kenya, South Africa and
Zimbabwe) together imported 54% (in value terms) of all the pesticides imported into Africa. This table therefore
gives a rough estimate (excluding exports and local production) of where most pesticides (including PTS) might
be applied. South Africa is the largest exporter ($89 million in 2001), but the balance between import and local
production, as well as between import and export for all countries is not known. Also, when comparing these
figures with that from Table 2.1, it seems probable that the production figures for South Africa might be an under-
estimate, and therefore a data gap to be investigated further.
The RBA technical workshop listed the most widely used PTS pesticides for Region V as shown below, in no
particular order, although this does not mean that others are or have not been used:
26
Atrazine
Endosulfan
Chlordane
Lindane
DDT
Heptachlor
Toxaphene
HCB
Aldrin
27
The RBA Technical Workshops and the Priority Setting Meeting both indicated the possibility and
likelihood of illegal use of PTS pesticides (likely to include DDT as well) in the region. However, it is not
possible to estimate the amounts involved, but this would most probably be low, when compared with the
overall amounts used legally. Awareness of the problems associated with PTS was also judged to be low.
28
Table 2.3
Yearly data for countries importing more than $5 million of pesticides during 1999
($1000). Countries importing more than $20 million worth of pesticides during 1999 are highlighted.
Export figures are not included. (FAO data, adjusted by RBA workshop)
Year
1992 1993 1994 1995 1996 1997 1998 1999
Country
Cameroon
10000 15548 14837
19587
12865
15020
16000 16000
DRC
6000 6000 6000
6000
6000
6000
6000 6000
Côte
d'Ivoire 16000 18000 20000
25677
20086
20000
19500 19500
Ethiopia
5813
11449
6325
6300
6300
6300
6300
Ghana
15910 16000 17000
18000
19031
31793
30000 32000
Kenya
30199 27954 23734
39712
31640
41643
62802 40497
Malawi
7383 5682 5029
5697
8000
14470
10035 10000
Mali
14000 14000 14000
14000
14000
14000
14000 14000
Mauritius
9545 7898 8783
9577
10543
9939
9327 8347
Mozambique 15000 20000 20811
9393
11626
11700
11800 11800
Nigeria
8495 11000 13000
16065
19000
25000
37149 16000
Senegal
6000 7057 7367
8019
8000
6749
10424 11511
South
Africa 66442 77418 85102
94941
115473
111218
108862 101498
Sudan
13000 14000 15000
16300
9712
10000
11000 16000
Swaziland
5000 7000 8000
8258
8500
9434
7639 7500
Tanzania
16000 15000 14000
12500
11000
10151
10100 10100
Togo
5066 4937 4304
5631
5782
7219
7980 8000
Uganda
3000 3000 4000
6000
8000
11000
13838 9511
Zimbabwe 29442 21330 27765
29443
44492
37033
38654 32487
TOTALS
276482 297637 320181
351125
370050
398669
431410 377051
The RBA technical workshop found that the data in general reflected the real situation, although some small
adjustments were made.
When assessing sources of PTS, it is also important to identify the major ports of entry of PTS into
countries. These ports, including major railheads, are areas where pollution, due to years of spillages and
accidents might have occurred, and therefore represent potential secondary sources of contamination. A
provisional list of major ports and railheads identified by the RBA workshop includes the following: Cape
Town, Durban, East London, Port Elisabeth, Maputo, Port Djibouti, Obock, Tadjoura, Rail link to Djibouti
via Addis Ababa, Port Sudan, Sawakin, Port Louis, Mogadishu, Barbara, Mombasa, Free Town, Guinea,
Accra, Beit Bridge, Abidjan, Dakar, Lagos, Douala, Mombassa, Tamatave, Port Harcourt, Cotonou.
Harbours and railway heads are not the only routes of entry, as many land-locked countries have no railway
links and these are served by roads. Additional risk exists from spillages that may occur along any of the
roads, thereby creating local contaminated hotspots. From experience from South Africa, road spillages are
29
not an uncommon event, yet it is unlikely that many countries do not have the means to attend to these spills
in a timely fashion, if such spills do get reported.
2.4 THE USE OF PESTICIDES AND MAJOR AGRICULTURAL AREAS
Table 2.4 presents the agricultural areas (including pasture) and irrigation of the countries of RBA Region V.
Not all these lands will experience pesticide treatment, but it is likely that the larger irrigated areas will be
treated regularly. The large areas in Sudan and South Africa are notable. Possibly the largest single irrigation
scheme in this region is the Gezira in the Sudan, with 800 000 ha.
Table 2.4: Areas used for agriculture (including pasture), as well as areas under irrigation, in
the various countries of the RBA Region V. Countries with more than 100 000 ha under
irrigation are highlighted in bold (FAO data for 1999, and adjusted by RBA workshop)
Country Agricultural
lands
Irrigated lands
Major agricultural areas
(1000 ha)
(1000 ha)
Angola
57500
75
Benin
2400
12 North and centre
Botswana 25946
1
Burkina Faso
9450
25 South west, South and West
Burundi 2200
74
Cameroon 9160
33
Central African Republic
5145
South, Centre, West, Lake Chad,
Chari-Logone region
Chad 48550
20
DRC
22880
13.5 Kinshasa region, Kasai, Lower
Congo, Equator
Republic of Congo
10220
1 Niari Valley, Songha
Côte d'Ivoire
20350
73
Djibouti 1300
1
Eritrea 7467
22
Ethiopia 30728
190
Gabon 5160
15
Gambia 659
2
Ghana
13628
11 Volta Basin, Middle Belt,
Savannah Region
Guinea 12185
95
Guinea-Bissau 1430
17
Kenya 25820
67
Lesotho 2325
1
Liberia 2327
2
Madagascar
27108
1090 Centre, West, South West
30
Malawi
3850
28 North Western Region,
Central Region
South Eastern Region
Mali 34650
138
Mauritania 39750
49
Mauritius 113
20
Mozambique 47350
107
Namibia 38820
7
Niger 17000
66
Nigeria 69938
233 North-East, North-West, Middle Belt,
East and Western Areas
Rwanda 1661
5
Reunion 49
12
Sao Tome and Principe
42
10
Senegal 7916
71
Seychelles 7
Sierra Leone
2740
29
Somalia 44065
200
South
Africa
99640
1354 Western cape, Free State,
Kwazulu-Natal, Mpumulanga,
Mhkahatini flats
Toyhandou - Levhubu
Sudan
126900
1950 Gezira, El-Rahad, New Halfa,
Suki, Blue Nile, White Nile,
Khartoum, Kenana,
Asalya, Sinnar, Elgunaid
Swaziland 1330
69
Tanzania 39650
155
Togo 3300
7
Uganda 8610
9
Zambia 35279
46
Zimbabwe
20550
117 Highveld, Middleveld, Lowveld,
Eastern Highlands.
Totals 987148
6522.5
31
Table 2.5:
Agricultural production data for the various countries of the RBA Region V (CIA
Factbook 2001 data, and amended by RBA workshop). Countries with more than $10 b worth of
agricultural production are highlighted. Crops with likely use of PTS use are included.
Country GDP
($b)
Agric
%
Agriculture Agricultural products using
GDP
($b)
PTS
Angola 10.1
60
6.1Sugarcane,
cotton,
Benin 6.6
37.9
2.5Cotton,
Botswana 10.4
4
0.4groundnuts
(peanuts)
Burkina Faso
12
26
3.1peanuts, cotton, sorghum
Burundi 4.4
50
2.2Cotton
Cameroon 26
43.4
11.3Cotton
Central African
6.1
53
3.2Cotton
Republic
Chad 8.1
40
3.2Cotton
Comoros 0.419
40
0.2
Congo
3.1
10
0.3sugarcane
(Brazzaville)
Cote d'Ivoire
26.2
32
8.4sugarcane, cotton, rubber;
timber
Democratic
31
58
18.0sugarcane, cotton, tobacco
Republic of
Congo
Djibouti 0.574
3
0.1hides
Equatorial Guinea
0.96
20
0.2
Eritrea 2.9
16
0.5Cotton,
tobacco
Ethiopia 39.2
45
17.6sugarcane,
hides
Gabon 7.7
10
0.8sugarcane
Ghana 37.4
36
13.5Cocoa,
peanuts
Guinea-Bissau 1.1
54
0.6peanuts,
cotton,
timber
Guinea 10
22.3
2.2
Kenya 45.6
25
11.4sugarcane,
floriculture,
tobacco
Lesotho 5.1
18
0.9
Liberia
3.35
60
2.0Cocoa, sugarcane, timber
Madagascar 12.3
30
3.7sugarcane,
cocoa,
peanuts;
Malawi 9.4
37
3.5tobacco,
sugarcane,
cotton,
Mali 9.1
46
4.2Cotton,
peanuts;
32
Mauritania 5.4
25
1.4
Mauritius 12.3
10
1.2sugarcane,
tobacco
Mozambique 19.1
44
8.4Cotton,
sugarcane,
Namibia 7.6
12
0.9peanuts;
Niger 10
40
4.0Cotton,
peanuts
Nigeria
117
42
36.0Cocoa, peanuts, cotton, root
crops
Rwanda 6.4
40
2.6
Sao Tome and 0.178
23
0.1Cocoa,
Principe
Senegal 16
19
3.0peanuts,
cotton,
Seychelles 0.61
3.1
0.1sugarcane
Sierra Leone
2.7
43
1.161Cocoa, peanuts
Somalia 4.3
60
2.6sugarcane
South Africa
369
5
18.5corn, sugarcane, vegetables,
cotton
Sudan 35.7
39
13.9cotton,
groundnuts
(peanuts),
sugarcane,
Swaziland 4.4
10
0.4Sugarcane,
cotton,
corn,
tobacco peanuts
Tanzania
25.1
50
12.5Coffee, cotton, maize, fruit
Togo
7.3
42
3.1Coffee, cocoa, cotton,
sugarcane
Uganda
26.2
43
11.3Coffee, cotton, tobacco,
Zambia
8.5
18
1.5flowers, tobacco, cotton,
sugarcane, hides
Zimbabwe
28.2
28
8.0corn, cotton, tobacco, coffee,
sugarcane, peanuts
From Table 2.5, more than 25 countries produce crops that are likely to involve the application of significant
amounts of pesticides. During the RBA workshop, experts from various countries indicated additional uses
of pesticides such as DDT for domestic use and malaria control at ports and airports. The Priority Setting
Meeting delegates also voiced their concerns about other potential uses. Such uses include the regular or
incidental control of malaria, tsetse fly, Quelea (South Africa and Sudan), locust (many countries), blackfly,
bilharzias and problem animals (such as jackal and hyena, the latter in Djibouti, and caracal). Other
(legal/illegal) uses are for food collection (e.g. fish and birds), harvesting for traditional medicine (e.g.
vultures), exotic vegetation control, and infrastructure protection (railways, electricity pylons, etc). These
applications rarely happen on agricultural lands, but often in natural areas. Although the overall amounts
used might be low when compared to agricultural application, they can be used at high rates and therefore
contribute towards local impacts and the creation of polluted areas, from where water, biota and humans can
be affected.
33
2.5 IDENTIFICATION OF STOCKS AND RESERVOIRS OF PTS PESTICIDES
According to the FAO, obsolete unwanted and banned pesticides and persistent organic pollutants (POPs)
are serious environmental hazards, especially where they are stocked and mostly neglected. Stocks of
leaking and corroding metal drums filled with obsolete and dangerous pesticides and industrial waste, the
source of which is often from outside Africa, is fortunately not increasing as rapidly as before in African
countries, but they can still often be found. The FAO estimates that there might be more than 40 000 tons,
perhaps even much more, of these chemicals stocked or discarded over many parts of Africa. These chemical
leftovers affect not only the country's agriculture and its environment, but also fundamentally the health of
its people and consequently both rural and urban development. Where research has been done, it was clear
that these pesticides enter the soil and eventually contaminated ground and surface water, with consequent
further contamination of humans, livestock and biota. These residues will therefore also become available
for long-range transport.
It is particularly worthy of note that some of the obsolete pesticides were imported as part of foreign aid. In
some cases, developed countries donated these pesticides that had been banned in their home countries, or
were no longer wanted, or had expired or were nearing expiry dates to unsuspecting African countries. This
practice should be discouraged, as the chemicals will eventually return to developed countries for ultimate
disposal.
According to the FAO (1999), obsolete pesticides take into consideration the following criteria:
Pesticides that are in the form of liquids, powder or dust, granules, emulsions, etc.
Empty and contaminated pesticide containers of all forms and kinds (i.e. metal drums, plastic
containers, paper cartoons, jute and other bags, etc.)
Heavily contaminated soil,
Buried pesticides, etc. (FAO 1999)
Obsolete pesticides are therefore pesticides that can no longer be used for their intended purpose or any other purpose. Thus it
requires disposal. Common causes of this situation include the following:
Use of the product has been prohibited or severely restricted for health or environmental reasons
(e.g. through banning, withdrawal of registration, or policy decisions).
The product has deteriorated as a result of improper or prolonged storage and can no longer be
used according to its label specifications and instructions for use, nor can it easily be reformulated
to become usable again.
The product is not suitable for its intended use and cannot be used for other purposes, nor can it
easily be modified to become usable. (FAO 1999)
Although the location, condition and identities of many of these stocks have been identified, the situation is
not static. Changes in conditions (such as floods, and neglect) can alter the status of the existing stocks or
dumps, or the stocks might be transferred elsewhere, sent for incineration, or misappropriated. There is
therefore a need to regularly update the existing databases. The latest available data are from the FAO
(2002), and are presented in Table 2.6.
Table 2.6 Available data from inventories conducted in Region V countries, of obsolete stocks
that require disposal (FAO 2002). Countries with more than a 1000 tons are highlighted.
Country Number
of
Affected
Number of
Stocks in Country
Sites
Different
(tons)
Pesticides
Angola
Benin 23
50
421
34
Botswana 6
60
18248
Burkina Faso
21
?
275
Burundi 2
6
169
Cameroon 97
283
Cape Verde
13
30
43
Central African Republic
3
15
238
Chad
Congo, Democratic
6
7
591
Republic of the
Congo, Republic of the
7
1
2
Côte d'Ivoire
5
10
828
Djibouti
Equatorial Guinea
5
25
146
Eritrea 45
>30
223
Ethiopia 764
>400
3402
Gabon
Gambia
Ghana 19
45
72
Guinea-Bissau
Guinea-Conakry 12
9
47
Kenya 33
49
56
Lesotho
Liberia
Madagascar 48
106
1
Malawi 20
70
111
Mali 24
>25
14001
Mauritania 15
>11
97
35
Mauritius
Mozambique >148
>143
198
Namibia 1
1
43
Niger 28
>29
151
Nigeria 55
40
22
Rwanda 3
15
451
Sao Tome and Principe
1
3
3
Senegal 12
20
265
Seychelles
Sierra Leone
5
15
7
Somalia
South Africa
>4
>10
70000
Sudan 44
145
666
Swaziland
Tanzania >325
>250
1136
Tchad 5
5
0
Togo 12
45
86
Uganda >28
>19
214
Zambia 6
51
0
Zimbabwe 15
166
27
TOTAL
112522
Table 2.6 shows that for Region V, 112522 tons of obsolete stocks have been inventoried. In some areas
such as Malawi, South Africa, Zambia, Tanzania, programmes have been completed or are current in
addressing accumulated stocks. The RBA workshop commented on the probable inaccuracies of the
information, as well as a number of countries not included, and has also adjusted some of the numbers. Note
was taken of the intended World Bank project to rid the whole continent of this problem in one concerted
action.
There are indications from the Sudan and South Africa of PTS contaminated soil (Technical Workshops).
These are just known examples and this category should therefore be indicated as a data gap.
36
2.5.1 Country Ranking According To Agricultural PTS
The data presented in many of these tables could be used to rank countries according to the perceived
sources of agricultural PTS. This must not be confused with a risk assessment. The RBA workshop
considered this approach and was in favour of including the resultant table (Table 2.7). The following score-
and ranking criteria were used:
A score of 1 was given for each $5 million of pesticide imports for each country (Table 2.3)
A score of 1 was given for each $5 billion of agricultural production (Table 2.5)
Obsolete stocks of pesticides were scored according to the criteria presented below Table 2.7
Table 2.7
Relative and indicative ranking of countries according to PTS pesticide data
Country
Pesticide
Agricultural
Obsolete
TOTAL RANK
imports
production
stocks
@ $5 m
@ $5 b
Score*
South Africa
20
4
6
30
1
Nigeria 3
9
1
13
2
Cote d'Ivoire
4
2
5
11
3
Kenya 8
2
1
11
3
Ethiopia 1
4
6
11
3
Ghana 6
3
1
10
4
Sudan 2
3
5
10
4
Tanzania 2
2
6
10
4
Mali 3
1
6
10
4
Zimbabwe 6
2
1
9
5
Democratic Republic of
1 4
4
9
5
the Congo
Botswana 1
1
6
8
6
Cameroon 3
2
2
7
7
Mozambique 2
2
2
6
8
Uganda 2
2
2
6
8
Rwanda 1
1
4
6
8
Benin 1
1
3
5
9
Senegal 2
1
2
5
9
Guinea 1
2
1
4
10
Mauritius 2
1
1
4
10
Malawi 2
1
1
4
10
Eritrea 1
1
2
4
10
37
Namibia 1
1
2
4
10
Niger 1
1
2
4
10
Togo 2
1
1
4
10
Burkina Faso
1
1
2
4
10
Central African Republic
1
1
2
4
10
Burundi 1
1
2
4
10
Swaziland 2
1
1
4
10
Gabon 1
1
1
3
11
Mauritania 1
1
1
3
11
Madagascar 1
1
1
3
11
Zambia 1
1
1
3
11
Lesotho 1
1
1
3
11
Congo (Brazzaville)
1
1
1
3
11
Angola 1
1
1
3
11
Chad 1
1
1
3
11
Guinea-Bissau 1
1
1
3
11
Sierra Leone
1
1
1
3
11
Somalia 1
1
1
3
11
Liberia 1
1
1
3
11
Equatorial Guinea
1
1
1
3
11
Djibouti 1
1
1
3
11
Sao Tome and Principe
1
1
1
3
11
Seychelles 1
1
1
3
11
Comoros 1
1
1
3
11
Gambia 1
1
1
3
11
*Score: 1= 0 - 150; 2=151-300; 3=301-450; 4=451-600; 5=601-750; 6=751-
2.6 SOURCES OF INDUSTRIAL
Essentially, very little is known about the pollution caused by various industries in Africa, but it is possible
to identify and describe the major industrial complexes in this region. In most cases they are located mainly
on the coast, but there are highly industrialized inland areas, such as the Vaal Triangle region in South Africa
and the Ikeja and Kaduna Industrial Estates in Nigeria. In all cases these are located close to water, with
possible concomitant water pollution potential from PTS. Available studies indicate localized environmental
media pollution with deleterious human health effects in the vicinity of industrial plants. The major
industrial complexes in the region will be identified and described as a means of rapid assessment, if only in
qualitative terms of potential PTS releases into the environment.
Industrial PTS chemicals of concern are PCBs, HCB which is also a PTS pesticide, pentachlorophenol (PCP)
and phthalates. The electricity generating industry is the major source of PCB release into the environment.
PCBs are contained in transformer oils and PCB containing equipment such as transformers and capacitors.
38
PCBs however, can also be formed during combustion processes. HCB is used as industrial solvent, PCP as
wood preservative, while phthalates are used as plasticisers in industry. Data is lacking on the use and import
of PTS industrial chemicals in the region. This data gap may be addressed when most of the countries have
carried out "Country Chemical Profile" study being driven by the Intergovernmental Forum on Chemical
Safety (IFCS).
To obtain an overview of possible indicators or surrogates of PTS production from industry of countries in
Region V, comparative country data was gathered on GDP ($), percentage of industry contribution to GDP,
the size of the industrial activity ($), major industrial products, and electricity production. The size of the
electricity production might provide a comparative surrogate of the possible PCB problems facing each
country. These data are presented in Table 2.8. The industries that are potential sources of PTS releases into
the environment are:
39
Petroleum refining (catalyst
regeneration)
Textiles and tanneries
Cement kilning
Wood products preservation
Truck and bus assembly
Chemicals
Paper milling
Solid minerals mining
Iron and steel industry
Pharmaceuticals
Bleached chemical pulp and paper
mills
Crematoria
Drum & barrel reclamation facilities
Ferrous Foundries
Hazardous waste incinerators
Industrial boilers burning hazardous
waste
Kraft black liquor recovery boilers
Motor vehicles (leaded, unleaded
and diesel)
Municipal solid waste incinerators
Medical waste incinerators
Power generating facilities (coal and
oil)
Primary ferrous metal smelting
(sinter and coke)
Primary non-ferrous metal smelting
Residential oil combustion
Secondary non-ferrous metal
smelting (aluminium, copper, lead)
Sewage sludge incineration
Scrap electric wire recovery
Tyre combustion
Wood combustion
40
Table 2.8: GDP data for the Region V countries. (CIA Factbook 2001 amended by RBA
workshop). Countries with a GDP of more than $20 b, and countries with an electricity
production of more than 4 b kWh are highlighted in bold. Industrial products, whose production
is likely associated with PTS, are indicated in italics.
Country GDP
($b)
Industry
Industry Industrial products
Electricity
% GDP
($b)
production,
(billion kWh)
Angola
10.1
7
0.707Petroleum, iron ore, basic metal
1.475
products; textiles.
Benin 6.6
13.5
0.891Textiles,
petroleum
0.51
Botswana 10.4
46
4.784Mining
0.61
Burkina Faso
12
27
3.24Textiles, mining
0.285
Burundi 4.4
18
0.792
0.141
Cameroon
26 20.1 5.226Petroleum production and
3.47
refining, textiles, lumber
Central
6.1 20
1.22mining,
sawmills,
textiles,
0.102
African
footwear, assembly of bicycles
Republic
and motorcycles
Chad
8.1
14
1.134cotton textiles,
0.09
Comoros 0.419 4
0.017textiles,
0.017
Congo
3.1 48
1.488petroleum extraction, cement
0.302
(Brazzaville)
kilning, lumbering
Cote d'Ivoire
26.2
18
4.716wood products, oil refining,
4.06
truck and bus assembly, textiles,
fertilizer
Democratic
31
17 5.27mining (diamonds, copper,
5.268
Republic of
zinc), mineral processing,
the Congo
textiles, cement
Djibouti 0.574
22
0.126brick
clay
firing
0.18
Equatorial
0.96 60
0.576petroleum,
saw
milling
0.021
Guinea
Eritrea 2.9
27
0.783Textiles
0.165
Ethiopia
39.2
12 4.704textiles, chemicals, metals
1.625
processing, cement, hides,
pharmaceuticals
Gabon
7.7
60
4.62textile; lumbering and plywood;
1.02
cement; petroleum extraction
and refining; mining; chemicals;
ship repair
41
Ghana 37.4
25
9.35mining,
lumbering,
light
5.466
manufacturing, aluminium
smelting,
Guinea-
1.1 15
0.165
0.055
Bissau
Guinea
10
35.3
3.53mining, light manufacturing
0.75
Kenya 45.6
13
5.928plastic, batteries, textiles oil
4.225
refining, cement, paper,
chemicals
Lesotho 5.1
38
1.938textiles,
0
from the RSA
Liberia
3.35
10
0.335rubber processing, mining
0.432
Madagascar
12.3
14
1.722tanneries, textiles, cement,
0.81
automobile assembly
plant,
paper, petroleum, mining
Malawi
9.4
29
2.726sawmill products, cement
1.025
Mali 9.1
21
1.911Mining
0.445
Mauritania 5.4
31
1.674mining
0.151
Mauritius
12.3
29
3.567textiles, chemicals, metal
1.26
products, transport equipment
Mozambique
19.1
19
3.629chemicals (fertilizer, paints),
2.3
petroleum products, textiles,
cement,
Namibia
7.6
25
1.9mining (diamond, lead, zinc, tin,
1.198
silver, tungsten, uranium,
copper)
Niger
10
18
1.8mining, cement, brick, textiles,
0.2
chemicals,
Nigeria
117
40
46.8crude oil, mining, rubber, wood,
18.7
hides and skins, textiles,
cement, chemicals, plastics,
fertilizer, printing, ceramics,
steel
Rwanda
6.4
20
1.28cement, plastic goods, textiles
0.132
Sao Tome 0.178
19
0.034textiles, timber
0.017
and Principe
Senegal
16
20
3.2fertilizer production, petroleum
1.27
refining
Seychelles
0.61
26.3
0.16boat building, printing
0.16
Sierra Leone
2.7
26
0.702mining, textiles, petroleum
0.24
refining
42
Somalia
4.3
10
0.43textiles, petroleum refining
0.26
South Africa
369
30
110.7mining, automobile assembly,
186.903
metalworking, machinery,
textile, iron and steel,
chemicals, fertilizer, foodstuffs,
plastics, cement, paper
Sudan
35.7
17
6.069textiles, cement, petroleum
1.76
refining, pharmaceuticals
Swaziland
4.4
46
2.024mining, wood pulp
0.375
Tanzania
25.1
17 4.267mining, oil refining, shoes,
2.248
cement, textiles, wood products,
fertilizer, salt
Togo
7.3
21
1.533mining, cement; textiles
0.092
Uganda 26.2
17
4.454cement
1.326
Zambia
8.5
27 2.295mining and processing,
7.642
chemicals, textiles, fertilizer
Zimbabwe
28.2
32 9.024mining, steel, wood products,
5.78
cement, chemicals, fertilizer
Table 2.8 shows that certain countries are more likely to have sites and activities for unintentional PTS
production, including the combustion of waste and discarded products. In addition, the electricity production
data can be associated with the use of PCBs in transformers and other equipment.
From the Priority Setting Meeting, the following data on PCB stock were obtained: Senegal inventoried
36043 tons of PCB polluted oils, and Congo Brazzaville reported 119 tons, although this inventory was not
complete (74 transformers, out of a total of 495, were not yet tested).
2.6.1 Country Ranking According to Industrial PTS Production
The data presented in Table 2.8 could be used to rank countries according to the perceived sources of PTS,
using economic data as surrogates for PCDD/Fs production, and electricity data for PCBs. This approach
must not be confused with a risk assessment, but only as an approximation, due to the lack of other data. The
RBA Technical Workshop and the Priority Setting Meeting considered this approach, and was in favour of
including the resultant table (Table 2.9). The following criteria were used:
A score of 1 was given for each $1 billion of industrial production, as surrogate for unintentional
PCDD/F production (Table 2.8)
A score of 1 was given for each 1 billion kWh produced as surrogate for PCB use (Table 2.8)
The countries were then ranked according to total scores.
The results are presented in Table 2.9.
43
Table 2.9
Relative and indicative ranking of countries according to derived unintentional PTS
production surrogates (PCDD/Fs and PCBs)
Country
Industry Electricity
TOTALS RANK
production
@ $1 b
@ 1 b kWh
South Africa
111
187
298
1
Nigeria 47
19
66
2
Zimbabwe 9
6
15
3
Ghana 9
5
14
4
Kenya 6
4
10
5
Democratic Republic of the Congo
5
5
10
5
Zambia 2
8
10
5
Cote d'Ivoire
5
4
9
6
Sudan 6
2
8
7
Cameroon 5
3
8
7
Ethiopia 5
2
7
8
Tanzania 4
2
6
9
Mozambique 4
2
6
9
Gabon 5
1
6
9
Botswana 5
1
6
9
Botswana 5
1
6
9
Uganda 4
1
5
10
Guinea 4
1
5
10
Mauritius 4
1
5
10
Senegal 3
1
4
11
Burkina Faso
3
1
4
11
Malawi 3
1
4
11
Mali 2
1
3
12
Lesotho 2
1
3
12
Mauritania 2
1
3
12
Madagascar 2
1
3
12
Namibia 2
1
3
12
Niger
2
1
3
12
Togo 2
1
3
12
Benin 1
1
2
13
44
Central African Republic
1
1
2
13
Burundi 1
1
2
13
Rwanda 1
1
2
13
Eritrea 1
1
2
13
Congo (Brazzaville)
1
1
2
13
Angola 1
1
2
13
Chad 1
1
2
13
Swaziland 2
1
3
13
Guinea-Bissau 1
1
2
13
Sierra Leone
1
1
2
13
Somalia 1
1
2
13
Liberia 1
1
2
13
Equatorial Guinea
1
1
2
13
Djibouti 1
1
2
13
Sao Tome and Principe
1
1
2
13
Seychelles 1
1
2
13
Comoros 1
1
2
13
Gambia 1
1
2
13
This table should be interpreted with caution. It should be seen as a relative ranking of countries, rather than
an estimation of the absolute condition regarding PCDD/F production, and the possible condition regarding
PCBs. Factors that can affect the rank includes current PCB elimination programmes, as well as
implementation of pollution control technologies to reduce PCDD/F production. Another serious
consideration is the surface area where these activities take place. Small countries and islands might have a
higher risk profile than suggested by this approach. Again this highlights the serious limitation placed by the
lack of data.
2.7 OTHER SOURCES OF PTS
PTS of concern in this category are PAHs and PCDD/Fs. Although not quantified, the main source
categories are:
PAHs exhaust emission from combustion of fossil fuels in vehicles and electrical generating
sets. The latter provide the main source of energy for most industries in the region due to epileptic
power supply from the national grid in many countries.
45
Dioxins and furans - Waste burning is possibly the least known factor in the production of
PCDD/Fs in Africa. A large amount of accidental and deliberate combustion is taking place,
including the burning of rubber tyres as well as stripping insulation of copper wires and cable.
Waste combustion could potentially be the largest source of PTS in Africa. Moreover, in countries
producing sugar, burning of sugar cane fields, to cut costs, just before harvest is of common
practice. This could also contribute to the formation of dioxins.
Uncontrolled waste incineration, especially incineration of hospital/clinical wastes, municipal and industrial
wastes is probably the major source of PCDD/F production. In an effort to arrive at some measure of
quantification of PCDD/Fs releases from the uncontrolled burning of domestic waste, the RBA technical
workshop went through an exercise to derive country level release estimation. The following assumptions
were discussed and agreed upon:
Although the per capita waste production differs significantly between rural and urban people,
and based on some data available from South Africa and the Africa Environment Outlook: Past,
Present and Future (UNEP 2002), a mean of 0.4 kg of domestic waste (10-15% plastics, rubber
and oils) per person was assumed per country.
Not all waste will be burned. The workshop assumed that only 25% would be burned in open
landfill or dumps.
The conversion factor for uncontrolled domestic waste burning emission to air is 300 µg / ton
waste (UNEP 2001).
The conversion factor for uncontrolled domestic waste burning emission as burned residue is 600
µg / ton waste (UNEP 2001).
We did not attempt a TEQ estimation for leaching from landfills and waste dumps, due to the lack
of data regarding leachate production, which is used in the conversion factor. Since the conversion
factor is low (30 pg / l leachate; UNEP 2001), this source is for now deemed negligible.
These assumptions were applied to population levels during the workshop. Accurate population levels were
not available, but subsequent correlation with external data showed a remarkable correlation. To derive
estimations for all countries in the region, the latest population estimates (2001) from the CIA Factbook were
used as basis. The results are presented in Table 2.10. This data was then ranked according to country.
46
Table 2.10
Countries ranked according to estimated daily TEQ releases from uncontrolled domestic
waste combustion, based on population data1
Country
Population
Waste
Air
Burned
TOTAL
200µg County
(2001
production releases Residue TEQ from divisions Rank
estimates)
(tons/day)
(mg
(mg
domestic
TEQ)
TEQ) waste (mg
TEQ / day)
Nigeria 126635626
50654
3799
7598
11397
57
1
Ethiopia 65891874
26357
1977
3954
5930
30
2
DRC 53624718
21450
1609
3217
4826
24
3
South Africa
43586097
17434
1308
2615
3923
20
4
Tanzania 36232074
14493
1087
2174
3261
16
5
Sudan 36080373
14432
1082
2165
3247
16
5
Kenya 30765916
12306
923
1846
2769
14
6
Uganda 23985712
9594
720
1439
2159
11
7
Ghana 19894014
7958
597
1194
1790
9
8
Mozambique 19371057
7748
581
1162
1743
9
8
Cote d'Ivoire
16393221
6557
492
984
1475
7
9
Madagascar 15982563
6393
479
959
1438
7
9
Cameroon 15803220
6321
474
948
1422
7
9
Burkina Faso
12272289
4909
368
736
1105
6
10
Zimbabwe 11365366
4546
341
682
1023
5
11
Mali 11008518
4403
330
661
991
5
11
Malawi 10548250
4219
316
633
949
5
11
Angola 10366031
4146
311
622
933
5
11
Niger 10355156
4142
311
621
932
5
11
Senegal 10284929
4114
309
617
926
5
11
Zambia 9770199
3908
293
586
879
4
12
Chad 8707078
3483
261
522
784
4
12
Guinea 7613870
3046
228
457
685
3
13
Somalia 7488773
2996
225
449
674
3
13
47
Rwanda 7312756
2925
219
439
658
3
13
Benin 6590782
2636
198
395
593
3
13
Burundi 6223897
2490
187
373
560
3
13
Sierra Leone
5426618
2171
163
326
488
2
14
Togo 5153088
2061
155
309
464
2
14
Eritrea 4298269
1719
129
258
387
2
14
Central African 3576884
1431
107
215
322
2
14
Republic
Liberia 3225837
1290
97
194
290
1
15
Congo
2894336
1158
87
174
260
1
15
(Brazzaville)
Mauritania 2747312
1099
82
165
247
1
15
Lesotho 2177062
871
65
131
196
1
15
Namibia 1797677
719
54
108
162
1
15
Botswana 1586119
634
48
95
143
1
15
Guinea-Bissau 1315822
526
39
79
118
1
15
Gabon 1221175
488
37
73
110
1
15
Mauritius 1189825
476
36
71
107
1
15
Swaziland 1104343
442
33
66
99
1
15
Comoros 596202
238
18
36
54
1
15
Equatorial Guinea
486060
194
15
29
44
1
15
Djibouti 460700
184
14
28
41
1
15
Sao Tome and
165034
66
5
10
15
1
15
Principe
Seychelles 79715
32
2
5
7
1
15
TOTALS 673656437
269463
20210
40419
60629
1
Data derived from CIA Factbook (2001) estimates
Table 2.10 shows a daily TEQ production of around 60g (21360 g TEQ/year) for dioxins and furans for
Region V, from uncontrolled domestic waste combustion. Care should be taken with this estimate, as some
of the assumptions will not be valid under certain conditions, such as very poor communities with less waste
production, or countries with less than normal use of plastics, as well as better landfill practices (in some
countries) where combustion is not carried out. The obverse is also true, as some combustion practices might
48
have higher conversion factors than indicated. The Table also shows that 15 countries produce more than
1000 mg TEQ per day (arbitrary criterion only). These countries also have populations of more than 11
million. Results given in this table suggest that even non-industrialised countries with large populations
(such as Ethiopia, Madagascar and Burkina Faso) might have to address the TEQ (PCDD/Fs) production
derived from waste combustion in their countries.
It must also be kept in mind that natural formation of some PTS probably occurs, notably the PCDD/Fs,
during combustion of natural vegetation (forest, savannah), and crops such as sugar cane. In some countries,
the burning of sugarcane is common practice, to mature the cane, but also to reduce the volume for
extraction of sugar. Some components of Africa's natural vegetation contain relatively high levels of chlorine
and, although not yet measured, could contribute towards environmental levels of PCDD/Fs.
The data gap on PCDD/Fs releases will only be partially addressed in the near future, since only a few
countries are currently carrying out the inventory of dioxins under the aegis of UNEP Chemicals. There are
only a few active research studies in Africa to cover some of these data gaps.
2.8 IMPORT AND EXPORT STATISTICS OF PTS CONTAINING WASTES
The Basel convention, Bamako Convention and many national environmental laws in the region prohibit
export of hazardous wastes including those containing PTS from OECD countries into African countries, not
even under the guise of wastes recycling. Since engineered landfill sites are generally lacking in the region,
coupled with non-availability of efficient high temperature incinerators with air pollution control devices, the
countries in the region have at present no option but to export their hazardous wastes containing PCBs and
obsolete pesticides for incineration to approved facilities in the developed countries. Illegal traffic in PTS
wastes in the region has been minimized through the Toxic Waste Dump Watch Alert system put in place by
the Organization of African Unity (OAU), and active cooperation with the Secretariat of the Basel
Convention. Otherwise, no data on imports or exports were available in the public domain, which constitutes
a major data gap.
2.9 COUNTRY RANKING ACCORDING TO PTS SCORES
The various rankings attempted in this Chapter, can be combined to provide an overview of the possible
relative sizes of PTS issues in each country. These ranks are provided for each country, alphabetically, in
Table 2.11 below. Because the ranks were derived independently using different criteria, they cannot be
combined or totalled. The countries are therefore given in alphabetical order.
Table 2.11
Ranking scores for the countries, according to agricultural PTS, unintended industrial PTS
production, and TEQ production through uncontrolled open waste burning
Country Agricultural
Industry PTS Domestic waste
PTS Rank
Rank
combustion Rank
Angola 11
13
11
Benin 9
13
13
Botswana 6
9
15
Burkina Faso
10
11
10
Burundi 10
13
13
Cameroon 7
7
9
Central African Republic
10
13
14
Chad 11
13
12
Comoros 11
13
15
Congo (Brazzaville)
11
13
15
Cote d'Ivoire
3
6
9
49
Democratic Republic of
5
5
3
Congo
Djibouti 11
13
15
Equatorial Guinea
11
13
15
Eritrea 10
13
14
Ethiopia 3
8
2
Gabon 11
9
15
Gambia 11
13
Ghana 4
4
8
Guinea 10
10
13
Guinea-Bissau 11
13
15
Kenya 3
5
6
Lesotho 11
12
15
Liberia 11
13
15
Madagascar 11
12
9
Malawi 10
11
11
Mali 4
12
11
Mauritania 11
12
15
Mauritius 10
10
15
Mozambique 8
9
8
Namibia 10
12
15
Niger 10
12
11
Nigeria 2
2
1
Rwanda 8
13
13
Sao Tome and Principe
11
13
15
Senegal 5
11
11
Seychelles 11
13
15
Sierra Leone
11
13
14
Somalia 11
13
13
South Africa
1
1
4
Sudan 4
7
5
Swaziland 10
13
15
Tanzania 4
9
5
Togo 10
12
14
Uganda 8
10
7
50
Zambia 11
5
12
Zimbabwe 5
3
11
Table 2.11 shows that the magnitude of the various PTS problems might derive from different sources from
different countries. Comparing for instance Nigeria with South Africa shows that Nigeria's biggest problem
might be open burning, while that of South Africa might be industry and agriculture.
Once again it must be cautioned that the scores were in many cases derived from surrogate data, or based on
incomplete information. This indicates yet again the importance of the existing data gaps that makes it very
difficult to derive a better justified overview and priority setting. Ranking of sources and the associated data
gaps is the subject of the next section.
2.10 RANKING OF PTS CHEMICALS FROM SOURCES BY COUNTRIES
At the Technical Workshop, experts from the countries present were asked to score the PTS as released from
sources according to levels of concern, as well as the data gaps for that specific country. The experts were
asked to rank from 0 for no concern, to 3 for major concern. The results are presented in Table 2.12 and 2.13.
Some country experts did indicate however, that their scoring was indicative only, but the combined scores
from the countries will give a good indication of the overall level of relative concern.
Note: The scoring system used by this region differed slightly from that of the other
regions. A system of 0-3 was used, while the other regions used 0-2. Converting the
scores from this region to a 0-2 system was attempted, but did not convey the concerns of
the participants. The overall ranking by totals from the various countries should therefore
rather be used.
Table 2.12
Levels of concern for different PTS sources as scored by various countries present at the
Technical and Priority Setting Workshops. Shading indicates indicative categories
Ben Bk ChdCo ConC.I Dj DR Et GanKe Mrt Ni SLeSey RS Sud Tan To Za Zi Tot
f
m
v i C h
n s
g
A
g m m
PCBs
2 2 1 0 3 1 1 3 2 3 1 0 3 2 1 2 1 2 2 3 2 37
Dioxins
1 2 0 0 2 0 3 2 1 3 2 1 3 2 2 3 0 3 2 3 2 37
Furans
1 2 0 0 2 0 3 2 1 3 2 1 3 2 2 3 0 3 2 3 2 37
DDT
2 2 0 1 1 1 3 0 3 2 1 1 1 2 0 2 2 2 2 3 1 32
Atrazine
1 1 1 1 2 0 0 1 3 2 2 1 2 1 0 3 1 2 1 3 3 31
Endosulf. 3 2 1 1 0 1 0 1 3 3 2 0 2 0 0 3 2 2 1 0 3 30
HCH
1 1 1 0 2 1 1 0 2 2 1 0 3 2 0 2 1 1 2 1 2 26
Org. Pb
1 2 0 0 2 0 2 1 1 2 1 1 3 2 0 1 0 1 1 3 1 25
Chlordane 0 1 0 0 0 1 2 0 2 1 0 0 0 1 0 2 1 1 2 3 2 19
Chlor.Para 0 2 1 0 0 0 2 0 1 1 -* 0 2 2 0 2 0 - 1 1 2 17
f
Dieldrin
1 1 0 0 0 1 0 0 2 1 1 0 0 1 2 0 2 1 2 1 0 16
Org. Hg
1 1 0 0 0 0 0 1 1 1 0 0 0 2 0 2 1 1 1 1 3 16
PAHs
2 1 0 0 0 0 1 0 0 1 - 0 3 2 0 2 0 0 1 0 2 15
Aldrin
1 1 0 0 1 1 0 0 2 1 1 0 0 1 0 0 2 1 1 1 0 14
51
Endrin
1 1 0 0 0 1 0 0 2 1 0 0 0 1 2 0 1 1 1 1 0 13
Heptachlor 1 1 0 1 1 1 0 0 2 1 1 0 0 0 0 0 1 1 1 1 0 13
HCB
1 2 1 0 0 1 0 0 1 1 0 0 0 3 0 0 0 1 1 1 0 13
Nonphenol 0 2 0 1 0 0 0 0 0 1 1 0 0 0 0 3 0 - 1 1 3 13
Octphenol 0 2 0 0 0 0 0 0 0 1 1 0 0 0 0 3 0 0 1 1 3 12
Phthalate
1 2 0 0 0 0 0 0 1 1 - 0 1 0 0 2 0 0 1 0 2 11
Toxaph.
1 1 0 1 0 1 1 1 0 1 0 0 0 0 0 0 1 1 1 0 0 10
Org. tin
0 2 0 0 0 0 0 0 1 1 1 0 0 0 0 0 0 1 1 0 1 8
PBDE
0 1 0 0 0 0 0 0 0 1 - 0 0 2 0 2 0 0 1 0 0 7
PCP
0 1 0 0 0 0 0 0 0 2 1 0 0 0 0 0 1 0 1 0 0 6
Chlordeco 0 1 0 0 0 0 0 0 1 1 0 0 0 0 0 0 0 - 1 1 0 5
Mirex
0 1 0 0 0 0 0 0 0 1 0 0 0 1 0 0 0 0 1 0 0 4
* - indicates no score presented.
From Table 2.13 it is clear that the country experts and representatives rated the unintentional production of
PCDD/Fs, as well as the problem of PCBs, as the highest concern for most countries, including the
associated data gaps. DDT, atrazine and endosulfan were ranked as the most important PTS pesticides.
Organic lead and mercury, as well as most of the other PTS pesticides were categorized in the next section.
The lack of knowledge by the participants about compounds such as PBDE and octyl and nonyl phenols
might have resulted in the low ranking of these compounds.
Table 2.13
Data gaps for different PTS sources as scored by various countries present at the Technical
Workshop and the Priority Setting Workshop. Shading indicates indicative categories.
Ben
Bk Chd Co Con C.I Dj DR Et Ke Mrt Ni SLeSey S. SudTan To Za Zi Total
f
m
v i C h n s g
A
g m m
Dioxins
3 3 3 3 3 3 3 3 3 3 2 3 2 3 3 3 3 3 2 3
57
Furans
1 3 3 3 3 3 3 3 3 3 2 3 2 3 3 3 3 3 2 3
55
Org. Pb
1 3 3 3 3 3 3 3 1 3 1 3 1 1 3 3 1 3 2 3
47
Endosulf.
3 3 2 3 3 3 3 3 3 1 0 2 3 1 3 2 3 3 1 1
46
PCBs
3 3 2 1 3 2 3 3 3 3 0 3 1 2 3 2 2 3 2 1
45
HCH
2 3 2 3 3 3 3 3 3 1 0 3 3 1 2 2 1 3 1 2
44
PCP
1 3 3 3 3 3 3 3 1 3 0 0 3 1 3 3 1 3 1 3
44
PAHs
2 3 3 3 3 3 3 3 1
- 0 3 2 1 3 3 1 3 1 3
44
Aldrin
2 3 3 3 3 2 3 3 3 2 0 0 3 2 1 2 2 3 3 0
43
DDT
3 3 3 1 3 2 3 3 3 2 1 1 2 1 2 2 2 3 2 1
43
Atrazine
1 3 3 1 3 3 3 3 2 1 1 2 2 1 3 3 2 3 1 1
42
Octphenol
1 3 3 3 3 3 3 3 1 3 0 0 3 1 3 3 0 3 1 2
42
Dieldrin
2 3 3 3 3 2 3 3 3 2 0 0 3 2 1 2 2 3 1 0
41
Org. Hg
1 3 3 2 3 3 3 3 3 2 0 0 1 1 3 3 1 3 1 2
41
Phthala
1 3 3 3 3 3 3 3 1
- 0 1 3 1 3 3 0 3 1 3
41
Chlor.Paraf 1 3 3 3 3 3 3 3 1
- 0 2 2 1 3 3 0 3 1 3
41
Endrin
2 3 3 3 3 2 3 3 3 1 0 0 3 2 1 2 2 3 1 0
40
52
Nonphenol
1 3 3 1 3 3 3 3 1 3 0 0 3 1 3 3 0 3 1 2
40
Chlordane
1 3 3 3 3 2 3 3 3
- 0 0 2 1 1 2 1 3 1 3
38
Heptachlor
2 3 3 1 3 2 3 3 3 2 0 0 3 1 1 2 2 3 1 0
38
PBDE
1 3 3 3 3 3 3 3 1
- 0 0 1 1 3 3 0 3 1 3
38
HCB
2 3 2 3 3 2 3 3 1 2 0 0 2 1 1 3 2 3 1 0
37
Mirex
1 3 3 3 3 3 3 3 2 1 0 0 3 1 1 3 0 3 1 0
37
Toxaph.
2 3 3 1 3 2 3 3 2 2 0 0 3 2 1 2 2 3 0 0
37
Org. tin
1 3 3 2 3 3 3 3 1 1 0 0 3 1 0 3 1 3 1 1
36
Chlordeco.
1 3 3 1 3 3 3 3 1 1 0 0 3 1 0 3 0 3 1 0
33
* - indicates no score presented.
When comparing this table with the previous, it becomes obvious that the participants gave much higher
scores for data gaps, than for levels of concern. PCDD/Fs were classified together as the compounds with the
greatest data gaps. PCBs were ranked lower, probably because more work has been done, or is ongoing, on
PCB inventories. For example, a complete inventory of PCBs has been achieved for Senegal. The industrial
compounds, such as organic lead, PCP, PAHs, and octyl and nonyl phenols were ranked higher than in the
previous table. Closer scrutiny also shows that certain participants might have inadequate knowledge about
the various compounds, and therefore the preponderance of zeros from certain countries. On the other hand,
PBDE for instance, was only scored as 0, 1 or 3, not 2. Only mirex and organic tin scored more than 3 zeros.
This table therefore clearly shows the high level of the data gaps for almost all compounds
2.11 SUMMARY: SOURCE CHARACTERISATION
Source characterization is probably the most important aspect required from the management of PTS in any
region. The main categories of sources identified in the region were production and imports, use of PTS
pesticides, obsolete stocks of PTS pesticides, industrial sources (manufacture, mining and electricity), and
open burning of waste.
2.11.1 Production And Imports
The manufacture of PTS pesticides is, as far as could be ascertained, only done in one country; Atrazine in
South Africa (Table 2.1). A number of other countries do import active ingredients and formulate and
package for local or regional use. The FAO data on import (in monetary terms) will therefore be a good
indicator, as only very little is produced inside the region. These data (Tables 2.2 and 2.3) show that the
countries of the region only import about 5% of the world imports. Not all these imports will be PTS
pesticides, and from calculations done at the Technical Workshops, it was estimated at 18% of the total
imported into Region V (equals $211 million). It also shows a preponderance of certain countries in terms of
import; Ghana, Kenya, South Africa and Zimbabwe imported more than half (54%) in value terms, of the
pesticides, for the whole of Region V.
Imports are channelled through harbours and railway heads, where spillages and accidents may occur, and
the majority of these have also been identified, but more information on road transport and routes need to be
added.
2.11.2 Use Of PTS Pesticides
Pesticides are mainly used in agriculture. The total area in Region V that might experience application is
estimated at almost one million ha (Table 2.4). The major agricultural areas for many countries have also
been identified, and reported. Ethiopia, Madagascar, Mozambique, Somalia, South Africa, Sudan, Tanzania
and Zimbabwe have especially large areas under cultivation and pasture, but smaller countries (such as
islands) might have a much higher percentage allocated. An analysis was also made of the major crops,
probably requiring the application of PTS pesticides, in each country. For the region only 25 such countries
were identified (Table 2.5).
53
It was also recognised that pesticides, including PTS, will also be used outside agricultural areas, for
purposes of disease vector control, vegetation control, food collection and others.
2.11.3 Stocks Of Obsolete Pesticides
Stocks of obsolete pesticides are a particular insidious problem in Africa. With more than 112 000 tons
estimated to be on the continent, this is a problem requiring urgent attention. Data however, is incomplete,
but the problem will be addressed by the African Stockpiles Programme (ASP). From the availablr data,
countries with particular problems appear to be Botswana, Ethiopia, Mali and Mozambique (Table 2.6).
When scores were applied to the data on pesticides for the various countries, the countries could be ranked,
although the rankings should be treated with caution. It seems that especially South Africa, Nigeria, Cote
d'Ivoire, Kenya, Ethiopia and Ghana might have more serious PTS issues to deal with, compared with others
(Table 2.7).
2.11.4 Industrial Chemicals, Including PCBS
Since almost no data was available on this issue (also see Chapter 3), surrogates were needed as an
approximation. The percentage of industry as a component of the national GDP for each country was
calculated. Information on the major types of industries (as related to PTS) was also collected and tabled
(Table 2.8). As a surrogate for PCBs, electricity production was used, and tabled.
This information was then scored and the countries ranked accordingly (Table 2.9). Again South Africa and
Nigeria were highlighted as countries with an apparent large industrial PTS problem, namely for HCB,
PCDD/F and PCBs, followed by Zimbabwe, Ghana, Kenya, DRC and Zambia.
2.11.5 PTS Production From Open Burning
Once again the complete lack of data on this topic for Africa, forced the use of a surrogate. Estimations were
made on amounts of domestic waste generated by each person, as well as the percentage of this waste that
will eventually be burned in an uncontrolled manner. Conversion factors were applied and the daily TEQ
calculated (Table 2.10). For Region V, the daily TEQ production calculated from this source was about 60
g/day. Since the only fixed and accurate information are population figures, only countries with a population
of more than 11 million produced more than 1 g/day (an arbitrary criterion only) via this source. When
ranked, countries that seem to have a particular problem are: Nigeria, Ethiopia, DRC and South Africa,
followed by Tanzania, Sudan, Kenya and Uganda.
Again this approach must be treated with caution. The conversion factors might not be applicable, and the
waste production and waste burning profiles might differ significantly between countries. Open burning is
likely to be a major source of PTS production, and the data gap indicated is therefore a serious issue, when
attempting to characterise the PTS profile for Region V.
Scoring of PTS by source and data gaps: The country experts scored PCBs and PCDD/Fs highly for both
level of concern and data gaps (Tables 2.11 and 2.13). PTS pesticides of concern were DDT, atrazine and
endosulfan. A lack of knowledge probably hampered scoring on PTS chemicals such as the nonyl and octyl
phenols. The scoring was much closer on data gaps than on levels of concern, once again indicating the
constraints facing Africa regarding PTS sources and its management.
2.11.6 REFERENCES
CIA (2001): Central Intelligence of America (CIA) Factbook 2001.
FAO. 2001. Inventory of Obsolete, Unwanted and/or Banned Pesticide Stocks in Africa and the Near East,
Food and Agriculture Organization of the United Nations, Rome, Italy.
UNEP 2002. Africa Environment Outlook. Past, present and future perspectives.
GESAMP (IMO/FAO/UNESCO-IOC/WMO/WHO/IAEA/UN/UNEP Joint Group of Experts on the
Scientific Aspects of Marine Environmental Protection). 2001. Protecting the oceans from land-
based activities Land-based sources and activities affecting the quality and uses of the marine,
coastal and associated freshwater environment. Rep.Stud.GESAMP No.71, 162 pp.
54
3 ENVIRONMENTAL LEVELS, TOXICOLOGICAL AND
ECOTOXICOLOGICAL CHARACTERISATION
3.1 INTRODUCTION
On the basis of about 3,000 questionnaires filled by experts in the region, this chapter presents data on the
levels and trends of PTS in environmental media and clinical samples. Toxicological data are generally
lacking in the region. Nonetheless, toxic effects are discussed in relation to the trends and levels based on the
regional survey.
Out of the 47 countries of Sub-Sahara Africa, only 16 countries have data related to levels of PTS in the
environment. These data have been classified according to the biological or non-biological matrix in which
the different PTS have been detected (Table 3.1).
Attempts have been made to undertake analysis of trends either on temporal and/or spatial basis where
feasible in spite of THE paucity of data for such an exercise. Almost all data have been "one-off" analyses
and there are no sites that have been regularly monitored over a long period of time for PTS. Nonetheless
special trends have been noted as high agricultural and highly industrialised countries in the region with
higher PTS sources (Chapter 2) tend to have higher levels of PTS in environmental media.
Table 3.1
Sub-Sahara Africa Countries that have provided PTS data
AIR WATER
SOILS
SEDIMENTS VEGETATIO
ANIMALS HUMANS
N
BENIN
_ Endosulfan,
endosulfan, endosulfan,
endosulfan,
Endosulfan, _
Dieldrin,
dieldrin,
dieldrin,
dieldrin,DDT,
DDT, PAHs
DDT,
DDT,
DDT,
PAHs
Heptachlor,
heptachlor
PAHs
COTE
_ Lindane,
Lindane,
Lindane,
d'IVOIRE
Heptachlor,
Lindane,
hepta-
Lindane,
Heptachlor, lindane,
Aldrin, HCH, heptachlor, chlor, aldrin,
heptachlor,
Aldrin,
heptachlor,
DDT, dieldrin aldrin,
HCH, DDT,
aldrin, HCH,
dieldrin,
aldrin,
HCH,
dieldrin
DDT, dieldrin
Endosulfan HCH,
DDT,
DDT,
dieldrin
dieldrin
CONGO
_
_
_ _ _
_ HCH,DDT,
(DRC)
heptachlor,
dieldrin,
HCB
PCBs
MADA-
DDT Pyrene
DDT,dieldrin
DDT,lindan endosulfan
GASCAR
_
_
endosulfan
e,
HCH
Lindane, aldrin Endosulfan
heptachlor
55
MALAWI mirex, Mirex, aldrin,
HCB, Dieldrin,
Heptac DDT,
hlor,
Heptachlor,
_
_
DDT
DDT
_
HCH, HCH,
endrin, endosulfan,
dieldri Chlordane,
n,
HCB,endrin,
DDT, Atrazine
Chlord
ane
Aldrin
MAURITI
_ _
atrazine
_
_
Organic
Hg
Organic
US
lead
NAMIBIA
PCBs,
_
_
_
_
_
chlordane
_
Toxaphene,
Dieldrin,
DDT
NIGERIA
_ Lindane,
Lindane,
DDT, PCBs,
HCB,DDT,
OrgHg,
endrin,
Aldrin, DDT
aldrin,DDT, dieldrin,HCH aldrin,lindane
Lindane
heptachlor
Heptachlor,
heptachlor, aldrin,lindane dieldrin, PCBs
Aldrin,
dieldrin,
dieldrin
Endrin,
endosulfan HCB, hepta-
heptachlor,
endosul-
DDT, HCB,
Endosulfan
endrin,
chlor, endo-
endosulfan,
fan,PCBs
HCH,
Dieldrin,HCB PCBs
sulfan
HCH, endrin
PCBs,
DDT, aldrin
PCBs, HCH
dieldrin
Heptachlor, Lindane
Endosulfan
SEYCHE
_
_ _
_ HCH,
DDT
_
_
LLES
SOUTH
_ Endosulfan
dieldrin, DDT Dieldrin, DDT
PCBs, DDT, DDT,*
AFRICA
Atrazine,
PCB
PCB
Heptachlor, dioxins,
endrin
_
HCB,
furans,
PCBs, DDT,
endrin,
HCB,
HCB
Toxaphen,
dieldrin
Dieldrin,
Endosulfan
aldrin
Chlordane
Heptachlor,
Aldrin,atrazi
Chlordane
n
SUDAN
- -
DDT,
BHC,
_ DDT
DDT
DDT,BHC,
Endosulfan
dieldrin
ZIMBAB
_ Aldrin,
HCB,
HCB,aldrin, DDT
HCB,aldrin,
DDT,HCH,
WE
dieldrin
dieldrin
Dieldrin,DD
56
DDT
DDT,
aldrin
dieldrin,DDT
T,
dieldrin
PCBs,HCH
GHANA
- HCB,endosulf Aldrin,
DDT,HCB,
Lindan, DDT,
-
Lindane,
an, DDT,
dieldrin,
lindan,
heptachlor,
heptachlor-
heptachlor,
DDT,
heptachlor,
HCB,
or, HCB,
Lindane
HCB
endosul-fan
endosulfan
endosul-fan
KENYA
- Dieldrin,
Dieldrin,
Dieldrin,
-
Lindane
Lindane, DDT, endosulfan,
PCB
DDT, PCB,
Lindane
UGANDA
-
Lindane
- - -
- -
ZAMBIA
-
Dieldrin, Aldrin,dieldrin,
Dieldrin,
DDT,
Heptachlor,
Aldrin,
endosulfan,
DDT,
aldrin
DDT, Lindane,
Lindane
Endosulfan
* Clinical samples from humans taken from South Africa.
57
3.2 CONCENTRATIONS OF PTS IN ABIOTIC COMPARTMENTS
Sub-Sahara Africa is a region with fairly active agricultural pests and disease vector control activities that
necessitated the use of PTS pesticides for a long period of time, viz. DDT, BHC, aldrin, dieldrin, heptachlor,
chlordane and endosulfan. Organochlorines (OCs) levels detected in various abiotic compartments (viz. air,
water, soil and sediments, Table 3.1) since the 1970's to date indicate that African countries are under the
threat of these PTS pesticides. Moreover, most of the 16 countries have reported data concerning many of the
PTS, excluding dioxins and furans. Table 3.1 indicates that only South Africa had reported data for these two
PTS and only in human tissues (1990). Moreover, PCBs were detectable in sediments, vegetation and
animals of South Africa. Data from Nigeria shows that all compartments, and some human samples are
contaminated with PCBs. Sediments, vegetation and animals also showed some levels of HCB. Although
certain countries like Sudan, Nigeria, Democratic Republic of Congo (DRC) and South Africa amongst
others, do have qualified scientists to analyse dioxins or furans. Most, if not all of the countries of Region V,
are however not properly equipped to undertake these analyses.
The data gathered via the questionnaires have been re-grouped according to their year of study. Data for the
period 1970 to 1979, 1980 to 1989 and 1990 to date (2002) are shown in tables 3.2, 3.3 and 3.4, respectively.
As these data come from different studies and from different areas (country or sub-region), therefore for each
biological or non-biological matrix, only the lowest and highest mean values of the PTS are reported in the
three tables.
Table 3.2: PTS levels detected in the environment in Sub-Sahara Africa for the period 1970-1979
PTS Country
Water
(ng/l) Vegetation (ng/g)
Animals* (ng/g)
DDT S.
Africa
<200- 300
97-540
1 25900
Dieldrin S.
Africa
<100 - 852
20-420
109 1144
Zimbabwe
Endosulfan
S. Africa
684 4843
-
5 - 2 467
Lindane
Zimbabwe
-
-
6305
Toxaphene
Zimbabwe
-
-
671 3119
PCBs Zimbabwe
2-2000
1300-2500
87 18000
S. Africa
HCB
Zimbabwe
-
-
0.7 915
*Terrestrial and aquatic animals
Table 3.3:
PTS levels detected in the environment in Sub-Sahara Africa for the period 1980-1989
PTS
Country
Water (ng/l) Vegetation (ng/g)
Animals* (ng/g)
DDT S.Africa
Zimbabwe
ND 400
ND 233
0.5 221797
Nigeria
Dieldrin S.Africa 0.2 200
17.8 657
78 275
Zimbabwe
Nigeria
Aldrin
S.Africa
ND 100
ND - 143
ND
Zimbabwe
58
Nigeria
Endosulfan
S. Africa
ND 260
17 111
ND 904
Zimbabwe
Nigeria
Lindane
Nigeria
ND - 41.9
2.2 - 23.4
0.2 598
Heptachlor
Nigeria
ND 11.4
1.8 20
ND 300
Atrazine
S. Africa
6900 44000 -
-
PCBs Nigeria,
S.
ND 5.3
ND 2700
74 8847
Africa
HCB
Zimbabwe
ND 100
ND - 5.0
0 6788
* Terrestrial and aquatic animals
Table 3.4:
PTS levels detected in the environment in Sub-Sahara Africa for the period 1990 - to date
PTS
Country
Water (ng/l)
Vegetation (ng/g) Animals (ng/g)
DDT S.
Africa Rivers: ND - 1266
Malawi
Lakes: 0 - 700
3.2 88.2
19 11065
Nigeria
Rain water: 0.097
Madagascar
Dieldrin S.
Africa
Rivers: ND - 657
Malawi
Rain water: 0.205***
15 - 44.5
0.3 70
Nigeria, Kenya
Lakes: 10- 5
Aldrin S.
Africa Rivers: ND - 40
Malawi
Lakes: 0 - 120
Nigeria
Rain water : 0.525
ND - 7.5
ND 30
Endrin
Rivers: ND - 4200
1.3 -
Lakes : 0
Rain water: 0.004
Chlordane S.
Africa
Rivers : 0.02
Malawi
Lakes: 0.018 - 1.9
-
44
Sudan
Rainwater : 0.051
Heptachlor S.
Africa
Rivers: ND - 202
Nigeria
Lakes: ND - 0.07
-
-
Malawi
Rainwater: 0.07
Sudan,
Ghana
HCH
Ghana, Nigeria
Rivers : ND - 297
(Lindane)
Lakes : 0.028
2.5 82.7
1 527
Rain water : 0.309
59
HCB S.
Africa Rivers: ND - 92
Malawi
Lakes: ND - 12.7
Nigeria
Estuarine: ND
Ghana
Rain water: 0.031
0.2 - 1.2
913
PCBs
S. Africa, Nigeria Rivers: ND - 0.3
-
ND 8847
Atrazine S.
Africa
River: 0.38 - 2500
Malawi,
Lakes: 0.38 - 97705
Zimbabwe
Ground water: 2482
Pyrene (PAH) Madagascar
300
-
-
Nonyphenols S. Africa
Rivers: 4
-
-
Mirex
Malawi
Lake: ND 0.003
Endosulfan S.
Africa
Rivers: ND - 430
Malawi
Lakes: 0.004 - 11.4
2.7 15
ND 21
Nigeria
Sudan,
Ghana
The wide range (in some cases high) of environmental concentrations observed in most of the areas of each
country indicates that Sub-Sahara Africa is grossly contaminated by PTS. The levels will tend to increase in
countries still using PTS in relatively large quantities (e.g. Nigeria, South Africa and Zimbabwe) and in
countries that have not enforced a ban or restriction, or countries without regulatory control on the use of
PTS chemicals.
During the period 1970 - 1979, data on only seven out of the twenty-eight PTS have been reported for
Region V (Table 3.2), which increased to nine for the period 1980-1989 (Table 3.3). This second period
corresponds to the period during which people became aware about the hazardous effects of most of the PTS.
In this period, most developed countries and some developing countries, including countries of Region V,
banned and/or restricted the use of most POPs pesticides. While DDT, Lindane, endosulfan, dieldrin PCBs
and HCB were the PTS that were detected in both periods, heptachlor, aldrin and atrazine were of concern
only for the 2nd period (1980's) and was not reported in the first period (1970's). In the third period, 1990 - to
date, several new chemicals used in the agricultural, constructional and industrial sector that are toxic and
persistent in the environment, e.g. endrin, chlordane, PAH compound (pyrene) and nonylphenols were
detected in the different environmental compartments of the region (Table 3.4). Surprisingly, PCBs and HCB
have been detected and reported, as early as the 1970's, in the region (S. Africa and Zimbabwe). Significant
levels of PCBs in water, vegetation and animals were detected, and very high levels (up to 18000 ng/g) in
animals were reported (Table 3.2). For that specific period (1970's), HCB was only detected in animals in
Zimbabwe (0.7- 915 ng/g, Table 3.2). During the 1980's, the HCB levels in animals in Zimbabwe ranged
from zero to 6788 ng/g. The maximum level in the latter is high enough to be of health concern.
Tables 3.2, 3.3 and 3.4 reveal that DDT levels showed a decreasing trend in the water medium; the levels
observed decreased from 705 ng/L for the 1970's, to 400 ng/L in the 1980's and, finally to 350 ng/L for the
last period (1990 - to date). The levels of DDT in vegetation exhibited a different trend, i.e. 97 ng/g, 233 ng/g
and 88.2 ng/g for the same three periods respectively. This trend is an indication that DDT was most
intensively used (agriculture & vectors control) during the 1980's and is reflected in the high levels of DDT
reported for other biota (vegetation and animals) during that period (Table 3.3). For example, an extremely
high concentration (221797 ng/g) of DDT was reported in animals in Zimbabwe (Douthwaite et.al.,1995;
Table 3.3).
Regarding dieldrin, the 1970's period showed the highest levels in all the environmental compartments. The
highest levels (109 - 1144 ng/g) were reported in animals for studies done in South Africa and Zimbabwe
60
(Table 3.2). In the 1980's and the 1990's, dieldrin was still detectable in the environment but at much lower
concentrations (78 - 275 ng/g). The levels of dieldrin in animals, from the previously mentioned countries, in
addition to Malawi, Nigeria and Kenya did not exceed 70 ng/g for the 1990's corresponding to the period
during which the use of POP pesticides use was restricted / limited.
The trend for the 1990's (Table3.4) is that for all PTS, except for atrazine, the levels found in rivers are
generally higher than levels detected in lakes. For atrazine, exceptionally high concentrations in both rivers
and lakes have been detected with the lakes exhibiting higher levels: 2500 ng/L & 97705 ng/L for rivers &
lakes, respectively, as reported in studies done in S. Africa & Zimbabwe (Table 3.4). High levels of atrazine
in water correlates with its relatively high water solubility.
3.2.1 Environmental Media: AIR
For Region V, very little data have been collected concerning PTS levels in air (Table 3.5). This is consistent
with general lack of air quality data for the region. Only two recent studies from Madagascar and Malawi
reported levels of PTS in ambient air. Table 3.5 indicates that an excessively high level of DDT (699000
pg/m3) was detected in Madagascar (Bigouret, 1998), suggesting this study must have been carried out
immediately following DDT application. Karlsson et al. (2000) in a recent study reported variable trace
levels in pg/m3 of 9 PTS in ambient air samples collected in air at Senga Bay, Malawi, from the period 27th
February 1997 to 2nd May 1998Malawi (Table3.5). Amongst the different PTS detected that of mirex is
worth noting as this chemical is not officially used or imported in Malawi. Therefore, its detection, although
at a very low level (1 pg/m3) must be due to either recycling of historical contamination, transboundary
movement, or from illegal trade and use. Generally the PTS pesticides in the study area were not extensively
weathered, implying recent use. Elevated levels of heptachlor, aldrin and dieldrin were detected periodically,
which indicated use on a regular basis. The study also suggested that tropical regions may act as both a
global source and sink for PTS since removal processes may be faster compared to temperate and arctic
regions. It was concluded that regional sources are dominating in the lake Malawi area. Nonetheless, ambient
air levels reported thus far except in the Madagascar study, are much lower than maximum air levels of 100 -
1000 ng/m3 for POPs under Occupational and safety laws in several developed countries.
Table 3.5: Mean Levels of PTS (pg/m3 ) detected in air in Sub-Sahara Africa
Country Location
Sampling
DDT Mirex
HCB Hepta-
Lindane
Endrin Dieldrin C
date
chlor
(HCH)
r
Madagas-
Ambient 11/97
to 699000
car
12/97
Malawi Ambient
02/97
to 26 0.51
11
44 25 1
80 5
05/98
3.2.2 Environmental Media: Water
Data gathered for this project indicate that Sub-Sahara African fresh waters (rivers, lakes, ground, estuaries
and rainwater) are contaminated by a broad spectrum of 14 measured PTS. From these data, the following
range of concentrations in rivers (ng/l) was found: endosulfan (ND - 4843), atrazine (0.38 - 44000), PCBs
(ND - 0.3), dieldrin (ND - 921), DDT (ND - 350), HCB (ND - 9.4), heptachlor (ND - 5.3), chlordane (0.02)
and HCH (ND - 0.1) (Tables 3.2, 3.3 and 3.4). Nonylphenols were reported for a river in South Africa at 4
ng/l while PAHs were detected in Madagascar at 300 ng/l. Mirex, PAHs and endrin were not detected in
rivers in S. Africa and Nigeria. These results come from individual studies done in some countries and do not
reflect the general situation of the region.
The reported range of concentrations (ng/l) for the PTS detected in lakes (Malawi, Nakuru, etc.) was as
follows: endosulfan (ND - 18.5), atrazine (0.004 - 97705), PCBs (ND - 2.0) , dieldrin (0.01 - 11.4), DDT
(0.06 - 8.1), heptachlor (ND -100), chlordane (0.9 - 30.9) and HCH (ND - 0.1). PAHs were reported for only
a lake in Madagascar at a concentration of 300 ng/l. In South Africa, PCBs were detectable in the lakes as
early as 1974 (2 ng/l). However, more recent data about the levels of PCBs in lakes rivers, dams and streams
(ND - 2000 ng/l), have been reported from Nigeria, South Africa, Zimbabwe, Kenya and Cote d'Ivoire
(1990/1992). The levels reported were much higher than 1970-1989 figures.
61
Except for dieldrin, PCBs and DDT with concentrations above 100 ng/l in some rivers (Table 3.2, Van Dyke
et al., 1978), most of the Sub-Sahara African waters have PTS concentrations below (10 ng/l) according to
the data that have been gathered so far for the region. However, this may not be the case generally in Africa,
as a huge data gap exists concerning levels of PTS in the environment in most African countries.
Nonetheless, the high values of PTS in water reported for some countries (Table 3.2) are of concern when
compared to standards for POPs in water in Australia (4 ng/l) and New Zealand (1 ng/L).
The only reported study done on PTS in rainwater was conducted in Malawi (Table 3.4). The following PTS
concentrations (ng /l) were obtained: endosulfan (0.10 ng/l), endrin (0.004), PCBs (ND - 0.3), dieldrin (0.21),
HCB (0.03), aldrin (0.52), chlordane (0.05), DDT (0.09), heptachlor (0.10), chlordane (0.02) and HCH (0.31
ng/l). Mirex was not detected in rainwater, but detected at a very low level (0.003 ng/L) in Lake Malawi by
Karlsson et al. (2000; Table 3.4). However, it was not reported in any African country that mirex was in their
list of imported pesticides. Kepone (isomer of mirex) was donated to Sierra Leone as mentioned by its
representative during the technical workshop.
The problem of ground water contamination by OC pesticides has also been identified in certain parts of
Nigeria (dieldrin, alpha-HCH, gamma-HCH, HCB, heptachlor, aldrin, endosulfan, DDT metabolites and
PCBs) (Osibanjo and Aiyejuyo 1994). Mean concentrations of total DDT and heptachlor exceed the WHO
limits for these chemicals in drinking water. This is expected to have health implications, as most urban and
peri-urban dwellers rely on ground water as the major source for drinking, washing and cooking.
3.2.3 Environmental Media: Marine Water
No data on PTS concentrations in marine waters have been reported in the questionnaires submitted for
Region V. It is probable that none of the coastal countries have conducted research in marine water, whether
for academic purposes or for safety/environmental purposes. Lack of facilities, funds and awareness are
expected to be responsible for the lack of information. However, it is expected, because of the poor working
conditions in almost all the African Ports, including potential spills of pesticides, oils and damaged
containers, that contamination by PTS in the marine environment especially near shore areas could be high
(Chapters 2 & 4).
3.2.4 Environmental Media: River And Lake Sediments
Very little data have been gathered from the questionnaire survey as far as the levels of PTS in sediments are
concerned. Only data from Zimbabwe, Nigeria, South Africa and Madagascar have been reported (Table
3.6). These levels indicate relatively high levels of PTS in certain local hot spots. For example, in
Madagascar (1999), levels of 1100 ng/g and 76 ng/g have been reported for pyrene (a PAH) and DDT,
respectively. In Nigeria (1991), dieldrin and DDT at concentrations of 4560 ng/g and 263 ng/g have been
detected. Other cases of relatively high contamination levels of PTS include South Africa (1974), PCBs in a
lake (320 ng/g), and Zimbabwe (1983), DDT (223 ng/g).
In summary PTS contamination levels in lake sediments (in ng/g dry weight) were as follows: Lindane (89 -
423), HCB (16), aldrin (1), dieldrin (2 - 5), DDT (13 - 223), PCBs (70 - 320) and Pyrene (1100). Heptachlor,
mirex, endosulfan and endrin were not detected (Tables 3. 6 & 3.7).
In the case of river sediments, the following concentrations (ng/g dry weight) of PTS have been reported:
HCB (0.4), aldrin (ND-56), dieldrin (1 - 4560), DDT (1 - 263), HCH (0.2 - 1.1), heptachlor (ND - 64),
endosulfan (ND - 30), and pyrene (1100). PCBs, mirex, and endrin were not detected. However, due to the
big data gap that exists in this compartment of the environment, this trend, again, cannot be generalised for
the whole of Region V (Table 3.6).
62
Table 3.6:
Concentrations of PTS (ng/g dry weight) in Fresh Water Sediments in Sub-Sahara Africa
Country Location Sampling HCB Aldrin
Dieldrin DDT Pyrene PCBs Heptachlor Endosulfan Lindane Endrin Reference
date
(PAH)
(HCH)
Zimbabwe Lake 03/87 to
16 1
4 57 120
Greichus
et.
03/78
al. 1978a
(Mcllwaine)
N. I.
12/82 to
1.0
Matthiessen
04/83
1983
(Kariba)
(ND - 12)
Lake
N.I.
5.0
(ND-16)
76
16
1.0
Mhlanga &
(Mcllwaine)
Madziva,
(32-
(2-42)
(ND-12)
1990
146)
Mada-
Lake
06/99 to
1100
Pijilot,
B.
et.
gascar
06/99
al. 1999
(Hartbeesport)
South
Dam
July 1974
2
45
70
Greichus
et.
Africa
al. 1977
(Hartbeesport)
Dam
N.I. <1 13
320
Greichus
et.
(Voelvlei)
al. 1977
Nigeria
N. I.
06/90 to
ND
1.1
10.8
ND ND
ND
0.2
Osibanjo
et.
12/90
al. 1994
56
4560
263
64
30
05/91
to
0.4
1.1
Osibanjo
et.
11/91
al. 1994
River NI
ND 0.9
13.1
ND ND
ND
1.2 Sunday,
1990
(Ogunpa,
Ibadan)
(ND-1.8)
(ND-
(ND-4)
37.3)
Kenya Lake NI <1.0
30
20
Greichus
et.
(Nakuru)
al. 1978b
Tanzania Lake
131
5
1 Passiverta
et.
(Nyumbaya
al. 1988
Mungu)
(ND-251)
(ND-
(ND-4)
11)
4
(3-6)
Uganda Lakes
10
Sserunjoji,
1974, 1976
63
(2-39)
* Wet weight
N.B: Mean Concentrations and range in parantethis
64
3.2.5 Environmental Media: Marine Sediments
Marine sediments can be considered to be the ultimate destination for certain PTS, as transport by rivers is
one of the main routes by which these PTS migrate (Chapter 4). However, no data has been gathered on the
levels in marine sediments for Sub-Sahara Africa. This constitutes a major data gap that must be filled before
any conclusions can be drawn.
Coastal water sediments of the region also received little attention with respect to PTS. The only two studies
known were done on Ebrie lagoon, Cote d'Ivoire. The 1985 study by Marchand & Martin (1985) revealed
sediments with high concentrations of Lindane (0.5-19 ng/g), DDT (1-997 ng/g) and PCB (2-213ng/g).
However, by the early 1990's, the levels DDT had drastically decreased to 2-243ng/g while PCBs increased
to 8-1014ng/g (Kaba 1992, unpublished data).
3.2.6 Environmental Media: Soil
As for the soil compartment, the questionnaire survey for Region V and other published data revealed that
PTS have been investigated in only a few countries, namely Mauritius (2001), Nigeria (1985) and Sudan
(1994) (Table 3.8). It is also noteworthy that all the PTS mentioned in Table 3.8 mostly concern pesticides;
no data have been reported for the other chemicals, except PCBs in Nigeria. The data showed that most PTS
levels reported were not alarmingly high, except in a few cases (e.g. the Sudan) where DDT and HCH at a
level of 17400 ng/g and 880 ng/g, respectively, have been reported. The relatively high levels of PCBs (538
ng/g) in Nigeria are worth noting. However, the major concern here is not the relatively high levels of some
PTS, but the major data gap that exists for the region.
65
Table 3.7: Concentrations of PTS (ng/g dry weight) in coastal water sediments in Sub-Sahara Africa
Country Location Lindane
DDT PCBs
Dieldrin
Heptachlor
Aldrin
Reference
(HCH)
Coted'Ivoire
Lagoon
2.3 (0.5-18) 17.1 (1.1-997)
46.7 (2.213)
Marchand & Matin
(Ebrie)
1985
Coted'Ivoire
Lagoon
6.2
46.2
356 (8.5-
17.8 (ND-
0.9 (ND-6.8)
157(0.07-62.1)
Kaba
(Ebrie)
(0.08-33.2)
(2.5 242.8)
1014)
126)
(Unpublished)
data)
N.D. = Not Detected
Table 3.8: Mean PTS concentrations (ng/g dry weight) in the soils of Sub-Sahara Africa
Country
Site
Sampling Atrazine Lindane Aldrin Heptachlor Endosulfan Endrin Dieldrin DDT PCB
Reference
Period
(HCH)
Mauritiu
Agricultural 06/97 to
22
Msiri
report
s
08/97
July 2001
Agric. Land
MSIRI,
Mauritius 2001
Nigeria
Agricultural 05/85 to
18 58 3
ND
ND 31.9 155 538 Babatunde
1985
land
11/85
Sudan
Agric.
1974 to
17400
Elzorgani
et. al.
Scheme
1993
880
1994
& Stores
1998
160
Ahmed
1999
Zambia
Agric. Land 01/1992
64
Anonymous
to
2002a
06/1992
66
3.3 CONCENTRATIONS OF PTS IN BIOTIC MEDIA
From the few data gathered so far (1970 - 2002) for Sub-Sahara Africa, the following PTS have been
detected in the different biotic media: aldrin, dieldrin, DDT, heptachlor, endosulfan, Lindane, toxaphene,
PCBs, HCB and endrin. Among the PTS that had the highest values, the trend observed is DDT> PCBs>
toxaphene. (see Tables 3.2, 3.3 & 3.4,).
3.3.1 PTS in Vegetation
PTS data in vegetation for Region V are presented in Tables 3.2, 3.3 and 3.4 & 3.9. Most samples showed
residue levels below the FAO's MRL. Nonetheless, in certain cases, high concentrations of PTS have been
reported. Some examples are 882 ng/g of DDT (lettuce in Madagascar,) 1900 ng/g of PCBs (aquatic micro
algae in South Africa), 233 ng/g of DDT (pine needles) and 2700 ng/g PCBs (plants from refuse dumps in
Nigeria). In the Sudan, fairly high levels of OC insecticides (e.g. 200 ng/g of DDT in cottonseeds,) have been
reported and, as result, these OCs were banned and /or restricted in the Sudan, except endosulfan.
Aquatic plants, viz. Water hyacinth in South Africa (1300 ng/g dry weight) and Nigeria (2700 ng/g dry
weight) proved to contain high levels of PCBs. Algae also showed high concentration of this industrial PTS
(2500 ng/g dry weight). Dieldrin, in Nigeria, was detected at a much lower concentration in water hyacinth
(43 ng/g dry weight). Plants from Lake Nymba Ya Mungu, in Tanzania, viz. Pistia stratiotes, showed the
following levels of PTS: dieldrin 27 ng/g, Lindane 4.5 ng/g and aldrin 25 ng/g dry weight. Higher plants of
Kenyan lakes proved to contain from traces to 107 ng/g dry weight of total DDT. A study done in
Hartbeespoort Dam Lake in South Africa (Greichus et al. 1977) revealed that algae (2500 ng/g dry weight)
contained higher levels of PCBs than water hyacinth (1300 ng/g dry weight). Following the same order,
concentrations of 230 and 540 ng/g dry weight were detected for DDT respectively. The same trend was also
found for dieldrin (20 and 50 ng/g; Table 3.9).
67
Table 3.9: Mean concentrations of PTS (ng/g dry weight) in aquatic plants in Sub-Sahara Africa
Country Location
Dieldrin Lindane Aldrin
DDT
Heptachlor
Endosulfan
PCB
Reference
(HCH)
Uganda Lake
90
Sserunjoji 1974, 1976
(Higher Plants)
Tanzania Lake
(Nyumba 27 4.5 25 33
Paasivirta
et. al. 1988
Ya Mangu; Pista
Stratiotes)
Kenya Lake
(Naivasha,
7
Algae)
Lake
(Naivasha,
30
Higher plants)
Lake
(Naivasha,
107
Ferns, Salvinia
Lincer et al. 1981
auriculata)
Lake
(Naivasha,
31
Total vegetation)
Lake
(Naivasha,
ND
Oscillatoria
platensis)
Lake
(Baringo;
ND
plant parts with
algae and
Spirogyra)
Nigeria Coastal
water 43 49 52
17
2700
Ogunseitan
1987
(Lagoon
Badagry; Water
Hyacinth)
68
South
Dam
50
540
2500
Greichus et al. 1977
Africa
(Hartbeespoort;
20
230
1300
Algae)
69
3.3.2 PTS in Animals
Animals in this text refer to aquatic and terrestrial animals. Data reported in Tables 3.2, 3.3, 3.4 and 3.10
concern animals, their organs and tissues, milk, etc.
3.3.3 PTS in Aquatic Animals
Table 3.10 provides available data on PTS levels in aquatic animals in the region. It is worth noting that most
of the reported data in Table 3.10 are below the FAO's MRL. El-Zorgani and Ali (1981) found that all fish
tissue samples collected from different areas of the Sudan contained DDT residues. The concentration in the
muscles and liver ranged between 0.04 and 0.2 µg/g. Fat samples contained higher levels, ranging from 0.3 -
3.3 µg/g.
In the 1970's the levels of DDT, dieldrin and PCBs in the finfish of Lake Nakuru of Kenya were found to be
< 11 - 13, 1.5 - 7, and < 140 ng/g, respectively. During the same period, Lake Tanganyika (Tanzania) finfish
was found to have levels of DDT ranging from 50 to 330 ng/g. The finfish of Lake Nubia, between Egypt
and the Sudan, in 1979 showed DDT levels ranging from 6 to 184 ng/g, whereas in 1976 the River Nile
finfish showed levels ranging from 270 to 116000 ng/g. The finfish of Lake Victoria (Kenya) was studied in
the years 1990 and 1992. The levels obtained were 7 - 70 ng/g for dieldrin, 1 - 47 ng/g for Lindane, 20 ng/g
for aldrin, 3 - 460 ng/g for DDT and 20 - 332 ng/g for PCBs (Table 3.10). It should be noted that Lake
Victoria feeds the river Nile that in turn feeds Lake Nubia. Data gap due to lack of systematic study makes
PTS trend analysis difficult. Moreover, high levels of DDT detected in the different lakes during that period,
(when DDT was not banned or restricted), can be correlated to its intensity of use for vector control in the
region.
Generally fish from Kenyan rivers have high PTS contamination as follows: Lindane ( 4-295ng/g),
Endosulfan (nd-110ng/g), DDT (85 1185ng/g). Nigerian rivers also have high PTS contamination in fish as
indicated by the following levels (Osibanjo et.al 1994) : dieldrin (nd-173ng/g) , Lindane ( 0.2- 598ng/g),
endosulfan ( 3-904ng/g),DDT( 3-161ng/g) and PCB (8-130 ng/g) respectively.
There are large data gaps on PTS levels in marine fish as data are available only for 6 countries (Benin,
Gambia, Sierra Leone, Cameroon, Nigeria and Cote D'Ivoire ) in the region. In general , marine fish are less
contaminated than freshwater species (Table 3.10). Data from marine fish from Cameroon however show
high levels for DDT and PCBs. A study done in Cameroon (1992) revealed that shrimps contained several
PTS: DDT (244 ng/g), PCBs (342 ng/g) and Lindane (0.98 ng/g). Oysters showed a different picture: DDT
(113 ng/g), PCBs (209 ng/g), and Lindane (144 ng/g) respectively. On the other hand, Nigerian shellfish
(shrimps, crab and oysters) proved to contain almost all the commonly encountered PTS. DDT was found at
37 ng/g, PCBs at 94.5 ng/g, Lindane at 0.8 ng/g and HCB at 0.22 ng/g( Osibanjo & Bamgbose 1990). Lower
levels were found in Gambia and Cote d'Ivoire shellfish (Table 3.10). Although the data available are
limited, Table 3.10 indicates that the aquatic environment of Region V is contaminated by a number of PTS
chemicals including PCBs and pesticides with shellfish having higher values than finfish in general.
Mean methyl mercury concentrations of about 300 ng/g were reported for fish in Nigeria, the only country
reporting this PTS. Furthermore, no levels of PAHs and dioxins/furans in animals were reported in the
region.
70
Table 3.10:
Concentrations of PTS (ng/g fresh weight) in fish and shellfish from Inland, Coastal and marine waters in Sub-Sahara Africa
Country
Location
Dieldrin Endosulfan DDT
PCBs
Lindane
Aldrin
HCB
Heptachlor
Reference
(HCH)
Kenya
Lake (Nakuru)
1.5-7
13
150
Greichus,
1978b
Koeman et. al.
1972
River (Tana,
20(ND-110)
Munga,
1985
Masinga Dam)
Lake (Victoria)
7-70
3.0-460
90
1-47 20
Mitema
and
(20-332)
Gitau 1990
Calamari et. al.
1992
Sudan
Lake (Nubia)
58
El-Zorgani,
1979
(6-184)
River Nile
2950
El-Zorgani,
1976
(270-
16000)
Uganda
Lakes
5(2-27)
Sserunjoji, 1974
and 1976
Tanzania Lake (Nyumbaya
3
8
1
Paasivirta
et
al,
Mungu)
1988
Lake (Tanganyika)
165
(50-
Deelstra et al;
330)
1976
Nigeria
River (Ogun and
173 (3-904) 21 (3.161) 29 (8-
20.5 (7-
13
50
Amakwe, 1984
Oyo)
130)
106)
(9-130) (1-300)
Nigeria
River (Cross River
14
2.5 3.8 62
55
0.3 (ND-1.0) Fayomi, 1987
and Akwa Ibom)
(ND-89.6)
(0.7-14)
(0.87-20.4) (ND-14.9)
Coastal & Marine
0.16
4.37
40.9
0.83 2.85 0.92
1.29 (ND-
Osibanjo &
(finfish)
(0.15-
(11.0
(0.04-
21.40)
Bamgbose 1990
71
(ND-4.95) 18.60) 225)
(ND-5.30) (ND-54.60)
9.48)
Coastal & Marine
2.41 37.0
94.5
0.80
0.52
0.22
1.35
Osibanjo &
Shellfish (Shrimp,
Bamgbose 1990
Crab, Oyster, Snail
(ND-21.0)
(4.73-152) (37.287)
(ND-1.69)
(ND-194)
(ND-
(ND-4.16)
0.80)
72
3.3.4 PTS in Terrestrial Animals
High concentrations of DDT were measured in Zebu (1917 ng/g) and chicken (777 ng/g) in Madagascar
(1996); in crocodile (34420 ng/g) and wildlife (25900 ng/g) in Zimbabwe were reported. Similarly high
concentrations of PCBs (8847 ng/g), Lindane (6305 ng/g) and toxaphene (3119 ng/g) were found in wildlife
of South Africa .
Another study done in Nigeria (Osibanjo & Adeyeye, 1997) on the residue levels of OCs in cow, pig and
goat indicated high Lindane levels (µg/kg) in pigs (226), followed by goat meat (54), and cow meat (35).
The same trend was observed for aldrin and dieldrin, and the former showed higher levels than the latter. The
ranking of total DDT level (µg/kg) in meat was as follows: pig (510)> cow (164)>goat (141). HCB and
heptachlor were not found in any of the three animals. Thus, dietary intakes of meat, milk, milk products,
and other animals probably form the greatest sources of human exposure to PTS. The MRL for total HCH is
set at 2000 µg/kg, for aldrin at 200 µg/kg, for total DDT at 5000 µg/kg, and for heptachlor 200 µg/kg.
Eltom (1997) analysed 50 samples of cow's milk from a village (Fadasi) in the central Sudan and found 0.12
µg/g of Lindane, 0.01 µg/g of aldrin, 1.28 µg/g of heptachlor epoxide and 1.75 µg/g of DDE.
These results and many more contained in the PTS database for Region V on the GEF/UNEP website
indicate that animals contamination by PTS could be a major problem in Sub-Sahara Africa.
3.3.5 PTS in Humans
The concentrations of PTS contaminants in human tissues, blood and breast milk provide a reliable indicator
to PTS exposure of different population groups. Although data are abundant for developed countries, studies
on PTS contaminants in human samples including breast milk are very limited in Africa. Table 3.8 indicates
that PTS, especially OC pesticides and PCBs grossly contaminate human tissues in the region, although the
values vary widely from country to country. The OC pesticides concentrations are relatively higher than
values reported in literature for European countries, but much lower than values for Hong Kong, except for
HCB.
The occurrence of relatively high levels of DDT, HCB, lindane and endosulfan in human breast milk for the
region is of concern in view of WHO's vigorous campaign that mothers breast milk is best for children. It has
been established by studies in South Africa that OCs can be transferred to infants via breast milk. Thus
infants are being exposed to these xenobiotics while the toxicological hazards and risks have not been
studied in many African countries.
In DRC, adipose DDT level proved to be extremely high (15000 µg/g) compared to the other PTS (range 10-
49 µg/g). The adipose tissue in South Africa showed high levels of HCB (4650 µg/kg) and DDT (6375
µg/kg). Breast milk in South Africa contained the following levels of dioxins (318 µg/kg) and furans (21
µg/kg). In Madagascar (1997) mothers' milk contained 49 µg/kg of HCH and 12 µg/kg of endosulfan. In
Nigeria, occupational exposure effected levels in blood as high as 11565 µg/kg of DDT, 3778 µg/kg of
PCBs, 958 µg/kg for aldrin, and 92 µg/kg for dieldrin. Levels of mothers' breast milk in Zimbabwe's urban
and rural population showed that 6000 µg/kg of DDT was detectable, and 910 µg/kg lindane was also
detectable
73
Table 3.11: Mean concentration of PTS (ng/g wet weight) in Humans in Sub-Sahara Africa
Country Sample
Exposure Sampling
Lindane
DDT Hepta-
Dieldrin HCB PCBs
Reference
date
(HCH)
chlor
Congo
Adipose
Urban
09/1982 to
41 15000
10
30
30
37
Okond'Ahoka
et. al
(DRC)
01/1983
1984
Madagascar Milk
Urban
and
04/1996 to
49
Cyril
Nogier
et. al.
Rural
06/1996
1997
South Africa Serum
Urban
11/1987
202
Bouwman et al. 1990
Adipose
- 06/1968
to
6375
40
4650
Van
Dyk
et al 1982
06/1975
Zimbabwe
Milk
Urban & Rural
910
6000
50
Chikunio et al 1989
Nigeria
Blood
Occupational
05/11987 to
11565
10
92
3778
Osasumwen
1987
11/1987
Blood
Urban
21.97
0.88
198.73
Ikem 1988
Sudan
Blood
Rural
October
0.40 10.00
1.00
Liedholm
&
Amisi
1977
1978
Kenya Milk,
-
1986
0.08
Kimani V. 1997
Serum Fat
Umbilical
-
2.75-4.86
Kimani V. 1997
cord,
serum,
milk
Madagascar
Milk
Urban & Rural 04/1996 to
12
Cyril Nogier
06/1996
South Africa Milk
Urban & Rural 1988 to 1990
318
21
Schecter et al.
1990
Nigeria Blood
Occupational
05/1987
to
59
958
ND
Osasumwen
1987
74
11/1987
Urban
05/1987
to
1.75 3.15
Ikem
1988
12/1988
Mauritius
Blood
Rural & Urban 07/2001 to
4.2µg/dl
Univ. M. 2002
01/2002
Kenya
Milk
-
1986
0.4
Kimani V. 1997
Serum
-
1986
4.83
Kimani V. 1997
75
3.4 EVIDENCE OF HARMFUL EFFECTS
For Region V, the few reported cases of poisoning due to PTS are given in Table 3.12. Many cases of
accidental or intentional release of large amounts of PTS (for fishing or hunting) causing severe stress to the
environment have been reported in the region. For example, according to Osibanjo et al. (1994) the
accidental release of OCs in large quantities had caused massive fish kills in many countries, such as
Senegal, Nigeria and Kenya.
3.4.1 Comparison Of Measured Data With Health And Environmental Quality Criteria
In the Sudan, a study was conducted in 1976 on Desert Locust Control Organisation-East Africa (DLCO-
EA) Staff, and the Plant Protection staff; 90 blood samples were taken. Samples were analysed for OCs,
namely DDT, dieldrin & HCH on persons who were 22 - 63 year olds. For HCH (Lindane) the minimum
detectable concentration (ng/ml whole blood) was nil; the acceptable concentration for unexposed
populations was not available at that time. The upper acceptable limits used in the study were 20 ng/ml
whole blood. For dieldrin the respective values were 1.0, 3.5 and 100 ng/ml whole blood. Following the
same order, DDT figures were 10.0, 10.0 and 500 ng/ml whole blood. Some workers had very high OC
levels in their blood, E.g. a few, worker N° 11: 12.4, 54.4, and zero, for HCH, DDT, and dieldrin; N° 13:
322.8 DDT only; N° 15: 33.6 HCH, 2101.2 DDT and 384 dieldrin (Liedholm & Amisi, 1978).
People working in plant protection department, Wad Medani, Sudan were occupationally exposed to
insecticides, either by selling, mixing or spraying. OCs were shown to affect the biochemistry of
mammalian systems in various ways. The problem is mainly their chronic effects. The results obtained from
the blood serum of occupationally exposed people were as follows: DDE was found in all samples with a
range of 0.02 to 0.72 ng/ml whole blood; p,p-DDT was detected in seven samples out of 24 (0.01-0.18);
o,p'-DDT & TDE were also detected(0.01-0.4& 0.02-0.2 µg/ml, respectively. HCH was detected in 11
samples (0.07-0.15 ng/ml whole blood). The occurrence of aldrin & dieldrin was less frequent; their
concentrations were lower than 0.03 µg/ml. There is correlation between DDE level in the whole blood &
adipose tissue. DDT in the blood indicated very recent exposure, whereas DDE reflected the chronic level
of DDT exposure. One year was required for the metabolism of DDT into DDE, when volunteers were fed
high DDT dosages (5-35 mg/day). The results of this work showed that there was no correlation between
year of exposure & the concentration in blood serum. The values obtained were higher than those from
Tunisia & Brazil and lower than those from India. DDT use was stopped in the Sudan 1981.
El-Zorgani and Musa (1976) studied the residues of OCs in the blood of 22 exposed personnel of the Gezira
Research Farm (Wad Medani, Sudan). The authors found DDE, and p,p'-DDT in all samples (0.01 - 0.12
ppm for DDE and 0.02 - 1.01 ppm for p,p'-DDT). The occurrence of dieldrin was less frequent and at
concentrations not exceeding 0.01 ppm. Eltom (1997) studied 50 blood samples from one village in central
Sudan. HCH, aldrin, heptachlor epoxide and DDE were detected at the levels of 0.12 ppm, 0.01 ppm, 1.28
ppm and 1.75 ppm, respectively.
76
3.4.1.1.1.1
Common Name of
Country
Species used
Pathway of
Exposure occurrences Type of effect
Period of
Reference
PTS incriminated
exposure
Assessment
Endosulfan South
Africa
Various Environment
Single/Accident
Acute toxicity 1980 to 1995
Fourie 1996
370 incidents of wildlife
poisonings
Toxaphene South
Africa
Crocodylus
Environment Single/
accident
Behavioural
08/1978 to 03/1979 Brooks 1980
niloticus
Toxaphene South
Africa
Tilapia sparmanii Environment Single/ accident
Acute toxicity 08/1978 to 08/1978 Brooks 1980
Toxaphene South
Africa
Oreochromis
Environment Single/ accident
Acute toxicity 08/1978 to 08/1978 Brooks 1980
mossambicus
Toxaphene
South Africa
Pseudocreni-
Environment Single/accident
Acute toxicity 08/1978 to 08/1978 Brooks 1980
labrus philander
Toxaphene South
Africa
Clarias garie
Environment Single/accident
Acute
toxicity 08/1978 to 08/1978 Brooks 1980
pinus
Toxaphene South
Africa
Barbus spp (fish)
Environment Single/accident
Acute
toxicity 08/1978 to 08/1978 Brooks 1980
Toxaphene South
Africa
Anguilla spp
Environment Single/accident
Acute toxicity 08/1978 to 08/1978 Brooks 1980
Toxaphene South
Africa
Podocica
Environment Single/ accident
Acute toxicity 08/1978 to 08/1978 Brooks 1980
senegalensis
(bird)
Endosulfan Botswana
Ceryle rudis
Environment Single/
accident
Behavioural
07/1978 to 10/1978 Douth-waite
1982
DDT Zimbabwe
Nematode, Acari, Environment Single/ accident
behavioural
16/1989 to1 2/1998 Tingle, CCD
collembola,
insecta
DDT Zimbabwe
Haliaeetus
Environment Multiple/
Chronic
Reproductive 1980
to1990
Douth-waite
vocifer
1992
77
3.5 ECOTOXICOLOGICAL DATA AND APPROPRIATE TEST SPECIES
Several studies were conducted in the Sudan aiming at studying the fate of these compounds in fish, birds,
rats and plants (cotton & vegetables). One of these studies was conducted by Elhabieb et al (1995): Uptake,
distribution and metabolism of C-14 DDT in the fish Oreochromis niloticus. The results showed that rapid
uptake of the insecticide was observed, and the labeled material was distributed in the different organs.
Concentration of DDT in fish increased with the increase in the exposure period. The highest concentration
(31.1 mg/kg) was found in the liver. The lowest mean concentration from organ samples was observed in
muscles. The means ranged from 0.191 to 0.836 mg/kg. In the alimentary canal the amount of radioactivity
was high, but fluctuated within the different sampling date. The means ranged from 2.1 to 8.5 mg/kg. In the
brain, there was a clear build-up in the concentration of the labelled material with the increase in the
exposure time. It ranged from 1.1 to 21.5 mg/kg after an exposure period of 3 weeks to 0.05 mg/l DDT in
water. The fish was able to metabolise p,p'-DDT into p,p'-DDE, and p,p'-TDE. About 80% of insecticide
was found as p,p'-DDT. The highest TDE percentage was found in the alimentary canal. The highest DDE
percentage was found in the muscles. DDT, TDE and DDE were also found in the aquarium water.
3.6 RANKING OF PTS CHEMICALS
At the technical workshops, the experts from the countries present were also asked to indicate by scoring the
priority attached to data gaps for different PTS on environmental levels and human effects according to
levels of concern for that specific country. The experts were asked to rank from 0 for no concern, to 3 for
major concern. The results are presented in Tables 3.13, 3.14, 3.15 and 3.16 respectively. Some country
experts did indicate however, that their scoring was indicative only, but the combined scores from the
countries will give a good indication of the overall level of relative concern. From Table 3.13 it is clear that
the country experts rated the levels of dioxins and PCBS in environmental media as highest concern. DDT
was of the highest concern among pesticides followed by endosulfan, atrazine, Lindane, aldrin, dieldrin,
chlordane and heptachlor. Organic lead was the organometalic of most concern. These concerns are in good
agreement with concerns on sources indicated earlier in Table 2.12. Similar pattern of response was obtained
for data gaps on human effects.
78
Table 3.13: Ranking of concern on environmental levels by countries in Sub-Sahara Africa
Ben
Bkf
Chd
com
Con CIv Dji Drc Eth Ken
Mts Nig
SLe
Sey
SA
Sud
Tan
Tog
Zam
zim
Total
DDT
2
3
0
1
0
1 2
0
0
1
0
3
1
0
3
1
2
2
3
2
27
Dioxins
1
3
0
0
0
0 1
0
0
2
1
3
1
2
3
0
0
3
2
1
23
Furans
1
3
0
0
0
0 1
0
0
2
1
3
1
2
3
0
0
3
2
1
23
PCBs
2
2
1
1
0
1 1
0
0
1
0
3
1
1
1
0
0
2
3
1
21
Org. Pb
1
1
0
0
0
0 1
0
0
1
2
3
2
0
2
0
1
1
3
1
19
Endosulf.
3
2
1
1
0
1 0
0
0
0
0
2
0
0
2
1
3
1
0
1
18
Atrazine
1
1
1
2
0
0 0
0
0
1
1
1
1
0
2
0
2
1
2
0
16
HCH
1
1
0
0
0
1 1
0
0
1
0
3
0
0
0
1
1
2
1
2
15
Aldrin
1
1
0
0
0
1 0
0
0
1
0
1
0
1
1
1
0
2
1
1
12
Chlordane
0
1
0
0
0
1 1
0
0
0
0
0
1
0
2
1
0
2
2
1
12
Dieldrin
1
1
0
0
0
1 0
0
0
1
0
1
0
1
1
1
1
2
1
1
12
Endrin
1
1
0
0
0
1 0
0
0
1
0
1
0
1
1
0
0
2
1
1
11
Hepta
1
1
0
1
0
1 0
0
0
0
0
1
0
0
1
1
0
2
1
1
11
Chlor.Paraf
0
2
1
0
0
0 1
0
0
-
0
1
1
0
2
0
0
1
1
0
10
HCB
1
2
0
0
0
1 0
0
0
1
0
0
0
0
1
0
0
2
1
1
10
Nonphenol
0
2
0
1
0
0
0
0
0
1
0
0 0 0 2 0
0
1 1 1 9
Org.
Hg 1
1
0
0
0
0
0
0
0
0
0
0 1 0 2 0
1
1 1 1 9
PAHs 2
1
0
0
0
0
0
0
0
-
0
3 0 0 2 0
0
1 0 0 9
Octphenol
0
2
0
0
0
0
0
0
0
1
0
0 0 0 2 0
0
1 1 1 8
Toxaph. 1
1
0
1
0
1
1
0
0
0
0
0 0 0 0 0
0
2 0 0 7
PBDE 0
1
0
0
0
0
0
0
0
-
0
0 2 0 2 0
0
1 0 0 6
Phthalate 1
1
0
0
0
0
0
0
0
-
0
1 0 0 2 0
0
1 0 0 6
Mirex 0
1
0
0
0
0
0
0
0
0
0
0 0 0 0 0
0
2 0 0 5
79
Org.
tin 0
1
0
0
0
0
0
0
0
1
0
0 0 0 0 0
1
1 1 0 5
Chlordeco.
0
1
0
0
0
0
0
0
0
0
0
0 0 0 0 0
0
1 0 0 2
PCP
0
1
0
0
0
0
0
0
0
0
0
0 0 0 0 0
0
1 0 0 2
80
Table 3.14 :
Ranking of concern on data gaps on environmental levels by countries in Sub-Sahara Africa
Ben Bkf Chd
Com
Con
CIv Dj Drc Eth gha gam Ken Mts Nig Sle Sey SA Sud Tan Tog Zam zim Total
i
Furans
0
3
3
0
3
3 3
3
3
3
3
3
3
3
2
3
3
3
3
3
3
1
57
Dioxins
0
3
3
0
3
3 3
3
3
3
3
3
3
3
2
3
3
3
3
3
3
0
56
HCH
2
3
3
0
3
3 3
3
3
3
3
1
3
3
3
1
3
2
2
3
2
1
53
Endosulfan
3
3
2
0
3
2 3
3
3
2
1
3
3
2
3
1
3
2
3
3
2
1
51
DDT
2
3
3
1
3
2 3
3
3
2
1
1
3
3
2
1
3
2
3
3
2
1
50
Endrin
2
3
3
0
3
2 3
3
3
1
1
3
3
1
3
2
3
3
1
3
2
1
49
PCBs
2
3
2
0
3
2 3
3
3
3
3
-
3
3
1
2
3
3
0
3
2
1
48
Atrazine
-
3
3
1
3
3 3
3
3
2
1
3
2
1
2
1
3
3
2
3
2
1
48
Aldrin
2
3
3
0
3
2 3
3
3
1
1
2
3
1
3
2
3
2
1
3
2
1
47
PCP
0
3
3
0
3
3 3
3
1
2
2
3
3
0
3
1
3
3
3
3
2
0
47
PAHs
2
3
3
0
3
3 3
3
3
2
2
-
3
3
2
1
3
3
1
3
1
0
47
HCB
2
3
3
0
3
2 3
3
2
2
2
3
3
0
2
1
3
3
0
3
2
2
47
Dieldrin
2
3
3
0
3
2 3
3
3
1
1
1
3
1
3
2
3
2
2
3
2
1
47
Org. Pb
-
3
3
0
3
3 3
3
2
1
1
3
2
3
1
1
3
3
3
3
2
0
46
Hepta
2
3
3
0
3
2 3
3
3
1
1
2
3
1
3
1
3
2
1
3
1
1
45
Chlordeco.
0
3
3
0
3
3 3
3
1
1
1
3
3
0
3
1
3
3
3
3
2
0
45
Toxaph.
2
3
3
0
3
2 3
3
1
1
1
3
3
0
3
2
3
3
0
3
1
1
44
Org. tin
0
3
3
0
3
3 3
3
2
1
1
3
3
0
3
1
3
3
2
3
1
0
44
Org. Hg
0
3
3
0
3
3 3
3
2
1
1
3
3
0
1
1
3
3
3
3
1
1
44
Octphenol
0
3
3
0
3
3 3
3
1
1
1
3
3
0
3
1
3
3
3
3
1
0
44
Nonphenol
0
3
3
0
3
3 3
3
1
1
1
3
3
0
3
1
3
3
3
3
1
0
44
Phthala
-
3
3
0
3
3 3
3
1
1
1
-
3
1
3
1
3
3
3
3
2
0
43
81
Chlordane
0
3
3
0
3
2 3
3
3
1
1
2
3
0
2
1
3
2
1
3
2
2
43
Chlor.Paraf
0
3
3
0
3
3 3
3
2
1
1
-
3
1
2
1
3
3
3
3
1
1
43
PBDE
0 3 3 0 3 3 3
3 1 1 2 - 3 0 1 1 3
3
3
3
1 0 40
Mirex
0 3 3 0 3 2 3
3 1 1 1 3 3 0 3 1 3
3
0
3
0 0 39
82
Table 3.15 : Ranking of concern on data gaps on eco-toxicological effects by countries in Sub-Sahara Africa
Ben
Bk Chd com Con CIv Dji Drc Eth Ken Mts Nig SLe Sey SA
Sud
Tan
Tog
zam
zim Total
f
DDT
2 3 3 1 3 2 3 3 3 2 3 3 2 1 3 3
3
3
2
1 49
Dieldrin
0 3 3 0 3 2 3 3 3 3 3 1 3 2 3 3
3
3
2
1 47
Dioxins
0 3 3 0 3 3 3 3 3 - 3 3 2 3 3 3
3
3
3
0 47
Furans
0 3 3 0 3 3 3 3 3 - 3 3 2 3 3 3
3
3
3
0 47
HCH
0 3 3 0 3 3 3 3 3 2 3 3 3 1 3 3
2
3
2
1 47
Aldrin
0 3 3 0 3 2 3 3 3 2 3 1 3 2 3 3
3
3
2
1 46
Endrin
0 3 3 0 3 2 3 3 3 3 3 0 3 2 3 3
3
3
2
1 46
PCBs
0 3 2 0 3 2 3 3 3 3 3 3 1 2 3 3
3
3
2
1 46
Chlordane 0 3 3 0 3 2 3 3 3 3 3 0 2 1 3 3
3
3
2
1 44
Endosulf.
2 3 2 0 3 2 3 3 3 3 3 2 3 1 3 3
0
3
2
- 44
Atrazine
0 3 3 1 3 3 3 3 3 2 3 1 2 1 3 3
2
3
2
0 44
Hepta
0 3 3 0 3 2 3 3 3 3 3 1 3 1 3 3
1
3
1
1 43
Toxaph.
0 3 3 0 3 2 3 3 1 3 3 0 3 2 3 3
3
3
1
1 43
PCP
0 3 3 0 3 3 3 3 1 3 3 0 3 1 3 3
3
3
2
0 43
Chlordeco 0 3 3 0 3 3 3 3 1 3 3 0 3 1 3 3
3
3
2
0 43
HCB
0 3 3 0 3 2 3 3 2 3 3 0 2 1 3 3
3
3
2
0 42
Org.
Hg
0 3 3 0 3 3 3 3 2 3 3 0 1 1 3 3
3
3
1
1 42
Org.
Pb
0 3 3 0 3 3 3 3 2 - 3 3 1 1 3 3
3
3
2
0 42
Octphenol 0 3 3 0 3 3 3 3 1 3 3 0 3 1 3 3
3
3
1
0 42
Nonphenol 0 3 3 0 3 3 3 3 1 3 3 0 3 1 3 3
3
3
1
0 42
PAHs
0 3 3 0 3 3 3 3 3 - 3 3 2 1 3 3
1
3
1
0 41
Org.
tin
0 3 3 0 3 3 3 3 2 3 3 0 3 1 3 3
1
3
1
0 41
Phthalate
0 3 3 0 3 3 3 3 1 - 3 1 3 1 3 3
3
3
2
0 41
83
Mirex
0 3 3 0 3 2 3 3 1 3 3 0 3 1 3 3
3
3
0
0 40
Chlor.Paraf 0 3 3 0 3 3 3 3 2 - 3 1 2 1 3 3
3
3
1
0 40
PBDE
0 3 3 0 3 3 3 3 1 - 3 0 1 1 3 3
3
3
1
0 37
84
Table 3.16: Ranking of concern on data gaps on human effects by countries in Sub-Sahara Africa
Ben Bk Chd Com Con CIv Dji DRC Eth
Gha Ken Mts Nig SLe Sey SA Sud Tan Tog
Zam Zim Total
f
DDT
2 3 3 1 3 2 3 3 3 3
3 3 2 2 1 3 2 3 3 2 0 52
Dioxins 0 3 3 3 3 3 3 3 3 3
- 3 3 2 3 3 3 3 3 3 0 50
Furans
0 3 3 3 3 3 3 3 3 3
- 3 3 2 3 3 3 3 3 3 0 50
Endosulf. 2 3 3 1 3 2 3 3 3 3
3 3 2 3 1 3 3 3 3 2 0 50
Dieldrin 0 3 3 3 3 2 3 3 3 2
3 3 1 3 2 3 2 3 3 2 0 49
PCBs
0 3 3 1 3 3 3 3 3 3
3 3 3 1 2 3 3 3 3 2 0 49
HCH
0 3 3 3 3 3 3 3 3 3
3 3 3 3 1 3 2 2 3 2 0 49
Endrin
0 3 3 3 3 3 3 3 3 2
3 3 0 3 2 3 3 3 3 2 0 48
Atrazine 0 3 3 1 3 3 3 3 3 3
3 2 1 2 1 3 3 3 3 2 0 47
Aldrin
0 3 3 3 3 3 3 3 3 2
3 3 0 3 2 3 2 3 3 2 0 46
Chlordane 0 3 3 3 3 3 3 3 3 2
3 3 0 2 1 3 3 3 3 2 0 46
Toxaph. 0 3 3 1 3 3 3 3 1 2
2 3 0 3 2 3 3 3 3 1 0 45
PCP
0 3 3 3 3 3 3 3 1 2
3 3 0 3 1 3 3 3 3 2 0 45
HCB
0 3 3 3 3 3 3 3 2 2
3 3 0 2 1 3 3 3 3 2 0 44
Org.
Hg 0 3 3 2 3 3 3 3 2 2
3 3 0 1 1 3 3 3 3 1 1 44
Nonphenol 0 3 3 1 3 3 3 3 1 2
3 3 0 3 1 3 3 3 3 1 0 44
Hepta
0 3 3 1 3 3 3 3 3 2
3 3 1 3 1 3 2 2 3 1 0 43
PAHs
0 3 3 3 3 3 3 3 3 2
- 3 3 2 1 3 3 2 3 1 0 42
Org.
tin 0 3 3 2 3 3 3 3 2 2
3 3 0 3 1 3 3 2 3 1 0 42
Org.
Pb 0 3 3 3 3 3 3 3 2 2
- 3 3 1 1 3 3 3 3 2 0 42
Phthala 0 3 3 3 3 3 3 3 1 2
- 3 1 3 1 3 3 3 3 2 0 42
Chlor.
0 3 3 3 3 3 3 3 2 2
- 3 1 2 1 3 3 3 3 1 0 42
Paraf
85
Mirex
0 3 3 3 3 3 3 3 1 2
3 3 0 3 1 3 3 3 3 0 0 40
PBDE
0 3 3 3 3 3 3 3 1 2
- 3 0 1 1 3 3 3 3 1 0 39
Chlordeco. 0 3 3 1 3 3 3 3 1 2
3 3 0 3 1 3 3 3 3 2 0 32
Octphenol 0 3 3 3 3 3 3 3 1 2
3 3 0 3 1 3 3 3 3 1 0 31
86
3.7 DATA GAPS
Sub-Sahara African countries lack the analytical facilities in terms of high technology equipment, such as Mass-
Spectrometry (MS), High Resolution Gas Chromatograph (HRGC) and High Pressure Liquid
Chromatograph (HPLC), in addition to recently developed efficient extraction and clean up apparatus/equipment.
Highly trained experts in trace organic analysis, access to current periodicals and other literature, as well as funds
for solvents and other pertinent chemicals are the main limiting factors for conducting research and/or
monitoring on PTS residues and pollutants in general.
Expertise is presumed to be available in at least 30% of Region V countries. PTS data gaps are in the following
areas:
PTS atmospheric concentrations in more than 90% of the countries in the region..
Levels in water and sediments of the major rivers e.g. Nile, Niger, Limpopo etc and lakes, e.g.
Tana, Victoria, Chad, Nubia, Nakuru, etc.
Dioxins & furans, in environmental compartments and humans
Systematic studies on the food-web contamination & biomagnification,
Transboundary movement of PTS residues,
The effect of burning crop residues, e.g. cotton, sugarcane, etc.
Effect of improper burning garbage.
The long-term effect of the accumulated stocks of obsolete PTS on the health of the human and
animal populations near them,
The effect of the emissions from the chimneys of the sugar and cement factories on the human
and animal populations in their areas and the vicinity, at least within 50 km from the site, where
some settles.
Concentrations of PAHs and dioxins/furans in environmental media and biota.
3.8 SUMMARY
Sub-Sahara is mainly an agricultural continent and it has been using pesticides for pest and disease control
for more than 30 years. Except for South Africa and Zimbabwe, no systematic pesticide monitoring/analysis
exists in all the countries of the region. These two countries account for more than two thirds of the filled
questionnaires gathered for the region. A big data gap therefore exists in the region as far as levels of PTS in
the environment is concerned.
Concentrations of PTS in abiotic and biotic media: From the data gathered through filled questionnaires,
the trend of concentration observed in Sub-Sahara Africa for PTS is DDT> PCBs> toxaphene for both the
biotic and abiotic media. However no systematic monitoring has been undertaken so far.
For the abiotic environments, most of the data reported are for soil and water compartments and these
indicate fairly high levels of PTS. Very few studies have been reported for air and coastal marine sediment
compartments. However, it should be pointed out that although mirex is not used in Sub-Sahara Africa, it
has been detected in one study in Malawi.
The data for biotic media apparently indicate that humans were less directly exposed than animals and
vegetation to PTS during the period 1970 - 2002. However the main risk remains the food-web
contamination. The occurrence of relatively high levels of DDT, PCB and dioxins in adipose tissues and
blood of occupationally exposed persons is of immense concern. Equally disturbing is the high levels of
HCB, lindane and endosulfan in human breast milk for the region in view of WHO's vigorous campaign that
mothers breast milk is best for children. It has been established by studies in South Africa that OCs can be
87
transferred to infants via breast milk. Thus infants are being exposed to these xenobiotics while the
toxicological hazards and risks have not been studied in many African countries.
Evidence of harmful effects: Many cases of accidental or intentional release of large amounts of PTS (for
fishing or hunting) causing severe stress to the environment have been reported in the region. For example,
the accidental release of organochlorine pesticides (OCs) in large quantities had caused massive fish kills in
many countries, such as Senegal, Nigeria and Kenya. Cases of people suffering from diseases as a result of
exposure to organochlorine insecticides while selling, mixing or spraying these were reported in Wad
Medani, Sudan.
Ranking of PTS chemicals on environmental levels, toxicological and ecotoxicological characterisation
by countries: At the technical workshops, the country experts rated dioxins and PCBs of highest concern in
regard to their levels in the environment. Among the PTS pesticides, it was DDT that was of highest concern
followed by endosulfan, atrazine, lindane, aldrin, dieldrin, chlordane and heptachlor respectively. A similar
pattern of response was obtained for data gaps: dioxins, PCBs and DDT were the chemicals that the experts
considered of highest priority.
3.9 REFERENCES
Adeyeye, A. and Osibanjo, O. (1999): Residues of Organochlorine Pesticides in fruits, vegetables and tubers
from Nigerian markets. Sci. Total. Env.231: 227 333.
Bouguerra, M.L. (1985): Les poisons du tiers monde. Editions La Découverte.
Calamari, D. , M.O. Akech and P.B.O. Ochumba (1994). Pollution of Winam Gulf, lake victoria, Kenya,. A
case study for preliminary hazard assessment. Paper presented at the CIFA seminar on
African Inland Fisheries Aquaculture and the environment, Harare, Zimbabwe, 5-7
December 1994. Rome, FAO, CIFA/94/Sem.A-25, 23 p.
Choudhury AW (1989) in: Lehtinen S, Kurpa K, Korhonew E, and Saarinen L(ed)Proceedings of East
Africa Regional Symposium on Chemicals accidents and Occupational Editions La
Découverte,1985
El- Zorgani & Musa, A.(1976). Organochlorine insecticides in the blood of occupationally exposed people in
SUDAN. Bull. Environ. Contam.
El Zorgani, G.A. & Ali, M.T. (1981) An indicator fish for monitoring DDT pollution in the Nile. The 3rd
Annual General Meeting of the African Association of Insect Scientists (AAIS), Khartoum.
El- Zorgani, G.A. & Ali, M.T. (1981). An indicator fish for monitoring DDT pollution in the Nile. The 3rd
Annual General Meeting of the African Association of Insect Scientists (AAIS), Khartoum.
El-Zorgani, G. A. (1976). Residues of organochlorine insecticides in some fishes and birds in the Gezira of
Sudan. Pesticide Science 7:150-152.
El-Zorgani, G.A.; A. M. Abdullah & M.E.T. Ali (1979). Residues of insecticides in fishes in Lake Nubia.
Bull. Environ. Contam. Toxicol. 22: 44-48.
Fayomi, S.F. (1987). Determination of organochlorine pesticides and polychlorinated biphenyls (PCBs) in
Nigerian fresh water fishes from Cross River State of Nigeria. B.Sc. Dissertation, Dept. of
Chemistry, University of Ibadan, Nigeria.
Greichus, Y. A. et al., 1978a. Insecticides, polychlorinated biphenyls and metals in African lake
ecosystems.2. Lake Mcllwaine, Rhodesia. Bull.Environ.Contam.Toxicol. 19: 444-53
Greichus, Y. A. et al., 1978b. Insecticides, polychlorinated biphenyls and metals in African lake ecosystems.
3. Lake Nakuru, Kenya. Bull.Environ.Toxicol.19: 454-61
Greichus, Y.A. et al., 1977. Insecticides, polychlorinated biphenyls and metals in African lake ecosystems.
1. Hartbeespoort Dam, Transvaal andVoelvlei Dam, Cape Province, Republic of South
Africa. Arch.Environ.Contam.Toxicol., 6:371-83
88
Jallow, S.B.O. (1988). Monitoring of organochlorine pesticides in the Gambia. Report presented to Second
Workshop of participants in the joint FAO/IOC/WHO/IAEA/UNEP Project on pollution in
the marine environment of the West and Central African region (WACAF/2- First Phase),
Accra, Ghana, 13-17 June 1988. Paris,IOC of Unesco.
Kaba, N. 1992. (unpublished). Résidus d'organochlorés dans les milieux lagunaire et marin. Communication
ŕ la Journée AISA (Association ivoirienne des Sciences Agronomiques) Abidjan, mai 1992.
Abidjan, Côte d'Ivoire, Centre de recherches océanographiques.
Karlsson, H., Muir, D.C.G, Teixiera, C.F, Burniston, D.A, Strachan, W.M.J, Hecky, R.E.,Mwita, J, Bootsma,
H. A, Grift, N.P, Grift, N.P, Kidd, K.A, & Rosenberg, B. (2000) : Persistent Chlorinated
Pesticides in Air, Water, and Precipitation from Lake Malawi Area, Southern Africa.
Environ.Sci. Technol. 34, 4490 4495
Kallqvist, T. & B.S. Meadows (1977). Pesticide levels in Kenyan rural environment. Afr. Environ. 2 (4)/3
(1): 163-170.
Koeman, J. H. & J. H. Pennings (1970). An orientational survey on the side-effects and environmental
distribution of insecticides used in tsetse control in Africa. Bull. Environ. Contam; Toxicol.
5: 164-170.
Koeman, J.H. et.al. (1972). A preliminary survey of the possible contamination of Lake Nakuru in Kenya
with some metals and chlorinated hydrocarbon pesticides. J. Appl. Ecol. 9: 411-416.
Koh D, Jeyaratnam J Sc Tot Env 188: S78
Koh, D & Jeyaratnam; J. Sc Tot Env 188: S
Marchand, M. & J.L. Martin (1985) De'termination de la pollution chimique (hyrocarbures,organochlore's,
me'taux) dans la lagune d'Abidjan (Cote d'Ivoire) par l'etude des sediments.
Oceanogr.Trop., 20 (1):25-39.
Nwakwoala, A. U and Osibanjo, O. (1992): Baseline levels of selected organochlorine pesticides in surface
waters in Ibadan (Nigeria) with electron capture gas chromatography. Sci. Total Environ.
119; 179 190.
Ogunseitan, R. O. 1987. Determination of organichlorine pesticides and polychlorinated biphenyls (PCBs)
in soil and plants from refuse dumps in Nigeria. B.Sc. Dissertation, Department of
Chemistry, University of Ibadan, Nigeria.
Okond'Ahoka et al.,: Etude de l'imprégnation humaine par les pesticides organohalogénés au Zaire (in Ann.
Fals.Exp. Chim. Novembre 1984-77-n°832 pp.531-540
Oladele Osibanjo (2002): Organochlorines in Nigeria and Africa .The Hand book of Environmental
Chemistry Vol.3, Persistent Organic Pollutants (ed. By H. Fiedler) @ Springer-Verlag
Berlin Heidelberg, pp 321-354.
Ondieki J. J (1996): Pesticide Poisoning in Africa. Sc Tot Env 188: S30
Osibanjo O and Aiyejuyo O (1994): Organochlorine Pesticides in Ground Water in Nigeria. Nig. J. Sc 5 : 14
Osibanjo O. and Bamgbose O. (1990): Chlorinated hydrocarbons in marine fish and shell fishes of Nigeria.
Marine Pollut Bull 21, 581- 586
Osibanjo, O. and Adeyeye, A. (1995): Organochlorine Pesticide Residues in Cereals in Nigerian Markets.
Bull. Environ. Contam. Toxicol., 54: 460 465.
Osibanjo, O. and Adeyeye, A. (1997): Organochlorine Pesticide Residues in Foodstuffs of Animal Origin in
Nigeria. Bull. Environ. Contam. Toxicol., 58: 206 212.
Osibanjo, O., Biney C., Calamari, D., Kaba, N., Mbome, I. L., Naeve, H., Ochumba, P. B. P. and Sadd, M.
A. H. (1994): Review of Chlorinated hydrocarbon substances in the African aquatic
89
environment In: Review of Pollution in the African aquatic environment. FAO Committee
for Inland Fisheries of Africa (CIFA). Technical papers 25, 61 91.
Paasivirta, J; H. Palm, and R. Paukku 1998. Chlorinated insecticide residues in Tanzanian
environment Tanzadrin. Chemosphere, 17 (10): 2055-2062.
Sserunjoji, J.M.S. (1974). A study of organochlorine insecticide residues in Uganda with special
reference to dieldrin and DDT, in:"Comparative studies of food and environment
contamination. Vienna, IAEA, STI/PUB/348, pp 43-48.
Sunday, M. (1990). Determination of chlorinated pesticide residues and metals in sediments from
rivers and streams in Ibadan, Oyo state, Nigeria. M.Sc. thesis, Department of chemistry, U.
of Ibadan., Nigeria.
Tongo, A.A. (1985). Baseline study of levels of organochlorine pesticides in Nigerian rivers and their
sediments. M.Sc. Thesis, Department. of Chemistry, U of Ibadan, Nigeria.
90
4 ASSESSMENT OF MAJOR PATHWAYS OF CONTAMINANTS
TRANSPORT
4.1 INTRODUCTION
Pathways are routes by which a substance released from a given source are translated or transported among
several compartments of the environment from one place, country or region to another. Information in
Chapter 2 indicates that anthropogenic activities are the primary sources of PTS input into environmental
media in the region. The latter has a diversity of ecosystems, e.g. coastal and marine, tropical rain forest,
wetlands, Sahelean, semiarid and deserts with different climatic conditions. These will therefore greatly
influence the migration and/or movement and fate of PTS once released into the environment. Specific or
systematic studies of the pathways and fate of PTS in the region are generally lacking. Nonetheless some
theories may be developed regarding transboundary movement of PTS in and out of the region. In particular,
the potential impact on the island states in the West Indian Ocean in East Africa and the Gulf of Guinea in
West Africa needs attention.
Below are the major pathways that would determine the fate of PTS in the environment:
Atmospheric transport dry or wet deposition
Food web transfers
Terrestrial aspects
Aquatic transport (oceanic currents, rivers, lakes, etc.)
Regional weather patterns have the potential to impact transport of PTS. Cyclones with their strong winds
and heavy rains can transport contaminants across the region into the ocean or other landmasses within a
relatively short amount of time. Cyclone conditions also affect oceans, increasing erosion and causing some
deposition on land. Contaminated particulate matter may be carried by winds and moved in colloidal
suspension. Temperature and salinity have an effect on the solubility of many of the PTS. The low organic
content of soils may also have an effect on concentrations and breakdown of PTS.
Near surface groundwater in the West Indian Ocean Islands may be brackish and have a hydrological
connection to the ocean. Therefore, contaminants may be mobilized swiftly from land to the surrounding
ocean. In other cases, fresh water lenses may impede movement of contaminants into the saline environment.
Many point source water discharges occur directly into the ocean and air sources are often dispersed above
the ocean especially in the islands, the coastal areas of East Africa, the Horn Of Africa and southern Africa
respectively.
4.2 OVERVIEW OF EXISTING MODELLING PROGRAMMES
Modelling of environmental pollutants is still in its infancy and little to no data is available on the success of
the modelling approach to the region. Application of compartmental mass balance models will certainly be
an essential tool for establishing and predicting the fate and distribution of PTS in the region. The
application of this technology will aid greatly in identifying areas within the region where a given PTS
compound may be more problematic than others, thus aiding in identifying 'Hot Spots' of contamination. The
models could also aid in the evaluation of the design of remediation strategies for the region. They could
also be applied to newer generation compounds and potential PTS, providing information on potential fate
and distribution, and in this way help in managing compounds that are potential PTS.
Research conducted in South Africa on pesticide leaching models indicate that the existing pesticide
leaching models developed primarily in USA and Europe do not accurately predict the leaching patterns in
soils of the southern region (Meinhardt, pers comm). This trend is likely to also be relevant to other models,
such as for prediction of chemical movement in air and carry-over into ground and surface water resources.
It will be necessary to either 'fine-tune' existing models for Africa or develop new models as necessary to
91
ensure accuracy. Very limited capacity is available in Region V to conduct this type of exercise, but it is also
financially constrained. Model development and evaluation is an expensive exercise, as data has to be
generated locally from which such models can be calibrated.
There is an urgent need for capacity building and institutional strengthening in the application of this
invaluable predictive, monitoring and assessment tool for Region V. The development and evaluation of
modelling capability should be done in parallel to PTS monitoring and other assessments for this area.
4.3 ATMOSPHERIC TRANSPORT
Atmospheric deposition/fallout of chemicals can be divided into two categories: substances with short
atmospheric residence times and those with long ones. PTS belong to the class of substances with long
residence time and are widely distributed on national, regional or global scales. These semi-volatile
substances can occur either in the vapour phase or adsorbed on atmospheric particles/dust, or in solution in
atmospheric water thereby facilitating their long-range transport through the atmosphere. They reach the
atmosphere in many ways including spray drift, volatilisation from soil and water and dust erosion. PTS
undergo the iterative process of deposition, remobilisation into the atmosphere and re-deposition. This
"global distillation" (Mackay and Wania, 1995) and their long-range transport have been given as a reason
for their prevalence in Polar Regions.
The uniqueness of the African continent in terms of secondary drift and temperature inversions is significant
in determining the environmental fate of PTS. For example air- monitoring data in Zimbabwe and Malawi
(Karlsson H et. al. 2000) has showed that elevated ambient temperatures volatilise sprayed DDT into pockets
of warm air that could drift down stream far from the spray site. The distillation and condensation of PTS on
top of cold mountains, like Kilimanjaro, could also take place, although no data from Africa exists to
confirm this.
Air has therefore been recognized as an important medium of long-range transport of PTS (GESAMP 1989).
While there have been many studies of the atmospheric input of chemicals including PTS into coastal waters
in Europe and North America, there is paucity of such data in Sub-Sahara Africa. Several studies have
established the fact that atmospheric input of PTS is much more important for the open ocean than riverine
input or land-based sources which are more dominant in near shore environment. This could also be true for
Africa but data is lacking to support this. Deposition of sand and particulate matters coming from Africa in
Southern Europe and the Americas are well known. This is indicative of the potential long-range
atmospheric transport of PTS released in Sub-Sahara Africa to other continents. The contamination of
Region V through this pathway from other parts of the world should therefore be seriously considered. It is
not known whether Africa is a net source or sink of global PTS. Current thinking is that the presence of the
Inter-Tropical Convergence Zone will prevent atmospheric transport of PTS to the north and vice versa.
However, whether Africa acts as a source of PTS to the Antarctic is unknown. Indications are that levels of
PTS in the Antarctic are lower when compared with the Arctic (see RBA Reports for the Antarctic and
Arctic regions). Nonetheless some studies on the occurrence of PTS in the atmosphere over the Atlantic
Ocean indicated an influence of air masses from the African continent (Nagabe et al., 1992).
In this context, the island states are particularly vulnerable to this atmospheric mode of contamination by
PTS. For the region there is recognised large big data gap concerning atmospheric transport of PTS and this
underscores the importance of modelling efforts.
From data collected in Malawi, mirex has been detected in air at a level of 1pg/m3, although there has been
no history of the use of this PTS in the country. Although the level is very low, this could be a tenuous
indication of long-range atmospheric transport. However, besides the RBA project no other data suggesting
long-range transport exist. This lack of information therefore constitutes a major data gap.
4.4 COASTAL AND MARINE ENVIRONMENT
On entry into the aquatic environment through various routes, PTS being non-polar, semi-volatile and fairly
persistent may remain in the water body unchanged for a long period of time, may undergo transformation
92
(e.g. DDE from DDT), may be adsorbed on solid surfaces (sediments and biota), or may get reversibly
transferred into the atmosphere by volatilisation.
The ultimate fate of these chemicals will depend on a certain number of factors including: concentration,
dilution, water solubility, biogeochemical processes taking place, adsorption to soils, suspended particulate
and sediments, lipophilicity, and bioaccumulation in living organisms (Khan, 1977).
The hydrophobic nature of PTS results in their presence in water to be at low-level concentrations. The
adsorption of these compounds to particulate matter and sediment is an important mechanism for their
removal from the water column. Consequently, the sediment component of aquatic ecosystems can be a
significant sink of PTS. Suspended particulates entering slow moving waters, such as large water bodies and
estuaries, settle out, and their associated PTS are added to the existing sediment load.
Being hydrophobic, PTS have a high potential for bioaccumulation in aquatic plants, fish and shellfish and
undergo bio-magnification along trophic levels. The accumulation of these recalcitrant PTS in birds and
mammals, feeding on contaminated aquatic biota, may occur which can then result in water transport of PTS
over great distances (migratory birds, fish and mammals) from estuaries to the oceans. This has been
demonstrated in Chapter 3. Organotin compounds from the anti-fouling paints of ships and PAHs in
sediments will be major exposure sources for aquatic biota and top predators such as fish-eating birds and
humans, as the Atlantic Ocean is the major route of large crude oil and cargo carriers/tankers which transport
oil and cargo from the Middle East to Europe, Asia and North America via the Cape.
PTS have been recognised as one of the high priority issues in the region based on the regional priority
rankings of the GPA/LBA contaminant classes (GESAMP, 2001). Land-based sources, especially riverine
inputs, are the major sources of PTS into the coastal and marine environment, especially for the near shore
environment. Agricultural run-off from agricultural fields, effluents from PTS formulation plants and other
industries, which release PTS in the course of their operations, are also important. Past regional monitoring
programmes under the aegis of the UNEP Regional Seas have established contamination of coastal and
marine fishes and shellfish with some PTS, especially PTS pesticides and PCBs (FAO, 1994). While data on
levels of PTS in coastal/marine waters is lacking for most of the region, some data exist on PTS
concentrations in rivers, lakes and dams (FAO, 1994 and Chapter 3). Riverine and oceanic transport of OCs,
PAHs, organotins, organomercurials, as well as PCDD/Fs are yet to be studied in a systematic manner.
The oceanic environment is the least studied in terms of contaminant levels in the region (see Chapter 3).
While copious data exists in Europe and North America on PTS levels and behaviour in the oceans, there is
a paucity of such data and understanding in the region. Africa has a number of large rivers that cross many
countries (see Chapter 1) and since most of the socio-economic activities are associated with these rivers and
other water bodies, it is expected that significant amount of PTS are transported across boundaries and
released into lakes, seas and oceans. The magnitude of this input is unknown for the region, but it is
recognised as another major data gap.
In addition, Africa is not isolated from the rest of the world and thus may contribute and/or receive the
effects of PTS, because of the transport via oceanic currents. Oceanic PTS transport is significant as a large
portion of food production is derived from the seas/oceans. PTS contamination of Africa's marine systems
from either the region itself, or from other regions such as the Americas or Oceania, could further cause
health, environmental and socio-economic problems.
4.5 TERRESTRIAL ASPECTS
The emphasis of this section will mainly concern the behaviour and fate of PTS in soils. The various soil
types of the region are mentioned in Chapter 1. The persistence and fate of PTS in soils is influenced by its
half-life, t1/2, amongst many other factors. There is however a paucity of data on the factors that affect the
half-lives of PTS in soils in the region. Transposing PTS degradation data from developed countries with
temperate weather will not be realistic in the tropical weather conditions of this region. Literature reviews of
the pathways of PTS in the atmosphere suggest volatilisation as a major pathway. Volatilisation and
degradation of PTS are assumed to be more rapid in the tropics than in the temperate regions. Comparison of
93
soil half-lives of PTS based on the limited data in the region (Chapter 3) indicate that PTS generally have
shorter t1/2 of a few weeks in African soils, compared to several weeks or years in the cold temperate soils.
The data available is not comprehensive and is only available for a few substances. For example, the trend of
persistence of a few PTS in Nigeria is: Lindane < aldrin < DDT (Lalah et al. 2001; Osibanjo, 2002). The
potential mobility of these chemicals in the soil is also found to have the trend: Lindane> aldrin > DDT,
similar to the water solubility trend of these chemicals. This suggests a higher potential for Lindane and
aldrin to leach into ground water. The contamination levels of PTS in soils are: agricultural lands < industrial
sites < municipal refuse dumps (Osibanjo, 2002). Major data gaps exist on levels of PAHs, dioxins and
PCBs in soils in Region V (see also Chapter 3).
Recent data produced from South African field leaching and laboratory studies have shown that under
environmental and soil conditions pertaining to South Africa, pesticides may persist for longer periods of
time than in countries outside the region. This data is in contrast with what has been found in other regions
in Africa. An example of this effect is that of the organophosphate insecticide fenthion which has a
published half-life of one day. Laboratory leaching trials conducted in South Africa have shown a half-life of
up to 7 days could be expected for this compound. This seven-fold increase in half-life is significant
(Meinhardt pers comm). The implications are that some PTS may remain in these soils for extended periods,
even longer than what is expected in temperate countries.
The persistence of a compound is but one of the important aspects that should be considered in assessment
of the risks associated with PTS. Another aspect that should be considered is that of the mobility of a
compound in soil.
Persistence is an important issue as varying results have been attained from various areas in the region even
though indications are that compounds may have shorter half-lives. In the same studies conducted, field
leaching of pesticides were evaluated. Results of field leaching studies for fenthion shows that this
compound may be highly mobile in soils relevant to South Africa, contrary to the its assumed immobility
from international literature (Meinhardt pers comm).
It is generally accepted that South African soils may be deemed as having developed from aged geomorphic
structures. The presence of organic topsoil horizons on South African soils is limited, leading to the soils
being characteristically low in organic carbon, and often having low microbial activity. These factors could
contribute to higher leaching characteristics and prolonged persistence of certain chemicals, including PTS
in soil. This aspect of soil composition, structure and development is expected to hold true for other southern
African countries and possibly Region V (Meinhardt pers comm). Temperature differences across the region
should also be taken into account, as major variations are experienced (Chapter 1).
This aspect of the behaviour of PTS in Region V again constitutes a major data gap. In depth studies on
these aspects in the region are essential to obtain a clearer picture of PTS behaviour in soil, and on the
environmental and human health risks associated with these compounds.
Leaching of chemical compounds in soil is not limited to downward movement of a compound to
groundwater (Meinhardt pers comm). An aspect, which must be highlighted, is that of the upward movement
of a compound, primarily together with the soil waterfront to the surface of the soil. This is especially
relevant to Region V, because of general high evaporation rates experienced combined with intermittent and
cyclical rainfall events. An additional aspect is that of preferential flow of a compound in fissures, cracks
earthworm holes etc. Preferential flow does not only occur in heavy cracking clay soils, but also in more
sandy soil, even though chromatographic flow will tend to be prevalent in sandy soils. Preferential flow
leads to rapid movement of a compound in soil, and is independent of the compounds adsorption ability.
This means that even if a compound is generally easily bound to soil particles, it could move freely in the
soil. Also, preferential flow occurs at the interfaces of heterogeneous soil layers. In a heterogeneous soil, a
compound will leach into soil, reach the interface with a different soil type, and this allows the compound to
move vertically in the soil and possibly enter surface water sources in this way (Meinhardt pers comm).
94
4.6 DATA GAPS
There is a recognised need to fill the following data gaps:
Application and validation of mult-media fate models at a range of spatial scales (local, Regional and
Global).
Ambient air monitoring data throughout the Region
Quantification of riverine inputs into the coastal/marine environment
Significance of upward migration of contaminants in soils
Impact of ccean currents as a transport medium
Validation of soil contaminat fate models for a range of African soil types
Significance of migrating animals and birds in terms of the potential for PTS bio-transport
4.7 SUMMARY
Modelling of environmental pollutants is still in its infancy and very limited data is available on the use or
success of chemical fate and behaviour modelling efforts in the region. The uniqueness of the African
continent in terms of climate and temperature inversions is significant in determining the environmental fate
of PTS.
It is not known whether Africa is a net source or sink of global PTS compounds. Current thinking is that the
presence of the Inter-Tropical Convergence Zone will prevent atmospheric transport of PTS to the north and
vice versa. However, whether Africa acts as a source of PTS to the Antarctic is not known. Island states are
particularly vulnerable to atmospheric transport of contamination by PTS. Almost no data on the potential
for PTS transport within the Region exists via monitoring data, a factor that is recognised as a large data gap.
Since most of the socio-economic activities of Region V are associated with rivers and other water bodies, it
is expected that significant amounts of PTS be transported across boundaries and released into lakes, seas
and oceans via this route. The magnitude of this input is unknown for the region, but it is likely to be
significant and therefore recognised as another major data gap.
Movement of PTS via soils is recognised as an important route of transfer within the Region. Models of
contaminant movement developed in Europe and the US may not be valid for Region V as the soil type and
climatic conditions are very different and require validation prior to use.
4.8 REFERENCES
GESAMP(IMO/FAO/UNESCO-IOC/WMO/WHO/IAEA/UN/UNEP Joint Group of Experts on the
Scientific Aspects of Marine Environmental Protection). (2001). Protecting the oceans from
land-based activities Land-based sources and activities affecting the quality and uses of the
marine, coastal and associated freshwater environment. Rep.Stud.GESAMP No.71,162 pp.
Karlsson, H., Muir, D.C.G, Teixiera, C.F, Burniston, D.A, Strachan, W.M.J, Hecky, R.E., Mwita, J,
Bootsma, H. A, Grift, N.P, Grift, N.P, Kidd, K.A, & Rosenberg, B. (2000): Persistent
Chlorinated Pesticides in Air, Water, and Precipitation from Lake Malawi Area, Southern
Africa. Environ.Sci. Technol. 34, 4490 4495
Khan M.A.O., (1977): Pesticides in aquatic environment. New York, Plenum Press, 257 p
Lakaschus S., Weber K., Wania F, Bruhn R., Schrems O. (2002): The air-sea equilibrium and time trend of
hexachlorocyclohexanes in the Atlantic Ocean between the Arctic and Antactica. Environ.
Sci. Technol. 36, 138-145
95
Lalah J.O., Kaigwara P.N., Getenga Z, Mghenyi JM. & Wandiga S.O. (2001): The major environmental
factors that influence rapid disappearance of pesticides from tropical soils in Kenya. Toxi. &
Envi. Chemistry. 81, 161 - 197.
Nagabe B. & Biddleman, T. F. (1992): Occurrence and vapour particle partitioning of heavy organic
compounds in ambient air in Brazzaville, Congo. Environ. Pollut. 76, 147-156
Schreitmuller J. & Ballschmiter K.H. (1994): Levels of polychlorinated biphenyls in the lower troposphere
of the north- and south-African ocean . Studies of global baseline pollution XVII, Fresenius
J. Anal. Chem. 348, 226-239
Schreitmuller J. & Ballschmiter K.H. (1995):
Air-water equilibrium of hexachlorocyclo-hexanes and
chloromethoxy benzenes in the north and south Atlantic. Environ. Sci. Technol. 29, 207-215
UNEP (2002): Africa Environment Outlook. Past, present and future perspectives
UNEP/GEF (2002): Regionally Based Assessment of Persistent Toxic Substances, Antarctic and Arctic
Region Report
96
5 ASSESSEMENT OF THE REGIONAL CAPACITY AND NEEDS TO
MANAGE PTS
5.1 INTRODUCTION
The economies of Sub-Sahara Africa countries largely depend on agriculture. Inadequate exploitation of the
vast available natural resources and the existence of political instabilities have contributed greatly to the
ongoing poverty experienced in most of the countries and constrains their ability to meet national, regional
and global obligations (see Chapter 1).
The small and medium-scale farmers in rural areas, of many countries, produce the required national food
and livestock. To adequately feed the populations, the farmers have to produce more food and livestock. To
facilitate this demand, farmers have turned to improved agricultural packages, which include the use of
conventional pesticides and PTS to control pests that destroy food and vectors of diseases. Additional
conventional pesticides and PTS are now due to the proliferation of industries without cleaner technologies
amongst the Sub-Saharan countries. The burning of charcoal (forests), solid waste, animal carcasses and
various crop residues are common in Sub-Saharan Africa and are significantly increasing the PTS burden to
the environment, particularly for compounds such as PAHs and PCDD/Fs (see Chapter 2).
African governments are not passive concerning the problems and associated issues (disease, illiteracy,
malnutrition, poverty, etc.) regarding hazardous compounds, (including PTS), but are joining the rest of the
world to contribute towards protection and conservation of the environment through involvement in fora
such as NEPAD, WSSD and different international agreements (Basel, Rotterdam, Stockholm, Bamako, see
Table 5.1). These demand new or strengthened initiatives and policy thrusts from African Governments
towards the environmentally sound management of PTS and other hazardous substances, that threaten the
environment and the health of the people.
Table 5.1
The status of countries that have signed and / or ratified the Stockholm and Basel
Conventions.
Conventions
Country
Stockholm Basel
Angola
- -
Benin
yes yes
Botswana
yes yes
Burkina Faso
yes yes
Burundi
yes yes
Cameroon
yes yes
Central African Republic
yes -
Chad
yes -
Comoros
yes yes
Congo (Brazzaville)
yes -
Cote d'Ivoire
yes yes
Democratic Republic of Congo
- yes
Djibouti
yes yes
97
Equatorial Guinea
- -
Eritrea
- -
Ethiopia
yes yes
Gabon
yes -
Gambia
yes yes
Ghana
yes -
Guinea
yes yes
Guinea-Bissau
- -
Kenya
yes yes
Lesotho
yes yes
Liberia
- -
Madagascar
- yes
Malawi
- yes
Mali
yes yes
Mauritania
yes yes
Mauritius
yes yes
Mozambique
- yes
Namibia
- yes
Niger
yes yes
Nigeria
yes yes
Rwanda
- -
Sao Tome and Principe
- -
Senegal
yes yes
Seychelles
yes yes
Sierra Leone
- -
Somalia
- -
South Africa
yes yes
Sudan
- -
Swaziland
- -
Tanzania
yes yes
Togo
yes -
Uganda
- yes
Zambia
- yes
Zimbabwe
- -
98
5.2 MONITORING CAPACITY
Capabilities to monitor the levels of PTS are seriously lacking in most parts of the region. The monitoring of
PTS in the environment varies from country to country depending on the level of development and financial
resources available. Sub-Sahara African countries lack the analytical facilities in terms of high technology
equipment, such as Mass-Spectrometry (MS), High Resolution Gas Chromatograph (HRGC) and High
Pressure Liquid Chromotograph (HPLC), in addition to recently developed efficient extraction and clean up
equipment. Highly trained experts in trace organic analysis, access to current periodicals and other literature,
as well as funds for solvents and other pertinent chemicals are the main limiting factors for conducting
research and/or monitoring on PTS residues and pollutants in general. They also present limitations with
respect to upgrading the capacities in the region
Necessary expertise is presumed to be available in at least 30% of Region V countries. Certain countries like
Sudan, Nigeria, Democratic Republic of Congo (DRC) and South Africa amongst others have the necessary
qualified scientists to carry out analysis of dioxins and furans
5.3 EXISTING POLICIES, REGULATIONS AND MANAGEMENT OF PTS
It is evident from available data that most of the countries of the region have developed, and others are in the
process of developing, policies and regulations in the management of chemicals including PTS. It is possible
that the low level of awareness among the stakeholders and the poor dissemination of available information
of the adverse effects of PTS on humans and the environment, are responsible for the slow pace in
developing regulations and policies on PTS (Table 5.2). Even then some of the existing national policies
need to be reviewed in response to new challenges and international obligations within existing Conventions
(e.g. Stockholm Convention on POPs).
Table 5.2
Summary of countries with regulations/policies and institutional framework to manage
chemicals/PTS
Country
Regulations/Policies
Institutional
Framework
Other chemicals
PTS
Angola
- -
-
Benin
Yes
no yes
Botswana
yes no
yes
Burkina Faso
yes no
yes
Burundi
yes no
yes
Cameroon
yes no
yes
Central African Republic
yes no
yes
Chad yes
no
yes
Comoros
yes no
yes
Congo (Brazzaville)
yes no
yes
Cote d'Ivoire
yes no
yes
Democratic Republic of Congo
yes no
yes
Djibouti
no no
no
Equatorial Guinea
no no
no
99
Eritrea
no no
no
Ethiopia
yes no
yes
Gabon
yes no
yes
Gambia
yes no
yes
Ghana
yes no
yes
Guinea
yes no
yes
Guinea-Bissau
no no
no
Kenya
yes no
yes
Lesotho
yes no
yes
Liberia
yes no
yes
Madagascar
yes no
yes
Malawi
yes no
yes
Mali
Yes no
yes
Mauritania
Yes no
yes
Mauritius
Yes no
yes
Mozambique
- -
-
Namibia
- -
-
Niger
Yes no
yes
Nigeria
Yes no
yes
Rwanda
-- -
-
Sao Tome and Principe
Yes no
yes
Senegal
Yes no
yes
Seychelles
Yes no
yes
Sierra Leone
Yes no
yes
Somalia
No no
no
South Africa
Yes no
yes
Sudan
Yes no
yes
Swaziland
-- -
-
Tanzania
Yes no
yes
Togo
Yes no
yes
Uganda
Yes no
yes
Zambia
Yes no
yes
Zimbabwe
Yes no
yes
Note: Most of the Region V countries have policies/Regulations on PTS-Pesticides.
100
It is regrettable that whereas most of the national legislations are either too general or too fragmentary in
nature and non-specific to PTS, some countries do not have any laws regarding hazardous chemicals. It will
be important that national legislations are enacted and/or harmonised to deal with hazardous chemicals in
general and PTS in particular.
It is also evident that most countries have established or are developing institutions to manage the
environment but lack management strategies regarding hazardous chemicals. There is further evidence that
these institutions also lack adequate capacity and resources for the environmentally sound management of
hazardous chemicals and PTS. A major constraint towards sustainable chemical management is the lack of
and / or weak enforcement of regulations. For the region to contribute effectively in the global effort to
reduce PTS, there is need to establish and/or strengthen existing institutions and legal frameworks through
capacity building and putting in place necessary mechanisms for compliance monitoring and enforcement.
The monitoring of PTS and other chemical levels in the environment vary from country to country
depending on the level of development and financial resources available. The few established organizations
and research institutions lack adequate trained scientists and proper equipment to monitor and assess PTS in
various media. Data that might have been generated by research is rarely published and disseminated to
relevant authorities that might use such data to establish control measures or perform enforcement. It must
also be noted that most generated data, if not all, are from individual studies, and not ongoing. This has
resulted in fragmentary data and numerous data gaps (Chapter 3). Despite these limitations, the increasing
awareness about PTS is stimulating cooperation amongst the various research institutions and other
stakeholders. This may be a good indication of proper future PTS management in Sub-Saharan Africa. It is
also encouraging that international agencies are joining hands with countries of the Sub-Saharan Africa
region in addressing the potential effects of PTS.
5.4 ALTERNATIVES AND/OR MEASURES FOR REDUCTION OF PTS
Some of the existing national legislations, rules and regulations in the region have placed a ban and/or
restriction on the importation, formulation and use of some PTS pesticides. This situation leads to the search
for alternatives for use in both agriculture and vector control. Due to lack of adequate knowledge about the
newly developed alternatives, some farmers are still using PTS pesticides 'undercover'. This calls for
aggressive awareness raising amongst farmers of the alternatives on the one hand and the effects of PTS on
the other in order to convince them of the need to turn to these alternatives.
Another common perception is that alternatives to PTS pesticides are ineffective and expensive. Countries
that cannot afford the alternatives can still use PTS pesticides within the period allowed under the Stockholm
Convention. The development of alternative chemicals to replace PTS has however continued in the Sub-
Saharan region. In East Africa for example, most of the banned PTS pesticides (organochlorines) have been
replaced by pyrethrums (some of which are locally manufactured and formulated).
It is noteworthy that there are some successful stories by well-established International Institutions (such as
IITA, IRRI, SAARC), which are implementing alternatives to PTS pesticides in agriculture and vector
control. For example, Integrated Pest Management (IPM) and Integrated Vector Management (IVM) have
been developed and are currently being implemented in various parts of the world including Region V.
Another example is the potential use of the extract of the Neem tree to control agricultural pests and some
fungal diseases instead of conventional pesticides. Furthermore the ecological approach entails the
technology of using chemicals, such as pheromones, to control the behaviour, sexual maturation, and
swarming behaviour of pests, so as to reduce the need for PTS.
It is encouraging to note that FAO has assisted some countries of the region to prepare inventories of
obsolete pesticides. Finding funds to dispose of these obsolete stocks safely will reduce PTS in the region.
There is hope that international funding agencies will provide assistance to African Governments for the
disposal of obsolete chemicals and chemical wastes.
Other options being explored are the employment of cleaner production technologies to reduce PTS. For
example, in the paper manufacturing industry the use of the thermo-mechanical paper process will certainly
101
reduce the release of dioxins and furans into the environment. High temperature incineration technology is
proven for effective treatment and disposal of hazardous chemicals. Nonetheless the prohibitive cost of this
technology makes it less attractive to the Governments of the region but provides a unique opportunity for
foreign investment. This will minimise the trans-boundary movement of hazardous wastes from the region to
other continents.
5.5 SOCIO-ECONOMIC INTERVENTIONS
In the foreseeable future, agriculture will remain one of the pillars of economic activities for Sub-Sahara
Africa and inevitably chemicals will still be used for better yields. In the light of the current health,
nutritional and educational status of the population of the region, a cleaner and safer environment is a
necessity for a sustainable socio-economic growth.
Data available for the region show that little or no socio-economic interventions have taken place to date. To
change the habits of its populations who are still using PTS containing and/or releasing chemicals, in
addition to what have been mentioned earlier, Governments of the region should give various incentives
(reduce cost of alternatives, tax rebates, compensations for loss of property, etc.) to the respective
stakeholders. Moreover, the developed nations should be encouraged to co-operate with the countries of the
region to promote low cost PTS free technologies and products.
5.6 THE REGIONAL NEEDS
Arising from the foregoing problems and related issues in the region the following needs have been
identified:
a)
The development of basic capacities in each country for identifying and addressing PTS
management issues:
I.
Awareness amongst the populations
II.
Specific mandates/policies/regulations and the harmonisation of laws
III.
Human resource development
IV.
Information resources (such as data bases)
V.
Communication and dissemination
VI.
Coordination amongst stakeholders
VII.
Responsible care
b)
Development of institutions and legal infrastructure relative to PTS:
I.
Evaluation of existing national / regional institutional and legal infrastructures
II.
Strengthening of institutions where needed
III.
Development of legal instruments where needed
c)
Development of action plan for management including monitoring, research and development for
PTS:
I.
Inventories
II.
Infrastructures (laboratories, equipment, etc.)
III.
National / regional data base
IV.
Partnership (Industry to industry and state)
V.
Research and monitoring capacities
VI.
Development of quality management systems and capacity
102
VII.
Development of capacity for modelling and prediction
VIII.
Alternative measures, strategies and cleaner production technologies
d)
Development of links between all stakeholders and establishment of national/regional co-ordinating
mechanisms that will relate to:
I.
Academia and research
II.
Private sectors
III.
Educational institutions
IV.
Bilateral agencies
V.
Multilateral agencies
VI.
NGOs
VII.
Professional associations
VIII.
Governments, African Union, and NEPAD
e)
Initiatives on trans-boundary issues:
I.
Regional protocols, procedures, enforcement and compliance monitoring programmes
II.
Development of joint co-operation programmes (research and monitoring facilities etc.)
III.
Involvement of the Regional Trade and development blocks such as SADC and
ECOWAS.
IV.
Joint management of common water bodies such as Lakes Chad, Zambia, Tanganyika,
Victoria and the rivers Nile and Niger
V.
High priority for the establishment of national / regional laboratories for PTS and in
particular for dioxins and furans
f)
Financial resource requirements for PTS management:
a)
Internal
- National/Regional personnel costs
- Communication
- Secretariat
- Information collection and dissemination
- Exchange of expertise
b)
External
- Facilities and equipment
- Training
- Human resource development
- Development, use and assessment of the technical assistance
- Formulation and development of programmes and their implementation
- Technical assistance in disposal and elimination of wastes
- Technical support in IT
- Costs of Capacity Building
103
- Technical assistance in enforcement facilities.
5.7 SUMMARY
The information and data in Chapters 1, 2, 3,and 4 confirm that countries of Sub-Sahara Africa region are
developing and that most of their economies rely mainly on agriculture. It has also been shown that
pesticides are used to control pests in agriculture and insect vectors in public health. Rapid industrialisation
in most of the countries of the region and waste combustion, amongst others, are also significantly
increasing the PTS load to the environment, especially PCDD/Fs.
Nevertheless, many countries of the region have made significant developments on chemical issues,
including policies / regulations, as well as appointing authorities to manage and monitor hazardous
chemicals, including PTS. The available information shows that the replacement of PTS by alternatives is
currently under investigation, but much has to be done, including awareness raising on this issue. The
disposal of stockpiles of pesticides and other hazardous chemicals is ongoing, but many countries of the
region require more technical and financial support.
It is important, in addition to the harmonization of the policies / regulations, to harness finances and develop
human capacities to aid environmentally sound management of PTS. Linkages and co-operation between all
the countries stakeholders and the international agencies have been identified to be a very necessary tool in
support of the sound management of the environment. Introduction of various incentives, including tax
rebates to industries with cleaner technology that are willing to support the sound management of the
environment, was identified as another positive way to incorporate stakeholders.
5.8 REFERENCES
The current State Of Pesticide Management in Sub-Saharan Africa By John J. Ondieki (1996Elsevier B.V.)
Assessing National Management Need Of Persistent Toxic Substances GEF Pilot Study PGF-B.
An introduction to Environment Management ByS.J. Muchina And S. Mmari Onyari 1996
African Newsletter On Occupational Health and Safety Vol.11 Number 2 August 2001.
Towards A Sustainable Chemical Policy-Government Official Report-Ministry Of Environment-Sweden.
104
6 CONCLUSIONS AND RECOMMENDATIONS
Although many of the countries of Region V have signed the different conventions (Stockholm, Basel,
Rotterdam and Bamako), it is clear, as seen in the previous Chapters, that most of them do not have adequate
legal framework and resources to soundly manage PTS (Chapter 5). Moreover, the existence of data gaps at
all levels (sources, concentrations in the environment, inventory of obsolete stocks, trans-boundary
movement of PTS, import & export data, etc.) renders the management of these PTS even more difficult
(Chapters 2, 3 and 4). A very big task therefore lies ahead for Sub-Saharan African Governments, with the
financial and technical assistance of international agencies to reduce or eliminate PTS in Region V.
6.1 KEY FINDINGS
PTS are not manufactured in the region but imported largely from developed countries and Asia.
Anthropogenic activities in agriculture, industrial manufacturing, waste burning, energy production and use,
and vehicular transport emissions are identifiable sources of PTS release into the environment. About
112,000 tons of obsolete stocks of PTS pesticides exist in the region, awaiting environmentally sound
disposal.
Research studies done in the African continent show ubiquitous PTS contamination of environmental media
and associated resources as well as humans. High concentrations of some PTS especially DDT, PCBs,
Lindane, Dieldrin and Toxaphene were reported for livestock, fish, wildlife, human blood and mothers breast
milk in countries with high usage of these chemicals, in particular South Africa, Zimbabwe, Madagascar,
Sudan and Nigeria. For example the estimated Allowable Daily Intake (ADI) of aldrin and dieldrin in some
foodstuffs from Nigeria was greater than the FAO ADI, which calls for caution and intervention.
The foregoing underscores the fact that PTS contamination of the environment and humans is a problem
shared by both developed and developing countries. Data gaps in most countries need to be addressed to
enable a realistic assessment of PTS issues and concerns in Region V.
The need to strengthen institutional and regulatory framework is compelling to ensure effective compliance
with national and international laws. Capacity building for regulators and the private sector is required
towards forging a partnership that will facilitate effectiveness of national and regional strategies for PTS
reduction. Awareness raising at all levels about the effects of PTS and its management is vital for the region.
Based on the foregoing chapters, the regional team felt that the general issues listed below require urgent
attention:
· Existing environmental data gaps should be filled as a matter of priority, as meaningful policy
interventions to protect humans and the environment from risk of exposure to PTS cannot be
achieved in a data vacuum. Environmental monitoring of PTS levels at national / regional level in
water, sediments, biota, air, livestock and human blood / breast milk is essential for identifying all
the hot spots for remedial action. The available number of reports in the RBA PTS database on
PCDD/Fs for Region V is less than 10, while for Germany it is about 10 000.
· The pathways and fate of PTS in the region should be studied, so that the critical pathways and
routes of exposure can be identified, followed by the evaluation of the relative impact of processes,
estimation of transport fluxes, and assessment of remedial measures. Information is lacking in this
critical area.
· Capacity building needs in the region deserve priority action to ensure global success of the recent
Stockholm Convention and other international agreements for the environmentally sustainable
management of PTS and other hazardous chemicals. Regionally based research including
development of ecotoxicological data based on the African environment is important. Training
African experts in the use of models and risk assessment for sound chemicals management and
environmental protection is also advantageous to the region and the international community.
105
6.2 SETTING OF PRIORITIES
· The following procedure was used to derive the list of priorities contained in this document:
· The draft document, following the Technical Workshops in Mombasa Kenya in late July 2002, was
submitted to all countries of the region, together with an invitation to send a ministerial delegation to
the Priority Setting Meeting, to be held in Nairobi, Kenya, during 30 October to 01 November 2002.
· Delegations from the following countries attended the technical workshops: Benin, Burkina Faso,
Chad, Comoros, Cote d' Ivoire, Democratic Republic of Congo, Cote d' Ivoire, Djibouti, Ethiopia,
Kenya, Madagascar, Mauritius, Malawi, Nigeria, Seychelles, Sierra Leone, South Africa, Sudan,
Tanzania, Togo, Zambia and Zimbabwe.
· At the Priority Setting Meeting, the participants from the following countries attended: Senegal,
Tanzania, Ghana, Ethiopia, Democratic Republic of Congo (DRC), Swaziland, Sierra Leone,
Burkina Faso, Togo, Mauritius, Niger, Cote d'ďvoire, Sao Tome & Principe, Namibia, Congo
Brazzaville, Benin, Gambia, Djibouti, Zambia, Sudan, Kenya, Nigeria and South Africa.
· The participants were introduced to the aim and scope of the project, with lectures, based on the
various chapters of the draft report. French - English translation was provided.
· The participants were then briefed to do the following in two groups; a Francophone and an
Anglophone group:
· Review the report and provide general comments
· Add, improve (or remove) information in the report, where deemed necessary
· Evaluate the scores on sources, levels and data gaps, and amend where deemed appropriate.
· Evaluate the indicative list of issues supplied (these were drawn up by the team, and proposed as
short headings to indicate possible priorities to be considered).
· Amend, add or remove issues in the list where needed
· Where possible, expand on each issue with justifications. Make recommendations as realistic and
specific as possible (e.g. indicate where a regional approach would be preferred).
· Also add the barriers that need to be overcome to implement these priorities.
· Prioritise the list of issues according to the following criteria:
1) Immediate attention (short term: 1-2 years implemented or completed*)
2) Urgent attention (medium term: 2-5 years implemented or completed)
3) Attention required (long term: 4-10 Years implemented or completed)
· The reports from the two groups were then presented together in plenary, and, through consensus and
discussion, chaired by the Regional Coordinator, and supported by the chairpersons of the
Francophone and Anglophone groups, a single document was drawn up, while a simultaneous text
translation in French was provided on a separate screen.
· The results of the priorities are reflected in the next section.
* By this is meant that the priority should be addressed or have been implemented within this timeframe. In
certain cases it also means that the activity is to be continued after implementation.
6.3 PRIORITIES AS AGREED UPON BY THE PRIORITY SETTING MEETING
The priorities have been evaluated specifically within the context of strengthening the capacity of Sub-Sahara
Africa to deal with the current and future social, technological, economic and environmental development
requirements.
106
The priorities below are presented in no particular order.
6.3.1 Short Term Priorities (1-2 years)
(1)
Survey of the current PTS contamination status of fresh, coastal and marine waters by PTS.
Justification:
· Impact of pollution on export markets if PTS pollution is not managed from knowledge
(Chapter 5)
· These ecosystems are already incorporated in NEPAD as an important priority (Chapter 5)
· Address the data gap indicated by this report, regarding lack of data (Chapters 2, 3 and 4)
· Pollution is closely linked to human health (chapters 1, 3 and 4)
· Pollution affects the integrity of affected ecosystems (Chapter 3)
· Polluted environments affect livelihood support of affected communities (Chapter 1)
· Fresh and coastal water important to life and maintenance of ecosystems (Chapter 1)
Barriers:
· Lack of resources (technical and financial)
· Lack of awareness
· Lack of existing data
· Weak legislation and enforcement
(2)
Identification, quantification and mapping of sources of PTS contaminants that release PTS to
the environment.
Justification:
· Address the data gap indicated by this report, regarding lack of data (Chapters 2 and 3)
· Data gathered will facilitate appropriate intervention measures (Chapters 2, 3, 4 and 5)
· Improved knowledge of pollution to support sustainable development and address poverty
(Chapter 5)
· To build trust and partnerships between all stakeholders (Chapter 5)
Barriers:
· Lack of laboratory equipment
· Insufficient legal framework to deal with pollution
· Inadequate personnel to deal with analytical and ecotoxicological issues
· Poor management of PTS
· Poor (or even reluctance) collaboration of all stakeholders to achieve aims of PTS
management
· Lack of knowledge of distribution of sources (see Priority 1)
(3)
Collection of import and export data for PTS through existing and strengthened databases,
with clear categorisation.
Justification:
· Need to facilitate planning and development of strategies regarding PTS (Chapter 5)
107
· Need for awareness on the part of the relevant government officers and all other stakeholders
(Chapter 5)
· Strengthening knowledge regarding PTS in trade, with a specific need to obtain knowledge
on illicit trade and illegal use and trade (Chapters 2 and 5)
Barriers:
· No proper records currently being kept
· No existing infrastructure for data management
· Insufficient technical infrastructure and / or legal capacity to deal or obtain the required data
(4)
Develop and / or strengthen appropriate national and (harmonised) regional regulations (in
line with relevant international agreements) for environmentally sound PTS management.
Justification:
· Need to ensure an environmentally sound management of chemicals including PTS at all
levels (Chapter 5)
· Need to regulate trans-boundary movement (Chapter 5)
Barriers:
· Low priority for funding
· Inadequate institutional capacity
· Lack of specific national focal points
· Lack of centre of excellence for PTS management
· Insufficient political will
(5)
Intensify awareness regarding PTS issues, amongst stakeholders, relevant government
regulatory officers and civil society.
Justification:
· Existing levels of ignorance of hazardous effects of PTS in most African countries needs to
be urgently addressed (Chapter 5)
Barriers:
· Low level of education of the population
· Lack of financial resources
· Lack of means of communication
(6)
Disposal of obsolete PTS stocks and remediation of sites contaminated by such (African
Stockpiles Programme).
Justification:
· Source of contamination of soil and associated ecosystems (Chapters 2 and 3)
· Prevalence of huge stockpiles in Africa (Chapter 2)
· Adverse health and environmental effects of communities and biota (Chapters 1 and 4)
· Access to existing liability and redress articles in the various Conventions possible
Barriers:
· Lack of funds,
108
· Lack of clean disposal technology,
· Continued use and imports of obsolete chemicals,
· Lack of regulatory framework to prevent accumulation,
· Lack of comprehensive inventories,
· Lack of knowledge about PTS other than obsolete pesticides stockpiles
(7)
Inventory of PTS sources, contaminated sites, affected communities and others (other than
PTS pesticides).
Justification:
· Intensive use of PTS in Africa (Chapter 2)
· Data gap on impacts of PTS use (Chapter 3)
· Facilitate intervention measures such as remediation (Chapter 5)
· Improved knowledge of pollution (Chapter 3)
· To build trust and partnerships amongst all stakeholders (Chapter 5)
· Protecting human health and environment (Chapter 1)
Barriers:
· Lack of laboratory equipment
· No legal framework
· Insufficient personnel
· Poor management of PTS
· Poor (or even reluctance of) collaboration of all stakeholders to achieve aims
· Lack of knowledge of distribution of sources
· Vast areas involved (including aquatic)
· The number of areas involved
· Accessibility of sites
· Lack of applicable assessment techniques and technologies
(8)
Specific attention to address open burning (combustion without Air Pollution Control
measures) (e.g. sugarcane, vegetation, forests, domestic waste, etc.), to reduce TEQ releases
and thereby reduce the risk to affected communities and ecosystems.
Justification:
· Common practice in Africa (Chapter 2)
· Probably a major source of release and exposure of humans and biota to PTS (Chapter 2)
· Source of PTS for long-distance transport (Chapters 2, 3 and 4)
· Domestic waste contains chlorine
· Waste can also contain PTS (hazardous waste) (Chapter 2)
Barriers:
· Poverty
109
· Ignorance of consequences
· Lack of alternative practices
· Entrenched burning practices
· Lack of trained human resources
· Lack of suitable sites for disposal of urban waste
· Lack of technical alternatives
· Lack of finance
· Lack of public awareness of health consequences of open burning
(9)
Support the maintenance of the existing RBA database, and thereby monitoring the reduction
of the identified data gaps.
Justification:
· Supports future monitoring and modelling of PTS residues in the environment, as well as
fate and pathways (Chapters 2, 3 and 4)
· Absence and/or insufficient reliable data will be addressed, adding substance and
information to environmental and health management at all levels (Chapters 2, 3 and 5)
Barriers:
· Lack of funding
· Lack of technical infrastructure
· Insufficient Information Technology
· Incompatibility of existing data
· Inaccessible information (proprietary)
(10)
Initiate and/or support implementation of regionally applicable (including research) IPM and
IVM, including the use of alternatives, to reduce the use of PTS pesticides.
Justification:
· Need to minimise the use of PTS pesticides and to establish ecologically sound approaches
to pest and vector control (Chapter 5)
· Efficiency of the IPM / IVM programmes (Chapter 5)
· Collaboration with other initiatives, such as Roll Back Malaria
Barriers:
· Cost of alternatives
· Resistance to implementation of IPM / IVM
· Time and funding required for research and implementation
(11)
Support an assessment of alternative industrial (cleaner) technologies as being relevant to
African conditions.
Justification:
· Environmentally sound production for economic development (Chapters 1 and 5)
· Improved export opportunities of products produced by cleaner technologies (Chapter 5)
110
· Need to minimise the production and release of PTS containing wastes to reduce
accumulation of hazardous waste (Chapter 5)
· Potential for poverty reduction by improved health and a cleaner environment (Chapter 5)
· Reduced exposure and pollution (Chapters 4 and 5)
· Support from, and synergy with, various international conventions (Chapters 1 and 5)
Barriers:
· High initial investment required
· Possible resistance to adoption by some stakeholders
(12)
Support human resource development relevant to PTS programmes
Justification:
· Capacity building/improvement needed to deal with various requirements (Chapter 5)
· Implementing relevant international agreements (e.g. Stockholm, Basel and Rotterdam)
(Chapter 5)
Barriers:
· Funding
· Inadequate training centres
(13)
To establish capacity to address disasters and emergencies relative to PTS (fires, explosions,
contaminated products etc.)
Justification:
· Protect the integrity of the environment as well as human lives and property
Barriers:
· Lack of funding
· Lack of technology
· Lack of training
(14)
To improve solid waste management
Justification:
· No existing or implemented sound management (Chapter 5)
· Preventing contamination of environment by PTS containing waste (Chapters 2, 4 and 5)
· Prevent off-site pollution by leachate
· Protection of public health through better waste management
Barriers:
· Lack of funding,
· Lack of appropriate technology
· Rapid urbanization increases waste and overburdens existing waste handling infrastructure
(15)
Inventory and strengthening of existing laboratories for PTS analysis
Justification:
· Enable monitoring and research into residues, exposure, risk assessment and effectiveness of
cleaner technologies and PTS management (Chapters 2, 3, 4 and 5)
111
· Satisfy environmental and health standards (Chapter 5)
· Compliance with international agreements (Chapter 5)
Barriers:
· Lack of funding
· Inadequate existing facilities
· Lack of trained personnel
(16)
Integrate PTS studies with health and environment initiatives
Justification:
· Awareness raising of impacts of PTS (Chapter 5)
· Support poverty reduction through establishing knowledge of linkages between exposure,
risk and health outcomes (Chapters 3 and 5)
· Improve effectiveness of existing and strengthened laboratories and human resources
(Chapters 3 and 5)
Barriers:
· Lack of analytical tools
· Lack of funding
· Lack of existing collaborative research and risk assessment networks
6.3.2 Medium Term Priorities (2-5 years)
(17)
Protection of the environment from contamination by PTS through the adoption of improved
technologies, enforcement, monitoring and information from 1 and 2.
Justification:
· This issue has been incorporated in NEPAD programmes where applicable (Chapter 5)
· Linkage to human health that will be improved through better management (Chapter 5)
· Improved integrity, quality and maintenance of ecosystems through reduced exposure to PTS
(Chapters 3 and 4)
· Improved livelihood support through a cleaner environment, and thereby addressing poverty
reduction (Chapters 1 and 5)
· Need for assessment and follow-up through research and monitoring (Chapter 5)
· Need for protection of export markets though production of more acceptable production
methods (relevant international standards such as WHO and FAO Maximum Residue
Limits) (Chapters 1 and 5)
Barriers:
· Lack of funding
· Lack of skilled personnel
· Lack of access to existing technology
· Lack of knowledge of technologies relevant to Africa
(18)
Identify, strengthen and improve capacity (laboratory infrastructure) in the region to deal with
PTS issues (scientific, analytical, modelling, accreditation, risk assessment), and support intra-
112
African (collaboration specifically Anglophone and Francophone) on PTS projects and
research, to support associated Conventions (Stockholm, Basel, Rotterdam, Bamako, etc).
Justification:
· To deal with PTS analysis and related scientific issues as identified (Chapters 2, 3, 4 and 5)
· To deal with the complex characteristics of PTS (Chapters 1 and 5)
· To deal with the transboundary aspects of PTS pollution (Chapters 4 and 5)
Barriers:
· Lack of funding
· Lack of skilled personnel
· Lack of access to facilities
· Lack of knowledge of technologies relevant to Africa
· Existing linguistic barriers
· Insufficient supporting policies
(19)
Establish an African PTS Advisory/Research Group
Justification:
· Stimulating, strengthening and coordinating African research work on PTS and alternatives
(Chapter 5)
· Strengthening communication between linguistic groups (Chapter 5)
Barriers:
· Lack of financial and technical resources
· Lack of IT infrastructure, especially communication and data management
· Long distances between centres hamper travel
· Lack of established links and protocols regarding research
(20) Develop tools and indicators to assess the impact of PTS on socio-economic activities, as well as
the success of the implementation of the various conventions, relevant to Africa.
Justification:
· Support sound identification of the socio-economic issues involved vis ŕ vis the international
agreements (Chapters 1 and 5)
· Facilitate technical and management solutions for PTS (Chapter 5)
· Produce end-points to measure achievement goals (Chapters1 and 5)
Barriers:
· Lack of funding and technical resources
(21)
Support and expand existing expert network to deal with research and monitoring
Justification:
· To foster collaboration and share experiences (Chapters 1 and 5)
· Improve regional co-operation (Chapters 1 and 5)
· Increase efficiency of research and monitoring (Chapter 5)
113
Barriers:
· Lack of funding
· Weak communication network
(22)
Support a specific project to analyse existing and new data to model the fate, transport and
effects of PTS in Region V.
Justification:
· Different climatic and biotic conditions prevail in Africa, requiring the application of models
to generate research questions (Chapters 1, 3 and 4)
· The lack of existing data could to some degree be addressed by modelling (Chapters 1, 3 and
4)
· Models currently not shown to have been calibrated to African conditions, requiring
extensive research before application of results (Chapter 4)
Barriers:
· Lack of funding
· Lack of skilled personnel
· Lack of data
· Lack of infrastructure to deal with models
(23)
Conduct a risk assessment using existing and new data, specifically aimed at determining the
risk to the human population and biota.
Justification:
· Provide information for decision making (Chapter 5)
· Identification of specific areas and magnitude / scope of risk (Chapters 2, 3, 4 and 5)
· Identify risk due to exposure profiles specific to Africa (Whole report)
· Need to harmonise Risk Assessment methodologies (Chapter 5)
· Need to develop Risk Assessment models applicable to African conditions (Chapter 5)
Barriers:
· Lack of funding
· Lack of skilled personnel
· Insufficiency of data
6.3.3 Long Term Priorities (5 to 10 years)
(24)
Assessment of need for regional incinerators.
Justification:
· Need to deal with obsolete stockpiles in an environmentally sound manner (Chapters 3 and 5)
· Reduce health hazards due to PTS wastes (Chapters 2 and 5)
· Determine the cost effectiveness of regional incineration (Chapter 5)
Barriers:
· Lack of funding
114
· Unknown cost structure
· Resistance to incineration
· Possible pollution from such plants
· Lack of established availability of regionally applicable technology
· Location of plant to be established
6.4 AREAS OF PRIORITY FOCUS
The delegates to the Priority Setting Meeting identified the following issues as the areas of priority focus,
against which actions and outcomes should be measured.
1.
Protection of international waters
2.
Reduction or monitoring of transboundary movements of PTS
3.
Monitoring of sediments, biota (biodiversity protection), air, soil
4.
Policy and legal harmonization
5.
Reduction of open burning
6.
Judicious use of DDT / Lindane
7.
Inventory / elimination of PCBs
8.
Technology transfer and development
9.
Laboratories (upgrading, strengthening and capacity improvement)
10.
Increase knowledge base in particular on PCDD/Fs
11.
Involvement of NGOs / civil society at all levels
6.5 FINAL WORD
Throughout this project, the RBA team for this region was impressed with the willingness of the experts,
academics, NGO representatives, members of the industry, members of IGOs and governments to contribute
meaningfully towards addressing the issues and problems posed by PTS in Africa. While communication and
transport were frequent problems encountered during this project, the energy and willingness to participate,
contribute and overcome all the obstacles, was an indication of what can be done on this scale.
The communication that was brought about by this project has, in our opinion, significantly raised the
awareness of PTS in the region. This report will hopefully contribute in meaningful ways, but, as such,
cannot be the end. It set out to make an assessment upon which further action can be based. Further action is
therefore, as has been expressed by the participants at both the Technical Workshops, as well as the Priority
Setting Meeting, crucial. The impression the team members received from the various international
organizations was that of a genuine commitment to this cause, in a region facing so many problems. The
lesson from this project is that with the right people and committed support from all sources, Africans will be
able to solve these issues. With this report go the hopes of 760 million people.
115
ANNEX: ABBREVIATIONS AND ACRONYMS
ADI Acceptable
Daily
Intake
AIDS Acquired
Immune
Deficiency
Syndrome
AU
African Union
BHC
Benzenehexachloride
şC
Celsius (Centigrade)
CHCs
Chlorinated Hydrocarbons
CIA
Central Intelligence Agency (USA)
DDT
Dichlorodiphenyltrichloroethane
DRC
Democratic Republic of Congo
E
East
EAF
East Africa
ECOWAS
Economic Commission of West African States
FAO
Food and Agriculture Organisation
GEF
Global Environment Facility
GESAMP
Group of Experts on the Scientific Aspects of Marine Environmental Protection
GDP
Gross Domestic Product
HCB
Hexachloroclobenzene
HCH
Hexachlorocyclohexane (Lindane)
Hg
Mercury
IARC
International Agency for Research on cancer
IFCS
Intergovernmental Forum on Chemical safety
IGOs Intergovernmental
Organisations
IITA international
Institute for Tropical Agriculture
IPM
Integrated Pest Management
IRRI
International Rice Research Institute
IVM
Integrated Vector Management
Kg
Kilogram
KOW
Octanol / Water Partition Coefficient
KWh Kilowatt hour
LC50 Median
Lethal Concentration
LD50 Median
lethal Dose
LOEL
Lowest Observed Effect Level
L Litre
MRL
Maximum Residue Limit
116
mg
Milligram
µg
Microgram
ml
Millilitre
N
North
ng
Nanogram
NEPAD
New Partnership for African Development
NOEL
No Observed Effect Level
OCs
Organochlorines
OCPs
Organochlorine Pesticides
OECD
Organisation for Economic Co-operation and Development
OPs
Organophosphates
Org.Hg
Organic mercury
Org.Pb
Organic Lead
OAU
Organisation of African Unity
PAHs
Polycyclic Aromatic Hydrocarbons
PBDEs
Polybrominated Diphenyl Ethers
PCBs
Polychlorinated biphenyls
PCDD
Polychlorinated Dibenzo-p-Dioxins
PCDD/Fs
Polychlorinated Dibenzo-p- Dioxins and Furans
PCDF
Polychlorinated DibenzoFurans
PCP
Pentachlorophenol
pg
Picogram
Pb Lead
POPs
Persistent Organic Pollutants (group of twelve as defined in the Stockholm Convention
2001)
ppm
Part Per Million
ppb
Part Per Billion
ppt
Part Per Trillion
PTS
Persistent Toxic Substances (as defined in the GEF project)
RBA
Regionally Based Assessment
RC
Regional Co-ordinator
RT
Regional Team
RSA
Republic of South Africa
S
South
SAARC
South Africa Agricultural Research Council
SADC
Southern Africa Development Cooperation
117
$
U.S. Dollar
TCDD
TetrachloroDibenzo-p-Dioxins
TEQ
Toxicity Equivalent
UNEP
United Nations Environment Programme
UNECE
United Nations Economic Commission for Europe
W
West
WACAF
West and Central Africa
WG
Working Group
WHO
World Health Organisation
118


United Nations
Environment Programme
Chemicals
Sub-Sahar
Sub-Saharan Africa
REGIONAL REPORT
an Africa
Regionally
RBA PTS REGIONAL REPOR
Based
Assessment
T
of
Persistent
Available from:
UNEP Chemicals
11-13, chemin des Anémones
CH-1219 Châtelaine, GE
Switzerland
Phone : +41 22 917 1234
Fax : +41 22 797 3460
Substances
E-mail: chemicals@unep.ch
December 2002
http://www.chem.unep.ch
UNEP Chemicals is a part of UNEP's Technology, Industry and
Printed at United Nations, Geneva
Economics Division
GE.03-00151January 2003500
UNEP/CHEMICALS/2003/5
G l o b a l E n v i r o n m e n t F a c i l i t y