


United Nations
Environment Programme
Chemicals
Centr
Central and North
al and Nor
East Asia
REGIONAL REPORT
th East
Regionally
Asia
RBA PTS REGIONAL REPOR
Based
Assessment
of
T
Persistent
Available from:
UNEP Chemicals
11-13, chemin des Anémones
CH-1219 Châtelaine, GE
Switzerland
Phone : +41 22 917 1234
Fax : +41 22 797 3460
Substances
E-mail: chemicals@unep.ch
December 2002
http://www.chem.unep.ch
UNEP Chemicals is a part of UNEP's Technology, Industry and
Printed at United Nations, Geneva
Economics Division
GE.03-00155January 2003500
UNEP/CHEMICALS/2003/7
G l o b a l E n v i r o n m e n t F a c i l i t y
UNITED NATIONS
ENVIRONMENT
PROGRAMME
CHEMICALS
Regional y Based Assessment
of Persistent Toxic Substances
Afghanistan, China, Democratic People's
Republic of Korea, South Korea, Japan,
Kazakhstan, Kyrgyzstan, Mongolia, Russian
Federation, Tajikistan, Turkmenistan, Uzbekistan
CENTRAL AND NORTH EAST
ASIA
REGIONAL REPORT
DECEMBER 2002
GLOBAL ENVIRONMENT FACILITY
This report was financed by the Global Environment Facility (GEF) through a global project with co-
financing from the Governments of Australia, France, Sweden, Switzerland and the United States of
America
This publication is produced within the framework of the Inter-Organization Programme for the Sound
Management of Chemicals (IOMC)
This publication is intended to serve as a guide. While the information provided is believed to be
accurate, UNEP disclaim any responsibility for the possible inaccuracies or omissions and
consequences, which may flow from them. UNEP nor any individual involved in the preparation of
this report shall be liable for any injury, loss, damage or prejudice of any kind that may be caused by
any persons who have acted based on their understanding of the information contained in this
publication.
The designations employed and the presentation of the material in this report do not imply the
expression of any opinion whatsoever on the part of the Secretariat of the United Nations of UNEP
concerning the legal status of any country, territory, city or area, or of its authorities, or concerning
the delimitation of its frontiers or boundaries.
The Inter-Organization Programme for the Sound Management of Chemicals (IOMC), was
established in 1995 by UNEP, ILO, FAO, WHO, UNIDO and OECD (Participating Organizations),
following recommendations made by the 1992 UN Conference on Environment and Development
to strengthen cooperation and increase coordination in the field of chemical safety. In January
1998, UNITAR formally joined the IOMC as a Participating Organization. The purpose of the
IOMC is to promote coordination of the policies and activities pursued by the Participating
Organizations, jointly or separately, to achieve the sound management of chemicals in relation to
human health and the environment.
Material in this publication may be freely quoted or reprinted but acknowledgement is requested
together with a reference to the document. A copy of the publication containing the quotation or
reprint should be sent to UNEP Chemicals.
UNEP
CHEMICALS
Available from:
UNEP Chemicals11-13, chemin des Anémones
CH-1219 Châtelaine, GE
Switzerland
Phone: +41 22 917 1234
Fax:
+41 22 797 3460
E-mail: chemicals@unep.ch
http://www.chem.unep.ch
UNEP Chemicals is a part of UNEP's Technology, Industry and Economics Division
ii
TABLE OF CONTENTS
PREFACE.........................................................................................VI
EXECUTIVE SUMMARY .................................................................VII
1
INTRODUCTION ....................................................................... 1
1.1
OVERVIEW OF THE RBA PTS PROJECT .............................................................................1
1.1.1 Objectives ...............................................................................................................................1
1.1.2 Results.....................................................................................................................................1
1.2 METHODOLOGY .....................................................................................................................2
1.2.1 Regional
Divisions..................................................................................................................2
1.2.2 Management
Structure............................................................................................................2
1.2.3 Data
Processing.......................................................................................................................2
1.2.4 Project
Funding.......................................................................................................................2
1.3
SCOPE OF THE CENTRAL AND NORTH EAST ASIA REGIONAL ASSESSMENT ........3
1.3.1 Existing
Assessments..............................................................................................................5
1.3.2
Intra-Regional Links and Collaboration .................................................................................5
1.3.3 Omissions
and
Weaknesses ....................................................................................................5
1.4 METHODOLOGY .....................................................................................................................5
1.5
GENERAL DEFINITIONS OF CHEMICALS..........................................................................6
1.5.1
Persistent Toxic Substances - Pesticides ................................................................................6
1.5.2
Persistent Toxic Substances Industrial Compounds ............................................................9
1.5.3
Persistent Toxic Substances Unintentional By-Products...................................................10
1.5.4
Regional Specific Chemicals ................................................................................................10
1.6
DEFINITION OF THE CENTRAL AND NORTH EAST ASIA REGION............................13
1.7 PHYSICAL
SETTING .............................................................................................................15
1.8
PATTERNS OF DEVELOPMENT/SETTLEMENT...............................................................17
2
SOURCE CHARACTERISATION ........................................... 19
2.1 BACKGROUND
INFORMATION TO PTS SOURCES ........................................................19
2.1.1
Scoring of PTS......................................................................................................................19
2.2
PRODUCTION, USE AND EMISSION..................................................................................21
2.2.1
Persistent Toxic Substances - Pesticides ..............................................................................21
2.2.2
Persistent Toxic Substances Industrial Compounds ..........................................................27
2.2.3
Persistent Toxic Substances Unintentional by-Products ...................................................31
2.2.4 Organic
Metals......................................................................................................................41
2.3 DATA
GAPS ............................................................................................................................43
2.4
SUMMARY OF HOT SPOTS AND MOST SIGNIFICANT REGIONAL SOURCES .........43
2.5 CONCLUSIONS ......................................................................................................................44
3
ENVIRONMENTAL LEVELS, TOXICOLOGICAL AND
ECOTOXICOLOGICAL PATTERNS....................................... 45
3.1 INTRODUCTION ....................................................................................................................45
3.1.1
Scoring of PTS......................................................................................................................45
iii
3.2 LEVELS
AND
TRENDS .........................................................................................................46
3.2.1 Air/Deposition ......................................................................................................................46
3.2.2
Surface Waters (Water and Sediment)..................................................................................48
3.2.3 Groundwater .........................................................................................................................51
3.2.4 Soils ......................................................................................................................................51
3.2.5 Aquatic
Biota ........................................................................................................................53
3.2.6 Terrestrial
Biota ....................................................................................................................57
3.2.7
Time Trends of PTS in the Region .......................................................................................58
3.3
TOXICOLOGICAL AND ECOTOXICOLOGICAL EFFECTS OF PTS...............................60
3.3.1 Introduction...........................................................................................................................60
3.3.2
Toxicology of PTS of Regional Concern..............................................................................61
3.3.3
Ecotoxicology of PTS of Regional Concern.........................................................................63
3.4 HOT
SPOTS .............................................................................................................................64
3.5 DATA
GAPS ............................................................................................................................64
3.6 CONCLUSION.........................................................................................................................64
4
MAJOR PATHWAYS OF CONTAMINANT TRANSPORT ..... 65
4.1 INTRODUCTION ....................................................................................................................65
4.1.1 General..................................................................................................................................65
4.1.2 Regionally
Specific
Features ................................................................................................65
4.2 MEASUREMENTS/MODELLING
APPROACH
FOR TRANSPORT ASSESSMENT.......65
4.3
OVERVIEW OF EXISTING MODELLING PROGRAMS AND PROJECTS ......................66
4.3.1 Japan .....................................................................................................................................66
4.3.2
Republic of Korea.................................................................................................................66
4.3.3 Russian
Federation................................................................................................................67
4.3.4
Other Modelling Programs ...................................................................................................67
4.4 EXISTING
MONITORING
PROGRAMMES CONCERNING PTS TRANSPORT.............67
4.5
TRANSBOUNDARY MOVEMENT OF PTS.........................................................................68
4.5.1 Atmospheric
Transport .........................................................................................................68
4.5.2 Terrestrial
Hydrology
Related to PTS Transport..................................................................74
4.5.3
Oceans as Pathway................................................................................................................76
4.6 DATA
GAPS ............................................................................................................................77
4.6.1
What Information Needs To Be Collected?..........................................................................77
4.6.2
How Should It Be Collected? ...............................................................................................77
4.7 CONCLUSIONS ......................................................................................................................78
5
PRELIMINARY ASSESSMENT OF THE REGIONAL
CAPACITY AND NEED TO MANAGE PTS............................ 79
5.1 INTRODUCTION ....................................................................................................................79
5.2 MONITORING
CAPACITY....................................................................................................79
5.2.1 Environmental
Monitoring ...................................................................................................79
5.2.2
Methods of Monitoring.........................................................................................................80
5.2.3
Items Actually Monitored.....................................................................................................85
5.3
EXISTING REGULATIONS AND MANAGEMENT STRUCTURES .................................86
5.3.1
Laws and Regulations...........................................................................................................86
5.3.2 Administrative
Institutions ...................................................................................................92
iv
5.4
STATUS OF ENFORCEMENT...............................................................................................94
5.5
ALTERNATIVES/MEASURES FOR REDUCTION .............................................................96
5.5.1
Intentionally Produced PTS ..................................................................................................96
5.5.2
Unintentionally Produced PTS .............................................................................................97
5.6 TECHNOLOGY
TRANSFER..................................................................................................97
5.7 IDENTIFICATION
OF
NEEDS ..............................................................................................98
5.7.1
Overview of Status................................................................................................................98
5.7.2 Existing
Difficulties..............................................................................................................98
5.7.3 Capacity
Building .................................................................................................................99
5.7.4 Follow-up
Activities ...........................................................................................................100
6
CONCLUSIONS .................................................................... 101
6.1 IDENTIFICATION
OF
BARRIERS......................................................................................101
6.2 IDENTIFICATION
OF
PRIORITIES....................................................................................101
6.2.1 Sources................................................................................................................................101
6.2.2 Pathways .............................................................................................................................101
6.2.3
Environmental Levels, Toxicological and Ecotoxicological Effects..................................102
6.3
RECOMMENDATION FOR FUTURE ACTIVITIES..........................................................102
REFERENCES .............................................................................. 103
ANNEX 1 ....................................................................................... 113
v
PREFACE
STRUCTURE OF THE REGIONAL TEAM
The following members comprise the Central and North East Asia Regional team:
Regional Co-ordinator
Prof Ming H WONG
Institute for Natural Resources and
Environmental Management
Hong Kong Baptist University
Kowloon Tong, Hong Kong SAR
Regional Team Members
Dr Yasuyuki SHIBATA
Dr Kyunghee CHOI
Environmental Chemodynamics Section
Environmental Risk Assessment Division
Environmental Chemistry Division
National Institute of Environmental Research
National Institute for Environmental Studies
(NIER)
(NIES)
Ministry of Environment
Tsukuba, Japan
Inchon, Republic of Korea
Dr Noriyuki SUZUKI
Dr Elena GROSHEVA
Endocrine Disruptors & Dioxin Research Project
Russian Federation Ministry of Natural Resources
National Institute for Environmental Studies
Albert Beim Institute of Ecological Toxicology
(NIES)
Irkutsk Region, Russian Federation
Tsukuba, Japan
Dr Shin-ichi SAKAI
Ms WANG Ji
Research Center for Material Cycles and Waste
Areal & Ecological Inspection Division
Management
Department of Environment Protection Inspection
National Institute for Environmental Studies
State Environmental Protection Administration
(NIES)
(SEPA)
Tsukuba, Japan
Beijing, PR China
Assistants
Ms ZHOU Hong - Assistant to Ms WANG Ji
Technical Supporting Division
Chemical Registration Center of SEPA
Beijing, PR China
Ms Anna LEUNG Assistant to Prof Ming H WONG
Institute for Natural Resources and
Environmental Management
Hong Kong Baptist University
Kowloon Tong, Hong Kong SAR
ACKNOWLEDGMENT
This report is very much a joint effort. In addition to the Regional team members, we would like to thank all the
experts and representatives from different countries who contributed significantly in data collection and/or
taking part in technical workshops. Special thanks are due to Dr Diana Graham who served as a resource person
in the Regional Priority Setting Meeting. Last, but not least, we would like to thank Mr Paul Whylie, the
Project Manager at UNEP Chemicals, for his continual support and patience.
vi
EXECUTIVE SUMMARY
1. As part of the global project supported by UNEP/GEF, this report presents findings of an assessment of
sources, fates and effects related to the 12 Stockholm Convention chemicals which include pesticides
(aldrin, endrin, dieldrin, chlordane, DDT, toxapnene, mirex, heptacholor, hexachlorobenzene), industrial
chemicals (PCBs and also hexachlorobenzene) and unintentional by-products (PCDD/PCDF), as well as six
additional chemicals (PAHs, organic mercury compounds, organic tin compounds, HCH, brominated flame
retardant [PBDE]), and pentachlorophenol (PCP) at the Central and North-East Asia (Region VII) which
includes 11 countries: China, Japan, Republic of Korea, Democratic People's Republic of Korea, Russian
Federation, Mongolia, Kazakhstan, Kyrgyzstan, Tajikistan, Turkmenistan and Uzbekistan.
2. This report is based on data gathering and interpretation of existing information, and through questionnaires
related to information on sources, environmental concentrations and impacts of PTS, and also by
participating in two technical workshops, using a Regional expert network comprising scientists,
researchers, and representatives from government, industry and NGOs in different countries within this
Region.
3. There is wide variation between the 11 countries of this Region in terms of geography, industrialization,
economic development and environmental monitoring and remediation. These variations are reflected in
the amount of information available on PTS and their management. In general, data on PTS within the
Region is still rather sparse especially in countries with their economies in transition.
4. The results of the scoring exercise derived from the 1st Technical Workshop indicated that PCDD/PCDF,
PCBs, PAHs, DDT and HCH are chemicals of Regional concern meaning that there is either a) a major
production of the chemical for local and export use, b) evidence of the chemical as a contaminant in large
scale production of other chemicals, c) known emissions of the chemical from large scale incinerators or
chlorine bleaching of pulp or other related combustion facilities, d) evidence of leakage from major
stockpiles of the chemical, e) large-scale use of the chemical throughout the Region, and/or f) spatial and/or
temporal trends increasing Regionally from levels above threshold. With regard to data gaps, there is
insufficient and/or unreliable data on 8 of the 18 chemicals. These are mainly industrial chemicals (PCBs,
PBDE, HCB) and unintentional by-products (PCDD/PCDF, PAHs). There is also insufficient information
available for PCP and organic mercury compounds.
5. The environmental levels, toxicological and ecotoxicological effects of PTS within the Region have been
assessed by means of data collection and literature review. The results of the scoring exercise derived from
the 2nd Technical Workshop revealed that PCDD/PCDF, PCBs, DDT and PAHs are chemicals of Regional
concern in terms of environmental levels and ecotoxicological effects, and these five plus HCH are
Regional concern for human health. With regards to data gaps, there are insufficient reliable data on 7 of
the 18 chemicals. These chemicals are mainly industrial chemicals (PCBs, HCH, and PBDE) and
unintentional by-products (PCDD/PCDF, PAHs). There is also insufficient data related to DDT and
toxaphene. More information is needed concerning the temporal and spatial distributions of PTS in
different ecological compartments, especially in developing countries and countries with their economies in
transition. It is difficult to compare data generated by different countries using different sampling, sample
preparation and analytical methods.
6. Due to the wide range of meteorological and geographical parameters of Region VI, there is insufficient
information on the pathways of contaminant transport. Some countries have experience of transport
assessment by modelling: such as hemispheric MSCE-POP by EMEP, multimedia modelling by Korea
(POPsME and EDCSeoul) and Grid-Catchments integrated MMM by Japan. In general, the transboundary
transport of PTS within the Region is not yet well described neither by modelling or monitoring
approaches. Source inventory data, monitoring data, modelling data, and source pattern/fingerprints are
urgently needed for the assessment of PTS in the Region.
7. The Regional capacity and need to manage PTS of the 11 countries within the Region were assessed
through collection of information by country representatives. Japan and Republic of Korea, especially the
former, have comparatively well-established PTS management systems within the Region. China has
monitored the import and export of toxic chemicals since 1994, and is in the process of establishing an
inventory of POPs, pesticides and PDF-B with a national implementation plan (NIP) as required by the
Sockholm Convention. The Russian Federation started an environmental administration of chemicals and
relevant research some time ago whilst the management of PTS in other countries was initiated more
vii
recently. The difficulties involved in the management of PTS for most countries within the Region include
a) lack of funds, b) lack of information, c) lack of advanced or best available technology, d) insufficient
knowledge and training of special personnel, e) low public awareness, and f) lack of coordination of
government departments dealing with PTS.
8. It can be concluded that the major barriers of PTS management of developing countries and countries with
economies in transition in the Region is the lack of fund for technology transfer. Safe disposal of obsolete
pesticides such as DDT and their substitutes should receive high priority. Capacity building for technical
and management personnel to deal with PTS, and raising the awareness of the general public are urgently
need in these countries. A Regional organization is recommended to be established for setting up a
monitoring network using standardized methodologies. The more reliable data generated could be used to
more accurately assess the fates and effects, including the transboudnary movement of PTS in the Region.
viii
1 INTRODUCTION
1.1 OVERVIEW OF THE RBA PTS PROJECT
Following the recommendations of the Intergovernmental Forum on Chemical Safety, the UNEP Governing
Council decided in February 1997 (Decision 19/13 C) that immediate international action should be initiated to
protect human health and the environment through measures which will reduce and/or eliminate the emissions
and discharges of an initial set of twelve persistent organic pollutants (POPs). Accordingly an
Intergovernmental Negotiating Committee (INC) was established with a mandate to prepare an international
legally binding instrument for implementing international action on certain persistent organic pollutants. These
series of negotiations have resulted in the adoption of the Stockholm Convention in 2001. The initial 12
substances fitting these categories that have been selected under the Stockholm Convention include: aldrin,
endrin, dieldrin, chlordane, DDT, toxaphene, mirex, heptachlor, hexachlorobenzene, PCBs, dioxins and furans.
Beside these 12, there are many other substances that satisfy the criteria listed above for which their sources,
environmental concentrations and effects are to be assessed.
Persistent toxic substances can be manufactured substances for use in various sectors of industry, pesticides, or
by-products of industrial processes and combustion. To date, their scientific assessment has largely
concentrated on specific local and/or Regional environmental and health effects, in particular "hot spots" such
as the Great Lakes Region of North America or the Baltic Sea.
The substances of greatest concern are anthropogenic organic compounds with certain distinctive
characteristics:
· PERSISTENCE IN THE ENVIRONMENT
· RESISTANCE TO DEGRADATION
· ACUTE AND CHRONIC TOXICITY
· BIO-ACCUMULATION
· LONG RANGE TRANSPORT BY AIR, WATER OR MIGRATORY SPECIES ACROSS STATE
BOUNDARIES
1.1.1 Objectives
There is a need for a scientifically-based assessment of the nature and scale of the threats to the environment
and its resources posed by persistent toxic substances that will provide guidance to the international community
concerning the priorities for future remedial and preventive action. The assessment will lead to the
identification of priorities for intervention, and through application of a root cause analysis will attempt to
identify appropriate measures to control, reduce or eliminate releases of PTS, at national, Regional or global
levels.
The objective of the project is to deliver a measure of the nature and comparative severity of damage and
threats posed at national, Regional and ultimately at global levels by PTS. This will provide the GEF with a
science-based rationale for assigning priorities for action among and between chemical related environmental
issues, and to determine the extent to which differences in priority exist among Regions.
1.1.2 Results
The project relies upon the collection and interpretation of existing data and information as the basis for the
assessment. No research will be undertaken to generate primary data, but projections will be made to fill
data/information gaps, and to predict threats to the environment. The proposed activities are designed to obtain
the following expected results:
· Identification of major sources of PTS at the Regional level;
· Impact of PTS on the environment and human health;
· Assessment of transboundary transport of PTS;
· Assessment of the root causes of PTS related problems, and Regional capacity to manage these
1
problems;
· Identification of Regional priority PTS related environmental issues; and
· Identification of PTS related priority environmental issues at the global level.
The outcome of this project will be a scientific assessment of the threats posed by persistent toxic substances to
the environment and human health. The activities to be undertaken in this project comprise an evaluation of the
sources of persistent toxic substances, their levels in the environment and consequent impact on biota and
humans, their modes of transport over a range of distances, the existing alternatives to their use and remediation
options, as well as the barriers that prevent their good management.
1.2 METHODOLOGY
1.2.1 Regional
Divisions
To achieve these results, the globe is divided into 12 Regions namely: Arctic, North America, Europe,
Mediterranean, Sub-Saharan Africa, Indian Ocean, Central and North East Asia (Western North Pacific), South
East Asia and South Pacific, Pacific Islands, Central America and the Caribbean, Eastern and Western South
America, Antarctica. The twelve Regions were selected based on obtaining geographical consistency while
trying to reside within financial constraints.
1.2.2 Management
Structure
The project is directed by the project manager who is located at UNEP Chemicals in Geneva, Switzerland. A
Steering Group comprising of representatives of other relevant intergovernmental organisations along with
participation from industry and the non-governmental community is established to monitor the progress of the
project and provide direction for the project manager. Each Region is controlled by a Regional coordinator
assisted by a team of approximately 4 persons. The co-ordinator and the Regional team are responsible for
promoting the project, the collection of data at the national level and to carry out a series of technical and
priority setting workshops for analysing the data on PTS on a Regional basis. Besides the 12 POPs from the
Stockholm Convention, the Regional team selects the chemicals to be assessed for its Region with selection
open for review during the various workshops undertaken throughout the assessment process. Each team writes
the Regional report for the respective Region.
1.2.3 Data
Processing
Data is collected on sources, environmental concentrations, human and ecological effects through
questionnaires that are filled in at the national level. The results from this data collection along with
presentations from Regional experts at the technical workshops, are used to develop Regional reports on the
PTS selected for analysis. A priority setting workshop with participation of representatives from each country
results in priorities being established regarding the threats and damages of these substances to each Region.
The information and conclusions derived from the 12 Regional reports will be used to develop a global report
on the state of these PTS in the environment.
The project is not intended to generate new information but to rely on existing data and its assessment to arrive
at priorities for these substances. The establishment of a broad and wide- ranging network of participants
involving all sectors of society was used for data collection and subsequent evaluation. Close cooperation with
other intergovernmental organizations such as UNECE, WHO, FAO, UNPD, World Bank and others was
obtained. Most have representatives on the Steering Group Committee that monitors the progress of the
project and critically reviews its implementation. Contributions were garnered from UNEP focal points, UNEP
POPs focal points, national focal points selected by the Regional teams, industry, government agencies,
research scientists and NGOs.
1.2.4 Project Funding
The project costs approximately US$4.2 million funded mainly by the Global Environment Facility (GEF) with
sponsorship from countries including Australia, France, Germany, Sweden, Switzerland and the USA. The
project runs between September, 2000 to April, 2003 with the intention that the reports be presented to the first
meeting of the Conference of the Parties of the Stockholm Convention projected for 2003/4.
2
1.3 SCOPE OF THE CENTRAL AND NORTH EAST ASIA REGIONAL ASSESSMENT
As defined in the UNEP/GEF's Guidance Document for the Collection, Assembly and Evaluation of Data on
Sources, Environmental Levels and Impacts of Persistent Toxic Substances, persistent toxic substances share
the following characteristics (UNEP, 2000):
· organic (including organometallic) substances;
· slowly degraded in the environment;
· accumulating in biota and;
· toxic
Many PTS have the ability to be transported over long distances across international boundaries through
atmospheric, aquatic or biological media. They are detectable even in areas where the chemicals have never
been used. Due to their affinity to lipids, PTS are absorbed by the fatty tissue of people and animals. They are
bioaccumulated and biomagnified through the food chain. PTS pose adverse health effects, such as
reproductive disorders, developmental deformities and cancer in both humans and wildlife. As a consequence
to their significant threat to both our environment and to our health, PTS are a major concern at the local,
national, Regional and global level. A subset of the PTS are Persistent Organic Pollutants (POPs) which are
organochlorine compounds that persist in the environment, resist degradation, and produce acute and chronic
toxicity.
The United Nations Environment Programme (UNEP) has identified twelve POPs to be the initial chemicals
targeted for global elimination or restriction of production and use. Under the Stockholm Convention, an
international legally binding treaty formally adopted on 22 May 2001, global awareness on the adverse effects
of POPs has been heightened. The treaty requires governments from over 122 countries to take action on the
POPs through minimizing and eliminating the production, import, export, disposal, and use. The twelve POPs,
also known as the dirty dozen, consists of the pesticides aldrin, chlordane, DDT, dieldrin, endrin,
hexachlorobenzene, heptachlor, mirex, and toxaphene; the industrial chemicals polychlorinated biphenyls
(PCBs) and hexachlorobenzene (which is also a pesticide mentioned above); and the unintentional by-
products polychlorinated dibenzoparadioxins (PCDD) and polychlorinated dibenzofurans (PCDF). The
treaty comes into force when it has been ratified by 50 countries. It is a sound and effective treaty that can be
updated and expanded over the decades to proactively manage POPs. The Stockholm Convention has
provisions for adding a chemical to the list of POPs if the chemical meets the criteria for persistence in the
environment, bioaccumulation, and transportability. This provision helps to ensure that the treaty remains
dynamic and responsive.
Most of the 12 POPs are subject to an immediate ban, however, DDT has been granted a health-related
exemption because it is needed in many countries to control malarial mosquitoes. These countries are permitted
to use DDT until a suitable alternative is found.
The objectives of the Regionally Based Assessment of Persistent Toxic Substances project are complementary
to the Stockholm Convention. The project a) identifies sources of PTS; b) assesses the impact of PTS on human
health and the environment; c) assesses transboundary pathways of PTS, d) assesses root causes of PTS
problems and capacity to manage Regionally; and e) identifies Regional and global priority PTS environmental
issues.
For this project, the globe has been divided into 12 Regions -Arctic, North America, Europe, Mediterranean,
Sub-Saharan Africa, Indian Ocean, Central and North East Asia, South East Asia and South Pacific, Pacific
islands, Central America and the Caribbean, Eastern and Western South America, and Antarctica. In each
Region, the collection of PTS data is to be managed by a Regional Co-ordinator who is assisted by a team of
approximately 4 persons. Each Region is to collect information on the twelve Stockholm POPs in addition to
other PTS which are of potential concern for the Region. The following is a list of chemicals provided by
UNEP Chemicals for possible consideration by each Region.
3
Table 1.1: List of PTS for Regional Consideration
Stockholm Convention POPs
Other PTS
Aldrin
Chlordecone
Chlordane
Hexabromobiphenyl
DDT
HCH
Dieldrin
PAHs
Endrin
Polybrominated Diphenyl Ether (PBDE)
Heptachlor
Chlorinated Paraffins
Hexachlorobenzene (HCB)
Endosulphan
Mirex
Atrazine
Toxaphene
Pentachlorophenol (PCP)
PCBs
Organic Mercury Compounds
Dioxins
Organic Tin Compounds
Furans
Organic Lead Compounds
Phthalates
Octylphenols
Nonylphenols
Upon consultations with experts within the Region, the Regional team of the Central and North East Asia
selected the following PTS in addition to the 12 POPs to be considered of potential concern for the Region:
· HCH
· Pentachlorophenol (PCP)
· PAHs
· Organic Mercury Compounds
· PBDE
· Organic Tin Compounds
The Stockholm Convention allows participating parties to register specific exemptions for the 12 POPs. The
following is a list, received as of 22 May 2001, for specific exemptions for the countries of Region VII (UNEP,
2001a) (Table 1.2). It should be noted that the list is not a preliminary draft of the register of specific
exemptions to be established under article 4 of the Convention.
Table 1.2 Extract from Revised List of Requests for Specific Exemptions in Annex A and Annex B and acceptable
purposes in Annex B to the Stockholm Convention (UNEP, 2001a)
Country
Specific exemption or acceptable purpose
China
Production and use of chlordane as a termiticide in buildings and dams
Production and use of hexachlorobenzene as an intermediate
Production and use of mirex as a termiticide
Production and use of DDT as an intermediate
Production and use of DDT for disease vector use in accordance with Part II of Annex
B of the Stockholm Convention on Persistent Organic Pollutants
Japan
Wooden articles in use treated with chlordane as a termiticide in the structures of
houses
Wooden articles in use treated with heptachlor as a termiticide in the structures of
houses
Republic of Korea
Use of chlordane as an additive in plywood adhesives
Use of heptachlor in articles in use in general
Use of PCBs in articles in use in accordance with Part II of Annex A of the Stockholm
Convention on Persistent Organic Pollutants
Russian Federation
Use of PCBs in dielectric solvents for industrial electric equipment
Production and use of hexachlorobenzene as an intermediate Production and use of
DDT for disease vector use in accordance with Part II of Annex B of the Stockholm
Convention on Persistent Organic Pollutants
4
1.3.1 Existing
Assessments
Assessment of PTS in some of the countries of the Region, especially in the more developed countries, has
been conducted. The Ministry of the Environment of Japan has been systematically conducting surveys for
nearly three decades to monitor environmental levels of some of the POPs, such as DDT and HCB (Japan
started monitoring in 1974). In 2002, the Ministry of the Environment reorganised the environmental
monitoring and started POPs monitoring. In the Republic of Korea, research projects on POPs/PTS include the
10-year National Research Plan (1999-2008) and projects to investigate endocrine disrupting chemicals.
Chemical information exchange systems such as Chem-Net Korea and ESCAP Clearinghouse system have
been implemented for public dissemination of PTS information. In China, preliminary surveys on PCBs were
carried out in the middle of the 1990's. A two-year project to provide an inventory of POP pesticides has
recently began. Furthermore, laboratories for the monitoring of PCDD/PCDF are also being established in
China. In Hong Kong SAR, a 3-year project "A Study of Toxic Substances Pollution in Hong Kong",
commissioned by the Environmental Protection Department, is currently being finalised. Its primary focus is on
identifying and quantifying pollutants, including PTS, released into local waters to establish a Priority Toxic
Substances List. The Russian Federation has concentrated on assessment of the PCB inventory and sources and
environmental levels of PCDD/PCDF. In some of the Commonwealth of Independent States (CIS) countries,
compilation of inventories of sources has only recently began. For example, Tajikistan started an inventory of
PTS sources in 1998. In Mongolia, source inventory of PTS has not started yet due to lack of professional
capacity.
1.3.2 Intra-Regional Links and Collaboration
Within Region VII, only Japan and Republic of Korea have collaboration projects on PTS. The Ministry of
Environment, National Institute of Environmental Research (NIER), of the Republic of Korea has been
working closely with the Ministry of the Environment, National Institute for Environmental Studies (NIES) of
Japan on a project to investigate endocrine disrupting chemicals (EDC), such as PCDD/PCDF and PCBs.
1.3.3 Omissions and Weaknesses
Information for this report is based mainly on literature review and information submitted by country experts
and relevant government departments. Information collected via questionnaires prepared by UNEP-Chemicals
on sources, concentrations, and impacts has not been comprehensive due to lack of human resources and lack
of available data from some of the countries. Of the completed questionnaires received, the majority of the
information has been on environmental concentrations with little information provided in relation to sources of
PTS. In addition to poor documentation of source inventories of pesticides, information with regards to the fate
of the pesticides has not been well documented (i.e. whether the pesticides have been exported, stockpiled,
etc.). Previously, there have not been any formal established communication channels on PTS between the
countries of the Region (perhaps except Japan and Republic of Korea), therefore dialogue concerning PTS
issues has been weak and should be developed.
1.4 METHODOLOGY
The development of this report was carried out through the gathering and interpretation of existing information,
including literature review (journals, reports, databases), and through the contribution of a Regional expert
network. Prior to this project, there had been no Regionally-coordinated network on PTS, aside from a
collaborative project between two countries (Japan and Republic of Korea). To establish the Regional expert
network, country experts on PTS, scientists, researchers, government, industry and NGOs were informed of the
UNEP/GEF project and invited to participate. The expert network contributed to the project by filling
questionnaires relating to information on sources, environmental concentrations and impacts of PTS, and by
participating in two technical workshops. The questionnaires, thirteen in total, were developed by UNEP-
Chemicals specifically for this project and can be found in the project website: www.chem.unep.ch/pts. All
completed questionnaires were stored in the project website database. During the two technical workshops- 1st
Technical Workshop (Sources and Concentration of PTS in the Environment, 18-20 March 2002, Tokyo,
Japan) and the 2nd Technical Workshop ((Eco)toxicological Impact and Transboundary Transport of Persistent
Toxic Substances, 14-16 May 2002, Hong Kong, PR China), background discussion papers were presented by
the Regional team, and invited participants presented technical papers on the situation of PTS in their countries.
Information contained within technical papers was incorporated into the background discussion papers for the
development of this draft Regional report. During the technical workshops, the participants were divided into
5
working groups to discuss prioritisation of sources, environmental levels, (eco)toxicological effects,
transboundary transport of chemicals, and data gaps of each of the 18 chemicals with the aid of a scoring
system developed by UNEP-Chemicals. In final plenary sessions, participants from the respective workshops,
upon collective agreement, assigned overall scores to each chemical. The scoring mechanism was a tool used to
prioritise the chemicals. The scoring results were a collective effort of all the participants of the workshops.
The scoring sheet (Annex 1) together with the final scores are listed in Chapter 2 and Chapter 3.
1.5 GENERAL DEFINITIONS OF CHEMICALS
The following are the general definitions of the 18 persistent toxic substances presented as the 12 Stockholm
Convention POPs followed by the 6 Regional specific chemicals:
Stockholm Convention POPs
1.5.1 Persistent Toxic Substances - Pesticides
1.5.1.1 Aldrin
Chemical Name: 1,2,3,4,10,10-Hexachloro-1,4,4a,5,8,8a-hexahydro-1,4-endo,exo-5,8-dimethanonaphthalene
(C12H8Cl6).
CAS Number: 309-00-2
Properties: Solubility in water: 27 µg/L at 25°C; vapour pressure: 2.3 x 10⁻⁵ mm Hg at 20°C; log KOW: 5.17-
7.4.
Discovery/Uses: It has been manufactured commercially since 1950, and used throughout the world up to the
early 1970's to control soil pests such as corn rootworm, wireworms, rice water weevil, and grasshoppers. It
has also been used to protect wooden structures from termites.
Persistence/Fate: Readily metabolised to dieldrin by both plants and animals. Biodegradation is expected to be
slow and it binds strongly to soil particles, and is resistant to leaching into groundwater. Aldrin was classified
as moderately persistent with half-life in soil and surface waters ranging from 20 days to 1.6 years.
Toxicity: Aldrin is toxic to humans; the lethal dose for an adult has been estimated to be about 80 mg/kg body
weight. The acute oral LD50 in laboratory animals is in the range of 33 mg/kg body weight for guinea pigs to
320 mg/kg body weight for hamsters. The toxicity of aldrin to aquatic organisms is quite variable, with aquatic
insects being the most sensitive group of invertebrates. The 96-h LC50 values range from 1-200 µg/L for
insects, and from 2.2-53 µg/L for fish. The maximum residue limits in food recommended by FAO/WHO
varies from 0.006 mg/kg milk fat to 0.2 mg/kg meat fat. Water quality criteria between 0.1 to 180 µg/L have
been published.
1.5.1.2 Chlordane
Chemical Name: 1,2,4,5,6,7,8,8-Octachloro-2,3,3a,4,7,7a-hexahydro-4,7-methanoindene (C10H6Cl8).
CAS Number: 57-74-9
Properties: Solubility in water: 56 µg/L at 25°C; vapour pressure: 0.98 x 10⁻⁵ mm Hg at 25 °C; log KOW: 4.58-
5.57.
Discovery/Uses: Chlordane appeared in 1945 and was used primarily as an insecticide for control of
cockroaches, ants, termites, and other household pests. Technical chlordane is a mixture of at least 120
compounds. Of these, 60-75% are chlordane isomers, the remainder being related to endo-compounds including
heptachlor, nonachlor, diels-alder adduct of cyclopentadiene and penta/hexa/octachlorocyclopentadienes.
Persistence/Fate: Chlordane is highly persistent in soils with a half-life of about 4 years. Its persistence and
high partition coefficient promotes binding to aquatic sediments and bioconcentration in organisms.
Toxicity: LC50 from 0.4 mg/L (pink shrimp) to 90 mg/L (rainbow trout) have been reported for aquatic
organisms. The acute toxicity for mammals is moderate with an LD50 in rat of 200-590 mg/kg body weight
(19.1 mg/kg body weight for oxychlordane). The maximum residue limits for chlordane in food are, according
to FAO/WHO between 0.002 mg/kg milk fat and 0.5 mg/kg poultry fat. Water quality criteria of 1.5 to 6 µg/L
have been published. Chlordane has been classified as a substance for which there is evidence of endocrine
disruption in an intact organism and possible carcinogenicity to humans.
6
1.5.1.3 Dichlorodiphenyltrichloroethane
(DDT)
Chemical Name: 1,1,1-Trichloro-2,2-bis-(4-chlorophenyl)-ethane (C14H9Cl5).
CAS Number: 50-29-3.
Properties: Solubility in water: 1.2-5.5 µg/L at 25°C; vapour pressure: 0.2 x 10⁻⁶ mm Hg at 20°C; log KOW:
6.19 for pp'-DDT, 5.5 for pp'-DDD and 5.7 for pp'-DDE.
Discovery/Use: DDT appeared for use during World War II to control insects that spread diseases like malaria,
dengue fever and typhus. Following this, it was widely used on a variety of agricultural crops. The technical
product is a mixture of about 85% pp'-DDT and 15% op'-DDT isomers.
Persistence/Fate: DDT is highly persistent in soils with a half-life of up to 15 years and of 7 days in air. It also
exhibits high bioconcentration factors (in the order of 50000 for fish and 500000 for bivalves). In the
environment, the product is metabolised mainly to DDD and DDE.
Toxicity: The lowest dietary concentration of DDT reported to cause egg shell thinning was 0.6 mg/kg for the
black duck. LC50 of 1.5 mg/L for largemouth bass and 56 mg/L for guppy have been reported. The acute
toxicity of DDT for mammals is moderate with an LD50 in rat of 113-118 mg/kg body weight. DDT has been
shown to have an estrogen-like activity, and possible carcinogenic activity in humans. The maximum residue
level in food recommended by WHO/FAO range from 0.02 mg/kg milk fat to 5 mg/kg meat fat. Maximum
permissible DDT residue levels in drinking water (WHO) is 1.0 µg/L.
DDT for control of disease vectors is exempt from ban under Annex B of the Stockholm Convention.
There is no continuous record of world production of DDT, and estimates of its usage vary. UNEP suggested
that annual world consumption from 1971 to 1981 was 68,800 t (UNEP, 1990). Currently, most uses of DDT is
for public health vector control. In 1990, the production of DDT was estimated at 2800 t
(UNEP/FAO/PIC/INC.1/inf.1, 1996).
1.5.1.4 Dieldrin
Chemical Name: 1,2,3,4,10,10-Hexachloro-6,7-epoxy-1,4,4a,5,6,7,8,8a-octahydroexo-1,4-endo-5,8-
dimethanonaphthalene (C12H8Cl6O).
CAS Number: 60-57-1
Properties: Solubility in water: 140 µg/L at 20°C; vapour pressure: 1.78 x 10⁻⁷ mm Hg at 20°C; log KOW:
3.69-6.2.Discovery/Uses: It appeared in 1948 after World War II and used mainly for the control of soil insects
such as corn rootworms, wireworms and catworms.
Persistence/Fate: It is highly persistent in soils, with a half-life of 3-4 years in temperate climates, and
bioconcentrates in organisms. The persistence in air has been estimated in 4-40 h.
Toxicity: The acute toxicity for fish is high (LC50 between 1.1 and 41 mg/L) and moderate for mammals (LD50
in mouse and rat ranging from 40 to 70 mg/kg body weight). However, a daily administration of 0.6 mg/kg to
rabbits adversely affected the survival rate. Aldrin and dieldrin mainly affect the central nervous system but
there is no direct evidence that they cause cancer in humans. The maximum residue limits in food
recommended by FAO/WHO varies from 0.006 mg/kg milk fat and 0.2 mg/kg poultry fat. Water quality
criteria between 0.1 to 18 µg/L have been published.
1.5.1.5 Endrin
Chemical Name: 3,4,5,6,9,9-Hexachloro-1a,2,2a,3,6,6a,7,7a-octahydro-2,7:3,6-dimethanonaphth[2,3-
b]oxirene (C12H8Cl6O).
CAS Number: 72-20-8
Properties: Solubility in water: 220-260 µg/L at 25 °C; vapour pressure: 2.7 x 10⁻⁷mm Hg at 25°C; log KOW:
3.21-5.34.
Discovery/Uses: It has been used since the 50s against a wide range of agricultural pests, mostly on cotton but
also on rice, sugar cane, maize and other crops. It has also been used as a rodenticide.
Persistence/Fate: Is highly persistent in soils (half-lives of up to 12 years have been reported in some cases).
Bioconcentration factors of 14 to 18,000 have been recorded in fish, after continuous exposure.
7
Toxicity: Endrin is very toxic to fish, aquatic invertebrates and phytoplankton; the LC50 values are mostly less
than 1 µg/L. The acute toxicity is high in laboratory animals, with LD50 values of 3-43 mg/kg, and a dermal
LD50 of 5-20 mg/kg in rats. Long term toxicity in the rat has been studied over two years and a NOEL of 0.05
mg/kg bw/day was found.
1.5.1.6 Heptachlor
Chemical Name: 1,4,5,6,7,8,8-Heptachloro-3a,4,7,7a-tetrahydro-4,7-methanoindene (C10H5Cl7).
CAS Number: 76-44-8
Properties: Solubility in water: 180 µg/L at 25°C; vapour pressure: 0.3 x 10⁻⁵mm Hg at 20°C; log KOW: 4.4-
5.5.
Production/Uses: Heptachlor is used primarily against soil insects and termites, but also against cotton insects,
grasshoppers, and malaria mosquitoes. Heptachlor epoxide is a more stable breakdown product of heptachlor.
Persistence/Fate: Heptachlor is metabolised in soils, plants and animals to heptachlor epoxide, which is more
stable in biological systems and is carcinogenic. The half-life of heptachlor in soil is in temperate Regions 0.75
2 years. Its high partition coefficient provides the necessary conditions for bioconcentrating in organisms.
Toxicity: The acute toxicity of heptachlor to mammals is moderate (LD50 values between 40 and 119 mg/kg
have been published). The toxicity to aquatic organisms is higher and LC50 values down to 0.11 µg/L have been
found for pink shrimp. Limited information is available on the effects in humans and studies are inconclusive
regarding heptachlor and cancer. The maximum residue levels recommended by FAO/WHO are between 0.006
mg/kg milk fat and 0.2 mg/kg meat or poultry fat.
1.5.1.7 Hexachlorobenzene
(HCB)
Chemical Name: Hexachlorobenzene (C6Cl6)
CAS Number: 118-74-1
Properties: Solubility in water: 50 µg/L at 20°C; vapour pressure: 1.09 x 10⁻⁵ mm Hg at 20°C; log KOW: 3.93-
6.42.
Discovery/Uses: It was first introduced in 1945 as fungicide for seed treatments of grain crops, and used to
make fireworks, ammunition, and synthetic rubber. Today it is mainly a by-product in the production of a large
number of chlorinated compounds, particularly lower chlorinated benzenes, solvents and several pesticides.
HCB is emitted to the atmosphere in flue gases generated by waste incineration facilities and metallurgical
industries.
Persistence/Fate: HCB has an estimated half-life in soils of 2.7-5.7 years and of 0.5-4.2 years in air. HCB has
a relatively high bioaccumulation potential and long half-life in biota.
Toxicity: LC50 for fish varies between 50 and 200 µg/L. The acute toxicity of HCB is low with LD50 values of
3.5 mg/g for rats. Mild effects of the [rat] liver have been observed at a daily dose of 0.25 mg HCB/kg bw.
HCB is known to cause liver disease in humans (porphyria cutanea tarda) and has been classified as a possible
carcinogen to humans by IARC.
1.5.1.8 Mirex
Chemical Name: 1,1a,2,2a,3,3a,4,5,5a,5b,6-Dodecachloroacta-hydro-1,3,4-metheno-1H-
cyclobuta[cd]pentalene (C10Cl12).
CAS Number: 2385-85-5
Properties: Solubility in water: 0.07 µg/L at 25°C; vapour pressure: 3 x 10⁻⁷ mm Hg at 25°C; log KOW: 5.28.
Discovery/Uses: The use in pesticide formulations started in the mid 1950's largely focused on the control of
ants. It is also a fire retardant for plastics, rubber, paint, paper and electrical goods. Technical grade
preparations of mirex contain 95.19% mirex and 2.58% chlordecone, the rest being unspecified.
Persistence/Fate: Mirex is considered to be one of the most stable and persistent pesticides, with a half-life is
soils of up to 10 years. Bioconcentration factors of 2600 and 51400 have been observed in pink shrimp and
fathead minnows, respectively. It is capable of undergoing long-range transport due to its relative volatility
(VPL = 4.76 Pa; H = 52 Pa m 3 /mol).
8
Toxicity: The acute toxicity of Mirex for mammals is moderate with an LD50 in rat of 235 mg/kg and dermal
toxicity in rabbits of 80 mg/kg. Mirex is also toxic to fish and can affect their behaviour (LC50 (96 h) from 0.2
to 30 mg/L for rainbow trout and bluegill, respectively). Delayed mortality of crustaceans occurred at 1 µg/L
exposure levels. There is evidence of its potential for endocrine disruption and possibly carcinogenic risk to
humans.
1.5.1.9 Toxaphene
Chemical Name: Polychlorinated bornanes and camphenes (C10H10Cl8).
CAS Number: 8001-35-2
Properties: Solubility in water: 550 µg/L at 20°C; vapour pressure: 3.3 x 10⁻⁵ mm Hg at 25°C; log KOW : 3.23-
5.50.
Discovery/Uses: Toxaphene has been in use since 1949 as a nonsystemic insecticide with some acaricidal
activity, primarily on cotton, cereal grains fruits, nuts and vegetables. It was also used to control livestock
ectoparasites such as lice, flies, ticks, mange, and scab mites. The technical product is a complex mixture of
over 300 congeners, containing 67-69% chlorine by weight.
Persistence/Fate: Toxaphene has a half life in soil from 100 days up to 12 years. It has been shown to
bioconcentrate in aquatic organisms (BCF of 4247 in mosquito fish and 76000 in brook trout).
Toxicity: Toxaphene is highly toxic in fish, with 96-hour LC50 values in the range of 1.8 µg/L in rainbow trout
to 22 µg/L in bluegill. Long term exposure to 0.5 µg/L reduced egg viability to zero. The acute oral toxicity is
in the range of 49 mg/kg body weight in dogs to 365 mg/kg in guinea pigs. In long term studies NOEL in rats
was 0.35 mg/kg bw/day, LD50 ranging from 60 to 293 mg/kg bw. For toxaphene exists a strong evidence of the
potential for endocrine disruption. Toxaphene is carcinogenic in mice and rats and is of carcinogenic risk to
humans, with a cancer potency factor of 1.1 mg/kg/day for oral exposure.
1.5.2 Persistent Toxic Substances Industrial Compounds
1.5.2.1 Polychlorinated biphenyls (PCBs)
Chemical Name: Polychlorinated biphenyls (C12H(10-n)Cln, where n is within the range of 1-10).
CAS Number: Various (e.g. for Aroclor 1242, CAS No.: 53469-21-9; for Aroclor 1254, CAS No.: 11097-69-
1);
Properties: Water solubility decreases with increasing chlorination: 0.01 to 0.0001 µg/L at 25°C; vapour
pressure: 1.6-0.003 x 10⁻⁶ mm Hg at 20°C; log KOW: 4.3-8.26.
Discovery/Uses: PCBs were introduced in 1929 and were manufactured in different countries under various
trade names (e.g., Aroclor, Clophen, Phenoclor). They are chemically stable and heat resistant, and were used
worldwide as transformer and capacitor oils, hydraulic and heat exchange fluids, and lubricating and cutting
oils. Theoretically, a total of 209 possible chlorinated biphenyl congeners exist, but only about 130 of these are
likely to occur in commercial products.
Persistence/Fate: Most PCB congeners, particularly those lacking adjacent unsubstituted positions on the
biphenyl rings (e.g., 2,4,5-, 2,3,5- or 2,3,6-substituted on both rings) are extremely persistent in the
environment. They are estimated to have half-lives ranging from three weeks to two years in air and, with the
exception of mono- and di-chlorobiphenyls, more than six years in aerobic soils and sediments. PCBs also have
extremely long half-lives in adult fish, for example, an eight-year study of eels found that the half-life of
CB153 was more than ten years.
Toxicity: LC50 for the larval stages of rainbow trout is 0.32 µg/L with a NOEL of 0.01 µg/L. The acute toxicity
of PCB in mammals is generally low and LD50 values in rat of 1 g/kg bw. IARC has concluded that PCB are
carcinogenic to laboratory animals and probably also for humans. They have also been classified as substances
for which there is evidence of endocrine disruption in an intact organism.
9
1.5.3 Persistent Toxic Substances Unintentional By-Products
1.5.3.1 Polychlorinated dibenzo-p-dioxins (PCDD) and Polychlorinated dibenzofurans (PCDF)
Chemical Name: PCDD (C12H(8-n)ClnO2) and PCDF (C12H(8-n)ClnO) may contain between 1 and 8 chlorine
atoms. Dioxins and furans have 75 and 135 possible positional isomers, respectively.
CAS Number: Various (2,3,7,8-TetraCDD: 1746-01-6; 2,3,7,8-TetraCDF: 51207-31-9).
Properties: Solubility in water: in the range 0.43 0.0002 ng/L at 25°C; vapour pressure: 2 0.007 x 10⁻⁶ mm
Hg at 20°C; log KOW: in the range 6.60 8.20 for tetra- to octa-substituted congeners.
Discovery/Uses: They are by-products resulting from the production of other chemicals and from the low-
temperature combustion and incineration processes. They have no known use.
Persistence/Fate: PCDD/PCDF are characterised by their lipophilicity, semi-volatility and resistance to
degradation (half life of TCDD in soil of 10-12 years) and to long-range transport. They are also known for
their ability to bio-concentrate and biomagnify under typical environmental conditions.
Toxicity: The toxicological effects reported refers to the 2,3,7,8-substituted compounds (17 congeners) that
are agonist for the AhR. All the 2,3,7,8-substituted PCDDs and PCDFs plus coplanar PCBs (with no chlorine
substitution at the ortho positions) show the same type of biological and toxic response. Possible effects include
dermal toxicity, immunotoxicity, reproductive effects and teratogenicity, endocrine disruption and
carcinogenicity. At the present time, the only persistent effect associated with dioxin exposure in humans is
chloracne. The most sensitive groups are fetus and neonatal infants.
Effects on the immune systems in the mouse have been found at doses of 10 ng/kg bw/day, while reproductive
effects were seen in rhesus monkeys at 1-2 ng/kg bw/day. Biochemical effects have been seen in rats down to
0.1 ng/kg bw/day. In a re-evaluation of the TDI for dioxins, furans (and planar PCB), the WHO decided to
recommend a range of 1-4 TEQ pg/kg bw, although more recently the acceptable intake value has been set
monthly at 1-70 TEQ pg/kg bw.
1.5.4 Regional Specific Chemicals
1.5.4.1 Hexachlorocyclohexanes
(HCH)
Chemical Name: 1,2,3,4,5,6-Hexachlorocyclohexane (mixed isomers) (C6H6Cl6).
CAS Number: 608-73-1 (-HCH, lindane: 58-89-9).
Properties: -HCH: solubility in water: 7 mg/L at 20°C; vapour pressure: 3.3 x 10⁻⁵ mm Hg at 20°C; log KOW:
3.8.
Discovery/Uses: There are two principle formulations: "technical HCH", which is a mixture of various
isomers, including -HCH (55-80%), -HCH (5-14%) and -HCH (8-15%), and "lindane", which is essentially
pure -HCH. Historically, lindane was one of the most widely used insecticides in the world. Its insecticidal
properties were discovered in the early 1940s. It controls a wide range of sucking and chewing insects and has
been used for seed treatment and soil application, in household biocidal products, and as textile and wood
preservatives.
Persistence/Fate: Lindane and other HCH isomers are relatively persistent in soils and water, with half lives
generally greater than 1 and 2 years, respectively. HCH are much less bioaccumulative than other
organochlorines because of their relatively low lipophilicity. On the contrary, their relatively high vapour
pressures, particularly of the -HCH isomer, determine their long-range transport in the atmosphere. BCF for
lindane is 1400.
Toxicity: Lindane is moderately toxic for invertebrates and fish, with LC50 values of 20-90 µg/L. The acute
toxicity for mice and rats is moderate with LD50 values in the range of 60-250 mg/kg. Lindane was found to
have no mutagenic potential in a number of studies but endocrine disrupting activity.
1.5.4.2 Polycyclic Aromatic Hydrocarbons (PAHs)
Chemical Name: PAHs are a group of compounds consisting of two or more fused aromatic rings.
CAS Number: Various
Properties: Solubility in water: 0.00014 -2.1 mg/L at 25şC; vapour pressure: from 0.0015 x 10⁻⁹ to 0.0051
10
mmHg at 25°C; log KOW: 4.79-8.20
Discovery/Use: Most of these are formed during incomplete combustion of organic material and the
composition of PAHs mixture vary with the source(s) and also due to selective weathering effects in the
environment.
Persistence/Fate: Persistence of the PAHs varies with their molecular weight. The low molecular weight
PAHs are the most easily degraded. The reported half-lives of naphthalene, anthracene and benzo(e)pyrene in
sediment are 9, 43 and 83 hours, respectively, whereas for higher molecular weight PAHs, their half-lives are
up to several years in soils/sediments. The BCFs in aquatic organisms frequently range between 100-2000 and
it increases with increasing molecular size. Due to their wide distribution, the environmental pollution by PAHs
has aroused global concern.
Toxicity: The acute toxicity of low PAHs is moderate with an LD50 of naphthalene and anthracene in rat of 490
and 18000 mg/kg body weight respectively, whereas the higher PAHs exhibit higher toxicity and LD50 of
benzo(a)anthracene in mice is 10mg/kg body weight. In Daphnia pulex, LC50 for naphthalene is 1.0 mg/L, for
phenanthrene 0.1 mg/L and for benzo(a)pyrene is 0.005 mg/L. The critical effect of many PAHs in mammals is
their carcinogenic potential. The metabolic action of these substances produce intermediates that bind
covalently with cellular DNA. IARC has classified benz[a]anthracene, benzo[a]pyrene, and
dibenzo[a,h]anthracene as probable carcinogenic to humans. Benzo[b]fluoranthene and indeno[1,2,3-c,d]pyrene
were classified as possible carcinogens to humans.
1.5.4.3 Polybrominated Diphenyl Ethers (PBDE)
Chemical Name: Polybrominated diphenyl ethers (C12H(10-n)BrnO, where n = 1-10). As in the case of PCBs the
total number of congeners is 209, with a predominance in commercial mixtures of the tetra-, penta- and octa-
substituted isomers.
CAS Number: Various (PeBDE: 32534-81-9; OBDE: 32536-52-0; DeBDE: 1163-19-5)
Properties: Solubility in water: 0.9 ng/L at 25°C (PeBDE); vapour pressure: 3.85 x 10⁻³ to <10-7 mmHg at 20-
25 °C; log KOW: 4.28 - 9.9.
Discovery/Uses: Since the 1960's, three commercial PBDE formulations have been in production. The
pentabrominated product is used principally to flame retard polyurethane foams in furniture, carpet underlay
and bedding. Commercial octa is a mixture of hexa- (10-12%), hepta- (44-46%), octa- (33-35%) and
nonabromodiphenyl (10-11%) ethers. It is used to treat a wide variety of thermoplastics and is recommended
for injection moulding applications such as high impact polystyrene (HIPS). The deca product (a single
congener) is used predominantly for textiles and denser plastics such as housings for a variety of electrical
products in particular TVs and computers.
Persistence/Fate: Data on environmental fate, although limited, suggest that biodegradation is not an important
degradation pathway, but that photodegradation may play a significant role. They have already been found in
high concentrations in marine birds and mammals from remote areas. The half-lives of PBDE components in rat
adipose tissue varies between 19 and 119 days, the higher values being for the higher brominated congeners.
Toxicity: The available data suggest that the lower (tetra- to hexa-) PBDE congeners are likely to be
carcinogens, endocrine disruptors, and/or neurodevelopmental toxicants. Studies in rats with commercial
PeBDE indicate a low acute toxicity via oral and dermal routes of exposure, with LD50 values > 2000 mg/kg
bw. In a 30-day study with rats, effects on the liver could be seen at a dose of 2 mg/kg bw/day, with a NOEL at
1mg/kg bw/day. The toxicity to Daphnia magna has also been investigated with a reported LC50 of 14 µg/L and
a NOEC of 4.9 µg/L. Although data on toxicology is limited, they have potential endocrine disrupting
properties, and there are concerns over the health effects of exposure.
1.5.4.4 Pentachlorophenol
(PCP)
Chemical Name: Pentachlorophenol (C6Cl5OH).
CAS Number: 87-86-5.
Properties: Solubility in water: 14 mg/L at 20°C; vapour pressure: 16 x 10-5 mm Hg at 20°C; log KOW: 3.32
5.86.
Discovery/Uses: It is used as insecticide (termiticide), fungicide, non-selective contact herbicide (defoliant)
and, particularly as wood preservative. It is also used in anti-fouling paints and other materials (e.g. textiles,
11
inks, paints, disinfectants and cleaners) as inhibitor of fermentation. Technical PCP contains trace amounts of
PCDD and PCDF
Persistence/Fate: The rate of photodecomposition increases with pH (t1/2 100 h at pH 3.3 and 3.5 h at pH 7.3).
Complete decomposition in soil suspensions takes >72 days, other authors reports half-life in soils of 23-178
days. Although enriched through the food chain, it is rapidly eliminated after discontinuing the exposure (t
1/2 =
10-24 h for fish). Highest measured BCF was 771.
Toxicity: It has been proven to be acutely toxic to aquatic organisms and have certain effects on human health
at very low concentrations. The 24-h LC50 values for trout were reported as 0.2 mg/L, and chronic toxicity
effects were observed at concentrations down to 3.2 µg/L. Mammalian acute toxicity of PCP is moderate-high.
LD50 oral in rat ranging from 50 to 210 mg/kg bw have been reported. LC50 ranged from 0.093 mg/L in
rainbow trout (48 h) to 0.77-0.97 mg/L for guppy (96 h) and 0.47 mg/L for fathead minnow (48 h).
1.5.4.5 Organic Mercury Compounds
Chemical Name: The main compound of concern is methyl mercury (HgCH3).
CAS Number: 22967-92-6
Properties: Solubility in water: 0.1 g/L at 21°C (HgCH3Cl) and 1.0 g/L at 25şC (Hg(CH3)2); vapour pressure:
8.5 x 10⁻³ mm Hg at 25°C (HgCH3Cl); log KOW: 1.6 (HgCH3Cl) and 2.28 (Hg(CH3)2).
Production/Uses: There are many sources of mercury release to the environment, both natural (volcanoes,
mercury deposits, and volatilisation from the ocean) and human-related (coal combustion, chlorine alkali
processing, waste incineration, and metal processing). It is also used in thermometers, batteries, lamps,
industrial processes, refining, lubrication oils, and dental amalgams. Methyl mercury has no industrial uses; it is
formed in the environment by methylation of the inorganic mercurial ion mainly by microorganisms in the
water and soil.
Persistence/Fate: Mercury released into the environment can either stay close to its source for long periods, or
be widely dispersed on a Regional or even world-wide basis. Not only are methylated mercury compounds
toxic, but highly bioaccumulative as well. The increase in concentration of mercury as it transfers through the
aquatic food chain results in relatively high levels of mercury in fish consumed by humans. Ingested elemental
mercury is only 0.01% absorbed, but methyl mercury is nearly 100% absorbed from the gastrointestinal tract.
The biological half-life of mercury is 60 days.
Toxicity: Long-term exposure to organic mercury can permanently damage the brain, kidneys, and developing
fetus. The most sensitive target of low level exposure to metallic and organic mercury following short or long
term exposures appears to be the nervous system.
1.5.4.6 Organic Tin Compounds
Chemical Name: Organotin compounds comprise mono-, di-, tri- and tetrabutyl and triphenyl tin compounds.
They conform to the following general formula (n-C4H9)nSn-X and (C6H5)3Sn-X, where X is an anion or a
group linked covalently through a hetero-atom.
CAS Number: 56-35-9 (TBTO); 76-87-9 (TPTOH)
Properties: Solubility in water: 4 mg/L (TBTO) and 1 mg/L (TPTOH) at 25°C and pH 7; vapour pressure: 7.5
x 10-7 mm Hg at 20°C (TBTO) 3.5 x 10⁻⁸ mmHg at 50şC (TPTOH); log KOW: 3.19 - 3.84. In sea water and
under normal conditions, TBT exists as three species in seawater (hydroxide, chloride, and carbonate).
Discovery/Uses: They are mainly used as antifouling paints (tributyl and triphenyl tin) for underwater
structures and ships. Minor identified applications are as antiseptic or disinfecting agents in textiles and
industrial water systems, such as cooling tower and refrigeration water systems, wood pulp and paper mill
systems, and breweries. They are also used as stabilizers in plastics and as catalytic agents in soft foam
production. It is also used to control the shistosomiasis in various parts of the world.
Persistence/Fate: Under aerobic conditions, TBT takes 1 to 3 months to degrade, but in anaerobic soils may
persist for more than 2 years. Because of the low water solubility it binds strongly to suspended material and
sediments. TBT is lipophilic and tends to accumulate in aquatic organisms. Oysters exposed to very low
concentrations exhibit BCF values from 1000 to 6000.
Toxicity: TBT is moderately toxic and all breakdown products are even less toxic. Its impact on the
environment was discovered in the early 1980's in France with harmful effects in aquatic organisms, such as
12
shell malformations of oysters, imposex in marine snails and reduced resistance to infection (e.g. in flounder).
Molluscs react adversely to very low levels of TBT (0.06-2.3 µg/L). Lobster larvae show a nearly complete
cessation of growth at just 1.0 µg /L TBT. In laboratory tests, reproduction was inhibited when female snails
exposed to 0.05-0.003 µg /L of TBT developed male characteristics. Large doses of TBT have been shown to
damage the reproductive and central nervous systems, bone structure, and the liver bile duct of mammals.
1.6 DEFINITION OF THE CENTRAL AND NORTH EAST ASIA REGION
The Central and North East Asia Region consists of the 11 countries: China, Japan, Republic of Korea,
Democratic People's of Korea, Mongolia, Russian Federation and the five Commonwealth of Independent
States (CIS)- Kazakhstan, Kyrgyzstan, Tajikistan, Turkmenistan, and Uzbekistan. China and the Russian
Federation are two of the world's largest countries. The total population in the Region is estimated to be about
1.6 billion, a quarter of the world population. Agricultural activity is extensive in the Region and is an
important factor which may cause pesticide over usage, water pollution and water management problems.
China China is the third largest country in the world with a land area of 9.6 million km2. The land border is
22800 km long, and the coastline is 18000 km long. It is located approximately between latitudes 4şN - 53şN
and longitudes 73şE 135şE. It has the largest population in the world estimated to be 1.3 billion in July 2001
(excluding Taiwan province and Jinmen, Mazu Island of Fujian province which has a population of 22.3
million).
Since the start of the policy of economic reform and opening to the outside world in 1978, China's economy
has grown remarkably by positively affecting the agricultural and industrial sectors. Agricultural output
doubled in the 1980's, and industry expanded. The gross domestic product (GDP) was approximately 9600
billion in 2001. The major industries include metallurgy (iron, steel), coal, crude oil, machinery, textiles,
cement, chemicals, and electronics.
Hong Kong Special Administrative Region (SAR) and Macau SAR both have the power of self-governing
directly under the central government of China, according to the policy of "one country, two systems".
Japan Japan is a technologically advanced country consisting of a chain of islands located on the western edge
of the North Pacific Ocean east of the Korean Peninsula. The islands occupy a total area of approximately
380000 km2 consisting of approximately 374744 km2 land and 3091 km2 water. It is located approximately
between latitudes 27şN - 42şN and longitudes 130şE 148şE. Its population is 126.8 million (July 2001
estimate).
Japan lacks natural resources and imports most of its raw materials. It is strong in manufacturing and its major
industries include automobile production, chemical industry, cement, electrical and electronic equipment,
fertilisers, fisheries, food processing, forestry, iron and steel, non-ferrous metals, oil refining, petrochemicals,
ship building and textiles. Japan is limited in arable land area and imports a high percentage of its food from
abroad.
Republic of Korea Republic of Korea is located at the southern half of the Korean Peninsula. It shares a 238
km border with the Democratic People's Republic of Korea. Its total area is 98480 km2 comprising of 98190
km2 land and 290 km2 water. It is located approximately between latitudes 33şN - 38şN and longitudes 126şE -
129şE. The population is 47.9 million (July 2001). Natural resources in Republic of Korea include coal,
tungsten, graphite, molybdenum, lead and hydropower potential. Its major industries include shipbuilding,
automobile production, machinery, electronics, chemicals, steel, textiles, and food processing.
Democratic People's Republic of Korea The Democratic People's Republic of Korea (DPRK) is located at
the northern half of the Korean Peninsula between China and Republic of Korea. Its total area is 120540 km2
comprising of 120410 km2 land and 130 km2 water. It is located approximately between latitudes 35şN - 41şN
and longitudes 124şE 130şE. The population is 21.97 million (July 2001). DPRK is a highly-centralised
Communist country that faces desperate economic conditions. In recent years, DPRK has experienced lower
crop production and other economic difficulties resulting in serious shortages of food, electrical power, clean
water and medicine. The population remains vulnerable to prolonged malnutrition and deteriorating living
conditions. Industry includes military products, machine building, electric power, and chemicals.
Russian Federation The Russian Federation is the largest country in the world. It borders the Arctic Ocean and
is located between Europe and the North Pacific Ocean. The area of the entire country is 17,075,200 km2
comprising of 16,995,800 km2 land and 79400 km2 water, however, the entire country is not included in Region
13
VII. The physical area of the Russian Federation that is included in Region VII is located approximately
between latitudes 43şN and 66şN (the southern limit of the Arctic Circle) and longitudes 46şE 166şE and
occupies approximately 9,767,000 km2. The northern part and the western part of the Russian Federation are
included in the Regional assessments of Region I (Arctic) and Region III (Europe), respectively. The
population of the whole Russian Federation is approximately 145 million (July 2001 estimate).
The section of Russian Federation can be divided into three broad geographic Regions: namely the European
part which includes the territory lying west of the Ural Mountains (the European part accounts for a small
section in Region VII; Siberia, stretching east from the Urals; and the Far Eastern part which includes the
extreme southeast and the Pacific coast. The Asian Region of Russia refers to Siberia and the Far East.
Its natural resource base includes major deposits of oil, natural gas, coal, many strategic minerals, and timber.
Russian Federation is a leading exporter of gas and oil. Major industries include all forms of machine building
from rolling mills to high-performance aircraft and space vehicles; shipbuilding; road and rail transportation
equipment; communications equipment; agricultural machinery, tractors, and construction equipment; electric
power generating and transmitting equipment.
Mongolia Mongolia is the seventh largest country in Asia and the 18th largest in the world. It is a land-locked
country bordered by Russian Federation to the north and China to the east, south, and west. Mongolia covers an
area of 1,566,500 km2 and is located approximately between latitudes 40şN - 53şN and longitudes 88şE 119
şE. The population is 2,654,600 (2000). The Mongolian economy is relatively diversified. Agriculture accounts
for close to 25.7 % of gross domestic product (GDP), industry and construction for 25.5 % (2001). The country
has one of the world's highest ratios of livestock to people. In 1998, for example, the ratio of sheep to people
was 5 to 1. Mining, mainly copper, provides an estimated 44.2 % of the economy's export earnings (2001).
Leading industries include copper, processing of animal products, building materials, food and beverages, and
coal mining. There are sizeable reserves of copper, gold, coal and other minerals. Prospects for petroleum in
commercial quantities are encouraging.
Kazakhstan The Republic of Kazakhstan is the second largest of the Commonwealth of Independent States
(and the 9th largest country in the world) which gained independence from the former Soviet Union on 16
December 1991. It is a land-locked State with an area of 2,756,000 km2 (land: 2,669,800 km2; water bodies: 47,
500 km2). The Russian Federation borders Kazakhstan on the west and north, China lies to the east,
Kyrgyzstan, Uzbekistan, and Turkmenistan lie to the south, and the Caspian Sea joins Russia on the west. It is
located approximately between latitudes 40şN - 55şN and longitudes 45şE 87şE. The country is divided into
14 oblasts, 160 districts and 2276 village okrugs. It has a population of 14.8 million (2000). Kazakhstan borders
the Aral Sea, split into two bodies of water, and the Caspian Sea on the western boundary. Kazakhstan is a
large agricultural producer (livestock and grain). Agricultural areas comprise of 2.2 million km2 . Leading
industries consists of extractive industries (oil, coal, iron ore, manganese, chromite, lead, zinc, copper, titanium,
bauxite, gold, silver, phosphates, sulphur), iron and steel, nonferrous metal, tractors and other agricultural
machinery, electric motors, and construction materials. Kazakhstan faces potentially severe health and
environmental problems from the legacy of the Cold War. High levels of radiation have resulted from the
dismantling of nuclear weapons factories, and from years of nuclear testing. Industrial pollution is heavy in
many cities. The fisheries of the Aral Sea have been seriously affected by irrigation projects, which have also
increased soil erosion and salinisation.
Kyrgyzstan Kyrgyzstan is a land-locked country whose neighbours are Kazakhstan to the north, China to the
east, China and Tajikistan to the south and Uzbekistan to the west. It occupies a total area of 198500 km2
comprising of 191300 km2 land and 72400 km2 water. It is located approximately between latitudes 39şN - 43şN
and longitudes 69şE 91şE. It has a population of 4.75 million (July 2001). Kyrgyzstan is a small, mountainous
country whose economy is undergoing transition. Its economy relies mainly on agriculture. There are about
101,000 km2 of arable land used as pastures and growing of crops (including cotton, sugar beet, vegetables,
tobacco, grain). Agriculture contributes to almost 50% of the Gross Domestic Product (Pak et al., 2002).
Cotton, potatoes, wool, and meat are the main agricultural products and exports. Industries include small
machinery, textiles, food processing, cement, refrigerators, furniture, electric motors, gold, and rare earth
metals.
Tajikistan Tajikistan is a land-locked country located in Central Asia, west of China. It is the southern most
republic of the former Soviet Union. Its bordering countries are Afghanistan, China, Kyrgyzstan, and
Uzbekistan. It occupies a total area of 143100 km2 comprising of 142700 km2 land and 400 km2 water. It is
located approximately between latitudes 35şN - 39şN and longitudes 68şE 75şE. It has a population of 6.13
14
million (July 2001 estimate). Tajikistan has the lowest per capita GDP among the 15 former Soviet republics.
Cotton is the most important crop. Before independence from the Soviet Union, the area relied on the textile
industry and concentrated on cotton production. Now, industry consists only of aluminum plants, hydropower
and mining facilities, and small obsolete factories mostly in light industry and food processing (CIA, 2001).
Turkmenistan Turkmenistan, with a population of 4.6 million (July 2001), is located in the west of Central
Asia, bordering the Caspian Sea, Afghanistan, Iran, Kazakhstan and Uzbekistan. It occupies a total area of
488100 km2 (CIA, 2001). It is located approximately between latitudes 32°N - 41°N and longitudes 51°E - 68°E.
Turkmenistan is largely desert country whereby approximately 350000 km2 is occupied by the waterless
Karakum Desert (rainfall occurs once every several years). However, intensive agriculture occurs in irrigated
oases. Only 2.5% of Turkmenistan is arable with the only significant agriculture along the banks of the
Amudarya River, which runs along the eastern edge of the Karaku. Water is carried along the 1100 km long
Lenin Canal from the Amu river to the capital, Ashkhabad. One-half of its irrigated land is planted with cotton,
making it the world's tenth largest producer. Turkmenistan is the fifth largest in gas reserves in the world and
also has large oil resources (CIA, 2001). The seabed of the Caspian Sea is believed to be the world's largest oil
deposits. A Caspian summit to be held in Turkmenistan is planned for 2002 to discuss how the resources of the
Caspian Sea is to be used among the five littoral countries (Anon, 2002). Industry comprises of cotton mills,
sulphur, super-phosphate and other chemical processing plants.
Uzbekistan Uzbekistan is a land-locked country located in Central Asia bordered by Afghanistan, Kazakhstan,
Kyrgyzstan, Tajikistan, and Turkmenistan. It occupies a total area of 447400 km2 comprising of 425400 km2
land and 22000 km2 water. It is located approximately between latitudes 35şN - 43şN and longitudes 57şE
74şE. Uzbekistan includes the southern portion of the Aral Sea with a 420 km shoreline. The independent state
has a population of 25.2 million (July 2001). Ten percent of Uzbekistan consists of intensely cultivated,
irrigated river valleys. Uzbekistan is now the world's third largest cotton exporter, a large producer of gold and
oil, and a Regionally significant producer of chemicals and machinery. Previously, during the Soviet era,
intensive production of "white gold" (cotton) and grain led to overuse of agrochemicals and the depletion of
water supplies. Independent since 1991, the country seeks to gradually lessen its dependence on agriculture
while developing its mineral and petroleum reserves (CIA, 2001).
1.7 PHYSICAL
SETTING
Region VII includes continental landmass, several major islands and various bodies of water. The continental
landmass is characterised by a hilly, often mountainous landscape, rolling plains, and deserts.
The proportions of the varied topography of China are: mountainous regions (33%), plateaus (26%), basins
(19%), plains (12%), and hills (10%) (China Today, February 1996). There are several major mountain systems
within the Region. In China, the Qinghai-Tibet Plateau averages more than 4000 m above sea level with Mt.
Qomolangma, the world's highest peak (8848 m) and the main peak of the Himalayas. In the Republic of
Korea, two major mountain ranges run as a spine down the peninsula close to the eastern coastline.
In the Democratic People's Republic of Korea, about 80% of land area is moderately high mountains separated
by deep, narrow valleys and small, cultivated plains. The remainder is lowland plains covering small, scattered
areas. South-east of the West Siberian Plain of the Russian Federation, a series of mountains and plateau make
up a high mountains system Altai (maximum elevation of 4506 m Mount Belukha) and Sayan Mountains
(maximum elevation of 3491 m near Hoevsgoel-Nuur Lake). The Altai Mountains fringe the east border of
Kazakhstan.
Two great Central Asian mountain systems--the Tian Shan and the Pamirs that generally run east to west also
dominate the landscape. Kyrgyzstan is almost completely mountainous and is subject to major earthquakes. The
country lies at the juncture of the Tian Shan (northeast) and the Pamirs (Pamiro-Alai mountains at southwest).
The highest elevation in Kyrgyzstan reaches 7439 m Pik Pobedy. More than half of the republic's territory
lies at an elevation higher than about 2500 m. More than 90 % of Tajikistan is occupied by mountains, and
almost half of the Republic lies at an elevation of 3000 m or higher.
Eastern Tajikistan includes the mountainous Pamirs Region. Ismail Samani Peak (7495 m), the highest
mountain in the former USSR, towers over northeast Tajikistan. In Turkmenistan, foothills and mountains,
some of which exceed 3100 m, rise along the country's southern (mainly Kopetdag Gershi and Paropamisus
Range) and easternmost borders.
In Uzbekistan, branches of the Tian Shan and Pamirs (Gissar-Altai) mountains rise in the southeast and
15
northeast, with the highest elevation in Uzbekistan reaching 4643 m. East of 43şE, are the relatively low Ural
Mountains of the Russian Federation. The highest elevation is in the north at Mount Narodnaya (People's
Mountain), at 1894 m.
There is also volcanic activity within the Region. On the Kamchatka Peninsula located on the far east of the
Russian Federation, 23 of the 120 volcanoes are currently active. The highest cone, Mount Klyuchevskaya,
reaches an elevation of 4750 m. This volcanic mountain chain continues southward in the Kuril Islands in the
North Pacific Ocean.
On the east coast of China running from north to south are the Northeast Plain, the North China Plain and the
Middle-Lower Reaches of the Yangtze River Plain. Rolling plains with an average elevation of 180 m can be
found in the European section of the Russian Federation. The southern border of the European section includes
the Caspian Lowland with an average depression of -20 metres.
East of the Ural Mountains, the plain Region continues, entering Siberia in the West Siberian Plain, an
expansive and poorly drained flat area that is generally marshy or swampy. East of the Yenisey River is the
rolling upland of the Central Siberian Plateau. Elevations here average about 500 to 700 m, and reaches a
maximum in the south at Yeniseysky Kryazh at 1104 m. Rivers in this Region have dissected or eroded the
surface and in some places have formed deep canyons. South-east of the Lena River, a series of mountains,
basins and plateau make up the South Siberian Uplands. The main highlands are Aldanskoye Nagorye
(maximum elevation of 2264 m), Stanovoye Nagorye (maximum elevation of 3073 m).
The Region's higher ranges, such as the Stanovoy Khrebet (maximum elevation of 2412 m) and Yablonevyy
Range, generally reach maximum elevations of about 2000 to 3000 m. Kazakhstan is a vast, generally low-
lying plain (mainly part of Caspian and Turan Depressions in the west, Kirgiz Steppe in center and south
border of Western Siberian Lowland in the north). The Vpadina Karagiye (Karagiye Depression) is 132 m
below sea level. Most of Turkmenistan is made up of plains, nearly all of which are occupied by the Garagum
Desert and its oases. Four-fifths of the country lies at an elevation of about 500 meters or less. The Vpadina
Akdzhakaya, located in the north central part of the country, is the lowest point in the republic at about 81
meters below sea level. Sandy desert plains make up most of Uzbekistan. The north central part of the republic
is occupied by the Qyzylqum Desert (in borders of Turan Depression), one of the largest deserts in the world
and the second largest of the former USSR. The Gobi, a huge desert Region, covers a wide arid tract in central
and southeast Mongolia.
Japan consists of four main islands Honshu, Hokkaido, Shikoku, and Kyushu and several smaller islands. It
is a highly mountainous Region, with 75 to 80% being covered by mountains. Since the country rests on the
boundaries of the Philippine, Pacific and Eurasian plates, it is prone to earthquakes. It has 188 volcanoes, 40 of
which are active.
Bodies of water within the Region include the Pacific Ocean, various seas, rivers, and lakes. Three of the
longest rivers are the Yangtze River (6300 km) and Yellow River (5464 km) in China, and the Ob River in the
Russian Federation. The largest lakes are the Aral Sea (33800 km) in Kazakhstan and Uzbekistan, Lake Baikal
(31500 km2) in Russian Federation, and Lake Balkhask (18428 km2) in Kazakhstan. The Caspian Sea (394299
km2) lies outside the Region and borders Russian Federation, Kazakhstan, and Turkmenistan.
Region VII lies between 4şN and 66şN. In general, the southern most countries experience a temperate climate.
Monsoon and humid climates dominate the eastern part of China, however, the northwestern part is arid due to
wind erosion and drought, and the Qinghai-Tibet Highland region can be found blanketed by frost. The Russian
Federation encompasses several distinct climate zones.
In general, the climate is temperate and can be divided into four broad climatic zones. The first zone of
temperate-continental climate (TCC) averages -17°C in January and +18°C in July (extends from west border
of the country to the West-Siberian Plain, including Ural Mountains) Region of taiga with high humidity in
the north and a Region of mixed forests and forest-steppes with average humidity. The second zone of
continental climate (CC)(-20°C in January and +18°C in July), covers the West-Siberian Plain Region of
taiga and forest-steppes with average humidification. The third zone of extreme continental climate (ECC),
covers the Central Siberian Plateau, Altai, Sayan Mountains, Buryatiya, Chita Region and Lena Aldan rivers
basins
The coldest winter temperatures occur in eastern Siberia. During January, temperatures average -32°C which
can plummet to -64°C (Yakutsk, and -54°C in Chita). During July, temperatures average +24°C (maximum
+39°C). The far eastern part experiences maritime and monsoon climates of mixed forest (MMC) averages -
16
12°C in January and +15°C in July (including Kamchatka Peninsula, Sakhalin and Kuril Islands) zones. Close
to the Arctic Circle border, the climate is subarctic climate zone.
The CIS countries experience a continental climate whereby there are noticeable temperature differences during
the winter and summer months. In January, the average daily temperature is usually below -1°C dropping to -
27°C at higher elevations (such as in Kyrgyzstan), while the average daily temperature in July is approximately
26°C. Precipitation is a few hundred millimeters per year. Due to the high elevation of some of the countries,
glaciers and permanent snowfields can be found. In Kyrgyzstan, they cover more than 3 % of the total land
area.
1.8 PATTERNS OF DEVELOPMENT/SETTLEMENT
The majority of the population is concentrated in the eastern half of the Region particularly along the east coast.
The population density is greatest in the coastal region of China. In the Republic of Korea, since 70 % of the
land is mountainous, the population is concentrated in the lowlands in the northern part of the country and in
the southern end. The lower latitudes of Japan are more densely populated than the upper latitudes.
The average population density of the Russian Federation in Region VII is approximately 6.8 persons/km2 ,
however, as 57% of the population lives on only 13% of the land, the average density is 30.5 persons/km2. The
country of Kazakhstan is sparsely populated with a density of 5.5 persons/km2. The maximum density of 17
persons/km2 can be found in the irrigated agricultural southern districts of the country in Almaty and South
Kazakhstan oblasts. A map of Region VII is shown below in Figure 1.1:
17
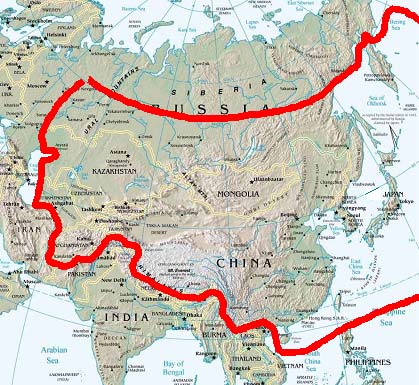
Figure 1.1: Map of Region VII
Region VII
18
2 SOURCE
CHARACTERISATION
2.1 BACKGROUND INFORMATION TO PTS SOURCES
Persistent toxic substances (PTS) have received worldwide attention. They are organochlorine compounds
(chlorinated hydrocarbons) that are characterised by low water solubility, high lipophilicity, and are both toxic
and persistent in the environment. The PTS that are considered for Region VII are comprised of pesticides,
industrial compounds and unintentional by-products. The production and usage of these pesticides and
industrial compounds and the production and emissions of unintentional by-products have resulted in the
ubiquitous distribution of these toxic substances throughout the earth's ecosphere, consequently causing
adverse impact on the environment and to living organisms.
The use of synthetic organic pesticides has been, and still is in many parts of the world, a necessity for the
control of pests and also for disease control. This is true for Region VII. These chemicals are effective as
pesticides, but they also have inherent properties which cause health and environmental impacts. Pesticides are
toxicants which are capable of affecting many types of biota, including nontarget organisms. Many pesticides
need to be resistant to environmental degradation such that they can persist in treated areas and thus enhance
their effectiveness, however, this also promotes long-term effects in natural ecosystems (Connell and Miller,
1984). In Region VII, most PTS pesticides are derived from agricultural practices.
The industrial compounds have introduced technological innovation and benefits to industries and thus have
been significantly produced in some countries of the Region. Unintentional by-products result from
anthropogenic sources, such as during the manufacture of pesticides and industrial compounds, and incineration
processes.
PTS affect the environment and human health in several ways. Since many PTS have a high affinity for soil and
are hence retained in this environmental medium, the PTS may be taken up by crops and by grazing animals
and finally reach the human food chain. The contaminants may also be transported during run-off from land
into watercourses. In areas that are characterised by heavy rainfall, soil erosion can be severe and eroded soils
may therefore cause significant pollution of waterways. Weak and ineffective control of emissions by industries
and lack of stringent control by governments have also contributed to the global pollution of the environment
by PTS.
In order to assess the extent of the impact that persistent toxic substances has on the Central and North East
Asia Region, it is necessary to trace the life cycle of the chemicals from its initial introduction into the
environment to their transport fate within the Region. For pesticides and industrial chemicals, the source into
the environment could be from its production, its use, or import into the Region. Thus, it may be important to
determine the location of the production facilities and the quantity of chemicals being produced, as well as
where and how they are used or stored. For unintentional by-products, the source will be due to the process
responsible for its unintentional production and emission. Therefore, it is important to identify how they are
produced and how much are produced and emitted.
2.1.1 Scoring of PTS
As mentioned in the methodology section of Chapter 1, a scoring mechanism was utilised as a tool to prioritise
the 18 selected persistent toxic substances of Region VII according to sources and source data gaps. Detailed
instructions for scoring can be found in the Annex 1. The scoring results based on a collective effort of all the
participants of the 1st Technical Workshop held in Tokyo, Japan, have been prioritised according to level of
concern and data gaps and are listed in Table 2.1.
In interpreting the scores, it is important to note that different scores for chemicals indicate that the chemicals
are of different levels of concern. For example, a chemical having a source score of `2' is a chemical of
Regional concern compared to a chemical having a source score of `1' indicating a chemical of local concern.
The scoring system does not provide any information on the ranking or prioritisation of chemicals having the
same source scores. In the following table (Table 2.1), the chemicals have been grouped according to score, but
they are not ranked within each group.
19
Table 2.1 Scoring for Prioritising PTS for Sources and Data Gaps
Chemicals Sources Data
Gaps
PCDD
2 2
PCDF
2 2
PCBs
2 2
PAHs
2 2
DDT
2 1
HCH
2 1
PCP
1 2
Org Hg Cmpds
1
2
PBDE
1 2
HCB
1 2
Org Tin Cmpds
1
1
Toxaphene
0 1
Heptachlor
0 1
Aldrin
0 1
Chlordane*
1 1
Dieldrin
0 1
Endrin
0 1
Mirex
0 1
Score=0 chemical is of no concern/supportive data is collected
Score=1 chemical has local concern/supportive data is limited
Score=2 chemical has Regional concern/supportive data is lacking
*During the 1st Technical Workshop, chlordane was given a score of `0', however upon the collection of further information on
chlordane and discussions during the Regional Priority Setting Meeting, the score was later revised to `1'.
The results of the scoring exercise indicate that PCDD, PCDF, PCBs, PAHs, DDT and HCH are chemicals of
Regional concern. This means that there is either a) a major production of the chemical for local and export use,
b) evidence of the chemical as a contaminant in large scale production of other chemicals, c) known emissions
of the chemical from large scale incinerators or chlorine bleaching of pulp or other related combustion
facilities, d) evidence of leakage from major stockpiles of the chemical, e) large-scale use of the chemical
throughout the Region, and/or f) spatial and /or temporal trends increasing Regionally from levels above
threshold.
With regards to data gaps, there is insufficient and/or unreliable data on 8 of the 18 chemicals. These chemicals
are mainly industrial chemicals (PCBs, PBDE, HCB) and unintentional by-products (PCDD/PCDF, PAHs).
There is also insufficient information available for PCP and organomercury compounds.
The sources including production, use and emissions of the 18 persistent toxic substances and the availability of
supportive data are described in the following section.
20
2.2 PRODUCTION, USE AND EMISSION
2.2.1 Persistent Toxic Substances - Pesticides
Pesticides are still being manufactured and applied within the Region. In the Commonwealth of Independent
States (CIS) countries, the application of pesticides and agricultural chemicals has been a serious issue. For
example, in Tajikistan, economic recession had previously resulted in the scarcity of seeds for the growing of
crops thus leading to the import of seeds from abroad. However, as significant amounts of seeds were not
adaptable to the local environment, they became vulnerable to diseases and agricultural pests. Consequently,
more pesticides than usual have been applied to protect the crops. Pesticide load in some areas of Tajikistan
ranged from 120 2680 kg/km2 and even reached 4800 kg/km2 for cotton fields (Ministry for Nature Protection
Republic of Tajikistan, 2000). In addition, before independence from the Soviet Union, Tajikistan concentrated
on cotton production to support its textile industry. DDT and various pesticides were heavily used to protect the
crops.
In the CIS countries and in the Russian Federation, obsolete pesticides are a significant problem. Often
cataloguing and documentation procedures of pesticides are inadequate or non-existent, as is the case for
pesticides located at the Sakhalin Oblast and the Primorski Krai of the Russian Federation. Monitoring of
obsolete pesticides are also lacking, therefore the locations of inconsistent burial of obsolete pesticides and their
quantities are not always known. The burial of obsolete pesticides, such as in Kyrgyzstan, has also led to
leakage and exposure of pesticides to the atmosphere. Some measures are known to have been taken in the past
to maintain banned pesticides in underground facilities which consisted of trenches and ferro-concrete bunkers..
In 1973 and 1980, 764 t and 255 t, respectively, of DDT, aldrin, and HCH were stored in such facilities in the
Kurg-Ukok and Tash-baka Kungey Regions of Kyrgyzstan (Pak et al., 2002). In other areas of Kyrgyzstan,
there is about 227 t of prohibited and deteriorated pesticides (Shakirov et al., 2002a). Due to poor control over
chemical imports into some of the countries of Region VII, large volumes of banned chemicals with expired
validity dates have been imported into the Region.
Currently, in Uzbekistan, banned and obsolete pesticides kept in storehouses amount to approximately 1433 t.
Of these, 118 t are organochlorine pesticides. Out-of-date pesticides are non-uniformly distributed across the
territory whereby greatest stocks (1022 t) are found in the Surkhandarya and Kashcadarya areas in southern
Uzbekistan. More than 15,000 t of banned and obsolete pesticides have been kept in special underground
facilities (made of ferro-concrete) since 1972. There are 14 such facilities in Uzbekistan occupying more than
0.6 km2. Environmental monitoring is conducted to control them. Open, unsealed facilities also exist in the
country posing a negative impact on the surrounding environment. During the 1980s when cotton monoculture
was dominant in Uzbekistan, aerial spraying was widely used to protect cotton and defoliation. Presently, there
are 461 former agriculture aerodromes on the territory of Uzbekistan, which occupy 45 km2. Soil pollution
levels at these aerodromes exceed the norm by more than 100 times (State Committee for Nature Protection of
the Republic of Uzbekistan, 2002).
In some of the countries of the Region, certain persistent toxic pesticides have never been used. For example, in
Mongolia, there is no information confirming that aldrin, dieldrin, chlordane, endrin, mirex, heptachlor and
toxaphene had been previously used or is presently used. However, from 19501970, DDT had been supplied
from the former Soviet Union in small quantities and used for the purpose of protecting plants and disinfecting
livestock. According to unreliable sources of information, small volumes of DDT are still kept in some rural
areas. In the Russian Federation, aldrin, dieldrin, endrin, chlordane, mirex, toxaphene and heptachlor have not
been used.
The following tables are a summary of the estimated amount of pesticides in some of the countries within the
Region:
21
Table 2.2 Obsolete and Banned Pesticides Located in Asian Part of Russian Federation (Yufit & Grosheva, 2002)
Total amount
Obsolete and banned pesticides
available with
Location
suppliers and
economic sites
929 t (2000)
Kurgan Oblast
1000 t (1999)
700 t prohibited and waste pesticides produced in 19721975 (1997)
218 t - Out of 200 storage sites, 135 have licenses, 25 were shutdown (1998).
Tyumen Oblast
Approximately 130 t (1996)
Chelyabinsk Oblast
170 t (1998)
202 t (fertilizers 16 t of pesticides prohibited for use. In 1992 there were 20 storage sites for
and pesticides) mineral fertilizers and pesticides in Tyva. By 2000, there were none (2000).
Tyva Republic
Over 100 t waste, prohibited and depreciated pesticides and their package
were found in destroyed warehouses of abandoned farms (Kolkhozes and
Sovkhozes) (1999).
More than 1500 t of unspent pesticides, including hexachlorocyclohexane -
Altai Krai
116 t, DDT - 14 t, Trichlorfon 18.3 t, have accumulated in the Region. There
is an urgent problem of their neutralization.
Krasnoyarsk Krai
126 t
66 t
Pesticide landfill built in 1979-1982 at foot of Kozelsky volcano
Kamchatka Oblast
102 t of various pesticides
Kemerovo Oblast
185 t (1998)
579 t pesticides (2000)
Primorski Krai
500 t pesticides (1997)
Over 590 t pesticides, including highly toxic mercury-containing Granosan -
Amur Oblast
20 t (1999).
19 t of various pesticides, 600 kg of which is DDT that has not been used since
Magadan oblast
1989 (1999)
352 t, out of which 149 t are stored on industrial land, and 203 t are landfilled
(2000).
Sakhalin oblast
375 t of obsolete waste and prohibited pesticides
were accumulated, out of which 69 t were stored directly on-site (1999)
Approximately 127 t of various pesticides (e.g. Granosan ~24 t) are stockpiled
Yakutia (Sakha)
on 9 storage areas
Table 2.3 Transport of Pesticides in Krasnoyarsk Territory, Russian Federation
1999, (t) (Shekhovtsov, 2002)
Amount
In Storage
Present on
Total in
Used in
1 January
Pesticide
Received
1 January
in 1999
1999
1999
2000
1999
Insecticides 28 10
38
11 27
Fungicides 28 6
34
10 24
Herbicides 92 36
128
76 53
Seed Dressing
29 38
67
45 22
Total 177
90
267
142
126
22
Table 2.4 Results of the Preliminary PTS Inventory in Kazakhstan (Ishankulov, 2002a)
PTS
Toxaphene
HCH
DDT
Location
Northern Kazakhstan oblast,
Atyrau oblast, Atyrau
East Kazakhstan, Zharminsky
Akkainsky Region
anti plague station
Region, Zhangiztobe village
Quantity
15 t
24 t
0.5 t
Formulation Emulsible
concentrate
Wettable powder
Wettable powder
Type of container
---
Paper sacks
Plastic bag
State of container
---
Normal
Normal
Year of Import
---
1985
1965-1970
Origin (country, company)
---
---
USSR
In addition to the infromation listed in Table 2.4, it has also been reported that there are 500 t of non-identified
pesticides kept in storehouses in Kazakhstan. The presence of PTS among these pesticides are assumed to be
high.
Table 2.5 Pesticides Stored in Underground Facilities in Kyrgyzstan (Pak et al., 2002)
Location
Kurg-Ukok
Tash-Baka Kungey
Name of Pesticide
(t)
(t)
1973
MME 20% DDT
22.7
37.3
30% DDT s.p.
5.5
2.0
72% DDT techn.
5.5
-
5.5% DDT dust
5.4
518.4
50% DDT paste
0.1
97.5
Aldrin
-
69.5
Subtotal 39.2
724.7
1980
5.5% DDT dust
250.7
-
12% HCH dust
4.5
-
Subtotal 255.2
Total
294.4
724.7
Certain pesticides have never been used in the Region, and many have already been banned, as shown in Table
2.6.
23
Table 2.6 Data on Usage and Ban of Pesticides
Aldrin
Chlordane
DDT
Dieldrin
Endrin
Heptachlor
HCB
Mirex
Toxaphene HCH PCP
China
Not used
(1)
1983 (1)
Not used
Not used
NR
1987 (2)
1983 (2)
-Hong Kong SAR
1988 (2)
1991 (2)
1988 (2)
1988 (2)
NR
NR
NR
1997 (2)
1984 (2)
1991 (2)
1994 (2)
1991 (2) -lindane
-Taiwan
1975 (1)
1988 (2)
1973 (1)
1975 (1)
1971 (1)
1975 (1)
1989 (2)
NR
1983 (1)
Banned
Province
1989 (2)
1989 (2)
1989 (2)
1989 (2)
1989 (2)
1989 (2)
Banned - lindane
Japan 1975
(1)
1968 (1)
1971 (1)
1981 (2)
1975 (1)
1975 (1)
NR as
2002 (2)
2002 (2)
1971 (1)
1990 (1)
pesticide
1981 (2)
1986 (2)
1981 (2)
1981 (2)
1986 (2)
Banned -lindane
Republic of
1969 (1)
1969 (1)
1969 (1)
1970 (1)
1969 (1)
1979 (1)
NR
1982 (1)
1991 (1)
Korea
1986 (2)
1986 (2)
1999 (2)
1999 (2)
1986 (2) -lindane
Mongolia 1997
(2)
1997 (2)
1997 (2)
1997 (2)
1997 (2)
1997 (2)
NR
NR
1997 (2)
1990
NR
Not used
NR- lindane
Russian
1980 (2)
NR
1970 (1)
NR
NR
1982 (2)
1986 (1)
Banned
NR
1987 (2)
Federation
Not used
Not used
Not used
1987 (2)-lindane
Kazakhstan
1986 (1)
1986
1986 (1)
1986
1986
1986
1986
1986 (2)
1986
Kyrgyzstan 1973 1973 1973 1973 1973 1973
1973 1973
1973
Tajikistan 1973
1990
(1)
1990
1990 1990
NR 1986 Banned 1973
Uzbekistan 1990's
1990's 2000 2001 NR 1980
(2) NR NR
NR
2000
NR
Note:
1. Banned from agriculture
2. Banned from all purposes
NR: Not registered
24
The following is the status of persistent toxic pesticides in the Central and North East Asia Region:
Aldrin Aldrin has not been used in China, Mongolia or the Russian Federation and is currently banned from all
countries in the Region. During the 1960's and 1970's, aldrin had already been banned from agricultural use by
four countries, namely the Republic of Korea, Japan, Kyrgyzstan, and Tajikistan.
It has been reported in a UNEP survey that formulations of aldrin, dieldrin, endrin, and DDT were buried in the
ground in concrete boxes in Japan from 1971 to 1972. The total quantity buried was approximately 4000 t,
however the percentage of each pesticide is not known. The report states that monitoring verified no leakage to
the surrounding soil and underground water (UNEP, 1997). Further investigations may be necessary to validate
the existence of the buried pesticides In Kyrgyzstan, although aldrin was banned in 1973, 8.6 t of the pesticide
was found within the Republic in 1989 (Pak et al., 2002).
Within the Region, aldrin is a chemical of low priority of concern as it has been banned in all of the countries
and was not historically widely used in the Region.
Chlordane Chlordane has not been used in Monglia, or the Russian Federation. Chlordane had been used in
China as a pesticide in agriculture, but now that usage is no longer permitted. However, it is still being
produced and being used locally as a termiticide in structures such as buildings and dams. In Japan, chlordane
had never been produced, but has been imported for usage. From 1958 to 1970, 262 t (technical grade) were
imported as a raw material for agricultural pesticides until it was banned as an agricultural pesticide in 1968.
After this time, the use of chlordane as a termite control agent increased (Ministry of the Environment,
Government of Japan, 2002). From 1979-1986, 12900 t were imported. Both China and Japan have registered
the exemption of chlordane from the Stockholm Convention. For China, the exemption is for production and
use of chlordane as a termiticide in buildings and dams, and for Japan, the exemption is for the continuous use
of wooden articles (which had previously been treated with chlordane and/or heptachlor) as a termiticide in
structure of houses. Of the Commonwealth of Independent States (CIS), limited quantities have been found,
e.g. in irrigated farmlands of Tajikistan although chlordane was banned in 1990. Obsolete stocks were also
reported to be located at some agricultural enterprises in Uzbekistan several years after the ban on production
and usage in the 1990's.
Except for China and Japan which have requested exemption from the Stockholm Convention for chlordane as
a termiticide, chlordane is banned from all other countries of the Region. Chlordane is a local concern for the
region.
DDT Of all the pesticides, DDT is more widely known due to its usage by many countries in the world and the
abundant studies that have been conducted on its adverse effects. In this Region, DDT is a significant concern
as it has been extensively applied. China had been a significant producer and user of DDT since the 1950's
until its ban on production and agricultural use were enforced in 1983. During its 30 years of production, 0.4
million t were produced. Hence, approximately 10000 t of DDT had been produced annually in China (Hua and
Shan, 1996). There may be stockpiling of DDT in China.
Besides its use as a pesticide, DDT has played an important role in disease vector control. For the prevention of
the spreading of malaria in China, the country has a small amount of DDT stored and readily available. At the
same time, if other countries need to prevent the occurrence of the disease or upon emergency situations, China
can export DDT to these other countries, based on Prior Informed Consent (PIC) procedures.
China, Republic of Korea, and Russian Federation have requested exemptions from the Stockholm Convention
for DDT; China, for the production and use of DDT as an intermediate and for vector control; Republic of
Korea for use as a de minimis contaminant in dicofol (maximum concentration 0.1%), and Russian Federation
for production and use for vector control. Dicofol is an organochlorine miticide used on fruit, vegetable and
field crops.
In Hong Kong SAR, DDT was banned from use on 31 December 1987, and currently can be traded only under
permit. From 1979 to 1982, 5023 to 5996 kg of DDT was imported into Hong Kong annually (Morton, 1990).
In Japan, DDT has been reported to be buried in concrete boxes along with other pesticides (see aldrin) (UNEP,
1997), however, this needs to be confirmed. In Mongolia, DDT was supplied from the former Soviet Union
during period 1950-1970. Small quantities of DDT are being kept in some rural areas in Mongolia.
Before its ban in 1972 from agricultural use, DDT was extensively applied in the Russian Federation. There are
also reports that DDT has been buried or is being stockpiled within the Russian Federation. The Oblast
Environment and Nature Use Committee (14 September 2001) reported that in 1953-57, DDT was applied to
25
2509 km2 of Tomsk oblast and that unspent DDT was disposed of in pits, however, the locations of the disposal
sites were not documented. The uncontained buried DDT had contaminated bottom sediments of the Chulym
River. It has also been reported that the total amount of DDT in registered tombs and stores which are kept in
poor conditions (with possible leakage) exceeds 600 t. In the Magadan oblast, about 0.6 t of DDT has remained
unused since 1989 and is being stockpiled (Deputy Governor of Magadan oblast, 2001) (refer to Table 2.2).
Also, in the village of Teguldet in Tomsk oblast, 184.7 t of DDT dust have been buried.
In the CIS countries, although DDT has been banned as a pesticide, the toxic chemical is still present within the
territory. For example, stocks of DDT (0.5 t) have been found in East Kazakhstan in the Zhangiztobe village of
the Zharminsky Region (refer to Table 2.4). It is estimated that 995 t of DDT are buried in Kyrgyzstan, a
country in which DDT have been substituted by pyrethroids. Approximately 33 t of pyrethroids have been used
to date (Shakirov, 2002a).
In Tajikistan, it has been reported that a large volume of prohibited chemicals (approximately 200-500 t)
including DDT are still being imported (Ministry for Nature Protection Republic of Tajikistan, 2000). In
Turkmenistan, DDT has been found in all agricultural regions of the country, and residual quantities of 109 t
have been found at four toxic waste burial grounds of the Akhal Region (Enev), Mary Region (Karabota),
Lebap Region (Zergher), and Dashoguz Region (Takhta) (Glazovsky, 2002).
Overall, DDT has been banned as a pesticide from all countries of the Region and has been specified for
exemption for vector control in China and in the Russian Federation in accordance to Part II of Annex B of the
Stockholm Convention on Persistent Organic Pollutants. As a result of stockpiling and burial, DDT is a
chemical of high priority of concern for this Region.
Dieldrin Dieldrin has not been used in Mongolia, the Russian Federation or in Uzbekistan. For five of the
countries in Region VII, the pesticide had been banned in the 1960's and 1970's. Dieldrin is currently banned
from all of the countries of the Region and thus is a PTS of low priority of concern.
Endrin Endrin has not been used in China (excluding Taiwan Province, which banned endrin in 1989),
Mongolia, the Russian Federation, Kazakhstan, and in Kyrgyzstan. During the 1960's and 1970's, endrin was
banned from the Republic of Korea, Japan, and Kyrgyzstan. The pesticide is currently banned from all
countries of the Region and is a PTS of low priority of concern.
Heptachlor Heptachlor has not been registered for use in China (excluding Taiwan Province, which banned
heptachlor in 1989), Mongolia, and Russian Federation. It is currently banned in most countries and was
banned from Republic of Korea, Japan, and Kyrgzystan in the 1970's. Some stockpiling exists in Uzbekistan at
agricultural sites, however, the amount is unknown.
Heptachlor is a local concern for some of the CIS countries due to limited releases or stockpiling.
Hexachlorobenzene In the past, hexachlorobenzene (HCB) has been used as both a pesticide (fungicide) and
as an industrial chemical for carbon anode treatments, synthetic rubber additives, and wood preservatives.
Today, HCB is mostly formed as an intermediate in a number of organic synthetic processes. In addition to
these, major sources into the environment are pesticides contaminated with HCB and the incineration of various
wastes. Due to the various possible sources of HCB it will be discussed in this report under the sections of
Pesticides, Industrial Chemicals, and will also be reviewed under Unintentional By-Products.
In the Region, HCB has not been used as a pesticide in Japan, Republic of Korea, Mongolia and Uzbekistan. In
most of the CIS countries, there is no data on the usage and production of HCB.
China has been listed as an exemption from the Stockholm Convention for production and use as an
intermediate. HCB is a pesticide of serious concern in the Russian Federation as it had been extensively
applied. Approximately 610 t were used in the former USSR. HCB was banned in 1986 for agricultural
purposes and the toxicant is now used in industry and for military purposes (Shekhovtsov, 2002). From 1990,
HCB had not been used in Tajikistan, and governmental monitoring data has indicated that HCB is present in
limited quantities in irrigated farmland in the country. HCB, as a pesticide, is a local concern for the Region.
Mirex Mirex has not been produced or used in the Republic of Korea, Japan, Russian Federation, Mongolia,
Kazakhstan, Kyrgyzstan, Tajikistan and Uzbekistan.
China has applied for an exemption from the Stockholm Convention for the production and use of mirex as a
termiticide. There is limited production and some local use as a termiticide.
Mirex was the last of the Stockholm Convention pesticides used in Hong Kong SAR to be banned. From 1992
26
until its deregistration on 31 December 1996, 141.5 kg of the pesticide was imported and 24.3 kg was exported
from Hong Kong SAR. During this time, Hong Kong SAR had a net gain of 117.2 kg of mirex (AFCD, 2001).
Mirex has not been used in many countries of the Region and has been banned from most of the countries.
Therefore, mirex is a chemical of relatively low priority of concern.
Toxaphene Toxaphene has not been used in Japan, the Russian Federation, or in Uzbekistan and has been
banned from agricultural use by most of the countries during the 1980's.
In the past, 24000 t of toxaphene were produced from 1964 to 1980 in China (Xu, 2002), and 99 t of the
pesticide were produced for agricultural pest control in Taeku City of Republic of Korea (UNEP, 1997). There
is no usage and stockpiling of the pesticide in these countries. There is stockpiling of toxaphene in the Russian
Federation (approximately 50 t) and in the Northern Kazakhstan oblast, Akkainsky Region (approximately 15 t)
(refer to Table 2.4).
Toxaphene is of some concern in the Russian Federation, Mongolia and some of the CIS countries
(Kazakhstan, Kyrgyzstan).
HCH HCH is banned in China, Republic of Korea, Japan, Kazakhstan, Kyrgyzstan and Uzbekistan, and
restricted in the Democratic People's Republic of Korea, Russian Federation, and Mongolia.
HCH was widely produced and used in China from the 1950's until its ban in 1983. During the 30 years, 4.9
million t of HCH were produced in China (Hua and Shan, 1996). The production of lindane (-HCH) is only
permitted to control specific pests, or it can be exported to other countries on request of their respective
governments. In Hong Kong SAR, lindane was banned on 15 March 1991 (AFCD, 2001). Prior to the ban,
import and export data for Hong Kong between November 1986 and end of January 1988 showed that Hong
Kong had a net gain of 11t of lindane during this period (Ip, 1990).
In Japan, 389000 t of HCH were produced from 1948 until its ban in 1971. It is used for insecticide, termite
control, and wood preservative.
HCH was extensively used in the Russian Federation, and production of HCH was banned in 1987. It is
estimated that there is a stockpile of approximately 1000 t of HCH whereby the Altai Region accounts for 116
t. In Kazakhstan, 24 t of HCH are located at the Atyrau oblast (refer to Table 2.4).
HCHs including lindane is an important concern for the Region as significant stockpiles exist and lindane is
still being produced.
PCP In Region VII, PCP has been used as a fungicide, herbicide, termiticide, wood preservative, industrial
fungicide and as a mold preventive. As a herbicide, it has been used in paddy fields and farmlands.
In China, PCP is still being produced and used as a pesticide and as a wood preservation. About 5000 t of PCP
were produced annually in the 1990's. Sodium pentachlorophenate has been sprayed since the 1960's in China
for controlling the spreading of snail schistosomiasis.
In Japan, PCP was registered as a fungicide in 1955 and as a herbicide in 1957, however in 1990, the chemical
was banned from production and use. The cumulative production in Japan amounts to 175700 t, 97% of which
was used prior to 1974.
PCP is restricted in the Democratic People's Republic of Korea and banned in Japan and Tajikistan. It has been
deregistered in Hong Kong SAR since 1993, but can be traded under permit. It is assumed to not have been
either produced or used in Uzbekistan. In the other countries, PCP is still being used in China, Mongolia, and
the Russian Federation, particularly in the wood-forest industry and railway industry. Residual amounts may be
found in storage in Tajikistan, but this has not been confirmed. Limited data is available about the usage in
Republic of Korea, Democratic People's Republic of Korea, Kazakhstan, Kyrgyzstan and Turkmenistan. In
general, there is insufficient information about PCP in the Region.
2.2.2 Persistent Toxic Substances Industrial Compounds
Polychlorinated biphenyls (PCBs) PCB sources are thought to be classified into two groups divided by the
formation process: one group are PCBs contained within PCB products manufactured in past industrial
activities, which are intentional products; and the other group are PCBs formed as a byproduct in the process of
combustion, such as municipal solid waste (MSW) incineration. In addition, a minute amount of PCBs are
reportedly contained in agricultural chemicals and various chemical products as impurities. The following is a
27
description of industrial PCBs:
In the past, the largest sources of PCBs were manufacturing and application of PCB products. PCB products in
Europe, USA and Japan have the following commercial names:
France:
Aceclor, Phenoclor and Pyralene
France/UK:
Santothern and Therminol
UK:
Ducanol, Plastivar and Pyroclor
UK/USA:
Askarel and Aroclor
USA:
Asbestol, Bakola 131, Chlorextol, Diaclor and Dykanol
West Germany:
Clophen
Italy:
Apirorlio, DK and Fenchlor
Japan:
Kanechlor
Russian Federation: Sovol and Sovtol
The total amount manufactured in the world is assumed to be over 1 M t. In some countries, especially
developing countries, PCB-containing products cannot be disposed of, but must be stored as these countries
lack the appropriate technology for effective and safe disposal. However, during PCB storage, some may
become lost due to inadequate documentation of inventory or some may leak into the environment. Although
there is no accurate data with regards to leakage, it has been estimated that 0.05% of the amount of PCBs
contained in stored PCB products are leaking per year in the US (Harrad et al., 1994). In addition, vaporisation
of PCB from PCB-containing products and their release during accidents such as fires could be significant.
In Japan, 58787 t of PCBs were manufactured from 1954 until the production ban in 1972. It is estimated that
54000 t has been used domestically and that amongst this, 37156 t were used as insulating oil for transformers,
capacitors and other electric devices, 8585 t for heating media, 5350 t for pressure sensitive papers and 2910 t
for other open type uses including plastic materials and paints (Hiraoka, 2001). The amount of PCB imported,
exported and used is shown in Figure 2.1 (Hiraoka, 2001). Although a part of these products and waste PCBs
have been stored, some products containing PCB are still used in a closed system even as recently as 1998.
28
Export: 5,318 t
Amount domestically manufactured
Import: 1,048 t
(Missing: 516 t)
Amount domestically used
Insulating oil for electric
apparatus such as transformers
+
For impact
For thermal +
For others:
and capacitors: 37,156 t
papers: 5,350 t
oil: 8,585 t
2,910 t
= 54,001 t
Product High
voltage
Low-voltage
Impact
PCB Others
Waste
Transformers
transformers and
transformers
papers
cloth and
for poles
capacitors
and capacitors
sludge
Purpose Power
plants, Electric
Office
Thermal oil
Plasticizer
Cleaning Power
substation and
apparatus
supplies
s and
distribution
power receiving
parts
(copy
paints
facilities
papers)
Major
Constructors,
Consumer
Public
Manufacture
Factories
6 power
business
Electric power
electronics
offices and rs
and Japan
companies in
companies and
makers
private
Railway
main land
JR
sector
Form
High level PCB,
Insulting
PCB
Liquid PCB
PCB-
Low level
metal containers
papers
applied
wiped
PCB,
and coils
containing
papers
cloth and
insulating oil,
PCB, metal
sludge
metal
and plastic
containers and
containers and
coils
coils
PCB
High voltage
PCB
PCB: 3 ~5
Variety from
PCB level in
level
transformers: 1/3 content/each:
% of the
undiluted
insulating oil:
of average weight few ~ dozens
weight of
solution to
few ~ dozens
is insulating oil
g
pressure
ppm order
ppm*.
(PCB level: 60 ~
sensitive
70%).
papers
For transformers for poles, PCB has not been used intentionally since the beginning. It is supposed that PCB came to be mixed in the recycling process
of insulating oil.
Fig. 2.1 PCB amount used and quantity consumed by application in Japan
China issued a "Relevant Regulations for Stopping the Production of PCBs" in 1974 and issued a "Circular on
Preventing the Pollution of Hazardous Substances of PCBs" in 1979. Approximately 10000 t of PCBs were
manufactured and of these, 9000 t were trichlorobiphenyl applied for transformers and capacitors. The
remaining 1000 t were pentachlorobiphenyl mainly applied for paints, inks and lubricants as an additive. The
first set of facilities for PCB incineration, located in Shenyang, began operation in 1995. The capacity of the
facility is about 400 t waste annually (Li, 2002).
PCBs are a serious concern for the Russian Federation. PCBs were produced at plants located in the European
part of Russian Federation from 1960-1990. During this period, the total amount was estimated to be 300000-
500000 t consisting of Sovol (PCBs) and Sovtol (mixture of PCBs and trichlorobenzene) as capacitor
dielectric fluid. Capacitors were produced at a plant in Serpukhov (European part of Russian Federation).
Location of operating capacitors in the Asian part of Russian Federation are unknown. The salvaging of oils
used in condensers and transformers is also a major problem. Main sources of PCB pollution in the Asian part
of Russian Federation are due to the numerous hydroelectric power stations, railroads, and industrial plants,
which have condensers and transformers. PCBs are also formed from chemical plants as by-products
(Shekhovtsov, 2002). PCBs are still being extensively applied in electrical equipment within the country.
According to the PCB inventory under the Arctic Monitoring and Assessment Program (AMAP) and based on
official data supplied by industry, the amount of PCBs in Russian Federation today is still tens of thousands of
29
tonnes. However, no accurate data is available concerning PCB amounts in the Asian part of Russian
Federation (Yufit and Grosheva, 2002). At the beginning of 2002, 224.8 t of PCB-containing waste were found
on 11 industrial sites of Sverdlovsk oblast. Another 190.3 t were generated in the course of the year and 1.5 t
were exported from the oblast. Therefore, a total of 413.6 t were located at the oblast. According to the
Stockholm Convention on POPs, Russian Federation has been given a 25-year deferment for the full
destruction of PCBs. The total amount of PCBs (active substance) produced in the former USSR is
approximately 180000 t.
The Ministry of Energy and Mineral Resources of the Republic of Kazakhstan estimate volumes of PCB
(trichlorodiphenyl), which is used in electrical equipment by industry as dielectric fluid, amount to 1060 t.
PCBs are mostly present in capacitators which were produced prior to 1994 at the Ust-Kamenogorsk Capacitor
Plant.
Small amounts of PCBs are being added to the transformer oil of some power stations operating in Mongolia,
notably in Ulaanbaatar city (Namkhai, 2002).
Hexachlorobenzene (HCB) HCB has been used as an industrial chemical. In Japan, during the period from
1952-1972, 70000 t of HCB was produced as a raw material for PCP. In the Russian Federation, HCB is
banned for agricultural usage, but it can be found in pyrotechnical compounds. Past emissions of HCB from
Russian Federation is documented in Table 2.7.
Table 2.7 Historic HCB emissions (kg/y) in Russian Federation (Münch and Axenfeld, 1999)
Year
Emission
1970 36092
1975 36369
1980 24501
1985 24376
1990 12120
1993-95 10980
Polybrominated diphenyl ethers (PBDEs) PBDEs have been widely used as brominated flame retardants
which enhances the flame retardation quality of consumer products through the addition to or reaction with
plastics and synthetic fibres. Their effects on the environment and human health have been a cause of concern.
Furthermore, it has been reported that PBDD/PCDF form via thermolysis of brominated flame retardants.
Worldwide demand of PBDEs reached approximately 70000 t (Table 2.7) in the 1999 (Rahman et al., 2001).
Production in Japan (Table 2.8) was about 10000t/y at its peak, but in recent years it has been approximately
5000t/y (Nishizawa, 1997, 1999, 2000).
Table 2.8 Worldwide Demand of PBDEs (1999, t/y) (Rahman et al., 2001)
US Europe Asia Total
deca-BDE 24,300 7,500 23,000 54,800
octa-BDE 1,375 450 2,000 3,825
penta-BDE 8,290 210 0 8,500
30
Table 2.9 Production of PBDEs in Japan (t/y) (Nishizawa, 1997, 1999, 2000)
1991 1993 1995 1997 1999
deca-BDE 9,800 5,800 4,900 4,700 4,450
octa-BDE 1,500 900 300 250 250
Although there is not much data on the demand in brominated flame retardants, 75% of production has been
reportedly used in electric and electronic products in the US (Raether, 1998). It seems to be similar for PBDEs.
In the UK, 1500 t/y of PBDEs were used in upholstered furniture in 1999 and 85t/y were used in electric
products. The main purpose of using PBDEs in Japan are said to be in household electric appliances and Office
Automation apparatus. PBDEs contained in electric and electronic products are possibly thought to enter the
environment by volatilising and leaching during their use and waste processes. On the other hand, there can
also be emissions from manufacturing plants of flame retardants.
In other countries of the Region, there is limited information on PBDE. In Mongolia, Russian Federation, and
most of the CIS countries, there is no data on usage.
2.2.3 Persistent Toxic Substances Unintentional by-Products
2.2.3.1 Polychlorinated
dibenzo-p-dioxins and polychlorinated dibenzofurans (PCDD/PCDF) Industrial
Sources
PCDD/PCDF have various sources and are produced as unintentional by-products of many manufacturing and
combustion processes involving the use, production or disposal of chlorine or chlorine-derived chemicals,
notably, polyvinyl chloride (PVC) polymers. Sources of significant environmental concern for PCDD/PCDF
include waste incineration, combustion in landfill fires, open burning, and many organochlorine production
processes. PCDD/PCDF emissions from the steel industry, ceramic industry, power generation, and vehicles
fuelled with leaded petrol are other sources of PCDD/Fs in the environment (Alcock and Jones, 1996; UNEP,
2001). In addition, PCDD/PCDF are emitted from paper making processes from pulp mills and can be found in
wastewater from the bleaching process. PCDD/PCDF are also found in the technical product of 2,4-D.
Sources of PCDD/PCDF and their emission factors are specified for 15 countries (Austria, Australia, Belgium,
Switzerland, Canada, Germany, Denmark, France, Hungary, Sweden, Japan, New Zealand, Slovakia, UK and
USA) (UNEP, 2001).
In Hong Kong SAR, soil on the property of a previously privately-owned shipyard had recently been found to
be contaminated with PCDD/PCDF among other contaminants. The estimated volume of the soil is 30000 m3
(CED, 2002). The source of the PCDD/PCDF may be from open burning on the site. Two incinerators which
will undergo decommissioning work will also contribute to sources of PCDD/PCDF, however the volume
needs to be confirmed.
In the Russian Federation, environmental pollution by PCDD/PCDF is not a major concern, however the
combustion of hazardous waste (approximately 42 million t in 1998) is a potential source of these substances
(6-7 kg TEQ/year; including European and Arctic Russia). Table 2.10 lists the potential sources of dioxin
pollution from the Russian Federation:
31
Table 2.10 Industrial Plants As Potential Sources of Pollution by PTS (Especially Dioxins andDioxin-Like
Compounds (Russian Dioxin Program, 1997)
Region City
Industrial
Plant
Kurgan Oblast
urgan
urgan plant of medicine "Syntez"
"Uraltyazhmash"
katerinburg
Plant of transformer
Ural Indusrtial Union "Stroiplastpolimer"
myshlov plant "Uralizolyator"
myshlov
myshlov leather plant
irovograd
irovograd copper-melting plant
Sverdlovsk Oblast
Nizhni Tagil
Nizhni Tagil Plastics Plant
Nizhnya Tura
Nizhneturinski plant of electric apparatus
Novoutkinsk
Novoutkinsk plant "Iskra"
Pervoural'sk
Share Society "Khrompic"
Rezh
Rezh's Chemical plant
Sysert
Sysert's electro-technical plant
Tavda
Tavda's Wood Plant
Chelyabinsk Oblast
Chelyabinsk
Chelyabinsk varnish factory
Altai Krai
Yarovoye
OAO AltaiKhimProm
Igarka Igarskiy
Sawmill
Krasnoyarsk Krai
Novoeniseyisky Sawmill
Lesosibirsk
Tunguska Sawmill
Angarsk
Angarsk electromechanical factory
Bratsk BratskKompleksKholding
Ust-Ilimsk
Ust-Ilimsk Lumbermill Factory
Baikalsk
Baikalsk Pulp and Papet Mill
Bratsk
Bratsk Chlorine Factory
Irkutsk Oblast
Irkutsk
East-Siberian Branch of GosNIIKhlorProekt
"Sibsol" Combine
Usolye-Sibirskoye
"Sibirsky Silikon"
"UsolyeKhimProm"
Sayansk
" SayanskKhimProm "
"Azot"
Kemerovo
P "Karbolit"
Kemerovo Oblast
"KhimProm"
Novokuzhnetsk "SibEnergoTcherMet"
Myski Experimentalno-Mekhanitcheskiy
Zavod
Zavod ElectroMontazhnykh Izdeliy
Novosibirsk Oblast
Novosibirsk
Novosibirsk Chemical Factory
"Novosibirsk ChimConcentrats Factory"
Tomsk Oblast
Tomsk
Tomsk Lumbermill Combine
Ussuriysk Ussuriysk
Tannery
Far East
Vladivostok Incinerator
Factory
32
Region City
Industrial
Plant
Amursk Pulp and Paper Mill
Khabarovsk Krai
Amursk
"AmurskBumProm"
Birobijan City
Birobijan
Biribijan Transformer Factory
More than 20 cities of the Asian Region of Russian Federation (Angarsk, Amursk, Baikalsk, Bratsk,
Selenguinsk, Norilsk, Shelekhov, Achinsk, Belovo, Barnaul) have industries that may be sources of
PCDD/PCDF emission in the environment (Revich, 2002). No analyses of PCDD/PCDF have been carried out
in Kazakhstan. It is speculated that PCDD/PCDF may be emitted from ferrous and non-ferrous, metallurgy,
energy and chemical industries.
No analyses of dioxins and furans have been carried out in Kazakhstan. It is speculated that dioxins and furans
may be emitted from ferrous and non-ferrous, metallurgy, energy and chemical industries.
Due to an unstable economy of Tajikistan, several industries that can contribute to emissions of PCDD/PCDF
have closed. These included a cement plant, transformer plant in Kurgan-Tubpe, Vachsh chemical plant and the
Yavan electrochemical plant. Therefore, for the last 10 years, emissions of PCDD/PCDF are likely to be
minimal, however, since 1997 following political stabilisation, plants have started operating. One of the main
PTS sources is a large aluminium plant. Although the plant operates at 60% capacity, 200 t of resin (tar)
substances are formed as a result of thermal treatment. PCDD/PCDF sources in Tajikistan are generated from
chemical and metal works, cement production and burning of municipal solid waste (Djuraev, 2002).
2.2.3.1.1
PCDDs/PCDF in Incineration Processes
Municipal waste incineration is the greatest contributor to releases of PCDD/PCDF, however, as a result of
better control of PCDD/PCDF emissions in some of the countries in recent years, the amounts of PCDD/PCDF
now released are significantly lower than the values reported in the past. In Japan, the emission amount in
1999 was reduced to 1/3 of that in 1997 (Table 2.11).
Table 2.11 PCDDs/PCDFs and Co-PCBs Inventory in Japan (Ministry of the Environment Japan,
http://www.env.go.jp)
Source 1997
1998
1999
2000
MSW incinerator
5,000
1,550
1,350
1,019
Water: 0.044*
Water: 0.044*
Water: 0.035*
Water: 0.035*
Industrial waste incinerator
1,500
1,100
690
555
Water: 5.27*
Water: 5.27*
Water: 5.29*
Water: 2.47*
Small-sized waste incinerator
368 ~619
368 ~ 619
307 ~ 509
353~370
Crematorium
2.1 ~ 4.6
2.2 ~ 4.8
2.2 ~ 4.8
2.2~4.9
Industry related source
Electric furnace
228.5
139.9
141.5
131.1
Steel manufacturing sintering
135
113.8
101.3
69.8
process
Zinc recycling
47.4
25.4
21.8
26.5
Aluminum alloy manufacture
25.066
23.166
17.366
16.566
Other businesses
26.3
25.7
17.6
14.6977
Cigarette smoke
0.1~0.2
0.1~0.2
0.1~0.2
0.1~0.2
Automobile emission gas
1.12
1.12
1.12
1.61
Final disposal site
0.093*
0.093*
0.093*
0.093
Others
7.30*
6.83*
6.93*
5.95*
7.30*
Total
7,343 ~ 7,597
3,358 ~ 3,612
2,659 ~ 2,864
2,198~2,218
Unit: g-WHO-TEQ/y (TEF: WHO1998)
*Amount released to water system
33
Kim et al. (2001) measured the PCDD/PCDF concentrations in emission gases from 9 commercial sized MSW
incineration facilities in the Republic of Korea. The results were 1.18 ~ 29.61 ng-TEQ/Nm3 (average: 5.75,
median: 2.77) at the exits of waste heat boilers and 0.026 ~ 4.548 ng-TEQ/Nm3 (average: 0.92, median: 0.07) in
gases released from stacks in 1998. In the Republic of Korea, PCDD/PCDF emission control has been
promoted and its regulation has been established (UNEP, 1999). For new MSW incineration facilities, the
regulation states that the maximum allowable level after 19 July 1997 is 0.1 ng-TEQ/Nm3 and for existing
facilities, the maximum allowable level between 1 July 1997 and 30 June 2003 is 0.5 ng-TEQ/Nm3, and 0.1 ng-
TEQ/Nm3 after 1 July 1 2003. As a result, the PCDD/PCDF concentrations in the gases from MSW facilities
were remarkably reduced: 5.87 ng-TEQ/Nm3 in 1997 0.92 ng-TEQ/Nm3 in 1998 0.051 ng-TEQ/Nm3 in
1999. For incineration facilities with the exception of MSW incinerators, Oh et al. (1999) reported the results
shown in Table 2.11. Since the data is insufficient, it is difficult to estimate the average concentration.
However, the emission factors were calculated. The total capacity of industrial waste incinerators in Republic
of Korea is 10260 t/day.
Table 2.12 Dioxins Concentrations In Emission Gases and Emission Factors in Republic of Korea (Oh et al., 1999)
n Waste to be
PCDDs/PCDFs Concentration
Emission Factor
incinerated
(ng-TEQ/Nm3)
(ng-TEQ/kg)
Range Average
Median Range Average Median
MSW incinerator
11
*1
0.13~22.3 1.75 0.81 0.4~112 20.3
9.0
Small-sized
1 *2 5.86 123
incinerator
1 *3 0.25 2.7
Incinerator in hospital
1 *4 43.3 496
1 *5 2.68 37.3
Industrial incinerator
1
*6
0.03
0.5
Composition of waste to be incinerated (%):
Perishables Papers Plastics
Fabric
Wood
Waste oil
*1 46.6
23.1
17.1
5.5
*2
51.2
26.0
13.9
*3
51.2
7.5
10.3
27.4
*4
32.3
29.8
24.2
7.9
*5
8.4
50.2
41.5
*6
100
By the end of the 1980's, several large waste incineration plants and many small waste incineration facilities
were built and operated in certain areas of the Pearl River Delta, such as Shenzhen, Zhuhai, and Huizhou. It is
estimated that 70% of the light industrial waste (such as PVC plastics, rubber, leather and cloth, etc.) were
mixed with the municipal waste in some Regions where the waste production was up to 215 t per day. In the
Pearl River Delta Region, the main sources of PCDD/PCDF were likely from waste incineration, PVC
industries and emissions from leaded petrol fuelling vehicles (Fu, 2002).
No analyses have been conducted to investigate for presence of PCDD/PCDF in Mongolia at rubbish dumps of
cities where wastes are burned.
PCDD/PCDF in Turkmenistan are mainly generated as a result of waste incineration, however there is no
regular monitoring except for chlorine-organic pesticides (such as DDT and its metabolite).
2.2.3.1.2
PCDD/PCDF in Agricultural Chemicals
In the past, products which contained PCDD/PCDF, such as agricultural chemicals, were used and the
PCDD/PCDF released from these products were significant. It has been noted that the PCDD/PCDF
34
concentrations in waste agricultural chemicals in Japan varied with production year (Masunaga, 2000, Table
2.13). Using these concentrations and the precise analysis of PCDD/PCDF in sediment samples in Shinji Lake
and Tokyo Bay, nationwide amounts released in the environment during the past 40 years were estimated. In
costal waters, 50% of the pollutants in Tokyo Bay were originated from past usage of PCP. Less than 10% was
caused by fallout from air (combustion-derived). In comparison, in Shinji Lake, pollution from PCP, CNP and
combustion were estimated to be approximately 60%, 10% and 30%, respectively.
Table 2.13 Estimation of environmental load of PCDD/PCDF derived from PCP and CNP in Japan
(Masunaga, 2000)
Agricultural
Utility
Amount
Actual/TEQ
Average Dioxin Concentration
Estimated
Chemicals
Shipped
PCDD/PCDF
Period
(t)
Released
PCP
1955-(1974) 164000 PCDD/PCDFs 1,100 (n=33)1) (µg/g)
180,000 (kg)
I-TEQ
3.77 (n=9)1) (µg-TEQ/g)
600 (kg-TEQ)
WHO-TEQ
1.25 (n=8)1) (µg-TEQ/g)
200 (kg-TEQ)
CNP
1965-(1994) 82000 PCDD/PCDFs
3,500 (1970),
280(1985)2)
190,000 (kg)
I-TEQ
(µg/g)
180 (kg-TEQ)
WHO-TEQ
4.1(1970), 0.002(1985)2) (µg-
440 (kg-TEQ)
TEQ/g)
10 (1970), 0.003(1985)2) (µg-
TEQ/g)
1) Average of reported values in the world including 4 types in Japan
2) The concentrations are assumed lower than those in year of manufacture based on report
Several recent studies have shown that PCDD/PCDF pollution in some areas of China was partly attributed to
the production and use of pesticide sodium-pentachlochlorophenol (Na-PCP) (Bao et al., 1995). Residues of
PCDD/PCDF have been found to be higher in concentration in environment media (such as soils, sediments
and food web) in areas that had been sprayed with Na-PCP.
2.2.3.1.3
PCDD/PCDF in PCBs
PCBs also contain PCDD/PCDF and the concentrations are listed in Table 2.14 as follows (UNEP, 2001).
Research carried out in Russian Federation has shown a correlation between an increase of PCDD/PCDF levels
in human breast milk with environmental pollution due to the use of PCBs.
Table 2.14 Dioxins in Technical PCBs (UNEP, 2001)
PCBs Dioxins
concentrations
(µg-TEQ/t)
Low level chlorine compounds (Clophen A30 and Aroclor 1242)
15,000
Middle level chlorine compounds (Clophen A40 and Aroclor 1248)
70,000
Middle level chlorine compounds (Clophen A50 and Aroclor 1254)
300,000
High level chlorine compounds (Clophen A60 and Aroclor 1260)
1,500,000
2.2.3.1.4
PCDD/PCDF in Other Chemicals
The process of manufacturing chlorophenol by chlorination of phenol or hydrolysis of chlorobenzene can
produce PCDD/PCDF. Of the chlorophenols, pentachlorophenol produces the most significant amount of
PCDD/PCDF, for example, 3660 ppm of octa-PCDD and 0.8-400 ppm of hepta-PCDF, respectively (US EPA,
1988). PCDD/PCDF are also secondly produced in the process of manufacturing chlorophenol-based
pesticides, herbicides and bactericides. Of these, 2,4,5-T and CNP are well known. 2,4-PA and chlometoxynyl
contains PCDD/PCDF and reportedly 23 ppm and 24 ppm of PCDD/PCDF are contained in chlometoxynyl and
2,4-PA, respectively. Taking trichlorobenzene as an example, 759 ppb of PCDD and 1145 ppb of PCDF are
contained (US PA, 1988). There is a report that 7170 ppb of PCDD and 3285 ppb of PCDF are contained in
35
hexachlorobenzene and 809 (mg/kg dry wt) of PCDD and 933 (mg/kg dry wt) of PCDF are contained in sludge
in the process of manufacturing trichlorobenzene-based PCP (Na salt).
Industries producing chloro-alkali are a source of PCDD/PCDF. In China, there are about 200 chloro-alkali
factories. In 1998, the amount of alkali produced in China was over 5 million tonnes (Li, 2002).
2.2.3.1.5
Emission Factors of PCDD/PCDF as By-Product
Table 2.15 shows the compiled emission factors of PCDD/F based on UNEP's classification (UNEP, 2001).
Facilities preventing the release of PCDD/PCDF are grouped into 5 levels that are classified in detail according
to PCDD/PCDF emission factors estimated by UNEP. According to the UNEP calculation by level of emission
gas treatment system and combustion control system, the total amounts in emission gases were between 0.5 and
3500 µg-TEQ/t-waste. Excluding the facilities without control system, the amounts were between 0.5 and 350
µg-TEQ/t.
Table 2.15 Emission Factors of PCDDs/PCDFs (UNEP, 2001)
Category Source
Occurrence
Factor
(µg TEQ/t)
Waste incineration
Municipal solid waste incineration
30350
Toxic waste incineration
10350
Medical waste incineration
5253000
Incineration of light components in shredder
11000
Sewage sludge incineration
0.450
Incineration of waste wood and biomass
1100
Animal burning
5500
Metal industries
Steel sintering
0.320
Coke production
0.33
Factories for steel industry and steel casting
0.13
Foundries 14.3
Copper production
0.0350
Aluminum production (all sections)
1035
Lead production
0.580
Zinc production
5100
Brass production
0.11
Magnesium production
50250
Other non-ferrous metal
2100
Metal shredding
0.2
Recycling of electric wire
3.35000
Electricity
Fossil-fuel-fired utility
2.510
Biomass fuelled power plant
5500
Landfill and biogas incineration
8
House heating and cooking--biomass
1001500
House heating--fossil fuels
1.570
Ceramic industries
Cement kiln
0.155
Lime 0.0710
Brick 0.020.2
Glass 0.0150.2
Ceramics 0.020.2
Mixing asphalt
0.00070.07
36
Exhaust gases from transportation
4-stroke engine
0.002.2
systems
2-stroke engine
2.53.5
Diesel engine
0.1
Crude petroleum engine
4
Uncontrolled burning
Fire/incineration--biomass 530
Fire, waste fire, landfill fire, industrial fire, accidental fire
94400
Other
Biomass drying
0.00710
Crematoria 0.490
Smoked room
0.650
Residue from dry cleaning
NA
Cigarette smoke
0.10.3
(1) Waste Incineration Facilities
As for MSW incineration facilities which are the biggest sources of PCDD/PCDF, Table 2.12 indicates that the
average amount released is about 20 µg-TEQ/t in Korea. In Japan, it is approx. 30-120 µg-TEQ/t, dividing the
total amount of PCDD/PCDF by the total quantity of MSW of about 41.1 M t. These values are based on the
release through emission gases.
In 1999-2000, an inventory of PCDD/PCDF emitting sources was undertaken with US EPA financial support.
It gave a figure of at least 10 kg for total PCDD/PCDF air emission in the Russian Federation. In Russian
Federation, PCDD/PCDF is mainly generated from the incineration of hazardous waste (42.2 million t/y)
producing 10835 g I-TEQ/year of PCDD/PCDF air emission. PCDD/PCDF monitoring has only been
undertaken in the Krasnoyarsk and Irkutsk oblast. Research is recommended in other areas such as in European
Russian Federation and especially in Siberia and the Far East.
(2) Metal Industry
Sintering plants are very important sources of PCDD/PCDF when compared with MSW incineration facilities.
The levels of PCDD/PCDF in emission gases from sintering plants were between 0.6 and 3.4 ng-TEQ/m3 in the
UK (Eduljee & Dyke, 1996), which are not remarkably high. However, the amount released becomes high due
to the large amount of emission gas. When the amount of PCDD/PCDF released from 1 t sintered metals are
calculated using the data, the released levels are between 1.2 and 9.0 µg-TEQ/t.
2.2.3.2 PCBs
2.2.3.2.1
PCBs - Combustion By-Products of Iincineration Processes
PCBs were formed and released from MSW incineration (Sakai et. al., 1993, 1999). The following are the unit
releases per one-tonne waste of PCB in the existing incinerator: Emission gas: 240 µg, Fly ash: 790 µg, Bottom
ash: 18 µg and Total: approximately 1000 µg (Table 2.16). In this measurement PCB in emission gas was 48
ng/Nm3. Of which, the release of coplanar PCBs (Co-PCBs) was about 140 µg/t-waste and the toxicity
equivalent amount was 2.8 µg/t-waste. These values are measurements in existing incinerators and the PCB
amount released from a new incinerator is thought to be drastically lower. Kaba et al. (1993) measured PCB
concentrations in gas released from 10 existing old-type incinerators in Kyoto. The concentrations in emission
gases vary greatly from 61.6 ng/Nm3 to 155 µg/Nm3. There is a positive correlation between CO and PCB
concentration in emission gas at 0.1% significant level. Therefore, it is thought to be caused by the difference in
combustion conditions. The average PCB concentration in gases from 10 incinerators is 17700 ng/Nm3
(median: approx. 1800 ng/Nm3).
Chang et al. (1999) measured PCBs in flue gases released from local MSW incinerators in Korea and reported
that PCB concentrations in gases released from 9 furnaces were between 0.005 and 12 ng-TEQ/Nm3 (average:
1.72 ng-TEQ/Nm3) and the total amount released was 24.9 g-TEQ/y. For the calculation of the amount
released, it was assumed that the furnaces were operated for 300 days/y and the amount of emission gases were
5000 Nm3 per one-tonne waste. From these assumptions, the PCB amount released from the combustion of one
tonne waste is 8.6 µg-TEQ/t-waste.
37
Table 2.16 PCB Output/Input in MSW Incineration Facilities (Sakai et al., 1999 a and b)
Concentration Unit
Generation Amount
Released Total
Amount Input
Amount
Output
PCBs (Total)
Emission
48 (ng/Nm3) 5000
(Nm3/t waste)
240 (µg/t waste)
gas
Fly ash
26 (ng/g)
30 (kg/t waste)
790 (µg/t waste)
1000 (µg/t
13,000~33,000
Bottom ash
0.12 (ng/g)
150 (kg/t waste)
18 (µg/t waste)
waste)
(µg/t waste)
Co-PCBs
Emission
11 (ng/Nm3) 5000
(Nm3/t waste)
55 (µg/t waste)
(Total)
gas
Fly ash
2.7 (ng/g)
30 (kg/t waste)
81 (µg/t waste)
140 (µg/t
450 ~ 550 (µg/t
Bottom ash
0.012 (ng/g)
150 (kg/t waste)
1.9 (µg/t waste)
waste)
waste)
Co-PCBs
Emission
0.23
5000 (Nm3/t waste)
1.2 (µgTEQ/t
(TEQ)
gas
(ngTEQ/Nm3)
waste)
Fly ash
0.053 (ngTEQ/g)
30 (kg/t waste)
1.6 (µgTEQ/t
waste)
2.8
0.31 ~ 0.29
(µgTEQ/t
(µgTEQ/t waste)
Bottom ash
0.00023
150 (kg/t waste)
0.035 (µgTEQ/t
waste)
(ngTEQ/g)
waste)
PCDDs/DFs +
Emission
1.8 ~ 14
5000 (Nm3/t waste)
9 ~ 70 (µgTEQ/t
Co-PCBs
gas
(ngTEQ/Nm3)
waste)
(TEQ)
Fly ash
5.0 (ngTEQ/g)
30 (kg/t waste)
150 (µgTEQ/t
waste)
160 ~ 220
1.5 (µgTEQ/t
(µgTEQ/t
waste)
Bottom ash
0.021 (ngTEQ/g)
150 (kg/t waste)
3.2 (µgTEQ/t
wastee)
waste)
The PCB concentrations in gases released from 12 MSW incinerators in the US were between non detectable
(ND) and 7000 ng/Nm3 (average: 1800 ng/Nm3, median: 275 ng/Nm3). Those in 10 hazardous waste
incineration facilities were between 21 and 14700 ng/Nm3 (average: 2430 ng/Nm3, median: 755 ng/Nm3)
(Lemieux et al., 1999). As mentioned above, the measurements of the PCB amounts released from incineration
facilities is variable, which is thought to be caused by the difference in incineration conditions.
2.2.3.2.2
PCBs in ChemicalBy-Products
HCB and PCP contain high levels of PCBs among agricultural chemicals. It has been observed that PCBs in
sediments and soils in the area of Ya-Er Lake were about 8200 ng-PCB/(g dry wt) in soils, which is supposed
to be caused by a chemical plant around the lake area. This chemical plant has not manufactured PCBs, but
HCB and PCP. It is assumed that PCBs generated as a by-product from the manufacturing process of these
chemicals was released through drainage. PCB concentrations in inks and pigments are reported. The PCB
concentrations in 7 samples of printing inks used in Denmark were between 1~184 ppb (average: 52 ppb,
median: 16 ppb) (Rastogi et. al, 1992).
2.2.3.2.3
PCBs in Secondary Sources
Sewage sludge is sometimes applied for agricultural use. In the UK, 43% of the sewage sludge of 1.22 x 10⁶ t
(dry wt.) is used for agriculture, and the amount of PCBs in sewage sludge volatilising into the atmosphere was
about 85 kg/y (Harrad et al. 1994). Concentration range of 0.084~19 µg/g of PCBs were detected in 12 samples
of composts containing MSW and sewage sludge in the USA (average: approx. 4.2 µg/g, median: approx. 1.4
µg/g) (Malloy et al., 1993).
2.2.3.3 HCB
2.2.3.3.1
HCB in Pesticides
HCB is a byproduct formed during the production of some pesticides and remains as an impurity in these
products. It is used as a raw material for PCP, PCNB (pentachloronitrobenzene), TCTP (dimethyl 2,3,5,6-
terephthalate), chlorothalonil (TPN), and picloram. Some reports on HCB concentrations in these pesticides are
38
presented in Table 2.17. By multiplying the HCB concentrations by the usage of each pesticide, it is estimated
that in the 1990's, 580 kg/y of HCB entered the environment in the UK (UK National Env. Tech. Centre,
2000), 1270 kg/y in the US, and 6463 kg/y worldwide (Bailey, 2001). HCB has been detected in bottom
sediments in China, which presume the source to be impurities in PCP. Other reports suggest that the sources
could also be PCP or HCH. However, none of the reports mention the quantity of HCB that has entered the
environment.
Table 2.17 HCB Content Rates In Pesticides
Pentachloro
Pentachloro
Dimethyl-2,3,5,6-
Chlorothalonil
Picloram Reference
phenol
nitrobenzene
tetrachloro
terephthalate
(TPN)
(PCP)
(PCNB)
(TCTP)
0.52.0%
0.111%
ND
ND
--
Saito et al., 1976
(Average 1.0%)
(Average 7.7%)
Nishimura et al.,
-- 0.1%
--
--
--
1980
0.4%
0.7%
--
--
--
Ando et al., 1984
-- --
10%14%
--
--
Wapensy,
1969
0.04%
--
--
--
--
Schewetz et al., 1978
9% (1973)
-- --
--
--
Burns et al., 1974
8% (1974)
--
--
0.3% (1972)
--
--
Mumma et al, 1975
-- 1.8%11%
--
--
--
Sittig,
1980
0.5% (1983)
--
-- --
--
US-EPA,
1982**
0.1% (1988)
Average
< 0.05%
< 0.3%
< 0.05%
< 0.02%
Tobin, 1986**
0.01%
-- 0.05%
0.07%0.3%
0.0018%0.0026%
--
Benazon,
1999
0.005%0.01% 0.05%
0.1%
0.004% 0.005%
Bailey,
2001
* Per ingredient, or it was not confirmed whether per ingredient or per product
** Self-standards set by pesticide manufacturers in the US
2.2.3.3.2
HCB in Chemicals
HCB is formed as a byproduct during the manufacture of chlorinated organic solvents such as
tetrachloroethylene (PCE), trichloroethylene (TCE), and carbon tetrachloride. Although HCB is separated by
distillation of the solvents, traces may remain. Separated HCB may be found in the distillation bottom fractions.
It has been estimated that, from 1980 to 1983 in the US, 3178 t/y of HCB was produced as a byproduct from
the manufacture of PCE, TCE, and carbon tetrachloride whereas the amount of HCB produced as a byproduct
from the manufacture of chlorobenzene was about 0.0065 t/y (Jacoff et al., 1986). Thus, we can infer that the
three chlorinated solvents are the major sources of HCB. Calculating from the amounts of HCB by-products
and the production of chlorinated solvents gives a result of 124 kg-HCB/t-PCE.
However, not all of these HCB byproducts in solvent residues are released into the environment; most are
incinerated and disposed of in landfill sites. The rate of HCB decomposed by thermal incineration is reported to
be more than 99.97%99.99% in the US (Jacoff et al., 1986, Quinlivan et al., 1975). It has been estimated that
124 g of HCB was emitted for each tonne of chlorinated solvents produced, which results in a value 3 orders
of magnitude lower than the above-mentioned 124 kg-HCB/t-PCE and was equivalent to a 99.9%
decomposition rate during incineration.
In China, the Ya-Er Lake located in the eastern part of Wuhan city, Hubei Province along the lower reaches of
the Yangtze River had been polluted with HCB from 1962-1987 by direct discharge of effluent from a large
chemical factory located on the bank of the lake. The effluent discharge resulted in serious pollution of the
39
surrounding soils and lake (Liu et al., 1985; Zhang et al., 1980).
2.2.3.3.3
HCB from Waste Incineration
HCB emissions from incineration facilities are quite different, depending on the type of furnace, collection
method, and incineration temperature; the measured values of HCB concentrations in flue gas range widely
from 0.13 µg/m3 to a few hundred µg/m3. Komatsu et al. (1992) and Kaba et al. (1992) carried out research into
HCB emission routes; their findings are shown in Table 2.18. The most important emission route was thought
to be in the form of flue gas, accounting for 62%97.9%, followed by 1.9%38% (42.42020 ng/g dry wt) in
flyash, 0%0.2% ND28.7 ng/g dry wt) in incinerator ash, with negligible amounts found in the cooling water
for the flue gas. With regard to the HCB emissions originating from municipal solid waste incineration, values
of 56056000 kg/y were measured in the 1990's worldwide (Bailey, 2001). Although the range of estimated
HCB emission factors was wide, most were within 1100 mg/t-waste. Multiplying these emission factors by
40 million t/y, which was the annual amount of municipal waste incinerated in the 1990's in Japan, the total
HCB emissions were estimated to be 404000 kg-HCB/y.
Table 2.18 HCB Emission Factors Derived from Municipal Solid Waste Incineration in Japan
HCB Concentration in Flue Gas
HCB Emission Factor
(µg/Nm3)
(mg/t-waste)
Minimum Maximum Average Minimum Maximum Average
0.03 3.2 1.3 1.0
51 19
0.16 12 2.9 0.80
90 24
0.36 14 7.9 3.6
200 76
0.05 0.09
0.063
0.32
0.61
0.44
0.04 3.5 1.6 0.29
25 12
0.82 110 38
5.7 770 270
6 110 59 90
1700
880
11
77
0.11
0.77
Another controlled combustion process is cement production. Using data from a survey conducted by the
Canadian Portland Cement Association, the HCB emission factor in cement production to be 0.17 mg-HCB/t-
cement (Bailey, 2001). The production of cement in Japan has been 70 000 00090 000 000 t/y from the late
1970's to the present; thus, HCB emissions are presumed to be approximately 10 kg-HCB/y. Even though
uncontrolled combustion processes, such as fires and open burning, can be considered to increase the amount of
HCB released to the environment owing to incomplete combustion, there are not many available data. With a
simulation of open burning in steel drums, Lemieux (1999) estimated HCB emissions to be 2248 mg-HCB/t-
waste, 2 orders of magnitude higher than the emission factor estimated above for recent municipal waste
incineration.
2.2.3.4 PCP
In the manufacturing of PCP, other PTS chemicals can be produced as intermediates. The manufacture of PCP
is a four step process whereby HCH is thermolysed in the presence of iron to yield chlorobenzenes which are
further chlorinated to produce HCB. HCB is then hydrolysed in alkaline conditions to produce PCP. During its
manufacturing, a certain amount of solid waste can be produced which may contain about 10% PCDD/PCDF
(Bao et al., 1989). Further information on the production of these PTS as intermediates or as by-products is
provided in a later section. Technical grade PCP, which is approximately 86% pure has historically contained
PCDD/PCDF (e.g. tetra-, hexa- and octochlorodibenzo-p-dioxins) and HCB as manufacturing by-products
(Extoxnet, 1996) .
In addition to the presence of PCP in the environment due to its uses as stated above, PCP can also be
unintentionally produced. PCP can be emitted from various sources, such as from the timber industry (through
leakage and volatilisation), textile industry, mushroom cultivation, combustion processes (coal, cokes, fluid
fuels/gas, treated wood, gasoline), and sewage sludge. (Wild et. al., 1992). While the emission from wood
treatment shows high values, cultivation of mushrooms was only indicated as an agricultural purpose. The
emission from the combustion process was estimated on the basis of PCP concentration in fly ash, not taking
40
into consideration PCP in flue gas.
Wikstroem et al. (1999) reported that PCP concentration in the flue gas ranged from 0.13 to 2.24 µg/Nm3
(n=11, the average 0.73 and the medium 0.45µg/Nm3) based on the results of combustion experiments of
artificial municipal solid wastes by means of laboratory-scale fluid bed furnace. If the flue gas emission per
waste-tonne is assumed to be 5000 Nm3, the emission factor will be 0.65-11.2 mg/t waste.
2.2.3.5 Polycyclic Aromatic Hydrocarbons (PAHs)
PAHs are ubiquitous and are formed during incomplete combustion of fossil fuels and other organic
compounds. It may also arise from petrochemical industrial practices. Among the many hydrocarbons,
benzo[a]pyrene poses the most concern since it is the most carcinogenic.
The main sources of PAHs in the Region are generated from power plants, automobile exhaust, coal industry
and metal production (aluminium, iron and steel industry).
In the Asian Region of Russian Federation, the major sources of PAHs are from the aluminium and coal
industry. There are large aluminium plants located in Krasnoyarsk and coal burning is predominant in the cities
of Irkutsk Region (e.g. Bratsk, Shelehovo, Sayansk). The highest concentrations are registered in cities with
cold climatic conditions where coal is used and aluminium plants are located Chita, Shelehovo,
Novokuznetsk, Bratsk, Zima, Kansk, Irkutsk, Yujno-Sahalinsk, and Ulan-Ude (Revich, 2002). In the Russian
Federation, automobiles are also major PAHs contributors to air pollution. For example, PAHs generated from
leaded gasoline vehicles and vehicles that have not been fitted with exhaust gas catalytic afterburners. PAHs
are also prevalent in the Asian Region of Russian Federation which is dominated by the coal and petroleum
industry.
In China, many studies have been carried out on PAH sources in the Pearl River Delta. The sources of PAH
emissions in the Pearl River Delta are mainly non-point sources which are difficult to control. These include
wet and dry atmospheric deposition and river runoff. Major sources of PAHs are industrial sewages (both
petroleum-and combustion derived), vehicle emissions and power plant emissions. Mobile combustion
emissions are thought to be primary contributors to PAH contamination in the atmospheric environment of
several urban cities including Guangzhou, Hong Kong SAR and Macau SAR (Fu et al., 1997; Qi et al., 2001).
It has been reported that PAHs found in mangrove sediments of Hong Kong SAR originated from petrogenic
(oil spill and leakage from boats and ships) and pyrolytic inputs, discharge from municipal and industrial
wastewater and runoff (Tam et al., 2001). Stormwater runoff is likely to contain trace amounts of PAHs
originating from roadways and motor vehicle discharges. PAHs found in marine sediments are likely to have
originated from domestic sewage, stormwater runoff and industrial discharges. Overall, the occurrence of PAHs
is mainly combustion-derived opposed to petroleum-derived since there is no raw petroleum industry in Hong
Kong (Hong et al., 1995). Emissions from vehicles is a major PAH contributor in Hong Kong SAR. Local
deposition of PAH in Hong Kong SAR may be a more important source than long-range atmospheric
transportation (Lam, 2002).
2.2.4 Organic
Metals
2.2.4.1 Organic Tin Compounds
Butyltins have been considered as the most widely distributed marine toxic contaminants, especially in coastal
waters with frequent shipping activities (Page et al., 1996; Ruiz et al., 1996). Sources of TBT in coastal
environments are primarily attributed to leaching from ship paint. Owing to its extreme toxicity to aquatic life
even at low concentrations and its hormone disrupting effects on marine invertebrates (Thain and Waldock,
1986; Valkirs et al., 1987), tributyltin and other forms of organotin, such as phenyltin, have been legislatively
banned for use in anti-fouling paints since the late 1980's in most European and North American countries.
Unfortunately, only a few countries or Regions in Asia have such regulations.
In the Region, organic tins have not been produced or used in Mongolia, Kazakhstan, Kyrgyzstan, and
Uzbekistan. In Tajikistan, small quantities of organic tins are used, however further clarification is required.
Use has been restricted in Republic of Korea since 2000.
Studies have shown that butyltin compounds were widespread in the aquatic environment in China (Jiang et al.,
2001). In the Pearl River Delta of China, there are several large harbours; Huangpu Harbor and Victoria
Harbour are the most important for shipping activities. Both domestic and international vessels with TBT-
containing anti-fouling paint that sail and dock in the area are the main causes for the tributyltin contamination
41
in the coastal waters of the area (Fu, 2002). Relatively high concentrations of TBT have been found in
sediments from the Pearl River where more than 30 shipyards are located. Shipping and activities, especially at
shipyards are mainly responsible for the TBT contamination in the Region.
In Hong Kong SAR, regulations were introduced in 1992 to control the sale and usage of TBT paint. TBT is not
a registered pesticide in Hong Kong SAR, but is still widely used as anti-fouling paints under a special permit
system. Under the permit system, application of TBT paint is not allowed on vessels below 25 m in length with
the exemption of aluminum hull, and TBT paints can only be sold to permit holders in containers of 20 litres or
more. Its use is monitored via permit records. The consumption of TBT from 1996 to 2000 is shown below
(AFCD, 2001):
Table 2.18 Consumption of TBT in Hong Kong SAR(quantity in kg active ingredient) (1996-2000) (AFCD, 2001)
Organic
Tin
Compounds 1996 1997 1998 1999 2000
Sub-total
471 285 172 179 135 1,242
Tributyltin fluoride (TBTF)
Tributyltin methacrylate
(TBTM) copolymer
87,806 90,686 69,861 69,723 50,346 368,422
3,792 2,521 1,753 2,681 1,172 11,919
Tributyltin oxide (TBTO)
Total
92,069 93,492 71,786 72,583 51,653 381,583
In Japan, TBT was banned from production for pesticide use in 1977 and banned from household use in 1979.
Approximately 11840 t were used for antifouling paints. Production and use of tributyltin oxide (TBTO)
discontinued in 1989. The production of TPhT, which was banned in 1989, had an accumulated production of
346 t. TBT was banned from all new vessels in 1990 and banned from all vessels in 1992. Due to bans on
organotin compounds in Japan, a decrease of 82% concentration in Japanese waters between 1989 and 1996
have been reported (ORTEP, 2001).
2.2.4.2 Organic Mercury Compounds
Representative organic mercury compounds include alkyl mercury (e.g. methylmercury) and allylmercury (e.g.
phenylmercury acetate) which were used as pesticides and medicines. Methylmercury and ethyl mercury
chloride have been utilized for the sterilisation of seeds as a pesticide. Other sources of mercury include gold
mining activities and sites of demolished chemical factories. The most well known source of organic mercury
to the environment, usually released with wastewater, is the byproduct formation of methylmercury from
inorganic mercury used as catalyst in the production process of acetaldehyde from acetylene. Methylmercury
was the cause of Minamata disease in Japan. Approximately 1 kg catalysts were consumed per 1 t
acetaldehyde. The production of acetaldehyde in Japan in 1960 was 50,000 t, and the consumption of mercury
was 50 t annually.
In China, mercury is mainly used for the battery, lamp, gold extraction, chloro-alkali industry and medicine.
The total amount of mercury emission from coal combustion was estimated at about 296-302.9 t annually in the
mid-1990's with 213.8 t discharged into the atmosphere and the other 89.1 t remaining in ash and cinder. The
data collected from 15 provinces, autonomous Regions and cities showed that the average content of organic
mercury in coal was 0.037 mg/kg, accounting for 18.8% of total mercury in coal, and the average content of
organic mercury remaining in ash was 0.045 mg/kg, accounting for 28.1% of total mercury in ash. From 1978
through 1995, mercury emission had increased at an average of 4.8% per year.
In Mongolia, mercury was restricted in 1997, however, mercury contamination is a serious concern since a
large volume of mercury compounds have been used over the past 30 years for the purpose of gold extraction.
Presently, a large technogenic mercury placer exists in the Boroo riverbed of the Selenge Aimage which is
located 120 km from Ulaanbaatar in northern Mongolia (Tumenbayer et al., 2000). In 2000, the Ministry of
Nature and Environment of Mongolia implemented a project to remove mercury accumulated in the river
sediment. Due to efforts of the project, 25 kg of mercury was removed from 400 m3 river sediment over a 0.4
km2 area (Namkhai, 2002).
In the Russian Federation, a large number of toxic substances, including mercury lamps, are disposed of in
MSW landfills. Approximately 22.5 t of Granosan (ethyl mercury chloride), a mercury-containing chemical
42
used as a fungicide for grains, are stockpiled on nine storage areas of Yakutia (Sakha) in the Asian part of
Russian Federation. Stockpiles of Granosan in the Amursk Region and the Krasnoyarsk Region, have also been
found to be 20 t and 3 t, respectively. Granosan was banned in 1994. In both the Chita Region and the Altai
Region, organomercury has been used for gold mining. In addition, plants in Usolie-Sibirskoe and Sayansk
(Irkutsk Region) among others utilised mercury electrolysis in the production of chlorine. Mercury from these
plants has polluted the sediments, water and fishes of the Bratsk reservoir (Revich, 2002).
In Kazakhstan, Kyrgyzstan, Tajikistan and Uzbekistan, mercury producing plants are still in operation, however
very little information is available.
2.3 DATA
GAPS
As mentioned earlier in Section 2.1, the 18 persistent toxic substances reviewed for Region VII were scored
according to the degree of data gaps experienced for PTS sources, by participants of the 3-day 1st Technical
Workshop. None of the chemicals had a score of `0' representing the establishment of full data sets, complete
evidence and/or ongoing monitoring data available. Ten of the toxic substances, consisting mostly of pesticides
were assigned a score of `1' indicating limited available data, conflicting data, and /or further monitoring data
are required on a wider scale. A score of `2' was assigned to 8 of the chemicals which consisted of mainly
industrial chemicals (PCBs, PBDE, HCB) and unintentional by-products (PCDD/PCDF, PAHs). PCP and
organic mercury were also scored `2'. For these 8 chemicals, there is very little or unreliable source data
available.
In general, inventories of PTS sources are not well documented in the Region, in particular for developing
countries and countries with economies in transition. There is basically little information available on PTS in
DPRK, and inventories of PTS sources in the Russian Federation have mainly been devoted to the industrially
developed European part of Russia where the population is greatest. There is a scarcity of reliable data on the
sources of PTS in the Asian territory of Russia (Siberia and Far East). Little information is available on the
quantity and location of obsolete pesticides in the CIS countries. In some cases, obsolete pesticides have not
been properly labelled, therefore the identities of pesticides are often unknown. Furthermore, environmental
management and health controls in developing countries have not been adequately implemented to support their
rapid industrialisation, thus resulting in stockpiling of obsolete pesticides and releases of toxic emissions to the
environment.
For some countries, although some PTS sources have been or are being monitored, the list of PTS monitored is
often shorter than the Stockholm Convention's list of 12 POPs, resulting in data gaps. For example, in Russia,
there is almost a complete lack of data on HCB stocks and occurrence. In Kazakhstan, there are no source
inventories particularly focused on PTS. In Tajikistan, there is little or no monitoring of PCDD/PCDF and
PAHs, and monitoring systems for obsolete pesticide stocks in Uzbekistan have not been established.
PCDD/PCDF sources have also been poorly investigated in the developing countries. Calls for sound efforts
aimed at emission inventory compilation are necessary.
In the Region, open burning and forest fires could be a fairly significant contributor of PCDD/PCDF and PAHs
emissions to the atmosphere, however, almost little or no information is available. In Russian Federation, forest
fires annually destroy huge taiga massifs, some of which had been treated with pesticides.
2.4 SUMMARY OF HOT SPOTS AND MOST SIGNIFICANT REGIONAL SOURCES
Hot spots are specific locations that have been significantly affected by PTS sources resulting from non-
anthropogenic or anthropogenic activities. The hot spots pose significant adverse impacts to the environment
and require urgent remedial actions.
In the Central and North East Asia Region, the former Soviet Union has major hot spots for obsolete pesticides.
A meeting held in Moscow on 7-8 February, 2001 by the Arctic Council for the "The ecological reasonable
mangement in field of stores of out-of-date pesticides" project have identified priority Regions whereby the
inventory of out-of-date pesticides should be documented. These Regions are the Kamchatka Peninsula,
Krasnoyarsk Krai, Magadan Oblast, Sakha Republic (Yakutia) and Tyumen Oblast of the Russian Federation.
Furthermore, inventory for out-of-date pesticides in three sub-boreal Regions have been identified: Altai Krai,
Kurgan and Omsk Oblast (Shekhovtsov, 2002). Members of the Commonwealth of Independent States have a
large quantity of PTS which are obsolete and redundant. A conservative estimate suggests there is greater than
150000 t of obsolete pesticides. Much is in poor condition and not properly managed (PAN UK, 2000). In
43
Kyrgyzstan, obsolete pesiticides such as aldrin and DDT are buried, however information about quantity and
location are not available. For some countries, such as Kazakhstan, the identification of hot spots is premature
due to the lack of detailed PTS inventories which are necessary to identify hot spots. Tajikistan was one of the
Regions leading users of pesticides (for cotton growing). Approximately 60% of all the pesticides used within
the country, were used for cotton crops. The amount of pesticide varied from 1.29 to 2220 kg/km2, sometimes
reaching 5000 kg/ km2 in the past, but this has decreased substantially (i.e. 0.03 kg/ha) due to the price of
pesticides and a decrease in imports. There is also a problem with lack of control of import of obsolete
pesticides and burial of prohibited PTS. In Turkmenistan, almost all pesticides are buried due to the lack of
management and insufficient expertise for management. In Uzbekistan, greatest stocks of out-dated pesticides
are located in the Surkhan-Darya area (southern Uzbekistan).
In the Pearl River Delta, it is estimated that 76,000 100,000 t of organochlorine pesticides were used annually
from 1972 to 1982 (Hua and Shan, 1996). Approximately 1.8 to 2.7 kg per metric acre of these pesticides were
applied to the agricultural zones around the delta region (GAEMS, 1996). Although production and usage of
DDT and HCHs have been officially banned in China since 1983, organochlorine pollutants found in the
environment around the delta region are most likely derived from organochlorine pesticide residues in
agricultural soils. The pesticides ultimately enter into the Pearl River through evaporation (including wind-
driven transport of suspended particulates) and surface runoff. The Pearl River carries a considerable load of up
to 863 t per annum (Zhou et al., 1997) of chlorinated pesticides. There is evidence from the distribution profiles
of DDT and its degradation products that current input of fresh DDT as an impurity of other pesticides may still
continue in some areas of the Pearl River Delta.
The Russian Federation is notably contaminated with PCBs especially in the Asian part due to the presence of
numerous large hydroelectric power stations and thermal power stations, railroads, and also industrial plants.
Uncontrolled burning of municipal waste is a noticeable contributor to PCDD/PCDF in addition to industries
producing chloro-alkali as PCDD/PCDF is released as a by-product during the manufacture of certain
chemicals, such as chlorophenols.
2.5 CONCLUSIONS
In general, for all of the countries of the Region, information on source inventories of PTS are not as readily
available as information on levels of PTS in environmental compartments. In particular, many of the
developing countries or countries with economies in transition have not established source inventories for PTS.
Of the countries, Japan has taken the lead in the characterisation of PTS as it has been building a relatively
broad database on PTS over the past three decades. The Republic of Korea is also relatively advanced in her
development of PTS source inventories. Through the collection of PTS information from the various countries
of the Region, it is noted that although some of the countries lack sufficient monitoring of PTS, programs on
emission control, and adequate quality control, the awareness of PTS issues is growing.
In the Central and North East Asia Region, the group of chemicals that are of high priority are PCDD/PCDF,
PCBs, PAHs, DDT and HCH as there is either a) still major production of the chemical for local and export
use, b) evidence of the chemical as a contaminant in large scale production of other chemicals, c) known
emissions of the chemical from large scale incinerators or chlorine bleaching of pulp or other related
combustion facilities, d) evidence of leakage from major stockpiles of the chemical, e) large-scale use of the
chemical throughout the Region, and/or f) spatial and/or temporal trends increasing Regionally from levels
above threshold. For these chemicals except for DDT and HCH, information on sources is also noticeably
insufficient or unreliable.
44
3 ENVIRONMENTAL LEVELS, TOXICOLOGICAL AND
ECOTOXICOLOGICAL PATTERNS
3.1 INTRODUCTION
This chapter deals with the environmental levels and trends, and toxicological and ecotoxicological effects of
PTS in the Region. The relative spatial and temporal variations in environmental concentrations of PTS are
described. The following section addresses hot spots whereby relatively high concentrations of PTS have been
reported in a variety of sources.
In Region VII, the awareness of significant environmental and human health effects of PTS have only relatively
recently been growing. Thus, the data reported herein are insufficient to make a full review of the spatial and
temporal variations as well as toxicological and ecotoxicological effects in this Region. For example, the
standard methods for sampling and analytical measurements of PTS have not been established among most
countries. Thus, data gaps are briefly explained, followed by the conclusion section.
3.1.1 Scoring of PTS
As mentioned in the methodology section of Chapter 1, a scoring mechanism was utilised as a tool to prioritise
the 18 selected PTS of Region VII. Detailed instructions for scoring can be found in Annex 1. The scoring
results based on a collective effort of all the participants of the 1st and 2nd Technical Workshops have been
prioritised according to level of concern and data gaps (Table 3.1).
Table 3.1 Scoring for Prioritizing PTS for Environmental Levels, Toxicology and Ecotoxicology and Data Gaps
Environ.
Toxicol.
Ecotoxicol.
Chemicals
Data Gaps
Data Gaps
Data Gaps
Levels
Effects
Effects
PCDD
2 2 2 2 2 2
PCDF
2
2 2 2 2 2
PCBs
2 2 2 2 2 2
DDT
2 2 2 2 2 2
PAHs
2 2 2 2 2 2
Toxaphene 1 2 0 1 0 1
HCH
1 2 2 2 1 2
PCP
1 1 1 1 1 1
Org
Hg
Cmpds
1 1 1 1 1 1
Org
Tin
Cmpds
1 1 1 1 1 1
PBDE
1 1 1 2 1 2
Chlordane 1 0 0 0 0 0
HCB
1 0 1 1 1 1
Heptachlor 0 1 0 1 0 1
Aldrin
0 0 0 1 0 1
Dieldrin
0 0 0 0 0 0
Endrin
0 0 0 0 0 0
Mirex
0 0 0 0 0 0
Score=0-chemical is of no concern/supportive data is collected
45
Score=1-chemical has local concern/supportive data is limited
Score=2-chemical has Regional concern/supportive data is lacking
In interpreting the scores, it is important to note that different scores for chemicals indicate that the chemicals
are of different levels of concern. For example, a chemical having a score of `2' is a chemical of Regional
concern compared to a chemical having a score of `1' indicating a chemical of local concern. The scoring
system does not provide any information on the ranking or prioritisation of chemicals having the same level
scores i.e. in the table above, the chemicals have been grouped according to score, but they are not ranked
within each group.
The results of the scoring exercise indicate that PCDD/PCDF, PCBs, DDT and PAHs are chemicals of
Regional concern for environmental levels and ecotoxicological effects, and these five PTS in addition to HCH
are of Regional concern for human effects.
With regards to data gaps, there are insufficient reliable data on 8 of the 18 chemicals. These chemicals are
mainly industrial chemicals (PCBs, HCH and PBDE) and unintentional by-products (PCDD/PCDF, PAHs).
There is also insufficient information available for DDT and toxaphene.
3.2 LEVELS AND TRENDS
A few reports from government and academia have been published with regards to PTS levels and trends in the
Region. Some data without references came from the data in questionnaires submitted to the UNEP/GEF PTS
program. In the following tables, a value of 0 means less than detection limit of an analytical method used for
the analysis.
3.2.1 Air/Deposition
Table 3.2 presents the range of concentration of 8 PTS in air sample conducted in four countries.
Table 3.2 Concentrations of PTS in air samples from Region VII (ng/m3)
Country
China Japan
Russian
Federation
Republic of Korea
Chemicals
DDTs
0.004 ~ 0.116
PCDD/PCDF *
0.0073 ~ 1.0*1
0.015 ~ 1.496*5
Endrin
0.022
0.18 ~ 0.4
HCB
0.070 ~ 0.170
0.020 ~ 0.387*5
0.013 ~ 1.1*2
Heptachlor
0.001 ~ 0.002
0.012 ~ 48
PAHs
~ 124*6
0.001 ~ 1.663*5
0.042 ~ 2.7*3
0.13 ~ 1.4
PCBs
0.297 ~ 0.537 **
0.009 ~ 0.023
0.091 ~ 2.3*4
Toxaphene
0.011 ~ 0.021
Italic data reported in questionnaires completed and submitted to the project website http://www.chem.unep.ch/pts/
* : The unit of dioxins is pg-TEQ/m3
**: PCBs concentrations in gas phase; 0.048 0.157 ng/m3 in particulate phase
*1: Dioxins Surveillance Data (2000) from Ministry of the Environment, Japan
*2: Chemicals in the Environment, Ministry of the Environment, Japan (2000)
*3: Chemicals in the Environment, Ministry of the Environment, Japan (2001)
*4: Chemicals in the Environment, Ministry of the Environment, Japan (2001)
*5: Annual Report of EDCs Research Project, NIER (2000)
*6: Reported in Bratsk city, Irkutsk oblast (Revich, 2002)
46
In a study on wet and dry deposition of organochlorine pesticides in the Pearl River Delta, China, the wet and
dry deposition samples collected from 14 stations from April to June 2001 were analysed to assess their
deposition fluxes in order to gain an insight into their possible migration processes in air. The deposition fluxes
of HCHs and DDTs were within the range of 0.6-9.4 ng/m2/day and 0.4-15.0 ng/m2/day, respectively.
Organochlorines such as DDTs, HCHs, heptachlor, and dieldrin were detected in aerosol samples collected
from Guangzhou, Shenzhen, Zhuhai, and Hong Kong SAR cities in the Pearl River Delta (Cheng et al., 2000).
Concentrations of DDTs in aerosols were higher in Guangzhou and Zhuhai than those in other cities in this
region.
PCB levels were measured in gas and particulate phase of air sampled from three cities (Guangzhou, Shenzhen
and Zhaoqing) in the Pearl River Delta (Li et al., 2001). The study reported PCB concentrations of 0.297 to
0.537 ng/m3 in gas phase, and 0.048-0.157 ng/m3 in particulate phase.
In the 2000 National Dioxin (PCDD+PCDF+co-PCB) Survey of Japan, the average atmospheric levels
(gas+particulates), of 920 sites were reported to be 0.15 pg-TEQ/m3 with a range of 0.073 to 1.0 pg-TEQ/m3
(National Dioxin Survey, Ministry of the Environment, Japan, 2000). The levels in 10 sites (1.1 % of total)
exceeded the Air Environment Standard (0.6 pg-TEQ/m3) of Japan.
In 2000, PCBs were detected in all the air samples in 15 cities all over Japan, with a range between 0.13 and 1.4
ng/m3 (Ministry of the Environment, Japan, Chemicals in the Environment, 2000). HCB was detected in all the
sampling sites (which were grouped into three categories: (a) near the sources, (b) residential areas and (c)
suburbs) at with a range of 0.18 to 0.4 ng/m3, and average of 0.27 ng/m3. No clear difference could be observed
among the three categories (Ministry of the Environment, Japan, Endocrine Disruptive Chemicals Survey,
2000).
In the early 1990s, atmospheric concentrations of several organochlorine compounds at Lake Baikal in the
Russian Federation were reported. Levels of HCB and PCBs were reported to be 70-170 and 8.7-23 pg/m3,
respectively (Iwata et al., 1995), while toxaphene levels were 11 to 21 pg/m3 (McConnell et al., 1993). The
chromatographic pattern of toxaphene was extremely "weathered" compared with the standard, and the
congener pattern of air samples was similar to lake water, indicating the importance of atmospheric deposition
processes.
In 2000, organochlorines in air samples of Republic of Korea were reported, and the levels of HCB, PAHs and
PCDD/PCDF were 0.02-0.387 ng/m3, 0.001-1.663 ng/m3, and 0.015-1.496 pg-TEQ/m3, respectively (NIER,
Annual Report of EDCs Research Project, 2000). In addition, PCDD/PCDF levels in Republic of Korea were
reported to be 0.593, 0.244 and 0.122 pg-TEQ/m3 for large, medium and small cities, respectively (NIER,
Annual Report of EDCs Research Project, 2000).
In the Asian part of the Russian Federation (Siberia and Far East), the total air emissions of benzo(a)pyrene
have been monitored in major provinces and cities and are shown in Table 3.3. The major contribution of PAHs
is from vehicular emissions.
Table 3.3 Emission of PAH (Benzo(a)pyrene) in the Asian Regions of Russian Federation, 1999 (Shekhovtsov, 2002)
Region
Total Air Emission, t
Sverdlovsk oblast
3.52
Chelyabinsk oblast
0.43
Novosibirsk oblast
0.12
Omsk oblast
1.45
Tomsk oblast
0.01
Krasnoyarski krai
2.93
Altaiski krai
0.70
Kemerov oblast
1.08
Chitinskaya oblast
0.01
Magadanskaya oblast
1.80
47
Yakutiya (Sakha)
0.09
Primorski krai
0.80
Sakhalinskaya oblast
0.001
Chukotka aut.okrug
0.02
3.2.2 Surface Waters (Water and Sediment)
3.2.2.1 Seas/Oceans
3.2.2.1.1 Water
A few reports have been published for the PTS concentrations of water samples in this Region. The
concentrations published were very high for some countries, as shown in Table 3.4.
Table 3.4 Concentrations of PTS in Sea Water Samples from Region VII (ng/m3)
Country
Kazakhstan Japan
Chemicals
PCDD/PCDF*
0.012 ~ 2.2*1
HCH
0 ~ 40
0 ~ 150
PCBs
0.11 ~ 2.8*2
Italic data reported in questionnaires completed and submitted to the project website http://www.chem.unep.ch/pts/
*: The unit of dioxins is pg-TEQ/L
*1: Dioxin Surveillance Data, Ministry of the Environment, Japan (2000)
*2: Chemicals in the Environment, Ministry of the Environment, Japan (2001)
In water environment (both river water and coastal sea water) in 1997 of Japan, the sum of PCDD/PCDF
reported by the Ministry of the Environment gave the average concentration of 0.37 pg-TEQ/m3 at 12 sites with
variations between 0.005 and 3.9 pg-TEQ/m3, and the data from the local governments at 21 sites ranged from
ND (not detected) to 0.4 pg-TEQ/m3 with an average concentration of 0.061 pg-TEQ/m3. It should be
mentioned here that they did not classify whether the water system was a sea or inland.
In the Japan National Dioxin (PCDD+PCDF+co-planar PCB) Survey in 2000, the average level in water
(rivers, lakes and coastal sea water) in a total of 2,116 sites was reported to be 0.31 pg-TEQ/L with a range of
0.012 to 48 pg-TEQ/L (Ministry of the Environment, Japan, National Dioxin Survey, 2000). The levels in 83
sites (3.9 % or total) exceeded Water Environment Standard (1pg-TEQ/L) of Japan. In general, PCDD/PCDF
levels in coastal water were an order of magnitude lower than those in rivers. The average level in ground water
(total 1,479 sites) was 0.097 pg-TEQ/L, ranging from 0.00081 to 0.89 pg-TEQ/L. Total PCB analyzed in 1999
ranged from ND (less than 0.01ng/L for each isomer) to 150 with a detection frequency of 131 among 171
samples (Ministry of the Environment, Japan, Endocrine Disruptive Chemicals Survey, 2000).
3.2.2.1.2 Sediment
In sediment samples of China and the Republic of Korea, organochlorines such as DDT, dieldrin, HCH, PAHs
and PCBs were detected. They are shown in Table 3.5.
Table 3.5 Concentrations of PTS in Marine Sediment Samples in Region VII (µg/kg)
Country
China
Japan
Kazakhstan
Republic of Korea
Chemicals
Aldrin
0*3
48
0 ~ 12.9
Chlordane
0 ~ 0.21*3
ND ~ 11.1*1
0 ~ 31.9
DDTs
1.56 ~ 1,629
6 ~ 4,600
0 ~ 1.26*3
ND ~ 17.2*1
Dieldrin
2.4 ~ 11
ND ~ 0.02*1
0 ~ 0.10*3
Dioxins *
0.018 ~ 470*2
Endrin
0 ~ 0.25*3
HCB
ND ~ 4.9*1
0 ~ 0.21*3
HCH
0.43 ~ 17
ND ~ 2.8*1
0 ~ 2.07*3
Heptachlor
0 ~0.01*3
Mirex
0*3
PAHs
39 ~ 68,560
98.8 ~ 2,300 **,*1
1.19 ~ 1,093*3
0 ~ 770
PCBs
5 ~ 750
0 ~ 1.62*3
0.54 ~ 750*1
TBT
0 ~ 450
TPT
0 ~ 62
Italic data reported in questionnaires completed and submitted to the project website http://www.chem.unep.ch/pts/
* : The unit of dioxins is pg-TEQ/g
**: Concentration of only benzo(a)pyrene of PAHs
*1: Chemicals in the Environment, Ministry of the Environment (2001)
*2: Dioxin Surveillance Data, Ministry of the Environment (2000)
*3: "Monitoring of POPs in the coastal environment, KORDI (2001)
In the National Dioxin (PCDD/F+co-PCB) Survey in Japan in 2000, the average level in sediments (total 1836
sites) was 9.6 pg-TEQ/g, ranging from 0.0011 to 1400 pg-TEQ/g (Ministry of the Environment, Japan, National
Dioxin Survey, 2000). In the results of PCB analysis in 1999, 47 out of 48 samples showed detectable levels of
PCB ranging between ND (<0.01) to 770 ng/g wet wt (Ministry of the Environment, Japan, Endocrine
Disruptive Chemicals Survey, 1999). HCB was detected in some sediments (4 out of 17 sites) in 2000 with a
range of 0.18 to 4.9 ng/g dry wt (Ministry of the Environment, Japan, Chemicals in the Environment). B(a)P
was detected in 12 out of 17 sediment samples with a range of 2.4 to 2300 ng/g dry wt (Ministry of the
Environment, Japan, Chemicals in the Environment). Other polycyclic aromatic hydrocarbons, including
benzo(a)anthracene, benzo(e)pyrene, pyrene, anthracene, benzo(ghi)perylene, phenanthrene etc., were also
detected in almost all samples with levels up to several hundreds ng/g dry. TBT and TPT were detected in high
frequencies, i.e., 85 out of 103 and 45 out of 99 sites, respectively, with levels up to 450 and 62 ng/g dry wt.,
respectively (Ministry of the Environment, Japan, Chemicals in the Environment).
3.2.2.2 Inland
Waters
3.2.2.2.1 Water
Chlordane, HCB, PCBs, toxaphene, DDTs, PCDD/PCDF and HCH were found in water samples of Japan,
Kazakhstan, Russian Federation and Republic of Korea as indicated in Table 3.6. PCDD/PCDF concentrations
of Republic of Korea were 0.001-1.061 pg TEQ/L (NIER, Annual Report of EDCs Research Project, 2000),
while HCH was reported at 1-322,000 ng/L in Kazakhstan (State Enterprise "Kazhydromet").
Table 3.6 Concentrations of PTS in Inland Water Samples from Region VII (ng/L)
Country
Japan
Kazakhstan
Russia
Republic of Korea
Chemicals
49
Chlordane
0.034
DDTs
0.405 ~ 1,200
0.053 ~ 5,900
PCDD/PCDF*
0.014 ~ 48*1
0.001 ~ 1.061*3
HCB
0.007 ~ 0.028
HCH
330 ~ 55,000
1 ~ 322,000
2 ~ 2,200
PCBs
0.095 ~ 8.4*2
0.018 ~ 0.590
Toxaphene
0.064
Italic data come from Italic data reported in questionnaires completed and submitted to the project website http://www.chem.unep.ch/pts/
*: The unit of dioxins is pg-TEQ/L
*1: Dioxin Surveillance data, Ministry of the Environment (2000)
*2: Chemicals in the Environment, Ministry of the Environment, Japan (2001)
*3: Annual Report of EDCs Research Project, NIER (2000)
-HCH concentration of Tya River in Buryatian Republic, Russian Federation was reported at 3 ng/L, while the
concentrations of -HCH and -HCH of Bargousin River were 1-2 ng/L and 2-4 ng/L, respectively. The total
concentration of -HCH and -HCH in the Selenga River was 2 ng/L (Regional Administration, and
Committee of Natural Resources, Russian Federation, 2001).
HCH concentration in water samples from the Lena River in Yakutya (Saha) region was 330-5500 ng/L. Total
concentrations of HCH and DDT compounds in water samples of the Ural River in Chelyabinsk region were
400-1,700 ng/L and 400-5,900 ng/L respectively, while those in Miass River were 60-2,200 ng/L and 280-
4,200 ng/L respectively. In Krasnoyarsk region, concentrations of -HCH, and -HCH in river water samples
were 22-98 and 16-96 ng/L respectively, while those in water samples from reservoirs were 0.098-0.099 and
0.090 ng/L, respectively. DDT was not detected in this region (Region Administration, and Committee of
Natural Resources, Russian Federation, 2001).
Organochlorine levels in Lake Baikal in the Russia Federation were analyzed in the early 1990s. Levels of
HCB and PCBs were reported to be 0.007-0.028 and 0.18-0.590 ng/L, respectively (Iwata et al., 1995). In
another report, total HCH, total chlordane, total DDT, and toxaphene in (dissolved+particulate) phases of water
in Lake Baikal were reported to be (1.340+ND), (0.028+0.006), (0.047+0.006), and (0.064+NA) ng/L,
respectively (Kucklick et al., 1993) (NA = not analyzed). HCHs and DDTs were analyzed in rivers of Russian
Federation (Kucklick et al., 1993). Ural, Volga and Ob River Basins were among the most polluted. In East
Russian Federation, Amur River sometimes showed relatively high levels of -HCH (<5-1840 ng/L), -HCH
(<5-620 ng/L) and DDT (<50-450 ng/L).
3.2.2.2.2 Sediment
DDTs, HCB, HCH, organic tins, PCBs, PAHs and PCDD/PCDF were detected in sediment samples of China,
Japan, Russian Federation, Kazakhstan and the Republic of Korea as shown in Table 3.7.
Table 3.7 Concentrations of PTS in Sediment Samples from Inland Waters in Region VII (µg/kg)
Republic of
Country
Russian
China Japan
Kazakhstan
Korea
Federation
Chemicals
(dry)
DDTs
0 ~ 38
ND ~ 11.7*3
0 ~ 53
0.02 ~ 64.5
0.002 ~ 20 *1
PCDD/PCDF*
0.03 ~ 7.7
0 ~ 0.244*5
16.1 ~ 50.7 *2
HCB
ND ~ 0.35*3
0.005 ~ 0.160
HCH
0.05 ~ 2.07
ND~ 2.9*3
47
0.015 ~ 69
50
Organic Tin compounds
1.7 ~ 379.7 **
ND ~ 220*3
0 ~ 3.82*5
PAHs
170 ~ 2,145
ND~ 76*3,*4
0 ~ 3*5
PCBs
43 ~ 461
0.042 ~ 160*3
188
0.08 ~ 6.1
Italic data reported in questionnaires completed and submitted to the project website http://www.chem.unep.ch/pts/
*: The unit of dioxins is pg-TEQ/g
**: Concentration of only TBT as organic tin compounds
*1: Sample from river sediments
*2: Samples from lake sediments
*3: Chemicals in the Environment, Ministry of the Environment (2001)
*4: Only benzo(a)pyrene was analyzed
*5: Annual Report of EDCs Research Project, NIER (2000)
The levels of organic tins (TBTs) in surface sediments from the Pearl River Delta were reported in the range
from 1.7 to 379.7 ng/g (Zhang et al., 2002). Compared to that in sediments from other parts of the world, the
TBT concentration in the Pearl River Delta sediments is relatively low. High TBT concentrations (328.7-377.7
ng/g) were found in sediments from the Front Channel of the Pearl River (Zhujiang) where more than 30
shipyards and ship-repairers were located. It was therefore suggested that shipping activities, especially at
shipyards, were mostly responsible for the TBT contamination in the Region.
In Japan, HCB was detected in some sediments 4 out of 17 sites in 2000 with a range of 0.18 to 4.9 ng/g dry wt.
In sediments of Japan, the sum of PCDD/PCDF reported by the Ministry of the Environment in 1997 ranged
from 0.002 to 20.0 pg-TEQ/g dry wt with an average of 3.68 pg-TEQ/g dry wt in river sediments, from 16.1 to
50.7 pg-TEQ/g dry wt with an average of 33.1 pg-TEQ/g dry wt in lake sediments, and from 0.012 to 49.3 pg-
TEQ/g dry wt with an average of 17.1 pg-TEQ/g dry wt in coastal sediments, respectively.
Sediment concentrations of PCDD/PCDF in Lake Baikal and Selenga River in Irkutsk Region of the Russian
Federation were reported to be 0.03 and 0.05 pg TEQ/g respectively, while that of the sediments near a
discharging point from a pulp and paper mill plant was 7.7 pg TEQ/g.
Total concentrations of HCH compounds and DDT compounds in bottom sediments in Ural River in
Chelyabinsk Region were 0.015-30 and 0.02-64.5 µg/kg respectively, while those in Miass River were 0.04-69
and 0.29-64.5 µg/kg respectively (Regional Administration, and Committee of Natural Resources, Russian
Federation, 2001).
In Lake Baikal sediments, levels of HCB, -HCH, -HCH, -HCH, p,p'-DDT, p,p'-DDE, p,p'-DDD, t-
chlordane, c-chlordane and PCB were reported to be 0.005-0.16, 0.006-0.054, 0.01-0.056, 0.003-0.009, 0.007-
0.83, 0.007-1.3, 0.009-0.6, <0.001, <0.001-0.002 and 0.08-6.1 ng/g dry wt., respectively (Iwata et al., 1995).
3.2.3 Groundwater
Few data have been reported on the PTS concentrations in groundwater.
In ground water samples from Japan, PCDD/F concentrations ranged from 0.00081 to 0.89 pg-TEQ/L at 1479
sites with no samples exceeding the Japanese Environmental Standards for Ground Water (1pg TEQ/L)
(Ministry of Environment, Japan, 2001).
3.2.4 Soils
Few data were reported for the detection and concentration of PCBs, PCDD/PCDF, PAHs, HCH in agricultural
soil samples. Concentrations of PCBs, PCDD/PCDF, and PAHs in agricultural soil samples of the Republic of
Korea were 0-1.215, 0-46.5, and 0-9 µg/kg, respectively. (NIER, Annual Report of EDCs Research Project,
2000).
3.2.4.1 Agricultural
Soils
A survey has been carried out on the levels of DDTs and HCHs in soils from the Pearl River Delta, China in
2000 (Zhang, et. al., 2001). Sixty-three soil samples were analyzed and the results showed DDTs (averaged
68.5 ng/g in all samples) ranged from 15-125 ng/g in 70% of the samples and HCHs (averaged 16.2 ng/g in all
samples) ranged from 2-30 ng/g in 80% of the samples were detected in agriculture soils as shown in Table 3.8.
Results of analyses of soil samples taken near one of the pits whereby DDT was disposed of in the Tomsk
51
oblast of the Russian Federation gave DDT concentrations ranging from 160-38500 µg/kg.
Table 3.8 Concentrations of Some PTS in Agricultural Soil Samples From Region VII (µg/kg)
Country
Russian
China Kazakhstan
Republic of Korea
Chemicals
Federation
DDTs
0.015 ~ 0.125
0.003 ~ 0.093
160-38,500*2
Dioxins *
0 ~ 46.5*1
HCH
0.002 ~ 0.030
0.022
10-110*2
PAHs
0 ~ 9*1
PCBs
0 ~ 1.215*1
Italic data reported in questionnaires completed and submitted to the project website http://www.chem.unep.ch/pts/
*: The unit of dioxins is ng-TEQ/kg
*1: Annual Report of EDCs Research Project, NIER (2000)
*2: Yufit and Grosheva, 2002
3.2.4.2 Unmanaged
Soils
Tble 3.9 Concentrations of PTS in Unmanaged Soil Samples from Region VII (µg/kg)
Country
China Japan
Kazakhstan
Russia
Chemicals
DDTs 6.7
6.7
PCDD/PCDF *
0.11 ~ 0.15
0 ~1,200
0.12 ~ 370
0.22 ~ 0.75
HCB
0.05 ~ 1.6
HCH
0.18 ~ 8.2
10
0 ~ 10
1~ 110
PAHs
0.92
PCBs
7.1 ~ 8.2
1.4 ~ 92
Italic data reported in questionnaires completed and submitted to the project website http://www.chem.unep.ch/pts/
*: The unit of dioxins is ng-TEQ/kg
According to Table 3.9, in the National Dioxin Survey (PCDD+PCDF+co-planar PCB) in Japan in 2000, the
average level in soil (total 3,031 sites) was 6.9 pg-TEQ/g, ranging from 0 to 1,200 pg-TEQ/g (National Dioxin
Survey, Ministry of the Environment, Japan, 2000). One location near the source exceeded the Soil
Environment Standard (1,000 pg-TEQ/g) of Japan. PCP and -HCH were detected in 1 out of 94 soil samples
with 12 and 10 ng/g dry wt, respectively (Ministry of the Environment, Japan, Endocrine Disruptive Chemicals
Survey). The other HCHs were not detected at all.
In soils around Lake Baikal, levels of HCB, and PCBs were reported to be 0.05-1.6 and 1.4-92 ng/g dry wt,
respectively (Iwata et al., 1995).
A survey had been carried out on the levels of DDTs and HCHs in soils from the Pearl River Delta, China in
2000 (Zhang, et. al., 2001). The concentrations of DDTs (averaged 6.7 ng/g) and HCHs (average 8.2 ng/g) in
the non-cultivated soils were lower than those in the cultivated soils.
HCH levels in soils of Tibet were reported to be 0.18-5.38 ng/g (Fu et al., 2001).
Soils from an industrial area near Angara of Irkutsk Region showed 312 pg TEQ/g of dioxin concentrations in
soils while the background concentration was 0.22-0.75 pg TEQ/g. In Tomsk Region, forest had been treated
with DDT and HCH from 1953 to 1957. A variety of pesticides were detected from the soil samples whereby
DDT: 0.16-38.5 mg/kg, DDD ND-1.6 mg/kg, DDE ND-0.99 mg/kg, and HCH 0.01-0.11 mg/kg. PAH
52
concentration in Sibkabel was reported to be 920 µg/g. HCH concentration of soil near Lena River in Yakutya
(Saha) Region was 0.001-0.017 mg/kg (Regional Administration, and Committee of Natural Resources of
Dioxins, Russian Federation, 2001).
HCH level in Kazakhstan was reported to be very high, 1000-1967 µg/kg. The sum of dioxins in soils varied
considerably, and ranged from 0.12 to 370 pg-TEQ/g, and 0.001 to 550 pg-TEQ/g near the incinerators
(Regional Administration, and Committee of Natural Resources, Kazakhstan, 2001).
3.2.5 Aquatic
Biota
The ranges of DDTs, HCHs, and PCBs in tilapia (fish) collected from inland river systems of Hong Kong SAR
were 28.2-40.1 ng/g (dry wt), 2.04-3.76 ng/g (dry wt) and 267-310 ng/g (dry wt), respectively (Zhou et al.,
1999a). It was revealed that the homologue pattern of PCBs varied between fish species. Feeding habits of fish
intervened in the PCBs accumulation process. Higher contents of PCBs and chlorine numbers were found in
black bass (Micropterus salmoides) located in the highest trophic level (Zhou et al., 1999b).
In Japan in 1999, 40 samples among 70 showed PCB data greater than the quantification limit in fish
samples (edible parts). These data ranged from ND (quantification limit in biological samples was 10
ng/g wet wt tissue) to 780 ng/g wet wt tissue. In mussels (whole homogenates), 13 samples out of 30
were above the quantification limit, ranging from ND to 52 ng/g wet wt, and in birds (pectoral muscle) the
frequency of quantification was 7 out of 10, ranging from ND to 20 ng/g wet wt. Occasionally, high
concentration of PCBs have been reported in wildlife, especially those in top predators in the marine
environment. In a recent report from Prof. Tanabe and Prof. Iwata, Ehime University, the average concentration
of PCBs in the adipose tissue of black-footed albatross in Western Pacific Ocean was reported to be 90000
ng/g.
PCDD/PCDF levels in aquatic organisms in rivers, lakes and coastal environment of Japan were found to range
from ND to 1.33, with an average of 0.46 pg-TEQ/g wet wt, from 0.34 to 0.44 with an average of 0.38 pg-
TEQ/g wet wt, and from ND to 2.90 with the average of 0.83 pg-TEQ/g wet wt, respectively.
HCB analysis in Japan was also conducted on biological samples. HCB was detected in fishes, mussels and
birds with frequencies of 10 % (7 out of 69), 0 % (0 out of 30) and 50 % (5 out of 10), respectively (the
quantification limit was 1 ng/g wet wt). The levels, however, were very low with maximum values of 2 ng/g
wet wt in fishes and birds.
3.2.5.1 Marine
Organisms
Bivalves are commonly used to assess PTS in the marine environment as shown, for example, in Table 3.10.
Several studies have been conducted on the levels of organochlorines and other contaminants in green mussel
(Perna viridis) from the Pearl River Estuary (Fang et al., 2001) and Hong Kong SAR waters (Phillips et al.,
1985, Tanabe et al., 1987).
The levels of organotins in several marine organisms (fish, mussel and shrimp) from the Pearl River Estuary
(Zhang et al., 2002, in manuscript) were reported. Results for measurements of butyltin compounds in fish
muscle samples from three sampling sites, mussel samples from one sampling site and shrimp samples from
one sampling site in the Pearl River Estuary were reported. The TBT concentrations in the fish tissue samples
vary from 4.8 to 18.8 ng/g wet wt. The TBT concentration in the mussel sample (13.2 ng/g) was comparable to
that of the fish samples (18.8 ng/g), but higher than that of the shrimp sample (3.6 ng/g).
In Japan, TBT and TPT were detected in some marine fishes (10 and 13 out of 70 samples, respectively) with
levels up to 160 and 100 ng/g wet wt, respectively (Ministry of the Environment, Japan, Chemicals in the
Environment). Dieldrin was detected in 10 out of 70 fishes and in 5 out of 30 mussels with levels up to 4 and
160 ng/g wet wt, respectively.
Bivalves are commonly used to assess PTS in the marine environment as shown in Table 3.10.
53
Table 3.10 Concentrations of PTS in Bivalve Samples From Seawaters in Region VII (µg/kg)
Country
Japan
Republic of Korea
Chemicals
Aldrin
0 ~ 2.55*3
Chlordane
<1 ~ 37*1
1.34 ~7.12*3
Coplanar PCBs *
DDTs
<1 ~ 5*1
6.60 ~ 59.46*3
Dieldrin
<1 ~ 160*1
0 ~ 5.60*3
Dioxins *
0.32 ~ 0.82*,*2
Endrin
0 ~ 1.37*3
Furans *
HCH <1*1
2.02 ~ 22.63*3
Heptachlor
0 ~ 0.23*3
Hexachlorobenzene <1*1
0.08 ~ 1.06*3
Mirex
0 ~ 0.40*3
PAHs
149 ~ 1,141*3
3.2 ~ 9.9*1
PCBs
3.34 ~64.10*3
6.9*1
TBT <0.05*1
TPT
<0.02 ~ 0.02*1
Italic data reported in questionnaires completed and submitted to the project website http://www.chem.unep.ch/pts/
*: The unit of dioxins, furans, and coplanar PCBs is ng/kg
*1: Chemicals in the Environment, Ministry of the Environment, Japan (2001)
*2: Dioxins Surveillance Data, Ministry of the Environment, Japan (2001)
It includes PCDD, PCDF and Coplanar PCBs and its unit is ng-TEQ/kg
*3: Monitoring of POPs in the Coastal Environment, KORDI (2001)
Concentrations of PTS in crustacean samples in Japanese seawater were reported as: chlordane 31µg/kg, DDTs
180 µg/kg, HCH < 2 µg/kg HCB 8.5 µg/kg, PCBs 270 µg/kg. In fish samples concentrations were reported as:
chlordane 6.6-510 µg/kg, DDTs 20-12000 µg/kg, dieldrin 0-4 µg/kg, HCH 2.1-3100 µg/kg, HCB 1.3- 120
µg/kg and PCBs 0-1100 µg/kg.
The TBT concentration of marine fish samples from China was reported as 4.8-18.8 µg/kg, while the
PCDD/PCDF concentration of those in the Russian Federation was 35 ng/kg.
Table 3.11 Concentrations of PTS in Marine Fish Samples in Region VII (µg/kg)
Country
Russian
China Japan
Chemicals
Federation
6.6 ~ 510
Chlordane
<1 ~ 34*1
20 ~ 1,200
DDTs
<1 ~ 66*1
54
Dieldrin
<1 ~ 4*1
0.15 ~ 1.2 (shark)*2
Dioxins *
35
0.10 ~ 0.95 (cod) *2
2.1 ~ 3,100
HCH
<1 ~ 1*1
1.3 ~ 120
Hexachlorobenzene
<1
0 ~ 1,100
PCBs
<10 ~ 950*1
3.8 ~ 350*1
TBT
4.8 ~ 18.8
<50 ~ 160
TPT
<10 ~ 100
Italic data reported in questionnaires completed and submitted to the project website http://www.chem.unep.ch/pts/
*: The unit of dioxins is ng TEQ/kg
*1: Chemicals in the Environment, Ministry of the Environment, Japan (2001)
*2: Marine Environmental Monitoring, Ministry of the Environment (2000)
Several studies related to PTS concentrations in marine mammal, prawn or starfish samples were reported from
China, Japan and the Russian Federation (Table 3.12 - 3.13). In Japan, organic tins and PCBs in mammalian
samples were 50-18,000 and 320 µg/kg, respectively, while 40-41 µg/kg chlordane, 46-50 µg/kg DDTs, 13
µg/kg HCH, 5.9-7.8 µg/kg HCB, 460-470 µg/kg PCBs and 3.6 µg/kg of TBT in prawn samples were reported.
In starfish samples, 16-160 µg/kg chlordane, 49-170 µg/kg DDTs, 8.9-44 µg/kg HCH, 30 µg/kg HCB and 45
µg/kg PCBs were detected.
Table 3.12 Concentrations of PTS in Mammalian Samples from Seawaters in Region VII (µg/kg)
Country
China
Japan
Russian Federation
Chemicals
(dolphin, porpoise)
(sea lion, seal, whale)
(seal)
Chlordane
14 ~ 840
1,500 ~ 1,700
DDTs
2,600 ~ 160,000
12,000 ~ 30,000
54,000 ~ 62,000
HCH
5.4 ~ 2,200
200 ~ 220
Hexachlorobenzene
5.6 ~ 240
Organo Tin Compounds
13,000 ~ 21,000
50 ~ 18,000
PCBs
800 ~ 48,000
320
24,000 ~ 28,000
0.71 ~ 13*
PCDD/PCDF
17 ~ 360**
Toxaphene
930 ~ 1,300
Italic data reported in questionnaires completed and submitted to the project website http://www.chem.unep.ch/pts/
*: Muscle levels in the two whale species (pg TEQ/g wet)
**: Fat levels in the two whale species (pg TEQ/g fat)
55
Table 3.13 Concentrations of PTS in Crustacean, Prawn and Starfish Samples From Seawaters in Japan (µg/kg)
Species
Crustacean Prawn Starfish
Chemicals
Chlordane
31
40 ~ 41
16 ~ 160
DDTs
180
46 ~ 50
49 ~ 170
HCH
<2
13
8.9 ~ 44
Hexachlorobenzene
8.5
5.9 ~ 7.8
30
PCBs
270
460 ~ 470
45
TBT
3.6
Italic data reported in questionnaires completed and submitted to the project website http://www.chem.unep.ch/pts/
3.2.5.2 Freshwater
Table 3.14 shows some of the PTS concentrations in amphibian, bivalve and fish samples in Republic of Korea
were reported as 0.17 µ/g DDT, 0.636 pg-TEQ/g dioxins, 0.91 µg/kg HCB, 5.16 µg/kg organic tin compounds,
and 0.3 µg/kg PCB for amphibia samples, while 0.35 µg/kg chlordane, 4.2 µg/kg DDT, 4.053 pg-TEQ/kg
dioxins, 1.3 µg/kg HCB, 124.32 µg/kg organic tin compounds, and 57.4 µg/kg PCBs for fish samples.
In China, DDTs and PCBs were reported at 1-54 µg/kg and 1-17 µg/kg, respectively for bivalve samples, 5-
40.1 µg/kg DDT, 2-240 µg/kg HCH, and 267 µg/kg PCBs for fish samples, and 8-26 µg/kg DDT, 5.5 µg/kg
PCBs for prawn samples. The concentration of PTS in fish samples were reported from the Russian Federation
as 90-141 µg/kg chlordane, 280-30 µg/kg DDTs, 20-21 µg/kg HCB, 730-1,600 µg/kg PCBs and 930-1,300
µg/kg toxaphene, respectively.
Table 3.14 Concentrations of PTS in Amphibian Samples From
Freshwaters in Region VII (µg/kg)
Country
Republic of Korea
Chemicals
DDTs
0 ~ 0.17
PCDD/PCDF*
ND ~ 0.636
Hexachlorobenzene
0 ~ 0.91
Organic Tin Compounds
0 ~ 5.16
PCBs
0 ~ 0.3
Italic data reported in questionnaires completed and submitted to the project website http://www.chem.unep.ch/pts/
*: The unit of dioxins is pg-TEQ/g
Table 3.15 Concentrations of PTS in Fish Samples From Freshwaters in Region VII (µg/kg)
Country
Russian
China Kazakhstan Japan
Republic of Korea
Chemicals
Federation
Chlordane
-
13 ~ 22*1
90 ~ 141
0 ~ 0.35
DDTs
5 ~ 40.1
0 ~ 11
7 ~ 18*1
280 ~ 300
0 ~ 4.2
Dieldrin
<1*1 -
-
56
PCDD/PCDF*
0.2 ~ 1.2**
ND ~ 4.053
HCH
2 ~ 240
2 ~ 3*1
20 ~ 21
Hexachlorobenzene
<1*1
0 ~ 1.3*2
Organic Tin Compounds
0 ~ 124.32*2
PCBs
2 ~ 267
<30 ~ 50*
730 ~ 1,600
0.41 ~ 57.4*2
Toxaphene
30 ~ 1,300
Italic data reported in questionnaires completed and submitted to the project website http://www.chem.unep.ch/pts/
*: The unit of dioxins is pg-TEQ/g
**: PCDDs + PCDFs in Omul in Lake Baikal (pg TEQ/g wet wt) (Mamontov, A.A., 1998)
*2: Annual Report of EDCs Research Project, NIER (2000)
Levels of total HCH, total chlordane, total DDT, PCB and toxaphene in organisms of Lake Baikal were
reported to be 0.02-0.021, 0.09-0.141, 0.28-0.3, 0.73-1.6 and 0.93-1.3 mg/kg lipid basis for omul (fish), and
0.2-0.22, 1.5-1.7, 54-62, 24-28 and 2.2-2.3 mg/kg lipid basis for Baikal Seal, respectively (Kucklick,. et al.,
1993).
3.2.6 Terrestrial
Biota
Table 3.16 shows PTS concentrations in humans reported in China (breast milk) and Japan (adipose, liver,
bile). China reported 6031 µg/kg DDTs, 40-800 µg/kg dieldrin, 2960-30090 µg/kg HCH, 1781 µg/kg HCB and
250-1,430 µg/kg PCBs, while the data of Japan were 42-3,800 µg/kg chlordane, 40-8100 µg/kg DDTs, 47-3200
µg/kg HCH, 17-240 µg/kg HCB and 230-6600 µg/kg PCBs, respectively.
Table 3.16 Concentrations of PTS in Humans From Region VII (µg/kg)
Country
China
Japan
Chemicals
(breast milk)
(adipose, liver, bile)
Chlordane
42 ~ 3,800
DDTs
6,031
140 ~ 8,100
Dieldrin
40 ~ 800
HCH
2,960 ~ 30,090
47 ~ 3,200
Hexachlorobenzene
1,781
17 ~ 240
PCBs
250 ~ 1,430
230 ~ 6,600
Italic data reported in questionnaires completed and submitted to the project website http://www.chem.unep.ch/pts/
Results from a survey conducted in China on human breast milk, sampled during the lactation period (3-5
weeks), showed mean levels of p,p'-DDT (Hong Kong SAR: 0.39; Guangzhou: 0.7 µg/g of lipid), p,p'-DDE
(2.28; 2.85), and -HCH (0.95; 1.11). These values were 2-15 folds higher when compared to studies
conducted elsewhere, such as United Kingdom, Germany, Sweden, Spain and Canada), however, PCB
concentrations (0.035; 0.031) of the samples were found to be 10 times lower. Both DDT and PCB showed
good correlations with consumption of seafood (Wong et al., 2002).
Figures 3.1 and 3.2 below show relatively low concentration of PCDD/PCDF in the blood of Siberian
inhabitants, even those situated at industrial centers, such as Shelekhov (aluminium plant), Sayansk (PVC
plant), and Angarsk (oil-chemistry industry) in the Russian Federation.
57
Mean TEQ Levels from Individually Analyzed Blood from Irkutsk Region,
Russia, 1998, Compared with Blood TEQ Levels Found in Baikalsk,
Germany, and North America
pg/g (ppt) lipid basis
30
PCDDs
Teq = 24 59 19 36
PCDFs
26
Coplanar PCBs
24
20
22
23
22
ppt
Q
TE
14
10
12
10 10
8 9
8
7
7
7
6
6
5
0
Angarsk
Sayansk
Shelekhovo
North
Baikalsk*
Germany*
Germany*
Resident
Residents
Firemen
America 1996
1989
1989
1996
N = 1 5 5 100 (pooled) 8 (pooled) 102 139
I R K U TS K R E G I O N
Figure 3.1
*Data not available for PCBs
Blood TEQ Levels in Residents of Sayansk, Irkutsk Region, Russia
ppt, lipid basis
75
Teq = 92 47 27 26 103 24
61
57
50
PCDDs
PCDFs
Coplanar PCBs
25
TEQ ppt, lipid basis
23
24
21
17
18
12
9
10
11
9
8
8
9
7
7
8
0
A B C D E F
1
2
3
4
5
6
Individual Residents
Figure 3.2
3.2.7 Time Trends of PTS in the Region
The Ministry of the Environment, Japan, has been conducting environmental monitoring of major
organochlorines for nearly three decades, and of organic tins for more than a decade (Ministry of the
Environment, Japan Chemicals in the Environment). Frequencies of detection (ratios between the number of
detected samples and the total samples) have been decreasing for many of the compounds, including PCBs in
fish (25/30 in 1978 to 36/70 in 2000) and bivalves (15/15 in 1978 to 10/30 in 2000), HCB in fish (30/30 in
1978 to 7/69 in 2000), dieldrin in fish (22/30 in 1978 to 10/70 in 2000) and bivalves (10/15 in 1978 to 5/30 in
2000), p,p'-DDT in fish (25/30 in 1978 to 16/69 in 2000) and bivalves (15/15 in 1978 to 4/30 in 2000), and -
HCH in fish (30/30 in 1978 to 1/69 in 2000) and bivalves (15/15 in 1978 to 0/30 in 2000), suggesting that
levels in Japan have generally been decreasing in recent decades. Due to the increase of proportion of ND data,
58
however, in recent years, it is difficult to calculate the average level of each compound in order to obtain
quantitative aspect on the time trends.
A similar trend is observed in organic tin analysis; frequencies of detection of TBT has decreased from 23/60 in
1985 to 10/70 in 2000 in fish, and from 15/20 in 1985 to 0/30 in 2000 in bivalves, respectively. Frequencies of
detection of TPT also decreased from 40/65 in 1989 to 13/70 in 2000 in fish, and 17/25 in 1989 to 1/30 in 2000
in bivalves. Furthermore, frequencies of detection in water (coasts and estuary) decreased from 62/79 in 1990
to 9/102 in 2000 in TBT, and 16/75 in 1990 to 0/102 in 2000 in TPT. However, the detection frequencies in
sediments have not changed significantly during the period; i.e., 79/90 in 1990 to 81/99 in 2000 for TBT, and
52/81 in 1990 to 52/96 in 2000 for TPT, respectively. The average levels of TBT and TPT in marine sediments
(calculated as ND which equals to half of the detection limit) have been stable in recent several years.
Among the above samples, sea bass collected in Tokyo and Osaka Bays, the most populated areas in Japan,
almost always showed the highest detection frequencies for all the chemicals and may deserve further
discussion. In both cases, the average levels of PCBs seemed to decrease in late 1970s, but no clear decreasing
trends were observed in the recent two decades. DDTs seemed to decrease in late 1970s ~ early 1980s, and then
became almost stable until now. Chlordanes, on the other hand, have been decreasing slowly in both places in
the two decades. TBT and TPT levels, on the other hand, showed considerable fluctuation, without a clear
decreasing trend, until early 1990s, and then started to decrease. The decrease of TPT seemed to proceed a
little earlier than TBT. The change in TBT and TPT levels in sea bass generally coincide with the start of their
regulation by the Japanese government.
Many of the PTS chemicals have been monitored in human breast milk obtained from Osaka Prefecture, Japan,
for 27 years (Konishi et al., 2001). Total PCBs levels showed decreasing trends with a couple of small peaks in
late 1970s and early 1980s during the period. -HCH, DDT and DDE also showed clear decreasing trends
during the period. Dieldrin also showed a decreasing trend, too, in the first decade, while HCB levels showed a
slight increase at the beginning of 1980s and then decreased. Chlordane levels, on the other hand, varied
considerably, but did not show a clear decreasing trend in the last decade. Compared with the levels in middle
1970s, -HCH decreased to 3.1%, total DDT (DDT+DDE) to 7.1 %, and PCB to 13.2 %, respectively.
PCDD/PCDF levels were also analysed in the archived samples, which were preserved as extracted lipids
(Ministry of Health and Welfare, 2000). The total level (including co-PCBs) was approximately 65 pg-TEQ/g
lipid basis during the mid 1970s, but decreased to 24 pg-TEQ/g lipid basis in 1999. The decrease of co-PCBs
was most significant followed by PCDF. PCDD levels, on the other hand, remained nearly unchanged from
early 1970s until late 1980s, and then started to decrease slowly.
In another program, PCDD/PCDF levels were analysed in archived diet samples obtained in Kansai Region
(Ministry of Health and Welfare, 1999) and in Kobe and Nagano cities (Sakurai, et al., 2001), Japan,
respectively. PCDD and co-PCB levels were higher in mid-1970s, and showed considerable decrease until late
1990s. On the other hand, PCDF levels seemed to be rather constant from mid-1970s to mid-1980s, and then
decreased. On a TEQ basis, co-PCB contributes more significantly followed by PCDD and PCDF. In the
analysis of archived human adipose tissues, (PCDD+PCDF) and co-PCBs were reported to be 31.6 and 35.4
pg-TEQ/g lipid basis in 1970-71, and 11.9 and 15.3 pg-TEQ/g wet wt in 2000 (Choi et al., 2002a). For
brominated compounds, both 2,3,7,8-TeBDD and 2,3,7,8-TeBDF decreased slightly in the period (median
decreased from 1.7 to 0.51 pg/g lipid basis, and 3.3 to 2.8 pg/g lipid basis, respectively) whilst a 44-fold
increase was observed in PBDE (median; 29.2 to 1288 pg/g lipid basis) (Choi et al., 2002a). Detailed analysis
of the archived fish samples, on the other hand, showed that PBDE levels (sum of tri- to hexa-) peaked in late
1980s and started to decrease steeply during 1990s until 2000, concomitant with the production of PBDE which
had peaked in 1990 and gradually declined due to its replacement by Tetrabromobisphenol A (TBBPA) (Ohta
et al., 2002).
There are several reports analysing sediment core samples in order to reveal time trend of PCBs, PCDD/PCDF
and other pollutants in Japan (Araki, et al., 2000; Okuda et al., 2000; Masunaga et al., 2001; Choi et al., 2002b;
Sakai et al., 2002). Many showed that PCB concentrations were highest in the 1960s followed by a decrease,
the rate of which has declined recently. PCDD/PCDF pollution showed a steep increase from the 1940s to the
1960s, with a peak in late 1960s to early 1970s, which started to decrease after that, but again the rate slowed
down and the level became almost flat in recent decades. In the retrospective analysis of archived paddy field
samples (Seike, et al., 2002), OCDD showed a peak in mid 1960s while 1,3,6,8-TCDD increased in late 1960s
and decreased in 1970s. In TEQ, PCDDs, especially 5-7 chlorinated congeners, have been dominant
contributors although the contribution from PCDFs has been increasing gradually in recent years. In Japan the
agrochemical PCP became popular in the 1960s. However, the usage stopped in the early `70s while CNP
59
registered in 1965, widely used through the 1970s but gradually decreased through 1980s and its usage stopped
in the mid 1990s. OCDD and 1,3,6,8-TCDD are the characteristic isomers of PCP and CNP, respectively. The
above data seem to support the view that in Japan PCDD/PCDF were emitted into the environment in the 1960s
to early 1970s as impurities of agrochemicals, especially PCP and then CNP, while incineration processes
remained as a dominant source until recently.
Distribution in sediment cores obtained from Macau estuary in China showed that DDT had a peak at 79 ng/g
in 1993 while the level was lower, between ND and 28.9 ng/g, after 1960. Total HCH, on the other hand, again
showed a peak of 82.3 ng/g in 1993 which decreased to less than detection limit afterwards (Zhang, et al.,
1999). PAHs levels in a sediment core sample from Ya-Er Lake showed that B(a)P levels were 18.7-49.2 ng/g
with an increasing trend after 1970 (Chen, et al., 1997). When comparing the PTS contents in human breast
milk samples collected from Hong Kong in 1989 (Ip and Phillips, 1989) and 2002 (Wong et al., 2002), it was
noted that all the concentrations were decreased (p,p'-DDT 2.17 to 0.39; p,p'-DDE 11.67 to 2.48; -HCH 15.96
to 0.95. However, the concentrations were 2-15 folds higher when compared with studies conducted elsewhere
(i.e. U.K., Germany, Sweden, Spain and Canada).
3.3 TOXICOLOGICAL AND ECOTOXICOLOGICAL EFFECTS OF PTS
3.3.1 Introduction
Some human populations and some wildlife species in northern and temperate Regions are known to suffer
significant injury from certain PTS. There are fewer studies that document health effects in different Regions
(background, south and north) caused by PTS in the environment. It stands to reason, however, that if PTS can
cause adverse effects to human health and ecosystems thousands of kilometers from their sources, PTS can
cause similar and greater injury in and near source areas. Documented injuries were especially prevalent in high
predator species and included:
· reproductive failure and population decline;
· abnormally functioning thyroids and other hormone system disfunctions;
· feminisation of males and masculinisation of females;
· compromised immune systems;
· behavioral abnormalities;
· tumors and cancers;
· gross birth defects.
Alarmed by these data, scientists investigated similar injury to humans, who also can be considered high
predators. In the years that followed, good evidence was gathered associating human exposure to specific PTS
or classes of PTS with:
· cancers and tumors at multiple sites;
· neurobehavioral impairment including learning disorders, reduced performance on standard tests and
changes in temperament;
· immune system changes;
· reproductive deficits and sex-linked disorders;
· a shortened period of lactation in nursing mothers;
· diseases such as endometriosis, increased incidence of diabetes, and others.
Of particular concern is evidence suggesting that women, infants, and children are especially vulnerable to
certain effects of PTS.
In humans, as in wildlife, effects caused by exposure to PTS is often expressed, not in the exposed adult
population, but in the offspring generation. Maternal body burdens of PTS are transferred through the placenta
to the developing fetus and through breast milk to the nursing infant, and can cause effects at vulnerable stages
of developing that may not be expressed until the infant reaches puberty or adulthood.
60
3.3.2 Toxicology of PTS of Regional Concern
Toxicological and eco-toxicological research is conducted all over the world, resulting in international
databases on basic toxicants (IARC Monographs, 1977, 1987, 1997).
The estimation of summary toxicity of pollutants in the water and wastes use in different countries, including
countries of Region VII, have been carried out for many years. Automatic systems, such as "Microtox",
"Vitotox", among others are well known. Some years ago, the Russian Federation initiated and developed
recommendations for the detection of toxicity of water samples, air samples, soils etc. by luminescent bacterial
test.
Mutagenicity was investigated in scientific research laboratories of Japan, Republic of Korea, and the Russian
Federation, including Ames test Salmonella/microsome and another short-term tests in different genetic
samples. More commonly conducted are total mutagenicity and toxicity of environment pollution which have
been carried out within the framework of ecological examination.
According to the data from the State Centre of Ecological Programs of the Russian Ministry of Natural
Resources, sources of PTS (pesticides, PCBs, PAHs, PCDD/PCDF) exist in the Asian Part of the Russian
Federation. Unfortunately, all the data concerning environmental levels of PTS and their influences on public
health are very fragmentary and are only available for the European part of the Russian Federation. The main
sources of PTS in Regions VII are metallurgic and chemical industries (PCDD/PCDF, PCBs, HCB). PAHs are
a serious problem in the high-density industrial areas. Human health problems are related to pesticides
manufacture and usage especially organochlorine pesticides with their application in agriculture and forestry
for many years.
Due to lack of storage and the use of PTS, including DDT, PCBs, and HCB, in agricultural districts of the
Kemerovo area of the Russian Federation have resulted in cytogenetic damages in children and adults; the level
of chromosomal aberrations being two times greater than populations in ecologically clear areas, and
corresponding to a level of genetic damage of the population located in Kemerovo' industrial areas. Kemerovo
is characterized by strong pollution generated from chemical, coal industries and metallurgical enterprises.
Determination of the somatic mutant frequencies at the TCR locus was performed in 70 persons - inhabitants of
Shelekhov city (Irkutsk Region, Russian Federation). The control group consisted of 13 healthy volunteers and
57 firemen who were involved with putting out the fire at the Cable factory in 1992. In addition, TCR mutant
cell frequencies in these two groups were compared with results previously received for 75 healthy inhabitants
(control group) of Obninsk (Kaluga Oblast) and 140 workers involved in the clean-up of the Chernobyl site
contaminated with relatively low doses (up to 0.25 Gy) of ionizing irradiation of a well-known genotoxic agent.
The observed data confirmed the effects of genotoxic agent(s) on both the firemen and the residents of
Shelekhov city, where a large aluminum plant is located.
Depending on the genome features of various individuals can keep stability or find out the increased sensitivity
to the injuring agents. When in an organism, the majority of xenobiotics do not render direct biological effect.
In the initial stage, the xenobiotics are exposed to various transformations called biotransformation. The
biotransformation xenobiotics, as a rule, undergo a multi-stage process, in which simultaneously or serially
many participate in detoxification ferments. Quite often, intermediate products of biotransformation in the
initial stages of this process can be more toxic, have more expressed mutagenic, teratogenic and even
carcinogenic activities than initial connections, and therefore cause various pathological condition and illnesses.
It is clear that from even the brief list of the reasons of distinctions in individual sensitivity of man to toxic
influences, this testifies to the extraordinary complexity of the decision of the problem for the estimation of the
dangers of contact with chemicals, and human risk for health, including genetic risk. At the same time, the
induction mutation in human somatic cells has been proven, and the account of risk is carried out on the
probability of development of cancer diseases. Practically total monitoring cytogenetic markers (ChA, CHE,
MN) in lymphocytes of blood of the inhabitants of a number of European countries convincingly has proved
their connection with frequency oncopathology (Revazova, 2002).
PTS are accumulated in food which are the main sources of PTS intake in human organisms. The use of
polluted soils for agricultural activities is a feature of many small Russian cities as they are located nearby large
metallurgic and chemical enterprises. Practically, all the Asian countries of the former USSR had used huge
amounts of PTS, especially DDT and HCH.
61
3.3.2.1 Pesticides
Environmental levels and human exposure of PTS (pesticides) in Region VII has decreased due to the
prohibited use of these substances in most of the countries. Mass DDT use and storage for many years is the
most dangerous problem for the Russian population (Revich, 2002). Territorial organisations of the Russian
Ministry of Health has been carrying out a constant control of pesticides, including DDT, in foodstuffs, soils
and water (Bragina, Garbuzova, 2001). Over a number of years DDT has been reported in the 18 33% of the
samples, and HCH in 21 33%.
A potential area of concern for the Region VII is the possibility of pesticide contamination in Pacific seafood.
The most polluted Region of the Japan Sea is the Golden Horn Bay. Average concentrations of organoclorine
pesticides in sea water (including DDT and its metabolites, - and -HCH) varied within the limits 0.8 1.9
ng/l. Pesticide pollution of the Bay's sediments suggests an anthropogenic influence over a long period of time.
For example, the DDT content of Golden Horn Bay sediment is 200 times higher than in sediments from the
Amurski gulf and 80 times higher than in sediments from the Ussuriisky Gulf (Revich, 2002).
Pesticide use over a long period and their high levels in foodstuffs has led to their intake in breast milk of
women living in agricultural regions. Significant changes in reproductive health of women living at pesticides
polluted territories have been recorded. These include late menarche, spontaneous abortions, and high
frequency of gynecological diseases, obstetric and perinatal pathologies. This is especially evident in the Asian
countries of the former USSR.
Investigation of the contamination of human body fluids (gastric juice, blood, breast milk ) by DDT and HCH
have been carried out in Kazakhstan and Kyrgyzstan. The results showed high contamination by pesticides
(especially DDT, DDE, HCH) of blood serum of pregnant women (20100 times higher than reported in
Sweden). More than 50% of blood samples from pregnant women from the Aral Sea region were found to be
contaminated by pesticides. Investigations also showed that the imbilical blood of 90% of newborns were
contaminated with pesticides eventhough the blood serum of the pregnant women sometimes failed to indicate
any presence of pesticides. Breast milk studies confirmed the possibility of the transfer of pesticides to
newborns through breast milk (Samuratova, 2002).
In the Karapalkak Region of Uzbekistan, maternal blood samples were found to contain HCH, DDT, and HCB.
The mother/infant ratio was calculated in a subset of 12 pairs for HCB, -HCH, pp-DDE and pp-DDT. The
median ratio was 2.1, 2.8, 3.0 and 3.3, respectively. Relatively high quantities of HCH (- and -) and pp-DDE
were measured in all 41 samples. 68% and 43% of the subjects contained more than 1000 ng/g (lipid basis) of
-HCH and pp-DDE (Revich, 2002).
Chlordane and mirex are not used and produced as pesticides, but are used for public health in small amounts.
In the prevention and control of termites (white ants), chlordane, heptachlor and DDT are used. DDT is used
mainly for control of some vectors of diseases, such as malaria. Investigation indicated that since the
prohibition of DDT, and other PTS pesticides, the residual DDT in tea leaves and breast milk had noticeably
decreased. The investigation in Changsha, China showed that HCB contents in human breast milk had
increased 60% within 10 years (Li, 2002).
3.3.2.2 PCBs and PAHs
The greatest volume of PCBs in Region VII is found in electrical equipment. After entering the environment,
PCBs accumulate in various media at concentrations which are influenced by a variety of factors. In the Asian
part of the Russian Federation, PCBs have been studied most extensively in hyperboreal organisms. This forms
part of the Arctic Pollution Monitoring Program (AMAP). There is a concern that foodstuffs with a high fat
content, such as marine mammals, deer and fish, form an important part of hyperboreal diets which may be a
source of increased intake of PCBs. The impact of PCBs on health has been studied in Serpukhov city
(European part of the Russian Federation), where past production of condensers filled with PCBs were
produced. Results have shown that even 10 years after the use of PCBs at the plant had been banned, the levels
of PCBs in soil and vegetables were still extremely high (Revich, 2002). However, the concentrations of PCBs
in breast milk (Kazakhstan) were lower than those reported for European women.
There is no accurate information about the storage of PCBs which poses a potential pollution risk. There is
shortage of systematic information about human exposure to PCBs and the effects of PCBs on human health.
Cities in the Asian Region of the Russian Federation, unlike the European Region, are dominated by the use of
coal and petroleum for fuel. PAHs are the dominant PTS in terms of its adverse influence on human health.
62
There are many reasons for concern including: the presence of a large aluminium plant in Krasnoyarsk city and
metallurgic plants in Norilsk city, in the Irkutsk Region, and the metallurgic plants of the Sverdlovsk,
Chelyabinsk Region, and Kuzbass. Systematic control of PAH control in air is conducted in 30 cities of the
Asian Region of the Russia Federation The highest concentrations have been measured in cities with negative
microclimatic conditions where coal is used for a Thermal Power station and for metallurgic (especially
aluminium) plants. These are located in: Cnita, Shelekhov, Novokuznetsk, Bratsk, Zima, Kansk, Irkutak,
Yuzhno-Sakhalinsk. More than 10 million people are exposed to high concentrations of benzo[a]pyrene
generally greater than 1 ng/m3. In several cities the level of air pollution by PAHs is extremely high (124
ng/m3 in Bratsk city, Irkutsk Region). Results of epidemiological studies on the estimation of Benzo[a]pyrene
as a risk factor of lung cancer showed a significant increase for people living in industrial cities with
concentrations of PAH in air higher than 3 ng/m3. Even higher levels of PAHs in the air have been measured in
Siberian Far East cities, which have a total population of approximately 9 million (Revich, 2002).
3.3.2.3 PCDD/Fs
The current estimate of background exposure levels to PCDD/PCDFs for adults in Korea is 0.43 pg
TEQ/kg/day (Korea Food and Drug Administration, 2001). Additional exposure may be expected from other
sources. The exposure contribution of food, air and soil was 85.3%, 14.7%, and 0.02%, respectively and that of
meat and dairy products including milk was 12.3% and 3.4%, respectively. It was recognised that the human
exposure patterns of PCDD/PCDF were very different from those of Europe and America. This feature of
Korean background exposure levels of PCDD/PCDF may be caused by the high ingestion rate of cereal and
vegetables than meat and dairy products (Lee et al., 2002).
Potential sources of PCDD/PCDF in the Asian part of the Russian Federation are the large metallurgic,
chemical and pulp and paper industries. There is only one municipal waste incinerator in Vladivostok, but
irregular burning of the toxic waste is the main source of air pollution in the Region. An investigation by Prof.
Schecter in 19861998 showed the levels of PCDD/PCDF in foodstuffs and human body fluids (blood and
breast milk) were lower in Siberian cities than in Europe and North America.
A large amount of the pesticide sodium pentachlorophenol (Na-PCP) salt have been sprayed over vast areas in
central China to control schistosomiasis, a parasitic disease of epidemic proportions (Schecter, 1996).
Approximately 5000 tons of Na-PCP are produced in China annually. PCDD/PCDF are found as impurities in
commertial Na-PCP product. These contaminats are subsequently released into the environment and present a
significant contribution to human exposure to PCDD/PCDF in China.
3.3.3 Ecotoxicology of PTS of Regional Concern
Several reports on the environmental efects of PTS were presented and discussed during the 2nd Technical
Workshop.
In recent years, several species of marine mammals and birds have been affected by unusual diseases and
mortalities. While several factors have been attributed to these events, a potential suspect is the exposure to
PTS. Investigation of the toxic effects of PTS in higher tropic level wildlife showed that PTS, such as
organochlorine pesticides, PCBs, organotins, etc , are found in tissues of a wide variety of wildlife. Extremely
high concentrations have been found in animals inflicted with diseases and/or victims of mass mortalities.
Elevated contamination by PTS has been found in open sea animals such as cetaceans and albatrosses, which
seemed to be attributable to to their low capacity to metabolise toxic persistent contaminants. Significant
correlations between biochemical parameters (serum hormone concentrations and cytochrome P450 enzyme
activities) and residues of PTS have been found in some species of marine animals, which indicates that these
chemicals may be causing toxic effects in animals even at the current levels of exposure (Chiba et al., 2002).
Lam's (2002) review indicated that elevated levels of PTS including PAHs, PCBs and certain organochlorine
pesticides are a long-term significance to the health of Hong Kong SAR water's ecosystem. Specifically, it is
apparent that PAHs and pesticides may pose a risk not only to the marine ecosystem, but also to primary and
secondary consumers of marine organisms. Although there are now considerable data on the levels of PTS in
the marine sediments and, to a lesser extent, other environmental compartments, such as biota, there is still a
general paucity of information of the sources of PTS and their precise effects on biological systems in Hong
Kong SAR`s marine waters. Authors of this study suggest that while the concentration of some toxicants in a
specific environmental compartment may be relatively easy to quantify, it is the potential biological/ecological
effects on the population that are more difficult to measure or predict.
63
3.4 HOT
SPOTS
In this Region, limited data have been published or reported and the sampling sites have been also localised.
Also, these data were reported based on insufficient replicates of samples. In addition, the sampling and the
analytical methods were not standardized. Although high levels of PTS in different ecological compartments
have been detected in some areas, these data do not currently allow rigorous identification of hot spots.
Based on data available at this stage, the following hot spots have been identified in the Region: HCH
concentrations of inland water in Kazakhstan, PAHs concentrations in sediment in the sea of China, Japan, and
the Republic of Korea were higher than those detected in other areas in Region VII.
Agricultural areas with high use of pesticides showed remarkably high concentrations of organochlorines in
soils and sediments, while urban areas showed high concentrations of PTS in air and soil, due mainly to
automobile sources. In addition, industrialized areas with chemical use and metallurgical plants showed high
concentration profiles of PTS. For example, high concentrations of organic mercury compounds in blood, urine
and hair of inhabitants in Kyrgyzstan were reported (Kasymov et al., 2000). DDTs in marine mammals of Japan
and the Russian Federation were high.
3.5 DATA
GAPS
Limited data have been published or reported in certain Regions or countries within Region VII. In addition,
the availability of information on contaminant levels of PTS is very recent except for Japan. It is therefore
important to recognise that data on the spatial and temporal distributions reported here are insufficient to
evaluate the effects of PTS on human health or on the environment. Also, there is as yet little conclusive
scientific information directly linking harmful human effects to low levels of exposure to these contaminants.
Overall, the information on temporal trends in this Region is very limited. The results available reinforce the
importance of precise sampling, analysis and archiving programs, which would allow continuous long-term
monitoring of key populations and retrospective analysis for new contaminants.
Data reported herein are insufficient to make a full review of the spatial and temporal variations in this Region
because many countries in this Region began the monitoring of PTS concentration only recently. Furthermore,
locations for monitoring have been scattered, and not comprehensive or consistent in the viewpoint of long and
global manner. Countries within Region VII should agree upon common standard methods for sampling,
treatment and analysis of PTS.
3.6 CONCLUSION
Spatial and temporal data on PTS monitoring have been collected from some countries in this Region, while
monitoring data concerning PTS were not found from some countries.
In this Region, the spectrum of national economic size is very wide. This may explain the variances in data
collection whereby some countries have collected data relatively earlier and more intensively, while some
countries have only recently or in the stages of developing their programs on PTS monitoring and inventories.
Based on the reported data, DDTs, HCH, dioxins, furans, PCBs and PAHs are the high priority chemicals
among other PTS in this Region. Many monitoring data for these chemicals were reported at a variety of
environmental media and biota, and very often the concentrations of one or some of those chemicals were
found to be relatively high, compared with other chemicals at certain environmental sample.
In addition, the data analysis described in previous sections was inclusive at this point for the full understanding
of the temporal and spatial trend.
More monitoring data from the countries in this Region should be collected for the full understanding and
evaluation of the present environmental levels of PTS in this Region. International cooperation on this matter is
required to obtain more precise and meaningful data in this Region.
It is widely accepted that PTS can concentrate in living organisms, including humans, to levels that can
potentially cause injury to human health and/or the environment even in Regions far from where they were
initially used or released. For Region VII, this phenomenon has been demonstrated in the Siberian territory
which is characterized by a cold climate and in the high mountain territory where PTS can accumulate and
persist for a long time.
64
4 MAJOR PATHWAYS OF CONTAMINANT TRANSPORT
The objective of this chapter is to provide basic information concerning contaminant transport within Region
VII. Because the Region is spread over a wide-range of different meteorological conditions with insufficient
information on the pathways of contaminant transport, the summary provided below will be considered as
preliminary.
4.1 INTRODUCTION
4.1.1 General
Region VII covers a variety of countries with different climatic and geographic conditions. Temperature and
rainfall vary greatly which may give rise to significant differences in fate processes of the contaminants. In
addition, the large area of open ocean may have a significant contribution to contaminant transport. The
characteristics of the Region may cause substantial differences in pollutant fate and transport when compared to
other Regions e.g., the Arctic Region. The limited available information in this Region has also made it
difficult to determing long-range transport of pollutants within the Region. Major data gaps should be
investigated in this Region especially for long-range transport information.
4.1.2 Regionally Specific Features
The organochlorine pesticides have similar properties, such as low water solubility, high lipophilicity, and are
persistent in the environment. Their half-lives in soil range from 2 years to 12 years (Connell and Miller, 1984).
Worldwide use of pesticides has resulted in the distribution of these persistent pesticides throughout the earth's
ecosphere whereby the atmosphere has been the one of the most major routes for the widespread distribution.
Pesticides applied to soils and crops may enter the atmosphere in several ways. For example, significant
proportions of aerially applied pesticides never reach the target and drift away from the treated area. Pesticides
may also volatilise from treated soils and crops and contaminate the atmosphere.
The major routes of pesticide translocation into the hydrosphere are generally governed by surface runoff and
aerial transport and deposition. Kerr and Vass (1973) concluded that aerial transport and deposition exceeded
surface runoff as the principal source of input for pesticides in the oceans. Significant amounts of pesticides to
the environment may originate from many industrial, agricultural and domestic sources.
The most widely used persistent organochlorines, ranked in order of global usage between 1950 and 1992 were
HCHs (6.3 Mt), DDT (2.6 Mt), toxaphene (1.33 Mt) and PCBs (1.2 Mt). HCHs are the most abundant OC in
arctic air and water (Jensen et al., 1997). Besides India, HCH has mostly been used in China and the former
Soviet Union. In 1983, China and India switched to using only the pesticide-active isomer of HCH (-HCH or
lindane).
Stockpiling of several chemicals with limited amounts has been reported from Japan, Russian Federation, and
Kazakhstan. However, there is very limited information for most of countries in the Region, and further studies
are needed to clarify the possible sources and/or stockpiling of contaminants in the Region.
It should be noted that the majority of PTS are a mixture of known and/or unknown complex isomer/congeners
that may have different transport/fate characteristics in the environment. Furthermore, concentrations of
pesticides may be reported on a different basis, e.g. on pure chemical basis or total formulation basis. Clear
emission and isomer/congener information is required which may also affect accurate assessment of chemical
transport.
4.2 MEASUREMENTS/MODELLING
APPROACH FOR TRANSPORT ASSESSMENT
An integrated measurement/modelling approach is highly recommended. The limited coverage of the Region
by a monitoring network does not allow one to make the assessment of PTS contamination in the Region based
only on monitoring data. On the other hand, modelling methods need monitoring data for model evaluation and
formulation. Hence, for assessment of PTS contamination in the Region, an integrated measurement/modelling
approach is highly recommended.
65
4.3 OVERVIEW OF EXISTING MODELLING PROGRAMS AND PROJECTS
There are a limited number of existing modelling programs and projects in the Region on the long-range
transport of PTS. Long-range transport of other contaminants, such as sulphur oxide, nitrogen oxide, VOC and
particles like yellow-sand have been studied for the East Asia Region, but not for semivolatile substances
including PTS. As modelling with multimedia consideration may be more suitable for semivolatile compounds,
limited examples of multimedia modelling programs within the Region are described below.
4.3.1 Japan
A multimedia environmental fate model integrating river catchments and gridded air compartments has been
developed using geographical information systems (GIS) (Suzuki et al., 2001). This model will be used to
assess multimedia chemical fate on real geographic information. The model formulation is based on the
fugacity approach. The geographical resolution for the air-grid is 5 km and that for river catchement and river
stretches are on similar scales. Necessary geographical and meteorological databases including wind data,
hydrological data and emission data have been developed. Several models with and without various multimedia
considerations have developed, and the different models share the same geographical/hydrological datasets for
calculation as a common basis. A case study on the Shinano river basin has been performed. The basin area was
roughly 15000 km2 with a maximum river path length of 380 km, containing about 600 air-grid and 1500
catchments and river segments. Simulation based on the real PCDD/PCDF emissions from municipal solid
waste incinerators showed general agreement with monitoring data for air and river water. Simulated soil
concentrations were significantly lower than monitoring data, probably because of the lack of emission data
from the past agrochemical impurities. Comparison of fate characteristics among several chemicals including
PCDD/PCDF, dichlorobenzene and trichloroethylene indicated different media/geographical distribution for
different chemicals.
The model can predict the environmental fate of contaminants in the multimedia environment. Environmental
fate for PTS including PCDD/PCDF can be simulated well by the models. Geographical and hydrological
databases will be developed for the whole Japanese environment, which enables the fate analysis with real
environmental conditions incorporating real river stream fluxes and geographical catchments.
4.3.2 Republic of Korea
4.3.2.1 POPsME
In Republic of Korea, a three-year research project has just been completed to develop a dynamic multimedia
mass balance fate and transport model (named POPsME (persistent organic pollutants in multimedia
environment) (Lee et al.,2002). The main purpose of the model is to describe the long-term average behaviour
of target substances, beginning with polycyclic aromatic hydrocarbons (PAHs), in multimedia environments
relevant to Republic of Korea. This work has been conducted as part of an integrated effort to establish a risk
assessment methodology that takes into account multimedia, multi-route exposure pathways. The model
domain includes the Seoul metropolitan and neighbouring areas (about 150km x 150km) of diverse land
including the most densely populated cities in the country, agricultural areas, and forests, and even a small
coastal area. The domain will be expanded to cover the whole of Republic of Korea in a year.
POPsME is an unsteady (Level IV) mass balance model where each medium is represented by a homogeneous
compartment. The environmental media included in the model are air (gas and particles), water, suspended
solids, bottom sediment, bare soil, coniferous plants and the soil, deciduous plants and the soil, and farm land.
The model has been designed to have variable spatial resolutions. The smallest "grid size" is currently limited
to 10km x 10km mainly due to computer based limitations in data handling capacity. Monte-Carlo simulation
capability has been included to estimate uncertainties of the model outcomes. The model is written in Fortran
and runs on a PC. The model is currently being evaluated by comparing the measured and predicted PAH
concentrations in multimedia.
4.3.2.2 ECO2
Project
A three-year project has been launched to set priorities for the management of environmental quality of
industrial complexes and large cities. Human health risk and ecotoxicological effects are the criteria to be used
to set the priorities. A dynamic multimedia mass balance model (tentatively named as ECO2) is being
developed for the prediction of environmental levels of PAHs, VOCs, and POPs in a selected industrial
complex and neighbouring residential areas (30 km x 30 km). The model is similar to POPsME in principle and
66
structure except that it deals with VOCs as well as SOCs. Measurements of multimedia concentrations of
contaminants of concern are being conducted to evaluate the model. The model, after calibration and evaluation,
will be applied for the prediction of environmental fate of the substances to major industrial areas and cities in
Republic of Korea.
4.3.2.3 EDC
Seoul
To understand the environmental fate of endocrine disrupting chemicals (EDCs), a single cell multimedia fate
model has been constructed and evaluated. The EDCs of concern were PAHs, OCls, PCBs, Alkyl phenols, and
phthalates. The model (EDC Seoul) will be refined in an ongoing research and used to support decision-
making concerning the management of EDCs (NIER, 2002).
4.3.3 Russian
Federation
In the Russian Federation, the EMEP/MSCE-POP model has been utilised to predict transboundary transport
of pollutants. This model is a multicompartment one describing processes in and exchange between basic
environmental compartments (atmosphere, soil, seawater, vegetation). A Regional (European Region,
resolution 50×50 km2 and 150×150 km2) and hemispheric (Northern Hemisphere, resolution 2.5ş×2.5ş) are
under development in MSC-E. Detailed model structure is described in Malanichev et al. (2002).
In particular, apart from atmospheric transport, the model takes into account the transport of pollutants by sea
currents. This is essential for pollutants which tend to accumulate in the marine environment (e.g. HCB and -
HCH). Vegetation should beconsidered when describing POP transport from atmosphere to soil. Forest litter is
introduced as an intermediate media between vegetation and soil. Model parameterisation has been carried out
for PAHs (B(a)P), HCHs (-HCH), PCBs, HCB, and PCDD/PCDF.
In the model, media such as atmosphere, soil, and sea are separated vertically into a number of layers to
describe the vertical transport of a pollutant in question. To describe variability of soil and vegetation properties
in the horizontal direction the corresponding land-use and leaf area index information is taken into account.
Time scale. Due to large accumulation capacities of soil and sea compartments and long periods required for
establishing an equilibrium, for correct evaluation of POP environmental pollution levels long-term
calculations are to be performed. This can be illustrated by plots of long-term dynamics of PCB accumulation
in various media (Shatalov, 2001) calculated for the period from 1970 to 2010 under the assumption that
emissions from 1995 are constant.
Model reliability. At present the discrepancies between measured and calculated data for all the pollutants
considered are within the order of magnitude. However, for particular pollutants the agreement is better. About
75% of comparisons between measured and calculated B(a)P, PCBs and PCDD/PCDF air concentrations are
within a factor of 3, and about 70% of comparisons between measured and calculated PCDD/PCDF
concentrations in soil are within a factor of 4, etc. More detailed information on comparison of calculated data
against measurements can be found in Shatalov et al. (2000; 2001;2002).
Detailed description of the hemispheric MSCE-POP model is published in EMEP/MSC-E Report 8/2002
(Malanichev et al. 2002, in preparation) and in MSC-E web site: www.msceast.org.
4.3.4 Other Modelling Programs
Long-range transport of aerosol particles, sulphur oxides, nitrogen oxides or other compounds has been studied
by several research groups, including those based in Japan and China (Hong Kong SAR). The Chemical
Weather Forecast System (CFORS) for these compounds is already being run for the East Asia Region (Uno, et
al., 2000) for those compounds. Although these efforts suggest possible long-range transport of PTS, the
different nature of target chemicals may give ride to substantial changes of transport phenomena. Model
application and improvement targetting semivolatile substances including PTS are therefore necessary for the
transport assessment of PTS.
4.4 EXISTING MONITORING PROGRAMMES CONCERNING PTS TRANSPORT
From the assessment of transport of PTS a special need for multi-media monitoring should be recognised.
However, there are limited monitoring programs in this Region especially from the point of multimedia
monitoring. The importance of soil data is noted as it is likely to be an important repository.Monitoring-based
studies have supported evidence for long-range transport of PTS in the Region. As shown in Chapter 3, various
67
monitoring efforts have been carried out by several countries within the Region.
Organochlorine pesticides such as HCHs and DDTs were found in different environmental samples collected
from Asian countries (Iwata et al., 1994). The Asia-Pacific Phase of the Mussel Watch Project revealed a
widespread pollution problem caused by DDTs, PCBs and organic tin compounds (Hong et al., 2002;
Sudaryanto et al., 2000 & 2002; Monirith et al., 2000; and Tanabe et al., 2000) although their distribution
patterns are different. Concentrations of DDT, HCH and PCBs were reported for water, snow, soil, plant and
animal samples taken at Tibet, China (Sun et al., 1986; and Fu et al., 2001).
Other monitoring data can be found in Chapter 3, which also generally provides evidence of long-range-
transport of PTS in the Region.
Although the implications from monitoring studies have been carefully interpreted, a mechanistic
understanding of the possible long-range transport of target compounds is necessary for confirmation.
However, long-range/transboundary transport of PTS in the Region could be strongly implicated based on the
monitoring studies already reported in the Region.
4.5 TRANSBOUNDARY MOVEMENT OF PTS
4.5.1 Atmospheric
Transport
4.5.1.1 General Implication of the Atmospheric Transport Concerning the Region
Among the three environmental compartments, higher concentrations of PTS compounds can be found in the
atmospheric compartment as a result of global redistribution by volatilisation and atmospheric transport. This is
governed by the physico-chemical properties of the PTS compounds which include water solubility, vapour
pressure, Henry's law constant (H), octanol water partition coefficient (KOW), and the organic carbon water
partition coefficient (KOC). Because some of these physical properties are strongly dependent on environmental
conditions, Region-specific consideration may be necessary for the assessment of transport in the Region. For
example, water solubility and vapour pressure are strongly affected by temperature. The distribution of PTS
may tend to be inversely related to vapour pressure, and thus to temperature. Lower temperatures favour greater
partitioning of these compounds from the vapour phase to particles suspended in the atmosphere. This increases
the likelihood of their removal and transport to the surface of the earth by rain and snow. For tropical countries
that experience high temperatures, the practice of using some pesticides in tropical agriculture during the
warmer, wetter growing season may facilitate the rapid dissipation of PTS through air and water (IPCS, 1995).
4.5.1.2 Meteorological
Condition
The varying seasons affect the transport of PTS. During the winter (e.g. January), a high pressure system is
located over most of the Central and North East Asia Region whereby a maximum pressure of approximately
1038 mb is located south of Lake Baikal. Comparatively, on the eastern areas of the Russian Federation at the
Bering Sea, a low pressure system exists at approximately 1008 mb. During the winter, northeast monsoon
winds sweep south from northern China, while westerly winds originate from northeast Region of the Russian
Federation.
During the summer months (e.g. July), the Region is dominated by a relatively low pressure system
accompanied by southeast monsoon winds from the South China Sea.
In general, the main air mass over the majority of the Russian Federation and parts of Mongolia and the CIS
countries is maritime polar (cool and fairly moist) which moves southeast. China experiences a continental
tropical (hot and dry) air mass.
4.5.1.3 Single and Multi-Hop Pathways
There are two types of atmospheric transport pathways:- the single-hop pathway and the multi-hop pathway.
Single-hop pathway describe the movement of substances that are emitted to the atmosphere, transported and
deposited to the surface never to return to the atmosphere. PTS that undergo single-hop transport pathways
include involatile organochlorines (e.g. DDT), and PAHs (e.g. benzo(a)pyrene). In contrast, the multi-hop
pathways describe the movement of substances that re-enter the atmosphere after initial deposition to the
earth's surface. Processes by which this can occur include volatilisation from the earth's surface under warmer
temperatures than those in which it was deposited, sudden exposure of ocean water to the atmosphere after
being covered by ice or resuspension of soil dust by wind. The majority of organochlorine PTS and many
68
PAHs exhibit atmospheric transport by multi-hop pathways (Jensen et al.,1997).
To assess the pathways for PTS transport in the Region, hemispheric simulations of PTS transport from
European sources can be used. The example calculations for -HCH, PCBs and HCB for 1990 are carried out
with the use of expert emission estimates by Pacyna et al., (1999), that were recalculated to the grid of the
hemispherical model MSCE-POP (2.5°x2.5°). Results obtained for HCH in the course of these simulations are
shown in Figure 4.1 (Malanichev 2002).
< 0.001
0.001 - 0.01
0.01 - 0.1
0.1 - 1
> 1
Figure 4.1 Spatial Distribution of Mean Annual -HCH Concentrations in the Surface Air Over the Northern
Hemisphere for 1990, ng/m3 (Malanichev, 2002)
The results suggest the possibility of long-range transport of PTS from the European Region to the Asian
Region. However, simulation based on emission from the Asian Region is necessary to confirm the
transboundary movement of PTS within and across the Region.
4.5.1.4 Transboundary
Transport
Model estimates (Lee et al. 2001) show that PAHs, PCBs, and OCls can travel a few hundreds to thousands
kilometers before their concentration levels in air reduces to a half initial values, which strongly indicates that
transboundary movements of these substances would readily occur from Republic of Korea to other countries
in this Region or vice versa.
Multimedia modelling (Suzuki et al., 2000) can be used to calculate a rough estimate of escaping amount of
PCDD/PCDF from the Japanese environment. It depends on the scenario and the congener, but more than half
of the PCDD/PCDF entering the atmospheric environment of Japan may escape from the Region.
Those data show the apparent possibility of transboundary transport of PTS from each country, however, more
detailed study may be necessary to determine the transport within the Region.
4.5.1.5 Atmospheric-Surface
Exchange
Deposition and re-emission processes are included in MSCE-POP model results, as shown in Figures 4.2 to 4.4.
The importance of multi-hop pathways for -HCH is shown by the example of accumulation in seawater (see
Figure 4.2).
69
Vegetation
Air
0.12 %
0.04%
Litterfall Soil
16%
11%
Sea
73%
Figure 4.2 -HCH Redistribution Between Main Environmental Compartments (Malanichev, 2002)
2.0
dry deposition
1.5
wet deposition
1.0
0.5
0.0
-0.5
-1.0
Jan Feb Mar Apr May Jun
Jul Aug Sep Oct Nov Dec
Figure 4.3 Seasonal Variations for Dry and Wet Deposition Fluxes of -HCH Over Sea, µg/m2/month (Negative
Values Mean Re-emission) (Malanichev, 2002)
Sea
15%
Soil
Vegetation
42%
43%
Air
0.06%
Figure 4.4 PCB Redistribution Between Main Environmental Compartments (Malanichev, 2002)
The role of re-emission process (and, hence, of the multi-hop pathway for HCB long-range transport) can be
illustrated by long-term trends of gaseous flux over land and sea (Figure 4.5).
0.4
soil
sea
0.2
0
-0.2
-0.4
-0.6
1985 1987 1989 1991 1993 1995 1997
Figure 4.5 Dynamics of Flux of Gaseous Exchange of HCB Between the Atmosphere and the Underlying Surface
During 1985-98, g/km2/y
70
One can see that during the period from 1985 to 1993 re-emission flux from sea did not occur. This is
controlled by the large capacity of the marine environment: during this period accumulation in sea takes place.
However, towards the end of the simulation period due to reduction in atmospheric concentrations, gaseous
fluxes both from soil and sea become essential and can lead to further long-range transport of the re-emitted
pollutant. It is expected that with further reductions in air concentrations the re-emission flux from the sea will
exceed that from soil.
4.5.1.6 Multimedia Distribution Data
PAHs, PCBs, OCls, PCDD/PCDF and other compounds have been measured in multimedia environments in
the Republic of Korea. The media include atmospheric vapour phases, atmospheric aerosols, dissolved and
sorbed to suspeneded sediments in water, sediment, tree leaves, and soils. Most of the data are available,
however, whether the data are relevant to transboundary movement of PTS is unclear at the moment (NIER,
2002).
Multimedia monitoring data for PCDD/PCDF is available in Japan. The same sampling points have beena
employed for simultaneous multimedia monitoring where possible, so the data can directly be used for the
estimate of the multimedia distribution of PCDD/PCDF for air, water, soil and sediment. Some of these results
are shown in Figure 4.6.
4.5.1.7 Travel
Distance
Long-range transport potential (LRTP) can be evaluated in many ways (Mackay et al., 2001). One of them is by
half-distance (HD), that is the distance which a parcel of a given PTS travels until its mass is reduced by half.
For evaluating of HD the results of long-term simulations for the above mentioned PTS (from 1970 to 1998) in
the European Region are used. The necessity of long-term simulations for this purpose is required owing to the
fact that the distribution of the considered pollutant between various environmental compartments will strongly
affect HD. This is affected by a possibility of re-volatilisation of earlier accumulated PTS to the atmosphere
with subsequent atmospheric transport (multi-hop pathway). As a result, the distribution between different
environmental compartments can be established only within a sufficiently long period (several decades).
Environmental half-lives of PTS in the atmosphere from degradation and deposition processes can be used to
calculate HD on this basis as a product of the calculated half-life with average wind speed. The latter is
evaluated at 4 m/s according to (Beyer and Matthies, 2001). Annual emissions of some PTS transported outside
the European region have been estimated (Table 4.1).
Table 4.1 Comparison of LRTP Calculated By Different Models (Malanichev, 2002)
Half-Distance, km
Atmospheric Half-Lives,
Congeners
(days) MSCE-POP
MSCE-POP
Beyer and Matthies
Model
Model
(2001)
2,3,7,8-TCDF
7.9
2740 3806
2,3,4,7,8-PeCDF 7.0
2400
2530
1,2,3,4,7,8-HxCDF
6.9
2390 2905
1,2,3,6,7,8-HxCDF 6.5
2240
1797
2,3,7,8-TCDD 5.3
1820
2348
1,2,3,7,8-PeCDD 5.0
1730
687
1,2,3,7,8,9-HxCDD 4.9
1690
-
1,2,3,6,7,8-HxCDD 4.8
1650
-
Figures 4.6 and 4.7 show the geographical distribution of atmospheric and soil concentrations of PCDD/PCDF
and the geographical distribution of PCDD/PCDF into air in the Japanese environment (see Chapter 3). The
data in Figures 4.6 and 4.7 do not directly show the quantitative travel distance, however, atmospheric levels
are changing roughly one order of magnitude between higher and lower concentration areas, which are a few
hundred kilometers apart from each other.
71
Dxn Conc. in Air
(pgTEQ/m3)
Area Averaged Dxn Conc.
in Soil (pgTEQ/m3)
Figure 4.6 Geographical Distribution of Atmospheric and Soil Concentration of PCDD/PCDF (Suzuki et al., 2001)
MSWI (pgTEQ/y)
Emission from Industrial
Sectors (pgTEQ/y)
Figure 4.7 Geographical Distribusion of PCDD/PCDF Emission Into Air (Suzuki et al., 2001)
4.5.1.8 Surface Exchange on Vegetation
Contaminant levels of PTS in tree leaves have been measured in the Republic of Korea, which show possible
surface exchange with vegetation (NIER, 2002).
4.5.1.9 Atmospheric
Deposition
A year-round monitoring program of atmospheric deposition of PAHs, DDT and HCH was conducted in 2001-
2002 in the Pearl River Delta, South China. Table 4.2 (Qi et al., in manuscript) below shows the atmospheric
deposition fluxes of PAHs in a sampling season. More data will become available for seasonal variations and
for DDT and HCH.
72
Table 4.2 Atmospheric Deposition Fluxes of Priority PAHs in Spring 2001, the Pearl River Delta, South China
(µg/m2·day) (Qi et al., in manuscript)
Hong
Compound\Sampling
Kong
Guangzhou Qingyuan Zhuhai Zhongshan Zhaoqing
Station
SAR
Naphthalene
ND 0.002
ND
0.000
0.002
0.004
Acenaphthylene
ND
0.009
0.004
ND
0.002
0.002
Acenaphthene
ND
ND
ND
ND
ND
ND
Fluorene
ND
0.018
0.009
ND
0.007
0.004
phenanthrene
0.031
0.109
0.086
0.023
0.052
0.046
Anthracene
0.002
0.009
0.007
ND
0.002
0.002
Fluoranthene
0.018
0.084
0.060
0.009
0.029
0.028
Pyrene
0.015
0.061
0.044
0.007
0.023
0.022
Benz(a)anthracene
0.002
0.023
0.013
ND
0.002
0.004
Chrysene
0.018
0.122
0.100
0.009
0.032
0.042
Benzo(b)fluoranthene
0.007
0.059
0.058
ND
0.011
0.020
Benzo(k)fluoranthene
0.004
0.038
0.035
0.002
0.007
0.011
Benzo(a)pyrene
0.002
0.014
0.018
ND
0.002
0.004
INDeno(1,2,3-cd)pyrene
0.002
0.043
0.038
ND
0.007
0.011
Dibenz(a,h)anthracene
ND
0.020
0.020
ND
ND
ND
Benzo(g,h,I)perylene
0.004
0.036
0.035
ND
0.007
0.011
ND = Not Detected
In another study on the wet and dry deposition of organochlorine pesticides in the Pearl River Delta, samples
collected from 14 stations from April to June 2001 were analysed to assess deposition fluxes in order to gain an
insight into possible migration processes in air. The deposition fluxes of HCHs and DDTs are within the range
of 0.6-9.4 ng/m2/day and 0.4-15.0ng/m2/day, respectively.
Nationwide monitoring of PCDD/PCDF deposition was carried out in 1999 in Japan. Wet and dry deposition
was separately collected by automatic sampling instruments. Results of this survey are summarized in Table 4.3
(Takei et al., 2000).
Table 4.3 Atmospheric Deposition of PCDD/PCDFs and Co-PCBs in Japan (Takei et al., 2000)
Mean Median Range
Unit
N
PCDD/Fs 21
17
0.20-170
pgTEQ/m2/day 205
PCDD/Fs+Co-PCBs 21
18
0.34-66
pgTEQ/m2/day 103
Table 4.4 shows the selected measured data for dry particulate deposition flux of PAHs from air to land in
Republic of Korea. More data will become available for PCBs, organochlorines, and phthalates (Lee, 2002).
Table 4.4 Atmospheric Deposition of Selected PAHs in Republic of Korea (ng/m2/day) (Lee, 2002)
sample site
Acenaph-
Acenaph-
Fluorene Phenanthrene Anthracene
+ year
Thylene
thene
summer seoul
`99
ND
ND
ND
ND
2638.49
inch `99
ND
ND
ND
ND
2394.99
yangs'99
ND
ND
ND
ND
2573.18
73
yangp `99
ND
ND
ND
ND
2394.99
hwac `99
ND
ND
ND
ND
4683.19
choongj `99
ND
ND
ND
ND
896.80
island `99
ND
ND
ND
ND
2204.44
autumn seoul
`99
ND
ND
ND
631.51
440.17
inch `99
ND
ND
ND
2269.48
682.08
yangs `99
ND
ND
ND
150.59
803.05
winter seoul
2000
738.91 1077.25
3834.20 4872.10
147.64
inch 2000
964.71
1612.79
5885.71
12398.02
398.65
yangs 2000
556.10
1087.40
3890.53
2994.93
ND
yangp 2000
344.47
663.27
2519.25
6155.48
169.97
spring seoul
2000
226.17 504.08 1008.06
3217.57
ND
inch 2000
211.59
587.65
1174.62
4705.38
674.14
yangs 2000
140.36
397.54
832.29
2218.27
59.32
yangp 2000
557.84
1322.28
3040.81
7905.18
ND
ND = Not Detected
Atmospheric deposition resulting from European sources are simulated by MSCE-POP model. Selected results
are shown in Table 4.5 (Shatalov V. et al, 2000)
Table 4.5 Deposition Fluxes Over Sea Caused By European Emission Sources (Malanichev , 2002)
Chemical
Deposition Flux, µg/m2/y
Near European Borders
Near Asian Borders
-HCH
1 50
0 10
PCBs
0.1 1
0 0.1
HCH
0.03 0.2
0.01 0.1
4.5.2 Terrestrial Hydrology Related to PTS Transport
4.5.2.1 General Geographical Characteristics of the Region
The land mass of Region VII including freshwater lakes and river systems, etc. is 32.8 million km2. The
terrestrial/freshwater compartment supports terrestrial and freshwater ecosystems and its surface area serves as
a receptor for atmospherically transported contaminants. Persistent toxic substances can enter into the
terrestrial/freshwater compartment by the atmosphere and from direct discharges to the land and water. Rivers
may be key pathways for long-range transport as they can collect water and particulate matter from catchment
areas and transport them over significant distances. The catchment areas of large rivers can include a variety of
sources of contaminants such as agricultural runoff (contaminated with pesticides). Discharges of municipal
and industrial sewage from heavily populated and industrialised areas also contribute to the contaminant load
(AMAP, 1998). Table 4.6 shows the geographical characteristics of selected rivers and Table 4.7 shows the
chracteristics of selected lakes within the Region.
Table 4.6 Geographical Characteristics of Selected Rivers Within Region VII
http://www.infoplease.com/ipa/A0001779.html
Approximate
River
Source
Outflow
Length (km)
Chang Jiang
Tibetan Plateau, China
China Sea
6,300
(Yangtze)
Huang Ho (Yellow) Eastern part of Kunlan Mts., West China
Gulf of Chihli
5,464
Ob
Altai Mts., Russian Federation
Gulf of Ob
5,567
Yenisei
Tannu-Ola Mts., western Tuva, Russian Federation
Arctic Ocean
4,506
74
Irtish
Altai Mts., Russian Federation
Ob River
4,438
Heilong (Amur)
Confluence of Shilka (Russian Federation) and Argun
Tatar Strait
3,420
(Manchuria) rivers
Lena
Baikal Mts., Russian Federation
Arctic Ocean
4,268
Mekong
Tibetan highlands
South China Sea
4,023
Ural
Southern Ural Mts., Russian Federation
Caspian Sea
2,533
Amu Darya (Oxus) Nicholas Range, Pamir Mts., Turkmenistan
Aral Sea
2,414
Salween
Tibet, south of Kunlun Mts.
Gulf of Martaban
2,414
Perl
Eastern Yunnan Province, China
China Sea
2,197
Songhua
ChinaNorth Korea boundary
Amur River
1,927
Table 4.7 Geographical characteristics of selected lakes within Region VII
http://www.infoplease.com/ipa/A0001777.html
Area
Maximum Depth
Name and Location
(km2)
(m)
Caspian Sea, Azerbaijan-Russia-
394,299
946
Kazakhstan-Turkmenistan-Iran1
Aral, Kazakhstan-Uzbekistan
33,800
68
Baikal, Russian Federation
31,500
1,741
Balkhash, Kazakhstan
18,428
27
Issyk-Kul, Kyrgyzstan
6,200
700
Poyang, China
3,583
--
4.5.2.2 Transport By Rivers
Monitoring data summarised in Chapter 3 may be used to estimate the possible transport of PTS in the Region.
Contamination by PCBs in Chinese river, soils and mussels are reported (Chen et al.,1999; Chu et al., 1995).
However, at this moment, there are no summarised estimates describing the transport of PTS by river discharge
based on these monitoring data.
4.5.2.3 Local Wastewater Discharges
Local wastewater discharges can carry significant amounts of contaminants, such as those from untreated or
partially treated municipal sewage, construction waste, disposal of industrial wastewaters (i.e.oil, mining,
smelting) etc. Storm and melt-water from ice and snow, which are usually channeled directly to receiving water
bodies without treatment, may be highly contaminated due to spills and localised atmospheric fallout.
4.5.2.4 Regional Wastewater Sources
Wastewaters within the Region may originate from the discharges of contaminants from heavily industrialised
developments. For example, due to rapid industrialisation of the Pearl River Delta Region after China's open
door policy, the delta has become significantly polluted and has adversely affected the quality of the
environment.
Regional wastewater sources into the freshwater systems of theRegion need to be further investigated.
4.5.2.5 Snowpack and Snowmelt
There is a lack of knowledge and information concerning snowpack and icemelt. However in general, for most
of the Region, they are not believed to be significant as most of the countries are in the temperate climatic zone.
Transport through ice is not considered significant in the Region.
75
4.5.3 Oceans as Pathway
4.5.3.1 General Description of the Region
The ocean that have direct physical contact with the terrestrial compartment of Region VII is the Pacific Ocean.
There are several other major water bodies. Figure 4.8 shows the HCB concentration distribution in the upper
oceanic layer estimated by MSCE-POP model from European sources.
0 - 0.05
0.05 - 0.1
0.1 - 0.5
0.5 - 5
> 5
Figure 4.8 HCB Concentration Distribution in the Upper Ooceanic Layer from European Sources in 1990, pg/l
(Malanichev, 2002)
4.5.3.2 River Discharges to the Oceans
There are several large rivers that have discharges to the oceans in the Region. Information on the possible
discharge of PTS compounds by the river is necessary for a detailed understanding of this pathway.
4.5.3.3 Atmospheric Deposition to the Oceans
Contaminants that have been emitted into the atmosphere will eventually return to the terrestrial and freshwater
compartments along with the oceans. As previously mentioned, transport through the atmosphere is the fastest
of the three components.
4.5.3.4 Ice
The Sea of Okhotsk and the Tatar Strait, located in the east of the Russian Federation, exhibit temporary ice
pack cover. However, in general, ice is not significant for the Region VII.
4.5.3.5 Sea Currents as Possible Oceanic Transport Pathway
The major currents in the Region are the Oyashio, the Tsushima Current, and Kuroshio Current located around
Japan.
Figure 4.9 shows that the PCDD/PCDF levels in squid obtained in northeastern part of Pacific Ocean decreases
with distance from Japan coast. Monitoring data show relatively high concentrations in shore areas of Japan
compared to the central ocean. Transport mechanisms for the phenomena are not well described yet although
the monitored concentration gradient apparently shows transport from terrestrial Region to oceanic Region.
Sea currents are an important consideration for this Region. It should be noted that these currents may have
transboundary transport implications for Region I (Arctic), Region VIII (South-east Asia and South Pacific),
and Region IX (Pacific Islands).
76
Figure 4.9 PCDD/PCDF concentration of squid in Pacific Ocean (pg/g) (Hashimoto et al., 2000)
4.6 DATA
GAPS
Major data gaps exist in the Region. The following section outlines possible data gaps to attain improved
assessment of contaminant transport in the Region.
4.6.1 What Information Needs To Be Collected?
4.6.1.1 Source Inventory Data
Establishment of consistent emission inventory across different regions is required. Expert estimate of emission
may be used as the initial step of emission evaluation.
4.6.1.2 Monitoring Data Concerning Modelling Purpose
A monitoring strategy should be designed to get temporally and spatially representative information in different
parts within the Region and across Regions. Monitoring data are necessary for model validation and evaluation
of levels of pollution. Monitoring data for soil should receive priority.
4.6.1.3 Contamination Level in Biota
Ecological effect seems to be more important at this stage, however, monitoring data for biota are also
important to quantify the chemical transport by biota migration. Data to fulfill the gaps should be developed in
the Region.
4.6.1.4 Modelling
Data
Physico-chemical properties are not available for some PTS. Possible factors that may affect Region specific
conditions, e.g. temperature, degradation rate, sedimentation/resuspension of suspended solids may also be
important. Information on the partition coefficients between gas and particles in air is extremely important,
along with data on wet deposition. The role of vegetation in the exchange process between air and soil is likely
to be important, so land cover information should be considered in more detail in the modelling work.
Interactions between air and ocean including sea current should also be taken into consideration.
4.6.2 How Should It Be Collected?
4.6.2.1 Source Inventory Data
The general needs for possible harmonisation of source inventory system has been identified. It is
recommended that a harmonised inventory system be developed..
4.6.2.2 Monitoring Data for Modelling Purpose
A data gap for Regional scale monitoring from the point of modelling has been identified. It is recommended
that monitoring strategy with regionally harmonised methods and systems are to be developed to narrow the
77
data gap on this point.
4.6.2.3 Concentration Level in Biota
Monitoring strategies with regionally harmonised methods and systems are also important to fulfil the data gap
for bio-transport of PTS.
4.6.2.4 Modelling
Data
Chemical-specific modelling data is not a regionally specific data gap, however, many modelling data have a
Region-specific nature, e.g., meteorological and/or geographical characteristics of the Region. Information on
advective transport by sea currents and/or large rivers may have priorities in combination with appropriate
monitoring dataset.
4.6.2.5 Source Pattern and Fingerprint
Characterisation and comparison of source patterns and fingerprints in different Regions may provide critical
evidence for trans-boundary transport of PTS, as well as their possible decay in the process of atmospheric
transport. These may include the use of molecular markers, pollutant patterns and compound-specific stable
isotopic compositions or patterns of selected compounds.
4.7 CONCLUSIONS
Because of the meteorological and geographical nature of the Region VII, there may be special concerns for the
development of transport models with a relatively large ocean area. Monitoring data do exist in several
countries, showing the possibility of long-range transport of PTS compounds. Some countries have experience
of transport assessment by modelling methodology, including; the hemispheric model at MSCE (EMEP),
multimedia modelling by Republic of Korea (POPsME and EDCSeoul) and Japan (Grid-Catchments integrated
MMM). However, the transboundary transport of PTS within the Region VII is not yet well described by either
modelling or monitoring approaches.
Substantial effort will be necessary to fill the data and technical gaps and to assess the long-range transport of
PTS in the Region.
Several data gaps are identified, and the importance of the gaps could tentatively prioritised as follows:
(1) Source inventory data: This is especially important, not only from the point of source identification, but
also from the point of the extensive transport assessment.
(2) Monitoring data: Again this is especially important, not only from the point of monitoring itself, but also
from the point of developing reliable transport assessments.
(3) Modelling data: There is always a general need for this topic, but continuing efforts in cooporation with
global experts could be suggested as a possible way forward.
(5) Source patterns and fingerprints: This point is not directly a data gap, but it should be considered to be
an important methodology to fulfill the gaps concerning PTS transport.
As a general comment for conclusion, transport assessment using an integrated approach may be important for
future risk management of PTS in the Region.
78
5 PRELIMINARY ASSESSMENT OF THE REGIONAL CAPACITY AND
NEED TO MANAGE PTS
5.1 INTRODUCTION
There are eleven countries with different economic development levels in the Region, which include developed
countries such as Japan, developing countries such as China and Mongolia, and Russian Federation and
Kazakhstan etc. whose economies are under transition. This chapter attempts to collate and integrate the
capacities and needs of these countries based on their status.
To compose this chapter, a questionnaire, designed in October 2001, was circulated to Regional team members
and representatives of the different countries within Region VII. Information was also collected from a wide
range of sources during various environmental protection meetings held within the Region using presentations
of representatives from different countries. This chapter is based on synthesising as much information as
possible, and several revisions.
5.2 MONITORING
CAPACITY
5.2.1 Environmental Monitoring
5.2.1.1 National
Level
Only a few countries in the Region possess stable environmental monitoring personnel, for example, in Japan
environmental monitoring is one of the major duties of its Ministry of Environment. The government of Japan
has a number environmental monitoring personel who are assured of funding and advanced instrumentation,
and are under strict administration. They provide abundant and comparable scientific data on the historical and
present state of environmental pollution. Moreover, other concerned ministries, local governments, universities
and some private research institutions also conduct some PTS monitoring.
In Republic of Korea, the Ministry of Environment has established mid- and long-term research plans
concerning Endocrine Disrupting Chemiocals (EDCs) including PTS. According to this plan, National
Environmental Monitoring is being conducted to measure the environmental levels of contamination by EDCs.
In China, environment monitoring is carried out under a unified plan, with organisation and coordination by
environmental protection departments at different levels. Environment monitoring stations including those
belonging to the agricultural sector have been set up at four levels (central, province, county, enterprise) to
form a nationwide network of environmental protection, which carries out monitoring of certain pollutants and
pollution indices according to unified standards with standardised processes and procedures. However, in
addition to inefficient equipment and lack of funding, there are no stipulations with regard to the monitoring of
PTS, thus regular monitoring of PTS has not yet been carried out. The scattered data collected are mainly
generated from scientific research institutes and institutions of higher learning. Efforts have been made to set
up major facilities for analysing PTS in several cities throughout China.
In China, under the organization of Ministry of Health (MOH), several PTS monitoring programs have been
implemented. In 1980s, China joined the Global Environment Monitoring System (GEMS), and the Chinese
Center for Disease Control and Prevention (CDC) passed the quality control evaluation of GEMS. In the
middle of 1980s, a monitoring program on accumulation level of hazardous substances in human body, which
was developed by MOH, was implemented in 31cities of 28 provinces. DDT in water as well as DDT and PCB
in biological materials were monitored until 1990s. As there were not enough funds to support routine
operation of environmental monitoring stations, such monitoring programs discontinued after 1990s. However,
the CDCs in the national and provincial levels still have the ability to monitor the main PTS in water and
biological materials. For the improvement of the quality and reliability of hazard monitoring data, the MOH has
begun to certify laboratories for toxicity evaluation and to establish national GLP laboratory and networking for
chemical safety testing since 2000.
In Hong Kong SAR, the Environmental Protection Department has commissioned environmental consultants to
monitor PTS in the environment. Scientists from local universities have conducted studies related to PTS
contamination in different ecological compartments.
79
In Russian Federation there are 4 laboratories accredited for PCDD/PCDF analysis (also on an international
level).
No regular environment monitoring personnel have been appointed in some of the countries in the Region,
where monitoring is carried out on an ad-hoc basis by research institutes. This prevents governments from
obtaining comprehensive information about environmental pollution.
5.2.1.2 Regional
level
So far there is no Regional network for the monitoring of chemicals in the environment.
5.2.1.3 Global
level
The Global Environment Monitoring System (GEMS) was established as early as the early 80's, and many
countries in this Region joined the system. However, this system does not have funding to support the routine
operation of environment monitoring stations for all countries. Furthermore, PTS are not included in the items
for monitoring according to the requirement of GEMS.
5.2.2 Methods of Monitoring
5.2.2.1 National
Level
In order to ensure the comparability of data collected, many countries in the Region have set requirements for
monitoring methods. All of these standardised methods are mostly focused on organiochlorine pesticides.
When it comes to different environmental media, in most cases only PTS in water are monitored. A summary
of the existing standardised methods of different countries are shown below in Table 5.1.
Table 5.1 Major Standardised Monitoring Methods*
PTS
Countries
Environmental Media
Analytical Methods
Detection Limit
Aldrin Japan
Air/water/sediment/ organisms
POPs**
No DL
GC/MS-SIM
Republic
of
Water
Analytical Methods on
1 ng/L
Korea
EDCs ***
Republic
of
Sediment/soil
Analytical Methods on
0.06 µg /kg dry
Korea
EDCs
Russian
Foodstuff
Photocolorimetry, TLC,
0.01- 0.1 mg/kg
Federation
GC, GLC
Fruits and vegetable
Photocolorimetry 0.1
mg/kg
Air
Photocolorimetry
0.1
µg Cl2 in
sample
Meat, meat products and animal
TLC 0.02-0.08
mg/kg
fat, water, soil, fish, milk, etc.
Water
0.0025
mg/L
Milk
0.01
mg/L
Meat, fish, fat
0.02 mg/kg
Butter
0.0025
mg/kg
GLC 0.5
µg/ml extract,
or 0.01 µg in
sample
Chlordane Japan
Air/water/sediment/organisms POPs
No DL
GC/MS-SIM
Sediments
Black book**
1 ng/g dry
GC/MS-SIM
80
Organisms
Black book
1 ng/g wet
GC/ECD or GC/MS
Republic
of
Water
Analytical Methods on
1 ng/L
Korea
EDCs
Republic
of
Sediment/soil
Analytical Methods on
0.07 µg/kg dry
Korea
EDCs
DDT
China
Surface water/ground water/ some
GB7492-87****
200 ng/L
wastewater
GC/ECD
Soil
GB/T
14550-93
>0.005 mg/kg
GC/ECD
Japan
Air/water/sediments/
POPs
No DL
organisms
GC/MS-SIM
Sediments
Black book
1 ng/g dry
GC/MS-SIM
Organisms
Black book
1 ng/g wet
GC/ECD or GC/MS
Kazakhstan
Water/soil
Vapour
phase
chromatographer
Republic
of
Water
Analytical Methods on
25 ng/L
Korea
EDCs
Republic
of
Sediment/soil
Analytical Methods on
5 µg/kg dry
Korea
EDCs
Kyrgyzstan
Water
200
µg/L
Russian
Air/soil/water/foodstuff TLC,
GLC 0.01-0.05
Federation
mg/kg (L)
Dieldrin Japan
Air/water/sediments/
POPs
No DL
organisms
GC/MS-SIM
Sediments
Black book
1 ng/g dry
GC/MS-SIM
Organisms
Black book
1 ng/g wet
GC/ECD or GC/MS
Russian
Air/soil/water Photocalorimetric,
TLC,
0.01-0.1mg/kg (L)
Federation
GC
see aldrin
Republic
of
Water
Analytical Methods on
6 ng/ L
Korea
EDCs
Endrin Japan
Air/
water/sediment/ organisms
POPs
No DL
GC/MS-SIM
Republic
of
Water
Analytical Methods on
3 ng/L
Korea
EDCs
Republic
of
Sediment/soil
Analytical Methods on
0.13 µg/kg dry
Korea
EDCs
81
Heptachlor Japan Air/water/sediment/organisms POPs
No DL
GC/MS-SIM
Republic
of
Water
Analytical Methods on
1 ng/L
Korea
EDCs
Republic
of
Sediment/soil
Analytical Methods on
0.04 µg/kg dry
Korea
EDCs
Russian
Air/water/soil
0.01-0.1mg/kg (L)
Federation
HCB Japan
Air/water/sediment/ organisms
POPs
No DL
GC/MS-SIM
Sediments
Black book
1 ng/g dry
GC/MS-SIM
Organisms
Black book
1 ng/g wet
GC/ECD or GC/MS
Republic
of
Air
Analytical Methods on
0.01 ng/ m3
Korea
EDCs
Republic
of
Water
Analytical Methods on
0.5 ng/L
Korea
EDCs
Republic
of
Sediment/soil
Analytical Methods on
0.02 µg/kg dry
Korea
EDCs
Russian
Air GLC
5*10-5 µg/µL
Federation
solvent
Water/foodstuff TLC 0.5
µg (90 %)
Soil
GLC 0.005-0.007
mg/kg
Mirex No
information
Toxaphene Russian Air/soil/water/plants GLC
0.1-0.2
ng
Federation
PCBs
China
Surface water
"Standard Guideline for
the Water and Waste
Water Monitoring " (ed.
15)
GC/ECD
Japan
Air/water/sediment/ organisms
POPs
No DL
GC/MS-SIM
Water
Water
Environment
0.5 µg/L
Quality Standard
GLC
Organisms
Black book
10 ng/g wet
GC/ECD or GC/MS
Republic
of
Water
Analytical Methods on
100 ng/L
Korea
EDCs
Republic
of
Sediment/soil
Analytical Methods on
0.5 µg/kg dry
Korea
EDCs
82
Russian
Water, soil, air, live organism,
GLC, CMS (as sum
DL-1 ng
Federation
foodstuff
PCB, analog EPA-600)
For environmental
matrix RD 52.18578-97.
Moscow 1999.
For foodstuff MUK
4.1.1023-01. Min of
Health RF, 2001.
PCDD
China
In gas/ liquid/solid status
HJ/T 77-2001
10-100 pg/L
(Water)
1-10 ng/kg (Solid)
0.5-5.0 pg/µl
(extractant)
Japan
Air/water/sediment/soil/
For dioxins analysis, an
organisms
analytical laboratory
accredited system exists
in Japan
GC/MS-SIM
Republic
of
Air/water/sediment/soil
Analytical Methods on
Korea
EDCs
Russian
Air
GN 2.16.014-94
<0.01-< 0.05 pg/g
Federation
in sample
Drinking water, ground and fresh
Order of Ministry of
<0.01-<0.05
water, water inlet
Health USSR No.142-
9/105. 05.05.1991
pg/g in sample
Soil, bottom sediments
Order of Ministry of
<0.01-<0.05
Health USSR No. 697.
08.09.68.
pg/g in sample
Milk and dairy, fish and fish
Order of Ministry of
<0.01-<0.05
productions, meat and meat
Health USSR No.142-
productions
9/105. 05.05.1991
pg/g in
sample
PCDF
see PCDD
B(a)P
China
Surface water/industrial waste
GB11895-89
water
Air
GB/T
15439-1995
6×10⁻⁵ ng/L
(acetonitrile as
mobil phase)
1.8×10⁻⁵ ng/L
(methanol/water as
mobil phase)
Japan
Air/water/sediments/ organisms
GC/MS HPLC-FL
No DL
Republic
of
Air
Analytical Methods on
0.03 ng/m3
Korea
EDCs
Republic
of
Water
Analytical Methods on
10 ng/L
Korea
EDCs
Republic
of
Sediment/soil
Analytical Methods on
0.1 µg/kg dry
Korea
EDCs
83
HCH
China
Surface water/Ground water/
GB7492-87
4 ng/L
Some sewage
GC/ECD
Soil
GB/T 14550-93
0.005 mg/kg
Japan
Air/water/sediments/ organisms
POPs
No DL
GC/MS-SIM
Sediments
Black book
1 ng/g dry
GC/MS-SIM
Organisms
Black
GC/ECD or GC/MS
Kazakhstan
Water/soil
Vapour
phase
chromatographer
Republic
of
Water
Analytical Methods on
1 ng/L
Korea
EDCs
Republic
of
Sediment/soil
Analytical Methods on
0.02 µg/kg dry
Korea
EDCs
(-HCH)
0.03 µg/kg dry
(-HCH)
0.04 µg/kg dry
(,-HCH)
Kyrgyzstan
Water
4 µg /L (-HCH)
Russian
Water, soil, live organism,
GLC
4-10 µg/kg (-
Federation
foodstuff
HCH)
TLC 120 µg/kg (-
HCH)
Oscillopolarography
1 µg/kg (-HCH)
PCP
China
Surface water
GB 8972-88
0.04 µg/L (50mL)
GC/ECD
Industrial water
GB 9803-88
0.01 mg/L
Spectrophotometer
Republic
of
Water
Analytical Methods on
5 ng/L
Korea
EDCs
Republic
of
Sediment/soil
Analytical Methods on
0.5 µg/kg dry
Korea
EDCs
PCP-Na
China
Surface water
GB 8972-88
0.04 µg/L (50mL)
GC/ECD
PBDE No
information
Organic
Japan
Water
GLC or TLC-AAS
0.0005mg/L
Mercury
Comp.
84
Methyl
China Water
GB/T17132-1997
0.01 ng/L
Mercury
GC/ECD
Water (Methyl Hg, Ethyl Hg)
GB/T14204-93
10 ng/L (Methyl
Hg)
GC/ECD
20 ng/L (Ethyl Hg)
Sediment
GB/T17132-1997
0.02 ng/kg
GC/ECD
Fish
GB/T17132-1997
0.1 ng/kg
GC/ECD
Hair
GB/T17132-1997
1 ng/kg
GC/ECD
Urine
GB/T17132-1997
2 ng/L
GC/ECD
Ethyl Hg
Russian
Air in industrial area, water
(pesticides)
Federation
Foodstuff
SanPiN
42-123-4540-87
GLC 0.005
mg/kg
TLC 0.12-0.4
mg/kg
Org. Tin
Republic of
Water
Analytical Methods on
1 ng/L
Compds.
Korea
EDCs
Republic
of
Sediment/soil
Analytical Methods on
0.1 µg/kg dry
Korea
EDCs
*AAS: Atomic Absorption Spectrometry; CMS: Chromato-Mass-Spectrometry; GC: Gas Chromatography; GLC: Gas-liquid Chromatography; HPLC-
FL: High Performance Liquid Chromatography with Fluorimetric Detection; SIM: Selected (or Single) Ion Monitoring; TLC: Thin-layer
Chromatography
** POPs: POPs monitoring method (2001~); Black book: Analytical methods used for monitoring in "Chemicals in the Environment". These methods
have been, or will be used for long-term environmental monitoring in Japan.
***Analytical Methods on EDCs were published by NIER of Republic of Korea
****GB: National Standard of China
5.2.2.2 Regional
Level
A UN sponsored university project has provided standards and methods for participants for at least some of the
compounds of concern, however, it was found that different methods are used in different countries even for the
monitoring of the same chemicals. There is so far no unified methods in the Region for PTS analysis. This
hampers the comparability of the data collected by different countries.
http://landbase.hq.unu.edu/Monitoring/MonitoringtheEnvironment.htm
5.2.3 Items Actually Monitored
5.2.3.1 Regular
Monitoring
The establishment of certain methods does not guarantee that actual monitoring will be carried out. In China,
there are standardised methods to monitor PTS in certain goods or products as is required by foreign trade, but
not all such products are monitored. The standard for PCDD/PCDF analysis in ash released from incinerators
was set in 1999, but the laboratories are still being established and need to be certified, it is essential for China
to build up her capacity in regular monitoring of PCDD/PCDF.
Japan has carried out regular monitoring for most PTS. The Ministry of Environment started environmental
monitoring from 1974 and has been reporting monitoring data annually in Chemicals in the Environment (or
KUROHON--"black book" in Japanese). The monitoring includes several categories, i.e., 1) a survey of
prioritised chemicals (c.a. 20 compounds each year) in air and water, 2) yearly monitoring by GC/MS of Class I
+ frequently detected chemicals in water and sediments, 3) yearly GC/ECD and GC/FPD monitoring of Class I
organochlorines and organotins, respectively in mussels and other organisms, 4) monitoring of residue levels of
some of the designated/registered chemicals in ambient air, indoor air, foods, water and sediments, and 5)
monitoring of unintentionally produced chemicals (until 1997; PCDD/PCDF and coplanar-PCBs, 1998~:
85
PBDDs and PBDFs).
An extensive nationwide survey for unintentionally produced chemicals has been conducted and the data
reported. Legislation has been passed concerning special measures against PCDD/PCDF in 1999. Furthermore,
another nationwide survey in Japan on endocrine disruptive chemicals started in 1998 (SPEED`98)
(http://www.env.go.jp), and the analytical data on some PTS are also reported.
In Hong Kong SAR, the Environmental Protection Department has been monitoring PCBs and PAHs in marine
sediment since 1987 and in 2000, a total of 60 stations (45 in open waters and 15 in typhoon shelters) were
routinely monitored (EPD, 2001). Routine monitoring of PCDD/PCDF, PAHS and total PCBs in ambient air at
two urban locations has also been conducted since mid-1997.
Extensive research on PCBs and other organochlorine chemicals, as well as many other pollutants, has been
conducted at national as well as local governmental research centers, universities and other institutes, and a
large amount of data have been reported.
The Ministry of Environment in Republic of Korea has conducted environmental monitoring of EDCs
including POPs since 1999 and has been reporting monitoring data annually. Experimental methods of EDCs
have been published in 1999 by National Institute of Environmental Research and revised in 2002. Overall
results of environmental monitoring would provide the fundamental and scientific data on future EDCs research
planning and also provide some rationale for decision-making for legislative and regulatory action.
In response to the inquiry of Stockholm Convention, the Ministry of Environment of Japan is now reorganising
its environmental monitoring system, and will re-start POPs monitoring from from April 2002. Ten chemicals
containing POPs (except PCDD/PCDF which are now monitored extensively in accordance with national
legislation) in air, water, sediments and biological samples (especially bivalves) are analysed. A combination of
13C-labeled internal standard techniques and GC/MS systems will be used in order to conduct precise and
reliable analysis in order to provide a basis for the understanding of the status and trends of POPs pollution in
the Asia-Pacific Region.
Regular monitoring of the PAHs (B(a)P) in air is conducted in all industrial cities of the Russian Federation and
Kazakhstan. Regular monitoring of pesticides is conducted in foodstuffs, soils and fresh water in the Russian
Federation, Kazakhstan , Kyrgyzstan, Tajikistan, Uzbekistan, and Mongolia.
5.2.3.2 Non-Regular
Monitoring
Although most countries in the Region have not carried out routine monitoring of PTS in response to
recognition of the potential harmful effects of PTS, ad hoc monitoring of certain PTS has been carried out by
most governments within their limited capacity. For example, Hong Kong SAR has recently commissioned a
study of PTS pollution of the marine environment.
Non-regular monitoring of PCDD/PCDF and PCBs sources and levels in the environment and humans are
conducted in Asian part of Russian Federation. The periodical control of mercury and organic mercury
compounds in the environment is conducted within gold mining areas (Chita oblast, Magadan oblast, Irkutask
oblast, Irkutsk oblast).
5.2.3.3 Co-operation Between Countries in Monitoring PTS
Japan and the Republic of Korea are carrying out a joint research program to study EDCs such as PCDD/PCDF
and PCBs. Research includes methods to monitor and techniques to test EDCs. Organisations taking part in the
program include NIES of Japan and NIER of Republic of Korea.
5.2.3.4 Items for the Effects on Human Health
Of items monitored and studied, the analysis of PTS in the environment account for the greatest percentage.
There are few cases of monitoring concerning PTS concentration in humans. There is only very scattered data
resulting from investigations of epidemic diseases caused by PTS, due to the lack of funding.
5.3 EXISTING REGULATIONS AND MANAGEMENT STRUCTURES
5.3.1 Laws and Regulations
Management of PTS through legislation is the major means adopted by all nations in the Region. Many
countries have modified regulations and rules in principle concerning the management--from production to
86
disposal--of hazardous chemicals including PTS. Analysis of legislation and regulation in different countries
has shown disparities, especially in the intensity of measures taken owing to different levels of development
and varying levels of recognition of the harm of PTS. A summary of the existing legislation and regulation is
shown below in Table 5.2.
Table 5.2 Major Laws and Regulations Concerning PTS
Countries
Laws and Regulations (Effective Dates)
China
1. Code of Occupational Disease Prevention of PRC (1st May, 2002)
2. Regulations on Hazardous Chemicals Safety (15th March, 2002)
3. Regulations on the Management of Pesticides (8th May, 1997)
4. Regulations for Environmental Management on the First Import of Chemicals and the
Import and Export of Toxic Chemicals (1st May, 1994)
Hong Kong SAR 1. Waste Disposal (Chemical Waste)(General) Regulation under the Waste Disposal
Ordinance, Chapter 354 (1992)
2. Water Pollution Control Ordinance, Chapter 358 (1980)
3. Air Pollution Control Ordinance, Chapter 311 (1983)
4. Dangerous Goods Ordinance, Chapter 295 (1956)
5. The Pesticides Ordinance, Chapter 133 (15th July, 1977)
6. Import and Export Ordinance, Chapter 60 (1st January, 1972)
7. Factories and Industrial Undertakings Ordinance (Chapter 59) (1955)
8. Occupational Safety and Health Ordinance (Chapter 509) (1997)
Democratic
1. Law on Environmental Protection (1986)
People's
2. Law on Land (1977)
Republic of
3. Law on Fishery (1995)
Korea
Republic of
1. Toxic Chemicals Control act (1990)
Korea
2. Agrochemical Management Act
3. Waste Management Act (1997)
4. Air and Water Quality Preservation Act
5. Soil
Environment Preservation Act
6. Industrial Safety Health Act
Japan
1. Law Concerning the Examination and Regulation of Manufactures, etc. of Chemical
Substances (1973)
2. Agriculture Chemicals Regulation Law (1948)
3. Law Concerning Special Measures against Dioxins (1999)
4. Law for the Promotion of Environmentally Sound Destruction of PCB Waste (2001)
5. Law Concerning Reporting, etc. of Release to the Environment of Specific Chemical
Substances and Promoting Improvements in their Management (2001)
Kazakhstan
1. Regulations about Licensing Import and Export of Goods (activities, services) in the
Republic of Kazakhstan
2. Guideline for Organization of State Environmental Control over Use, Storage,
Transportation and Disposal of Pesticides and Mineral Fertilizers
3. Sanitary Rules and Norms of Storage, Transportation and Use of Chemical Plant Protection
Means
4. List Chemical and Biological Means of Pest, Plant Disease, and Weed Prevention,
Defoliants, and Regulators of Plant Growth Allowed for Use in Agriculture and Forestry in
the Republic of Kazakhstan in 1997-2001
Kyrgyzstan
1. Law on Chemicals and Plant Protection (1999)
2. Law about the Environmental Protection
3. Law on Atmosphere Air
Mongolia
1. Law on Protection from Toxic Chemical Substances (1995)
2. Law on Environmental Impact Assessment (1998)
Russian
1. Law on Environment Protection (2002)
Federation
2. The Earth Code (2001)
3. The Water Code (1998)
4. Law on Air Protection (1999)
5. Law about Sanitary Epidemiological Well-being of the Population (1999)
6. Law about Safe Handling with Pesticides and Agrochemicals
87
Tajikistan
1. Law on the Natural Reservation (1993)
2. Law on the Waste (2002)
3. The Earth Code
4. The Water Code
5. Law on the Atmosphere Air Protection
Turkmenistan
1. Law on the Environment Protection (1991)
2. Decree of President about Commission of the importation and usage of the pesticides
(1997)
Uzbekistan
1. Law about Agricultural Plant Protection
2. About regulation of input in Republic of Uzbekistan and conclusion from its territory
ecologically of dangerous production and solid waste (2000)
3. Law on Nature Reservation (1992)
4. Law on Atmosphere Air (1986)
5. Law on Waste (2002)
6. List Chemical and Biological Means of Pest, Plant Disease and Weed Prevention,
Defoliants and Regulators of Plant Growth allowed for Use on Agriculture (2001-2005)
Some countries within the Region have no specific legislation concerning hazardous chemicals, although there
may be some relevant stipulations in environment protection legislation and elsewhere.
The standards of some PTS have been set for some environmental media in the Region. A summary of these
standards is shown below in Table 5.3 to Table 5.7.
Table 5.3 Major Environmental Standards on PTS
PTS Environmental
Standards
Aldrin
Uzbekistan:
Air: 0.01 mg/m3
Ground water: 0.002 µg/L
Chlordane No
information
DDT
China:
Fishery water: 0.001 mg/L
Ground water: (I)ND; (II)0.005 µg/L; (III)0.05 µg/L; (IV)1.0 µg/L
Soil: (I)0.05µg/L; (II)0.5 µg/L; (III)1.0µg/L
Democratic People's Republic of Korea:
Soil: 0.1mg/kg
Russian Federation:
Air (working zone): 0.1 mg/m3
Air: 0.005 mg/m3
Soil: 0.1 mg/kg
Water: 0.002 mg/L
Maximum allowed (permissible) level
Potato, vegetables: 0.1 mg/kg
Meat, eggs, grain of the bread plants: 0.02 mg/kg
Milk: 0.05 mg/L
Fish: 0.2 0.3 mg/kg
Plant oil: 0.25 mg/kg
Uzbekistan:
Air: 0.005 mg/m3
Ground water: 0.002 µg/L
Soil: 0.5 mg/kg
Dieldrin No
information
Endrin No
information
Heptachlor
Russian Federation:
Air (working zone): 0.01 mg/m3
Water: 0.001 mg/L
Soil: 0.05 mg/kg
Permissible residual conc.:
Plant oil: 0.02 0.25 mg/kg
For others food products not permissible
Uzbekistan:
Ground water: 0.05 µg/L
Soil: 0.05 mg/kg
Air: 0.9 mg/m3
88
Hexachlorbenzene
Uzbekistan:
Air: 0.013 mg/m3
Ground water: 0.05 µg/L
Mirex No
information
Toxaphene
Russian Federation:
Air (working zone): 0.2 mg/m3
Water: 0.002 mg/L
Soil: 0.5 mg/kg
Maximum allowed level:
Beetroot: 0.1 mg/kg
For others food product: not permissible
PCBs
Japan:
Water: not detected (detection limit of the analytical method is set to
0.5 µg/L)
Russian Federation:
Air (industrial area): 1 mg/m3
Water: 0.5 2.5 ng/L
Soil: 0.1 mg/kg
Fish: 0.1 mg/kg wet weight
Milk: 1.5 mg/kg of lipid base
Dioxins
Japan:
(Dioxins = PCDDs + PCDFs + co-PCB)
Air: yearly average <0.6 pg TEQ/m3
Water: yearly average <1 pg TEQ/L
Sediments: <150 pg TEQ/g
Soils: <1000 pg TEQ/g
Refer to Table 5.4, Table 5.5
Republic of Korea:
Refer to Table 5.6, Table 5.7
Russian Federation: (TEQ)
Air: 0.5 pg/m3
Water: 20 pg/L
Sediment: 9 ng/kg
Soil: 0.33 ng/kg
Fish: 88ng/kg of lipid base
Meat: 3.3 ng/kg of lipid base
Milk: 5.2 ng/kg of lipid base
China:
Air: 0.01µg/m3;
Surface water: (I)0.0025µg/L; (II)0.0025µg/L; (III)0.0025µg/L.
Pollutants in sludge from agricultural use: 3mg/kg
Wastewater discharged: 0.00003mg/L
Russian Federation
Air (working zone): 0.15 µg/m3
Air: 1 ng/m3
Water: 0.000005 µg/L
Soil: 20 µ/kg
HCH
China:
Ground water: (I)0.005 µg/L; (II)0.05 µg/L; (III)5.0 µg/L; (IV)5.0
Soil: (I)0.05 µg/L;; (II)0.5 µg/L; (III)1.0 µg/L
Uzbekistan:
Air: 0.03 µg/m3
Ground water: 0.02 µg/L
Soil: 0.1 mg/kg
Air: 0.1 µg/m3
-HCH
China:
Fishery water: 0.002mg/L
Democratic People's Republic of Korea:
Soil: 0.1mg/kg
PCP
China:
Wastewater discharged: (I)5.0 mg/L ; (II)8.0mg/L; (III)10mg/L;
Russian Federation:
Air (working zone): 0.1 mg/m3
Air: 0.001 mg/m3
Water: 0.3 mg/L
Residual content in food: not permissible
PBDE No
information
89
Org. Hg compds.
China:
Wastewater discharged: ND
Japan:
Water: not detected (detection limit of the method is set to
0.0005 mg/L)
Russian Federation:
Air (working zone): 0.005 mg/m3 (diethylmercury,
ethylmercury chloride)
Air : 0.0003 mg/m3 (diethylmercury)
Water: 0.0001 mg/L (diethylmercury and ethylmercury cloride)
Soil: 2.1 mg/kg (total mercury)
Temporary allowed norms for food products (1989)
Milk, juice: 0.005 mg/kg (total mercury)
Fruits, grain, bread: 0.01 mg/kg (total mercury)
Vegetables: 0.02 mg/kg (total mercury)
Meat: 0.03 mg/kg (total mercury)
Fish: 0.5 mg/kg (total mercury)
I, II, III, IV: Different environmental quality levels in China with I = Good; IV = Poor
Table 5.4 PCDD/PCDF* Emission Gas Standards in Japan (Unit: ng-TEQ/m3)
Existing
Facility under Control
New
Until Nov.
After Dec. 2002
2002
Waste Incineration
>4 t/h-
0.1
80
1
1
2-4 t/h
80
5
<2 t/h
5 80 10
Steel Manufacturing by Electric Furnace
0.5
20
5
Sintering Process of Steel Industry
0.1
2
1
Secondary Production of Zinc
1
40
10
Secondary Production of Aluminum Alloy
1
20
5
* including PCDDs+PCDFs+co-PCBs
Table 5.5 PCDD/PCDF* Effluent Standards in Japan (Unit: pg-TEQ/l)
Existing
Facility
New
Until 14
After 15
Jan
Jan.
2003
2003
Bleaching facilities using chlorine compounds used for manufacturing sulfate
10 10 10
pulps (kraft pulps) or sulfite pulps.
Resolving facilities waste PCB or PCB-processed products.
Cleansing facilities for PCB contaminated matter or PCB- processed products.
Cleansing facilities for waste gas and wet dust collecting facilities relating to
10 20 10
roasting furnaces, melting furnaces or dry kilns used for manufacturing
aluminum or aluminum-base alloy.
Cleansing facilities for dichloroethane used for manufacturing vinyl chloride
monomer.
Cleansing facilities, wet dust collecting facilities, and ash storing facilities
10 50 10
which are related to waste incinerators (capacity of incineration is more than
50kg/h) and discharge sewage or waste solution.
* including PCDD+PCDF+co-PCBs
90
Table 5.6 PCDDs/PCDFs Emission Standard for MSWI in Republic of Korea (Unit: ng-TEQ/m3)
Capacity (>2 t/h)
Standards
Effective Data
New
0.1
19 July 1997
Existing
0.5
1 July 1999 30 June 2003
Existing
0.1
After 1 July 2003
Table 5.7 PCDDs/PCDFs Emission Standard for Incinerator in Republic of Korea (except MSWI)
(Unit: ng-TEQ/m3)
Capacity New
Existing
1 Jan. 2001 31 Dec. 2005
After 1 Jan. 2006
> 4 t/h
0.1
20
1
2 t/h 4 t/h
1
40
5
0.2 t/h 2 t/h
5
40
10
Table 5.8 Emission Standard of B(a)P for Coke Oven in China (mg/m3) (GB 16171-1996)*
Mechanized Non-mechanized
(I) (II)
(III) (I) (II) (III)
Existing
0.0010 0.0040 0.0055 0.010 0.020 0.025
(until 1st July
1999)
New
0.0025
0.0040 1.50 2.00
(after 1st July
1999)
*GB: National Standard of China
I, II, III, IV: Different environmental quality levels in China with I the best and the bigger number the worse
Table 5.9 B(a)P Emission Standard in China (GB 16297-1996)*
Threshold for
Maximal Permitted Emission Rate (kg/h)
Threshold on the
Producing and
Monitoring Sites
Processing of Asphalt
Height of
(I) (II) (III) about the non-
and Carbonate Produce
Chimney
point Emission
(m)
Sources
(mg/m3)
(µg/m3)
Existing
0.50×10⁻³
15 0.06×10⁻³
Banned
0.09×10⁻³
0.01
(until 1st July
20 0.10×10⁻³ 0.15×10⁻³
1997)
30 0.34×10⁻³ 0.51×10⁻³
40 0.59×10⁻³ 0.89×10⁻³
50 0.90×10⁻³ 1.4×10⁻³
60
1.3×10⁻³ 2.0×10⁻³
New
0.30×10⁻³
15 0.050×10⁻³
Banned
0.080×10⁻³
0.008
(after 1st July
20 0.085×10⁻³ 0.13×10⁻³
1997)
30 0.29×10⁻³ 0.43×10⁻³
40 0.50×10⁻³ 0.76×10⁻³
50 0.77×10⁻³ 1.2×10⁻³
60
1.1×10⁻³ 1.7×10⁻³
GB: National Standard of China
I, II, III, IV: Different environmental quality levels in China with I = Good; IV = Poor
91
5.3.2 Administrative
Institutions
5.3.2.1 National
Level
5.3.2.1.1
Responsible Government Organisation
As the management involves many sections and departments, it is hardly possible for any single department to
execute all the necessary administrative requirements with regards to the management of PTS. In many
countries there are three or four departments responsible for the management of PTS and in some countries
there are as many as ten. Apart from the environmental protection department, governmental departments
involved in the management of dangerous chemicals may also include departments engaged in agriculture,
industry/economy, public health, and even foreign affairs when international relations such international
conventions are involved. In general, the environmental protection department is the Focal Point/Competent
Authority/Designated National Authority as stipulated in the Stockholm Convention. In a sense, the capacity of
management of chemicals can be evaluated based on whether a country has set up special organisations and
how many people are assigned to the task.
5.3.2.1.2
Inter-Government Co-ordination
Different countries have different ways to coordinate the management of chemicals between different
departments. For example, Mongolia established its National Council for Chemical Safety (NCCS) in 1998,
whose mandate is to regulate the implementation of governmental laws, resolutions of international
conventions in which Mongolia takes part. NCCS are also involved with decisions concerning toxic and
hazardous chemicals and to provide technical advice on the import of toxic substances and issue import
licenses. They also serve as a steering committee to carry out projects concerning POPs. The present NCCS has
35 members and represents 16 ministries and organisations. It has a network of 21 aimages (Mongolian
Regions), which are sub-divided into more than 300 soums (Mongolian counties), greatly improving co-
ordination between different departments and organisations throughout the nation in the management of
chemicals. The NCCS will serve as the steering committee for POPs activities.
Special inter-departmental committees are formed in some countries to implement certain legislation or to carry
out certain tasks in the management of chemicals. Such committees are usually formed by technical and
administrative specialists from different departments, who will make comprehensive assessments on certain
chemicals from different points of view and put forward advice to concerned departments for the
implementation of relative legislation. In addition, China has established a special inter-department co-
ordination group for the International Forum of Chemical Safety (IFCS) as well as a POPs co-ordination group
for the negotiation of the Stockholm Convention. Members of these groups are mainly administrative and
academic specialists.
A summary of the various management agencies, departments and coordinating mechanisms for the various
countries in the Region are shown in Table 5.10.
Table 5.10 Management Structures
Countries Management
Structures
China
The Ministries/ Agencies/ Committees Concerning PTS:
1. State Environmental Protection Administration
2. State Economic and Trade Commission
3. Ministry of Agriculture
4. Ministry of Health
5. General Bureau of Quality and Technical Supervision
Co-ordinating Mechanism:
1. Inter-ministerial Coordination Group on Chemical Safety in order to carry out the various tasks set
out by the IFCS and effectively participate in IFCS activities
2. State Technical Coordinating Group of POPs for the negotiation of the Stockholm Convention
3. The Committee for the Standardization of Dangerous Chemicals under Regulations on the Control
over Safety of Dangerous Chemicals
4. National Pesticides Register Review Board under The Regulation on the Management of Pesticides
5. The State Toxic Chemicals Review Board under Regulations for Environmental Management on
the First Import of Chemicals and the Import and Export of Toxic Chemicals
The Focal Point for the Stockholm Convention:
State Environmental Protection Administration
92
Hong Kong
The Ministries/ Agencies/ Committees Concerning PTS:
SAR
1. Environment, Transport and Works Bureau
2. Environmental Protection Department
3. Health, Welfare and Food Bureau
4. Agriculture, Fisheries and Conservation Department
5. Environmental Food and Hygiene Department
Democratic
The Ministries/ Agencies/ Committees Concerning PTS:
People's
1. Ministry of Land and Environment Protection
Republic of
2. Ministry of Chemical Industry
Korea
3. Ministry of Agriculture
4. Ministry of Metal and Machine Industries
5. Ministry of Building-materials Industries
6. General Bureau of Quality Control
Co-ordinating Mechanism:
The National Coordinating Committee for Environment.
In general, Ministry of Land and Environment Protection is responsible for control of harmful
chemicals. Other ministries obtain written agreement from the ministry of Land and Environment
Protection with regard to production, use, storage, disposal, import and export of hazardous chemicals.
Institute of Hygiene under the Branch Academy of Medical Sciences, Institute of Chemistry under the
Academy of Agricultural Sciences and Institute of Environmental protection under the Ministry of
Land and Environment protection undertake the activities for examination and registration of these
chemicals.
The Focal Point for the Stockholm Convention:
Ministry of Land and Environment Protection
Republic of
The Ministries/ Agencies/ Committees Concerning PTS:
Korea
1. Ministry of Environment
2. Ministry of Labor
3. Ministry of Health and Welfare
4. Ministry Foreign Affairs and Trade
5. Rural Development Administration
6. Ministry of Maritime Affairs and Fisheries
7. Korea Food and Drug Administration
Co-ordinating Mechanism:
1. Toxic Substance Management Committee
The Focal Point for the Stockholm Convention:
Ministry of Environment
Japan
The Ministries/ Agencies/ Committees Concerning PTS:
1. Ministry of the Environment
2. Ministry of Agriculture, Forestry and Fisheries
3. Ministry of Economy, Trade and Industry
4. Ministry of Health, Labor and Welfare
Co-ordinating Mechanism:
1. Chemical Assessing Committee for the implementation of the Law concerning the Examination and
Regulation of Manufactures, etc., of Chemical Substances.
The Focal Point for the Stockholm Convention:
Ministry of Foreign Affairs
Kazakhstan
The Ministries/ Agencies/ Committees Concerning PTS:
1. Ministry of Economy and Trade
2. Ministry of Nature Resources and Environmental Protection
3. Ministry of Agriculture
4. Ministry of Healthcare
5. Customs Committee of the Ministry of State Revenues
6. Ministry of Energy and Mineral Resources
Kyrgyzstan
The Ministries/ Agencies/ Committees Concerning PTS:
1. Ministry of Ecology and Civil Emergency
2. Ministry of the Health
3. Ministry of Agriculture
93
Mongolia
The Ministries/ Agencies/ Committees Concerning PTS:
1. Ministry of Nature and Environment
2. Ministry of Health
3. Ministry of Labor and Social Welfare
4. Ministry of Food and Agriculture
5. Ministry of Trade and Industry
Co-ordinating Mechanism: National Council for Chemical Safety (NCCS) headed by the Minister of
Nature and Environment of Mongolia
The Focal Point for the Stockholm Convention: Ministry of Nature and Environment of Mongolia
through its Environment Protection Agency with representatives in each aimage
Russian
The Ministries/ Agencies/ Committees Concerning PTS:
Federation
1. Ministry of Natural Resources
2. Ministry of Health
3. State Committee for Hydrometeorology
4. Ministry of Emergency Situation
5. State Chemical Commission under Ministry of Agriculture
6. Center of the Registration of Chemical Compounds
7. Center of Registration and Safety Using of Pesticides
Co-ordinating Mechanism:
According to the order of Ministry of Natural Resources Center of the International Project is
responsible for realizing the requirements of Stockholm Convention in Russian Federation. Center of
the Registration of Chemical Compounds and State Chemical Commission conduct inter-department
coordination between the Ministries of Natural Resources, Health and Agriculture
Tajikistan
The Ministries/ Agencies/ Committees Concerning PTS:
1. Ministry of Natural Protection
2. Ministry of Agriculture
3. Ministry of Health
4. Commission on the Management of Chemicals
Turkmenistan
The Ministries/ Agencies/ Committees Concerning PTS Problem
1.Ministry of Natural Protection
2.Ministry of Agriculture
3.Commission on importation and usage of the pesticides
Uzbekistan
The Ministries/ Agencies/ Committees Concerning PTS:
1. State Committee for Nature Protection
2. State Chemical Commission
3. Ministry of Agriculture
4. Ministry of Healthcare
Co-ordinating Mechanism:
In general, State Committee for Nature Protection Other ministries obtain written agreement from State
Committee for Nature Protection with regard to use, storage, and disposal of hazardous chemicals
The Focal Point for the Stockholm Convention:
State Committee for Nature Protection
5.3.2.2 Regional
Level
There is currently no organisation in the Region in charge of the management of chemicals or co-ordination in
this area. However, there is an organisation (located in Beijing, China) that is related to the management of
chemicals: the Asia-Pacific Regional Center for Hazardous Waste Management Training & Technology
Transfer under the Basel Convention. Their task is to take charge of affairs concerning technical training and
transfer for the management and disposal of hazardous waste matters in the Region. Due to various reasons, the
independence and functions of administration at the Regional level need further clarification.
5.4 STATUS OF ENFORCEMENT
Efforts have been made by all the countries in the Region to strengthen the management of PTS. Efforts are
also being made for the prohibition or strict control of the production, use and emission of PTS in order to
protect the eco-environment and human health in the Region and the global environment.
94


For some countries international cooperation projects are being used to strengthen the capacity for further
enforcement. These projects concerning PTS are witnessing active participation and many are carried out
through bilateral and multilateral funding and co-operation. In some countries inventories of PTS are being
compiled. Table 5.11 shows PTS related programs and actions carried or being carried in the countries of the
Region.
Table 5.11 PTS Related Programs and Actions
Countries
Programs and Actions
China
1. An investigation of typical hazardous organic pollutants in typical parts of the country and its eco-
toxicity safety assessment (2000-2002)
2. Strategy and program on Reduction and Phase-Out of Pesticide POPs in China funded by Italian
government (2002-2003)
3. National Implementation Plan (NIP) for Stockholm Convention PDF-B financed by GEF (2002-
2003)
4. PCB phase-out strategy, funded by Italian government
Hong Kong
1. Study of Toxic Substances Pollution in Hong Kong (1999-2003, Hong Kong SAR Environmental
SAR
Protection Department)
Democratic
1. Standards for environmental protection have been updated to take stronger measures for
People's
prevention of flow, stockpile and transfer of these chemicals
Republic of
Korea
2. Production of DDT has been banned and production and use of HCB and PCP have been severely
restricted
Republic of
1. National dioxin emission inventory: the purpose is to identify emission sources of dioxin-like
Korea
chemicals, -will be available by the end of 2003 (MoE)
2. Mid- and Long-Term Research Program on EDCs including POPs (from 1999) (MoE)
3. Ministerial Implementing Arrangement between Republic of Korea and Japan (April 7, 2001)
Japan
1. Stockholm Convention was acceded on 30th Aug. 2002
2. Extensive monitoring has been conducted in various chemicals in the environment (from 1974)
3. The law concerning special measures against Dioxins (Law No. 105 of 1999) took effect on
January 2000
4. Ministry of Environment is now reorganizing their environmental monitoring system, and will re-
start POPs monitoring from April 2002
5. Ministry of Environment has just started the survey on major sources of non-planer PCB and
unintentionally-released HCB listed in Annex C of Stockholm Convention
Kazakhstan
1. Programme 058 "Environmental monitoring and environmental protection", Sub-programme
"Conducting Environmental Monitoring". PTS: DDT and HCH in soil (twice a year) and water (4
times a year)
2. Preliminary POPs inventory was conducted in 2001 with the support of UNEP Chemicals
Kyrgyzstan
1. The project of "Destroying of prohibited and deteriorated pesticides in the Republic of
Kyrgyzstan" has received the support of the state government
95
Mongolia
1. The first check and examination on storing and using of toxic chemical substances was conducted
in 1994
2. In 1997, Ministry of Nature and Environment (MNE) updated a list of restricted or banned
chemicals in Mongolia. Import of all of the POPs pesticides and industrial chemicals has been
banned
3. The project on removing mercury from the relevant site was implemented by the Ministry of
Nature and Environment and 25 kg mercury was separated from 400 m3 water of 4 hectare area in
2000
4. Some investigations are being conducted on the probability of PTS existence within the range of
the environmental impact assessments made at some industries in accordance with the Law on
Environmental Impact Assessment
5. Enabling activities to facilitate early action on the implementation of the Stockholm Convention
on persistent organic pollutants (POPs)" Project US$ 492,000 has been approved by GEF in July,
2002 and is expected to start by the end of 2002
Russian
1. Measurements of general dioxin toxicity in human milk conducted over the past years
Federation
demonstrated a high risk of environmental pollution with PCB
2. Federal Target Program "Environment and Population Protection from Dioxins and Dioxin-like
toxicants for 1996-1997" made a preliminary assessment of the general dioxin pollution level in
Russian Federation. However no accurate data was obtained
3. In 1999-2000 the inventory of dioxin emitting sources was taken under US EPA financial
support. It showed that there was at least 10 kg for total dioxin air emission in Russian Federation
4. The government has issued several Russian Federation State Environmental Reports in recent
years
5. The PCB inventory taken under the AMAP program and based on official data supplied by
industries show that there are still tens of thousands tons of PCBs in Russian Federation today.
Russian Federation has been given a 25-year deferment for full destruction of PCBs
Tajikistan No
information
Turkmenistan No
information
Uzbekistan
1. The project "Inventory of Obsolete, Unwanted and Banned pesticides in the Republic of
Uzbekistan" in 2000 with support of UNEP Chemicals
2. State Committee for Nature Protection entered 22 Substances of PTC in a list of restricted or
banned chemicals in the Republic of Uzbekistan
3. Program "Environmental Monitoring of the Republic of Uzbekistan" (2001-2003)
5.5 ALTERNATIVES/MEASURES FOR REDUCTION
5.5.1 Intentionally Produced PTS
There are three main ways to reduce or eliminate emissions of intentionally produced PTS: first, substitutes can
be identified, so that the production or use of PTS can be prohibited. For example, DDT and HCH were major
pesticides in China during the 1970's and early 1980's. In the middle of the 1980's China began to replace
organochlorine pesticides with organophosphate pesticides. Since 1983 DDT and HCH have been banned as
pesticides. In Kyrgyzstan, DDT and HCH have been replaced by pyrethroid pesticides. The annual
consumption of pyrethroids is about 33 t, which represents a replacement rate of about 75%. In addition to
using substitutes for PTS pesticides, integrated pest management practices can be used to reduce the overall
need for pesticide applications. Substitutes have also been identified for industrial chemicals such as PCBs.
Alternatives to the UNEP POPs can be found on the UNEP web site at
http://dbserver.irptc.unep.ch:8887/irptc/owa/ini.init
Second, if substitution cannot completely replace a PTS, its use can be restricted to only essential applications.
For example, DDT in no longer produced or used as an agricultural pesticide, but it is still allowed as an
intermediate in the process of producing dicofol and produced for public health applications for the prevention
of malaria. Chlordane can no longer be used in agriculture, but it is extensively used in structures, such as
96
buildings and dams to protect against termites.
Third, certain PTS components in products may be banned, so as to reduce or eliminate PTS components
entering the environment. For example, compounds and mixtures containing HCH are now banned in China,
but the production and use of lindane, an isomer with less toxicity and lower bioaccumulation potential is
permitted in some special cases.
Replacing PTS is not a simple issue, as there may be monetary and social consequences. For Mongolia or other
countries that do not produce any chemicals and depend entirely on imports, the replacement of PTS is
relatively simple: directly import substitutes as long as the country can afford them. For China and other
countries which have been producing and using PTS on a large scale, the solution may not be so simple. The
prohibition and replacement of PTS may involve the closing down of manufacturing facilities or conversion of
the facilities to make different products. This may also lead to other problems such as unemployment.
The replacement of PTS may have an impact on the country's infrastructure. For example, chlordane is widely
used in many areas of China, especially in south China, where termites are causing extensive damage and affect
many areas of China's national economy. Therefore, the Chinese government stipulates that prevention and
treatment of termites must be carried out in the building, remodelling, reconstructing or expansion of any
buildings in areas where termites are widespread. It is not affordable to frequently demolish or reconstruct
buildings, especially large dams in water conservancy projects, so it is mandatory that the prevention of
termintes in buildings be effective for more than ten years. An effective substitute for chlordane for this
purpose has not been identified.
5.5.2 Unintentionally Produced PTS
Unintented byproduct emissions have been reduced through the implementation of stricter environmental
standards. For example, the emission of PCDD/PCDF has been reduced in recent years in Japan because of the
Law concerning Special Measures against Dioxins passed in 1999. The policy target of the law is that the total
emission of PCDD will be reduced by 90% of that of 1997 by March 2003. The TDI was set up as 4 pg-
TEQ/kg/day and the air, water and soil environmental quality standards were 0.6 pt-TEQ/m3, 1pg-TEQ/I and
1000 pg-TEQ/g respectively (the sediment environmental quality standard is to be decided.) In order to reach
the policy targets, the Ministry of the Environment has set up emission and effluent standards (See Tables 5.4
and 5.5). Relevant governmental departments can tighten these emission and effluent standards when it is
necessary and enforce these control standards through examination and inspection. Furthermore, the
government also takes measures to control the discharge of ash and dust from incinerators (treatment standards
for ash and dust from waste incinerators is 3 ng-TEQ/g) and standards for maintenance and management of the
final disposal site of waste. Additional measures in other countries are required to reduce production of
unintentional byproducts. These measures will result in costs to industry and as in the case of intentionally
produced PTS, social and infrastructure costs.
5.6 TECHNOLOGY
TRANSFER
Great difficulties for technology transfer exist in this Region. Major problems are as follows:
(1) Most countries in the Region are developing countries or countries with economies in transition and do not
possess advanced techniques except for Japan and Republic of Korea.
(2) Most countries lack the funds for technology transfer.
(3) No proper mechanism for technology transfer has been established either at the Regional level or at the
global level.
(4) Developing countries have limited choices for available techniques. For example, in Japan most refuse,
including everyday refuse, is disposed of by incineration. In China, disposal of refuse by incineration is less
than 3.5%, although in the future, this may be the main method for disposing everyday refuse. Currently China
cannot yet afford to adopt techniques with high standards as those achieved by Japan. On the one hand, Japan's
environmental standard is too high for China, a developing country, and on the other hand, some techniques
may not be appropriate for developing countries. For example, China has introduced an incinerator from a
developed country, but as the heat value of refuse is very low, 30 kilograms of oil per day is needed to maintain
the normal operation of the furnace.
(5) Advanced administration and the training of specialised personnel should be mandatory to complement the
97
importation of techniques. For example, China has imported some advanced techniques and equipment from
industrialised countries, however, because of the lack of advanced management and trained manpower, the
efficiency is much lower than that in the original supplier countries.
5.7 IDENTIFICATION OF NEEDS
5.7.1 Overview of Status
As most of the countries in this Region are developing countries with relatively backward economies or their
economies are undergoing transition, the capacity of the management of PTS is fairly weak and there is much
need in this respect.
Japan and the Republic Korea are members of OECD. Japan has established a comparatively comprehensive,
scientific, and strict legal system for the management of PTS and possesses large amount of data and relevant
information. Japan has also been developing advanced techniques for the disposal of waste. Therefore, Japan
has been far ahead than other countries in the Region on PTS management.
The Republic of Korea has established a system for risk/hazard evaluation, accident prevention and response,
risk reduction, and chemical information management, under which there is a group of specialists engaged in
formulating national action plans. It is now carrying out a 10-year national research program, whose work
includes the compilation of a PCB and PCDD/PCDF inventory. A joint project with Japan on EDCs (including
PCBs and PCDD/PCDF) is also in progress.
The environmental administration of chemicals has also begun in China, especially with the development of
environmental management controls on the import and export of toxic chemicals since 1994. This is a direct
result of the management of chemicals being brought into routine government proceedures. A number of
scientific research institutes and institutions of higher learning have carried out scientific research and
investigation on PTS. The Chinese government is now carrying out an inventory of POP pesticides and the
PDF-B of national implementation plan (NIP) required by the Stockholm Convention.
Work has recently been initiated on the environmental management of chemicals in the Hong Kong SAR. The
on-going study of toxic substances pollution in Hong Kong SAR, commissioned by the Environmental
Protection Department, aims to identify the trade, usage, production and disposal of priority toxic substances in
Hong Kong SAR and assess the potential impact that any such substances may pose to local aquatic life and
human health.
The Mongolian government has also strengthened its management of PTS and promulgated several laws and
regulations. In 1998, Mongolia established a coordination organisation: the National Council for Chemical
Safety (NCCS) which greatly boosted the efficiency of the enforcement of legislation and regulations.
Mongolia does not produce any chemicals and totally depends on import. This makes it easy to control and ban
intentionally produced PTS.
In the Russian Federation, the environmental administration of chemicals and relevant research started some
time ago. The Russian Federation has set up many environmental standards covering PTS. Investigations into
the concentration of PTS in the environment and the human population have been carried out periodically. A
PCB inventory under the AMAP program has also been compiled. During 1999-2000, the inventory of
PCDD/PCDF emitting sources was compiled with financial support from the US EPA.
The management of PTS has also begun in central Asian countries such as Kazakhstan. The production and use
of most pesticides containing PTS are now banned under relevant laws of these countries. With the support of
the UNEP, a preliminary POPs inventory of chemicals in Kazakhstan was conducted in 2001.
The Democratic People's Republic of Korea has also begun their own management of PTS. Production of DDT
has been banned and production and use of HCB and PCP are now restricted.
5.7.2 Existing
Difficulties
Major difficulties involved in administering the management of chemicals for most countries in this Region
include:
5.7.2.1 Lack of Funds
The management of PTS, including the elimination/reduction of PTS emissions requires large financial
98
resources. Large amounts of funds are also needed for the destruction of PCBs and the analysis and monitoring
of PCDD/PCDF. Unfortunately, most countries in this Region lack enough funds to carry out these tasks
although they realise the importance of such work.
5.7.2.2 Lack of Information
Most countries in this Region have not obtained necessary information for the management of PTS, including
methods which can provide scientific comparable monitoring data, information about PTS sources, existing
pollution caused by PTS, harm thus caused, and their substitutes. Developing countries and countries
undergoing economic transfer seriously lack such information. In some countries, the situation has become
more severe, as their government controlled the production and use of certain products under planned national
economies, but now they can no longer control many products containing PTS under market economies. In
addition, there are numerous privately owned small industries scattered throughout the country, which makes it
harder for the government to obtain certain information.
5.7.2.3 Lack of Advanced or Best Available Technology
Taking the burning of refuse for example, - because the calorific value of refuse is much lower in China than
that in developed countries, the technique of refuse burning is not suitable for China. There are large quantities
of accumulated solid wastes cast away during mining, which are problematic to treat. Increasing the purity of
certain products so as to reduce their content of PTS poses another problem for many countries. Without proper
or best available technology it is impossible to eliminate or reduce the emission of PTS.
5.7.2.4 Insufficient Knowledge and Training of Special Personnel
The knowledge and techniques of those specialists in many countries in the Region can no longer meet the
requirements of up-to-date administration or research. Competent specialists and experts are in great demand.
5.7.2.5 Low Public Awareness
Although almost all governments in the Region are aware of the harm that PTS may possibly cause and have
been active in participating in the process of developing the Stockholm Convention, the general population,
consumers and buyers in most counties lack awareness of the possible harm. They also lack information about
the sources of hazardous chemicals and consequently do not know their long-term effects.
5.7.2.6 Difficulties in Co-ordination Within Government
As the management of PTS involves the whole process from production to disposal, including management of
the products themselves, impurities they contain, sources, potential harms, many departments become involved.
Therefore, the coordination and cooperation between these departments is of great importance. But such
coordination and cooperation are still bureaucratic hurdles in many countries.
5.7.3 Capacity
Building
Capacity to be built in the Region includes the following:
(1) A framework for administration, management systems and policy should be developed for the
implementation of the Stockholm Convention. Institutional strengthening should be considered at the Regional
level. A Regional PTS group should be set up to provide a co-ordination and co-operation mechanism with
regularly held meetings.
(2) Capacity strengthening on PTS monitoring is a priority in the Region. Standardisation of monitoring
methodologies and detection limits may be the initial steps towards capacity strengthening of monitoring of
PTS.
(3) Capacity strengthening on technical assistance and promoting the transfer of technology is important
especially for substitution, reduction, elimination, and safe disposal of PTS.
(4) The best available technique (BAT) and the best environmental practice (BEP) for developed countries and
for developing countries or for countries with the economy in transition should be used and adapted to suit local
situations.
99
5.7.4 Follow-up
Activities
5.7.4.1 Tasks In the Near Future:
· Ratification of Stockholm Convention. To date, only Japan and DPRK have accession to the Stockholm
Convention in the Region;
· The preparation or formulation of National Implementation Plans (NIP) for POPs;
· Co-ordination of monitoring methods and initiating monitoring projects for priority PTS in the Region;
· Compilation of source inventories for PTS, which shall include the present status related to production,
stockpiles, and emissions;
· Demonstration of BAT and BEP and pilot schemes of substitute technologies;
· Public awareness promotion including involvement of NGOs and training this should include the
training of government officials, enterprise executives, and technical personnel, and raising public
awareness;
5.7.4.2 Long-Term
Tasks
· Development of action plans;
· R&D of alternatives to DDT, chlordane, HCH;
· Safe disposal of PCB, obsolete pesticides;
· Measures to reduce unintentional PTS;
· Suitable models to trace movement of PTS
· Risk assessments and investigations of PTS on environmental and human health.
100
6 CONCLUSIONS
6.1 IDENTIFICATION OF BARRIERS
The main barriers to reduction of PTS in Region VII involve difficulties in technology transfer. Most countries
in the Region are developing countries or countries with their economies in transition, therefore due to
relatively weak economies, these countries lack funds for technology transfer. A proper mechanism has not
been established for technology transfer within this Region. For some countries, available human resources in
the area of PTS management are weak. The knowledge base and techniques of specialists in parts of the
Region cannot meet the requirements of up-to-date administration or research. Another barrier is the fact that
there are no established disposal mechanisms for the safe elimination of PTS from the environment, therefore
certain PTS such as obsolete pesticides may continue to remain buried or stockpiled. In some cases, there have
been no adequate alternatives available. For example, although pyrethroids have been presented as an
alternative to DDT, they are far more expensive and not as effective when compared to DDT.
6.2 IDENTIFICATION OF PRIORITIES
6.2.1 Sources
For all of the countries of the Region, there is generally more information available on the levels of PTS in the
environment than on information pertaining to sources of PTS. In many cases, this is due to the fact that many
of the developing countries or countries with their economies in transition have not established source
inventories for PTS. In some cases, there is also insufficient monitoring of PTS, lack of programs on emission
control and insufficient quality control.
In Region VII, the groups of chemicals that are of high priority are PCDD/PCDF, PCBs, PAHs, DDT and HCH
as there is either:
· still major production of the chemical for local and export use,
· evidence of the chemical as a contaminant in large scale production of other chemicals,
· known emissions of the chemical from large scale incinerators or chlorine bleaching of pulp or other
related combustion facilities,
· evidence of leakage from major stockpiles of the chemical,
· large-scale use of the chemicals throughout the Region, and/or
· spatial and/or temporal trends increasing Regionally from levels above threshold.
For these chemicals except for DDT and HCH, information on sources is also noticeably insufficient or
unreliable. The substantial amount of obsolete PTS, such as DDT stored in some countries is a major concern
for the Region.
6.2.2 Pathways
Due to the diverse meteorological and geographical natures of Region VII, there are special concerns for the
development of effective transport models e.g. a relatively large ocean area. In addition, monitoring data do not
exist in some countries to enable the assessment of long-range transport of PTS compounds. Some countries in
the Region do have experience of transport assessment by modelling, including hemispheric models from
MSCE-POP/EMEP, multimedia modelling by the Republic of Korea (POPsME and EDCSeoul) and Grid-
Catchments integrated MMM by Japan. However, a complete picture concerning the transboundary transport of
PTS across different countries within the Region is very much needed.
Substantial effort will be therefore necessary to fill the data and technical gaps and to assess the long-range
transport of PTS chemicals in the Region:
· Source inventory data: This is especially important, not only from the view point of source identification,
but also for extensive transport assessment.
· Monitoring data: This is especially important, not only from the view point of monitoring itself, but also
101
for developing reliable transport assessment.
· Modelling data: There is a need for reliable model tools to better predict the fate and effects of PTS in
the Region. Co-operation with global experts is highly recommended.
· Source pattern and fingerprint: This point is not directly meant as a data gap, but it should be considered
to be an important methodology to fulfill the gaps concerning PTS transport.
6.2.3 Environmental Levels, Toxicological and Ecotoxicological Effects
Some countries have been collecting PTS data for longer and more intensively than others, but most countries
are in the process of developing their programs on PTS monitoring and inventories. Therefore, comprehensive
spatial and temporal data on PTS monitoring are only available in a small number of countries in the Region,
e.g. Japan, while there is a general lack of complete information related to the environmental levels of PTS in
most countries.
Based on the reported data, DDTs, HCH, PCDD/PCDF, PCBs and PAHs are high priority chemicals among
other PTS in this Region. Many monitoring data for these chemicals were reported for a variety of
environmental media and biota, and frequently the concentrations of one or some of those chemicals were
found to be relatively high compared with other chemicals.
Bioaccumulation and biomagnification are evident according to the measurement of PTS in living organisms of
different trophic levels along food chains. A limited amount of studies in the Region revealed that levels of PTS
in human breast milk samples tend to reflect their oral intake, e.g. through seafood consumption. It was also
indicated that the use of biomarkers could be an effective tool to provide an early warning system of the
potential threats imposed by different PTS. More monitoring data from the countries in this Region should be
collected for the full understanding and accurate evaluation of the environmental levels of PTS in Region VII.
International cooperation in this matter is urgently required.
6.3 RECOMMENDATION FOR FUTURE ACTIVITIES
A Regional organisation is recommended to be established for setting up a monitoring network. The
organisation will ensure that monitoring methods among the countries within Region VII are coordinated and
standardised. Above all, an integrated monitoring/modelling approach based on:
· Systematic monitoring,
· Measurement campaigns on national and international levels and
· Model assessments of contamination within the Region, should be established.
It is also essential for representatives of different countries to meet on a regular basis to update information and
improve Regional communication. Collection of PTS information should be continued. There should be joint
effort among different countries to closely monitor human health effects using effective and less invasive
analysis such as PTS levels in human breast milk. This will provide information on the possible adverse impact
of contaminants on future generations. Studies on the effects of different PTS on sensitive animal species are
also essential. Development of various biomarkers could provide us with effective early warning systems.
In addition to collaboration amongst government, industry and NGOs, support from the public is important in
contributing to the effective and efficient implementation of proposed actions towards the elimination of PTS.
Hence, raising the awareness of the general public is an important issue that needs to be addressed. It is
recommended that financial assistance should be actively sought from international funding agencies such as
the World Bank and GEF for supporting technology transfer for studies into PTS and related activities.
102
REFERENCES
AFCD (Agriculture, Fisheries, and Conservation Department) Hong Kong SAR Government (2001) Trade information on
pesticides in Hong Kong, 1992-2001
Alcock, R.E., Jones, K.C. (1996) Dioxins in the environment: a review of trend data. Environmental Science and
technology, 30:3133-3143
AMAP (Arctic Monitoring and Assessment Program) (1998)
Anon (2002) The Summary of Environmental Affairs in Russia (19 January 8 February 2002)
Araki, S., Kurono, K., Kanai, M., Sakurai, T., Doi, T., Tanaka, A., Ishiwatari, R., Suzuki, N., Sakai, S., Nakasugi, O.,
Morita, M (2000) Time trends of dioxins in aquatic sediment cores in Japan. Organohalogen Comp., 46, 330-333
Bailey, R.E. (2001) Global hexachlorobenzene emissions. Chemosphere, 43, 167-182
Bao Z.C., Wang, K.O., Kang, J.X., Zhao L.W. (1995) Analysis of polychlorinated dibenzo-p-dioxins and dibenzofurans in
pentachlorophenol and sodium pentachloropenate. Environmental Chemistry (China), 14: 317-321
Bao, Z.C., Zhang, Z. (1989) Analysis of PCDDs and PCDFs in solid wastes from production of trichlorobenzenes. Environ.
Chem. (Chinese), 8, 6-15
Benazon, N. (1999) Hexachlorobenzene emissions/releases inventory for Ontario 1988, 1998 and 2000, Draft Report for
Environment Canada
Beyer, A., Matthies, M. (2001) Criteria for atmospheric long-range transport potential and persistence of pesticides and
industrial chemicals. Umweltforschungsplan des Bundesministerium fur Umwelt, Naturschutz und Reaktorsicherheit.
Stoffbewertung, Gentechnik, Forderkennzeichen (UFOPLAN) 299 65 402
Bok, H. S. et al. (2002) Country Report from Democratic People's Republic of Korea, at The First Northeast Asian Sub-
Regional Workshop Towards the Effective Implementation of the Chemicals and Hazardous Wastes Conventions, 15-
17 May 2002, Beijing, PR China
Burns, J.E., Miller, F.M., Gomes, E.D., Albert, R.A. (1974) Hexachlorobenzene exposure from contaminated DCPA in
vegetable spraymen. Archives of Environmental Health, 29, 192-194
Callahan, M.A., Hammerstrom, K.A., Schweer, G. (1983) Present PCB uses and their potential for release to the
environment, Proceedings of the PCB-Seminar, The Hague, The Netherlands, 28-30/9/83, Barros, M.C., Konemann, H.
and Visser, R. (ed.), Ministry of Housing, Physical Planning and Environment, 152-172
CED (Civil Engineering Department Hong Kong SAR) (2002) Decommissioning of Cheoy Lee Shipyard at Penny's Bay
Environmental Impact Assessment Report
Chang, Y.S., Kong, S.B., Ikonomou, M.G. (1999) PCBs contributions to the total TEQ related from Korean municipal and
industrial waste incinerators. Chemosphere, 39(15): 2629-2640
Chen, G.S., Xu, Y., Zhang, Y.Y., Schramm, K.W., Klimm, C., Kettrup, A. (1997) Polycyclic aromatic hydrocarbons in
Ya-Er Lake (Hubei, China): sources and distribution. Fresenius J. Anal. Chem., 359, 280-284
Chen J.S., Gao X.M. (1999) The contents of polychlorinated biphenyl in river sediments in eastern China. Acta Scientiae
Circumstaniae, 19(6): 614-618
Cheng, Y., Sheng, G.Y., Shao, B., Lin, Z., Min, Y.S., and Fu, J.M. (2000) Characteristics and sources of organochlorine
pesticides from cooking smoke and aerosols. China Environmental Science, 20(1): 18-22 (in Chinese)
Chiba, I., Sakakibara, A., Iwata, H., Ishizuka, M., Tanabe, S., Akahori, F., Kazusaka, Fujita, A. (2002) Hepatic
Microsomal cytochrome P450 and chlorinated hydrocarbons in Largha and Ribbon seals from Hokkaido, Japan:
differential response of seal species to AH receptor agonist exposure. Env.Toxicol. and Chem., 21(4): 794-806
Choi, J.W., Fujimaki, S., Kitamura, K., Hashimoto, S., Ito, H., Suzuki, N., Sakai, S., Morita, M. (2002a) Polybrominated
dibenzo-p-dioxins (PBDDs), dibenzofurans (PBDFs), and diphenyl ethers (PBDEs) in Japanese human adipose tissue.
103
Organohalogen Comp., 58, 169-171
Choi, J.W., Fujimaki, S., Kitamura, K., Hashimoto, S., Ito, H., Sakurai, T., Suzuki, N., Nagasaka, H., Sakai, S., Morita, M.
(2002b) Time trends of polybrominated dibenzo-p-dioxins, dibenzofurans and diphenyl ethers in core sediment from
Tokyo Bay. 11th Symposium on Environmental Chemistry, Programs and Abstracts, 14-15
Choi, J.W., Miyabara, Y., Hashimoto, S., Morita, M. (2002d) Comparison of PCDD/F and coplanar PCB concentrations in
Japanese human adipose tissue collected in 1970-1971, 1994-1996 and 2000. Chemosphere, 47, 591-597
Choi, K.H (2001) Previous & Current Work on POPs/PTS in Korea, Presented at the First Regional Team Meeting of
UNEP/GEF Regionally Based Assessment of PTS, Central and North East Asia Region (Region VII), 29-31 May 2001,
Shenzhen, PR China
Choi, K.H., Lee, E.K., Kang, D.I., Park, S.J., Jeon, S.H., Chung, Y.H. and Na, J.G. (2002c) Temporal Trend of PCDD/DFs
in Environmental Media in Republic of Korea, National Endocrine Disrupters Soil Monitoring in Korea, National
Ambient Air Monitoring Measurement for Endocrine Disrupters, Environmental Levels of Endocrine Disrupters in
Environmental Media in Korea. J. Environmental Science, 4
CIA, Central Intelligence Agency (2001) The World Factbook.
http://www.cia.gov/cia/publications/factbook/index.html
Connell, D.W., Miller, G.J. (1984) Chemistry and Ecotoxicology of Pollution, John Wiley and Sons, Inc.
Dagva, S., Naranuya, S., Lhasuren, B. (2002) Country Presentation of Mongolia, at The First Northeast Asian Sub-
Regional Workshop Towards the Effective Implementation of the Chemicals and Hazardous Wastes Conventions, 15-
17 May 2002, Beijing, PR China
Deputy Governor of Magadan Oblast (1 October 2001) in Country Report from Russian Federation, at the 1st Technical
Workshop of UNEP/GEF Regionally Based Assessment of PTS, Central and North East Asia Region (Region VII), 18-
20 March 2002, Tokyo, Japan
Eduljee, G.H., Dyke, P. (1996) An updated inventory of potential PCDD and PCDF emission sources in the UK. Sci. Total
Environ., 177(1/3): 303-321
EPD (Environmental Protection Department, Government of the Hong Kong Special Administrative Region) (2001)
Marine Water Quality in Hong Kong in 2000
Extoxnet (1996) Extension Toxicology Network, Pesticide Information Profiles
Fang, Z.Q., Cheung, R.Y.H., and Wong M.H. (2001) Concentrations and distribution of organochlorinated pesticides and
PCBs in green-lipped mussels, Perna viridis collected from the Pearl River Estuarine Zone. Acta Scientiae
Circumstantiae, 21(1): 113-116 (in Chinese)
Fen, X.B, Hong Y.T. Coal Mine Environment Protection, 10(3), 10-13, 24
Fu, J., Mai, B., Sheng, G., Zhang, G., Wang, X., Peng, P., Xiao, X., Ran, Y., Cheng, F., Peng, X., Wang, Z., Tang, U.W.
(2002) Persistent Organic Pollutants in Environment of the Pearl River Delta, China: An Overview Technical Report
presented at The First Technical Workshop of Regionally Based Assessment of PTS, 18-20 March 2002, Tokyo, Japan
Fu, J., Sheng G., Chen Y., Wang X., Min Y., Peng P., Lee, S., Chang L., Wang, Z. (1997) Preliminary study of organic
pollutants in air of Guangzhou, Hong Kong and Macao. In: Eganhouse, R. P. (Ed.), Molecular Markers in
Environmental Geochemistry, ACS Symposium Series 671: 164-176
Fu, S., Chu, S., Xu. X. (2001) Organochlorine Pesticide Residue in Soils from Tibet, China. Bull. Environ. Contam.
Toxicol, 66: 171-177
GAEMS (1986) A survey on the remnants of BHCs in soils and rice of Guangzhou, Guangzhou Agricultural
Environmental Monitoring Station. Guangzhou Environmental Science, 1986(1):17-23 (in Chinese)
Glazovsky, V., Ministry of Nature Protection of Turkmenistan (2002) The Problems of Persistent Toxic Substances in
Turkmenistan -Technical Report, at the 1st Technical Workshop of UNEP/GEF Regionally Based Assessment of PTS,
Central and North East Asia Region (Region VII), 18-20 March 2002, Tokyo, Japan
104
Harrad, S.J., Sewart, A.P., Alcock, R., Boumphrey, R., Burnett V., Duarte-Davidson, R., Halsall, C., Waterhouse, K., Wild,
S.R., Jones, K.C. (1994) Polychlorinated biphenyls (PCBs) in the British environment: sinks, sources and temporal
trends. Environmental Pollution, 85(2): 131-146
Hashimoto, S., Shibata, Y., Tanaka, H., Yatsu, A., Morita, M. (1999) PCDDs and PCDFs contamination in the Northern
Pacific area reflected on squid liver tissues. Organohalogen Compounds, 41: 413-416
HELCOM, Helsinki Commission (October 2001) The Pesticides Selected for Immediate Priority Action A compilation
and evaluation of the information given by the Contracting Parties with the focus on use and legislation. Helsinki
Commission, Baltic Marine Environment Protection Commission
Hiraoka, M. (2001) Background and future trends of PCB problems of Japan. Environmental Research Quarterly, 122: 64-
73
Hong, H.K., Takahashi, S., Min, B.Y., Tanabe, S. (2002) Butyltin residues in blue mussels (Mytilus edulis) and arkshells
(Scapharca broughtonii) collected from Korea coastal waters. Environmental Pollution, 117, 475-486
Hong, H., Xu, L., Zhang, L., Chen, J.C., Wong, Y S., Wan, T.S.M. (1995) Environmental fate and chemistry of organic
pollutants in the sediment of Xiamen and Victoria Harbours. Marine Pollution Bulletin, 31: 229-236
Hua, X. M., Shan, Z. J. (1996) The production and application of pesticides and factor analysis of their pollution in
environment in China. Advances in Environmental Science, 4(2): 33-45 (in Chinese)
Ip, H.M.H. (1990) Chlorinated pesticides in foodstuffs in Hong Kong. Archives of Environmental Contamination and
Toxicology, 19: 291-296
Ip, H.M.H., Phillips, D.J.H. (1989). Organochlorine chemicals in human breast milk in Hong Kong. Archives of
Environmental Contamination and Toxicology, 18:490-494
IPCS (1995) An Assessment Report on: DDT, Aldrin, Dieldrin, Endrin, Chlordane, Heptachlor, Hexachlorobenzene,
Mirex, Toxaphene, Polychlorinated Biphenyls, Dioxins and Furans
Ishankulov, M. (2002a) Country Report from Kazakhstan, presented at the 1st Technical Workshop of UNEP/GEF
Regionally Based Assessment of PTS, Central and North East Asia Region (Region VII), 18-20 March 2002, Tokyo,
Japan
Ishankulov, M. (2002b) Questionnaire of Assessment of the National Capacity and Needs to Manage PTS (developed for
UNEP/GEF Regionally Based Assessment of PTS by Central and North East Asia Region, Region VII)
Iwata, H., Tanabe, S., Sakai, N., Nishimura, A., Tatsukawa, R. (1994) Geographical distribution of persistent
organochlorines in air, water and sediments from Asia and Oceania, and their implications for global redistribution
from lower latitudes. Environmental Pollution, 85, 15-33
Iwata, H., Tanabe, S., Ueda, K., Tatsukawa, R. (1995) Persistent organochlorine residues in air, water, sediments and soils
from the Lake Baikal Region, Russia. Environ. Sci. Technol., 29, 792-801
Jacoff, F.S., Scarberry, R., Rosa, D. (1986) Source assessment of hexachlorobenzene from the organic chemical
manufacturing industry. In: Morris, C.R., Cabral, J.R.P. ed. Hexachlorobenzene: Proceedings of an International
Symposium. Lyon, IARC scientific publications, 77: 31-37
Jensen, J., Adare, K., Shearer, R., eds. (1997) Canadian Arctic Contaminants Assessment Report. Indian and Northern
Affairs Canada, Ottawa
Jiang, G.B., Zhou, Q.F., Liu, J.Y., Wu, D.J. (2001) Occurrence of butyltin compounds in the waters of selected lakes,
rivers and coastal environments from China. Environmental Pollution, 115: 81-87
Juraev, A. (2002) The solving (decision) ways of PTS problem in the Republic of Tajikistan Country Report from
Tajikistan presented at the 1st Technical Workshop of UNEP/GEF Regionally Based Assessment of PTS, Central and
North East Asia Region (Region VII), 18-20 March 2002, Tokyo, Japan
Kaba, T., Komatsu, T. and Yamada A. (1993) PCBs discharged from municipal solid waste incinerators. Annual Report of
Kyoto Prefectural Institute of Public Health, 38: 96-99
105
Kasymov, O.T. (2000) Actual aspects of the ecological monitoring. Bishkek
Kim, S.R., Hong, S.B., and Ri, S.H. (2002) Country Report from Democratic People's Republic of Korea, at The First
Northeast Asian Sub-Regional Workshop Towards the Effective Implementation of the Chemicals and Hazardous
Wastes Conventions, 15-17 May 2002, Beijing, PR China
Konishi, Y., Kuwabara, K., Hori, S. (2001) Continuous surveillance of organochlorine compounds in human breast milk
from 1972 to 1998 in Osaka, Japan. Arch. Environ. Contam. Toxicol., 40, 571-578
KORDI (Korea Ocean Research and Development Institute) (2001) Monitoring of POPs in the coastal environment
Kucklick, J.R., McConnell, L.L., Bidleman, T.F., Ivanov, G.P., Walla, M.D. (1993) Toxaphene contamination in Lake
Baikal's water and food web. Chemophere, 27, 2017-2026
Kurata, T., Ono, Y. (1999) Chemicals in waste construction woods. Proceedings of The Japan Society of Waste
Management Experts, 10(1): 414-416
Lam, P.K.S. (2002) Studies of Persistent Toxic Substances in Coastal Waters of Hong Kong, presented at the 2nd
Technical Workshop of UNEP/GEF Regionally Based Assessment of PTS, Central and North East Asia Region
(Region VII), 14-16 May 2002, Hong Kong SAR, PR China
Lee, D.S. (2002) Personal communication
Lee, D.S., Shin, Y.S., Kim Y.K., Shin, J.H., Yim, U.H., Shim, W.J., Oh, J.R. Choi, K.H., Jeon, S.H., Na, J. H. (2002) Use
of relative concentration for the evaluation of a multimedia mass balance model: PAHs in Seoul, Korea, presented at
the 2nd Technical Workshop of UNEP/GEF Regionally Based Assessment of PTS, Central and North East Asia
Region (Region VII), 14-16 May 2002, Hong Kong SAR, PR China
Lee, D.S., Kim, S.K., Lee, Y.A., Kim, D.W. (2001) Development of a Multimedia Mass Balance Model for the
Assessment of Environmental Fate and Exposure to Persistent Organic Pollutants (POPs). Ministry of Environment,
Korea, (in review)
Lee, H.M, Yoon, E.K, Choi, D.M, Han, S.Y, Kim, S.H, W, K.P.,Yang, K.H, Kil, K.S, Lee, K.C, Choi, K.H, Jang, S.G, Na,
J.G (2001) Background exposure levels of PCDDs/Fs in Korea. Dioxin 2001. 52: 239-242
Lemieux, P.M., Lee, C.W., Kilgroe, J.D., Ryan, J.V. (1999) Emissions of Polychlorinated Biphenyls as Products of
Incomplete Combustion from Incinerators. PB-99-163065: 1-16.
Li, C. (2002) The Review of the Status of PTS in China, presented at the 2nd Technical Workshop of UNEP/GEF
Regionally Based Assessment of PTS, Central and North East Asia Region (Region VII), 14-16 May 2002, Hong Kong
SAR, PR China
Li, C.L., Fu, J.M., Mai, B.X., Sheng, G.Y., Wang, X.M. (2001) Atmospheric polychlorobiphenyls at Three Cities in the
Pearl River Delta Region, China. Abstract on the 3rd Asia-Pacific Symposium on Environmental Geochemistry,
Guangzhou, China, 96
Liu, J.K. (1985) Recovery of the insecticide wastewater polluted Ya-Er Lake. Proceedings of European Water Pollution
Control Association (EWPCA), International Congress, Rome, 15-18 April, 1985
Lyu, E.K., Park, J.G. (2002) Country Presentation of Republic of Korea, at The First Northeast Asian Sub-Regional
Workshop Towards the Effective Implementation of the Chemicals and Hazardous Wastes Conventions, 15-17 May
2002, Beijing, PR China
Ma, Stephanie. (2002). A Study of Toxic Substances Pollution in Hong Kong, presented at the 1st Technical Workshop of
UNEP/GEF Regionally Based Assessment of PTS, Central and North East Asia Region (Region VII), 18-20 March
2002, Tokyo, Japan
Mackay, D. (2001) Multimedia Environmental Models The Fugacity Approach, 2nd ed. CRC Press LLC.
Mai, B.X., Fu, J.M., Sheng, G.Y., Kang, Y.H., Lin, Z., Zhang, G., Min, Y.S., Zeng, E.Y. (2002) Chlorinated and
polycyclic aromatic hydrocarbons in riverine and estuarine sediments from Pearl River Delta, China. Environmental
Pollution, 117(3): 457-474
106
Malanichev, A., Shatalov, V., Vulykh, N., Strukov B. (2002) Modelling of POP hemispheric transport. EMEP/MSC-E
Technical Report 8/2002 (under preparation)
Malloy, T.A, Goldfarb, T.D., Surico, M.T.J. (1993) PCDDs, PCDFs, PCBs, Chlorophenols (CPs) and Chlorobenzenes
(CBzs) in samples from various types of composting facilities in the United States. Chemosphere, 27(1/3): 325-334
Mamontov, A.A. et al. (1998) Organohalogen Comp. 39; 323
Masunaga, S. (2000) The origin of and change in, dioxin pollutant in Japan-the contribution of dioxins in herbicides. J.
Japan Society of Waste Management Experts, 11(3), 173-181
Masunaga, S., Yao, Y., Ogura, I., Nakai, S., Kanai, Y., Yamamuro, M., Nakanishi, J. (2001) Identifying sources and mass
balance of dioxin pollution in Lake Shinji basin, Japan. Environ. Sci. Technol., 35, 1967
McConnell, L.L., Kucklick, J.R., Bidleman, T.F., Walla, M.D. (1993) Long-range atmospheric transport of toxaphene to
Lake Baikal. Chemosphere 27, 2027-2036
Ministry of the Environment Japan, http://www.env.go.jp
Ministry of Environment of Republic of Korea
http://www.me.go.kr
Ministry for Nature Protection Republic of Tajikistan (2000) State of the Environment Report-The Republic of Tajikistan,
http://www.grida.no/enrin/htmls/tadjik/soe2/eng/htm/chemics/press.htm
Ministry of the Environment, Japan (2001) Chemicals in the Environment
Ministry of the Environment, Japan (2000) Chemicals in the Environment
Ministry of the Environment, Japan (Yearly) Endocrine Disruptive Chemicals Survey
Ministry of the Environment, Japan (2000) National Dioxin Survey
Ministry of the Environment, Japan (2000) Dioxins Surveillance Data
Ministry of the Environment, Environmental Health Department, Government of Japan (2002) The Environmental
Monitoring Report of the Persistent Organic Pollutants (POPs) in Japan
Ministry of Health and Welfare, Japan (2000) A brief report of the result of Dioxins Survey in Human Breast Milk
(Japanese) http://www.mhlw.go.jp/topics/0012/tp1228-1.html
Ministry of Health and Welfare, Japan (1999) Dioxin food contamination survey in FY 1998
Monirith, I., Nakata, H., Watanabe, M., Takahashi, S., Tanabe, S., Tana, T.S. (2000) Organochlorine contamination in fish
and mussels from Cambodia and other Asian countries. Water Science & Technology, 42, 241-252
Morton, B. (1990) Pollution and the Sub-tropical Inshore Hydrographic Environment of Hong Kong. Proceedings of the
Second International Marine Biological Workshop: The Marine Flora and Fauna of Hong Kong and Southern China,
Hong Kong University Press
Mumma, C.F., Lawless, E.W. (1975) Survey of Industrial Processing Data. Task I - Hexachlorobenzene and
Hexachlorobutadiene Pollution for Chlorocarbon Processes (EPA 56013-75-004), Washington D.C., US EPA
Münch, J., Axenfeld, F. (1999) Datenbasis historisher Emissionen ausgewählter persistenter organischer Stoffe in Europa
(1970-95) PCDD/F, B(a), PCB, -HCH, HCB, DDT/DDT (Within the Framework of the EU Environment and
Climate Project ENV4-CT96-0214 on Environmental Cycling of Selected Persistent Organic Pollutants (POPs) in the
Baltic Region (POPCYCLING- BALTIC PROJECT). Funded by Umweltbundesamtes, Berlin. F.u.E. Vorhaben 104 02
843. European Commission (DG XII). Environment and Climate project ENV4-CT96-0214. Research project no. 297
25 527: Emission inventory of the German Baltic Sea catchment area.
Namkhai, A. (2002) Country Report from Mongolia, presented at the 1st Technical Workshop of UNEP/GEF Regionally
Based Assessment of PTS, Central and North East Asia Region (Region VII), 18-20 March 2002, Tokyo, Japan
107
NDRC (Natural Resources Defense Council) (2001) Healthy Milk, Healthy Baby- Chemical Pollution and Mother's Milk,
http://www.nrdc.org/breastmilk/chem5.asp
NIER (National Institute of Environmental Research) (2002) Study on Environmental Fate of Endocrine Disrupting
Chemicals (I)
NIER, Annual Report of EDCs Research Project (2000)
NIER, Korean Chemical Information Center, http://kcic.nier.go.kr/edindex.html
Nishizawa, J. (2000) Perspectives on 2000 energy and chemical industry Flame retardants. JETI, 48(1): 119-122
Nishizawa, J. (1999) Recent trends of flame retardants and future perspectives. JETI, 47(3): 116-119
Nishizawa, J. (1997) Recent developments of flame retardant technologies. JETI, 45(3): 104-107
Ohta, S., Ishizuka, D., Nihimura, H., Nakano, T., Aozasa, O., Shimidzu, Y., Ochiai, F., Kida, T., Nishi, M., Miyata, H.
(2002) Elucidation of environmental pollution by tetrabromobisphenol A as brominated flame retardant in the long-
term stock-fish samples (Japanese sea bass and grey mullet: 1986-1999), 11th Symposium on Environmental Chemistry,
Programs and Abstracts, 184-185
Okuda, K., Nakada, N., Isobe, T., Nishimura, H., Sanada, Y., Sato, T., Takada, H. (2000) Endocrine disruptors in a
sediment core collected from Tokyo Bay The historical trends during the past 50 years. Bull. Coastal Oceanogr., 37,
97-106
ORTEP (Organotin Environmental Programme) (2001) http://www.ortepa.org/pages/r2.htm
OSPAR (1999) OSPAR convention for the protection of the marine environment of the North-East Atlantic, Working
group on diffuse sources, Berne, 18-22 October 1999
Pacyna, J., Brorstroem-Lunden, E., Runge, E., Paasivirta, J., Muench, J., Fudala, J., Calamari, D., Broman D. (1999).
Environmental cycling of selected persistent organic pollutants (POPs) in the Baltic Region, (POPCYCLING-Baltic),
Technical Report. Appendix 1. to executive final summary report, 149, Contract No. ENV4-CT96-0214. CD-Rom
Page, D.S., Ozbal C.C., Lanphear, M.E. (1996) Concentration of butyltin species in sediments associated with shipyard
activity. Environmental Pollution, 91: 237-243
Pak, V.A., Shakirov, K. (2002) The review of a problem and a plan of action on destruction of the forbidden and
unsuitable pesticides in Kyrgyzstan, as potential sources Persistent Organic Pollutants (POPs). The State Department
on Chemicalization and Plant Protection of the Ministry Rural and a Water Management and a Process Industry of
Kyrgyz Republic. UNEP, the Subroutine on chemical substances
PAN UK (Pesticide Action Network UK) (2000) Chemical time bomb in the CIS. Pesticides News No. 45, September
2000, http://www.pan-uk.org/pestnews/pn45/pn45p8.htm
PIC, UNEP, FAO (1996) Report on Study on International Trade in Widely Prohibited Chemicals. United Nations
Environment Programme (UNEP) and Food and Agricultural Organization of the United Nations (FAO)
(UNEP/FAO/PIC/INC.1/Inf.1)
Qi, S., Yan, J., Zhang, G., Fu, J., Sheng, G., Wang, Z., Tong, S.M., Tang, U.W., Min, Y., (2001) Distribution of polycyclic
aromatic hydrocarbons in aerosols and dustfall in Macao. Environmental Monitoring and Assessment, 72: 115-127
Qi, S.H., Zhang, G., Jun Li et al., Dry and wet deposition of polycyclic aromatic hydrocarbons (PAHs) in March-June
2001 in the Pearl River Delta, South China. Environmental Monitoring and Assessment (in manuscript)
Quinlivan, S.C., Ghassemi, M., Leshendok, T.V. (1975/1977) Sources, characteristics and treatment and disposal of
industrial wastes containing hexachlorobenzene. Journal of Hazardous Materials 1 (1975/77): 343-359
Raether, L. (1998) Regulation, codes, standards, test - How do they effect our markets? Fire Saf. Technol. Turmoil. Prog.
Oppor.: 25-33
Rahman, F., Langford, K.H., Scrimshaw, M.D., Lester, J.N. (2001) Polybrominated diphenyl ether (PBDE) flame
retardants Sci. of the Total Environ., 275: 1-17
108
Rastogi, S.C. (1992) Investigation of isomer specific polychlorinated biphenyls in printing inks. Bulletin of Environmental
Contamination and Toxicology, 48(4): 567-571
Revazova, Y.A., Grosheva, E.I. (2002) (Eco)toxicological Effects of PTS-Background Discussion, presented at the 2nd
Technical Workshop of UNEP/GEF Regionally Based Assessment of PTS, Central and North East Asia Region
(Region VII), 14-16 May 2002, Hong Kong SAR, PR China
Revich, B.A. (2002) DDT, PAH, Dioxins, PCBs and human effects in Russian, presented at the 2nd Technical Workshop
of UNEP/GEF Regionally Based Assessment of PTS, Central and North East Asia Region (Region VII), 14-16 May
2002, Hong Kong SAR, PR China
Ruiz, J.M., Bachelet, G., Caumette, P., Donard, O.F.X. (1996) Three decades of tributyltin in the coastal environment with
emphasis on Arcachon Bay, France. Environmental Pollution, 93: 195-203
Russian Dioxin Program (1997)
Sakai, M., Kajihara, H., Fukumura, K., Kobayashi, J., Ohizumi, M., Takahashi, Y., Nakadaira, M., Yamamoto, M. (2002)
Time trends and source of dioxins in sediments in a large-scale rice production area, Niigata, Japan. Organohalogen
Comp., 57, 11-14
Sakai, S., Hirai, Y., Takatsuki, H. (2001) Environmental emissions and their sources of hexachlorobenzene (HCB). J. of
the Japan Society of Waste Management Experts 12: 349-362
Sakai, S., Ukai, T., Takatsuki, H., Nakamura, K., Kinoshita, S., Takasuga T. (1999a) Substance flow analysis of coplanar
PCBs released from waste incineration processes. J. Material Cycles and Waste Management, 1: 62-74
Sakai, S. (1999b) Substance flow approach for the control of PCDDs/DFs- Recent development on emission control and
abatement of PCDDs/DFs in Japan. Organohalogen Compounds, 40: 449-452
Sakai, S., Hiraoka, M., Takeda, N., Shiozaki, K. (1993) Coplanar PCBs and PCDDs/PCDFs in Municipal Waste
Incineration. Chemosphere, 27(1-3): 233-240
Sakurai, T., Tanabe, K., Shibata, Y., Nakasugi, O., Morita, M., Seki, Y., and Matsumura, T (2001) Use of archived
duplicate diet samples to measure past dietary exposure to dioxins in Japan. Organohalogen Comp., 52, 230-233
Samuratova, R.B., Ishankulov, M., Mazhitova, Z.K. (2002) Consequence of stable toxic substances influence on the health
of the Aral Sea Region population, presented at the 2nd Technical Workshop of UNEP/GEF Regionally Based
Assessment of PTS, Central and North East Asia Region (Region VII), 14-16 May 2002, Hong Kong SAR, PR China
Schecter, A., Piskac, A.L., Grosheva, E.I., Matorova, N.I., Ryan, J.J., Furst, P., Papke, O., Adibi, J., Pavuk, M., Silver, A.,
Ghaffar, S. (2002) Levels of dioxins and dibenzofurans in breast milk of women residing in two cities in the Irkutsk
Region of Russian Siberia compared with American levels. Chemosphere, 47, 157-164
Schwetz, B.A., Quast, I.F., Keeler, P.A., Humiston, C.G., Kociba, R.J. (1978) Results of two-year toxicity and
reproduction studies on pentachlorophenol in rats. In: Rao, K.R. ed. Pentachlorophenol: chemistry, pharmacology, and
environmental toxicology, New York, London, Plenum Press: 301-309
Seike, N., Eun, H.S., Ishizaka, M., Komamura, M., Uegaki, R., Kuwahara, M., Ueji, M. (2002) Time trends of dioxins in
paddy soil in Japan, 11th Symposium on Environmental Chemistry, Programs and Abstracts, 20-21
Shakirov, K., Bekkoesnov, M. (2002a) Country Report from Kyrgyzstan, presented at the 1st Technical Workshop of
UNEP/GEF Regionally Based Assessment of PTS, Central and North East Asia Region (Region VII), 18-20 March
2002, Tokyo, Japan
Shakirov, K. (2002) Questionnaire of Assessment of the National Capacity and Needs to Manage PTS (developed for
UNEP/GEF Regionally Based Assessment of PTS by Central and North East Asia Region, Region VII)
Shatalov, V., Dutchak, S., Malanichev, A. (2002) EMEP/MSC-E contribution to the 2nd Technical Workshop of
UNEP/GEF Regionally Based Assessment of PTS, Central and North East Asia Region (Region VII), 14-16 May 2002,
Hong Kong SAR, PR China
Shatalov, V., Malanitchev, A., Berg, T., Larsen, R. (2000) Investigation and assessment of POP transboundary transport
109
and accumulation in different media. EMEP/MSC-E, Report 4/2000, Part 1,2
Shatalov V., Malanichev, A., Vulykh, N., Berg, T., Manř, S. (2001) Assessment of POP Transport and Accumulation in
the Environment. EMEP/MSC-E Report 4/2001
Shatalov V., Malanichev, A. Vulykh, N., Berg, T., Manř, S. (2002) Assessment of POP Transport and Accumulation in
the Environment. EMEP/MSC-E Technical Report 7/2002 (under preparation)
Shekhovtsov, A. (2002) The Main Sources of Pollution Asia Part of Russia by PTS Technical Report, presented at the 1st
Technical Workshop of UNEP/GEF Regionally Based Assessment of PTS, Central and North East Asia Region
(Region VII), 18-20 March 2002, Tokyo, Japan
Shibata, Y. (2002) Environmental Level of Persistent Toxic Substances in Japan Technical Report, presented at the 1st
Technical Workshop of UNEP/GEF Regionally Based Assessment of PTS, Central and North East Asia Region
(Region VII), 18-20 March 2002, Tokyo, Japan
Shibata, Y. (2002) Questionnaire of Assessment of the National Capacity and Needs to Manage PTS (developed for
UNEP/GEF Regionally Based Assessment of PTS by Central and North East Asia Region, Region VII)
Sittig, M. ed. (1980) Pesticide Manufacturing and Toxic Materials Control Encyclopedia. Park Ridge, NJ, Noyes Data
Corporation
State Committee for Nature Protection of the Republic of Uzbekistan (2002)
State Environmental Protection Administration (2000) China's National Mini-Profile for Sound Management of
Chemicals
Sudayanto, A., Takahashi, S., Monitith, I., Ismail, A., Muchtar, M. Zheng, J., Richardson, B.J., Subramanian, A. Prudente,
M., Hue, N.D., Tanabe, S. (2002) Asia-Pacific mussel watch monitoring of butyltin contamination in coastal waters of
Asian developing countries. Environmental Toxicology and Chemistry (in press)
Sudayanto, A., Takahashi, S., Tanabe, S., Muchtar, M., Razak, H. (2000) Occurrence of butyltin compounds in mussels
from Indonesian coastal waters and some Asian countries. Water Science & Technology, 42, 71-79
Sun, W.X., Chen, R.L., Sun, A.Q. (1986) The pollution of organochlorine in Nanjiabawa peak area, Tibet. Environmental
Science, 7(6): 64-69
Suzuki, N. Yasuda, M., Sakurai, T. and Nakanishi, J. (2000) Simulation of long-term environmental dynamics of
polychlorinated dibenzo-p-dioxins and polychlorinated dibenzofurans using the dynamic multimedia environmental
fate model and its implication to the time trend analysis of dioxins. Chemosphere, 40: 969-976
Suzuki, N., Murasawa, K., Sakurai, T., Moriguchi, K., Tanabe, K., Nakasugi, O., Morita, M. (2001) Multimedia Modeling
Integrating the River Catchments and Gridded Air by Fugacity Formulation, 22nd Annual Meeting of Society of
Enviromental Toxicology and Chemistry, Baltimore, U.S.A.
Takei, T., Araki, S., Kanai, M., Morita, M. (2000) Environmental Levels of Dioxins in Japan: Results of Nationwide
Survey of Dioxins. Organohalogen Compounds, 46, 475-478
Tam, N.F.Y., Ke, L., Wang, X.H., Wong, Y.S. (2001) Environmental Pollution, 114(2): 255-263
Tanabe, S., Senthilkumar, K., Kannann, K., Subramanian, A.N. (2000) Mussel watch: marine pollution monitoring of
butyltins and organochlorines in coastal waters of Thailand, Philippines and India. Ocean & Coastal Management, 43,
819-839
Tobin, P. (1986) Known and potential sources of hexachlorobenzene. In: Morris, C.R. and Cabral, J.R.P. ed.
Hexachlorobenzene: Proceedings of an International Symposium. Lyon, IARC scientific publications no. 77: 3-11
Tumenbayer, B., Batbayar, M., Grayson, R. (2000) Environmental hazard in Lake Baikal watershed posed by mercury
placer in Mongolia. World Placer Journal, 1: 134-159
UNEP (2001a) Conference of the Plenipotentiaries on the Stockholm Convention on Persistent Organic Pollutants,
Stockholm, 22-23 May 2001, Revised list of requests for specific exemptions in Annex A and Annex B and acceptable
purposes, UNEP/POPS/CONF/INF/1/Rev.3, 14 June 2001
110
http://www.chem.unep.ch/pops/POPs_Inc/dipcon/meetingdocs/25june2001/inf1rev3/k0122169.pdf
UNEP (2001b) Conference of the Plenipotentiaries on the Stockholm Convention on Persistent Organic Pollutants,
Stockholm, 22-23 May 2001. Final Act of the Conference of Plenipotentiaries on the Stockholm Convention on
Persistent Organic Pollutants. UNEP/POPS/CONF/4, 5 June 2001
http://www.pops.int/documents/meetings/dipcon/25june2001/conf4_finalact/en/FINALACT-
UNEP (2001c) Standardized Toolkit for Identification and Quantification of Dioxin and Furan Releases
UNEP (2000) Regionally Based Assessment of Persistent Toxic Substances http://www.chem.unep.ch/pts/
UNEP (1999) Proceedings of the SubRegional Expert Meeting on Technologies for Treatment/Destruction of PCBs and
+Obsolete Pesticides, 6-9 July, 1999
UNEP (1997) Global Survey on Persistent Organic Pollutants, POPs Profile Information Reporting Form,
http://www.chem.unep.ch/pops/pops-gs/popsgs.htm
UNEP (1990) Data profile on DDT, International Register on Potentially Toxic Chemicals, Geneva
UNEP Chemicals (2000) Regionally Based Assessment of Persistent Toxic Substances, Guidance Document for the
Collection, Assembly and Evaluation of Data on Sources, Environmental Level and Impacts of Persistent Toxic
Substances, September 2000
Uno, I., Jang, E.S., Murano, K., Shimohara, T., Oishi, O., Utsunomiya, A., Hatakeyama, S., Tang, X.Y., Kim, Y.P. (2000)
Wintertime intermittent transboundary air pollution over east Asia simulated by a long-range transport model. Global
Environment Research, 4: 3-12
US EPA (1982) Pentachloronitrobenzene (PCNB) notice of determination concluding the rebuttable presumption against
registration. Fed. Regist. 47(82): 18177-18179
US EPA (1988) Pilot Study on International Information Related Compounds, Report Number 173, August 1988
US EPA (1996) Mercury Study Report to Congress, EPA-452/R-96-001b
Valkirs, A.O., Davidson, B.M., Seligman, P.F. (1987) Sublethal growth effects and mortality to marine bivalves from
long-term exposure to tributyltin. Chemosphere, 16: 201-220
Wang, Q., Chen, W., Ma, Z. (1999) The evaluation on the mercury emitted from coal combustion in China. China
Environmental Science, 19(4):318-321
Wang, Q, Ma, Z., Chen, W., Fang, F., Liu, R. (1999) Organic mercury in coal and its cinder. China Environmental Science,
19(4):318-321
Wapensky, L.A. (1969) Pesticide formulations. Journal of the AOAC, 52, 1284-1292
Wild, S.R., Harrad, S.J., Jones, K.C. (1992) Pentachlorophenol in the UK environment I: A budget and source inventory.
Chemosphere, 24(7): 833-845
Wikstroem, E., Tysklind, M., Marklund, S. (1999) Influence of variation in combustion conditions on the primary
formation of chlorinated organic micropollutants during municipal solid waste combustion. Environ Sci. Technol.,
33(23): 4263-4269
Wong, C.K.C., Leung, K.M., Poon, B.H.T., Lan, C.Y., Wong, M.H. (2002). Organochlorine Hydrocarbons in Human
Breast Milk Collected in Hong Kong and Guangzhou. Arch. Environ. Contamin. Toxicol. (in press)
Wu, Y., Zhang, J., Zhou Q. (1999). Persistent organochlorine residues in sediments from Chinese river/estuary systems.
Environmental Pollution,. 105: 143-150
WWF (2001) Fact Sheet DDT, http://www.worldwildlife.org/toxics/pubres/fact_ddt.pdf
Xu, X. (2002) Country Report from China, presented at the 1st Technical Workshop of UNEP/GEF Regionally Based
Assessment of PTS, Central and North East Asia Region (Region VII), 18-20 March 2002, Tokyo, Japan
111
Yoo, J. et al. (2002) Country Presentation of Korea, at The First Northeast Asian Sub-Regional Workshop Towards the
Effective Implementation of the Chemicals and Hazardous Wastes Conventions, 15-17 May 2002, Beijing, PR China
Yuan, D., Yang, D., Wade, T.L., Qian, Y. (2001) Status of persistent organic pollutants in the sediment from several
estuaries in China. Environmental Pollution, 114: 101-111
Yue, R., Tu, R., Gao, Y., Li, J. (2002) Country Presentation of China, at The First Northeast Asian Sub-Regional
Workshop Towards the Effective Implementation of the Chemicals and Hazardous Wastes Conventions, 15-17 May
2002, Beijing, PR China
Yufit, S., Grosheva, E. (2002). Country Report from Russian Federation, presented at the 1st Technical Workshop of
UNEP/GEF Regionally Based Assessment of PTS, Central and North East Asia Region (Region VII), 18-20 March
2002, Tokyo, Japan
Zhang, G., Min, Y.S., Mai,B.X., Sheng G.Y., Fu, J.M., Wang, Z.S. (1999) Time trend of BHCs and DDTs in a
sedimentary core in Macao estuary, Southern China. Mar. Pollut. Bull. 39, 326-330
Zhang, G., Qi, S., Parker, A., Li, X., Li, J., Wang, X. (2001) Distribution of organochlorine pesticides and polycyclic
aromatic hydrocarbons in soils from the Pearl River Delta, South China. Abstract on the 3rd Asia-Pacific Symposium
on Environmental Geochemistry, Guangzhou, China, 93
Zhang, G., Yan, Y., Fu, J.M., Parker, A., Li, X.D., Wang, Z.S. (2002) Butyltins in sediments and biota from the Pearl
River Delta, South China. Marine Pollution Bulletin (in manuscript)
Zhang, Y.Y., Tan, Y., Sun, M. (1980) Biodegradation of HCH in lake sediments under anaerobic condition. Environ. Biol.,
4: 1-7
Zheng, M.H., Chu, S.G., Sheng, G.Y., Min, Y.S., Bao, Z.C., Xu, X.B. (2001) Polychlorinated dibenzo-p-dioxins and
dibenzofurans in surface sediments from Pearl River Delta in China. Bulletin Environmental Contamination
Toxicology, 66:504-507
Zhou, H.Y., Cheung, R.Y.H., Wong, M.H. (1999a). Residues of organochlorines in sediments and tilapia collected from
inland water systems of Hong Kong. Archives of Environmental Contamination and Toxicology, 36:424-431
Zhou, H.Y., Cheung, R.Y.H., Wong, M.H. (1999b). Bioaccumulation of organochlorines in freshwater fish with different
feeding modes cultured in treated wastewater. Water Research, 33:2747-2756
Zhou, J.L., Maskaoui, K., Qiu, Y.W., Hong, H.S., Wang, Z.D. (2001) Polychlorinated biphenyl congeners and
organochlorine insecticides in the water column and sediments of Daya Bay, China. Environmental Pollution, 113:
373-384
Zhou, J.Y., Zhang, S., Zheng, J.S., Cai, F., Zhang, C., Zhou, M.J., Zhang, D.F, Cui, S.Z. (1997) Sources, transport and
environmental impact of contaminants in the coastal and estuarine areas of China, China Ocean Press, Beijing (in
Chinese)
112
ANNEX 1
Table 1. Scoring for Prioritising PTS for Sources, Environmental Levels, Effects and Data Gaps
SCORING BY MATRIX
Chemical Sources
Data
Env.
Data
Ecotox
Data
Human
Data
Gaps
Levels
Gaps
Effects
Gaps
Effects
Gaps
Aldrin
0 1 0 0 0 1 0 1
Chlordane
1 1 1 0 0 0 0 0
DDT
2 1 2 2 2 2 2 2
Dieldrin
0 1 0 0 0 0 0 0
Endrin
0 1 0 0 0 0 0 0
Heptachlor
0 1 0 1 0 1 0 1
HCB
1 2 1 0 1 1 1 1
Mirex
0 1 0 0 0 0 0 0
Toxaphene
0 1 1 2 0 1 0 1
PCBs
2 2 2 2 2 2 2 2
Dioxins
2 2 2 2 2 2 2 2
Furans
2 2 2 2 2 2 2 2
HCH
2 1 1 2 1 2 2 2
PCP
1 2 1 1 1 1 1 1
PAHs
2 2 2 2 2 2 2 2
Org. Mercury
1 2 1 1 1 1 1 2
Compds.
Org. Tin
1 1 1 1 1 1 1 1
Compds.
PBDE
1 2 1 1 1 2 1 2
Instructions:
1. Chemicals to be grouped by matrix (sources, environmental conc., etc.) and by score. There is no
total score for any chemical.
2. An associated column for data gaps is attached to each matrix. For example, Sources has an
accompanying column to score the degree of data gaps experienced for Sources.
3. A short summary with representative, specific data must be used to justify the score given. Use <50
words.
4. All chemicals selected for the study must have a score for each category
5. The guidelines attached provide a qualitative measure for scores. Scores are measured as follows:
113
Scores:
Score = 0 chemical is of no concern/ supportive data is collected
Score = 1 chemical has local concern/ supportive data is limited
Score = 2 chemical has Regional concern/ supportive data is lacking
NB. The score given for a matrix on a chemical does not have to be the same score for data gaps on that matrix
Chemicals should be tabled according to their placement by score. For example, a table should be presented for
chemicals under Sources of Regional concern (score 2) with the accompanying data gap score for Sources. An
example of a chemical placed in the Score 2 table for sources for a particular Region is given below:
SOURCES: Regional Concern
CHEMICAL DATA
COMMENTS
GAPS
DDT
1
DDT used historically for > 30 years. Approximately 800,00kg
now produced annually. 240,000kg used annually in the Region (6
countries) for malaria control (75%) and 80,000kg used in
agriculture (8 countries).
Table 2.
Guidelines for Scoring Issues Associated with Each Chemical
Score 0 =
Score 1 =
Score 2 =
Issue
No concern
Local concern
Regional concern
No evidence of production Evidence of limited
Major production of
or product contamination
production
chemical for local and
Sources of the
export use.
Chemical
No evidence of air
Presence of small sources
emissions
with possible emissions
Chemical evident as
(e.g.,small incineration
contaminant in large scale
No evidence of emissions
plants or bleached
production of other
from solid residues
kraft/pulp mills using
chemicals
No evidence of chemical
chlorine);
Known emission of
stockpiled
Some limited evidence of
chemical from large scale
No evidence of chemical
releases but on a small scale incinerators or chlorine
being contaminant in
invoking local concerns
bleaching of pulp or other
production of other
related combustion facilities
Some use of the chemical
chemicals
locally
Evidence of leakage from
major stockpiles of the
No evidence of use of the
Over time, levels remain
chemical
chemical poorly packaged
below threshold or are
No evidence of release
decreasing
Large-scale use of the
from liquid effluent
chemical throughout the
Use of chemical in
Region
agriculture or industry sub-
Regionally
Spatial and/or temporal
trends increasing Regionally
Evidence of limited
from levels above threshold
stockpiles of the chemical
Increasing spatial and/or
temporal trends from levels
below threshold and
localised
114
Ecotoxicological
No fisheries closures or
Inconclusive evidence of
Public health and public
Effects from
advisories due to chemical limited fish or wildlife
awareness of food/fisheries
exposure to the
pollution
mortality events on a local
contamination problems
chemical
or sub-Regional scale
with associated reduction in
No incidence of
the marketability of such
food/fisheries product
Temporal trend shows
products either through the
tainting
constant or decreasing
imposition of limited
effect of chemical
No unusual fish or wildlife
advisories or by area
mortality events
closures
Large-scale mortalities of
aquatic or wildlife species
Temporal trend showing
increase in effects of
chemical Regionally
No indication of any ill
Odd incidence of ill effects
Indications of health effects
effects from exposure to
that may be related to
resulting from use of
Human Effects
the chemical
exposure to the chemical
pesticide/industry chemical
from exposure to
the chemical
No correlation between
Evidence of localised
Wide spread health effects
human diseases and
effects from spot exposure
from involuntary exposure
chemical exposure
to the chemical
to the chemical
Temporal trend shows
Temporal trend showing
constant or decreasing
increase in effects of
effect of chemical locally
chemical Regionally
Data gaps
Full data sets established
Limited data available
Sparse data available
Evidence complete
Minimum data required to
Data unreliable
confirm findings
Ongoing monitoring data
No data available
available
Data available conflicting
Only historical data (>20
Further monitoring data
years) available
required on a wider scale
Limited data available
Limited anecdotal evidence
shows major concern
of local human and
environmental effects
Widespread anecdotal
evidence of human and
environmental effects
115


United Nations
Environment Programme
Chemicals
Centr
Central and North
al and Nor
East Asia
REGIONAL REPORT
th East
Regionally
Asia
RBA PTS REGIONAL REPOR
Based
Assessment
of
T
Persistent
Available from:
UNEP Chemicals
11-13, chemin des Anémones
CH-1219 Châtelaine, GE
Switzerland
Phone : +41 22 917 1234
Fax : +41 22 797 3460
Substances
E-mail: chemicals@unep.ch
December 2002
http://www.chem.unep.ch
UNEP Chemicals is a part of UNEP's Technology, Industry and
Printed at United Nations, Geneva
Economics Division
GE.03-00155January 2003500
UNEP/CHEMICALS/2003/7
G l o b a l E n v i r o n m e n t F a c i l i t y