
BOBLME-2009-REG-5.0-IWS-10
Implementation of the
BOBLME Project in
India
Country Report

Global Vs. Indian Fisheries Scenario
Global Production
Quantity
% Share
(million
tonnes)
Total Fisheries (2005)
141.6
100
Marine Capture Production
84.2
59.5
Inland Capture Production
9.2
6.5
Inland Aquaculture
28.9
20.5
Mariculture
18.9
13.5
Indian Production (2007-08)
Total Fisheries
7.13
100
Marine
2.91
40.9
Inland
4.22
59.1
10/Nov/2009
2

World Fish Production
160
Millions of tonnes
Aquaculture
140
Catch
120
100
80
60
40
20
0 1950 1951 1952 1953 1954 1955 1956 1957 1958 1959 1960 1961 1962 1963 1964 1965 1966 1967 1968 1969 1970 1971 1972 1973 1974 1975 1976 1977 1978 1979 1980 1981 1982 1983 1984 1985 1986 1987 1988 1989 1990 1991 1992 1993 1994 1995 1996 1997 1998 1999 2000 2001 2002 2003 2004 2005 2006 2007
FISHSTAT 2007/FIIU estimates
10/Nov/2009
3

World Fish Production 2007
(2006, 2005, 2004)
Catches:
91 (91, 93, 94) mmt
Aquaculture:
52 (50, 48, 46) mmt
Total:
143 (141, 141, 140) mmt
10/Nov/2009
4

World Aquaculture Production
60
Mil ions of tonnes
Aquaculture
50
40
30
20
10
0 1950 1951 1952 1953 1954 1955 1956 1957 1958 1959 1960 1961 1962 1963 1964 1965 1966 1967 1968 1969 1970 1971 1972 1973 1974 1975 1976 1977 1978 1979 1980 1981 1982 1983 1984 1985 1986 1987 1988 1989 1990 1991 1992 1993 1994 1995 1996 1997 1998 1999 2000 2001 2002 2003 2004 2005 2006 2007
10/Nov/2009
5

World Projections
100,000
90,000
80,000
70,000
60,000
50,000
40,000
30,000
20,000
10,000
0
2005
2010
2015
2020
2025
2030
10/Nov/2009
Aquaculture Production
Food Fish Capture Production
6

Profile of Fish Utilization (million tonnes)
Global
India
Total Production
143.0
7.13
Human Consumption
108.0
5.80
Non-food uses
35.0
1.33
Per-Capita fish supply
16.6
4.78
(kg)
10/Nov/2009
7

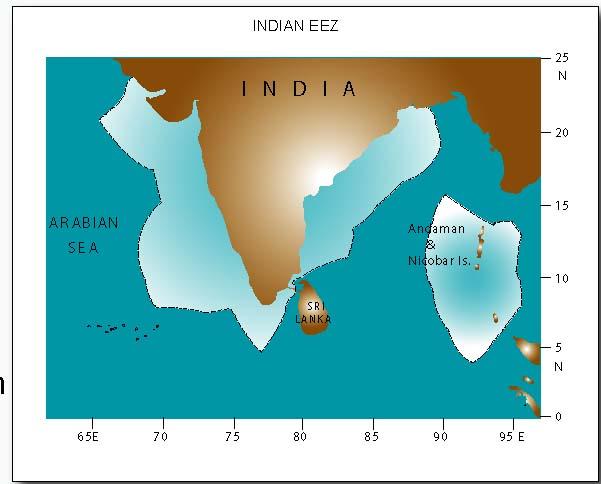
India : Fisheries Resources
Marine
Length of Coastline
8118 km
Exclusive Economic Zone
2.02 million sq. km
Continental shelf
0.506 million sq.km
No of landing centres
1914
No of Fishing Villages
3827
Estimated potential
3.9 million tonnes
Inland
Rivers and canals
0.19 million km
Reservoirs
3.15 million ha
Ponds and tanks
2.36 million ha
Brackish water
1.24 million ha
10/Nov/2009
8

India : Fishing Craft and
Fisher Population
Traditional Craft
1,81,300
Motorized Craft
44, 600
Mechanised Vessels
53,700
Total craft
2,79 600
Fisher population
144,850,00
10/Nov/2009
9

India Fish Species Diversity
· Total Fish Species
2200
· Marine
1440
· Freshwater
544
· Coldwater
73
· Brackish-water
143

Indian Fisheries Projections
Projected
Projected
Production in
production in
production in
Area
2008,
2012,
2022,
million tonnes
million tonnes
million tonnes
Marine capture
2.91
3.00
3.13
fisheries
Mariculture
0.01
0.03
0.12
Coastal
0.144
0.16
0.34
aquaculture
Inland capture
0.85
1.20
1.70
fisheries
Coldwater
0.0003
0.001
0.01
fisheries
Freshwater
3.22
5.60
7.40
aquaculture
Total
7.13
9.99
12.70
0.62
0.70
Export
0.82
(Rs. 8,000 crore) (Rs. 10,000 crore) (Rs. 15,400 crore)
10/Nov/2009
11

World Fish Trade: Export Value
- in 1000 US$ -
100,000,000
90,000,000
Developing countries
80,000,000
or areas
Developed countries
70,000,000
or areas
60,000,000
50,000,000
40,000,000
30,000,000
20,000,000
10,000,000
0
1976
1979
1982
1985
1988
1991
1994
1997
2000
2003
2006
10/Nov/2009
12

India-Profile of Seafood Exports
World Ranking: 19th Position
Item
Quantity
Value (US$)
Total
0.61 million tonnes
1.85 billion
Shrimp
28%
55%
Finfish
17%
--
Cuttle fish
9%
--
Squid
7%
--
10/Nov/2009
13

Marine Fisheries Scenario-
Challenges:
Depleting Marine catches
Over fishing in coastal waters
Highly Perishable and postharvest loss
Weak presence in the EEZ and high seas
Low levels of investment
10/Nov/2009
14

10/Nov/2009
15

Issues
Open water, open access
Multi-species, multi-gear
Potential Fishing Zones
Fish Aggregating Devices
Mesh/season regulations
Island fisheries (underutilized, poor
infrastructure support)
Ranching
10/Nov/2009
16

Comprehensive Marine Fishing Policy
The policy objectives are:
to augment marine fish production of the country up to
the sustainable level in a responsible manner so as to
boost export of sea food from the country and also to
increase per capita fish protein intake of the masses,
to ensure socio-economic security of the artisanal
fishermen whose livelihood solely depends on this
vocation.
to ensure sustainable development of marine fisheries
with due concern for ecological integrity and bio
diversity.

MAIN FEATURES OF THE COMPREHENSIVE MARINE FISHING
POLICY (CMFP)
Harmonized development of coastal and deep sea sectors
Ensure sustainable development of marine fisheries
Lay down norms for making EEZ a limited access fishery
Evolve procedures for monitoring and control of fishing operations
Sensitizing the stake holders about the need for Code of Conduct for
Responsible Fisheries (CCRF)
To curb Illegal, Unregulated and Unreported (IUU) fishing
To manage fishing capacity to prevent over capitalization in the sector and
over exploitation of resources
To be responsive to regional and international regimes in Marine Fisheries
Conservations and Management.
Address the requirements of ancillary and Complementary activities such
as post harvest care, marketing etc.

Large Marine Ecosystems (LMEs)
· Regions of ocean space encompassing
coastal areas from river basins and
estuaries to the seaward boundaries of
continental shelves and the outer margins
of the major coastal currents
· Relatively larger regions of the order of
200,000 sq km or more

Large Marine Ecosystems
(LMEs)
· Characterized by distinct:
Bathymetry
Hydrography
Productivity
Trophically dependent populations
LMEs:
· Globally there are 64 identified LMEs
· Produce 95% of the world's annual
marine fishery biomass yields

Bay of Bengal (BOB):
· One of the world's 64 LMEs
· Bounded by 8 countries viz. Bangladesh,
India, Indonesia, Malaysia, Maldives,
Myanmar, Sri Lanka & Thailand
· Southern part merges into the Indian
Ocean

Bay of Bengal (BOB):
· About 20% of world's population resides
in the littoral countries of BOB
· Approximately 400 million living in the
Bay's catchment area

Project Overview
· Structured into five inter-linking
components:
· Strategic Action Programme, including
Trans-boundary issues.
· Coastal/marine national resources
management and sustainable use.
· Improved understanding and predictability
of the ecosystem.
· Maintenance of ecosystem, health and
management of pollution.
· Project management.

India's interests
· Development of Regional Fishery
Management Plan for Shark.
· Development of Sub-regional Fishery
Management Plan for Indian Mackerel.
· Development of Sub-regional Fishery
Management Plan for Hilsa & other
migratory species.

Project Outcome
· a finalized trans-boundary diagnostic analysis,
· agreed strategic action programme,
· institutional arrangements to support the
continued development,
· improved well being of rural fisher communities,
· establishment and monitoring of basic health
indicators in the BOBLME area,
· capacity building to manage the resources, etc

Commitments:
· India earlier agreed for total contribution of:
US $ 600,000 in cash
US $ 430,000 in kind
For 6 years period
· Later the project cost was scaled down and the
project duration was reduced to 5 years
· Contribution to the revised project now would be
US $ 55,000/- p. a. in cash for a period of 5 years
US $ 87,500/- p. a. in kind contribution of about

Cash Contribution
· Cash contribution would cover:
cost of full time contracted National Technical
Advisor / National Technical Assistant and
Secretary, pro-rata proportion of the salary of
the National Coordinator, associated
communication and facilities, project related
workshops, etc.

In kind Contributions
· In kind contribution would cover:
expenses of the National counterparts, the
project Steering Committee Members,
National Task Force Members, staff and
consultants and pro-rata cost of office space
of National Coordinator, National Technical
Advisor, etc.

Progress so far
· Project Document was signed on 22nd
January, 2009
· FAO was provided with the signature page
· Joint Secretary (Fisheries) was designated
as focal point for implementation of
BOBLME Project.

Progress so far
· An amount of Rs. 2.500 million has been
provided for the BOBLME project in the
budget during 2009-10.
· The inception workshop was held in
Colombo, Sri Lanka along with the APFIC
Regional Workshop on Ecosystem
Approach in Fisheries & Aquaculture
during 18-22 May, 2009.

Progress so far
· India's representative attended the
meeting, where working arrangements for
the project were further discussed.
· Nominations of the Indian representatives
for the Project Steering Committee and
National task force etc. is under process.

Thank You

Export Growth of Fish Products
10/Nov/2009
34

Marine Capture Fisheries
Sustainable production
Present annual production
2.91 m t
Projected production, 2011-12
3.00 m t
Strategy
Regulated fishing and capacity management in
mechanized sector.
Conservation, sea ranching , FAD's
Diversified fishing in Deep sea & Oceanic
resources
10/Nov/2009
35

Major Trading Partners
Market
Share(%)
European Union:
34
Japan
:
16
USA
:
16
China
:
14
10/Nov/2009
36

INDIAN FISHERIES
Present fish Production
7.13 mmt
Inland
4.22 mmt
Marine
2.91 mmt
Primary sale value
~ Rs. 42,000 crore
(US $ 9 bn)
Fish seed production
31,688 million fry
Hatcheries
1,070
FFDA
422
BFDA
39
Export
Rs. 8,000 crore
10/Nov/2009
37

India: Fish Production
Growth (MT)
8
7
6
5
Marine
4
Inland
3
Total
2
1
0
2005
2006
2007
10/Nov/2009
38

Indian Fish Facts
4.7% of global production
1.07% of GDP
5.34% of Agriculture GDP
2.5% of global trade
18% of National Agricultural Exports
10/Nov/2009
39