
United Nations
Global Environment
Environment Programme
Facility
Transboundary Diagnostic Analysis of
Land-based Sources and Activities in the
Western Indian Ocean Region
TABLE OF CONTENTS & LIST OF ACRONYMS
Draft
November 2008

UNEP-GEF WIO-LaB Project
Addressing Land Based Activities in the Western Indian Ocean
TABLE OF CONTENTS
Chapter 1
INTRODUCTION
1.1
The Western Indian Ocean setting
1.2
Global and regional significance of the WIO region
1.3
A call for action
1.4
Purpose of the TDA and relationship to the Nairobi Convention and NEPAD
1.5
Boundaries and conditions of the TDA
1.6
Description of the TDA Process
Annex 1
Main contributors to the TDA
Chapter 2
BIOPHYSICAL SETTING OF THE WIO REGION
2.1 Physical
setting
2.1.1 Geographical location and setting
2.1.2 Climatic
conditions
2.1.3 Geology
and
geomorphology
2.1.4 Watersheds, hydrological conditions and estuaries
2.1.5 Oceanographic
characteristics
2.2 Ecological
setting
2.2.1 Coastal ecosystems and habitats
2.2.2 Mangrove
forests
2.2.3 Seagrass
beds
2.2.4 Rocky shores and sandy beaches of the WIO region
2.2.5 Coastal
forests
2.2.6 Fisheries
ecology
2.2.7 Species of special concern
UNEP-GEF WIO-LaB Project
2
Chapter 3
SOCIO-ECONOMIC SETTING
3.1
General socio-economic characteristics
3.1.1 Introduction
3.1.2 Demographic
characteristics
3.2 Socio-economic
activities
3.2.1 Fishery
resources
3.2.2 Aquaculture
resources
3.2.3 Tourism
3.2.4 Industry
3.2.5 Agriculture
3.2.6 Mining
3.2.7 Solar Salt Production
3.2.8 Oil and gas production
3.2.9 Shipping and ports
3.3
Valuation of ecosystem goods and services
3.3.1 Overall valuation of key ecosystems in the region
3.3.2 Valuation of key economic activities (ecosystem uses) in the region
3.4 Conclusions
Chapter 4
ASSESSMENT OF MAJOR TRANSBOUNDARY PROBLEMS AND
ISSUES
4.1 Introduction
4.1.1 Identification of major perceived problems and issues
4.1.2 Approach and methodology
4.2
Problem Area 1: Water and sediment quality degeneration due to pollution from land-
based sources
4.2.1 Overview
4.2.2 Microbial
contamination
4.2.3 High Suspended Solids /Sediments
4.2.4 Chemical
Pollution
4.2.5 Marine
litter
4.2.6 Eutrophication
4.2.7 Stakeholder
analysis
UNEP-GEF WIO-LaB Project
3
4.3
Problem area 2: Physical alteration and destruction of habitats (PADH)
4.3.1 Overview
4.3.2 Degradation of mangrove forests
4.3.3 Degradation of Seagrass Beds
4.3.4 Degradation of Coral Reef Ecosystem
4.3.5 Degradation of coastal forests in the WIO region
4.3.6 Shoreline
changes
4.3.7 Stakeholder
analysis
4.4
Problem Area 3: Alteration in freshwater flows and sediment loads from rivers.
4.4.1 Overview
4.4.2 Alteration of river flows and water quality
4.4.3 Alteration of sediment loads
4.4.4 Stakeholder
analysis
Annex 1
Overview of sectors, stakeholder groups and governing institutions involved in
LBSA Management
Chapter 5
GOVERNANCE ANALYSIS
5.1 Introduction
and
overview
5.2
`Governance' and `government' in the context of land-based marine pollution
5.3
Governance analysis of main problems and issues
5.3.1 Overview of governance issues related to the three TDA problem areas
5.3.2 Stakeholders
involved in LBSA Governance
5.4
International and regional governance frameworks and institutions
5.4.1 International and regional conventions
5.4.2 Soft Laws and related developments
5.4.3 Regional Economic Integration Agreements
5.4.4 International and Regional Institutions
5.4.5 Intergovernmental
Agreements
5.4.6 River-basin Governance frameworks
5.5
National governance frameworks
5.5.1 Legal and policy frameworks
5.5.2 National
institutional
frameworks
5.6
The role of civil society
5.6.1 International and regional Civil Society Organisations
UNEP-GEF WIO-LaB Project
4
5.6.2 National civil society organisations
5.7 Financial
mechanisms
5.7.1 International and regional context
5.7.2 National
context
5.8
Education and public awareness
Chapter 6
FINAL ANALYSIS AND CONCLUSIONS
6.1 Introduction
6.2
Overall synthesis of transboundary problems
6.3
Summary of transboundary problems
6.3.1 Water and sediment quality degeneration from land-based sources
6.3.2 Physical alteration and destruction of habitats (PADH)
6.3.3 Alteration in fresh water flows and sediment loads from rivers
6.4
Overview of governance problems related to LBSA management
6.5
Prioritization of transboundary problems and issues
6.6
The way ahead: a framework for a Strategic Action Programme
BIBLIOGRAPHY
UNEP-GEF WIO-LaB Project
5

UNEP-GEF WIO-LaB Project
Addressing Land Based Activities in the Western Indian Ocean
LIST OF ACRONYMS
ACEP
African Coelacanths Ecosystems Project
ACP
African Caribbean Pacific group of countries
AEIN Africa
Environmental Information Network
AEO
African Environment Outlook
AGOA
African Growth and Opportunity Act
AIDE
Association de Institute pour Development et l' Environment Comoro
ACLME
Agulhas Current Large Marine Ecosystem
AMCEN
African Ministerial Conference on the Environment
AMCOW
African Ministerial Conference on Water
ANGAP
Association Nationale pour la Gestion des Aires Protégés, Madagascar
ASCLMEs
Agulhas and Somali Current LMEs
BCC
Benguela Current Commission
BCLME
Benguela Current LME
BMU
BEACH Management Unit
BOD
Biochemical Oxygen Demand
CDA
Coast Development Authority of Kenya
CEAS
Coastal Environment Award Scheme
CHM Clearinghouse
Mechanism
CITES
Convention on the International Trade in Endangered Species
COD
Chemical Oxygen Demand
COMESA
Common Market for Eastern and Southern Africa
COSMAR
Coastal and Marine Secretariat
COP
Conference of the Parties
CORDIO
Coral Reef Degradation in the Indian Ocean
CSIR
Council for Scientific and Industrial Research, South Africa
CSO
Civil Society Organizations
DEAT
Department of Environmental Affairs and Tourism (South Africa)
DGE
La Directeur Generale de L' Environment
DNE
Direction Nationale de l'Environnement, des Forets et des Stratégies Agricoles (Comores)
DWAF
Department of Water Affairs and Forestry (South Africa)
EA Environmental
Assessment
EAC
East African Community
EACC
East African Coastal Current
EAF/RCU
Eastern African Regional Coordination Center for the Nairobi Convention
EAME
East Africa Marine Ecoregion
EAMS
East Africa Marine Systems
EARO
East Africa Regional Office (IUCN)
EARPO Eastern
Africa
Regional Programme Office (WWF)
EC European
Community
EIA
Environmental Impact Assessment
EIS
Environmental Information System
EEZ
Exclusive Economic Zone
EHN
Empresa Nacional de Hidrocabonatos
EJ Equatorial
Jet
UNEP-GEF WIO-LaB Project
6
ELVs
Effluent Limit Values
EMPS
Environmental Management Plan of Seychelles
EPZ
Export Processing Zone
EQO
Environmental Quality Objectives
EQO/Ts
Environmental Quality Objectives and Targets
EQS
Environmental Quality Standards (also referred to as Quality Guideline Values)
EPA
Environment Protection Act 1994
EU European
Union
FARI
Forum for Academic and Research Institutions in the WIO-Region
FPSO
Floating, production, storage and offloading (of cargo from vessel)
GEF
Global Environment Facility
GEMPA-EA
Group of Experts for Marine Protected Areas in Eastern Africa
GESAMP
Group of Experts on the Scientific Aspects of Marine Pollution
GDP
Gross Domestic Product
GIS
Geographical Information System
GIWA Global
International Waters Assessment
GNP
Gross National Product
GPA
Global Programme of Action
GWP
Global Water Partnership
HID
Human Development Index
IAEA
International Atomic Energy Agency
IAEA-MESL
International Atomic Energy Agency Marine Environmental Studies Laboratory
IAIA
International Association for Impact Assessment
ICARM
Integrated Coastal Area and River Basin Management
ICZM
Integrated Coastal Zone Management
IFIs
International Financial Institutions
IMO International
Maritime Organisation
IMS
Institute of Marine Sciences, Tanzania
IOC Indian
Ocean
Commission
IOC-UNESCO
Inter-governmental Oceanographic Commission of UNESCO
ISO
International Standards Organization
IT
Information Technology
IUCN
The World Conservation Union
IW International
Waters
IWMI
International Water Management Institute of the Consultative Group on International
Agricultural Research
IWRM
Integrated Water Resources Management
KMF Kenya
Marine
Forum
KMFRI
Kenya Marine Fisheries Research Institute
KOBWA
Komati Basin Water Authority
LBA Land-based
Activities
LBS Land-based
Sources
LBSA
Land-based Sources and Activities
LME
Large Marine Ecosystem
MAP Mean
Annual
Precipitation
MAR Mean
Annual
Runoff
MBREMP
Mnazi Bay-Ruvuma Estuary Marine Park
MCM
Marine and Coastal Management
MENRT
Ministry of Environment, Natural Resources and Transport, Seychelles
MDG
Millennium Development Goals
UNEP-GEF WIO-LaB Project
7
MICOA
Ministério de Coordenaçao Ambiental, Mozambique
MOE
Ministry of Environment and National Development Unit, Mauritius
MPAs
Marine Protected Areas
MSP Medium
Sized
Project
MWW Municipal
Wastewater
NCS
Nairobi Convention Secretariat
NEMA
National Environmental Management Authority (Kenya)
NEMC
National Environmental Management Council (Tanzania)
NEPAD
New Partnership for Africa's Development
NEPAD
New Partnership for Africa's Development
NFP
National Focal Point
NFPI
National Focal Point Institution
NGO Non-Governmental
Organization
NOAA
National Oceanic and Atmospheric Administration (United States)
NORAD
Norwegian Development Agency
NPA National
Programme of Action
OMNIS
Office des Mines Nationales et des Industries Strategiques
ORI Oceanographic
Research
Institute, South Africa
PADH
Physical Alteration and Destruction of Habitats
PAH Polyaromatic
hydrocarbon
PACSICOM
Pan African Conference on Sustainable Integrated Coastal Management
PCB Polychlorinated
biphenyl
PDF-B
Project Development Facility Block B Grant
PMU
Project Management Unit
POPs Persistent
Organic Pollutants
PPP
Public Private Partnership
PSA
Product Sharing Agreement
PSC
Project Steering Committee
PSU
Practical Salinity Unity
RAC
Regional Activity Centre
RCU
Regional Coordinating Unit (of Nairobi Convention)
RSP
Regional Sea Programme
RSA
Republic of South Africa
RWQO
Receiving Water Quality Objectives
SADC
Southern African Development Community
SAIEA Southern
African
Institute for Environmental Assessment
SAMSA
South African Maritime Authority
SAP
Strategic Action Program
SAREC
Swedish Agency for Research Cooperation with developing countries
SANBI South
African
National Biodiversity Institute
SCLME
Somali Current Large Marine Ecosystem
SEA
Strategic Environmental Assessment
SEACAM
Secretariat for East African Coastal Area Management
SIDS
Small Island development State
STAC
Scientific and Technical Advisory Committee
SWCI
Shared Watercourse Institutions
SWIOFP
South-Western Indian Ocean Fisheries Project
STAC
Scientific and Technical Advisory Committee
TCMP
Tanzania Coast Management Partnership
TDA
Transboundary Diagnostic Assessment
UNEP-GEF WIO-LaB Project
8
TIA
Transboundary Impact Assessment
TOR
Terms of References
TPDC
Tanzania Petroleum Development Corporation
TTT
TDA Task Team
UDSM
University of Dar es Salaam
UNCLOS
United Nations Convention on the Law of the Sea
UNEP
United Nations Environmental Program
UNESCO
United Nations Scientific and Cultural Organization
USAID
United States Agency for International Development
WCS
World Conservation Society
WHO World
Health
Organisation
WIO
Western Indian Ocean
WIO-C
Consortium for the Conservation of the Coastal and Marine Ecosystems in the Western
Indian Ocean
WIO-Lab
Addressing Land-based Activities in the West Indian Ocean
WIOMSA
Western Indian Ocean Marine Sciences Association
WSSD
World Summit for Sustainable Development
WWF
World Wildlife Fund
ZAMCOM
Zambezi River Basin Commission
ZRA Zambezi
River
Authority
UNEP-GEF WIO-LaB Project
9

United Nations
Global Environment
Environment Programme
Facility
Transboundary Diagnostic Analysis of
Land-based Sources and Activities in the
Western Indian Ocean Region
CHAPTER 1 - INTRODUCTION
Draft
November 2008

UNEP-GEF WIO-LaB Project
Addressing Land Based Activities in the Western Indian Ocean
Table of contents
1.
Introduction
3
1.1
The Western Indian Ocean setting
3
1.2
Global and regional significance of the WIO region
4
1.3
A call for action
5
1.4
Purpose of the TDA and relationship to the Nairobi Convention and NEPAD
6
1.5
Boundaries and conditions of the TDA
7
1.6
Description of the TDA Process
7
Annexes
Annex1
Main contributors to the TDA
UNEP-GEF WIO-LaB Project
2

UNEP-GEF WIO-LaB Project
Addressing Land Based Activities in the Western Indian Ocean
1. Introduction
1.1 The Western Indian Ocean setting
The Western Indian Ocean (WIO) region extends from approximately latitude 120 N to 340 S
and longitude 300 to 800 E (see Figure 1-1). The region encompasses a large array of marine
and coastal settings, ranging from small island states to large countries with extensive
coastlines and tropical and subtropical climates. The continental coastal states are Somalia,
Kenya, Tanzania, Mozambique and South Africa while the island states are Mauritius,
Comoros, Seychelles, Madagascar and Réunion (France).
The WIO countries not only share common biological resources and climatic features but also
many historical, cultural and economic ties. Despite these commonalities, the countries in the
region are at different stages of both political and economic development, reflected among
others by the individual economic indicators for countries in the region ranging from those
with a per capita gross national product (GNP) of over $ 8,000 per annum (Seychelles and
Reunion), to those with less than $1,000 GNP (Comoros, Tanzania, and Madagascar).
(UNDP, 2006).
Some 40 million people inhabit the coastal areas of the region and so overall population Some
40 million people inhabit the coastal areas of the region and so overall population density of
the region is not remarkably high. However, while large areas may lack coastal populations,
such as much of the Somali coastline, certain areas are indeed very densely populated.
Urbanization pressures are most marked in the mainland states, where main urban centres
such as Mombasa (Kenya), Dar es Salaam (Tanzania), Maputo (Mozambique) and Durban
(South Africa) have arisen, each supporting populations of 2 to 4 million.
These same coastal settlements are centres of economic activities in the WIO region,
sheltering internationally important ports and harbours that handle most of the region's
incoming and outward-bound ship-borne cargo. Mainland countries are rich in mineral
deposits, with most mining activities taking place inland, but increasingly, coastal mining is
becoming significant in South Africa, Kenya, Mozambique and Tanzania (SEACAM, 2003).
Recently, significant oil and gas exploration and development in the coastal zone has begun in
Tanzania and Mozambique, with increasing activity in Kenya (including deep-water
exploration well-drilling in 2006) and similar exploration off Madagascar and Seychelles.
During the last three decades, the tourism industry played a significant role in the economic
development of most of the countries of the WIO region. Tourism expansion has been
actively pursued by national governments because of its positive effects on national income,
high levels of employment and diversification of the economic structure. Much of the tourism
activity takes place in coastal areas, often associated with Marine Protected Areas (MPAs)
UNEP-GEF WIO-LaB Project
3
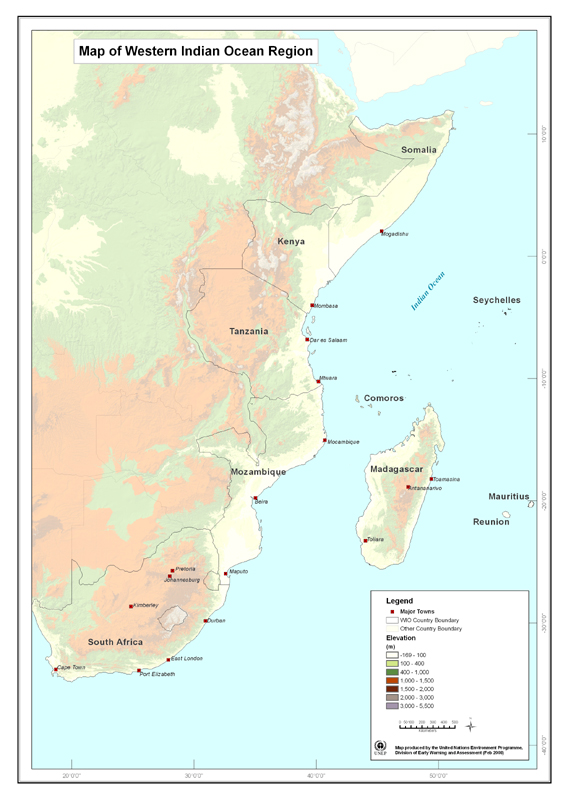
· Figure 1-1: Map of the WIO region
1.2 Global and regional significance of the WIO region
The marine and coastal environment in the WIO is recognized for its high ecological and
economic value. The region is considered a distinct subdivision of the tropical Indo-West
Pacific, the world's largest marine biogeographic province (Sheppard, 1987; 2000). The
UNEP-GEF WIO-LaB Project
4
WIO region contributes to a high level of biodiversity, including more than 2,200 species of
fish, 200 species of hard coral, 10 species of mangroves, 12 species of seagrass, over 1,000
species of marine algae, several hundred sponge species, 3,000 species of molluscs, 300
species of crabs and more than 400 echinoderms (Richmond, 2001). The WIO region is
regionally significant for high levels of endemism, reaching up to 22% as compared to, for
example, the Red Sea (13%) and Eastern Indian Ocean (6%). Highly threatened and unusual
species occur, such as coelacanths, whale sharks and sawfishes, while, five of the world's
seven turtle species nest on beaches of the region. The cetacean fauna is also rich with more
than 38 cetacean species found here and especially diverse towards higher latitudes (Best
2007).
The biological richness and natural beauty of the WIO region, including its beaches,
mangrove forests, lagoons and coral reefs represent a basis for the region's growing tourism
sector, attracting visitors from all over the world. Its marine waters, and in particular its
continental shelves, coastal margins, lagoons and estuaries are important fishing grounds for a
great diversity of fishers, ranging from artisanal fishers using traditional gear to industrial
fisheries generating food, employment and foreign exchange. It has been estimated that up to
8 million tons of fish is landed in the WIO annually, making it one of the most significant
fishing regions on the planet (van der Elst et al 2005. Besides biological productivity, the
various diverse coastal habitats of the WIO also provide coastal protection, food, shelter and
safety for fishes, crustaceans, molluscs and other organisms of ecological and commercial
value.
Although the WIO is still considered to be one of the least ecologically disturbed areas of
global oceans, it is increasingly threatened by natural and anthropogenic events. In the recent
past, coastal and marine environments have started showing signs of degradation, attributed to
both natural factors (coral bleaching) (Lindén and Sporrong, 1999) and a variety of human
activities, acting at different intensities and in various combinations. The coastal zone of the
WIO region is the site of major cities, harbours, industries and other socio-economic
infrastructure, which increasingly affect the environment. Pollution from domestic, industrial
and agricultural sources causes the degradation of water and sediment quality, resulting in
loss of biological diversity, problems for human health and a reduction in fish stocks. Human
activities also lead to the destruction of vital habitats such as mangrove forests, seagrass beds
and coral reefs, and cause physical alteration of the coastal zone which either causes or
accelerates coastal erosion.
1.3 A call for action
Most countries in the region currently lack both the capacity and regulatory framework to
adequately manage the afore-mentioned threats to the coastal zone. Moreover, it is generally
realized that the protection, management and development of the shared ecosystems of the
WIO would require a regional approach, because the impacts of the above-mentioned
disturbance sources and activities are not confined to national borders. The mobile
components of the WIO, such as winds, currents, rivers and tides exist on scales larger than
geopolitical entities, and over-exploitation, habitat destruction or degeneration in water
quality in one part of the WIO may adversely impact on one or more neighbouring countries.
Recognizing these facts, the First Meeting of the Contracting Parties to the Convention for the
Protection, Management and Development of the Marine and Coastal Environment in the
Eastern African Region (Nairobi Convention) in March 1997 called for concerted action to
address the increasing impact of human activities on the WIO coastal and marine
environment. Based upon this call, UNEP, as the host for the Secretariat of the Nairobi
Convention, took the lead in developing a preliminary Transboundary Diagnostic Analysis
(TDA) and Strategic Action Plan (SAP) for the WIO region, facilitated through a Global
Environment Facility (GEF) Project Development Facility Block B (PDF-B) Grant.
UNEP-GEF WIO-LaB Project
5
The preliminary TDA and SAP, which were finalized in 2002, defined a number of priority
areas for intervention, as well as identified gaps in information that need to be filled in order
to make better-founded management decisions. These documents built strongly on the
outcome of the GEF Medium-sized Project (MSP) "Development and Protection of the
Coastal and Marine Environment in Sub-Saharan Africa" (often referred to as "The African
Process"). Subsequently, three regional projects were developed within the GEF framework
in order to undertake further data collection and analysis and to define and demonstrate
appropriate strategies that would address priority problems in the WIO region. These projects
(and their respective implementation agencies) are:
1. Addressing Land-based Activities in the Western Indian Ocean (WIO-LaB), with a
mandate primarily focused on the issues relating to land-based sources of pollution
and other activities that impact on the marine and coastal environment (UNEP);
2. Agulhas and Somali Current Large Marine Ecosystems (ASCLMEs) project, whose
scope is focused on issues relating to ocean dynamics, productivity, artisanal
(subsistence) fisheries and to a certain extent marine pollution (heavy metals and
Persistent Organic Pollutants or POPs (UNDP); and,
3. South Western Indian Ocean Fisheries Project (SWIOFP), which concentrates on the
issue relating to assessment and shared management of the region's offshore fisheries
(World Bank).
The WIO-LaB was the first of these three projects to be initiated, officially launched at a
ceremony in Madagascar in July 2004, during the Fourth meeting of the Contracting Parties to
the Nairobi Convention. The project is a direct follow-on to the 2002 World Summit for
Sustainable Development (WSSD) and the related Johannesburg Plan of Implementation,
which calls for "advanced implementation of the Global Programme of Action for the
Protection of the Marine Environment from Land-based Activities (GPA)".
One of the key outputs expected of the WIO-LaB Project is a TDA and SAP focusing on
land-based activities and sources of pollution. The WIO-LaB TDA/SAP process will be
closely coordinated with the ASCLMEs and SWIOFP projects, and their results will
eventually be integrated in the overall TDA and SAP for the region.
1.4 Purpose of the TDA and relationship to the Nairobi Convention and
NEPAD
The main purpose of this TDA is to provide a tool for the identification and prioritization of
key issues concerning management of the coastal and marine environment in the WIO.. The
TDA should furthermore serve to define the potential areas of intervention to address such
issues as a basis for the development of a comprehensive and regionally-agreed and
implementable plan: the SAP.
The WIO-LaB Project forms an integral part of the work programme of the Nairobi
Convention. It is intended that the TDA and SAP resulting from this Project will provide the
basis for the further implementation of the Nairobi Convention in the WIO region, as well as
supporting the goals and objectives of other regional and international conventions and policy
frameworks including:
· Millennium Development Goals;
· Regional and global priorities identified under Agenda 21 (Chapter 17);
· Convention on Biological Diversity;
UNEP-GEF WIO-LaB Project
6
· Programme of Action for the Sustainable Development of Small Island Developing
States (Barbados, 1994);
· Pan-African Conference on Sustainable Integrated Coastal Management
(Mozambique, 1998);
· Arusha Resolution on Integrated Coastal Zone Management (ICZM) in Eastern
Africa including the Island States (April, 1993);
· Seychelles Conference Statement on ICZM (October, 1996); and,
· Marine Turtle Conservation and Action Plan for the WIO region.
The TDA and SAP are also specifically intended to complement the commitments and
priorities identified within the Environmental Component of the New Partnership for Africa's
Development (NEPAD), and in particular its marine and coastal component (COSMAR), with
the Nairobi Convention thereby functioning as one of its main implementation mechanisms.
1.5 Boundaries and conditions of the TDA
In terms of geographical scope, this TDA covers the shared waters of the WIO (including
river basins and catchments) of the eight WIO-LaB project countries, namely: Comoros,
Kenya, Madagascar, Mauritius, Mozambique, Seychelles, the East Coast of South Africa, and
Tanzania. Although not formally part of the WIO-LaB Project, information and data from
Reunion (France) and Somalia have been included in the analysis as far as possible.
In terms of thematic scope, this TDA is confined to issues related to land-based sources and
activities affecting the coastal and marine environment. The main thematic areas of this TDA
are therefore:
1. Water and sediment quality degeneration due to pollution from land-based sources;
2. Physical alteration and destruction of habitats due to human activities; and,
3. Alteration of river flows, quality and sediment loads.
1.6 Description of the TDA Process
A schematic presentation of the proposed TDA process is shown in Figure 1.2. The five main
steps in the TDA development process may be distinguished as:
1. Establishment of the TDA Task Team
2. Initial identification of transboundary problems
3. Fact finding (data collection and analysis)
4. Causal Chain and Governance Analysis
5. Review and validation
Each of these steps is further defined in the sections that follow:
Establishment of the TDA Task Team
The TDA development was led by a regional TDA Task Team (TTT) consisting of scientific
and institutional experts from the WIO region, covering the following fields of expertise:
1. Marine Pollution
2. Coastal Habitats (including fisheries aspects)
3. River-coast Interactions
UNEP-GEF WIO-LaB Project
7
4. Governance
5. Socio-economic Issues
· Figure 1-2: Schematic presentation of the TDA process
UNEP-GEF WIO-LaB Project
8
In order to ensure close interaction with the other parts of the Project workplan, the function
of Coordinator of this Team was held by the WIO-LaB Project Management Unit. Members
of the Unit and contributors of the TTT are presented in Annex 1
Initial identification of transboundary problems
Based upon the "major perceived issues and problems" identified as part of the Preliminary
TDA (2002) and the African Process, using available documentation and seeking expert
advice where necessary, the TTT embarked on an initial review of transboundary problems
within the WIO region. The findings of this exercise enabled the team to establish a clear
workplan with division of responsibilities for each of the team members, as well as to
establish activities and mechanisms for consultation with national and regional stakeholder
groups on the issues and problems identified.
As a next step in the process, the TTT facilitated a regional TDA/SAP workshop, in order to:
· identify and validate the perceived priority transboundary problems;
· undertake an initial root-cause analysis of the identified transboundary problems;
· identify data sources and gaps related to each of the transboundary problems and
establish mechanisms to fill such gaps;
· undertake an initial analysis of governance and socio-economic aspects related to the
identified transboundary problems;
· establish criteria for the prioritization of transboundary problems and undertake a
preliminary prioritization of the identified problems based upon expert opinion; and,
· identify key areas for intervention to provide solutions to the identified transboundary
problems.
The first TDA/SAP workshop gathered over 40 experts from the various technical Task
Forces established by the WIO-LaB Project, as well as representatives of key academic and
research institutions in the region and other regional organizations, including NGOs, active in
marine ecosystem conservation in the WIO region.
Fact finding (data collection and analysis)
On the basis of the outcomes of the regional TDA/SAP workshop, the TTT embarked upon a
detailed analysis of the perceived priority transboundary problems, based upon available
scientific and technical data and information. Much of this data was collected as part of
thematic assessment studies undertaken as part of the WIO-LaB Project, or through other
initiatives1. The results of these detailed studies feature as the main supporting documents of
this TDA and concern in particular the following:
1. Regional Overview of Physical Alteration and Destruction of Habitats in the WIO
Region (UNEP/Nairobi Convention Secretariat, 2004a);
2. Regional Assessment of the State of Pollution in the WIO Region (UNEP/Nairobi
Convention Secretariat, 2008a)
3. Regional Overview and Assessment of Marine Litter Related Activities in the WIO
Region (UNEP/Regional Seas Programme, 2008b)
4. The Status of Municipal Wastewater (MWW) Management in the WIO Region
(UNEP/Nairobi Convention Secretariat, 2008c)
5. Regional Overview and Assessment of River-coast Interactions in the WIO Region
(UNEP/Nairobi Convention Secretariat, 2008d)
1 Such as the African Process, the Global International Waters Assessment (GIWA) programme, the
Eastern African Marine Systems (EAMS) programme, GESAMP, TransMap and various reports
prepared by the UNEP Nairobi Convention Secretariat, the UNEP Global programme of Action for the
Protection of the Marine Environment from land-based Activities (UNEP/GPA).
UNEP-GEF WIO-LaB Project
9
6. Regional Review of Policy, Legal and Institutional Frameworks for Addressing Land-
based Sources and Activities in the WIO Region (UNEP/Nairobi Convention
Secretariat, 2008e)
7. Regional Review of the Status of Ratification of International Conventions related to
Land-based Sources and Activities Management in the WIO Region (UNEP/Nairobi
Convention Secretariat, 2008f)
Causal Chain and Governance Analysis
Based upon these detailed studies, plus seeking specific expert advice and consulting
additional documentation where needed, the TTT undertook a comprehensive causal-chain
analysis of the priority transboundary problems. Furthermore, detailed consultations on the
various topics were held within the context of the WIO-LaB Technical Task Forces, more
specifically at the following meetings:
1. The 3rd meeting of the Regional Legal and Technical Review Task Force (Stone
Town, Zanzibar, 31 January 2 February 2007);
2. The 2nd meeting of the Regional MWW Task Force (Toliara, Madagascar, 3-5 June
2007);
3. The 2nd meeting of the Regional PADH Task Force (Toliara, Madagascar, 3-5 June
2007); and,
4. The 3rd meeting of the Regional Working Group on Water, Sediment and Biota
Quality (Maputo, Mozambique, 19-20 July 2007).
The discussions and decisions from these various stakeholder meetings are documented in the
respective reports of these meetings.
The final step involved a detailed governance analysis which, within the context of the WIO-
LaB Project, was embarked on through the regional legal, policy and institutional review
process undertaken by the Legal and Technical Review Task Force established by the WIO-
LaB Project. More details on this process are presented in Chapter 5.
Review and validation of the TDA
An important step in the development of the TDA involves validation of the results by
respected experts and institutions in the region to provide credence and authenticity to the
process. The principal mechanism for validation of the WIO-LaB TDA report was the
Scientific and Technical Advisory Committee (STAC) established by the Project. The STAC
comprised selected heads of academic and research institutions (or their delegates) as
represented in the Forum for Academic and Research Institutions in the WIO-Region (FARI),
as well as selected independent experts.
As part of the review process, the draft TDA was presented to FARI during a meeting held on
27 November 2008 in Durban, South Africa. During this meeting, the modalities of operation
of the STAC were also agreed upon. Subsequently, members of FARI we requested to
nominate experts to participate in the TDA review process. The selection of 12 STAC
members took place on the basis of review the CVs of nominees by the Chair and Secretariat
of FARI, Nairobi Convention Secretariat and the WIO-LaB PMU. The draft TDA was
subsequently circulated to the members of the STAC in July 2008. A meeting of the STAC,
together with a selected number of representatives of the TTT, took place on 25th and 26th
August 2008. Following updating of the TDA, the second draft TDA was subsequently
circulated for endorsement by the STAC and subsequently put forward for endorsement by
the WIO-LaB Project Steering Committee in May 2009.
UNEP-GEF WIO-LaB Project
10

UNEP-GEF WIO-LaB Project
Addressing Land Based Activities in the Western Indian Ocean
Annex 1
Main contributors to the TDA
Members of the TDA Drafting Team
Prof. Jan Ignacy Glazewski (University of Cape Town, South Africa), Governance Expert
Mr. Akunga Momanyi (Nairobi University, Kenya), Governance Expert
Mr. Jacob Ochiewo (KMFRI, Kenya), Socio-Economic Expert
Dr. Susan Taljaard (CSIR, South Africa), Pollution Expert
Dr. Sixtus Kayombo (UDSM, Tanzania), Pollution Expert
Dr. Salomao Bandeira (UEM, Mozambique), PADH Expert
Dr. James Kairo (KMFRI, Kenya), PADH Expert
Dr, Narriman Jiddawi (IMS, Tanzania)
Mr. Jude Bijoux (SCMRT-MPA, Seychelles)
Dr. Anton Earle (ACWR, South Africa), River Basins Expert
Technical Editor
Dr. Matthew Richmond (SAMAKI Consultants Ltd., Dar es Salaam, Tanzania)
WIO-LaB Project Management Unit
Dr. Peter Scheren, Project Manager
Dr. Johnson Kitheka, Project Scientific Officer
Ms. Angelina Musera, Project Assistant
Members of the Scientific and technical Advisory Committee (STAC)
To be listed
Members of the Water and Sediment Quality Working Group
To be listed
Members of the MWW Task Force
To be listed
Members of the PADH Task Force
To be listed
Members of the Legal and Technical Review Task Force
To be listed
UNEP-GEF WIO-LaB Project
11

United Nations
Global Environment
Environment Programme
Facility
Transboundary Diagnostic Analysis of Land-
based Sources and Activities in the Western
Indian Ocean Region
CHAPTER 2 BIOPHYSICAL SETTING OF THE WIO
REGION
Draft
November 2008
Table of contents
2
Biophysical setting of the WIO region
3
2.1
Physical setting
3
2.1.1 Geographical location and setting
3
2.1.2 Climatic conditions
3
2.1.3 Geology and geomorphology
4
2.1.4 Watersheds, hydrological conditions and estuaries
5
2.1.5 Oceanographic characteristics
14
2.2
Ecological setting
17
2.2.1 Coastal ecosystems and habitats
17
2.2.2 Mangrove forests
20
2.2.3 Seagrass beds
21
2.2.4 Rocky shores and sandy beaches of the WIO region
24
2.2.5 Coastal forests
25
2.2.6 Fisheries ecology
29
2.2.7 Species of special concern
31
2 Biophysical
setting of the WIO region
2.1 Physical
setting
2.1.1 Geographical location and setting
The WIO region has a combined coastline exceeding 15,000 km (including those of the island states)
and a total continental shelf area of about 450,000 km2 (GEO, 2003) as detailed in Table 2-1 and
Figure 1-1. The region is characterized by a wide diversity of habitats including sandy beaches, sand
dunes, coral reefs, estuarine systems, mangroves and seagrass beds. The region also has several major
river basins that drain into the Indian Ocean (Van den Bosche and Bernacsek, 1990; Hatziolos et al.,
1996; Hirji et al., 1996; FAO, 2001; UNEP, 2001). Some of the coastal-marine ecosystems and river
basins are transboundary in nature as they extend across more than one country.
· Table 2-1
Key geographical characteristics of the WIO region Countries
Land area
Coastline
Territorial
Continental
EEZ (million
Countries
(km2)
(km)
waters (km2)
Shelf (km2)
km2)
Comoros 2,230 340
12,684
1,416
0.161
Madagascar 581,540 4,828 124,938 96,653 1.079
Mauritius 2,030 322
16,840
27,373
1.274
Seychelles 450
491
45,411
31,479
1.288
Kenya 569,140
536
12,832
8,460
0.104
Mozambique 784,090
2,470 70,894 73,300
0.493
Somalia 62,734
3,025
68,849
40,392
1.200
South Africa
1,214,470
2,881
74,699
160,938
1.016
Tanzania 883,590 1,424
36,578
17,903 0.204
TOTAL 4,100,274
15,141
463,725
457,914
6.819
Note: Data extracted from the GEO Data Portal (2003)
2.1.2 Climatic conditions
The climate in the WIO region can be characterised as tropical and sub-tropical. Temperatures in the
northern parts range from 24oC-30oC while the hottest summer reaches 34oC, usually recorded in the
months of December through February. In Kenya, the temperature range between summer and winter
is the smallest (range from 25oC to 30oC). In Tanzania and northern Mozambique, the temperature
range between 21oC and 33oC. The relatively lower temperatures, ranging between 4-14oC are usually
experienced in the period June through August in the southern extreme of the region. Temperature
ranges in South Africa for example, are around 27oC in summer with a maximum of 34oC range
during the winter months (AFRISCO 1994; IUCN 2003; FAO 2005), as shown in Figure 2-1.
The prevailing wind regimes in the WIO region can be divided into two distinct systems: the monsoon
regime that dominates the Somali Current Large Marine Ecosystem (SCLME), and the subtropical
high-pressure system that dominates the southern part (the Agulhas Current LME, or ACLME). The
Northeast Monsoon affects the climate of the northwest Indian Ocean from December to April and is
characterized by northeasterly winds over the tropics and northern subtropics. The Northeast
Monsoon has winds of moderate strength, with dry terrestrially-derived air and wind directions from
Arabia to Madagascar. In contrast, during the months of June to October, the Southwest Monsoon
reverses the wind direction and the winds then tend to be much stronger, with an intense wind jet
developing along the high Eastern African highlands (Ethiopian highlands, Kenya highlands,
highlands of northern and southern Tanzania, etc.).
The rainfall patterns in the region decreases northwards from Mozambique (mean annual rainfall in
the range of 530-1,140 mm) to Somalia (250-375 mm) and increasing inland and at higher altitudes
3
(AFRISCO, 1994; IUCN, 2003; FAO, 2005). On average, the island states receive more rainfall than
the mainland states of eastern and southern Africa. For instance, along the west coast of Madagascar,
the mean annual rainfall is in the range of 800 to 1,800 mm while the east coast receives annual
rainfall ranging between 2,500 and 3,500 mm. The mean annual rainfall in Seychelles, Mauritius and
Comoros is in the range of 1,000 2,100 mm. On the other hand, in the coastal regions of continental
states such as South Africa, Mozambique, Tanzania and Kenya, the maximum mean annual rainfall
does not exceed 1,500 mm and in most cases is in the range of 500 to 1,000 mm.
The rainfall seasons in te WIO are strongly influenced by monsoon winds. The northern part of
Mozambique, Tanzania, Kenya and the southern parts of Somalia receives long rains in the period
March through May, before the Southeast Monsoon sets in. In the same region, short rains are
experienced in October through December during the Northeast Monsoon (AFRISCO, 1997; Kitheka
et al., 2004). The islands of the Seychelles receive long rains during the Northeast Monsoon, while
the rainfall pattern in other island states is strongly influenced by the Southeast Monsoon. Because of
its large size, the island of Madagascar experiences climatic conditions similar to mainland Africa.
The volume of river discharge into the Indian Ocean to a certain extent reflects the rainfall patterns in
the region, thus rivers draining high rainfall areas have relatively higher discharges. In the northern
parts of the WIO region (e.g. Somalia and Kenya) the total annual river discharge has been estimated
to be in the range 1.8 - 4.95 km3/yr. In the central and southern parts (e.g. Tanzania, Mozambique and
South Africa) the annual river discharge is in the range of 2.9 - 106 km3 (Hatziolos et al., 1996; Hirji
et al., 1996; FAO, 2001; UNEP, 2001). Consequently, the southern parts of the WIO region (in
particular Mozambique) are characterized by the presence of large estuarine zones supporting
extensive mangrove forests.
· Figure 2-1
Climatology map for the WIO region [TO BE PROVIDED]
2.1.3 Geology and geomorphology
In terms of its geological structure, the coastline of eastern Africa represents a passive continental
margin, from which through geological time, continental fragments have separated and migrated
across the adjoining oceanic crust, of what is now the Indian Ocean (Kairu and Nyandwi, 2000). This
200-million-years process is reflected today in the heterogeneity of the geological formations in WIO.
The coastal sediments of Tanzania, Kenya and Mozambique for instance, vary in age from Jurassic
through Cretaceous to Tertiary and Quaternary; and are composed of both marine and terrestrial
sedimentary rocks (see Kent et al., 1971). Some of the detached continental fragments are those
granitic islands of the main Seychelles group and the island of Madagascar (see Fig. 2.2). The more
recent outer islands of the Seychelles archipelago (e.g. Aldabra, Cosmoledo), and the islands of
Réunion, Comoros, Mauritius and Rodrigues are essentially of volcanic origin.
This structural history has left the mainland states with generally narrow continental shelves
(Ngusaru, 2002), with exceptions being central parts of the coasts of Mozambique and central
Tanzania in the vicinity of Unguja and Mafia islands. Similar wide continental shelves exist along
western Madagascar and most of the Seychelles Bank (Kairu and Nyandwi, 2000).
Pleistocene coral limestone overlays older rocks along much of the mainland coastline and on some of
the islands, in places forming extensive coastal terraces, cliffs, and fringing intertidal platforms
(Arthurton, 1992). The intertidal platforms, eroded from Pleistocene limestone cliffs, dominate the
coastal geomorphology in much of the region, extending seawards generally from 100 to 2,000
meters, their seaward edges forming reef crests, and the ocean swell breaker zone. Terraces and
platforms alike are incised by major creeks draining the hinterland, as at Dar es Salaam and
4
Mombasa. Holocene and Recent beach ridge and bar deposits overlie the platform rocks in many
places.
The WIO region harbors a variety of submerged geomorphological features, including abyssal plains,
basins, mid-ocean ridges, seamounts and ocean trenches. Some of the deep ocean trenches range from
6,000 to 7,000 meters in depth. Continental shelves in the region tend to be narrow in the north, along
the Somali coast, and gradually widen further to the south. The average depth of these shelves range
from 200-300 meters. The region has a number of key geographic features, which influence the
biological and physicochemical environment including the Mascarene Plateau.
The Mascarene Plateau is one of the most notable physical influences behind climatological and
oceanographic boundary changes in the WIO. It extends as a fault-composite arc for 2,300 kilometers
from the Equator southward, with water depths mostly ranging from 8-150 meters. As such, this mid-
oceanic geographical feature interrupts the westward flow of the South Equatorial Current and
consequently determines the fluxes of water, nutrients and biogeochemical constituents the essential
controls on ocean and shallow-sea productivity and ecosystem health (see Gallienne and Smythe-
Wright, 2005; New et al., 2005). The Plateau extends from the Seychelles in the north to Réunion in
the south and covers an area of approximately 115,000 km2. In addition to the two Large Marine
Ecosystems (LMEs) of the WIO region mentioned above, the ACLME and SCLME, the entire marine
zone around the Mascarene Plateau might also be considered to be a large marine ecosystem.
· Figure 2-2
Geology of the WIO region [TO BE PROVIDED]
2.1.4 Watersheds, hydrological conditions and estuaries
Within the WIO region there are 12 main river basins, including the largest of Madagascar. A ap of
the main river basins in the WIO region is presented in Figure 2-3. Table 2-2 furthermore provides an
overview of the size of the river basins, length of the main stem of the river, mean annual
precipitation (MAP) and mean annual runoff (MAR), the months of the highest and the lowest flows
respectively, as well as the sediment load transported to the river mouth. As can be seen there is
considerable spatial variation in all of these factors. Not shown is the fact that in most of the basins
there is also considerable temporal variation in variables such as rainfall, runoff and sediment
transport. Very few years can be considered 'average', the norm being variability and change.
5
· Table 2-2
Overview of the main rivers in the WIO region
River and
Area (km2)
Length
MAP1
MAR2
Ave flow Highest
Lowest
Sediment
countries
(km)
(mm)
(mm)
(mm3/y)
flow
flow
Load (mil.
month
Month
t/yr)
Tana
126,828 a
1,102 b 566
a,c 38
a 7,200
d May
d
Aug d 6.8
a
Athi-
69,930 e
650 g 585
a 35
h
2,302 a
April f Sept
i,f 5.7
a
Sabaki
66,800 f
1,539 f
7.5-14.3 i, j
Pangani
43,650 k 432 k 1,079
k, l 20
m 850 m
May m
Sept m No
data
Rufiji
177,000
±600
1,000
No data 35,000 n
April p,o Nov p,o 16.5
n ; 15-
30,000 o
25 o; 17 q
Ruvumaz
155,400 p,r
800 p,s 1,160 s 96 t
28,000 t, u Feb t
Aug t
No data
Zambezi
1,300,000 s
2,650 s 1,000
x 67 t
106,000 t Feb t
Sept t
43 q
1,200,000 t
190 v
22 v
Pungwe
31,000 w
395 w 1,100 w 115 t
6,600 t
Feb w Oct
w No
data
29,500 t
Limpopo
415,500 y
1,750 z 530
iv 13 t
5,200 t
Feb z
Sep z
10 z
412,000 t
34 q
Incomati
46,800 ii, iii
480 s
736 ii
46 t
3,587 ii Feb
v
Sep v
7 ii
Maputo
28,500 t
380 t
630 t
102 t
2,900 t
Feb t
Sept t
Thukela
30,000 vi 405
viii 840 vii 133
vii 3,800
vi
Feb vii Sept
vii 9.3 vi
4,600 viii
10.5 q
Betsiboka
49,000 ix
525 ix
Feb x Sept
x
Sources: a. Kitheka et al., 2004a; b. Kitheka, et al., 2003; c. GOK, 1979; d. Kitheka et al., 2004b; e. Kitheka et al., 2004d; f. Fleitmann et
al., 2007; g. UNEP, 1998; h. Kitheka et al., 2004c; i. van Katwijk et al., 1993; j. Watermeyer et al., 1981; k. PBWO/IUCN, 2007; l. Røhr
et al., 2002; m. PBWO/IUCN, 2006a; n. Temple & Sundborg, 1973; o. Shaghude, 2004 citing Euroconsult, 1980; p. Anon Tanzania, 2006;
q. Arthurton et al., 2002; r. GoT, 2006; s. Pallet, 1997; t. DNA, 1994; u. Kaponda, 2005; v. Hirji et al., 2002 ; w. Van der Zaag, 2000; x.
FAO, 1997; y. CP, 2004; z. Louw & Gichuki, 2003; ii. TPTC, 2001; iii. Hoguane, 2007; iv. UNEP, 2005; v. (Van der Zaag & Carmo Vaz,
2003; vi. DWAF, 2004a; vii. DWAF, 2004b; viii. Forbes et al., 2002 ; ix. Shahin, 2003; x. IWMI, 2006.
The freshwater flows from the various rivers have a profound effect on the marine ecosystems in the
region, driving various ecological processes and providing nutrients for the development of species
(Kairu and Nyandwi, 2000; Crossland et al., 2005). Major rivers from the central highlands, the
Maputo, Incomati, Limpopo, Save, Tana, Athi-Sabaki, Rufiji, Zambezi and Ruvuma discharge large
volumes of siliclastic sediment to the sea (Kairu and Nyandwi, 2000).
Of significance for this study is the zone of interaction between the freshwater and the saltwater
ecosystems - the estuaries. According to the South African National Water Act (No. 36 of 1998)
estuaries can be defined as "a partially or fully enclosed body of water, which is open to the sea
permanently or periodically; and within which the sea water can be diluted, to an extent that is
measurable, with freshwater drained from land" (RSA, 1998). According to the DWAF (South Africa)
report "Methodology for the Determination of the Ecological Water Requirements for Estuaries" the
patterns of river inflows to estuaries show strong correlation with important hydrodynamic and
sediment characteristics, such as state of the mouth, amplitude of tidal variation, water circulation
patterns and sediment deposition/erosion. However, the relationships between these characteristics
and river inflow are generally complicated to interpret, owing to the influence of the sea, i.e. state of
the tide and associated seawater intrusion. The manner in which these characteristics are influenced
by river flows is often not the result of a single flow event, but rather that of characteristic flow
patterns occurring over weeks or months. In estuaries there is also a much larger buffer or delay-
effect between river inflow patterns and their effect on abiotic parameters than in rivers (DWAF,
2004c).
1 MAP: Mean Annual Precipitation
2 MAR: Mean annual Runoff
6
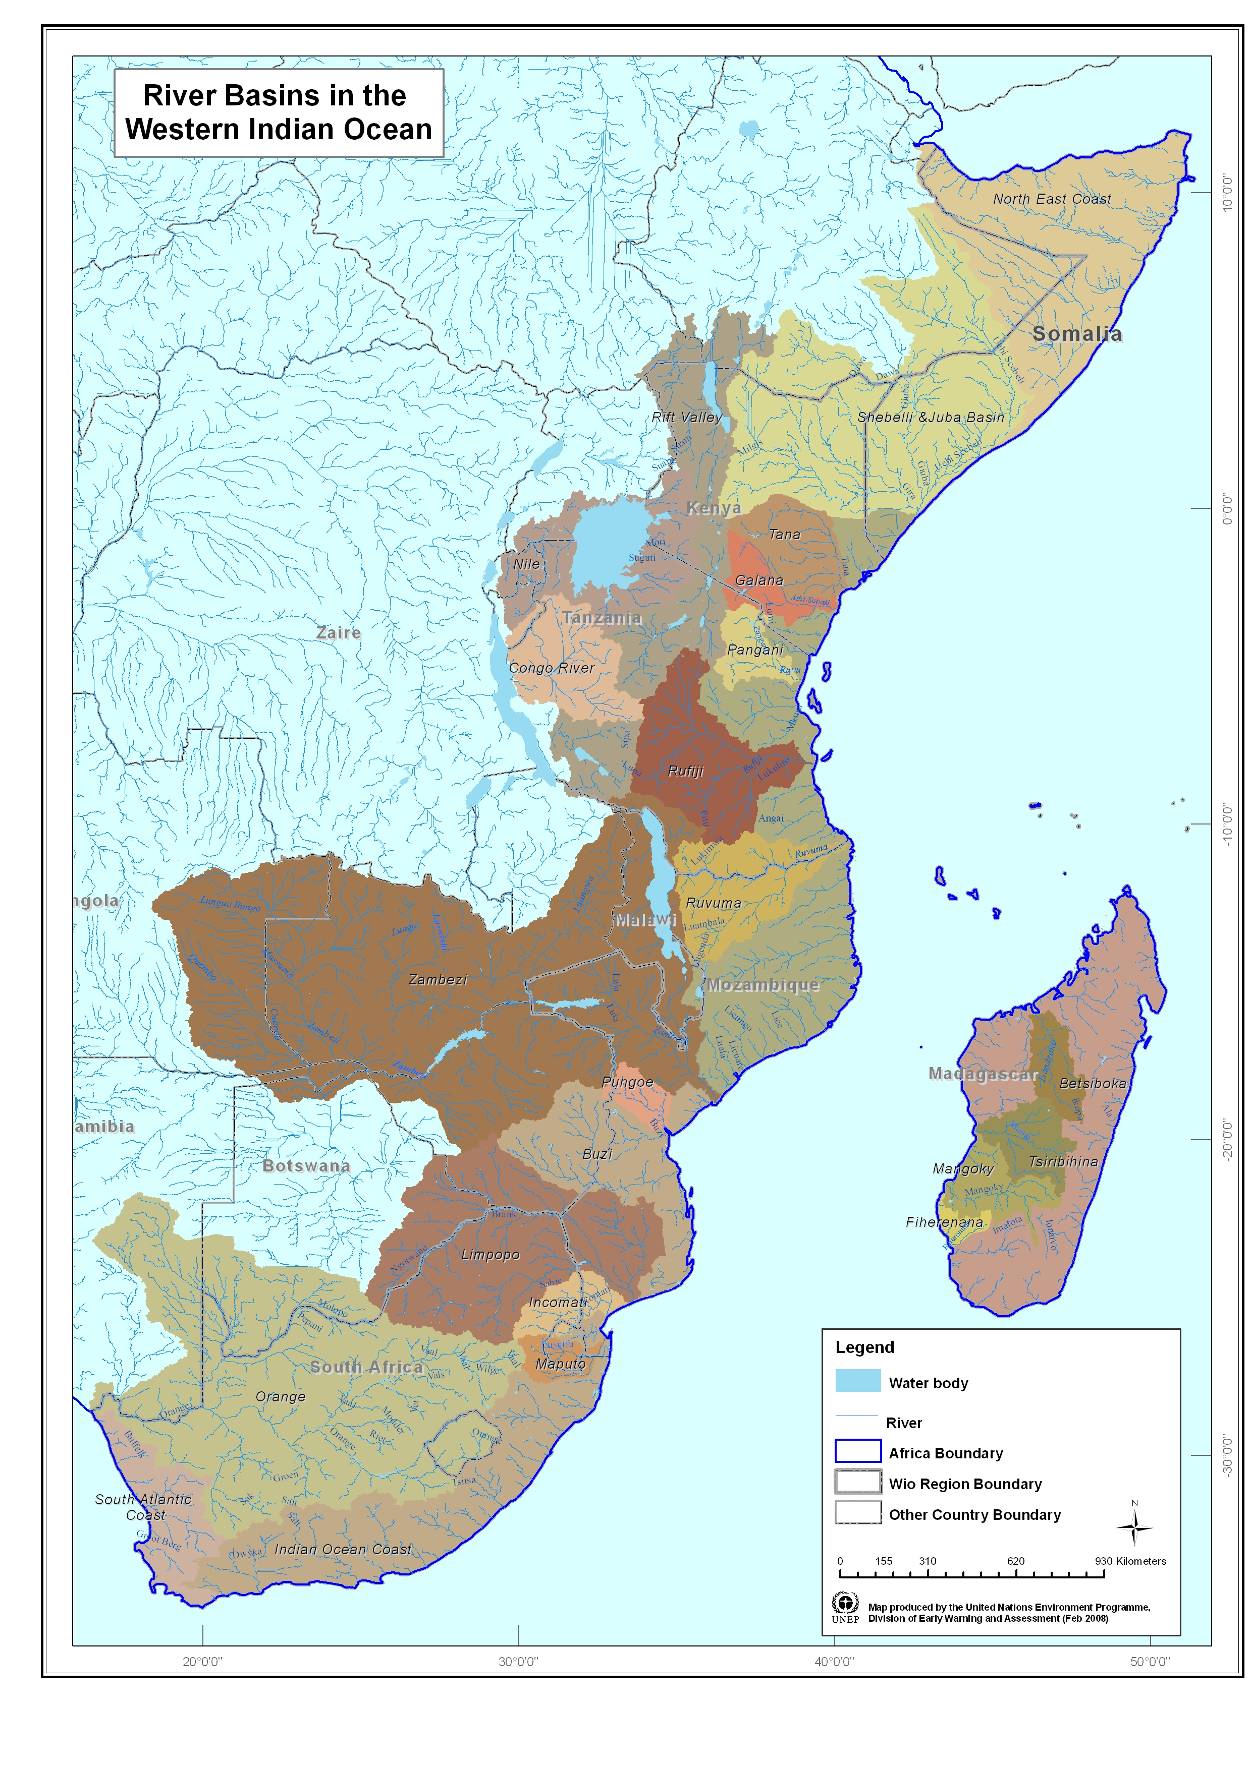
· Figure 2-3
Map of the main river basins in the WIO
7
Many of the rivers terminate with important estuaries or deltas that serve as habitat and rich breeding
grounds for various species of fish, crustaceans and other marine life. Table 2-3 provides an overview
of the main estuaries and deltas in the WIO region and lists key facts about each estuary depending
on the available data and information, as well as listing some of the key ecological functions.
It should be noted that several of the estuaries in the WIO region are already experiencing stress due
to land-based activities upstream and are thus less able to provide the ecosystem services upon which
communities depend (Arthurton et al., 2002; UNEP, 2006a). In addition to climatic variability and/or
change, the principle drivers of environmental change in basins in the region include agricultural
development, urbanisation, deforestation, river damming and industrialisation (Crossland et al., 2005;
UNEP, 2006b).
The small, island nations of Comoros, Seychelles and those in the Mascarene Group (Mauritius,
Réunion) have very small, usually seasonal rivers, of low volume and flow rates. These are not
described further, whereas the countries with significant river basins are the focus of the remainder of
this section.
Kenya - The two river basins included in this study are the Tana and Athi-Sabaki. Both are medium-
sized basins, seasonally flushed by rainfall mainly occurring during the transitions between the
Northeast and Southeast monsoons (Kitheka et al., 2004; Crossland, 2005). Both these river basins
have experienced impacts due to diversions and changes in land use (UNEP, 2006b), as they originate
in the highly populated and heavily cultivated Central Kenyan highlands (Kitheka et al., 2004;
Dominik et al., 2007; WRI, 2007). Hydropower generated by dams in the Upper Tana Basin is the
principle source of electricity for the country (WRI, 2007), but dam construction has had a major
influence on the river's downstream flow and physical characteristics, most notably through
regulating water flow and decreasing the frequency and magnitude of flooding (IUCN, 2003; UNEP,
2006a).
· Table 2-3
Summary of the features of the main estuaries and deltas of the WIO region
River
Key facts
Key ecological functions
Athi-Sabaki The estuary at Malindi is small and narrow (0.58 Habitat and nursery ground for shrimps and
km2 and 2.5 km long), shallow, with an average
feeding ground for birds, (UNEP, 1998 and
depth of 2 m (Kitheka, 2004a) and a small
Kitheka, 2004a). Plays an important role is
section is colonised by mangroves and associated the sustaining the productivity of Ungwana
plans. Accretion is associated with the deposition Bay (see above).
of high sediment load.
Betsiboka
The estuary is large, but shallow; highly braided
Mangroves acts as nursery and feeding
and experiences significant tidal incursions
grounds for shrimp, crab and finfish
during spring tide. Accretion exists associated
(Shahin, 2003). Also, a source of materials
with heavy deposition of sediments. Mangroves
to the local communities.
cover 420 km2 (IWMI, 2006)
Incomati
The estuary is of limited spatial extent, but with
Mangroves acts as breeding ground for fish
significant sea water intrusion. There are 5,000
and shrimp and provide materials to local
ha of mangroves. Lower parts of the estuary are
communities.
eroding.
Limpopo
Limpopo estuary is small, about 6 km in length
Breeding ground for fish and shrimp,
(Louw and Gichuki, 2003).
provides materials to local communities and
has some mangroves (Louw and Gichuki,
2003).
Maputo
Maputo Bay extends for 70,000 ha (Hoguane et
Has a large mangrove forest and is
al., 2002).
important in terms of fisheries. It acts as
shrimp breeding grounds (Hoguane et al.,
2002; Arthurton, 2002).
Pangani
The estuary is about 3 km2. Due to reduction in
Contains 753 ha of mangroves (Kijazi,
8
River
Key facts
Key ecological functions
sediment load, the estuary is eroding. There is
2002). Also important for fishing (crabs and
also a large fringing mangrove forest.
prawns) (PBWO/IUCN, 2007).
Pungwe
The estuary is located 20 km north-west of the
Aquaculture, targeting prawns and
city of Beira (Van der Zaag, 2000).
prevention of salt-water intrusion into
Beira's freshwater supply intake (Van der
Zaag, 2000).
Rufiji
Large delta area (65 km across, 23 km long and
Mangroves (largest estuarine forest in East
1,200 km2 in size) with 53,000 ha of mangroves
Africa), fishing and aquaculture (Mwalyosi,
(Richmond et al., 2002; Shaghude, 2004).
2004; Shaghude, 2004).
Ruvuma
Northern portion of 650 km2 estuary been
Mangroves, seagrass beds, breeding ground
declared a marine park - Mnazi Bay-Ruvuma
for fish and shrimp (Francis et al., 2002;
Estuary Marine Park (Lerise, 2006).
Richmond and Mohamed, 2005).
Tana
Tana Delta consists of several estuaries such as
Large mangrove forests acts as an important
Kipini (of 27 km2), Mto Kilifi, Mto Moni and
habitat and nursery ground for juvenile fish
Mto Tana. The estuaries extend up to 10 km from and shrimps (Munga et al., 2006). Plays an
the ocean and are relatively deep with mean
important role is the sustaining the
depth of about 5 m. Accretion is limited and
productivity of Ungwana Bay (Kenya's
some sections of the delta are already eroding.
most productive coastal fishing ground).
The delta is colonized by mangroves (4,100 ha)
and associated plants.
Thukela
0.6 km² size during low flows (DWAF, 2004b);
Extensive areas of mud-flats interspersed
estimated axial length of 800 m and shore line
with submerged aeolianite reef provides
length of 2 km during low flow; maximum width significant fishing ground and is the only
during low flow is 350 m with channel width of
shallow water penaied prawn trawling
50 m, increasing to over 1,000 m during floods
ground in South Africa (Forbes et al., 2002).
(DWAF, 2004b)
Zambezi
The delta is about 100 km long and 120 km wide Mangroves, breeding ground for fish and
at the coast, covering 15,000 km2 (Pallet, 1997;
shrimp (ZRA, 1998; Masundire and
ZRA, 1998; Chenje, 2000) or 1.4 million ha
Mackay, 2002). Provides materials to local
(Turpie, 2006).
communities.
9
The Tana River Delta consists of four main estuaries Kipini, Mto Kilifi, Mto Tana and Mto Moni
(Kitheka et al., 2003; Kitheka et al., 2004). It is Kenya's only major ocean delta (UNEP, 1998) that
receives flow from the Tana River. The annual sediment load is currently estimated to be 6.8 x 10⁶
tonnes year-1 (Kitheka et al., 2004) which is lower than the estimated sediment load before the
construction of dams in the Upper Tana Basin. The estuaries support artisanal and industrial fishers,
estimated to support around 50,000 people in 1991 (IUCN, 2003). However, construction of HEP
dams in the Upper Tana Basin has led to some changes in the flow patterns of the river in the lower
Tana Basin. There has been a reduction in the surface area and longevity of flood-supported riverine
forests, wetlands and mangrove areas, as well as diminishing fish populations and diversity in the
main river channel. It is thought that additional dam construction will rapidly exacerbate this decline
in fishing area and catch (Turpie, 2006). A controversial sugar cane project that will utilse several
thousand acres is being promoted by Nairobi-based business investors.
The Athi-Sabaki River comprises the second longest and the fourth largest catchment in Kenya, with
an area that includes large urban centres such as Nairobi (UNEP, 1998; Kitheka et al., 2004d).
Urbanisation in the headwaters region has led to reduced infiltration of rainfall causing rapid, but
short-lived, high flows and much reduced base flow (van Katwijk et al., 1993; Snoussi et al., 2004).
There are two main tributaries, namely the Tsavo and Athi rivers, which join to form the Sabaki
River. The Athi River drains the lower parts of the Central Highlands of Kenya, including Nairobi,
while the Tsavo receives flow from the slopes of Mount Kilimanjaro (Kitheka et al., 2004a). The
flow, terminating in the Indian Ocean north of Malindi, displays great seasonal as well as inter-annual
variability (Kitheka et al., 2004d). To-date there is no dam on the river (Snoussi et al., 2004),
however, major land-use changes within the basin combined with climatic variability have already
affected the flow of the river.
Malindi Bay is where the Athi-Sabaki River flows into the Indian Ocean, via the Sabaki estuary
(Kitheka et al., 2004a). Although not a large estuary, it is nonetheless important in terms of the
biodiversity and productivity of Malindi-Ungwana Bay which supports both artisanal and industrial
fishing targeting prawns ((UNEP, 1998).. However, the estuary has experienced a large increase in
sediment load, from an estimated 58,000 tonnes in 1960s to the sediment load that ranged between 7.5
and 14.3 million tonnes in the 1980s (Watermeyer et al., 1981; van Katwijk et al., 1993). However,
recent studies by Kitheka et al., (2004) have estimated the annual total sediment load for the Sabaki
River to be 4 million tonnes. These differences are a demonstration of high variability of the sediment
load of the Athi-Sabaki River that is partly governed by the rainfall patterns in the river basin.
Rainfall variability affects river flow and hence the river capacity to transport sediments. The relative
general increase in sediment load has had a negative impact on coral reef ecosystem at Malindi Bay
particularly at Malindi Marine National Park and Watamu Marine Reserve (van Katwijk et al., 1993;
Fleitmann et al., 2007). One positive impact of the sediment accretion in the estuary has been an
increase in the area colonised by mangroves in the Sabaki Estuary (Kitheka, 2004a).
Madagascar - The Betsiboka River is one of the largest river systems in Madagascar, originating near
Falaise de l'Angavo at 1,755 meter altitude (Shahin, 2003) and is navigable for about 140 kilometers
upstream making it important for shipping and local transport. It flows to the northwest and empties
into Bombetoka Bay forming a large delta. Major tributaries are the Mahajamba, Isandrano and Ikopa
rivers. A floodplain is developed in the lower course containing some 150 small lakes (IWMI, 2006),
including Amparihibe-South (12.5 km2), Ambania (9.1 km2), Amboromalandy (6.6 km2) and
Bondrony and Matsiabe (5.0 km2 combined). The total area of the lakes is 80 km2. The Ikopa tributary
basin has large dams at Mantasoa and Tsiazompaniry.
The Betsiboka River estuary is one of the largest and most important in Madagascar, with waters
distinct for their red colour caused by sediments emanating from highly eroded/degraded catchment
areas associated with high rates of soil erosion, reaching up to 250 tonnes per hectare (IWMI, 2006).
Mozambique - The Zambezi River basin is the fourth largest in Africa after the Congo, Nile and the
Niger. The River rises from the Kalene Hills in the North Western Province of Zambia and flows
10
south and then eastwards for some 2,650 kilometers to the Indian Ocean. The Zambezi River is an
exemplary transboundary river system since before discharging into the Indian Ocean, it flows
through nine riparian states, namely Angola, Botswana, Democratic Republic of Congo (DRC),
Malawi, Namibia, Tanzania, Zambia, Zimbabwe and Mozambique. The main stem of the river forms
the southern border of Zambia with Namibia, Botswana and Zimbabwe, before flowing through
Mozambique, where it discharges into the Indian Ocean. One of the largest tributaries of the Zambezi,
the Shire River, forms the outflow of Lake Nyassa (Malawi), shared by Malawi, Mozambique and
Tanzania (Pallet, 1997). There is no doubt that water resource developments have improved the
economy of the riparian states. However, the construction and operations of large HEP dams, such as
the Kariba and Cahora Bassa dams, have had environmental impacts downstream (Beilfuss, 1999).
The proposals for the development of these dams did not seriously consider environmental impacts
(Brown and King, 2002), as a result, adverse impacts of the dams were not effectively mitigated
against and now include reduction in terrigenous sediment loads of the two rivers (thus increasing its
scouring effect downstream), changes to the riverine habitats and flora due to reduced natural
variability of stream-flow and destruction of estuarine habitat (Hirji et al., 2002).
The Zambezi River provides important functions in sustaining and maintaining the productivity of
aquatic fauna and fisheries in the Indian Ocean waters directly off the Delta, through the transport of
vital nutrients downstream which are discharged into the sea (ZRA, 1998; Brown and King, 2002).
The coastal geography and the pattern of oceanic currents combine to restrict the availability of
nutrients to the near-shore marine environment along this stretch of the eastern Africa coastline. Since
the construction of the Cahora-Bassa dam in Mozambique, the flow regime at the delta has become
much more constant with higher low flows and lower high flows, with very few years of floods
(Brown and King, 2002). This has had a negative impact on fisheries, prawn catch and mangrove
forests in Mozambique (ZRA, 1998; Hirji et al., 2002). The floodplain areas of the Delta have shrunk
and the drop in sediment load has led to accelerated coastal erosion and incision of the channel
(Brown and King, 2002). Studies carried out by Hoguane (2002) show that the northern part of the
estuary, Chinde outlet, is eroding by an average of 22 m yr-1, while accretion is taking place at the
southern outlet of Ponta Liberal at a rate of 58 m yr-1 (Anon Mozambique, 2006).
The Pungwe River originates on the Zimbabwe Highveld (Inyangani Mountain system) at an altitude
of more than 1,000 meters, then travels 395 kilometers eastwards into the Indian Ocean (van der Zaag,
2000). In the north and eastern part of the basin the climate can be described as tropical savannah,
while the rest is characterised by humid temperate climate. The river enters the Indian Ocean through
Mozambique at an estuary located some 20 kilometers northeast of the city of Beira, at Bué Maria.
Up-country, although there is no dam on the main stem of the river, a water pipeline transfers 22
million m3 per year (60,273 m3 per day) of water from the Pungwe River to the Odzani catchment (a
part of the Save River basin) to augment the water supply for the town of Mutare in Zimbabwe (Van
der Zaag, 2000).
The estuary of the Pungwe River and its discharge has critical environmental implications (Van der
Zaag, 2000) by holding back seawater intrusion into the estuary, crucial for Beira's freshwater supply.
The 10 % low flow (i.e. the flow with a 10 % chance of occurring; with a return period of 10 years) at
Bué Maria has been established at 8.8 m3 s-1 (Van der Zaag, 2000 citing Zanting et al., 1994). A flow
of 10 m3 s-1 is considered the minimum flow to safeguard the intake of freshwater for Beira (Van der
Zaag, 2000). The large amount of sediment released by the river also has the effect of reducing coastal
erosion in the area (Anon Mozambique, 2006).
The Limpopo River drains Botswana, South Africa and Zimbabwe, some of the economically most
developed economies in the region, and flows into the Indian Ocean at the city of Xai-Xai in
Mozambique (UNEP, 2005). The river experiences high streamflow variability characterised by
flooding after intense rainfall and extreme low flows during periods of severe droughts. This creates
great hardship for rural communities that rely on rain-fed subsistence agriculture (Ashton et al.,
2001). In Mozambique, three important tributaries join the Limpopo River: the Nuanedzi River in the
north of the basin (rising entirely in Zimbabwe) and joining the Limpopo after flowing for about 60
11
kilometers through Mozambique; the Changane River (rising close to the Zimbabwe border) joining
the Limpopo close to its mouth on the coast near to Xai-Xai town (SARDC, 2003); and the Elephants
River joining the Limpopo after the Massingir Reservoir (Louw and Gichuki, 2003). Two important
water resource of the Limpopo River basin within Mozambique are the wetlands, typically supporting
swamp ecosystems along the rivers, for example, downstream of the confluence of Limpopo River
with the Elephant River, and riverine floodplains extending along the Limpopo River near its
approaches to the confluence with the Changane River (Brito et al., 2003). Although no large dams
exist on the main stem of the river (the Massingir Dam being on the Elephants River tributary) the
water resources of the basin are heavily utilised, maily through direct abstraction (UNEP, 2005). The
basin supports large urban settlements such as Francistown, Gaborone, Pretoria (parts of), Polokwane
and Johannesburg all contributing a heavy pollution load to the river (Earle et al., 2006).
Although the Limpopo River estuary is comparatively small, it plays an important role in supporting
fisheries and providing a breeding ground for shrimp (Louw and Gichuki, 2003). Sea water intrusion
into the river is regularly measured up to 55 km upstream and up to 80 km during droughts (Anon
Mozambique, 2006). The estuary is associated with between 40,000 and 60,000 hectares of floodplain
directly upstream, extensively cultivated by local farmers (Louw and Gichuki, 2003).
The Incomati River is shared by South Africa, Swaziland and Mozambique and its six tributaries
support a large variety of ecosystems, including important conservation areas such as the Kruger
National Park. The Incomati's water resources are highly developed but water demand is continuously
increasing so that the water available is not sufficient to meet demand (Hoguane, 2007). Population
growth and urban and industrial development negatively affect the river basin, as the demand for land and
water increases (van der Zaag and Carmo Vaz, 2003). Consequently, water quality has deteriorated
(Hoguane, 2007) and upstream impoundments and abstractions have changed the flow regime with
negative effects for the estuarine ecosystem, while mangroves in the estuary area are affected by
harvesting for construction, charcoal and firewood (Van der Zaag and Carmo Vaz, 2003). The
The estuary zone of the Incomati River extends from approximately Manhiça to where the River
discharges into the Indian Ocean at Marracuene (Noble and Hemens, 1978). The estuary comprises
several inter-linked habitats including a long narrow peninsula (the Macaneta Peninsula) and a series
of inter-riverine islands (TPTC, 2001). The estuary ecosystems are important sanctuaries for breeding
colonies of aquatic birds, as well as playing a variety of roles such as purifying water, ameliorating
flood damage and supplying water to local communities (TPTC, 2001).
The Maputo River has two principal tributaries, namely the Usutu and the Pongola. Most of the area
of the Usutu River lies in Swaziland and that drained by the Pongola River in South Africa. Within
Mozambique, the river passes through the Libombos Range and there takes a northerly course until it
discharges into Maputo Bay and the Indian Ocean. Although the Maputo River basin is small in terms
of size as well as discharge, along with the Incomati River, it is one of the two largest rivers flowing
into Maputo Bay (DNA, 1994).
Maputo Bay supports one of Mozambique's most important fisheries (Arthurton et al., 2002; Anon
Mozambique, 2006). The estuary and the adjacent mangrove forests serve as nursery grounds for
fisheries which sustain a considerable proportion of the local population and fishing industry,
contributing approximately 20 % of the overall shrimp catch of Maputo Bay (Anon, 2001). The high
productivity of the Bay depends largely on the freshwater input from the Maputo River and the Incomati
(see above) (Hoguane, 2007). However, this fishery is considered an environmental "hot spot" due to
its continued degradation (Hoguane et al., 2002), including the estuary's mangrove areas which have
been significantly reduced by harvesting, particularly on Benguelene Island. Since 1996, a ban on
mangrove harvesting on the island has been enforced (TPTC, 2001). Nevertheless, Maputo Bay is
experiencing increasing stress from pollution, emanating from agricultural return flows, industrial
waste and urban sewerage (Hoguane et al., 2002).
12
Mozambique - Tanzania The Ruvuma River (Rovuma in Mozambique) forms the border between
Tanzania and Mozambique for the final 650 km of its journey to the Indian Ocean (Pallet, 1997). A
small part of the catchment is in Malawi around 470 km2. After rising in the Matogoro Mountains in
southeast Tanzania, the river flows across the Makonde Plateau before dropping to the coastal plain
(DNA, 1994; Anon Tanzania, 2006; GoT, 2006). The river basin includes ecologically important
areas such as the Nyassa Nature Reserve and the Quirimbas National Park, both in northern
Mozambique.
At the point where the Ruvuma River flows into the Indian Ocean is the Ruvuma estuary - famous for
its beaches, mangrove and other tropical coastal marine resources. The estuary is shared between
Tanzania and Mozambique within the Mtwara Region and Cabo Delgado Province, respectively
(Lerise, 2006). The estuary dominates the middle part of the Tanzania Mozambique border coastline.
In general, the coastline is made up of a stable basement with deep sheltered bay with the potential for
fishing and sea sports. The coastline of Mtwara Region and Cabo Delgado province extends for about
200 km, the estuary coves 15 % of the coastline (Lerise, 2006). The Mnazi Bay-Ruvuma Estuary
Marine Park (MBREMP) is on the Tanzanian side while the Qurimbas National Park is found on the
Mozambique side. There are plans to link up these two marine reserves providing a contiguous
protected habitat (Anon Tanzania, 2006). The estuary has a large mangrove forest as well as important
stretches of seagrass beds (Francis et al., 2002; Richmond and Mohamed, 2005).
Tanzania - The Pangani River basin is a transboundary river basin shared by Kenya and Tanzania,
with Ruvu, Weruweru, Kikuletwa, Rau and Kikafu rivers being the main tributaries. Much of the
basin covers Tanzania, with the headwaters of the Pangani River located in the Kilimanjaro and Meru
mountains (both in Tanzania), fed by cloud-forest precipitation and snowmelt from the glaciers
respectively (PBWO/IUCN, 2007; Hamerlynck et al., 2008.). The name Pangani is assumed after the
confluence of Kikuletwa and Ruvu at Nyumba ya Mungu dam. The river then flows in the dry plains
through the extensive Kirua swamps and is joined by the Mkomazi at Korogwe and then Luengera
before passing the Pangani Falls into the Indian Ocean (Akitanda, 2002).
The Pangani River flows into the Indian Ocean just south of Pangani town through the Pangani
estuary (PBWO/IUCN, 2007). Fishing is an important activity in the estuary, particularly for crabs
and prawns (PBWO/IUCN, 2007). Local inhabitants also harvest aquatic plants such as reeds, sedges,
mangroves and medicinal plants for household use or sale (Kijazi, 2002). In the Pangani Basin Water
Office (PBWO) State of the Basin Report the estuary is described as being in a "poor condition"
(PBWO/IUCN, 2007). It has far fewer fish, birds and other animal species than comparable systems
in Tanzania. Sea water is intruding further upstream as river flows weaken through upstream
abstractions; this is eroding banks and affecting agriculture. Pollutants associated with decomposing
plants and fine silt from cultivated land, brought in by the river, are creating oxygen levels so low for
much of the year that most fish and other aquatic animals cannot survive there. A once-abundant
fishery is now seriously depleted (PBWO/IUCN, 2007).
Umba River basin is another transboundary river basin shared between Kenya and Tanzania. The
Umba River drains northeast and crosses the Tanzania-Kenya boarder before it enters the Indian
Ocean through a huge mangrove system at Vanga in southern Kenya. The river has its main
catchment area located in the Usambara Mountains of northeast Tanzania. The flow of Umba River is
characterised by high seasonal variability, attributed to changes in land-use (cultivation, deforestation,
etc), and climatic variability within its upper catchment areas.
Tanzania's larges river basin is the Rufiji, comprised of three sub-basins - Great Ruaha, the Little
Ruaha and the Kilombero. The Great Ruaha originates from the Paroto Mountains and Njombe
highlands, where numerous rivers flow into the Usangu Plains and the vast Utengule swamps. It then
traverses the Great Ruaha National Park plains and latter joins with the Little Ruaha before joining the
Kisigo River at Mtera. After Mtera, it joins with the Kilombero River system in the Kilombero Plains
before joining the Rufiji River upstream of Stiegler's Gorge the site of a proposed new hydro-power
dam (Richmond et al., 2002). At present, the river is not dammed, but its resources are used via direct
13
abstraction and in-flow uses such as fishing (Shaghude, 2004). From Stiegler's gorge the river flows
another 180 km across the floodplain and into the Rufiji delta flowing into the Indian Ocean
opposite Mafia Island (Anon Tanzania, 2006). Sediments carried by the river have resulted in
accretion, causing a shift in the shoreline seaward by about 15 km (Mwalyosi, 2004). Another
important feature of the lower Rufiji floodplain is the presence of a permanent lake system. There are
altogether 13 permanent lakes on the flood plain (Shaghude, 2004 citing Hogan et al., 1999).
The Rufiji Delta is characterised by the presence of a huge expanse of mangrove forests (about 50
square kilometers) that plays an important role in supporting productivity of the coastal fisheries. It is
formed through the splitting of the river into seven main distributary channels, interwoven by small
channels (Shaghude, 2004 citing Kajia, 2000). The Rufiji Delta estuarine mangrove forests constitute
around 46 percent of the total mangrove coverage in Tanzania and support an extensive marine food
web (Mwalyosi, 2004). The estuary serves as a nursery ground for shrimps, supporting a
commercially important fishing industry around 80 percent of Tanzania's prawn catch comes from the
Rufiji delta and the area to its north (Mwalyosi, 2004). Studies have shown the shrimp catch to be
closely related to the extent of intertidal vegetation (particularly mangroves) and freshwater flows in
the estuary (Mwalyosi, 2004 citing Turner, 1977). The Delta is in a constant state of flux with the
present trend being an increase in water flowing to the northern channels and a decrease to the south
(Richmond et al., 2002; Mwalyosi, 2004). This dynamic system is driven by changes in river flow and
sediment load, with the forces of erosion and accretion coming into play. A change to this balance,
such as through the construction of a dam upstream, could have potential negative impacts on the
Delta ecosystems (Mwalyosi, 2004).
South Africa - The Thukela River catchment has one of the steepest gradients in the world, extending
from sea-level to the Drakensberg Plateau at an altitude of about 2,000 meters (with peaks over 3,000
meters), within a distance of 180 kilometers from the coast (Forbes et al., 2002). Rainfall in the
catchment is erratic and years of prolonged drought in the central and lower catchment alternate with
very wet periods. The main economic activities in the Thukela catchment are manufacturing, trade,
transport and agriculture, the latter an important source of livelihood, both in the form of commercial
as well as of subsistence agriculture (DWAF, 2004a). Most of the Thukela River system is
comparatively undeveloped there are, however, some dams in the upper catchment and
infrastructure for four inter-basin transfers of water out of the basin (DWAF, 2004). The feasibility of
the development of the Thukela Water Project, consisting of two large dams, has been positively
assessed, but no decision regarding construction has been made.
The frequent turbid conditions associated with the output of the Thukela River and the extensive areas
of muddy sediments contrast with the rest of the South African east coast, rendering the Thukela
estuary and shelf a unique ecosystem in the South African context (Forbes et al., 2002). The muddy
sediments are interspersed with submerged aeolianite reef and the combination of the two habitats
provides significant fishing grounds and the only shallow water penaied prawn trawling grounds in
South Africa (Forbes et al., 2002). It is believed that extreme flood events are responsible for channel
formation of the Thukela River, making extreme events significant in the sediment dynamics of the
adjoining shelf (Forbes, et al., 2002). The two sub-catchments that would be affected by the proposed
dams that form part of the Thukela Water Project provide 40 % of the total flow discharge and 25-30
% of the total sediment load (Forbes et al., 2002). Conversely, the DWAF (2004b) study contends that
sediment dynamics in the estuary would remain in a dynamic equilibrium even after the construction
of the dams.
2.1.5 Oceanographic characteristics
The oceanographic characteristics of the WIO can best be appreciated by considering its water
circulation patterns as determined by prevailing winds and ocean currents and the key physico-
chemical characteristics of salinity, temperature and oxygen and seawater productivity.
14
A zonal asymmetry is noted in the surface-water temperature distribution in summer for areas north of
20° S. Summer surface temperatures are higher in the eastern part of this region than in the west,
where a minimum temperature of about 22 °C is recorded in the area of Cape Gwardafuy (Guardafui)
on the Horn of Africa, associated with seasonal up-welling. South of 20° S, the temperature of the
surface waters decreases at a uniform rate with increase in latitude, from 24 °C to -1 °C near
Antarctica. In more central areas, near the Equator, northern winter surface-water temperatures exceed
28 °C, notably in the eastern part of the ocean.
The WIO generally is subject to large variations in salinity as a result of dramatic changes in rainfall,
both seasonally and from year to year. Sea surface salinity is affected by rainfall, but is also affected
by anomalous anti-cyclonic winds blowing in the southeast Indian Ocean that block the transport of
saltier water out of the WIO. Winds in the region are seen to effect salinity and rainfall both of which
are linked to El Niño events.
Overall, the salinity of Indian Ocean surface waters varies between 32 and 37 practical salinity units
(PSU) with large local differences (see Figure 2-4). The northern parts of the WIO, especially the
Arabian Sea, has a dense, high-salinity layer (37 PSU) to a depth of about 120 meters because of high
evaporation rates at subtropical temperatures, with moderate seasonal variations. However, salinity in
the eastern part of the WIO, particularly towards the Bay of Bengal is considerably lower, often less
than 32 PSU because of the huge drainage of freshwater from Asiatic rivers. High surface salinity
greater than 35 PSU is also found in the Southern Hemisphere subtropical zone between 25° and 35°
S; while a low-salinity zone stretches along the hydrological boundary of 10° S from Indonesia to
Madagascar. Antarctic surface-water salinity is generally below 34 PSU.
· Figure 2-4
Ocean circulation and salinity for the WIO region [TO BE PROVIDED]
Ocean surface circulation in the WIO is wind-driven. In the northern monsoon zone, surface
circulation reverses every half year and features two opposing gyres that are separated by the Indian
subcontinent (see Figure 2-4). During the Northeast Monsoon, a weak counter-clockwise gyre
develops in the Arabian Sea, and a strong clockwise gyre forms in the Bay of Bengal. During the
Southwest Monsoon, the current reverses direction in both seas, with warm- and cold-core eddies
forming in the Arabian Sea. During the Northeast Monsoon, the North Equatorial Current flows
westward, turns south at the coast of Somalia, and returns east as the Equatorial Countercurrent
between 2° and 10° S. An equatorial undercurrent flows eastward at a depth of 150 meters during this
period. During the Southwest Monsoon, the North Equatorial Current reverses its flow and becomes
the strong east-flowing Monsoon Current. Part of the South Equatorial Current turns north along the
coast of Somalia to become the strong Somali Current. A pronounced front, unique to the Indian
Ocean, at 10° S, marks the limit of the monsoon influence.
The Somali Current, the western boundary current of the northwest Indian Ocean, reverses direction
with season. During the Northeast Monsoon, the Somali Current flows south, meeting the north-
flowing East African Coastal Current (EACC) which originates from the South Equatorial Current.
With the transition from northeast to southwest monsoons, an intense Indian Equatorial Jet (EJ)
develops within these waters between April and June for short (one-month) periods. The EACC's
geographical extent is seasonally-determined so that its interaction with the Somali Current shifts
southward as the monsoon progresses. During the Southwest Monsoon, the EACC strengthens,
causing the Somali Current to change direction and flow northward as an intense coastal jet that may
reach velocities of 3.5 meters per second. By the time the Southwest Monsoon peaks in August, the
Somali Current is established as a continuous current running from the EACC (south) to the East
Arabian Current (north). Nutrients and primary productivity in surface waters are generally low,
although this is seasonal, with higher values being associated with surface up-welling areas.
15
South of the monsoon region, a steady subtropical anti-cyclonic gyre exists, consisting of the
westward-flowing South Equatorial Current between 10° and 20° S, which divides as it reaches
Madagascar. One branch passes to the north of Madagascar, turns south as the Mozambique Current
between mainland Africa and Madagascar, and then becomes the strong, narrow 95 kilometer-wide
Agulhas Current flowing along South Africa before turning east and joining the Antarctic
Circumpolar Current south of 45° S. The other branch turns south to the east of Madagascar and then
curves back to the east as the South Indian Current at about 40° to 45° S. The current system at the
eastern boundary of the ocean is undeveloped, but the West Australian Current flowing north from the
South Indian Current closes the gyre to a certain extent. Only the Antarctic Circumpolar Current
reaches the ocean floor. The Agulhas Current extends down to about 1,200 meters and the Somali
Current to about 800 meters; the other currents do not penetrate farther than 300 meters.
The Agulhas Current is the western boundary current of the South Indian Ocean and flows down the
east coast of Africa from 27°S to 40°S. The source water for the current is derived from the
Mozambique Channel eddies and the East Madagascar Current with the greatest source of water
arriving through re-circulation of the southwest Indian Ocean sub-gyre (Gründlingh, 1983; Stramma
and Lutjeharms, 1997; de Ruijter et al., 1999). The Mozambique eddies drift southward along the
shelf edge at speeds of about 5 cm/s (Schouten et al., 2002). They form the major elements of the
circulation in the Mozambique Channel. The movement and direction of the current varies both
seasonally and geographically across its extent. Generally, it is limited to the top 2,300 meters of the
ocean but this depth limit increases with increasing latitude and there is a further seasonal variation
causing oscillation in sea surface height within the current. The warm-water link between the Indian
and South Atlantic oceans is likely to have a strong influence on global climate.
Below the influence of the surface currents, water movement is sluggish and irregular. Two sources of
highly saline water enter the WIO via the Arabian Sea, one from the Persian Gulf and the other from
the Red Sea, and sink below the fresher surface water to form the North Indian High Salinity
Intermediate Water between 600 and 1,000 meters. This layer spreads east into the Bay of Bengal and
as far south as Madagascar and Sumatra. Below this layer is the Antarctic Intermediate Water to about
1,600 meters depth. Between 1,500 and 3,000 meters is the North Atlantic Deep Water (named for the
source of this current), and below 3,200 meters depth, the Antarctic Bottom Water from the Weddell
Sea. These cold, dense layers creep slowly northward from their source in the Antarctic Circumpolar
Region, becoming nearly anoxic (oxygen-deficient) en route. Unlike the Atlantic and Pacific oceans,
the Indian Ocean has no separate source of bottom water.
The WIO region, particularly the areas covered by the Agulhas and Somali Current Large Marine
Ecosystem (ASCLME), are considered to be oligotrophic and characterized by low nutrient
concentration, low phytoplankton biomass and a predominance of regenerated production.
Ammonium is found to be the major nitrogen substrate supplying between 50-99 % of the
phytoplankton nitrogen requirements. Nutrient levels do vary seasonally, especially between the
monsoons. The flow of the South Equatorial Current delivers high levels of nutrients to the waters of
the central and northern Mascarene Plateau regions, which may be responsible for higher levels of
productivity in these areas.
Upwelling is a seasonal phenomenon in the WIO because of the monsoon regime. During the
Southwest Monsoon, upwelling occurs off the Somali and Arabian coasts. It is most intense between
5° and 11° N, with replacement of warmer surface water by water of about 14 °C.
Examples of all three tidal types - diurnal, semi-diurnal, and mixed - can be found in the Indian
Ocean, although semi-diurnal (i.e. twice daily) are the most widespread. Semi-diurnal tides prevail on
the coast of eastern Africa as far north as the Equator. The tides are mixed in the northern region of
the WIO particularly towards the Arabian Sea. Tidal ranges vary considerably from place to place in
the Indian Ocean and its adjacent seas. Mauritius, for example, has a spring tidal range of only 0.5
meters while along the eastern Africa coast, the spring tidal range is of the order of 3-4 meters.
16
2.2 Ecological
setting
2.2.1 Coastal ecosystems and habitats
The WIO region comprises the western extremity of the tropical Indo-West Pacific, the world's
largest marine biogeographic province (Ekman, 1953; Sheppard, 1987; 2000). The region is
characterized by diverse coastal and marine ecosystems such as coral reefs, seagrass beds, mangroves,
sandy beaches, sand dunes and terrestrial coastal forests. Figure 2-4 presents the key ecosystems
habitats found in the WIO region. A further description of each of the types of ecosystems is
presented in the following sections.
2.2.2 Coral reefs
The coral reef ecosystem in the WIO cover a surface area of approximately 12,913 km2. Most coral
reefs in the region are fringing carbonate reefs found along the length of the coastline, particularly in
areas where there is no river drainage. Atolls and patch reefs are common in the island states and the
offshore islands along the East African continental margin. In the WIO region, coral reefs play an
important role in the socio-economic well-being of the people as many are dependent on them for
work and subsistence. Coral reefs are probably the most diverse marine ecosystem with more than
300 coral species known (see Table 2-4).
· Table 2-4
Cover of coral reef and scleractinian coral species diversity by country in WIO.
Country
Reef area
Recorded no.
coral species
(km2)
Comoros
430
314
Kenya
630
237
Madagascar
2,230
315
Mauritius
870
294
Mozambique
1,860
314
Seychelles
1,690
310
Somalia
710
308
South Africa
<50
43
Tanzania
3,580
314
Source: Spalding et al. (2001).
Comoros Archipelago - The three islands are surrounded by fringing reefs, with the exception of the
main island of Grande Comore, an island which is still volcanically active with steep and barren
shores, where fringing reefs are restricted to a only few parts of the coastline, mostly to the north and
west. Moheli Island has the most extensive reef system with continuous fringing reefs all around the
island.
Kenya - The coral reef covers a surface area of about 630 km2 which is equivalent to 4.9 % of the
total regional coverage. Better reef development is found in the fringing reefs in the southern part of
the country. The northern coast of Kenya contains patchy reefs, in a system of barrier islands,
mangrove and seagrass beds (Obura, 2002). Reduced reef development in the northern part of the
Kenya coast is attributed to the large areas of loose sediment and significant freshwater inputs via the
Tana and Athi-Sabaki rivers (Spalding et al., 2001). Fringing reefs are also found off Lamu Island and
along many of the barrier islands to the north.
17
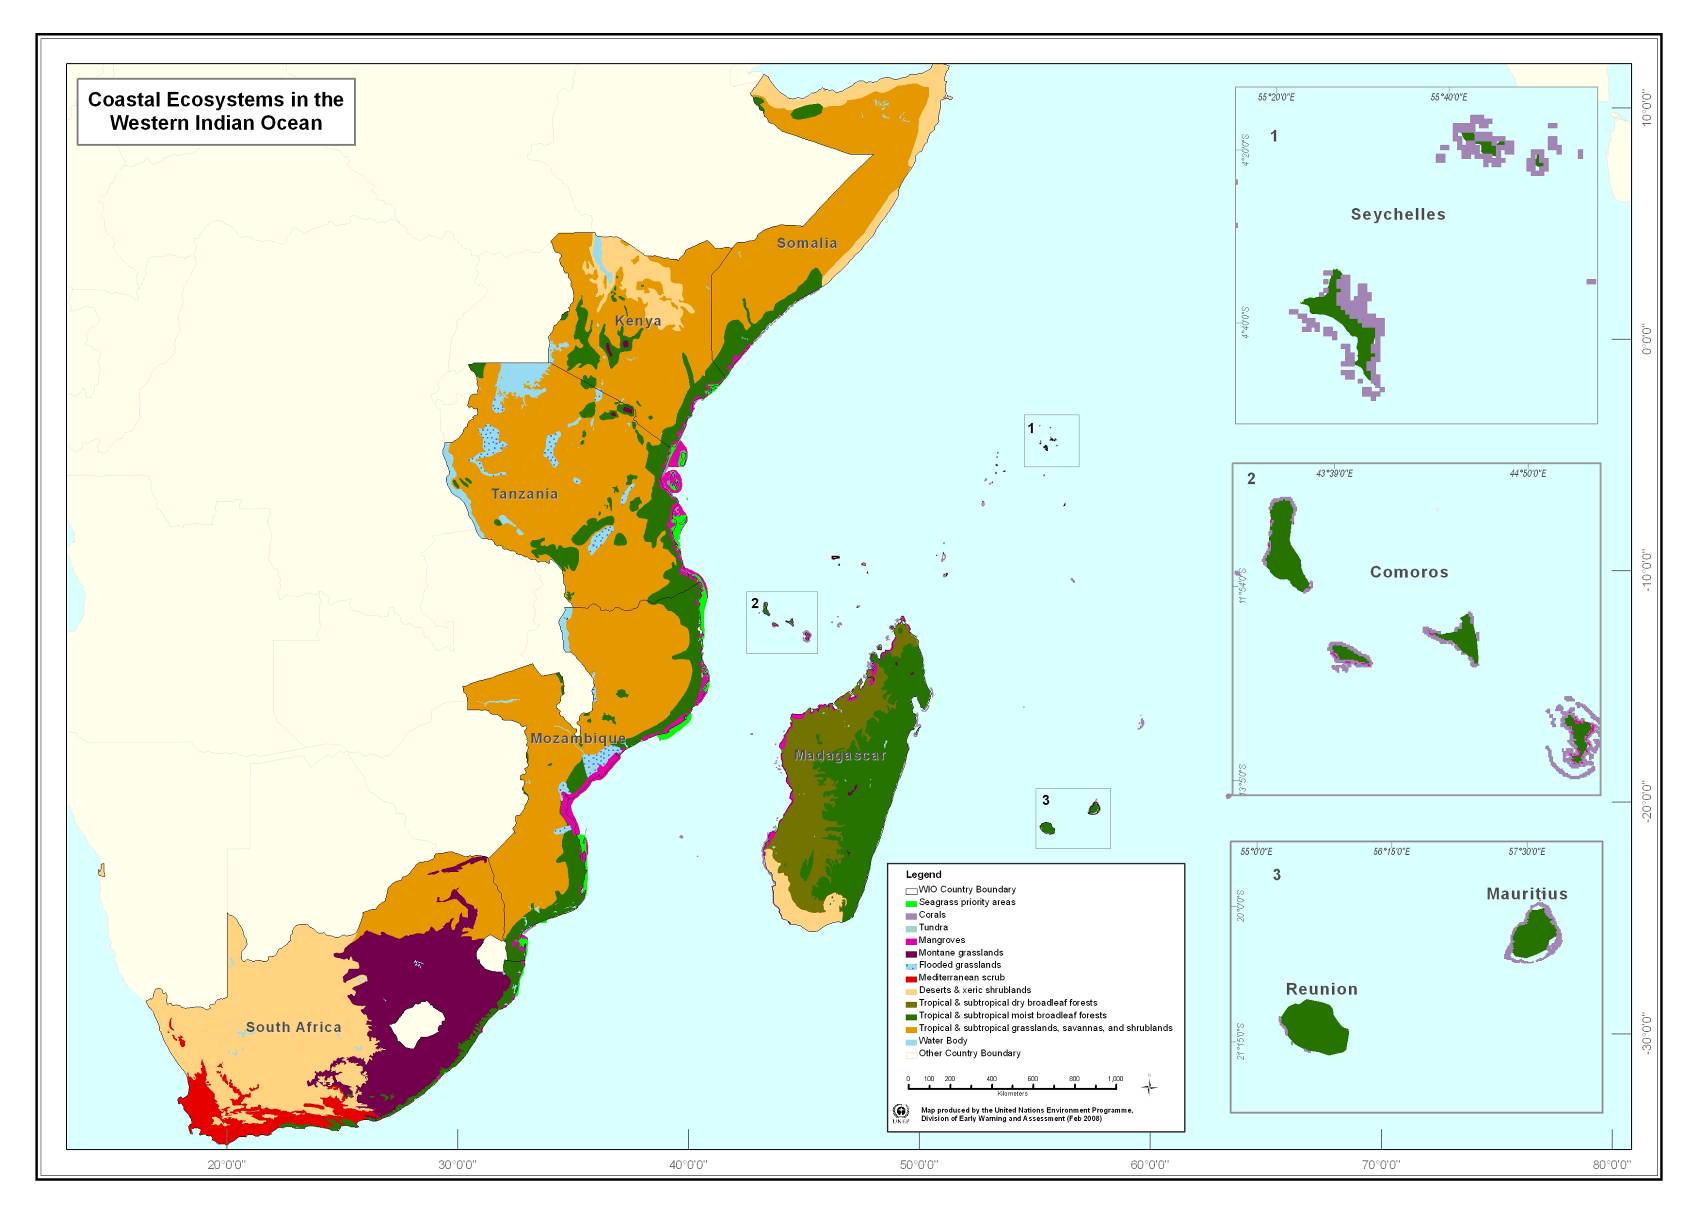
· Figure 2-4
Map displaying key ecosystems and habitats in the WIO region
18
Madagascar - Coral reefs are widely distributed along the west coast and cover a surface area of
about 2,230 km2 which is equivalent to 17.3 % of the regional total. Different types of reefs are
present including fringing reefs, barrier reefs, patch reefs and submerged coral banks and shoals
(Cooke et al., 2000). Extensive fringing reefs off the west coast of Madagascar are located between
500 meters and a few kilometers offshore and separated from the shore by generally shallow channels.
A notable feature is the well developed barrier reef known as Grand Recif, which runs continuously
for 18 kilometers. A fragmented barrier reef system exists in the area between Baie des Assassins and
Morombe and north of the Mangoky Delta. Along most of the central section of the west coast, there
is no reef development, which is probably caused by terrigenous sediment discharge from rivers and
heavy input of freshwater. On the outer edge of the continental shelf in the far north there is a series of
raised banks, forming a near continuous ridge which is thought to be the remain of a large barrier reef
system. The east coast has less developed coral reefs (Spalding et al., 2001).
Mascarene Islands - The Indian Ocean islands of Mauritius (including Rodrigues) and Réunion
(France), located at the southern end of the Mascarene Ridge are all of volcanic origin. Réunion has
the youngest reef in the region, while Mauritius is almost completely surrounded by fringing reefs
with substantial lagoon and barrier reef development on the east and south west coast and Rodrigues
has a highly developed reef structure, although a true barrier reef has not formed (Fenner et al., 2004).
The outer reef slopes in both Rodrigues and Mauritius are reported to be of high coral cover
(Ahamada et al., 2004). The islands of the Cargados Carajos Bank are also under the jurisdiction of
Mauritius and are surrounded by large expanses of coral reefs. Réunion has only a few fringing reefs,
restricted to the leeward western shore, while the Iles Eparses (also under the administration of
France), have reefs that accounts for about 1.9 % of coral reefs in the region.
Mozambique - Coral reef cover an area of about 1,860 km2 about 14.4 % of the region's t total, with
most located within the provinces of Nampula and Cabo Delgado in northern Mozambique. As a
result of the remoteness of some northern areas, Mozambique has many reefs which have experienced
limited human impacts.. Though the country has one of the longest coastlines on the east African
coast, coral reefs are not as prolific as might be expected. This is partly due to the fact that within the
central coast of the country, nicknamed the `swamp' coast, over 24 rivers discharge into the Indian
Ocean, carrying sediments and reducing the salinity of coastal waters.
Seychelles - The coral reefs covers a surface area of about 1,690 km2, equivalent to 13.1 % of all the
coral reefs in the WIO region. The granitic islands on the Seychelles Bank are surrounded by
widespread, discontinuous fringing reefs. The best developed reef areas are found along the east coast
of Mahe and the west coast of Praslin where the reef flats often reach 2 kilometers in width, with
highly exposed, seaward algal ridges. Granite reefs are common in the shallow waters around the
inner islands and comprise corals growing over granitic boulders. These coral communities were
shown to be better able to recover from coral bleaching events (Engelhardt, 2003; Payet et al., 2005).
The coralline islands to the south and south west of the Seychelles Bank form a number of geographic
groups, the Amirantes Group being the largest and the Aldabra Groups the most distant. The reefs in
these outer islands are highly varied and include true atolls, raised atolls, submerged or partially
submerged atolls and platform or bank structures with coral cover varying considerably between
localities. In the inner islands of the Seychelles Bank, coral cover is very low following the 1989 El
Niño event and is taking a long time to recover (Payet et al., 2005).
Somalia - Fringing reefs are well developed in the south and around the islands of the Bajuni
Archipelago. However, north of the Archipelago, fossil carbonate reef structure is present but
supports reduced coral cover and biodiversity (Spalding et al., 2001). This has been attributed to the
upwelling of cold water within the Somali Current during the Southeast Monsoon. Somalia has 710
km2 of coral reef which accounts to 5.5 % of the regional total. Despite this significant contribution to
regional coral reef cover, due to political instability, very little is known today about the state of
Somalia's coral reef, especially after the 1998 coral bleaching event in which the neighbouring
countries suffered mortality of between 5095 % (Wilkinson, 1998; Wilkinson et al., 1999).
19
South Africa The only coral reefs are found along the north coast of KwaZulu-Natal, covering a
surface area of just under 50 km2 (Schleyer et al., 2005) where the coral communities represent the
southernmost reefs of the African coast, reported to be of high coral cover though dominated by soft
corals (Schleyer and Celliers, 2002). The coral reefs of South Africa are however not true accretive
reefs as corals only grow as a thin cover over the limited sandstone substrata (Ramsay and Mason,
1990; Ramsay, 1996).
Tanzania - This is the country with the largest area of coral reef in the region (3,580 km2) with
fringing reefs being found along the coast of most of mainland Tanzania and the three main offshore
islands: Pemba, Unguja (Zanzibar) and Mafia. In areas of high freshwater discharge, such as around
the Rufiji Delta, there are breaks in the reef structure brought about by high sediment load and
reduced salinity. As a result of its location, where the Equatorial Current meets with the east African
coast, the coral reefs of Tanzania have high connectivity with other reef systems along the north of the
East African coast through the constant northward flow of the East African Coastal Current (EACC)
and the sites south through the Mozambique Current, acting as a source of larvae to these reef sites.
Around the three main offshore islands, coral reefs are well-developed; however, the eastern shores of
these islands have been reported to have low coverage of live hard coral, which is possibly due to high
wave impact combined with anchor damage from decades of artisanal fishing.
2.2.2 Mangrove forests
Mangroves trees and shrubs are a common sight on sheltered areas of tropical and subtropical
shorelines in many parts of the world. They form fringing coastal vegetation between the spring tide
high mark and the mid-tide level, consequently their roots are exposed to air at least during each tidal
cycle. The latitudinal limits of mangroves are about 31o22'N and 38o20'S (Tomlinson, 1986; Spalding
et al., 1997). Two main centres of mangrove diversity have been identified: the eastern group includes
the Indo-West Pacific that stretches from the central Pacific to the mainland coastline of the WIO and
the western group includes the mangroves of Atlantic-East Pacific including those of West Africa,
Americas and the Caribbean Sea. The eastern group is more diverse and contains about five times the
species diversity recorded in the western region (Duke, 1992).
The total area of mangroves in the WIO is estimated to be 10,000 km2 (Spalding et al., 1997)
representing about 5.0 % of the total global mangrove coverage. The best developed mangroves in the
region are found in the deltas of the River Rufiji (Tanzania), the Tana River (Kenya), the Zambezi and
Limpopo rivers (Mozambique) and along the west coast of Madagascar at Mahajanga, Nosy be and
Hahavavy (Table 2-5).
· Table 2-5
Distribution of mangroves in the WIO
Country
Area (ha) 1
Species
Main mangrove areas
Mozambique
390,500
9
Zambezi Delta
Madagascar
314,000
9
West coast at Mahajanga bay, Nosy Be, and Hahavavy
Tanzania
164,200
9
Rufiji Delta, Tanga, Kilwa , Pangani.
Kenya
51,600
9
Lamu Archipelago, Tana Delta
Seychelles 1,900
7
Aldabra
Atoll
South Africa
667
6
St Lucia
Comoros
670
5
Grande Comoro, Moheli
Mauritius 7
2
Mathurin
Bay,
Rodrigues
Somali 9,100
6
Juba/Shebele
estuary
Data source: 1FAO, 2002, Beentje and Bandeira 2007; Spalding et al., 1997.
In the WIO region, nine species of mangroves are commonly encountered, with the most common
species being Rhizophora mucronata and Ceriops tagal (see Table 2-6). The most common
20
associated tree species occurring within the mangrove ecosystem are Barringtonia asiatica,
Barringtonia racemosa and Pemphis acidula (Beentje and Bandeira, 2007).
· Table 2-6
Species of mangroves in WIO
Family
Species
Avicenniaceae
Avicennia marina (Forsk.) Vierh.
Combretaceae
Lumnitzera racemosa Willd.
Meliaceae
Xylocarpus granatum König
Xylocarpus moluccensis (Lamk.) Roem.
Bruguiera gymnorrhiza (L.) Lam.
Rhizophoraceae
Ceriops tagal (Perr.) C.B. Robinson
Rhizophora mucronata Lamk.
Sonneratiaceae
Sonneratia alba J. Smith
Sterculiaceae
Heritiera littoralis Dryand.
Sources: Macnae, 1968; Semesi 1997
2.2.3 Seagrass beds
Twelve seagrass species, comprising about a fifth of the world's total, occur in the WIO region
(Bandeira and Bjork 2001; Gulström et al., 2002). These species are divided into three families
namely, Zostera capensis of the Zosteraceae; Thalassia hepmrichii, Halophila ovalis, H. minor, H.
stipulacea and Enhalus acoroides all Hydrocharitaceae and Cymodocea rotundata, C. serrulata,
Halodule uninervis, H. wrightii, Syringodium isoetifolium and Thalassodendron ciliatum from the
Cymodoceaceae family. Kenya, Tanzania and Mozambique support the highest diversity of seagrasses
(see Table 2-7). Ruppia maritima, recently defined as a seagrass (Short et al., 2001), is also a
dominant species in the south-eastern Africa (Colloty, 2000).
· Table 2-7
Seagrasses species in WIO counties
Species
m
o
r e
n a y g
a r
i a t m
b c
h
e m
a h l
A n
z
a
Zostera capensis
Thalassia hemprichii
Thallassodendron ciliatum
Syringodim isoetifolium
Halodule wrightii
Halodule uninervis
Halphila stipulacea
Halphila minor
Halophila ovalis
Enhalus acoroides
Cymodocea serrulata
Cymodocea rotundata
Ruppia maritima
Sources: Bandeira, 2000; Colloty, 2000; Bandeira and Bjork, 2001; Bandeira and Gell, 2003; Ochieng
and Erftemeijer, 2003; Database of Marine Organisms of Mauritius, 2007).
21
The principal locations of seagrass beds in WIO countries are shown in Table 2-8, while the following
sections describe the main characteristics of seagrass bed distribution within the relevant countries.
Comoros - Being located less than 400 kilometers east of the coastline of Mozambique and sharing a
similar climate, these islands are likely to support similar seagrass meadows to those of northern
Mozambique, with mixed seagrass species in intertidal areas and subtidal seagrass species dominated
by broad-leafed species such as Thalassodendron ciliatum (see Bandeira and Gell, 2003).
Kenya - Seagrass beds cover a surface are of about 33.6 km2, with the most important sites in the
region between Lamu and Kiunga, Malindi, Mombasa, Gazi Bay (8 km2), and Mida Creek and Diane-
Chale lagoon (4.5 km2) (Dahdouh-Guebas et al., 1999; Ochieng and Erftemeijer, 2003). Twelve
species of seagrass are present in Kenya. Some of the most common species are Thalassodendon
ciliatum, Halodule wrightii and Halophla minor (see Obura, 2001; Gulstrom et al., 2002). The
pioneer seagrass association comprises Halophila ovalis and Halodule wrightti, while the climax
vegetation of the intertidal zone is mainly composed of Thallasia hemprichii and some few
macroalgae (e.g. Halimeda opuntia, Gracilaria salicornia and G. corticata). Monospecific patches of
Enhalus Acoroides also occur in deep water, while the lagoon is dominated by monospecific stands of
T. ciliatum meadow (Coppejans et al., 1992). In the north of Kenya (Kiunga Marine Reserve), eleven
of the total number of species was identified in estuary, bay and reef habitats (McMahon and
Waycott, 2006). There has been significant loss of seagrass along the coast, initially attributed to
human-related activities, but now also to sea urchin population growth. In Diane-Chale lagoon for
instance, preliminary studies indicate that T. ciliatum beds experienced a loss of more than 50 % of
cover. These degraded sites were also found to have a density of the sea urchin Tripneustes gratilla of
more 37 individuls/m², while healthy sites had a density of 4 individuals/m² (Uku, 2006).
Madagascar - Little is known about the relative dominance of seagrass species though it is likely that
in southwest Madagascar they are similar to the species from the limestone areas of Mozambique with
most meadows being dominated by Thalassodendron ciliatum and Thalassia hemprichii (Bandeira
and Gell, 2003). Seaweeds are also a common feature in intertidal and subtidal seagrass areas of
Madagascar (Rabesandratana, 1996).
Mascarene Islands Around Mauritius and Rodrigues islands, seagrass beds cover a surface area of
5.5 km2 and 64.9 km2 respectively (Turner and Klaus, 2005). The most abundant species in Mauritian
lagoons is Syringodium isoetifolium, with other species present being Thalassodendron ciliatum,
Halophila ovalis, H. stipulacea, Halodule uninervis and Cymodocea serrulata (Montaggioni and
Faure, 1980; Database of Marine Organisms of Mauritius, 2007). Seagrass beds are found both as
extensive beds of mixed species and monospecific stands - constituting natural habitats for a diverse
group of organisms in these lagoons.
Mozambique - Seagrass beds are estimated to cover a total surface area of 439 km2, with some 25
km2 around Inhassoro and Bazaruto Island, 30 km2 at Mecúfi-Pemba and 45 km2 in the southern
Quirimbas Archipelago (Bandeira and Gell, 2003). The largest seagrass beds occur at Fernão Veloso,
Quirimbas and Inhaca-Ponta do Ouro (Bandeira and Gell, 2002). Pioneer species observed in
Mozambique include Halophila wrightii, H. ovalis and Cymodocea serrulata. The first two species
occur in exposed sandy areas close to the coastline (den Hartog, 1970), whereas C. serrulata is a
pioneer species in silted channels (Bandeira, 2002). Seagrasses abound in the sandy and limestone
areas of Mozambique with the three dominant mixed-seagrass communities on the sandy substrates of
southern Mozambique comprised of Thalassia hemprichii, Halodule wrightii, Zostera capensis,
Thalassodendron ciliatum and C. serrulata (Bandeira, 1995). In contrast, the seagrass communities of
the more northerly limestone areas are quite different, with seagrasses tending to occur intermingled
with seaweeds species (Bandeira and António, 1996). Macroalgae such as Gracilaria salicornia,
Halimeda spp. and Laurencia papillosa occur mixed with T. hemprichii, and Sargassum spp. with T.
ciliatum (Bandeira and Antonio, 1996; Bandeira, 2000). Elsewhere, Zostera capensis and Haludule
wrightii also form mixed beds (Bandeira, 2000; Bandeira and Björk, 2001; Massingue and Bandeira,
22
2005). Enhalus acoroides, Halophila stipulacea and H. minor were only found in northern
Mozambique.
Seychelles - A total of eight seagrass species occur in the Seychelles Archipelago, mixed with more
than 300 species of macroalgae. The total area covered is not known, but in general, Cymodocea
serrulata, Syringodium isoetifolium and Thalassia hemprichii dominate the soft bottoms (Ingram and
Dawson, 2001). The clear waters of Seychelles have supported the deepest known seagrass
distribution within WIO, with Thalasodendron ciliatum occurring up to 33 meter depth (Titlyanov,
1995). The structure of the Aldabra Atoll differs considerably from some of the other island groups,
since its coasts are built primarily of dead consolidated corals and are steeply undercut with
overhangs. Four seagrass species (T. ciliatum, T. hemprichii, H. uninervis and S. isoetifolium) and 119
algal species occur both on the reef slope and in the lagoon itself, with some of common algae genera
in the atoll being Halimeda, Turbinaria and Laurencia (Kalugina-Gutnik et al., 1992). Mahé Island
supports the highest recorded seagrass diversity for the archipelago (seven species), with C. rotundata
inhabiting a narrow band along the shore, which is then replaced by T. ciliatum occupying the entire
area exposed at low waters. Kalugina-Gutnik et al. (1992) report on some associations with algae,
including Sargassum cristaefolium, Gracilaria crassa, Cheilosporum spectabile, Jania spp., Hypnea
spp., Laurencia parvipapillata, Amphiroa foliacea, Cladophoropsis sundanensis and Gelidiella
acerosa.
South Africa - Seagrass beds, found only along the east coast of South Africa, cover about 7 km2,
with the largest concentration in the St. Lucia estuary of 1.81 km2 (Colloty, 2000). Zostera capensis is
the most widespread and one of the dominant seagrass species in the country, occuring mostly in
estuaries from Kwazulu-Natal to Western Cape region. Other important locations with seagrass
species are around the rocky protuberances of KwaZulu-Natal, mostly dominated by Thalassodendron
ciliatum, adapted to rocky habitat together with seaweeds (Barnabas, 1991). Ruppia maritima is one
of the dominate seagrass species within estuaries, especially St Lucia (Short and Coles, 2003).
Tanzania - Major seagrass areas include Pemba, Unguja and Mafia Islands (Ochieng and Erftemeijer,
2001). One of the most described (best studied) sites for seagrasses in Tanzania is Chwaka Bay,
Unguja Island, Zanzibar (de la Torre e Castro, 2000; Gultröm et al., 2006). Here, two types of
seagrass habitats can be found: shallow beds in marine embayment, far away from coral reefs and
adjacent to mangroves and mud flats, and shallow seagrass beds situated on the shallow continental
shelf adjacent to coral reefs and far away from mangroves and mud flats (Dorenbosch et al., 2006).
Seagrasses are present in most places of the tidal zone, but are more abundant in the western part of
the bay. There are about 11 species, the dominant include T. hemprichii, E. accoroides and T. ciliatum
(de la Torre e Castro and Ronnback, 2004; Eklof et al., 2005). Since 1990, the island is an important
site of seaweed farming, which is being reported to negatively affect seagrass beds (de la Torre e
Castro and Ronnback, 2004; Eklof et al., 2005).
· Table 2-8
Important sites of seagrass beds in the WIO mainland (and area covered).
Country
Key location
Area
(km2)
Kenya
Gazi Bay
8.00
Diane-Chale Lagoon
4.50
Tanzania
Chwaka Bay (Zanzibar)
100.00
Mozambique
Inhaca Island and Maputo Bay
80.00
Mecúfi-Pemba
30.00
Quirimbas Archipelago
45.00
South Africa
St. Lucia estuary
1.81
23
2.2.4 Rocky shores and sandy beaches of the WIO region
Various types of rocky beaches occurs within the WIO region, the most common being limestone,
sandstone and granite. Pleistocene limestone outcrop is the main rock formation within the WIO,
being dominant in Madagascar, northern Mozambique, Tanzania, Kenya, northern South Africa and
southern Mozambique (e.g. Kalk, 1995). Basalt and granite rocks also occur, though to a minor
extent, being common in Comoros and Seychelles (see Hill and Currie, 2007) and Mauritius. Table 2-
9 lists some WIO locations with their main shoreline substrate type.
· Table 2-9
Substrate in some rocky shores of the WIO
Location
Substrate
Dar es Salam (Tanzania)
Limestone
Inhaca (Mozambique)
Sandstone
Durban (South Africa)
Sandstone
Seychelles
Beach rock, granite
Mauritius
Basalt, lava, limestone
Kenya
Fossil Pleistocene reef rock formations (old limestone)
Tulear (Madagascar)
Limestone
Comoros
Basalt
Northern Mombasa
Limestone
Sources: Hartnoll (1976); Kalk (1995); Hill and Currie (2007).
The porosity and hardness of rocks affects water retention capacity, and thus the development of
epifaunal marine life in the intertidal zone, with limestone and basalt being more porous than granite.
Clear zonation patterns can be seen in places where hard substrates extend from the upper reaches of
wave action to the lower spring tide levels, with bands of algae, bivalves and gastropods (Hartnoll,
1976; Ngusaru, 1997). The degree of exposure, slope of the substrate and tidal range control the
abundance and number of species.
Sandy beaches are also a common feature within the WIO, dominating stretches of coast with
different degrees of wave action. These coastal sandy areas are dominated by mangrove forests or
with fine accumulations of shell and coral debris (see Ngusaru, 1997; Barbosa et al., 2001). The
coastlines of the region's countries are thus strongly influenced by the nature of the substrate, as the
sections that follow describe.
Comoros The Comoros Archipelago, of a volcanic origin, has a dominant and geologically
relatively young rocky shore of basalt (Ngasuru, 2002)
Kenya - The southern coast of Kenya and the islands north from Lamu are made up of fossil
Pleistocene rock formations, resulting in large areas of intertidal reef platforms and cliffs. These
platforms are inundated by sea water twice a day, resulting in strong zonation of intertidal
communities into the littoral fringe, eulittoral zone and sublittoral (Ruwa, 1996). Fringing coral reefs
run roughly parallel to the coast between 0.5-2 kilometers offshore, growing on fossil limestone,
while sandy subtidal habitats dominate the shoreline from Malindi to Lamu, under the influence of the
Tana and Sabaki rivers (Obura, 2001).
Madagascar - The south and southeast coasts of Madagascar consist of narrow rocky platforms partly
covered with scattered reef formations (Mollion, 1998). The southwestern region has a similar
geomorphology to northern mainland East Africa with its coral limestone shores (Hartnoll, 1976).
Mascarene Islands - Calcareous limestone in Mauritius is found mostly in La Prairie, Balaclava,
south coast of Ville Noire region, Ile aux Aigrettes and south of Wolmar (Baird and Associates,
2003). On such shores, the upper littoral zone is colonized by Tetrachthamalus, Acmaea and
24
Siphonaria in the higher portions and Tetraclita, together with various echinoids, in the lower parts.
Similar pattern occur on the basalt shores, but the very exposed shores the echinoids become abundant
(Hartnoll, 1976). Little is documented of the rocky shores of the other islands of Rodrigues and
Réunion.
Mozambique - The northern coast of Mozambique is characterised by limestone substrata and
extensive coral reefs lying beneath the subtidal fringe, similar to Tanzania and Kenya. Some coral
reefs occur in lagoons usually within extensive intertidal areas. Considerable seaweed and seagrass
communities, forming mosaics, dominate this coastline. The substratum in central Mozambique tends
to be soft, with sandstone rock occurring in restricted areas mainly in rocky fulcra or small capes
common in many places in the southern part of Mozambique e.g. Ponta Mazóndwe at Inhaca, Ponta
do Ouro, northern end of Bazaruto Island (e.g. Kalk, 1995; Bandeira, 1995, 1998). In southern
Mozambique, Inhaca has exposed and sheltered rocky shores with different zonation patterns, the
main difference being the presence of marine algae on the exposed rocks; the commonest macroalgae
species being Jania adherens, Padina biryana in the upper zones, Saragum sp. and Laurencia sp. in
the middle and Gracilaria sp. and Sargassum sp. in subtidal areas (Bandeira, 2000).
Seychelles - Although rocky shores are a common feature in the granitic islands, as well as in the
raised coralline islands, they were generally poorly studied, mostly because of difficult human access.
The intertidal communities are relatively narrow due to the low tidal range, the commonest animals
found there being limpets, barnacles and rock crabs.
South Africa - The rocky shores along the east coast of South Africa (Kwazulu-Natal) are mainly
composed of aeolinite (beach rock). The south and central shore has rocky headlands, wave-cut
platforms and shallow reefs, which are important features for the establishment of some organisms,
while the northern part is more characterized by sandy beaches. In general, there are three main
intertidal zones. The upper zone is barely covered by seaweeds, with common genera including
Bostrychia, Gelidium, Rhizoclonium and Herposiphonia and the fauna is also very sparse, with
common species such as littorinid snails and oysters (Sarcostrea cucullata). The mid-intertidal is
colonised by limpets and barnacles, sometimes with Pomatoleios (tube worms); the commonest
seaweeds are Gelidium reptans, G. foliaceum and Gigartina minima. The coloured zoanthids that
dominate the lower intertidal zone are associated with coralline turfs (Jania spp.) and large
populations of the red alga Hypnea spicifera. A wide variety of seaweeds are present in the subtidal
and shallow tidal zones, often dominated by coralline genera Amphiroa, Arthocardia and
Cheilosporum (see de Clerck et al., 2005).
Tanzania - Many localities along Tanzania's shoreline are of raised coral limestone, generally with
wide erosional platform that rise to the level of mean neap tide (Hartnoll, 1976). Around Dar es
Salaam the shore is divided into three zones: lower eulittoral up to mean tide level, with a dense cover
of small algae and characteristic fauna which does not extend to higher levels; an upper eulittoral to
about mean high water springs, with algae only under shading overhangs and an abundant fauna
dominated by polychaetes (Pomatoleios), barnacles (Chthamalus, Tetraclita, Lithotrya, Acmaea) and
bivalves (Sarcostrea cucculata); and a littoral fringe characterized by littorinides and Nerita snails,
extending in some areas more than 5 meters above mean high water springs. This pattern of zonation
is found with little modifications throughout the WIO. In terms of botanical diversity, macroalgae are
intermingled with seagrasses and dominant species include Cystoseira myrica, Enteromorpha sp.,
Gracilaria salicornia, Laurencia papillosa, Sargassum spp., Ulva spp. Extensive description of
macroalgae of Tanzania appers in Jaasund (1976) and Oliveira et al. (2005). These species distributions
can be applicable to Kenya and northern Mozambique.
2.2.5 Coastal forests
Coastal forests in the WIO region include terrestrial vegetation with a continuous stand of trees
(White, 1983), found adjacent to the coastal areas but excluding mangroves. The range inland can be
25
up to 200 kilometers (sensu Burgess and Clarke, 2000) or to the maximum inland extension of coastal
communities.
There are four phytogeographical regions (= phytocoria) in the WIO mainland region supporting
various vegetation types, namely the Cape Regional Centre of Endemism, Maputaland-Pondoland
Regional Mosaic, Swahilian-Maputaland Regional Transition Zone, and the Swahilian Regional
Centre of Endemism (see Burgess and Clarke, 2000). Table 2-10 and Figure 2-5 summarize the
phytochoria, their area, geographical position, geomorphology and vegetation types. The limits of the
Swahilian Regional Centre of Endemism and Swahilian-Maputaland Regional Transition Zone
correspond to Zanzibar-Inhambane Regional Mosaic, as identified by White (1983).
· Table 2-10 Phytogeographic region in mainland WIO region
Phytogeographic region
Area
Geographical
Geology
Vegetation types
(km²)
position
Cape Regional Centre of
71,000
32° and 35° S
Landscape dominated
Fynbos is the prevalent
Endemism (South Africa)
and 18° and
by mountains, in
vegetation type.
27°E
average ranging
between 1,000 and
1,500 m.
Maputaland-Pondoland
148,000 From the
Coastal plain composed Mosaic of forests, scrub
Regional Mosaic (South
Limpopo River
of Cretaceous and
forest and evergreen
Africa and Mozambique)
mouth to Port
Tertiary marine
and semi evergreen
Elisabeth (25°S sediments.
bushland, secondary
and 34°S)
grassland and woody
grassland.
Swahilian-Maputaland
336,000 Coastal
belt
Most land lies below
Forest, secondary
Regional Transition Zone
from southern
200 m; scattered hills in wooded grassland,
(Mozambique)
Somalia (1º N) northern part of the
scrub forest, edaphic
Swahilian Regional
to the mouth of
coastal plain, underlain
grassland; small areas
Centre of Endemism
the Limpopo
by marine sediments of of transition woodland,
(Mozambique, Tanzania,
Rriver (25º S)
various ages from
bushland and thicket
Kenya and Somalia)
Cretaceous onwards.
Sources: White 1983; Burgess and Clarke, 2000.
Geographical distribution of coastal forests in the WIO region is controlled by climate, hydrology and
geomorphology (Burgess and Clarke, 2000). In semi-arid coastal zones of Kenya and northern
Tanzania, the coastal forests are located close to the ocean and are thought to be sustained by
groundwater flow. Arabuko-Sokoke Forest in Kenya, covering a surface area of 410 km2 (Burgess and
Clarke, 2002) is one of the better protected coastal forests in the region.
Most coastal forest sites are isolated from each other, over distances varying from one to several tens
of kilometers. The vegetation between the forests is a mixture of farmland, savannah-woodland and
thicket (Burgess and Clarke, 2000). The savannah-woodland is usually dominated by mixtures of
miombo vegetation and coastal mosaics (see Flora Zambesiaca maps in Wild and Grandvoux
Barbosa, 1967).
Comoros - Up to 2,000 species of plants are found in the Comoros. Major natural plant assemblages
include dense humid forests, shrubby thickets and open woodlands, although the number of endemic
species is not known (see Gurib-Fakim, 2003).
Kenya - Coastal forests in Kenya are estimated to cover a surface area of about 660 km2, however, the
majority of them are now degraded (Burgess and Clarke, 2000). According to White (1983), Kenya's
coastal forests fall within the northern range of the broad Zanzibar-Inhambane Regional Mosaic, an
extensive biogeographical unit stretching from the southern tip of Somalia to the southern coast of
26
Mozambique. Due to its plant endemism, the northern area has more recently been re-classified as the
Swahilian Regional Centre of Endemism (Burgess and Clarke, 2000). The vegetation types are mostly
semi-evergreen or evergreen undifferentiated dry forest (Burgess and Clarke, 2000; Clarke, 2000).
Examples of coastal forests in Kenya include Arabuko-Sokoke, Tiwi and Diani Forests.
· Figure 2-5
Phytogeographical zones (or phytocaria) of the WIO region. V - Cape Regional Centre of Endemism,
XV Maputoland-Pondoland Regional Mosaic, XIII b Swahilian-Maputaland Regional Transition Zone, XIIIa
Swahilian Regional Centre of Endemism (adapted by Burgess and Clarke, 2000, from White's 1983 map).
Madagascar - Two phytocoria cover the island, the East Malagasy Regional Centre and the West
Malagasy Regional Centre of Endemism (White, 1983). Although Madagascar's floristic composition
is distinct from that of Africa, a florisitic link was found between this island and eastern Africa, with
13 genera shared between the Swahilian and Madagascar/Mascarene phytocoria (Burgess and Clarke,
2000). About 8,500 species were known to occur in these two centers, some endemic families and
genera, respectively, being Didiereaceae, Sarcolaenaceae, Humbertiaceae and Dypsis, Tambourissa
and Tina (White, 1983). According to Gurib-Fakim (2003), up to 80 % of the Madagascar flora is
composed of endemic species.
27
Mascarene Islands - Mauritius has some 300 plant species, 50 % being introduced plants and only
seven species are endemic (Gurib-Fakim, 2002). Areas of the coastline, such as Flic en Flac, are
generally dominated by introduced species such as Filao (Casuarina), reported to a poor ability to
recover from cyclone damage (Baird and Associates, 2003). Rodrigues possess 75 species out of
which only five are endemic.
Mozambique - Coastal forests in Mozambique cover an estimated surface area of 1,790 km2 (Burgess
and Muir, 1994; Burgess and Clarke, 2000). Recent studies in the Quirimbas National Park, northern
Mozambique, have identified five vegetation communities, namely: Acacia-Grassland, Miombo-
Velloziace, Mixed Woodland, Miombo Woodland and Coastal thicket (Bandeira et al., 2007). Two
special vegetation associations found in coastal areas are the community dominated by Icuria
dunensis, an endemic tree in Zambezia, Nampula and Cabo Delgado provinces in northern
Mozambique (Izidine and Bandeira, 2002) and that dominated by Brenaniodedron carvalhoi (ex
Cynometra carvalhoi) and Cynometra fischeri, also endemic to northern Mozambique (Eduardo
Mondlane University Herbarium records and Palgrave, 2002). In southern Mozambique, the dominant
habitats include the coastal dune mosaics, coastal grassland, and miombo woodland. The southern tip
of the country is home of Maputaland Centre of Endemism known to house some 230 endemic
species in Mozambique and northern South Africa (KwazuluNatal) (Wyk and Smith, 2001). The
woody glassland and sand vegetation of Licuati Forest also possess large numbers of endemic species.
The area extends from southwest Maputo Bay southwards to South Africa and includes ancient
coastal dunes, up to 30,000 years old that contains many of the endemic species of the Maputaland
Centre of Endemism (see Wyk and Smith, 2001).
Seychelles Even with its 115 islands, the original vegetation has somehow changed since the arrival
of humans. Main dominant vegetation associations now include the high altitude moist forest of the
granitic islands, mid-altitude vegetation, coastal lowland vegetation and the vegetation on raised
coralline islands. Seychelles possess some 250 species of indigenous plant species, out of them 75 are
reported endemic (see Gurib-Fakim, 2003). Examples of endemics species include Vateriopsis
seychellarm (`Dipterocarp'), Lodoicea maldivica (`Coco de mer') and Deckenia nobilis (`Palmiste')
(Hill and Currie, 2007).
Somalia - Little coastal forest w nremains in Somalia, though the best lowland forests in country did
extend along the Jubba and Shabeelle river valleys, for most of their length. However, between 1960
and 1987, the forest along Jubba valley was reduced from 93.5 km2 to 9.0 km2 (Burgess and Clarke,
2000).
South Africa Much of the country is covered by Maputaland-Pondoland Mosaic which stretches
along the east coast of southern Africa, extending from southern Mozambique (Limpopo River) and
Mpumalanga Province (South Africa) in the north, through eastern Swaziland to the Eastern Cape
Province in the south. Three clear foci of endemism and high biodiversity occur, namely Maputaland
in the north, Pondoland in the middle and Albany further south near Port Elizabeth (Wyk and Smith,
2001). The Maputaland and Pondoland centres make up a total area of approximately 19,500 km2. The
vegetation is comprised mainly of forests, thickets, woodland, grassland and aquatic communities rich
in terms of species diversity (6,000 to 7,000 species), though with relatively low endemism - 15 % of
the species that occur in the Albany centre are endemic, and 60 % are succulent plants. The main
coastal plant associations of South Africa's east coast are coastal scarp forest, Pondoland coastal
forest, coastal lowland forest and dune forest (Pooley, 1997).
Tanzania - Up to 50 individual coastal forests exist from near sea level to highlands rising up to 870
meters (Burgess and Clarke, 2000). These forest habitats include mainly dry forest, moist forest,
hilltop, riverine forest and shrub forest. Notable coastal forests in Tanzania include the Jozane forest,
one of the few remnants on Unguja Island (Zanzibar), Mlola forest on Mafia Island and Ngezi Forest
Nature Reserve on Pemba Island. Apart of these, several sub-centres of endemism have been
described from along the coast of Tanzania, including the "Lindi Local Centre of Endemism" located
some 200 kilometers north of the border (Ruvuma River) between Mozambique and Tanzania, the
28
Matumbi and Kichi Hills, with at least three species of endemic plants, the Pugu Hills, near Dar es
Salaam, and Usambara-Kwale Local Centre of Endemism, at the border between Tanzania and
Kenya, with some 29 species of endemic species of plants (Burgess, 2000).
2.2.6 Fisheries ecology
The WIO region has only a very small portion, less than 5% of the sea, with depths shallower than
200 meters, the zone of seabed known as the continental shelf. The central coast of Tanzania (with the
continental islands of Mafia and Unguja (Zanzibar)), the south-central coastal section of Mozambique
including the Sofala Bank, parts of the west coast of Madagascar and the Seychelles Plateau that
surrounds the main granitic islands of Mahe, Praslin and La Digue are the only areas where there exist
considerable expanses of continental shelf. The remaining 95 % of the region's ocean is deep, mostly
between 500 and 4,000 meters. This deep water surrounds the oceanic islands of Mauritius, La
Réunion, the east coast of Madagascar, all the Seychelles islands excluding those on the Seychelles
Plateau, most of the Natal coast of South Africa, the northern coast of Mozambique extending into
central Tanzania, and almost the entire coast of Kenya and Somalia. All are fringed by a very narrow
continental shelf, rarely wider than a few hundred meters.
Despite this relatively small shallow area of sea, the coastal zone of the WIO region contains
numerous marine ecosystems that are of vital important to the productivity of the region, particularly
its fisheries. Mangroves are located at the estuaries of most rivers and seagrass beds flourish in
shallow, soft bottom environments where the sun's rays penetrate. Coral reefs have developed on
rocky fringes and hard surfaces in clear, well-oxygenated waters, notably along coastlines away from
sediment, forming hundreds of kilometers of fringing reefs along the edge of the continental shelf and
around the oceanic islands. All these ecosystems and the waters they are bathed in support plankton
communities that in turn feed diverse and vast fish populations.
Estimates vary, but the consensus based on the few studies that do exist, estimate a fish diversity for
the WIO region that overall includes some 2,200 species, with few oceans sharing similar
ichthyofaunal richness, about 15 % of the global total of marine fishes. This richness is due to the
large variety of habitats and oceanographic conditions of the region. In addition, within the region
there are zones of high endemism as well as unique groups of fish (Van der Elst et al., 2005). On a
local scale, the Tanzania national fish species lists may reach 1,000 species (see Benbow, 1976), that
of the Seychelles over 1,000 species, or a smaller scale still, 552 species of fish recorded for the
Toliara reefs in the south-west of Madagascar (Gaudian et al., 2003).
Of the 2,200 species of fish so far recorded for the region, plus the countless crustaceans, mollusks
and echinoderms, several hundred are important to five main fishery resources, namely those
associated with coral reefs, those of the shrimp fisheries, the fishery for small pelagic species, that for
larger pelagic species and the deepwater demersal fishery. Whether a fishery resource is exploited or
not and to what level depends on many factors, including shifts in demand for the resource or species,
increasing oil prices affecting the fuel costs or technology available to exploit the resource. With this
in mind, the basic ecological features of the five main fisheries in the WIO are described below.
Coral reef fisheries - The coral reefs of the WIO support thousand of species of animals and plants.
Of interest to humans along these shores are two main resources, the (mostly) edible marine
invertebrates such as octopus, squid, lobsters, crabs, sea cucumbers and fish. The collection, or
gleaning, of marine invertebrates from reef crests, shallow lagoons and seagrass areas is typically
undertaken on foot, especially during low tide. The majority of species taken are relatively immobile
or sessile and the activity may involve all members of a community, but tends to be the preserve of
women and children. A variety of methods are employed, including the simple hand collection of
shellfish (lobsters and crabs) and sea cucumbers into baskets or small nets, the use of natural or
synthetic poisons in pools or in deeper water, the capture of lobster and octopus using spear guns, in
some places by fishers using SCUBA diving gear.
29
Most of the animals collected like this are consumed locally, but some are marketed internationally.
Sea cucumbers (Bêche-de-mer) in particular are exported after preparation, mainly to markets in
south-east Asia. Many gastropods (marine snails) are eaten, but larger and more attractive species are
specifically collected for their shells which are sold to tourists or exporters.
The capture of fish from coral reefs involves the use of a variety of traditional vessels and modern
gears, targeting hundreds of species of fish, but mostly fish of small to medium-sized (1030 cm),
belonging to the families Acanthuridae, Labridae, Lethrinidae, Lutjanidae, Mullidae, Scaridae,
Serranidae and Siganidae. Many are caught using baited fish traps, though nets are important in
fisheries of the larger species. Goat-fish (Mullidae) are caught in gill-nets set in lagoons and over
seagrass beds, and often actively corralled into the net by the fishers. Parrotfish (Scaridae) and some
surgeonfish (Acanthuridae) are also taken in nets as they come in over the reef crest at high tide to
feed. Many species, particularly highly valued groupers (Serranidae) and snappers (Lutjanidae), are
fished using baited hook and line set from dugout sailing canoes, small dhows or other vessels
anchoring on or around reefs.
Penaeid shrimp fishery - In the WIO countries endowed with large river mouths and mangrove
forests, the nutrients-rich sediments support a productive soft sediment ecosystem dominated by
benthic-feeding penaeid shrimps. These in turn support a coastal industrial fishery, notably in the
estuarine fishing grounds of the Malindi-Ungwana Bay in Kenya, Rufiji and Wami rivers in Tanzania,
Sofala Bank and Maputo Bay in Mozambique and off the west coast of Madagascar (UNEP/GPA and
WIOMSA, 2004b). In Mozambique especially, estuarine penaeid shrimp fisheries make an important
economic contribution (UNEP, 2006).
The mangroves are a vital element in the life of the shrimp acting as a nursery ground for the
juveniles. The entire fishery depends on the rivers that supply the estuaries with freshwater and
nutrients brought to the coast from the hinterland, for some river such as the Rufiji and Zambesi
extending hundred of kilometers inland and draining vast areas of the respective countries.
Fishing for penaeid shrimp is undertaken by both commercial trawlers (1530 m in length) and
artisanal fishermen using seine-nets, traps and scoop-nets, operating on foot or from small canoes.
Many of the commercial vessels in the region are foreign-owned, and operate under license. The catch
is dominated by Fenneropenaeus indicus, Penaeus monodon and Metapenaeus monoceros, but there
is also a significant finfish by-catch. Estimates from Tanzania and Kenya's Ungwana Bay suggest that
the weight of by-catch was twice that of the shrimp with the majority of the valuable finfish by-catch
(commonly snappers, groupers, emperors and jacks) landed aboard and not wasted. However, since
the by-catch also includes juveniles which inhabit the highly productive estuarine areas, prawn fishing
may threaten recruitment to finfish stocks.
Deepwater demersal fishery - Beyond the depth of coral reefs, on the wide expanses of the
Seychelles Plateau, the Saya de Malha Bank (Mauritius) and edge of the continental shelves of
mainland countries and western Madagascar, at depths from 100-200 m, exist a community of
demersal fish that are the target of a deepwater fishery in the region. Various sharks (e.g.
Charcharhinidae), groupers (Serranidae), jacks (Carangidae) and especially deep-water snappers
(Lutjanidae) live on the edges of the continental shelf and slopes, moving to and from shallower
depths for feeding and resting. The crimson jobfish (Pristipomoides filamentous) is a deepwater
snapper and a main target of a trial demersal fishery at Saya de Malha where an estimated potential
sustainable yield of 567 kg/km2 (Grandcourt, 2003). Though not very well researched, the growth
(and recruitment) rates are thought to be slow for members of this fish community and it is widely
agreed that fishing pressure can rapidly over-exploit the resource. Nevertheless, in the Seychelles, this
deepwater resource provides an important contribution to the artisanal fishery. In Tanzania, the setting
of gill-nets for such deepwater species yields sharks and other species but also a by-catch of
Coelacanth which threatens the local population of this rare species.
30
Small pelagic fish and baitfish fishery - In the same way that the inshore waters along the
continental margins of the WIO and the coast of Madagascar benefit from nutrients and sediments that
nurture the mangrove-based shrimp fishery described above, vast population of small pelagic species
feed on the rich plankton of the water column. In the same water off the estuaries of the same rivers
that support the industrial shrimp fisheries described above, schools of herrings, sardines and shads
(Clupeidae), anchovies (Engraulidae), pony-fish (Leiognathidae), scads (Carangidae) and larger
mackerel (Scombridae) comprise an important inshore fishery. Cast-nets, beach-seines, gill-nets,
scoop-nets and traditional and commercial purse-seines are used land vast quantities of these small
pelagic species. In Tanzania, purse-seine fishery is undertaken at night with lights to attract and
aggregate schools of fish, much of which is consumed locally, fresh or dried.
Large pelagic fishery - The oceanic waters of the WIO region are the territory of migratory and
shoaling schools of various species of tuna (notably yellowfin, skipjack and bigeye) all of the
Scombridae family as well as other oceanic species including dorado (Corphyaenidae), sailfish and
marlin (Istiophoridae), and sharks. Collectively these fish are referred to as `large pelagic species',
restricted to warm water, many are know to migrate thousands of kilometers and occur from the
surface to several hundred meters of depth. At certain times of the year, juvenile tuna venture inshore
to feed on small pelagic species (see above) while billfish roam the oceans feeding on pelagic squid,
flyingfish and juvenile tunas.
Stocks of tuna form the basis of two distinct fisheries: a local small-scale inshore fishery and an
international, large-scale and highly mechanized industrial fishery. Of the latter there are two forms,
long-liners that deploy kilometers of baited hooks and purse-seiners capable of rapidly setting 200
meter-deep nets around moving schools. The countries with the largest EEZs, such as Seychelles and
Mauritius benefit the greatest from the pelagic fishery, while smaller mainland Africa countries like
Kenya see little profit from this resource.
2.2.7 Species of special concern
In addition to the diverse ecosystems described earlier, the WIO island states have unique habitats,
with endemism quite a common feature. Species of special concern are those that are threatened by
over-exploitation or by the destruction of their natural habitat. The term also includes rare and
endemic groups, as described below:
Coelacanth - The coelacanth is a `living fossil' previously believed to have gone extinct at the time of
the dinosaurs until the first re-discovery in 1938 by Marjorie Courtenay Latimer who was the curator
of a tiny museum in the port town of East London, South Africa (Ribbink et al., 2006). It is now
classified as critically endangered in the IUCN Red List 2004 and listed on Appendix I of CITES
(UNEP, 2005). Two species of coelacanth have so far been identified in the Indian Ocean region:
Latimeria chalumnae from the Comoros Islands and other parts of East Africa and L. menadoensis
from Indonesia (Ribbink et al., 2006). Coelacanths are usually found at depths of 120-250 meters,
where they congregate in caves, with as many as 14 fish crowded together in a single cave. More than
180 coelacanths have been so far caught, from Comoros, Mozambique, Madagascar, South Africa,
Kenya and Tanzania (Benno et al., 2006). In the last two years, the steep shores off Tanga in northern
Tanzania have yielded over 30 coelacanths, mainly from artisanal fishers using gill-nets for deep
water sharks, driven by the demand from China for the fins (Richmond, pers. comm.). Efforts are
underway to estimate the local population of coelacanths and gazette this area and prohibit the fishing
practice.
Cetaceans (Marine mammals) - Marine mammals of the WIO region are members of the orders
Cetacea (whales and dolphins) and Sirenia (dugong). It is estimated that there are 80 species of marine
mammals worldwide (Carwardine, 1995), of which approximately 34 species occur in the WIO region
(Bandeira, 1997, 2002). Several cetacean species occur in the region only during migration season,
however little information is available regarding feeding ecology, distribution and abundance of these
species present.
31
Dolphins: Species that are encountered within the WIO include the Indo-Pacific bottlenose (Tursiops
aduncus) and common bottlenose (T. truncatus), the Indo-Pacific humpback (Sousa chinensis), the
spinner dolphin (Stenella longirostris) and pan-tropical spotted dolphins (S. attenuata), Risso's
dolphin (Grampus griseus), and rough toothed dolphin (Steno bredanensis) (see Berggren, 2000;
Amir et al., 2005). The main contemporary threat to cetaceans is entanglement in gill-nets (Amir et
al., 2002). Dolphins beachings have happened in Bazaruto (Mozambique) and Unguja Island
(Zanzibar) in 2006 (Jiddawi et al., 2006) and off northern Madagascar in 2008.
Whales: The fishery for whales started in the WIO in 1791 with the arrival of the whaler Delagoa
Bay while exploitation in Seychelles water started later, in 1823 (see Best, 1983). Various species of
whales were captured, including, sperm whale (Physester macrocephalus), humpback whale
(Megaptera novaengliae) and the right whale (Eubalanea glacialis). Humpback whales and sperm
whales are two of the species that have been known to strand in some beaches of Zanzibar and
mainland Tanzania, for unknown reasons. Threatened whales within WIO are shown in Table 2-12.
· Table 2-12 Threatened whale species within the WIO region.
Species of whales
Status
Megaptera novaeangliae (Humpback whale)
Vulnerable
Balaenoptera borealis (Sei whale)
Vulnerable
B. edeni (Tropical whale)
Data deficient
B. musculus (blue whale)
Endangered
B. physalus (common rorqual)
Endangered
Mesoplodon densirostris (Blainville's beaked whale) Data deficient
Physeter macrocephalus (Sperm whale)
Vulnerable
Eubalaena glacialis (Right whale)
Endangered
Source: www.iucnredlist.org/ (2007)
Dugong: Dugongs (Dugong dugon) are usually found where there are extensive seagrass meadows
which occur from the high inter-tidal to shallow sub-tidal areas off the coast. Within the WIO region,
the largest known population of dugong is found in Bazaruto Archipelago in Mozambique where up
to 200 dugongs were counted in 2007 (Guissamulo pers. comm.). Others are known from around
Lamu Island (Kenya), Aldabra Atoll (Seychelles) and from accidental catches in Tanzania (off the
Rufiji Delta) and Comoros.
Whale shark -The Whale shark (Rhyncodon typus) is the largest fish in the world's oceans,
distributed worldwide, and occurring in all tropical and warm temperate waters. The first scientific
record of this fish in the Indian Ocean dates back to 1828 and specifically from the Seychelles, to
1768 (Rowat and Engelhardt, 2007). Currently, the whale shark is listed on Appendix II of the
Convention on the International Trade in Endangered Species (CITES) and also included in the
Agreement on Straddling Fish Stocks and Highly Migratory Fish Stocks of the United Nations
Convention on the Law of the Sea (UNCLOS) (Rowat and Engelhardt, 2007). Though widespread,
there are regular siting and aggregations at two locations, off Silouette Island (Seychelles), Mafia
Island (Tanzania) and Bazaruto Archipelago (Mozambique).
Turtles - Five species of turtles are found in the WIO: green (Chelonia myda), hawksbill
(Eretmochelys imbricata), olive ridley (Lepidochelys olivacea), loggerhead (Caretta caretta) and
leatherback (Dermochelys coriacea) (see Frazier, 1980; Howell, 1993). All five species are featured
on the IUCN Red List of Threatened Animals (1996 version), with the hawksbill and leatherback
listed as `critically endangered' and the green, loggerhead and olive ridley as `endangered'.
Turtles have complex life cycles, migrating between different foraging grounds at different times of
their life, often hundreds of kilometers apart. They also migrate from these foraging grounds to
32
nesting beaches during the reproductive season. The leatherback is reported off South Africa's east
coast during the months of November and December (Humphrey, 1998). The number of nesting
female hawksbill turtles in the Seychelles has declined by more than 50 % over the past 20 years, and
is expected to decline significantly more in the next five years (J. Bijoux, pers. comm.) This decline
has been attributed to intense over-harvesting of nesting females during the 1970s, 1980s and early
1990s, which prevented successful reproduction at numerous nesting sites in Seychelles. Since 1981,
more than 2,000 nesting green turtles have been tagged at Aldabra (Seychelles). The present
knowledge of turtle migrations was derived in part from turtle tagging on Aldabra, and from a
comprehensive tagging programme along the coast of Natal, South Afirica.
Seahorses - Seahorses (mainly of the genus Hippocampus) are listed as vulnerable or endangered on
the IUCN Red List, but are traded worldwide as souvenirs, aquarium fish and, primarily, for use in
Asian traditional medicines. Given concern over the sustainability of this trade, the genus was added
to Appendix II CITES. This is a genus that could provide early warning signs of depletion of is wild
populations. Their biology renders them particularly vulnerable to habitat loss (shallow coastal
habitats with seagrass beds and coral reefs) and over-exploitation. Fiver species of seahorses have
previously been recorded in East Africa, namely Hippocampus histrix and H. kelloggi, H.
borboniensis, H. camelopardalis and H. fuscus (Foster and Vincent, in press). In Kenya, seahorses are
exported as aquarium fish in negligible numbers and in Tanzania and Mozambique they are sold as
souvenirs to tourists and in bulk to Chinese traders. In Tanzania, seahorse trade has been reported to
export large amounts of seahorse species (alive and dried), mainly to Asian countries, and in Kenya,
though figures are not so high yet, special attention must be paid to it (Mcpherson and Vincent, 2004).
Sawfish - Sawfishes are a group of extremely large, shark-like, rays which occur in the muddy
shallow waters of tropical bays, rivers and lagoons. All sawfishes are classified under the family
Pristidae, derived from an Ancient Greek term for sawfishes. Though fearsome in appearance,
sawfishes are very docile. The toothed rostrum of the sawfishes makes them especially prone to
accidental entanglement in fishing nets and possibly line gear. Sawfish are exploited for their rostra
(toothed saw-like projection), fins and meat and are highly prized exhibits in public aquaria. Some
past sawfish declines are known to have been largely driven by a lucrative market for meat and fins.
Due to decades of incidental capture in nets set for other species, sawfish populations worldwide are
severely depleted and threatened. The two critically endangered species that occur in the WIO are
Pristis microdon and P. zijsron. Both occur in Tanzania, Mozambique and South Africa, and the latter
also in Mauritius.
Giant groupers or Potato bass - Because of their great size, giant grouper or potato bass
(Epinephalus lanceolatus) are rare throughout their range, even in areas that have not been fished.
Found throughout the WIO, giant groupers can attain a body length of 270 cm and weight of 400 kg
(Fishbase, 2006), making them the largest bony fish to be found in coral reefs. They are common in
shallow waters in the WIO Region but they are also found in caves or wrecks. Juveniles are secretive
in reefs and are rarely seen. Giant groupers feed on spiny lobsters, fishes, including small sharks and
batoids, and juvenile sea turtles. The species is listed as vulnerable in the IUCN Red List of threatened
animals. Its populations are thought to be declining at average rate of 20% in 10 years (Shuk Man and
Wai Chuen, 2005).
Coconut crabs - Coconut crab (or robber crab), Birgus latro, is the largest terrestrial arthropod on
earth (Grub, 1971). They have been found to attain weights in excess of 5 kg (Fletcher and Amos,
1994) and are very powerful creatures with extremely strong pincers (or `chelae') that can easily cut
through an ordinary broom handle (Johnson, 1965). The coconut crab comes from the same family as
the hermit crab, the Coenobitidae, which contains only two genera Coenobita, the land-hermit-crabs,
and Birgus, containing only the coconut crab, B. latro (Johnson, 1965). Although the two genera
appear very different in adulthood, they share extremely similar juvenile lives. Like adult land hermit
crabs, the coconut crab occupies an empty snail shell when young, eventually growing so big that it
cannot find any suitable shells into which to inhabit, and then undergoes metamorphosis into the adult
form (Murdoch, 2004). The coconut crab lives almost exclusively on small tropical islands, yet
33
despite this wide distribution, it is threatened with extinction. In remote regions, the crab has become
a valuable cash food crop, considered a delicacy and eaten privately or sold in restaurants. Intensive
harvesting in combination with the ease of capture has resulted with the crab's virtually extinction in
some countries, thus the need for its recently-acquired IUCN Red List status (Fletcher and Amos,
1994). In Zanzibar they are common on Chumbe and Misali islands (Pemba, Zanzibar), on Mafia
Island, and in Kenya on Wasini Island.
Species threatened by curio trade - In addition to seahorses (see above) some other species that are
harvested for the curio trade and listed in Appendix II of CITES include the Blue Coral (Heliopora
coerulea), Organ-pipe coral (Tubipora musica), Staghorn corals (Acropora sp.), Giant Clam
(Tridacna sp.), and some species of cowries (Cyprea sp.), Cone shells (Conus sp.), Auger (Terebra
sp.), Murex (Murex sp.), Conch (Lambis sp.) and the giant triton shell (Charonia tritonis). Countries
with highly threatened marine curios include Comoros, Mozambique, Madagascar, Kenya and
Tanzania.
A summary of the status and main threats of the species of special concern is shown in table 2.12.
· Table 2-12 Species of special concern in the WIO: their status and main threats.
Species
Status
IUCN red list
Main threats
Coelacanth
Critically endangered
Accidental mortality (by-catch)
(Latimeria chalumnae)
Dolphins
Deficient data or low risk
Accidental mortality, water pollution,
(various species)
harvesting (food, trade), cultural, scientific
and leisure activities
Whale shark
Vulnerable Harvesting
(food,
trade), poor recruitment,
(Rhincodon typus)
low densities
Seahorses
Deficient data
Habitat loss/degradation, harvesting (trade,
(Hippocampus spp.)
cultural, scientific, leisure activities), water
pollution, accidental mortality
Saw fish
Endangered and critically
Habitat loss/degradation, harvesting (for food,
(two species)
endangered
trade and medicine), accidental mortality (by-
catch), pollution, human disturbance
Giant grouper
Vulnerable; extinct in Mauritius
Habitat loss/degradation, harvesting (for trade,
Epinephelus lanceolatus
medicinal and cultural habits), accidental
mortality, low density
Coconut crab
Deficient data
-
(Birgus latro)
Whales
Low risk, endangered,
Harvesting for national and international
vulnerable and deficient data
trade, accidental mortality (by-catch)
Sea turtles
Endangered and critically
Habitat loss and degradation, accidental
(five species)
endangered
mortality, harvesting (food)
Dugong
Vulnerable
Habitat loss and degradation, harvesting
(Dugong dugon)
(food, trade, medicine, cultural and scientific
activities), accidental mortality, pollution,
natural disasters, slow population growth
rates, human disturbance
Source: www.iucnredlist.org/ (2007)
34

United Nations
Global Environment
Environment Programme
Facility
Transboundary Diagnostic Analysis of
Land-based Sources and Activities in the
Western Indian Ocean Region
CHAPTER 3 - SOCIO-ECONOMIC SETTING
Draft
November 2008

UNEP-GEF WIO-LaB Project
Addressing Land Based Activities in the Western Indian Ocean
Table of contents
3
Socio-economic setting .................................................................................................... 3
3.1
General socio-economic characteristics ................................................................... 3
3.1.1 Introduction ........................................................................................................... 3
3.1.2 Demographic characteristics.................................................................................. 3
3.2
Socio-economic activities .......................................................................................... 6
3.2.1 Fishery resources ................................................................................................... 6
3.2.2 Aquaculture resources ......................................................................................... 12
3.2.3 Tourism................................................................................................................ 13
3.2.4 Industry................................................................................................................ 15
3.2.5 Agriculture........................................................................................................... 17
3.2.6 Mining ................................................................................................................. 20
3.2.7 Solar Salt Production........................................................................................... 20
3.2.8 Oil and gas production......................................................................................... 20
3.2.9 Shipping and ports............................................................................................... 22
3.3
Valuation of ecosystem goods and services............................................................. 23
3.3.1 Overall valuation of key ecosystems in the region.............................................. 26
3.3.2 Valuation of key economic activities (ecosystem uses) in the region ................. 29
3.4
Conclusions ............................................................................................................. 30
UNEP-GEF WIO-LaB Project
2
3 Socio-economic
setting
3.1 General socio-economic characteristics
3.1.1 Introduction
The socio-economic characteristics of the WIO region are largely dictated by the availability and
patterns of natural resource utilization. Among the most significant coastal and marine resources are
diverse fisheries, those associated with coral reefs, mangroves, coastal forests, seagrass beds and
coastal wetlands, minerals (including oil and gas) and agricultural land. These resources provide
opportunities for numerous extractive activities of subsistence and commercial value. The coastal
communities depend on these resources for their livelihoods, particularly for acquisition of food, fuel,
shelter and income, while the condition of these resources determines the social and economic status
of these communities.
The WIO countries are at various stages of economic growth, with considerable differences in the
Gross Domestic Product (GDP) and the majority are classified as `poor' by World Bank criteria. The
overview shown in Table 3-1 indicates that the mainland countries have relatively higher GDP
compared to the island states. On the other hand, Seychelles had the highest GDP Per Capita (PPP) in
2004, followed by Mauritius, South Africa, Comoros, Kenya, Mozambique, Tanzania and
Madagascar (UNDP, 2006). This reflects the fact that Seychelles, Mauritius and South Africa that
have per capita GDP of over US$ 10,000 per annum are enjoying relatively higher living standards
than the other countries, other factors being equal. The same follows from a comparison of the human
development indexes (HDI) for each of these countries (see Table 3-1), with the highest values for the
most `developed' nations of Seychelles, La Réunion (France) and South Africa.
3.1.2 Demographic characteristics
Figure 3-1 displays the distribution of population in the WIO region. The countries of the WIO region
have a combined population of approximately 167 million people, of which approximately 24 % (39
million people) live within 100 km of the coast (see Table 3-1Table 3-1 Land area, population size,
life expectancy and GDP of the Western Indian Ocean countries.). The population density varies in
the region with some countries such as Madagascar and Mozambique being sparsely populated, at
population densities of 27 and 23 people per square kilometer respectively, while other countries such
as Mauritius and Comoros are very densely populated, at 581 and 315 persons per square kilometer
respectively (UNEP/GPA and WIOMSA, 2004b; The Encyclopaedia of Earth, 2007).
Much of the coastal zones of the mainland African countries are experiencing an influx of new
residents and rapid expansion of economic activities. Population growth in coastal areas places heavy
demands on inshore marine ecosystems, notably seagrass beds, coral reefs and mangrove forests,
leading to damage and depletion of some species. All WIO countries have some form of coastal
infrastructure, much of which is related to particular economic activities such as tourism, ports and
harbors, industry, mining, road and railway transport. These activities are usually the attraction of the
immigrant population (UNEP/GPA and WIOMSA, 2004b), seeking to better their lives and improve
their status.
According to World Bank projections, the annual population growth rate in the region in 2005 ranges
from 1 % in Seychelles to 2.7 % in Madagascar (Table 3-1). Similarly, life expectancy in the WIO
varies from country to country, with the Small Island States having relatively higher life expectancy
compared to the mainland countries.
UNEP-GEF WIO-LaB Project
3


· Figure 3-1
population distribution in the WIO region
UNEP-GEF WIO-LaB Project
4
· Table 3-1
Land area, population size, life expectancy and GDP of the Western Indian Ocean countries.
Country
Area
Pop.
Coastal
GDP
GDP Per
HDI
Pop.
Life
(km2) (millions)
pop.
2004
Capita
growth expectancy
(millions)
(US$
(US$)
rate
billions)
2004
Comoros
2,170 0.8
0.572 0.4 1,943 0.556
2.1 63
Kenya
582,650 33.5
3 16.1 1,140 0.491
2.3 49
Madagascar
587,040 18.1 5.92 4.4 857 0.509
2.7 56
Mauritius
2,040 1.2 1.22 6.0 12,027 0.800
0.8 73
Mozambique
801,590 19.4 6.154 6.1 1,237 0.390
1.9 42
Réunion (France)
2,517 0.766 0.766
-
-
- -
*80.2
Seychelles
455 0.082 0.082 0.7 16,652 0.842 1.0
73
Somalia
637,657 8.45
1 3.6
-
- 3.0
48
South Africa
1,219,912 47.2
11.664 212.8 11,192 0.650
1.1 48
Tanzania
945,087 37.6 8.625 10.9 674 0.430
1.8 46
TOTALS
167.098 39.003
Abbreviations: HDI Human Development Index; Sources: Gossling, 2006; UNDP: Human Development Report 2006;
Kelleher and Everret, 1998; Hatziolos et al., 1994; World Bank, 2001; World Bank, 2008. Source: World Bank, 2007, 2008;
UNDP: Human Development Report 2006; *Life expectancy in France
The paragraphs that follow describe the salient demographic features of the WIO countries:
Kenya The population is about 33.5 million with about 3 million (or 9.2% of the total) residing in
the Coast Province. Population size and density on the Kenyan coast varies from place to place with
the highest density in the urban centres, resulting from significant rural-urban migration, like
Mombasa, Malindi, Kilifi, Kwale and Ukunda. Mombasa is the largest urban centre with a population
of 665,018 (Republic of Kenya, 2005). Rapid population growth, especially along the coast has been
identified as one of the fundamental threats to coastal and marine resources because of the increased
demand for goods and services, and means of livelihood.
Madagascar - About 34% of the population of 18.1 million lives within 100 km from the coast. Much
of the island of Madagascar (larger in area than Kenya) is sparsely populated, with an average density
of about 20 inhabitants per square kilometer. The majority of the population resides in the large cities
such as Tamatave, Antananarive, Masoala and Tulear, such that the countryside and much of the
coastline has a very low human presence.
Mozambique - The population now exceeds 19.4 million people (UNDP, 2006), and according to the
last census, population growth rate is about 2.3% per year (INE, 2000). Approximately 32 % of the
population live in coastal districts, meaning that of all WIO mainland Africa nations, Mozambique
has the highest percentage of population living in the coastal zone.
Somalia Of the total population of 8.45 million, about 1 million (or 12 %) live in the coastal area
(Kelleher and Everret, 1998; Hatziolos et al., 1994), in the towns of Mogadisho ADD
South Africa - About 47.2 million people live in South Africa of which an estimated 11.6 million
people live within 60 km of the coast, equivalent to about 25% of South Africa's population. The
coastal population density of 81 per square kilometer which is high compared to the average African
density of 55 per square kilometer. Population growth rates declined from about 2.9% per year in the
early 1980s to 2.4% in 1995, dropping further, to 1.1% in 2005 (World Bank, 2007).
UNEP-GEF WIO-LaB Project
5
Seychelles and Mascarene Islands - About 95 % of the entire population of the Small Island States
of the WIO, namely Seychelles, Comoros, Mauritius, and La Réunion live within 100 km of the coast
(see Table 3-1). Their combined population is about 2.78 million.
Tanzania Of a total population of 37.6 million, about 8.6 million live in the coastal zone, though
density varies widely. The Dar es Salaam region has the highest population of 2,497,940 people
followed by Tanga with a population of 1.6 million. Dar es Salaam also has the highest population
growth rate of 4.3% followed by Unguja Island (Zanzibar) with 3%. There is a significant rural-urban
migration, particularly to the cities such as Zanzibar and Dar es Salaam due to search for livelihood
opportunities and better living conditions (Mvungi, 2003).
3.2 Socio-economic
activities
Most coastal communities in the WIO region depend on nearby coastal and marine resources for their
livelihood and to generate income. The main activities or uses of coastal resources are fisheries,
tourism, agriculture, industry, forestry, shipping and ports, mining, conservation (e.g. national parks
and reserves), urbanization and infrastructure.
A recent study conducted by Hoagland and Jin (2008) revealed that, in absolute terms, the WIO
region is among the regions with the lowest levels of marine industry1. As recognized in this study,
this underdevelopment of activities is largely related to the low level of overall socio-economic
development of the region, and it can therefore not be denied that coastal and marine related activities
such as tourism and fisheries are important economic factors to the region.
More details on the various types and levels of economic activities in the WIO regions are presented
in the following sections, beginning with perhaps one of the most shared and transboundary resource
of all, fisheries.
3.2.1 Fishery resources
The area of sea defined by the FAO for the `Indian Ocean Western' covers about 8 % of the world's
oceans and generates about 4 % of the global fish catch, equivalent to about 4 million tonnes of fish
per year (see Figure 3-2), from a global total of about 120 million tonnes (FAO, 2000; Van der Elst et
al, 2006). Part of that is derived from the northern waters of this fishing zone, particularly the Red
Sea, Arabian Gulf and Arabian Sea which are included in the FAO definition. In this assessment, the
`western Indian Ocean' region is considered to extend only as far north as Somalia and is thus a
smaller area than that defined by FAO, hence likely only to produce three quarters of the total landing,
or around 3 million tonnes per year.
The 30 million coastal inhabitants of these developing countries have a high dependence on coastal
and marine resources, with fisheries of high importance to the region in terms of food security,
employment, and income generation (FAO 2001, 2003). For most countries in the region, these
resources are either primary contributors to their GDP (through export earnings) or vital elements of
socio-economic stability in their coastal region (Van der Elst et al., 2005).
1 The study used an indexing system, comparing Large Marine Ecosystems (LMEs) around the world, on the
basis of different types of marine activities.
UNEP-GEF WIO-LaB Project
6
4.4
es)
nn
4.3
n to
llio
4.2
mi
N (
4.1
TIO
4.0
UC
OD
3.9
PR
S
RIE
3.8
HE
3.7
FIS
1999
2000
2001
2002
2003
2004
2005
YEAR
· Figure 3-2
Total marine catch in the Indian Ocean (West) (Source: FAO Fisheries Statistics, 2007).
Data show that marine fish production in the WIO region has increased since 2000 by about 10 %,
probably attributed to an increase in fishing effort, however, it is also recognised that the landing data
used by the FAO for fisheries statistics are not reliable for all countries in the region, and are likely to
be under-reporting and distorting actual fish landings (both from artisanal and the industrial sub-
sectors). This is the situation for much of central and northern Mozambique, most of Tanzania and
Kenya and likely large parts of Madagascar. Speculation, modeling or other important use of such
data should therefore be avoided. Whatever the total figure of fish production from wild stocks, there
is concern based on the declared landings that the WIO may be approaching its maximum harvest
potential of about 4 million tonnes per annum. On a more local level, fisheries data for South Africa,
Seychelles and the tuna operations of the Mascarene Islands fisheries are of high quality and suitable
for management purposes, in some cases with accurate records extending back fifty years or longer.
Most of the various coastal fisheries of the region are the focus of local (usual artisanal) communities,
while the oceanic fisheries are mainly harvested through seine-netting and long-lining, by foreign
fishing vessels from Europe and Eastern Asia, with some trans-shipment and cannery in the region,
primarily for export (FAO, 1997). At the artisanal level, over 150 different fishing activities have
been identified in five WIO countries, ranging from passive trap net fishing conducted at village level
to extensive beach seine operations (Van der Elst et al., 2005). It is concluded that the majority of the
region's artisanal fisheries are not adequately supported by scientific information and that
management strategies need to be improved if the enormous development challenges of East African
countries are to be met.
Table 3-2 provides an overview of artisanal fisheries activities in the WIO region. Restricted to
inshore areas mostly, the artisanal fishery is conducted over a range of coastal habitats such as sandy
beaches, estuaries, coral reefs, lagoons, wetlands, bays, mangrove forests and seagrass beds, but rarely
oceanic waters. They are carried out by the coastal communities who fish on a small scale, using
simple equipment (often without engines) for own use and to supply surplus catch to the domestic
market, or in some cases, to fish exporters. Typically, individual daily catches per fisher are a few
kilogrammes. Significantly, this low-yield, but widespread fishery accounts for more than 80 % of the
total marine catch in Tanzania, Kenya, Comoros and Madagascar. For all countries in the WIO, small
catches are made of spiny lobsters (Panulirus versicolor, P. penicillatus, P. longipes and P. ornatus),
mangrove crabs (Scylla serrata), octopus, squid and sea-cucumbers, either for local consumption
(especially to tourism sector) or for export in small quantities.
UNEP-GEF WIO-LaB Project
7
· Table 3-2
Main artisanal fishing statistics per country.
Country
No. artisanal
Artisanal catch Principal fish families
fishers
(t/yr)
Comoros 1
8,000
5,500 - 7,507
Scombridae, Gempylidae
13,500 (`97)
Kenya 3
10,000
8,000 16,000
Lethrinidae, Siganidae, Scaridae, Lutjanidae,
Epiniphelus, tuna, Caranxprawns.
Madagascar 4
10,651
12,382 70,000 Mugelidae, Serranidae, Carangidae, Gerridae,
Hemiramphidae, Elopidae
Mauritius 5
4,200
9,489 (`04)
Lethrinidae, Mugilidae, Siganidae, Acanthuridae,
10,765
Scaridae.
Mozambique 6
70,000 100,000
Siganidae, Monacanthidae, Labridae
120,000
Réunion (France) 2
521 866
Scombridae,
Sparidae
Seychelles 7
1,700 1,800
4,000 5,000
Carandiae, Sphyraenidae, Scombridae, Siganidae,
Serranidae, Scaridae
Somalia 8
4,200 6,000
Lobsters,
Sharks
South Africa
5,183 2,153
Mugilidae, Carangidae, Ammbassidae,
(KwaZulu Natal only) 9
Scombridae, Leiognathidae, Gerridae,
Tanzania (including
58,000 70,000
Lethrinidae,
Serranidae, Siganidae, Mullidae,
Zanzibar) 10
Lutjanidae, Caramgidae, Scombridae, Cluepidae
Sources 1: Williams (1989), WWF (2005); 2: Direction Régionale de l'Environnement (2003); 3: Malleret et al.,
(2004), Ochiewo (2004), WWF (2005), Kenya Fisheries Dept. (2007); 4: Ralison (1989), Stabrawa (1999), WWF
(2005); 5: Ministry of Fisheries (2005); 6: Hoguane et al., (2002). Santana-Afonso et al., (2004), WWF (2005); 7:
Robinson and Shroff (2004), Robinson et al., (2004); 8: Kelleher and Everrett (1997), Fielding and Mann (1999),
Hatziolos et al. (1994), Lovatelli (1995), World Bank (2001); 9: ORI-unpub. data (2006), FAO Fisheries Country Profiles
(2005), IUCN, Jakarta mandate (2002), Ochiewo (2004); 10: Jiddawi (2003), TCMP, (2001), WWF (2005).
The sections that follow describe the salient features of the fishery sector of each of these countries.
Comoros The fisheries are essentially artisanal, practiced on all three islands. Very few biological
investigations have been undertaken, and documentation of catches, efforts and species is scarce
(William, 1988; Walmsley et al., 2006). The productivity per unit area of the Comoros fishing
grounds is roughly 7 tonnes per square kilometre which is a slightly higher than 5 tonnes often
assumed for highly productive coral reef grounds (see William, 1988). However, the fishery is
regarded as at or near the level of full exploitation (Talla, 2005), with a total fish landing of about
7,700 tonnes in 2003 (Cunningham and Bodiguel, 2005), up from 5,500 tonnes in 1990 (Stabrawa,
1999). Pirogues and vedettes powered by engines are used with hand-lines, gill-nets and traps.
In Comoros, fisheries production has generated export earnings since the latter part of the 1980s.
Furthermore, it has been estimated that up to 30,000 tonnes of fish could be landed per year from the
Comorian EEZ, using vessels equipped for deep-water fishing for both demersal species (e.g.
snappers) and oceanic species like tuna and billfish. As with neighboring Tanzania, illegal deep sea
fishing is reported but accurate estimates of landings remain elusive.
Kenya - The contribution of the marine fishery to overall national fisheries production in Kenya is a
very modest 3-4 % (FAO, 2003) with only between 47 % of that comprising fish from the Indian
Ocean. Marine landings average 7,000 tonnes per year (for 1990-2002), but estimates for all `inshore'
landing reach 16,000 tonnes (King et al., 2003). Lake Victoria catches dominate the national total of
200,000 tonnes (UNEP, 1998, Nzungi, 2003), nevertheless, the marine capture fisheries potential is
estimated at 150,000 tonnes but with a value of about US$ 7 million. Kenya's EEZ is reported to
UNEP-GEF WIO-LaB Project
8
include part of the richest tuna belt in the Indian Ocean (Kariuki, 2005) though sustained utilization of
this resource remains a challenge and no data are available.
The artisanal fisheries in Kenya are multi-species in nature with a productivity of 5.5 tonnes per
square kilometer. It is estimated that the artisanal fisheries generates over US$ 3.2 million per year,
landing over 95% of the marine catch (UNEP, 2006). Dhows, outriggers canoes, planked boats are
used to fish with gill-nets, hand-lines and tangle-nets. The most productive fishing areas include the
Lamu area that covers Kiunga, Kizingitini and Faza, the Malindi Bay and Tana River Delta, and the
south coast around Majoreni and Vanga (Ruwa et al., 2003). Consequently, most fishing is confined
to the shelf area close inshore, among coral reefs.
After decades of growth, the artisanal fishery is now considered fully exploited with over-fishing and
intense fishing over coral reefs with ensuing changes in community structures. Reef degradation
adversely affects the productivity and diversity. Similarly, trawling for shallow water prawns in the
Malindi Ungwana Bay has resulted in destruction of the seagrass habitat, and impacted on
productivity and fish diversity, with resultant conflicts between artisanal fishers and trawler operators.
Madagascar Artisanal fishing is characterized by `traditional' fishers using non-motorised vessels,
with others using motorized boats with engines of less than 50 horsepower (Mathieu, 2005). The
industrial sector includes shrimp trawlers and deep sea tuna vessels.
Madagascar has about 10,651 fishers, some of who are engaged full-time and others part-time. The
most recent estimate of the catch is 12,382 tonnes for 1983 (Ralison, 1989), but more recent landings
exceed 70,000 tonnes per year (WWF, 2005). These traditional fishers contribute significantly to the
enrichment of the population's diet and in 2002 were responsible for about 53 % of the total marine
fish catch (Mathieu, 2005). Artisanal gears typically include various gill-nets, traps and beach seines.
The deepwater, offshore, industrial fishery is accessed by about 100 vessels and lands about 25,000
tonnes a year, mainly of tuna, mostly for export. The shrimp fishery is also an important foreign
exchange earner in Madagascar with over 7,600 tonnes landed in 1995 (FAO, 1997), increasing to
11,500 tonnes (FAO, 2003). The artisanal shrimp fishery, which is of good quality, is supplied to
large processing units. For all three categories of the shrimp fishery, the period of fishing is opened
from March to November. It has been estimated that the fishery for small pelagic species has a
potential yield of 135,000 tonnes for the west coast and 11,800 tonnes for the east coast.
Mauritius - With the ever-increasing demand for marine products and the incentives given to
professional offshore fishermen, the artisanal fisheries in Mauritius have experienced a significant
drop in catch, from 1,302 tonnes in 2002, to 947 tonnes reported more recently (Jahengers, 2004).
Fisheries in Mauritius provide direct and indirect employment to around 10,000 persons, with about
2,500 fishers in 2004, mostly engaged in the artisanal fishery. Invertebrates are fished to a minor
extent, but some species (e.g. octopus) are now completely absent from the local market as fresh,
local product being only available frozen, imported from neighboring countries. The nearby
Rodrigues octopus fishery has similarly been heavily affected with a considerable decline in catch and
size over the past years. Vessels include wooden pirogues of 6-10 meter length with hand-lines,
basket traps, large nets, gill-nets and harpoon or hand spears.
The artisanal sector of Mauritius landed 1,043 tonnes of fish with a value of US$ 4 million. In 2004,
the St. Brandon fishery landed over 250 tonnes of fish (including about 2 tonnes of lobster), while the
annual tuna fisheries production of the entire EEZ is between 9,470 and 10,765 tonnes, of which
about 90 % of the product is exported.
Mozambique - The fishing industry is one of the largest generators of foreign income in
Mozambique, with shrimp contributing to about 50 % of the export in the late 1990's, most of that
coming from the Sofala Bank (FAO, 1997). The contribution made by shrimps has however dropped,
UNEP-GEF WIO-LaB Project
9
to about 21 % (Macia, 2004). Total marine fishery production is estimated at between 100,000 to
120,000 tonnes per year and consumption is estimated at 7.5 kg per capita (Hoguane et al., 2002).
While the industrial fishing, at various levels, contributes significantly to overall landings, the
artisanal fisheries provides livelihoods for more than 70,000 fishers and their families, and supplies
food to a large part of the population, from the coast and inland. The number of artisanal vessels is
estimated at 15,269 (IDPPE, 2004; Hoguane et al., 2002). Wooden, un-motorised canoes are
commonly used to reach fishing grounds, while hand-lines, cast-nets, beach seines, gill-nets, trap and
cages, and trolling lines are popular gears. Deepwater fishing by about 150 industrial and semi-
industrial vessels earns the country over US$ 100 million each year.
Sports line-fishing, mainly by South African fishers, has increased significantly since 1992, and with
little or no control in the southern waters of Mozambique, the many reported cases of "sports" fishers
exporting large quantities of line and reef fish to South Africa are credible (Massinga and Hatton,
1996). Apart from fish and shrimp, other important exploited resources near urban centres include
invertebrates such as crabs, clams, and sea urchins (see Bandeira et al., in press; Muthiga, 2005).
Réunion Fish is the second-most important export product of the island after sugar-cane and the
main recipient nations being Japan, the USA and France. The majority of fish products are provided
by the medium and large-scale (industrial) fisheries, accounting for approximately 6,000 tonnes per
year or over US$ 40 million (Direction Régionale de l'Environnement, 2003). Only a small portion,
approximately 866 tonnes per year, at a value of approximately US$ 13 million is derived from small-
scale artisanal fisheries activities, of which a large part is sold locally.
Seychelles The fishery sector, after tourism, is the major exchange earner, and comprises industrial,
semi-industrial and artisanal fisheries sub-sectors. In 1999, Seychelles earned US$ 96 million from
tuna export, derived mainly from the industrial fishery, though the artisanal fisheries is of great
importance in terms of food security, employment, and cultural identity in the Seychelles. The total
catch from the artisanal sector has remained fairly stable since 1985 with landings typically ranging
between 4,000 and 5,000 tonnes per year (Robinson et al, 2004).
The artisanal fishery sector employs approximately 1,000 fishers (using 400 vessels). Spiny lobster,
crab, octopus and sea cucumber are very important resources in this sector, constituting valuable
export products. Smaller boats (pirogues) of 5-16 meter length are used for more inshore areas, with
hand-line, trapping, various nets and SCUB diving gears used widely.
The main fishing grounds in Seychelles for the semi-industrial fleet are the offshore banks and drop-
offs of the Mahe Plateau, which are fished by fully decked inboard vessels (`schooners'). Most of the
catch is sold and consumed locally, and meets the demand of the tourism industry, although a small
percentage (< 5 %) is exported (Azemia and Robinson, 2004).
Somalia - Fisheries data and details are scarce, but a small thriving locally-based artisanal and semi-
industrial fishery does exist, focusing on inshore, demersal species as well as small-pelagic species.
The relatively few artisanal fishers (about 4,200) land about 6,000 tonnes per year while the industrial
fishing fleets land about 21,000 tonnes of fish per year (Hatziolos et al., 1994; Lovatelli, 1995).
Industrial fishing takes place in the EEZ of Somalia for large pelagic species like tuna, though precise
data are scarce. The catch potential for the marine fisheries is estimated at 150,000 tonnes per year but
only 14,750 27,000 tonnes are reported per year (Lovatelli, 1995; FAO, 1998).
South Africa - Indian Ocean fisheries in South Africa are relatively minor compared to the large-
scale, industrial fisheries found on the Atlantic coast. Nevertheless, numerous subsistence fisheries
exist off the Natal coast of the Indian Ocean. The fisheries sector is a relatively small sector within the
national economy of South Africa, with an overall contribution to GDP less than 1 % (FAO, 2001).
UNEP-GEF WIO-LaB Project
10
South African fisheries have generally been well-managed with frequent revision of management
procedures reflecting progressive change within the management structures as well as changes in
international trends (Japp, 2004). Overall, the industrial fishing operation generates approximately
US$ 270 million annually, while recreational fishing generates about US$ 200 million annually. The
small penaeid shrimp fishery contributes about 200 tonnes per annum (FAO, 2003).
The purse-seine fishery for small pelagic species (anchovy, pilchard, round herring, and juvenile
horse mackerel) is South Africa's largest fishery in terms of volume with the 2004 total allowable
catch (TAC), combined for anchovy and pilchard, approximating 600,000 tonnes (SWIOFP, 2006).
The bulk of this catch is however taken in the Atlantic Ocean, with directed fishing for adult pilchard
on the South Coast a recent development (since 2000).
Commercial fishing employs 27,000 people (with an additional 60,000 people employed in related
industries), of which approximately 2.3 % work in the Kwazulu Natal and 13.6% in Eastern Cape
Provinces (Department of Environmental Affairs and Tourism, 2005). Recreational fishing employs
131,000 people in related activities. In addition, at least 3.6 million South Africans depend largely on
coastal food sources through subsistence activities, estimated to be worth US$ 175 million annually.
A range of small, engine-powered boats are used to access sea conditions that can be challenging.
Fishing gears used include on foot beach collection, hook and line, beach-seine, traps, hoop-nets,
shove nets, cast-nets, drag-nets, and gill-nets.
Tanzania As for Kenya, freshwater catches outweigh marine landings. Data for 1984 - 1995, show
marine fish landings ranged from 45,000 - 59,000 tonnes for mainland Tanzania (including from
Mafia Island) and 15,000 - 20,000 tonnes for Zanzibar (TCMP, 2001). The combined annual total of
about 70,000 tonnes is a realistic figure for a fishery that employs an increasing number of fishers,
now estimated 58,000, who land about 90% of all catches (TCMP, 1999).
The coral reefs of Tanzania support 70 % of the artisanal catches (Ngoile and Horrill, 1993), landed
from dhows, outrigger canoes and canoes, using gill-nets, beach seines, hand-lines, fixed traps, basket
traps, poison, dynamite and spear guns. Most fish caught from inshore waters by artisanal fishers are
demersal, but large pelagic species (e.g. tunas) and small pelagic species such as sardines are also
important. Others are sharks, rays, crustacean, octopus and squid (Jiddawi and Stanley, 1999). In
addition, shrimp exports are an important source of foreign exchange. The trawling companies operate
as joint ventures between Tanzanian and foreign companies (TCMP, 2001), and combined with the
artisanal contribution, the shrimp fishery (for export) is worth over US$ 6 million annually.
Deepwater tuna fishing has become the subject of on-going discussions over a fishery that has the
potential to produce between 8,000 and 24,000 tonnes per year from 70 licensed vessels (EC, 2005).
To date however, much illegal fishing has taken place inside Tanzania's EEZ and as for Kenya and
Somalia, true estimates of actual catches are not reported.
Along much of the coast, the collection and fishing of marine products is without restriction or size
limitation, and there is little monitoring, control or surveillance of the artisanal fishery. Some species
of sea shells and sea cucumbers are now considered to be over-exploited, driven by the export market.
There have been few population studies of commercially exploited species, however traders claim that
the sizes have reduced tremendously, though the pressure to continue purchase continues. Shark fin
trade has also declined and some fish species are rarely seen now in Tanzania waters (Barnett, 1997;
Jiddawi and Shehe, 1999).
Artisanal fishing, though an important activity for the coastal population, has contributed to the severe
degradation of the marine environment and reduced overall catches. Destructive fishing practices
continue to be widely uses with considerable damage, especially to coral reefs (e.g. from dynamite
fishing, drag nets and spear-guns. In Tanga for example, the coral reefs were severely damaged during
the 1980s by dynamite fishing as evidenced by the present fractured massive framework of coral
colonies, craters and rubble patterns, exacerbated by anchoring techniques employed by artisanal
fishers, and reducing the recruitment rate of many species (Francis et al., 2002).
UNEP-GEF WIO-LaB Project
11
Problems related to fisheries in the WIO region
The artisanal fisheries in all these countries share similar problems and challenges, most of which are
not adequately supported by scientific information and consequently not addressed by current
management strategies. Improved management is needed across the entire coastal fisheries sector in
much of the region if development challenges are to be met.
Pressure on the coastal zone has been increasing over the past 20 years, as a result of population
growth, the development of international tourism as well as introduction of coastal aquaculture
(Cunningham and Bodiguel, 2005). One common feature of artisanal fisheries in the region is that
they are fully- or over-exploited, especially close to highly populated areas (SWIOP, 2006). Some of
the problems facing the fishery industry in WIO region include:
· Poverty and lack of alternatives livelihood systems: Over-harvesting of marine fisheries in the
region is blamed on poverty, rapid population growth and urbanization. Over-fishing has serious
consequences on fishery yields, livelihood, and conservation. For instance, evidence exists to
show that some sites in WIO have experienced a 40% decline in reef fishery over the last 20 years
(WWF, 2004).
· Destructive fishing practices: Destructive fishing techniques commonly used in the region include
dynamite fishing, inappropriate use of small mesh-size nets and gill-nets, use of seine nets, un-
supervised prawn trawling, and fish poisoning. Due to their high dependence on fishery resources,
degradation of traditional fishing grounds, as well as increased demand for the product, in some
countries fishermen have resorted to using destructive fishing techniques such as poison, spear
gun and dynamite (Muhammed et al., 2005), degrading the very marine ecosystems on which the
fish depend for nursery and breeding grounds (Jiddawi, 1998).
· Transformation of habitats: Across the region, there is very poor understanding of the linkages
between fisheries and the supporting ecosystem such as mangroves, seagrass beds and coral reefs.
Trampling, during collection of octopus, shellfish, sea cucumbers and seaweeds in the shallow
intertidal areas is also causing physical damage throughout the region. Mangroves and other
critical habitats are being cleared and transformed to other land uses (Semesi, 1998).
· Lack of effective governance: Inadequate, and in certain instances outdated, fishery management
plans, policies and regulations have contributed to poor governance of the marine fishery.
· Inadequate capacity for enforcement: Most fishing activities are carried out in remote areas along
the coast. Inadequate capital and financial resources, lack of technical support, and poor staff
management and incentives often hampers effective management of the marine fishery.
· Lack of capacity to explore offshore fishery resources: Poverty, lack of resources and the lack of
private sector involvement in the fisheries sector have hindered exploitation of offshore fish
resources in most parts of the Eastern Africa.
3.2.2 Aquaculture resources
Globally, aquaculture production is largely dominated by freshwater fish species, mainly from
activities in SE Asian countries and China. Marine and brackish water fish and shrimp production has
in recent decades increased significantly, in many parts of the world, contributing about 20 million
tonnes to the capture fishery, equivalent to about 20 % of the global total production (FAO, 2000).
The WIO region is not famed for its aquaculture production, considered non-existent about twenty
years ago, but changes have taken place and currently most countries have at least once experimented
with aquaculture, which in some instances provides an important contribution to local economies.
There are two main forms of cultivation in the region that for macroalgae (for alginates) and for
shrimps and fish (for food and export). Tanzania, in particular Zanzibar, has been farming red algae of
the genera Eucheuma and Kappaphycus for over 15 years, and now exports between 5,000 and 7,000
tonnes of the dried product each year, providing valuable incomes to over 15,000 farmers (mostly
women). Having started in Zanzibar, the practice is since spread to many areas along the coast of
UNEP-GEF WIO-LaB Project
12
mainland Tanzania including Mafia Island, Tanga, Lindi, Mtwara, Bagamoyo and Dar es Salaam.
Outside of Zanzibar, the industry employs at least another 15,000 people. Other countries, for
example Mozambique, are conducting growth trials and the regional production is expected to grow.
Shrimp farming is also relatively new in the WIO region, with a few farms now operating in all
countries except Somalia and Comoros. Experimental trials were conducted in Kenya but were not
taken up commercially. In Tanzania, there is currently a single operation on Mafia Island with others
in the pipeline. Mozambique produces about 540 tonnes, from farms near Pemba and further south.
Shrimp has actually become one of Madagascar's main seafood exports but there is concern that the
development of shrimp farming may be reaching unsustainable levels (UNEP/GPA and WIOMSA,
2004). In South Africa, mariculture is limited by the paucity of sheltered bays, although land-based
aquaculture offers great potential and current production exceeds 5,400 tonnes, while Seychelles
produces just over 1,000 tonnes of shrimp (Hoagland and Jin, 2008). Milkfish (Chanos chanos) and
rabbitfish (Siganus sutor) have been farmed experimentally on Zanzibar for ten years (see Mmochi et
al., 2001; Kyewalyanga, 2004; Sullivan et al., 2007), while moon-pearl oysters and edible oysters
have been the focus of trials of small women groups in Mafia Island and Mombasa, respectively.
Though quantities and contributions to overall fishery production from farmed species remains
relatively small, the expectation is for considerable further expansion, since environmental conditions,
suitable land, brood stock, export infrastructure and labour are readily available in most countries. The
expansion of shrimp farming in particular is likely to be fastest in Tanzania, Mozambique and
Madagascar due to the abundance of suitable conditions and suitable land. However, as Rönnbäck et
al. (2000) conclude, without clear recognition of its dependence on natural ecosystems, the
aquaculture industry is unlikely to develop to its full potential in the region.
3.2.3 Tourism
The WIO region is endowed with good climate, an abundance of beautiful sand beaches and a rich
biological and cultural diversity (UNEP/GPA and WIOMSA, 2004b), resulting in a huge tourism
potential. Tourism is already a major foreign exchange earner and is increasingly becoming important,
particularly in the Seychelles and Mauritius (UNEP, 2006). It also provides employment and
international recognition.
· Table 3-3 Tourist arrivals, average length of stay and total spending.
Country
Tourist arrivals Average length of
Total spending
Spending per
(`000)
stay
(US$ millions)
tourist
Comoros
24 - 15 625
Kenya
915 9.4 329 354
Madagascar
170 21* 115 677
Mauritius
702 - 697 993
Mozambique
550 - - -
Réunion (France)
432 6.7 311 406
Seychelles
122 10.5* 171 1,402
Somalia
- - - -
South Africa
6,640 - 4,270 643
Tanzania
552 8.0 450 815
TOTAL 10,107
6,358
Sources: Gössling, 2006; Gössling and Hörstmeier, 2003; Republic of Kenya, 2006; UNEP/GPA & WIOMSA, 2004b.
UNEP-GEF WIO-LaB Project
13
Tourist arrivals in the WIO region, their average length of stay and total spending vary enourmously
(see Table 3-3). However, it is difficult to delineate the value from tourism related to the coastal
ecosystems because tourist hotspots are interrelated. For example, it is not always the case that all
tourists who visit terrestrial parks also visit marine and coastal attractions. Nevertheless, coastal
tourism is undoubtedly a major factor in the economies of the WIO countries.
Political stability and security major concerns of tourists visiting the region, thus the industry is
vulnerable to sudden perturbation, as demonstrated in early 2008 by political uncertainties in Kenya
that resulted in an 80 % drop in tourist bookings. Mindful that in Somalia, the tourism sector has
never developed due to security problems, these two factors have influenced the level of development
of the tourism sector in each country in the WIO region, as described in the following sections.
Comoros The tourism industry is still not well-developed mainly due to political instability, though
24,000 tourists are estimated to have arrived annually, over recent years (UNEP/GPA and WIOMSA,
2004). The tourism industry contributes about 9.1 % of the GNP and employs about 500 people in
direct and indirect activities. The main tourist activities are beach holidays, sport fishing and other
water-related tourism and eco-tourism. The areas most frequented by tourists are the beaches of
northern Grande Comore, plus the beaches of Chomoni and Bouni, the salt lake and Turtle Island, all
on Grande Comore. The turtle-nesting beaches of Moheli Island and beaches of Mutsamudu and
Moya on Anjouan Island are also tourist attractions.
Kenya - Coastal tourism accounts for over 60 % of Kenya's tourism earnings and a total of 45 % of
the coastal economy. Main tourist activities are coastal and include boating, water sports, sports
fishing and diving. Boat anchoring has impacted negatively on some coral reefs and is cause for
concern. The main sites are the coastlines immediately south (Diani beach) and north of Mombasa, as
well as further to the north, at Watamu, Malindi and Lamu (Republic of Kenya, 2005), many
associated with the well-established marine park network managed by the Kenya Wildlife Service.
In the early 1990's, approximately 800,000 tourists visited Kenya. Before the slump in 1998, tourism
was a leading foreign exchange earner in the country. Over half a million people work in the tourism
sector directly or indirectly and coastal tourism earns between US$ 329 million and 514.3 million
annually and accounts for 60 % of the overall earnings from tourism.
Madagascar - Coastal tourism in Madagascar is concentrated at the coast of the Virgin Islands (of
Cape d'Ambre with Maintirano), the Capricorn Coast (west coast), the Coast of Contrasts (south-
eastern coast and its hinterland) and the Coast of the Purple-wood.
The tourism sector in Madagascar is growing each year. Each year the island receives over 80,000
tourists and tourism accounts for 2 % of the GNP (UNEP/GPA and WIOMSA, 2004). Tourism
activities are mainly cultural and beach-based activities. Revenues from this sector amounted to US$
91 million in 1998 (UNEP/GPA and WIOMSA, 2004b) and US$ 119 million in 2000.
Mauritius - Tourism has grown through the development of high-end hotels and resorts along the
coast. The success to date is largely attributable to the exceptional natural assets of the coastline.
Some 718,861 tourists arrived in Mauritius in 2004 when there were around 10,640 hotel rooms. The
contribution of tourism increased from 3 % of GDP in 1995 to 13 % in 2001 and the total direct
employment in the tourism industry has more than doubled from 1990 to 2001, increasing from about
9,000 to 20,000. Mauritius is planning to develop new and upgraded resort complexes near the coast,
with a total area of 2,000 hectares.
Mozambique - The coast of Mozambique has many excellent natural and cultural resources that have
the potential to serve as world-class tourist attractions, characterized by beautiful sand beaches and
extensive coral reefs. The tourist sector is one of the fastest growing sectors in the country. In 1994,
136,000 tourists visited Mozambique and the number has increased 550,000 in 1998 (UNEP/GPA and
WIOMSA, 2004b).
UNEP-GEF WIO-LaB Project
14
Coastal tourism is well developed in the southern region, with other popular sites at Porta do Ouro
(Machungulo Peninsula), Inhaca Island, the Macaneta Peninsula, the Biline-Xai-Xai-Chonguene
coastline, the Inhambane coastline, the Bazaruto Archipelago, and more recently the Cabo Delgado
Province in the northeast, centered on the port city of Pemba. Some of tourism activities are beach-
based activities and game fishing with game fishing competitions taking place every year in Bazaruto,
Inhambane, Maputo and Ponta do Ouro (Hoguane et al., 2002; UNEP/GPA & WIOMSA, 2004b).
Réunion Tourism on the island is dominated by influx from France, with approximately 80 % of
tourists of an annual 342,000 originating from the `home-land', a large proportion of which (about 34
%) are family connections. Beaches as well as marine-related activities such as diving, sailing and
fishing are popular tourist activities (Direction Régionale de l'Environnement, 2003). The tourism
sector provide employment to 6,000-7,000 persons and an annual income of around US$ 500 million,
representing 3-4 % of the island's GDP.
Seychelles - Tourism is concentrated on Mahe Island and surrounding granitic islands (La Digue and
Praslin) and is one of the most important economic sectors for the country, mainly based on marine
and coastal resources. Seychelles has successfully focus on high-value tourism, and there are plans to
turn the country into a "3-5 star destination" (Gössling, 2006; Gössling and Horstmeier, 2003). In
2000, 130,000 tourist arrivals generated US$ 112 million, corresponding to 20 % of GDP and 60 % of
foreign exchange earnings (Shah, 2002). The tourism industry also provides approximately 5,000
direct jobs (UNEP/GPA and WIOMSA, 2004b).
South Africa - Diverse and abundant natural and cultural resources exist in South Africa, including
wildlife, beaches, shopping infrastructure and cultural activities. Tourism figures have risen since the
late 1980s and exceeded 3.8 million in 1994, rising to 6.6 million in 2004. Between 3040 % of
tourists book holidays near the coast, where the main activities are beach-based, diving/snorkeling and
sport fishing. South Africa is involved in the Blue Flag programme for beach quality, a widely-
recognized programme that assures recreational users of the quality of visits to the beaches.
Tanzania - Coastal tourism is based on beaches, seafood, and aquatic features such as coral reefs and
the nine MPAs. For example, 20-30 % of the tourists who visit Zanzibar annually are attracted by its
suitability for SCUBA diving and snorkeling (Westmacott et al., 2000). Considerable tourism
development is now found on the main Zanzibar island of Unguja, with growing development on the
sister island of Pemba as well as on Mafia Island. Furthermore, there is tourism expansion in Dar es
Salaam, Tanga, Bagamoyo and a few other sites along the coast, most beginning in the 1990s.
Tourism brings in substantial foreign currency and provides important livelihood for the coastal
population. It accounts for 16 % of the national GDP, and nearly 25 % of the total export earnings
(Masekesa, 2003).
3.2.4 Industry
Over the last fifty years, the principle factor that has influenced the level of industrial development in
each country in the WIO region is political stability, since stable governance encourages investment -
a prerequisite for all industrial development. Industrial development, for most countries in the WIO
region, is achieved through value addition (i.e. their net output) to primary production (mainly
agriculture, but also fisheries and mining). Between 2000 and 2006 there has been a general increase
in the value added contribution of industry to the GDP of most of the countries of the WIO region (see
Figure 3-3), while three countries (Tanzania, Comoros and Seychelles) experienced a decline .
UNEP-GEF WIO-LaB Project
15
35
30
25
t
i
on
20
r
i
bu
nt
Value added (% of GDP in 2000)
co
Value added (% of GDP in 2005)
Value added (% of GDP in 2006)
t
a
ge
15
e
r
c
en
P
10
5
0
ue
ar
nya
os
ania
rica
or
ritius
Ke
biq
Af
asc
m
au
Tanz
zam
uth
ychelles
adag
Co
Se
M
Mo
So
M
Country
· Figure 3-3
An overview of the value added contribution of industry to the GDP of WIO countries (World Bank,
2007).
Recognising that at present no industrial development exists in Somalia, the paragraphs that follow
describe the salient features of the industrial development of the remaining WIO countries:
Comoros Lack of investment and political instability has hampered the development of any
meaningful industrial activity to date. The potential exists for processing of specialist food and fish
products for export to neighbouring countries.
Kenya Historically, the port of Mombasa has dominated shipping trade and been the focus of
coastal industries, many associated with export and trade, while the inland capital Nairobi has
attracted industrial development associated with agriculture, mining, pharmaceutical and
miscellaneous other sectors. Over the last six years, the coast has experienced rapid increase in
industrial development due to the incentive to exploit the United Sates of America (USA) market
under African Growth and Opportunity Act (AGOA) initiatives. Textile industries have been
established in the Export Processing Zones (EPZs) in the coast region, especially in Mombasa and
Kilifi districts, while other industries are engaged in primary production and agro-processing for
export as well as local consumption. These include cashew husking works, pineapple canneries, rice
mills, coconut processing and facilities for crops such as coffee, groundnuts and sisal. Cement
manufacture, steel rolling mills, iron smelting and oil refining are also present. The large urban
centres provide the main market for industrial goods. Industrial activities outside Mombasa are
primarily based on the processing of agricultural, livestock and forest produce for the domestic
market.
Madagascar - Most of the industrial activities relate to the processing of agricultural and farmed
animal products, with the exception of the oil refinery at the northeastern port of Toamasina.
Industrial activities around the coast are focused in the ports of Antsiranana, Ambilbe, Mahajanga,
Tolagnaro and Toamasina.
Mauritius - Sugar cane processing is the main industrial activity, with 18 sugar mills producing
500,000 tonnes of sugar in 1994. The manufacturing sector, dominated by textile and clothing has
been a growing industry since 1970. However, the declining sugar prices and end of an era of
perferential trade agreements with the Europena Union, as well as growing competition for Asian
UNEP-GEF WIO-LaB Project
16
textile manufacturing industries, is increasingly putting pressure on these traditional sectors. The
manufacturing industries are mainly located near the harbour of Port Louis.
Mozambique Over the last twenty years, since the end of the 16-year civil war, the industrial sector
has grown fast, with the total number of industrial units listed for Maputo increased from 11 in 1982
to 137 in 1996. The port city of Maputo is likely to witness continued growth in this sector, with
possible parallel development further up the coast at Beira and Pemba.
Réunion The largest industrial sector on island is associated with the goods consumption industry,
i.e. production of goods and services for direct use by its inhabitants. Other large sectors are
equipment manufacturing and agro-industry. Sugar cane processing alone produces approximately
200,000 tonnes of sugar per year.
Seychelles - Agricultural and livestock production are the main form of industry. Other industries
include fish processing and canning, and some breweries.
South Africa - Industrial activities include mining (of platinum, gold, chromium, coal, etc), energy
production, automobile assembly, metal work, machinery, textile, iron and steel, chemicals, fertilizer
and foodstuffs. These activities are mainly based in the large cities of Durban, Richards Bay, East
London, Port Elizabeth and Cape Town. In Port Elizabeth and East London, the industrial sector is
mainly based on manufacturing, the most important being motor manufacturing. Other industrial
activities are textiles and tyres production. At Coega, an aluminium smelter is operational, while
Richards Bay is the centre of operations for South Africa's aluminium industry. In Durban, several
industrial activities exist, like oil refineries, paper factories, chemicals, textiles, rubber goods, ship-
building, sugar milling and tanning. The industrial installations have some form of treatment,
although some waste is discharged directly into coastal waters.
Tanzania - There are many industrial developments in coastal Tanzania. In 1992, Dar es Salaam
hosted 74 industrial units while in the northern port city of Tanga there were five industrial units.
Some of the industries include paper, sugar, textile, chemical, plastics and cement industries. Over the
last decade industrial units have significantly increased, driven by stable and improved economy and
improved power supply options, partly derived from reliable Songo Songo methane gas reserves.
3.2.5 Agriculture
Agriculture is a major economic activity in the WIO region and the backbone of the economy of most
countries. In 1982, 90 % of the population in the region was dependent on agriculture. The use of
fertilizers, pesticides and other farm inputs differ significantly between countries. Despite the
importance of agriculture to economies of many countries in the WIO region, their value added
contribution is much lower than their absolute contributions (see Figure 3-4).
UNEP-GEF WIO-LaB Project
17
60
50
40
i
on
ut
r
i
b
Value added (% of GDP in 2000)
ont
c
30
Value added (% of GDP in 2005)
a
ge
Value added (% of GDP in 2006)
e
r
c
e
nt
P
20
10
0
ia
s
lles
bique
scar
oros
Kenya
om
auritiu
Tanzan
ozam
adaga
C
Seyche
M
M
South Africa
M
Country
· Figure 3-4 Overview of the value added contribution of agriculture to the GDP of the countries of the WIO region
(World Bank, 2007).
Since the 1970's the level and pace of development of agriculture in each country in the WIO region
has diferred, as described in the following sections:
Comoros - Agricultural production occupies approximately 67 % of the land use in Comoros and
employs between 7080 % of the total population. The main crops produced for export are vanilla,
ylang-ylang and cloves. Cereals, rice, potatoes, fruits and legumes are grown mainly for local
consumption.
Kenya - Nationally, agriculture is the mainstay of the Kenyan economy where it supports over 80 %
of the population. It employs 70 % of the country's labour force of over 10 million compared to only 3
million employed in the formal sector. It also generates 80% of the export earnings and supplies over
70 % of raw materials for the agro-industry. Overall the sector contributes to more than 45 % of the
government revenue. It is however interesting that its value added percentage of GDP has remained
small and declining between the years 2002 and 2006.
Agricultural activities along the coast of Kenya produce food and non-food products at subsistence
and commercial levels. The main food crops include cassava, sweet potatoes, maize, coconut, cow
peas and rice which are grown in irrigated areas, marshes, and floodplains. Similarly, vegetables and
tropical fruits such as citrus, mangoes, bananas, pineapples and watermelons are grown for both
subsistence and export. The other crops which are mainly grown for export include cashew nut, bixa
and sisal. The average farm size in the Kenyan coast is 6-8 hectares. Tree crops (cashew nuts,
coconuts, citrus and mangoes) occupy about 50% of the arable land. Traditional shifting cultivation,
and slash-and-burn farming practices are widespread. Livestock production contributes significantly
to the Kenyan coastal economy. There are 85 ranches within the Coast Province of which 25 are
operational. Livestock rearing is mainly concentrated on marginal land of the coastal region that
accounts for 69 % of the total area. The pastoral communities in Tana River district graze large herds
of cattle in the lower ridges of the Tana River basin.
Madagascar - About 3 million hectares of land is under cultivation, of which, less than 2 million
hectares are permanently cultivated. Only 484,000 hectares of the agricultural land are irrigated. Some
300,000 km2 of the total landmass is grazing pasture for cattle. Other forms of land use are forests,
shrub land and urbanization. Both traditional and industrial agriculture practices are present in
Madagascar, with food crops including rice, sweet potato, coffee, vanilla, pepper and maize. The main
UNEP-GEF WIO-LaB Project
18
cash crops include sugar-cane, peas, cotton, tobacco, groundnut and cocoa. The traditional agriculture
contributes 30-60 % of the total agricultural production in Madagascar.
Mauritius - 43% of the land is used for agricultural purposes, with 90 % of this land planted with
sugar cane, producing around 500,000 tonnes of sugar annually. The rest of the agricultural land is
used for tea, tobacco and food crops. The main food crops cultivated are onion, tomato, chili and
eggplants. The past decade has witnessed a constant conversion of agricultural lands to land for
industrial and urban development. In this context agricultural land has decreased by approximately
5,500 ha over the past ten years.
Mozambique - Agriculture contributed 26.1% and 22.3% of the GDP in 2000 and 2005 respectively
(World Bank, 2006). Most of the agricultural activities take place along or close to main river basins
and in the Monapo, Pungoe, Maputo and Incomati river mouths.
Réunion Sugar cane production is by far the largest agricultural sector in La Réunion, accounting
for 32.5 % of total agricultural production at a value of approximately US$ 160 million annually
(Direction Régionale de l'Environnement, 2003). Of the 37,000 hectares of arable land, two thirds is
designated to sugar cane production. Sugar is also the main export product of Réunion, with the
residues being used for alcohol production and energy generation. The remaining 67.5 % of
agricultural production is largely attributed to fruits and vegetables (31.6%) and animal husbandry
(32.8%), mostly for the local market.
Seychelles Due to the small size of the three main islands and the lack of good soil, there are only
small areas suitable to agriculture in the Seychelles. Coconuts, cassava, fruits and vegetables are
cultivated, some on commercial basis, but many small-holders provide an important contribution by
cultivating crops for domestic consumption.
Somalia Rain-fed and irrigated agriculture form the main crop production practices especially in the
Juba-Shebelle catchment. The rain-fed agricultural production is however interrupted by the erratic
and low rainfall that is characterized by frequent droughts (Herlocker and Douthwaiter, 1997).
Approximately 50,000 hectares are intensively used for commercial crops and an additional 150,000
ha for grain production (FAO, 1995; Ruwa et al.,, 2004). Banana production for export is the main
activity covering 4,350 hectares within the Juba-Shebelle catchment (UNDP, 1998). Various
horticultural crops, such as vegetables, are also produced for local and export market.
South Africa - The coast provides significant opportunities for agriculture, with generally poor but
variable soils, on the west coast and rich soils on the east coast. The net income from farming
increased from US$ 870,000 in 2000 to US$ 1.3 million in 2001. The country is self-sufficient in
primary foods, with the exception of wheat, oil-seeds, rice, tea and coffee. The largest area of
farmland is planted with maize, followed by wheat and, to an extent, sugar-cane and sunflowers.
Deciduous fruit export earnings account for 15% of the country's total earnings from agricultural
exports. In 2001, apples made up the largest percentage of the crop (43%), followed by grapes 21%
and pears 19%. Eucalyptus forestry is significant in the northern parts of coastal KwaZulu-Natal
province, for use in paper production.
Livestock is farmed in most parts of South Africa and the dairy industry is an important employer
with 4,300 milk producers employing about 60,000 farm workers and indirectly providing jobs to
some 40,000 people. Milk production for 2001-2002 was estimated at 1.97 million liters. South
Africa's poultry meat production is estimated at 980,000 tonnes. The gross value of broilers and other
fowls slaughtered in 2001 was some US$ 1.24 million, which makes it the most important contributor
to the value of agricultural production in South Africa.
Tanzania As for Kenya, the agricultural sector employs more than any other and is considered the
mainstay of the economy. Coastal agriculture in Tanzania is similar to other areas in the country. The
coastal agriculture is rain-fed and is dominated by peasant small-holder farmers typically cultivating
UNEP-GEF WIO-LaB Project
19
on average farm sizes of between 1 and 3 hectares. The main food crops produced include cassava
and maize. Rice is cultivated in river valleys and flood plains. Cash crops include sisal, coconut,
cashew nut, cardamom, cotton, fruits and horticulture. Women constitute the main part of agricultural
labour force. Poor agricultural practices such as slash and burn have resulted in soil erosion and
subsequent sedimentation of coastal waters.
3.2.6 Mining
Mineral resources are found in many of the coastal sediments of southern and eastern Africa where
rich mineral deposits exist. In Kenya, various types of minerals are found along the coast. Some of the
minerals occur in significant quantities although only a few are being exploited. These include sand
and limestones, which are used in construction and building industries. Sand and limestones are non
renewable and if mining continues unabated, may result in environmental degradation of wide areas.
Other mineral deposits that occur in economically-meaningful quantities along the Kenyan coast
include salt, coral rock (limestone), titanium, pyrochlore, gypsum, barites, gypsum, iron ore and clay.
Other lesser minerals are apetite, galena, and manganese. Recently, mineral sands have been
identified as a source of titanium ore in the south coast.
In Tanzania, mining activities in the coastal zone mainly take place near Tanga in the north or Mtwara
in the south. Other coastal mining activities take place in Kisarawe, Miono, Mkonge and Mandera,
Dar es Salaam, Bagamoyo and Lindi. Mining of gravel, sand, limestone and rutile goes on throughout
the coast of Tanzania. In Mozambique, mining activities for limestone take place in Salamanga, Buzi,
Muanza and Nampula, while the mining of heavy mineral sands takes place in Chibuto.
Mining activities in Madagascar occur in the region of Taolagnaro where rich deposits exist for
sapphire, beryl, garnet, amethyst, crystal, zircon, mica, bauxite and ilmenite. South Africa is rich in
mineral resources and to date the mining of minerals such as platinum, gold, chromium, and coal have
established the largest operations in the region.
In Mauritius, sand mining along the coast was an important activity until 2001. It employed nearly
1,000 people and had an estimated turn over of US$ 8 million per year (Dulyamamode et al., 2002).
Its devastating impact was felt on the destruction of lagoon ecosystems and habitats hence it was
declared illegal in October 2001. In Comoros, coral sand, pebbles, gravel for concrete and corals for
lime are being mined for construction works (UNEP/GPA and WIOMSA, 2004b).
3.2.7 Solar Salt Production
In Kenya, salt production takes place in the mangrove area north of Malindi at Gongoni and Fundissa.
Extensive clearing of the mangroves has occurred in the Ngomeni swamps for the construction of salt
pans. Presently, eight operational salt works occur in Kenya occupying more than 7,922 hectares of
tidal swamps between Ngomeni and Kurawa. It has been estimated that these salt pans produce over
170,000 tonnes of salt annually (UNEP, 1998). In Tanzania, the high demand for solar salt has
resulted in clearance of mangrove forests to pave way for construction of evaporation ponds for solar
salt production. Solar salt currently contributes about 76% of the total salt produced in Tanzania
(TCMP, 2001). It is a significant industry, employing many people on a household basis or through
private companies (UNEP/GPA and WIOMSA, 2004b). In Mozambique, clearing of mangroves for
saline salt production is causing depletion of mangrove forests, mainly in the northern provinces.
3.2.8 Oil and gas production
Oil and gas exploration has been going on in many parts of the WIO region for at least the last thirty
years. Small reserves have been found in many places but only recently, with the improvement of
exploration and drilling technologies and the increase in the price of fuel, have there been major
developments in this sector. In summary, as the sections below describe, oil and gas exploitation is
still relatively under-developed in the WIO region, but considerable exploration is under way with the
potential of rapid developments in this field.
UNEP-GEF WIO-LaB Project
20
The level and pace of development of the oil and gas industry in each country in the WIO region has
varied significantly over the last thirty years. In Somalia, political instablity and security problems
have completely deterred exploration, whereas on the small volcanic, island states of Mauritius,
Comoros and Réunion (France), there are no data that indicate the existence of oil and gas reserves.
The absence of a continental shelf surrounding the islands potentially limits the possibility of the
presence of oil or gas-bearing geologic formations. For the mainland Africa nations, Madagascar and
Seychelles, the situation is very different, as the following sections describe.
Kenya - Oil and gas exploration is continuing along the Kenyan coast (EIA, 2005; UNEP, 2006).
From the limited data available, analysis of hydrocarbon potential is difficult. However, if there is to
be any potential, the most promising areas along the Kenya coast would be the Lamu Basin and the
Malindi area. The good source rocks and reservoir rocks for hydrocarbon deposits have been recorded
along the Kenyan coast, with conditions becoming more favourable offshore. There are interests in
the offshore Lamu Basin with an Australian firm recently completing an exploratory well about 70
kilometers off the Lamu coast (Tychsen, 2006), drilling from a drill-ship but failing to confirm a
viable resource.
Tanzania - Oil and gas exploration has been conducted for the last 50 years, more recently promoted
by the Tanzania Petroleum Development Corporation (TPDC). Significant gas discoveries have so far
be made at Songo Songo, Mkuranga and Mnazi Bay with explorations continuing along much of the
coast and 35 exploration and development wells drilled to date (http://www.tpdc-tz.com
/exploration.htm). The aim of the Songo Songo gas to electricity project is to develop natural gas from
the Songo Songo gas field in Kilwa District, supply gas to a power station in Dar es Salaam and local
industries, providing a reliable source of low cost electricity. The project was completed in 2006 and
is since expanding. The Mnazi Bay block, allocated to the Artumas Group (Canada), includes a gas
field with about 500 billion cubic feet of proven gas reserves and a single drilled well, but plans are
underway to conduct additional exploratory drilling. The estimated Mnazi Bay gas field may have
more gas reserves than that of Songo Songo field and generating facilities are now in place, supplying
electricity to the city of Mtwara and surroundings. In addition, the Mafia Deep Offshore Basin in
southern Tanzania has a high potential for exploration. Other areas with high potential for exploration
include sedimentary basins onshore and offshore with open acreage at Rufiji Basin, inland rift basins
of Lakes Rukwa, Tanganyika and Nyasa, and the Ruhhu Karoo Basin (http://www.tpdc-
tz.com/exploration.htm).
From 2005, the Government of Tanzania, through the TPDC, has put up invitations to several
international petroleum industry partners and other specialized investors to participate in exploration
of hydrocarbons in Tanzania and production sharing agreements (PSAs) have been signed with Ophir
Energy (Austria), StatoilHydro (Norway), Petrobras (Brazil), Maurel et Prom (France), Petrodel and
Dominion (both UK). Shell has yet to finalize an agreement for four blocks near Unguja and Pemba
Islands (Zanzibar), which it successfully negotiated over two years ago.
Mozambique - Gas reserves exist, some of which are being explored, with a significant collaboration
with South Africa for gas from the Temane gas field in southern Mozambique to South Africa's
Gauteng region, transported by a 925-kilometer pipeline. In early 1998, Mozambique signed a PSA
with BP-Amoco, giving it exclusive rights to explore 40,000 square kilometers in waters off the
Zambezi Delta. Another international consortium of oil firms has also signed three exploration
agreements with Mozambique's state oil firm. There are plans for natural gas from Mozambique's
Pande field to be utilized for new and existing industries in Maputo. Natural gas from the Temane
consortium's other Mozambican exploration areas (Sofala and M10, both of which are located
offshore) could be used in Mozambique's central industrial area of Beira (http://www.eia.doe.gov/
emeu/cabs/Archives/africa/chater4.html).
In February 2005, Mozambique launched its second offshore licensing round for blocks in the
northern Rovuma basin. In June 2005, the Mozambican Empresa Nacional de Hidrocarbonetos (ENH)
UNEP-GEF WIO-LaB Project
21
and the South African petrochemical company Sasol signed an agreement for blocks off the southern
coast. In May 2006, the Mozambican government awarded StatoilHydro two concessions in the
Rovuma basin and companies Eni, Petrobras and Petronas are also seeking concessions in the basin.
The Artumas Group which is currently operating across the border in southern Tanzania at Mnazi Bay
also has a large exploration block in the Cabo Delgado area, which is now also being explored.
South Africa - Production of natural gas and oil is underway with oil production meeting 10 % of its
domestic needs. The South African national oil company, PetroSA has concentrated its exploration
efforts on the country's western and southern coasts. Several discoveries have been made in the
Bredasdorp Basin on Block 9, including the Oribi, Oryx and Sable fields. Combined, the Oribi and
Oryx fields produce 16,000 barrels per day; however, PetroSA has indicated that both fields are in
decline. Production at the Sable Field, located approximately 115 kilometers off the southern coast,
commenced in August 2003. The project is a partnership between PetroSA and Pioneer and includes
six sub-sea wells connected to a floating, production, storage and offloading vessel (FPSO) with the
capacity to process 60,000 barrels per day of oil. Current production at Sable is around 23,000 barrels
per day of oil.
The well-established experience in oil and gas exploration, has allowed South African oil and gas
companies opportunities to collaborate with the Mozambican Government to explore for oil and gas
in that country (see above).
Madagascar There is a modest production of crude oil in Madagascar and it has also been
confirmed that oil and gas reserves exist at Bemolanga and Tsimiroro oil fields (UNEP, 2006). Actual
oil and gas exploitation is still relatively under-developed, but a lot of exploration is going on with the
potential of rapid exploitation.
In April 2006, Madagascar opened up 96 new offshore oil and natural gas blocks for tender with the
government accepting bids from interested parties until November 17, 2006. The licensing round was
overseen by the Office des Mines Nationales et des Industries Strategiques (OMNIS) and TGS-
Nopec, which completed seismic data on the blocks. In 2005, U.K.-based Sterling Energy sold 70 %
of offshore Ambilobe and Ampasindava licenses to ExxonMobil who plan to finance exploration
work. Additional international oil and natural gas companies active in Madagascar include
StatoilHydro (Norway), Vanco (U.S.), Vuna Resources (China) and Sun-Pec (China).
Seychelles The potential for producing oil and gas exists, with offshore geophysical and geological
exploration continueing over the Seychelles Bank.
3.2.9 Shipping and ports
For mainland African countries, the development of shipping and ports has been stimulated by
demand for port services from hinterland where export goods are produced and imports are required
for consumption. Throughout the region, increased shipping activities have resulted in upgrades and
expansion at a number of ports, as the following sections describe:
Somalia Mogadishu is the largest and principal port, though other smaller harbours exist.
Kenya - Shipping and ports are important economic activities accounting for 15% of the economy of
the Kenyan coast. The Mombasa Port is not only the largest sea port in Kenya but is also one of the
largest and most important ports along the East African coast. It is a natural harbour and is
strategically positioned to serve a number of east and central African countries; these include Rwanda,
Uganda, Burundi, north-western parts of Tanzania, Zaire and Sudan. Besides the main port, located in
the Tudor Creek of Mombasa is much smaller but has also remained active and is mainly receiving
smaller vessels. Other small ports are spread along the entire coastline and are located at Shimoni,
Kilifi, Mtwapa, Kipini, Vanga-Funzi area, Malindi and Lamu. The latter have catered for dhow trade
for over 2,000 years. All these Kenyan ports are managed by the Kenya Ports Authority. Mombasa
UNEP-GEF WIO-LaB Project
22
Port is connected to the world's major ports with over 200 sailings per week, to Europe, North and
South America, Asia, the Middle East, Australia and the rest of Africa.
Tanzania The major ports are Dar es Salaam, Tanga, Mtwara, and Zanzibar. It also has smaller
ports in Kilwa, Lindi and Mafia. Both Dar es Salaam and Zanzibar have witnessed significant
expansions and improvements to their port facilities, in part resulting from the increased tourism-
related trade between the two destinations and recent economic development.
Mozambique There are three main ports, located at Maputo, Beira and Nacala. The country also
has several small ports (Inhambane, Quelimane, Pebane, Angoche and Pemba).
South Africa - The large commercial ports are situated at Saldanha Bay, Cape Town, Mossel Bay,
Port Elizabeth, East London, Durban and Richards Bay. South African ports handle an average of
13,000 vessels carrying 500 million tonnes of cargo annually, with major upgrades under way to
increase handling capacity and absorb the rapid increase in commercial traffic (www.safrica.info;
www.ngo.grida.no/soesa/nsoer/issues/coast/). Though these ports triggered extensive industrial and
urban development as well as Spatial Development Initiatives (SDI's), they also have had a negative
impact on coastal waters.
Madagascar The island has 19 ports with the main ones being Mahajanga, Toliara, Antsiranana
(Diego Suarez), Tolagnaro, Manakara, Mananjary, Morombe, Morondava, Nosi-Be, Port Saint Louis,
Ambilobe, Vohimarina, Antalaha, Maroantsetra, Ambodifoltatra, Analalava, Antsohihy and
Maintirano.
Comoros - Each of the three islands (Grande Comore, Moheli and Anjouan) has a small port facility
catering for local trade.
Mauritius - Port Louis, the only port of Ile Maurice has experienced increase in port activity due to
improved infrastructure and facilities. By 2004, Port Louis was handling about 4.8 million tonnes of
cargo annually with about 1,900 vessels docking every year and a vessel traffic growth of 4%
recorded over recent years (UNEP/GPA and WIOMSA, 2004b). Port Mathurin serves the sister island
of Rodrigues, mainly transporting cargo and passengers to Port Louis.
Réunion The main harbour is located on the east coast of the island, around 30 kilometers to the
south of the capital St. Denis. The port area hosts one of the main power plants as well as various
depots and several smaller industrial enterprises (Direction Nationale de l'Environnement, 2003).
3.3 Valuation of ecosystem goods and services
The coastal and marine ecosystems of the WIO region, as presented in Chapter 2, provide many goods
and services to the populations and economies of the region. Ecosystem goods refer to products which
can be extracted from an ecosystem, for direct or indirect human utilization, such as seafood, timber,
honey, biomass fuels and medicines, among others. Ecosystem services on the other hand refers to the
conditions and processes through which ecosystems and species that make them up sustain and fulfill
human life. Examples of key ecosystem functions include climate regulation, nutrient re-cycling and
coastal erosion control. These and other examples goods and services, as they concern the coastal and
marine environment, are listed in Table 3-4.
The main ecosystems that provide goods and services in the WIO region include coral reefs, seagrass
beds, mangrove forests, estuaries, coastal forests (woodlands, forests, wetlands, grasslands, and
dunes), small islands and coastal beaches. There are two broad values of ecosystem goods and
services, namely `use' values and `non-use' (or `passive use') values. The use values may further be
sub-divided into direct use values, indirect use values and option values, as described below:
UNEP-GEF WIO-LaB Project
23
· Direct use values - These are associated with the actual use of the environment such as fishing,
harvesting of mangrove and coastal forests to obtain building materials like timber, firewood
or charcoal, hunting of game, collection of honey and tannins, recreational use such as beach
walks, snorkeling and diving over coral reefs, sport fishing and bird watching. These
ecosystem goods and services are traded in the market and therefore have direct use values.
They support livelihood and income generation for the coastal communities and contribute to
the national economies in the WIO region.
· Indirect use values Most indirect use values are derived without directly interacting with the
ecosystem, for example, people may enjoy watching videos on marine life in a marine park in
one of the countries of the WIO region, thus deriving indirect use value.
· Option values These refer to the value that people place on having the option to enjoy an
ecosystem good or service in the future although he/she might not be using it at present.
· Non-use values - The simple existence of the goods and services, their altruistic and bequest
values as reffered to as `non-use' values. Existence value is that which people place on simply
knowing that something exists even if they will never have a chance to see it or use it. Bequest
value on the other hand is the value that people place on knowing that future generations will
also have an opportunity to enjoy an ecosystem good or service. It is measured by what people
are willing to pay to preserve natural ecosystem intact for future generations.
UNEP-GEF WIO-LaB Project
24
· Table 3-4
Key ecosystem functions and their corresponding goods and services for coastal and marine
habitats.
Ecosystem functions
Corresponding
Examples
goods and services
Regulation of atmospheric chemical
Gas regulation
CO2/O2 balance, O3 for UVB protection,
composition
SOx levels
Regulation of global temperature, preci-
Climate regulation
Greenhouse gas regulation,
pitation and other biologically mediated
climatic processes at global or local levels
Capacitance, damping and integrity of
Disturbance
Coastal protection from storm surges and
ecosystem response to environmental
regulation
flooding, erosion control and sediment
fluctuations
retention
Storage and retention of water
Water supply
Provision of water by watersheds,
reservoirs and aquifers
Retention of soil within an ecosystem
Erosion control
Prevention of soil loss by wind, runoff or
other processes, silt storage in wetlands
Storage, internal cycling, processing and
Nutrient cycling
N fixation, N and P plus other elemental
acquisition of nutrients and compounds
or nutrient cycles
Recovery of mobile nutrients and/or
Waste treatment
Waste treatment, pollution control,
break-down of excess or xenic nutrients
detoxification
and compounds
Trophic-dynamic regulations of
Biological
Feeding places both within ecosystems
populations
control/regulation
and between ecosystems
Habitat for resident and transient
Habitat/refugia Nurseries,
breeding grounds and habitats
populations
Gross primary production extractable as
Food production
Fish, shrimp, crab, lobster and other sea-
food
food products
Gross primary production extractable as
Raw materials
Seaweed, materials for medicine, curio,
raw materials
jewellery, coral blocks, shells, timber,
fuel and sand
Opportunities for recreational activities
Recreation
Eco-tourism, recreational activities,
sport-fishing
Opportunities for non commercial uses
Cultural and
Aesthetic, cultural, educational, scientific
amenity
and spiritual values of ecosystems
Adapted from: Constanza et al. (1997), Moberg and Folke (1999), Cesar (2000), World Resources Institute (2007).
There are different approaches for estimating values of direct and indirect uses of ecosystems. Some
of the most commonly used are based on quantifying the `willingness-to-pay' for goods and services,
or the market value of the resources, or on costs of replacing resource if lost, as described below:
· Willingness-to-pay - This is the potential amount users of services would pay for the services that
are provided by the ecosystems, offering a kind of `simulated' market value. In many cases, such
methods involve obtaining the opinions of stakeholders. Because of this, the outcomes of such
studies are often subjective (due to their dependance on opinions involved), however, `willingness-
to-pay' studies do allow for incorporation of otherwise difficult to quantify indirect, non-use and
option values.
· Market value Here the actual market values of ecosystems are quantified in terms of the
financial value of the goods and services provided. The limitation of such methods is that it is
difficult to attach an actual market value for indirect, non-use and option values. Often in such
studies, therefore, only direct use values are considered, therewith underestimating the actual value.
UNEP-GEF WIO-LaB Project
25
· Replacement costs These are those costs associated with attempting to replace part of or an
entire ecosystem (e.g. the cost of rehabilitating two hectares of mangroves). While this method is
quite objective and scientifically justifiable, the weakness is that the value obtained often does not
relate to the actual value of the goods and services provided by the ecosystem.
The two sections that follow provide estimates based upon the first two methods presented above
beginning with a valuation of ecosystem goods and services following an analysis of the two main
direct use values derived from the WIO coastal ecosystems, namely tourism and fisheries.
3.3.1 Overall valuation of key ecosystems in the region
An overall assessment of the value of the world's ecosystem services has been reported by Constanza
et al., (1997) based, either directly or indirectly, on attempts to estimate the `willingness-to-pay' of
individuals for ecosystem services (see Table 3-5). The valuation method applied in this study is
based upon a synthesis of many other studies, using various methods of valuation. The indicators
derived from this study are based upon studies from around the world.
Despite the obvious risks associated with using `globalized indicators' within the local context of the
WIO region, applying this method should provide a better estimate for actual ecosystems values.
Where appropriate, a perspective on the estimates is here provided, based on comparable case studies.
Coral Reefs
The direct use values of coral reefs in the WIO region cannot be over-stated. Reefs support the
artisanal fishery which provides livelihoods, employment and income to coastal communities. Coral
reefs also support tourism - important source of employment and foreign exchange earnings in the
WIO region and provide coastal protection against wave action thus reducing shoreline erosion.
The value of coral reefs in the WIO region is estimated at US$ 7,291 million per year (see Table 3-6),
based on the sum of the individual indicator values for ecosystem services showh in Table 3-5. Some
discrepancy exists to the absolute values for ecosystem services. For example, a recent study
conducted by the South China Seas Project (www.scs.org) rates the annual value of coral reef systems
at US$ 1,181 per hectare per year. The total economic value of coral reefs in India has also been
estimated, in terms of extractive uses, and valued at US$ 2,750 per hectare; and in terms of both
extractive uses and aesthetic/recreational value (tourism value), at US$ 5,645 per hectare per year
(Wafar and Wafar, 2001), therewith totaling at US$ 8,395 per hectare per year. The total estimated
economic value of coral reef ecosystems value, as presented in Table 3-6, therefore provides a value
in the middle, albeit at the higher end of the scale.
Restoration costs of coral reefs are potentially extremely high, with estimates ranging vastly, from
US$ 13,000 to US$ 100 million per hectare, depending on the specifics of the situation (Lindahl,
1998; Spurgeon and Lindahl, 2000).
Mangroves
Mangrove forests are among the most productive ecosystems and offer a variety of goods and services
(see Bosire, 2006). The mangroves of the WIO region provide goods and services with significant
social and economic value to the coastal communities (UNEP/GPA and WIOMSA, 2004; McLeod
and Salm, 2006), goods and services that can be grouped into four main categories:
UNEP-GEF WIO-LaB Project
26
· Table 3-5 Indicator values (in US dollars per year) for ecosystem services (after Constanza et al., 1997).
Climate Disturbance Water
Erosion Nutrient
Waste Biological Habitat
Food
Raw
Recreation Cultural
Total
regulation regulation
supply
control
cycling treatment
control
refuge production materials
Seagrass
.. .. .. ..
19,002 .. .. .. .. 2 .. ..
19,004
Coral reefs
..
2,750 .. .. .. 58 5 7
220 27
3,008 1
6,076
Tropical forest
223 5 8
245
922 87 .. .. 32
315
112 2
2,008
Tidal marsh/
..
1,839 .. .. ..
6,696 ..
169
466
162
658 ..
9,990
mangroves
· Table 3-6 Valuation of ecosystem goods and services in the WIO region based on Constanza et al., (1997).
Coral reefs
Mangroves
Coastal forests
Seagrass beds
Total
Country
Area
Value
Area
Value
Area
Value
Area
Value
Value
(km2)
(million US$)
(km2)
(million US$)
(km2)
(million US$)
(km2)
(million US$)
(million US$)
Comoros
430 261
1 1
2,170 436 .. ..
698
Kenya
630 383
500 500 660 133 34 65 1,079
Madagascar
2,230
1,355
3,000
2,997 .. .. .. .. 4,352
Mauritius
870 529
1 1
2,040 410 70 133 1,072
Mozambique
1,860 1,130
3,902
3,898
1,790 359 439 834 6,222
Réunion (France)
<50 ..
.. ..
2,517
505 .. .. 505
Seychelles
1,690 1,027
25 25 455 91
..
..
1,143
Somalia
710
431
91 91 2 0 .. .. 523
South Africa
<50 ..
30
30
19,500
3,916 7
13 3,959
Tanzania
3,580 2,175
1,250 1,249 700 141
..
..
3,565
Total
12,000 7,291
8,800 8,791
29,834 5,991 550 1,045
23,118
UNEP-GEF WIO-LaB Project
27
· Provisioning - A variety of goods or products e.g. timber, fuelwood, charcoal, building poles and
boat building materials are provided by mangrove forests, as are finfish and shellfish (Rönnbäck et
al., 2002; Ngoile and Shunula, 1992). Traditional include medicines, tannins for preserving nets and
fishing gears, dyes for cloth, honey, insect repellants and leaves as fodder for livestock are further
examples of products.
· Regulation - Mangroves stabilize the shorelines by their intricate root networks and the trees
themselves forming a barrier against storm damage (McLeod and Salm, 2006) thus mitigating
socio-economic losses that could otherwise be incurred. The mangroves also filter and trap land-
based sediments, heavy metals, nitrogen from domestic wastes and other pollutants, moderate water
quality, protect the integrity of adjacent ecosystems, and fix and store significant amounts of carbon
thus playing an important role in carbon sequestration.
· Support - The organic productivity within mangroves supports the nearshore fisheries production
(Lee, 1999). The high biomass of shrimps, fish, molluscs and crabs that mangroves support has
significant economic value to artisanal and commercial fisheries.
· Cultural - Many local communities use designated locations in mangrove forests as sacred shrines.
There is also growing interest in and use of mangrove ecosystem for eco-tourism due to its unique
structure and diversity, which will enhance public awareness and mangrove conservation.
It is estimated that over 150,000 people in Tanzania earn their living directly from mangrove resources
(TCMP, 2001). Mangrove exploitation for poles for construction and bark (for tannin extraction) both
for export, was common in Tanzania up to the mid 1990s. In Kenya, export of mangroves to the
Middle East and Gulf countries went on until the 1980s when it was banned. In Madagascar,
mangroves are an important source of income both for the local population and the national economy.
The mangrove trees are harvested for building poles and firewood, and traditional and industrial
shrimp fishing take place in mangrove areas. In Mauritius, there is no widespread traditional use of
mangroves and only a few parts of the two species that occur in Mauritius (Bruiguiera gymnorhiza and
Rhyzophora mucronata) are traditionally used for medicinal purposes. The non-market value of
mangroves (ecosystem function) is however evident when the contribution of the coastal zone to
foreign exchange earnings is considered.
The total economic value of mangrove forests in the WIO region may be estimated at US$ 8,791
million per year, concentrated mainly in Mozambique, Madagascar and Tanzania. However, this value
is likely to be on the high side, with recent studies in Thailand (World Resources Institute, 2008) and
in South China Seas (www.unepscs.org) providing values ranging from US$ 3,680 to US$ 2,872 per
hectare per year, roughly one third of the values presented in Table 3-6.
Coastal forests
Similar to mangroves, coastal forests present a large range of direct and indirect use values. Two
particular functions relevant to the coastal and marine environment are stabilisation of soil, which
reduces erosion, and recharge of groundwater aquifers. Ultimately, these functions determine, in part,
the dynamics of both sediment and water exchange in the coastal zone.
The total value of the coastal forests systems in the WIO region is estimated at US$ 5,991 per hectare
per year. Unfortunately, there is little comparable data concerning the specific values of coastal forest
goods and services with regard to their functions related to the coastal and marine environment, and
the values presented in Table 3-6 should therefore be considered as the high end of the range.
Seagrass resources
Although seagrass beds are found in all countries of the WIO region, their actual extent is largely
unknown. The largest recorded area is found in Mozambique (439 square kilometers), with the total
reaching over 550 square kilometers. Their total value reaches US$ 1,045 million per year (see Table
3-6). However, a recent valuation study performed for the South China Seas attaches a much lower
value to seagrass beds, at US$ 1,182 per hectare per year, an order of magnitude lower in value.
UNEP-GEF WIO-LaB Project
28
Valuation summary - From the analysis above, it may be concluded the value of the ecosystems in
the WIO region is definitely considerable. Whilst the analysis does not provide a specific value, the
probable total value of the coastal ecosystems ranges from US$ 4.6 to 26.1 billion, but likely in the
higher part of this range.
3.3.2 Valuation of key economic activities (ecosystem uses) in the region
The best and most visible benefits derived from the coastal and marine environment are translated into
a number of key services, provided to a number of economic sectors. Of these, the most obvious and
tangible sectors are tourism and fisheries. An attempt to quantify the direct economic value
represented by these sectors is presented in Table 3-7.
· Table 3-7 Estimation of direct use values represented by the fishery and tourism sectors in the WIO region.
Country
Fisheries
Tourism
Annual fish
Annual value
Annual number
Annual value (million
landings (tons)
(million US$)
(thousands)
US$)
Comoros
13,500
29
24
15
Kenya
8,000 15 915
329
Madagascar
12,382
23
170 115
Mauritius
10,765 58 702
697
Mozambique
110,000 103 550 unknown
Réunion (France)
6,980 55 432
499
Seychelles
179,516 212 122
171
Somalia
14,750 72
0
0
South Africa2
95,400
75 18,065
2,694
Tanzania
70,000 131 552
450
Total
507,793 744 21,508
3,814
Sources: Hoguane et al, 2002; Ochiewo, 2004; Fisheries Department - Kenya, 2007; Horrill et al., 2001; Stabrawa, 1999;
UNEP, 1998; Nzungi, 2003; Robinson et al, 2004; Hatziolos et al., 1994; Lovatelli, A. (1995). EC Rehabilitation
Programme for Somalia: Artisanal fisheries Final Report. Report to the European Commission (EC) Somalia Unit. Project
Agreement No.4420/50-6/50-82/74; FAO, 1998; FAO, 2005; FAO, 2008; Gössling, 2006; Gössling and Hörstmeier, 2003;
Republic of Kenya, 2006; Grant Thornton and Kessel Feinstein (2003); KwaZulu Natal Tourism Authority (2008);
Direction Nationale de l'Environnement (2003).
Although the tourism and fisheries represent only the key direct uses of the coastal and marine
environment, it is immediately clear that their contributions to the economies of the WIO region are
very important. It also becomes clear that these two sectors derive a substantial portion of their overall
economic value from the coastal and marine resources in the region, as described in the previous
section.
2 Fisheries statistics for South Africa are from country-wide data, proportioned according to distribution of the
fishing industry sector, i.e. 2.3 % in Kwazulu Natal and 13.6 % in Eastern Cape (Dept. Environmental Affairs
and Tourism, 2005). Tourism estimates are based upon data for KwaZulu Natal and Eastern Cape Provinces,
including domestic and foreign (Thornton and Feinstein, 2003; KwaZulu Natal Tourism Authority, 2008).
UNEP-GEF WIO-LaB Project
29
3.4
Conclusions
The WIO Island States have relatively higher life expectancy, per capita GDP and human development
index compared to the mainland countries.
The coastal and marine related activities such as tourism and fisheries are important economic factors
to the region. The coastal fisheries of the WIO region are mostly exploited by local (usual artisanal)
communities, while the offshore oceanic fisheries are mainly harvested by foreign fishing vessels from
Europe and Eastern Asia. However, there is need to put in place a system to improve fisheries and
socio-economics data collection and sharing in the region. Various published reports contain
conflicting data thus making it difficult to establish the reliability of some available data.
The economic value of the ecosystem goods and services is estimated to range between 4.6 and 26.1
billion US$ annually, but likely in the higher part of this range. Tourism is the largest sector benefiting
directly from coastal and marine services.
UNEP-GEF WIO-LaB Project
30

United Nations
Global Environment
Environment Programme
Facility
Transboundary Diagnostic Analysis of
Land-based Sources and Activities in the
Western Indian Ocean Region
CHAPTER 4 - ASSESSMENT OF MAJOR
TRANSBOUNDARY PROBLEMS AND ISSUES
Draft
November 2008

UNEP-GEF WIO-LaB Project
Addressing Land Based Activities in the Western Indian Ocean
Table of contents
4
Assessment of major transboundary problems and issues .......................................... 1
4.1
Introduction ............................................................................................................... 1
4.1.1 Identification of major perceived problems and issues ......................................... 1
4.1.2 Approach and methodology................................................................................... 2
4.2
Problem Area 1: Water and sediment quality degeneration due to pollution from
land-based sources.................................................................................................... 4
4.2.1 Overview ............................................................................................................... 4
4.2.2 Microbial contamination ..................................................................................... 15
4.2.3 High Suspended Solids /Sediments ..................................................................... 18
4.2.4 Chemical Pollution .............................................................................................. 21
4.2.5 Marine litter ......................................................................................................... 27
4.2.6 Eutrophication ..................................................................................................... 30
4.2.7 Stakeholder analysis ............................................................................................ 33
4.3
Problem area 2: Physical alteration and destruction of habitats (PADH) ............. 34
4.3.1 Overview ............................................................................................................. 34
4.3.2 Degradation of mangrove forests ........................................................................ 40
4.3.3 Degradation of Seagrass Beds ............................................................................. 45
4.3.4 Degradation of Coral Reef Ecosystem ................................................................ 49
4.3.5 Degradation of coastal forests in the WIO region ............................................... 54
4.3.6 Shoreline changes................................................................................................ 58
4.3.7 Stakeholder analysis ............................................................................................ 62
4.4
Problem Area 3: Alteration in fresh water flows and sediment loads from rivers. . 63
4.4.1 Overview ............................................................................................................. 63
4.4.2 Alteration of river flows and water quality ......................................................... 78
4.4.3 Alteration of sediment loads................................................................................ 85
4.4.4 Stakeholder analysis ............................................................................................ 92
Annexes
Annex 1
Overview of sectors, stakeholder groups and governing institutions involved in
LBSA Management
UNEP-GEF WIO-LaB Project
2
4
Assessment of major transboundary problems and issues
4.1 Introduction
This chapter of the TDA presents an analysis of the major perceived and documented problems related
to land-based sources and activities.
4.1.1 Identification of major perceived problems and issues
The identification of the major perceived problems and issues is a first step in the TDA process. It
constitutes the basis for subsequent in-depth scientific and technical analysis of such perceived
problems and issues in order to validate and prioritize the same.
The classification of key transboundary problems related to LBSA is primarily based on the results of
the regional TDA/SAP workshop held in April 2007 in Nairobi, Kenya, which identified and grouped
problems into three distinguishable clusters:
1. Water and sediment quality degeneration due to pollution from land-based sources;
2. Physical alteration and destruction of habitats; and
3. Alteration in freshwater flows and sediment loads from rivers.
During the TDA workshop, participants (including over 40 experts) established initial problem trees
for these three problem areas, where necessary these were further divided into sub-clusters. The
individual problem areas were further defined in more detail by the TDA Drafting Team in
consultation with the various Task Forces and Working Groups as described in Chapter 1. A short
description of each of these problem areas is presented below.
Water and sediment quality degeneration due to pollution from land-based sources
A significant amount of the pollution load to the sea emanates from land-based activities, such as
municipal and industrial discharges, contaminated surface and sub-surface run-off, agricultural
returned flows and atmospheric emissions. Pollutant loads from such land-based activities are typically
disposed of in the coastal zone where they affect some of the most productive areas of the marine
environment, such as estuaries and near-shore waters. Moreover, contaminants which pose risks to
human health and living resources can be transported long distances by watercourses, ocean currents
and atmospheric processes.
The TDA identified five distinguishable pollution categories:
1. Microbial contamination
2. High suspended solids1
3. Chemical pollution
4. Marine litter (including debris)
5. Eutrophication (harmful/nuisance algal blooms)
Physical alteration and destruction of habitats (PADH)
One of the priority transboundary problems for the WIO region is the transformation and loss of
habitats. The causes of these transformations are both physical, as in the dredging of waterways,
deforestation, diversion of freshwater flows, and construction of ports and jetties, tourist resorts, and
housing developments; and biological, as in over-exploitation of living resources such as coastal
forests, mangroves, seagrass beds and coral reefs. In addition, global climate change, which is a cross-
1 Specifically referring to particulate material
1
cutting concern attributed to human activities, has led to abnormal rainfall patterns, droughts, floods,
and sea level changes. Finally, land reclamation for agriculture and development as well as extensive
upland deforestation cause acute problems for the major river catchments in the region, as witnessed in
Tana, Sabaki, Rufiji and Zambezi. The cumulative impacts of these transformations and losses have
been manifest by significant physical and ecological changes in the region and an overall decline in
many ecosystem services.
The five categories of PADH distinguished in this TDA are:
1. Degradation of mangrove forests
2. Degradation of seagrass beds
3. Degradation of coastal forests
4. Degradation of coral reefs
5. Shoreline changes
Alteration in freshwater flows and sediment loads from rivers
One of the key areas of concern for the WIO region relates to the interaction between river basins and
the coastal and marine environment. Throughout much of the region, more so for continental states,
many of the coastal issues are linked to human activities and climatic variability far removed from the
coast. The impacts of such distant impacts have altered the nature of the drainage through the river
systems large and small impeding the flow of freshwater, terrigenous sediment and organic matter.
They have also affected the quality of the water, mainly through the addition of nutrients and
pollutants from domestic sewage and industrial and agricultural chemicals.
The two key problem areas related to river-coast interaction that have been distinguished in the TDA
are:
1. Alteration of river flow and degradation of water quality.
2. Alteration of river sediment load.
4.1.2 Approach and methodology
The main basis and justifying data for the analysis presented in this chapter is a number of targeted
studies commissioned by the Nairobi Convention, largely as part of the WIO-LaB project, and which
have resulted in a series of supporting documents (see Chapter 1, Section 1.6).
Apart from these main supporting documents, the analysis comprises a comprehensive evaluation of
other studies and reports2. The process of identification of such data and information as well as of
validation of its conclusions consisted of a series of technical workshops with experts in various areas
of discipline, the final validation being assignment to the Scientific and Technical Advisory Panel of
the Project. For further details on the TDA development process, please refer to Chapter 1 of this
report.
The analysis of the above-listed perceived transboundary problem clusters, which are presented in the
following sections, follows a systematic approach, as schematically displayed in Figure 4-1 and further
laid out below.
2 Such as the African Process, the Global International Waters Assessment (GIWA) programme, the Eastern
African Marine Systems (EAMS) programme, GESAMP, TransMap and various reports prepared by the UNEP
Nairobi Convention Secretariat, the UNEP Global programme of Action for the Protection of the Marine
Environment from land-based Activities (UNEP/GPA).
2
Transboundary problem
General overview
Detailed analysis
Problem statement
Transboundary elements
Root-cause analysis
Risks, uncertainties and trends
Stakeholder analysis
· Figure 4-1
Schematic presentation of the problem analysis framework.
General overview
Each section first presents a general overview of the specific problem at hand, including:
· A general overview of the problem;
· A general overview of the (root and direct) causes as well as the environmental impacts and
socio-economic consequences related to the problem; and
· An identification and description of the perceived hotspots of the problem.
Subsequent to this general overview, each problem is then further analysed in more detail at the level
of the problem sub-categories as defined above (i.e. the five problem sub-categories of pollution and
PADH and the three of river-coast interactions).
Detailed analysis
Each of the above problem areas are analysed in detail in individual sub-sections, organised in a
similar way reflecting the various steps in the analysis, as follows:
a. Problem statement
Presents a brief definition of the problem, providing its general perspective and context.
b. Transboundary elements
Provides a brief review of the transboundary elements of the problem, investigating to what
extent the problem is relevant within the context of the TDA, and in particular responding to
questions such as, `Is the problem truly transboundary, in that it has transboundary causes
and/or impacts? Is it a common problem in the region, or is it relevant to certain regions only
(e.g. mainland versus islands)?
c. Root-cause analysis
This is the most substantial section, providing first a graphical presentation of the
transboundary problem in the form of a problem tree, and describing and reflecting on the
elements of the problem tree. The analysis is supported by a summary of relevant data and
3
information based upon the detailed assessment reports presented above3. The root-cause
analysis distinguishes five different levels, as schematically displayed in Figure 4-2.
Socio-economic Consequences
Socio-economic consequences
The consequences of the environmental impacts in terms of social and economic effects, both direct and indirect,
such as loss of revenue, lowering quality of life, health
The effects of biophysical changes on the social and economic well-being of the
population, e.g. reduced revenues from fisheries or health risks
Environmental Impacts
The effects of activities on the biophysical environment, e.g. changes in species
composition or mortality of marine organisms
Transboundary problem
Underlying sector and immediate causes
The immediate causes of the problem, including the sectors associated with
such causes, e.g. effluent streams related to industries and coastal settlements;
soil erosion related to agriculture and forestry, etc.
Root Causes
The underlying (fundamental) reasons for the problem, e.g. poverty, bad
governance or financial constraints
· Figure 4-2
Schematic presentation of the various levels of analysis in the problem trees that follow.
d. Risks, uncertainties and trends
This sub-section presents an analysis of risks and uncertainties, such as important gaps in
data/knowledge that may hamper adequate assessment of the problem and its effects, as well
as uncertainties in future development. It also identifies any observed trends, such as
developments that might cause a problem to be greater of more significant in the future and
which should be noted now.
Stakeholder analysis
The final component is an analysis of the main stakeholders associated with the causes of the problem,
as well as those affected by it. The analysis is based on a standard list of identified potential
stakeholder groups and sub-groups (see Annex 1).
4.2 Problem Area 1: Water and sediment quality degeneration due to pollution from
land-based sources
4.2.1 Overview
According to a world-wide study by the UN Group of Experts on the Scientific Aspects of Marine
Pollution (GESAMP) in 1990, the majority of marine pollution (an estimated 80%) originates from
3 It cannot be emphasized enough that the TDA report only presents a summary of relevant supporting data and
information analysis and that detailed supporting data and information is provided in separate supporting
documents.
4
land-based sources through municipal and industrial discharges, contaminated surface and sub-surface
run-off, agricultural return flows and atmospheric emissions. Pollutant loads from land-based activities
are typically disposed of in the coastal zone where it affects some of the most productive areas of the
marine environment, such as estuaries and near-shore waters. Moreover, contaminants which pose
risks to human health and living resources can be transported long distances by watercourses, ocean
currents and atmospheric processes.
The African Process, which preceded the WIO-LaB project, developed as initiatives under the Abidjan
and Nairobi Conventions, aimed at identifying hotspots of pollution or sensitive areas and unique
ecological areas along the sub-Saharan African coast. Hotspots of pollution were described as those
localities where there was readily observable evidence of pollution impacts that affected the health of
the coastal environment or the coast's natural ability to deliver services. Madagascar and the Comoros
did not participate in the African Process, but under the auspices of the WIO-LaB Project, these
countries identified their hotspots which were confirmed during the 2nd meeting of the Water,
Sediment and Biota Quality Regional Working Group established under the auspices if the WIO-LaB
Project held in Mauritius in February 2006. Hotspots of land-based sources of marine pollution
(mainly urban centres situated in sheltered locations along the coast), were identified in the African
Process Reports (see Francis et al., 2002; Kazungu et al., 2002; Jones et al., 2002; Dulymamode et al.,
2002; Hoguane et a.l, 2002; Clark et al., 2002) and are highlighted in Figure 4.3, while an overview
of identified hotspots in the WIO region is presented in Table 4-1.
The development and implementation of a water, sediment and biota quality monitoring plan for the
WIO, under the WIO-LaB project, followed an attempt to make a first regionally comparable estimate
of pollution in perceived hotspots of pollution in each of the eight countries in the region. This
included the preparation of National Pollution Status Reports (Anon Madagascar, 2006, Anon
Mozambique, 2006; Anon Mauritius, 2006; Munga et al., 2006; Mohammed et al., 2006; Abdallah et
al., 2006; Dubula et al., 2006; Antoine et al., 2007), as well as the execution of a regional monitoring
programme coordinated through a Regional Activity Centre (RAC), in this case the Council for
Scientific and Industrial Research (CSIR) of South Africa.
Results from these national reports are incorporated in a Regional Synthesis Report on Marine
Pollution in the WIO region (Taljaard et al., 2008). Other related studies commissioned under the
WIO-LaB project that are of relevance included the regional reports on the assessments of the status of
municipal wastewater (MWW) management and marine litter problems in the WIO region (Kayombo,
2007; Lane, 2007). These three reports form the main supporting documents for this section of the
TDA.
Within this context, the focus of this analysis is on land-based sources of marine pollution as opposed
to pollution linked to maritime transportation or dumping of waste at sea. Land-based sources of
marine pollution in the WIO region are primarily associated with densely populated areas and
industrial zones within urban centres and in the vicinity of river discharges, particularly those from
larger river basins. Although, at present urban centres in the WIO region are still several hundred
kilometres apart, creating distinct hotspots, rapid urbanization in the region could result in so-called
`strip development' of coastal areas where smaller coastal towns and suburban areas eventually join
with the main cities, creating larger continuous urban zones along the coastline (Ruwa, 2006).
5
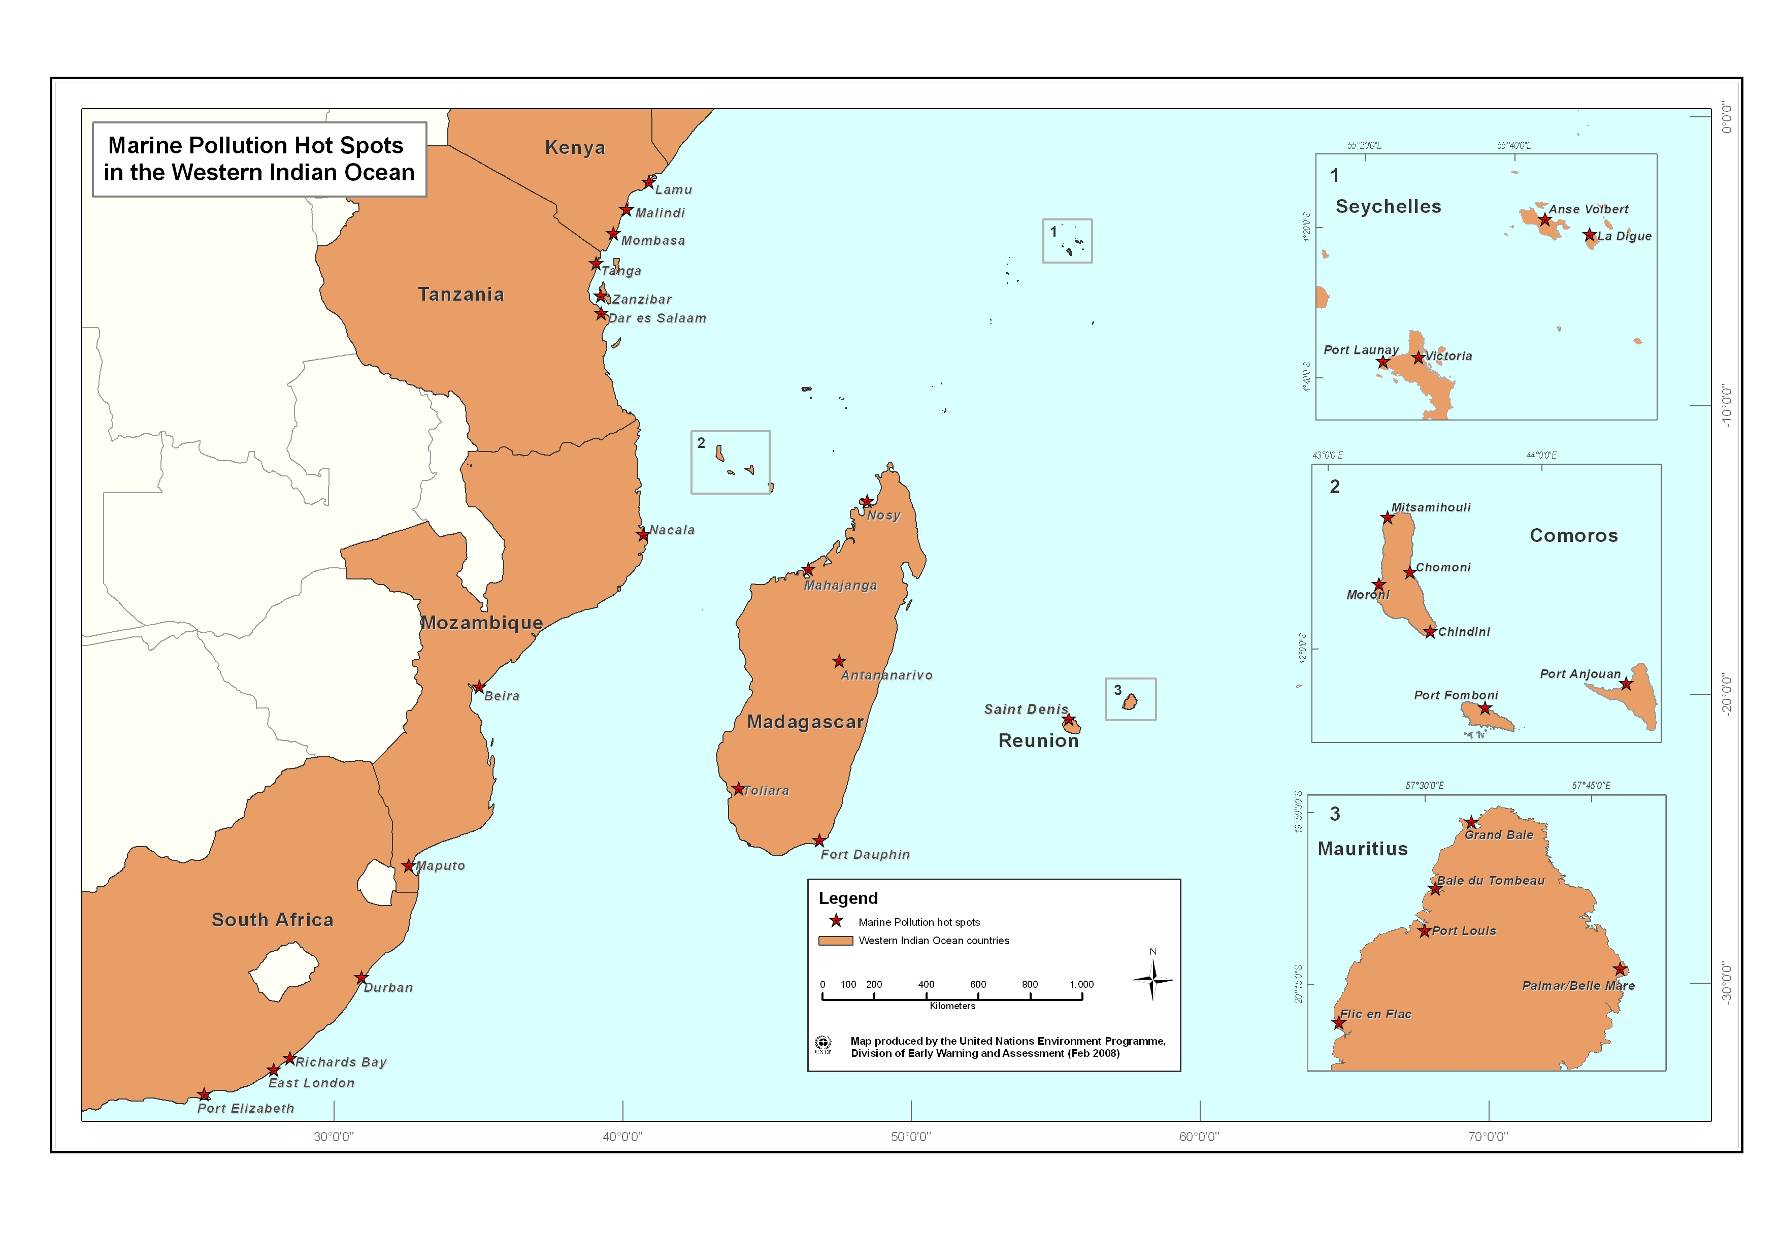
· Figure 4-3
`Hotspots' of land-based sources of marine pollution in the WIO region
1
Based on the draft National Pollution Status Reports prepared under the auspices of the WIO-LaB
Project five transboundary problems were identified (here defined as problems that are common to the
countries of the WIO region), all linked to the deterioration of water quality in coastal areas (or marine
pollution) as a result of land-based activities. These were:
· Microbial contamination
· High suspended solids
· Chemical pollution
· Marine litter
· Eutrophication (or nutrient over-enrichment).
The most important environmental impacts and socio-economic consequences associated with the
priority transboundary marine pollution problems, as well as the most important direct causes of such
problems are summarized in Table 4-2 and Table 4-3 respectively. From these summary tables, it is
apparent that the observed environmental impacts and socio-economic consequence may be the
cumulative result of various pollution problems. Also, there are several direct causes linked to a
specific transboundary marine pollution problem likewise the same direct cause can result in several
transboundary marine pollution problems.
1
· Table 4-1
Overview of pollution hotspots in the WIO region and associated (perceived) pollution problems.
TRANSBOUNDARY PROBLEM
COUNTRY
Micro
Eutrophication
Marine litter
Chemical
bial
(harmful/nuisance
Suspended solids
(solid waste)
Pollution
contamination
algal blooms)
Beach
Beach Mitsamihouli
Port Moroni
Mitsamihouli
Comoros
Beach Chindini
Port Anjouan
Beach Chindini
Beach Chomoni
Port Fomboni
Beach Chomoni
Vanga Creek
(Wasini)
Mombasa inshore
Mombasa inshore
waters
waters
Mombasa inshore
Mombasa inshore
Lamu inshore waters
Mombasa inshore
Kenya
Lamu inshore
waters
Malindi/Watamu
waters
waters
waters
Lamu inshore waters
Marine Park
Malindi/Watamu
Ungwana Bay
Malindi Bay
Marine Park
Port Mahajanga
Port Mahajanga
Port de Nosy-Be
Port de Nosy-Be
Madagascar
Toliara
Toliara
Toliara
Baie de Fort-
Baie de Fort-Dauphin
Dauphin
Baie du Tombeau
Pointe Aux Sables
Grand Baie
Mauritius
Pointe Aux Sables
to Pointe Aux
Palmar
Port Louis Harbour
Rodrigues
Belle Mare-Palmar
Sables
Bain des Dames
Pointe Aux Sables
Mozambique
Maputo Bay
Nacala Bay
East coast Mahé
Port Victoria and
East Coast Mahé
Seychelles
La Digue
Port Launay Marine
Anse Volbert
Park
surrounding areas
(including lagoons)
Mahé Wetland
South Africa
Richards
Bay
Dar es Salaam
Dar es Salaam
Tanzania
Tanga
Zanzibar
Zanzibar
Note: The above prioritization will be further substantiated using the results of the ongoing regional
monitoring programme as well as the newly defined EQ Objectives and Targets. This will occur
during the final meeting of the Regional Working Group on Water and Sediment Quality scheduled for
early 2009.
2
· Table 4-2
Environmental impacts and socio-economic consequences potentially associated with priority transboundary marine pollution problems.
TRANSBOUNDARY PROBLEM
Micro
ENVIRONMENTAL IMPACTS
Eutrophi-
Marine
Suspended
Chemical
bial
cation
litter
solids
Pollution
contamination
Modification in marine biotic species composition
Smothering of benthic communities
Entanglement/suffocation of marine organisms
Chronic effects on marine biota
Mortality (acute effects) on marine biota
Opportunistic/nuisance/harmful/toxic
algal
blooms
Discoloration of coastal waters
Anoxic
conditions/bad
odours
High
levels
of
pathogenic
organisms
SOCIO-ECONOMIC CONSEQUENCES
Loss of aesthetic value
Human health risk through contact recreation
Human health risk through ingestion of contaminated seafood
Loss in quality of seafood products
Loss of fisheries resources and revenue
3
· Table 4-3
An overview of direct causes and underlying sectors linked to transboundary marine pollution problems related to land-based activities.
TRANSBOUNDARY PROBLEM
UNDERLYING
DIRECT CAUSE
Microbial
Eutrophi-
Marine
Suspended
Chemical
SECTOR
contamination
cation
litter
solids
Pollution
Disposal of un- or under-treated municipal wastewater
Urbanisation, Tourism
Industriesa discharging un- or under-treated wastewater
Industry
Dredging activities
Transportation
Waste from coastal mining and exploration activities
Mining
Urbanisation, Tourism,
Contaminated surface and sub-surface runoff (e.g. from municipal, industrial Industry, Mining,
and agricultural areas, as well as from accidental spills)
Transportation,
Agriculture
Destruction of coastal forests contributing to high suspended solid loads
Forestry
River discharges transporting high suspended solid loads (as a result of soil
Agriculture. Urbanisation,
erosion) and/or transporting municipal/ industrial waste and agrochemicals
Industry
from catchments
Leaking and leaching of agrochemical (fertilizers and pesticides) from
Agriculture
inadequate storage facilities, dumping or return-flows
Runoff
from
livestock
rearing areas
Agriculture
Industry, Urbanisation,
Atmospheric emissions (e.g. incineration of waste, vehicle and industrial
Tourism, Energy
emissions and wood/coal burning)
production
Urbanisation, Tourism,
Inadequate collection, treatment and disposal of solid waste
Industry, Transportation
Public littering on beaches and in areas where litter can be transported into
Urbanisation,
coastal areas
Tourism
Waste products from aquaculture farms that are high in nutrients and
Aquaculture
suspended solid loads
a. Including: sugar factories, fish and food processing industries, textile industries, tanneries, paper and pulp mills, chemical, pharmaceutical, cement and fertilizer factories.
4
The root causes of the priority transboundary marine pollution problems identified for the WIO region
are generally cross-cutting. Within the WIO region, the following root causes are considered relevant
to marine pollution issues:
· Population pressure - Population growth is one of the key (or fundamental) root causes posing a
threat to marine resources in coastal areas of the WIO region because of the increase in demand
for goods and services and means of livelihood. The associated rapid urbanisation with changes in
lifestyles characterised by high consumption rates, results in increased generation of waste. All of
the countries in the WIO region experienced rapid population growth and urbanisation in coastal
areas, particularly within the larger coastal centres. More details on these demographic
characteristics of the region are provided in Chapter 3.
· Poverty and inequality - The WIO region is characterised by some of the highest poverty levels in
the world, as seen from the estimated per capita income in the different countries (see Table 3.1).
Consequently, lack of adequate resources is one of the main reasons for insufficient or unsuitable
sanitation or solid waste disposal facilities in many of the countries in the region.
· Inappropriate Governance - Governance sets the stage within which management occurs (UNEP,
2006). Based on the assessment of governance of marine pollution in the WIO region (Chapter 5),
it is clear that in many of the countries some of the important building blocks for effective
governance are not in place, the level of inefficiency varying from one country to another.
· Inadequate knowledge and awareness - Empowerment of people in society is considered a key
factor in the alleviation of poverty (another root cause), allowing them to play an active role in
effective governance and management of natural resources (including marine resources).
Knowledge is a key pillar for empowerment of people, however, within the countries of the WIO
region many do not have access to appropriate knowledge on matter such as:
· Environmental impacts and socio-economic consequences of human activities that, in many
instances, are affecting people's own quality of life.
· Technologies to prevent or minimize the impact on environment and the goods and services
that are provided, for example technologies for municipal wastewater treatment, solid waste
treatment and disposal, or appropriate agricultural activities.
· Existing policies and institutional structures that provide (often legally) enforceable ways of
preventing or mitigating impacts on the environment and socio-economic well-being of
people.
· Inadequate Financial Resources - Lack of financial resources, both to implement and enforce
appropriate technologies and practices to prevent or minimise environmental impacts and/or socio-
economic consequences of human activities in the marine environment are a concern in many
countries in the WIO region. Furthermore, the lack of commitment by politicians in many
instances, to address issues of environmental concern (including marine pollution) is reflected in
the low priority given to such issues in the policies and budget allocations of countries in the
region. Furthermore, the socio-economic consequences of such impacts are also not properly
communicated to politicians knowledge that could change such behaviour.
As may be concluded from Table 4-3, the direct causes of the priority transboundary marine pollution
problems can roughly be attributed to eight key underlying sectors, namely:
· Urbanisation
· Tourism
· Agriculture
· Industry
· Mining
5
· Transportation (including harbours)
· Energy production
· Aquaculture
The direct causes (or activities) contributing to transboundary marine pollution problems related to the
above-mentioned sectors are further explored in the following sections.
Urbanisation & Tourism
Of increasing concern in the countries of the WIO region is the rapid and often uncontrolled
urbanization (including tourism developments) occurring in coastal areas. Associated with this rapid
and uncontrolled urbanisation are an increase in municipal wastewater, municipal solid waste and
atmospheric emissions (e.g. from fossil fuel burning and vehicular traffic) which are often not properly
managed or controlled, thereby contributing to many of the priority transboundary marine pollution
problems seen in the region (see Table 4-3).
Municipal wastewater. Untreated sewage from sanitary facilities (septic tanks, pit latrines and
malfunctioning wastewater treatment plants) is a major source of marine water quality degradation in
many of the countries in the WIO region (Anon Madagascar, 2006; Anon Mozambique, 2006; Munga
et al., 2006; Mohammed et al., 2006; Abdallah et al., 2006). Available information on municipal
wastewater loads from coastal areas in the WIO region vary from one country to another, where some
countries have detailed information on waste loads, others have very limited, often only qualitative
information. The level of treatment of municipal (or domestic) wastewater, as well as the type of
treatment (or lack thereof) also differs from one country to another (Kayombo, 2007) (see Table 4-4).
6
· Table 4-4
Indication of level of treatment of municipal (or domestic) wastewater in different countries of the WIO
region (Kayombo, 2007 unless otherwise indicated).
PERCENTAGE OF POPULATION
ESTIMATED
(numbers in brackets)
COUNTRY
COASTAL
Central
POPULATION
Septic tanks
sewer
Pit latrines
No system
& soak aways
systems
Comoros
0.3
5.3
94
(WHO and UNICEF, 2000;
838,399
-
(30,702)
(44,346)
(790.980)
WHO, 2003)
12
17
71
Kenya (major coastal towns)
844,412
-
(96,987)
(146,050)
(601,375)
Madagascar
11
70
19
3,940,894 -
(Mong, 2007; UNEP, 2007)
(429,309)
(2,759,165)
(752,420)
7
87.6
3.6
1.3
Mauritius 91,233
(6,816)
(79,916)
(3,305)
(1,196)
Mozambique
3.1
36
48.7
(Mozambique Demographic
2,035,324 - (64,988)
(732,717)
(991,447)
and Health Survey, 2003)
Seychelles
7.5
87.6
3.6
1.3
89,575
(Montano, 2007)
(6,712)
(78,489)
(3,195)
(1,179)
South Africa* (25 coastal
47
4
18
15
municipalities) (derived from
8,994,000
(4,255,000)
(353,000)
(1,652,000)
(1,330,000)
Statistics South Africa, 2008)
Tanzania (large coastal towns -
2.8
9.8
81.5
5.9
24,603,587
Tanzania mainland & Zanzibar)
(677,205)
(2,423,160)
(20,046,107)
(2,243,011)
* Western Indian Ocean region, i.e. Provinces of Eastern Cape and KwaZulu-Natal (population of 25 coastal
municipalities). Note that 16% of the population (1,414,000) uses other systems e.g. dry and chemical toilets (14.5%)
and bucket systems (1.5%)
Available data on estimated volumes and loads of selected pollutants associated with municipal
wastewater in coastal areas of the WIO region are provided in Table 4-5 and Table 4-6, respectively.
· Table 4-5 Estimated volumes of municipal wastewater generated in coastal areas of the WIO region (i.e.
potentially entering the coastal zone).
COUNTRY
ESTIMATED VOLUME (m3/day)
Comoros 168a
Kenya (Mwaguni, 2007, Kayombo, 2007)
145,500
Madagascar (Kayombo, 2007)
No data readily available
Mauritius (Kayombo, 2007) 130,420
(173,500b)
Mozambique 29,149c
Seychelles 4,922
(10,372b)
255,000 (offshore, preliminary treatment)
South Africad
46,300 (surf zone, secondary treatment)
31,500 (estuaries, secondary treatment)
Tanzania (Tanzania mainland and Islands)
37,912
a. Assuming 0.8% of population is sewered with an estimated 20 kl/capita/yr given by UNEP, 1982
b. Volume of wastewater to be collected and treated after planned extension of systems
c. Assuming 15% of population is sewered with an estimated 20 kl/capita/yr given by UNEP, 1982
d. Western Indian Ocean region, i.e. Provinces of Eastern Cape and KwaZulu-Natal (RSA DWAF, 2004)
Note: Estimate for wastewater volume for Madagascar are outstanding.
7
· Table 4-6
Estimated loads of organic material (BOD), suspended solids and nutrients generated from municipal
wastewater in coastal areas of the WIO region (Kayombo, 2007).
ESTIMATED LOADS (tonnes/year)a
COUNTRY
SUSPENDED
BOD
NITROGEN
PHOSPHOROUS
SOLIDS
Comoros
489 1,063 212
26
Kenya
2,744 3,889 802
97
Madagascar
2,962 6,869 1,417 172
Mauritius
598 1,388 286
35
Mozambique
1,137 1,203 108
26
Seychelles
541 1,254 259
31
South Africab
39,502 30,478 4,518 2,259
Tanzania
21,741 50,413 10,398 1,260
a. Loads from septic tanks calculated as per WHO (1982) unless otherwise stated
b. Western Indian Ocean region, i.e. Provinces of Eastern Cape and KwaZulu-Natal (using volumes from Table 5 and
estimated concentrations for raw sewage provided in WRc, 1990 with secondary treatment concentrations derived
from percentage removal estimated in WHO, 1982)
To varying levels, municipal wastewater is disposed of into or enters the marine environment through
seepage or rivers in all of the countries of the WIO region. Microbial contaminants, nutrients and
suspended solids are the main pollutants of untreated municipal wastewater. Highest concentrations of
these pollutants are found close to the major cities in the region, though in many rural areas of the
coast, low level sewage contamination from defecation on beaches or in coastal bush is common.
From the above analysis it may be concluded that the highest pollutant loads entering the WIO
originate from the mainland states as well as Madagascar, with South Africa and Tanzania far upfront.
This finding is obviously not very surprising, considering the size of the coastal cities in these
countries. However, in the case of South Africa, about 74% of the municipal wastewater is discharged
to the offshore marine environment (Table 4-5) through properly designed marine outfalls where the
quantity and composition of the effluent must be within limits that meet site-specific environmental
quality objectives (RSA DWAF, 2004). In terms of wastewater volumes, countries having a high level
of sewerage coverage obviously generate and discharge relatively more wastewater than those whose
pollution is mainly served by offline system (pit latrines, septic tanks and soakaway pits). The
example in this case is Mauritius, which generates equal or more wastewater than most (much larger)
mainland states, although the pollution (BOD, N, P and SS) loads are much lower.
Solid waste disposal Information and data on the quantities of solid waste disposed of in coastal areas
of the WIO region varies considerably from country to country (Lane, 2007). At one extreme, South
Africa has been publishing the results of research into marine litter for over two decades and there is
information on the abundance, distribution and trends of different types of litter around the coast. The
sources of the litter are inferred rather than demonstrated, but it is obvious that most of it originates
from littering and inappropriate waste disposal on land. Seychelles also has such a good waste
management system in place and knows it contributes almost nothing to the marine litter load of the
region. Mauritius falls into a similar category of wealth and governance and ability to contain wastes.
Mozambique, despite poverty and inadequate governance capacity, knows it also currently contributes
very little to the marine litter load. This is because it has a very poor transport infrastructure and the
vast majority (about 70%) of the population live in rural poverty with limited access to products with
plastic packaging. Additionally, informal `recycling' of most salvageable products is commonplace.
These factors have kept solid waste loads that may contribute to marine litter under control thus far but
this situation may change fast (Lane, 2007).
At the other extreme, in Tanzania, Madagascar and Kenya, there is relatively little information on the
quantities, types and characteristics of solid waste sources contributing to marine litter, except that
8
large quantities of litter from urban areas do reach the sea. The main reason for the littering is that
none of these countries has an adequate solid waste management system in place (Lane, 2007).
However, common to all countries is that most land-based sources of solid wastes are associated with
urban centres, particularly informal settlements and industrial/commercial areas, and that wastewater
run-off is the main distributor - via rivers, streams and storm water drains. According to Lane (2007),
the major land-based sources of marine litter were found to be:
· Solid waste dump sites (legal and illegal) located on the coast or on rivers banks;
· Surface water runoff (from storm water drains, untreated municipal wastewater);
· River discharges and flood waters;
· Industrial wastewater discharges; and,
· Public litter on beaches and other coastal areas.
The major sources of solid waste contributing to marine litter in each of the countries of the WIO
region are summarised by Lane (2007), and shown in Table 4-7.
· Table 4-7
Summary of major sources of marine litter in the countries of the WIO region (Source: Lane, 2007,
unless otherwise referenced).
COUNTRY
MAJOR SOURCES
Of particular concern is waste from hospitals, including compresses, syringes, braiding,
Comoros
packaging, plastics, glasses and human waste discharged in open dumpsites usually in the
vicinity of the hospitals (Abdallah et al., 2006).
The major sources of marine litter are reported to be beach recreation (66%), shipping (14%),
Kenya
dumping and surface run-off from urban areas.
The major sources are dumping on the beach and surface run-off from urban/industrial areas
(including medical and household wastes) and other areas with crude dumping practices on
Madagascar
land. There are also reported to be numerous shipwrecks that contribute substantially to
marine litter, occurring particularly during the annual cyclone period.
Marine litter arises chiefly from beach recreation, surface run-off from urban areas and from
Mauritius
rivers. The volume of ship-generated garbage is far smaller than land generated volumes.
Beach users, garbage from shipping, fishing gear, road users and urban storm water runoff
Mozambique
are the major sources of litter.
Most litter is from water run-off from rivers and storm drains, despite daily cleaning, from
Seychelles
port wastes and particularly from public eating spots or picnic areas. Data are not available
for litter from the fishing industry.
The major source of marine litter is surface run-off from urban areas (via rivers and storm
drains), confirmed by (a) litter deposition being greatest in the rainy season (winter in the
Cape) and higher closer to urban areas; and (b) the high proportion of South African-made
articles (96%) among stranded litter. Commercial, industrial and low income residential areas
South Africa
produce most litter. Ship-generated waste in South Africa is trivial compared to land-based
litter sources. Some litter comes across the South Atlantic in the West Wind Drift from
Argentina, Uruguay and Brazil. Marine litter on uninhabited oceanic islands derives from
local and foreign fisheries, and distant continents.
The major source of marine litter arises from uncontrolled disposal of solid wastes in
unplanned settlements where, for example, about 70% of Dar es Salaam's population live.
Most litter is from surface run-off, illegal dumping into river valleys and drainage from crude
Tanzania
open dump sites located near the beach and by rivers. Marine litter also arises from fishing
and shipping, as the economic major city of Dar es Salaam has a moderate sized port and
fishing is a major activity of the coastal communities. The latter are presumed to contribute a
significant quantity of gear, boats, traps, and plastic bottles to the marine litter volume.
Atmospheric emissions Activities linked to urbanisation and tourism that can contribute to marine
pollution through atmospheric emissions include:
9
· Fossil fuel fires - a large majority of coastal communities in the WIO region use fossil fuel for
their domestic energy needs (therefore also linked to the energy production sector).
· Traffic emissions - motor vehicles emissions can contribute significantly to atmospheric pollution.
· Forest burning for land clearing urban development adds pressure on land for growth.
Atmospheric pollutants can also originate from solid waste dump sites and burning of waste. Rotting
processes can cause serious odour problems and methane gas emissions, while burning of wastes
generates thick smoke which is not only aesthetically unpleasant, but also contains other pollutants,
such as particulate matter and gases from burning plastics.
Data on atmospheric emissions (e.g. suspended solids, nitrogen, trace metals and hydrocarbons),
particularly those which contribute to marine pollution, are lacking for the entire WIO region. In
Mauritius, South Africa and Tanzania, atmospheric emissions are being monitored in some of the
coastal centres (see Dubula et al., 2007; Mohammed et al., 2006; Anon Mauritius, 2006), but fail to
provide insights into the actual loads being deposited in the marine environment.
Agriculture and Forestry
Agriculture is the backbone of the economy of most countries in the WIO region and is central to the
alleviation of poverty and generation of revenue. Agricultural activities contribute mainly to marine
pollution insofar as practices produce elevated levels of four types of pollutant, namely suspended
solids (the result of erosion due to inappropriate land use practices), inorganic nutrients (excessive use
of fertilizers), pesticides (persistent organic pollutants) and microbial contaminants (typically
associated with runoff from livestock rearing areas). Pollutants from agricultural activities usually
enter the marine environment through river discharges, although agricultural activities adjacent to
coastal areas can directly contaminate coastal waters through surface or sub-surface runoff.
As reported by UNEP (1998), the physical effects of soil erosion in river basins and the subsequent
impacts related to suspended solid loading and siltation in coastal systems are currently of greater
concern than agrochemical pollution in most countries throughout the region. Impacts from soil
erosion are most notably along the coasts of Kenya and Madagascar.
Agricultural activities in the countries of the WIO region are increasing and are becoming more
industrialised. With this comes the risk of increased soil erosion and use of agro-chemicals. Even
without substantial scientific evidence of existing impacts, it can be expected that marine pollution
risks associated with agricultural activities (e.g. high suspend solid, nutrient and persistent organic
pollutant loads) may well increase in coming years, unless appropriate and environmentally-
sustainable agricultural practices are promoted within the large river basins discharging into the WIO
region, thereby following the precautionary approach.
The destruction of coastal forests can also contribute to high suspend solid loading in coastal areas.
Industry
Major industries and mining activities situated within coastal areas of the WIO region include:
· Textile industries
· Tanneries
· Paper and pulp mills
· Breweries
· Chemical factories
· Cement factories
· Sugar refineries
10
· Food processing industries (e.g. fish factories and slaughter houses)
· Fertilizer factories
· Oil refineries
· Oil and gas exploration (an emerging activity).
These industries and mining activities do, or potentially can, contribute to transboundary marine
pollution problems either through inappropriate disposal of liquid wastewater, solid waste or
atmospheric emissions. An overview of the industries and mining activities and their potential
contribution to transboundary marine pollution problems is presented in Table 4-8.
· Table 4-8
Overview of key industries and their potential contribution to transboundary marine pollution problems
in the WIO region.
TRANSBOUNDARY PROBLEM
INDUSTRY TYPE
Microbial
Eutrophication
Marine Litter
Suspended
Chemical
contaminants
(nutrients)
(solid waste)
solids
pollution
Textile
X
X
X
Sisal
X X
X
Tanneries
X
X
X
X
Paper and pulp
X
X
X
Breweries
X
X
X
Chemical*
X
X
X
Cement
X
X
Sugar production
X
X
X
X
Food processing (including fish)
X
X
X
X
Fertilizer
X
X
X
Oil refinery
X
X
Oil and gas exploration
X
X
* including production of agrochemicals and pharmaceuticals
In the Comoros, processing industries associated with agricultural and livestock production (including
food processing) account for 85% (14.41 tonnes per annum) and 92% of the BOD and suspended solid
load, respectively (Abdullah et al., 2006). However, the loads of BOD, suspended solids and solid
waste produced by such industries are considered to be small by comparison to domestic waste loads.
In the coastal areas of Kenya, most industrial activity is situated in and around Mombasa, Kilifi and
Lamu districts. Very few industries treat their wastewater which is discharged either to municipal
sewers or storm water drains. Due to the proximity of the industrial areas to the natural drainage
systems, e.g. on Mombasa Island and the surrounding mainland shores, most of the pollution effluent
ends up in the creeks around Mombasa. Solid wastes from industries are of unknown composition and
quantity, but likely to include hazardous components (Mwaguni and Munga, 1997). The petroleum
refinery at Changamwe produces considerable quantities of hazardous sludge (containing toxic
substances such as hydrocarbons and heavy metals) which is disposed of on agricultural land within
the refinery grounds. Large quantities of solid waste are produced by cashew nut and sisal processing
factories, producing about 15,330 and 8,400 tonnes/year respectively. The sisal processing industry
also discharges considerable quantities of liquid waste directly into the sea, thereby exerting a
significant BOD load.
11
Most industrial activities in Madagascar are situated in coastal urban centres, mainly near the ports of
Antsiranana, Ambilbe, Mahajanga, Tolagnaro and Toamasina, with the exception of the textile
industry, which is primarily located inland at Antananarivo. The industrial activities are focused on
seafood processing, sugar, oil and soap production, breweries, tanneries and sisal production (Anon
Madagascar, 2006). The majority of these industries do not treat their waste; however, where there is
some treatment, it is limited to coagulation and decanting, or only decanting prior to discharging into a
treatment system or directly into the sea (Anon Madagascar, 2006; Kayombo, 2007). By comparison
with municipal waste, the pollution load from industry is considered to be relatively small.
In Mauritius, about 4 million cubic metres of industrial wastewater are produced annually, of which
most is discharged to treatment plants (Anon Mauritius, 2006), from industries that include sugar
production (the largest contributor to industrial wastewater), textile (e.g. dye houses), breweries and
food processing plants. Plaine Lauzun, Vacoas-Phoenix and Coromandel are the main industrial zones
in Mauritius, with industries in the former two areas discharging wastewater directly to the Fort
Victoria and St Martin wastewater treatment plants, respectively, while the Coromandel industrial
zone, comprising mostly dye houses and soap- and food-processing industries, directs wastewater
through a 600 m long outfall into the Pointe aux Sables lagoon. The estimated pollution loading from
31 industries located in Mauritius is 1,117 tonnes/year of BOD, 17 tonnes/year of nitrogen, 81
tonnes/year of total phosphorous and 2,306 tonnes/year of suspended solids.
Most industrial facilities in Mozambique are located in the coastal urban centres of Maputo, Matola
and Beira and include textile, paper and tyre factories as well as a brewery. Most of these industries
discharge untreated wastewater into the Infulene River that drains into Maputo Bay (Anon
Mozambique, 2006). The total number of industrial units listed for Maputo has increased from 11 in
1982, to 29 in 1992 and 137 in 1996. These industries produced a total of 79,388 tonnes of BOD in
1996, including an unknown amount of waste containing heavy metals such as mercury, lead,
chromium, manganese, nickel and zinc (Anon Mozambique, 2006).
The major industries in the Seychelles known to be sources of marine pollution are the food
processing and chemical industries. Calculations of BOD loads to the coastal water environment
derived from industrial activities indicate that food processing industries (agriculture and livestock
products) accounts for 71.6 % and 88.7 % of the BOD and suspended solid loads from industry,
respectively (Radegonde, 1997). Other major contributions are from the fish processing and canning
industries (also food processing), which account for 17.7% and 6.7% for BOD and suspended solid
loads respectively. The brewing industry is reported to contribute 18% to the total BOD load. In
Seychelles, industrial waste accounts for only 17.5% of total BOD load discharged into the
environment, with 72% derived from storm runoff and municipal wastewater. Fifty six percent of the
suspended solid load was reported to be derived from industrial waste, with the remainder being
derived from municipal sources.
In South Africa, industrial wastewater disposal to the WIO region mainly occurs in the larger urban
centres along the east coast (e.g. Port Elizabeth, East London, Durban and Richards Bay) where an
estimated 308,100 m3/day of industrial wastewater is disposed of to sea. Most of these discharges,
however, occur to the offshore environment through properly designed marine outfalls that are subject
to regular environmental monitoring and assessment studies (RSA DWAF, 2004; Taljaard et al.,
2006).
Although the level of industrialisation of Tanzania is considered to be relatively low, disposal of
untreated industrial waste is causing localised pollution. About 80% of the industries in Tanzania,
including food processing industries (also referred to as agro-industries), chemical factories,
breweries, soap and steel manufacturing establishments, are located in the coastal city of Dar es
Salaam where most of the industries discharge their wastewater into the Msimbazi and Mzinga creeks
(Mgana and Mahongo, 1997, 2002). Industrial wastewater discharges contribute an estimated
2,715 tonnes/year of BOD and 15,454 tonnes/year suspended solids to the marine environment. This is
equivalent to 19% and 55% of the total BOD and suspended solid loads for the city, respectively.
12
Breweries account for most of the BOD and suspended solid loading, while nutrient loads (nitrogen
and phosphorus), originate mainly from slaughter houses.
About 43% of the major industries examined in Dar es Salaam contribute to atmospheric pollutant
loads. Among these, the cement industry (at Wazo Hill) is the principal atmospheric polluter, emitting
approximately 2,831 tonnes of air-borne particulate material per year. If Wazo Hill is a representative
model, the same levels of pollution may be expected from the cement factories elsewhere in the
region, e.g. Maputo, Bamburi (Mombasa) and Kaloleni (Kilifi).
In Zanzibar, industrial activities are mainly concentrated in the Saateni, Maruhubi and Mtoni areas and
include mainly food processing (slaughter houses, dairy products and beverages) and chemical (soap
production) industries, in total generating BOD and suspended solid loads of between 15 and 16
tonnes per year, respectively.
Mining
Coastal mining in the WIO largely comprise the extraction and baking of coral rock or and mineral
mining. These activities potentially contribute to the deterioration in water and sediment quality
through the disposal of solid waste, suspended solids and chemical pollution. No quantitative
information on the contribution of these activities to marine pollution, however, are available for the
region.
Transportation
Almost all of the large urban centres within the WIO region support large commercial ports and
harbours (Figure 1.1). Activities within harbours contribute significantly to transboundary marine
pollution problems including dry dock facilities, disposal of garbage and dredging. Furthermore,
industrial zones are often in close proximity to the major ports and harbours. Major issues that have
been listed for ports and harbours in different countries are highlighted in Table 4-9.
13
· Table 4-9
Major ports in the countries of the WIO region and reported marine pollution issues.
COUNTRY
PORT/HARBOUR
MAJOR ISSUES
Located near a river and as a result of continued sedimentation is
Comoros Mutsamudu
becoming shallower, reducing its capacity to accommodate larger
ships and vessels (Abdullah et al., 2006).
The port area is subjected to environmental perturbation due to
shipping and other marine and land-based activities. Periodic
dredging in the port and approach channels for maintenance and
Kenya Kilindini
(Mombasa)
expansion of utilities re-suspends considerable quantities of
particulate material and associated pollutants (e.g. nutrients,
heavy metals, persistent organic pollutants, etc.) (Munga et al.,
2006).
According to Anon Madagascar (2006), marine pollution linked
to harbours derive from:
Numerous ports, e.g. · Spillage of pollutants (e.g. chemical products and oil) during
Madagascar
Antisranana, Mahajanga,
loading and off loading;
Toamasina and Toliar
· Lack of facilities to handle garbage, oil residues and
wastewater from vessels; and,
· Lack of facilities and infrastructure to remove wrecks.
Dredging is undertaken on an ad hoc basis for maintenance
Mauritius Port
Louis
works in existing channels as well as for port development (Anon
Mauritius, 2006).
Mozambique
Maputo, Beira and Nacala No specific issues have been listed, but major issues are most
and several small ports e.g. likely associated with dredging and spills. Waste management in
Inhambane, Quelimane,
Port Louis harbour is a major issue (solid waste enters the port
Pebane, Angoche and through streams/surface runoff during rainy seasons) (Anon
Pemba
Mozambique, 2006).
Seychelles
Port Victoria
Dredging, reclamation, waste from rivers and fishing vessels,
food processing plants (cannery) (Antoine et al., 2007).
South Africa
Port Elizabeth, Ngqura and Contribute to marine pollution through poor operational practices
East London
and dredging activities (Dubula et al., 2006).
Tanzania
Dar es Salaam, Tanga, Heavy metals and organophophates levels in sediments are of
Mtwara and Zanzibar
concern, while other issues are mostly associated with dredging
operations and chemical spills. There are also waste management
problems (Mohammed et al., 2006).
Energy production
The energy production sector mainly influences marine water quality through thermal discharges of
cooling water and atmospheric emissions from combustion of oil, gas, or coal from power generation
installations and through atmospheric emissions associated with burning of fossil fuels (e.g. wood,
*charcoal and paraffin) for domestic cooking. Pollutant loads from these activities have not been
properly quantified for the WIO region and further investigation is needed before conclusive
statements can be made in terms of their contribution to marine pollution in the region.
Aquaculture
Although the WIO has much potential for aquaculture, these activities are currently largely limited to
the farming of crustaceans (e.g. shrimp, prawns and crabs) and seaweed in countries like Seychelles,
Madagascar, Mozambique (crustaceans) and Tanzania (seaweed) (WIOMSA, 2007). However,
although aquaculture is still poorly developed in the region, it is an emerging sector that could have
deleterious impacts on coastal water quality, in terms of organic/nutrient pollution from uneaten feeds
or waste products (e.g. faeces), cleaning fluids and antibiotics in the feeds, and suspended solids from
cleaning of ponds.
From the above overview, it may be concluded that the main sectors contributing to the transboundary
pollution problems in the WIO region are urbanisation, agriculture and industry, all having quite cross-
14
cutting impacts. Added to this, aquaculture, tourism, mining, transportation and energy are associated
with specific types of pollution.
4.2.2 Microbial contamination
Problem statement
Microbial contamination refers to the presence of pathogenic organisms in the aquatic environment
(protozoa, bacteria and/or viruses) of either human or animal origin that can pose health risks to
humans. In the WIO region, microbial contamination of coastal waters is typically associated with
inappropriate disposal of municipal wastewater (including sewage), contaminated surface and sub-
surface runoff from urban areas, contaminated runoff from agricultural areas used for livestock rearing
and industrial effluents (mainly from food processing industries).
Transboundary elements
Unlike enclosed or semi-enclosed marine water bodies, such as the Baltic or Mediterranean seas, the
coastal region of the WIO is more oceanic, generally with less chance of land-based sources of marine
pollution having widespread transboundary impacts. Furthermore, microbial contamination is often
localised to the immediate vicinity of the wastewater source. The transboundary element is therefore
on the basis of the problem being common to most of the WIO countries (rather than interlinked),
recognising that the problem is likely to be of different priority ranking for each country. In general,
microbial contamination of nearshore seawaters, such as amenity beaches, is considered one of the key
pollution problems for the WIO regions (see Table 4-1).
Root-cause analysis
The problem tree for microbial contamination in the WIO region, specifically linked to land-based
activities, is provided in Figure 4-4. As indicated, the key sectors contributing to microbial
contamination are urbanisation and tourism sectors (e.g. municipalities and tourist developments
responsible for municipal waste and wastewater disposal), agriculture (in particular livestock rearing
farmers), industry (specifically food processing) and transportation (referring to waste disposal
facilities in harbour and port areas).
Microbial contamination can have severe socio-economic consequences in coastal waters, such as:
· Human health risks associated contact recreation or ingestion of contaminated seafood; and,
· Reduced quality of seafood products cultured or harvested from a particular area.
These consequences affect stakeholders across society, from local communities to large international
tourism, industrial and aquaculture concerns who utilise the marine environment for recreation and
collecting and culture of seafood.
Loss or potential loss in the recreational value of coastal waters, as reflected in unacceptable levels of
faecal bacteria (typically used as indicators of microbial contamination) is evident throughout the
coastal zone of the WIO region. Areas of concern are usually linked to larger urban centres where
insufficiently treated or untreated waste and wastewater are some of the most important land-based
sources of pollution. In many areas the situation is worsened by unacceptable aesthetics and bad
odours, also a consequence of inappropriate waste and wastewater management.
Studies conducted around Taolagnaro (Madagascar) measured E. coli counts as high as 13,300
counts/100 ml in coastal waters. The high levels of microbial contamination were attributed to
defecation on the beaches as well as inappropriate treatment of municipal wastewater (Anon
Madagascar, 2006).
In Maputo Bay (Mozambique), microbial contamination has been recorded in shellfish tissues, where
for example, the bacteria Vibrio parahaemolyticus and V. mimicus were found in clams in the
15
Incomati River mouth, in the bay adjacent to Polana and near Matola in the Maputo Estuary. Vibrio is
the main cause of severe gastro-intestinal illnesses (Fernandes, 1996). High faecal coliform counts
were also detected at several locations including the area near the Infulene River mouth where values
exceeded 2,400 counts/100 ml. Such high contamination results from inappropriate sewage treatment
facilities - there is only one sewage treatment plant in Mozambique, located in Maputo City which
treats only about 50% of the city's sewage. Areas near the entrance of the Maputo Estuary (Miramar)
are also not considered safe for swimming. Faecal contamination has also been recorded in Beira Bay
and Nacala Bay, although levels were lower than those recorded for Maputo Bay (Fernandes, 1995).
Along the coast of Mauritius, total and faecal coliform is monitored on a monthly basis at eleven
selected public beaches, namely Flic en Flac, Albion, Pointe aux Sables, Trou aux Biches, Mon
Choisy, Le Goulet, Grand Baie and Blue Bay. The Ministry of Fisheries in 2004 reported that most of
the stations were within the recommended water quality guidelines for contact recreation in Mauritius
(counts of total coliform < 1,000 per 100 ml and faecal coliform < 200 per 100 ml), except some areas
in Pointe aux Sables (near Port Louis) where levels exceeded recommended guidelines (Dulymamode
et al., 2006).
16
Socio-economic Consequences
Human Health risks
Human Health risks
Loss in Quality of
(contact recreation)
(seafood ingestion)
Seafood Products
Environmental Impacts
IMPACTS AND
High levels of pathogenic
CONSEQUENCES
organisms
MICROBIAL CONTAMINATION
Agriculture
Tourism &
Industry &
Transport
Urbanisation
Mining
· Runoff from livestock
· Municipal wastewater
· Industrial wastewater
· Contaminated surface
raising areas
discharges
discharges (mainly food
and sub-surface storm
· River discharges
processing)
water runoff
· Contaminated surface
(municipal waste via
and sub-surface runoff
· Contaminated surface
· Solid waste disposal
catchments)
and sub-surface runoff
· Solid waste disposal
· Solid waste disposal
· River discharges
(municipal waste via
· River discharges
catchments)
(industrial waste via
DIRECT CAUSES AND
catchments)
UNDERLYING SECTORS
Root Causes
Poverty &
Inappropriate
Population pressure
Inadequate Financial
Inadequate
Inequality
Governance
Resources
Knowledge
· Figure 4-4
Problem tree: Microbial Contamination.
17
Studies conducted in Mombasa (Kenya) showed that microbial pollution levels in urban aquatic
environments were several orders of magnitude higher than in rural aquatic environments (Mwanguni,
2002).
In the Seychelles, the effluent from the wastewater treatment plants discharging directly to the ocean
was found to contain bacterial counts with ranges between 2,000 and 5,000 per 100 ml for total
coliform counts, far from their stipulated standards of 500 per 100 ml (Antoine et al., 2007).
In Zanzibar (Tanzania), high total and faecal coliform levels have been reported prompting health
concerns and warning of health risks to swimmers in certain coastal areas, e.g. Stone Town. Similarly,
some beaches in Dar es Salaam (e.g. Ocean Road and Banda beaches) have also been closed for
swimming and other recreational activities due to microbial contamination (Mohammed et al., 2006)
Risks/uncertainties and trends
Although the direct risks to human health associated with microbial contamination of coastal water in
particular are not clear, it was noted that, for example over 50% of all reported diseases in Kenya were
related to poor water quality associated with inadequate wastewater management (see note), although
no distinction was made between drinking water and coastal recreational waters , (Mwanguni, 2002).
Note:
In the literature consulted here, many sources reported that human diseases in coastal areas were mainly
water-borne diseases associated with poor water quality. These include diseases such as dysentery, cholera
and diarrhoea. However, the literature seldom distinguishes between the exact sources, i.e. whether these are
as a result of ingesting contaminated drinking (fresh) water or whether these are associated with
contaminated coastal waters (e.g. used for contact recreation). We are of the opinion that the former is
probably the most dominant source of these water-borne diseases, although contaminated recreational waters
certainly contribute to the problem.
Taking some of the root causes of microbial contamination into account, in particular population
pressure and poverty and inequality, it is likely that this problem will intensify in future, posing even
greater socio-economic risks to society, unless those responsible in the different sectors contributing to
this problem intervene.
4.2.3 High Suspended Solids /Sediments
Problem statement
High concentrations of suspended solid loads from land-based sources enter WIO coastal waters
mainly through municipal and industrial wastewater discharges, river discharges and surface runoff,
particularly during rainy seasons. Dredging activities (usually associated with ports and harbours) can
also significantly contribute to this transboundary problem.
Transboundary elements
The transboundary element is based of the problem being common in most of the WIO countries
(rather than interlinked) (see Table 4-1). However, taking into account the ocean circulation patterns in
the area (Figure 2-4), true transboundary impacts cannot be excluded, particularly where large
discharges from rivers are concerned. Also, high levels of suspended solids tend to effect nearshore
habitats such as coral reefs and estuaries, which are important for fish reproduction, consequently
resulting in a secondary transboundary impact.
18
Root-cause analysis
The key sectors contributing to high suspended solid loading into the marine environment are
agriculture (linked to soil erosion in river basins/catchments), industry (particularly those discharging
effluents containing high suspended solid loads/sediments) and transportation (primarily linked to
dredging activities). The urban sector (e.g. local municipalities) also contributes through inappropriate
disposal of municipal waste, while aquaculture farms can also contribute to the problems through the
disposal of waste containing high suspended solids. These are depicted in the problem tree shown in
Figure 4-5.
Key environmental impacts linked to high suspended solid loads are:
· Smothering of benthic communities
· Suffocation of marine organisms
· Mortality (acute effects) on marine biota
· Chronic and acute effects on marine biota
· Modification of marine biota species composition
· Discolouration of coastal waters.
Consequences associated with the problem affect stakeholders across society, from local communities
to large international tourism concerns. The social and economic consequences of increased
suspension of solids in coastal waters include:
· Loss of aesthetic value
· Loss of commercial and/or artisanal fisheries resources and revenue
· Loss in quality of seafood products.
Within the fisheries sector, aquaculture and agro-processing industries (for example, of seafood
production) are also affected.
Impacts associated with sediment loading have been recorded in the WIO region. For example, in
Kenya, sediment loading has been found to impact the coral reefs in the Malindi National Marine Park
and Reserve (McClanahan and Obura, 1997; Kazungu et al., 2002). A decrease in the number of some
local seagrass species has also been reported in Malindi Bay. In 1972 four endemic species were
reported for Mambrui in Malindi Bay, but in 1992 only two species remained (Wakibia, 1995).
Coincidentally, the decrease occurred in an area experiencing heavy siltation. There is also concern
that the loss of seagrass beds, due to sediment loading, may also have potential negative impacts on
fisheries, as these are important habitats for numerous fish species (Kazungu et al., 2002).
Discoloration of coral reef waters also results in the loss of aesthetic value rendering them less
attractive for tourism.
19
Socio-economic Consequences
Loss of Fisheries
Loss of Aesthetic Value and
Loss in Quality of
Resources & Revenue
Associated Revenue
Seafood Products
Environmental Impacts
Discolouration of
Modification in marine
Chronic effects on
Smothering of benthic
coastal waters
biotic species composition
marine biota
communities
IMPACTS AND
CONSEQUENCES
Mortality (acute effects)
Entanglement and/or suffocation
on marine biota
of marine organisms
High Suspended Solids
Agriculture &
Tourism &
Industry &
Transport
Aquaculture
Forestry
Urbanisation
Mining
· Soil erosion
· Municipal wastewater
·
· Disposal of waste (high
Industrial wastewater
· Dredging
· River discharges
discharges
discharges
suspended solids)
· Contaminated surface
(sediments from
· Contaminated surface
· Contaminated surface
and sub-surface storm
catchments)
and sub-surface runoff
and sub-surface runoff
water runoff
· Destruction of coastal
· River discharges
· Solid waste disposal
· Disposal of waste from
forests
(municipal waste from
mining and exploration
· River discharges
catchments)
activities (suspended
(industrial waste from
solids)
catchments)
DIRECT CAUSES AND
UNDERLYING SECTORS
Root Causes
Poverty &
Inappropriate
Population Pressure
Inadequate Financial
Inadequate
Inequality
Governance
Resources
Knowledge
· Figure 4-5
Problem tree: High suspended solids.
20
Sediment deposition and beach accretion (e.g. in Malindi Bay) have resulted in the loss of beach
frontage from some hotel and resort developments in Kenya with a resulting loss of tourism revenue,
further manifested in loss of employment (Kazungu et al., 2002). The port of Mombasa (Kenya) also
requires regular dredging of the navigational channel to maintain the depth required for shipping
activities. The associated costs of dredging are another socio-economic consequence of the impacts of
suspended solids on the Kenyan coastal waters (Kazungu et al., 2002).
In Mauritius, increased sedimentation and suspended solids (enhanced turbidity) have been reported in
the lagoon at Rodrigues and in Grand Baie, respectively, resulting in the modification of ecosystems
(Resource Analysis-EDC, 1999). In Grand Baie, increased suspended sediment loads were mainly
associated with industrial and household wastewater discharges, while in Rodriques it is mostly the
result of soil erosion from agricultural pasture in the highlands. Here some of the bays are completely
silted and channels have been constructed to facilitate the movement of boats. Sedimentation also
caused damage to the coral ecosystem (e.g. smothering) thereby impacting on artisanal fishing
(Mauritius Pollution Status Report, 2006).
In Mozambique, sedimentation due to poor land-use practices, including deforestation of the coast and
hinterland areas, are the main contributors to sedimentation of the coastal environment. As a result,
more frequent dredging of the Maputo and Beira harbours is needed. Surveys from ten years ago
showed that between 1.2 x 10⁶ m3 and 2.5 x10⁶ m3 of sediments need to be dredged annually from the
Maputo and Beira ports respectively (FAO, 1999).
Around the main islands of Mahe, Praslin and La Digue (Seychelles) sediment discharges contributed
significantly (~10%) to coral bleaching, together with other factors such as global warming (~70%)
(Jones et al., 2002).
In Madagascar, sedimentation has resulted in significant impact on mangrove areas, smothering the
root systems of trees and causing die-back of these forests (Anon, Madagascar, 2006).
Risks/uncertainties and trends
With agricultural activities increasing in the countries of the WIO region so too does the risk of soil
erosion due to inappropriate farming practices. Together with a projected increase in urbanisation
(and associated municipal waste) and industrial activities in the coastal zone, the problem of
sedimentation is likely to intensify unless the sectors contributing to this problem implement
mitigating measures, through better legislation and regulation, better land-use practices, education and
awareness.
4.2.4 Chemical Pollution
Problem statement
Chemical pollution refers to the adverse effects of chemical contaminants released to the coastal
environment from land-based human activities. Chemical contaminants are here defined as compounds
that are toxic, persistent and/or bio-accumulating. These can be grouped in three broad categories,
namely heavy metals, hydrocarbons and persistent organic compounds (e.g. pesticides). Sources in the
WIO region are typically linked to agrochemical discharges (e.g. persistent organic pollutants),
dredging activities in ports and harbour (thereby releasing sediment-bound heavy metals and
hydrocarbons), atmospheric emissions (e.g. heavy metals) and leachates from solid waste dump sites
(that include pollutants depending on the type of solid waste disposed).
Transboundary elements
The transboundary element is of chemical pollution is based on the problem being common for most
of the WIO countries rather than interlinked (see Table 4-1). However, taking into account the ocean
circulation patterns in the area, transboundary impacts cannot be excluded, particularly where large
21
discharges from rivers are concerned (see Figure 2-4). Also, this problem can contribute to
transboundary issues in an indirect way. For example, chemical pollution may affect one or more life
stage of a migrating marine organism, which may impact on the distribution and abundance of that
marine organism in a neighbouring country or region.
Root-cause analysis
The key sectors contributing towards chemical pollution of the coastal marine waters of the WIO
region include industry (disposal of toxic substances in wastewaters), agriculture (persistent organic
pollutants) and transportation (dredging activities in ports and harbours), and probably to a lesser
extent the urban sector (through traffic emissions) and energy production (from burning of fossil
fuels). Major industries contributing to chemical pollution in the WIO region include textile industries,
tanneries, paper and pulp mills, breweries, chemical, cement, sugar factories and fertilizer factories
and oil refineries. Inappropriate utilisation, storage and dumping of agrochemicals (e.g. pesticides) are
also of increasing concern. Furthermore, accidental spills of oil or chemicals in harbour areas or along
transport routes near the coast is another potential cause of chemical pollution in coastal areas. These
are summarised in the problem tree for chemical pollution provided in Figure 4-6.
Specific environmental impacts linked to chemical pollution include:
· Discolouration of coastal waters;
· Chronic effects (e.g. affecting growth and reproduction) of marine biota;
· Mortalities (acute effects) on marine biota; and,
· Modification of marine biotic species composition.
Consequences associated with chemical pollution problem affect stakeholders across society, from
local communities to large tourist development insofar as these pose risks to human health. The
fisheries sector, both commercial and artisanal, as well as the aquaculture and seafood production
industries may also be affected. Particular socio-economic consequences include:
· Loss of artisanal and/or commercial fisheries;
· Loss in quality of seafood products cultured or harvested from a particular area; and,
· Human health risks associated with contact recreation or ingestion of contaminated seafood.
Signs of chemical pollution have been recorded in coastal areas of the WIO region. Studies conducted
in the Killindini and Makupa creeks, Mombasa (Kenya) revealed elevated levels of heavy metals
(copper [Cu], cadmium [Cd], iron [Fe] and zinc [Zn]) although these levels were still considered to be
substantially lower than those reported for many perturbed coastal setting (Kamau, 2001).
22
Socio-economic Consequences
Loss of Fisheries
Human Health risks
Human Health risks
Loss in Quality of
Resources & Revenue
(contact recreation)
(seafood ingestion)
Seafood Products
Environmental Impacts
Discolouration of
Mortality (acute effects)
Modification in marine
Chronic effects on
on marine biota
biotic species composition
marine biota
IMPACTS AND
coastal waters
CONSEQUENCES
Chemical Pollution
Agriculture
Tourism &
Industry &
Transport
Energy
Mining
Urbanisation
· Agrochemicals
· Atmospheric emissions
· Industrial wastewater
· Dredging
(pesticides)
discharges
· Contaminated surface
·
·
River discharges
Municipal wastewater
discharges
· Contaminated surface
and sub-surface runoff
(agrochemicals from
and sub-surface runoff
catchments)
· Contaminated surface
and sub-surface runoff
· Solid waste disposal
· River discharges
· River discharges
(municipal waste from
(industrial waste from
catchments)
catchments)
DIRECT CAUSES AND
UNDERLYING SECTORS
· Atmospheric emissions
· Atmospheric emissions
Root Causes
Poverty &
Inappropriate
Population Pressure
Inadequate Financial
Inadequate
Inequality
Governance
Resources
Knowledge
· Figure 4-6
Problem tree: Chemical pollution.
23
Other studies conducted in these areas in Kenya also found that overall lead and cadmium
concentrations were low in the water column of Makupa and Tudor creeks. A few incidents of
elevated levels in sediments and some fish species were recorded, but levels of lead and cadmium in
most of the fish species analysed were generally within acceptable limits (FAO/WHO, 1986).
Studies conducted in Mozambique have shown the presence of heavy metals, particularly lead, in the
Port of Maputo, in the discharges from the Matola and Maputo rivers and in Nacala Bay (Fernandes,
1995; Anon Mozambique, 2006). Also in Mozambique, common pesticide residues identified were
2,4,5-TCB, p,p'-DDT, p,p'-DDE, p,p'-DDD, Lindane and HCB. Though DDT is officially banned in
Mozambique it is still used, as it is in neighboring countries (Massinga and Hatton, 1997).
During the period July 2001 and January 2003, studies on six estuaries along the Mauritian west coast
were undertaken to measure heavy metal concentrations. In water samples taken from river mouths at
Grand River North West, Pointe Roches Noires, Grand River South East, Mahebourg, l'Escalier, Baie
du Cap, Tamarin and Rivière Lataniers, the heavy metals copper, zinc, lead, cadmium and mercury
and the three pesticides, atrazine, diuron and hexazinone were not detected at any of the monitored
sites. The study concluded that the levels of chromium, lead and zinc were well below the limits of
600, 2,500 and 700 µg/g respectively quoted for contaminated sediments adopted from the draft
Netherlands standards (24% clay and 10% organic matter by weight) during the period January
October 2000 (Mauritius Pollution Status Report, 2006).
In South Africa, municipal and industrial wastewater discharges are regulated and licensed. This
appears to have some positive influence on sustaining acceptable environmental quality (also in terms
of controlling chemical pollutants) as reflected in the monitoring and assessment studies conducted in
and around these offshore outfalls (CSIR 2004; McClurg et al., 2007;). Inputs of persistent organic
pollutant loads into coastal waters from agriculture (e.g. pesticides) are not known for South Africa,
though pesticides have been detected in fatty tissues of seals and dolphins along the South African
(and Namibian) coast (Vetter et al., 1999) although, in general, levels were not considered to represent
a serious pollution problem.
Similarly, studies investigating heavy metal accumulation in Cape Town revealed that the coastal
environment is generally in a clean condition, except is localised areas such as the Port of Cape Town
(Brown, 2005; CSIR, 2006a, 2006b). The fairly good state of the environment is also reflected in the
results from a Mussel Watch Programme conducted along South Africa's west coast. Results for
cadmium, lead, zinc and mercury did reflect inter-annual variations, but as yet no clear long-term
(increasing) trends seem to be apparent (Figure 4-7).
24
30
700
Cadmium
Zinc
) 25
600
s
s
ma
y
500
20
g dr
400
ug/ 15
(
300
onc 10
c
200
s
ue
s
5
Ti
100
0
0
35
0.45
Lead
Mercury
30
0.40
ass)
0.35
25
y m
0.30
dr
/
g 20
g
0.25
u
c
( 15
0.20
0.15
10
ssue con
0.10
Ti
5
0.05
0
0.00
7
8
9
0
1
4
5
8
5
8
6
8
8
7
8
8
8
8
8
9
9
9
0
9
9
2
9
3
9
3
9
9
4
9
9
6
9
7
9
9
0
0
0
1
8
7
8
8
8
9
9
0
9
1
9
4
9
5
T
T
8
5
8
6
8
7
8
8
8
9
9
0
9
2
9
3
9
3
9
4
9
9
Y
T
Y
T
Y
T
Y
T
Y
T
R
T
Y
T
Y
`
9
5
T
T
T
Y
T
Y
T
Y
T
Y
T
Y
T
R
T
Y
T
Y
`
9
5
y
-
9
6
y
-
97
y
-
98
y
-
99
T
C
C
A
C
A
C
A
C
A
C
A
C
A
C
A
C
A
T
a
y
-96
c
t-
a
y
-97
c
t-
a
y
-98
a
y
-
99
C
2
0
2
0
2
001
2
002
2
003
C
C
A
C
A
C
A
C
A
C
A
C
A
C
A
C
A
T
a
c
t
-
96
a
c
t
-
97
a
a
C
2
0
00
2
001
2
0
01
2
002
2
003
O
O
M
O
M
O
M
O
M
O
M
O
O
O
O
O
M
O
M
O
M
C
Y
Y
T
T
C
Y
Y
T
T
O
M
M
M
M
O
A
A
C
C
A
O
O
M
O
M
O
M
O
M
O
M
O
M
O
M
O
M
O
M
M
M
M
O
A
A
C
C
A
M
M
O
O
M
M
O
O
· Figure 4-7
Heavy metal concentrations (µg/g or mg/kg dry weight) measured in mussel tissue along the South
African coast (Cape Town) (1985 2003) (Source: G Kieviets, Department of Environmental Affairs and Tourism,
Marine and Coastal Management, South Africa, pers. comm.)
In Dar es Salaam (Tanzania), Mremi and Machiwa (2003) found significant amounts of some heavy
metals in mangrove sediments and associated biota near Dar s Salaam. Sediment samples from
Msimbazi and Mtoni mangrove areas, which are located within the city, had higher levels of heavy
metals (up to three-fold) compared to samples from mangrove forests away from the city, at Mbweni,
clearly signifying anthropogenic input as a cause (see Table 4-10).
· Table 4-10 Average concentration (mg/kg dry weight) of heavy metals in mangrove sediment and biota in Dar es
Salaam area (Mremi and Machiwa, 2003), as well as the recommended environmental targets (EQTs) for sediments
in the WIO (Taljaard et al., in prep).
HEAVY
RECOMMENDED EQTs
MBWENI
MSIMBAZI
MTONI
METAL
(Sediments)
Sediment Crab Sediment Crab Sediment Crab
Copper
18.7
10.7 24.7 31.6 36.2 17.9 39.3
Cromium
52.3
10.1 30.0 31.7 30.0 27.1 30.0
Lead
30.2
27.8 15.0 37.5 14.3 36.8 44.1
A ten-fold increase in heavy metal content in several algal species over a period of just seven years has
been reported from different parts of Zanzibar and Dar es Salaam (Ferletta et al., 1996). Another study
has shown that macroalgae collected from Chapwani and Changuu Islands off Zanzibar had significant
levels of aluminium and cadmium (Engdahl et al., 1998), with a suggested source of these
contaminants being the various industries in nearby Stone Town.
Ferletta et al. (1996) conducted baseline study on the accumulation of heavy metals in algae as
indicators of pollution of marine water in Dar es Salaam and Zanzibar. Comparing the results from
1989 and 1994 there was a significant increase of heavy metal concentrations (Table 4-11). These
authors collected samples at 20 stations along Dar es Salaam and Zanzibar beaches and found zinc and
other heavy metal concentrations to be highest at stations close to the city centre compared with the
stations in rural areas.
25
· Table 4-11 Comparison of heavy metal concentrations measured in the algae in 1989 (Wekwe et al., 1989) and
1994 (Ferletta et al., 1996) in Dar es Salaam (Oyster Bay) and Zanzibar (Mdudya Island).
DAR ES SALAAM (OYSTER
MDUDYA ISLAND (near
HEAVY METAL
ALGAE
BAY)
Zanzibar)
1989
1994
1989
1994
Cadmium 0.12
2.3
0.14
2.6
Chromium
1.5 6.6 1.5 4.6
Copper
1.0 5.0 1.0 8.4
Iron 11
Padina
90
613
1189
278
Manganese 58
tetrastromatica
.5
nd
58.6
nd
Nickel 0.38
6.5
0.38
6.5
lead
2.15 6.10 2.17 10.10
Zinc
33.4 104.6 34.0 13.4
Cadmium
0.3 3.3 0.3 nd
Chromium
0.8 5.5 0.8 nd
Copper
7.0 7.9 7.0 nd
Iron
230 412 230 nd
Ulva sp.
Manganese 3.5
24
3.6
nd
Nickel
0.9 7.8 0.9 nd
lead 1.6
13.3
1.6
nd
Zinc
28 39.9
27.9
nd
nd - Not detected
An analysis of heavy metals in the sediments of the inner area of the Dar es Salaam harbour
(Machiwa, 2000) also revealed the accumulation of certain heavy metals, notably chromium and
copper (see Table 4-12). The harbour area is a recipient of large quantities of industrial waste from
the city of Dar es Salaam.
· Table 4-12 Average concentration (mg/kg dry weight) of total heavy metals measured in sediments of harbours
and estuaries in the WIO region (Sources: Machiwa, 2000; Mauritius Pollution Status Report, 2006), as well as the
recommended environmental targets (EQTs) for sediments in the WIO (Taljaard et al., in prep).
AVERAGE HEAVY METAL CONCENTRATION (mg/kg)
STUDY AREA
Chromium
Copper
Mercury
Lead
Zinc
Recommended
EQTs
(sediments)
52.3 18.7 0.13 30.2 124
Dar es Salaam harbour
33
28
0.1
21
68
Mauritius west coast estuaries
225
-
-
27
107
One study conducted on marine sediments and biota along the coastline of Dar es Salaam (Mwevura et
al., 2002b) concluded that organochlorine pesticide levels in sediments (for dieldrin, p,p'-DDT, p,p'-
DDE, p,p'-DDD, o,p'-DDT and g-HCH) might cause adverse effects to humans consuming biota
directly exposed to the sediments, but that levels measured in biota living in the water column were
safe for human consumption, with levels significantly below the FAO/WHO maximum acceptable
limits for fish and seafood (200 mg/kg fresh weight) (see FAO/WHO, 1986).
Risks/uncertainties and trends
Although several scientific studies conducted in coastal areas of the WIO region do show elevated
levels of chemical pollutants, most likely attributed to land-based sources, there are still uncertainties
regarding the geographical spread of chemical contamination (as most studies were not designed to
reflect the spatial extent of the polluted water body). Furthermore, scientific data on environmental
impacts or socio-economic consequences directly linked to chemical pollution have not been collected
for the region.
Industrialization in the WIO region remains slow relative to other parts of the world, however, it is
increasing rapidly. Recent history has shown that rapid development often takes place without proper
26
environmental impact assessments or legislative controls, often leading to increased pressure on the
environment, including the coastal areas. Commercial agricultural activities are also increasing in the
countries of the WIO region as are the use of agrochemicals (e.g. pesticides), thus chemical pollution
from these sectors is likely to intensify unless the sectors contributing to this problem implement
mitigating measures, through better legislation and regulation, best practice guidance and education
and awareness. Despite the lack of precise data, the risk of chemical pollution of coastal water from
these land-based activities should not be ignored. Following the precautionary approach, there is a
need for a timely intervention by industry managers, farmers and the government authorities
responsible for regulating those activities.
4.2.5 Marine litter
Problem statement
Inappropriate disposal of solid waste represents a serious problem in most of the urban centres in the
WIO region, although quantitative data are limited. Marine litter pollution refers to the introduction of
solid waste materials (which either float or sink) into water bodies and their surroundings. Important
land-based sources are the waste from urban centres (particularly ports, industrial and commercial
areas and informal settlements) and that discharged through rivers (transporting solid waste from
adjacent catchments).
Transboundary elements
Taking into account the fact that floating marine litter can be carried over large distances and
considering the ocean circulation patterns in the region, transboundary impacts related to marine litter
are very likely (see Figure 2-4). Litter at sea may disperse vast distances, crossing ocean basins, and
arrive at remote locations such as oceanic islands. There are no data to justify actual transboundary
effects for the WIO region, but studies from Antarctica and other parts of the world (e.g. the north
Pacific Ocean) have gathered ample evidence of the transboundary nature of floating marine litter as a
serious pollution problem, most certainly one common also to most WIO countries (see Table 4-1).
Root-cause analysis
The main sectors (or stakeholders) contributing litter to the marine environment include the urban and
tourisms sectors, industry and transport, all mainly linked to inappropriate facilities for the disposal of
solid waste, as shown in the problem tree provided in Figure 4-8.
Major environmental impacts are largely linked to ingestion or entanglement of marine organisms
resulting in loss of biodiversity (Lane, 2007), while socio-economic consequences include:
· Loss of aesthetic value of coastal areas; and,
· Risks to human heath through contact with contaminated waste products (e.g. medical and sewage
waste).
The consequences associated with marine litter affect stakeholders across society, from local
communities to large tourist developments affecting the aesthetic value of coastal areas and posing
risks to human health.
The assessment of marine litter related activities in the WIO region found that environmental impacts
and socio-economic consequences of marine litter (solid waste disposal) are largely inferred and not
adequately assessed or quantified (Lane (2007) (Table 4-7), other than in South Africa. However, the
description given in South Africa's national report (Ryan, 2006) would largely be applicable to the
entire region: `Litter has numerous impacts on marine ecosystems, as well as direct and indirect
impacts on humans. The main ecological impacts of floating litter are that it is ingested by, or
entangles, marine organisms. Off South Africa, levels of ingestion and, perhaps to a lesser extent,
entanglement, are on a par with the highest recorded elsewhere in the world. There are some
27
encouraging developments (e.g. the reduction in virgin [pre-processed] plastic pellets ingested by
seabirds), but overall the situation remains unacceptable, with several threatened species affected. It
may play a role in rafting invasive organisms to these remote systems, with potentially serious
biological and commercial impacts. Litter that sinks to the seabed may impede gas exchange in bottom
sediments or become entangled around sessile organisms, increasing their drag and, in shallow depths,
their risk being dislodged or washed off during large storm swells.
Risks/uncertainties and trends
The impact of marine litter on the aesthetic quality of coastal areas in the WIO region is visibly real.
Taking some of the root causes of microbial contamination in the WIO region into account, in
particular population growth pressure and poverty and inequality, it is likely that this problem will
intensify in future, posing even greater socio-economic risks to society, unless those responsible in the
different polluting sectors intervene. There are potentially serious impacts on tourism development, an
important sector that is able to contribute to reducing some of the listed root causes. Equally, as
economies develop and expand and infrastructures improve, the demand for some waste products for
re-cycling has emerged, for example in Dar es Salaam recently, where the demand for empty plastic
mineral water bottles for re-cycling in China has resulted in their removal from local waste dumps,
roadsides and beaches (Richmond, M. pers comm.). The trend in Seychelles has been to ban take away
boxes, plastic bags, pet bottles and plastic bottle recycling. Grills have been placed on most river
outlets and there is collection of marine litter in the port area and of all litter on all major beaches.
28
Socio-economic Consequences
Loss of Aesthetic Value
Human Health risks
and Associated Revenue
(contact recreation)
Environmental Impacts
Entanglement and suffocation of
IMPACTS AND
marine organisms
CONSEQUENCES
Marine Litter
Tourism &
Industry &
Transport
Urbanisation
Mining
· Contaminated surface
· Industrial solid waste
· Solid waste disposal
and sub-surface runoff
· Contaminated surface
· Solid waste disposal
and sub-surface runoff
· Public littering
· Solid waste disposal
· River discharges
· River discharges
(municipal waste from
(industrial waste from
catchments)
catchments)
DIRECT CAUSES AND
UNDERLYING SECTORS
Root Causes
Poverty &
Inappropriate
Population Pressure
Inadequate Financial
Inadequate
Inequality
Governance
Resources
Knowledge
· Figure 4-8
Problem tree: Marine litter
29
4.2.6 Eutrophication
Problem statement
Eutrophication refers to artificially enhanced primary productivity (e.g. algal and phytoplankton
growth) and organic matter loading in coastal waters due to the increased availability or supply of
nutrients, usually as a result of inappropriate disposal of municipal wastewater or nutrient-enriched
agricultural return flows. Wastewater with a high organic content (e.g. of high BOD or COD levels) or
wastewater containing high levels of inorganic nutrient (e.g. with high inorganic nitrogen and
phosphate concentrations) can typically contribute to eutrophication problems. It should be noted that
`eutrophication' in the true sense of the word, hardly ever occurs; instead, within the regional context,
the main issue is that of harmful/nuisance algal blooms resulting from nutrient enrichment.
Transboundary elements
With the coastal zone of the WIO being open and exposed, there is little chance of eutrophication/algal
blooms stretching across boundaries, however, the problem is common to some WIO countries, albeit
on a local level. Consequently, eutrophication is not a high priority in most countries (Table4-1)).
Nevertheless, the cumulative effect of eutrophication/algal blooms in estuaries, creeks and coastal
lagoons, does affect critical habitats for fish reproduction and growth, hence resulting in secondary
impacts on regional fish stocks and biodiversity.
Root-cause analysis
The key sectors (or stakeholders) potentially contributing to eutrophication/algal blooms in coastal
waters include the urban sectors (municipalities responsible for waste disposal), industries (with high
BOD and nutrient loads in their wastewater) and agriculture (with inappropriate disposal and use of
fertilizers), as shown in the eutrophication problem tree (see Figure 4-9).
Environmental impacts of eutrophication/algal blooms include:
· Nuisance, opportunistic or harmful algal blooms affecting both aesthetics and biodiversity;
· Discolouration of coastal waters, affecting light-dependent benthic species;
· Smothering of benthic communities (e.g. during die off of algal blooms);
· Mortalities in marine biota (e.g. anoxic conditions generated on decomposition of organic matter);
and,
· Modification in marine biotic species composition.
A broad range of stakeholders are potentially affected by eutrophication/algal blooms, from local
communities to larger sectors such as fisheries, aquaculture and tourism, which bear the socio-
economic consequences which include:
· Loss of aesthetic value
· Risks to human health in terms of contact recreation and ingestion of contaminated seafood
· Loss in artisanal and/or commercial fisheries and aquaculture.
30
Socio-economic Consequences
Loss of Fisheries
Loss of Aesthetic Value
Human Health risks
Human Health risks
Loss in Quality of
Resources & Revenue
and Associated Revenue
(contact recreation)
(seafood ingestion)
Seafood Products
Environmental Impacts
Smothering of benthic
Discolouration of
Anoxic conditions/
Modification in marine
coastal waters
Bad odours
biotic species composition
communities
IMPACTS AND
CONSEQUENCES
Mortality (acute effects)
Opportunistic/Nuisance/Harmful
on marine biota
algal blooms
Eutrophication (harmful/nuisance algal blooms)
Agriculture
Tourism &
Industry
Energy
Aquaculture
Urbanisation
· Runoff from live stock
· Atmospheric emissions
· Disposal of waste
· Municipal wastewater
· Industrial wastewater
areas
discharges
discharges
(high in nutrients)
· Agrochemical disposal
· Contaminated surface
· Contaminated surface
(fertilizers)
and sub-surface runoff
and sub-surface runoff
· River discharges
· River discharges
· River discharges
(agrochemicals from
(municipal waste from
(industrial waste from
catchments)
catchments)
catchments)
· Atmospheric emissions
· Atmospheric emissions
DIRECT CAUSES AND
UNDERLYING SECTORS
Root Causes
Poverty &
Inappropriate
Population Pressure
Inadequate Financial
Inadequate
Inequality
Governance
Resources
Knowledge
· Figure 4-9
Problem tree: Eutrophication/algal blooms.
31
Within the WIO region, there exists some evidence of anthropogenic sources of nutrients impacting
on coastal ecosystems through harmful or nuisance algal growth. Along the Kenyan coast, Uku
(1995, 2005) and Uku and Björk (2005) demonstrated the abundant growth of epiphytic algae on
seagrass and the dominance of the green algae (Ulva and Enteromorpha sp.) in areas adjacent to
heavy tourism infrastructure development, where epiphytic cover reached up to 69% in the more
developed areas. Nuisance algal growth, affecting the recreational (aesthetic) value of coastal
resources has also been reported in Mauritius, where for example, high nitrate concentrations
introduced into lagoon systems through agricultural return flows, have been associated with algal
proliferation in the lagoons of Belle Mare/Palmar with the result that many hotels have had to remove
algal deposits from the shoreline on a weekly basis (Dulymamode et al., 2002). In Flic en Flac, black
anoxic sands, smelling of hydrogen sulphide, have been observed at the low water mark and are
associated with organic enrichment through wastewater discharges (Prayag et al., 1995). Also in
Mauritius, the release of domestic sewage to coastal waters from urban areas and poorly planned
housing developments on reclaimed wetlands is recognized as a cause of eutrophication/algal blooms
leading to the smothering of coral reefs. Algal blooms are observed annually at Trou aux Biches, and
isolated cases have been reported at Bain des Dames near Port Louis. In both Belle Mare and Flic en
Flac, higher levels of nitrate and phosphate have been recorded associated with proliferation of algal
growth (Prayag et al., 1995; Botte, 2001). Nutrient enrichment of lagoon waters also results in
increased algal growth over coral, thus affecting their biology and the coral reef ecosystem as a whole
(Botte, 2001).
Jones et al., (2002) identified eutrophication/algal blooms as a major issue in some of the sensitive
areas around the coast of the Seychelles, although the report did not include any (measured) scientific
evidence thereof.
Along the South African coast, estuarine systems typically act as nutrient purifying systems where,
for example, nutrients from catchments are absorbed, resulting in cleaner water entering the sea.
Evidence for this nutrient removal function is provided by excessive weed growth or phytoplankton
blooms in estuaries (Snow et al., 2000; Taljaard et al., 2000), rather than in the adjacent marine
environment. This is particularly evident during low flow periods (dry seasons) when river runoff
entering the estuaries can have high nutrients levels (for example, due to agricultural irrigation return
flows). High nutrients levels in estuaries can also result during periods when the water experiences
longer residence times within the estuaries, for example during a period of weak neap tides where
exchange with the sea is reduced (Taljaard et al., 2006).
In the Tanga area of Tanzania, there are reports of the proliferation of macroalgae in coastal waters
due to excess nutrient loading from municipal wastewater and industrial discharges, in particular a
fertilizer factory (see Munissi, 1998). Munissi (2000) also demonstrated an association of Ulva spp.
and Enteromorpha spp. with areas receiving nutrients from sewage pipes. In Zanzibar,
eutrophication/algal blooms associated with the release of inorganic nutrients from domestic sewage
has been identified as one of the main causes for the decreased cover of coral-reef-building algae
(Bjork et al., 1995). Bjork et al., (1996) also showed that calcified algae are sensitive to phosphate
and are disappearing from phosphate-rich areas.
Risks/uncertainties and trends
There is some evidence of the impact associated with nutrient enrichment from land-based activities
(as illustrated above) with the problem mainly confined to more sheltered environments such as
estuaries and creeks where weak water circulation generally limits the environment's assimilative
capacity for nutrient and biodegradable organic matter. However, with the rapid increase in coastal
urbanisation (and associated municipals waste), as well as the projected increase in commercial
agricultural and expansion of industrial activities in the region, nutrient loads to the marine
environment could increase markedly over the next years, challenging the assimilative capacity of
coastal regions.
32
4.2.7 Stakeholder analysis
When a stakeholder matrix analysis of the five types of transboundary marine pollution problems is
conducted (see Table 4-13) it becomes clear that the main sectors contributing to the problem are
urbanisation, agriculture and industry. These all have broad cross-cutting impacts though added to
this, aquaculture, tourism, mining, transportation and energy are associated with specific types of
pollution.
The stakeholders most impacted are the local communities, as well as the fisheries and tourism sector;
i.e. those commercial sectors linked directly to the coastal and marine resources. To a lesser degree,
certain mining, industrial and transportation activities may be impacted.
· Table 4-13 Analysis of sectors and stakeholder groups causing (C) transboundary marine pollution problems as
well as those impacted (I) by pollution.
TRANSBOUNDARY PROBLEM
SECTOR
STAKEHOLDER
Micro-biological Eutrophication Marine Litter
Suspended
Chemical
contaminants
(algal blooms)
(solid waste)
solids
pollution
Artisanal fishers
I I I
Industrial fishers
I I I
Fisheries and
Aquaculture
Seaweed farmers
I I I
Industrial prawn farmers
C
I C
I I
Fish and shellfish farmers
I
C
I C
I I
Charcoal makers
C
C
Small-scale loggers
C
C
Industrial loggers
C
C
Small-scale farmers
C
C C
Agriculture and
Large-scale farmers
C
C C
Forestry
Pastoralists
C C
Ranchers
Poultry farmers
C C
Dairy farmers
C C
Beekeepers
Tourists
I I
C
I I I
Hotel owners/operators
Tourism
I
C
I
C
I I I
Small-scale traders
C
Tourist boat/SCUBA operator
I I
C
I I I
Coral/lime miners
C
Sand miners
C
Small-scale salt producers
I I I I
Industrial salt works
Mining
I I I I
Small-scale miners
C C
Industrial mining companies
C C
Fuel suppliers and stations
C
Oil and gas production
C
Heavy manufacturing
C C C
Light manufacturing
Industry
C C C
Agro-processing industries
C C I I I
Oil refining
C
Ports
C I
C
I I
C
Dredging companies
C C
Clearing and forwarding
Railway
Transportation
Roads (incl. traffic)
C
Airports
Airlines
Shipping
I C
33
TRANSBOUNDARY PROBLEM
SECTOR
STAKEHOLDER
Micro-biological Eutrophication Marine Litter
Suspended
Chemical
contaminants
(algal blooms)
(solid waste)
solids
pollution
Hydro-dam operators
Energy
Power station operators
production
Renewable energy producers
Fossil fuel users
C C C
Solid waste operators
C C C C C
Sewage managers
C C C C
Urbanisation
Property developers
C
I
C
I I I I
Town planners
Coastal communities
C
I I
C
I I I
4.3 Problem area 2: Physical alteration and destruction of habitats (PADH)
4.3.1 Overview
The world's coastal and marine habitats have been extensively modified by human activities over the
last fifty years, with a consequential reduction in biodiversity and an alteration of ecological
community structures in many regions (UNEP, 2006a). In the WIO region, national and regional
processes and assessments such as the African Process (GEF/MSP, 2003), Nairobi Convention
(UNEP, 1987), GIWA (UNEP, 2006) as well as the WWF's-Eastern African Marine Ecoregion
(WWF, 2004) have identified the need to address the loss and transformation of habitats as a priority
issue for all countries in the region. Such `physical alteration and destruction of habitats (PADH)'
manifests itself in the form of coastal erosion, removal of vegetation cover (forests, mangroves and
seagrasses), coral reef degradation and the establishment of invasive species.
While a main cause of PADH is directly related to human interventions and activities in the coastal
zone, global climate change (in itself attributed partly to human activities) has also led to extreme
hydrological events (droughts and floods), sea level variability and coral bleaching. Also, land
transformations for agriculture, urban development, as well as extensive deforestation in the WIO
region river basins such as Athi-Sabaki, Tana, Rufiji, Pangani, Limpopo, Betsiboka, contribute to
PADH by altering river flows, water quality and sediment loads from river basins (Arthurton et al.,
2002, Kitheka, 2003)4. The cumulative impacts of these problems have been significant physical
alterations and modifications of ecological systems in the WIO region, leading to an overall decline in
the productivity of coastal and marine ecosystems and reducing further their capability of providing
expected ecosystem services.
The following five categories of PADH are distinguished in this chapter:
1. Degradation of mangrove forests
2. Degradation of seagrass beds
3. Degradation of coastal forests
4. Degradation of coral reefs
5. Shoreline changes
It is useful to note that this catagorization is mainly based on the key types of coastal habitats
prominent in the WIO region, as identified in Chapter 2. Because of the different basic characteristics
of the individual habitats a separate analysis is needed for each. In addition, shoreline changes are
defined as a separate category of transboundary problems, in light of the over-arching nature of
problems related to the physical alteration of the coastal zone.
4 Impacts from river-coast interaction are discussed in detail in section 4.4 of this TDA.
34
The first phase of the GEF/MSP Sub Saharan Project, commonly referred to as the African Process
(GEF/MSP, 2003), provides a consolidated analysis of the PADH hotspots in the region. In the
context of this TDA, hotspots are broadly defined as coastal and marine areas threatened by human
activities (WGIPA-I, 2000). PADH hotspots are located in sites with important human activities, such
as estuaries, islands, harbours, bays and lagoons. These sites are threatened predominantly by
pollution, over-exploitation of coastal-marine resources (e.g. mangroves and fisheries) and habitat
modification. An overview of the specifics of hotspots of PADH in the WIO region is presented in
Table 4-14.
· Table 4-14 Summary table for PADH hotspots in WIO countries (Modified from the African Process Reports:
GEF/MSP, 2003).
Country
Hotspots
Major pressure
Kenya
Malindi Ungwana Bay
Salt works, aquaculture
Vanga-Msambweni Complex
Upland deforestation, overfishing
Tana Delta
Deforestation, agriculture, trawling
Mida Creek
Mangrove degradation, urbanization
Tanzania
Dar es Salaam
Pollution, urbanization
Tanga Coastal Area
Coastal development, salt works
Zanzibar
Coastal development
Bagamoyo
Destructive fishing practices
Mozambique
Maputo Bay
Erosion, seagrass degradation
Nacala-Mossuril seascape
Mangrove degradation, salt works, erosion
change in hydrological cycle
Zambezi delta
Mangrove degradation, erosion
South Africa
Richard's Bay
Over exploitation of resources; sand mining
Seychelles
La Digue
Loss and modification of habitats
East Coast, Mahé
Loss and modification of habitats
Anse Volbert, Praslin
Erosion
Mauritius
Rodrigues
Deforestation
Gran Bay
Wetland transformation
Flic en Flac
Shoreline change, erosion
Madagascar
Toliar
Mangrove deforestation, aquaculture
Mahanjanga Bay
Aquaculture, sedimentation
Nosy Be
Sedimentation
Hahavavy
Mangrove degradation
Comoros
Moheli
Over exploitation of resources
Grand Comoros
Destructive fishing practices
Anjuan
Deforestation and lan-elang distillation
Sources: GEF/MSP (2001)
High levels of poverty as well as poor governance are the most important root cause of PADH in the
WIO region. Poverty forces the poor to rely on `free' resources they can extract from forests
(firewood, building poles, medicinal plants, and bush meat) and the sea (fish, mollusks, sea
cucumbers, corals, etc.) and in some instances to resort to illegal activities to exploit these resources
(such as encroachment and dynamite fishing). Importantly, poverty restricts the capacity of the
communities to think beyond immediate needs, and thus to take onboard the message of natural
resources conservation. The consequent over-exploitation of coastal resources has led to degradation
of the habitats. For example, mangroves forests have suffered loss for mangrove poles, aquaculture
development and salt extraction, seagrass habitats have been prone to intense collection of
invertebrates and use of drag nets for fishing, while intense fishing in coral reefs and extraction of
coral for lime production, and deforestation for infrastructure development has lead to significant
degradation of coastal habitats. The increased demand for coastal resources also arises from rapid
population growth in the coastal zone, linked also with coastal development and urbanization, leading
to an increasing demand for living and non-living resources thus further impacting negatively on
coastal and marine ecosystems.
35
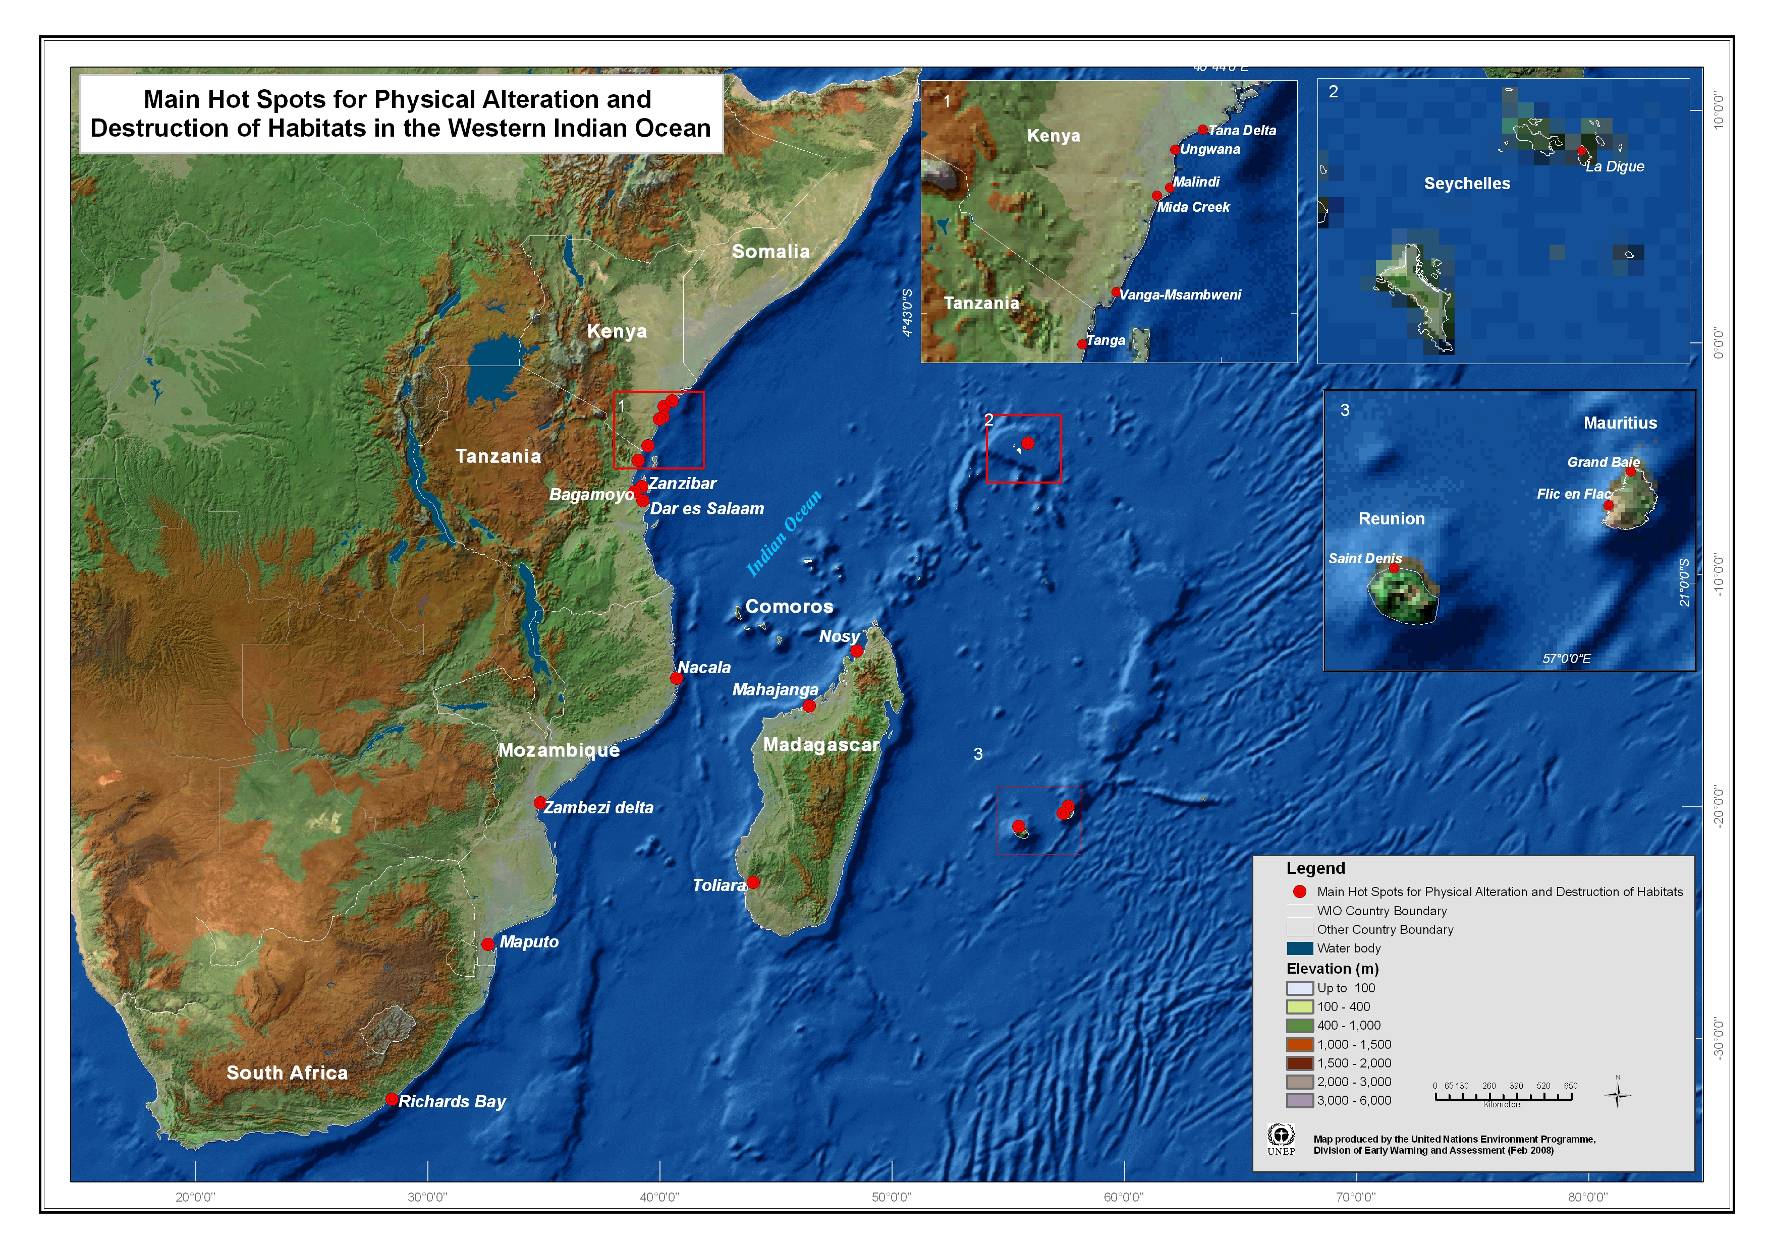
· Figure 4-10 `Hotspots' of PADH in the WIO region
36
The main sectors contributing to the problems of PADH in the WIO region are:
· Urbanisation and Coastal Development Population growth is a fundamental component,
accompanied by changes in settlement patterns from rural to urban environments and related
coastal developments. Apart from the communities themselves, specific sectors involved are
property developers, town planners, operators of wastewater management facilitaties and solid
waste operators.
· Agriculture and Forestry This is one of the most important sectors contributing to PADH in
the region. Major small-scale stakeholders include firewood collectors and charcoal burners,
farmers, loggers, pastoralists and bee keepers.
· Fisheries The sector involves both artisanal and industrial fisheries, including mariculture
initiatives (shrimp, seaweeds, etc).
· Industry Involves both small and large scale industries based in the coastal zone. These
include agro-processing industries, manufacturing industry, oil-refineries and desalination
plants.
· Mining This range from coral/lime miners, sand miners, salt work producers (both small
scale and industrial).
· Tourism Encompasses hotels, tourists, tour operators and small-scale traders involved in
tourism activities at the coast.
· Energy production This sector concerns (hydro-) power stations, renewable energy producers
and fossil fuel users.
A summary of the main threats, impacts, and the underlying root causes of PADH in the region, for
each of the five categories of PADH defined above are presented in Table 4-15 and Table 4-16. The
following sections present a detailed root-cause analysis of each of these problem areas.
37
· Table 4-15 Causes, environmental impacts and socio-economic consequences of PADH in the region.
TRANSBOUNDARY PROBLEM
Coastal
Shoreline
ENVIRONMENTAL IMPACTS
Mangroves
Seagrasses
Coral reefs
forests
change
Reduced biomass and cover of habitat
Reduced sequestration of greenhouse gases
Increased vulnerability to natural calamities (e.g. coastal flooding associated with Tsunamis)
Increased coastal erosion
Reduction in biodiversity
Reduced sediment and contaminant filtration/trapping capacity
Reduced
water
quality
Increased sedimentation and turbidity in coastal areas (estuaries, lagoons, etc.)
Reduced fish habitats and fisheries reproduction
Breakdown of inter-species relationships
Lowering of ground water table resulting in drying of rivers
Sand accretion
Salt water intrusion
SOCIO-ECONOMIC CONSEQUENCES
Increased poverty (impoverishment of communities)
Loss of life and property
Reduced revenue from fisheries
Reduced touristic and aesthetic value
Reduced food security
Loss of cultural heritage
Threats to public health
Reduced land value in coastal areas
38
· Table 4-16 Direct causes and sectors responsible for the PADH in the WIO region.
TRANSBOUNDARY PROBLEM
DIRECT CAUSES
SECTORS
Coastal
Shoreline
Mangroves
Seagrasses
Coral reefs
forests
change
Coastal flooding as a result of sea level rise
N/A
Sedimentation associated with heavy river sediment discharge
Urbanisation, Agriculture and
Forestry
Alteration of fresh water flow
Urbanisation
Salt water intrusion
Urbanisation
Destruction and/or degradation of wetlands
Urbanisation, Agriculture and
Forestry, Tourism
Clearance of natural vegetation for human settlement
Urbanisation, Industry, Tourism
Pollution (discharge of municipal wastewater agricultural and Urbanisation, Agriculture and
industrial effluents, including accidental oil spillage)
Forestry, Tourism, Industry
Land reclamation
Urbanisation
Increased sea urchin population associated with reducation in Fisheries
predators (due to inappropriate fishing practices or changes in
environmental conditions)
Seaweed harvesting for commercial purposes
Fisheries
Increased reef activity
Fisheries, Tourism
Anchor damage
Fisheries, Tourism
Over-fishing and bad fishing practices
Fisheries
Coral bleaching
N/A
Conversion of habitats for aquaculture/mariculture
Fisheries
Conversion of habitats to industrial zones
Urbanisation, industry
Mining of beach sand and removal of corals
Mining
Dredging for port and harbours
Transportation
Alteration in freshwater flows and sediment loads due to dam Industry, Agriculture and
construction
Forestry, Energy production
Conversion of habitats for saltworks
Mining
Deforestation to meet timber and fuelwood needs
Urbanisation, Industry
Seagrass beds removal for clam collection and bathers (tourists)
Tourism, Fisheries
Over-harvesting for supply of fuelwood and charcoal
Agriculture and Forestry
Overgrazing associated with high cattle population
Agriculture and Forestry
Land clearance for agriculture
Agriculture and Forestry
Uncontrolled wild fires
Agriculture and Forestry
39
4.3.2 Degradation of mangrove forests
Problem statement
Mangrove wetlands are multiple-use systems that provide protective, productive and economic
benefits to coastal communities. The forest provides timber and non timber products such as
fuelwood, poles, fodder and fisheries resources to millions of people in the tropics, including the WIO
region (Saenger et al., 2002). They buffer land from storms and provide safe havens for humans
(Spalding et al., 1997). Mangroves have the capacity to absorb heavy metals and other pollutants, thus
controlling the quality of water reaching coral reef and seagrass ecosystems (Larcenda et al., 1997). In
addition, mangrove forests provide nursery grounds for a number of commercially important fish
species, prawn, crabs and other animals, and enhance fishery productivity of the nearby waters
(Kathiresan and Bingham, 2001).
As a dynamic zone between land and the sea, mangrove wetlands are controlled by several interacting
factors such as tides, periodicity of freshwater and sediment influx, topography, soil and water
salinity, temperature and sedimentation patterns. These factors are closely related to land and water
use practices in the areas adjacent to and upstream of the mangrove forests. In some instances,
human-induced stresses on mangrove forests range from diversion of freshwater, poor land-use in and
around the forests to over-exploitation of the mangrove resources. These stresses disrupt the natural
equilibrium, ultimately leading to the degradation of the mangrove wetlands which in turn not only
depletes the resources within their boundaries, but also affect the productivity of the adjacent coastal
and marine ecosystems.
Transboundary elements
Mangroves in the WIO countries constitute about 5% of the current global area of mangroves (see
Table 2.3). A number of these mangrove stands or their catchments are shared by several countries in
the region, as are mangrove goods and services by communities adjacent to the forests (Semesi,
1998). Besides the common uses for firewood, charcoal and building materials, herbal medicine and
traditional lime making are common practices in coastal communities throughout the region. Key
transboundary elements as far as mangrove forests are concerned are related to the fact that
mangroves provide important nursery or feeding grounds that are vital for several marine fishery
resources of the entire WIO region.
Pressures on mangroves throughout the WIO countries are similar and are mostly human-induced.
The area of mangrove in the WIO region that has been lost over the last century is estimated to exceed
50% of the current area (FAO, 2002). Direct causes of mangrove degradation include tree felling for
firewood and building materials, clearance of mangrove areas for aquaculture and solar salt works,
urban development, and human settlement. Other causes include reduction in freshwater flow (both
surface and groundwater) and heavy or increased sedimentation and pollution. The impacts of
mangrove degradation are difficult to quantify for the region and more thorough analyses should
consider the rate of loss brought about by each cause.
The major transboundary issues associated with mangrove degradation that affects the entire WIO
region include loss of cover, decrease and/or loss of biodiversity, decreased fisheries productivity,
shortage of firewood and building materials, and increased coastal erosion (Semesi, 1998; FAO,
2002). These ultimately lead to loss of livelihood and increased poverty among the coastal population.
In this TDA, the quality of information to support the transboundary nature of the problems are
assessed in the light of data provided by the national PADH reports of the participating countries, as
well as data accessed during the preparation of this analysis. None of these issues have been well
documented across the countries in the region, thereby identifying a major research or knowledge
deficiency.
40
Socio-economic Consequences
Reduced tourism and aesthetic value
Threat to public health
Increased poverty
Loss of life and property
Decrease in revenue
Reduced food security
Environmental Impacts
Reduced trapping capacity
Reduced water
Increase vulnerability to
Increased sedimentation and
Increased coastal
quality
natural calamities
turbidity
erosion
Breakdown of inter-
Reduced sequestration of
Reduced biomass and cover of
Reduced fish habitat and
Reduction in biodiversity
species relationships
green house gases
habitat
fisheries production
Degradation of Mangrove Forests
Fisheries &
Agriculture
Tourism
Urbanisation &
Industry
Aquaculture
& Forestry
Coastal Dev
· Clearance of land for
· Increased sediment load
· Clearing for aquaculture
· Clearance of vegetation
tourism development
from rivers
· Conversions of mangrove
for human settlement
areas to industrial zones
· Wastewater
· Clearing land for farming
· Wastewater
· Discharge of industrial
discharge/pollution
· Alteration in river flow
discharge/pollution
effluents /pollution
and sediment loads due
· Alteration in river flow
to dam construction
· Alteration in river flow
and sediment loads due
and sediment loads due
· Runoff/pollution
to dam construction
to dam construction
·
Over-harvesting for fuel
· Harvesting for fuel and
· Harvesting for fuel and
timber
wood
timber
Root causes
Climate change and
Economic
Population
Poverty &
Inappropriate
Inadequate knowledge
Inadequate financial
natural processes
drivers
pressure
inequality
governance
and awareness
resources
· Figure 4-11 Problem tree degradation of mangroves.
41
Illegal trade of mangrove wood products across the borders, such as between Somali and Kenya, and
Kenya and Tanzania is a major transboundary concern. Apart from depleting wood resources at the
Kenya-Tanzania border, over-exploitation of the Tanga-Vanga transboundary mangroves has
triggered coastal erosion and sediment transport with a negative effect on fisheries in the area
(Semesi, 1997). Cross-border mangrove sites have been ranked as being of regional importance due to
the unique flora and fauna they support. For example the Tanga-Vanga seascape contains some of the
tallest mangroves in the region at Challe Island (Kenya) measuring up to 34 m (WWF, 2004).
Root-cause analysis
The underlying root causes of the loss and modification of mangroves in the WIO are associated with
population pressure, poor governance, economic pressure in rural and urban centres, the poverty
status of local communities and unequal distribution of resources. In addition, climate change related
factors such as sea level rise and increased sedimentation have affected the fringing mangroves in
Kenya, Tanzania and Mozambique (FAO, 2001). These have led to loss of mangrove cover, shortage
of harvestable mangrove products (Abuodha and Kairo, 2001; Beetje and Bandeira 2007), reduction
in fisheries, shoreline change (Kitheka et al., 2003), pollution (Munga et al., 2006), loss of livelihood
and increase in poverty (UNEP, 2003; WWF, 2004). Several studies have provided detailed problem
analyses associated with over-exploitation of coastal and marine resources in Sub-Saharan Africa (see
GEF/MSP, 2002), findings from which are presented in the problem tree for mangrove forest
degradation (see Figure 4-11).
According to a recent assessment of global mangrove forests, the WIO region has lost approximately
8% of its mangrove cover in the last 25 years (FAO, 2007), on average approximately 3,000 ha per
year. While causes of mangrove degradation may vary from one country to another, the major causes
seem to be over-exploitation of mangrove wood products, conversion of mangrove areas to other land
uses and pollution. These causes are described in detailed below. The most affected countries are
Tanzania, South Africa and Madagascar (see Table 4-17). No change in mangrove area has been
reported in Seychelles since the 1980's, perhaps due to reduced pressure or lack of reliable
quantitative information on mangrove exploitation. Successful mangrove reforestation programs in
Mauritius since the 1980's have led to an increase in the extent of mangrove area in this country
which nearly balanced the considerable previous net loss from the high demand for fuelwood and
infrastructure development. Increased awareness of the uses and benefits of mangroves in the region
is leading to other successful small-scale mangrove re-forestation activities. In Kenya, for instance,
recent small-scale mangrove re-forestation activities have helped in meeting wood demand as well as
controlling shoreline erosion (Kairo et al., 2001, 2008). In Mozambique, efforts are being made to
rehabilitate degraded mangroves in Ila de Mozambique district (GTA, 2007).
· Table 4-17 Loss of coverage of mangrove areas in the WIO region (1980 2005).
Annual loss of mangrove cover
1980
2005
(1980 -2005)
Country
ha
%
Mozambique 402,500
390,200
-492 -0.1
Madagascar 330,000
300,000 -1200 -0.4
Tanzania 152,000
125,000
-1080 -0.7
Kenya 54,700
50,000
-188 -0.3
Seychelles 2,500
2,500 0 0.0
South Africa
3,500
3,000
-20 -0.6
Comoros 125
115
-0.4 -0.3
Mauritius 45
120
3 6.7
945,370
870,935
-2977.4 -0.3
Source: FAO, (2007)
42
A main cause of mangrove forest degradation is related to the increasing population in the coastal
zone and the related demand for space and resources. Exploitation of mangrove wood products for
heating and building are widespread (Macnae, 1969; Semesi, 1998; UNEP, 2003). Historical records
indicate that, in the 1950's, mangrove products were major export commodities from Kenya,
Tanzania and Mozambique to treeless Arab countries (Macnae, 1969; Rawlins 1957; Semesi, 1998).
In the beginning of the 20th Century, export of mangrove wood products from Kenya averaged 24,150
scores, equivalent to 483,000 poles per year (Grant, 1938). Between 1941 and 1956 this export
averaged 35,451.3 scores (Rawlins, 1957), dropping to 13,774.4 scores between 1991 and 1996
(Abuodha and Kairo, 2001). The commercial exploitation of mangrove products is also reported for
Madagascar, where some 200,000 tons of tannins derived from mangrove trees were produced and
exported to Europe in the early parts of 20th Century (Guillaumin, 1928). Apart from loss in cover
associated with mangrove resource over-exploitation, changes in community structure of regenerating
stands often occur once a forest is cleared. This has been shown in Tanzania (Semesi, 1991), Kenya
(Kairo, et al., 2002) and Madagascar (Radhika, 2006) whereby stands initially occupied by
Rhizophora are re-colonized by inferior Ceriops species. The effects of this composition change on
the general functioning of the forest have not been studied.
The growth of coastal towns and cities has greatly contributed to loss of mangrove forests in the
region, through clearing for development and pollution. At least four major cities on mainland Africa,
namely Mombasa, Dar es Salaam, Beira and Maputo, are located in the vicinity of mangrove forests.
Between 1972 and 1990, the cover of peri-urban mangroves of Maputo decreased by 15.2 % (Saket
and Matusse, 1994) and between 1991 and 2003, the loss of mangrove cover in Maputo exceeded
17%. Similar problems have been reported for Mombasa (Abuodha and Kairo, 2001); Beira
(Hoguane, et al., 2002) and Dar es Salaam (Semesi, 1991; Wang et al., 2003).
In coastal towns in the WIO region, it is common to find garbage and solid wastes dumped at the edge
of mangroves (UNEP, 2007). These unsightly materials are occasionally carried into the mangrove
forests by tides thus affecting the wider system. In addition, accidental oil spills are reported to have
killed areas of mangrove forest in Mombasa and Dar es Salaam (Abuodtha and Kairo, 2001; Semesi,
1998).
Because of their location between land and the sea, mangrove areas in many parts of the world have
been converted for solar salt works, urban development, agriculture and aquaculture (Spalding et al.,
1997; Valiela et al., 2001; FAO, 2003). In Kenya, more than 5,000 ha of mangrove area at Ungwana
Bay have been converted for solar salt work and aquaculture (Abuodha and Kairo, 2001). In
Tanzania and Mozambique, extensive stretches of riverine mangroves of Rufiji and Zambezi
respectively have been reclaimed during the last few decades. The major uses of reclaimed mangrove
land are for agriculture and pond aquaculture (Saket and Matusse, 1994; Semesi, 1998; FAO, 2003).
A proposal to reclaim a further 10,000 ha of mangrove of Rufiji Delta was, however, halted in 2000
due to pressure from environmental groups (Bryceson, 2002).
The mangroves in the WIO do not seem to suffer a great deal from natural causes. A few cases exists,
however, where mangroves have died due to massive sedimentation caused by El Niño weather and
cyclones in Kenya and Mozambique respectively (Kitheka et al., 2002, 2003; Hoguane et al., 2002).
In Kenya and Tanzania, die-back of riverine mangroves of Tana and Rufiji rivers have been reported
following massive erosion of the riverbank (Kitheka, et al., 2002; Semesi, 1998). Other reported
natural causes of mangrove degradation in the region include pest infestation and desiccation (Semesi,
1998; Kairo et al., 2001; Bandeira et al., 2008).
The mangrove resources of the WIO region have many values, and are of great importance to the
socio-economy of the countries. Their importance derives both from the direct products from the
forest such as timber, and from the ecosystem services provided by mangroves from within and
beyond its boundaries. The main socio-economic impacts of the loss and modification of mangroves
are, therefore, associated with the loss of livelihood, shortage of mangrove wood products, decrease in
43
revenue from forestry and fishery activities, increased coastal erosion, increased resource conflict,
increased poverty, and loss of cultural heritage. In Kenya for example, the 1950's revenue generated
from the export of mangrove products was ranked third among the sale of national forest products
(Rawlins, 1957). With the ban on mangrove exploitation in many parts of the region such revenue is
no longer generated thus resulting in a loss of livelihood to local people.
Mangrove ecosystems are important for the maintenance of the local coastal industries in the WIO
countries. The majority of artisanal and commercial prawn and fish landings are from grounds in the
proximity of mangroves (see section 2.2). The fishing industry in the WIO region provides direct
employment for a huge workforce (Van der Elst et al., 2005; SWIOP, 2006). This is particularly true
for prawn fisheries in Ungwana Bay (Kenya), Rufiji Delta (Tanzania), Sofala Bank (Mozambique)
and the west coast of Madagascar where the bulk of mangrove forests are found (see Spalding et al.,
1997). The marine fishery in Kenya alone provides direct employment to about 10,000 fishers, and
indirectly supports those who are engaged in manufacturing fishing gears and marketing and sale of
fish products (Ochewo, 2004).
The supporting roles of mangroves to fishery are well-documented in most parts of the world
(Kepertsy, 1985; Robertson and Duke, 1987) and recent studies on the mangroves of Mozambique
and Kenya have demonstrated strong linkages between coastal fisheries and the health of adjacent
mangrove ecosystem (Huxham et al., 2004; Bandeira et al., 2006). Non-degraded forests in the
Incomati estuary in Mozambique and Ungwana Bay in Kenya support higher densities of crabs and
finfish respectively (Bandeira, et al., 2006). Other ecological studies have established the connections
between mangroves, coral reefs and seagrass in supporting the life cycles of many coastal organisms
(see Mumby et al., 2004).
Although there is no comprehensive study on mangrove biodiversity in the WIO region, independent
scientific studies at local levels usually associate mangrove ecosystem with high biodiversity (Little,
et al., 1988; Huxham et al., 2005), reflected in the high number of species of mangrove trees, finfish
and penaeid shrimps, among other taxa (Crona et al., 2005). Most mangrove studies in the region
have been carried out in Inhaca in Mozambique and Gazi Bay in Kenya, with Kenya studies showing
for instance that replanting mangroves in clear-cut areas enhances biodiversity and ecosystem
functions of the forest (see Bosire et al., 2003; Crona and Ronnback, 2005).
Risks/uncertainties and trends
There are several risks and uncertainties related to the analysis presented in this section. These are
most importantly:
· Irreversible ecosystem change There is uncertainty as to the degree to which changes that
take place in the ecosystem (from over-harvesting) are reversible.
· Biodiversity change Changes in biodiversity (genetic, species, ecosystem) may occur as a
result of over-harvesting of resources or climate change, but the lack of good baseline data
makes this difficult to assess. Hence the degree to which over-harvesting mangroves affects
biodiversity is not precisely known.
· Cumulative impacts - Uncertainties exist about the regional cumulative impact from mangrove
degradation on other ecosystem functions.
· Tourism value The degradation of the seascape in general reduces the regional value for
tourism, an aspect that has not been studied in the WIO region.
44
4.3.3 Degradation of Seagrass Beds
Problem statement
Seagrass beds (or meadows) are a critical habitat with multiple roles in the coastal ecosystem. They
function as nursery grounds for fish and crustaceans of commercial importance, offer coastal
protection and provide economic goods and services to the coastal communities. These habitats play a
key role in marine fisheries and they are also the main food of the endangered dugong (Waycott et al.,
2004). Seagrass degradation in the WIO region is generally evidenced by destruction and/or reduction
of seagrass habitats in intertidal and shallow subtidal areas, usually as a result of physical action
(Ochieng and Erfermeyer, 2003). Typically these include clearance of seagrass beds by hotel
operators (Daby, 2003), people trampling and uprooting seagrass for clam collection (Balidy, 2003;
Bandeira and Gell, 2003) and destructive fisheries practices, for example use of drag nets (de la
Torre-Castro and Rönnaback, 2004; Mangi and Roberts, 2007). All are common phenomenon in
various countries in the WIO. Less regulated coastal development, as well as dredging and
reclamation of land are also common practices in many WIO countries that impact on seagrass beds.
Another direct cause of seagrass degradation is pollution that reduces water quality, impacting on
seagrass ecophysiology. Pollution from industrial activities has been documented in Mauritius coastal
waters where reduction in seagrass habitat in port and jetty areas is also a common consequence of
water quality degradation (Ramessur et al., 1998). At Inhaca Island (Mozambique), a seagrass
community dominated by Zostera capensis was wiped out in an area with a heavy boat concentration
(Bandeira, 2002). Climate change, through increased discharge of sediment-laden low salinity water
derived from flooded river systems also potentially affects seagrass beds (Short and Neckles, 1999;
Bandeira and Gell, 2003).
The degradation of seagrass beds has a negative impact on the system's productivity and biodiversity
and leading to both environmental and socio-economic impacts across the WIO region. Common
socio-economic consequences include reduction in fishing areas and fisheries productivity with
accompanying reduction in revenue from fisheries impacting on food security (Short and Neckles,
1999). Ultimately the degradation leads to loss of livelihoods and increased poverty among the coastal
populations.
Transboundary elements
Due to relatively few studies on seagrass systems within the WIO, the transboundary nature of
seagrass degradation is not always as evident as it is for mangrove forest or coral reef degradation.
Nevertheless, the activities described above reduce seagrass habitat cover, impact on biodiversity and
reduce fishing grounds and fishing productivity. Reduced seagrass cover in turn renders the habitat
vulnerable to increased sedimentation which ultimately impacts on fisheries and fisheries revenue to
people. These impacts are felt along the shores and across national boundaries. Finally, climate
change, which brings about coastal flooding and increased sedimentation is also a common
transboundary issue in several WIO countries that potentially affects seagrass beds (Bandeira and
Gell, 2003).
Root-cause analysis
As described above, the degradation of seagrass beds is due to multiple causes. At the root-cause
level, lack of appropriate coastal development and/or management legislation and policies, and the
lack of enforcement (of existing regulations) are probably the most important problems that affect all
sectors that exploit marine resources. In some cases this is due to lack of financial and human
resources, or lack of understanding of the value of goods and services derived from seagrass beds.
45
Socio-economic Consequences
Reduced tourism & aesthetic
Reduced food security
Increased poverty
Reduced revenue from fisheries
value
Environmental Impacts
Reduced water quality
Increase Sedimentation & turbidity
Reduction in
Reduced fishing habitats &
biodiversity
fisheries production
IMPACTS AND
CONSEQUENCES
Breakdown of inter-species
Reduced
Coastal erosion
Reduced biomass & cover of
relationship
filtration/trapping
habitat
Degradation of Seagrass Ecosystem
S
Urbanization &
Fisheries &
Agriculture &
Tourism
Industry
Coastal Dev
aquaculture
forestry
·
·
·
Wastewater
Over-fishing and
Increased river sediment
· Wastewater
· Wastewater
discharges/pollution
destructive fishing
discharge
discharge/pollution
discharge/pollution
practices;
· Agricultural
· Seagrass bed removal
· Alteration of fresh water
·
runoff/pollution
Alteration of freshwater
for bathers
flow and sediment loads
· Seaweed farming
flow and sediment loads
due to dam construction
· Sea urchin population
· Alteration of fresh water
due to dam construction
flow and sediment loads
· Land reclamation
growth
· Seagrass bed removal
due to dam construction
for clam col ectors
ASSOCIATED CAUSE
UNDERLYING SECTORS AND
Root Causes
Climate change and
Economic
Population
Poverty &
Inappropriate
Inadequate knowledge
Inadequate financial
natural processes
drivers
pressure
inequality
governance
and awareness
resources
· Figure 4-12 Problem tree degradation of seagrasses.
46
Among the underlying sectors causing the problems, urbanization and coastal development rank
highly, accompanied by various sorts of activities that do, to a major or minor extent, affect the
seagrass environment. Population growth is increasing the pressure on marine resources and also the
need for development infrastructures. The WIO region continues to experience an increase in tourism
that is not consistent with planned coastal development. The high concentration of tourist hotels has
led to an increase in the discharge of wastes to the sea, and other impacts include damages caused by
motor boat propellers, anchoring and physical removal of seagrasses by tourist operators in order to
make beaches more attractive to tourists (Daby, 2003). The removal of seagrasses leads to
environmental changes such as increased water turbidity, loss of fauna, decreased biomass and
increased vulnerability to extreme events. These impacts in turn affect the long-term sustainability of
the tourism industry itself (Daby, 2003).
Pollution is one of the direct causes of habitat degradation. Studies undertaken in Mauritius at Flic en
Flec and Grand River North West, during the period 1996-1997, have shown that chromium and lead
concentrations had exceeded the pollution limits; the main sources attributed to tourist hotels and
industrial activities (Ramessur et al., 1998). Heavy metals were also found to have been incorporated
into seagrass leaves and vascular tissue from either the water column or the sediment (Lyngbay et al.,
1982; Brinx and Lyngbay, 1982). Contamination by heavy metals is harmful to seagrasses, interfering
with the photosynthetic apparatus and affecting CO2 fixation at different levels. Copper, zinc,
cadmium, mercury, and lead can reduce chlorophyll content because these elements interfere with the
pigment biosynthesis, although the damage is not necessary permanent (Catriona et al., 2001; Lewis
et al., 1997). More information on the status of pollution in WIO region is presented in section 4.2.
Fishing in seagrass beds is another factor that may largely contribute to the degradation of the
seagrass habitat. Coastal communities use seagrass bed areas as fishing grounds (Bandeira and Gell,
2003; de la Torre-Castro and Rönnaback, 2004; Eklöf et al., 2005). Different destructive fishing gears
are used such as drag-nets, basket traps, harpoons and hand lines. Destructive practices such as drag-
nets, dynamite, toxins, harpoons and nets with smaller mesh size, exacerbate the negative effects of
over-fishing in seagrass bed areas (Mangi and Roberts, 2007).
Coastal communities also collect invertebrate from seagrass beds. At Inhaca Island in Mozambique,
sea cucumber and seahorse fish harvesting for commercial purpose has increased in the last few
decades and this has led to a significant decline in the availability of invertebrates (Pereira, M., pers.
comm.). The destructive fisheries such as digging of Zostera capensis beds and surroundings seagrass
areas for collection of edible bivalves has also led to the depletion of the seagrass beds at Bairro dos
Pescadores near Maputo (Balidy, 2003; Bandeira and Gell, 2003). Almost 14 km2 of seagrasses,
notably Z. capensis beds, were lost in the period 1989-2002 due to the collection of bivalves. Also,
river flooding during 2000 lead to heavy discharge of sediments into the seagrass beds leading to
extensive smothering and die-off.
Aquaculture in general and seaweed farming in particular, are other two activities that potentially
affect seagrass beds. Seaweed farming has been reported to be responsible for the reduction of
seagrass cover, reduction of macrofauna biomass and changes in its structure. It also leads to the
changes in sediment texture including the organic content (de la Torre-Castro and Rönnaback, 2004;
Eklöf et al., 2005).
Climate change is also responsible for degradation of seagrass beds. The effects of climate change
includes the alteration of growth rates and physiological functions, changes in distribution and
reproduction patterns, changes in plant community structure and loss of some key species (Short and
Neckles, 1998). In the WIO region, the best examples of climate change impacts on seagrasses are
those from Mozambique, a country with quite extensive cyclones and floods nearly every year. Heavy
floods in Mozambique in 2000 caused smothering of 24 km2 and 10 km2 of seagrass beds in southern
Mozambique and Inhassoro, respectively (Bandeira and Gell, 2003). Other areas where seagrass beds
were lost included off Pemba town, Moçambique Island, Inhambane Bay and Inhaca Island. It is
estimated that close to 28 km2 of seagrass beds were lost due to sediment smothering associated with
47
flooding by the Incomati and Govuro rivers (Bandeira and Gell, 2003). Harbour development, sewage
disposal and coastal development in areas of southern Mozambique have further diminished seagrass
coverage (Bandeira and Gell, 2003), while heavy concentrations of artisanal fishing boats, in
combination with intense trampling during low tides, have also caused a reduction in seagrasses
species at Inhaca Island (Bandeira, 2002).
Sea urchin population growth has seriously affected the seagrass community in Kenya, particularly at
Diane-Chale lagoon (Uku et al., 2005) and other places along the Kenya coast (e.g Malindi-Watamu
Marine National Park and Reserve). There has also been a significant loss of seagrasses along the
Kenya coast as a result of anthropogenic activities. More than 50% of the Diane-Chale lagoon's
seagrass bed cover was lost, and in most of the cases, the degraded sites were found to have a density
of more than 37 sea urchin individuals per m2, a very high number when compared to the 4
individuals/m2 in healthy sites (Uku et al., 2005).
In Mauritius, seagrass beds are threatened by eutrophication caused by heavy use of organic fertilizers
in the sugar cane plantations (Ramessur and Jarvis, 1998). They have also being degraded as a result
of dredging of channels for special areas for swimming and water skiing (Daby, 2003). Other factors
that have impacted on the seagrass beds of Mauritius include sedimentation, disposal of sewage and
sand mining (Ramessur, 2002). In Seychelles, sedimentation, reduced salinity and decreased water
quality associated with effluent discharge have adversely affected seagrass beds (Ingram and Dawson,
2001).
The consequence of these various impacts is a severe degradation in seagrass bed coverage on local
scales. For example, in Mauritius, the disappearance of seagrass species is reported from areas such as
Albion (Halodule uninervis) and Poudre d'Or, Mont Choisy and Poste Lafayette (Syringodium
isoetifolium), though the actual area lost is unknown. Similarly, areas covered by Zostera capensis in
estuaries in KwaZulu-Natal are believed to have been seriously depleted by periodically heavy
flooding in the northern parts of South Africa.
Risks/uncertainties and trends
There are several risks and uncertainties related to the analysis presented in this section. These are
most importantly:
· Biodiversity change Changes in biodiversity (genetic, species, ecosystem) may occur as a
result of over-harvesting of resources, but the lack of good baseline data makes this difficult to
assess.
· Habitat destruction The degree to which over-harvesting affects habitats through impacts on
dominant invertebrate species is unknown and baseline data are lacking.
· Level of seagrass degradation - Precise data on degradation of seagrass beds within the WIO
are scarce.
· Future trends - Seagrass are fast-growing plants that can rapidly replenish the denuded seabed
areas, provided the physical damage to the habitat is minor. Future scenarios could include (i)
natural recovery of seagrasses occurring in areas were water quality is maintained despite
physical alteration of the habitat; (ii) the continuous depletion of seagrass beds in areas of
intense impact (e.g. collection of invertebrates or intense tourism that leads to clearing of
beaches) and (iii) seagrass replantation interventions in areas where intense habitat destruction
has been alleviated and re-colonisation is assisted.
48
4.3.4 Degradation of Coral Reef Ecosystem
Problem Statement
Coral reef ecosystems face various types and levels of impact across the WIO region. In addition to
anthropogenic threats, are included those associated with climate change, which led to severe coral
bleaching during the 1997-98 El Niño Southern Oscillation, damaging reefs throughout the WIO
region (Sheppard, 2003; McClanahan et al., 2005; Obura, 2005; Graham et al., 2006). Poverty and
socio-economic drivers impact reefs mostly at local levels, associated with the use of destructive
fisheries practices that leads to reef degradation (Edinger et al., 1998). In the recent past, it has been
shown that the lack of effective governance, such as effective policies, laws and regulations and
inadequate institutional capacity for coral reef management, have allowed increased degradation of
reefs throughout the region. The continuous degradation and resultant diminishment of coral reef
biodiversity ultimately impacts on the socio-economic well being of coastal communities, because
destruction of reef ecosystems leads to reduction in fisheries productivity that eventually impacts on
livelihoods and incomes, ultimately leading to increased poverty levels (Souter and Lindén, 2000;
Sheppard et al., 2005).
Transboundary elements
The transboundary issues associated with coral reef degradation include a decline in productivity and
biodiversity, reduction in reef fisheries, impacts on coastal tourism and threatened or migratory
species like marine turtles. Information to support the transboundary relevance of these issues is
generally well-documented for areas that were involved in the Coral Reef Degradation in the Indian
Ocean (CORDIO) project, namely Kenya, Tanzania, Mozambique and the islands states of the WIO.
There is sufficient information to suggest that degraded reefs in the region have incurred cover loss,
decline in biodiversity, and reduction in fisheries and other wildlife (CORDIO, 2002; ICRAN, 2004).
In Diani, Kenya, McClanahan et al., (1997) have shown the reduction in species diversity of reef
fishes together with a decline in fish abundance as a consequence of over-exploitation. Similar results
have been reported for Tanzania, Mozambique and island states in WIO (Wilkinson et al., 1999).
Any threats to fringing reefs of the WIO are transboundary because of strong ecological linkages
between the reefs in the region, resulting from the high biodiversity they support, which notably
includes massive numbers of both planktonic and adult forms of marine life that move freely through
the region, transported for weeks at a time drifting on the ocean currents or actively swimming or
migrating thousands of miles. The seasonal monsoon winds and oceanic currents provide connections
between north and south of the WIO. Kaunda and Rose (2004) have hypothesized that planktonic
larva of many coral reef biota from northern Mozambique can recruit in the fringing reefs of Tanzania
and Kenya, and vice versa, depending on the direction of water circulation. Endangered migratory
species such as turtles are reported to nest in a number of localities around WIO and move freely
between several site and coral reefs areas. Through tagging recoveries, migration patterns for a
number of them are emerging. These migratory organisms also support the transboundary nature of
the degraded critical habitats as coral reefs.
Root-cause analysis
The underlying root causes of coral reef degradation in the region can be grouped into four broad
categories that include: a) global climate change and natural phenomenon, b) poverty and inequality
factors, c) lack of alternative livelihood systems, and d) inappropriate governance. In most cases more
than one of these drivers is responsible for any observed degradation on coral reefs thus making the
determination of root causes a complex issue (Payet et al., 2004). The sections that follow describe
the problem of coral reef degradation from this perspective, highlighting three underlying root causes.
Underlying root cause 1: Global climate change and natural process
One of the most important underlying root causes of coral reef degradation in the WIO is coral
bleaching brought about by climate change. The first noticeable impact of climate change to the coral
reefs in the WIO was observed in 1997 when most reefs witnessed unprecedented coral bleaching and
49
eventual death four months later (Wilkinson et al., 1999). The immediate cause of this event was a
warm water episode linked to the 1997-98 El Niño, which raised the sea surface temperatures over
wide areas of the region (Wilkinson et al., 1999; Spencer et al., 2000). The severity of this event is
thought to have been further exacerbated by the background increases in sea surface temperatures
(SSTs) linked to global climate change (Hoegh-Guldberg, 1999). Bleaching-related damage in the
WIO region was variable. For instance, in Kenya, mortality ranged between 50-95% (Wilkinson,
1998; Wilkinson, 2000) whereas in the Seychelles mortality was close to 95% on most reef sites of
the inner islands. On the other end of the scale, countries such as Mauritius recorded less than 10%
coral bleaching (McClanahan et al., 2005) with most of bleaching occurring in the bleaching sensitive
genus Acropora (Pillay et al., 2002).
A number of factors may be responsible for the differential bleaching that has been observed across
the region such as the presence of clouds or storms (Turner et al., 2000), geography and temperature
histories (Berkelmans et al., 2004), the coral taxa involved (McClanahan, 2004; McClanahan et al.,
2005), the dominant algal symbionts on the reefs (Baker et al., 2004) and water flow (Nakamura and
van Woesik, 2001). Recovery of coral reefs from the impact of the 1998 coral bleaching event has
been variable. Strong recovery has been recorded in the Comoros (Ahamada et al., 2004) while slow
recovery is being recorded in the Seychelles (Payet et al., 2005) and patchy recovery is being
observed in Kenya (Obura, 2002).
Almost ten years after the first regional bleaching event in the WIO, the longer term impact of this on
the fish communities is the shift in species composition and local extinction of certain species and a
reduction of the reef structural complexity (Graham et al., 2006), a break down of commensalisms
relationship between corals and other reef inhabiting species, the decrease in the ability of coral reef
to dampen wave action (Sheppard et al., 2005) leading to increased coastal erosion, and population
explosions of plague organisms. However, very few studies have been able to detect any impact of
coral bleaching on fisheries. It has been predicted that many coral species in the WIO would be
extinct by the year 2050 (Sheppard, 2003). The increase in ocean acidity observed in other regions of
the world (Kulshrestha et al., 1999) should also be a cause for concern for coral reef managers and
users in the WIO. Such a change in water chemistry is likely to result in the need for corals to devote
more energy to the mineralization of their calcium carbonate skeletons, consequently devoting less
energy to colony growth and reproduction.
A global survey of reefs at risk carried out by Bryant et al. (1998), in the wake of the circum-tropical
mass coral bleaching event of that year, found that 25% of coral reefs in the Indian Ocean were at
high risk from human activities (equivalent to 36,100 km2) whereas 29% were of medium risk (or
16,600 km2) and 46% (or 36,100 km2) were at low risk Monitoring results from throughout the
countries of the WIO have indicated that many reef sites are taking a long time to recover and that
human pressures are further exacerbating coral reef degradation.
50
Socio-economic Consequences
Loss of life and
Reduced
Decreased revenue from
Impoverishment of
Decreased revenues from
property
food security
tourism and touristic value
communities
fisheries
Environmental Impacts
Reduced fishing areas and fisheries production
Reduced coral cover and recruitment
Increased coastal
erosion
IMPACTS AND
Reduced coral reef
Break down of inter-species
Increased vulnerability of coral rubble &
CONSEQUENCES
biodiversity
relationships
natural calamities
Degradation of Coral Reef Ecosystem
Urbanization &
Fisheries &
Agriculture &
Tourism
Industry
Coastal Dev
Aquaculture
Forestry
· Wastewater
·
·
Wastewater
Anchor damage
· Increased sediment load
· Wastewater
discharge/pollution
from rivers
discharge/pollution
discharge/pollution
· Increased reef activity
· Land reclamation
· Agricultural
· Anchor damage
· Alteration in fresh
· Over-fishing and bad
runoff/pollution
water flows and
fishing practices
· Increased reef activity
· Alteration in fresh water
sediment loads due to
· Over-fishing and
flow and sediment loads
dam construction
destructive fishing
due to dam construction
practices
ASSOCIATED CAUSES
UNDERLYING SECTORS AND
Root Causes
Climate change and
Economic
Population
Poverty &
Inappropriate
Inadequate knowledge
Inadequate financial
natural processes
drivers
pressure
inequality
governance
and awareness
resources
· Figure 4-13 Problem tree coral reef degradation.
51
Freshwater input, via discharge of surface runoff, is known to be one of the major influences
controlling coral reef distribution in the WIO region. Heavy sediment discharge at Malindi Bay (from
Athi-Sabaki River) is affecting the coral reef system at MalindiWatamu Marine National Park and
Reserve (Blorn et al., 1985; McClanahan and Obura, 1995; Obura, 2002; Kitheka et al., 2003a-b,
2005; Arturton et al., 2006). As a result of heavy river discharge of sediments and freshwater, coral
reefs are absent in the extensive swampy coast of central Mozambique (Bandeira et al., 2002). In
Madagascar, sediment-laden rivers such as Betsiboka are known to have been responsible for
degradation of coral reef ecosystem. In addition to sedimentation associated with river discharge,
coastal currents and winds have been known to be responsible for the increased sedimentation of coral
reefs at Ponta Torres, Inhaca Island, Mozambique (Kalk, 1995). Change in rainfall pattern could
increase the amount of freshwater and sediments discharged from river catchments areas/basins to
coral reefs throughout the WIO region. This would cause further stress, phase shift and degradation on
coral reefs.
Outbreaks of plague organisms such as crown of thorns starfish (COTS), black-spinned sea urchins
(BSU) and coral-eating snail Drupella have been recorded on many coral reefs where they have
grazed live corals causing death of the colony which has lead to reduction in live coral cover and
collapse of the reef matrix through increased bio-erosion (Carreiro-Silva and McClanahan, 2001;
Spencer and Viles, 2002). The population outbreak of BSUs is of particular relevance to our region as
recovery on many reef sites is being retarded by their destructive grazing (Carreiro-Silva and
McClanahan, 2001).
Underlying root cause 2: Poverty, inequality and economic drivers
Poverty and inequality are some of the strongest underlying root causes of widespread degradation
observed on coral reefs throughout the region. Over-fishing and destructive fishing practices are very
common in Tanzania (Francis et al., 2002), Comoros (Ahamada et al., 2004) and Kenya.
Coral mining is still practiced in many countries of the region as a source of construction materials,
leading to an increase in the amount of coral rubble in the reef. As the rubble is easily moved about by
wave action and swells, it often results in increased physical damage to the remaining live coral
community. Coral mining also has severe implications to the stability of the near-shore marine
continental shelf as it tends to lead to the deepening of the reef flat and thus increases the volume of
water and the height of the waves inshore which leads to increased coastal erosion.
Reef trampling is a very important cause of destruction of the reef flat community throughout most of
the region where there are many fishers and collectors operating, notably those involved in the
octopus, sea cucumbers and shell fishery.
Seine netting is still practiced in most of the continental WIO states as well as in Madagascar and the
Comoros. This type of fishing involves dragging a weighted net over the reef which causes great
physical impact to the reef structure as well as to the benthic reef community. As the mesh seize of
the net are often very small, this type of fishing method is responsible for capturing a large number of
juvenile fish.
Poaching in Marine Protected Areas (MPAs) is widespread in the WIO region. The overall effect is
that most MPAs are not effective in acting as fisheries reserves and as a source of larvae and mature
individuals to the more exploited reefs beyond their boundaries. Poaching of MPAs also has an
indirect impact on the tourism industry as it removes large fishes that are one of the main sources of
attraction for tourists. This loss of large fish impacts on the pristineness of the MPAs and willingness
by tourists to pay to enter into the MPAs (Jennings et al., 1996; Kaunda-Arara and Rose, 2004).
Over-harvesting of marine resources is also widespread in reef areas, often driven by increased market
demands. In continental countries, demographic changes resulting in net migration to the coast has
also fuelled over-harvesting of marine resources. Marine resources that are presently being targeted
52
from coral reef areas include large coral reef fishes, especially large groupers and snappers, lobsters,
octopus and sea cucumbers.
In addition to poverty and inequality, there are also a number of economic drivers operating in the
region which are underlying root causes of coral reef degradation. These include industrial
development, tourism, economic and social growth of countries, accompanied by increases in market
demand, and factors such as government budget limitations.
The increasing need for flat land for industries and other aspects of social development and the
creation of ports and harbours has lead to reclamation and dredging in some parts of the region.
Notable are the Seychelles islands, where the need for flat land has led the government to reclaim
large expanses of the reef flat on the east coast of Mahé Island.
Sedimentation associated with dredging (also for ports and harbour development and expansion) have
long term impacts of coral reef communities due to the increase in the amount of fine sediments
available for re-suspension. Poor coastal development planning is also a source of significant
sediment input to the reef ecosystem - the resultant impact often seen as a reduction in coral
recruitment and increased turbidity of the water column which reduces light, needed for
photosynthesis in marine plants and as the main source of energy for scleractinian reef building corals
(Birrell, et al., 2005; Weber et al., 2006).
Tourism development has also been linked to degradation of coral reefs in the WIO region through
increased discharge of municipal wastewater from high-density beach tourist sites (Edinger et al.,
1998; Fabricius, 2005), trampling (Hawkins and Roberts, 1993; Brown and Taylor, 1999) and
increased demand for marine products such as seafood and marine curios. Tourism-associated
SCUBA recreation has destructive potential when in high concentration (from boat and diver
damages), yet coversely tourism may boost conservation efforts and the creation of MPAs that protect
coral reef areas.
Underlying root cause 3: Inappropriate governance
Governance or institutional influences or aspects that are responsible for coral reef degradation in the
WIO include (i) inappropriate and outdated legislations; (ii) lack of enforcement of existing
legislations, (iii) lack of appropriate coastal development policies, (iv) lack of effective coastal
planning, (v) inadequate institutional capacities and (vi) poor stakeholder's or community
participation. These underlying root causes act at levels that lead to destructive practices in the coastal
zone such as discharge of untreated municipal wastewater and run-off, poaching in MPAs, use of
destructive fishing gears and physical damage caused by anchors, trampling and sedimentation. An in-
depth analysis of governance-related issues is presented in Chapter 5 of this TDA.
For all drivers of coral reef degradation in the WIO, the combined impacts on coral reef communities
are most readily observed in the form of decreased coral cover, decrease in coral recruitment,
reduction in reef structural complexity, lost of nursery areas, breakdown in inter-species relationship,
reduction in coral reef biodiversity, decreased reproductive output of reef organisms, reduction in
wave dampening (leading to coastal erosion) and loss of important fishing grounds. These primary
impacts have a cascading effect causing secondary impacts in the form of collapse in reef structure,
reduced pristineness and aesthetic value, and reduction in coastal fisheries productivity (Sheppard,
2003) In turn these lead to the loss of livelihoods and increased poverty among coastal communities.
If management does not improve and there are repeats of the recent climate-related stresses, it is
predicted that most reefs in the region will have less than 20% live coral cover by 2014 (Wilkinson,
2004). As more people migrate to the coast and as the world population continues to grow, it is
expected that reef-based activities will continue to increase and that greater pressure will be exerted
on the coral reef ecosystem. However, it is encouraging to note that patchy recovery of coral reefs
from impacts are being reported from many countries in the WIO region (Obura, 2002; Motta et al.,
2002; Linden et al., 2002; Wilkinson, 2004; Payet et al., 2005; Souter and Linden, 2005).
53
Risks, uncertainties and trends
There are several risks and uncertainties related to the analysis presented in this section. These are,
most importantly:
· Inadequacy of data - The lack of data on the current status of coral reefs in various areas
within the WIO hampers a better prediction of the actual trends of coral reef degradation and
recovery in the region.
· Uncertainties in trend Over-fishing seems to be a major cause of coral degradation in the
region. Without alternative livelihoods, the region is likely to continue experiencing reef
degradation. A positive trend could be the establishment of community-based fisheries
organizations that may play a role in promoting good fisheries practices throughout WIO
countries.
· Trend - Climate change impacts on coral reefs is becoming an important risk issue and
threatening coral reefs in the WIO, though considerable uncertainties remain as to the ability
of reefs to recover from impacts such as raised sea surface temperatures and bleaching.
4.3.5 Degradation of coastal forests in the WIO region
Problem Statement
Degradation of coastal forests is basically physical, mainly in the form of land transformation through
intense clearing for agriculture, mining, human settlement and coastal development, including
tourism. There is also destruction associated with an increased demand for forest products such as
timber and firewood. Increased population in the coastal area is exacerbating the condition of the
coastal forests. Coastal forest degradation impacts on the marine environment in various ways
Transformation of coastal forests impacts on the coastal environment through a reduction of plant and
faunal diversity, resulting in soils prone to erosion, reducing recharge of groundwater aquifers and
negatively affecting the development infrastructure. (Dubinsky and Stambler, 1996). Ultimately, these
impacts change the dynamics of both sediment and water exchange in the coastal zone.
Transboundary elements
The transboundary context of coastal forest degradation in the WIO region is mainly attributed to the
problem being shared, with only a few boundary areas supporting forests that are truly transboundary,
such as parts of the Mozambique-South Africa and the Mozambique-Tanzania borders. In such
situations, deforested areas can result in soil erosion adding sediment loads of rivers which are
subsequently carried to coastal waters and beyond, increasing turbidity waters of neighboring
countries. The single major shared problem in that most of the countries in the WIO region have to a
certain extent experienced deforestation of coastal forests with considerable impacts on biodiversity.
54
Socio-economic Consequences
Reduced tourism and
Increased poverty
Loss of cultural
Threats to public health
aesthetic value
heritage
Environmental Impacts
Increased coastal erosion
Increased sedimentation & turbidity
Increase vulnerability to natural
Drying of rivers
in coastal areas
calamities and tsunami
IMPACTS AND
CONSEQUENCES
Reduced sequestration of green
Reduction of biodiversity
Reduced biomass & cover of
Lowering of ground water
house gases
habitat
table
Coastal forests degradation
S
Urbanization &
Fisheries &
Agriculture &
Tourism
Industry & Mining
Coastal Dev
aquaculture
forestry
· Conversion of habitats to
· Clearing land for farming
· Clearing of natural
·
industrial zones
Salt water intrusion
· Conversion of habitat
and settlement
vegetation for tourism
·
· Wastewater
Clearing of natural
for aquaculture
· Over harvesting for fuel
· Wastewater
discharge/pollution
vegetation for human
and charcoal
discharge/pollution
settlement
· Conversion of habitat for
· Over-grazing associated
·
saltworks
Wastewater
with high cattle production
discharge/pollution
· Alteration in freshwater
· Uncontrolled wildfires
flows and sediment loads
· Alteration in freshwater
ASSOCIATED CAUSE
· Deforestation to meet
flows and sediment loads
timber and fuel needs
UNDERLYING SECTORS AND
Root Causes
Climate change and
Economic
Population
Poverty &
Inappropriate
Inadequate knowledge
Inadequate financial
natural processes
drivers
pressure
inequality
governance
and awareness
resources
· Figure 4-14 Problem tree coastal forest degradation.
55
Root-cause analysis
The impacts associated with coastal forest degradation are numerous and includes loss of
biodiversity and associated natural resources, increased soil erosion and subsequent siltation
of important coastal and marine habitats such as mangroves and coral reefs, reduction in the
recharge of groundwater aquifers leading to a reduction in groundwater flow to the coast.
These impacts in turn affect the livelihood of coastal communities eventually leading to
poverty, as shown in the problem tree of Figure 4-14.
Most of the impacts are mainly due to the clearance of coastal forests (e.g. Brouwer and
Falcão, 2004) in order to open land for agriculture/farming, settlement, livestock grazing,
supply of timber, supply of fuelwood, urban and infrastructure developments. Such
degradation and loss of coastal forests and associated species is widespread. An estimated
60% of coastal forests in eastern Africa have been converted over time to farmland and
human settlement (Burgess and Clarke, 2000). Stakeholders have identified 75% of the
remaining coastal forest areas to be highly or very highly fragmented (Younge et al., 2002).
According to WWF (2006), the major direct threats to the coastal forets are (in ranked order):
· expanding agriculture
· charcoal burning and firewood collection
· uncontrolled wild fires
· illegal logging
· unplanned settlement
· destructive mining practices
Agriculture is the major threat facing coastal forests. As the soils of coastal forests are
generally poor and cannot easily support settled agriculture, the type of farming practiced by
most subsistence farmers at the coast is shifting agriculture, concentrating on food crops such
as tomatoes, cassava, maize, millets, along with pawpaw, banana and citrus fruits. The high
poverty status of the traditional coastal communities, as well as growing population pressures,
tend to decrease the length of the fallow period (Younge et al., 2002), thus the same piece of
land is cultivated year after year leading to soil degradation. Plantations of sisal, coconut,
cashew nuts and fruit trees have claimed a considerable area of coastal forests in the WIO
countries; particularly in Arabuko-Sokoke in Kenya (Githitho, 2004), Tanga and Pungu in
Tanzania (Dallu, 2004) and northern Mozambique (Kanji et al., 2004; Burgess and Clarke,
2000; Bandeira et al., 2007b). In KwazuluNatal, South Africa, extensive areas of the
Maputaland centre of endemism have been converted into exotic plantations (Wyk and Smith,
2001). In the island states such as Mauritius and Madagascar, the native flora is being
transformed and replaced by non-indigenous plantations such as sugarcane.
Fuel wood is the major source of energy for rural people in eastern Africa and charcoal is the
preferred fuel in peri-urban areas (Brouwer and Falcão, 2004; Burgess and Clarke, 2000). The
increased demand for fuelwood and charcoal in urban areas has led to an increase in
deforestatiuon of coastal forests (Burguess and Clarke 2000,Brouwer and Falcão, 2004).
Although not well documented, the business of charcoal production has heavily impacted
forest areas of Arabuko Sokoke and Ganze in Kenya, Pungu-Kazimzubwi (Tanzania) as well
as northern Mozambique area (Younge et al., 2002).
Commercial logging of coastal forests occurs mainly in northern Mozambique and remote
areas of Tanzania and Kenya; with many forests intensively logged (Burgess and Clarke,
2000). Heavy exploitation for roundwood export has recently occurred in coastal forests of
Rufiji, Kilwa and Lindi districts in Tanzania (Dallu, 2004) and similar logging for export to
the Far East continues in the northern and central area of Tanzania (Kanji et al., 2004).
56
Coastal areas of the WIO region are endowed with huge deposits of mineral resources.
Mining of iron ores, aluminium, titanium, gemstone, limestone, coral rag and silica has for
example already destroyed large areas of natural habitats (Younge et al., 2002). Future
exploitation of these and other minerals present a threat to remaining coastal forests, although
in some instances rehabilitation is possible, as demonstrated by the Bamburi Cement quarry
rehabilitation initiative in Kenya (Wass, 1992).
Tourism development indirectly causes the degradation of coastal forest through increased
demand for wood materials used in the construction of tourist hotels and also through
increased demand for agricultural products.
For local communities, the loss of livelihoods and cultural values associated with forests
further increases their poverty. Additional socio-economic impacts include the reduction in
the touristic value of the forest due to deforestation that physically reduces forest area. These
communities become further vulnerable to natural calamities such as droughts or floods.
Destruction of coastal forests and climate change also affect large animal communities that
live in forests. The coastal forests of eastern Africa are recognized as of global importance,
earmarked as of the 25 world's hotspots of biodiversity due to the high concentrations of
endemic plants and animal species in exceptionally small areas (Bruton and Cooper, 1980;
Burgess and Clarke, 2000).
Deforested areas experience high rates of soil erosion leading to high sediment loads of rivers
and subsequent heavy sedimentation in coastal waters. The discharge of sediments from
degraded lands leads to an increased turbidity of coastal waters with consequent impacts on
the productivity of critical coastal ecosystems such as mangroves, seagrass beds and coral
reefs. These impacts negatively reduce coastal and marine biodiversity. The reduction in the
recharge of groundwater aquifers due to increased surface run-off from cleared areas leads to
lowering of ground water table, drying of rivers and increased intrusion of saltwater.
Risks/uncertainties and trends
There are several risks and uncertainties related to the analysis presented in this section.
These are, most importantly:
· Habitat destruction, biodiversity change and impacts on marine habitats - The lack of
good baseline data makes it difficult to assess real changes in biodiversity and impacts
on marine life due to coastal forest degradation.
· Governance issues Uncertainty surrounds the maintenance of the current levels of
pristine costal forests in the WIO region.
· Extent of coastal forests - The precise area of coastal forest in each country remains to
be determined. A standardized assessment across the WIO region is needed to
develop an agreed baseline assessment.
· Relationship to coastal ecosystems - The importance of coastal forests to other
ecosystems such as marine systems remains to be established.
· Economic value - The economic value of coastal forests have not been clearly
established.
· Uncertainties in trends - Coastal forest encroachment due to the development of
settlements and tourism is already an ongoing process. Further reduction of coastal
forests is foreseen over the next 20-50 years.
57
4.3.6 Shoreline changes
Problem statement
Shoreline changes, particularly coastal erosion, pose serious threats to the coastal ecosystems
and development in the WIO (IOC-UNEP-WMO-SAREC, 1994; Kairu and Nyandwi, 2000).
Sedimentation and/or accretion of the coastline results in shoreline changes, generally from
two sources: first, terrestrial sediments are carried to the sea by rivers, often derived from
poor agricultural practices in the hinterland as well as deforestation, and secondly, re-
suspension of benthic sediments by rough seas or through trawling activities over soft
substrate.
Throughout the WIO region, coastal areas dominated by loose sand and sediments are eroding
rapidly. This has led to loss of land for agriculture, human settlement, infrastructure
development as well as damage to coastal infrastructure, such as roads and buildings (Kairu
and Nyanndwi, 2000). Increased water turbidity, due to re-suspended sediments, interferes
with the amount of light reaching corals and seagrass beds and, as the suspended sediments
settle, they smother corals and seagrasses leading to loss of productivity, ultimately
impacting on the system. In addition, coastal erosion has contributed to loss of critical
ecosystems such as mangroves in Kenya, Tanzania and Mozambique through burial of their
breathing roots (pneumatophores) leading to suffocation and eventually death of trees. The
socio-economic impacts of coastal erosion have serious repercussions on the livelihood and
incomes of coastal communities.
Sea level rise is an additional problem of concern for low lying coastal areas, as is the case of
the swampy coasts in central Mozambique, the west coast of Madagascar, and the Tana and
Rufiji deltas. The Intergovernmental Panel on Climate Change (IPCC) has predicted that sea
level will rise between 20 and 80 cm over the next century as a result of global climate
change. Under this scenario, the low-lying coastal settlements are considered to be at risk, as
the expected coastal inundation will displace a large segment of the coastal population and
lead to major impacts on the socio-economic well-being of the coastal populations.
Transboundary elements
The most common transboundary issues associated with shoreline changes include
modification and/or loss of habitat, increased coastal erosion/sedimentation, loss of property
and increased poverty. The impacts of shoreline changes, either through sedimentation or
erosion, are significant in all the countries in the WIO. The problem is most prevalent in
Malindi Mamburi area in Kenya (Abuodha and Kairo, 2001; Abuodha, 2003); NW coast of
Madagascar (Joottun et al., 1994); Beira and Macaneta Penninsula in Mozambique (Lundin
and Linden, 1996; Kairu and Nyandwi, 2000) and Unguja Islands (Zanzibar) in Tanzania
(Shaghude et al., 1994). Some of the affected marine and coastal ecosystems, for example
Tanga-Vanga and Lindi-Ruvuma systems, are cross-border areas. The silting of Mahajanga
Port in Madagascar (as further discussed in section 4.4) can be viewed as a transboundary
problem as the port was rendered useless thus affecting regional trade in terms of loss of
revenue and livelihood. In this example, the transboundary issue is firstly economic in nature
rather than environmental.
Root cause analysis
The main root causes of shoreline change in the region are high population pressure, poor and
unregulated coastal development, restricted livelihood opportunities due to poverty, and
increased economic growth in the coast areas, as shown in the problem tree presented in
Figure 4-15. Climate change, which manifests itself in the form of prolonged drought,
desertification and flooding, exacerbates the transboundary impacts of shoreline change in the
region. Natural processes contributing to shoreline change in the region include, among
others, the combined action of waves, low coastal topography and nature of sediments, tides,
58
winds and currents, variations in sea level, tectonic movement and storms (Kairu and
Nyandwi, 2000). Coastal erosion leads to loss of beaches, agricultural and settlement land,
and damages to coastal property or infrastructure, and destruction of important ecosystems.
The principal sectors leading to shoreline change are urbanization and coastal development,
fisheries and aquaculture, agriculture and tourism.
Increased population along the WIO coastline has led to increased demand of food and
shelter. For instance, around the Tana River (Kenya) and in central Mozambique, thousands
of hectares of wetlands have been reclaimed for agriculture and human settlement in order to
accommodate an increasing population. In addition to population pressure, shoreline change
in the region is being caused by economic growth and increased demand for products and
services. This is leading to the obstruction of natural nearshore sea water tidal and current
flows through the erection of coastal structures on beaches, such as those used by tourist
hotels, alongside marinas, harbours and beach jetties, many leading to accelerated shoreline
changes (Kairu and Nyandwi, 2000).
In most of the WIO countries, there is little understanding among policy makers of the
complex human-environment interactions, which provides an inadequate basis for sound
policy making. For this reason, mangroves and catchment deforestation including destruction
of wetlands; mining of beaches and sand dunes for construction materials and minerals, and
the dredging for ports and harbours are proceeding without clear guidelines, causing land
transformation and accelerated shoreline change.
In Kenya, coastal erosion is severe in the Malindi-Mambrui area. Between 1976 and 2003,
due to sedimentation processes, the shoreline in Malindi has receded by about 500 m (Kairu,
2003). Coastal erosion is also prevalent in beaches situated at Kanamai, Shanzu, Nyali,
Likoni, and Tiwi (Aboudha, 2003). The increased discharge of terrigenous sediments into the
coast has also caused shoreline changes, as observed in the Athi-Sabaki estuary in Malindi
(Kitheka, et al., 2003, 2005; Arthurton et al., 2006). The Tana and Sabaki rivers in Kenya
carry extensive terrestrial sediment to the sea (Kitheka, 2002; Kitheka et al., 2004).
In Tanzania, coastal erosion problems have been reported from along parts of the mainland
and the shores of Unguja Island (Zanzibar) (Shaghude et al., 1994; Mohammed and Betlem,
1996). The most seriously affected sites include the Dar es Salaam coast (Msasani to
Kunduchi); Tanga (Mwambani, Kigombe and Pangani delta); Mtwara (Mikindani) and
Unguja (Jambiani Bwejuu, Maruhubi). The Rufiji River also carries massive quantities of
terrestrial sediments to the sea (Kairu and Nyandwi, 2000).
Areas experiencing severe coastal erosion in Mozambique include Beira, Nacala, Macaneta
Penninsula and Maputo Bay (Lundin and Linden, 1996; Kairu and Nyandwi, 2000). The
Zambezi River (Mozambique) carries significant amounts of sediment to the ocean (Hoguane
et al., 2003), but for the past 40 years, the Zambezi delta has been experiencing accretion of
about one metre per year (Kairu and Nyandwi, 2000). Maputo city and the surrounding areas
experienced severe coastal erosion during the 2000 floods (Bandeira and Gell, 2003).
Coastal erosion is observed in many areas on both the east and west coasts of Madagascar.
These areas include Morondova, Mahajanga Port, at the mouth of the Betsiboka River,
received 100 million cubic metres of sediment from upstream sources, killing mangroves and
rendering the port unoperable (Rasolofoharinoro et al., 1997; Kairu and Nyandwi, 2000).
Beach sand mining has led to erosion in the Comoros, while in Mauritius erosion has been
documented in Flic en Flac, Le Morne, Riambel-Pomponette, Belle Mare and Grand Baie
(Joottun et al., 1994). In Seychelles, coastal erosion is more pronounced on the island of La
Digue, Bird Island and Praslin as well as the East Coast of Mahe Island (Shah, 1994).
59
Socio-economic Consequences
Reduced tourism and
Reduced land value in coastal
Threats to human health
Increased poverty
aesthetic value
areas
Environmental Impacts
Increased vulnerability to natural calamities (floods and
Destruction of habitats impacting on
frequency of episodic event)
biodiversity
IMPACTS AND
CONSEQUENCES
Increased sedimentation in
Sand accretion
Salt water intrusion
Increased coastal
coastal areas
erosion
Shoreline change (erosion and accretion)
Urbanization &
Fisheries &
Agriculture &
Tourism
Industry, Mining
Coastal Dev
aquaculture
forestry
& Transportation
· Land reclamation
· Clearing of natural
· Land reclamation
· Land conversion for
· Clearing land for
aquaculture/mariculture
agriculture
· Destruction/degradation
vegetation for settlement
· Destruction/degradation of
of wet lands
· Dredging for ports and
wet lands
· Destruction /degradation
of wet lands
· Clearing of natural
harbours
· Clearing of natural
vegetation for human
· Mining of beach sand &
vegetation for human
· Alteration in freshwater
settlement
removal of corals
settlement
flows and sediment loads
due to dam construction
· Alteration in freshwater
· Alteration in freshwater
flows and sediment loads
flows and sediment loads
ASSOCIATED CAUSES
due to dam construction
· Conversion of habitat for
salt works
UNDERLYING SECTORS AND
Root Causes
Climate change and
Economic
Population
Poverty &
Inappropriate
Inadequate knowledge
Inadequate financial
natural processes
drivers
pressure
inequality
governance
and awareness
resources
· Figure 4-15 Problem tree shoreline changes.
60
· Table 4-18 Examples of eroding/accreting shorelines.
Site
Geology
Comments
Comoros
Low volcanic rock cliffs and Removal of beach sands for construction has
Grande Comoros
narrow coastal lowlands
reduced beach areas (Kairu and Nyandwi, 2000).
Kenya
Sandy beaches
Major beach accretion of micaceous sand has
Malindi
occurred since the 1960s.
Madagascar
In 1953, the Morondova city lost 100 m of
Morondova
Wide low-lying area
shoreline due to the swell and storm events (Kairu
and Nyandwi, 2000).
Mauritius
Sandy beaches are the
Between 19801994, the position of high water
Flic en Flac
most common and exposed mark at Flic en Flac moved by a distance of 8 m
basaltic cliffs in the northern end (Jootum et al., 1994). The ridge complex zone
which runs parallel to the shoreline, stretching
over 600 m and attaining 5 m high in some
regions, has been mined for its good quality sand.
Mauritius
Sand beaches
Beaches receded to about 5 m in 1988 due to
Belle Mare
tropical cyclones (Jootum et al., 1994).
Mozambique
Sandy beaches, and
According to Lundin and Linden (1996), apart
Beira
coastal swamps
from natural causes, coastal erosion could be
attributed to: inadequate maintenance of the
buttress and sand retention wall, destruction of the
dunes, mangrove and casuarina tree removal;
removal of sand for construction, and building on
beaches.
Mozambique
Sandy beaches
Floods, cyclones and water swell accelerated
Maputo city
erosion of the coastline north of Maputo, and the
2000 floods divided the small Chefina Grande
Island into two.
Seychelles
Low-lying coralline island
Its south-western shoreline shift and recede
Bird Island
naturally while, north-eastern shoreline is
accreting (Shah, 1994).
Tanzania
Cliff erosion
Mwambani shoreline is characterized by a
Mwambani,Tanga
fringing reef platform bordered by a line of cliffs.
The stretch is a high wave energy environment
and fine sediment is lacking.
Maziwi Island
Sandy island
The Island disappeared in 1977/1978, attributed to
sea level rise (Fay, 1992) and clearance of all
vegetation (Shaghude et al., 1994).
Nungwi, Zanzibar
Sandy beaches
An erosional regime that threatened the village of
in the early 1990s has been replaced by accretion.
Risk, uncertainties and trends
There are several risks and uncertainties related to the analysis presented in this section. These
are, most importantly:
· Uncertainties with regard to the extent of shoreline changes The problem of shoreline
change in the WIO region has been studied and reported widely for some countries more
than others.
· Governance issues - There is at present no comprehensive set of strategies (policies,
legislation and regulations) in the WIO which is specifically geared towards addressing
problems of shoreline change. Also, most countries in the WIO lack key government
mechanisms such as Integrated Coastal Zone Management Programmes, guidelines or
codes of conduct to address shoreline change. Consequently, there is large uncertainty as to
what extent mitigation of shoreline changes will be implemented at least in the near future.
61
4.3.7 Stakeholder analysis
Various stakeholders were identified for all natural ecosystems discussed in this TDA. For most
habitats, the main stakeholders were those involved with resource use such as local communities
and management authorities. The main stakeholder sectors identified for PADH are fisheries and
aquaculture, agriculture and forestry, tourism, mining industry, management authorities, NGO's,
local communities and researchers/scientists. The principal stakeholders involved at the root of
each problem, were the resource users and management authorites, whereas at the impact level,
the most affected include again the resource users especially the tourism and local community
sectors. Several stakeholders were both at the root cause of the problems and were also affected
by the degraded ecosystems (see Table 4-19Error! Reference source not found.).
· Table 4-19 Analysis of sectors and stakeholder groups causing (C) PADH as well as those impacted (I) by
such.
SECTOR STAKEHOLDER
TRANSBOUNDARY PROBLEM
Mangroves Coral
Reefs Seagrasses Coastal
Shoreline
forests
change
Fisheries and
Artisanal fishers
I
C
I
C
I
Aquaculture
Industrial fishers
I I I
Seaweed farmers
C
Industrial prawn farmers
C
I
Fish and shellfish farmers
C
I C
I I
Agriculture and
Charcoal makers
C
I C
I
Forestry
Small-scale loggers
C
I C
I
Industrial loggers
C
Small-scale farmers
C
I
Large-scale farmers
C
I C
I
Pastoralists
C
I
Ranchers
C
Poultry farmers
C
Dairy farmers
C
Beekeepers
I
I
Tourism
Tourists
I
C
I I I I
Hotel owners/operators
C
I
C
I
C
I
C
I I
Small-scale traders
C
I
C
I
C
I I
Tourist boat/SCUBA operator
I I I I
Mining
Coral/lime miners
C
I I
Sand miners
C
I
C
I
Small-scale salt producers
C
I
Industrial salt works
C C C
Small-scale miners
C C
I
Industrial mining companies
C C C C
I
Fuel suppliers and stations
Oil and gas production
C C C
Industry
Heavy manufacturing
Light manufacturing
Agro-processing industries
Oil refining
C C
Transportation
Ports
C C C C C
Dredging companies
C C C
Clearing and forwarding
Railway
C C
Roads (incl. traffic)
C C
Airports
C
Airlines
Shipping
I
Energy Hydro-dam
operators
62
SECTOR STAKEHOLDER
TRANSBOUNDARY PROBLEM
Mangroves Coral
Reefs Seagrasses Coastal
Shoreline
forests
change
production
Power station operators
Renewable energy producers
Fossil fuel users
I I I I I
Urbanisation
Solid waste operators
C I
Sewage managers
C C C C
Property developers
C
I
C
I
C
I
C
I
C
I
Town planners
C
I
C
I
C
I
C
I
C
I
Coastal communities
C
I
C
I
C
I
C
I
C
I
4.4 Problem Area 3: Alteration in freshwater flows and sediment loads from
rivers.
4.4.1 Overview
One of the key areas of concern for the WIO region is the zone of interaction between river basins
and the coastal and marine environment where the alteration and/or modifications of freshwater
flows, of sediment loads, water quality and pollution are main aspects. The seriousness of this
concern is understated among others by the Land Ocean Interaction in the Coastal Zone (LOICZ)
Global Change Assessments and Synthesis of River Catchment Coastal Sea Interaction and
Human Dimension of African Basins (see LOICZ Reports and Studies No. 25, 2002) as well as
the preliminary Transboundary Diagnostic Analysis for the WIO region (UNEP, 2002).
Around much of the region many of the coastal issues are linked to human activities and climatic
variability that are distant, often far removed from the coast. Such up-country pressures have
altered the nature of the drainage through the river systems large and small impeding the flow
of freshwater, terrigenous sediment and organic matter. They have also affected the quality of the
water, mainly through the addition of nutrients and pollutants from domestic sewage and
industrial and agricultural chemicals (Crossland et al., 2005).
The focus of this section of the TDA is on the main rivers flowing into the south-west Indian
Ocean. The overview will cover information on hydrology, environmental issues such as water
quality, flow alteration, sediment loads, etc. It will highlight what the current main environmental
impacts are, related to freshwater flows, and analyse their drivers and impacts. For the purposes of
this TDA the area of interest is the outflow of the river where it crosses over from being a
freshwater system and into the saltwater marine system. Thus the issues may vary in different
parts of the basin, but cumulatively there is an impact in the outflow area be it a delta, estuary or
a linear river mouth.
There are two key problem areas, and associated issues, analysed in this section of the TDA:
A. Alteration of river flow and degradation of water quality:
a) Quantity of water at river mouth
b) Timing of the flows at the river mouth
c) Quality of water at river mouth
B. Alteration in river sediment loads:
a) Increase in sediment load at the river mouth
b) Decrease in sediment load at the river mouth
63
The most important transboundary environmental impacts associated with alteration of river flow
and degradation of water quality problems, as well as the most important causes and sectors
associated with such problems, are summarized in Table 4-20 and Table 4-21, respectively. From
these summary tables, it is apparent that there are several problems that contribute to a specific
impact or consequence and vice versa. There are also several direct causes linked to each specific
transboundary problem. These can roughly be attributed to six key underlying sectors, namely:
· Urbanisation and coastal development
· Agriculture and Forestry
· Industry
· Mining
· Transportation
· Energy production
Each of the above sectors has potential impacts on one or a combination of river flow, water
quality and sediment loads. Southern and eastern Africa is becoming increasingly urbanized, with
some of the largest cities in the region located in basins included in this study such as Nairobi in
the Athi-Sabaki and Johannesburg and Pretoria in the Limpopo basins. Increased urbanization
leads to an increase in paved areas, reducing infiltration of rainfall to the soil. A reduction in the
holding capacity of the terrain leads to flash-floods during periods of intense rainfall, with
possible increases in soil erosion in the lower reaches of catchments. Urbanisation results in an
increase in water consumption. To accommodate this, large-scale water storage and transfer
infrastructure has been constructed, with dams, impoundments and weirs altering the flow regime
of rivers as well as trapping sediments.
Much of the population in the WIO region, especially in the hinterland of the upper-reaches of the
basins in the study, is heavily dependant on agriculture and forestry. These activities are
associated with heavy water consumption both through interception of rainfall (thus leading to a
drop in groundwater levels) as well as through the evapo-transpiration of irrigated water. Intense
or inappropriate farming techniques, such as planting on steep slopes or deep drainage furrows,
can also lead to an increase in erosion with sediments reaching the main flow of the river.
Furthermore, the return flows from fields frequently have elevated levels of nitrates, phosphates,
salts and other pollutants such as herbicides and pesticides, which could impact river water
quality.
Accompanying, and in some cases driving, the increased urbanization is industrial development in
various parts of the river basins of the region. From these industries there is the potential for
organic and inorganic pollutants to reach the lower reaches of the rivers, while the increase in
water use also raises the possibility of reducing the dilution capacity of the rivers.
Mining is a mainstay of economic development in much of the region. Although precautions are
generally taken to ensure that environmental impacts from mining activities are minimized, there
exists the potential for the contamination of water resources from mine water runoff. This has
already become an issue in the headwaters of the Limpopo River where acid mine drainage from
decommissioned gold mines on the Witwatersrand has found its way into the groundwater
(Coetzee et al., 2005). In addition to large-scale mining activities, there are in several parts of the
basins of the region small-scale, unregulated or illegal, mining activities. These lead to erosion of
river banks during the digging and panning process, increasing the sediment load and turbidity of
the rivers. Numbers of these on a single system result in significant effects particularly in lower
catchments and can irreversibly alter ecological goods and services afforded by estuaries.
64
The transportation sector has impacts on river basins in areas where road networks have been
covered with impermeable surfaces. This reduces water infiltration to top soils leading to
increased runoff and less tolerance to heavy downpours and flash floods, causing soil erosion and
an increase in sediment loads. Dirt roads, through their construction as well as long-term use, may
also increase soil erosion, conversely by exposing bare soil (cleared of vegetation) to the rain.
Several countries in the region rely extensively on energy produced by hydro-electric power
schemes important for Kenya, Tanzania and Mozambique. Much like dams constructed for
water-supply these hydro-power dams alter the flow regime of rivers and trap sediments. The
Cahora Bassa Dam on the Zambezi River has had an impact on its delta area by encouraging
coastal erosion and reducing the nutrient supply carried downstream by floods (Turpie, 2006;
Brown and King, 2002). In South Africa, large amounts of water are taken from rivers for wet
cooling of thermal power stations, impacting particularly the Limpopo and Incomati rivers once
the warmed effluent is returned to the rivers.
At the root-cause level, seven common factors contribute to environmental problems related to
river-coast interaction in the WIO region:
· Climate change and natural processes Climate change and natural events to an important
extent influence river flows, turbidity and sediment transport. For example, Mozambique
has in recent years had several severe floods impacting on the floodplain and the delta in
the lower reaches of the Zambezi and Limpopo rivers. Most of the region is characterized
by large spatial as well as temporal variations in rainfall. Year-on-year variation around the
long term norm for various parts of the region is as high as 30 35 % (Earle and
Malzbender, 2007). This natural climatic variability is exacerbated by human induced
climate change. Temperature increases of between two and six degrees by the end of the
21st Century is predicted by the IPCC (2005) for much of the region, though the exact
impact is more difficult to predict, with some areas experiencing an increase while other a
decrease in rainfall. What seems likely though is that there will be an increase in what is
termed "extreme events" floods and droughts following on from each other (UNEP,
2005). This is likely to increase the stress on the river systems in the region by increasing
soil erosion and sedimentation and, in places, increasing pollution concentrations where
average water volumes decline. It is also likely that there will be decreased freshwater
flows to the coast in times of drought.
· Economic growth - Increased demands for limited water resources due to economic growth
in the region results in growing competition over the resource between different sectors
and the construction of more dams on rivers. The countries in the WIO region have, over
the past half century, experienced high levels of economic development, with a
commensurate increase in water use in river basins for industry, mining, urban
development, agriculture and energy production (TPTC, 2001; Arthurton et al., 2002; Van
der Zaag and Carmo Vaz, 2003; Hoguane, 2008). This trend is likely to continue with
several countries in the region already experiencing electricity shortages due to the
increase in demand from industrial users. The response in South Africa has been to plan
the construction of new power stations (such as the dry cooled Medupi plant in the
Limpopo River basin). With electricity production currently the largest user of water in
that country, and forecast to grow, this will likely lead to increased demands for water on
the resources of the Limpopo and Incomati rivers.
· Population pressure The increased demand for water resources by growing populations
can change river systems irreversibly. For example, in the Pangani River basin (Tanzania)
where increased water use of the Luengera and Mkomazi rivers, which were historically
perennial, has now led to only seasonal flow (PBWO/IUCN, 2007). All of the countries in
the region are experiencing medium to high rates of overall population growth, which in
the context of a finite supply of water resources, equates to ever greater demands on
existing supplies (Hirji et al., 2002).
65
· Poverty and inequality Due to limited resources, people engage in unsustainable land-use
practices, such as over-stocking of cattle leading to over-grazing and therefore increased
run-off of nutrients and soil erosion. Other harmful practices are the inefficient application
of fertilizers and use of (often cheap) harmful pesticides leading to compromised river
water quality. Poverty and inequality is also at the base of large-scale deforestation for
fuelwood and building materials in many areas at the coast, which is at the root of
increased soil erosion and sediment load to rivers.
· Inappropriate governance - The lack of inter-sectoral coordination, notably little or no
involvement of different water use sectors, with different sets of priorities in the
management of the resource, leads to the misuse of the resource. This is widespread in the
region, often with no, or inadequate, intervention and governing regulatory instruments.
The inclusion of stakeholder views, knowledge and interests is also limited. The lack of
information and data (in some areas) of the nature, causes and impacts of environmental
problems, and weakly enforced legislation, compounded by the lack of harmonised legal
and institutional frameworks for the management of transboundary rivers has allowed the
deterioration of river and adjacent coastal areas. Fortunately, these issues are increasingly
being addressed, with a more detailed analysis of governance related issues presented in
Chapter 5, section (5.3.6) with particular relevance to river basin management structures.
· Inadequate knowledge and awareness This concerns two important factors:
· Shortcomings in information and data (in some areas) of the nature, causes and
impacts of environmental problems. For example, in the Pangani River the melting of
glaciers on Mount Kilimanjaro has increased streamflow at certain periods in some of
the tributaries, making it difficult to determine whether increased water abstraction
has had an impact on overall streamflow (PBWO/IUCN, 2007).
· Lack of awareness of stakeholders of the impact of their activities on other
stakeholders and the ecosystem as a whole. For example, in the Pangani River the
melting of glaciers on Mount Kilimanjaro has increased streamflow during certain
periods in some of its tributaries, making it difficult to determine whether increased
water abstraction has had an impact on overall natural streamflow (PBWO/IUCN,
2007).
· Inadequate financial resources and human capital There is limited financial and human
resource capacity for effective implementation and monitoring of agreements and
comprehensive water management regimes.
The impacts on the coastal and marine environment of changes in river flow and sediment load
from rivers of the WIO, results in physical alteration and destruction of habitats, the degeneration
of water quality or a combination of these issues. In other words, the actual effects relate back to
the two main categories of transboundary problems that were analyzed in sections 4.2 and 4.3. For
this reason, the secondary environmental impacts and related socio-economic consequences
related to river-coast interactions are not dealt with in this section, but for further analyses on
these aspects, the reader is referred to the respective sections of this TDA.
66
· Table 4-20 Overview of common environmental impacts and socio-economic consequences associated with alteration of river flows, quality and sediment loads.
TRANSBOUNDARY PROBLEM
Increased
Decreased
Alteration of
Water quality
COASTAL IMPACTS
sediment
sediment
river flow
degeneration
loads
loads
IMPACTS ON COASTAL HABITATS AND SHORELINES
X
Increased salinisation of agricultural land (flood plain agriculture) due to lack of flooding
X
X
X X
Modification of ecosystem (riverine and estuarine) community structure and dynamics
X
Loss of wetlands due to lack of flooding and erosion
Decreased natural productivity due to changes in habitats, nurseries and spawning areas (e.g.
X
X
X X
vertebrate and crustacean fisheries)
X
Changes in habitats of terrestrial fauna including birds
X
X
X X
Reduction of available natural living resources (fauna and flora)
Loss of natural estuarine/river mouth riparian habitat resulting in human encroachment onto
X
floodplain and subsequent loss of buffering benefits to flooding from upstream and sea storms
X
X
X X
Loss of biodiversity
X X
Shoreline changes (erosion/accretion)
X
Coral reef degradation
X
X
Mangrove forest degradation
IMPACTS ON WATER QUALITY
X
X
Water quality degeneration due to decreased absorption capacity
Water quality degeneration due to increased pollutant loads from rivers or decreased dilution
X
factor through reduced flows
X
Increased salt water intrusion into downstream end of rivers
X
Increased turbidity, siltation and at times eutrophication of estuarine and coastal waters
67
· Table 4-21 Overview of common causes and sectors associated with alteration of river flows, quality and sediment loads.
TRANSBOUNDARY PROBLEM
Increased
Decreased
UNDERLYING
Alteration of
Water quality
IMMEDIATE CAUSES
sediment
sediment
SECTORS
river flow
degeneration
loads
loads
Damming of rivers, construction of off-channel impoundments, Energy, Agriculture and
X
X
X
weirs
Forestry, Urbanisation
Direct water abstraction for urban water supply, irrigated Agriculture, Urbanisation,
X
X
agriculture and wet process mineral mining
Mining
X
X
Inter-basin water transfer
Energy, UCD
X
Hydrological variability
N/A
X
X
Poor land-use
Agriculture
X
Agricultural runoff of nutrients and pesticides
Agriculture
Wastewater discharges
Urbanisation,
Industry,
X
Mining, Energy
X
Stormwater runoff
Urbanisation
Changes in vegetation types and patterns (including
X
X X
Agriculture and Forestry
afforestation)
X
X X
Alteration of climatic conditions
N/A
X
Insustainable agricultural techniques (e.g. slash and burn)
Agriculture
X
Deforestation
Agriculture and Forestry
X
Encroachment on river banks
Urbanisation
X
Mining of sand and aggregates
Mining
X
Road development
Urbanisation
Canalization and impoundment of river reaches for navigation
X
Transportation
purposes
68
· Table 4-22 Overview of the main issues related to freshwater flow in the basins
Issues deemed "critical" or "important" by consulted studies are highlighted in red:
River
Flow Issues
Quality Issues
Sediment Issues
Main Issues
Tana
Variable (Kitheka et al.,
Stable (Kitheka et al.,
Decrease but not critical
Reduction in sediment load due to construction of the HEP dams
2003 and Kitheka et al
2004d)
(Snoussi, 2004; Kitheka et
in the Upper Tana Basin (Ongwenyi, 1979 and1983; Dunne and
2004d)
al., 2003)
Ongwenyi, 1974 and 1976; Kairu, 1997).
Salt water intrusion and erosion of the mangrove colonised delta
(Kitheka et al., 2003)
Athi-
Variable, possible
Stable slight decrease
Increase (Fleitmann et al.,
Increased siltation of the estuary and Malindi Bay, Degradation of
Sabaki
(Fleitmann et al., 2007,
(Kitheka et al., 2004d)
2007, Kitheka et al., 2004a
the coral reef ecosystem at Malindi ( van Katwijk et al., 1993;
Kitheka et al., 2004a and
and d)
Kitheka et al., 2004a)
d)
Pangani
Decrease (PBWO/IUCN,
Decrease (PBWO/IUCN,
Small Increase
Reduced freshwater flows, Increased sea water intrusion in the
2006a).
2006a).
(PBWO/IUCN, 2006a and
estuary, Reduced water quality, particularly increased oxygen
(PBWO/IUCN, 2007).
demand (PBWO/IUCN, 2007)
Rufiji
Stable small increase
Stable Variable
Limited water quality degradation due to agricultural runoff
(Shaghude, 2004)
including nutrients and pesticides (Shaghude, 2004; Kulindwa et
al., 2001)
Ruvuma
Stable Stable
Small
Increase
Destructive fishing practices have led to a drop in biodiversity,
negatively affecting seagrass beds (Francis et al., 2002)
Zambezi
Decrease and less
Stable slight decrease
Decrease (Turpie, 2006;
Drop in sediment loads has led to landward erosion of the delta
fluctuation (Turpie,
Brown and King, 2002)
and sea water intrusion into the lower catchment.
2006;Brown and King,
Size of delta has reduced from 18,000 km2 in 1977 to around
2002)
15,000 in 1998 (Chenje, 2000).
Decreased variability of seasonal flow negatively impacting
fisheries (Turpie, 2006 ;Brown and King, 2002).
Pungue
Small Decrease (Hoguane,
Stable Stable
Decrease in riverflow, due to increased abstraction upstream, is
et al., 2002 and Anon
accelerating coastal erosion and salt-water intrusion through the
Mozambique, 2006)
estuary (Anon Mozambique, 2006; Van Der Zaag, 2000)
Limpopo
Decrease (Arthurton, et
Decrease not critical
Decrease not critical
Streamflow reduction, nutrient depletion, biodiversity loss and
al., 2002)
(Louw and Gichuki, 2003) (Louw and Gichuki, 2003)
salinisation receive impact codes of between 6 and 9 out of 10 in
the LOICZ study (Arthurton et al., 2002)
Incomati
Decrease (Hoguane, 2008; Decrease (Hoguane, 2008; Decrease (Hoguane, 2008;
Streamflow reduction due to heavy abstraction upstream. Salt
TPTC, 2001; Van der
TPTC, 2001))
Van der Zaag and Carmo
water intrusion through the estuary.
Zaag and Carmo Vaz,
Vaz, 2003; TPTC, 2001)
Reduction in sediment loads impacting mangrove vegetation
2003)
(TPTC, 2001; Hoguane, 2008; Van der Zaag and Carmo Vaz,
69
2003)
Maputo
Small Decrease
Decrease (Fernandes,
Stable
River is increasingly polluted due to industrial and urban wastes
1995)
(Hoguane et al., 2002)
Thukela
Stable (DWAF,2004;
Decrease
Decrease (DWAF, 2004)
Unknown effects of further flow and sediment reduction,
DWAF, 2004a)
particularly for prawn and fish nursing grounds (DWAF, 2004).
Risk of decrease if further impoundments/ transfers reduce
dilution capacity (DWAF, 2004a)
Betsiboka
Stable (Chaperon et al.,
Stable
Increase (Autrand, 1997)
High sediment loading of river outflow (IWMI, 2006)
1993)
Accretion in the Bay hindering the of Mahajanga harbour
shipping activities (Autrand, 1997)
Increase in area of basin affected by bush fire practice leading to
increasing runoff and heavy sediment loads
Tsiribihina
Stable (Chaperon et al.,
Stable
Increase (Salomon, 1987)
Continual accretion in the delta that could impact on mangrove
1993)
ecosystem e.g. species dominance related to growth condition
(salinity, type of soil etc)
Mangoky
Stable (Chaperon et al.,
Stable
Increase (Salomon, 1987)
Continual accretion in the delta but seems to be mitigated by
1993)
strong oceanic currents bringing marine sediments to certain areas
Marine sediments not conducive to optimal conditions for
mangrove growth.
Fiherenana Variable (Chaperon et al.,
Stable Increase
(Salomon,
1987)
Displacement of delta due to violent flood inundating the city of
1993)
Toliara.
Heavy sediment loads into the Bay of Toliara damaging the
barrier reef (Aldegheri, 1967)
70
· Figure 4-16 Map showing key hotspot areas for rivers of the WIO region (map to be provided by the PMU)
71
Some of the main specific issues related to each of the twelve river basins are introduced below:
Tana River:
Since the development of the hydropower dams on the Tana River there has been a 56 % decline
in sediment load to the Tana Delta (Kitheka et al., 2004d). This drop has led to the erosion of
beaches along the Tana Delta/Ungwana Bay (Otieno and Maingi, 1983; Kitheka et al., 2004b;
Kitheka et al., 2004d) and a loss of wetlands and mangroves in the delta (IUCN, 2003). The flow
regime is highly variable, both year on year as well as seasonally. Some studies suggest that there
is a long-term increase in runoff from the basin however the reliability of the data cannot be
confirmed (Kitheka, 2004d). Although there has been an increase in the use of agro-chemicals in
the Tana Basin, expected to lead to increased nutrient levels (Davis, 2000), the chemical water
quality at the Delta has not reflected major deterioration although nutrients levels are generally
high at the Tana Delta (Kitheka et al., 2004d).
Athi-Sabaki River:
The Athi-Sabaki River has over the past five to six decades experienced a major increase in
sediment load at the estuary (van Katwijk et al., 1993; Kitheka et al., 2004a). One of the prime
causes of this is poor land-use patterns in the catchment, with intensive agriculture (both small-
scale as well as large-scale farming, including livestock and wildlife over-grazing) leading to soil
erosion (van Katwijk et al., 1993; Fleitmann et al., 2007). This has been coupled with an increase
in rainfall in the catchment as well as a reduction of rainfall infiltration all contributing to an
increase in soil weathering and erosion (Snoussi et al., 2004; Kitheka et al., 2004a). There is
evidence that this increase in sediment transport started at the time of British colonial settlement
in the central highlands of Kenya, when there was a shift from traditional subsistence agricultural
practices to more intensive land use (Champion, 1933; Dunne, 1974, 75; Dunne and Ongwenyi,
1976; Fleitmann et al., 2007). The consequences of this large increase in the sediment load from
the river include the siltation of Malindi Bay, deposition of sedimentary matter and debris on
beaches rendering them unappealing to tourists, and the degradation of nearby coral reefs and
seagrass beds through suspended solid settlement and decreased water clarity. (van Katwijk et al.,
1993; , Snoussi et al., 2004; Kitheka et al., 2004a; Fleitmann et al., 2007).
Pangani River:
According to the Pangani State of the Basin Report the "main causes of (Pangani) river
degradation are: changes to the flow regime; changes to the channel and riverbed, including the
extent of inundated areas such as floodplains; changes to water quality due to pollution; and the
presence of alien plants and animals" (PBWO/IUCN, 2007). In the Pangani catchment, power
production at the Nyumba ya Mungu Dam relies on storage of water during rainy seasons and a
constant release of water through the turbines (PBWO/IUCN, 2007). Regulation at the dam also
ensures a relatively even flow through the year to the downstream power stations at Hale and New
Pangani. The Nyumba ya Mungu Dam on the Pangani River and Kalimawe Dam on the Mkomazi
River have had the effect of smoothing-out the flow regime experienced at the estuary,
significantly changing the natural hydrographic pattern (Lugeiyamu, 2002). In the dry season, the
low flows are still present due to constant dam releases, but any higher flows are withheld by the
dams. In the wet season, large floods still move down the system but smaller floods and a
proportion of the low flows are trapped by the dams between floods. Thus, the flow is lower than
natural (PBWO/IUCN, 2007). The quality of the water in the river generally deteriorates from
upstream to downstream (Lugeiyamu, 2002), and most of the lower reaches of the river are
classified by the State of the Basin Report as being "largely modifiedv" for parameters such as
water quality, stream morphology and aquatic life. Poor quality is mostly related to increased
levels of dissolved salts, nutrients, faecal coliforms, decaying organic material and turbidity in
v Ecological state: Severe modification with major disruptions in ecosystem functioning; mostly tolerant
species remaining, often to pest proportions; alien species common; plants and animals may be diseased
(PBWO/IUCN, 2007).
72
various parts of the system (PBWO/IUCN, 2007). Dissolved oxygen levels in the estuary are very
low, especially in the upper reaches before the diluting effect of seawater plays a role.
Rufiji River:
The Rufiji River, like the Athi-Sabaki River in Kenya, is one of the last undammed rivers (on the
main stem) in the region (Shaghude, 2004). This makes it an interesting system to study,
providing a valuable baseline against which to compare the situation after any future dam
construction such as the proposed hydro-power dam at Stiegler's Gorge. At present there is
some degree of water quality degradation in the Delta region, mainly as a result of DDT applied
by rice farmers to combat freshwater crab damage to seedlings (Kulindwa et al., 2001) though
contamination is at a low levels and seems to be locally confined. Nutrient flows from agricultural
activities upstream in areas around Mbeya and Iringa are high, but again, most of this is broken
down or absorbed by the ecosystem prior to it reaching the delta (Mwalyosi, 2004). The flow of
water and sediment also appears to be stable, with no significant changes noted. Building of dams,
such as the one proposed at Stiegler's Gorge, would have the main impact of trapping sediments
being transported downstream preventing them from reaching the delta. Reduction of the fine
sediments means reduction in the average supply of nutrients to the floodplain and delta. This is
expected to have significant consequences to agriculture and the deltaic and offshore ecology
(Shaghude, 2004).
Ruvuma River:
The hydrology of the Ruvuma River has not been systematically studied, thus little is known of
changes in flow rates or quantities or about sediment load (Francis et al., 2002; DNA, 2004;
Lerise, 2006). Floods and a high sediment load seem to be a natural part of the flow regime, with
no evidence of anthropogenic drivers (DNA, 2004). The remoteness of the river and relatively low
population densities in the catchment has meant that some of the best preserved mangrove forests
along the coastline are found in the estuary (Kyewalyanga, 2004).
Zambezi River:
The construction of the Kariba and the Cahora-Bassa dams has had the dual impact on the
Zambezi Delta of reducing sediment load and reducing the seasonal variability of flow (ZRA,
1998; Beilfuss, 1999; Chenje, 2000; Brown and King, 2002; Turpie, 2006). According to a study
by Gammelsrød (1996), as cited by the ZRA (1998) report, "in the case of the Zambezi River the
construction of Cahora Bassa Dam in Mozambique has had a significant impact on fisheries,
particularly along the Sofala Bank at the River mouth". This has bearing to the shrimp
Fenneropenaeus indicus (previously called Penaeus indicus), for example, there is a close
relationship between river runoff and abundance. Regulation of river flow has two main impacts
on this shrimp: (a) increased runoff during the dry season is likely to set up currents heading
offshore strong enough to prevent the larvae from entering nursery areas and (b) after having
developed to a juvenile state in the nursery areas, a strong rainy season runoff facilitates high
levels of recruitment to the fisheries - because higher runoff flushes a larger area and creates a
stronger offshore current" (ZRA, 1998).
The economic losses from reduced fisheries landings, due to the reduction in nutrients entering the
Indian Ocean at the Sofala Bank fishery (Arthurton, 2002), following alterations to the Zambezi
River freshwater flows has been estimated at between 10 and 20 million USD (Turpie, 2006). In
addition, there has also been a large reduction in the extent of the mangrove forests, due to
desiccation following reduced freshwater flows (Beilfuss, 1999), while the reduced sediment load
has led to increased coastal erosion.
Pungwe River:
The Pungwe River has experienced a large increase in abstraction of water for use in agriculture,
urban areas and industry (Van der Zaag, 2000; Hoguane et al., 2002). This abstraction is taking
place at various points throughout the basin, including the headwaters in Zimbabwe and the mid
73
and lower reaches in Mozambique. No comprehensive studies have so far been carried out to
assess whether there is a substantial change in the flow regime received at the Pungwe Delta (Van
der Zaag, 2000; Hoguane et al., 2002) thus no pressing issues have been identified related to the
freshwater flow of this river into the ocean, other than the fact that coastal erosion in the area does
seem to be increasing (Hoguane et al., 2002).
Limpopo River:
The water of the Limpopo River is heavily used by the four basin states (Botswana, South Africa,
Mozambique and Zimbabwe). Agriculture (large and small scale), mining, industry, energy
production and urban water use are all significant water consumers. The large number of dams in
the basin (over 40), coupled with direct abstractions, has reduced the annual flow of the river
significantly (Arthurton et al., 2002; Louw and Gichuki, 2003; Anon Mozambique, 2006). The
reduced flows in the lower reaches of the river, have lowered the potential for the river to absorb
pollutants. Thus water quality degradation, emanating from the sources above, is a problem, with
high concentrations of chromium, copper, iron and manganese found in the gills, liver, muscle and
skin of freshwater fish in the river (Louw and Gichuki, 2003). There has also been an increase in
seawater intrusion into the floodplains in Mozambique, negatively affecting agriculture (Arthurton
et al., 2002). The Limpopo reaches the Indian Ocean cutting through a coastal dunes belt by a
narrow river mouth lacking any deltaic features. This partly indicates the prevalence of natural
ocean forces over the river mouth in creating the physical environment of the narrow coastal zone
whereby typical river-ocean interrelations are confined to a relatively small coastal and marine
area (Louw and Gichuki, 2002). The most significant direct impacts to reduced freshwater flows
are the intrusion of the ocean saline water into the river course during high tides and the spread of
sediment in the nearshore sea, particularly suspended particles which on extreme floods may be
transported long distances by longshore currents.
Incomati River:
Due to the heavy utilisation of its water resources, the flow regime of the Incomati River is
significantly altered. Water quality has decreased in some areas (Hoguane, 2008) but at present,
flow alteration due to impoundment and abstraction from those impoundments has the biggest
impact on the system and the estuary. The estuary has suffered from reduced freshwater inflows
and sediment deposition (TPTC, 2001; Van der Zaag and Carmo Vaz, 2003; Hoguane, 2008),
leading to salt intrusion and sediment deficit, and consequently erosion. Hoguane (2002) observed
salt intrusion up to about 40 km upstream. There are currently numerous dams in the system and
further dams are planned, which would potentially aggravate the described impacts on the estuary
(TPTC, 2001).
Maputo River:
The main issue on the Maputo River is the discharge of agricultural, industrial and urban wastes
into the river shortly before it flows into Maputo Bay. The Bay has seen a general degradation in
its water quality partly caused by the discharge it receives from the Maputo River, but also from
direct discharges from Maputo City (Hoguane et al., 2002).
Thukela River:
Despite some dams and inter-basin transfer infrastructure (such as pipelines and canals) the river
system is relatively undeveloped, so that current flow and sediment load conditions at the estuary
can be considered stable (DWAF, 2004a; DWAF, 2004b). The effect of the dams on floods and
sediment dynamics at the estuary is minimal (DWAF, 2004a). Overall water quality is currently
stable, although there are pockets where water quality problems are more significant, for example
in the upper reaches where acid mine liquid waste enters the river (DWAF, 2004a). Water quality
at the estuary is also currently stable since effluent releases are mitigated by reasonably large
volumes of water that flow down the lower section of the Thukela from the well-watered tributary
sub-catchments upstream (DWAF, 2004a). The Thukela Water Project, comprising the
construction of the Jana and Groot Mielietuin Dam, has been deemed feasible (DWAF, 2001) but
74
the approval to construct has not yet been given. If the Thukela Water Project does proceed, it
might not become operational before 2020, possibly even later if Lesotho and South Africa go
ahead with Phase 2 of the Lesotho Highlands Water Project (DWAF, 2004a). Though the estuary
sediment dynamics has been shown to currently be in a dynamic equilibrium state, simulations of
a post-dam scenario indicate that a dynamic equilibrium similar to the current conditions would
prevail (DWAF, 2004b).
Betsiboka River:
Although there are two dams in the upstream part of the Ikopa River (a main tributary), flow
regime issues seem not to be associated with dams, but rather from changing climate affecting the
whole basin. Despite the absence of current data on climatic conditions in Madagascar, studies
have reported increasing periods of drought, mainly in the south-western region, coupled with
mostly irregular rainfall which often causes violent erosive flows downstream. Betsiboka River
basin is much more affected by poor land use along its course. Bush fires and slash-and-burn
practice are the main causes of the basin's degradation every year, leading to heavy sediment load
transport into the Bay of Mahajanga. There is evidence that this problem began before
independence in 1960. It was reported by Autrand (1997), during a study of the western coast
potential for shrimp nursery, that the accretion in the Bay has reduced the water depth from 70 to
40 m. This process is thought to have transformed the former bay into a lagoon system (Autrand,
1997). Nowadays, shipping activities are the first affected by the changes but the water quality
may also worsen from the reduced circulation combined with the continual and direct discharge of
untreated municipal wastewater. Finally, some kilometres north, at Antrema, local coral reefs have
also been impacted by the higher turbidity associated with the sediment load Maharavo (2003).
Tsiribihiny, Mangoky and Fiherenana rivers:
The three south-western rivers, Tsiribihiny, Mangoky, and Fiherenana, located in a semi-arid zone
have experienced the same problem of increasing sediment load due to: the irregular occurrence of
violent storms concentrated at the start of the rainy season; the relatively steep and long slopes in
the crystalline zone of the river courses; and a catchment area in which the destruction of the
vegetation cover has resulted in the erosion of topsoil. All of these impact, to varying degrees, on
the mangrove ecosystem at the delta and the surrounding coral reef ecosystem, such as the Gran
Recife in the Bay of Toliara, heavily impacted by siltation from the Fiherenana River. The current
agricultural policies of government, encouraging and facilitating the use of chemicals and
fertilizers, are likely to have an impact on the quality of freshwater downstream and subsequently
on the fragile nearshore ecosystems such as coral reefs. The expansion of mining and petroleum
investment and activities in the country, particularly in the western part, could have a severe
impact on water use and quality and should not be overlooked.
Based on the above descriptions it may be concluded that all of the twelve rivers covered in this
review have been modified by human activities to some degree. In certain cases, the modification
is significant, such as Pangani Zambezi and Incomati, as highlighted above. In others, the degree
of impact is relatively low such as the Ruvuma and the Rufiji. Again, when discussing the
degree of modification for this transboundary impact study, it is the situation at the outflow of the
river which is of interest and direct relevance to transboundary issues.
The degree of impacts of land and water use activities in the basins concerned is difficult to
quantify and compare. This is due to the fact that no empirical studies using standardised
methodologies have been carried out on all the rivers. A subjective categorisation of the degree of
impact on the rivers has been performed by the authors of this TDA, largely based on citations
from the literature consulted, whereby the rivers have been divided into three classes severe,
moderate and little affected (by human activities). Essentially, if studies have flagged an issue in a
basin as "severe", "pressing", "important", or "critical", it has been classified under the "severe"
heading in the present analysis. Likewise, "little affected" rivers or similar are those which the
literature indicates there is low human impact at the mouth of the river. The remainder of the
75
basins are placed in the "moderate" category indicating either that the various studies consulted
have concluded, on the basis of empirical evidence, that the impacts are moderate (or a similar
description) or that studies and data are inconclusive. The final categorisation of the degree of
impact severity on the rivers is thus, as follows:
· Severe: Pangani, Athi-Sabaki, Incomati, Zambezi, Betsiboka
· Moderate: Rufiji, Limpopo, Maputo, Fiherenana, Tana, Thukela
· Little affected: Ruvuma, Pungwe, Mangoky, Tsiribihina
The majority of the main rivers of the WIO region are thus either moderately or little affected,
while only four of the rivers appear severely modified with measurable impacts on the
immediate marine ecology associated with them (Table 4-24). The latter may therefore be
considered as the main `hotspots' in the region, as it comes to issues related to river-coast
interaction. It should be noted, however, that even for rivers classified as "moderately affected"
there are some issues which either currently are posing an environmental threat or have the
potential to develop into one in future.
This situation, whereby most WIO rivers are little or moderately affected could change if
economic and social development pressures in the basins increase. Table 4-23 provides an
overview of the existing and proposed dams and inter-basin transfers (IBTs) for the main river
basins. The planned dams are ones for which there is some likelihood that they will be constructed
(or at least that construction will begin) in the next 15 years or so.
As the economies of the region develop and populations grow, so will the pressures on the
freshwater ecosystems increase, with a commensurate decrease in the quantity, quality and timing
of flows into the coastal marine ecosystem.
76
· Table 4-23 Overview of dams and inter-basin transfers in the WIO region existing and planned
River
Current significant Damsvi Potential/Planned
Inter-basin transfers
significant Dams
Tana
Masinga, Kamburu, Gitaru,
Mutonga Grand Falls,
Transfer to the Athi river
Kindaruma, Kiambere (Kitheka
Usueni, Adamson's Falls,
Basin through water supply
et al., 2004d; IUCN, 2003)
Kora Hills (Kitheka et al.,
to the City of Nairobi
2004d; IUCN, 2003)
(Snoussi et al., 2004)
Athi-
None (Snoussi et al., 2004 ;
Yatta, Munyu and
Transfer from the Tana
Sabaki
Kitheka et al., 2004a)
Ndarugu (Kitheka et al.,
River to supply Nairobi
2004 citing GOK-
(Gupta, 2001; Snoussi et al.,
TARDA, 1981a-c)
2004)
Pangani
Nyumba ya Mungu, Kalimawe, Possible new hydro-power None
Mabayani, Kihansi, Hale
dams
Rufiji
Mtera Stiegler's
Gorge
None
(Shaghude, 2004,
Richmond et al., 2002;
Mwalyosi, 2004)
Rovuma
None None
None
Zambezi
Kariba, Cahora Bassa, Kamuzu
Mepanda-Uncua, Batoka,
Matabeleland Zambezi
barrage, Itezhitezi, Kafue Gorge, Mupata, Baroma, Lupata,
Water project to
Sebakwe, Mazvikadei,
Mutarare (ZRA, 1998;
Bulawayo (Chenje, 2000)
Manyame, Chivero
Turpie, 2006; Beilfuss,
1999; Pallet, 1997)
Pungue
Transfer to the Save basin
to supply Mutare in
Zimbabwe (Van der Zaag).
Limpopo
Macarretane, Massingir,
Rehabilitation and raising
Currently IBTs from the
Hartebeespoort, Eerstepoort,
of Massingir dam
Orange-Senqu and the
Loskop,
Incomati basins
Incomati
Maguga, Driekoppies,
Corumana (raising),
Currently several IBTs to
Nooitgedacht, Vygeboom,
Moamba, Mountain View, the Limpopo Basin in RSA
Mbambiso, Kwena, Ngodwana,
Boekenhoutrand and New
(TPTC, 2001)
Witklip,
Forest Dams (Van Wyk,
Klipkopje, Da Gama, and
pers comm., 2007; TPTC,
Corumana Dams (TPTC, 2001)
2001)
Maputo
Small earth dams only (less than
6m in height) DNA, 1994
Thukela
Woodstock, Spioenkop,
Jana, Mielietuin (DWAF,
Currently four IBTs into
Ntshingwayo (previously
2004; DWAF, 2001)
neighbouring catchments
Chelmsford), Zaaihoek,
Feasible but not yet
(DWAF, 2004)
Wagendrift (DWAF, 2004;
decided on
DWAF, 2004a)
Betsiboka
Mantasoa and Tsiazompaniry
(IWMI, 2006)
Based on the earlier assessment of problems and issues related to the main river basins in the WIO
region, the sections that follow provide a further systematic analysis of the two main problem
areas related to river-coast interaction in the WIO region:
A. Alteration of river flow and degradation of river water quality
B. Alteration in river sediment loads
vi These are dams on the main stem or important tributaries of the river which have an impact either due to
their storage capacity or due to being located close to the mouth of the river, thus affecting sediment
transport
77
4.4.2 Alteration of river flows and water quality
It should be noted that issues related to river flow alteration and the degradation of water quality,
while seemingly different in nature, are strongly interconnected. This is because the eventual
effect of pollution inputs on water quality depends on the absorption capacity of rivers. This
capacity is directly related to the flow of rivers. For the purpose of this TDA, therefore, these two
issues are analysed in an integrated manner.
Problem statement
The alteration (changes in quality, quantity or timing of flow) of the natural river flow occurs to
different degrees in many of the major river basins in the WIO region. The four most frequent
reasons for flow alterations are due to: (i) consumptive uses, (ii) increase of river surface area
along sections because of impoundment, (iii) changed seasonal flow patterns (e.g. releases for
hydropower-generation during the dry season), (iv) increased floods due to wetland losses (loss of
water retention capacity) (Hirji et al., 2002). These are coupled with the large-scale realities and
uncertainties brought about as a consequence of climate change, with some basins predicted to
receive more rainfall than the historic mean, and others less (Bailey, and Scholes, 1999; Hulme et
al., 2001; IPCC, 2001; Hirji et al., 2002; Cave et al., 2003; Kitheka et al., 2004d; UNEP, 2005;
Earle and Malzbender, 2007).
Transboundary elements
The problem of flow alteration is specific to the rivers mentioned above, notably the Pangani,
Zambezi, Limpopo, Incomati and Maputo. Although the impacts are relatively localized, the
cumulative impacts of flow alteration are such that the effects on coastal communities and marine
ecosystems are of considerable significance within the regional context. This is particularly the
case when several rivers terminate in close proximity, as is the case in Maputo Bay where the
Incomati and the Maputo rivers end. Individually, the water quality of these rivers is not
considered critical (Anon Mozambique, 2006) but combined with increased pollution directly
from the city of Maputo, the water quality of the Bay has deteriorated significantly (Fernandes,
1995; Arthurton et al., 2002; Anon Mozambique, 2006).
Root-cause analysis
The main sectors linked to the immediate causes of river flow alteration and degradation of water
quality are:
· Agriculture, in particular extensive farming and forestry
· Urbanisation and coastal development
· Mining
· Energy Production
· Industry
Each of these sectors is associated with the abstraction of water from rivers, with or without
damming. The consequent drop in river flows can lead to a wide range of impacts on the marine
environment, both in terms of destruction of coastal habitats and shoreline changes as well as on
water quality modifications. These issues are presented in the problem trees for river flow
alteration in the WIO region (Figure 4-17) and degeneration of water quality (see Figure 4-18). An
overview of direct causes, impacts and affected stakeholders for the major river basins in the WIO
region, based on currently available data, is shown in Table 4-25.
78
Physical Alteration and Destruction of Habitats
Degeneration of water quality
· Increased salinisation of agricultural land
· Reduced assimilative and dilution capacity of freshwater inflows leading to water
CTS AND
· Modification of ecosystem community structure and dynamics
quality degeneration
· Loss of wetlands due to lack of flooding
· Increased salt water intrusion into downstream end of rivers
· Decreased productivity
IMPA
CONSEQUENCES
· Changes in habitats of terrestrial fauna
· Reduction of available natural living resources (fauna and flora)
· Loss of biodiversity
Alteration of Flow at River Outflow
Agriculture &
SES
Mining
Forestry
Industry
Energy
Urbanisation
ORS AND
· Abstraction for
· Damming, diversions,
· Abstraction for
· Damming of rivers
· Abstraction for
consumptive use
impoundments & weirs of
consumptive use
· Water releases from
consumptive use
rivers
dams against natural
· Damming of rivers
flow patterns
ED CAU
· Water releases from dams
T
against natural flow patterns
· Water retention in
dams against natural
ING SECT
IA
· Water retention in dams
flow patterns
Y
against natural flow patterns
· Inter-basin water
· Abstraction for irrigation
transfer
· Direct use of groundwater
ASSOC
UNDERL
Root Causes
Climate change and
Economic
Population
Poverty &
Inappropriate
Inadequate knowledge
Inadequate financial
natural processes
drivers
pressure
inequality
governance
and awareness
resources
· Figure 4-17 Problem tree flow alteration.
79
Physical Alteration and Destruction of Habitats
Degeneration of water quality
· Modification of ecosystem (riverine, estuarine, nearshore) community structure and
· Water quality degeneration due to reduced pollutant assimilative capacity
dynamics
· Water quality degeneration due to increased pollutant loads
· Decreased productivity (or increased in case of blooms and pests)
· Reduction of available natural living resource
IMPACTS AND
CONSEQUENCES
· Loss of biodiversity
Decrease of Water Quality at River
S
Agriculture &
Industry
Energy
Urbanisation
S AND
Mining
R
Forestry
· Discharge of untreated
· Flow reduction due to
· Discharge of untreated
· Discharge of polluted
· Discharge of effluents
wastewater
water extraction and
sewerage
return flows (heavy
· Agricultural runoff of
· Solid waste
inter-basin transfers
· Stormwater runoff
metals, etc.)
nutrients and pesticides
· Flow reduction due to
· Flow reduction due to
ED CAUSE
· Increased
Salinisation
water extraction and
water extraction and
sedimentation
· Poor land-use
inter-basin transfers
inter-basin transfers
· Flow reduction due to
· Livestock manure
water extraction and
inter-basin transfers
· Flow reduction due to
water extraction and inter-
ASSOCIAT
basin transfers
UNDERLYING SECTO
Root Causes
Climate change and
Economic
Population
Poverty &
Inappropriate
Inadequate knowledge
Inadequate financial
natural processes
drivers
pressure
inequality
governance
and awareness
resources
· Figure 4-18 Problem tree water quality.
80
· Table 4-24 Overview of the key problems, impacts and direct causes related to alteration of freshwater flows and degradation of water quality in the main river basins of WIO region
(Highly impacted basins are highlighted in red).
KEY PROBLEM
River Basin Alteration of Degradation
COASTAL IMPACTS
DIRECT CAUSE
freshwater
of water
flow
quality
· Decrease in the extent and frequency of flooding (IUCN, 2003).
· Damming of river for hydro-power generation
· Increased turbidity of coastal waters in Ungwana Bay.
· Direct abstraction for urban water supply and
Tana
X X
· Increased seawater intrusion and erosion of the delta leading to loss of
irrigated agriculture
mangroves and other important habitats such as riverine forests.
· Hydrological variability
· Poor land use
· High flow variability (Kitheka et al., 2004a; Fleitmann et al., 2007)
· Poor land use
· Increased flash of flood events due to reduced percolation of rainfall
· Wastewater and stormwater runoff from urban
Athi-Sabaki
X X
(Snoussi et al., 2004).
settlements
· Increased turbidity of water in Malindi Bay (Kitheka et al., 2004a)
· Hydrological variability
· Impacts on coastal habitats particularly coral reef ecosystem
· Smoothing-out of the annual-flow hydrograph leading to reduced
· Damming of river for hydro-power generation
flooding downstream (Lugeiyamu, 2002; PBWO/IUCN, 2007)
· Direct abstraction for irrigated agriculture and
· Low oxygen levels in water entering estuary associated with a heavy
urban water supply
Pangani
X X
pollution load (Lugeiyamu, 2002; PBWO/IUCN, 2007)
· Agricultural runoff
· Increased salt water intrusion at estuary
· Wastewater and stormwater runoff from urban
settlements
· Hydrological variability
·
·
Rufiji
X
Limited and localised water quality degradation (Shaghude, 2004;
Agricultural runoff and pesticides
Arthurton et al., 2002)
· Very little development in the basin, resulting in insignificant impacts
Ruvuma
--- ---
· Reduction in inter-seasonal flow variability resulting in the decrease in · Damming of river (to supply water for
mangrove forest cover, decrease in fish and shrimp catches.
hydropower generation and irrigated agriculture)
Zambezi
X
· Reduced colonisation of sandbanks in delta by riverine plants (Turpie,
· Land use change
2006; Brown and King, 2002; Beilfuss, 1999; Chenje, 2000; ZRA,
1998)
81
KEY PROBLEM
River Basin Alteration of Degradation
COASTAL IMPACTS
DIRECT CAUSE
freshwater
of water
flow
quality
· Increased water abstraction upstream of the estuary has lead to a
· Water transfer out of the basin
reduction in streamflow and increase in coastal erosion (Van der Zaag,
·
Pungue
X
Direct abstraction for agriculture and urban water
2000; Hoguane et al., 2002)
supply
· Exotic forest plantations consuming more water
· Increased salinisation of the estuary associated with sea water
· Direct abstraction for agriculture and urban water
Limpopo
X
intrusion leading to loss of biodiversity in estuary. Reduced
supply
absorptive capacity of the river has led to a reduction in water quality.
· Reduced streamflow leading to reduced sediment load and sediment
· Damming of River to supply water for irrigation
deposition; increased sea water intrusion; reduction in fish and shrimp
and cooling of power generation stations, (TPTC,
catches (TPTC, 2001; Van der Zaag and Carmo Vaz, 2003; Hoguane,
2001)
Incomati
X
2008)
· Direct abstraction for irrigated agriculture, inter-
basin water transfers (TPTC, 2001; Van der Zaag
and Carmo Vaz, 2003)
· Reduction in water quality associated with increased anthropogenic
· Increased direct discharge of industrial effluents.
Maputo
X
activities; Reduction in the water and sediment quality in Maputo Bay;
· Increased water abstraction for urban water
Reduced aesthetic/recreational values of Maputo Bay
supply
· Increased frequency of river mouth closure due to increased sediment
· Damming of river for irrigated agriculture and
deposition and erosion dynamics (DWAF, 2004)
consumptive use
Thukela
X
· Compromised water quality due to presence of industrial waste
· Inter-basin water transfers (DWAF, 2004a)
· Discharge of industrial effluents and poorly
treated sewage
· Slow shift of the Bay of Mahajanga to lagoon system (Autrand, 1997)
· Harsh climate
· Inter-seasonal high variability of salinity
· Bush fire and slash and burn practice
Betsiboka
X
· Steeply and long slope
· Irregular and intense rainfall
· Increased salinisation and regression of mangroves area at the delta
· Harsh climate and expansion of drought
· Bush fire for grazing purpose
Tsiribihina
X
· Steeply and long slope
· Irregular and short-lived intense rainfall
82
KEY PROBLEM
River Basin Alteration of Degradation
COASTAL IMPACTS
DIRECT CAUSE
freshwater
of water
flow
quality
· Increased salinisation and regression of mangroves area at the delta
· Harsh climate and expansion of drought
· Bush fire for grazing purpose
Mangoky
X
· Steeply and long slope
· Irregular and short-lived intense rainfall
· Severe flooding affecting the riverine plain and the city of Toliara
· Harsh climate and expansion of drought
(Chaperon et al., 1993)
· Bush fire for grazing purpose
Fiherenana
X
· Steeply and long slope
· Irregular and short-lived intense rainfall
83
For most of the rivers in the region, pollution of the marine environment from freshwater flows is not
significant, although (as described earlier) various studies undertaken in the Pangani, Limpopo,
Incomati and the Maputo rivers show that there has been some reduction in water quality and that the
spatial-temporal distribution of such reduction is usually significant. In a few hotspot areas however,
where there are changes to the estuarine environment due to increased pollution levels, reduced flows
and changed sediment deposition patterns have severely affected fish and shrimp catches (for example,
at the Zambezi Delta), confirming that the estuaries' function as fish and prawn spawning areas,
nurseries and feeding habitats is compromised. The reduction in flow, and especially the flood events,
has led to the physical alteration and destruction of habitats (PADH) of the lower delta, mainly
through salt-water intrusion, impacting on important spawning grounds for fish and shrimp (ZRA,
1998). The other PADH impact on the Zambezi Delta area is the reduction in mangrove forests
coverage. Similar trends, leading to reduced fish catches linked with alteration of flow and drop in
water quality, have been observed for the coast off the Incomati River mouth (TPTC, 2001; Van der
Zaag and Carmo Vaz, 2003; Hoguane, 2008) and off the Pangani River mouth (PBWO/IUCN, 2007).
The Maputo River has experienced high levels of chemical and biological pollution emanating from
industries and from effluent from neighboring towns, threatening seagrass beds (Fernandes, 1995).
The combination of increased pollutants from the city of Maputo and a reduction in freshwater flows
from the Incomati River which leads to salt-water intrusion, threatens mangrove forests and seagrass
beds in the vicinity of Maputo Bay (Hoguane et al., 2002). Increased demands for water in the region,
coupled with possible drops in rainfall due to climate change, could lead to further problems.
In Mozambique, alteration of river flow from impoundments and water abstraction e.g the Incomati
River has led to the Delta suffering from an increase in the salt-water intrusion, extending upstream
for about 40 km. This is accompanied by an increased erosion of the Delta, due to reduced sediment
loads and consequent reduction in mangrove forest areas (Hoguane et al., 2004).
The growing demand for water and unsustainable land use practices are often coupled with limited
awareness at grassroots levels of the cause-impact relationships as well as weak legal and institutional
frameworks and capacity to address the problems. Poor enforcement of water use licenses, such as in
the Pangani basin (PBWO/IUCN, 2007), limited knowledge of environmental water requirements,
such as in the Incomati basin (Van der Zaag and Carmo Vaz, 2003; Hoguane, 2008) and lack of
financial and human resources to effectively mitigate and adequately manage causes and impacts are
common problems throughout the WIO region.
Governance is specifically related to flow alterations from the damming of rivers through dam operating
rules. Hydro-power and water supply dams aim to provide maximum hydraulic pressure at times when
power is needed most and store wet season runoff for use in the dry season respectively. The net impact
is a reduction in the natural flow variability of the river, leading to loss of biodiversity and habitat
destruction. For instance, the construction of the Cahora-Bassa Dam and its operation and its impact on
the downstream fisheries has been mentioned above. The same is true for the Pangani River where
hydro-power reservoirs upstream have an impacted the flow regime at the estuary (PBWO/IUCN,
2007).
Addressing the underlying root causes requires cooperation between countries as solutions often
cannot be developed on a national basis. The transboundary nature of the resource renders national or
local responses, often in isolation, ineffective at addressing the described environmental problems.
These can only be solved if they are addressed throughout entire basins, some requiring harmonisation
of legal instruments on a regional level beyond the basin scale. Increased cooperation between sectors
is also needed to overcome management interventions that are mainly sectoral in nature with little
coordination between sectors. Further analysis of the governance-related problems related to river
flows and quality is presented in Chapter 5.
84
Risks, uncertainties and trends
Increasing demands for water (for irrigation, industry, mining and domestic use) due to population
growth and economic development, coupled with changing rainfall patterns and greater climatic
variability increases the pressure on the water resource. Although the problem of flow regime
alteration (and its impact on the marine environment) does not occur in all rivers of the region, there
exists the possibility for it to increase as economic development continues.
One of the biggest challenges faced is to obtain reliable hydrological data for most of the rivers.
Records which do exist tend to be incomplete due to failure of gauging stations and reporting
procedures for a variety of reasons. Additionally, the quality of the data is questionable, being
measured by different types of instruments, often mixed and corrupted. Several countries in the region
have plans for new large-scale water infrastructure and use (see Table 4-23) thus it will become
increasingly necessary to be able to understand the impact of such developments on downstream users
and ecosystems. Without sound data on which to base decisions, it is likely that damage to other users
and the ecosystem will continue to increase.
4.4.3 Alteration of sediment loads
Problem statement
A number of factors, such as changing climatic conditions, land use practices and dam construction,
have led to changes in the sediment load transported by some of the rivers in the WIO region. Broadly,
the alteration of sediment loads manifests itself in three ways:
1. Increased sediment loads The Athi-Sabaki and the Pangani rivers, among others, suffer
from increased sediment loads (e.g. van Katwijk et al., 1993; Fleitmann et al., 2007;
PBWO/IUCN, 2007). The increase in the sediment load of the Athi-Sabaki River has a
negative impact on the marine environment, through the degradation of the coral reef
ecosystem in Malindi Bay (van Katwijk et al., 1993; Kitheka et al., 2004a).
2. Decreased sediment loads The Tana, Zambezi, Limpopo and Incomati rivers are all
experiencing decreases in their sediment loads, important for downstream ecosystems (e.g.
Kitheka et al., 2003; Turpie, 2006; Hoguane, 2008) According to the literature consulted, the
issue of decreased sediment load is having a negative impact on the marine environment in
the Zambezi and the Incomati rivers. The size of the Zambezi Delta has decreased from
18,000 km2 in 1977 to around 15,000 km2 in 1998, due to the construction of the Cahora-
Bassa Dam (Chenje, 2000). In the Incomati Delta, there is an increase in salt-water intrusion
(up to 40 km upstream) and increased erosion of the delta due to a decrease in the sediment
load. The result is a reduction in mangrove area (Hoguane et al., 2004).
3. Variable sediment loads in different parts of the basin - In some rivers, both increased
sediment loads, from erosion in upstream areas, and reduced sediment transport downstream
of dams, following the trapping of the sediments behind the dam wall, are observed. The
latter situation could affect more rivers in the WIO region, as more dam development projects
are planned. Even where rivers are dammed, the sediment load reduction immediately
downstream of the dam can at times be off-set by sediment load increases caused by bad land
use practices on the river stretch between the dam and the river mouth. It is difficult to judge
what the impacts of such an altered situation will be on the marine ecology, with no studies
found covering the issue.
The combination of direct anthropogenic causes such as erosion with changing climatic conditions
(e.g. changing rainfall patterns) makes it difficult at times to determine the exact contribution of a
specific factor to the problem of sediment load alterations.
Transboundary elements
A common problem in the WIO region is poor land use practices (e.g. over-grazing, deforestation)
which are often aggravated by increased population pressure. Poor land use practices can lead to
85
problems of large-scale soil erosion (and resulting increase in sediment load), which may severely
impact river floodplains. Combined with reduced or significantly altered flows, detrimental effects can
be felt at the estuaries (e.g. Dunne and Ongwenyi, 1976; Kitheka et al., 2004a; Turpie, 2006;) Natural
phenomena such as climatic extremes (violent rainfall) coupled with slash-and-burn practices to clear
land for grazing is a common cause of wide-scale soil erosion. An example is the western sedimentary
zone of Madagascar, with resulting dramatic increases in sediment load in affected rivers. Salomon
(1987) measured the average rate of specific degradation of south-western Malagasy river basins
reporting 3,000 tonnes/km2/yr, a value significantly higher than those of other major rivers.
Sediment load alterations can be found to some degree in several rivers in the WIO region (see Table
4-22), be they transboundary rivers or rivers flowing in only one country. However, as described
above, the impact of sediment load alterations on the marine environment emerges as a problem only
for the following five river basins:
· Athi-Sabaki (increase)
· Zambezi (decrease)
· Incomati (decrease)
· Tana (decrease)
· Betsiboka (increase).
Changes in sediment loads have been observed for some of the other basins in this study, with no
negative impact on the marine environment, but no conclusive studies exist to confirm these
observations. Where rivers are shared between countries, the factors causing sediment load alterations
usually occur in all countries with poor land use practices that lead to erosion being a typical example.
Effectively addressing transboundary environmental problems such as sediment load alterations would
significantly benefit from harmonised legislation and institutional frameworks.
In the case of sediment load reductions as a result of river impoundment dams being a major
contributor to sediment flow reduction the effects occur downstream of the dam, hence making
downstream countries more vulnerable to the impacts. However, under the SADC Protocol on Shared
Watercourses (relevant to all continental WIO countries except Kenya) major infrastructure
development requires notification of the other riparian states as well as data and information exchange.
The implementation of major water infrastructure development thus needs to be on the basis of
transboundary cooperation.
Root-cause analysis
It becomes clear from the range of potential impacts that alteration of sediment loads in rivers can
trigger negative impacts both when levels drop too low and when they are too high as shown in the
problem trees of Figure 4-19 and Figure 4-20 for increases and decreases in sediment loads from
rivers, respectively. In the context of assessing the impact of sediment load alterations on the marine
environment it is thus not accurate to draw generic conclusions from the occurrence of contributing
factors in a river basin. Instead, the exact combination of factors and specific location of activities
resulting in sediment load alterations need to be assessed on a case by case basis. It needs to be
emphasised that for most rivers assessed in this study the data is very limited and often outdated. More
detailed studies are required in order to determine likely impacts and to what extent the respective
rivers are affected.
86
Physical Alteration and Destruction of Habitats
Marine Pollution
Impacts on coastal habitats and shorelines
Impacts on water quality
· Shoreline change due to erosion
· PADH through the decrease in size of freshwater portion of deltas and estuaries
IMPACTS AND
· Destruction of mangroves and sea-grass beds
CONSEQUENCES
· PADH through the reduction of mudflats suited to prawn gestation
Decrease in Sediment load at the Coast
S
Agriculture &
S AND
Energy
Urbanisation
Mining
R
Forestry
Production
Transportation
· Dams constructed for
· Dams and IBTs to
·
supply large-scale mines
Dams constructed for
· Hydro-power dams
· Canalisation and
urban water supply
irrigation water supply
constructed
impoundment of river
trap sediments and
reduce stream-flow
· Water-supply dams for
reaches for navigation
ED CAUSE
cooling of thermal
purposes
power plants
ASSOCIAT
UNDERLYING SECTO
Root Causes
Climate change and
Economic
Population
Poverty &
Inappropriate
Inadequate knowledge
Inadequate financial
natural processes
drivers
pressure
inequality
governance
and awareness
resources
· Figure 4-19 Problem tree decrease in sediments.
87
Physical Alteration and Destruction of Habitats
Marine Pollution
Impacts on coastal habitats and shorelines
Impacts on water quality
·
·
Shoreline change due to accretion
Suspended solids increased
·
·
Eutrophication through reduced photosynthetic capacity of flora
PADH through increased deposition of solids
IMPACTS AND
CONSEQUENCES
· Coral reef degradation
Increase in Sediment Loads at the Coast
S
Agriculture &
S AND
Tourism
Urbanisation
Mining
R
Transportation
Forestry
·
· Digging-up of river
Clearance of land for
· Draining and
·
banks for sand for
Clearance of natural
tourism developments
· Badly constructed or
destruction of wetlands
maintained earth road
building
vegetation
·
reducing runoff
Reduced absorptive
cause erosion
retention
·
· Small-scale gold panning
Overgrazing of
capacity of land
ED CAUSE
· Hillside destabilisation
rangelands
· Unregulated land-use
during road construction
· Tillage practises leading
to erosion
· Charcoal production
ASSOCIAT
UNDERLYING SECTO
Root Causes
Climate change and
Economic
Population
Poverty &
Inappropriate
Inadequate knowledge
Inadequate financial
natural processes
drivers
pressure
inequality
governance
and awareness
resources
· Figure 4-20 Problem tree increase in sediments.
88
· Table 4-25 Overview of the key problems, impacts and direct causes related to alteration of sediment loads in the main river basins of WIO region.
Hot-spot basins are highlighted in red:
KEY PROBLEM
River Basin
COASTAL IMPACTS
DIRECT CAUSES
Increase
Decrease
sediments
sediment
Erosion of the Tana delta and the Ungwana Bay coastline leading
Damming of river for hydropower generation
to loss of biodiversity (NB. the sediment load has dropped from Direct abstraction (weirs) for irrigated agriculture
12 x 106 tons.yr-1 to about 6.8 x 10⁶ tons.yr-1 (cf. Ongwenyi, 1979;
1983; Otieno and Maingi, 1983; Dunne, 1974; Dunne and
Ongwenyi, 1976; Kitheka et al., 2004d).
Tana
X
Reduced spatial extent of mangrove forests and associated impacts
on coastal fisheries and biodiversity.
Changes in the morphology of the Tana Delta and associated
estuaries.
Increased turbidity of water impacting on the productivity and
fisheries of Ungwana Bay.
Siltation of Malindi Bay limiting the use of port facilities such as
Poor land use - increased cultivation and livestock
jetties.
grazing.
Deposition of sedimentary matter (and debris) on beaches thus Deforestation
reducing the aesthetic and recreational values of Malindi Bay Rural roads and other constructions
beaches.
Urban development
Increased turbidity of water impacting on the productivity and Hydrological variability
Athi-Sabaki
X fisheries of Malindi Bay.
Degradation of the coral reefs sea-grass beds off the shoreline and
in particular at Malindi Marine National Park (van Katwijk et al.,
1993; Fleitmann et al., 2007;, Snoussi et al., 2004; Kitheka et al.,
2004a).
Accretion creating new grounds for colonisation by mangroves and
other coastal vegetation.
Increased water turbidity that impacts on the productivity of the Poor land use increased cultivation
coastal waters.-excess phytoplankton concentrations (Akitanda and
Encroachment on river banks
Pangani
X PBWO/IUCN, 2007).
Deforestation
Changes in the morphology of the Pangani Estuary due to Rural roads and other constructions
89
KEY PROBLEM
River Basin
COASTAL IMPACTS
DIRECT CAUSES
Increase
Decrease
sediments
sediment
increased scouring of the channel.
Sand mining
No major changes in sediment loads at the mouth mentioned in the
No major changes in sediment loads at the mouth
Rufiji
--- ---
literature consulted
mentioned in the literature consulted
No major changes in sediment loads at the mouth mentioned in the
No major changes in sediment loads at the mouth
Rovuma
--- --- literature consulted
mentioned in the literature consulted
Reduction of nutrients supply to Sofala Banks leading to reduced
Damming of river (to supply water for hydropower
productivity and reduced fisheries.
generation and irrigated agriculture)
Zambezi
X
Erosion of the delta and the coastline leading to loss of valuable
land and biodiversity.
Loss of mangrove forests at the Zambezi delta
Increased coastal erosion leading to loss of land and valuable Water transfer out of the basin
biodiversity.
Direct abstraction for agriculture and urban water
Pungue
X
supply
Exotic forest plantations consuming more water
No sediment studies in the estuary have been carried out No sediment studies in the estuary have been
Limpopo
--- --- increased erosion in the headwaters is countered by dams (Louw
carried out increased erosion in the headwaters is
and Gichuki, 2003)
countered by dams (Louw and Gichuki, 2003)
Reduced fish and shrimp catch (Hoguane, 2008; Van der Zaag and
Damming of river(TPTC, 2001)
Carmo Vaz, 2003)
Landuse change increased agriculture and other
Incomati
X
See the summary prepared by Hoguane
rural activities such as charcoal production
Climate change
No major changes mentioned in the literature consulted
No major changes in sediment loads at the mouth
Maputo
--- ---
mentioned in the literature consulted
The decrease in flood peaks from natural to present day conditions
Damming of river; inter-basin transfers (DWAF,
Thukela
X
is estimated at 8% and the impact of the reduced sediment on the
2004a)
estuary is minimal (DWAF, 2004).
Siltation of Mahajanga Bay hindering the shipment activities
Poor land use leading to the degradation of the
Confinement of the Bay leading it to shift into lagoon system
Betsiboka
X
basin
(Autrand , 1997)
Irregular intense rainfall
Weak development of coral reef around (Maharavo, 2003)
90
KEY PROBLEM
River Basin
COASTAL IMPACTS
DIRECT CAUSES
Increase
Decrease
sediments
sediment
Red-coloured water up to few miles of the coast
Siltation at the delta
Poor land use leading to the degradation of basin
Tsiribihina
X
Irregular intense rainfall
Siltation of rice growing field
Poor land use leading to the degradation of basin
Mangoky
X
Siltation of the delta
and agriculture
Irregular intense rainfall
Subsurface flow due to accumulation of sand and silt in the river
Poor land use, agriculture and rush mining
Fiherenana
X bed (Aldegheri, 1967)
Siltation affecting the Great reef barrier in the Toliara Bay
91
Several sectors contribute to changes in sediment load in the basins in the region. For the
basins with documented evidence for sediment load changes (e.g. Athi-Sabaki, Zambezi,
Incomati, and Betsiboka) the main underlying sectors causing these changes include:
· Agriculture and Forestry
· Urbanisation
· Transport
· Energy Production
· Industry
Risks/uncertainties and trends
One of the prime challenges faced is the general lack of reliable, long-term hydrological data.
For most of the basins in the study there was less data available on sediments (rates, fluxes,
variation, etc.) than on water flow. The future dams planned for the region will certainly have
a noticeable impact on the amount of sediment reaching the ocean from these rivers. Without
a good long-term understanding of sediment transport dynamics it will not be possible to
develop and implement mitigatory strategies for such dams.
4.4.4 Stakeholder analysis
There are important differences between stakeholders involved in the various problem
categories, for example, between stakeholders causing water quality degeneration and those
causing flow alteration or sediment flux. Also, the nature of the problems related to the
different river basins differs considerably. An obvious example of this is the difference
between rivers with large dams, such as Tana, Pangani, Zambezi, Incomati and Thukela, and
those without. For this reason, the stakeholder analysis presented in this section warrants a
case-by-case scrutiny.
As the region is still heavily reliant on farming as a principle economic activity, the bulk of
stakeholders causing as well as being impacted by flow alteration and water quality issues
derive from this sector and include small-scale farmers, large-scale farmers, pastoralists and
loggers. However, in several of the basins, the actions of light manufacturing industries as
well as hydro-dam operators are having an increasing impact. Most impacted by upstream
activities are the artisanal and industrial fishers. Table 4-26 provides a tabular overview of the
main sectors and stakeholder groups causing flow alterations and degeneration of water
quality, as well as of sectors negatively affected by such issues.
The sectors mostly responsible for causing impacts from sediment flux alterations, as well as
the most affected by the impacts are agriculture and forestry. On the whole the impacts which
they cause are due to many and diffuse activities small dams, run-off and erosion from
fields. While these collectively represent substantial impacts, the largest impacts are caused
by the hydro-dam operators due to trapping of sediments behind reservoir walls. Artisanal
fishers and coastal communities tend to be most negatively impacted by the upstream
activities. Table 4-27 provides a tabular overview of the main sectors and stakeholder groups
causing sediment load alterations and those negatively affected by it.
92
· Table 4-26 Analysis of sectors and stakeholder groups causing river flow alteration and degeneration of water quality, as well as those impacted by such
Hot-spot basins are highlighted in red:
River basin
Key Problem
Stakeholder groups
Energy
Agriculture and Forestry
Mining
Industry
Fisheries
Production
Urbani
s
ation
Transport
s
ow
g
fl
ity
ts
iner
nin
on
ers
on of
ggers
h
ers
hers
ies
c
a
le
c
a
le
is
c
a
le
u
r
i
n
g
n
of
ati
ual
t
r
y
tati
tal
l-s
l-s
gers
a
l mi
h
t
ators
ators
l fis
a
l fis
ann
unit
tio
e
-s
toral
a
l Lo
c
a
le m
f
a
ct
us
u
s
t
ries
farmers
farmers
log
tri
tri
Lig
dro-dam
tri
Ports
l-s
ind
oper
oper
ana
Roads
Coas
water q
Smal
Larg
Pas
Smal
a
nu
ind
Hy
Comm
Altera
Degrad
m
Power s
Indus
Town Pl
Smal
Indus
Agro-processing
Artis
Indus
Tana
X
X
C I C
C I
C
C
I
Athi-
X
X
I C I C
C
I C
C I
Sabaki
Pangani
X
X
C I C
C
C
I C
I
Rufiji
X
C
I I
Rovuma
Zambezi
X
C I C
C
I I I
Pungue
X
C C
C
C
I C
Limpopo
X
C I C I C
C
C
C
I C
Incomati
X
C I C I C
C
C
C
C
I I C I I
Maputo
X
C
C
C
I I C
Thukela
X
X
C C
C
C
C
C
Betsiboka
X
C C
C
I I I I
Tsiribihina
C C
C
I I
Mangoky
C C
C
I
Fihere'ana
X
C C
C
C
I I I
C = Cause and. I = Impact
Where both "C" and "I" are present indication is of cause and impact applicable in different parts of the basin
93
· Table 4-27 Analysis of sectors and stakeholder groups causing sediment flux alteration from river basins as well as those impacted by such
Hot-spot basins highlighted in red:
River basin
Key Problem
Stakeholder groups
Energy
Agriculture and Forestry
Mining
Industry
Fisheries
a
ti
Production
Urba
nis
on
Transport
se
s
g
t
e
ts
iner
nin
on
h
ers
hers
ers
ies
c
a
le
is
ggers
u
r
i
n
g
ts
I
n
crea
c
a
le
c
a
le
t
r
y
tal
men
tati
ann
reas
l-s
h
t
l fis
e
-s
l-s
gers
a
l mi
us
ators
ators
a
l fis
unit
e
nt
toral
a
l Lo
c
a
le m
tri
Lig
f
a
ct
u
s
t
ries
dro-dam
tri
Ports
Sedi
dec
farmers
farmers
log
tri
l-s
ind
Roads
ind
oper
oper
ana
Touris
Coas
d
i
m
Smal
Larg
Pas
Smal
a
nu
Hy
m
Power s
Town Pl
Comm
Se
Indus
Smal
Indus
Agro-processing
Artis
Indus
Tana
X
I C
C I
Athi-
X
C I C
C I C
C
I C
I C
I I
Sabaki
Pangani
X
C C
C
C
C
C
I I I C
I
Rufiji
---
---
Rovuma
---
---
Zambezi
X
I C
C I I
I
Pungue
X
C C
C
C
I C
Limpopo
---
---
Incomati
X
C C
C
C
C I I
I I
Maputo
---
---
Thukela
X
C C
C
C
C C
Betsiboka
X
C C
C
I I I I I
Tsiribihina
X
C C
C
I I
Mangoky
X
C I C
C
Fiherenan
X
C C
C
C
I I I I
a
C = Cause and. I = Impact
Where both "C" and "I" are present indication is of cause and impact applicable in different parts of the basin
94

UNEP-GEF WIO-LaB Project
Addressing Land Based Activities in the Western Indian Ocean
Annex 1
Overview of sectors, stakeholder groups and governing institutions
involved in LBSA Management
Sectors
Stakeholder groups
Governing
institutions
Fisheries (including aquaculture)
Artisanal fishers
Fisheries dept.
Industrial fishers
Seaweed farmers
Environment dept.
Industrial prawn farmers
Conservation dept.
Fish and shellfish farmers
Agriculture and forestry
Charcoal makers
Environment dept.
Small-scale loggers
Agriculture dept.
Industrial loggers
Forestry dept.
Small-scale farmers
Conservation dept.
Large-scale farmers
Livestock dept.
Pastoralists
Ranchers
Poultry farmers
Dairy farmers
Beekeepers
Tourism
Tourists
Tourism dept.
Hotel owners and operators
Infrastructure dept.
Small-scale traders
Tourist boat and SCUBA
operators
Mining
Coral/lime miners
Minerals dept.
Sand miners
Energy dept.
Small-scale salt producers
Infrastructure dept.
Industrial salt works
Small-scale miners
Industrial mining companies
Fuel suppliers and stations
Oil and gas production
Industry
Heavy manufacturing industry
Infrastructure dept.
Light manufacturing industry
Agro-processing industries
Oil refining
Transportation
Ports
Harbour dept.
Dredging companies
Infrastructure dept.
Clearing and forwarding
Transport dept.
Railway
Water mngmt dept.
Roads
Airports
Airlines
Shipping
Energy production
Hydro-dam operators
Infrastructure dept.
Power station operators
Energy dept.
Renewable energy producers
Urbanisation and Coastal
Solid waste operators
Local authorities
Development
Sewage managers
Infrastructure dept.
Property developers
Town planners
Coastal community
UNEP-GEF WIO-LaB Project
95

United Nations
Global Environment
Environment Programme
Facility
Transboundary Diagnostic Analysis of Land-
based Sources and Activities in the Western
Indian Ocean Region
CHAPTER 5 GOVERNANCE ANALYSIS
Draft
November 2008
Table of contents
5.1
Introduction and overview........................................................................................................3
5.1.1 Background ............................................................................................................................ 3
5.1.2 `Governance' and `government' in the context of land-based marine pollution.................... 4
5.2
Governance analysis of main problems and issues .................................................................5
5.2.1 Overview of governance issues related to the three TDA problem areas .............................. 5
5.2.2 Stakeholders involved in LBSA Governance ......................................................................... 10
5.3
International and regional governance frameworks and institutions.................................12
5.3.1 International and regional conventions ............................................................................... 12
5.3.2 Soft Laws and related developments .................................................................................... 17
5.3.3 Regional Economic Integration Agreements........................................................................ 19
5.3.4 International and Regional Institutions ............................................................................... 23
5.3.5 Intergovernmental Agreements ............................................................................................ 25
5.3.6 River-basin Governance frameworks................................................................................... 27
5.4
National governance frameworks ..........................................................................................33
5.4.1 Legal and policy frameworks ............................................................................................... 33
5.4.2 National institutional frameworks........................................................................................ 37
5.5
The role of civil society............................................................................................................40
5.5.1 International and regional Civil Society Organisations ...................................................... 41
5.5.2 National civil society organisations..................................................................................... 43
5.6
Financial mechanisms .............................................................................................................44
5.6.1 International and regional context....................................................................................... 44
5.6.2 National context ................................................................................................................... 45
5.7
Education and public awareness ............................................................................................47
5.8
Conclusions ..............................................................................................................................49
2
5.1
Introduction and overview
5.1.1 Background
The focus in this chapter is on governance in the WIO region in so far as it relates to the management
and protection of the marine environment from land-based sources and activities. More specifically,
the issues dealt with in this regard are:
International and regional governance frameworks and institution;
National policy, legal and institutional frameworks;
The role of civil society;
Financial mechanisms; and,
Education and public awareness.
The bio-physical character of the region is described extensively elsewhere in this report (Chapter 2).
Here it is pertinent to simply note that politically the region comprises ten states, of which five are
mainland states and five are island states, a factor which is relevant to governance in that marine and
coastal area management is generally better developed on the islands.
The ten countries have, from an ecosystem, historical and economic perspective formed more or less a
cohesive geopolitical area, since the mid-1990's becoming known as the Western Indian Ocean
(WIO) region. In recognition of the uniqueness of the coastal and marine environment of the region,
the threats it faces, and the necessity for remedial and/or pre-emptive action, the countries of the
WIO region adopted the 1985 Nairobi Convention for the Protection, Management and Development
of the Marine and Coastal Environment of the Eastern African Region and its two protocols on
Protected Areas and Wild Fauna and Flora (SPAW Protocol) and the Protocol concerning Cooperation
in Combating Marine Pollution in Cases of Emergency. The Nairobi Convention is one of a dozen or so
regional seas initiatives promoted under UNEPs Regional Seas Programme and provides a useful point
of departure to examine the governance regime in the region.
However, increasing threats and evidence of mounting coastal and marine degradation necessitates re-
visiting various aspects of the region, including governance. This is done in this chapter with a view
to identifying the causes of coastal and marine environmental degradation from a governance
standpoint and identifying key governance issues with a view to planning and recommending action
for optimizing governance in the region. As such, this chapter straddles international, regional and
national laws, policies and institutions with the overall purpose of generally understanding the role of
governance in better managing and regulating the marine and coastal environment in the WIO region.
A particular strength of the Nairobi Convention, with strong relevance to the WIO region, is that all
ten countries referred to above are parties to it. The Nairobi Convention and its protocols are
described in more detail in section 5.3.1. In that section, reference is also made to a third draft
protocol which is currently being developed and which will deal specifically with issues related to the
protection of the marine and coastal environment from land-based sources and activities.
The process leading up to compiling this governance analysis has been as follows:
· The foundation for governance analysis was laid by the Regional Assessment of Policy, Legal
and Institutional Frameworks as well as the Status of Ratification of International
Conventions related to Protection of the Marine and Coastal Environment from Land-based
Sources and Activities, which was undertaken by a team of national and regional experts
under the overall guidance of the Regional Legal and Technical Review Task Force
3
established under the Nairobi Convention. The Regional Synthesis Reports resulting from this
exercise (UNEP, 2008a; UNEP, 2008b) form the main basis for this governance analysis.
· Further analysis of the situation in the region was undertaken during the Third meeting of the
Legal and Technical Review Task Force (Zanzibar, 31 January 2 February, 2007) during
which the Task Force identified and highlighted key shortcomings and gaps related to
national and regional policy, as well as legal and institutional frameworks for land-based
marine pollution management.
· Subsequently, the First Regional TDA/SAP Stakeholders Workshop (Nairobi, 17-19 April,
2007) identified governance as a key crossing-cutting issue in each of the three problems
areas dealt with in Chapter 4. During the further course of the TDA development, the analyses
presented in this chapter of the TDA were further examined and discussed.
5.1.2 `Governance' and `government' in the context of land-based marine pollution
A broad spectrum of governance approaches is evident among Eastern and Southern African coastal
nations and island states. Like governance systems in sub-Saharan Africa as a whole, these vary or
have varied in a historical perspective from authoritarian regimes on the one hand to successful
democracies on the other. Some systems retain remnants from colonial governance processes,
particularly with respect to legal systems, institutional frameworks and language. Thus, while much of
eastern Africa is English-speaking, the official language of Mozambique is Portuguese and several of
the island nations in the southwest Indian Ocean are French-speaking. A general feature is, however,
that present governance institutions invariably reflect ties to former colonial powers.
For the purposes of this report it should be noted that the term `governance', has a meaning very
distinct to `government'. Government denotes the formal legal institutions of the state, including, in
particular, formal political authority and leadership structures. In terms of classical constitutional
separation of powers, it means the executive arm of the state, that is, the political, socio-economic and
administrative management of public affairs. As such it encompasses the mechanisms, processes and
institutions through which citizens and groups articulate their various interests, mediate their
differences and exercise their legal rights and obligations (UNDP, 1997, 2003).
In contrast, governance is much broader and includes, in meaning and scope, the exercise of political
authority and control over society and how that affects the management of a country's economic and
social resources for development (Landell-Mills and Serageldin, 1993; cited in UNDP, 2003).
Governance usually broadly brings together all development and other players or stakeholders in
society and emphasizes shared or collective responsibility in ensuring overall well-being of the
society in question.
Governance is defined as the process of informed decision making that enables trade-offs between
competing users of a given resource so as to balance protection with beneficial use in such a way as to
mitigate conflict, enhance equity, ensure sustainability and hold officials accountable (Turton et al.,
2007).
Governance, thus entails the institutional capacity of public organizations (not limited to formal
government) to furnish public and other goods and services to the citizens in an effective, transparent,
impartial and accountable manner (subject to resource constraints), thus intertwining both political
and economic governance (World Bank, 2000; UNDP, 2003). As such, governance provides an
enabling environment for development and eradication of poverty and deprivation, and has qualities
such as protection of property rights, equitable development and accountability (UNDP, 2000; 2003).
Governance plays out at various levels and in respect of varying parties including both the formal
government sphere and civil society. In this context, governance loosely comprises of a hybrid of
international and national laws and policies as well as the institutions and actors both in government
and in civil society which make them work, or not, in some cases. Thus, in the national government
sphere, the point of departure for international governance are the various international conventions
4
and related institutions outlined under Section 5.3 below, presenting a review of relevant international
and regional governance frameworks and institutions.
5.2
Governance analysis of main problems and issues
This section identifies, analyses and describes the governance-related issues of the three main
problem areas related to the degradation of the coastal and marine environment described in Chapter
4. These are:
1. Problem area 1: Water and sediment quality degeneration due to pollution from land-based
sources;
2. Problem area 2: Physical alteration and destruction of habitats (PADH); and
3. Problem area 3: Alteration of freshwater flow, quality and sediment loads.
5.2.1 Overview of governance issues related to the three TDA problem areas
A number of governance-related issues in respect of each of the three key problem areas, as presented
in Chapter 4, are summarised in this section. It must be realized, however, that in some cases the
issues raised are generalizations because not every issue is applicable to all countries in the region1.
Furthermore, it should also be noted that it is possible to further fine-tune the various aspects up to the
level of the management of individual sources and activities, which raises a whole new spectrum of
governance issues. An example of such is presented in Box 5.1 below. Rather than going into such
level of detail, however, this chapter seeks to identify the main governance issues related to the
problem areas2. Within the same context, it should also be noted that the list of issues identified in this
chapter may not be complete due to the large variety of issues specific to the various levels in the
governance framework for LBSA management.
Box 5.1 Example of detailed governance at the activity level
In the case of sources of marine pollution, a direct cause of coastal water quality degradation could be
attributed to mining activities. From a governance perspective this would trigger analysis of any number of
possible legal, policy and institutional causes from local to international level, raising the following potential
queries: At the local level, is there a water quality emission standard which is included in the mining license?
At national level, is there a water law providing for the setting of standards, if so are the necessary
institutional frameworks in place and is it working adequately and if not, why not? Is there the necessary
human and resource capacity to enforce this standard and/or law? Does the mining law require coastal water
quality considerations to be taken into account in granting an upstream mining authorization? At regional
level, is there a legal obligation to set coastal water quality targets; similarly at international level? What does
international law, for example the UN Convention on Law of the Sea, state in this regard and how is this
implemented at national level? What is the role of international institutions through to local community
organizations with regard to this one particular problem area?
An analysis of governance issues related to problem area 1: Water and sediment quality degeneration
due to pollution from land-based sources is presented in Table 5-1. The key issues in this regard relate
to the policy, legal and institutional frameworks in place for controlling the discharge of pollutants to
the environment.
1 Where such is the case, the term `partial' is used in the analysis presented in this section.
2 Which may serve, among others, as a basis for more detailed localized analysis within the context of the
relevant national governance processes, e.g. National Programmes of Action on Land-based Activities,
Integrated Coastal Zone Management, National Environmental Management Plans.
5
Table 5-1 Governance issues related to the degeneration of water and sediment quality due to pollution
from land-based sources.
Category
Regional/international governance
National governance
Legal
· Absence of a regional agreement with
· Partial absence of national effluent
framework
regard to the management of land-based
standards
sources of pollution
· Partial absence of national water quality
· Absence of a regional agreement for
objectives and target values
maintaining minimum coastal water quality · Fragmented (sectoral as opposed to
targets
integrated) legislation
· Absence of a regional agreement for
· National legislation not adequately aligned
transboundary EIA/SEA, including
with international and regional obligations
reporting procedures
·
· Poor/lack of enforcement of legislation
Shortcomings in the adoption and
ratification of key LBSA-related
· Lack of adequate dispute resolution
conventions, including the Nairobi
procedures
Convention
· Weak integration of regional inter-
governmental agreements (including
economic treaties)
Institutional
· Absence of a regional `champion'
· Restricted capacity of national institutions
framework
providing oversight on land-based sources
responsible for regulating and controlling
of pollution management
discharges of land-based sources
· Shortcomings in collaboration and
· Partial absence of national water quality
coordination between regional institutions
monitoring programmes
· Absence of adequate regional financial
· Inadequate cooperation between and
mechanisms
conflicting mandates of national institutions
· Inadequate data for sustainable
charged with various aspects of LBA
management
management
· Partial absence of a register of industries
and wastewater treatment facilities
· Insufficient public and private sector
involvement
· Lack of human resources and technical
capacity for managing, monitoring and
enforcement
· Lack of adequate financial mechanisms and
resources
Policy
· Absence of coherent regional policies and
· Absence of coherent national policies and
framework
strategies for land-based sources of
strategies for land-based sources of
pollution management
pollution management
· Limited awareness and understanding with
· Low priority afforded to LBSA-related
regard to the importance of management of
issues at political level
land-based sources of pollution, especially
in political sphere
· Low priority afforded to LBSA-related
issues at political level
6
The governance issues raised in the PADH analysis (Chapter 4), relate to problems associated with
the marine artisanal fisheries resource; mangrove forest, seagrass bed, coral reef and coastal forest
degradation; and shoreline changes. The relevant governance issues identified in section 4.3 are
summarized in Table 5-2.
Table 5-2 Governance issues related to physical alteration and destruction of habitats (PADH)
Category
Regional/international governance
National governance
Legal
· Non- or only partial implementation of
· Inappropriate and incomplete national
framework
Nairobi Convention and its Protocols
legislation for dealing with PADH
· Shortcomings in the adoption and
· Fragmented (sectoral as opposed to
ratification of key LBSA-related
integrated) legislation
conventions, including the Nairobi
· National legislation often not aligned
Convention
with international and regional
· Weak integration of regional inter-
obligations
governmental agreements (including
· Poor/lack of enforcement of legislation
economic treaties)
· Lack of adequate dispute resolution
procedures
Institutional
· Absence of a regional `champion'
· Lack of human resources and technical
framework
providing oversight on critical habitat
capacity for natural resource
management
management
· Shortcomings in collaboration and
· Lack of human resources and technical
coordination between regional
capacity for managing, monitoring and
institutions
enforcement
· Absence of adequate regional financial · Inadequate cooperation and conflicting
mechanisms
mandates of national institutions charged
· Inadequate data for sustainable
with various aspects of LBA management
management
· Limited involvement of stakeholders in
· Inadequate capacity to assess ecosystem
resource use planning and management
health
· Lack of adequate financial mechanisms
and resources
Policy
· Absence of coherent regional policies and · Lack of understanding of the values of
framework
strategies for habitat management
ecosystem services at policy-maker level
· Limited awareness and understanding
· Absence of coherent national policies and
with regard to the importance of
strategies for habitat and biodiversity
management of critical coastal habitats,
management
especially in political sphere
· Low priority afforded to LBSA-related
· Low priority afforded to LBSA-related
issues at political level
issues at political level
The governance issues raised related to river-coast interaction (Chapter 4), relate to problems
associated with the interaction between river basins and the coastal and marine environment. It
highlights alteration and/or modifications of freshwater flows, alteration and/or modifications of
sediment loads and water quality/pollution. The governance issues identified in section 4.4 are
summarized in Table 5-3.
7
Table 5-3: Governance issues related to alteration of river flows and sediment loads.
Category
Regional/international governance
National governance
Legal
· Lack of harmonised legal frameworks
· Lack of a coherent legal framework for
framework
(including inter-governmental
the governance of river basins
agreements) for the management of
· Lack of a legal framework for inter-state
transboundary water resources/rivers
collaboration
· Shortcomings in the implementation of
· National legislation often not aligned
inter-governmental agreement for river
with international and regional
basin management
obligations
· Poor/lack of enforcement of legislation
· Lack of adequate dispute resolution
procedures
Institutional
· Limited financial and human resource
· Limited involvement of stakeholders in
framework
capacity for effective implementation of
resource use planning and management
agreements and comprehensive water
· Lack of awareness of stakeholders of the
resources management regimes
impact of their activities on other
· Lack of inter-sectoral water governance,
stakeholders and the ecosystem as a
i.e. involvement of different water use
whole in particular marine and coastal
sectors in the management of the resource
environments
· Lack of information on and data of the
· Inadequate cooperation and conflicting
nature, causes and impacts of water
mandates of national institutions charged
resources utilization, particularly on the
with various aspects of water resources
marine and coastal environments
management
· Lack of human resources and technical
capacity for integrated river basin and
coastal area management
· Lack of adequate financial mechanisms
and resources
Policy
· Lack of adequate integrated regional
· Limited awareness and understanding
framework
water resource management policies to
with regard to the importance of
address increased demands for limited
management of river basins
water resources
· Absence of coherent national policies and
· Low priority afforded to LBSA-related
strategies for river basin management
issues at political level
· Low priority afforded to LBSA-related
issues at political level
The above-presented analysis illustrates that that there are a number of common denominators
regarding weaknesses in the existing governance structures related to the three problem areas. In all
three problem areas there is a general shortcoming in the available legislative frameworks, with laws
and regulations weak, incoherent or not existing at all, or not being implemented and/or enforced
(both at the national and regional level in the form of intergovernmental agreements). This
weakness is closely linked to weaknesses in the institutional framework, which highlight issues of
human resources and technical capacity as well as financial mechanisms. Weak coordination between
various government institutions involved in LBSA management, as well as limited stakeholder
involvement (including private sector) are other general issues of concern in this regard. Finally, at the
8
policy level, the main issue seems to pertain to a lack of coherence in policies, which is often sector-
based rather than integrated, as well as a general lack of awareness and recognition of the (economic)
values of coastal and marine resources at the level of policy makers as well as the wider public, which
leads to low priority afforded to LBSA-related issues at political level. Table 5-4 presents a summary
of such common weaknesses in LBSA governance.
Table 5-4 Common weaknesses in LBSA Governance.
Category
Regional/international governance
National governance
Legal
· Absence and/or shortcomings in regional
· Absence and/or shortcoming in national
framework
inter-governmental agreements.
legal and regulatory frameworks
· Shortcomings in the ratification and
· Fragmented (sectoral as opposed to
implementation of inter-governmental
integrated) legislation
agreements
· Poor/lack of enforcement of legislation
Institutional
· Absence of a regional `champion'
· Restricted capacity of national
framework
providing oversight on LBA Governance
institutions
· Shortcomings in collaboration and
· Inadequate cooperation and conflicting
coordination between regional
mandates of national institutions
institutions
· Insufficient stakeholder (including
· Lack of adequate regional financial
private sector) involvement
mechanisms
· Lack of adequate financial mechanisms
and resources
Policy
· Absence of coherent regional policies and · Absence of coherent national policies and
framework
strategies
strategies
· Lack of awareness and recognition of the
· Lack of awareness and recognition of the
(economic) values of coastal and marine
(economic) values of coastal and marine
resources at the level of policy makers
resources at the level of policy makers
The challenge is then to identify the specific aspects that are the basis of such `weak governance.
More specifically, to flesh out and examine the root causes of weak governance in the WIO in the
context of the legal and institutional frameworks regulating land-based marine pollution against the
backdrop of the above three inter-related problem areas.
A number of key issues are identified (see Box 5.2), yet this list, while summarising the common
governance-related root causes for poor performance, may obviously differ from country to country.
Box 5.2 Summary of common governance-related problem areas.
1. Lack of awareness, understanding and appreciation of economic value of coastal-marine ecosystem
goods and services at the level of policy-makers and legislators
2. Lack of mechanisms for effective coordination and inter-sectoral governance3
3. Lack of scientific and socio-economic data and information to support policy making and monitoring
and enforcement
4. Inadequate financial mechanisms and resources for dealing with LBSA-related issues
5. Implementation/enforcement of legislation not effectively monitored and legal instruments not
systematically updated
6. Insufficient public and stakeholder involvement and awareness
7. Inadequate human resources and technical capacity in institutions dealing with LBSA-related issues
8. Lack of oversight resulting in corruption
3 Including the use of management tools such as ICZM policies and plans, Environmental Impact Assessment
(EIA) and Strategic Environmental Assessment (SEA)
9
Addressing the many issues related to the governance of LBSA management is severely complicated
by the large number of players/stakeholders involved. This is especially relevant at the national level,
which, coupled with the above-mentioned lack of adequate mechanisms for effective coordination and
inter-sectoral governance, often results in incoherent and inefficient management approaches.
Stakeholder involvement in LBSA Governance is therefore a key cross-cutting issue. For this reason,
a separate analysis of stakeholders involved in LBSA Management, focusing on the national level, is
presented in the following section.
5.2.2 Stakeholders involved in LBSA Governance
Obviously there are many factors involved, and depending on the situation, one aspect might be more
important than others. After considering both direct and root causes, the national and synthesis reports
identified and described the respective constitutional structures, laws, policies and institutions in eight
WIO countries and identified eight sectors as being central to combating the degradation of the coastal
and marine environment in the WIO Region. An overview of these sectors, as well as the respective
governing institutions, is presented in Table 5-5.
Each of the sectors shown has a broad array of laws, institutions and policy aspects pertaining to them
either directly or indirectly.
At national level, the exact government structures (institutions responsible) for the various sectoral
topics may vary from country, although generally they are as indicated in the third column of Table 5-
5. Whatever the exact names of the institutions involved, however, from a governance perspective
these sectors are all central to combating coastal degradation associated with land-based activities
and/or sources in the region. A further perspective on the existing national policy, legal and
institutional frameworks is presented in section 5.4.
Furthermore, at the regional level there exists an array of institutions and organization involved in
issues related to the governance of LBSA. Also, there is a range of international and regional
agreements, conventions and programmes that are relevant in this regard. A further perspective on
such regional and international governance frameworks is presented in section 5.3.
In addition, there are community and civil society organizations, NGO's and related actors and
stakeholders involved with various facets of governance, not only at institutional level but in
developing polices and to some extent laws at national level. The role of civil society in LBSA
management is further described in section 5.5.
All in all, the number of stakeholders involved in LBSA management is extensive thus achieving
coordination and coherence in addressing LBSA-related issues is one of the main challenges of LBSA
governance. A good sign is that this important weakness is more and more acknowledged by policy
makers and many countries have or are embarking on integrated governance processes such as ICZM,
National Action Plans or the like. Also, the use of integrated management tools such as EIA and SEA
are becoming more and more embedded in national management frameworks. However, much still
remains to be done in order to lift such practices to an adequate level for efficient and effective LBSA
governance.
10
Table 5-5 Table of key sectors, stakeholder groups and governing institutions involved in LBSA
Management.
Sectors
Stakeholder groups
Governing department
Fisheries and aquaculture
Artisanal fishers
Fisheries
Industrial fishers
Seaweed farmers
Environment
Industrial prawn farmers
Conservation
Fish & shellfish farmers
Agriculture and forestry
Charcoal makers
Environment Agriculture
Small-scale loggers
Forestry
Industrial loggers
Small-scale farmers
Conservation,
Large-scale farmers
Natural Resource Management
Wildlife Management
Livestock
Pastoralists
Ranchers
Poultry farmers
Dairy farmers
Beekeepers
Tourism
Tourists
Tourism
Hotel owners & operators
Infrastructure
Small-scale traders
Wildlife
Tourist boat & SCUBA operators
Forestry
Mining
Coral/lime miners
Minerals
Sand miners
Energy
Small-scale salt producers
Infrastructure
Industrial salt works
Small-scale miners
Industrial mining companies
Fuel suppliers & stations
Oil & gas production
Industry
Heavy manufacturing industry
Infrastructure
Light manufacturing industry
Agro-processing industries
Oil refining
Transportation
Ports
Harbour
Dredging companies
Infrastructure
Clearing and forwarding
Transport
Railway
Water management
Roads
Airports
Airlines
Shipping
11
Sectors
Stakeholder groups
Governing department
Energy production
Hydro-dam operators
Infrastructure.
Power station operators
Energy
Renewable energy producers
Coastal development and urbanisation Solid waste operators
Local authorities
Sewage managers
Infrastructure
Property developers
Physical planning
Property owners
Environment
Town planners
Coastal community
5.3
International and regional governance frameworks and institutions
International and regional conventions, inter-governmental frameworks, agreements and institutions
are central to governance in the WIO region. Such initiatives are present across a broad range of
levels from regional economic integration units at the broadest level, to specific trans-boundary
commissions such as for example for the management of shared resources such as river basin
management authorities, to civil society organizations at the local level. Seven distinct classes of
relevant frameworks are described and assessed in the following sections.
5.3.1 International and regional conventions
A number of international and regional conventions, and the work of related institutions, are relevant
to meeting the increasing challenge posed by land-based sources and activities that cause pollution
and degradation of the marine environment in the WIO region. The two main international
conventions are United Nations Convention on the Law of the Sea and the Nairobi Convention
(introduced in section 5.1.1). These are described below, with brief details of other relevant
conventions. These must also be seen in the context of the broader array of relevant `soft laws',
which, together with the relevant institutions, provide an international and regional framework to help
protect and conserve the marine and coastal environment in the WIO region.
UN Convention on the Law of the Sea (UNCLOS)
The first concerted effort to regulate marine pollution generally and land-based marine pollution
specifically at the international level emerged with the adoption of the 1982 UN Convention on the
Law of the Sea (UNCLOS). Part XII (Articles. 192 to 237) of UNCLOS is devoted to "Protection and
Preservation of the Marine Environment". Of particular relevance are articles which impose an
obligation on states to protect and preserve the marine environment (Article 192); a duty imposed on
states to take measures that are necessary to prevent, reduce, and control of the marine environment
(Article 194) and specifically Article 207, headed "Pollution from Land-based Sources", which
obliges states to:
(1) ...adopt laws and regulations to prevent reduce, and control pollution of the marine environment from
land-based sources, including rivers, estuaries, pipelines, and outfall structures, taking into account
internationally agreed rules, standards and recommended practices and procedures
(2)...
(3) States shall endeavour to harmonise their policies in this connection at the appropriate regional level.
(4) States, acting especially through competent international organizations or diplomatic conference, shall
endeavour to establish global and regional rules, standards and recommended practices and procedures to
prevent, reduce, and control pollution of the marine environment from [?] land-based sources...
A further potentially relevant article is Article 198 entitled "Notification of imminent or actual
damage" because of its potential linkage to the Nairobi Convention Emergency Protocols. It states:
12
"When a State becomes aware of cases in which the marine environment is in imminent danger of
being damaged or has been damaged by pollution, it shall immediately notify other States it deems
likely to be affected by such damage, as well as the competent international organizations"
All ten countries that are parties to the Nairobi Convention are also parties to the 1982 UNCLOS.
UNCLOS however only sets the framework to encourage governments to address the impacts on the
marine environment from land-based sources and activities (LBSA) as its provisions are by their
nature framed in broad terms. Thus, further initiatives have been taken at international level to deal
with land-based sources specifically as now outlined.
13
UN Convention on the Law of the Non-Navigational Uses of International Watercourses 1997 (the
`International Watercourses Convention')
The International Watercourses Convention is particularly relevant to the five terrestrial WIO
countries given the aridity of the region and the likelihood that the problems associated with drought,
PADH and so on, are likely to be exacerbated by climate change. The Convention obliges watercourse
states to protect, preserve, and manage international watercourses and their waters (Art. 1(1)), and
specifically to protect and preserve watercourse ecosystems (Article 20). It defines `watercourse' as
"a system of surface waters and groundwaters constituting by virtue of their physical relationship a
unitary whole and normally flowing in a common terminus"; an `international watercourse' is defined
as "a watercourse, parts of which are situated in different states"(Articles 2(a) & (b)). Article 3 of the
Convention encourages the adoption of watercourse agreements at a regional level and to this end a
South African Development Community (SADC) Water Protocol, later a Revised Water Protocol,
was adopted (as outlined in section 5.3.2 below). The convention goes on to oblige states to prevent,
reduce and control pollution, in particular in harmonising their policies. The measures advocated
include setting joint water quality objectives and criteria, establishing techniques and practises to
address pollution from point and non-point sources, and establishing lists of substances whose
introduction is to be prohibited, limited, investigated or monitored (Article 21).
It is evident that the Convention is especially relevant to the five terrestrial WIO states particularly
with respect to combating marine pollution from land-based sources and PADH. More generally the
boundaries of eleven of the SADC countries straddle fifteen major perennial and ephemeral river
basins (Pallet, 1997). Moreover, fifteen major rivers are shared between the different SADC countries
on the sub-continent.
Nairobi Convention
The central and key regional convention is the 1985 Nairobi Convention for the Protection,
Management and Development of the Marine and Coastal Environment of the Eastern African Region,
(the `Nairobi Convention'). Originally it included two protocols: the Protocol Concerning Protected
Areas and Wild Fauna and Flora in the East African Region (the `SPAW Protocol') which is particularly
relevant to PADH in the region and which is elaborated on below, and secondly, the Protocol
concerning Co-operation in Combating Marine Pollution in Cases of Emergency (the `Emergency
Protocol'). The Convention and its two Protocols were adopted in 1985 and has been in force since 30
May 1996 when the necessary number of ratifications signatories was obtained. South Africa was not
an original signatory in 1985 but acceded to the Convention and associated Protocols on 16 May
2003. Thus a particular strength of the Convention is that is has achieved 100 % ratification by all
signatories which is a rare achievement for a regional or international convention.
The Convention provides a framework for regional cooperation in the protection, management and
development of the WIO region's marine and coastal environment, for sustainable socio-economic
growth and prosperity. The Preamble recognises "the threat to the marine and coastal environment,
its ecological equilibrium, resources and legitimate uses posed by pollution and by an insufficient
integration of an environmental dimension into the development process...". It goes on to
acknowledge "the need for co-operation amongst themselves and with competent regional and
international organizations in order to ensure a coordinated and comprehensive development of the
natural resources of the region...". Of specific relevance to this report is the fact that the Convention
under the heading `Pollution from Land-based Sources' states:
The Contracting Parties shall endeavour to take all appropriate measures to prevent, reduce and combat
pollution of the Convention area caused by coastal disposal or by discharges emanating from rivers,
estuaries, coastal establishments, outfall structures or any other sources within their territories.
14
Article 4(1) of the Convention headed `General Obligations' goes on to state:
The Contracting Parties shall, individually or jointly, take all appropriate measures in conformity with
international law and in accordance with this Convention and those of its protocols in force to which
they are party, to prevent, reduce and combat pollution of the Convention area and to ensure sound
environmental management of natural resources, using for this purpose the best practicable means at
their disposal, and in accordance with their capabilities.
The remaining sub-articles of Article 4 go on to oblige contracting parties to cooperate in the
formulation of protocols, to cooperate with the competent international, regional and sub-regional
organizations, to harmonise policies in this regard and to assist each other in fulfilling their
obligations under the Convention (Article 4(2) to (5)).
The SPAW Protocol's relevance to PADH stems from its recognition of "...the danger from increasing
human activities which is threatening the environment of the Eastern African region", and "...that
natural resources constitute a heritage of scientific, cultural, educational, recreational and economic
value that needs to be effectively protected..." (Preamble to the Protocol). Article 2 elaborates by
providing for a general undertaking that the parties "...shall take all appropriate measures to maintain
essential ecological processes and life support systems, to protect genetic diversity, and to ensure the
sustainable utilization of harvested natural resources...[and] shall endeavour to protect and preserve rare
or fragile ecosystems as well as rare, depleted, threatened or endangered species of wild fauna and flora
and their habitats in the Eastern African region. The Convention then lists the `Protected species of wild
flora', `Species of wild fauna requiring special protection', `Harvestable species of wild fauna requiring
protection' and `Protected migratory species' in four separate annexes, and provides for appropriate
protection for each category (Articles 3 to 6 respectively). It also provides for specific protection
measures (Article 10), Publicity and Notification (Article 14), Public Information and Education (Article
15), Regional Co-operation (Article 16) and related provisions.
The sister to SPAW, the `Emergency Protocol' is relevant to pollution of marine and coastal waters,
primarily geared to combat oil pollution from ships. Though it specially defines `oil', it is clearly not
limited thereto as it also defines `harmful substances'. (The equivalent protocol in the western African
Abidjan Convention is limited to oil). Moreover, various articles refer to `marine pollution incident'
which is defined as `...a discharge or spillage of oil or other harmful substance into the marine
environment, or a significant threat of such a discharge or spillage...of a magnitude that requires
emergency action...". This would clearly cover a land-based disaster or a threat thereof, such as a
chemical outflow from an industrial plant, a serious spill of chemicals at a coastal mining site, or from
inappropriate or accidental drilling chemical or waste disposal at sea. The Protocol obliges parties to
cooperate (Article 3), exchange information (Article 4), and provide mutual assistance (Article 6). As
such, it seems clear that the necessary regional law is in place, providing for disasters but the
governance question remain whether national frameworks are in place to practically deal with such
disasters.
A third (draft) Protocol on LBSA to the Nairobi Convention was presented by the Nairobi Convention
secretariat to the fifth conference of parties (COP 5) in November 2007 in Johannesburg, South Africa.
The development of this Protocol is a tacit acknowledgement of an existing legal gap to confront the
increasing challenge and severity of land-based sources and activities causing pollution and
degradation of the marine environment in the WIO region. More specifically, it is currently being
developed as a result of calls by the Conference of Parties (COPs) of the Nairobi Convention made in
1999 in Nairobi, and subsequently by COP 3 (Maputo, 2001) and COP 4 (Antananarivo, 2004). These
called upon the Executive Director of UNEP to expedite the process of revision of the Nairobi
Convention and its protocols as well as the development of the LBS Protocol in the context of a more
general initiative calling for the review of the Convention and its protocols. This would bring them up
to date as modern and dynamic legal instruments better suited for the protection and conservation of
the marine and coastal environment in the WIO region.
15
The management of the Nairobi Conventions is broad-based, and besides the core secretariat staff
based in Nairobi, the Convention is guided by the governments of the region through a network of
national focal points and thematic experts groups. The premier decision-making organ of the Nairobi
Convention is the Conference of Parties (COP) - a biennial meeting that brings together the Ministers
of Environment and technical experts from all the countries that are party to the Convention. The
Ministers of Environment are represented in the technical meetings of the Convention by senior
government officers in a forum referred to as the Forum of Focal Points. The Forum provides over-
arching policy direction and coordination to the programmes implemented by the Convention
secretariat.
On the institutional side, the Convention has two offices: the secretariat is based at the UNEP
headquarters in Nairobi, Kenya, and a Regional Coordinating Unit (RCU) is based in the
Seychelles. The UNEP-based secretariat works closely with the Seychelles, and is responsible for
providing overall technical coordination, planning and developing the work programme of the
Convention and monitoring the progress in its implementation. Meanwhile, the RCU based in the
Seychelles is responsible for activities geared towards enhancing political visibility for the Nairobi
Convention, and resource mobilization. The responsibilities of the Convention are therefore split into:
(a) programme coordination based in Nairobi and (b) inter-governmental political coordination based
in the Seychelles. Task forces and Working Groups under the Nairobi Convention provide a means
for collaboration and cooperation between partners in addressing urgent technical issues within the
scope of the Convention. The ad hoc Legal and Technical Working Group; the Coral Reef Task
Force, the Group of Experts for Marine Protected Areas in Eastern Africa (GEMPA-EA); the Physical
Alteration and Destruction of Habitats (PADH) Task Force, The Municipal Wastewater Task Force,
the EIA Task Force and the Working Group on Water, Sediment and Biota Quality provide technical
inputs to all organs of the Nairobi Convention.
Other international conventions
Having provided a brief overview of the main international and regional conventions which shape governance of
sources of marine pollution in the WIO region the main international and regional inter-governmental frameworks and
institutions are now turned to. Those related to and directly relevant to land-based sources in the region
include:
· Convention on the Non-Navigational Uses of International Watercourses based on the articles
drafted by the International Law Commission, adopted by the UN General Assembly 1997
("Watercourse")
· Convention on the Prevention of Marine Pollution by Dumping of Wastes and Other Matter,
1972 ("London")
· Protocol to the Convention on the Prevention of Marine Pollution by Dumping of Wastes and
Other Matter (1972), 1996
· International Convention for the Prevention of Pollution from Ships (1973/78). ("MARPOL")
· Convention on Biological Diversity, 1992 ("CBD")
· Convention on Persistent Organic Pollutants, 2001 ("Stockholm")
· Convention on the Prior Informed Consent Procedure for certain Hazardous Chemicals and
Pesticides in International Trade, 1998 ("Rotterdam")
· African Convention on Conservation of Nature and Natural Resources, 1968 ("African
Nature")
The nine international conventions described above embrace a broad range of issues and
responsibilities, that would appear to ensure sustainable utilization of the marine and aquatic
resources and environment of the WIO region. However, accent to the terms and responsibilities of
16
and thus signatory t the conventions is not uniform throughout the region, though in general the is
widespread inclusion (see Table 5-6).
Table 5-6 Key conventions relevant to LBSAs and ratification status in each WIO country.
CONVENTION
KEN
TANZ
MOC
SA
SOM
COM
MAD
MAU
SEY
FRA
UNCLOS 1982
Yes
Yes
Yes
Yes
n/a
Yes
Yes
Yes
Yes
Yes
Watercourses 97
No
No
Yes
Yes
n/a
No
No
No
No
n/a
London 1972
Yes
Yes
Yes
Yes
n/a
Yes
Yes
Yes
Yes
Yes
MARPOL
73/78 Yes Yes Yes Yes n/a Yes Yes Yes Yes Yes
CBD 1992
Yes
Yes
Yes
Yes
n/a
Yes
Yes
Yes
Yes
Yes
Stockholm 2001
Yes
Yes
Yes
Yes
n/a
No
Yes
Yes
Yes
Yes
Rotterdam 1998
Yes
No
No
Yes
n/a
No
Yes
-
Yes
Yes
Nairobi
1985
Yes Yes Yes Yes Yes Yes Yes Yes Yes Yes
African Nature
Signed Signed Signed Yes n/a
Yes Yes Yes Yes Yes
1968/2003
5.3.2 Soft Laws and related developments
There are five important `soft' laws that have been established over the last twenty years that are
relevant to the WIO region. These are presented below in chronological order.
Montreal Guidelines
After UNCLOS was adopted, the Montreal Guidelines for the Protection of the Marine Environment
against Pollution from Land-based Sources were prepared by an expert group under the auspices of
UNEP and were adopted by its Governing Council in 1984. These Guidelines represented the first
attempt to address the problem of land-based pollution at a global level.
Agenda 21
One of the documents adopted at the 1992 Rio Summit was Agenda 21. Chapter 17 on the marine
environment includes some key elements in that it emphasises the focus on sustainable development
and an integrated approach to the protection and preservation of the marine environment. Although
Agenda 21 is a `soft' law instrument and not a `hard' convention, many of its provisions have laid the
foundation for incorporation in subsequent `hard' law as evidenced by a number of multilateral
environmental agreements (MEAs) entered into over the last fifteen years.
Washington Declaration and Global Programme of Action on Protection of the Marine Environment
from Land-Based Activities (GPA)
In 1995, the above developments were followed up with an inter-governmental conference in
Washington, USA, dealing specifically with land-based marine pollution. Two key documents were
adopted: firstly the Washington Declaration on the Protection of the Marine Environment from Land-
based Activities, secondly the Global Programme of Action (GPA) (www.gpa.unep.org). The GPA is
a `soft' law agreement reflecting the resolve of states to address the impacts of LBSA and physical
degradation of the coastal and marine environments. As such it is an action-oriented programme with
the over-arching goal to address the negative effects of land-based activities on the coastal and marine
environment. It has a coordination office based in the Netherlands but is not an international
institution. Rather, it is an inter-governmental programme that addresses the inter-linkages between
freshwater and the coastal environment and has a close working relationship with the UNEP Regional
Seas Programme (RSP). Chapter 2 of the GPA (paras. 29 to 35) sets out its objectives which include
the strengthening of regional cooperation agreements, such as the Nairobi Convention, and where
17
necessary to create new ones to support effective action, strategies and programmes (UNEP-GPA,
1995 and www.gpa.unep.org).
The GPA has identified at least nine pollutant or source nodes across most of the UNEP's RSPz.
Many of these source nodes are also manifested in the WIO region and are described in the respective
problem areas in section 5.2. Briefly, these include: municipal wastewater, heavy metals, litter,
nutrients, oil, physical alterations and destruction of habitats (PADH), , sediment mobilization and
persistent organic pollutants (POPs).
The GPA assists states in taking concrete actions that produce tangible results within their respective
policies, priorities and resources available. The implementation of the GPA is primarily the task of
governments, in close partnership with all stakeholders, including local communities, public
organizations, non-governmental organizations and the private sector. It also has initiated the drafting
of LBA protocols for at least six of the Regional Seas Programme treaties, for the Mediterranean,
Southeast Pacific, Black Sea, Ropme Sea Area (Kuwait Convention), the Wider Caribbean and
PERGSA (Red Sea and Gulf of Aden). As such, the GPA plays a central role in the WIO region
mainly because it is active through the Nairobi Convention to help mainstream LBSA in the region. In
particular, the WIOLaB is a demonstration project for the GPA, executed by the Nairobi Secretariat.
The GPA is also involved in capacity building in the region, as indicated in the next development.
World Summit on Sustainable Development and Johannesburg Plan of Implementation
The third significant development was the 2002 World Summit on Sustainable Development (WSSD)
held in Johannesburg. This adopted a Plan of Implementation (JPOI) which included provisions
dealing with oceans, coasts and islands (Recommendations 30-36). It also endorsed the provisions of
Agenda 21 (referred to above) and reiterated the importance of sustainable use and management of the
marine environment in reducing poverty and achieving the goals of sustainable development
(www.un.org/esa/sustdev/documents). Furthermore, the JPOI specifically endorsed the GPA referred
to above (adopted through the Washington Declaration of 1995) (Recommendation 33).
The JPOI also makes specific reference to the GPA in that it encourages its advanced implementation
and that of the Montreal Declaration on the Protection of the Marine Environment from Land-based
Activities, with particular emphasis in the period 2002-2006 on municipal waste water, the physical
alteration and destruction of habitats, and nutrient pollution (paragraphs 32 and 52(e)). The JPOI also
formulates actions at all levels to achieve advanced GPA implementation, in particular to:
· facilitate partnerships, scientific research and diffusion of technical knowledge; mobilise
domestic, regional and international resources; and promote human and institutional capacity-
building, paying particular attention to the needs of developing countries;
· strengthen the capacity of developing countries to develop their national and regional programmes
and mechanisms to mainstream the objectives of the GPA and to manage the risks and impacts of
ocean pollution;
· elaborate regional programmes of action and improve the links with strategic plans for the
sustainable development of coastal and marine resources, noting in particular areas which are
subject to accelerated environmental changes and development pressures;
· make every effort to achieve substantial progress by the next GPA Conference in 2006 to protect
the marine environment from land-based activities.
Finally, the Plan of Implementation calls to "effectively reduce, prevent and control waste and
pollution and their health-related impacts by undertaking by 2004 initiatives aimed at implementing
the GPA in small island developing states". This would include Mauritius, Seychelles and Comoros
in the present case (UNEP/GPA, 2006).
18
UNEPs Regional Seas Programme
The invoking of the Nairobi Convention by the GPA must be seen in the context of UNEPs Regional
Seas Programme under which over a dozen regional conventions on marine and coastal waters have
been adopted in various regions of the world. The oldest is the 1976 Barcelona Convention for the
Protection of the Mediterranean Sea Against Pollution. Of central relevance to the WIO region is the
Nairobi Convention referred to in section 5.1 and elsewhere in this report, and to a lesser extent its
counterpart, the Abidjan Convention, which is applicable to the west coast of Africa.
These regional seas conventions lay down a broadly uniform pattern of principles which have been
adopted by a substantial number of coastal countries including developing. Only some have included
specific protocols on preventing and combating land-based sources of marine pollution, for example,
the Barcelona Convention 1976 (amended 1995) for the Mediterranean or the Kuwait Convention
1978. The process of developing new LBSA protocols is under way under the Caspian Sea
Convention 1999, the Nairobi Convention 1985 and the Abidjan Convention 1983.
5.3.3 Regional Economic Integration Agreements
This section outlines the four main regional economic integration units relevant to the WIO region
and more particularly to combating marine pollution from land-based sources. All four (SADC,
COMESA, the EAC and the IOC) must be seen against the backdrop of the Nairobi Convention which
is the regional springboard for implementing LBSA implementation mechanisms at national level.
Table 5-7 accordingly lists the Nairobi Convention parties and depicts which other regional economic
integration units each Nairobi party belongs to.
It is evident from Table 5-7 that there is no ideal regional economic integration unit that would be a
logical vehicle to launch land-based sources of marine pollution implementation mechanisms or
related instruments. Four WIO countries are not members of SADC including Comoros and Kenya;
similarly four are not members of COMESA including South Africa and Tanzania; by its nature only
three coastal countries are members of the EAC; and only the island states are members of the IOC.
However, each can play a role in one way or another of at least generating political momentum behind
efforts to combat land-based marine pollution. Thus for example, if the SADC, (as described in the
next paragraph), had an environmental assessment protocol, it would provide the momentum for the
adoption of such laws in other countries in the region. Such a framework is discussed further in the
conclusion of this section.
Southern African Development Community (SADC)
SADC is a regional economic cooperation agreement constituted under the 1992 Treaty of the
Southern African Development Community (SADC). It origins go back further in particular to the
predecessor of SADC, the Southern African Development Coordination Committee which was not
underpinned by a formal treaty but was nevertheless an effective mechanism. The objective of the
treaty is to "achieve development and economic growth, alleviate poverty, enhance the standard and
quality of life of the peoples of southern Africa and support the socially disadvantaged through
regional integration" (Article 5(1)(a)). According to the preamble, member states are committed to
"coordinate, harmonise, and rationalise their policies and strategies for sustainable development in all
areas of human endeavour..." and "agree to co-operate in the areas of natural resources and the
environment" (Article 21(3)(e).
On the regional scale, the SADC Protocol is the key instrument for transboundary water management.
It is a framework agreement containing the generic rules for the management of shared rivers within
the SADC region. Article 5, establishes the institutional set-up for the management of shared
watercourses, consisting of the SADC Water Sector Organs and Shared Watercourse Institutions
(SWCIs).
19
There are currently fifteen members of the Treaty with six of these also members of the Nairobi
Convention as shown in Table 5.7. The Table also illustrates membership and overlaps with other
relevant conventions, namely COMESA, the EAC and IOC.
Table 5-7 Membership of Nairobi and other relevant regional integration agreements.
Country
Nairobi
SADC
COMESA
EAC
IOC
(9)
(15)
(19)
(5)
(5)
Angola
Yes
Botswana
Yes
Burundi
Yes
Yes
Comoros
Yes Yes
Yes
Djibouti
Yes
DRC
Yes
Yes
Egypt
Yes
Eritrea
Yes
Ethiopia
Yes
Kenya
Yes Yes
Yes
Lesotho
Yes
Libya
Yes
Madagascar
Yes Yes Yes
Yes
Malawi
Yes
Yes
Mauritius
Yes Yes Yes
Yes
Mozambique
Yes Yes
Namibia
Yes
France
Yes
Yes
(Réunion)
Rwanda
Yes
Yes
Seychelles
Yes Yes Yes
Yes
South Africa
Yes Yes
Sudan
Yes
Swaziland
Yes
Yes
Tanzania
Yes Yes Yes
Uganda
Yes
Yes
Zambia
Yes
Yes
Zimbabwe
Yes
Yes
The SADC Treaty is headquartered in Gaberone, Botswana and administered by sectoral sub-
committees including an Environment and Land Management sector and a Fisheries sector. There is
no sector dedicated specifically to the marine environment but the Fisheries Protocol and the Shared
Water Courses Protocol (Table 5-8) is relevant the coastal and marine environment but not to land-
based marine pollution directly. Similarly, there is no environmental assessment protocol governing
potential transboundary pollution and impacts. The adoption of a dedicated protocol on environmental
assessment in SADC along the lines of the Espoo Convention in the EU would however go a long
way to adopting and harmonising environmental assessments at national level. The challenge
therefore is to include at least land-based marine pollution concerns and `thinking' in developing and
implementing protocols whether they are to SADC or to the Nairobi Convention.
The Revised Protocol on Shared Water Courses follows from the International Water Courses
Convention referred to in section 5.2 and encourages the establishment of institutions for all river
basins in the region, to be known as Permanent River Basin Water Commissions or Operating
Authorities to manage shared water resources in a sustainable way.
20
Table 5-8 SADC Protocols relevant to pollution of marine and coastal waters
Year SADC Protocol
2004 Declaration on Agriculture and Food Security
2003 Revised Protocol on Shared Watercourses in the SADCRegion
2001 Protocol
on
Fisheries
1999 Protocol on Wildlife Conservation and Law Enforcement
1997 Protocol on Mining
1996 Protocol on Energy
1995 Protocol on Shared Watercourse Systems in the SADC
A number of specific agreements have been entered into regarding a number of basins and a number
of other instruments of co-operation for specific basins also exist, such as: the Permanent Joint
Technical Commission between Angola and Namibia on the Kunene River Basin; the Limpopo Basin
Permanent Technical Committee between Botswana, Mozambique, Zimbabwe and South Africa; the
Incomati Tripartite Committee, and others. In addition, a number of multi- and bi-lateral treaties have
been entered into in the SADC (including countries of the WIO region). These are addressed in more
detail in section 5.3.7.
Common Market for Eastern and Southern Africa (COMESA)
COMESA is a regional inter-governmental framework which extends from Libya to Zimbabwe. Since
its inception in 1994 its objective has been to further economic integration by the removal of trade and
economic barriers between member states. In that year it replaced a previous preferential trading area
agreement which had existed since 1981. The focus of its vision has accordingly shifted from pure
`economic' integration to `development integration' by `the attainment of a fully integrated economic
community through a combination of trade development and investment promotion and co-ordination'
(www.comesa.int/about/vision).
There are currently nineteen member states within COMESA (see Table 5.7). Only five countries,
Seychelles, Mauritius, Madagascar, Kenya and the Comoros are COMESA members and party to the
Nairobi Convention, with Tanzania recently leaving the group. Consequently, COMESA is unlikely to
play a central role in governance in the WIO region.
East African Community (EAC)
The East African Community is a regional intergovernmental organization now comprising five
member countries: Kenya, Uganda and Tanzania, and more recently Rwanda and Burundi. It has
headquartered in Arusha, northern Tanzania. Originally it was a customs union but its remit was
widened under the 1999 Treaty for the Establishment of the East African Community, so that it is now
a regional economic integration organization. Environmental considerations are not a priority for the
EAC and with only three (continental) members of the WIO region, it has little relevance to regional
marine pollution.
Indian Ocean Commission (IOC)
The Indian Ocean Commission is a regional organization comprising five island states: Comoros,
Madagascar, Mauritius and Seychelles and France (by virtue of its sovereignty over Reunion and
Mayotte). It was established in 1984 under the General Victoria Agreement and its objectives include
diplomatic cooperation, economic and commercial cooperation, cooperation in marine fisheries,
agriculture, scientific, technical and cultural fields as well as the conservation of resources and
ecosystems.
21
Inevitably, the principal focus of the five IOC countries is marine fisheries, to which most efforts and
development are targeted. Central to fisheries at present is a number of Fisheries Partnership
Agreements (FPAs) (elaborated on in section 5.3.4, below).
Conclusion
The above analysis reveals that the focus of these four regional economic integration units is
economic integration and not environmental considerations. However, as far as trans-boundary issues
are concerned, resource management and environmental issues are accommodated particularly well in
the SADC protocols, notably the Shared Waters Protocol. In light of this opportunity, a
recommendation of this is that a concerted effort be made to promote the development of a SADC
environmental assessment Protocol which would include land-based marine pollution considerations.
Given that it is unlikely that such a Protocol will be developed for SADC in the near future, an interim
measure would be to incorporate a land-based marine pollution clause in the draft Protocol on Land-
based Sources of Marine Pollution which is currently being prepared.
A SADC environmental assessment Protocol, if and when it emerges, could be along the lines of the
Convention on Environmental Impact Assessment in a Transboundary Context, 1991 ("Espoo")
which applies to trans-boundary impact in the European context. A general obligation under Espoo is
that states agree to:
. . . take all appropriate and effective measures to prevent, reduce and control significant adverse
transboundary environmental impact from proposed activities" (Article 2(1)).
The Convention defines the term "transboundary impact" as ". . . any impact, not exclusively of a
global nature, within the area of jurisdiction of a party caused by a proposed activity the physical
origin of which is situated wholly or in part within the area of jurisdiction of another party" (Article
1(viii)). The definition of environmental impact assessment is also pertinent, namely, "a national
procedure for evaluation of the likely impact of a proposed activity on the environment" (Article
1(vi)). The Convention also sets out the required contents of environmental impact assessment
documentation, as well as a number of other relevant provisions. These include provisions on
Notification, Final Decision, Post Project Analysis (in Articles 5 to 7) and others. Finally it can be
noted that a number of international agencies have developed directives and guidelines on
environmental assessment. These include the World Bank, the African Development Bank, UNEP,
IUCN, and the International Association for Impact Assessment (IAIA), an international NGO active
in developing environmental assessment procedures and techniques.
However, it should be noted that Article 13 of the Nairobi Convention entitled `Environmental Impact
Assessment' provides for environmental assessment in the following terms:
1. As part of their environmental management policies, the Contracting Parties shall, in
cooperation with competent regional and international organizations if necessary, develop
technical and other guidelines to assist the planning of their major development projects in such
a way as to prevent or minimize harmful impacts on the Convention area.
2. Each Contracting Party shall assess, within its capabilities, the potential environmental
effects of
major projects which it has reasonable grounds to expect may cause substantial pollution of, or
significant and harmful changes to, the Convention area.
3. With respect to the assessments referred to in paragraph 2, the Contracting Parties shall, if
appropriate in consultation with the Organization, develop procedures for the dissemination of
information and, if necessary, for consultations among the Contracting Parties concerned.
22
It is accordingly clear that the Convention already binds parties to undertake environmental
assessments where there may be transboundary impacts or where there may be a significant impact on
the Convention area.
A final matter which needs to be considered under this review of regional agreements is the
possibility of linking both the Nairobi and Abidjan conventions to SADC, the IOC, and/or other
relevant regional integration units in some way such as by an inter-governmental agreement. This
could be achieved by both the Nairobi and Abidjan conventions adopting a land-based marine
pollution protocol and linking this to the LME programmes described below, thereby taking into
account ecological considerations.
5.3.4 International and Regional Institutions
There are six principal international institutions involved in economic development and the marine
environment of the WIO region. As the follows descriptions reveal, their focus within the region are
varied and approaches to implementation diverse.
United Nations Environment Programme (UNEP)
UNEP is a specialized UN agency constituted under a Governing Council of 59 members elected by
the General Assembly and is based in Kenya. Although it an international institution, its physical
location in Nairobi makes it a central player at the regional African and WIO level. It among many
other things initiated the international Regional Seas Programme (RSP) referred to in section 5.3.1
above including the central convention to this report, the `Nairobi Convention' and its two protocols,
described in the previous section. UNEP also initiated two further RSP conventions relevant to the
African region namely the Convention for the Co-operation in the Protection and Development of the
Marine and Coastal Environment of the West and Central African Region, 1981 "Abidjan" which
applies to the West Coast of Africa and the 1976/1995 Barcelona Convention which applies to the
Mediterranean including North Africa.
The secretariat to the Nairobi Convention is in fact a joint secretariat for the Abidjan Convention as
well, thus providing a platform for regional African cooperation. This agency is accordingly central in
driving the initiative to regulate, control and coordinate land-based activities at the regional level
including the development of the LBSA Protocol referred to in the introductory section 5.1.
UN Development Programme (UNDP)
The UNDP is involved by virtue of being the principle channel of multilateral, technical and
investment assistance to developing countries, and includes various environmental programmes, such
as the GEF (Global Environmental Facility) which not only makes funds available to developing
countries but has also initiated capacity-building programmes (described further in section 5.5.1).
African Ministerial Conference on the Environment (AMCEN)
The African Ministerial Conference on the Environment (AMCEN) was established in December
1985, following a conference of African ministers of environment held in Cairo, Egypt. It meets every
two years and its mandate is to provide advocacy for environmental protection in Africa; to ensure
that basic human needs are met adequately and in a sustainable manner; to ensure that social and
economic development is realized at all levels; and to ensure that agricultural activities and practices
meet the food security needs of the region.
AMCEN led the process for the development of the action plan for the Environment Initiative for the
New Partnership for Africa 's Development (or NEPAD (described below). It endorsed a framework a
specific NEPAD Environment Action Plan which commenced in 2002 early on in the NEPAD
initiative. This was endorsed by the African Union in the same year. The Environment Action Plan is
underpinned by the notion of sustainable development in that in takes consideration of economic
growth, income distribution, poverty eradication, social equity and better governance. It is organised
23
in programme clusters and project activities to be implemented over a period of ten years. AMCEN
has provided guidance in the process for the implementation of the action plan for the environment
initiative of NEPAD, including its work programme for the biennium 2005-2006.
AMCEN has also prompted and encouraged the preparation of the comprehensive regional report on
the state of Africa's environment, Africa Environment Outlook (AEO), by the United Nations
Environment Programme (UNEP). The AEO is an instrument for monitoring and reporting on the
environment. Additionally, AMCEN successfully facilitated the revision of the 1968 African
Convention on the Conservation of Nature and Natural Resources (Algiers Convention). Current
measures are being taken to strengthen the linkages between AMCEN and the region's two marine
and coastal conventions, namely, the Nairobi Convention and the Abidjan Convention. The UNEP
Regional Office for Africa has served as the secretariat to AMCEN since its inception.
New Partnership for Africa's Development (NEPAD)
NEPAD is a vision and programme of action for the development of the African continent, formulated
by African leaders throughout the African Union and adopted in October 2001. It is a comprehensive
integrated development plan that addresses key social, economic and political priorities for the
sustainable growth of Africa. The goals of NEPAD are broad and include to promote accelerated
growth and sustainable development, eradicate widespread and severe poverty, and halt the
marginalization of Africa in the globalization process.
Relevant to land-based impacts on the ocean is the fact that NEPAD has developed an environmental
Action Plan to address priority environmental issues. A framework for the action plan was endorsed
by the African Ministerial Conference on the Environment (AMCEN) in 2002 and by the African
Union later in the same year. The framework proposes four strategic directions: (1) capacity building
for environmental management; (2) securing political will to address environmental issues; (3)
mobilizing and harmonizing international, regional and national resources, conventions and protocols;
and (4) supporting best practice and pilot programs. The Action Plan is organized in programme
clusters and project activities to be implemented over an initial period of ten years. The environmental
initiative identifies programme areas that cover, among others, the following priority sectors and
cross-cutting issues: combating land degradation, drought and desertification, wetlands, invasive
species, marine and coastal resources, cross-border conservation of natural resources, and climate
change. The Action Plan builds on the related coastal problems of pollution, forests, freshwater,
capacity-building and technology transfer.
The African Process for the Development and Protection of the Coastal and Marine Environment in
Sub-Saharan Africa (the `African Process') and the Pan African Conference on Sustainable
Integrated Coastal Management (PACSICOM)
PACSICOM and the African Process are not really inter-governmental frameworks or institutions.
Instead, they are processes whose results are incorporated into framework plans, for example the
results of the African Process are integrated into the NEPAD Action Plan. The African Process is a
Global Environment Facility (GEF) supported initiative which emerged out of priorities highlighted at
two conferences held in 1998: PACSICOM in Mozambique, and the Cape Town Conference on
Cooperation Development and Protection of the Coastal and Marine Environment in Sub-Saharan
Africa. These events stimulated a unified political awareness amongst African governments for the
need to develop an integrated approach towards sustainable development of coasts and the oceans
fringing Africa.
The underlying motivation for the African Process is the recognition of the need for regional
cooperation to maximize capacity to address the many social, economic and environmental problems
that are either transboundary in nature, or common to most countries. The initiative drew from
scientific expertise, such as the Western Indian Ocean Marine Science Association (WIOMSA) (see
section 5.5.1), within individual countries to identify priority areas for action. It has led to the
incorporation of a coastal and marine sub-component of the environment component of the NEPAD
24
Action Plan referred to above. The African Process has a secretariat known as the NEPAD Coastal
and Marine Secretariat (COSMAR) and is based in Nairobi, Kenya.
African Ministerial Conference on Water (AMCOW)
The African Ministerial Council on Water (AMCOW) was formally launched in Abuja, Nigeria on
April 2002 by African Ministers responsible for water with a specific focus on water and sanitation
issues. This was done in the same year as the establishment of the African Union and the launch of the
NEPAD. Essentially, AMCOW is a regional inter-governmental response to encourage new
approaches to Africa's sustainable development challenges, and to meet the challenges posed by the
Millennium Declaration and the Millennium Development Goals (MDGs).
The Mission of AMCOW is to provide political leadership, policy direction and advocacy in the
provision, use and management of water resources for sustainable social and economic development
and maintenance of African ecosystems, and strengthen inter-governmental cooperation to address the
water and sanitation issues in Africa. Its functions include: to facilitate regional and international
cooperation through the coordination of policies and actions amongst African countries regarding
water resource issues; to review and mobilize additional financing for the water sector in Africa; and
to provide a mechanism for monitoring the progress of implementation of major regional and global
water resources and water supply and sanitation initiatives.
AMCOW aims to develop mechanisms that will promote best practices for water policy reforms,
integrated water resources management, food security, water supply and sanitation. It will also
enhance and solidify inter-governmental and regional cooperation in the management of shared
waters, including surface and groundwater. It also provides a forum for dialogue with UN agencies
and other partners on water issues, promotes participation in regional studies regarding climate
change and development of observation networks, facilitates information exchange and aims to
develop policies and strategies for addressing water issues. AMCOW engages in dialogue and
consultations with UN agencies, regional economic groupings and with regional and global financial
institutions on financing and other issues relevant to the water and sanitation sector in Africa.
The AMCOW institutional set-up consists of a Full Council of Ministers (the minister responsible for
water from each member country), and an Executive Committee with a President/Chair. The
Executive Committee is composed of three representatives/water ministers from each of the five sub-
regions: West Africa, Eastern Africa, Central Africa, North Africa and Southern Africa). Each sub-
region has a sub-regional Secretariat (usually housed in the respective Regional Economic
Community) for coordination of sub-regional activities. Each sub-region is headed by a Vice
President. The main AMCOW Secretariat is in Abuja, Nigeria and is headed by an Interim Executive
Secretary and support staff. The Executive Committee is advised by a Technical Advisory Committee
(TAC). AMCOW is addressed in more detail in section 5.3.7 with respect to river basins.
5.3.5 Intergovernmental
Agreements
There are a number of Africa-wide, sub-Saharan and WIO region inter-governmental arrangements,
agreements and frameworks which are relevant to the TDA. Their focus is generally on shared natural
resource management, more particularly around marine fisheries, marine ecosystem management, and
freshwater management as outlined below.
Marine fisheries management
From the point of view of governance in the WIO region, the marine fisheries sector is the most
sophisticated, developed and prominent. This is because of the fishing activities by the fleets of long
distant fishing nations from the EU and Asia operating in the WIO region. Regional governance
structures have been developed by a number of international institutions including the World Bank
which implements the South West Indian Ocean Fisheries Project (SWIOFP) and the FAO which
25
administers the Regional Fisheries Management Organisations (RFMOs) and commissions as well as
projects such as the South West Indian Ocean Fisheries Commission (SWIOFC).
In addition, there are European Union Fisheries Partnership Agreements (FPAs) which have been
developed in the context of the more general ACP-EU Economic Partnership Agreements initiative.
The previous Contonou Partnership Agreement between the EU and African, Caribbean, Pacific
(ACP) States has been replaced by a comprehensive partnership agreement between the EU and ACP
regional groupings, including the WIO region. There are currently 79 members of the African,
Caribbean and Pacific (ACP) group of states including the WIO countries
(www.acpsec.org/en/acp_states.htm). At ACP level, there is considerable scope for improving the
contribution of fisheries to poverty reduction strategies. An important aspect to be noted is the central
role that ACP artisanal fisheries sector activities play in food security, job creation and, increasingly,
in generating foreign exchange earnings. Through FPAs, the EU has changed its approach in its
bilateral fisheries access agreements, particularly those signed with ACP countries, in order to
contribute to responsible fishing in the mutual interest of the parties concerned.
Responsible fisheries may be seen to include impacts from fish processing plants whose polluting
activities can be mitigated. However, all the RFMOs focus only on sustainable harvesting. It is
suggested that processing plant pollution issues be scrutinized to ensure that fish processing activities
include their polluting effect on marine and coastal waters. The regulatory tool for achieving this is
through the EIA process, prior to siting and construction of such facilities, accordingly, the logical
recommendation is that `fish processing activities' be a specified activity national legislation
triggering mandatory EIA.
Large Marine Ecosystems (LME) Programmes
The Large Marine Ecosystem programmes (LMEs) are not strictly inter-governmental agreements but
rather a management approach committed to an ecosystem-based assessment and management
practices in support of Chapter 17 of Agenda 21 (UNCED 1992). However, an inter-governmental
agreement may result from such an initiative as in the case of the BCLME commission referred to
below.
A number of LMEs have been launched to address the restoration and sustainability of ocean areas in
Africa. They generally aim to improve global coastal health, reduce pollution and restore depleted
biomass yields. They are supported by the GEF and its implementing partners, the World Bank, the
UNDP and UNEP. Projects are based on the five-module assessment and management methodology,
targeting productivity, fisheries, pollution, ecosystem health, socio-economics and governance.
The most developed African programme is the Benguela Current LME (BCLME) where the GEF is
supporting an ecosystem-based approach in partnership with the governments of Angola, Namibia and
South Africa to promote integrated management, sustainable development and environmental
protection of the south-east Atlantic region. This may hold lessons for the WIO region as, amongst
others, the BCLME programme recognizing the absence of inter-agency coordination mechanisms for
sustainable management of that region's resources, established a Benguela Current Commission
(BCC) to strengthen regional cooperation and to address the gaps in current knowledge and to
coordinate management of shared resources.
A similar process to the BCLME is underway in the WIO region. This incorporates not only the Agulhas
Current Large Marine Ecosystem (ACLME) but also the Somali Current Large Marine Ecosystem
(SCLME). The latter extends from the Comoros and the northern tip of Madagascar to Somalia at the Horn
of Africa while the former ACLME stretches from the north end of the Mozambique Channel to Cape
Agulhas. This is as a result of the identification of a need to identify the ecosystem effects of climate change
and to discover the major driving forces causing large scale changes in biomass yields within the broader
region for monitoring efforts on spatial and temporal scales (UNDP, 2006).
26
Transmap
The objective of this European Union funded project is to develop scientific knowledge for the
creation of transboundary networks of marine protected areas in the East African region. As such it is
directly related to the PADH chapter of this report. More particularly, the project focuses on the
definition of the type, size and location of single reserves, which together, and irrespective of political
borders, can maintain ecological functions, sustainable resource-uses and expected future socio-
economic development. This involves the identification and indexing of data relating to the various
research thrusts of the project, which are biophysical, socio-economic, governance, existing protected
areas and framework, as well as geo-analytical support in the form of aerial and satellite imagery,
spatial information and related matters.
The final product will be options for a zonation plan that regulates activities and resource use in two
distinct ecoregions, one subtropical and one tropical which together encompass a significant
proportion of the biogeographical range of the East African coastal and marine environment. More
broadly the initiative aims to maintain ecological functions, resource-uses and future socio-economic
developments in the coastal areas of the region (http://www.transmap.fc.ul.pt/).
5.3.6 River-basin Governance frameworks
A leading authority states that the management of international watercourses through regional
cooperation provides the most comprehensive basis for environmental protection and pollution control
(Birnie and Boyle, 2002). Numerous examples of Shared Water or Joint Water Commissions exist in
the region. Probably the best known is the 1987 Botswana-Mozambique-Tanzania-Zambia-Zimbabwe
Agreement on an Action Plan for the Environmentally Sound Management of the Common Zambezi
River System (Zambezi River System Agreement) which now also includes the Democratic Republic
of Congo and is administered by the Zambezi River Basin Commission (ZAMCOM). Such shared
water agreements are flexible in nature but provide broadly for two categories of shared watercourse
institutions:
· Shared Water Commissions that are essentially advisory bodies providing a forum for
notification, consultation and negotiation, for coordinating responses to emergencies, for
collecting data, and environmental matters including setting water quality targets and
standards; and,
· River Basin Authorities go further in that they have specific powers granted to them by
parties to the shared waters agreement concerned.
Both the International Water Course Treaty and the SADC Protocol on Shared Watercourses (SADC,
2000) envisage the formation of both these kinds of arrangements. In the case of the SADC Protocol,
Article 5(3) provides two relevant paragraphs:
(a) Watercourse States undertake to establish appropriate institutions such as watercourse
commissions, water authorities or boards as may be determined.
(b) The responsibilities of such institutions shall be determined by the nature of their objectives
which must be in conformity with the principles set out in this Protocol.
Within the SADC region there is a rich history of international agreements dealing with freshwater
management and allocation as well as associated institutions at the basin level. Some of these
agreements were concluded between the then colonial powers (and are still valid), others between the
countries of the region post-independence. In South Africa alone, there are at least 60 of these
agreements, of a bilateral as well as a multi-lateral nature (see Ashton et al., 2006). Although
Malzbender and Earle (2007) identify over twenty shared water institutions in the SADC region, only
two are relevant to the east coast of Africa and can be considered as falling into the category of river
basin authorities referred to above. These are the Zambezi River Authority, between Zimbabwe and
27
Zambia, established to manage and develop the shared hydro-electric infrastructure between the two
states on the Zambezi River; and the Komati Basin Water Authority (KOBWA) between the Kingdom
of Swaziland and the Republic of South Africa. The latter is a bi-national company formed in 1993 to
manage a large dam project between these two countries under the Treaty on the Development and
Utilization of the Water Resources of the Komati River Basin which is part of the wider Incomati
water basin, shared by these two countries as well as Mozambique. For other examples see Table 5-9.
A general feature identified by Birnie and Boyle (2002) and Malzbender and Earle (2007) is for
member countries to forego some of their sovereign rights by granting powers to a river basin
authority. Such management authorities, or river basin organizations, have specific executive powers
and secretariats. Apart from the Zambezi system, others are in the process of being established or
converted from commissions to authorities, e.g. Limpopo Basin Commission with member Botswana,
Mozambique, South Africa and Zimbabwe. In addition, these arrangements are now beginning to be
dove-tailed with the environmental requirements of the SADC Protocol as exemplified by the
Incomaputo-Agreement (described in more detail below).
Table 5-9 Bilateral and multi-lateral water agreements
Participating countries
Nature of
Objectives
cooperation
Mozambique, South Africa,
Joint Incomati Basin water resources Provide valuable information
Swaziland
management
necessary for producing a basin plan.
Mozambique, South Africa,
Pongola and Maputo rivers
Study present conditions and future
Swaziland
development and planning
plans for the two rivers to ensure
proper water flow quantities and
water quality.
Mozambique, Zimbabwe
Joint water commission for the Save,
Produce basin management plans to
Buzi and Pungwe rivers
assess sustainability of water
transfers for the Pungwe and Save
rivers, including EIAs.
Zambia, Zimbabwe
Management of Kariba Dam and
Operate, monitor and maintain the
related infrastructure through the
Kariba Dam, investigate new dam
Zambezi River Authority
projects, collect and process
hydrological and environmental data,
liaise with utilities of the water plus
various administrative functions.
Despite these positive initiatives, the region is still faced with a number of problems, including lack of
sufficient capacity to address transboundary issues, poor coordination among different initiatives,
overlapping responsibilities, weak promotion of sectoral approaches to coastal and marine
environment issues, and lack of sustained political and financial commitment to the protection of the
coastal and marine environment, partly as a result of lack of awareness.
Three of the four continental WIO states (Mozambique, South Africa and Tanzania) are SADC
Member States and bound by the SADC Protocol (see section 5.3.3). In addition, most other SADC
Member States that contribute run-off to rivers terminating in the WIO are also bound by the SADC
Protocol (see Table below).
On the regional scale, the SADC Protocol, complemented at policy level by the SADC Regional
Water Policy and SADC Regional Water Strategy. The SADC Protocol in Article 5, establishes the
institutional set-up for the management of shared watercourses, consisting of the SADC Water Sector
Organs and Shared Watercourse Institutions (SWCIs).
With respect to the International Watercourses Convention and the SADC Protocol referred to in
section 5.3.1, the nature and scope of the obligation to protect the "aquatic environment", enshrined in
28
Article 4(2)(d) are not well defined. By contrast, the respective provision of the UN Convention,
Article 23, obliges states to take all necessary measures to protect and preserve the "marine
environment," including estuaries. The relevant SADC Protocol, being otherwise identical with the
UN Convention, uses the term "aquatic environment" instead of "marine environment". While there is
no universally accepted definition for aquatic ecosystems, these are considered to include riverine
systems, estuarine systems, coastal marine systems, wetland systems, floodplains, lakes and
groundwater systems (Masundire and Mackay, 2002). Following this definition the SADC Protocol
obligation would extend only to coastal marine systems but not include impacts that occur in the open
sea, i.e. beyond coastal areas, as discussed by Malzbender and Earle (2007).
The difference between the two provisions might in practice be less significant since many impacts
that affect the marine environment in the open sea would also affect the estuary and coastal areas, in
which case the protection obligation applies in any case. Where this does not happen, the protection
obligations set forth in the SADC Protocol is arguably less rigorous, with potential implications for
marine water quality in the WIO region.
29
Table 5-10 Overview of applicable laws in the WIO countries and SADC states contributing to rivers
terminating in the WIO region.
Country
WIO
WIO
Non-WIO
SADC
Country
National Water
state
state with state
Member bound by
Legislation
without
shared
contributing
state
SADC
shared
rivers
to shared
Protocol on
rivers
rivers
Shared
terminating
Watercourses
into the WIO
Angola
x yes
yes
Water
Law
(2006)
Botswana
x
yes
yes
Water Act (34 of
1968)
Comoros
x
no no
Kenya
x
no
no
Water Act (No. 8
of 2002)
Madagascar
x
yes No
Water Law (No 98-
(ratification
029 of 1999)
pending)
Malawi
x yes
yes
Water
Resources
Act 1969
Mauritius
x
yes yes
Mozambique
x yes yes
Water
Law
(Law
16/91, of 1991)
Namibia
x
yes
yes
Water Act No 54
of 1956;
Water Resources
Management Act
(24 of 2004)
pending
commencement
Seychelles
x
no no
Water
Resources
Management Act
(No. 99/ 2005)
South Africa
x yes yes
National
Water
Act
36 of 1998
Swaziland
x
yes
yes
Water Act (No 7 of
2003)
Tanzania
x yes yes
Water
Utilisation
(Control and
Regulation ) Act
(42 of 1974)
Zambia
x
yes
yes
Water Act 1948
Zimbabwe
x yes no
Zimbabwe Water
(signatory
Act (31 of 1998)
state but
ratification
pending)
30
As a framework agreement, the SADC Protocol does not contain basin-specific rules; rather it
provides that watercourse states may enter into watercourse specific agreements that apply the
provisions of the Protocol to that watercourse or part thereof (see Article 6(3)). In line with this article
of the SADC Protocol, the Incomaputo-Agreement4 is the first comprehensive basin-wide agreement
that has been drafted, Although other basins in the regions still lack such governance, it can be
expected that in the long-run similar agreements will be drafted, thereby harmonising the management
of shared watercourses within the framework set by the SADC Protocol (as explained by Malzbender
and Earle, 2007). The SADC Protocol is also notable in that it preserves the validity of existing
agreements that member states have entered into prior to the entry into force of the SADC Protocol.
Institutional framework
In practice, the institutions operating within SADC are currently mandated primarily with monitoring
functions concerning the application of the SADC Protocol, as well as with facilitating the
harmonisation of water laws and policies between SADC member states. These water management
institutions are not mandated with the implementation and enforcement of basin-wide agreements,
instead, where such activities are undertaken, they are done by Shared Watercourse Institutions
(SWCIs) as well as relevant domestic institutions in each country.
Through the above-mentioned basin-specific agreements, a range of organisations have been formed
to advise basin states on river management issues (such as basin commissions), cooperate over
technical aspects (technical committees) and implement projects (development authorities)
(Malzbender and Earle, 2007). An overview of the various organisations in the SADC is provided in
Table 5-11.
The SADC Protocol is non-prescriptive on the types of shared water course institutions (or SWCIs)
which may be formed, leaving their scope of powers, mandate to member states to determine with
their own mechanisms most appropriate to their situations.
For WIO rivers, only four organizations: TARDA, PBWO, ZRA and KOBWA have an executive
mandate (see Table 5-11), meaning that they have the authority to develop, implement and maintain
joint projects and to make management decisions about those projects. They are formed specifically
for some type of joint project dam construction or operation, hydropower generation or irrigation.
They do not engage in inter-state negotiations or policy formation only operating within their clearly
defined mandate as agreed by the states concerned (Malzbender and Earle, 2007).
The two transboundary river basin organizations (RBOs) with an executive mandate are the Zambezi
River Authority, formed between Zambia and Zimbabwe to manage and further develop the shared
hydro-electric infrastructure on the Zambezi River, and the Komati Basin Water Authority, formed
between South Africa and Swaziland to implement Phase 1 of the Komati River Basin Development
Project. These two organisations cover transboundary rivers yet do not include all the basin states,
nevertheless, these SWCIs are important as they represent a tangible example of cooperation between
states developing and managing water-related infrastructure in an effort to promote the socio-
economic development which the region requires (as explained by Malzbender and Earle, 2007).
4 Tripartite Interim Agreement between the Republic of Mozambique and the Republic of South Africa and The
Kingdom of Swaziland for Co-operation on the Protection and Sustainable Utilisation of the Water Resources of
the Incomati and Maputo Watercourses.
31
Table 5-11 River basin organisations (RBOs) in the WIO region (note: no such organisations exist in Madagascar).
RBO'S with executive
Commissions with
Technical
Basins
States
Commissions not covering the whole basin
authority
basin-wide mandate
committees
Tana
Kenya TARDA
Athi-Sabaki
Kenya TARDA
Kenya
Pangani
Tanzania
Pangani Basin Water Office
Rufiji Basin Development
Rufiji
Tanzania
Authority; Rufiji Basin
Development Office
Mozambique
Rovuma Joint Comm.
Rovuma
Tanzania
(being formed)
Angola
Joint Permanent
Botswana
Technical
Comm.
Committee
Malawi
Mozambique
ZAMCOM
Zambezi
Namibia
(pending ratification)
Technical Comm.
Tanzania
Zimbabwe
Zambezi River Authority
Zambia
Mozambique
Pungwe River Basin
Pungue
Zimbabwe
Commission
Botswana
Joint
Water
Mozambique
Limpopo River
Joint Water
Limpopo
South Africa
Commission
Commission (4)
Commission (3)
Zimbabwe
Mozambique
Joint Water
Joint Water
Tripartite
Incomati
South Africa
Commission (4)
Joint Water
Technical
Kobwa
Swaziland
Commission (2)
Commission
(5)
Committee (6)
Mozambique
Joint Water
Joint
Water
Tripartite
Maputo
South Africa
Commission (4)
Joint Water
Technical
Swaziland
Commission
(5)
Commission (2)
Committee (6)
32
In addition to SWCIs with an executive mandate, several basin-wide commissions have also been
formed between states, operating as advisory bodies to their national states thus not limiting their
sovereignty (Malzbender and Earle, 2007). These commissions mostly work through subcommittee
systems in which the members are technical experts or advisors nominated by each delegation. It is at
this level that studies are carried out to provide the information to enable the committees to reach
consensus around river and water management issues. Several of these commissions have now formed
secretariats to assist them in conducting their duties (Malzbender and Earle, 2007).
Various other bilateral, or non-basin-wide, technical committees and commissions exist in the region.
These will most likely continue to be the mechanisms for the implementation of joint projects,
although some of them are increasingly coming under the remit of basin-wide commissions.
5.4
National governance frameworks
5.4.1 Legal and policy frameworks
From a constitutional systems perspective, it should be noted that the system of government varies in
the different national jurisdictions. Thus some of the countries have a unitary form of government
(particularly the island states) where administration is centralized, with the notable exception of
Comoros where government is decentralized, each of the three islands having their own ministries and
departments. Other countries have a form of (quasi) federal system of government where
administration is decentralized. Governments of the mainland states tends to be centralized, with the
notable exception of South Africa, a quasi federal state where nine provinces, including four coastal
provinces exercise significant powers and where functions are divided between national, provincial
and local authorities in line with the constitutional imperative of cooperative governance.
The position in Tanzania, officially the United Republic of Tanzania, is somewhat complicated. In
1964 it became a unitary state comprising of the island of the former Peoples' Republic on Zanzibar
and the former Republic of Tanganyika. The constitution distinguishes between union and non-union
matters. Thus `environment' is a non union matter resulting in separate laws and administrative
authorities for Zanzibar (which also includes the sister island of Pemba) and the mainland. The same
applies for marine fisheries where the island and mainland have separate laws and authorities but
where an additional act, the Deep Sea Fishing Act is common to both and is a union matter...
An important trend in some of the countries of the region is that of decentralization, evident in
Comoros mentioned above, as well as in Mauritius, and Madagascar which are moving towards
devolving powers to the provinces (No 21 of The Courier (ACP-EU) Nov 2003). On the mainland,
decentralization is also occurring in Tanzania which, for example, is in the process of granting greater
powers to district councils.
The individual country reports provided the starting point for examining the legal and policy
frameworks which described and detailed the constitutional, legal/regulatory and policy framework
for each country. This reveals more or less the following eight key sectoral areas from which laws,
institutions and policies can be examined: fisheries and aquaculture, agriculture and forestry, tourism,
mining, (mainly terrestrial but to some extent and off-shore oil and gas activities), industry,
transportation, energy production, coastal development and urbanisation. The Synthesis Report
(Document 4) identified these sectors and analysed their national legal and policy frameworks from a
legal (constitutional, regulatory framework, adoption of international conventions), policy and
institutional perspective.
From a governance perspective, the key legal issues concern the existence of environmental
provisions in the constitution, the existence of a framework environmental act, including
33
environmental assessment provisions, and at least a policy promoting the notion of integrated coastal
area management. These are now examined in turn.
Constitutional frameworks
The constitutional legal frameworks of the WIO-LAB countries has been broadly shaped by their
respective colonial past. Thus the constitutional governance structures of former British colonies such
as Kenya and Tanzania have their roots in the British Westminster system of parliamentary
democracy. Conversely those countries which fell under European colonial masters such as
Mozambique or Seychelles have constitutional structures which are continental European in nature;
yet others for example Mauritius, have a blend of both British and continental systems.
However with the advent of independence in African countries including those of the WIO-LAB
region, most WIO countries adopted modern forms of constitutional frameworks. These have to some
extent been influenced by the United States model by incorporating a Bill of Rights. However while
the United Sates' Bill of Rights includes only civil and political rights, meaning that the state must
guarantee certain fundamental rights and freedoms such the right to vote, freedom of assembly,
expression etc, and not interfere with such rights, modern day constitutions tend to, in addition,
include socio-economic rights such as the right to health care or a right to a decent environment. The
latter tend to impose a positive duty on state rather than require it to desist from interfering with
fundamental rights and freedoms and are more socialist in nature.
The African Charter on Human and Peoples' rights which is a regional treaty encouraging the
adoption of human rights principles by states in the African region includes socio-economic rights
among its articles as well as a right to the environment in article 16. At the national level South Africa
was a pace-setter in the African context as regards environmental rights when the advent of a new
constitutional dispensation in 1994 presented a golden opportunity to include an environmental right
in its Bill of Rights. Two other countries in the WIO region followed suit as depicted in see Table 5-
12.
While this figure may appear relatively low, it must be seen in the context of the fact that no
developing nation has such a right in their constitution, though some medium developed countries do,
such as India and Brazil. It is difficult to assess what the practical impact is of these relatively young
rights is but it is safe to say that at the very least they given greater prominence to environmental
issues in the national context, including those described in this report, than was the case previously.
As such the inclusion of an environmental right sets in place the overall environmental governance
framework for individual countries.
Table 5-12 Inclusion of an environmental right or related provisions in the Constitutions of the ten WIO
countries and their nature.
Country
Environmental
Brief description
Right
Comoros
No n/a
Kenya
No n/a
Madagascar
No n/a
Mauritius
No n/a
Mozambique
Yes
Everyone has a right to live in a balanced environment; duty to protect
environment imposed on the people and Government.
Réunion
n/a n/a
Seychelles
Yes
Citizens have the right to clean and safe environment; State to ensure a
safe and clean environment.
South Africa
Yes
Everyone has an environmental right; state to enact laws in this regard
Somalia
Not known
Not known
34
Tanzania
No n/a
Of the three countries with a constitutional environmental right, the Seychelles 1993 Constitution
(1993) declares with the strongest wording that the Seychelles is committed to preserve a safe, healthy
and functioning environment for the present and future generations. In Article 38 it recognizes the
right of everyone to a safe environment and commits the state to undertake measures to promote the
protection, preservation, and improvement of the environment; to ensure sustainable socio-economic
development by judicious use and management of resources; and to promote public awareness of the
need to protect, preserve and improve the environment. A number of other countries have included
environmental rights. However, in most cases a constitutional environmental right has not been
established.
Framework environmental act and/or environmental assessment legislation
A related, and also relatively recent, trend is for countries to adopt framework environmental
legislation. Such an act would at least include environmental management principles such as the
`polluter pays' and precautionary principles. In addition, the act would include specific and all-
important environmental assessment provisions, or this may be included in a separate act. Such
legislation would also invariably establish governmental environmental institutions and set out their
powers and objectives. Environmental concerns are by their nature cross-cutting, overlapping with the
activities of most government departments, so that it is imperative for countries to have in place cross-
cutting legislation and instruments to ensure that environmental considerations are taken into account
in all aspects of governance. The environmental assessment procedure is a key instrument in this
regard. With the exception of Somalia and Reunion (from where details are not known) all WIO
countries have enacted framework environmental legislation and/or environmental assessment
legislation.
Water Quality and pollution-related laws and/or policies
Many of the WIO countries have in place effluent discharge standards incorporated in legislation or
accompanying regulations to combat freshwater pollution. In some countries, as is the case in South
Africa, these are set in the context of Receiving Water Quality Objectives (RWQOs) (RSA DWAF,
2004). South Africa has gone further by developing environmental quality objectives and targets
(EQO/Ts) for the coastal marine environment. These are provided for four types of uses of coastal
marine waters, namely protection of aquatic ecosystems (e.g. conservation), recreational use, marine
aquaculture and industrial use (e.g. seawater intake for hydro-cooling).
A diverse range of water quality and use legislation exists with numerous institutions responsible for
ensuring water quality and thus implicitly coastal water quality (see Table 5-13).
Table 5-13 Water (Quality) Act and potential key national land-based marine pollution government
institutions.
Country
Water (quality) Act
Coastal water quality institution
Comoros
Loi No. 94-018 du 2 Juin 1994
La Directeur Gen :}\erale de L'Environment,
(DGE)
Kenya
Water Act 2002
Water Services Regulatory Board Water Services
Boards
Madagascar
LOI No. 90-033) Relative a la
L'Organe de Lutte contre l'Evènement de
Charte de L' Environnement
Pollution marine par les Hydrocarbures; Comité
Malagasy of December 21 1990
interministériel de l'environnement
Conseil National de l'Environnement
Mauritius
Environmental Protection Act
National Environment Commission;
2002 amended by GN57/05;
Director of Environment
35
Central Water Act; Canal and
National Environmental Laboratory
Rivers Act
Mozambique
Law 495/73 6 Oct, Pollution of
National Council of Water
Waters beaches and margins;
Regional Water Authorities
Law no. 16/91, of 3 of August,
Water Law
Réunion
n/a n/a
Seychelles
Environment Protection Act
Ministry of Environment and Natural Resources;
(EPA) 1994
Public Utilities Corporation
Public Utilities Corporation Act,
1985
Somalia
n/a n/a
South Africa
National Water Act 1998
DWAF (insofar as it is linked to land-based sources
of pollution)
Tanzania
Environment Management Act
Department of Water Resources (Ministry of Water
2004;
and Irrigation)
National Environment Management Council
Integrated Coastal Area Management (ICAM) laws and/or policies
In examining legal and policy frameworks, a particular priority area which emerges from this gover-
nance review is the notion of Integrated Coastal Area Management (ICAM). Worldwide the trend is
for coastal states, including islands, to promote the concept of integrated coastal area management. At
the time of writing, ICAM has been adopted in some WIO countries (see Table 5-14).
Table 5-14 Adoption of Integrated Coastal Area Management policies laws and/or institutions in the
WIO.
Country
Coastal policy
Coastal area legislation
Coastal management institution
Kenya
Policy prepared
Yes
NEMA/CDA
Tanzania Yes Yes
NEMC
Mozambique Yes
Yes
MICOA
South Africa
Yes
Yes; Bill in process
DEAT (MCM)
Reunion n/a n/a
n/a
Comoros Yes Yes
DGE-
Madagascar
Yes
Yes
Comite National des Zones Marins et
Cotieres
Mauritius Yes Yes MOE/ICZM
Department
Seychelles Yes
Yes
DOE
Somalia n/a n/a
n/a
It evident from the above that most countries, in particular South Africa, Kenya and Tanzania, have
formally moved towards developing policies, laws and institutions promoting integrated coastal area
management (ICAM). On the other hand, it must be stated that environmental management policies
laws and institutions in the small island states are by their nature all concerned with coastal and
36
marine issues to a greater or lesser degree. Be that as it may, there have been a number of
developments and regional initiatives, and organizations formed, to further ICAM. These include:
· The Arusha Resolution (April 1993) on Integrated Coastal Area Management in Eastern Africa
including the island states. This is a soft law declaration which focuses on the promotion and
monitoring of long-term regional impacts caused by climate change; adaptation to, and planning
for, the effects of sea-level rise in the coastal areas; formulating an inventory of potential hotspots
in the region (shoreline changes, coastal erosion, land-based and marine sources of pollution,
coral reefs and associated ecosystems); and the establishment and strengthening of regional
measures of forecasting and early warning capabilities to deal with natural disasters.
· The Pan African Conference on Sustainable Integrated Coastal Management (PACSICOM,
Maputo, July 1998) was a conference which further drove this particular process and ICAM more
generally in the region (see also section 5.3.4);
· The African Process on Protection, Management and Development of the Marine and Coastal
Environment, adopted the portfolio of actions arising from PACSICOM; and
· The Cape Town Conference (December 1998).
An important institution in this regard is NEPAD-COSMAR referred to in section 5.3.3 above.
Summary
The regional challenges and opportunities with respect to national legal/policy frameworks are
summarized in Table 5-15.
Table 5-15 Regional challenges and opportunities regarding legal and regulatory issues.
Challenges
Opportunities
Lack of harmonization of existing
Draft model LBA legislation and or amend existing laws
legislation
Promote principles of regionally integrated ICM
Financial constraints for enforcement
Opportunities to mobilize resources to finalize regional
programme
Coordinating activities through existing regional organizations
(IOC, SADEC, EAC, COMESA, UNEP)
Limited access to environmental justice
Sharing of national best practices (legal, policy, institutional)
Ongoing capacity-building programme for legal stakeholders
Lack of environmental consideration in
Draft model LBA legislation
planning laws
Ongoing capacity-building programme for legal stakeholders
Lack of environmental education in
Provide input into environmental education curricula
curricula
Ongoing capacity-building programme for legal stakeholders
5.4.2 National institutional frameworks
A particular feature and potential strength is that all the countries which are subject to this study have
one or more national government institution for the environment and or natural resource management.
Their area of jurisdiction can be broad, such as environmental management, natural resource
management or conserving biodiversity (resources and PADH), or more specific, such as regulating
(water) pollution and waste management. But invariably a number of institutions are involved. Thus,
for example in South Africa, there is a national Department of Environmental Affairs and Tourism, a
separate department of Water Affairs and Forestry, provincial departments of nature conservation in
the (nine) provinces and parastatal bodies such as the South African National Biodiversity Institute
(SANBI) charged with the study and conservation of biodiversity. Another example is the Seychelles,
where the Ministry of Environment and Natural Resources is the parent ministry to a number of sub-
37
agencies including the Marine Park Authority, the Solid Waste and Cleaning Agency, the Seychelles
Fishing Authority, and pollution control. In Tanzania the National Environmental Management
Council (NEMC) established under the Environmental Management Act of 2004 plays a regulatory
and enforcement role on similar matters, while the Department of Environment is responsible for the
review of strategic environmental assessments and hazardous waste management.
A strength revealed in the TDA synthesis report is that all the countries, with the possible exception of
Somalia, have a national government institution championing the environmental impact assessment
process. Thus for example in Kenya the National Environmental Management Authority (NEMA) is
charged with implementing the EIA reports and reviewing the completed EIAs.
However, when it comes to land-based marine pollution and degradation, the position is more
complex. For example in Kenya, the Coast Development Authority (CDA), established under the
CDA Act (Chapter 449), focuses primarily on coastal regional development and hosts the ICZM
Secretariat. Its mandate is to coordinate coastal development programmes in Kenya but the country
has no land-based marine pollution legislation or regulations in place. In Tanzania, the National
Environmental Standards Committee of the Tanzania Bureau of Standards sets water quality standards
which in the case of LBSA are gazetted by the Minister responsible for the Environment. The nine
national river basin authorities in Tanzania are charged with implementing them in the respective
basins. This illustrates the fact that in many countries there are a number of national agencies which
are (potentially) involved with land-based marine pollution and that attention needs to be paid to the
development of effluent and/or marine environmental quality standards.
The survey reveals that in general there tends not to be a lead agency championing the notion of
integrated coastal area management, including taking the lead in designing and implementing
regulations on land-based sources of marine pollution. The priority then is for each country to identify
which government institution should be charged with leading regulation on marine pollution
activities. In the longer term, the ideal is for each country to have a dedicated coastal agency or a
coastal and marine desk/department within an existing institution such as the environmental affairs
department.
Conversely, a particular weakness in virtually all the countries is that there is no dedicated
government agency charged with the marine environment and marine resources along the lines of the
National Oceanographic and Atmospheric Authority (NOAA) in the USA. This often results in the
fragmentation of matters pertaining to marine and coastal waters. Thus for example in South Africa,
the Department of Environmental Affairs (DEAT) is charged with marine fisheries (Division: Marine
and Coastal Management), the Department of Water Affairs and Forestry (DWAF) is charged with
estuarine management and land-based sources of marine pollution, the Department of Transport (with
the parastatal South African Maritime Safety Authority (SAMSA)), is charged with shipping and
prevention and combating oil and hazardous waste spills.
Summary
The regional challenges and opportunities regarding national institutional frameworks are summarized
in Table 5-16 (see below).
Table 5-16 Regional challenges and opportunities regarding national institutional and policy issues.
Challenges
Opportunities
Enhance capacity in personnel:
Capacity building:
Formulate, review and evaluate policies
Technical: WIOMSA, IUCN, WWF
Technical advise
Policy: UNEP, SADC, bilateral cooperation
Build on relevant data/info:
Use existing networks
38
Build and develop coordination mechanisms
CHM
Identify links between human health and marine
MOUs between (national) institutions
& coastal ecosytems
Federation of NGOs (Comoros)
Communication and information sharing?
Environmental Information System (EIS)
AEIN (UNEP)
Central archives (Mozambique)
Develop and coordinate enforcement mechanisms Establishment of mechanisms similar to regional OSRP/
particularly at regional level
IOC
Establishment of beach management units
Capacity building programmes
Harness political will to drive policies and
Capacity building for politicians
support governance
Training on negotiation and lobbying skills
Involvement of public, NGOs, EU
Develop and mainstream coordination
Coordination committees (e.g. EMPS in Seychelles)
Decentralized planning
Inadequate public awareness on the national legal
framework; ensuring environmental stewardship
Financial constraints
Local funding (SGP/UNDP)
Linking with local programmes for MDG, poverty
alleviation
International assistance
Economic instruments: polluter-pays principle
Source: UNEP WIOLAB (2007): Report of Third Regional Legal and Technical Taskforce.
39
5.5
The role of civil society
The role and influence of Civil Society Organisations (CSOs) in environmental governance generally,
and the coastal and marine environment in particular, whether at international, regional or local levels,
has been steadily growing over the years. Today CSOs are important stakeholders and partners in the
efforts to protect the environment of the WIO region. Nevertheless, there are also weaknesses and
limitations and constraints, as well as opportunities for further engagement.
The general roles of CSOs working on the coastal and marine environment in the WIO Region
include the following:
· Advocacy: Advocacy and campaigns for the improvement of the coastal and marine environment,
including the reduction, mitigation, or elimination of adverse impacts from land-based marine
activities, especially at the grassroots and community levels. This includes the establishment of
formal and informal networks and collaborative arrangements.
· Education, Training and Capacity Programmes: The development of enhanced capacity and
impact through education, training and research programmes is a key feature of the roles of CSOs
in the region. This includes the empowerment of communities and individuals to participate better
in the governance of coastal and marine resources.
· Research and Information: CSOs also have a role in research and information gathering relevant
to land-based marine activities in the region. Some of the organizations specialise in process
aspects, others in specific resources.
· Alternative Voice of Government: In their areas of mandate, CSOs in the region play the role of
alternative voices, which keeps government and public institutions in check and more accountable
to the public. In this role, CSOs assist governments in the provision of basic goods and services,
especially for poorer communities.
Some of the strengths of the CSOs as facilitators of governance include the following:
· International Financial Support: They are considered to be viable alternative vehicles to
government and at times are more flexible, possibly more efficient and generally seen as
corruption-free agents of development and environmental conservation. Because of these
features, CSOs are often recipients of financial support from international development
partners (see further discussion in section 5.6). Such support is usually directed towards
funding the human and institutional capacity development of the CSOs. Owing to this
support, more CSOs have either emerged or become strengthened and attracted some of the
best intellectuals and scientists in the region.
· Technical Capacity: Many of the CSOs in the region are run by highly trained and skilled
intellectuals, scientists and managers. Because they are generally project or activity-based,
there is usually a concentration of specific skills and competencies. This is the case with
regard to those which deal with coastal and marine environment of the WIO region, including
those involved in land-based activity issues.
· Operational Flexibility: Compared to government institutions or public authorities, CSOs are
generally more flexible operationally. Their financial and administrative operations, including
decision making, is more flexible than the more rigid structures of government.
· Participatory and Advocatory: CSOs are generally strong on participatory and advocacy
mechanisms, especially at the grassroots and community levels.
· Legitimacy: CSOs generally own the initiative and it is not imposed on them.
However, despite these well-recognised strengths, there are also areas of weaknesses and limitations
to the involvement of CSOs in governance of WIO marine and coastal resources, including aspects of
land-based marine pollution. These include:
40
· Poor Governance: Many CSOs, especially the smaller national ones, lack accountability and
proper governance structures, thus making it difficult to hold them responsible where they fail
to deliver on stated environmental goods and services.
· Weak Capacities: Many of the national CSOs lack financial and technical capacities to
contribute effectively to management of impacts from land-based activities. They are often
small or medium sized organisations whose impact is barely discernible.
· Lack of Coordinated Structure and Approach: In most of the countries, there appears to be an
absence of a specific coordination structure and approach to the work and intervention of the
CSOs working on land-based issues. This leads to duplication, rivalries, competition for
projects or exposure and consequently ineffective interventions. This applies even to the work
of larger, international or regional CSOs. However, in some countries a modicum of
coordination structure between NGOs does exist. For example, the Kenya Marine Forum
(KMF) is active in that country, while in Comoros there is the Association de Institutes pour
Developement et l'Environnement (AIDE). Unfortunately, however, where they exist they are
invariably weak. As regards international NGOs, the WIO-C (dealt with below) is expected
particularly to play a key coordinating role.
· Restricted or Limited Mandates: Unlike government and public institutions generally, CSOs
have restricted mandates, usually defined by their own constitutive instruments, their owners,
trustees or management, and the laws or framework under which they are registered or
operate. Thus they deal with specific issues or aspects of problems, often as a funded activity
or project. This leads to lack of institutional memory and limited impact. Some larger,
international CSOs also develop programmes primarily to sustain their economic viability,
high expenses, management fees and individual salaries.
5.5.1 International and regional Civil Society Organisations
Various international and regional, as well as national civil society organizations, have been active in
the WIO region over time, with emphasis on various aspects of the marine and coastal environment
and resources as outlined below. Many international (CSOs) have regional and/or national presence.
For convenience, international and regional CSOs are described in the remainder of this section while
national CSOs are the focus of section 5.5.2. .
The World Conservation Union (IUCN)
The IUCN was established in 1948 and brings together 83 States, 110 government agencies, over 800
non-governmental organizations (NGOs), and some 10,000 scientists and experts from 181 countries
in a unique worldwide partnership (www.iucn.org). Its 1,100 staff are located in 40 countries thus it is
a multicultural, multilingual organization with the world's largest and most important conservation
network. Its mission is to influence, encourage and assist societies throughout the world to conserve
the integrity and diversity of nature and to ensure that any use of natural resources is equitable and
ecologically sustainable. Its headquarters and secretariat is in Switzerland and while its undisputed
strength is the scientific basis of its activities it also has an Environmental Law Centre based in
Germany.
The IUCN has played an important role in developing treaties to protect wildlife, and for the
conservation of natural resources. It has also undertaken numerous studies and produced many
publications. These include the 1992 Convention on Biodiversity, the World Conservation Strategy
which has been published since 1980, and an on-going series of Red Data Books listing endangered
species of plants and animals.
The priority of IUCN's current Global Programme (20052008) is to build recognition of the many
ways in which human lives and livelihoods, especially of the poor, depend on the sustainable
management of natural resources. The Union attempts to apply sound ecosystem management to
conserve biodiversity and build sustainable livelihoods for those directly dependent on natural
resources in all its projects. Consequently, it is actively engaged in managing and restoring
41
ecosystems and improving people's lives, economies and societies, including land-based issues of
concern.
The IUCN East African Regional Office (EARO) was established in 1985, becoming the first IUCN's
first regional office worldwide. Through its ability to galvanise funds from international donors, and
to coordinate and manage implementation of programmes and activities (usually through sub-
contracting consultants), the EARO has contributed to several important interventions in the WIO
region. These including advocacy for rare, threatened and endangered species and habitats, as well as
education and awareness programmes. Examples are numerous and include the facilitation of the
Tanga Coastal Zone Conservation and Development Programme in Tanzania; the Eastern Africa
Marine and Coastal Ecosystems Programme; its partnership with other organizations to implement the
Jakarta Mandate for the implementation of the 1992 Biodiversity Convention; its support of the
Kisite Marine Park in Kenya; and, its support Tanzania's newly established Mnazi Bay-Ruvuma
Estuary Marine Park and Moheli Marine Park in the Comoros. In addition, the organization has been
assisting the region in the development of marine protected areas (MPAs), and particularly with the
production of a 'Toolkit' to help MPA managers find the resource information they need; as well as
also working in collaboration with the IUCN World Commission on Protected Areas to introduce the
concept of 'assessment of management effectiveness'. All these initiatives have a direct bearing on
land-based marine pollution.
Elsewhere, the IUCN supports projects on Kenya's coast such as the Diani Project which demonstrates
how marine/coastal conflicts may be reduced. Also, special attention is given to biodiversity
conservation in Small Island Developing States (SIDS), such as the Seychelles, where IUCN has been
managing a fund established to support a series of practical biodiversity conservation projects. In the
Comoros, IUCN assists with the implementation of a GEF funded biodiversity conservation project.
IUCN-EARO provides support for the implementation of the Nairobi Convention through assistance
to countries on national marine and coastal projects and through its regional work, funded by
NORAD, WWF, UNEP/ICRAN and the Coastal Zone Management Centre of the Netherlands
Western Indian Ocean Marine Science Association (WIOMSA)
WIOMSA is a non-governmental and non-profit regional organization for promoting the educational,
scientific and technological development of all aspects of marine sciences throughout the WIO region.
It promotes the educational, scientific and technological development of all aspects of marine sciences
in the region with a view toward sustaining the use and conservation of its marine resources
(www.wiomsa.org). The association gathers and disseminates marine science information, coordinates
meetings to foster marine science development and information exchange, and enhances
communication among the marine scientists and other professionals involved in the advancement of
marine science research and development in the WIO region (WIOMSA, 2006). Among the flagship
programmes of WIOMSA are the Marine Science for Management (MASMA); several marine
scientific symposia; and joint efforts and initiatives (with other partners) on the Jakarta Mandate for
implementation of the 1992 Biodiversity Convention.
World Wide Fund for Nature (WWF)
WWF was established in 1991 and operates in more than 100 countries. Its stated mission statement is
to stop the degradation of the planet's natural environment and to build a future in which humans live
in harmony with nature, by conserving the world's biological diversity; ensuring that the use of
renewable natural resources is sustainable; and promoting the reduction of pollution and wasteful
consumption. IUCN has secured funds for and is currently implementing around 2,000 conservation
projects, employing almost 4,000 people worldwide. Apart from several other interventions both in
the terrestrial and aquatic environment and natural resource base, the WWF has a global marine and
coastal component with several initiatives. These include a dedicated marine programme, MPAs,
sustainable fishing, sustainable resource use and climate change interventions (www.panda.org).
WWF has been involved in active conservation work in eastern Africa since 1962, beginning with the
purchase of land in Nakuru (Kenya) to allow for the establishment of an enlarged park to help support
42
the conservation of the flamingos of Lake Nakuru. The WWF Eastern Africa Regional Programme
Office (WWF-EARPO) was established in Nairobi in 1986 within the WWF Africa and Madagascar
Programme (WWF-AMP). WWF-EARPO acts as the principal focus within the eastern Africa region
by providing project support and evaluation at the local and regional level. WWF-EARPO's goal is to
ensure the conservation of biodiversity is in harmony with the needs and aspirations of local
communities and through partnership with players from different sectors of society.
In the marine and coastal environment, the main interventions have included the WWF's East African
Marine Ecoregion (EAME) project, based in Tanzania, with specific interventions in coastal forests in
Kenya and Tanzania; threatened marine turtles; and climate change. It is expected that an East African
Coastal Forest Programme is to be established to take a more wholesome and region-wide mandate
over coastal forests. The WWF works in close partnership with the Nairobi Convention and other
stakeholders to promote the marine and coastal environment of the WIO region.
Consortium for Conservation of Coastal and Marine Ecosystems in Western Indian Ocean, (WIO-C)
A particularly relevant development, given the clear need to coordinate matters to do with land-based
marine pollution in the WIO region, has been the relatively recent launch of the Consortium for
Conservation of Coastal and Marine Ecosystems in the Western Indian Ocean, (WIO-C) at UNEP in
Nairobi, in September 2006. Over the years, the governments of the WIO have voiced concern over
the continued degradation of the marine and coastal environment as a result of which several regional
organizations have developed strong coastal and marine conservation programmes. These
programmes include the EAME (see above), plus related projects implemented by CORDIO,
WIOMSA, WCS, UNEP and United Nations Educational, Scientific and Cultural Organization
(UNESCO). Due to the multiplicity of projects and programmes, a number of key stakeholders came
together to discuss and agree on how the initiatives can be more effective in influencing decision-
making and changing the face of natural resource management in the WIO region. WIO-C was
formed to rationalize these contributions and particularly to develop synergistic partnerships that will
advance the interests of marine research, conservation and management in the region.
The nine founding members: IUCN, WWF, WIOMSA, CORDIO, WCS, UNEP-Nairobi Convention,
Indian Ocean Commission (IOC), New Partnerships for African Development (NEPAD), and Inter-
Governmental Oceanographic Commission (IOC-UNESCO), are committed to anchor the Consortium
in the Nairobi Convention. The Consortium is expected to provide a credible network of
organizations, which will be able to provide decision support, share information and management
experiences, mobilize resources and develop collaborative programmes. These activities will
particularly relate to regional and transboundary issues. While the nine-member leadership group will
steer the Consortium, the day-to-day secretariat functions are to be a revolving responsibility
initially undertaken by the WWF-EAME office in Dar es Salaam, Tanzania. A formal launch took
place during the COP 5 meeting for the Nairobi Convention in November 2007.
Other international and regional CSOs active in the WIO region include Conservation International
(CI); Eastern African Wildlife Society (EAWS); and World Conservation Society (WCS).
5.5.2 National civil society organisations
There are numerous CSOs operating within the national territories of the countries of the WIO region.
A number are national branches of international or regional organizations described above; others are
homegrown, particularly at the community level. AKUNGA: Prof Kabudi suggest a few examples of
national CSOs because the next sentence does not quite follow as 5.5.1 deal with international. CAN
you add one or twoWhile the examples cited in section 5.5.1 above are by no means exhaustive, the
reality is that this category of LBSA stakeholders is important and indispensable in the governance of
the coastal and marine environment. In their respective areas of mandate, they perform critical
functions related to education and awareness, advocacy, research and information, and they also act as
alternative voice to government.
43
5.6 Financial
mechanisms
5.6.1 International and regional context
Financial mechanisms encompass not only the availability of finance but also include financial
instruments such as incentive schemes and commercial arrangements such as partnerships, all of
which together contribute to providing a secure financial basis to facilitate optimum environmental
management in the marine and coastal sector. The topic traverses international, regional and national
considerations partly because international stakeholders play an active role in national coastal sectors.
These range from resource extraction, recreation and tourism development, to trade, transport, and
communication. In this regard, the prevention of deterioration of the quality of environmental and
natural resources such as fisheries, and the maintenance of recreational amenities, coastal
infrastructure such as ports and harbours are ultimately all in the interest of both the international and
regional community.
In general, the demand for environmental financing arises as a result of political commitment to the
environment through budget transfers, users' willingness to pay for services and the use of
environmental resources, and the polluter's willingness, enforced or otherwise, to clean up and
prevent environmental degradation. National aspects such as coastal policies, institutions and
legislative processes, dealt with in the next section, should therefore facilitate and promote
international and regional funding and investments to combat land-based sources of marine pollution
(UNEP 2006)
Accordingly, a fundamental cross-cutting issue is the availability of financial resources in the WIO
region. This is critically important for the success of land-based activity interventions for all the
problem areas outlined in Chapter 4. It is suggested that the scarcity of financial resources, linked to
weak institutional capacity and the governance issue described above, remain the main limiting
factors against optimal land-based activity interventions. Such interventions include planning, the
setting of standards and designs, evaluation and implementation of concrete actions.
In the context of Large Marine Ecosystems (LMEs), Olsen et al. (2006) point out that `there are
literally hundreds of mechanisms for sustainable financing of LME programs'. Nevertheless, these
authors identify four basic methods of financing government programmes whatever area they might
target, namely: (i) taxes, (ii) user charges, (iii) borrowing (bonds and loans) and, (iv) grants.
The use of general tax revenues is not preferred in the current context, as firstly, use of such taxes
competes with other public funding priorities such as health care, education, infrastructure and
defence, and secondly, there is no direct relationship between the amount of taxes paid by individual
taxpayers and the amount of goods and services they have used or benefits received. The tendency in
the context of financing marine and coastal related projects accordingly is to move away from broad-
based taxation to the second category referred to above, namely user charges (also knows as fees or
selective taxes paid for ecosystem services). This form of revenue-raising balances what individuals
pay with the benefits they receive.
Olsen et al. (2006) describe user charges as the fees that individuals pay to their government based on
the benefits received or the amounts used of the goods or services provided by their government, and
distinguish four types of user charges:
a) User fees. These include royalties on the use of natural resources (e.g. a tax on fish landings),
bridge and highway tolls, lease and rental payments, and charges for recurring sales of
resources (e.g. water).
b) Regulatory Fees. These include charges for inspecting and testing services, permit and license
fees associated with regulatory programs, payment for providing electricity, water, and waste
44
water treatment services, solid waste disposal, construction of environmental facilities, permit
services, etc.
c) Beneficiary based taxes (or ear-marked taxes). These are correlated with but not tied to, the
use of a government-provided goods or services. For example. a government tax or levy on
fuel may be dedicated to financing highway construction.
d) Liability-based taxes. These are charges for purpose of abating hazards, and fall into the legal
category of the `polluter pays' principle. The best known example of this is the international
law scheme built around liability for oil spills and pollution.
As regards grants, the fourth category mentioned above, an important financing mechanism for
environmental protection generally in the WIO region is derived from domestic or international
development partners such as the GEF and donors. These are amenable to contribute funding in the
form of grants, loans, or other forms of financing without cost (UNEP, 2006). For lower income
countries, donors tend to be the main source of environmental financing together with International
Financial Institutions (IFIs). Bilateral and multilateral funding has been applied in the WIO region to
assist countries in the formulation and implementation of ICZM/ICARM policies, resource
management, capacity building, sectoral and regional programmes, and projects and research. Some
of the external funding is channeled through regional organizations such as the Indian Ocean
Commission (IOC), the UNEP/Nairobi Convention Secretariat (and related Nairobi Convention
Regional Coordination Unit (RCU) in Seychelles), the WIOMSA and the now defunct Secretariat for
Eastern African Coastal Area Management (SEACAM). Major external funding for activities,
including international waters, has come from the Swedish International Development
Agency/Department for Research Cooperation (Sida/SAREC); European Union (EU); World Bank
(WB); Norwegian Development Agency (NORAD); Ireland Aid; the governments of the
Netherlands, Finland and Denmark, the United States Agency for International Development
(USAID); and the Global Environmental Facility (GEF) (SEACAM, 2001). The links with these to
national institutions are elaborated further in section 5.6.2 below
CSOs, through their international donors, also contribute finance to implement projects, which largely
by-passes the formal hurdles of national governments. For example, established international CSOs
such as the WWF and IUCN, create a measure of sustainability and stability for interventions
addressing land-based sources and related environmental issues. It would be worthwhile for the
countries of the region to facilitate, promote and enhance the participation of such CSOs in order to
ensure long term financial sustainability of land-based activity interventions. From a WIO
perspective, the first priority is to secure and maintain a long-term sustainable financing mechanism to
support the Nairobi Convention secretariat and its programme of work related to land-based activities.
As important is the need to strengthen in-country capacity to address land-based activities which a
regional institution is ideally placed to facilitate.
5.6.2 National
context
The financing of activities related to land-based pollution and coastal disturbance issues is closely
linked to the funding of integrated national coastal management policies and initiatives. National
needs typically include funding for the development of infrastructure such as water and sewerage
services, and/or appropriate alternative technologies, access roads, markets, fish landing sites,
capacity building and human resource development. Related areas include financial resources and
mechanisms for implementing the National Programmes of Action (NPAs), and the Strategic Action
Programme (SAP) - expected to follow upon completion of this TDA. In practice, limited availability
of long-term financing is one of the main obstacles to increasing environmental protection generally
and reducing pollution from land-based sources in particular. This arises due to a variety of reasons
including low public sector allocations, limited participation by private sector and users of
environmental services, and lack of awareness of the services provided by ecosystems.
45
Sources of funding
Conventional sources of funding at national level include government allocations, through direct
budgetary allocations, or through market-based instruments such as taxes, rebates and the polluter-
pays principle. Also important are donor funding and private sector financing, support for civil
society, as well as interventions and contributions from external development partners amongst
others.
Government allocations have traditionally been, and remain, the main source of finance for
environmental protection generally and coastal and marine issues, including land-based activity
interventions. For example the government of South Africa directly allocated to their national
environmental authorities USD 90 million in 1999/2000 of which USD 13.8 million was allocated to
coastal management for environmental action (SEACAM, 2001). However, government allocations
are relatively more evident in the island states where there is a comparatively higher dependence upon
coastal resources compared to the Africa mainland states. The identification of domestic sources of
funding (bonds, soft loans, taxes, etc.) remains a key to securing long-term support. For example,
grants from the British Department for International Development (DfID) can assist in building a
sustainable funding strategy but the core must be found within domestic resources.
Apart from government allocation, a further important source of domestic resources for land-based
activity intervention is the private sector and civil society. As a category their contribution is smaller
than public sector allocations and even perhaps external resources. Civil society groups do, however,
play a small but increasingly important financing role, especially in working directly with local
communities in awareness raising and empowerment programmes, financed mainly from external
sources. However, the private sector is being increasingly involved in various development activities
in the WIO region especially in Mauritius, Reunion, and Seychelles (SEACAM, 2001). In Mauritius,
for example, an environment fund was established through which private sector invests in tourism and
coastal zone planning projects. In the Seychelles, the Environment Trust Fund attracts about USD
100,000 per annum from the private sector. Nevertheless, voluntary contributions from the private
sector remain isolated situations, mainly because investments for pollution abatement, such as waste
water treatment, are costly (SEACAM, 2001). The main expenditure related to interventions on
abating negative environmental impacts are usually in infrastructure, which have historically mainly
been public sector funded.
Apart from conventional financing mechanisms, innovative arrangements such as public- private
partnerships (PPPs) and decentralization may present appropriate financing options for coastal area
management (UNEP, 2006). By having the private sector invest in, and operate facilities for, public
services such as water supply and sewage services, the public utility may benefit from lower costs
as a result of the more efficient management practices that are characteristic of the private sector.
The PPP mechanism is being used in different places around the world with mixed outcomes (UNEP,
2006).
Apart from PPP, pure self interest of the private sector, which is seen to have an interest in
maintaining environmental quality in the coastal zone, can be a powerful motivating factor in
providing financial means for maintaining a healthy coastal environment. Thus, for example, on the
Kenyan coast, a group of hotels has formed a syndicate to manage sewerage outflows from their
respective resorts to maintain the environmental integrity and water quality of the coastal area to
ensure the sustainability of the tourist sector. Government-led incentive-based approaches can also be
invoked to promote environmental quality of coastal areas. A vivid example of this is the `Blue Flag'
Programme which has been invoked in South Africa over the last decade, following the example of
the EU. Twenty one beaches in South Africa have since been designated as such, meaning that they
guarantee a certain marine waters quality, provide minimum human health and safety standards, and
provide environmental information and management.
Donor funding, addressed briefly in section 5.6.1, is attractive as supplementary to local resources,
mindful of its limitations. These include lack of sustainability, as they are usually intended for specific
46
activities or sectors and are time-bound. Consequently they are often short-term with little chance of
durable impact on target groups (SEACAM, 2001; UNEP 2006). This often obliges the recipient
country to tailor or modify its funding request and proposal to meet donor criteria which may be
discordant with the priorities in the recipient countries. It has been pointed out that it is of vital
importance for donors to focus on projects which are initiated and designed by recipient countries,
according to their priorities (SEACAM, 2001). Moreover, there is also the risk of donor dependence,
especially where governments fail to take a firm position on national policies, priorities and practices.
Apart from this, where external donors are not properly coordinated, this may lead to strategic
confusion, financial wastage and ultimately an unsustainable result (SEACAM, 2001). Further
disadvantages of donor funding include the lengthy process for obtaining grants, especially from
multilateral organizations; significant lags between commitments and disbursements and the
possibility of undermining local efforts at self-sufficiency and reduction in the potential for leveraging
user-financing (UNEP, 2006). In recent year, donor `fatigue' has been noted, reflected in diminishing
inflows. It also remains doubtful whether donor support has in any event adequately addressed
national and regional priorities of coastal and marine issues.
In conclusion, the urgent priority for the future remains the rather elusive sustainable financing
mechanism for integrated coastal area management. It is essential for long-term action programmes to
have financial plans based on realistic expectations of grant transfers or external resources as well as
long-term sustainable domestic resources (UNEP, 2006). With respect to the latter, it is proposed that
carefully negotiated public-private partnerships may provide the basis for needed sustainable
investments in services such as sewage and solid waste disposal and other sources of land-based
pollution and degradation in the WIO region (SEACAM, 2001). A much needed strategy to break this
cycle of dependence is strengthening institutional capacities for planning and budgeting, including
mainstreaming environmental finance into national budgets.
Moreover, it is feasible to use existing or new legal and institutional instruments, such as
environmental taxes and environmental penalties, to improve the effectiveness of interventions.
Environmental taxes, which may include penalties for environmental crimes, levies on production
processes considered to be environmentally un-friendly, environmental licenses and/or permits or
fees, or similar, are possible lines of revenue on the domestic front which could augment formal
budgetary allocations in the countries.
5.7
Education and public awareness
An informed public is an empowered public, therefore education and public awareness programmes
are critically important for the sustainable management of the coastal and marine environment of the
WIO region and for more effective interventions against LBSA. Education and public awareness
programmes sensitize and empower the people, particularly coastal communities concerning the
coastal marine resource potential and uses. But education and public awareness programmes should
target entire national populations and should not be limited to coastal communities and public
officials and others directly involved in coastal zone governance. This is because LBSA issues are
intimately connected with upstream activities and communities from a wider geographic zone. Suffice
to say that education and public awareness concerning LBSA issues and interventions are critically
important in the region.
Through such programmes, national and local authorities can more easily initiate interventions
addressing LBSA, including more effective management and regulatory measures. Education and
public awareness also enlightens the public about development opportunities in the coastal zone as
well as sensitive ecosystems. Lack of education and awareness, on the other hand, leads to ignorance,
poor public participation and consequently increased pollution and degradation of the coastal and
marine environment.
47
Education initiatives
A variety of public awareness, educational and training programmes have been implemented in the
WIO region countries in recent years but largely in an ad hoc and un-coordinated manner. They have
been disseminated mainly through the public media, workshops, conferences and specific public
events, and they have had the effect of increasing awareness generally and particularly of ICAM
issues (SEACAM, 2001; WIO LaB/WIOMSA, 2007).
More recently, a WIO LaB-supported "Educational Needs Assessment" for the WIO region (WIO
LaB/WIOMSA, 2007) produced interesting results concerning education and awareness programmes
relevant to LBSA. The findings of the educational survey indicated that educational programmes in
most countries cover only limited aspects of marine and coastal environmental management.
However, some countries in the WIO region have in place more advanced education programmes in
this regard, which may prove to be useful in sharing of experiences between countries. From this
survey, countries with advanced and coordinated educational and outreach programmes included
Seychelles and South Africa.
These initiatives have largely been within the framework of more general ICAM pilot projects
launched in the countries in recent years which have included public awareness and educational
programmes such as for example in Kenya, Mauritius, Seychelles, Tanzania, and South Africa,
among others. Television, radio programmes, posters and bill-boards, and the Internet, have all
contributed to the raising of awareness and disseminating educational material, in spite of limited
access especially to TV and the Internet across the region. Best practices from Mauritius and
Seychelles include specific environmental media and education units which ensure the development
and implementation of specific media and awareness programmes throughout the year. In Mauritius,
the Information, Education and Research Division of the Ministry of Environment is fully involved in
such activities (SEACAM, 2001). The challenge is to replicate such programmes in the other
countries of the WIO region, and also to adequately emphasize LBSA issues.
These initiatives have had a measure of success in spite of various constraints including limited
national budget allocations, limited private sector participation, and intermittent and unsustainable
project-based donor support. It is suggested that these interventions can be improved by developing
appropriate legislative, policy and institutional frameworks to institutionalize public awareness and
education programmes. In addition, priority areas for attention could be identified and be incorporated
as action points in the Strategic Action Plan (SAP) for the WIO region.
Other critical challenges include the significant disparities in educational and socio-economic
opportunities faced by historically disadvantaged people (particularly in South Africa); the practical
challenges of establishing or mounting awareness and educational programmes among coastal zone
stakeholders in rural and remote coastal areas; and the need to focus more specifically on target
groups such as key decision makers, women and youth (SEACAM, 2001). As regards socio-economic
and educational disparities, it would be necessary to devise methodologies to disseminate technically
sophisticated information, inter-alia, by translating the same into "plain language" and in some cases
go further to accommodate illiterate coastal communities and other stakeholders (Ibid). A
corresponding challenge is to ensure that educational and public awareness programmes are available
at all levels, and incorporate indigenous knowledge and local expertise, for wider and greater
acceptability and sustainability.
Some of the national institutions responsible for educational and public awareness programmes in the
WIO region include national environmental authorities such NEMA (Kenya), NEMC (Tanzania),
DEAT (South Africa), MICOA (Mozambique), DGE (Comoros), ONE (Madagascar), MENR
(Seychelles) and the Department of Environment (Mauritius). Others include educational institutions
such as universities, which offer, among others, short courses and capacity-building for the
development of public education materials. Elsewhere, there is a significant contribution to
educational and awareness programmes by CSOs as highlighted the discussion of their roles under
section 5.5.
48
Educational priorities
Among the main outstanding priorities for further action include the raising of adequate and
sustainable financing for LBSA interventions, especially from national budgeting allocations, private
public partnerships and longer term development partner support, as discussed in section 5.6. Another
priority focus area is the development of capacity among institutions and human resources engaged in
educational and public awareness issues on LBSA. In this respect, the countries ought to take concrete
steps towards establishing effective legal policy and institutional frameworks to support the
development of needed capacities. One practical approach would be to create appropriate frameworks
to encourage and support private sector participation in educational and public awareness
programmes. This could be part of their commercial advertisements for their goods and services,
corporate and social responsibilities, and could entail financial contributions, the use of their
commercial outlets and networks, and their profiles and standing. Such programmes could be
integrated in private sector activities in key production and commercial activities such as tourism,
fishing, mining, urban developments, aquaculture and agriculture.
Some of the possibilities suggested by the WIO-LaB/WIOMSA study include the use of beach clean-
up campaigns to raise awareness in schools, as one area in which the WIO-LaB project could
contribute, particularly in countries like Tanzania (notably Zanzibar) and Comoros, modeled along the
International Coastal Clean-up campaigns that are held in Kenya annually. Moreover, the Coastal
Environment Award Scheme (CEAS) conducted in Tanzania was successful in raising awareness of
environmental issues as well as securing the support of communities during the development of the
National Integrated Coastal Management Strategy. This programme promotes public participation in
management of natural resources in the coastal region of Tanzania and encourages the use of
environment-friendly technologies and practices and demonstrates government commitment to
ICAM. CEAS could be used to motivate the communities to establish beach management units
(BMUs), like those now established in Kenya and around parts of Lake Victoria, make them
operational (WIO LaB/WIOMSA, 2007). Elsewhere, South Africa is the only country in the region
that has been participating in the Blue Flag Programme, and the other countries in the region such as
Kenya, the Seychelles and Mauritius, with substantial tourists visiting their coastal areas every year
could benefit, and be assisted to initiate the Blue Flag Programme for their beaches (WIO
LaB/WIOMSA, 2007).
Finally, to address both technical capacities for the longer term and to increase the national impact of
educational and public awareness campaigns, efforts should be made by countries of the WIO region
to introduce and integrate coastal and marine environment, including LBSA issues in the formal
curricula of schools and appropriate tertiary education institutions. At present, environmental studies
in the formal school curriculum is rather sparse and even more insignificant with regard to coastal and
marine or LBSA issues. This is in spite of the finding by the WIO LaB/WIOMSA study that some of
the countries do have well-established educational programmes at the higher level. Ultimately,
enhanced public awareness and education on LBSA issues will lead to greater and inclusive public
ownership and participation in appropriate interventions, and sustainable development and utilization,
financing, and management of the enormous coastal and marine environment and resources of the
WIO region.
5.8 Conclusions
Despite international conventions, national agreements, international and nation responsible
institutions, degradation of the coastal and marine environment seemingly continues apace. Though
simple single regional solution is apparent to stem the degradation, from a governance perspective it
is suggested that all the reasons referred to in section 5.2 above, of capacity and commitment at
national level contribute to this complex situation and should be a focus of initiatives to address
LBSA problems.
49
A common link among root causes of LBSA-related problems stems from the fact that governance
structures for LBSA management are inappropriate and inadequate. As described earlier (see section
5.2), though each of the three problem areas has its unique aspects, from the analysis it has become
clear that there a number of common weaknesses in governance-frameworks for LBSA management,
both at the national and the regional level that distract or impeded successful response to LBSA-
related problems (see Table 5-17).
Table 5-17 Common weaknesses in LBSA governance in the WIO region.
Category
Regional/international governance
National governance
Legal
· Absence and/or shortcomings in regional
· Absence and/or shortcoming in national
framework
inter-governmental agreements
legal and regulatory frameworks
· Shortcomings in the ratification and
· Fragmented (sectoral as opposed to
implementation of inter-governmental
integrated) legislation
agreements
· Poor/lack of enforcement of legislation
· Weak coordination of sectoral legislation
dealing with LBSA
Institutional · Absence of a regional `champion'
· Restricted capacity of national institutions
framework
providing oversight on LBSA governance · Inadequate cooperation and conflicting
· Shortcomings in collaboration and
mandates of national institutions
coordination between regional
· Insufficient stakeholder (including private
institutions
sector) involvement
· Lack of adequate regional financial
· Lack of adequate financial mechanisms and
mechanisms
resources
· Weak coordination of sectoral legislation
dealing with LBSA
Policy
· Absence of coherent regional policies and · Absence of coherent national policies and
framework
strategies
strategies
· Lack of awareness and recognition of the
· Lack of awareness and recognition of the
(economic) values of coastal and marine
(economic) values of coastal and marine
resources at the level of policy makers
resources at the level of policy makers
Similarly, there are a number of common causes that are the root of these weaknesses, notably with
respect to inappropriate and incoherent legislation, or lack of adequate institutional framework for
dealing with LBSA issues, which are often inter-related. A summary of such `root causes of
governance' is presented in Box 5.3.
Box 5.3 Summary of common governance related problem areas.
1. Lack of awareness, understanding and appreciation of economic value of coastal and/or marine
ecosystem goods and services at the level of policy-makers and legislators
2. Lack of mechanisms for effective coordination and inter-sectoral governance5
3. Lack of scientific and socio-economic data and information to support policy making and monitoring
and enforcement
4. Inadequate financial mechanisms and resources for dealing with LBSA-related issues
5. Implementation/enforcement of legislation not effectively monitored and legal instruments not
systematically updated
6. Insufficient public and stakeholder involvement and awareness
7. Inadequate human resources and technical capacity in institutions dealing with LBSA-related issues
8. Lack of oversight resulting in corruption
5 Including the use of management tools such as ICZM (or ICAM) policies and plans, Environmental Impact
Assessment (EIA) and Strategic Environmental Assessment (SEA)
50
As may furthermore be concluded from the analysis presented in this chapter, the number of
stakeholders involved are numerous and diverse. Coastal zone users are diverse in nature, involving a
variety of economic sectors such as fishing and aquaculture, agriculture and forestry, tourism, mining,
industry, transportation, energy production, as well as related coastal development and urbanisation
activities. Traditionally, governance of these sectors was based on a sectoral approach; each managed
separately through dedicated legal/regulatory, institutional and policy frameworks. This fact, in
addition to the often overlapping mandates and responsibilities of such stakeholders, makes LBSA
management a complex undertaking.
It is therefore not surprising that a primary root cause of governance failure is related to a lack of
coordination of administrative decisions affecting coastal and marine waters. A key conclusion that
may be derived is therefore that cross-cutting governance instruments need to be promoted and
developed to meet the unique challenges in the coastal zone. Such instruments and initiatives include
ICAM, EIA and SEA. A positive development is recognised whereby virtually all WIO countries
have to a greater or lesser degree commenced, or at least considered, the notion of ICZM in their
respective jurisdictions6, many with EIA policies and legislation in place and operational.
Furthermore, since many of the impacts related to LBSA cross borders, efforts should be focused on
harmonizing and adopting legislative frameworks at the regional level, developing and agreeing on
regional-level strategies for LBSA management (including financial mechanisms for their
implementation) and establishing mechanisms for coordination between institutions as well as
financial mechanisms. Various international and regional conventions, inter-governmental agreements
and institutions already exist, central to governance in the WIO region, though the task of
coordinating between such governing bodies and mechanisms remains a challenge. The need for a
lead institution is recognised.
The underlying cross-cutting theme which emerges from this governance analysis is the need for
coordination of the key instruments which together will lead to better governance in the strategy to
improve the quality of the coastal and marine waters in the WIO region. At the various levels of
governance such instruments would include:
· International level: Adoption and implementation of relevant international conventions and
agreements;
· Regional Level: Establishing and strengthening regional cooperation arrangements including
regional treaties, conventions and institutions; and,
· National Level: Identifying key legislative, institutional and policy inadequacies and
opportunities and developing and implementing measures to address these.
In developing and strengthening such instruments, the key themes are:
1. raising awareness at policy-maker level;
2. institutional capacity building;
3. filling data and information gaps;
4. adopting an inter-sectoral approach through tools such as ICZM, EIA and SEA;
5. establishing the necessary financial mechanisms; and,
6. adopting a participatory approach through effective stakeholder involvement.
The main recommendations emanating from this chapter are further outlined in Chapter 6.
6 South Africa has progressed furthest in that it has published the White Paper on Sustainable Coastal
Management and has tabled a Coastal Bill which includes a chapter on LBSA.
51

United Nations
Global Environment
Environment Programme
Facility
Transboundary Diagnostic Analysis of
Land-based Sources and Activities in the
Western Indian Ocean Region
CHAPTER 6 FINAL ANALYSIS AND CONCLUSIONS
Draft
November 2008
Table of contents
6
Final analysis and conclusions ................................................................................................. 1
6.1
Introduction......................................................................................................................... 1
6.2
Overall synthesis of transboundary problems..................................................................... 1
6.3
Summary of transboundary problems ................................................................................. 4
6.3.1 Water and sediment quality degeneration from land-based sources ............................... 4
6.3.2 Physical alteration and destruction of habitats (PADH) ................................................. 6
6.3.3 Alteration in fresh water flows and sediment loads from rivers ..................................... 8
6.4
Overview of governance problems related to LBSA management .................................... 10
6.5
Prioritization of transboundary problems and related causes.......................................... 12
6.6
The way ahead: a framework for a Strategic Action Programme..................................... 13
Annexes
Annex 1
Criteria for the prioritization of transboundary problems
Annex 2
Results of the prioritization exercise
Annex 3
Framework for SAP development
UNEP-GEF WIO-LaB Project
6
Final analysis and conclusions
6.1 Introduction
This final Chapter of the TDA presents a synthesis and overall analysis of the transboundary problem
analyses presented in the previous chapters. It also provides an overview of the various possible areas
of intervention required to address the different problems identified, as part of the long-term Strategic
Action Programme on LBSA for the WIO region.
6.2 Overall synthesis of transboundary problems
The three main categories of transboundary environmental problems related to LBSA that described in
detail in Chapter 4 are:
1. Water and sediment quality degeneration due to pollution from land-based sources;
2. Physical alteration and destruction of habitats; and
3. Alteration in freshwater flows and sediment loads from rivers.
An overview of the main elements, root causes and sectors involved in each of the three problem
categories is shown (Table 6-1). This simple analysis reveals some general conclusions, under three
themes:
A. Transboundary elements
· All three categories have a transboundary nature that is common throughout the region, as is
their potential effects on shared coastal habitats impacting on the reproduction rate and health of
migratory species.
· Apart from certain types of pollution, which may result in direct transboundary effects (in
particular as it concerns persistent substances and marine litter), the transboundary effects
resulting from pollution, PADH and river-coast interactions are more indirect, i.e. through
impacting on important, but specific and confined, coastal habitats that in turn influence the
overall ecosystem integrity of the WIO.
B. Root causes
· Common root causes are related to population pressure, poverty and equality, knowledge and
awareness gaps, inadequate financial resources and inappropriate governance, which are
relevant to all categories of transboundary problems.
· Climate change and other natural processes, as well as economic drivers, influence mainly
physical alteration of habitats and impact on river basins, in particular in terms of insustainable
use/extraction of resources.
C. Sectors
· Most economic sectors are cross-cutting, i.e. they affect all three categories of transboundary
problems (although not all to the same extent), but two are more specific:
a. Industry is relevant mostly to water quality degradation
b. Fisheries is mainly relevant only to physical alteration of habitats and impacts on river
basins
A synthesizing analysis of each of the three problem areas is presented in the sections that follow.
Furthermore, section 6.4 provides an overall analysis of the governance aspects related to the three
transboundary problem areas, based upon the findings of Chapter 5.
UNEP-GEF WIO-LaB Project
1
· Table 6-1
Synthesis Matrix of transboundary problems (see Box 6-1 for description of codes).
Major Transboundary Problem
Transboundary elements
Major root causes
Main sectors
ss
s
ces
awarene
velopment
a
l
processe
our
and
y
a
tur
t
ure
tr
tal de
n
a
l
i
t
y
a
l res
v
e
rnance
coas
and
fores
on
essure
equ
aquacul
i
n
e go
nanci
nowledge
ge
v
ers
o
n
u
c
ti
fi
k
an
ti
od
o
n pr
a
te
ta
ch
c
dri
t
ure and
or
ati
y and
quate
qu
ate
omi
try
y pr
vert
p
propriat
i
m
erg
c
on
urism
r
ansp
n
Popul
Po
Ina
Inade
Inade
Cl
E
Fisheries and
Agricul
To
Mining
Indus
T
E
Urbanization and
Common in all countries
WATER AND SEDIMENT
Affecting spawning areas for
QUALITY DEGENERATION
migratory marine organisms
DUE TO POLLUTION FROM
Potential for transboundary dispersion
LAND-BASED SOURCES
of persistent pollutants and litter
Common in all countries
PHYSICAL ALTERATION
Affecting spawning areas for
AND DESTRUCTION OF
migratory marine organisms
HABITATS
ALTERATION IN
Common in many countries
FRESHWATER FLOWS AND
Affecting spawning areas for
SEDIMENT LOADS FROM
migratory marine organisms
RIVERS
Category codes
A
B
C
D
E
F
G
1
2
3
4
5
6
7
8
UNEP-GEF WIO-LaB Project
2
· Box 6-1 Index to category codes of root
causes and sectors in Table 6-1.
Generic sectors
1
Fisheries and aquaculture
Artisanal fishers
Industrial fishers
Generic Root Causes
Seaweed farmers
A Population pressure
Industrial prawn farmers
Rapid population growth and associated
Fish & shellfish farmers
urbanization increases generation of waste
2
Agriculture and forestry
and concentration of waste streams. Also,
Charcoal makers
population growth leads to increased
Small-scale loggers
demand for ecosystem goods and services.
Industrial loggers
B Poverty and inequality
Small-scale farmers
The WIO region is characterized by some
Large-scale farmers
of the highest poverty levels in the world.
Pastoralists
The consequent lack of resources leads to
Ranchers
inadequate sanitation infrastructure, and
Poultry farmers
institutions and regulatory bodies lacking
Dairy farmers
capacity.
Beekeepers
C Inappropriate governance
3
Tourism
Relates to the absence of adequate policy,
Tourists
legal and institutional structures and
Hotel owners & operators
building blocks for effective management
Small-scale traders
of the coastal and marine environment.
Tourist boat & SCUBA operators
D Inadequate financial resources
4
Mining
The absence of adequate financial
Coral/lime miners
resources, whether in absolute terms or
Sand miners
through inadequate priority setting, for
Small-scale salt producers
effective management of the coastal and
Industrial salt works
marine environment is widespread.
Small-scale miners
Industrial mining companies
E Inadequate knowledge and awareness
Fuel suppliers & stations
Knowledge deficiencies and inadequate
Oil & gas production
awareness of both population and policy
makers are a major cause of management
5
Industry
inefficiencies.
Heavy manufacturing industry
Light manufacturing industry
F Climate change and natural processes
Agro-processing industries
Climate change and natural variability
Oil refining
influence the flow patterns of rivers
impacting on floodplains and deltas and is
6
Transportation
the main cause of coral bleaching.
Ports
Dredging companies
G Economic drivers
Clearing and forwarding
The demand for ecosystem goods and
Railway
services, including from export markets,
Roads
may exceed availability and regeneration
Airports
capacity of elements of the ecosystem.
Airlines
Shipping
7
Energy production
Hydro-dam operators
Power station operators
Renewable energy producers
8
Urbanization and Coastal
Development
Coastal communities
Solid waste operators
Sewage managers
Property developers
Town planners
UNEP-GEF WIO-LaB Project
3
6.3 Summary of transboundary problems
6.3.1 Water and sediment quality degeneration from land-based sources
A significant amount of the pollution load to the sea emanates from land-based activities, such as
municipal and industrial discharges, contaminated surface and sub-surface run-off, including from
agriculture, and atmospheric emissions. Pollutant loads from such land-based activities are typically
disposed of in the coastal zone where they affect some of the most productive areas of the marine
environment, such as estuaries and near-shore waters. Moreover, contaminants which pose risks to
human health and living resources can be transported long distances by watercourses, ocean currents
and atmospheric processes.
Chapter 4 identified five distinguishable pollution categories, a brief summary of which is presented in
Table 6-2. The various categories of pollution are not equally common or widely spread through the
region and in many cases their impacts are confined to specific hot spots, often related to urban centers
and/or river outlets. In all, 35 hotspot sites of pollution were identified and the specific transboundary
problems associated with each are presented in Table 6-3.
From the analysis presented in section 4.2 it was shown that the highest pollutant loads entering the
WIO originate from the mainland states and Madagascar. South Africa and Tanzania contribute the
greatest overall loading of nutrients and organic matter, material originating mainly from the discharge
of untreated wastewater from the larger coastal municipalities.
· Table 6-2
Overview of the five pollution categories identified in the TDA.
Microbial
Microbial contamination refers to the presence of pathogenic organisms
contamination
(protozoa, bacteria and/or viruses) in the aquatic environment of either human or
animal origin that can pose health risks to humans. In the WIO region, microbial
contamination of coastal waters is typically associated with inappropriate
disposal of municipal wastewater, contaminated surface and sub-surface runoff
from urban areas, contaminated runoff from agricultural areas used for livestock
rearing and industrial effluents (mainly from food processing industries).
High suspended solids
High suspended solid loads from land-based sources enter WIO coastal waters
mainly through municipal and industrial wastewater discharges, river discharges
and surface runoff, particularly during rainy seasons. Dredging activities (usually
associated with ports and harbours) can also significantly contribute to this
transboundary problem.
Chemical pollution
Chemical pollution refers to the adverse effects of chemical contaminants (heavy
metals, hydrocarbons and persistent organic compounds) released to the coastal
environment from land-based human activities. Sources in the WIO region are
typically linked to agrochemical discharges, dredging activities in ports and
harbour (releasing sediment-bound heavy metals and hydrocarbons), leachate
from solid waste dump sites, and atmospheric emissions (e.g. heavy metals).
Marine litter
Inappropriate disposal of solid waste represents a serious problem in most of the
urban centers in the WIO region, although quantitative data are limited. Marine
litter refers to the introduction of solid waste materials into water bodies and
their surroundings. Important land-based sources of waste are urban centers
(ports, industrial and commercial areas and informal settlements) and discharges
through rivers (transporting solid waste from adjacent catchments).
Eutrophication
Eutrophication refers to artificially enhanced primary productivity (algal and
(harmful/nuisance algal phytoplankton growth) and organic matter loading in coastal waters as a result of
blooms)
the increased availability or supply of nutrients, usually as a result of
inappropriate disposal of municipal wastewater or nutrient-enriched agricultural
return flows. It should be noted that `eutrophication' in the true sense of the
word, hardly ever occurs in the coastal waters of the WIO region; rather - the
main issue is that of harmful/nuisance algal blooms resulting from nutrient
enrichment.
UNEP-GEF WIO-LaB Project
4
· Table 6-3
Overview of pollution hotspots in the WIO region and associated (perceived) pollution problems.
TRANSBOUNDARY PROBLEM
er
d
COUNTRY
HOT SPOT
nde
r
obial
e
litt
pe
solids
Mic
blooms)
Chemical
Pollution
contamination
(solid waste)
Sus
Eutrophication
(harmful algal
Marin
Mitsamihouli beach
Chindini Beach
Chomoni Beach
Comoros
Moroni Port
Anjouan Port
Fomboni Port
Mombassa
Vanga Creek (Wasini)
Lamu
Kenya
Malindi/Watamu Marine Park
Malindi Bay
Ungwana Bay
Port de Mahajanga
Port de Nosy-Be
Madagascar
Toliara
Baie de Fort-Dauphin
Port Louis Harbour
Pointe Aux Sables
Baie du Tombeau
Bain des Dames
Mauritius
Palmar
Belle Mare
Grand Baie
Rodrigues
Maputo Bay
Mozambique
Nacala Bay
La Digue
Anse Volbert
Seychelles
East coast Mahe
Port Launay Marine Park
Mahe Wetland
South Africa
Richards Bay
Dar es Salaam
Tanzania
Tanga
Zanzibar
UNEP-GEF WIO-LaB Project
5
One main conclusion gained from the above overview of pollution hotspots in the WIO region, shown
in Table 6-3, is that the most common transboundary problem related to pollution is microbial
contamination. With the evidence presented in section 4.2 it may further be concluded that microbial
contamination, largely originating from the discharge of untreated wastewater in nearshore waters, is
one of the most significant common failures of the authorities in the region. This form of pollution
also has the highest level of impact, mainly in terms of health risks to the population (through both
direct contact with seawater and consumption of seafood products).
The second important failing to be recognised is the continued inappropriate management of solid
waste which leads to marine litter, a now common feature at the coasts of Comoros, Mozambique,
Kenya and Tanzania. Issues elated to high levels of suspeneded solids, furthermore, are largely
confined to areas around the main river outlets, while chemical pollution is mostly associated with the
presence of major ports. Eutrophication and harmful algal blooms were generally rated as a problem of
lower importance, with the exception of Seychelles and Mauritius where cases of seasonal harmful
algal blooms have been reported.
6.3.2 Physical alteration and destruction of habitats (PADH)
One of the priority transboundary problems for the WIO region is the transformation and loss of
habitats. These transformations are both physical, as in the dredging of waterways, deforestation,
diversion of freshwater flows, and construction of ports and jetties, tourist resorts, and housing
developments; and biological, as in over-exploitation of living resources such as coastal forests,
mangroves, seagrass beds and coral reefs. In addition, global climate change, which is a cross-cutting
concern at least partly attributed to human activities, has led to abnormal rainfall patterns, droughts,
floods, and sea level changes. Finally, land reclamation for agriculture and development, as well as
extensive upland deforestation, cause acute problems for the major river catchments in the region, as
witnessed in Tana, Sabaki, Rufiji and Zambezi.
The cumulative impacts of these transformations and losses have lead to significant physical and
ecological changes in the region and an overall decline in many ecosystem services. These impacts are
grouped under five categories of PADH and presented in Table 6-4.
In all, 25 hotspot sites of PADH were identified in the WIO region, and the specific transboundary
problems associated with each are presented in Table 6-5. It is obvious that the categories or types of
PADH are not the same throughout the region, although all countries face problems related to
shoreline changes, albeit to varying extents. The other categories of PADH are largely dependent on
the extent to which certain resources are available, such as mangroves, which are found mainly in
Tanzania, Kenya, Mozambique and Madagascar, and coral reefs which are mainly limited to the island
states, Kenya and Tanzania.
UNEP-GEF WIO-LaB Project
6
· Table 6-4
Overview of the five categories of PADH identified in the TDA.
Degradation of
As a dynamic zone between land and the sea, mangrove wetlands are controlled by
mangrove forests
several interacting factors such as tides, periodicity of freshwater and sediment
influx, topography, soil and water salinity, temperature and sedimentation patterns.
These factors are closely related to land and water use practices in the areas adjacent
to and upstream of the mangrove forests. Human-induced stresses range from
diversion of freshwater, poor land-use in and around mangrove forests to over-
exploitation of the mangrove resources. These stresses disrupt the natural
equilibrium, ultimately leading to the degradation of the mangrove wetlands which
in turn not only depletes the resources within their boundaries, but also affects the
productivity of the adjacent coastal and marine ecosystems.
Degradation of seagrass Seagrass degradation in the WIO region is generally evidenced by continued
beds
destruction and/or reduction of seagrass habitats in shallow inter-tidal and sub-tidal
areas. This degradation is usually as a result of physical action (e.g. dragging of nets,
clearing), pollution or by climate change through increased discharge of sediment-
laden low salinity water derived from flooded river systems. Seagrass degradation
has negative impacts on the system's productivity, biodiversity and food security,
and ultimately leads to loss of livelihood and increased poverty among coastal
populations.
Degradation of coral
Coral reef ecosystems face various types and levels of impact across the WIO
reefs
region. In addition to anthropogenic threats such as the use of destructive fishing
nets, there is climate change, which has led to severe coral bleaching during the
1997-98 El Niño Southern Oscillation, damaging reefs throughout the region.
Continuous degradation of coral reef biodiversity ultimately leads to reduction in
fisheries productivity that eventually impacts on the livelihood and incomes, thereby
leading to increased poverty levels.
Degradation of coastal
Degradation of coastal forests is mainly in the form of land transformation through
forests
intense clearing for agriculture, mining, human settlement and coastal development,
including tourism. There is also destruction associated with an increased demand for
forest products such as timber and firewood. Transformation of coastal forest
impacts on the coastal environment through reduction of plant and faunal diversity,
resulting in soils prone to erosion, reducing recharge of groundwater aquifers and
negatively affecting the development infrastructure. Ultimately, these impacts
change the dynamics of both sediment and water exchange in the coastal zone.
Shoreline changes
Sedimentation and/or accretion of the coastline results in shoreline changes, the two
main sources being: changes in sediment loads from rivers; and, re-suspension of
benthic sediments by rough seas or through trawling activities over soft substrate.
Coastal areas in the WIO region are dominated by loose sediments; eroding rapidly,
this has led to loss of land for agriculture, human settlement, infrastructure
development as well as damage to coastal infrastructure. Also, increased water
turbidity, due to re-suspended sediments, results among others in smothering of
corals and seagrasses, as well as suffocation and eventually death of mangrove trees.
Sea level rise is an additional problem of concern for low lying coastal areas, such as
in central Mozambique, the west coast of Madagascar, Tana and Rufiji Deltas.
UNEP-GEF WIO-LaB Project
7
· Table 6-5
Overview of PADH hotspots in the WIO region.
TRANSBOUNDARY PROBLEM
ds
e
COUNTRY
HOT SPOT
eefs
ass be
r
forests
o
relin
h
mangrove
agr
coral
S
changes
Degradation of
Degradation of
se
Degradation of
Degradation of
coastal forests
Moheli
Comoros
Grand Comoros
Anjuan
Malindi Ungwana Bay
Vanga-Msambweni Complex
Kenya
Tana Delta
Mida Creek
Toliare
Mahanjanga Bay
Madagascar
Nosy Be
Hahavavy
Rodrigues
Mauritius
Grand Bay
Flic en Flac
Maputo Bay
Mozambique
Nacala-Mossuril seascape
Zambezi delta
La Digue
Seychelles
East Coast, Mahé
Anse Volbert, Praslin
South Africa
Richards Bay
Dar es Salaam
Tanga Coastal Area
Tanzania
Zanzibar
Bagamoyo
6.3.3 Alteration in fresh water flows and sediment loads from rivers
One of the key areas of concern for the WIO region relates to the interaction between river basins and
the coastal and marine environment. Throughout much of the region, many of the coastal issues
identified are linked to human activities and climatic variability far removed from the coastline. This is
especially so for continental states. Such distant impacts have altered the nature of the drainage
through the river systems large and small impeding the flow of freshwater, terrigenous sediment
and organic matter. They have also affected the quality of the water, mainly through the addition of
nutrients and pollutants from domestic sewage and industrial and agricultural chemicals. An overview
of the two main categories of river-coast interaction is presented in Table 6-6.
UNEP-GEF WIO-LaB Project
8
· Table 6-6
Overview of the two categories of river-coast interaction identified in the TDA.
Alteration of river
The alteration of the natural river flow (whether through a drop in quality, quantity
flows and water quality or timing of flow) is found to some degree in many of the major river basins in the
WIO region. The four most frequent reasons for flow alterations are: (i) overall
reduced flow due to consumptive uses of water, (ii) increase of river surface area
along sections of the river due to impoundment, (iii) changed seasonal flow patterns
(e.g. releases for hydropower-generation during the dry season), (iv) increased
floods due to wetland losses (loss of water retention capacity). These are coupled
with the large-scale realities and uncertainties brought about as a consequence of
climatic change, with some basins predicted to receive more rainfall than the historic
mean and others less.
Alteration of sediment
A number of factors, such as changing climatic conditions, land use practices and
loads
dam construction, have led to changes in the sediment load transported by some of
the rivers in the WIO region. The alteration of sediment loads broadly manifests
itself in three ways:
· Increased sediment loads May have a negative impact on the marine
environment, through for example the degradation (smothering) of coral reef
ecosystem. e.g. Athi-Sabaki and the Betsiboka rivers.
· Decreased sediment loads Has a negative impact on the marine environment
through increased erosion of the delta mouth, and through salt-water intrusion,
leading to a reduction of downstream habitats for mangroves and other species,
e.g. Zambezi and Incomati rivers.
· Variable sediment loads in different parts of the basin - in some rivers, both
increased sediment loads, from erosion in upstream areas, and reduced sediment
transport downstream of dams following the trapping of the sediments behind the
dam wall are observed. It is difficult to judge what the impacts of such an altered
situation is on the marine ecology, with no studies found covering the issue.
An overview of the type of river-coast interaction problems for the 15 main river basins in the WIO
region is presented in Table 6-7. In terms of severity of problems associated with these river systems,
it is quite obvious that alteration of river flow is most common throughout the region. Neverthless,
there are cases where changes in sediment loading and water quality have severely impacted on
coastal habitats. According to the analysis, the most affected river basins are:
· Pangani (Kenya and Tanzania);
· Athi-Sabaki (Kenya);
· Incomati (South Africa, Swaziland and Mozambique);
· Zambezi (Angola, Botswana, Democratic Republic of Congo (DRC), Malawi, Namibia,
Tanzania, Zambia, Zimbabwe and Mozambique); and
· Betsiboka (Madagascar).
UNEP-GEF WIO-LaB Project
9
· Table 6-7
Overview of river-coast interaction problems for main rivers in the WIO region.
TRANSBOUNDARY PROBLEM
in
e in
e
in
COUNTRY*
HOT SPOT
u
a
lity
nt load
nt load
river flow
dime
dime
Alteration
I
n
creas
Decreas
Degradation of
water q
se
se
Tana
Kenya
Athi-Sabaki
Betsiboka
Tsiribihina
Madagascar
Mangoky
Fiherenana
Zambezi
Pungue
Mozambique
Limpopo
Incomati
Maputo
South Africa
Thukela
Pangani
Tanzania
Rufiji
Ruvuma
*Refers to country of river outflow
Issues of `critical' concern
6.4 Overview of governance problems related to LBSA management
As may be concluded from the analysis presented in this TDA, despite international conventions,
national agreements, international and nation responsible institutions, degradation of the coastal and
marine environment seemingly continues apace. As concluded in section 6.2, a common link among
root causes of LBSA-related problems stems from the fact that governance structures for LBSA
management are inappropriate and inadequate. Furthermore, as described in Chapter 5 (section 5.2),
though each of the three problem areas has its unique aspects, from the analysis it has become clear
that there a number of common weaknesses in governance-frameworks for LBSA management, both
at the national and the regional level that distract or impeded successful response to LBSA-related
problems (see Table 6-8).
· Table 6-8
Common weaknesses in LBSA governance in the WIO region.
Category
Regional/international governance
National governance
Legal
· Absence and/or shortcomings in regional
· Absence and/or shortcoming in national
framework
inter-governmental agreements
legal and regulatory frameworks
· Shortcomings in the ratification and
· Fragmented (sectoral as opposed to
implementation of inter-governmental
integrated) legislation
agreements
· Poor/lack of enforcement of legislation
UNEP-GEF WIO-LaB Project
10
Category
Regional/international governance
National governance
Institutional · Absence of a regional `champion'
· Restricted capacity of national institutions
framework
providing oversight on LBSA governance
· Inadequate cooperation and conflicting
· Shortcomings in collaboration and
mandates of national institutions
coordination between regional institutions
· Insufficient stakeholder (including private
· Lack of adequate regional financial
sector) involvement
mechanisms
· Lack of adequate financial mechanisms and
resources
Policy
· Absence of coherent regional policies and · Absence of coherent national policies and
framework
strategies
strategies
· Lack of awareness and recognition of the
· Lack of awareness and recognition of the
(economic) values of coastal and marine
(economic) values of coastal and marine
resources at the level of policy makers
resources at the level of policy makers
As may be concluded from the assessment presented in Chapter 5, there are a number of common
causes that are the root of these weaknesses, notably with respect to inappropriate and incoherent
legislation, or lack of adequate institutional framework for dealing with LBSA issues, which are often
inter-related. A summary of such `root causes of governance' is presented in Box 6-2.
· Box 6-2
Summary of common governance related problem areas.
1. Lack of awareness, understanding and appreciation of economic value of coastal and/or marine
ecosystem goods and services at the level of policy-makers and legislators
2. Lack of mechanisms for effective coordination and inter-sectoral governance1
3. Lack of scientific and socio-economic data and information to support policy making and monitoring
and enforcement
4. Inadequate financial mechanisms and resources for dealing with LBSA-related issues
5. Implementation/enforcement of legislation not effectively monitored and legal instruments not
systematically updated
6. Insufficient public and stakeholder involvement and awareness
7. Inadequate human resources and technical capacity in institutions dealing with LBSA-related issues
8. Lack of oversight resulting in corruption
As may furthermore be concluded from the stakeholder analyses presented in this TDA, the number of
stakeholders involved are numerous and diverse. Coastal zone users are diverse in nature, involving a
variety of economic sectors such as fishing and aquaculture, agriculture and forestry, tourism, mining,
industry, transportation, energy production, as well as related coastal development and urbanisation
activities. Traditionally, governance of these sectors was based on a sectoral approach; each managed
separately through dedicated legal/regulatory, institutional and policy frameworks. This fact, in
addition to the often overlapping mandates and responsibilities of such stakeholders, makes LBSA
management a complex undertaking.
It is therefore not surprising that a primary root cause of governance failure is related to a lack of
coordination of administrative decisions affecting coastal and marine waters. A key conclusion that
may be derived is therefore that cross-cutting governance instruments need to be promoted and
developed to meet the unique challenges in the coastal zone. Such instruments and initiatives include
ICZM, EIA and SEA. A positive development is recognised whereby virtually all WIO countries have
to a greater or lesser degree commenced, or at least considered, the notion of ICZM in their respective
jurisdictions2, many with EIA policies and legislation in place and operational.
1 Including the use of management tools such as ICZM policies and plans, Environmental Impact Assessment
(EIA) and Strategic Environmental Assessment (SEA)
2 South Africa has progressed furthest in that it has published the White Paper on Sustainable Coastal
Management and has tabled a Coastal Bill which includes a chapter on LBSA.
UNEP-GEF WIO-LaB Project
11
Furthermore, since many of the impacts related to LBSA cross borders, efforts should be focused on
harmonizing and adopting legislative frameworks at the regional level, developing and agreeing on
regional-level strategies for LBSA management (including financial mechanisms for their
implementation) and establishing mechanisms for coordination between institutions as well as
financial mechanisms. Various international and regional conventions, inter-governmental agreements
and institutions already exist, central to governance in the WIO region, though the task of coordinating
between such governing bodies and mechanisms remains a challenge. The need for a lead institution is
recognised.
The underlying cross-cutting theme which emerges from this governance analysis is the need for
coordination of the key instruments which together will lead to better governance in the strategy to
improve the quality of the coastal and marine waters in the WIO region. At the various levels of
governance such instruments would include:
· International level: Adoption and implementation of relevant international conventions and
agreements;
· Regional Level: Establishing and strengthening regional cooperation arrangements including
regional treaties, conventions and institutions; and,
· National Level: Identifying key legislative, institutional and policy inadequacies and
opportunities and developing and implementing measures to address these.
In developing and strengthening such instruments, the key themes are:
1. raising awareness at policy-maker level;
2. institutional capacity building;
3. filling data and information gaps;
4. adopting an inter-sectoral approach through tools such as ICZM, EIA and SEA;
5. establishing the necessary financial mechanisms; and,
6. adopting a participatory approach through effective stakeholder involvement.
6.5 Prioritization of transboundary problems and related causes
An initial prioritization of transboundary problems was undertaken as part of a regional stakeholder
meeting held from 17 - 19 April 2007 in Nairobi (UNEP, 2007). The primary method applied for this
exercise was a multi-criteria analysis undertaken by over 40 experts from various disciplines and
representing all the project countries, based on a set of six criteria, which may be divided into two
general categories:
(a) the scope of the problem:
· Transboundary nature of the problem (i.e. geographical scope)
· Scale of benefits of resolving problem
· Feasibility of finding solutions to the problem
(b) the severity of the problem:
· Environmental impact of the problem
· Socio-economic impact of the problem
· Macro-economic consequences of the problem
Following detailed analysis of the transboundary problems, the prioritization of problems was further
refined. During the Scientific and Technical Review Workshop of the TDA held in Mombassa, Kenya
in August 2008, the various problems and causes were analysed through a step-wise prioritization
exercise. A detailed overview and description of the method and criteria used for prioritization, as well
a detailed report on its results is presented in Annex 1 and 2 respectively. The results of the
UNEP-GEF WIO-LaB Project
12
prioritization exercise identify the key issues that should be on top of the list of policy makers when
defining actions and strategies.
6.6 The way ahead: a framework for a Strategic Action Programme
This TDA identifies the key transboundary problems related to the impacts of land-based activities on
the marine and coastal environment of the WIO. Throughout the different steps of the TDA and in
particular during consultations with stakeholders, a number of priority areas of intervention to address
such problems were identified. It is recommended that these areas of intervention will form the basis
for development of the SAP. An overview of these priority areas of intervention derived from the
TDA process is presented in Annex 3.
Annex 3 identifies specific actions for each of the three main problem areas, as well as a number of
cross-cutting areas of intervention. Four main categories of actions are defined:
1. Monitoring and Assessment - actions geared at filling gaps in data and information in order
to generate the necessary knowledge for better, more sustainable management.
2. Management Tools - actions geared towards the preparation of management tools such as
guidelines and investment plans, as well as actions geared towards demonstrating appropriate
approaches.
3. Governance - actions geared towards the development and implementation of governance
frameworks, including policies, laws, regulations and standards, as well in stimulating and
supporting governments in mainstreaming marine and coastal management in existing policies
and budgets.
4. Information management, capacity building and awareness raising - actions geared at
capacity building and education, as well as providing platforms for information exchange and
interaction with stakeholders.
It is suggested that during the various steps of the SAP development, the areas of intervention will be
further defined, detailed and prioritized.
Annex 3 furthermore identifies potential partners that could be involved in the design and
implementation of specific actions. It is recommended that consultations with such stakeholders be
held to define specific, targeted interventions, including investment plans and required policy, legal
and institutional changes.
At the national level, attention will furthermore be paid to the mainstreaming of SAP activities into
national policy and legal frameworks, development plans and budgets. At the regional level,
supporting activities will be defined, including activities directed at capacity building, strengthening of
the regional legal framework and financial mechanisms.
UNEP-GEF WIO-LaB Project
13
Annex 1
Criteria for the prioritization of transboundary problems
LEVEL 1: PRIORITIZATION OF TRANSBOUNDARY PROBLEMS
Simple Rating Form:
Severity
Scope
Overall
rating
Problem 1
Problem 2
Problem 3
Problem 4
Problem 5
Rating Criteria for Transboundary Problems
Severity - The level of damage to the WIO coastal and marine ecosystem that can reasonably
be expected within 10 years under current circumstances (i.e., given the continuation of the
existing situation).
· Very High: Likely to destroy or eliminate part of the ecosystem.
· High: Likely to seriously degrade part of the ecosystem.
· Medium: Likely to moderately degrade part of the ecosystem.
· Limited: Likely to only slightly impair part of the ecosystem.
Scope - Most commonly defined spatially as the geographic scope of impact on the ecosystem
integrity that can reasonably be expected within 10 years under current circumstances (i.e.,
given the continuation of the existing situation).
· Very High: Likely to be widespread or pervasive in its scope and affect the ecosystem
throughout the WIO region.
· High: Likely to be widespread in its scope and affect the ecosystem in many parts of
the WIO region.
· Medium: The threat is likely to be localized in its scope and affect the ecosystem in
some parts of the WIO region.
· Limited: Likely to be very localized in its scope and affect the ecosystem in limited
parts of the WIO region.
Overall rating:
Use this table to derive an overall rating. If you don't feel comfortable with the results, you
might prefer to revise the table.
Scope
Very High
High
Medium
Limited
Very High
Very High
High
Medium
Limited
High
High
High
Medium
Limited
Medium
Medium
Medium
Medium
Limited
Severity
Limited
Limited
Limited
Limited
Limited
UNEP-GEF WIO-LaB Project
14
LEVEL 2: PRIORITIZATION OF DIRECT CAUSES
Simple Rating Form
For each transboundary problem, list and rank the immediate causes, using the criteria below.
For example:
Problem 1: Microbial contamination
Contribution
Irreversibility
Overall
rating
Direct Cause 1: (e.g. Disposal of
un- or under-treated municipal VH, H, M, or L VH, H, M, or L VH, H, M, or L
wastewater
Direct Cause 2
Direct Cause 3
Rating Criteria for Direct Causes:
Contribution - The expected contribution of the cause, acting alone, to the full expression of
a threat (as determined in the threat assessment) under current circumstances (i.e. given the
continuation of the existing management situation).
· Very High: The cause is a very large contributor of the particular problem.
· High: The cause is a large contributor of the particular problem.
· Medium: The cause is a moderate contributor of the particular problem.
· Limited: The cause is a limited contributor of the particular problem.
Irreversibility - The degree to which the effects of a cause of problem can be restored.
· Very High: The cause produces a problem that is not reversible (e.g., destruction of
coral reefs due to unsustainable fishing practices).
· High: The cause produces a problem that is reversible, but not practically affordable
(e.g. changed river flow regime due to damming).
· Medium: The cause produces a problem that is reversible with a reasonable
commitment of resources (e.g. conversion of mangrove wetland into fish pond).
· Limited: The cause produces a problem that is easily reversible at relatively low cost
(e.g. degenerated water quality due to wastewater discharge).
Overall rating:
Overall Rating is calculated from the matrix below; for example, if the Irreversibility is Very
High and the Contribution is Medium, the overall rank of the source is High.
Contribution
Very High
High
Medium
Limited
Very High
Very High
High
High
Limited
-
High
Very High
High
Medium
Limited
ibility
Medium
High
Medium
Medium
Limited
Irrevers
Limited
High
Medium
Limited
Limited
UNEP-GEF WIO-LaB Project
15
LEVEL 3: COMBINING RATINGS
Combining problems (level 1) and causes (level 2) ratings results in a combined rating and it
done using the threat matrix below.
Cause
Very High
High
Medium
Limited
Very High
Very High Very High
High
Medium
High
High
High
Medium
Limited
Medium
Medium
Medium
Limited
Limited
Problem
Limited
Limited
Limited
Limited
Limited
UNEP-GEF WIO-LaB Project
16
Annex 2
Results of the prioritization exercise
PHYSICAL ALTERATION AND DEGRADATION OF HABITATS
Level 1
Prioritarization of Transboundary problems
Problem area
Severity
Scope
Overall rating
Mangroves
VH
H
H
Seagrasses
H
H
H
Coral Reefs
VH
H
H
Coastal
forests
VH VH VH
5. Shoreline change
M
M
M
Level 2
Prioritization of direct causes
Problem 1: Degradation of Mangroves
Contribution Irreversibility Overall
rating
Coastal flooding due sea level rise
H
VH
H
Sedimentation due to heavy rainfall
H
H
H
Alteration of freshwater flow
M
H
M
Clearance for human settlement
L
L
L
Pollution due wastewater discharge
L
M
L
Conversion for aquaculture
L
H
M
Conversion for industrial use
L
VH
L
Conversion for salt works
H
H
H
Deforestation for timber/poles, fuel
VH M H
wood, etc
Problem 2: Degradation of Seagrass beds
Contribution Irreversibility Overall
rating
Sedimentation due to heavy rainfall
H
M
H
Alteration of freshwater flow
L
L
L
Pollution from wastewater discharge
M
H
M
Land reclamation
L
M
L
Sea urchin grazing
H
M
M
Seaweed farming
L
L
L
Overfishing & bad fishing practices
M
M
M
Seagrass removal for clam collection &
H H H
swimming (tourism)
Problem 3: Degradation of Coral Reef ecosystem
Contribution
Irreversibility Overall
rating
Sedimentation due to heavy rainfall
L
H
M
Pollution from wastewater discharge
L
M
L
Land reclamation
L
L
L
Increased reef activity causing anchor
H M M
damages on the reef
Overfishing & bad fishing practices
H
M
M
Coral bleaching
VH
VH
VH
Alteration of freshwater flow
L
L
L
UNEP-GEF WIO-LaB Project
17
Problem 4: Degradation of Coastal Forests
Contribution
Irreversibility Overall
rating
Salt water intrusion
L
H
L
Clearance for human settlement
H
H
H
Pollution due to wastewater discharge
L
L
L
Conversion for aquaculture
L
L
L
Conversion for industry
M
H
M
Alteration of freshwater flow &
L L L
sediment load due to dam construction
Conversion for salt works
L
L
L
Deforestation for fuel wood & timber
VH
VH
VH
Overgrazing
L
L
L
Land clearance for agriculture
H
VH
H
Uncontrolled wild fires
M
M
M
Problem 5: Shoreline change
Contribution
Irreversibility Overall
rating
Coastal flooding due to climate
M H M
change/sea level rise
Destruction & degradation of wetlands
M
H
M
Clearance of natural vegetation
H
H
H
Land reclamation
L
L
L
Land conversion for aquaculture
L
L
L
Mining of beach sand and removal of
M M M
fossil corals
Dredging for ports and harbours
L
L
L
Alteration in freshwater flow and
H H H
sediment loads due to dam construction
Conversion of habitat for salt works
L
M
L
Land clearance for agriculture
M
M
M
UNEP-GEF WIO-LaB Project
18
Level 3
Overall ranking
TRANSBOUNDARY PROBLEM
Coastal
Shore-line
Mangroves
Seagrasses
Coral reefs
DIRECT CAUSES
forests
change
H L
Coastal flooding as a result of sea level rise
H
H
M
Sedimentation associated with heavy river sediment discharge
M
L
Alteration of fresh water flow
M
Salt water intrusion
L
Destruction and/or degradation of wetlands
L VH
M
Clearance of natural vegetation for human settlement
L
M
L
M
Pollution (discharge of municipal wastewater agricultural and industrial effluents, including
accidental oil spillage)
L
L L
Land reclamation
M
Increased sea urchin population associated with reduction in predators (due to inappropriate fishing
practices or changes in environmental conditions)
L
Seaweed harvesting for commercial purposes
M
Increased reef activity
M
Anchor damage
M
M
Over-fishing and bad fishing practices
VH
Coral bleaching
M M
L
Conversion of habitats for aquaculture/mariculture
L H
Conversion of habitats to industrial zones
L
Mining of beach sand and removal of corals
L
Dredging for port and harbours
M
L
L
M
M
Alteration in freshwater flows and sediment loads due to dam construction
H M
L
Conversion of habitats for saltworks
H VH
Deforestation to meet timber and fuelwood needs
H
Seagrass beds removal for clam collection and bathers (tourists)
H VH
Over-harvesting for supply of fuelwood and charcoal
M
Overgrazing associated with high cattle population
VH
L
Land clearance for agriculture
H
Uncontrolled wild fires
Key:
L: Limited
M: Medium
H: High VH: Very High
UNEP-GEF WIO-LaB Project
19
DEGRADATION OF WATER AND SEDIMENT QUALITY
Level 1
Prioritarization of Transboundary problems
Problems Severity
Scope
Overall
rating
Microbiological contamination
H
H
H
High Suspended Solids Concentration
H
H
H
Chemical pollution
M
L
L
Marine litter and debris
L
L
L
Eutrophication
L L L
Level 2
Prioritization of direct causes
Problem 1: Microbial contamination
Direct Cause
Contribution
Reversibility Overall
rating
Disposal of un- or under-treated municipal
VH H VH
wastewater
Industriesa discharging un- or under-treated
L H L
industrial effluents
Waste from coastal mining and minerals (oil,
L H L
gas, etc) exploration activities
Contaminated surface and sub-surface runoff
H H M
(from municipal, industrial and agricultural
areas, as well as from accidental spills)
River discharges transporting high suspended
M H M
sediment loads (as a result of basin soil
erosion) and/or transporting municipal/
industrial wastes and agrochemicals from
catchment areas
Runoff from livestock rearing areas
L
H
L
Inadequate collection, treatment and disposal
L H L
of solid waste in urban areas
Problem 2: Eutrophication
Direct Cause
Contribution
Reversibility Overall
rating
Disposal of un- or under-treated municipal
H H H
wastewater
Industriesa discharging un- or under-treated
L H L
industrial effluents
Waste from coastal mining and exploration
L H L
activities
Contaminated surface and sub-surface runoff
M H M
(e.g. from municipal, industrial and
agricultural areas, as well as from accidental
spills)
River discharges transporting high suspended
M H M
sediment loads (due to soil erosion) and/or
transporting municipal/ industrial waste and
agrochemicals from catchment areas
Leaking of agrochemical (fertilizer and
L H L
pesticide residues) from storage facilities,
dumping or return-flows
Runoff from livestock rearing areas
L
H
L
UNEP-GEF WIO-LaB Project
20
Problem 3: Marine litter and Debris
Direct Cause
Contribution
Reversibility Overall
rating
Contaminated surface and sub-surface runoff
M M M
from municipal, industrial and agricultural
areas, as well as from accidental spills)
River discharges transporting high suspended
M H M
sediment loads (due to soil erosion) and/or
transporting municipal/ industrial waste and
agrochemicals from catchments
Inadequate collection, treatment and disposal
H H H
of solid waste
Public littering on beaches and in areas
H H H
where marine litter can be transported into
coastal areas
Problem 4: High suspended sediment concentration
Direct Cause
Contribution
Reversibility Overall
rating
Disposal of un- or under-treated municipal
M H H
wastewater
Industries discharging un- or under-treated
H H H
industrial effluents
Dredging activities in ports and harbours
L
H
L
Waste from coastal mining and exploration
M H M
activities
Contaminated surface and sub-surface runoff
VH H VH
(from municipal, industrial and agricultural
areas, as well as from accidental spills)
Destruction of coastal forests contributing to
M H M
high suspended solid loads
River discharges transporting high suspended
VH H VH
sediment loads (due to soil erosion) and/or
transporting municipal/ industrial waste and
agrochemicals from catchment areas
Waste products from aquaculture farms -
L H L
high in nutrients and suspended solid loads
Problem 5: Chemical pollution
Direct Cause
Contribution
Reversibility Overall
rating
Industriesa discharging un- or under-treated
VH H VH
industrial effluents
Dredging activities in ports and harbours
L
L
L
Waste from coastal mining and mineral (oil,
L L L
gas, etc) exploration activities
Contaminated surface and sub-surface runoff
H H H
(from municipal, industrial and agricultural
areas, as well as from accidental spills)
River discharges transporting high suspended
H L M
sediment loads (due to soil erosion) and/or
transporting municipal/industrial waste and
agrochemicals from catchment areas
Leaking of agrochemical (fertilizer and
L L L
pesticide residues) from inadequate storage
facilities, dumping or return-flows
Inadequate collection, treatment and disposal
L L L
of solid waste in urban areas
UNEP-GEF WIO-LaB Project
21
Level 3
Overall ranking
TRANSBOUNDARY PROBLEM
DIRECT CAUSE
Microbial
Eutrophi-
Marine litter
Suspended
Chemical
contamination
cation
and debris
solids
Pollution
H
L H
Disposal of un- or under-treated municipal wastewater
L
L H
L
Industries a discharging un- or under-treated industrial wastewater
L
L
Dredging activities in ports and harbours
L
L M
L
Waste from coastal mining and mineral (oil, gas, etc) exploration activities
M
L
L
H
L
Contaminated surface and sub-surface runoff (e.g. from municipal, industrial and agricultural
areas, as well as from accidental spills)
M
Destruction of coastal forests contributing to high suspended solid loads
M
L
L
H
L
River discharges transporting high suspended sediment loads (as a result of soil erosion) and/or
transporting municipal/ industrial waste and agrochemicals from catchment areas
L
L
Leaking of agrochemical (fertilizer and pesticide residues) from inadequate storage facilities,
dumping or return-flows
L
L
Runoff from livestock rearing areas
L L L
Inadequate collection, treatment and disposal of solid waste
L
Public littering on beaches and in areas where litter can be transported into coastal areas
L
Waste products from aquaculture farms that are high in nutrients and suspended solid loads
Key:
L: Limited
M: Medium
H: High VH: Very High
UNEP-GEF WIO-LaB Project
22
ALTERATION OF FRESHWATER FLOW AND SEDIMENT LOAD
Level 1
Prioritarization of Transboundary problems
Severity
Scope
Overall
rating
Alteration of River Flow
H
H
H
Water Quality Degradation
M
M
M
Increased Sediment Loads
H
M
M
Decreased
Sediment
Loads
M M M
Level 2
Prioritization of direct causes
Problem 1: Alteration of river flows
Contribution
Irreversibility Overall
rating
Damming of rivers
VH
M H
Direct abstraction of freshwater
VH
L
H
Inter-basin water transfers
H
H
H
Hydrological variability
L
VH
L
Alteration of climatic conditions
H
H
H
Problem 2: Water quality degeneration
Contribution
Irreversibility Overall
rating
Damming of rivers
L
H
L
Direct abstraction of freshwater
L
M
L
Poor land use in river basins
H
M
M
Agricultural run-off
VH
H
VH
Wastewater discharges
VH
H
VH
Storm water run-off
H
H
H
Problem 3: Increased sediment Loads
Contribution
Irreversibility Overall
rating
Poor land use in river basins
VH
H
VH
Changes in vegetation types and
H H H
patterns
Alteration in climatic conditions
L
H
L
Unsustainable agricultural practices
VH
H
VH
Deforestation of catchment areas
VH
H
VH
Encroachment on river banks
H
H
H
Sand mining in river courses
VH
H
VH
Road development in river basins
H
M
M
Problem 4: Decreased sediment loads
Contribution
Irreversibility Overall
rating
Damming of rivers
VH
H
VH
Inter-basin water transfers
H
H
H
Changes in vegetation types and
H H H
patterns
Alteration of climatic conditions
L
H
L
Canalization and impoundment of
L H L
rivers for navigation purposes
UNEP-GEF WIO-LaB Project
23
Level 3
Overall ranking
TRANSBOUNDARY PROBLEM
Alteration of river
Water quality
Increased sediment
Decreased
IMMEDIATE CAUSES
flow
degradation3
loads
sediment loads
H
L
M
Damming of rivers
H
L
Direct water abstraction for urban water supply and irrigation agriculture
H
M
Inter-basin water transfer
L
Hydrological variability
L
H
Poor land-use in river basins
M
Agricultural runoff of nutrients and pesticide residues
M
Wastewater discharges
M
Stormwater runoff
H
M
Changes in vegetation types and patterns
H
L
L
Alteration of climatic conditions
H
Unsustainable agricultural practices/techniques (e.g. slash and burn)
H
Deforestation of catchment areas
H
Encroachment on river banks
H
Mining of sand and aggregates within river courses
M
Road development in rural and urban areas
L
Canalization and impoundment of rivers for navigation purposes
Key:
L: Limited
M: Medium
H: High VH: Very High
3 Whereas the overall ranking is low, water quality degeneration is a problem in some hotspots
UNEP-GEF WIO-LaB Project
24
PRIORITIZATION OF OVERNANCE RELATED ISSUES:
Problem
Severity Scope
Overall
rating
Implementation/enforcement of legislation not effectively monitored and legal instruments not systematically
VH VH VH
updated
Inadequate of awareness, understanding and appreciation of economic value of coastal-marine ecosystem
VH H H
goods and services at the level of policy-makers and legislators
Lack of mechanisms for effective coordination and inter-sectoral governance
H
H
H
Inadequate financial resources for dealing with LBSA-related issues
VH
H
H
Inadequate scientific and socio-economic data and information to support policy making and monitoring and
M M M
enforcement
Insufficient public and stakeholder involvement and awareness
M M M
Inadequate human resources and technical capacity in institutions dealing with LBSA-related issues
H
H
H
Inadequate oversight resulting in corruption
H
H
H
Inadequate ratification and domestication of relevant international and regional instruments and awareness
H
H
H
Key:
L: Limited
M: Medium
H: High VH: Very High
UNEP-GEF WIO-LaB Project
25
Annex 3
Framework for SAP development
PROBLEM AREA 1: Water and sediment quality degeneration due to pollution from
land-based sources
Type of
Activities/solutions
Implementing Partners
intervention
Monitoring
Fill gaps (e.g. identified in the national pollution status reports) in
National & Local
and
knowledge of priority pollutants, including major sources of pollution
Government
Assessment
and the driving forces, with special emphasis on the identified coastal
Industries
hotspots of pollution.
Research Institutions
Management
Develop specific regional guidelines and demonstrate best practice
UNEP/NCS
Tools
technologies and management approaches for:
UNEP/GPA
· Municipal and industrial wastewater and solid waste (including
Industries
governance aspects such as holding products manufacturers
IMO
responsible for the treatment and recycling of their packaging,
Port Authorities
applying the `polluter pays' and `cradle to grave' principles and
National & Local
introducing economic incentives for low-waste packaging).
Government
· Ports and harbours (including issues related to on- and offloading,
Research Institutions
disposal of waste from vessels, disposal of used oil and oil related
products, and contingency planning in instances of accidental spills).
· Agricultural activities (including issues related to soil erosion,
agrochemical application and livestock raising).
Develop regional guidelines for setting effluent limit values (ELV) /
UNEP/NCS
standards for different industry types based on a Technology-based
National Government
Approach or Environmental Quality Objective (EQO)-based approach
Industries
Research Institutions
Develop targeted investment plans and proposals for the establishment
National & Local
of appropriate wastewater and solid waste management infrastructure in
Government
priority hot spots of pollution, e.g. based on the above-mentioned
Industries
guidelines and lessons learnt from the demonstration projects.
Governance
Establish sector-specific effluent limit values (ELV) / standards for
National Government
different industry types based on a Technology-based Approach and/or
Industries
Environmental Quality Objective (EQO)-based approach and develop
Research Institutions
mechanisms to convert such scientifically set standards into legally
enforceable mechanisms.
Mainstream the above-mentioned guidelines and investment plans into
National & Local
national policies, strategies, legislation and budgets.
Government
Enforce legislations/regulation for industries to conduct EIA studies and
National Government
regular audits to assess and evaluate potential impacts on the coastal
Industries
marine environment - in alignment with the overarching EQOs and
sector-specific ELVs and ensure that local level (`on the ground')
mechanisms are in place to audit and enforce compliance (e.g.
monitoring programmes, incentive systems and penalty systems).
Develop a register of municipal wastewater and solid waste manage-
National & Local
ment facilities for each country (working towards a permitting system
Government
particularly for central wastewater treatment facilities and landfills).
Develop a register of manufacturing industries working towards a
National & Local
permitting system for such facilities.
Government
Industries
Develop a register of agro-chemical use (e.g. fertilizers, pesticides,
National & Regional
herbicides, etc), specifying allowable products and dosages (working
Government
towards legally enforcing such specifications).
Farmers
Identify and establish sustainable financial mechanisms for investments
UNEP/NCS
in the field of wastewater and solid waste management, and cleaner
National Governments
production technology (including through development of public-private IFIs
partnerships).
Information
Develop and enroll regional training programmes to build capacity in
UNEP/GPA
management,
wastewater and solid waste management (in many instances focusing on UNEP/NCS
UNEP-GEF WIO-LaB Project
26
capacity
local municipalities and harbour authorities).
National Government
building and
Educational Institutions
awareness
Develop and enroll regional education and awareness programmes to
UNEP/NCS
raising
inform all sectors of society (e.g. general public, politicians and
National Government
managers) on their roles and responsibilities in the generation,
Education Institutions
collection, treatment and disposal of wastewater and solid waste, as well
as the consequences on the environment and socio-economic wellbeing.
Develop and maintain a web-based regional information management
UNEP/NCS
system that includes information on best practice technologies, registers
UNEP/GPA
(listed above) as well as tools and guidelines for the selection of
National Government
appropriate technology, institutional and policy frameworks and
IT Institution
financial mechanisms.
UNEP-GEF WIO-LaB Project
27
PROBLEM AREA 2: Physical Alteration and Destruction of Habitats (PADH)
Type of
Activities/solutions
Implementing Partners
intervention
Monitoring
Assess the current status of the critical coastal and marine habitats
UNEP/NCS
and
(mangroves, seagrasses, coral reef, coastal forests etc), including threats
Research institutions
assessment
to their long term sustainability.
NGOs (WWF, IUCN)
Undertake an assessment of ecosystem goods and services, including an
UNEP/NCS
economic valuation of coastal and marine habitats.
ASCLMEs Project
Research institutions
Undertake an assessment of the vulnerability of coastal and marine
UNEP/NCS
habitats to climate change and variability (as far as not already done as
ASCLMEs Project
part of IPCC assessment reports).
Research institutions
Management
Generate thematic coastal-marine habitat GIS maps for the WIO region.
UNEP/NCS
tools
National & Local Gov
NGOs (WWF, IUCN)
Develop guidelines and demonstrate appropriate (management)
UNEP/NCS
approaches, technologies and actions to reduce and prevent the
UNE P/GPA
degradation of the coastal and marine environment caused by PADH.
National & Local Gov
Research institutions
Develop guidelines and demonstrate appropriate (management)
UNEP/NCS
approaches, techniques and actions for the rehabilitation and/or
GovDepartments
restoration of degraded critical coastal-marine habitats.
NGOs (WWF, IUCN)
Develop guidelines and demonstrate appropriate (management)
UNEP/NCS
approaches, techniques and actions for mitigation of and adaptation to
ASCLMEs Project
impacts related to climate change and variability.
National & Local Gov
Research institutions
Governance
Enforce legislations/regulation for EIA studies and audits to assess and
National & Local Gov.
evaluate potential impacts of coastal developments on the coastal marine
environment and ensure that local level (`on the ground') mechanisms
are in place to audit and enforce compliance (e.g. monitoring
programmes, incentive systems and penalty systems).
Develop targeted conservation and rehabilitation plans for critical
National & Local Gov.
coastal habitats in selected areas in the WIO Region.
NGOs
Research institutions
Develop specific mitigation and adaptation plans for areas (in particular
National & Local Gov.
critical coastal and marine habitats) vulnerable to climate change and
Research institutions
variability.
Mainstream above-mentioned guidelines and conservation and rehabi-
National & Local Gov.
litation plans into national policies, strategies, legislation and budgets.
Information
Strengthen local capacity in the conservation and rehabilitation of
UNEP/GPA
management,
marine and coastal habitats through training and workshops.
UNEP/NCS
capacity
National Gov.
building and
Educational institutions
awareness
NGOs (WWF, IUCN)
raising
Develop and implement educational and awareness raising programmes
UNEP/NCS
with regard to the value of critical coastal habitats in selected areas in
National Gov.
the WIO Region.
Educational Institutions,
NGOs
Maintain an online regional toolkit for PADH management, including
UNEP/NCS
the above-mentioned guidelines.
UNEP/GPA
National Gov.
IT Institutions
UNEP-GEF WIO-LaB Project
28
PROBLEM AREA 3: Alteration in fresh water flows and sediment loads from rivers
Type of intervention Activities/solutions
Implementing Partners
Monitoring and
Develop detailed environmental profiles (including river-
UNEP/NCS
assessment
coast interactions) for selected major river systems in the
River Basin Organizations
WIO region, including desktop and field research.
Research institutions
Review gaps in existing political, legal and institutional
UNEP/NCS
frameworks for dealing with river-coast interactions affecting
River Basin Organizations
the coastal and marine environment, in particular as they
National Government
concerns transboundary river basins.
Research Institutions
Undertake an assessment of the potential impact of climate
UNEP/NCS
change and variability on main river basins, including river-
ASCLMEs Project
coast interaction.
Research institutions
Perform an assessment of the water-related infrastructure
UNEP/NCS
planned on the major river basins of the WIO region and
River Basin Organizations
assess their potential impacts on the marine ecosystem and
National Departments of
possible mitigative strategies which may be implemented.
Water
Research Institutions
Management tools
Based upon experiences from the region and beyond, develop
UNEP/NCS
a toolkit for ICARM in the WIO Region.
UNEP/GPA
Research Institutions
GWP (link with IWRM
Toolbox)
Governance
Develop detailed ICARM plans (or related instruments) for
River Basin Organizations
the main river basins, linking up with existing or planned
National Government
basin management plans.
GWP
Research Institutions
Mainstream the ICARM Plans (or related instruments) into
River Basin Organizations
national policies, strategies, legislation and budgets.
National Departments of
Water
Information
Promote and enhance the integrated management of river
UNEP/NCS
management,
basin and coastal zones through the application of the ICARM UNEP/GPA
capacity building and principles and their incorporation into national and regional
River Basin Organizations
awareness
IWRM planning processes.
National Government
GWP
Strengthen capacity in the field of ICARM through training
UNEP/NCS
and workshops, including topics such as environmental water
UNEP/GPA
requirements, environmental management plans for dams and
River Basin Organizations
options assessment.
National Governments
GWP
Educational institutions
Maintain an online regional toolkit for ICARM, including the
UNEP/NCS
above-mentioned guidelines.
UNEP/GPA
National Governments
IT Institution
UNEP-GEF WIO-LaB Project
29
Cross-cutting issues
Type of intervention
Activities/solutions
Implementing Partners
Monitoring and
Prepare biennial State of the Coast Environment
UNEP/NCS
assessment
Reports Update, identifying information and activity
National Governments
gaps.
Management tools
Develop framework environmental legislation for
UNEP/NCS
LBS/A Management.
UNEP/DELC
National Governments
Develop basic GIS products (regional maps,
UNEP/NCS
overlays) to support regional monitoring and
UNEP/DEWA
assessments of the coastal and marine environment
and its threats.
Governance
Mainstream LBS/A Management in national policy,
UNEP/NCS
legal and institutional frameworks, including the
UNEP/DELC
ratification and implementation of relevant
National Governments
multilateral environmental agreements.
Develop realistic national strategies for managing
UNEP/NCS
LBS/A in the form of National Programmes of
UNEP/GPA
Action (NPAs) or related instruments such as ICZM
National Governments
plans, NEAPs, etc.
Catalyze implementation of NPAs (or related
National & Local
instruments) through political awareness raising,
Governments
public debates and the development of targeted
interventions including investment plans.
Strengthen the Nairobi Convention EAF/RCU as the
UNEP/NCS
recognized and effective Regional Seas coordinating
unit for all regional policies and activities related to
coastal and marine resources.
Develop and ratify Protocol on Environmental
UNEP/NCS
Assessment to the Nairobi Convention and promote
UNEP/DELC
the development of similar Protocols at the level of
National Governments
the Regional Economic Commissions (SADC, IOC,
etc.).
Mainstream the implementation of the Strategic
UNEP/NCS
Action Programme in national and regional policies,
National Governments
strategies and budgets and undertake monitoring
thereof.
Develop and strengthen regional and national Public-
UNEP/NCS
Private Partnerships related to LBS/A management.
National Governments
Strengthen stakeholder involvement in LBS/A
UNEP/NCS
management.
National Governments
Develop regional sustainable financing mechanisms
UNEP/NCS
to address marine and coastal environment
National Governments
management issues.
IFIs
Information
Operate and continuously update the Nairobi
UNEP/NCS
management, capacity Convention Clearing House Mechanism (a regional
National Governments
building and
information system on the WIO marine and coastal
IT Institution
awareness raising
environment and its management).
Develop and maintain relevant institutional and
UNEP/NCS
thematic expert networks related to LBS/A
WIOMSA
management as a means of regional capacity building
and knowledge exchange.
Provide support to the development and
UNEP/NCS
implementation of relevant environmental
National Governments
educational and awareness raising programs at all
Educational institutions
levels on LBS/A issues.
NGOs
UNEP-GEF WIO-LaB Project
30

United Nations
Global Environment
Environment Programme
Facility
Transboundary Diagnostic Analysis of
Land-based Sources and Activities in the
Western Indian Ocean Region
BIBLIOGRAPHY
Draft
November 2008

UNEP-GEF WIO-LaB Project
Addressing Land Based Activities in the Western Indian Ocean
BIBLIOGRAPHY
Abdallah, F.A., Bacari, A., Sinane, H.M., Ibrahim, Y. and Mouridi, A.A. 2006. Comores rapport national
sommaire sur les activites terrestes, les sources de pollution et les niveaux des polluants dans l'eau et
les sediments: Comores. Draft report submitted to WIO-Lab PMU, Nairobi, Kenya.
Abuodha, P.A.W. 2003. Coastal erosion in Kenya: The Bamburi-Shanzu case study. A report prepared for
UNEP/GPA, UNEP and WIOMSA.
Abuodha, P.A.W. and Kairo, J.G. 2001. Human-induced stresses on mangrove swamps along the Kenyan
coast. Hydrobiologia 458: 255-265.
AFRISCO, 1994. Lake Chala Water Resources Development Project (Phase One). Project Evaluation
Report to Coast Development Authority, Kenya. Afrisco Ltd., Israel.
Ahamada, S., Bijoux, J., Bigot, L., Cauvin, B., Kooonjul, M., Jean Maharavo, J., Meunier, S., Moine-
Picard, M., Quod, J-P. and Pierre-Louis, R. 2004. Status of the coral reefs of the South West Indian
Ocean Island States. In: Wilkinson, C. (ed.) Status of Coral Reefs of the World: 2004 Vol. 1.
Akitanda, P. 2002. South Kilimanjaro catchment forestry management strategies perspectives and
constraints for integrated water resources management in Pangani River Basin. Paper presented at the
International Conference on Integrated River Basin management, Pangani River Basin. 13-14 June
2001, Moshi, Tanzania.
Aldegheri, 1997. "..Grand Recife sediment damage.." NOT FOUND OR SEE NEXT
Aldegueri, M. 1967. Fleuves et Rivières de Madagascar. ORSTOM, Antananarivo.
Amir, O.A., Berggren, P. and Jiddawi, N.S. 2002. The incidental catch of dolphins in gillnet fisheries in
Zanzibar, Tanzania. W. Indian Ocean J. Mar Sci. 1 (2): 155162.
Amir, O.A., Jiddawi, N.S. and Berggren, P. 2005. The occurrence and distribution of dolphins in Zanzibar,
Tanzania, with comments on the differences between two species of Tursiops. Tanzania. W. Indian
Ocean J. Mar. Sci. 4 (1): 85-94.
Anon, 2001. Transboundary Water Management as an International Public Good Development Finance
2000. Report prepared for the Ministry for Foreign Affairs, Sweden. Stockholm, Sweden
Anon Tanzania. 2006. UNEP-GEF WIO-LaB Project - addressing land-based activities in the western
Indian ocean. Tanzania National draft summary report. Draft report submitted to WIO-Lab PMU,
Nairobi, Kenya.
Anon, Madagascar. 2006. Madagascar rapport national sur les activites terrestres, sources de pollution, et
niveaux de pollution des eaux et des sediments. Draft report submitted to WIO-Lab PMU, Nairobi,
Kenya.
Anon, Mauritius. 2006. UNEP-GEF WIO-LaB Project - addressing land-based activities in the western
Indian ocean. National draft summary report for Mauritius. Draft report submitted to WIO-Lab PMU,
Nairobi, Kenya.
Anon, Mozambique. 2006. Mozambique national summary report on land-based activities, sources of
pollution and pollutant levels in water and sediment. Draft report submitted to WIO-Lab PMU,
Nairobi, Kenya.
Antoine, H., Carolus, I., Naya, N., Radegonde, V. and Sabury, E. 2007. Seychelles national summary
report on land-based activities, sources of pollution and pollutant levels in water and sediment. Draft
report submitted to WIO-Lab PMU, Nairobi, Kenya.
Arthurton, R., Korateng, W., Forbes, T., Snoussi, M., Kitheka, J., Robinson, J., Shah, N., Taljaard, S. and
Monteiro, P. 2006. Chapter 5: Coastal and marine environments, 155-195. In: UNEP (2006) Africa
Environment Outlook 2-Our Environment, Our Wealth. ISBN: 92-807-26691-9, Nairobi, Kenya, 542
pp.
Arthurton, R. 1992. Beach erosion: Case studies on the East African coast. In: proceedings of Bordeaux,
1992, International Convention on Rational Use of the Coastal Zone. IOC, Bordeaux. P. 91-95.
Arthurton, R.S., Kremer, H.H., Odada, E., Salomons, W. and Marshall Crossland, J.I. 2002. African
Basins: LOICZ Global Change Assessment and Synthesis of Rivers Catchment Coastal Sea
Interactions and Human Dimensions. LOICZ Reports and Studies No. 25: ii + 344 pages, LOICZ,
Texel, The Netherlands.
Ashton, P.J., Earle, D., Malzbender, A., Molo, MBH, Patricki, M.J. and Turton A.R. 2006. A compilation
of all the international freshwater agreements entered into by South Africa with other states report to
the water research commission. WRC Report No. 1515/1/06 ISBN No. 1-77005-406-5 JANUARY
2006.
UNEP-GEF WIO-LaB Project
2
Ashton, P.J., Love, D., Mahachi, H. and Dirks, P.H.G.M. 2001. An Overview of the Impact of Mining and
Mineral Processing Operations on Water Resources and Water Quality in the Zambezi, Limpopo and
Olifants Catchments in Southern Africa. Contract Report to the Mining, Minerals and Sustainable
Development (Southern Africa) Project, by SIREnvironmentek, Pretoria, South Africa and Geology
Department, Uni. of Zimbabwe, Harare, Zimbabwe. Report No. ENV-P-C 2001-042. xvi + 336 pp.
Autrand, M. 1997. Etude du schéma d'aménagement de l'aquaculture de crevettes à Madagascar : Phase
I : Cas des zones 2, 3, 5. Les élevages de crevettes de mer : Contexte général et grand choix
préliminaires. Rapport provisoire. Consortium OSIPD-FTM-PHD.
Azemia, R. and Robinson, J. 2004. Seychelles Artisanal Fishery Statistics for 2003. Seychelles Fishing
Authority Technical Report (SFA/RandD/059), 2004. 82 pp.
Bailey, C.L. and Scholes, R.J. 1999. Progress Report on the Global Change Research Project. CSIR,
Pretoria.
Baird W.F. and Associates Coastal Engineering Ltd. 2003. Study on the coastal erosion of Mauritius. Vol.
1 Final technical Report. Ontario (Canada), 462 pp.
Baker, A.C., Starger, C.J., McClanahan, T.R., and Glynn, P.W. 2004. Corals' adaptative response to
climate change. Nature 430, 741.
Balidy, J. 2003. Variação de cobertura das comunidades de ervas marinhas, causas desta variação e seu
valor ecológico-económico na Baía de Maputo. Tese de Licenciatura, Universidade Eduardo
Mondlane, Maputo. 90 pp.
Bandeira, S.O. 1995. Marine botanical communities in southern Mozambique: Seagrass and seaweed
diversity and conservation. Ambio 24: 506-509.
Bandeira, S.O. 1998. The seaweed resources of Mozambique. In: Critchley, A. and Ohno, M. (eds).
Seaweed Resources of the World. Japan International Cooperation Agency, p. 385-388.
Bandeira S.O. 2000. Diversity and Ecology of seagrasses in Mozambique: Emphasis on Thalassodendron
ciliatum structure, dynamics, nutrients and genetic variability. PhD Thesis. Götenborg University,
Sweden.
Bandeira, S.O. 2002. Diversity and distribution of seagrasses around Inhaca Island, Southern Mozambique.
South Afr. J Bot. 68: 191-198.
Bandeira, S.O. and António, C.M. 1996. The intertidal distribution of seagrasses and seaweeds at Mecúfi
Bay, northern Mozambique. In: Kuo, J., Phillips R. C., Walker, D.I., Kirjman, H. (eds). Seagrass
Biology: Proceedings of an International Workshop. University of Western Australia, Nedlands. p 15-
20.
Bandeira S.O. and Bjork, M. 2001. Seagrass research in eastern Africa region: emphasis to diversity,
ecology and ecophysiology. South Afr. J Bot. 67: 420-425.
Bandeira S.O. and Gell, F. 2003. The Seagrasses of Mozambique and Southeastern Africa. In F. Short and
E. Green. Seagrass Atlas of the World. World Conservation Monitoring Centre. University of
California press. 93-100 pp.
Bandeira S., Kairo J. and Rönnbäck P. 2006. Ecological economics of mangrove associated fisheries food
security and sustainability. Marine Science for Management (MASMA) final Research Report. 50 pp.
Bandeira S.O., Paula e Silva, R., Paula, J., Macia, A., Hernroth, L.,Guissamulo, A.T. and Gove, D.Z. 2002.
Marine Biological Research in Mozambique: past, present and future. Ambio 31: 606-609.
Bandeira et al 2007b. Vegetation assessment of Quirimbas National Park. Report to WWF.128 pp. MORE
DETAILS
Barbosa, F.M.A., Cuambe, C.C and Bandeira, S.O. 2001. Minireview: Status and distribution of
mangroves in Mozambique. South Afr. J Bot. 67(3): 393-398.
Barnabas, A.D. 1991. Thalassodendron ciliatum (Forsk.) den Hartog: Root structure and histochemistry in
relation to apoplastic transport. Aquatic Botany 40: 129-143.
Barnes, D.K.A. and Fraser, K.P.P. 2003 Rafting by five phyla on man-made flotsam in the. Southern
Ocean. Mar. Ecol. Progr. Ser. 262: 289-291.
Barnett, R., 1997: The shark trade in mainland Tanzania and Zanzibar. p 39-67. In: Marshall, N.T. and R.
Barnett, (eds.).The trade in sharks and shark products in the Western Indian and Southeast Atlantic
Oceans. TRAFFIC East/ Southern Africa. 132 pp.
Beentje, H. and Bandeira S.O. 2007. Field Guide to the Mangrove Trees of Africa and Madagascar. Royal
Botanic Gardens, Kew. 91 pp.
Beilfuss, R. 1999. Can this river be saved? Rethinking Cahorra-Bassa could make a difference for dam-
battered Zambezi. World Rivers Review 14 (1): 8-11.
Benbow, B 1976 Dangerous marine aniumals of east Africa. East African Literature bureau 24 pp.
Benno B., Verheij E., Stapley J., Rumisha C.,. Ngatunga B., Abdallah A. and Kalombo H. 2006.
Coelacanth discoveries and conservation in Tanzania. S. Afr. J. Sci. 102: 486490.
UNEP-GEF WIO-LaB Project
3
Berggren, P. 2000. Dolphin tourism as a conservation tool for critical habitats for dolphins in East Africa.
European Cetacean Society Conference, Cork, Ireland, 35 April 2000.
Berkelmans R., De'ath G., Kininmonth S. and Skirving W. 2004. A comparison of the 1998 and 2002 coral
bleaching events on the Great Barrier Reef: spatial correlation and predictions. Coral Reefs. 23: 7483.
Birnie P.W. and Boyle A.E. 2002. International Law and the Environment (2ed) Oxford University Press.
Birrell, C., McCook, L., and Willis, B. 2005. Effects of algae turfs and sedimentation on coral settlement.
Mar. Poll. Bull. 51: 408-414.
Bjork, M., Mohammed, S.M., Bjorklund, M. and Naaslund, I. 1996. Distribution of coral associated algae
at four locations near Zanzibar Town, Tanzania. I: Bjork, M. Semesi, A.K., Pedersen, M. and Bergman,
B. (eds.) Current trends in marine botanical research in the East African region. Proceedings of the
symposium on the biology of microalgae, macroalgae and seagrasses in the Western Indian Ocean. 3-
10 December, 1995. University of Mauritius, pp. 347-357.
Bjork, M., Mohammed, S.M., Bjorklund, M. and Semesi, A.K. 1995. Corraline algae, important coral reef
builders threatened by pollution. Ambio 24 (7-8): 502-503.
Blom, J., van der Hagen, H., van Hove, E., van Katwijk, M., van Loon, R. and Meier, R. 1985. Decline of
Malindi-Watamu Reef complex. Lab. of Aqua. Ecolo. Catholic University, 195.
Bosire, J. 2006. Ecological Recovery of Reforested Mangroves in Kenya. Thesis submitted in fulfillment of
the requirements of the Degree of Doctor of Philosophy in Science of the Vrije Universiteit Brussel,
Brussels, 138 pp.
Bosire, J.O., Dahdouh-Guebas, F., Kairo, J.G. and Koedam, N. 2003. Colonization of non-planted
mangrove species into restored mangrove stands in Gazi Bay, Kenya. Aquatic Botany 76: 267279.
Botte, M.D.M. 2001. Monitoring of coral bleaching at four sites around Mauritius. BSc Thesis.
(unpublished). University of Mauritius.
Brito, R., Munguambe,P. and Massingue, F. 2003. Wetlands of Mozambique Country Report. Presented
at IUCN and IWMI workshop in Maputo, Mozambique 2003.
Brix, H. and Lyngby, J.E. 1982. The distribution of cadmium, cooper, lead and zinc in eelgrass (Zostera
marina L). The Science of the Total Environment 24 (1): 51-63.
Brouwer, R. and Falcão, P.M. 2004. Wood fuel consumption in Maputo, Mozambique. Biomass and
Miometry 27: 233-245.
Brown, 2005. ".pollution Cape Town." CANNOT FIND OR Brown, C., Pemberton, C., Birkhead, A.,
Bok, A., Boucher, C., Dollar, E., Harding, W., Kamish, W., King, J., Paxton, B. and Ractliffe, S. 2006.
In support of water resource planning highlighting key management issues using drift: a case study.
Water SA 32:181-191.
Brown, C. and King, J. 2002. Environmental Flows: Requirements and Assessments. In: Hirji, R., Johnson,
P., Maro, P. and Chiuta, T.M. (eds.) Environmental Sustainability in Water Resources Management in
Southern Africa. SADC, IUCN, SARDC, World Bank: Maseru, Harare, Washington DC.
Brown, P.J. and Taylor, R.B. 1999. Effects of trampling by humans on animals inhabiting coralline algal
turf in the rocky intertidal. J. Exp. Mar. Biol. Ecol. 235 (1): 45-53
Bruton, M .N. and Cooper, K .H . (eds.) Studies on the ecology of Maputaland. Rhodes University Press,
Grahamstown and the Natal Branch of the Wildlife Society of Southern Africa, Durban.
Bryant, D., L. Burke, J. McManus, and M. Spalding. 1998. Reefs at Risk: A Map-based Indicator of
Threats to the World's Coral Reefs. World Resources Institute p. 11-15.
Bryceson, I. 2002. Coastal aquaculture developments in Tanzania. Sustainable and non-sustainable
experiences. W. Indian Ocean J. Mar.Sci. 1: 110.
Burgess, N.D. 2000. The biological importance of Tanzania I: Endemic. Bird Areas. Miombo 23:. 27.
WCST. Annual report for 1998-1999.
Burgess, N.D. and Clarke, G.P. 2000. The Coastal Forests of eastern Africa. IUCN Forest Conservation
Programme, Gland and Cambridge.
Burgess and Clarke 2002 ".Arabouke SokoKe Kenya...". CANNOT FIND OR SEE ABOVE OR NEXT
Burgess, N.D., Clarke, G.P., Madgick, J., Robertson, S. A. and Dickinson, A. 2000. Distribution and
Status. In: Burgess, N.D. and Clarke, G.P. (eds). Coastal Forests of Eastern Africa. IUCN, Gland,
Switzerland and Cambridge, UK. p. 71-81.
Burgess, N.D. and Muir, C. (eds.) 1994. Coastal Forests of Eastern Africa: Biodiversity and Conservation.
Proceedings of a workshop held at the University of Dar es Salaam, August 9-11, 1993. Society for
Environmental Exploration/ Royal Society for the Protection of Birds, UK.
Carreiro-Silva M. and McClanahan, T. R. 2001. Echinoid bioerosion and herbivory on Kenyan coral reefs:
the role of protection from fishing. J. Exp. Mar. Biol. Ecol. 262 (2) 133-153.
Catriona et al 2001. NOT FOUND OR Catriona, M.O., Macinnis-Ng and Ralph, P. 2002. Towards a more
ecologically relevant assessment of the impact of heavy metals on the photosynthesis of the seagrass,
Zostera capricorni. Mar. Poll. Bull. 45 (1):100-106.
UNEP-GEF WIO-LaB Project
4
Cave, L.C., Beekman, H.E. and Weaver, J.M.C. 2003. Impact of Climate Change on Groundwater
Recharge Estimation. Council for Scientific and Industrial Research (CSIR), Stellenbosh.
Cesar, H.S. 2000. Coral Reefs: their functions, threats and economic value. In: Cesar H.S. (ed.). Collected
Essays on the Economics of Coral Reefs. Cordio, Kalmar, Sweden. p. 14-39.
Champion, A. M. 1933. Soil erosion in Africa, Geogr. J. 82: 130-139.
Chaperon, P., Danloux, J., Ferry, L. 1993. Fleuves et Rivières de Madagascar. ORSTOM, DMH, CNRE,
Montpellier.
Chenje, M. (ed) 2000. State of the Environment Zambezi Basin 2000. SADC/IUCN/ZRA/SARDC,
Maseru/Lusaka/Harare.
Clark, B.M., Lane, S., Turpie, J.K., van Niekerk, L. and Morant, P.D. 2002. Development and protection
of the coastal and marine environment in sub-Saharan Africa: South Africa National Report Phase 1:
Integrated Problem Analysis. March 2002. GEF MSP Sub-Saharan Africa Project (GF/6010-0016)
Sponsored by GEF, UNEP, IOC-UNESCO, GPA and ACOPS.
http://www.acops.org/African_Process/National_Reports.htm
CNPS 1997. Seychelles Biodiversity: Economic assessment. Report prepared for National Biodiversity
Strategy and Action Plan, Conservation and National Parks Section, Division of Environment, Victoria.
Coetzee, H., Venter, J. and Ntsume, G. 2005. Contamination of wetlands by Witwatersrand gold mines
processes and theeconomic potential of gold in wetlands. Pretoria Council for Geoscience, 114 pp.
Colloty, B.M. 2000. Botanical Importance of Estuaries of the Former Ciskei/Transkei region. PhD Thesis,
Department of Botany, University of Port Elizabeth.
CORDIO, 2002. Reef Degradation in the Indian Ocean: Status Report 2002. CORDIO.
Constanza, R., d'Arge, R., de Groot, R., Farber, S., Grasso, M., Hannon, B., Limburg, K., Neem, S.,
O'Neill, R.V., Paruelo, J., Raskin, R. G., and Sutton, P. 1997. The value of world's ecosystem services
and natural capital. Nature 387: 253-260.
Cooke, A.J., Ratomahenina, O., Ranaivoson, E., and Razafindrainibe, H., 2000. Madagascar. In: Sheppard,
C. (ed.) Seas at the Millenium: An Environmental Evaluation. Vol 2 Ch. 60 p.1, 13-131.
Coppejans, E., Beeckman, H. and de Wit, M. 1992. Status, primary productivity and taxonomy of
mangroves, seagrasses and algae. Hydrobiologia 247: 59-75.
Crona, et al 2005. "shrimp by-catch.". CANNOT FIND
Crona, B. I. and Ronnback, P. 2005. Use of replanted mangroves as nursery grounds by shrimp
communities in Gazi Bay, Kenya. Est. Coastal Shelf Sci. 65: 535-544.
Crossland, C.J., Kremer, H.H., Lindeboom, H.J., Marshall-Crossland, J.I. and Le Tissier, M.D.A. (eds).
2005. Coastal Fluxes in the Anthropocene The Land-Ocean Interactions in the Coastal Zone. Project
of the International Geosphere-Biosphere Programme Series. Springer, Berlin.
Crossland, 2005. CANNOT FIND OR Crossland C.J., Baird, D., Ducrotoy, J-P., and Lindeboom, H.
2005. The coastal zone a domain of global interactions. Chapter 2. In: Crossland, C.J., Krenner, H.H.
Lindeboom, H.I., Marshall Crossland, J.I. and Le Tisser, M.D.A. (eds.) Coastal Fluxes in the
Anthropocene The Land-Ocean Interactions in the Coastal Zone. Project of the International
Geosphere-Biosphere Programme Series. Springer, Berlin.
CSIR, 2004. Environmental studies in the Richards Bay offshore outfalls region. Report No. 17: Surveys
made during 2003. CSIR Report: ENV-D-C-2004-013. Durban, South Africa.
Cunningham, S. and Bodiguel, C. 2005. CANNOT FIND OR 2006.- Subregional review: Southwest
Indian Ocean. In: DeYoung, C. (ed.) Review of the state of world marine fisheries capture
management: Indian Ocean. FAO Fisheries Technical Paper 488 458 pp.
Daby, D. 2003. Effects of seagrass removal for tourism pouposes in Mauritian Bay. Environmental
pollution, 125: 313-324.
Dahdouh-Guebas F., Coppejans E. and van Speybroeck, D. 1999. Remote sensing and zonation of
seagrasses and algae along the Kenyan coast. Hydrobiologia 400: 63-73.
Database Marine Organism of Mauritius, 2007. MORE DETAILS
Davis, J.R. 2000. Integrated Water Resources Management Strategy for Kenya: Water quality and
pollution assessment in freshwater lakes and rivers of Central Kenya. A World Bank Report. 27p.
de Clerck, O., Bolton, J. J., Anderson, R.J. and Coppejans, E. 2005. Guide to the Seaweeds of Kwaulu-
Natal. 296 pp.
de la Torre e Castro, M. 2000. Seagrass characteristics of the five sites in Chwaka Bay, Zanzibar
seagrasses in Tanzania is Chwaka Bay, Unguja Island, Zanzibar. Est.Coastal Shelf Sci. MORE
DETAILS
de la Torre e Castro, M. and Ronnback, P. 2004. Links between humans and seagrasses an example from
tropical east Africa. Ocean and Coastal Management 47: 361-387.
den Hartog, C. 1970. The Seagrasses of the World. North Holland Publication Co. Amsterdam. 275 pp.
UNEP-GEF WIO-LaB Project
5
DNA, 1994: Actual Situation of Water Resources Management in Mozambique (Final Dratf). Ministério
da Construção e Águas. Maputo Moçambique.
Dominik, F., Dunbar, R. B., McCulloch, M., Mudelsee, M., Vuille, M., McClanahan, T.R., Cole, J.E. and
Eggins, S. 2007. East African soil erosion recorded in a 300 year old coral colony from Kenya.
Geophysical Research Letters 34 L04401, DOI:10.1029/2006GL028525.
Dorenbosch, et al., 2006. NOT FOUND OR Dorenbosch, M., Groll, M. G., Christianen, M. J.,
Nagelkerken, I. and Velde, G. 2005. Indo-Pacific seagrass beds contribute to fish density and diversity
on adjacent coral reefs. Mar. Ecol. Progr. Ser. 302: 63-76. OR Dorenbosch M., Grol M.G.G.,
Nagelkerken I., van der Velde G., 2005b. Distribution of coral reef fishes along a coral reef-seagrass
gradient: edge effects and habitat segregation.
Mar. Ecol. Progr. Ser. 299, 277-288.
Dubinsky, Z. and Stambler, N. 1996. Marine pollution and coral reefs. Global Change Biology 2: 511 -
526
Dubula, O., Taljaard, S. and Weerts, S. 2006. South Africa national summary report on land-based
activities, sources of pollution and pollutant levels in water and sediment. Draft report submitted to
WIO-Lab PMU, Nairobi, Kenya.
Duke, N.C. 1992. Mangrove floristics and biogeography. In: Robertson, A.I. and Alongi, D.M. (eds.),
Tropical Mangrove Ecosystems. Washington D.C., USA p. 63-100.
Dulymamode, R., Bhikajee, M. and Sanassee, V. 2002. Development and protection of the coastal and
marine environment in sub-Saharan Africa: Mauritius National Report Phase 1: Integrated Problem
Analysis. March 2002. GEF MSP Sub-Saharan Africa Project (GF/6010-0016) Sponsored by GEF,
UNEP, IOC-UNESCO, GPA and ACOPS.
http://www.acops.org/African_Process/National_Reports.htm
Dulymamode et al 2006. "except some areas in Pointe aux Sables (near Port Louis) where levels exceeded
recommended guideline Mauritius". DOES EXIST CANNOT FIND
Dunne, T. and Ongwenyi, G.S. 1976. A new estimate of sediment rates in the Upper Tana River. Kenyan
Geographer 2(2): 14-29.
DWAF, 2001. TWP: An overview of the Thukela Water Project Feasibility Study. Department of Water
Affairs and Forestry, South Africa, Pretoria.
DWAF, 2004a. Thukela Water Project Decision Support Phase: Reserve Determination Model.
Department of Water Affairs and Forestry, South Africa. Pretoria.
DWAF. 2004b. Internal Strategic Perspective: Thukela Water Management Area Version 1. Department
of Water Affairs and Forestry, South Africa, Pretoria.
DWAF, 2004c. Methodology for the Determination of the Ecological Water Requirements for Estuaries.
Department of Water Affairs and Forestry, South Africa, Pretoria.
Earle, A. and Malzbender, D. 2007. Water and the Peaceful, Sustainable Development of the SADC
Region. Paper produced for the Safer Africa project, entitled, "Towards a Continental Common
Position on the governance of natural resources in Africa".
Earle, A., J. Goldin, R., Machiridza.D., Malzbender,E., Manzungu, E. and Mpho, T. 2006. Indigenous and
institutional profile: Limpopo River Basin. Working Paper No 112.International Water Management
Institute, Colombo.
Edinger, E., Ompa, J., Limmon, G., Widjatmoko, W. and Risk, M. 1998. Reef degradation and coral
biodiversity in Indonesia: effects of land-based pollution, destructive fishing practices and changes
over time. Mar. Poll. Bull. 36(8): 617-630.
Eklof, J.S., de la Torre e Castro, M., Adelskold, L., Jiddawi, N. S. and Kautsky, S. 2005. Differences in
Macrofauna and seagrass assemblages in seagrass bed with and without seaweed farms. Est. Coast.
Shelf Sci. 63: 385-396.
Ekman, S. 1953. Zoogeography of the sea. Sidgwick and Jackson, London. 417 pp.
Engdahl, S., Mamboya, F., Mtolera, M., Semesi, A. and Björk, M. 1998. The brown macroalgae Padina
boergesenii as an indicator of heavy metal contamination in the Zanzibar channel. Ambio 27: 694-700.
Engelhardt, 2003 "coral bleaching recovery" NOT FOUND OR Engelhardt, U., Russell, M. and
Wendling, B. 2003. Coral communities around the Seychelles Islands 1998 2002. In: Coral Reef
Degradation in the Indian Ocean (CORDIO) Stat Rep 2002, CORDIO, 212 pp.
Euroconsult. 1980. Identification study on the ecological impacts of the Stiegler's Gorge power and flood
control project, Part I, Summary, background and approach to the study.
EC, 2005. licences fishing vessels in WIO.. MORE DETAILS
Fabricius, K. 2005. Effects of terrestrial runoff on the ecology of corals and coral reefs: review and
synthesis. Mar. Poll. Bull.50: 125-146.
FAO, 1997. Irrigation potential in Africa: a basin approach: Food and Agriculture Organisation Land and
Water Bulletin 4. FAO Land and Water Division. Rome. Italy.
UNEP-GEF WIO-LaB Project
6
FAO, 1997. Review of the State of World Fishery Resources: Marine Fisheries. FAO Fisheries Circular
No. 920:173 pp.
FAO, 1999. Land-based sources and activities affecting the marine, coastal and associated freshwater
environment in Comores, Kenya, Mozambique, Seychelles and United Republic of Tanzania. EAF/5.
Ed. D. Waruinge and D. Ouya. Nairobi. Kenya, 42 pp.
FAO, 2000. Report of the four GEF/UNEP/FAO regional workshops on reducing the impact of tropical
shrimp trawl fisheries. FAO Fisheries Report 627: 40pp.
FAO, 2001. Asynthesis of flood warning and control for the Juba and Shabelle Rivers.Working Paper
FAO SOM/SSF/2001/12. FAO, Nairobi, Kenya
FAO, 2002. description of transboudary elements mangrove degradation ... MORE DETAILS
FAO, 2003. Fishery statistics: capture production. Volume 92/1. Year 2001. FAO
FAO, 2003 Report of the regional workshop on approaches to reducing shrimp trawl bycatch in the
Western Indian Ocean. FAO Fisheries Report 734: 49 pp.
FAO 2005a. Irrigation in Africa: http://www.fao.org/docrep/w4347e/w4347ey.htm
FAO 2005. Country fisheries profile and Information on fisheries management for Kenya and Seychelles.
Rome. Available at http://www.fao.org/fi/fcp/fcp.asp
FAO, 2007. Fisheries Statistics... Mozambique... MORE DETAILS
FAO/UNEP, 1984. Legal Aspects of Protecting and Managing the Marine and Coastal Environment of the
East African Region; National Reports;UNEP Regional Seas Reports and Studies 49.UNEP.
FAO/WHO, 1986. Maximum limits for pesticide residues. Codex Alimentarius Vol. XIII, 2nd edn. Rome.
Fenner, D., Clark, T.H., Turner, J.R., Chapman, B. 2004. A checklist of the corals of the island state of
Rodrigues, Mauritius. Journal of Natural History 38: 3091-3102.
Ferletta, M., Bramer, P., Semesi, A. K. and Björk, M. 1996. Heavy metal contents in macroalgae in the
Zanzibar channel - an initial study. In: Bjork, M, Semesi, A.K., Pedersen, M. and Bergman, B (eds.)
Current Trends in Marine Botanical Research in the East African Region. Proceedings of the
symposium on the biology of microalgae, macroalgae and seagrasses in the Western Indian Ocean.
University of Mauritius, 3-10 December, 1996, pp. 332-346.
Fernandes, A. 1995. Pollution in Maputo Bay: Contamination levels from 1968 to 1996. Revista Medica
de Mozambique 6 (34). Instituto Nacional de Saide.
Fernandes, A. 1996 Poluicao: Factos e figuras. Proceedings from the Workshop on the Role of Research in
Coastal Zone Management, Maputo, 24-25 de Abril, 1996. Departamento de Ciencias Biologicas,
Universidade Eduardo Mondlane.
Fishbase, 2006. www.fishbase.org
Fisheries Department Kenya, 2007. Frame survey report 2007. (unpublished).
Fleitmann, D. R. B., Dunbar, M., McCulloch, M., Mudelsee, M., Vuille, M., McClanahan, T.R., Cole, J.E.
and Eggins, S. 2007. East African soil erosion recorded in a 300 year old coral colony from Kenya,
Geophys. Res. Lett., 34, L04401, doi:10.1029/2006GL028525.
Fletcher W.J. and Amos, M. 1994. Stock assessment of coconut crabs. Canberra, ACIAR Monograph No.
29, 32 pp.
Forbes, A.T., Demetriades, N.T., Bosman, C., Leuci, R., Sinclair, D., Smith, A.M., Fennessy, S.,
Robertson, W.D., Sink, K., Kruger, A., Everett, B.I., Fielding, P.J. and Celliers, L. 2002. Impacts of
proposed dams on the Thukela estuary and inshore marine environment, Kwa-Zulu-Natal, South
Africa. In: Arthurton, R.S., Kremer, H.H., Odada, E., Salomons, W. and Marshall Crossland, J.I. (eds.)
African Basins: LOICZ Global Change Assessment and Synthesis of River Catchment-Coastal Sea
Interaction and Human Dimensions. LOICZ Reports and Studies No. 25, p. 168-173, LOICZ, Texel,
The Netherlands.
Francis, J., Wagner, G.M., Mvungi, A., Ngwale, J. and Salema, R. 2002. Development and protection of
the coastal and marine environment in sub-Saharan Africa: Tanzania National Report Phase 1:
Integrated Problem Analysis. Part of the GEF MSP Sub-Saharan Africa Project (GF/6010-0016):
"Development and Protection of the Coastal and Marine Environment in Sub-Saharan Africa". UNEP,
Nairobi. http://www.acops.org/African_Process/National_Reports.htm
Frazier, J.1980. Exploitation of marine turtles in the Indian Ocean. Human EcologyHuman Ecology 8: 329-
370.
Gallienne, C.P. and Smythe-Wright, D. 2005. Epipelagic mesozooplankton dynamics around the
Mascarene Plateau and Basin, Southwest Indian Ocean. Phil. Trans. Roy Soc. Lond. A 363, (1826),
191-202.
Gammelsrød, 1996 .cited by ZRA, 1998. NOT FOUND
Gaudian, G., Koyo, A., Wells, S. 2003. A global representative of Marine Protected Areas marine region.
East Africa. A report to the World Bank environment. Department.
GEF/MSP, 2001 (in table) MORE DETAILS
UNEP-GEF WIO-LaB Project
7
GEF/MSP 2002 "causes impacts and consequences of mangrove degradation" MORE DETAILS
GEF/MSP 2003 "main threats and hotspots ..." MORE DETAILS
GEO Data Portal, 2003. Global Environment Outlook Data Portal. Retrieved Jan., 2003, from
http://geodata.grid.unep.ch/.
Githitho, A. N. 2004. The coastal terrestrial forests of Kenya: A Report on Resources, Threats and
Investments. WWF EARPO, Nairobi.
Glavovic B.C., Browne, J. and Coetzee, M. 2001. Integrated Coastal Zone Management in South Africa.
In: Voabil & Engdahl (eds.) The Voyage from Seychelles to Maputo; Successes and Failures of
Integrated Coastal Zone Management in Eastern Africa and Island States 1996-2001, Vol I
(SEACAM, 2001); Maputo, p. 67-120.
GOK, 1979. 1979-1983 Development plan, Government Press, Nairobi, Kenya.
Gössling, S. 2006. Towards Sustainable Tourism in the Western Indian Ocean. W Indian Ocean J. Mar.
Sci. 5(1): 55-70.
Gössling, S. and Hörstmeier, O. 2003. High-Value Conservation Tourism: Integrated Tourism
Management in the Seychelles? In: Gössling, S. (ed.) Tourism Development in Tropical Islands:
Political Ecology Perspectives. Cheltenham: Edward Elgar Publishing, p. 203-221.
GoT, 2006. National Land use Framework Plan, existing situation, trends and issues. The National Land
Use Planning Commission. Government of Tanzania, Dar es Salaam.
Graham, N.A.J., Wilson, S.K., Jennings, S., Polunin, N.V.C., Bijoux, J.P. 2006. Dynamic fragility of
oceanic coral reef ecosystems. Proc Natl Acad Sci U S A 103: 84258429.
Grandcourt, E.M. 2003. The effect of intensive line fishing on the virgin biomass of a tropical deepwater
snapper, the crimson jobfish - Pristipomoides filamentosus. Fishery Bulletin (April 2003).
Grant, D.K.S. 1938. Mangrove woods of Tanganyika Territory: Their silviculture and dependent
industries. Tanganyika Notes and Records 5: 5-16.
GTA, 2007 "rehabilitate degraded mangroves in Ila de Mozambique" NOT FOUND MORE DETAILS
Grubb, P. 1971. Ecology of terrestrial decapod crustacean on Aldabra. Phil. Trans. Roy. Soc. Lond. Ser B.
260: 411-416.
Guillaumin, A. 1928. Les régions florales du Pacifique d'aprés leur endémisme et la répartition de
quelques plantes phanérogames. Proc. 3rd Pan Pacific Sci. Cungr., Tokyo 1: 920-938.
Gullström M., de la Castro Torre M., Bandeira S.O., Björk M, Dahlberg M., Kautsky N., Rönnbäck, P .and
Öhman, M.C. 2002. Seagrass ecosystems in the Western Indidan Ocean. Ambio 31: 588-596.
Gupta, R.K. 2001 ... and ecology of riverine fish of Kenya in the Athi-Galana-Sabaki River drainage
system. International Journal of Water Resources Development, 17 (1): 125-147. CANNOT FIND
FULL DETAILS
Gurib-Fakim, A. 2002. Mauritius through its medicinal plants. Éditions le Printemps. 216 pp.
Gurib-Fakim, A. 2003. An Illustrated Guide to the Flora of Mauritius and the Indian Ocean Islands.
Mauritius. 206 pp.
Hamerlynck, O., Richmond, M.D., Mohamed, A. and Mwaitega, S.R. 2008. Fish and invertebrate life
histories and important fisheries of the Pangani River Basin, Tanzania Final Report. Pangani River
Basin Flow Assessment - Specialist Study. IUCN/PBWO. 74 pp.
Hartnoll, R.G. 1976. The Ecology of some rocky shores in Tropical East Africa. Est. Coast. Mar. Sci. 4
(1): 1-10.
Hatziolos, M., Lundin, C.G. and Alm, A. 1996. Africa: A Framework for Integrated Coastal Zone
Management. The World Bank,Washington D.C., 150 p.
Hawkins, J. and Roberts, C. 1993. Effects of recreational scuba diving on coral reefs: trampling on reef flat
communities. J. Appl. Ecol 30: 25-30.
Hill, M. and Currie, D. 2007. Wildlife of Seychelles. HarperCollins Publishers Ltd., London. 272 pp.
Hirji, R., Johnson, P., Maro, P. and Chiuta, T.M. (eds.) 2002. Environmental Sustainability in Water
Resources Management in Southern Africa. SADC, IUCN, SARDC, World Bank: Maseru, Harare,
Washington DC.
Hirji, R., Partorni, F.M. and Rubin, D. (eds) 1996. Seminar on integrated water resources management in
Kenya. Proceedings Sponsored by Government of the Netherlands and the World Bank. The Economic
Development Institute of the World Bank, 227 pp.
Hoagland, P. and Jin, D. 2008. Accounting for Marine Economic Activities in Large Marine Ecosystems.
Ocean Coastal Management 51: 246-258.
Hoegh-Guldberg, O. 1999. Climate change, coral bleaching and the future of the world's coral reefs.
Marine and Freshwater Research. 50: 839866.
Hogan, A.R., Nandi, R.X.L., Mtiga, M.O., Chirwa, E.B., Kilonzo, P. and Peter, J. 1999. Selection of pilot
villages: A report on the rapid appraisal methodology used and the selections made, together with
eleven individual village profiles. REMP Technical Report No. 2.
UNEP-GEF WIO-LaB Project
8
Hoguane, A.M. 2002. Salt intrusion in the Incomati river. Proceedings of the IInational conference on
integrated coastal zone management. Proceedings of the II National Conference on Coastal Zone
Research. Maputo, 27-29 September 2000. CDS-ZC/MICOA, SECAM/UEM. 127 pp.
Hoguane, A.M., Motta, H., Lopes, S. and Menete, Z. 2002. Development and protection of the coastal and
marine environment in sub-Saharan Africa: Mozambique National Report Phase 1: Integrated Problem
Analysis. 113 pp. March 2002. GEF MSP Sub-Saharan Africa Project (GF/6010-0016) Sponsored by
GEF, UNEP, IOC-UNESCO, GPA and ACOPS.
http://www.acops.org/African_Process/National_Reports.htm
Hoguane, A.M., Dove, V.F., Sete, C.I., and Ibrahimo, N.V. 2003. Coastal Erosion in Mozambique: The
Macaneta Peninsula Case Study. A report prepared for UNEP/GPA, UNEP and WIOMSA.
Hoguane, A.M.; Dove, V. and Sete, C. 2004. Physical alteration and destruction of habitats in
Mozambique. A Report prepared for UNEP/GPA.
Hoguane, A.M. 2007. Diagnosis of Mozambique Costal Zone. Revista de Gestão Costeira Integrada 7(1):
69-82.
Hoguane, 2008. "water use in industry Incomati river" NOT FOUND
Horrill, J. C., Kalombo, H. and Makoloweka, S. 2001. Tanga Coasta l Zone Conservation and
Development Programme: Collaborative Reef and Reef Fisheries Management in Tanga, Tanzania.
IUCN Eastern Africa Programme.
Howell, K.H. 1993. A review of the conservation status of sea turtles in Tanzania. Wildlife Conservation
Society of Tanzania.
Hulme, M., R.M. Doherty, T. Ngara, M.G. New, and D. Lister. 2001. African Climate Change: 1900
2100. Climate Research 17: 14568.
Huxham, M; Kimani, E; and Augley, J. 2004. Mangrove fish: a comparison of community structure
between forested and cleared habitats. Estuarine, Coastal and Shelf Science 60: 637-647.
Huxham et al., 2005. mangrove diversity NOT FOUND
Humphrey, 1998. "leatherback in SA" NOT FOUND OR Humphrey, S.L. and R.V. Salm (eds.). 1996.
Status of Sea Turtle Conservation in the Western Indian Ocean. UNEP Regional Seas Reports and
Studies No. 165. IUCN/UNEP, Nairobi, Kenya. 162 pp.
IOC-UNEP-WMO-SAREC. 1994. Planning Workshop on an Integrated Approach to Coastal Erosion, Sea
Level Changes and their impacts. Zanzibar, Tanzania, 17-21 January 1994. IOC - Workshop report no.
96 (incl. 2 supplements).
IDPPE. 2004. Censo Nacional da Pesca Artesanal Águas Maritimas (2002), IDPPE. Maputo. 76 pp.
Ingram, J. C. and Dawson, T. P. 2001. The impacts of a river effluent on a coastal seagrass habitat of
Mahé, Seychelles. South African Journal of Botany 67: 483-487.
IPCC. 2001. Special Report on Emissions Scenarios. In: N. Nakicenovic and R. Swart (eds.). Special
Report of the Intergovernmental Panel Cambridge University Press, Cambridge, UK. MORE
DETAILS?
IPCC, 2005. UNCERTAIN Special Report on Carbon Dioxide Capture and Storage ch.7, p.321, p.330,
Prepared by working group III of the Intergovernmental Panel on Climate Change. Metz, B.,
O.Davidson, H. C. de Coninck, M. Loos, and L.A. Meyer (eds.). Cambridge University Press,
Cambridge, United Kingdom and New York, NY, USA, 442 pp.
Iqbal, M.S. 1992. Assessment of the Eastern Africa action plan and the effectiveness of its legal
instruments, UNEP Regional Seas Reports and Studies No.150.
IUCN, 2002. Advancing the understanding and management of small scale fisheries. Jakarta Mandate.
IUCN, 2003. Pangani Basin - A Situation Analysis. IUCN, Nairobi, 59 pp.
IUCN, 2003.Tana River, Kenya: Integrating downstream values into hydropower planning. Case Studies in
Wetland Valuation, No.6, May 2003. IUCN The World Conservation Union.
http://www.iucn.org/themes/wani/econ/CaseStudy06Tana.pdf
IWMI, 2006. IWMI Global Wetland Initiative Madagascar country overview. Accessed at
www.iwmi.cgiar.org/wetlands/pdf/Africa/Region6/MADAGASCAR.pdf on 13/10/2007.
Izidine, S. and Bandeira, S.O. 2002. Mozambique. In: Golding, J. (ed.) Southern African Red Data Lists.
Southern African Botanical Diversity Network Report No. 14: 43-60.
Jaasund, E. 1976. Intertidal seaweeds in Tanzania, Tromso, University of Tromso, 160 pp.
Jahengers, I. 2004. Country review: Mauritius. Ministry of Fisheries
Japp, D. 2004 Country review: South Africa (Indian Ocean). EXISTS NOT FOUND OR Japp, D.W. &
James, A. 2005. Potential exploitable deepwater resources and exploratory fishing off the South
African coast and the Dvelopment of the deepwater fishery on the south Madagascar ridge. In: Shotton,
R. (ed.). Deep Sea 2003: Conference on Governance and Management of Deep-sea Fisheries. Part 1:
Conference reports. Queenstown, New Zealand.
UNEP-GEF WIO-LaB Project
9
Jenning, S., Marshall, S. and Polunin, N. 1996. Seychelles's Marine Protected Areas: Comparative
structure and status of reef fish communities. Biological Conservation 75: 201-209.
Jiddawi, N.S. 1998. The reef dependant fisheries of Zanzibar. In: Johnstone R.W., Francis, J. and Muhando
C.A. (eds). Proceeding of the National conference on coral reefs Zanzibar, Values, threats and
solutions. December 199. p. 22-35.
Jiddawi, N.S. 2003....fisheries data." NOT FOUND OR Jiddawi, N.S, and Ohman, M. 2003. Marie
fisheries of Tanzania. Ambio 32: 518-527.
Jiddawi, N.S, and Shehe, M.S. 1999. The status of shark fishery in Zanzibar, East Africa: a case study. In:
Jiddawi, N.S.and R. Stanley (eds.) Fisheries Stock Assessment in the Traditional Fishery Sector: The
Information Needs. Proceedings of the National Workshop on the Artisanal Fisheries Sector, Zanzibar.
September, 22-24, 1997, Zanzibar, Tanzania Institute of Marine Sciences, University of Dar es Salaam,
Zanzibar, Tanzania: pp 87-92.
Jiddawi, N.S. and Stanley, R.D. (eds), 1999. Fisheries Stock Assessment in the Traditional Fishery Sector:
The Information Needs. Proceedings of the National Workshop on the Artisanal Fisheries Sector,
Zanzibar. Sept, 22-24, 1997, Zanzibar, Tanzania IMSISBN 0-662-28909-9, IMS.UDSM, Zanzibar,
Tanzania: 192 pp.
Jiddawi, et al. 2006 dolphin deaths in ZNZ.. NOT FOUND
Johnson, 1965 "birgus latro" EXISTS BUT NOT FOUND
Jones, T., Payet, R., Beaver, K. and Nalletamby, M. 2002. Development and protection of the coastal and
marine environment in sub-Saharan Africa: Seychelles National Report Phase 1: Integrated Problem
Analysis. March 2002. GEF MSP Sub-Saharan Africa Project (GF/6010-0016) Sponsored by GEF,
UNEP, IOC-UNESCO, GPA and ACOPS.
http://www.acops.org/African_Process/National_Reports.htm
Joottun, L., Gangapersad, D., Ragoonaden, S., Dunputh, K., and Ujodha, I. 1994. Status of coastline
changes in Mauritius. In: IOC (ed), IOC-UNEP-WMO-SAREC Planning Workshop on an Integrated
Approach to Coastal 19 Regional Report Erosion, Sea Level Changes and their impacts. Zanzibar,
Tanzania, 17-21 January 1994. IOC - Workshop report no. 96. supp.1., 29-63.
Kairo, et al 2001 "mangroves" NOT FOUND OR Kairo, J.G., Dahdouh-Guebas, F., Gwada, P.O.,
Ochieng, C., Koedam, N. 2002. Regeneration status of mangrove forests in Mida Creek, Kenya: a
compromised or secured future ? Ambio 31:562-568.
Kairo, J.G., Farid, D.G., Gwada, P.O., Ochieng, C. and Koedam, N. 2002. Regeneration Status of
Mangrove Forests in Mida Creek, Kenya: A Compromised or Secured Future? Ambio 31 (7-8): 562-
556.
Kairo, J.G. and Dahdouh-Guebas, F. 2008. Conservation status of mangroves in Kenya. In: Ashton, E.
(ed). Mainstreaming conservation of coastal biodiversity through formulation of a code of conduct for
sustainable management of mangrove forests. World Bank, ISME, (in press).
Kairu, K.K. 1997. Vulnerability of the Kenya shoreline to coastal instability. UNESCO-Kenya National
Seminar on sustainable development, Mombasa, Kenya, p 13-25.
Kairu, K.K, 2003. Coastal Erosion in Kenya: Malindi Ungwana Bay Case Study. A report prepared for
UNEP/GPA, UNEP and WIOMSA.
Kairu, K. and Nyandwi, N. (eds.) 2000. Guidelines for the study of shoreline change in the Western Indian
Ocean region. IOC Manuals and Guides No. 40. UNESCO 2000. 55 pp.
Kajia, Y.S. 2000. Assessment of the effects of rice farming in the mangrove forests of the Rufiji delta,
mainland Tanzania. MSc. Thesis in ecological marine management, Faculty of Science, Free
University of Brussels. (cited in Shagude, 2004).
Kalk, M.1995. A Natural History of Inhaca Island, Mozambique. Witwatersrand University Press, South
Africa. 395 pp.
Kalugina-Gutnik, A., Perestenko, L. and Titlyanova, T. 1992. Species composition, distribution and
abundance of algae and seagrasses of the Seychelles Islands. Atoll Reseach Bulletin. 359(5): 1-68.
Kamau, J. N. 2001. Heavy metals distribution in sediments along the Kilindini and Makupa creeks, Kenya.
Hydrobiologia 459: 235-240.
Kanji, F., Albano, G., Macucule, A., Sato, S., and Massago, H. A. 2004. The Coastal Forests of
Mozambique. WWF EARPO, Nairobi.
Kaponda, A. 2005. Ruvuma River Basin: Water Resources Development and Management. Unpublished
Report for Ruvuma river and Southern Coast Basin. UNCERTAIN
Kariuki J. 2005. Review of the State of World Marine Capture Fisheries. Management: Indian Ocean.
Rome. FAO Technical Paper 489. Fisheries Department, Kenya.
Kathiresan, K. and Bingham, B.L. 2001. Biology of mangroves and mangrove ecosystems Adv. Mar. Sci.
40: 81-251.
UNEP-GEF WIO-LaB Project
10
Kaunda-Arara, B. and Rose, G. 2004. Effects of marine reef National Parks on fishery CPUE in coastal
Kenya. Biological Conservation 118: 1-13.
Kayombo, S. 2007. Draft Regional `state-of-the-art' report on MWW management in the WIO-Lab region.
Report submitted to UNEP/GEF WIO-Lab Project Management Unit, Nairobi, Kenya.
Kazungu, J.M., Munga, D., Mwaguni, S.M. and Ochiewo, J. 2002. Development and protection of the
coastal and marine environment in sub-Saharan Africa: Kenya National Report Phase 1: Integrated
Problem Analysis. March 2002. GEF MSP Sub-Saharan Africa Project (GF/6010-0016) Sponsored by
GEF, UNEP, IOC-UNESCO, GPA and ACOPS.
http://www.acops.org/African_Process/National_Reports.htm
Kent, P.E., Hunt, J.A. and Johnstone, D.W. 1971. The Geology and Geophysics of Coastal Tanzania. 101
pp., Geophysical 6, HMS Stationary Office London: Institute of Geophysical Sciences.
Kepertsy, 1985. "mangroves fisheries" NOT FOUND
Kijazi, A.S. 2002. Catchment and Mangrove management programmes: activities and environmental
concerns in the Pangani Basin. Report of a Workshop held at the Kilimanjaro Crane Hotel, Moshi,
Tanzania, 8-10 May 2002. December 2002. Nairobi, IUCN EARO: 38-43.
King, M.D., King, A., Manghubhai, S., Tunje, I., Muturi, I., Mueni, E. and Onganda, H. 2003. Review of
marine fisheries resources for Kenya. FMSP Project R8196. Understanding fisheries associated
livelihoods and the constraints to their development in Kenya and Tanzania. 105 pp
Kitheka, J.U. 2002. Dry season sediment fluxes in the frontwater zone of the mangrove-fringed Mwache
Creek, Kenya. In: Arthurton, R.S., H.H. Kremer, E. Odada, W. Salomons and J.I. Marshall Crossland
(eds). African Basins: LOICZ Global Change Assessment and Synthesis of River Catchment-Coastal
Sea Interactions and Human Dimensions. LOICZ Reports and Studies No. 25:ii+344p, LOICZ, Texel,
The Netherlands. p.194-202.
Kitheka, J.U. 2002. Freshwater and sediment discharge in Ungwana Bay: The role of the Tana and Sabaki
Rivers. In: Current status of the trawl fishery of Malindi-Ungwana Bay. KMFRI Final Report 2002, 97
pp.
Kitheka, J.U., Ongwenyi, G.S and Mavuti, K.M. 2002. Dynamics of suspended sediment exchange and
transport in a degraded mangrove Creek in Kenya. Ambio 31 (7-8): 580-587.
Kitheka, J.U., Nthenge, P. and Obiero, M. 2003. Sabaki estuary sediment transport dynamics and resultant
sediment fluxes in the monsoon-driven Malindi Bay. LOICZ-START AfriCAT Report, Nov. 2003, 58
pp.
Kitheka, J.U., M. Obiero and P Nthenge, 2003. Dynamics of sediment transport and exchange in the Tana
Estuary in Kenya. Kenya Marine and Fisheries Research Institute, Mombassa.
Kitheka, J.U., Ochiewo, J, Nthenge, P and M. Obiero 2003. Coastal impacts of damming and water
abstraction in the Tana and Athi-Sabaki river basins. LOICZ-START AfriCAT Project Report, Dec.
2003, 70 pp.
Kitheka, J.U., Ongwenyi, G.S and Mavuti, K.M. 2003. Fluxes and exchange of suspended sediments in
tidal inlets draining a degraded mangrove forest in Kenya. Estuarine, Coastal Shelf Science 56: 655-
667.
Kitheka, J.U., P. Nthenge and M. Obiero, 2004a. Dynamics Of Sediment Transport And Exchange In The
Sabaki Estuary And Malindi Bay, Kenya. LOICZ-START Africat Project Sub-Report
Kitheka, et al 2004b NOT FOUND OR (see Kitheka et al 2005, below).
Kitheka, J.U., J. Ochiewo., P. Nthenge and M. Obiero 2004c. Land Use Change And Climatic Variability
In The Tana And Athi-Sabaki River Basins And Associated Impacts On Coastal Resources In Kenya.
Paper for START-LOICZ AfriCAT Workshop, February 18-21, 2004.
Kitheka, J.U., J. Ochiewo., P. Nthenge and M. Obiero, 2004d: Coastal Impacts Of Damming And Water
Astraction In The Tana And Athi-Sabaki River Basins Of Kenya Loicz-Start Africat Project Report.
Kitheka, J.U., Obiero, M. and Nthenge, P. 2005. River discharge, sediment transport and exchange in the
Tana Estuary, Kenya. Est. Coast. Shelf Sci. 63: 455-468.
Kulindwa, K., Sosovele, H. and Mgaya, Y.D. 2001. Socio-economic dimensions of biodiversity loss in
Tanzania. Dar es Salaam University Press.
Kulshrestha, U.C., Jain, M., Mandal, T.K., Gupta, P.K., Sarkar, A.K. and Parashar, D.C. 1999.
Measurements of acid rain over Indian Ocean and surface measurements of atmospheric aerosols at
New Delhi during INDOEXpre-campaigns Curr. Sci. 76 (7) 968-976.
Kyewalyanga, M.S. 2004. Physical Alteration And Destruction Of Habitat (PADH) In: Tanzania. UNEP,
Nairobi
Lacerda, L. D. 1997. Trace metals in mangrove plants: why such low concentrations? In: Kjerve, B.,
Lacerda, L.D. and Diop, E.H.S. (eds.) Mangrove ecosystem studies in Latin America and Africa.
UNESCO, Paris, p. 171-178.
UNEP-GEF WIO-LaB Project
11
Larcenda et al, 1997 "water quality on reefs an seagrases" NOT FOUND OR Lacerda, L.D. 1997. (SEE
ABOVE)
Lane, S. 2007. Regional overview and assessment of marine litter related activities in the West Indian
Ocean Region (Nairobi Convention and GEF WIO-LaB Project Countries). Prepared for WIOMSA on
behalf of UNEP (GPA and the Regional Seas Programme).
Landell-Mills & Sarageldin, 1993 cited in UNEP (2003) NOT FOUND OR Landell-Mills & Sarageldin,
1991. EXISTS BUT NOT FOUND
Lee, S.Y. 1999. Tropical mangrove ecology: physical and biotic factors influencing ecosystem structure
and function. Australian Journal of Ecology 24: 355-366.
Lerise, 2006. "flow and sediments" NOT FOUND
Lewis, S., May, S., Donkin, N. and Deplege, H. 1997. The influence of copper and heatshock on the
physiology and cellular stress response of Enteromprpha intestinalis. Marine Environmental Research
46 (1-5): 421-424.
Lindahl, U. 1998. Low-Tech Rehabilitation of Degraded Coral Reefs through Transplantation of Staghorn
Corals. Ambio, Vol. 27, No.8
Linden et al., 2002 "coral reefs" EXISTS BUT NOT FOUND
Linden, O. and Lundin, G.C. (eds.) (1996). Integrated Castal Zone Management in Tanzania Sida-Sarec
and World Bank, 166 pp.
Linden, O. and Sporrong, N. (eds.) 1999. Coral Reef degradation in the Indian Ocean - Status reports and
project presentations 1999. CORDIO, Sweden.
Little, M.C., Reay P.J., Grove, S.J. 1988. The fish community of an East African mangrove creek. J. Fish
Biol. 32: 729-747.
Louw, A., and F. Gichuki. 2003. Limpopo Basin Profile: Strategic research for enhancing agricultural
water productivity. Challenge Program on Water and Food http://www.waterforfood.org
Lugeiyamu, J.E. 2002. TANESCO activities and environment in the Pangani River Basin. In: The Pangani
River Basin: options for management. Report of a Workshop held at the Kilimanjaro Crane Hotel,
Moshi, Tanzania, 8-10 May 2002. December 2002. Nairobi, IUCN-EARO. p. 62-63.
Lyngby, J. E., Brix, H. and Schierup, H. 1992. Absorption and translocation of zinc in eelgrass (Zostera
marina L). J. Exp. Mar. Biol. Ecol. 58: 259-270.
Machiwa, J.F. 2000. Heavy metals and organic pollutants in sediments of Dar es Salaam Harbor prior to
dredging in 1999. Tanzania Journal of Science 26: 29-46.
Macia, A. 2004. Primary carbon sources for juvenile penaeid shrimps in a mangrove-fringed Bay of Inhaca
Island, Mozambique: a dual carbon and nitrogen isotope analysis. W Indian Ocean J. Mar. Sci. 3 (2):
151-161.
Maharavo, J. 2003. Rapport national sur le suivi de l'état de santé des récifs coralliens. NOT FOUND OR
Maharavo, J. 2002. EXISTS NOT FOUND
Malzbender, D. and Earle, A., 2007. The Impact and Implications of the Adoption of the 1997 UN
Watercourse Conventions for countries in Southern Africa. African Centre for Water Research Cape
Town, South Africa.
Mangi, S.C. and Roberts, C.M. 2007. Factors influencing fish catch levels on Kenyan's coral reefs.
Fisheries management and Ecology 14 (4): 245-253.
Masekesa, I. 2003. Coastal tourism. In: State of the Coast Report 2003. The National ICM Strategy and
Prospects for Poverty Reduction. p. 51- 56. Coastal Management Report No. 2002 TCMP.
Massingue, A. and Bandeira, S.O. 2005. Distribution of seagrasses and common seaweeds around
Nampula province (Northen Mozambique) with emphasis on Mozambique Island. W. Indian Ocean J.
Mar.Sci. 4(2):175-185.
Massinga, A. and Hatton, J. 1997. Status of the Coastal zone of Mozambique. In: C.G. Lundin and O.
Linden (eds.) Integrated Coastal Zone Management in Mozambique. Proceedings of the National
Workshop on Integrated Coastal Zone Management in Mozambique. Inhaca Island and Maputo,
Mozambique, May 5-10, 1996. p. 7-68.
Masundire, H. and Mackay, H. 2002. The role and importance of aquatic ecosystems in water resources
management. In: Hirji, R., Johnson, P., Maro, P. and Chiuta, T.M. (eds.) Environmental Sustainability
in Water Resources Management in Southern Africa. SADC, IUCN, SARDC, World Bank: Maseru,
Harare, Washington DC.
Mathieu, S. 2005. Country review: Madagascar. In: De Young, C. (ed.) Review of the state of world marine
capture fisheries management: Indian Ocean. FAO Fisheries Technical Paper. No. 488. Rome, FAO.
2006. 458 pp.
McAllister et al 1994. "reef fish." NOT FOUND OR McCallister, D.E., Schueler, F.W., Roberts, C.M.
and Hawkins, J.P. 1993. Mapping and GIS analysis of the global distribution of coral reef fishes on an
equal area grid. In: Miller, R. (ed.) Mapping the Diversity of Nature. London: Chapman and Hall.
UNEP-GEF WIO-LaB Project
12
McClanahan, T.R. 2004. The relationship between bleaching and mortality of common corals. Mar. Biol.
144(6): 1239-1245.
McClanahan, T.R., Maina, J., Sarger, C., Herran-Perez, P. and Deisek, E. 2005. Detriments to post-
bleaching recovery of corals. Coral Reefs 24: 230-246.
McClanahan, T.R. and Obura, D.O. 1995. Status of Kenyan coral reefs. Coastal Management 23: 47-76.
McClanahan, T.R. and Obura, D.O. 1997. Sedimentation effects on shallow coral communities in Kenya.
J. Exp. Mar. Biol. Ecol. 209:103-122.
McClanahan, T.R., Glaesel, H., Rubens, J., and Kiambo, R.W. 1997. The Effects of Traditional Fisheries
Management on Fisheries Yields and the Coral-Reef Ecosystems of Southern Kenya. Environmental
Conservation 24 (2): 105-120.
McClurg, T. P., Parsons, G. A., Simpson, E. A., Mudaly, R., Pillay, S., Newman, B. K. 2007. Sea disposal
of sewage Environmental surveys in the Durban outfalls region. Report No. 25. Surveys made in 2006.
CSIR Report: CSIR/NRE/PW/ER/2007/0080/C. Durban, South Africa.
McLeod, E. and Salm, R.V. 2006. Managing Mangroves for Resilience to Climate Change. IUCN, Gland,
Switzerland. 64 pp.
McMahon and Waycott, 2006 algae Kenya NOT FOUND
MacNae, W. 1968. A general account of the fauna and flora of mangrove swamps and forest in the Indo
West Pacific region. Adv. Mar. Biol. 63: 73-270.
McPherson, J.M. and Vincent, A.C.J. 2004. Assessing East African trade in seahorse species as a basis for
conservation under international controls. Aquatic Conservation: Marine and Freshwater Ecosystems
14: 521-538.
Mgana, S.S. and Mahongo, S. 1997. Land-based Sources and Activities Affecting the Quality and Use of
the Marine, Coastal and Associated Freshwater Environment Tanzania Mainland. Paper Presented at
a Workshop on the Implementation of the Global Programme of Action for the Protection of the
Marine Environment from Land-based Activities in the East African Region. Zanzibar, Tanzania, 6-9
October 1997.
Mgana, S.S. and Mahongo, S. 2002. Strategic Action Plan for Land-Based Sources and Activities
Affecting the Marine, Coastal and Associated Fresh Water Environment in the Eastern African Region.
A Report prepared by Food and Agriculture Organisation of the United Nations project for the
Protection and Management of the Marine and Coastal Areas of the Eastern African Region (EAF/5).
Ministry of Fisheries, 2003. Annual report 2000 Fisheries. Republic of Mauritius.
Moberg, F., and Folke, C. 1999. Ecological goods and services of coral reef ecosystems. Ecological
Economics 29: 215-233.
Mohammed, K. and Betlem, J. 1996. Proceedings of the National workshop on coastal erosion Zanzibar,
11-12 April 1996. Zanzibar environmental study series No. 20.
Mohammed, S.M., Machiwa, J., Njau, K.N., and Mato, R.R.A.M. 2006. Tanzania national summary report
on priority land-based activities, sources of pollution and pollutant levels in water and sediment. Draft
report submitted to WIO-Lab PMU, Nairobi, Kenya.
Mollion, 1998 "Madagascar reefs " EXISTS NOT FOUND
Montaggioni L. and Faure, G. 1980. Les Récifs corallines des Mascareignes (Océan Indien). Coll. Trav.
Univ. Fr. O. Indien, 151 pp.
Montano, M. 2007. Seychelles Country Report. Municipal Wastewater Management. Draft report
submitted to WIO-Lab PMU, Nairobi, Kenya.
Motta, H., Pereira, M.A.M., Gonçalves, M., Ridgway, T. and Schleyer, M.H. 2002. Coral reef monitoring
in Mozambique. II: 2000 report. MICOA/CORDIO/ORI/WWF. Maputo, Mozambique Coral Reef
Management Programme. 31 pp.
Mremi, S.D. and Machiwa, J.F. 2003. Heavy metal contamination of mangrove sediments and the
associated biota in Dar es Salaam, Tanzania. Tanzanian Journal of Science 29 (1): 61-76
Muhammed, S.M., Muhando, C.A., Machano, H., Jiddawi, N. and Yahya, S. 2005. Status of coral reefs in
Tanzania. In: Souter, D. and Linden, O. (eds.) Coral Reef Degradation in the Indian Ocean: Status
Report 2005. p. 36-47.
Mumby, P.J., Edwards, A.J., Arias-Gonzalez, J.E., Lindeman, K.C., Blackwell, P.G., Gall, A., Gorczynska,
M.I., Harborne, A.R., Pescod, C.L., Renken, H., Wabnitz, C.C.C. and Llewellyn, G. 2004. Mangroves
enhance the biomass of coral reef fish communities in the Caribbean. Nature 427: 533-536.
Munga, D., S. Mwangi, J., Kamau, M.M., Nguli, P.O., Gwada, L.N., Daudi, H., Ong'anda, S.M.,
Mwaguni, H.S., Massa, M., Tole, J.M., Onyari, J., Makopa, A., Gachanja, G., Opello, A., Kheir and S.
Machua, 2006. Land-based activities, pollution sources and levels in water and sediment in the coastal
and marine area of Kenya. UNEP, Nairobi. Draft report submitted to WIO-Lab PMU, Nairobi, Kenya.
UNEP-GEF WIO-LaB Project
13
Munissi, J.J.E. 1998. A comparative study of polluted and unpolluted intertidal floral communities near
Tanga Town. A report submitted for the fulfilment of the forth term programme at the University of
Dar Es Salaam. Department of Zoology and Marine Biology, 17 pp.
Munissi, J.J.E .2000. Dissolved oxygen, biochemical oxygen demand and selected green algae as
indicators of marine pollution near Dar Es Salaam. A report submitted in partial fulfilment of the
Degree of Bachelor of Science at the University of Dar Es Salaam. Department of Zoology and Marine
Biology, University of Dar Es Salaam, 18 pp.
Murdoch, W. 2004. A comprehensive account of the biology and conservation issues. Website. In
association with the University of Nottingham and The British Marine Life Study Society.
Muthiga, N.A. 2005.Testing for the effects of seasonal and lunar periodicity on the reproduction of the
edible sea urchin Tripneustes gratilla (L) in Kenyan coral reef lagoons. Hydrobiologia 549: 57-64.
Mvungi, A. 2003. Coastal Population Growth. In: State of the Coast Report 2003. The National ICM
Strategy and Prospects for Poverty Reduction. p. 45-47. Coastal Management Report No. 2002 TCMP.
Mwaipopo, R. and Lufumbi, J.M. 2003. An Assessment of the Soco-Economic Implications of PADH due
to Coastal Tourism; Mangrove Destruction; and Mining/Sedimnt Movement, Ports and Land
Reclamation & Dammng of Rivers. MORE DETAILS
Mwalyosi, R.B.B. 2004. Management of the Rufiji Delta as a wetland. Institute of Resource Assessment.
University of Dar es Salaam.
Mwanguni and Munga, 1997. Land-based sources and activities affecting the quality and uses of the
marine coastal and associated fresh water environments along the Kenya Coast.
http://seawaste.uwc.ac.za/archive/socio-economic.doc MORE DETAILS
Mwanguni, S. 2002. Public Health Problems in Mombasa District. A Case Study on Sewage Management.
MSc. Thesis, University of Nairobi, 86 pp.
Mwevura, H,, Othman, C. and Mhehe, G.L. 2002. Organochlorine pesticide residues in sediments and
biota from the coastal area of Dar es Salaam city. Mar. Poll. Bull. 45: 262-267.
Nakamura T., van Woesik R. 2001. Differential survival of corals during the 1998 bleaching event is
partially explained by water-flow rates and passive diffusion. Mar. Ecol. Progr. Ser. 212: 301304.
NEPAD, 2003. New Partnership for Africa's Development (NEPAD), Action Plan for the Environment
Initiative of NEPAD. http://www.nepad.org/2005/files/reports/action_plan/action_plan_english2.pdf
(accessed 17 July 2007).
New, et al., 2005. "ocean currents " NOT FOUND
Ngoile, M.A.K and Horrill, C. 1993. Coastal Ecosystems, Productivity and Ecosystem Protection: coastal
ecosystem management. Ambio 22:461-467.
Ngoile, M.A.K. and Shunula, J.P. 1992. Status and exploitation of the mangroves and associated fishery
resources in Zanzibar. In: Jaccarini, V., Martens, E. (eds.) The ecology of mangroves and related
ecosystems. Hydrobiologia 247: 229-234.
Ngusaru, A. 2002. Geological history. In: Richmond, M.D. (ed.) A Field Guide to Seashores of Eastern
Africa and the Western Indian Ocean Islands. SIDA, SAREC and University of Dar es Salaam. 461
pp.
Noble, R.G and Hemens, J. 1978. Inland water ecosystems in South Africa - a review of research needs.
Council for Scientific and Industrial Research (CSIR); Foundation for MORE DETAILS
Obura, D.O. 2001. Kenya Mar. Poll. Bull. 42 (8): 1264-1278.
Obura D.O. (ed) 2002. Proceedings of the International Coral Reef Initiative (ICRI) Regional Workshop
for the Indian Ocean, 2001. ICRI/UNEP/ICRAN/CORDIO.
Obura, D.O. 2005. Resilience and climate change: Lessons from coral reefs and bleaching in the Western
Indian Ocean. Est.Coast. Shelf Sci. 62: 353-372.
Ochieng, C., Erftemeijer, P.L.A. 2001 The status of seagrass ecosystems in Kenya and Tanzania. Draft
paper submitted to the UNEP-WCMC Global Seagrass Workshop, St Pete's Beach, Florida, 5-9
November, 2001. Unpublished.
Ochieng, C.A., Erftemeijer, P.L.A. 2003. Seagrasses of Kenya and Tanzania. In: Green, E.P. and Short,
F.T. (eds.) World Atlas of Seagrasses. WCMC. p. 82-92
Ochiewo, J. 2004. Changing fisheries practices and their socioeconomic implications in South Coast
Kenya. Ocean & Coastal Management 47: 389-408.
Oliveira E.C., Österlund, K., Mtolera, M.S.P. 2005. Marine Plants of Tanzania. A Field Guide to the
Seaweeds and Seagrasses. Stockholm University. 267 pp.
Olsen, S.B., Sutinen, J.G., Juda, L., Hennessey, T.M., Grigalunas, T.A. 2006. A Handbook on Governance
and Socioeconomic of Large Marine Ecosystems University of Rhode Island.
Ongwenyi, G.S. 1979. Problems of soil erosion and sedimentation in selected water catchment areas in
Kenya with special reference to the Tana River. UN Water E/CONF 70/TP 23.
UNEP-GEF WIO-LaB Project
14
Ongwenyi, G.S. 1983. Development of water resources. In: Ojany. F.F and Olson, S. (eds.) The Kenyan
Geographer. Special issue on the Proceedings of the Nairobi workshop (4-8th August 1981) Strategies
for developing the resources of the semi-arid areas of Kenya. p. 36-47.
Otieno, F.A.O and Maingi, S.M. 1983. Sedimentation Problems of Masinga Reservoir, paper presented at
the 4th Land and Water Management Workshop Feb. 15-19, 1993, Nairobi, Kenya
Palgrave, K.C. 2002. Trees of Southern Africa. Struik Publishers, Cape Town. 1212 pp.
Pallet, J. (ed.) 1997. Sharing Water of Southern Africa. The Desert Research Foundation of Namibia,
Windhoek.
Payet, R. 2003. Seychelles Country Report on Physical Alteration and Destruction of Habitats. Final
Report.
Payet, R.A., Soogun, N., Ranaivoson, E., Payet, R.J. and Abdallah, F.A. 2004. Indian Ocean ..UNEP 2002
Preliminary transboundary diagnostic study for the Western Indian.. MORE DETAILS
Payet et al., 2005 "coral reef" NOT FOUND OR Payet, R. 2005. Philosophical Transactions of the
Royal Society A: OR Payet, R. 2005. Management plan of the Seychelles sea cucumber fishery. Final
Report of Project No. FAO/TCP/SEY/2902, September 2005.:
PBWO/IUCN, 2006a. Hydrology of the Pangani River Basin. PBWO, Moshi, Tanzania and IUCN Eastern
Africa Regional Program, Nairobi, Kenya.
PBWO/IUCN, 2006b. Pangani River Health Assessment. PBWO, Moshi, Tanzania and IUCN Eastern
Africa Regional Program, Nairobi, Kenya.
PBWO/IUCN, 2007. Pangani River System State of the Basin Report 2007. PBWO, Moshi, Tanzania
and IUCN Eastern Africa Regional Program, Nairobi, Kenya.
Pillay, M. et al., 2002 "coral reef degradation " . . EXISTS BUT NOT FOUND
Pooley, 1997. "forest and dune forest" NOT FOUND OR Pooley, E. 1994. The Complete Field Guide to
Trees of Natal, Zululand and Transkei. Natal Flora Publications Trust. Durban. 512 pp.
Prayag, R., Jootun, L. and Bheeroo, R.A. 1995. Integrated coastal zone management. Protection and
management of marine and coastal areas of the Eastern African Region. Report prepared for
UNEP/FAO/IOC/IUCN EAF5 project. Ministry of Environment and Quality of Life, Mauritius. 92 pp.
Rabesandratana, R.N. 1996. Ecological distribution of seaweeds in two fringing coral reefs at Toliara (SW
of Madagarsacar). In: Bjork, M., Semesi A. K., Pedersén M. and Bergman, B. (eds.). Current trends in
Marine Botanical Research in East Africa Region. SIDA/SAREC, Uppsala, pp 141-161.
Radegonde, V. 1997. Update Seychelles National Overview on land-based sources and activities affecting
the marine, coastal and associated freshwater environment. Seychelles Bureau of Standards,
Seychelles. 31 pp.
Radhika, D. 2006. Mangrove Ecosystems of Southwest Madagascar: An Ecological, Human Impact, and
Subsistence Value Assessment. Tropical Resources Bulletin 25: 7 13.
Ralison, S. 1989. Summary of fisheries and resources information for Madagascar. In: Sanders, M.J.,
Sparre, P. and Venema, S.C. (eds.) Proceedings of the workshop on the assessment of the fishery
resources in the Southwest Indian Ocean. Albion, Mauritius, 4-25 Sept. 1987.
RAF/79/065/WP/41/85/E.
Ramsay, P.J. 1996 "..SA reefs.." EXISTS BUT NOT FOUND
Ramsay, P.J. and Mason T.R. 1990. Development of a type zoning model for Zululand coral reefs,
Sodwana Bay, South Africa . J. Coastal Res. 6: 829-852.
Ramessur, R.T. 2002. Anthropogenic-driven changes with focus on the coastal zone of Mauritius, south
western Indian Ocean. Regional Environmental Change 3 (13): 99-106.
Ramessusr, R.T., Parry, S.J. and Jarvis, K.E. 1998. Characterization of some trace metals from the export
processing zone and a costal tourist area in Mauritius using inductively coupled plasma mass
spectrometry. Environment International 24 (7): 773-781.
Rasolofoharinoro, M., Blasco, F. and Denis, J. 1997. Aquaculture in Madagascar's Mahajamba Bay.
Intercoast Network Special Edition 1. http://www.crc.uri.edu/comm/download/IC_Mangrove.pdf
Rawlins, S. 1957. The East African Mangrove Trade. Unpublished typescript in the East Africa
Herbarium, NMK, Nairobi.
Republic of Kenya, 2005. Statistical Abstract 2005. Central Bureau of Statistics: Ministry of Planning and
National Development, Government Printers, Nairobi.
Republic of Kenya, 2006. Ministry Of Tourism And Wildlife, Statistical Analysis Of Tourism Trends,
(Globally And Locally).
RSA DWAF, 1995. South African water quality guidelines for coastal marine waters. Volume 1. Natural
Environment, Volume 2. Recreational Use. Volume 3. Industrial Use. Volume 4. Mariculture.
Pretoria.
UNEP-GEF WIO-LaB Project
15
RSA DWAF, 2004. Water Quality Management Series Sub-Series No. MS 13.4. Operational policy for the
disposal of land-derived water containing waste to the marine environment of South Africa
Appendices. Edition 1. Pretoria (www.dwaf.gov.za/Documents).
Resource Analysis EDC, 1999. Feasibility of desiltation of lagoons in Rodrigues, Mauritius. MORE
DETAILS
Ribbink et al 2006 "SA coelacanth story" NOT FOUND OR Ribbink, A.J. and Roberts, M. 2006. African
coelacanth Programme Overview: An overview of the conference contributions. S. Afr. J. Sci. 102: 99.
Richmond, M.D. 2001. The marine biodiversity of the western Indian Ocean and its biogeography: How
much do we know? p. 241-262. In: Richmond M.D. & Francis, J. (eds.) Marine Science Development
in Tanzania and Eastern Africa. Proceedings of the 20th Anniversary Conference on Advances in
Marine Science in Tanzania. 28 June - 1 July, 1999, Zanzibar, Tanzania. IMS/WIOMSA. 569 pp.
Richmond, M.D. & Mohamed, A. 2005. Assessment of marine biodiversity, ecosystem health and resource
status of intertidal (non-mangrove) and sub-tidal (non-coral) habitats in MBREMP. Final Report.
Samaki Consultants Ltd., Dar es Salaam, Tanzania for IUCN-EARO, Nairobi, Kenya. 61 pp.
Richmond, M.D., Wilson, J.D.K., Mgaya, Y.D. and Le Vay, L. 2002. An analysis of smallholder
opportunities in fisheries, coastal and related enterprises in the floodplain and delta areas of the Rufiji
River, Tanzania. Rufiji Environment Management Project, IUCN.
Robertson, A. I. and Duke, N. C. 1987. Mangroves as nursery sites: comparisons of the abundance and
species composition of fish and crustaceans in mangroves and other nearshore habitats in tropical
Australia. Mar. Biol. 96: 193-206.
Robinson, J. and Shroff, J. 2004. The fishing sector in Seychelles. An over view with an amphasis on
Artisanal fisheries. SFA. Republic of Seychelles, Seychelles Medical and Dental Journal special issue.
7(1): 52-56.
Røhr, P.C., Killingtveit, Å Rumambo, O.H. 2002. Brief report on the River Basin MORE DETAILS
Rönnbäck, P., Macia, A., Almqvist, G., Schultz, L., Troell, M. 2002. Do penaeid shrimps have a
preference for mangrove habitats? Distribution pattern analysis on Inhaca Island, Mozambique. Est.
Coast. Shelf Sci. 55: 427-436.
Rowat, D. and Engelhardt, U. 2007. Seychelles: A case study of community involvement in the
development of whale shark ecotourism and its socio-economic impact. Fisheries research 84:11, 109-
113, Elsevier.
RSA. 1998. National Water Act - Act No 36 of 1998. ftp://ftp.hst.org.za/pubs/govdocs/acts/1998/act36.pdf
RSA DWAF, 2004. Water Quality Management Series Sub-Series No. MS 13.4. Operational policy for the
disposal of land-derived water containing waste to the marine environment of South Africa
Appendices. Edition 1. Pretoria. (www.dwaf.gov.za/Documents).
RSA DWAF, 2004. Water Quality Management Series Sub-Series No. MS 13.3. Operational policy for the
disposal of land-derived water containing waste to the marine environment of South Africa Guidance
on Implementation. Edition 1. Pretoria (www.dwaf.gov.za/Documents).
RSA DWAF, 2004. Water resource protection and assessment policy implementation process. Resource
directed measures for protection of water resource: Methodology for the Determination of the
Ecological Water Requirements for Estuaries. Version 2. Pretoria.
Ruwa, R.K. 1996 "communities into the littoral fringe" EXISTS NOT FOUND
Ruwa, R.K. 2006. The state of the marine environment: Regional Assessments. Chapter 3: Eastern
Africa. Report published by the United Nations Environmental Programme - Global Programme of
Action for the Protection (UNEP/GPA) Coordination Office, The Hague, Netherlands. Retrieved from
http://www.gpa.unep.org/.
Ruwa, R.K., Habib, G., Mukira, M., Okoth, G. and Mwatha, G. 2003. Profile of Kenya Marine and
Fisheries Country Working Resource Document. GEF-South-West Indian Ocean Fisheries Project
(SWIOFP) in Kenya. Publication No. 1 (2003), 71 pp.
Ryan, P. 2006. Assessment of current status on marine litter in South Africa. Unpublished report prepared
as input data to Land (2006). DST/NRF Centre of Excellence at the Percy FitzPatrick Insititute
University of Cape Town, Rondebosch 7701, South Africa.
SADC, 2000. SADC Protocol on Shared Watercourses. MORE DETAILS
Saenger et al, 2002. "fodder and fisheries resources to millions.. including.. WIO" NOT FOUND OR
Saenger, P. 2002. Mangrove ecology, silviculture and conservation. Kluwer Academic Publishers,
Dordrecht, the Netherlands. 361 pp.
Saket, M. and Matusse, R.V. 1994. Study for the determination of the rate of deforestation of the mangrove
vegetation in Mozambique. FAO/PNUD, MOZ/92/013.
Salomon, J.N. 1987. Le Sud-ouest de Madagascar, E´ tude de Ge´ographie Physique. Presses
Universitaires Bordeaux, Bordeaux, 998 pp. [in French].
UNEP-GEF WIO-LaB Project
16
Santana-Afonso S.P. et al., 2004. MORE DETAILS Country review: Mozambique Institute for Fisheries
research, Mozambique.
SARDC, 2003. Limpopo River Basin Factsheet 1. SADC Water Sector. [Web].
http://www.sardc.net/imercsa/Limpopo/pdf/Limpopo1.pdf [Date of access: 21 September 2006].
Schleyer et al 2005 coral reefs are found .. Natal" NOT FOUND OR Schleyer, M.H. and Celliers, L.2005.
Modelling reef zonation in the Greater StLucia Wetland Park, South Africa. Estuarine, Coastal and
Shelf Science. 63 (3): 373-384.
Schleyer, M.H. and Celliers L 2002. Biodiversity on Southern African coral reefs: what does the future
hold? CORDIO Annual Report, 2002.
Schouten et al 2002. ".. Mozambique eddies drift southward" CANNOT FIND OR Schouten, M.W., de
Ruijter, W.P.M., van Leeuwen, P.J. and Ridderinkhof, H. 2003. Eddies and variability in the
Mozambique Channel. Deep-Sea Research II 50 (12-13): 1987-2003.
SEACAM, 2001. The Voyage from Seychelles to Maputo: Successes and Failures of Integrated Coastal
Zone Management in Eastern Africa and Island States 1996-2001.Vols. 1& II.
SEACAM, 2003 "..coastal mining South Africa, Kenya, Mozambique and Tanzania" NOT FOUND
Semesi, A.K. 1991. Management plan for the mangrove ecosystem of mainland Tanzania. Vol. 11. Dar es
Salaam: Ministry of Tourism, Natural Resources and Environment (MTNRE), Forestry and
Beekeeping Division, Catchment Forestry Project.
Semesi., A.K. 1997 CANNOT FIND OR Semesi, A.K. 1988. Seasonal changes in macroepiphytes on
Thalassodendron ciliatum (Forsk) den Hartog at Oyster Bay, Dar-es-Salaam, Tanzania. In: Mainoya,
J.R. (ed). Proceedings of a workshop on ecology and bioproductivity of marine coastal waters of
Eastern Africa. Dar-es-Salaam, Tanzania. Faculty of Science, University of Dar-es-Salaam. 51 58.
Semesi., A.K. 1998. Mangrove management and utilization in eastern Africa. Ambio 27:620-626.
Shaghude, Y., Mutakyahwa, and Mohamed, S. 1994. National report on the status of coastal erosion, sea-
level changes and their impacts, Tanzanian case. In: IOC (ed) IOC-UNEP-WMO-SAREC Planning
Workshop on an Integrated Approach to Coastal Erosion, Sea Level Changes and their impacts.
Zanzibar, Tanzania, 17-21 January 1994. IOC - Workshop report no. 96. supp.1.,85-106.
Shaghude, Y.W. 2004. Coastal impacts of water abstraction and impoundment by damming in Africa: The
case of Rufiji river, Tanzania. Final Report Submitted to START, Washington DC.
Shah, N. 1994. Seychelles National report: Coastal erosion, sea-level changes and their impacts. In: IOC
(ed.) IOC-UNEP-WMO-SAREC Planning Workshop on an Integrated Approach to Coastal Erosion,
Sea Level Changes and their impacts. Zanzibar, Tanzania, 17-21 January 1994. IOC - Workshop report
no. 96. supp.1., 64-8.
Shah, N. 2002. Bikinis and biodiversity: tourism and conservation on Cousin Island. In: F. diCastri, and V.
Balaji (eds.) Tourism, Biodiversity and Information p.185-196. Leiden, Neth: Backhuys Publishers.
Shahin, M. 2003: Hydrology and Water resources of Africa. Kluwer, New York.
Sheppard, C.R.C 1987. Biodiversity, productivity and system integrity. Mar. Poll. Bull. 34: 680-681.
Sheppard, C.R.C. 2000. Coral reefs of the Western Indian Ocean: An overview. In: McClanahan, T.R.,
Sheppard, C.R.C. and Obura, D.O.(eds.) Coral Reefs of the Indian Ocean their ecology and
Conservation. Oxford University Press. 525 pp. ISBN 0-19-512596-7.
Sheppard, C. 2003. Predicted recurrences of mass coral mortality in the Indian Ocean. Nature 425: 294-
297.
Sheppard, C., Dixon, D., Gourlay, M., Sheppard, A., and Payet, R. 2005. Coral mortality increases
wave energy reaching shores protected by reef flats: Examples from Seychelles. Est. Coast Shelf Sci.
64: 223-234.
Short F.T., Coles R.G. and Pergent-martini, C. 2001. Global Seagrass Distribution. In: Short, F.T. and
Coles R. (eds.) Seagrass Reseach Methods. Elsevier Publishing, Amsterdan, pp 5-30.
Short, F.T. and Coles, R. (eds.) 2003. Seagrass Research Methods. Elsevier Publishing, Amsterdam
CHECK SPALDING "seagrass species within estuaries, especially St Lucia..... "
Short and Neckles, 1998. "changes in plant community structure ..loss .key species." NOT FOUND OR
(SEE NEXT)
Short, F.T. and Neckles, H.A. 1999. Review: The effects of global climate change on seagrasses. Aquatic
Botany 63: 169-196.
Shuk Man & Wai Chuen, 2005. "declining Giant groupers.." NOT FOUND
Snoussi, M., Kitheka, J., Shaghude. Y. and Kane, A. 2004. Coastal impacts of damming and water
abstraction in African catchments a synthesis of Africa. START, Washington DC.
Snow, G.C., Adams, J.B. and Bate, G.C. 2000. Effect of river flow on estuarine microalgal biomass and
distribution. Est. Coast. Shelf Sci. 51: 255266.
Souter, D. and Lindén, O. 2000. The health and future of coral reef systems. Ocean and coastal
management 43: 657-688.
UNEP-GEF WIO-LaB Project
17
Souter, D. and Lindén, O. 2005. Coral Reef Degradation in the Indian Ocean. (CORDIO) Status Report.
Spalding, M.D., Blasco, F. and Field, C.D., (eds.) 1997. World Mangrove Atlas. The International Society
for Mangrove Ecosystems, Okinawa, Japan. 178 pp.
Spalding, M.D., Ravilious, C. and Green, E.P. 2001. World Atlas of Coral Reefs. University of California
Press, Berkeley, CA.
Spencer T., Teleki, K.A., Bradshaw, C. and Spalding, M.D. 2000. Coral Bleaching in the Southern
Seychelles During the 19971998 Indian Ocean Warm Event. Mar. Poll. Bull 40: 569-586.
Spencer , T. and Viles, H. 2002. Bioconstruction, bioerosion and disturbance on tropical coasts: Coral reefs
and rocky limestone shores. Geomorphology 48 (1-3, 1) 23-50.
Spurgeon, J.P.G. and Lindahl, U. 2000. Economics of Coral Reef Restoration. In: Cesar, H.S.J. (ed.)
Collected Essays on the Economic of Coral Reefs. CORDIO, Kalmar, Sweden.
Stabrawa, A. 1999. Western Indian Ocean Environmental Outlook. United Nations Environment
Programme, 89 pp.
Stramma, L. and Lutjeharms, J.R.E. 1997. The flow field of the subtropical gyre of the South Indian
Ocean. J. Geophys. Res. 102 (3): 55135530.
SWIOP, 2006. FAO, South West Indian Ocean Fisheries Commission. Report of the first session of the
Scientific Committee. Dar es Salaam, United Republic of Tanzania, 31 May3 June 2006. FAO
Fisheries Report No. 806. Rome, FAO. 2006. 79 pp.
Taljaard, S., Van Ballegooyen, R.C. and Morant, P.D. 2000. False Bay Water Quality Review. Volume 2:
Specialist Assessments and Inventories of Available Literature and Data. Report to the False Bay
Water Quality Advisory Committee. CSIR Report ENV-S-C 2000-086/2. Stellenbosch.
Taljaard et al., 2004. "designed marine outfalls.." NOT FOUND
Taljaard, S., Morant, P.D., Van Niekerk, L. and Iita, A. 2006. The state of the marine environment:
Regional Assessments. Chapter 2: Southern Africa. Report published by the United Nations
Environmental Programme - Global Programme of Action for the Protection (UNEP/GPA)
Coordination Office, The Hague, Netherlands. Retrieved from http://www.gpa.unep.org/. OR Taljaard,
S., Monteiro, P.M.S. and Botes, W A M. 2006 - A structured ecosystem-scale approach to marine water
quality management. Water SA 32(4): 535-542.
Taljaard S., et al 2008. Regional Synthesis Report on Marine Pollution in the WIO region. MORE
DETAILS
Taljaard, S., Weerts, S., Pillay, S. and Rajkumar, A (in prep OR 2007). Proposed environmental quality
guidelines for the coastal zone of the WIO R region. Technical Discussion Document Draft for
Discussion. CSIR, Natural Resources and the Environment 170 pp.
Taljaard, S., Weerts, S., Pillay, S. and Rajkumar, A (in prep OR 2007 above). Guidelines for the
establishment of environmental quality objectives and targets in the coastal zone of the WIO R region.
Report to the WIO-LaB Project Management Unit, Nairobi, Krnya.
Talla 2005 "..Comoros fishery is regarded as at or near the level of full exploitation.." CHANGE
TEXT+YEAR ? Talla, P., De Young, C. & Gallène, J. 2004. Refonte du cadre juridique et définition
d'une stratégie opérationnelle de gestion des pêcheries Union des Comores. Rapport Final et
compendium des documents du projet TCP/COI/2902. Rome, FAO. (unpublished)
TCMP, 1999. "..fishers, now estimated 58,000, who land about 90% of all catches.." OR TCMP. 1999.
Mariculture Issue Profile, Working mariculture issue profile and guidelines. (http://www.crc.uri.edu).
OR TCMP. 1999. Initial Elements of a Coastal Policy.Proposed Vision, Principles, Goals and
Strategies. Working Document No. 5018.
TCMP, 2001. State of the Coast 2000. People and the Environment. Dar-es, Salaam, Tanzania: Tanzania
Coastal Management Partnership. October 2001. 53 pp
Temple, P.H. and Sundborg, A.1973. The Rufiji river, Tanzania: Hydrology and sediment transport. In (A.
Rapp, L. berry and P. Temple, eds.), Studies on Soil Erosion and Sedimentation in Tanzania. Research
Monograph No. 1. Institute of Resource Assessment and Land use Planning, pp. 345-368.
Titlyanov, E., Cherbagdy, I. and Kolmakov, P. 1995. Daily variations of primary production and
dependence of photosynthesis on irradiance in seaweeds and seagrass Thalassodendron ciliatum of the
Seychelles Islands. Photossyntetica 31: 101-115.
Tomlison, C.B. 1986. The Botany of Mangroves. Cambridge Tropical Biology Series, Cambridge,
University Press, Cambridge, New York, U.S.A
TPTC. 2001. Joint Incomati Basin Study. Tripartite Permanent Technical Committee: Kingdom of
Swaziland, Republic of Mozambique, Republic of South Africa.
Turner J., Hardman E., Klaus R., Fagoone I., Daby, D., Baghooli R., Persands S. 2000. The reefs of
Mauritius. Pages 94107 In: Souter D., Obura D., Linden O. Coral reef degradation in the Indian
Ocean. Status Report 2000. CORDIO/SAREC Marine Science. Stockholm, Sweden.
UNEP-GEF WIO-LaB Project
18
Turner, J. and Klaus, R. 2005. Coral reefs of the Mascarenes, western Indian Ocean. Phil. Trans. R. Soc. A
363 (1826): 229-250.
Turner, R.E. 1977. Intertidal vegetation and commercial yields of Penaeid shrimp. Trans. American
Fisheries Soc. 106 (5): 411-416.
Turpie, J.K., 2006: The Valuation of Riparian Fisheries in Southern and Eastern Africa. Southern Waters,
Cape Town.
Turton, A.R., Hattingh, H.J., Maree, G.A.,Roux, D.J., Claassen, M.,Strydom, W.F. (Eds.) (2007):
Governance as a Trialogue: Government-Society-Science in Transition Series: Water Resources
Development and Management, 354pp..
Uku, J.N. 1995. An Ecological Assessment of Littoral Seagrass. MSc. Thesis University of Nairobi, 185
pp.
Uku, J.N. 2005. Seagrass and their Epiphytes: Characterization of Abundance and Productivity in Tropical
Seagrass Beds. PhD. Thesis, University of Stockholm, Sweden
Uku, 2006. sea urchin Tripneustes gratilla NOT FOUND OR see De la Torre Castro et al..
Uku, J. and Björk, M. 2005. Productivity aspects of three tropical seagrass species in areas of different
nutrient levels in Kenya. Est. Coastal Shelf Sci. 63: 407-420.
Uku et al., 2005 "urchins in Diane-Chale lagoon" NOT FOUND OR Uku, J., Ndirangu, S. 2001 Seagrass
habitats of the Diani-Chale area. In: Muthiga, N.(ed.) The biophysical and ecological profile of Diani-
Chale. Draft report for IUCN. P 27-37. OR Uku, J., Sven, B. and Björk, M. 2005 Mar. Biol. 147 (5):
1085-1090.
UNDP, 1997. "....their legal rights and obligations" NOT FOUND
UNDP, 2000. ".....rights, equitable development and accountability"
UNDP, 2003 Poverty Reduction and Human Rights. A Practice Note.
http://www.hshr.org/hrpovertyresources.htm
UNDP, 2006. Human Development Report 2006: Beyond Scarcity: Power, poverty and global water crisis.
"includes: the ecosystem effects of climate change; ALSO the highest per capita GDP ".. Viewed on 2
October 2007 at http://hdr.undp.org/hdr2006/statistics/indicators/5.html.
UNEP, 1982. "estimated 20 kl/capita/yr" NOT FOUND
UNEP, 1987. "Nairobi Convention..." NOT FOUND
UNEP, 1998. Eastern Africa Atlas of Coastal Resources 1: Kenya. UNEP Regional Reports and Studies,
UNEP and BADC (Government of Belgium), 119 pp.
UNEP, 1998. Overview of land-based sources and activities affecting marine, coastal and associated
freshwater environment in the eastern Africa region. UNEP Regional; Seas Reports and Studies No.
167.
UNEP, 2001. Eastern Africa Atlas of Coastal Resources: Tanzania. UNEP and BADC (Government of
Belgium), 111 pp.
UNEP, 2003. "..loss of mangrove cover, ..poverty" NOT FOUND
UNEP, 2005 "..coelacanth on Red List." UNCERTAIN OR UNEP, 2005. Atlantic and Indian Oceans
Environment Outlook. United Nations Environment Programme, Nairobi. ISBN: 9280725254.
UNEP, 2005. Hydropolitical Vulnerability and Resilience along International Waters. Africa, Nairobi,
United Nations Environment Programme.
UNEP, 2006. Ecosystem-based management. Markers for assessing progress. UNEP/GPA, The Hague,
Netherlands.
UNEP, 2006a. Africa Environment Outlook 2, Our Environment, Our Wealth. United Nations Environment
Programme, Nairobi, Kenya. 542 pp.
UNEP, 2006b. Challenges to International Waters Regional Assessments in a Global Perspective. United
Nations Environment Programme, Nairobi, Kenya. ("fisheries.. tourism". CHECK)
UNEP. 2007. "solid wastes dumped at the edge of mangroves" NOT FOUND
UNEP. 2008a. Regional Synthesis Reports ...
UNEP. 2008b. Regional Synthesis Reports ...
UNEP/GPA and WIOMSA, 2004. Overview of Physical Alteration and Destruction of Habitats in the
Eastern African Region using Geographical Information System (GIS).
UNEP/GPA and WIOMSA, 2004b. Regional Overview of the Physical Alteration and Habitat Destruction
(PADH) in the Western Indian Ocean.
UNEP/Nairobi Conversion Secretariat, 2008a. Regional Assessment of the State of Pollution in the WIO
Region.
UNEP/Regional Seas Programme, 2008b. Regional Overview and Assessment of Marine Litter Related
Activities in the WIO Region.
UNEP/Nairobi Convention Secretariat, 2008c. The Status of Municipal Wastewater (MWW) Management
in the WIO Region.
UNEP-GEF WIO-LaB Project
19
UNEP/Nairobi Convention Secretariat, 2008d. Regional Overview and Assessment of River-coast
Interactions in the WIO Region.
UNEP/Nairobi Convention Secretariat, 2008e. Regional Review of Policy, Legal and Institutional
Frameworks for Addressing Land-based Sources and Activities in the WIO Region.
UNEP/Nairobi Convention Secretariat, 2008f. Regional Review of the Status of Ratification of
International Conventions related to Land-based Sources and Activities Management in the WIO
Region.
Valiela, I., Bowen, J.L., and York, J.K. 2001. Mangrove forests: one of the world's threatened major
tropical environments. Biosciences 51 (10): 801 815.
Van den Bossche, J.P. and Barnascek, G.M. 1990. Some general and theoretical considerations on the fish
yield of African rivers. J. Fish. Biol. OR Van den Bossche, J.P. and Bernascek, G.M.1990. Source-
book for the inland fishery resources of Africa. 3 vols. CIFA Tech. Pap. 18/1, 411 p.
Van der Elst, R., Everett, B., Jiddawi, N., Mwatha, G., Afonso, P.S. and Boulle, D. 2005. Fish, fishers and
fisheries of the West Indian Ocean: their diversity and status. A preliminary assessment. Phil. Trans. A
Math. Phys. Eng. Sci. Jan 15. 363 (1826): 263-84.
Van der Zaag, P. and Carmo Vaz, A. 2003. Sharing the Incomati waters: cooperation and competition in
the balance. Water Policy 5: 349-368.
Van der Zaag, P. 2000. "The Pungwe River Basin" NOT FOUND OR (from www.unesco.org).
Van Katwijk, M.M., Meier, N.F., van Loon, R., van Hove, E.M., Giesen, W.B.J.T., van der Velde, G. and
C. den Hartog, C. 1993. Sabaki River sediment load and coral stress: correlation between sediments
and condition of the Malindi-Watamu reefs in Kenya (Indian-Ocean), Mar. Biol. 117: 675 683.
Van Wyk, N. 2007: Personal Communication via e-mail on 21/8/2007.
Van Wyk, A. and Smith, G. 2001. Regions of Floristic Endemism in Southern Africa. A Review with
Emphasis on Succulents. Undamus Press, South Africa. 1999 pp.
Veron, 1995. "..coral diversity" DOES EXIST CANNOT FIND
Vetter, W., Weichbrodt, M., Scholz, E., Luckas, B. and Oelschläger, H. 1999. Levels of organochlorine
(DDT, PCBs, Toxaphene, Chlordane, Dieldrin, and HCHs) in blubber of South African fur seals
(Arctocephalus pusillus pusillus) from Cape Cross/Namibia. Mar. Poll. Bull. 38 (9): 830-836.
Wafar, M.V.M. and Wafar, S. 2001. 101 Questions: Chapter 3 In: Coral Resources, National Institute of
Oceanography, Goa and Administration of the U.T. of Lakshadweep, India.
Wakibia, J.G. 1995. The potential human induced impacts on the Kenya seagrasses. UNESCO reports in
Marine science, No.66.
Walmsley, S., Purvis, J. and Ninnesa, C. 2006. The role of small-scale fisheries management in the
poverty reduction strategies in the Western Indian Ocean region Ocean and Coastal Mgt. 2006, Pages
812-833 Environmental Issues in the Western Indian Ocean, Environmental Issues in the Western
Indian Ocean.
Wang Y., Bonynge, G., Nugranad, J., Traber, M., Ngusaru, A., Tobey., J., Hale, L., Bowen, R. and
Makota, V. 2003. Remote Sensing of Mangrove Change Along the Tanzania Coast. Marine Geodesy,
26:3548.
Wass, 1992. " Bamburi Cement quarry rehabilitation initiative in Kenya" NOT FOUND OR Wass, P.
(ed.) 1995. Kenya's indigenous forests: status, management and conservation. IUCN, Grand,
Switzerland, and Cambridge, UK. Xii + 205pp. 2-8317-0292-5.
Watermeyer, Legge, Piesold, Uhlman, 1981. Athi river basin preinvestment study. For: TARDA (Tana and
Athi River Development Authority), Nairobi. Agrar and Hydrotechnik GmbH, Essen
Waycott, M., McMahon, K., Mellors, J., Calladine, A. and Kleine, D. 2004. A guide to tropical seagrasses
of the Indo-West Pacific. Copyright James Cook University, Townsville. 72 pp.
Weber, M., Lott, C. and Fabricius, K. 2006. Sedimentation stress in a scleractinian coral exposed to
terrestrial and marine sediments with contrasting physical, organic and geochemical properties. J Exp.
Mar. Biol. Eco. 336: 18-32.
Wekwe, W.W., Othman, O.C. and Khan, M.R .1989. Seaweeds as heavy metal pollution indicators. In:
Environmental Pollution and its Management in Eastern Africa. In: Khan, M.R. and Gijzen, H.J. (eds.)
Proceedings of a Symposium on Environmental Pollution and its Management in Eastern Africa 11- 15
September, 1989, Dar es Salaam.
Westmacott, S., Cesar, H. S. J., Pet-Soede, L., and Linden, O. 2000. Coral Bleaching in the Indian Ocean:
Socio-Economic Assessment of Effects. In: Cesar, H.S.J. Collected Essays on the Economic of Coral
Reefs. CORDIO, Kalmar, Sweden.
WGIPA-I, 2000. Development and Protection of the Coastal and Marine Environment in Sub-Saharan
Africa. First Meeting of the Working Group on Integrated Problem Analysis (WGIPA-I) Paris, 5-7
December 2000.http://www.environnement.gouv.sn/IMG/pdf/1-WGIPA-I.pdf
White, F. 1983. The Vegetation of Africa. United Nations, Paris. 356 pp.
UNEP-GEF WIO-LaB Project
20
Wild, H. Barbosa, L.A. Grandvaux, L.A. 1967. Vegetation map (1:2 500 000) of the flora Zambeziaca
area. Descriptive memoir, Collins, Salisbury, Rhodesia. 71 pp.
William, J. 1988. Summary of the fisheries and resources information for the Comores. In: M.J. Sanders,
P. Sparre and S.C. Venema (eds.), Proceedings of the workshop on the assessment of the fishery
resources in the Southwest Indian Ocean, Albion, Mauritius, 4-25 September 1987.
RAF/79/065/WP/41/85/E.
Wilkinson, 1998. "..coral reef bleaching" NOT FOUND OR Wilkinson, C R. 1999 - Global and local
threats to coral reef functioning and existence: review and prediction. Marine and Freshwater Research
50: 867 - 878.
Wilkinson, C.R., Linden, O., Cesar, H., Hodgson, G., Rubens, J. and Strong, A.E. 1999. Ecological and
socio-economic impacts of 1998 coral mortality in the Indian Ocean: an ENSO impact and a warning
for future change? Ambio 28: 188-196.
Wilkinson, 2000. "Kenya coral reefs mortality" OR Wilkinson C.R. 2000. Status of coral reefs of the
world: 2000. Global Coral Reef Monitoring Network and Australian Institute of Marine Science, 363
pp. Townsville, Australia.
Wilkinson, C.R. 2004. Status of coral reefs of the world: 2004. Australian Institute of Marine Science.
WIOMSA, 2006. ".... science research and development in the WIO region" NOT FOUND
WIOMSA, 2007. Sheet 13: Mariculture. In: Managing Marine Protected Areas: A TOOLKIT for the
Western Indian Ocean. (www.wiomsa.org/mpatoolkit/Themesheets/I3_Mariculture.pdf on 26 July
2007).
WIO Lab/WIOMSA, 2007. "... particularly of ICAM issues" NOT FOUND
World Bank (2000) Can Africa Claim the 21st Century, World Bank, Washington D.C
World Bank, 2006. "..Mozambique - Agriculture contributed." NOT FOUND OR internet citation: World
Bank, 2006. Site:
http://web.worldbank.org/external/projects/main?pagePK=104231&piPK=73230&theSitePK=40941&
menuPK=228424&Projectid=P001799
World Bank. 2007. Key Development Data and Statistics. (viewed 11 August 2007).
http://econ.worldbank.org/WBSITE/EXTERNAL/DATASTATISTICS/)
World Bank. 2007. World Development Indicators database.
WHO, 1982, Rapid Assessment of Sources of Air, Water and Land Pollution. WHO Offset Publication No.
62, Geneva.
WHO, 2003 "World Health Survey, Comoros" OR WHO, 2003. Diet, Nutrition and the Prevention of
Chronic Diseases: Report of a Joint WHO/FAO. Expert Consultation, Geneva, 28 January - 1 February
2002, WHO technical report series: 916, World Health Organization, Geneva.
WHO and UNICEF, 2000. Global Water Supply and Sanitation Assessment 2000 Report. 41 pp.
World Resources Institute, 2007. (Website). The Value of Coastal Ecosystems. Viewed on 22nd February
2008 at http://www.earthtrends.wri.org/updates/node/118.
World Resources Institute, 2007. Nature's Benefits in Kenya, An Atlas of Ecosystems and Human Well-
Being. WRI and Department of Resource Surveys and Remote Sensing, Ministry of Environment and
Natural Resources, Kenya; Central Bureau of Statistics, Ministry of Planning and National
Development, Kenya; and International Livestock Research Institute. Washington, DC and Nairobi:
World Resources Institute.
World Resources Institute, 2008. Empowering people; A good Governance Analysis of Electricity (India ,
Indonesia, Philippines, Thailand).
WWF, 2006. The Eastern Africa Coastal Forests Ecoregion. Strategic Framework for Conservation: 2005
2025. WWF-EARPO, Nairobi.
WWF, 2004. The Eastern African Marine Ecoregion Vision: A large scale conservation approach to the
management of biodiversity. WWF: Dar es Salaam, Tanzania. 53 pp.
van Wyk A.E. and Smith G.F. 2001 Regions of Floristic Endemism in Southern Africa. A Review with
Emphasis on Succulents. Umdaus Press, Pretoria.
Younge, A., Negussie, G. and Burgess, N.D. 2002. Eastern Africa Coastal Forest Programme. Regional
Workshop Report, WWF-EARPO, Nairobi.
Zanting, H.A., Nacueve, C. and Novela, B. 1994. Salt intrusion in the Pungue estuary. Conflict Prevention
and Cooperation in International Water Resources Handouts DNA,. Maputo / Companhia de Aguas da
Beira E.E., Beira; p.1-3; p.19, p. 29-32 http://unesdoc.unesco.org/images/0013/001333/133316e.pdf
ZRA, 1998: Environmental Impact of Expanding Utilisation of Water Resources from the Basin. Sector
Studies under ZACPLAN. Sector Study No. 7. Zambezi River Authority, Lusaka.
UNEP-GEF WIO-LaB Project
21
Document Outline
- þÿ
- þÿ
- TOC TDA_111108.pdf
- TDA Chapter 2_111108.pdf
- Chapter 3 TDA_111108.pdf
- þÿ
- þÿ
- þÿ
- þÿ
- þÿ
- þÿ
- þÿ
- þÿ
- þÿ
- þÿ
- þÿ
- þÿ
- þÿ
- þÿ
- Chapter 4 TDA_111108.pdf
- þÿ
- þÿ
- þÿ
- þÿ
- þÿ
- þÿ
- þÿ
- þÿ
- þÿ
- þÿ
- þÿ
- þÿ
- þÿ
- þÿ
- þÿ
- þÿ
- þÿ
- þÿ
- þÿ
- þÿ
- þÿ
- þÿ
- þÿ
- þÿ
- þÿ
- þÿ
- þÿ
- þÿ
- þÿ
- Chapter 5 TDA_111108.pdf
- Chapter 6 TDA_111108.pdf
- þÿ
- þÿ
- þÿ
- þÿ
- þÿ
- þÿ
- þÿ
- þÿ
- þÿ
- þÿ
- þÿ
- þÿ
- þÿ
- þÿ
- þÿ
- þÿ
- þÿ
- þÿ
- þÿ
- þÿ
- þÿ
- þÿ
- þÿ
- þÿ
- þÿ
- þÿ
- þÿ
- þÿ
- þÿ
- þÿ
- þÿ
- þÿ
- þÿ
- Bibliography TDA_111108.pdf