


Removal of barriers to the introduction
of cleaner artisanal gold mining
and extraction technologie
in Kadoma, Zimbabwe
Part B: Health Assessment
Final Report

Removal of barriers to the introduction
of cleaner artisanal gold mining
and extraction technologie
in Kadoma, Zimbabwe
Part B: Health Assessment
Final Report
Stephan Boese-O´Reilly, Felicitas Dahlmann, Beate Lettmeier, Gustav Drasch
Institute of Forensic Medicine, Ludwig-Maximilians University,
Munich, November 11th, 2004
UNIDO Project EG/GLO/01/G34 No.03/089
BRGM Project Nr 822657-3
Keywords : Mercury, Amalgamation, Gold, Environmental Assessment, Health Assessment,
Artisanal mining, Cleaner Technology, Fish, Muscle, Chakari, Kadoma, Zimbabwe.
In bibliography, this report should be cited as follows :
Boese-O'Reilly S., Dahlmann F., Lettmeier B., Drasch G. (2004) Removal of barriers to the
introduction of cleaner artisanal gold mining and extraction technologie in Kadoma, Zimbabwe.
Final report, 130 p., 28 Figures, 25 Pictures, 22 Tables, 3 Appendix.
© BRGM, 2005. No part of this document may be reproduced without the prior permission of BRGM.
Health Assessment Kadoma, Zimbabwe
Contents
1. Executive summary..............................................................................................9
2. Study setting and clinical examinations (Stephan Boese-O´Reilly, Beate
Lettmeier, Felicitas Dahlmann) ..................................................................................13
2.1. INTRODUCTION ...............................................................................................13
2.2. MERCURY.........................................................................................................14
2.3. ZIMBABWE - KADOMA SMALL SCALE MINING AREA...................................14
2.4. PROJECT DESIGN ...........................................................................................22
2.4.1.Questionnaire.........................................................................................25
2.4.2.Neurological examination.......................................................................25
2.4.3.Neuro-psychological testing ...................................................................27
2.4.4.Tremor-meter .........................................................................................28
2.4.5.Laboratory field project...........................................................................29
2.4.6.Test for protein in urine ..........................................................................31
2.5. GENERAL HEALTH PROBLEMS IN KADOMA DISTRICT...............................31
2.5.1.Health care system in Kadoma district ...................................................31
2.5.2.General health data................................................................................32
2.6. GENERAL HEALTH PROBLEMS IN KADOMA DISTRICT...............................36
2.6.1.Children's health in Kadoma district.......................................................37
2.7. PRELIMINARY CLINICAL RESULTS OF THE HEALTH ASSESSMENT.........38
2.7.1.Clinical and neurological examination ....................................................38
2.7.2.Children's health in Kadoma mining area...............................................40
2.7.3.Hygienic problems..................................................................................41
2.7.4.Social problems......................................................................................41
2.7.5.General problems during the field project ..............................................42
2.7.6.Participation ...........................................................................................42
Final Report
3
Health Assessment Kadoma, Zimbabwe
3. Specimen analysis and statistical results
(Gustav Drasch, Beate Lettmeier) ...................................................................... 43
3.1. LABORATORY METHODS............................................................................... 43
3.1.1.Material and sample storage ................................................................. 43
3.1.2.Sample preparation ............................................................................... 43
3.1.3.Mercury determination and quality control............................................. 43
3.2. STATISTICAL ANALYSIS ................................................................................. 44
3.2.1.Statistical methods................................................................................. 44
3.2.2.Description of mercury levels in urine, blood and hair ........................... 44
3.2.3.Exclusion of data ................................................................................... 46
3.2.4.Forming subgroups due to residence and occupation........................... 46
3.2.5.Mercury Levels compared to Toxicological Threshold Limits ................ 51
3.2.6.Reducing of redundant data for statistical analysis ............................... 53
3.2.7.Scoring of medical results...................................................................... 56
3.2.8.Statistical analysis of mercury levels versus clinical data...................... 59
3.3. DISCUSSION OF THE STATISTICAL ANALYSIS............................................ 61
3.4. DECISION FOR THE DIAGNOSIS OF A CHRONIC MERCURY
INTOXICATION................................................................................................. 61
3.5. PREVALENCE OF THE DIAGNOSIS "MERCURY INTOXICATION" ............... 62
3.6. COMPARISON OF VOLUNTEERS FROM DIFFERENT MINES ..................... 64
3.7. INFLUENCE ON NURSED BABIES ................................................................. 69
3.8. SCREENING OF MERCURY URINE CONCENTRATION IN FIELD................ 71
4. Summary and Recommendations (Gustav Drasch, Stephan Boese-O´Reilly) . 73
4.1. SUMMARY ........................................................................................................ 73
4.2. CONCLUSIONS AND RECOMMENDATIONS ................................................. 75
4.2.1.How to improve "general health"?.......................................................... 75
4
Final Report
Health Assessment Kadoma, Zimbabwe
4.2.2.How to reduce "mercury as a health hazard"? .......................................75
4.2.3.How to improve the "knowledge on mercury as a health hazard" ..........76
4.2.4.How to reduce the "release of mercury into the environment" ...............76
4.3. LITERATURE.....................................................................................................77
5. Acknowledgement..........................................................................................................81
List of figures
Figure 1 - UNIDO project countries............................................................................................13
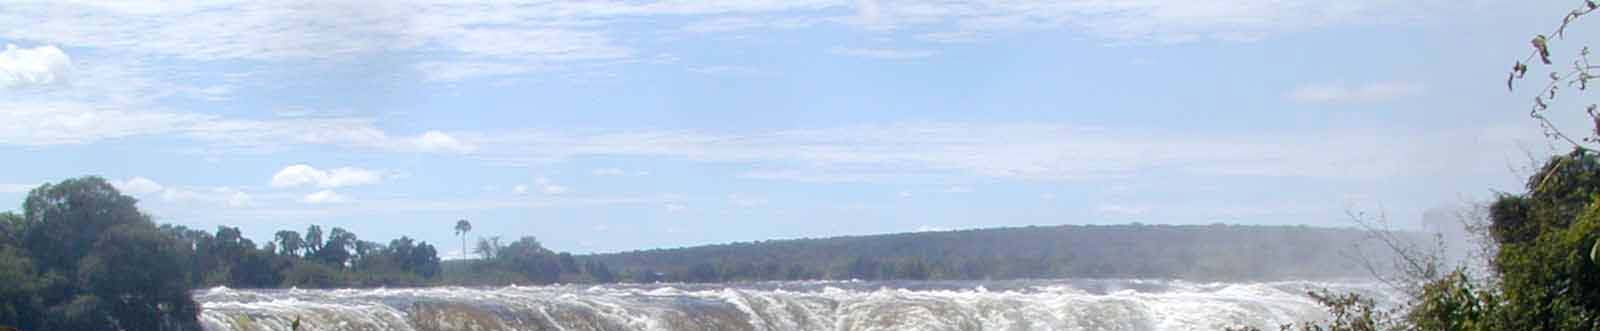
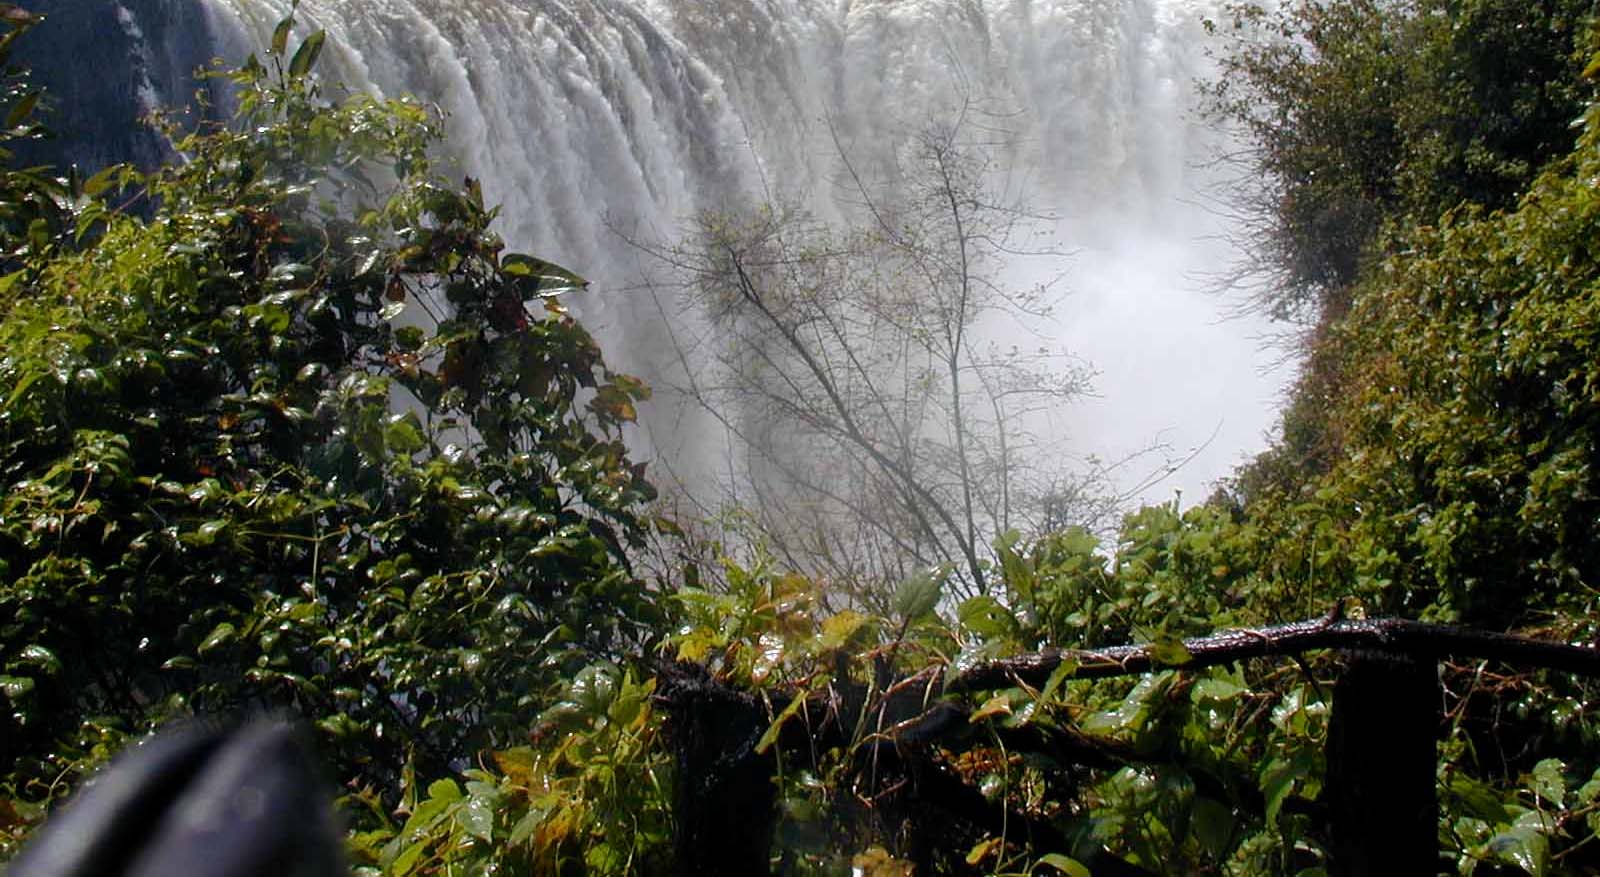
Figure 2 - Map of Zimbabwe Victoria Falls .............................................................................14
Figure 3 - Local map of Kadoma area (provided by BRGM) .....................................................15
Figure 4 - Age distribution of all volunteers, selected for the statistical evaluation ...................47
Figure 5 - Total mercury concentration in blood samples..........................................................48
Figure 6 - Total mercury concentration in urine samples...........................................................48
Figure 7 - Total mercury concentration in hair samples.............................................................49
Figure 8 - Percentage of inorganic mercury in hair samples. ....................................................50
Figure 9 - Percentage of organic bound mercury in hair samples.............................................50
Figure 10 - Frequency of the anamnestic parameter "metallic taste" ..........................................54
Figure 11 - Children; frequency of the anamnestic parameter "excessive salivation" .................54
Figure 12 - Adults; frequency of the anamnestic parameter "bluish coloration of
gingiva". .....................................................................................................................55
Figure 13 - Adults; frequency of the anamnestic parameter "ataxia of gait"................................55
Figure 14 - Frequency of the anamnestic parameter "dysdiadochokinesia"................................56
Figure 15 - Hg-concentration in blood; comparison of the heavy drinkers with the non
heavy drinkers among the group of amalgam-burners..............................................57
Figure 16 - Hg-concentration in urine; comparison of the heavy drinkers with the non
heavy drinkers among the group of amalgam-burners..............................................58
Figure 17 - Medical score sum of the different subgroups...........................................................59
Figure 18 - Frequency of the diagnosis "mercury intoxication"....................................................63
Figure 19 - Distribution of age versus different mining areas; amalgam-burners only. ...............65
Figure 20 - Distribution of gender versus different mining areas; amalgam-burners only...........65
Figure 21 - Medical score sum versus different mining areas; amalgam-burners only. ..............66
Figure 22 - Hg-concentration in urine versus different mining areas; amalgam-burners
only. ...........................................................................................................................66
Figure 23 - Concentration of total Hg in hair versus different mining areas; amalgam-
burner only.................................................................................................................67
Final Report
5
Health Assessment Kadoma, Zimbabwe
Figure 24 - Hg-concentration in blood versus different mining areas; amalgam-burner
only............................................................................................................................ 67
Figure 25 - Frequency of the clinical parameter "ataxia of gait"; amalgam-burner only.............. 68
Figure 26 - Frequency of the clinical parameter "dysdiadochokinesia"; amalgam-burner
only............................................................................................................................ 68
Figure 27 - Frequency of the diagnosis of a mercury intoxication; amalgam-burner only. ......... 69
Figure 28 - Comparison of the concentration of inorganic Hg-U, as determined in field
and the total Hg-U concentration, as determined in the lab (Linear
regression line and 90% confidence intervals). ........................................................ 71
List of pictures
Picture 1-
Liquid mercury used in Tix mine ............................................................................. 14
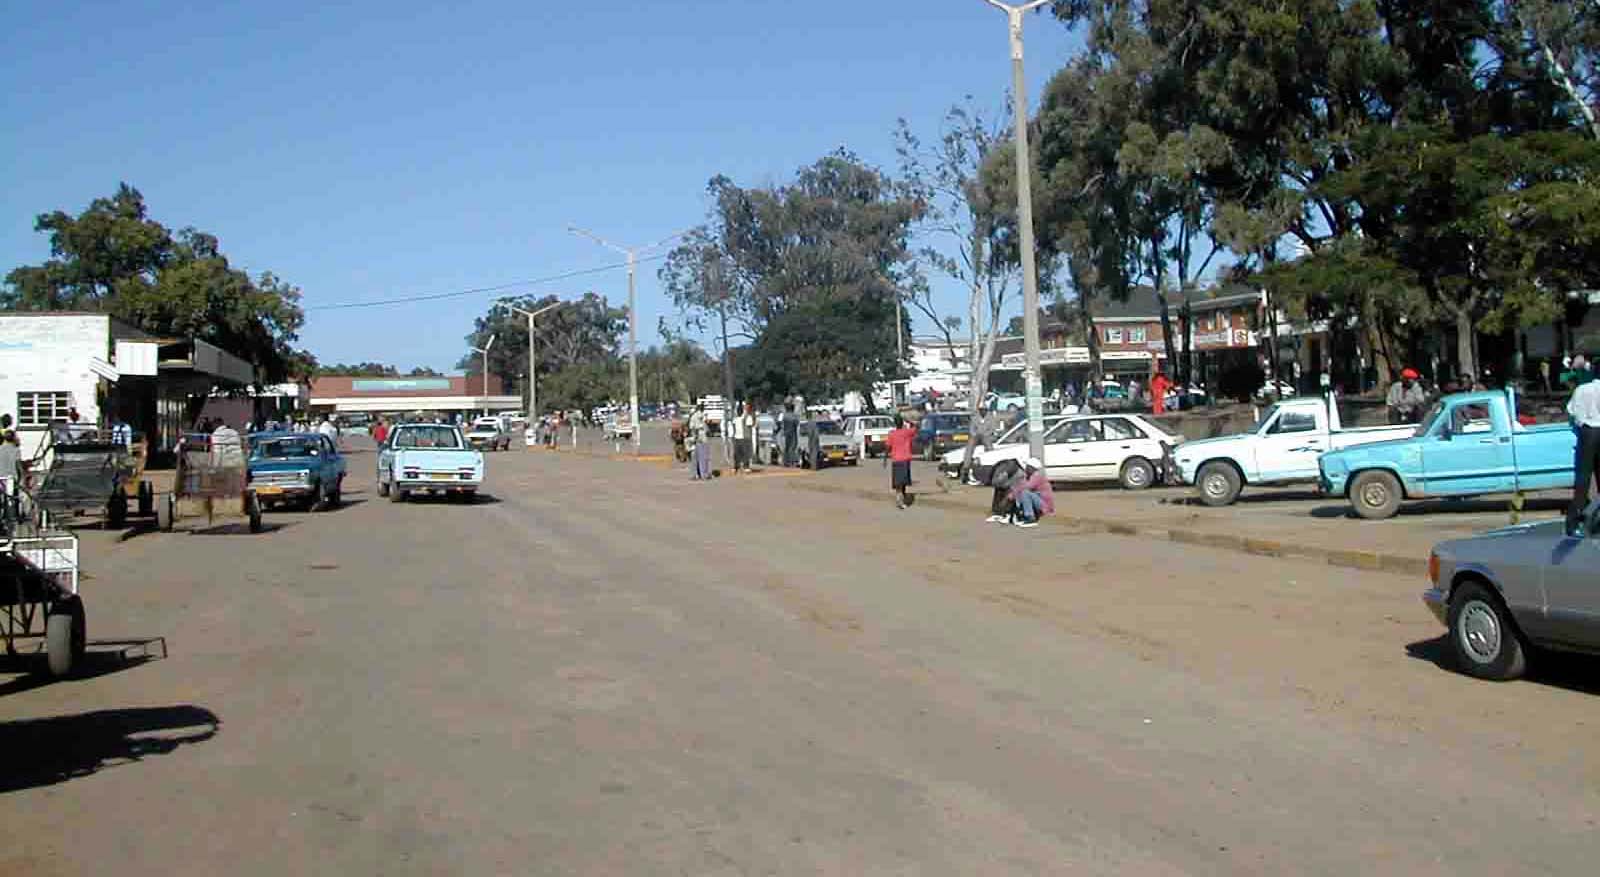
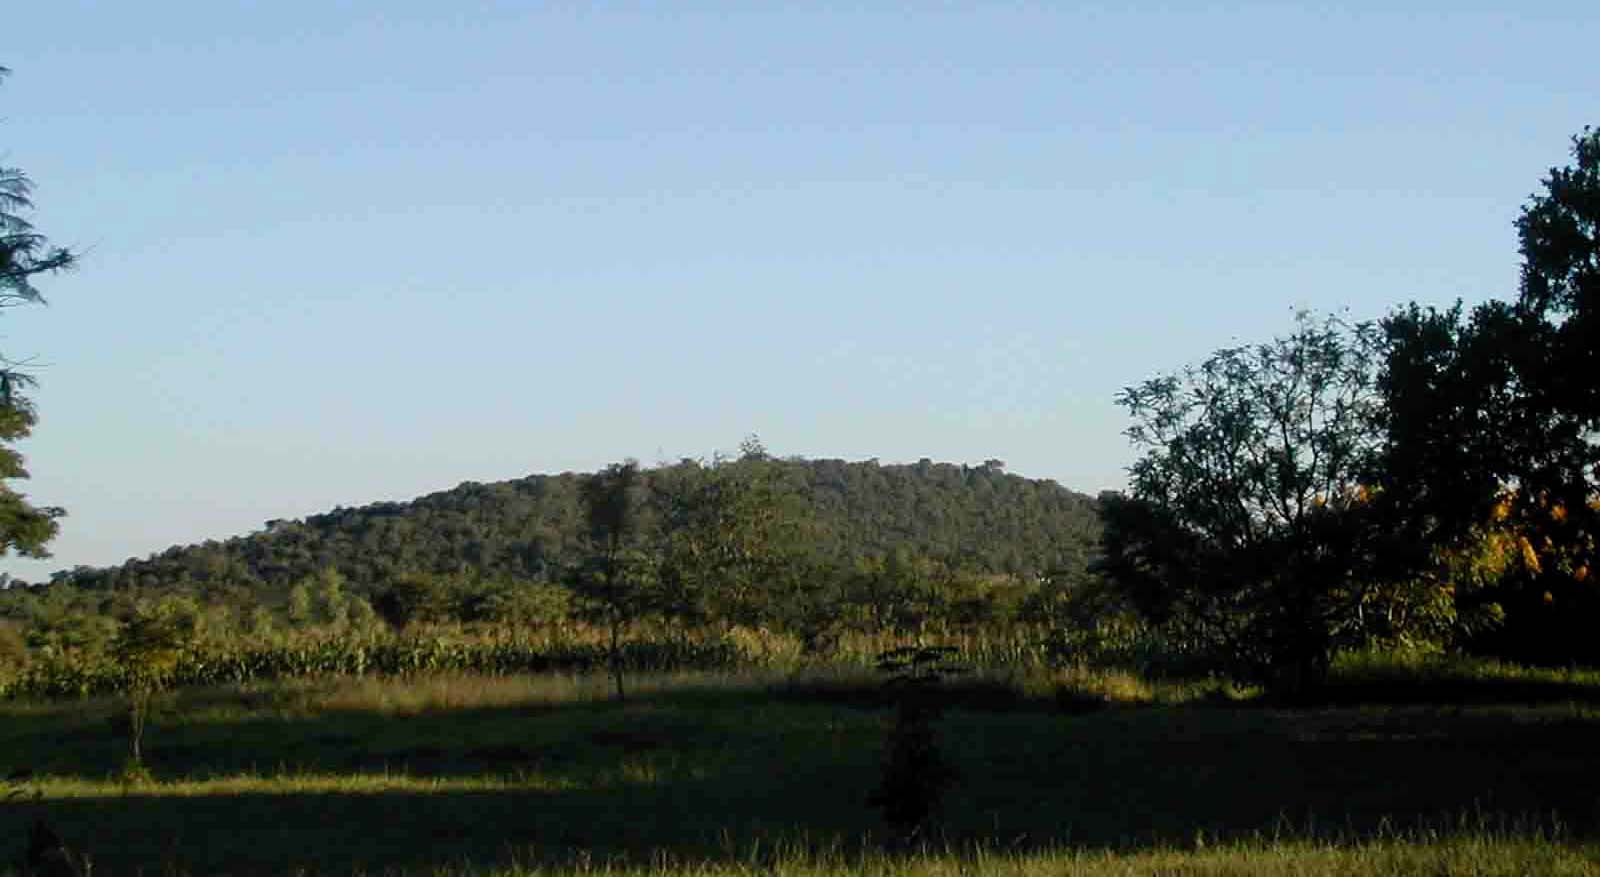
Picture 2 - Kadoma village and nearby area. ........................................................................... 16
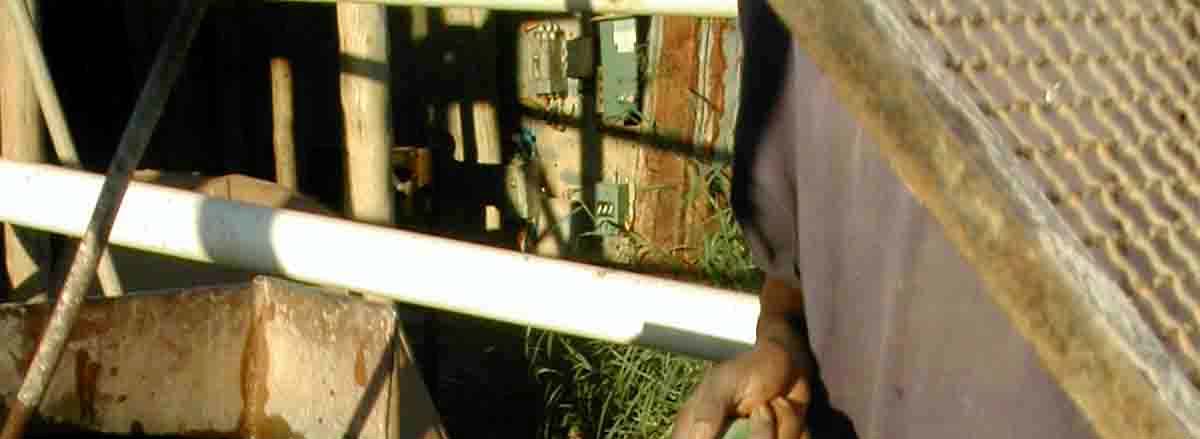
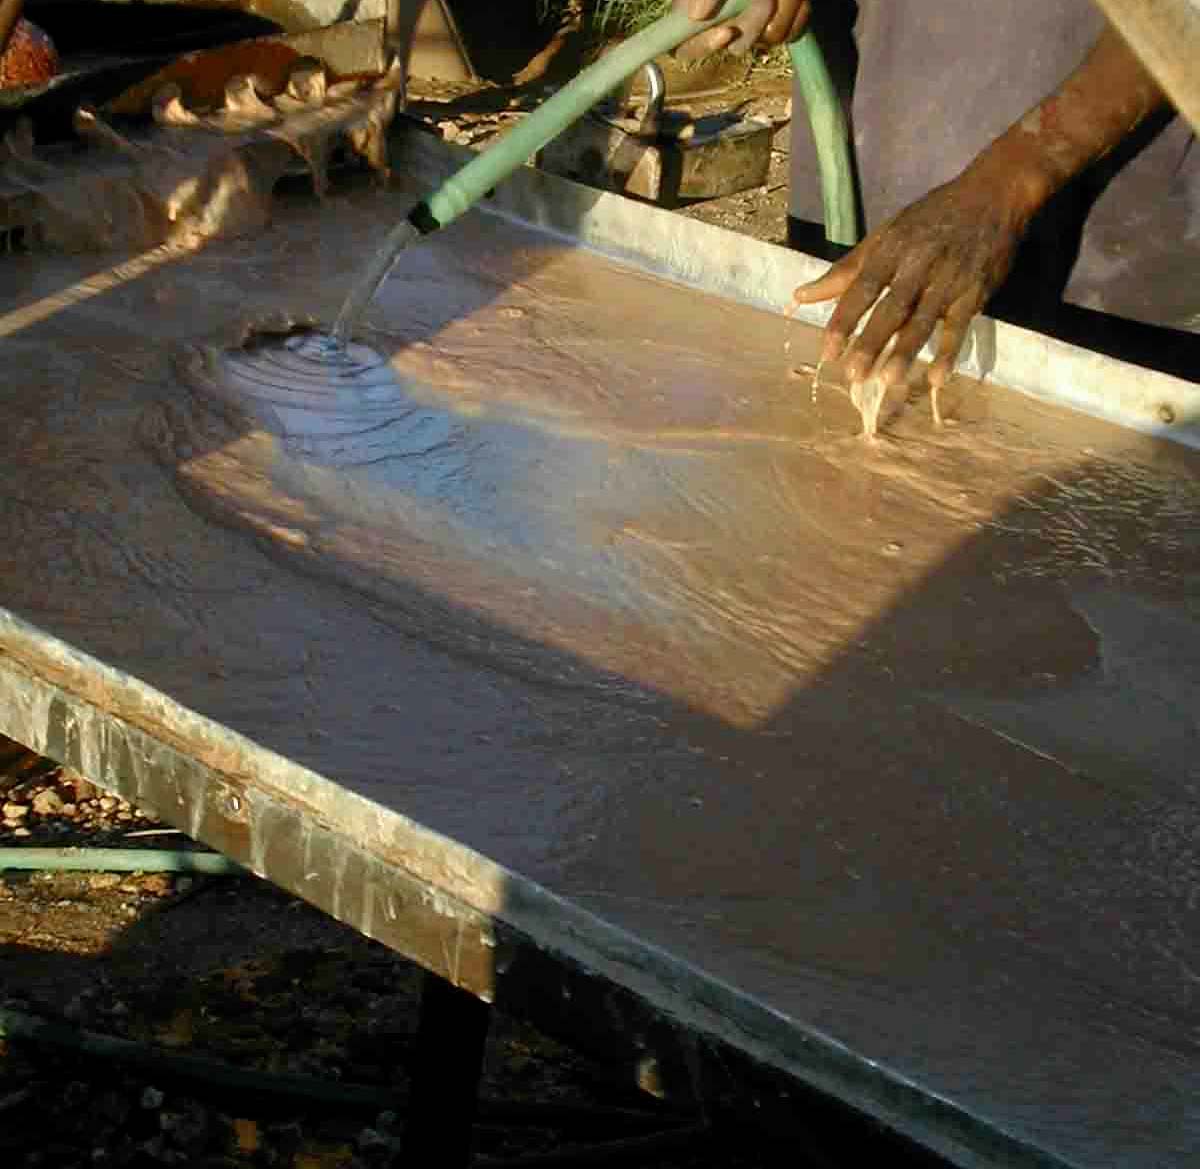
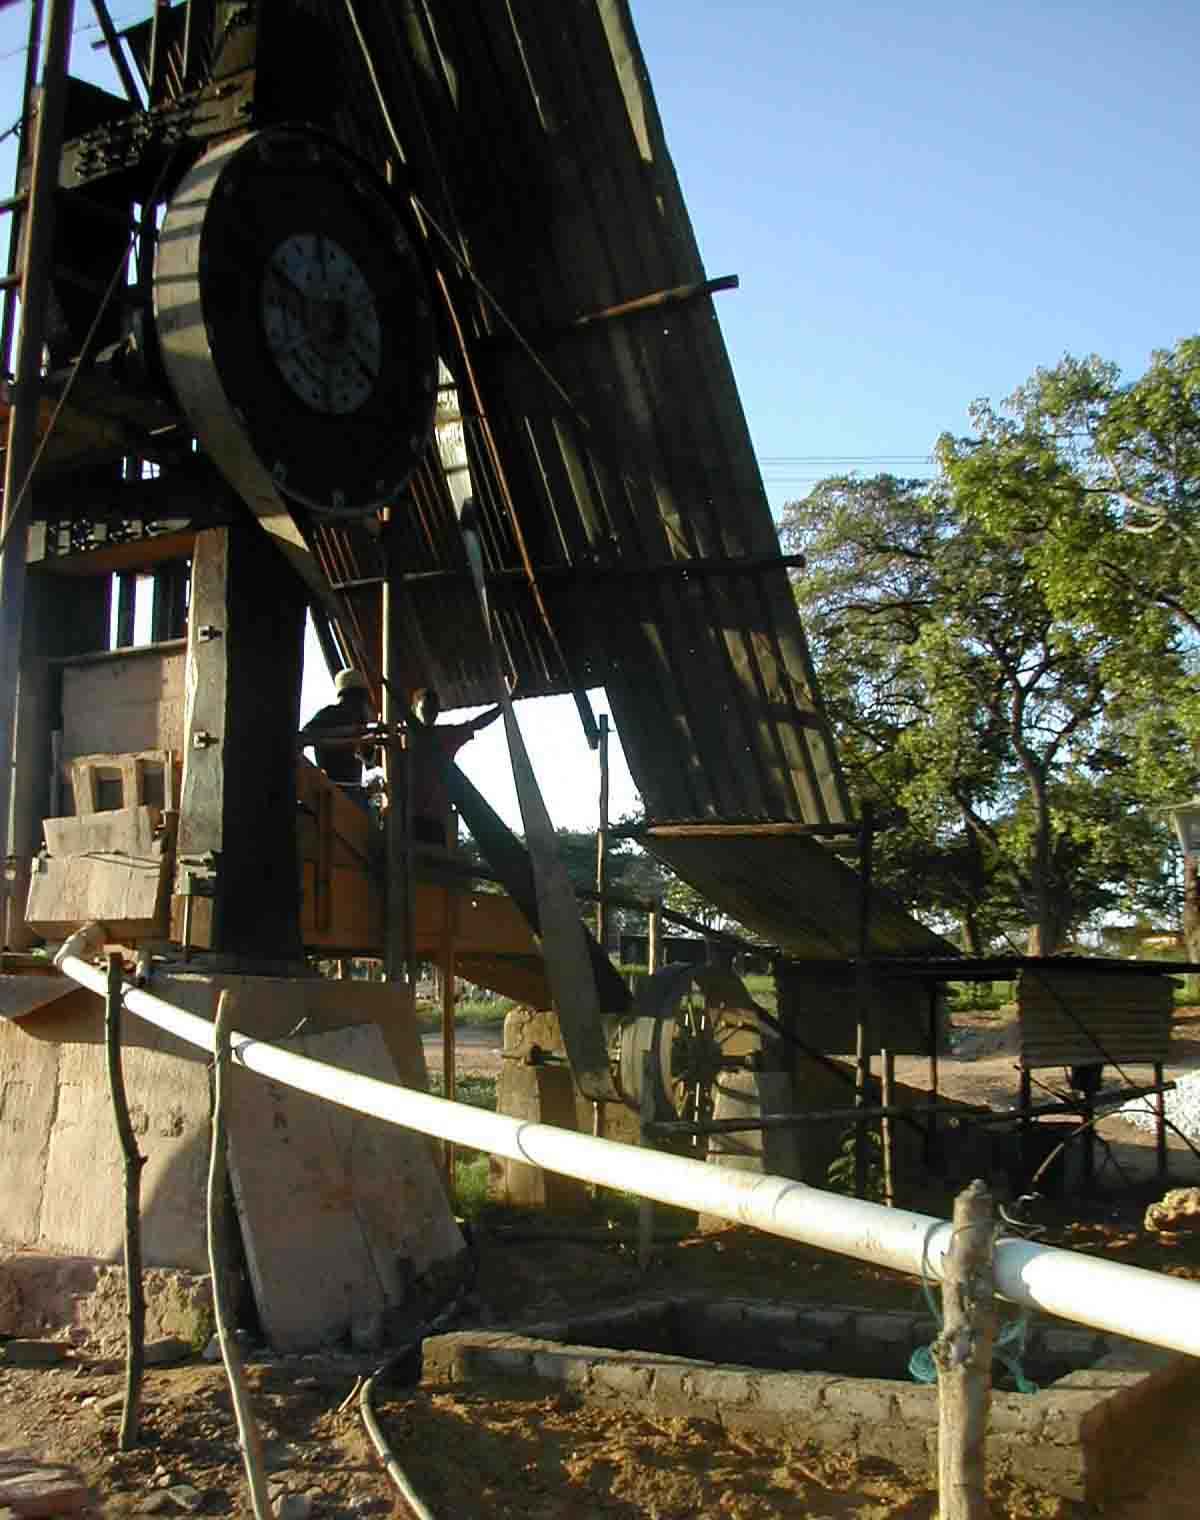
Picture 3 - Tix mine copper plate and stamp mill. .................................................................... 16
Picture 4 - Tix mine - scratching of amalgam; squeezing amalgam through a cloth;
piece of amalgam; burning amalgam...................................................................... 17
Picture 5 - Small artisanal open pit........................................................................................... 18
Picture 6 - Muzvezve river ........................................................................................................ 18
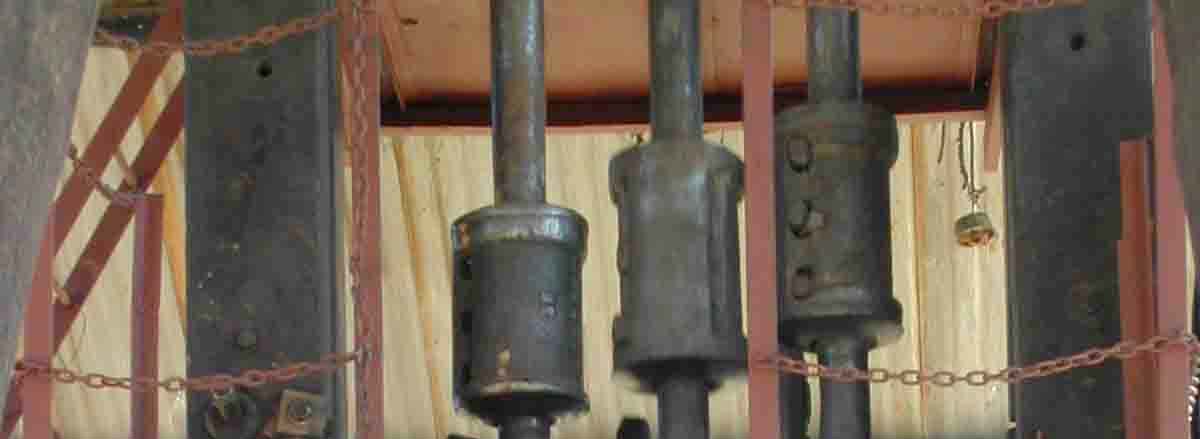
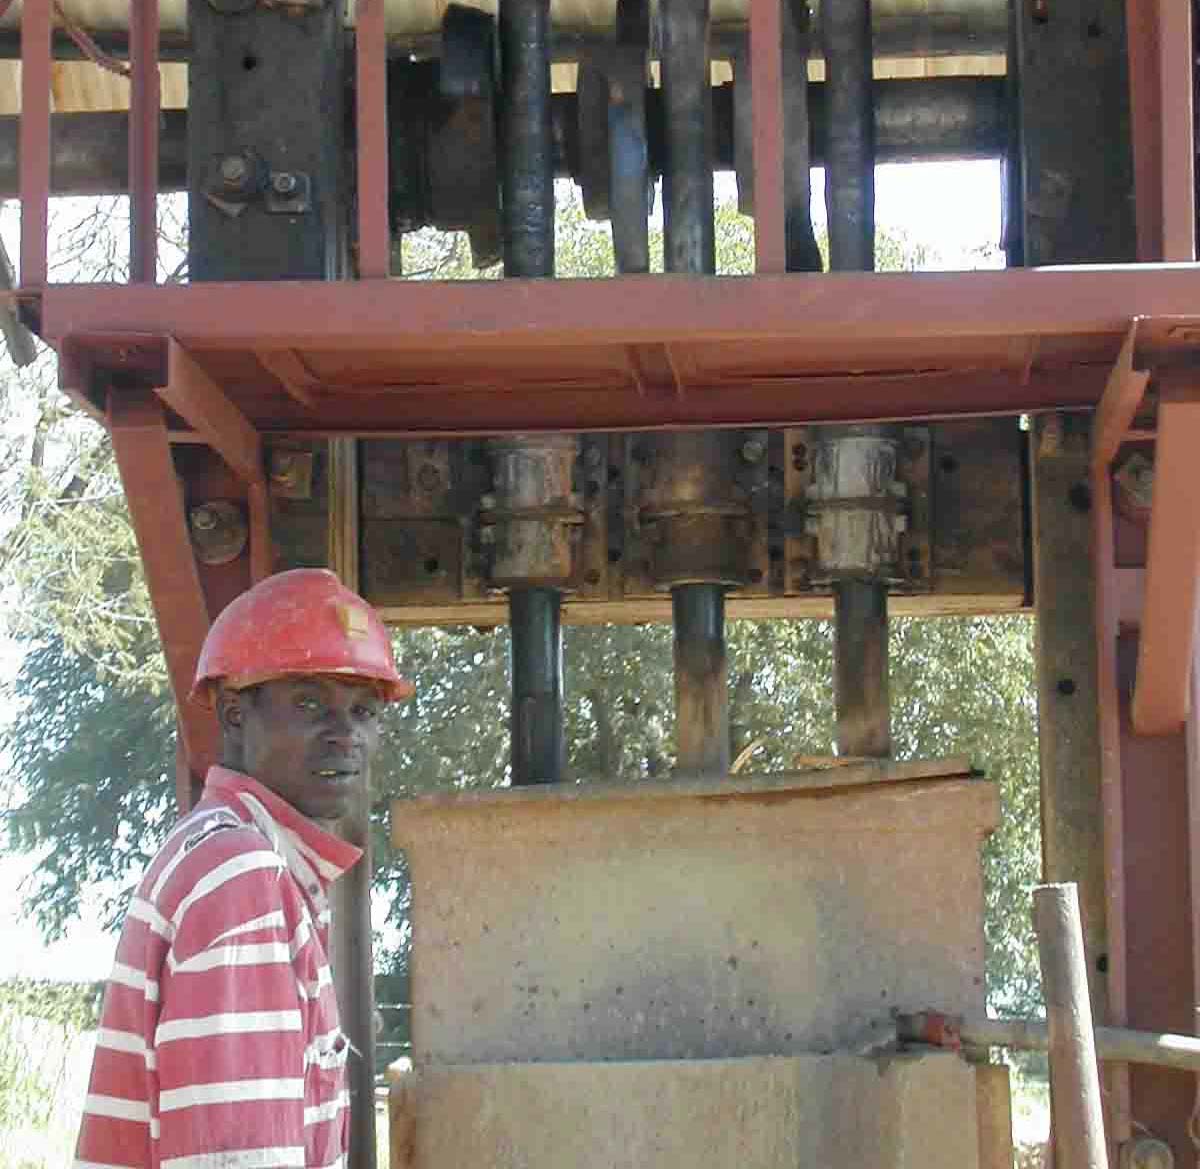
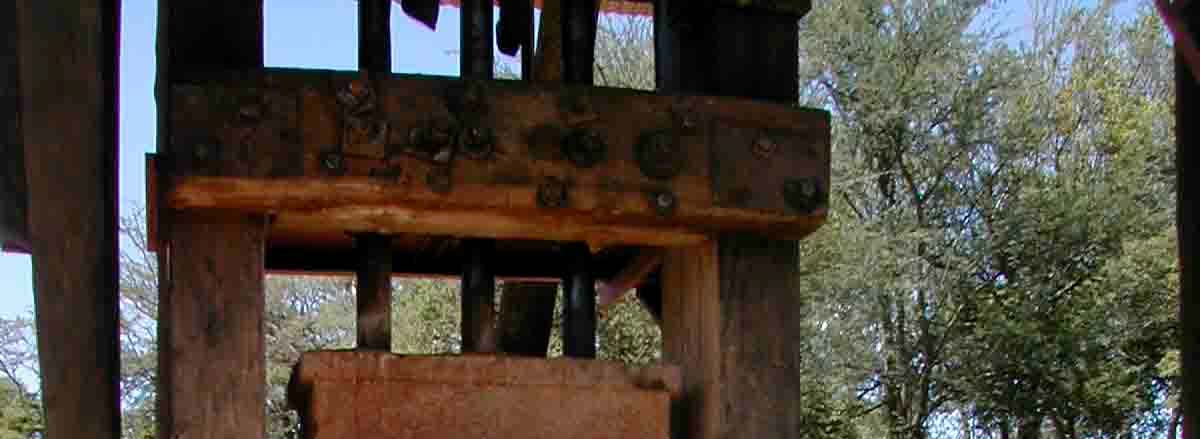
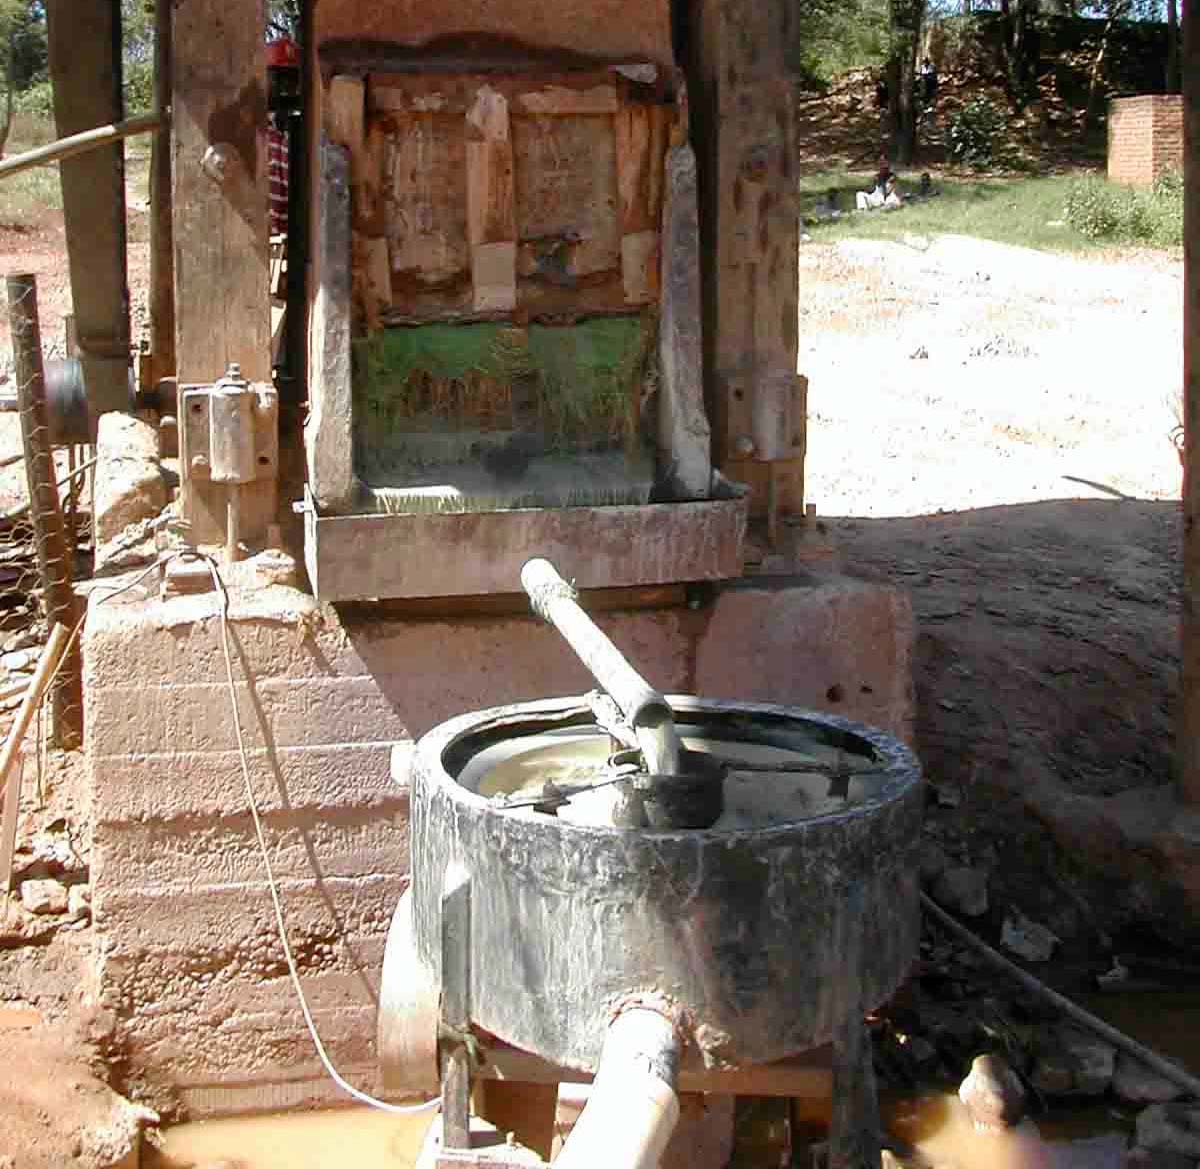
Picture 7 - Amber Rose mill: stamp mill; cyclotron ................................................................... 19
Picture 8 - Amber Rose mill - tailings; cyanidation tank; pregnant solution; filling the
tanks with tailings .................................................................................................... 20
Picture 9 - Primitive sluice box and James table at Etna village .............................................. 21
Picture 10 - Panning at Etna, piece of amalgam; one sack of stones collected
by a miner in a day.................................................................................................. 21
Picture 11 - Amber Rose village ................................................................................................. 22
Picture 12 - Mayflower school .................................................................................................... 23
Picture 13 - Kwayedza school .................................................................................................... 23
Picture 14 - Mobile field clinic at Amber Rose mill neuro-psychological testing;
history; laboratory; blood sampling ......................................................................... 24
Picture 15 - Nurses taking the history......................................................................................... 25
Picture 16 - Neurological examination (PSR reflex; finger-finger-nose test).............................. 26
Picture 17 - Visual field test ........................................................................................................ 27
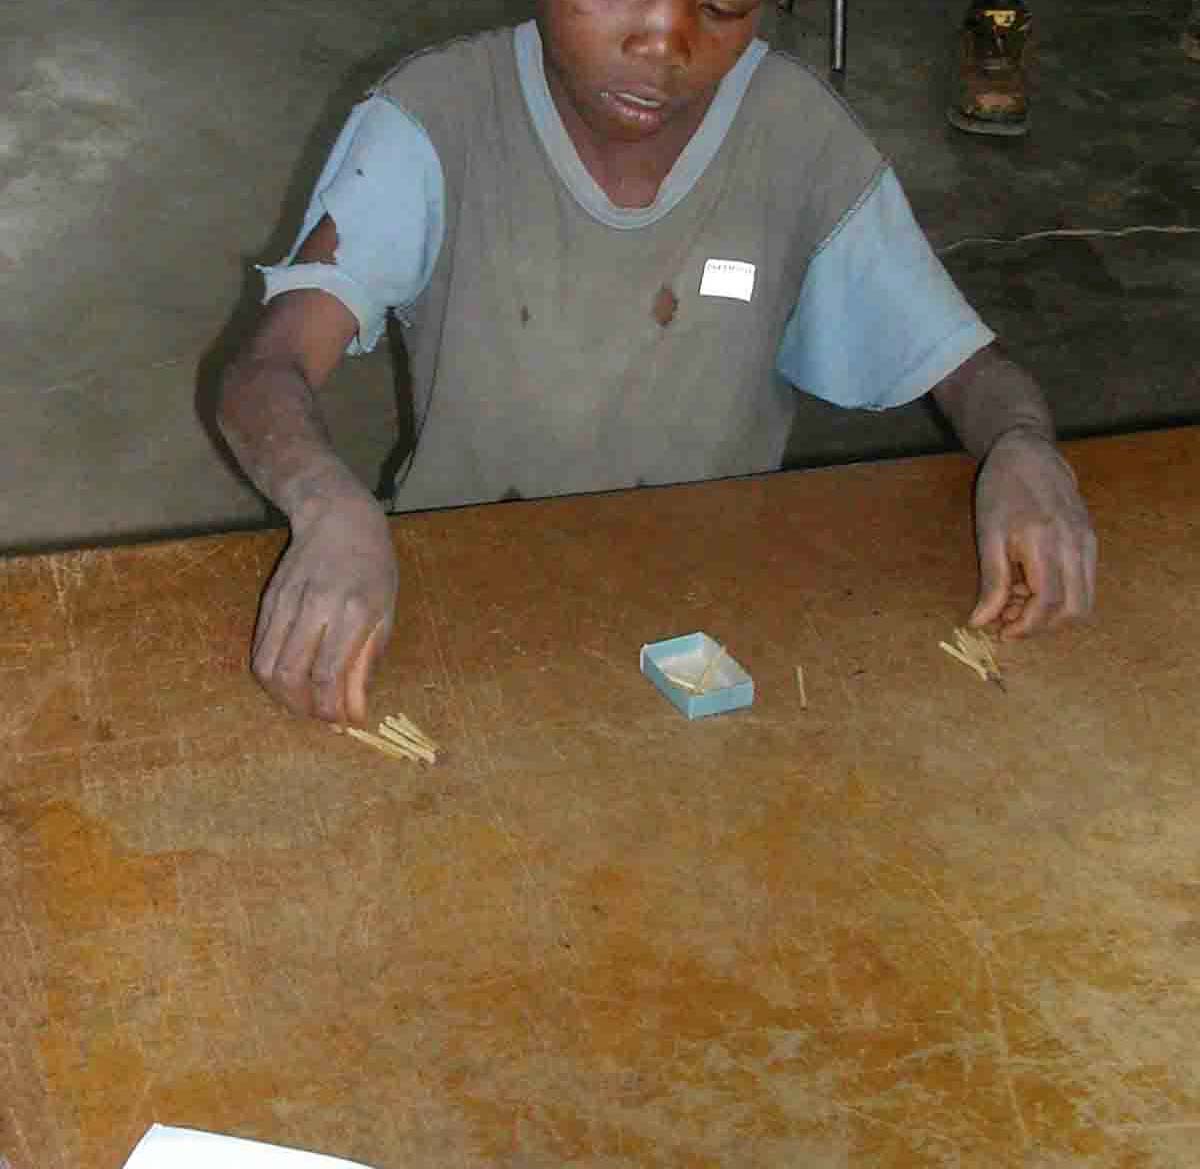
Picture 18 - Match box text, memory test, pencil tapping test, Frostig test................................ 28
Picture 19 - Tremor-meter .......................................................................................................... 29
Picture 20 - Hair and urine sampling .......................................................................................... 30
Picture 21 - Mobile Hg analyser for urine (Lumex)..................................................................... 30
Picture 22 - Children from Kadoma, all working as miners. ....................................................... 38
6
Final Report
Health Assessment Kadoma, Zimbabwe
Picture 23 - Participants with hypertrophic skin, scars due to mining accident, scar due
to a knife injury ........................................................................................................39
Picture 24 - Dental malformation ................................................................................................40
Picture 25 - Control area Chikwaka ............................................................................................40
List of tables
Table 1 -
Kadoma district demographic data (by Mr. Gift from Kadoma District
Hospital).....................................................................................................................32
Table 2 -
Main causes of out-patient morbidity (under 5 years) (data from Mr. Gift
from Kadoma District Hospital)..................................................................................33
Table 3 -
Main causes of out-patient morbidity (all ages) (date from Mr. Gift from
Kadoma District Hospital. ..........................................................................................33
Table 4 -
Main causes of in-patient morbidity (under 1 year of age) (data from Mr. Gift
from Kadoma District Hospital)..................................................................................34
Table 5 -
Main causes of in-patient morbidity (5 years and over) (data from Mr. Gift
from Kadoma District Hospital)..................................................................................34
Table 6 -
Top five causes of mortality (under 1 year) (data from Mr. Gift from Kadoma
District Hospital).........................................................................................................35
Table 7 -
Top five causes of mortality (5 years and over) (data from Mr. Gift from
Kadoma District Hospital) ..........................................................................................35
Table 8 -
HIV/ AIDS (data from Mr. Gift from Kadoma District Hospital. ..................................35
Table 9 -
Concentration of total mercury in blood, urine and hair.............................................45
Table 10 - Concentration of organic mercury in hair ..................................................................46
Table 11 - Toxicologically established threshold limits for mercury in blood, urine and
hair (HBM = Human Bio-Monitoring; BAT = "Biologischer Arbeitsstoff-
Toleranzwert" (biological work-exposure tolerance limit); BEI = Biological
Exposure Indices)......................................................................................................52
Table 12 - Anamnestic, clinical, neurological and neuro-psychological scoring scale. ..............58
Table 13 - ignificant correlations between anamnestic data and mercury concentration
in bio-monitors (group of amalgam-burners only, n = 116).+ = p < 0.05...................59
Table 14 - Significant correlations between anamnestic data and mercury
concentration in bio-monitors (group of amalgam-burners only, n = 116).+ =
p < 0.05......................................................................................................................60
Table 15 - Significant correlations between clinical data and mercury concentration in
bio-monitors (group of amalgam-burners only, n = 116) .+ = p < 0.05......................60
Table 16 - Significant correlations between neuro-psychological test classes and
mercury concentration in bio-monitors (group of amalgam-burners only, n =
116). + = p < 0.05. .....................................................................................................61
Table 17 - Significant correlations between medical scores and mercury concentration
in bio-monitors (group of amalgam-burners only, n = 116). + = p < 0.05..................61
Table 18 - Decision for the diagnosis "chronic mercury intoxication". ........................................62
Final Report
7
Health Assessment Kadoma, Zimbabwe
Table 19 - Frequency of mercury intoxication. ........................................................................... 62
Table 20 - Distribution of the formed subgroups in the different mining areas. ......................... 64
Table 21 - (Total) mercury concentration in breast-milk samples compared to other
data from the mothers. .............................................................................................. 70
Table 22 - Comparison of the preliminary classified "mercury intoxicated" in field and
by all lab results. ....................................................................................................... 72
List of appendix
Appendix 1 Tables................................................................................................................... 83
Appendix 2 Health assessment questionnaire........................................................................ 99
Appendix 3 Zimbabwe clinical main data.............................................................................. 119
8
Final Report
Health Assessment Kadoma, Zimbabwe
1. Executive summary
Kadoma is a typical small-scale mining area with approximately 235,000 inhabitants in
the Midlands in Zimbabwe. Artisanal small-scale miners use mercury to extract gold
from the ore. It is estimated that approximately a few hundred thousand people work
and live in similar small scale mining communities all over Zimbabwe.
In the selected area there is no clean and safe drinking water, no waste disposal for the
toxic mercury or any other waste or human discharge. Hygienic standards are
extremely low and are a reason for many infectious diseases such as diarrhoea,
malaria and parasitism.
Accidents in insecure tunnels and amalgamation plants, acute respiratory tract
infections, malaria, tuberculosis, and sexually transmitted diseases including AIDS are
the dominant causes of morbidity and mortality. No proper health service exists in the
mining communities. The District Hospital in Kadoma has very limited means.
The extraction of gold with liquid mercury releases serious amounts of mercury,
especially high toxic mercury fumes into the local environment. The health status of
218 volunteers in Kadoma and 55 from a control area in Chikwaka was assessed with
a standardised health assessment protocol from UNIDO (Veiga 2003) by an expert
team from the University of Munich/Germany in April 2004.
The mercury levels in the human bio-monitors were much higher in the exposed
population in Kadoma than in the control group. The exposed population was divided
into sub-groups to compare the levels of exposure. As to be expected the control group
was within a normal range and the amalgam-burners had the highest exposure levels
in all human bio-monitors, while the less exposed population in the mining areas
ranged in between. Child mercury exposure due to living in the mining areas and
working with mercury show similar levels in the bio-monitors as adult amalgam-
burners, children not working but living in the area also have increased levels, mainly
compared to children from the control area. The results of the human bio-monitoring
show clearly the severe exposure of the total population in the mining areas with
mercury; the extreme exposure mainly of amalgam-burners and the especially severe
exposure of children working with mercury. The mercury exposure in the mining areas
is mainly due to exposure with elemental mercury and not due to exposure with methyl-
mercury. The relation of inorganic versus organic mercury in the control population
shows the usual exposure of any population, where most of the mercury exposure
comes from the consumption of methyl-mercury contaminated fish. Whereas in the
mining areas the high amounts of inorganic mercury in hair indicate that the main
exposure in the mining areas more then likely comes from elemental mercury, than
from methyl-mercury exposure through contaminated food. Exposure with elemental
mercury could come from handling mercury with bare hands, but the immanent
exposure with mercury vapour might be the more important pathway, since amalgam-
burners show the highest human bio-monitor levels.
Final Report
9
Health Assessment Kadoma, Zimbabwe
Typical symptoms of mercury intoxication were prevalent in the exposed group. The
medical score sum plus the bio-monitoring results made it possible to diagnose in 70%
of the amalgam-burners, 63% of otherwise occupational burdened population and 23%
of former occupational burdened population a chronic mercury intoxication. 5% of the
not occupationally burdened population showed chronic mercury intoxication and
nobody in the control area was intoxicated. These results confirm severe exposure due
to working with mercury, either by panning with mercury or smelting amalgam.
Child labour in the mining sites is very common from the age of 10 on, the children
work and play with their bare hands with toxic mercury. Of special notice is, that 0% of
the children from the control area, 33% of children living in the area, but not working
with mercury and 69% of the children working with mercury have a chronic intoxication
with mercury.
Mercury can cause severe damage to the developing brain. From 9 breast milk
samples taken, 4 showed increased levels of mercury. The different mining areas in
Kadoma district use slightly different extraction technologies. A comparison of the
various mining areas is difficult due to the relatively small number of participants in
each area, and non-comparable subgroups (number of men, amalgam burners etc).
But it seems that in the Glasgow mill the exposure to mercury may be even bigger than
in the Amber Rose mill, and possibly bigger than in the Tix mill.
Poverty is the main reason for the disastrous health status in the small-scale mining
communities. Struggling for pure survival makes mining for gold a necessity to find any
financial resource. The daily fight for survival requires the miners to put their own
health and the health of their children at risk.
A reduction of the release of mercury vapours from small-scale gold mining into the
atmosphere will not only reduce the number of mercury intoxicated people in the and
milling areas proper, it will reduce the global pollution of the atmosphere with mercury.
Most of the mercury vapours formed by open burning of gold amalgam deposits not
locally but is transported by air on long-range distances all over the globe (Lamborg,
2002). The total release of mercury vapour from gold mining is estimated today up to
1,000 metric tons per year (MMSD 2002), while from all other anthropogenic sources
approximately 1.900 tons were released into the atmosphere (Pirrone, 2001).
These results correspond to former examinations in Zimbabwe, for example the study
from Matchaba-Hove et al. (2001). They found, that "mercury poisoning among gold
panners in Chiweshe and Tafuna communal lands is of public health importance.
Panners should be educated on the possibilities of mercury being a poison. A low cost
and safe technology to separate mercury from the amalgam should be introduced to
the panners".
The result is that mercury is a serious health hazard in the small-scale gold mining area
of Kadoma. The exposure of the whole community to mercury is reflected in raised
mercury levels in the urine, blood and hair. Symptoms of severe damage of the brain
(cerebellum) such as ataxia, tremor and movement disorders were found in the mining
communities. In 70% of the amalgam-burners in Kadoma mercury intoxication was
10
Final Report
Health Assessment Kadoma, Zimbabwe
diagnosed. The background burden in the control group is in the same order of
magnitude as in western industrial countries.
Poverty is the main reason for all health and environmental problems:
- At the moment it does not seem to be acceptable that children live in Kadoma small
scale mining and milling areas. Child labour with hazardous chemicals needs to be
especially addressed. Missing sanitary standards and high exposure to mercury are
the main problems. Sanitary standards need urgent improvement.
- The
occupational related health risk of mining should be assessed in more detail
(accidents, drinking water quality, HIV / AIDS, other sexually transmitted diseases,
malaria, tuberculosis). One first step to reduce the health hazards in Kadoma district
might be a proper zoning into industrial areas, commercial areas and housing areas.
Mainly the smelting of amalgam needs to be performed outside the housing areas,
and "away from the nose" people in charge of amalgam roasting. Imposing basic
hygienic standards, such as proper drinking water and reduction of Anopheles
mosquitoes is essential.
- To reduce the obvious risk of accidents in mining sites, raising awareness is
necessary. Introducing proper mining techniques is necessary (e.g. tunnel safety).
- The risk of sexually transmitted diseases could be reduced, if campaigns for safer
sex were more effective.
- To improve the health status of the communities a better financed health service is
urgently required.
Referring to the clinical testing and laboratory results, mercury is a major health hazard
in the area. Some first suggestions are:
- Child labour with highly toxic substances must be stopped immediately. Legal
restrictions on child labour need to be immediately implemented.
- Women in childbearing age need special information campaigns on this risk of
mercury to the foetus and the nursed baby.
- The participants with intoxication need medical treatment. It is necessary to build up
a system to diagnose and treat mercury related health problems in the area.
Capacity building including establishing laboratory facilities in the Kadoma district is
required to analyse mercury in human specimens. The financial aspect of treatment
and the legal problem of importing drugs (chelating agents like DMPS or DMSA, to
sweep mercury out of the body) need to be solved. Funding of preventive
campaigns and for treatment facilities is needed now.
- Training programs for the health care providers in the Kadoma district and other
health centres in mining areas to raise awareness of mercury as a health hazard.
- Continuous clinical training of local health workers, including a standardised
questionnaire and examination flow scheme (MES = mercury examination score).
- Mercury ambulance: A mobile ,,mercury ambulance" might easier reach small-scale
miners, than any local health office. A bus could be used as a mobile mercury
ambulance. Equipped with the necessary medical and laboratory utensils, the bus
Final Report
11
Health Assessment Kadoma, Zimbabwe
could be driven into the mining areas. Two or three specially trained doctors or
nurses could perform the examinations, and begin to carry out treatment. The bus
could also be used for health awareness programs (e.g. video equipment). Miners in
remote areas might welcome any evening entertainment. Soccer videos might
attract more miners to the bus, than much other information material. Why not ask
e.g. sponsors for such a bus (or truck).
The knowledge on mercury as a health hazard needs to be improved:
- Assessing in a different study design the possibility of mercury related birth and
growth defects, increased abortion/miscarriage rates, infertility problems, learning
difficulties in childhood or other neuro-psychological problems related to mercury
exposure.
- Assessing in a more detailed study the possible transfer of mercury from mother to
child via breast-milk and the related possible adverse health effects. Females at
childbearing age and before urgently need more awareness to refrain from amalgam
burning, at least during pregnancy and nursing.
The release of mercury into the environment needs to be reduced:
- The exposure to mercury for the miners and the community has to be drastically
decreased. Proper mining techniques to reduce the burden of accidents and
mercury exposure are essentially needed. Small-scale miners need all possible
support to introduce cleaner and safer gold mining and extraction technologies.
- The exposure with mercury is avoidable with such simple technology as retorts.
Technical solutions need to go hand in hand with awareness raising campaigns.
- To improve the social, health and environmental situation of artisanal small-scale
gold miners an alliance of local, regional, governmental and intergovernmental
bodies is needed. Cooperation between health, mining and environmental sectors is
needed on local, regional, national and intergovernmental level. E.g. UNIDO and
WHO in Harare could form a nucleus of a national mercury task force.
12
Final Report
Health Assessment Kadoma, Zimbabwe
2. Study setting and clinical examinations
(Stephan Boese-O´Reilly, Beate Lettmeier, Felicitas Dahlmann)
2.1. INTRODUCTION
The Health Assessment project is part of a major UNIDO project to remove "Barriers to
the Introduction of Cleaner Artisanal Gold Mining and Extraction Technologies", which
is performed in six countries. The main funding comes from GEF (Global Environment
Program) through UNDP (United Nations Development Program) to UNIDO (United
Nations Industrial Development Organization). The University of Munich is
subcontractor to BRGM for the health assessment in Zimbabwe.
Figure 1 - UNIDO project countries.
The aim of the subcontract was to undertake a medical investigation of approximately
250 people living in the Kadoma area, in the Midlands of Zimbabwe. The ultimate aim
of the whole UNIDO project is to replace mercury amalgamation in the project
demonstration sites with new technology, while improving the income of the miners
through more efficient recovery, increasing knowledge and awareness, and providing
policy advice on the regulation of artisanal gold mining with due consideration for
gender issues.
Final Report
13


Health Assessment Kadoma, Zimbabwe
2.2. MERCURY
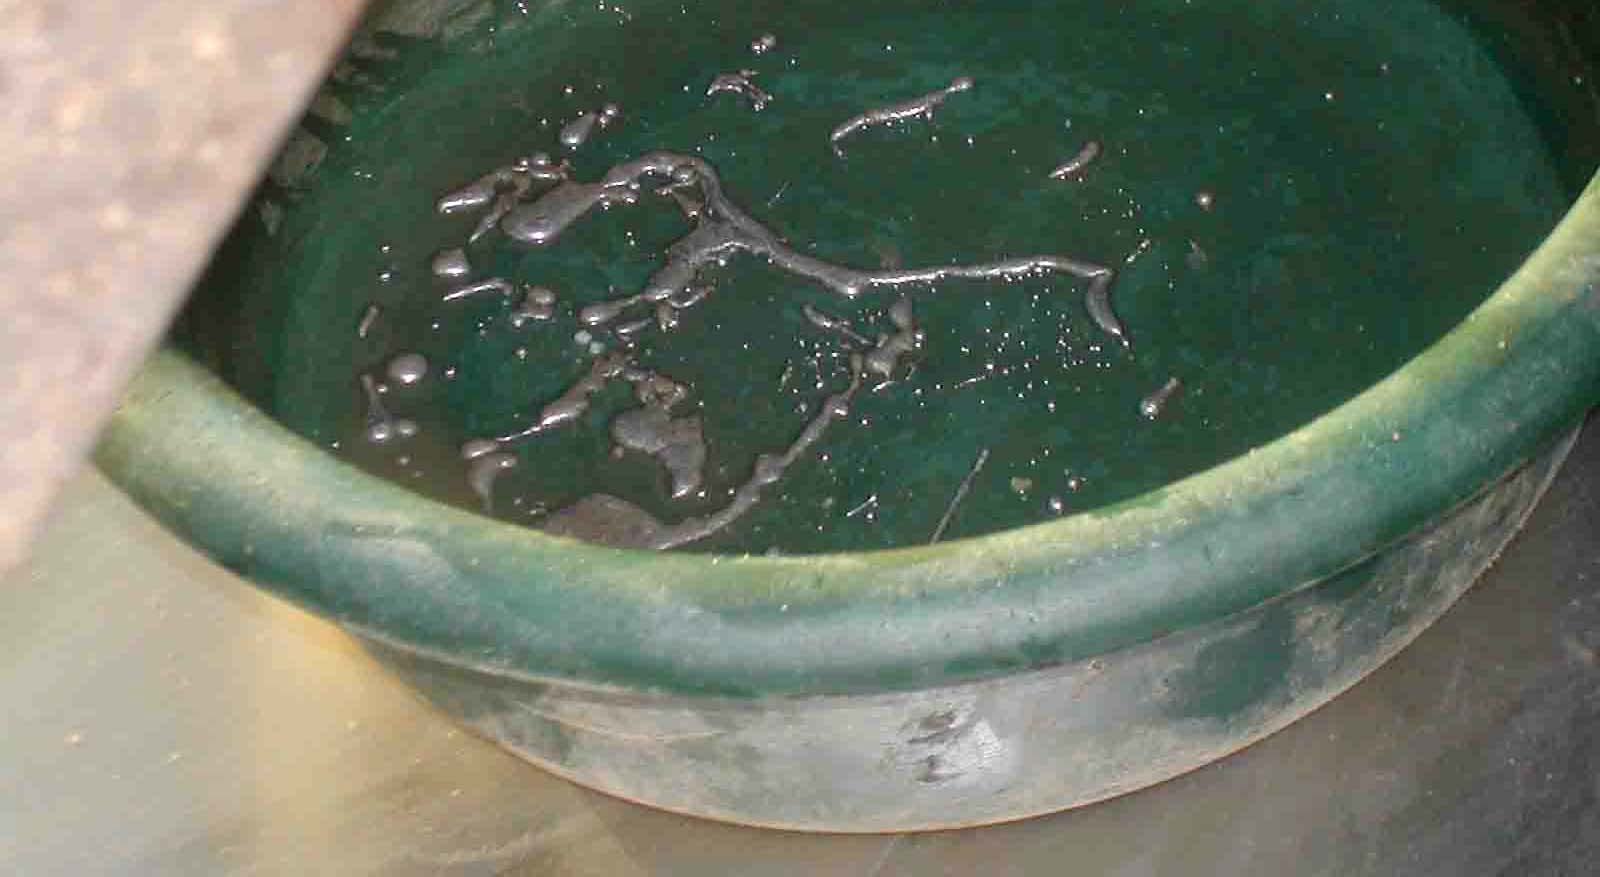
Mercury is a silvery-white shiny heavy metal, liquid at room temperature. Mercury
exists in different forms:
- Metallic (elemental) mercury (Hg0)
Liquid in room temperature (non toxic), as mercury vapor highly toxic.
- Inorganic mercury (salt of Hg2+), Soluble compounds are toxic
- Organic mercury compounds, especially methyl mercury in fish, highly toxic
Picture 1 - Liquid mercury used in Tix mine.
The lungs absorb 80% of mercury vapor. Target organs are the brain (cerebellum) and
the kidney. Mercury is a neurotoxin, nephrotoxin and teratogen. Mercury can cause
acute and chronic intoxication.
2.3. ZIMBABWE - KADOMA SMALL SCALE MINING AREA
Figure 2 - Map of Zimbabwe Victoria Falls.
14
Final Report
Health Assessment Kadoma, Zimbabwe
Zimbabwe is in South-East Africa. The Kadoma district is situated in the Midlands.
Farming is the main activity of the rural population.
1829B2
Chakari
Coetzee
North zone
Glasgow
Summit
1829B4
Kadoma
To Harare
Even Milling center
River/Lake
South Zone
Road, Wide tarred
Road, Narrow tarred
Tix
Alexander
Claw Dam
Milling center
Panners
Amber Rose
City
Figure 3 - Local map of Kadoma area (provided by BRGM).
Kadoma is approx. 150 km east from Harare on a good road. The area is slightly hilly,
and covered by grassland and woodland. The Kadoma mining area spreads on both
sides of the town. The surface is open at many spots, either for tunnels or for
amalgamation areas. Mining operations have been carried out in this area since the
1940`s. After 1980 small-scale mining activities began. Since around the year 2000 the
activities have increased. The infrastructure in Kadoma is good, in the surrounding
mining villages poor. Roads are in an acceptable condition.
Final Report
15


Health Assessment Kadoma, Zimbabwe
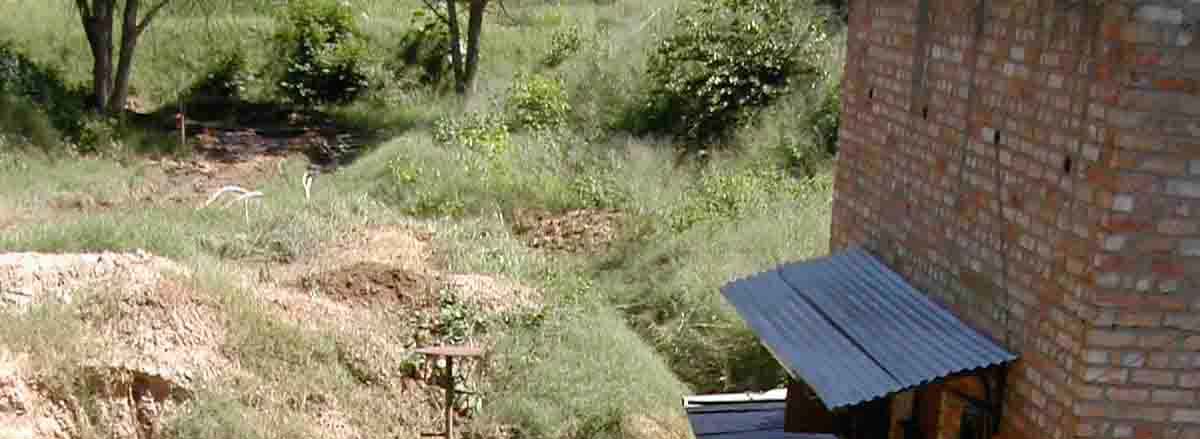
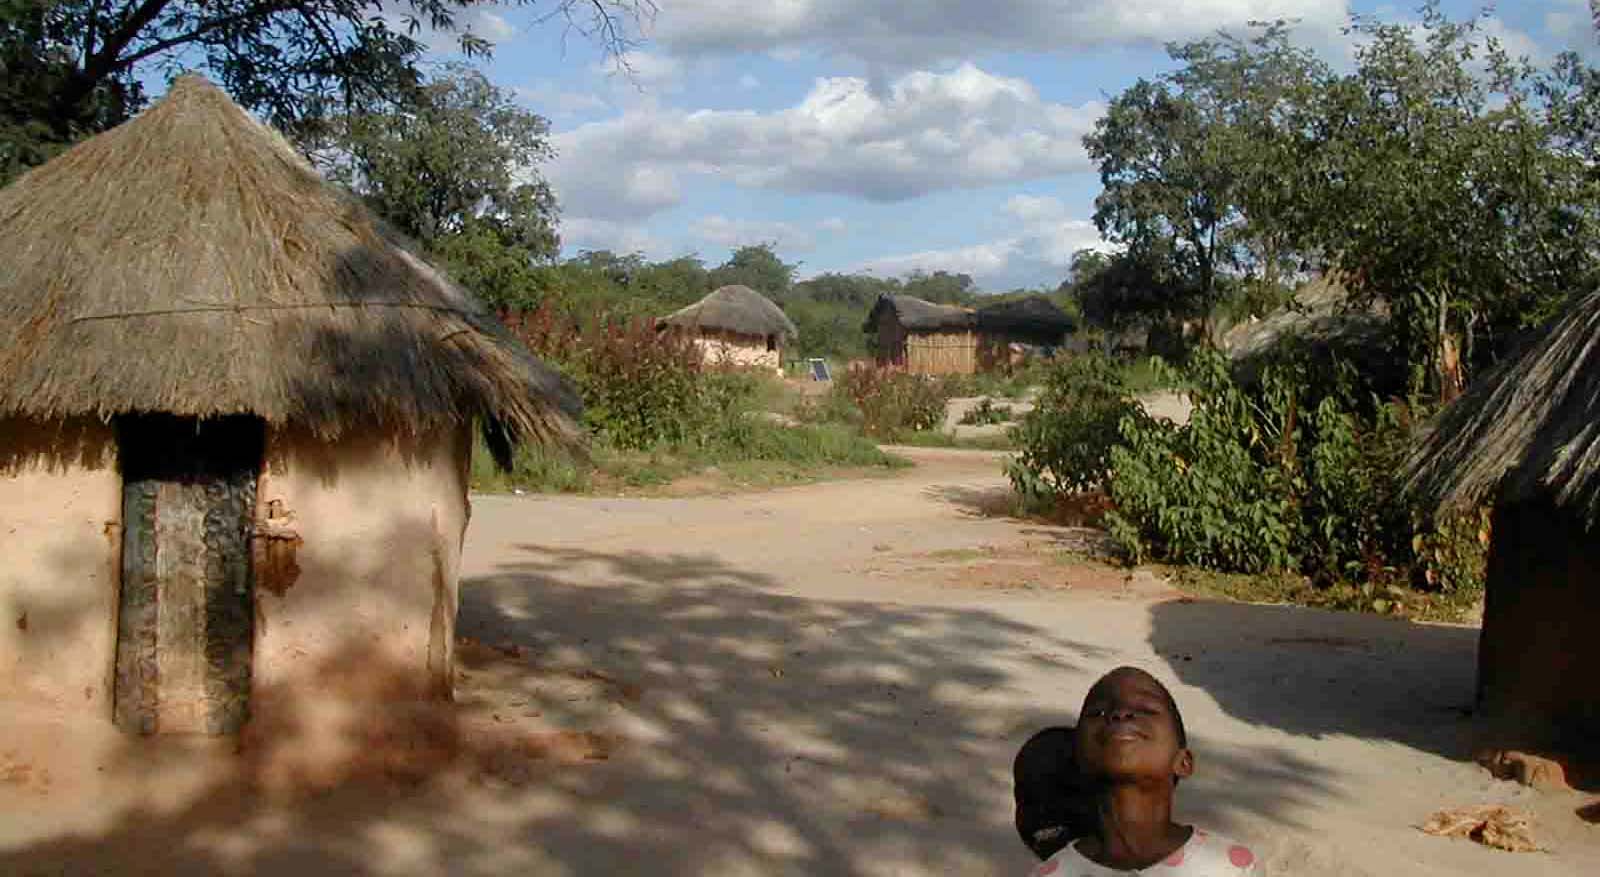
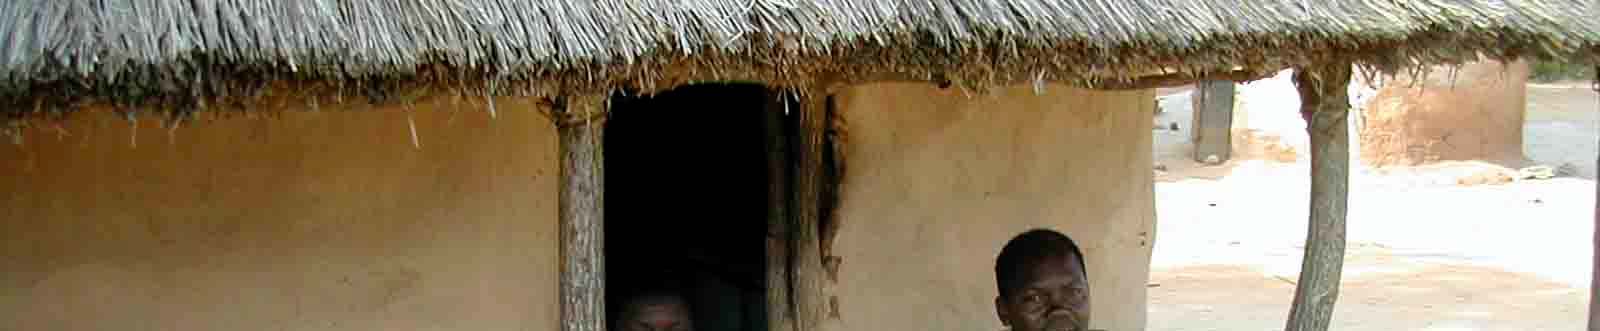
Picture 2 - Kadoma village and nearby area.
Picture 3 - Tix mine copper plate and stamp mill.
Some miners work in small-scale mining companies, which are licensed. Equipped with
generators and other technical equipment miners work in tunnels to extract the ore.
The tunnels have a small diameter. The miners try to follow veins, so tunnels are
curved, and tend to be very steep. Miners work in shifts.
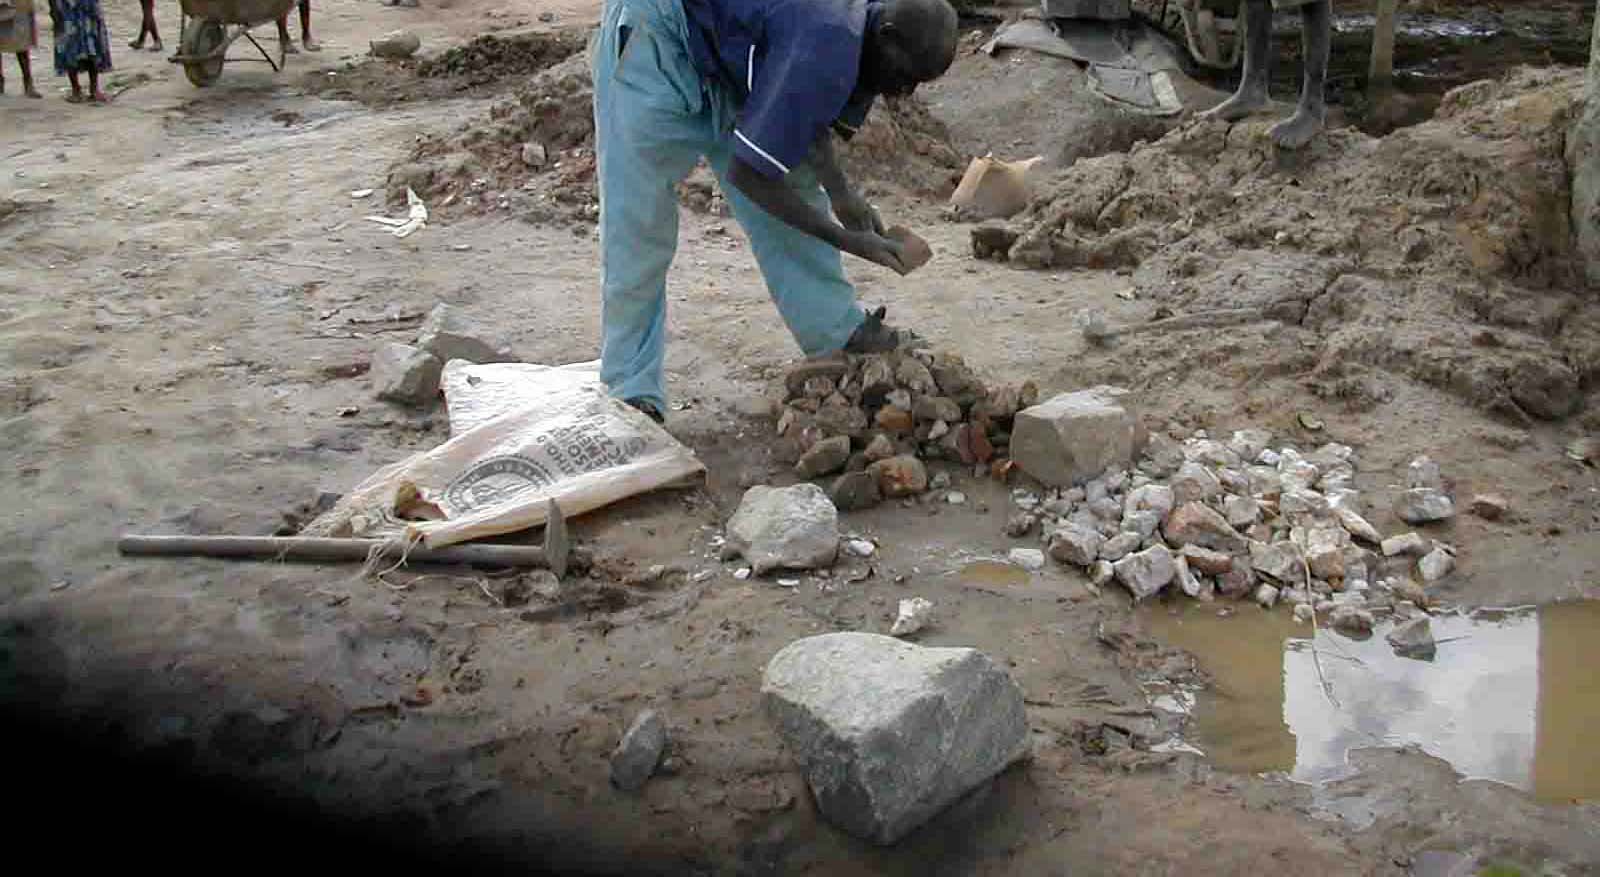
Tix mine is close to the big Muzvezve River and approx. 6 km southeast of Kadoma
town. Tix mine was first opened in 1974. When the ore is removed from the tunnels it is
crushed by workers with hammers, and powdered in stamp mills. The ore is then
16
Final Report
Health Assessment Kadoma, Zimbabwe
dispersed with water. Using copper plates, the miners try to concentrate the gold
containing materials. These copper plates are "loaded" with mercury, then the
dispersed fine ore is washed out over the copper plates, during which the gold binds to
the mercury.
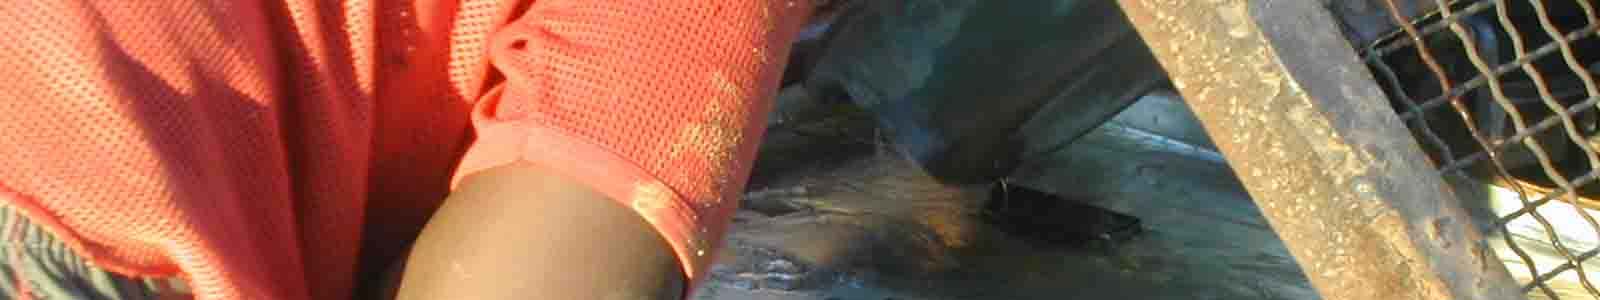
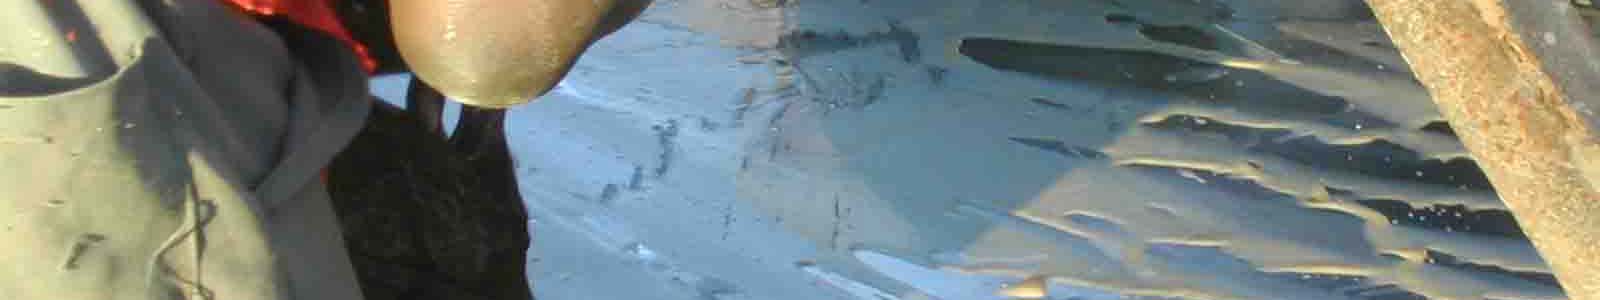
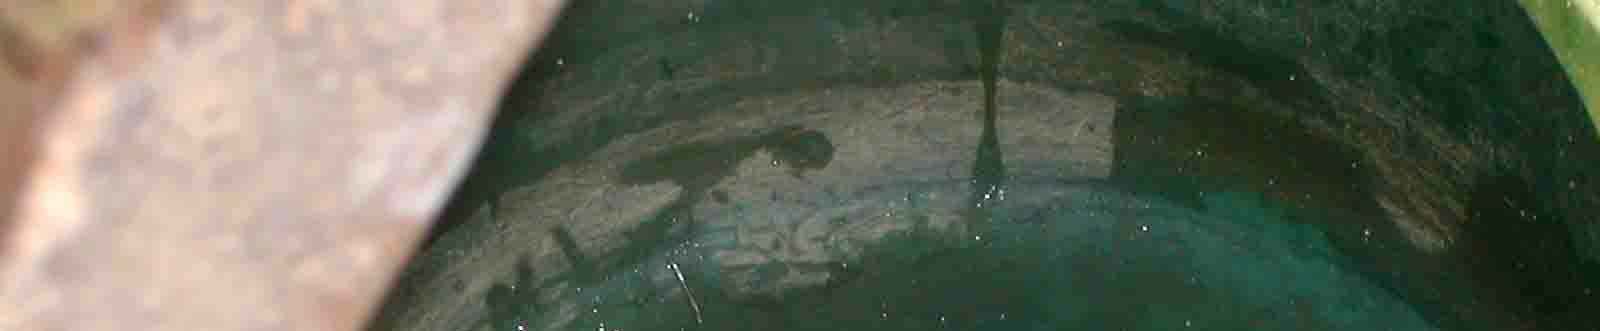
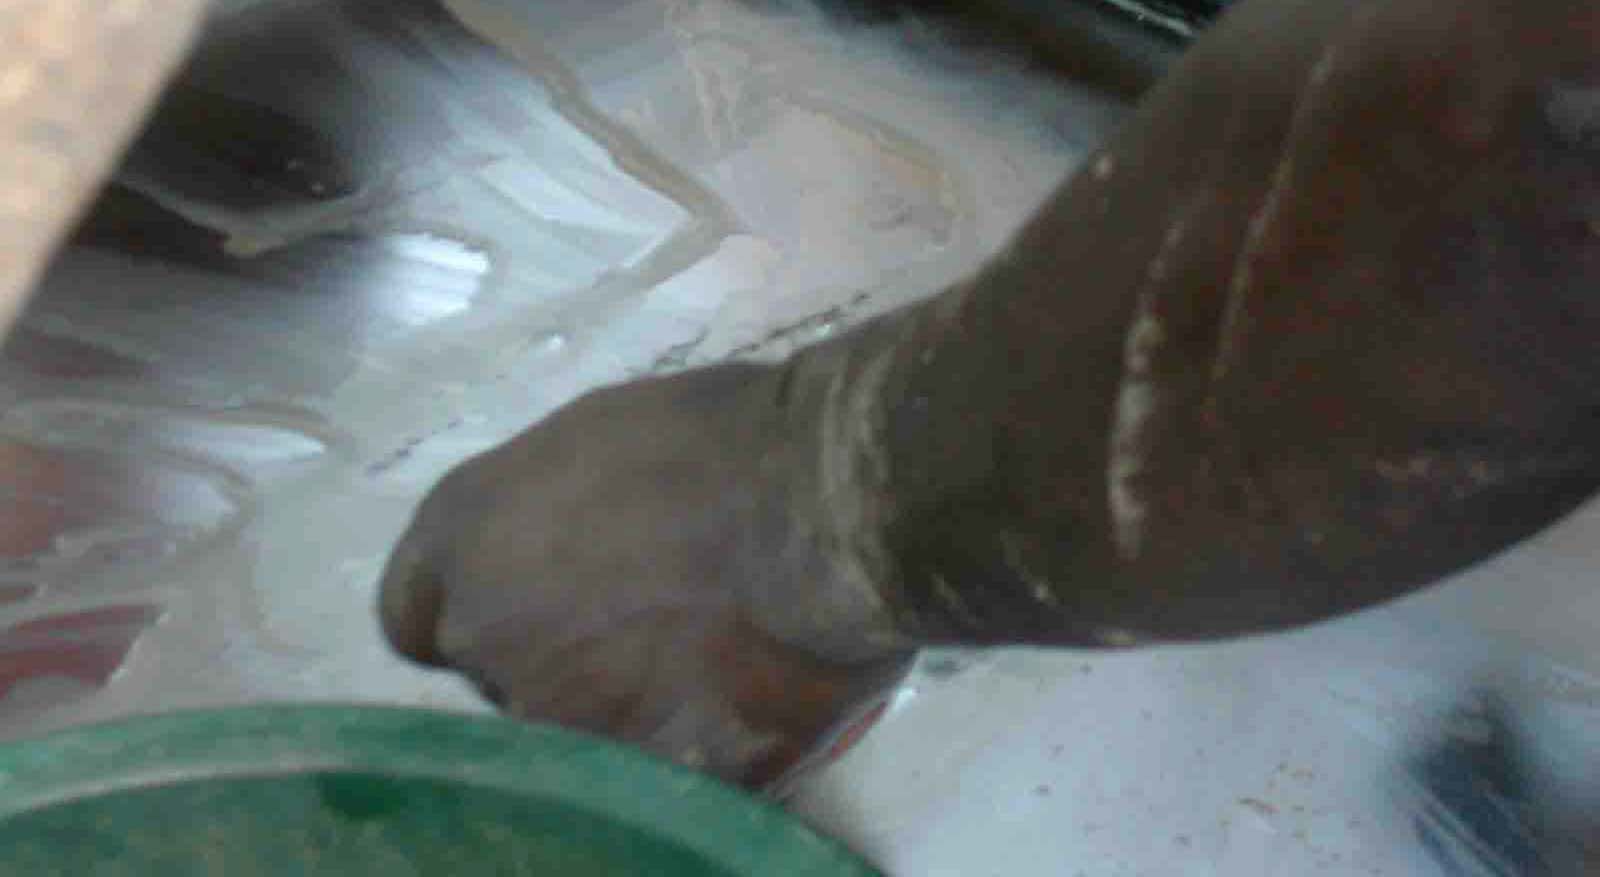
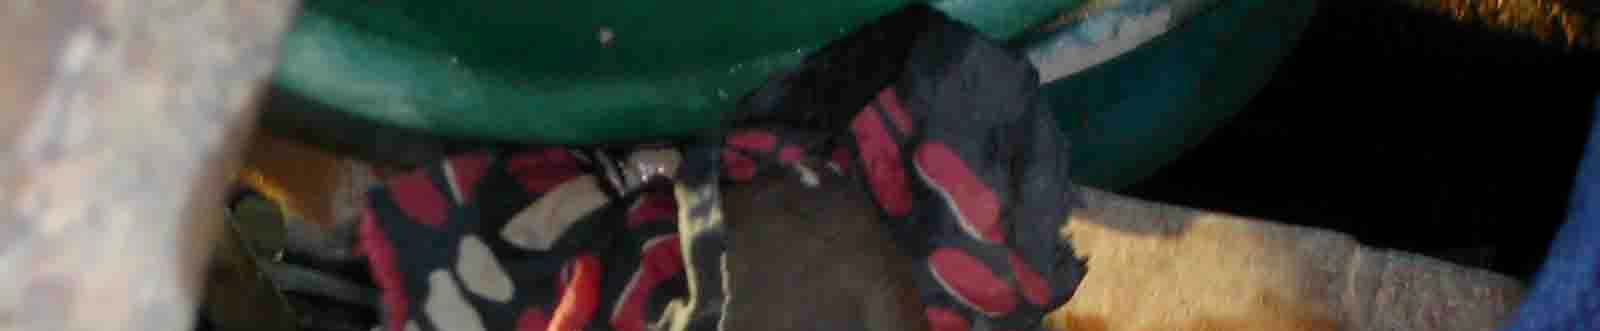
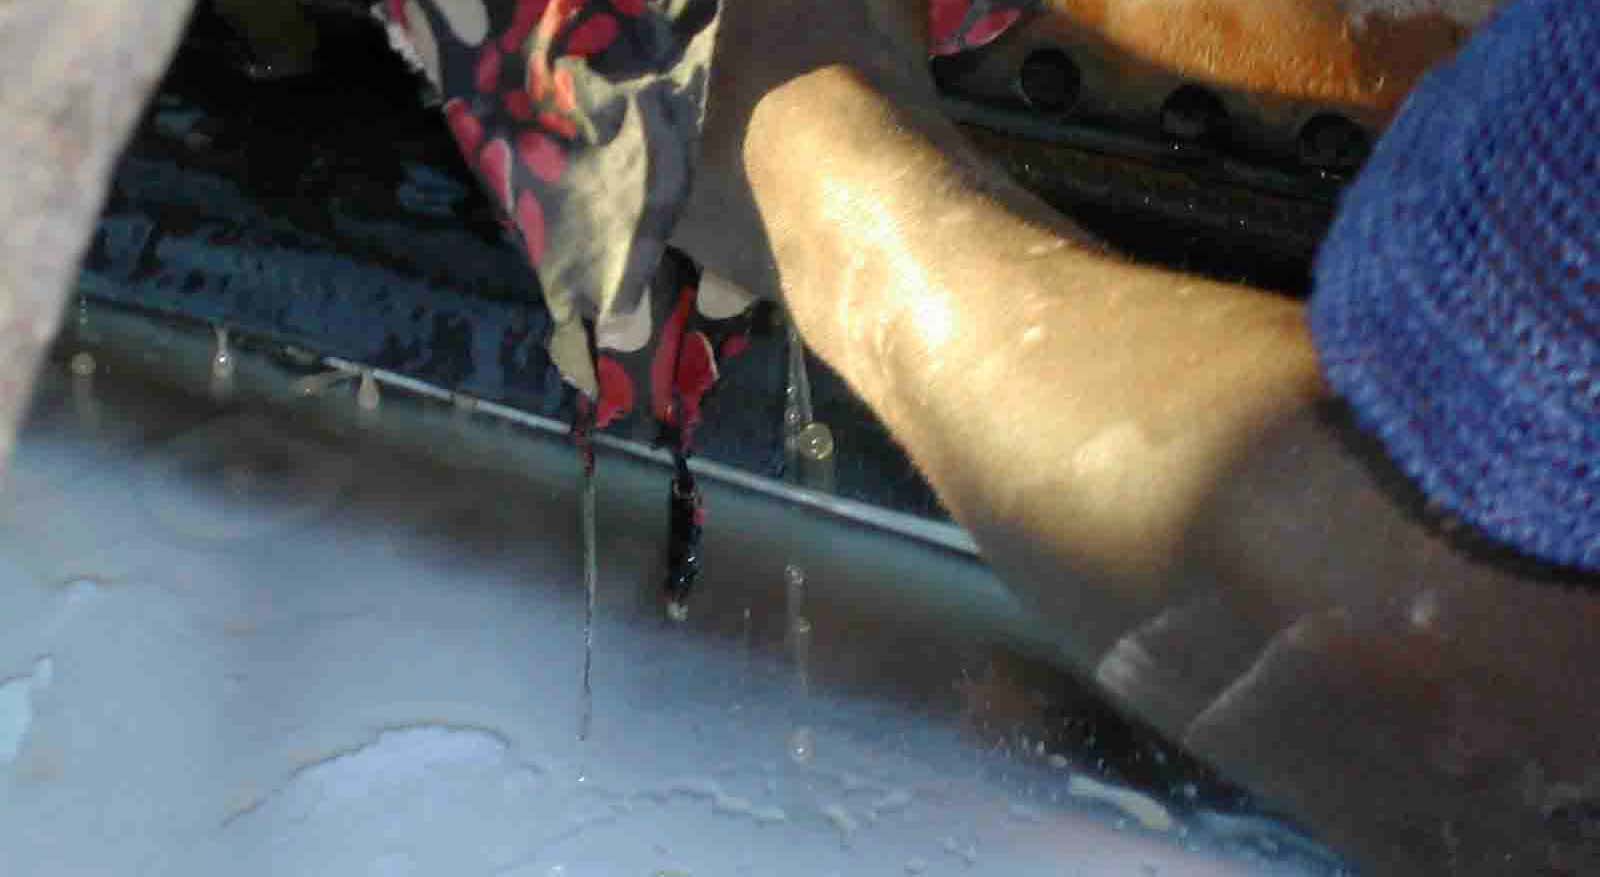
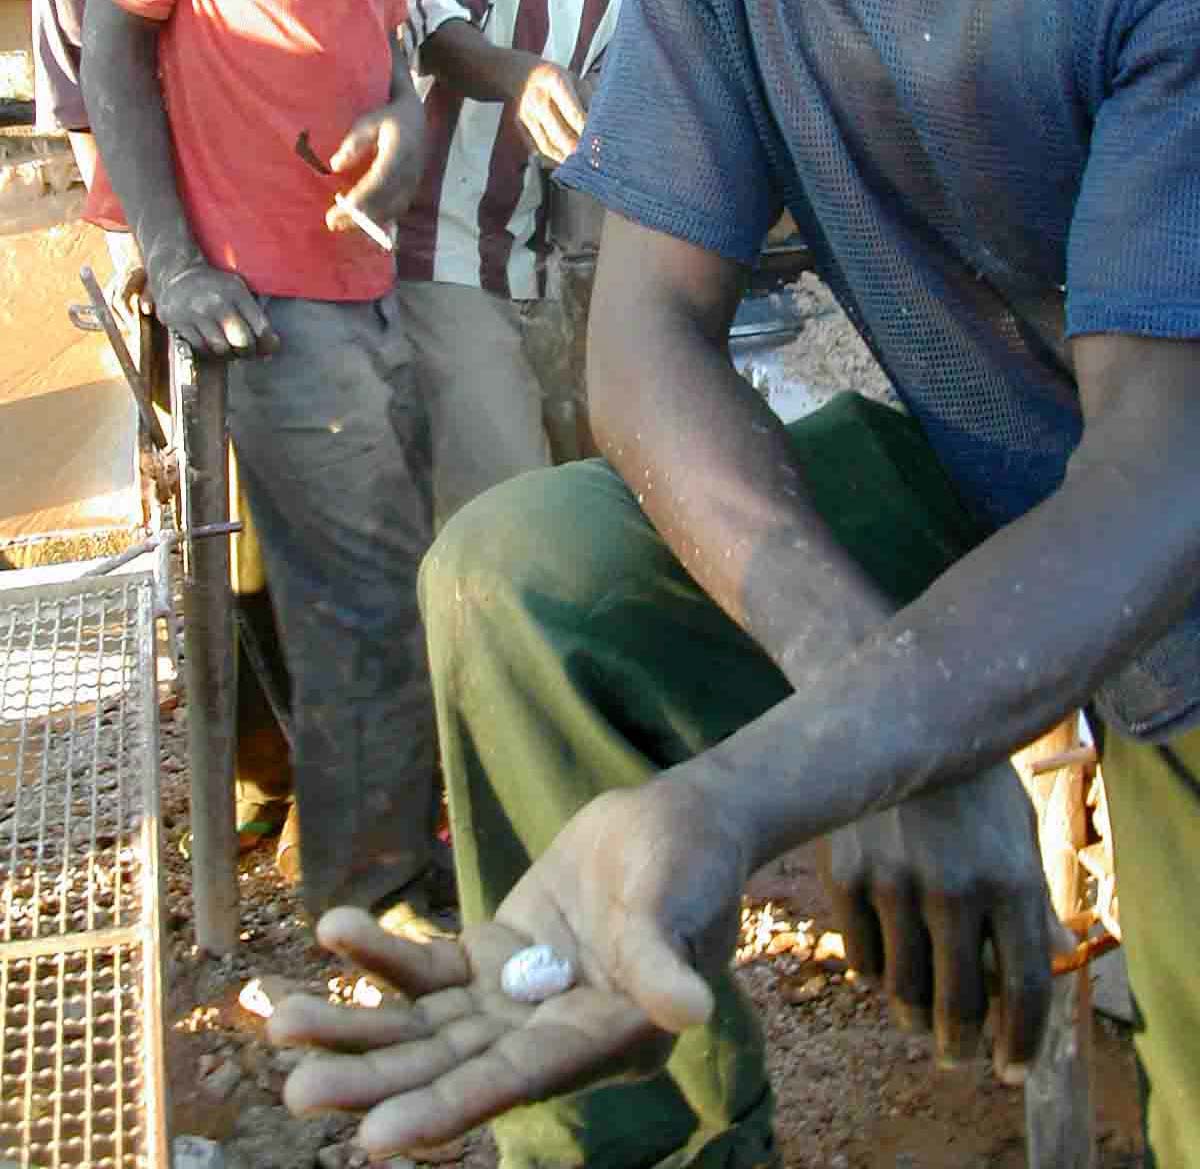
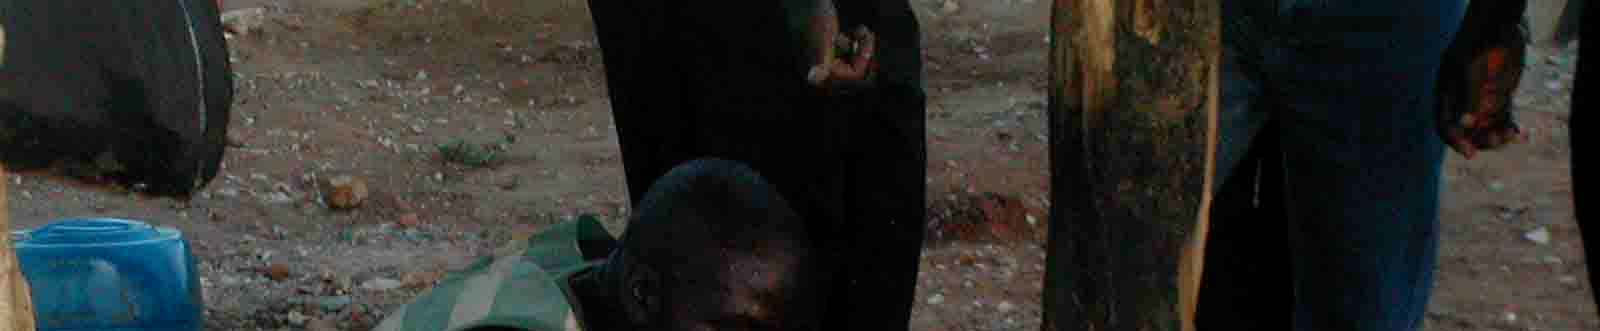
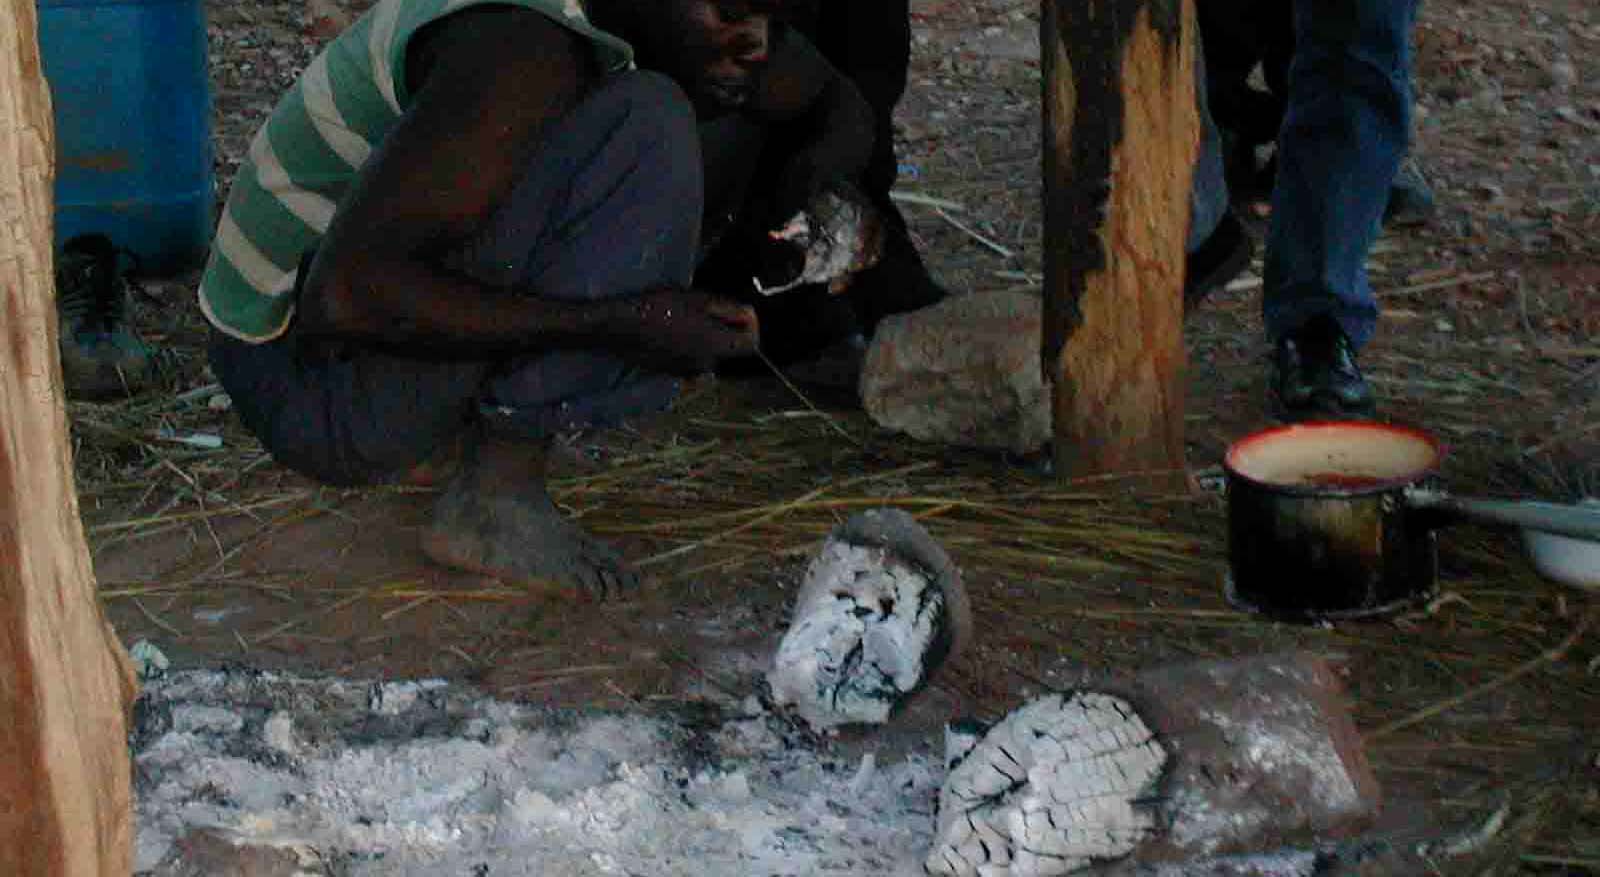
Picture 4 - Tix mine - scratching of amalgam; squeezing amalgam through a cloth; piece of
amalgam; burning amalgam.
After some time the millers stop the process and scratch the amalgam from the copper
plates. A cyanide solution is used on the copper plates to enrich the process. This
liquorish mercury compound is squeezed through a cloth and a hard piece of amalgam
is the result. Sometimes the miners use their mouth to hold the cloth whilst squeezing
stronger. The proper amalgam is formed now. The amalgam is smelted on open
wooden fire either beside the stamp mill or in the village.
The ore is gained nearby. The artisanal miners work in smaller units. Their equipment
and tools are very limited.
Final Report
17

Health Assessment Kadoma, Zimbabwe
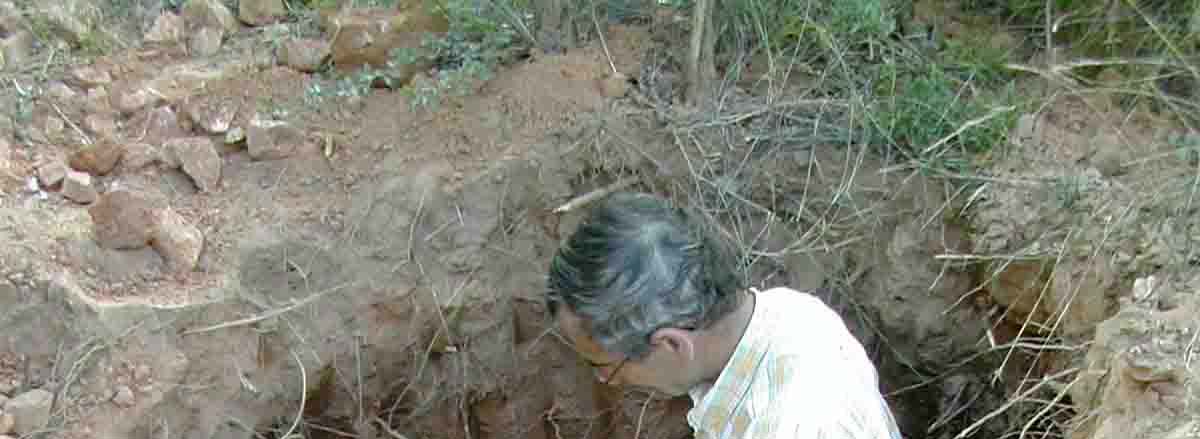
Picture 5 - Small artisanal open pit.
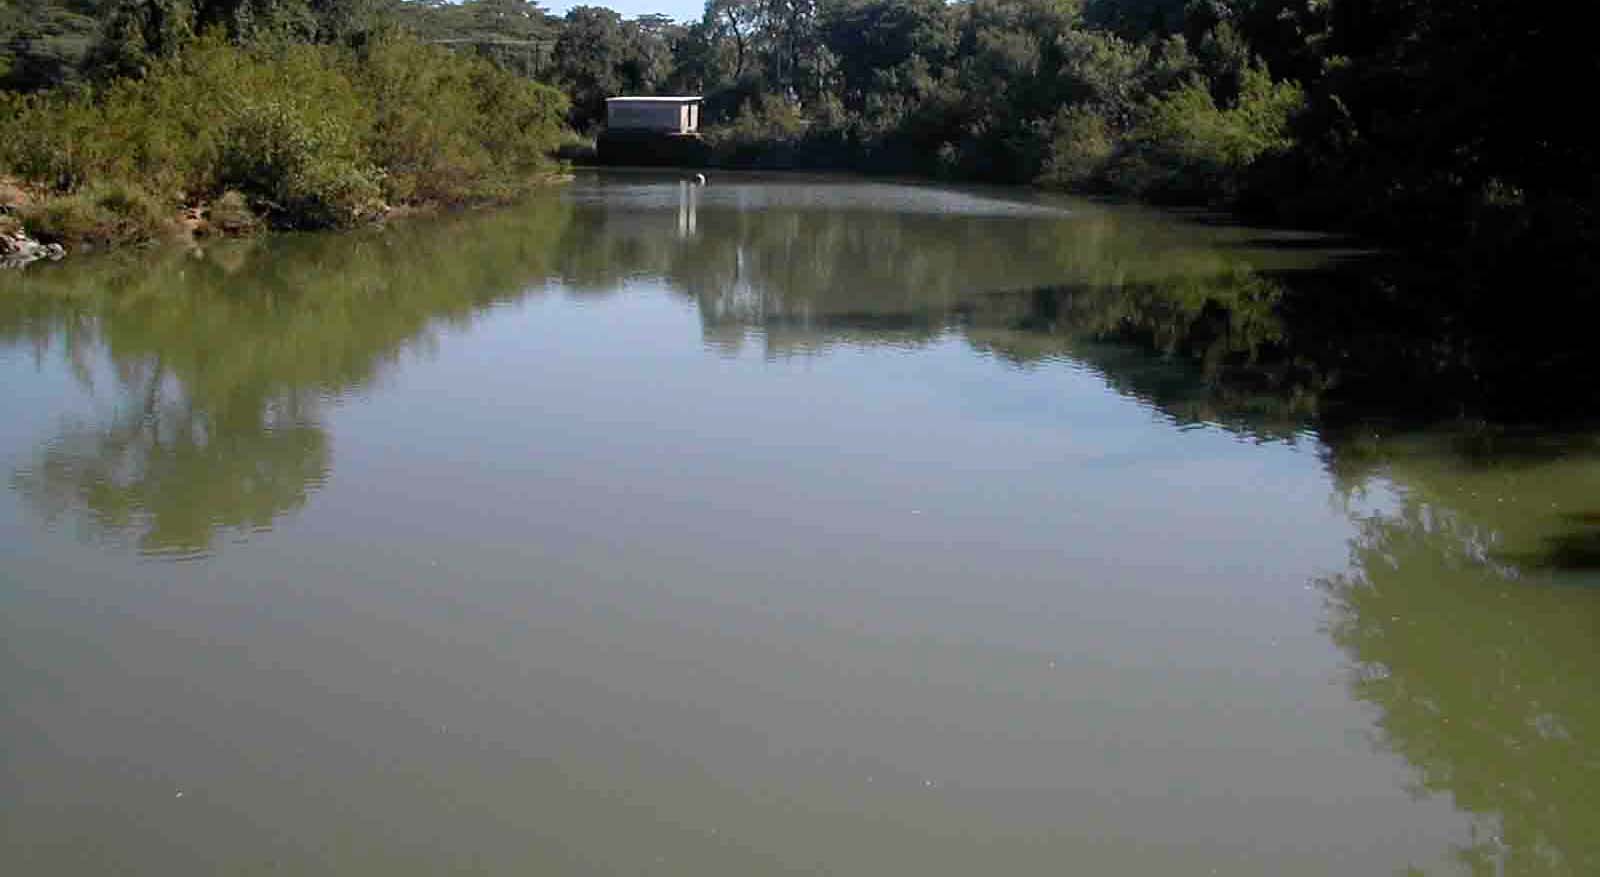
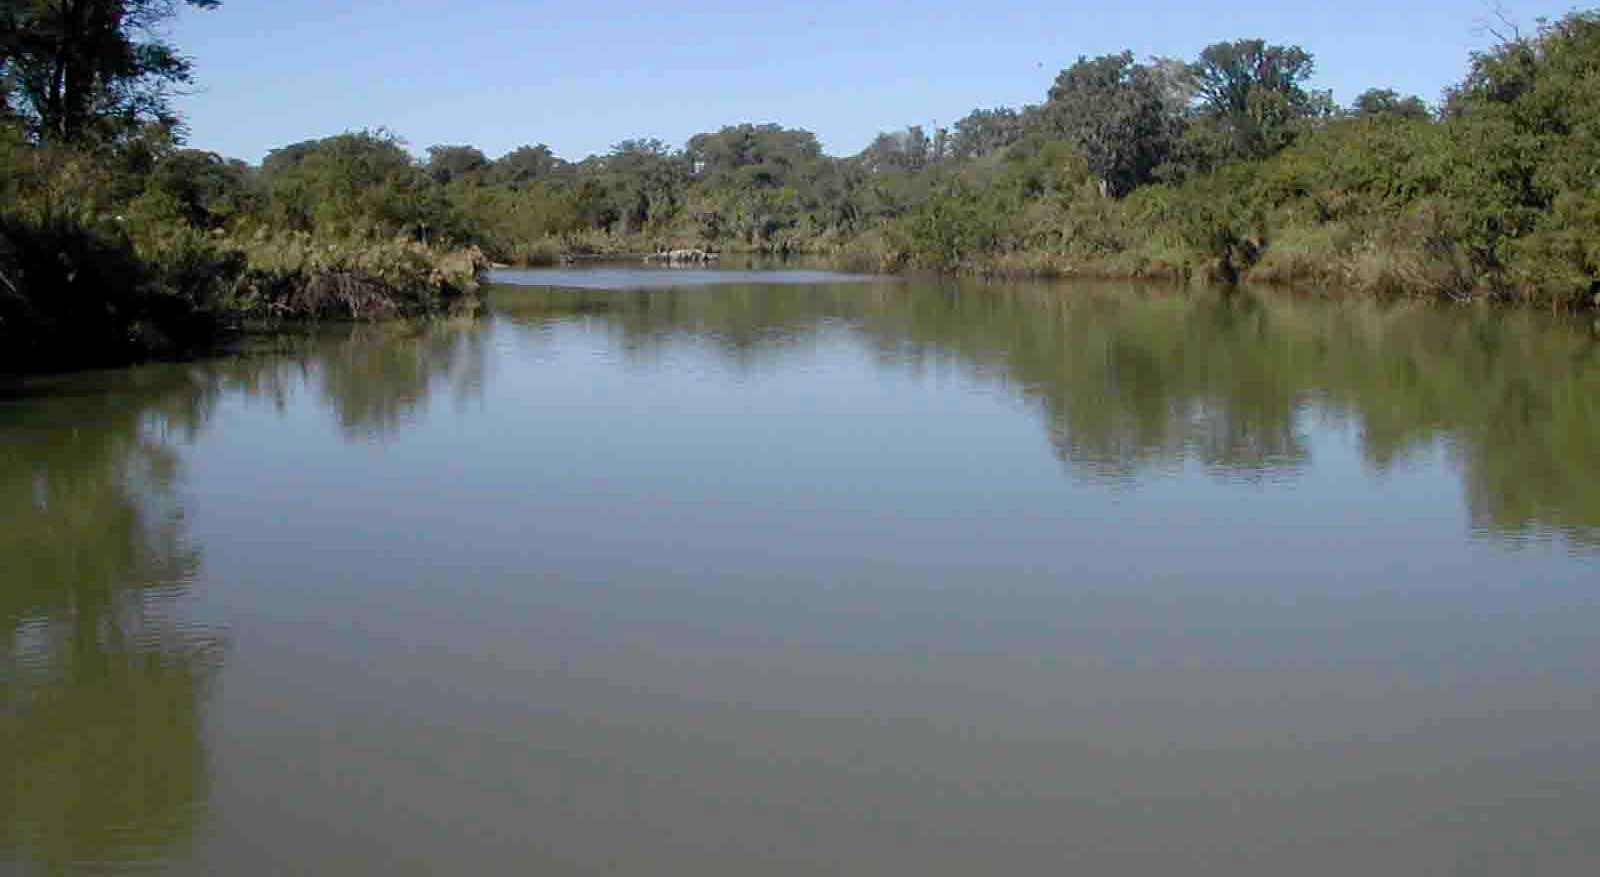
Picture 6 - Muzvezve river.
More than 250 miner families live within 400 meters to the Tix mine. Families consist in
average of-5-6 members (Mtetwa 2004). Within the village further amalgamation
processes take place, including panning and smelting.
Miners use the bush as toilet, since no other facilities exist. The villagers drink the
unsafe water from the river, contaminated with mercury and human excrements. The
local fish, eaten by the miners is high in mercury (see environmental report).
Amber Rose mine is close to the big Muzvezve River and approx. 7 km southwest of
Kadoma town. In this mining area the ore is also crushed by workers with hammers,
and then powdered in stamp mills. The mercury is added at the outlet of the stamp mill
18
Final Report
Health Assessment Kadoma, Zimbabwe
Picture 7 - Amber Rose mill: stamp mill; cyclotron.
into a cyclotron, where the gold binds to the mercury in a combination of a gravity
method and a chemical reaction.
The amalgam is collected by the ore owner. The amalgam is smelted by the owner
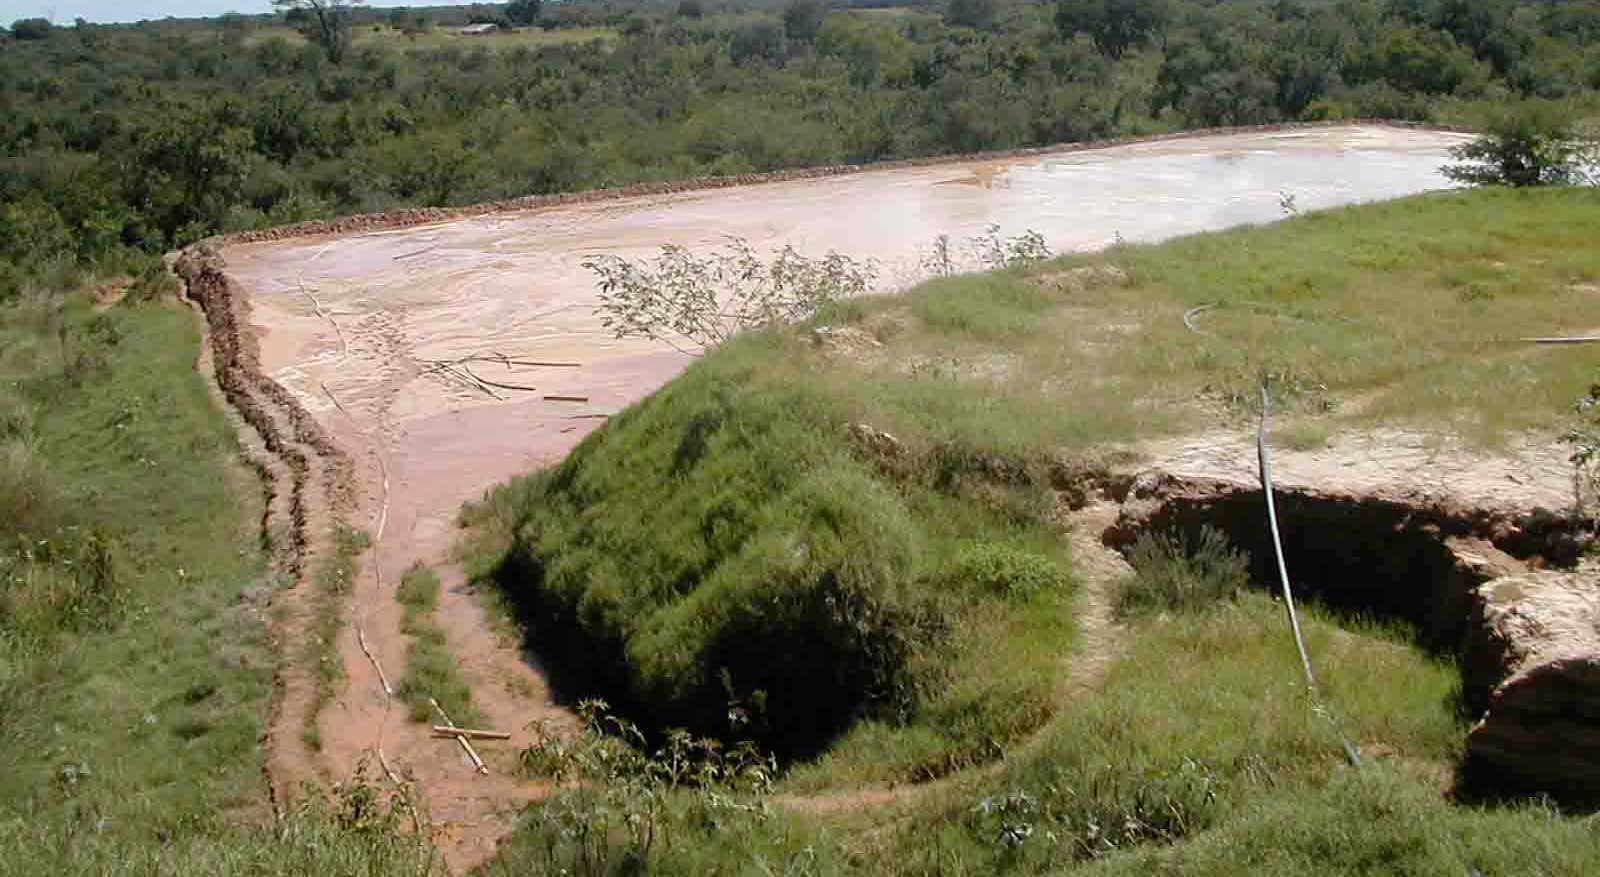
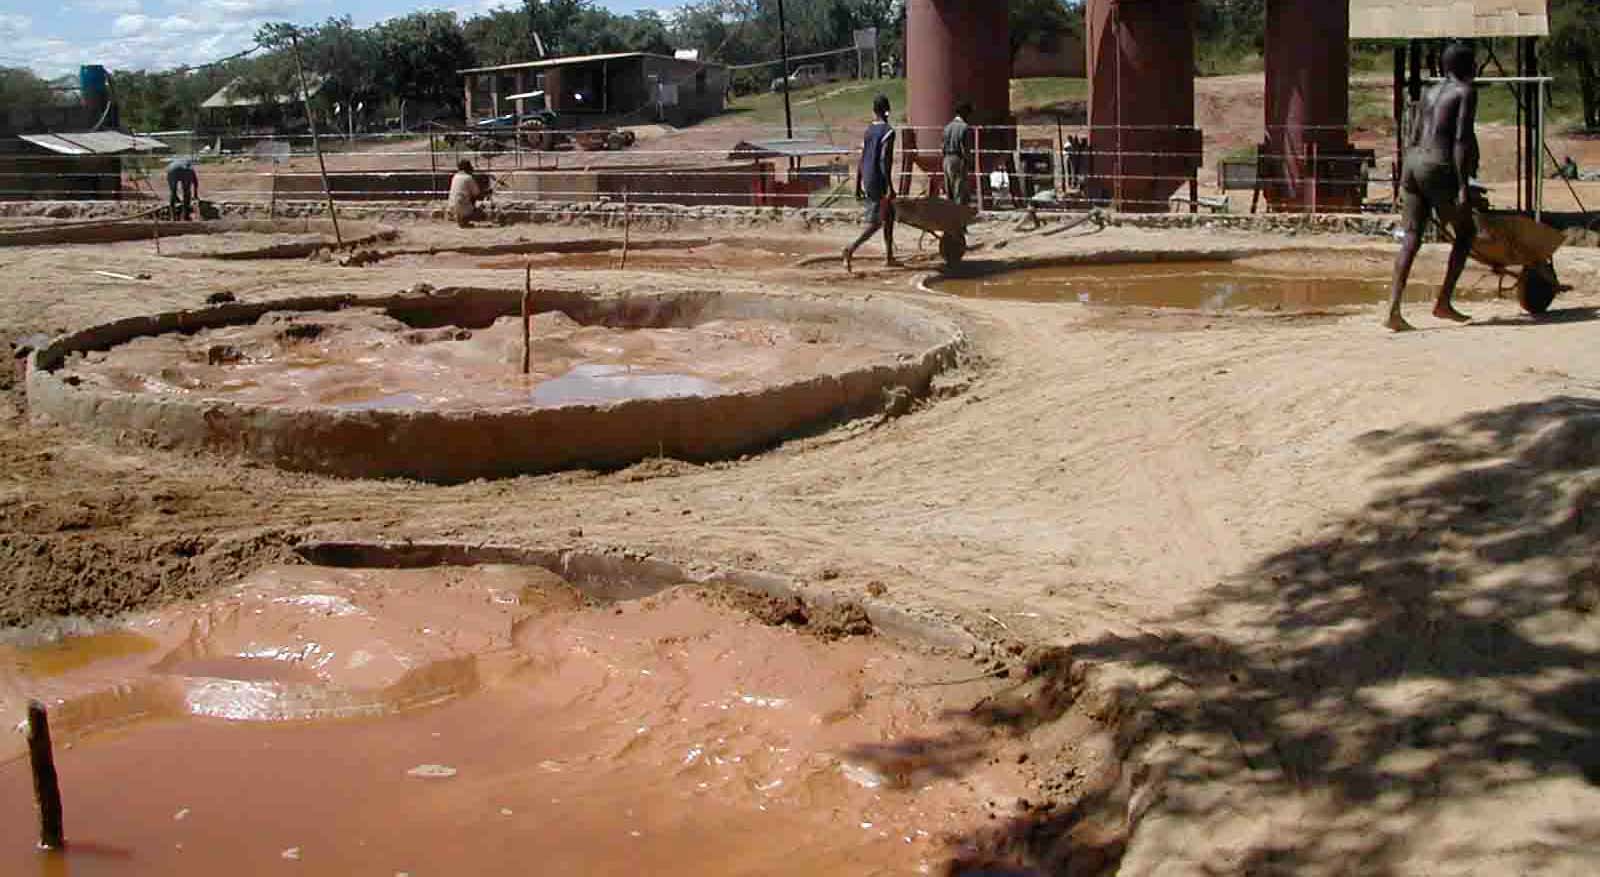
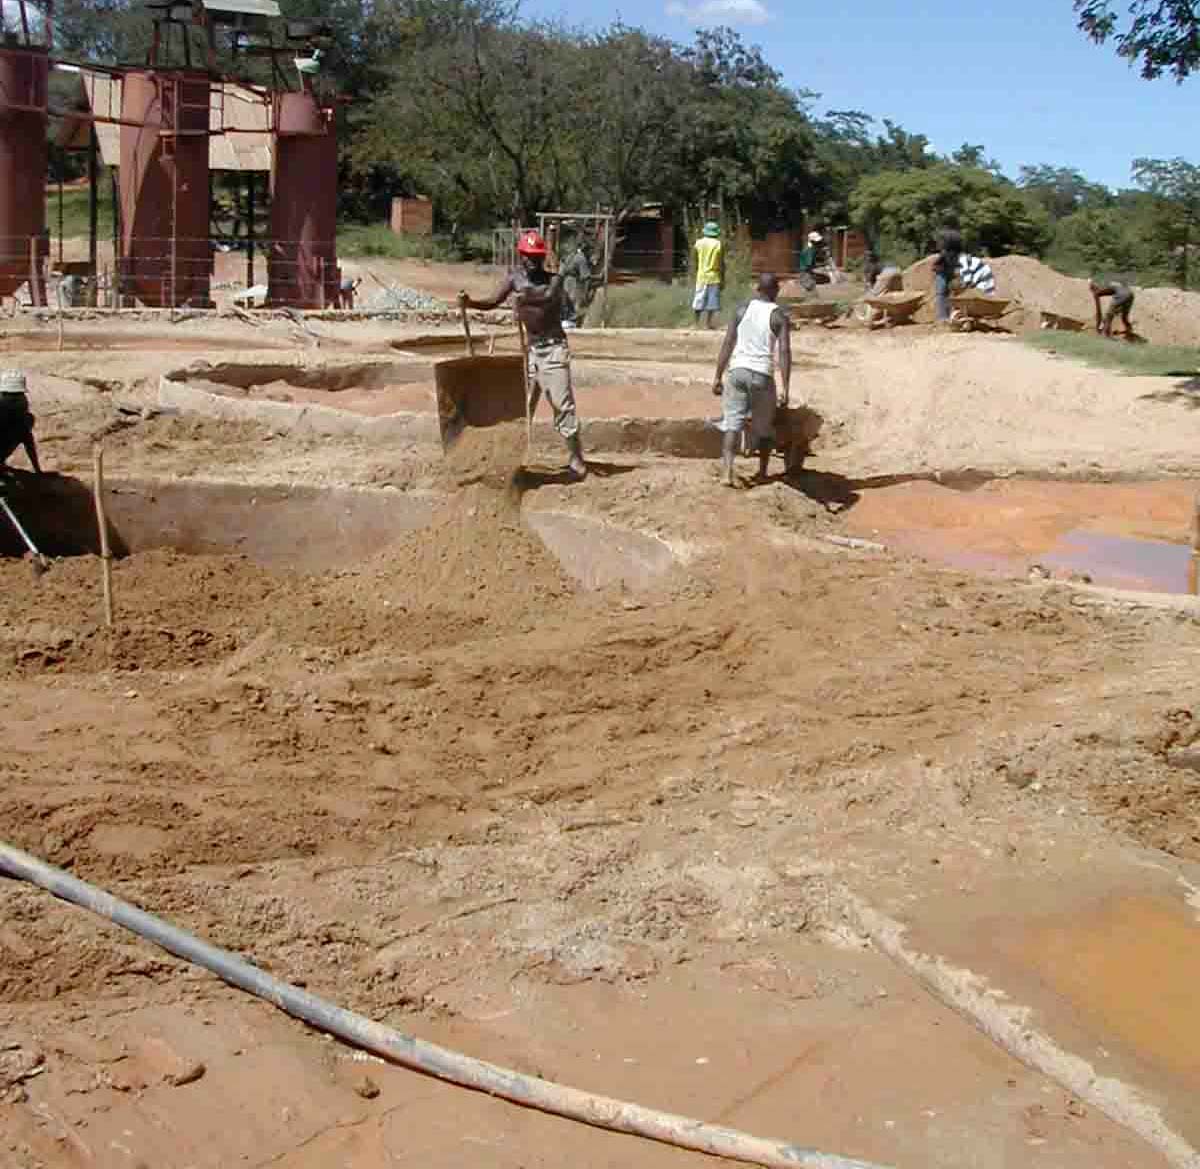
either on the spot with a wooden fire or a blow torch, or in his village. The tailings are
further processed by the mill owner. After drying the tailings there are reprocessed in
big cyanidation tanks. In the "pregnant" solution the gold is recovered and filtered out
by carbon. The carbon containing gold is further processed by the stamp mill owner
outside the premises.
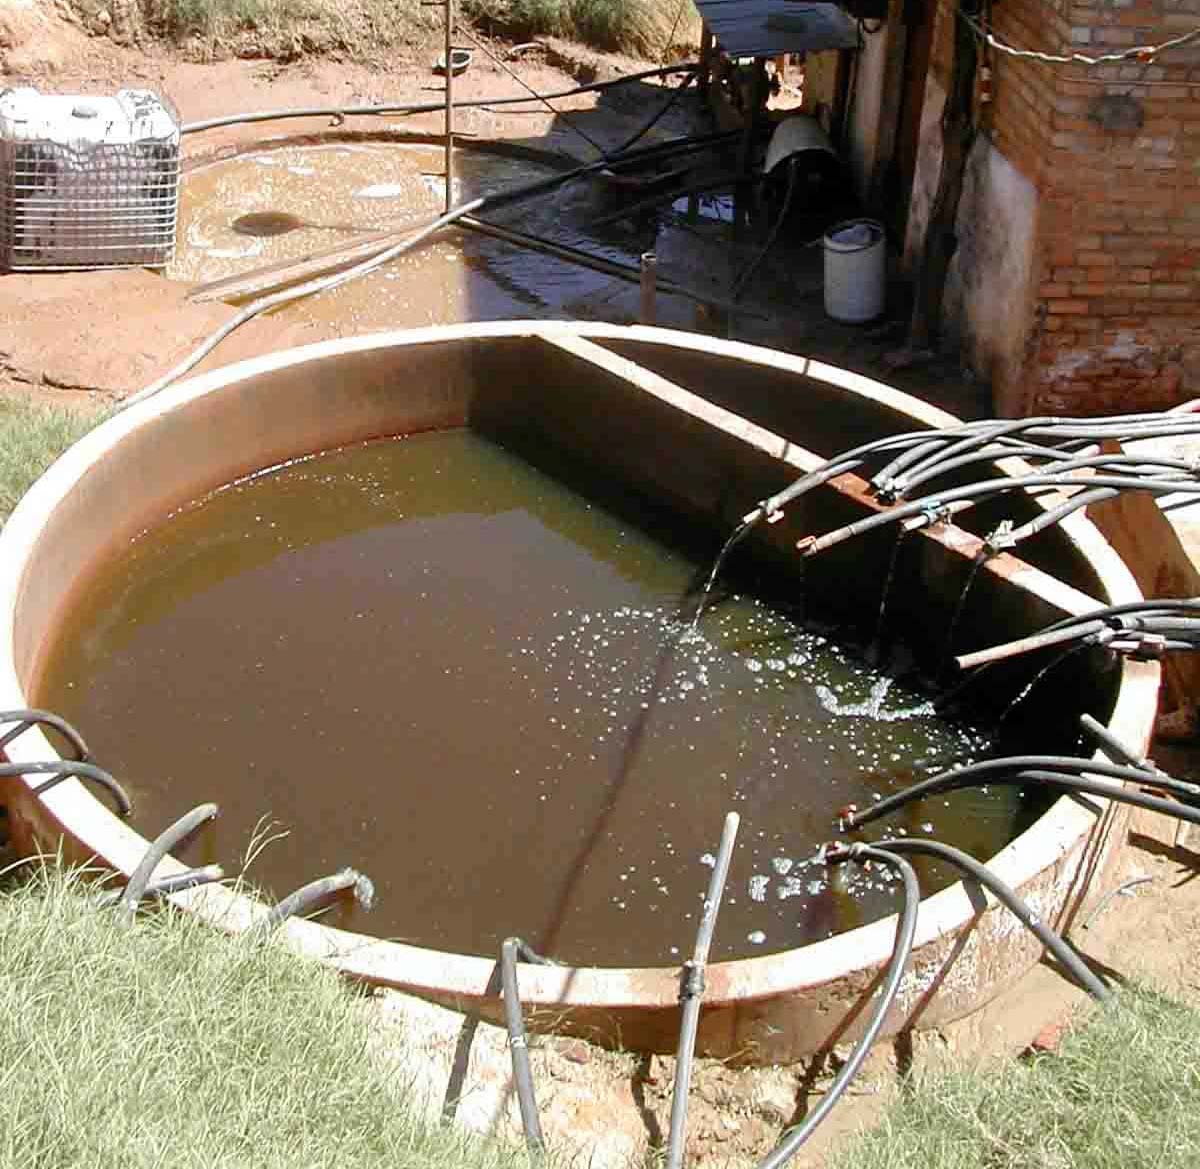
Picture 8 Amber Rose mill: tailings and cyanidation tank.
Final Report
19

Health Assessment Kadoma, Zimbabwe
Picture 8 - Amber Rose mill - tailings; cyanidation tank; pregnant solution; filling the tanks with
tailings (end).
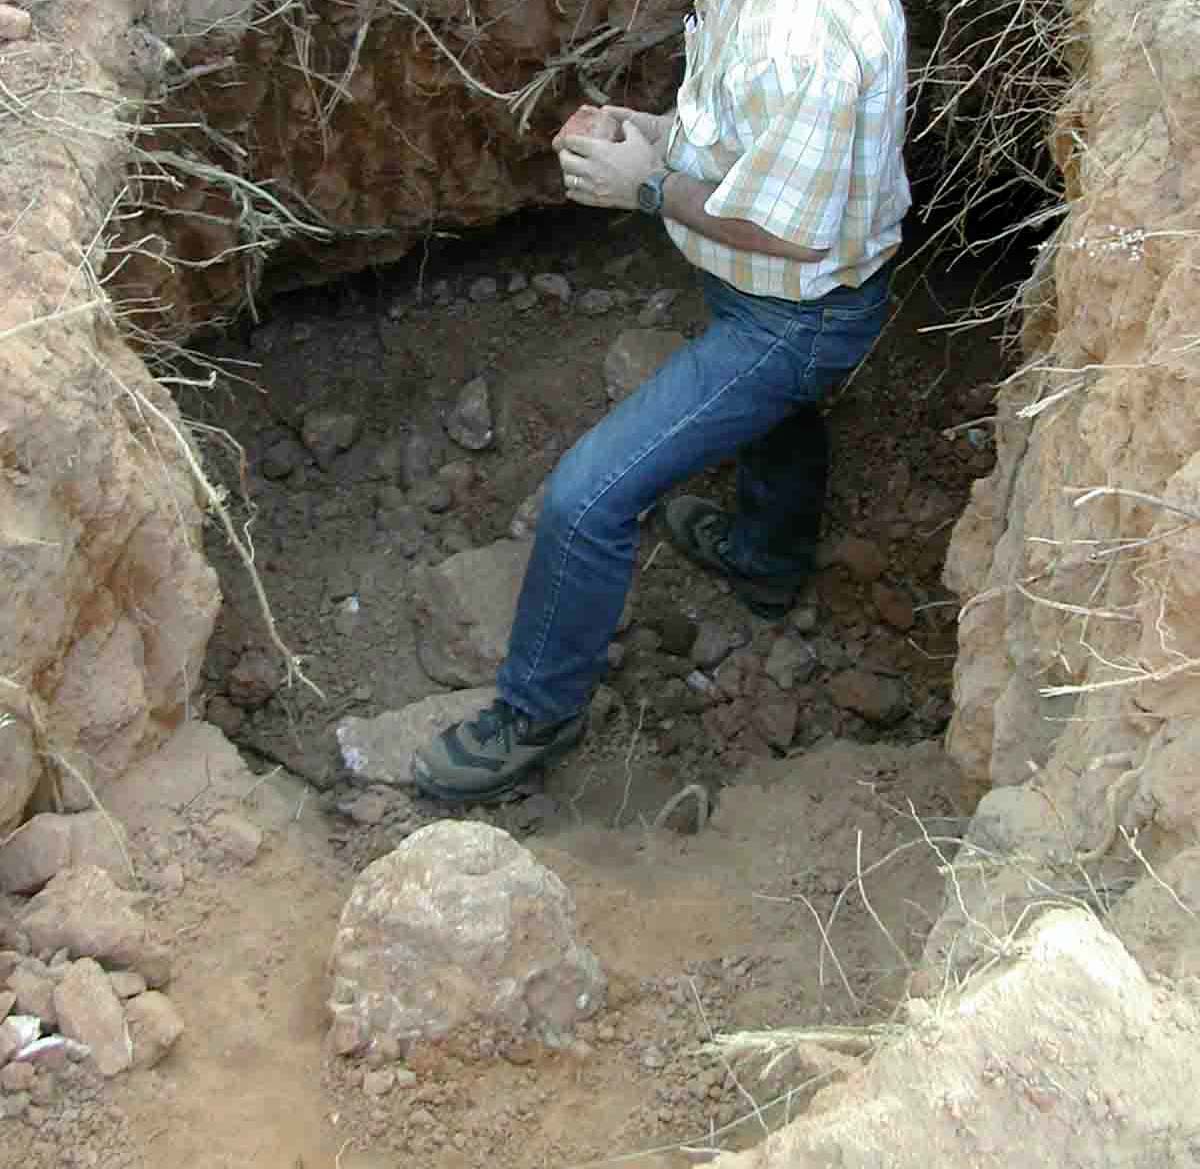
The ore is gained nearby. The artisanal miners work in smaller units. The artisanal
miners have very limited equipment and tools. Some just dig small pits in the area.
Other miners dig bigger open pits or even small tunnels.
Approx. 50 miners with their families live on the mining compound, on average with 5
members per family (Mtetwa, 2004).
Blair toilets are used. Drinking water is obtained from boreholes.
Etna mining area
Etna is a large farm approx 30 km south-east outside of Kadoma on off roads. An old
abandoned mine was squatted by artisanal miners a few years ago. Outbreaks of
violence are reported especially in this area. The old mine is underground, miners
nowadays reuse the tunnels, without any safety precautions, and e.g. they take out the
pillars. High rate of lethal accidents are a result of this improper mining technology.
One stamp mill is operating to crush the ore. A copper plate loaded with mercury plus a
ball concentrator with mercury is used to bind the gold to the mercury.
20
Final Report
Health Assessment Kadoma, Zimbabwe
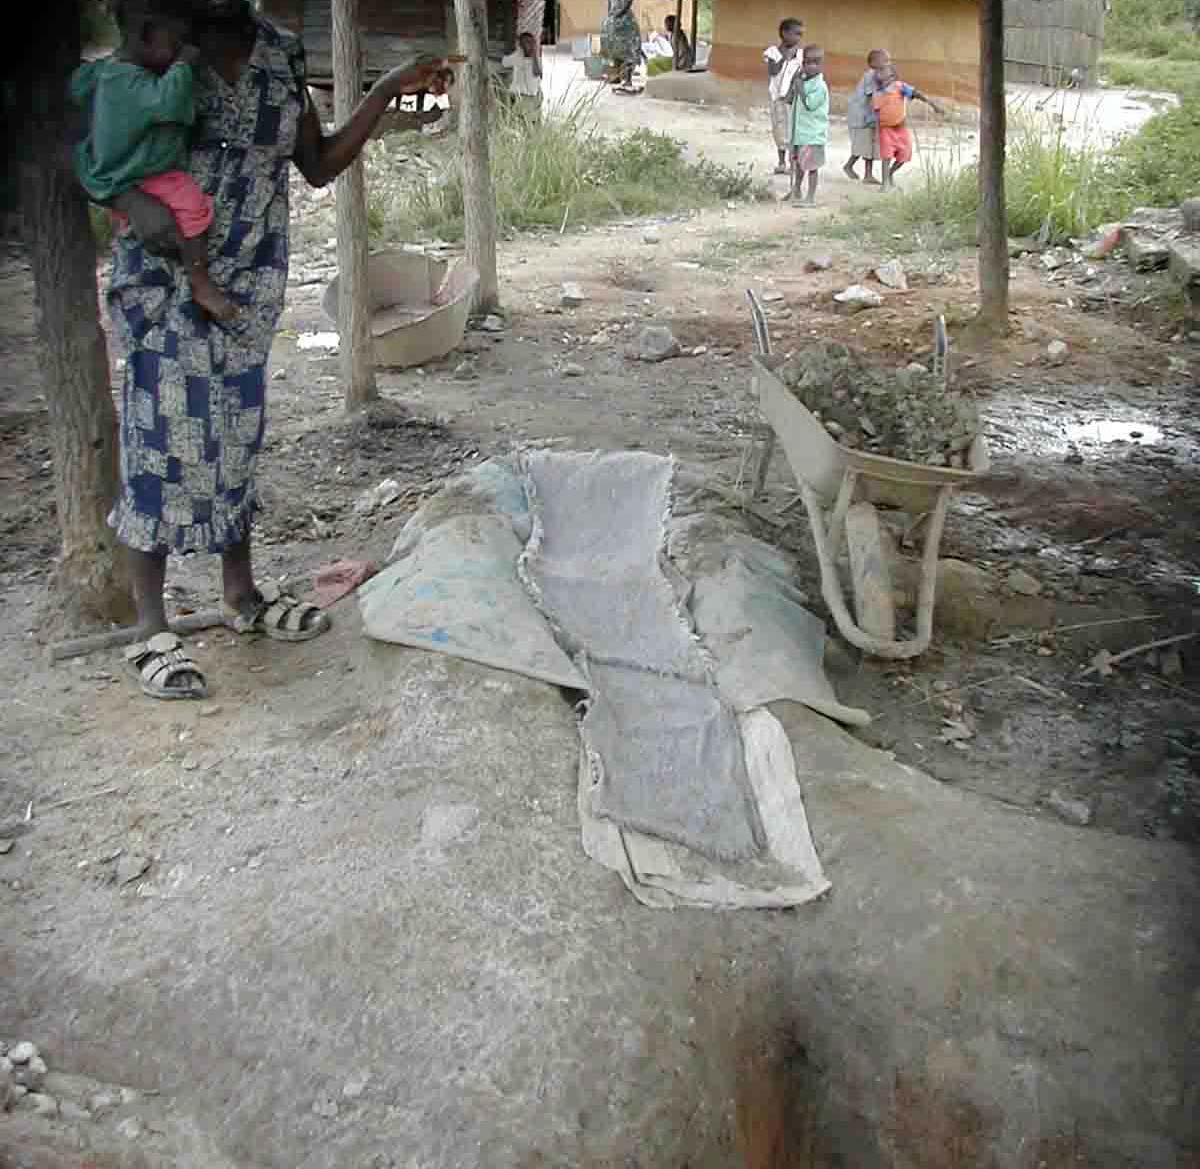
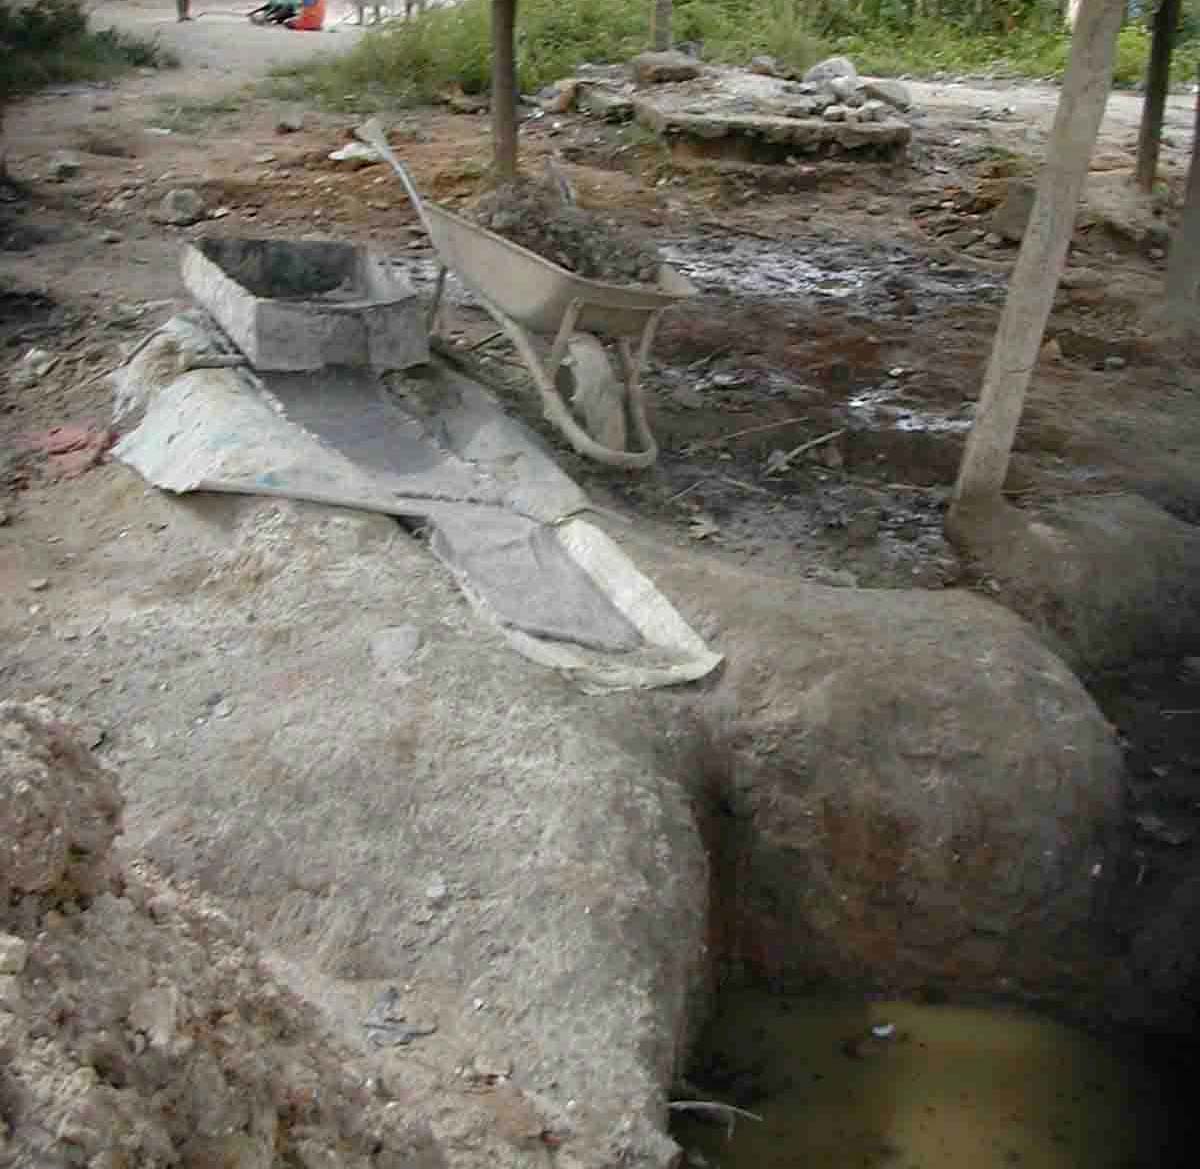
Picture 9 - Primitive sluice box and James table at Etna village.
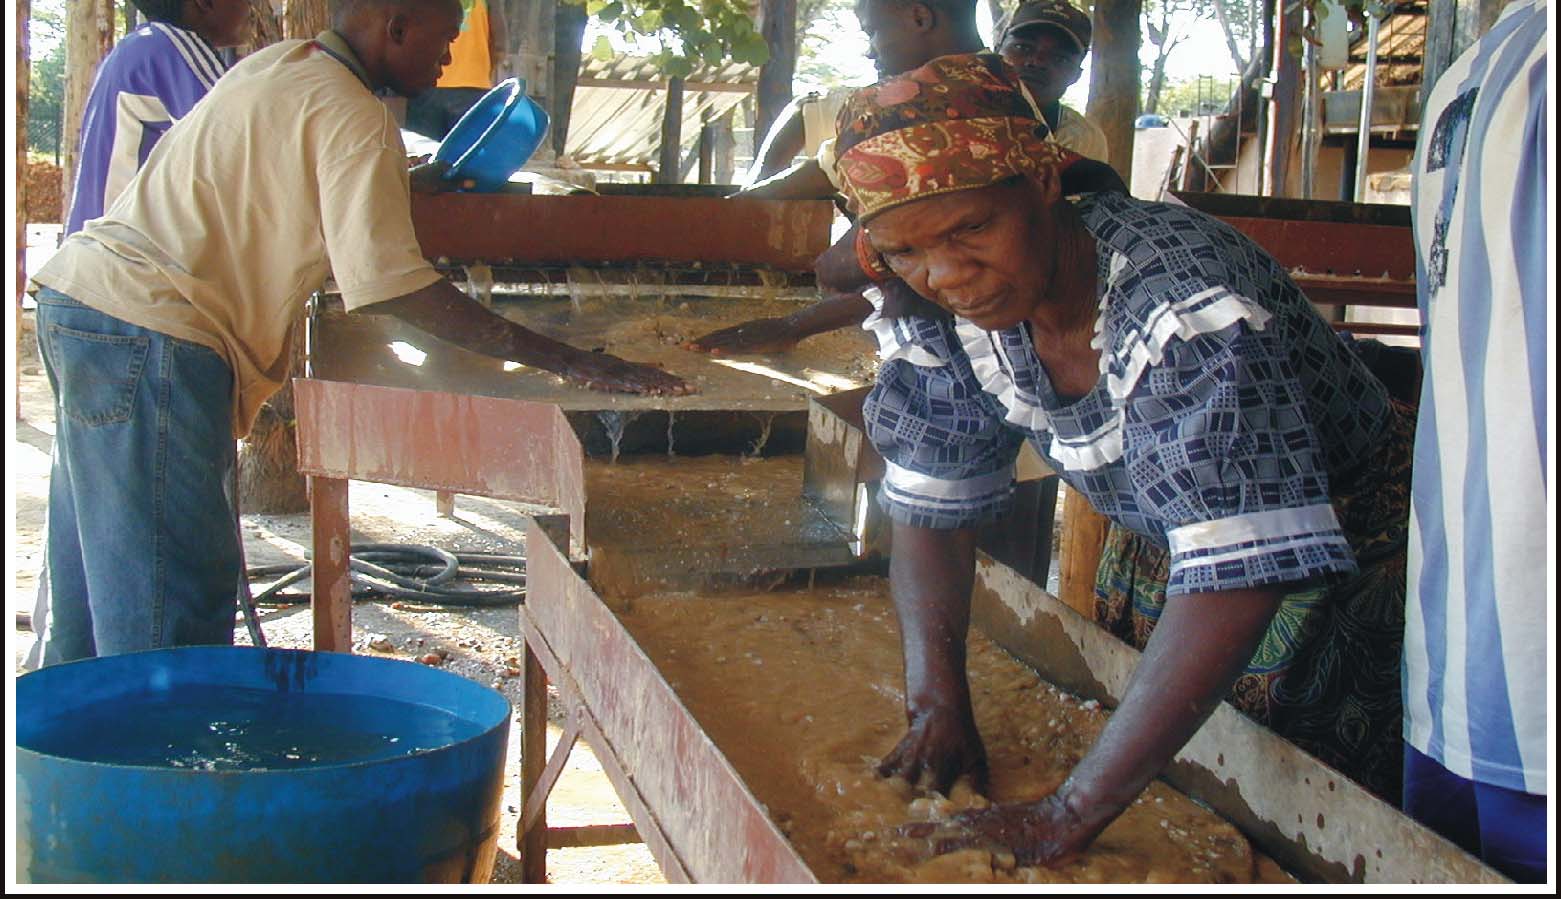
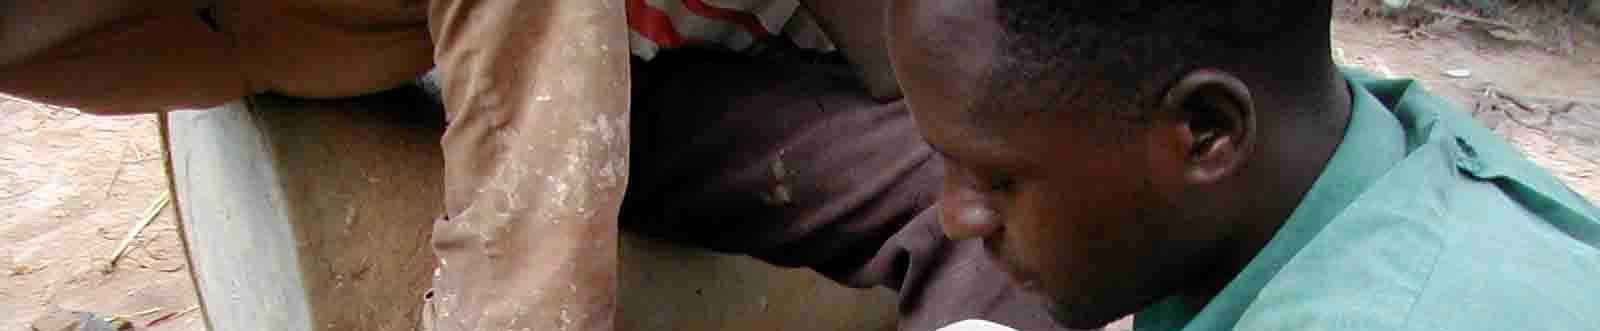
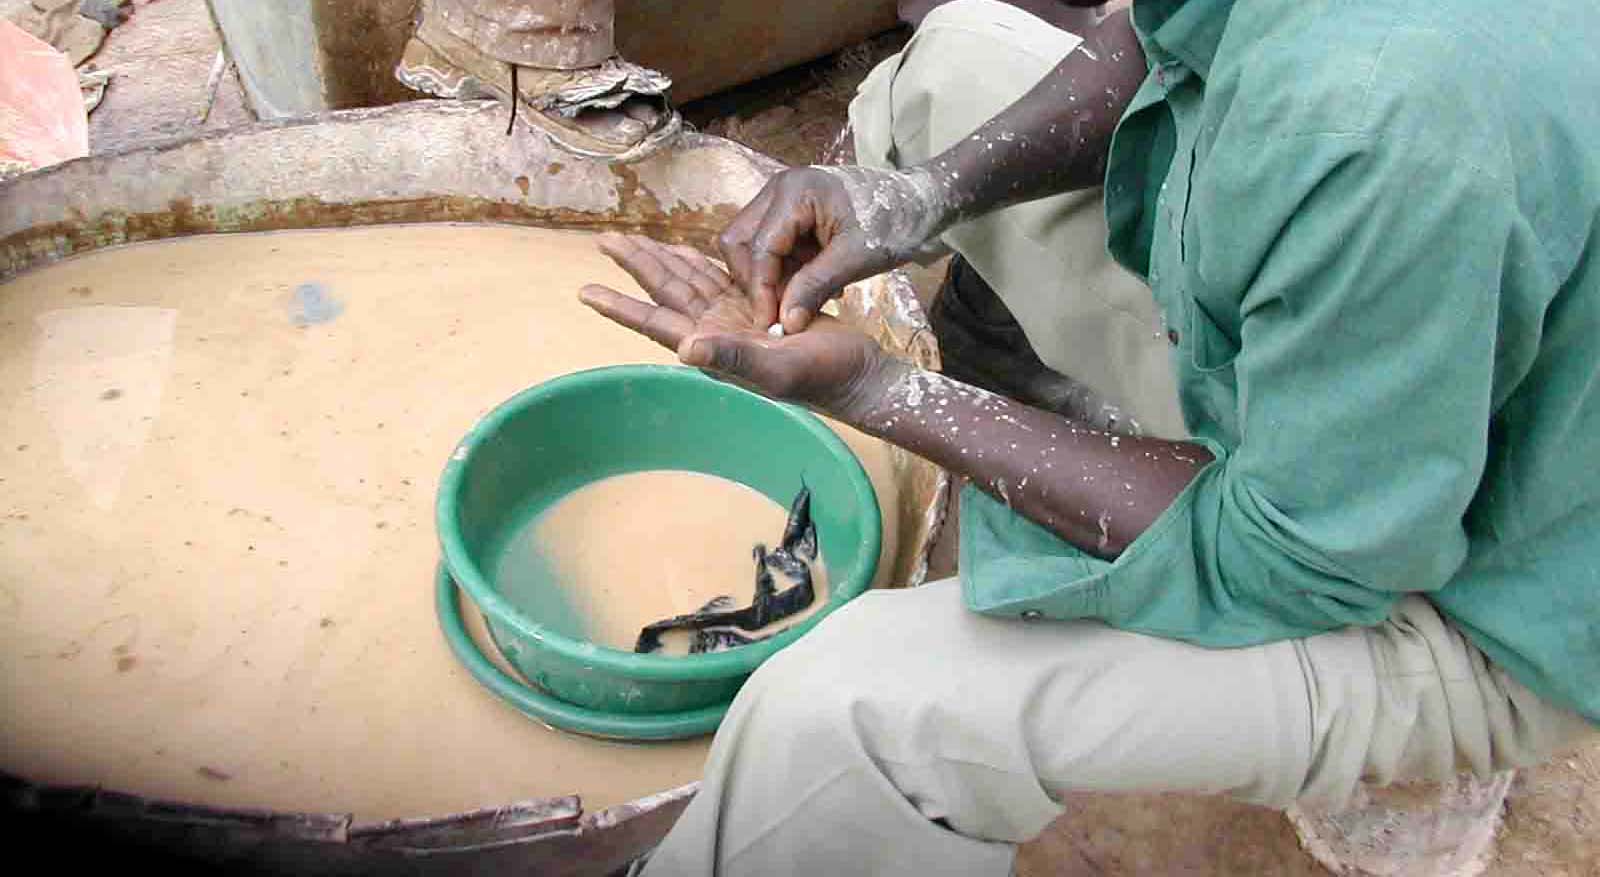
Many miners crush their ore with pestle and mortar. The powdered ore is panned with
mercury. The amalgam is smelted beside the houses. There is no infrastructure at all,
poverty is very obvious. Children work in all processes.
Picture 10 - Panning at Etna, piece of amalgam;
one sack of stones collected by a miner in a day.
Final Report
21

Health Assessment Kadoma, Zimbabwe
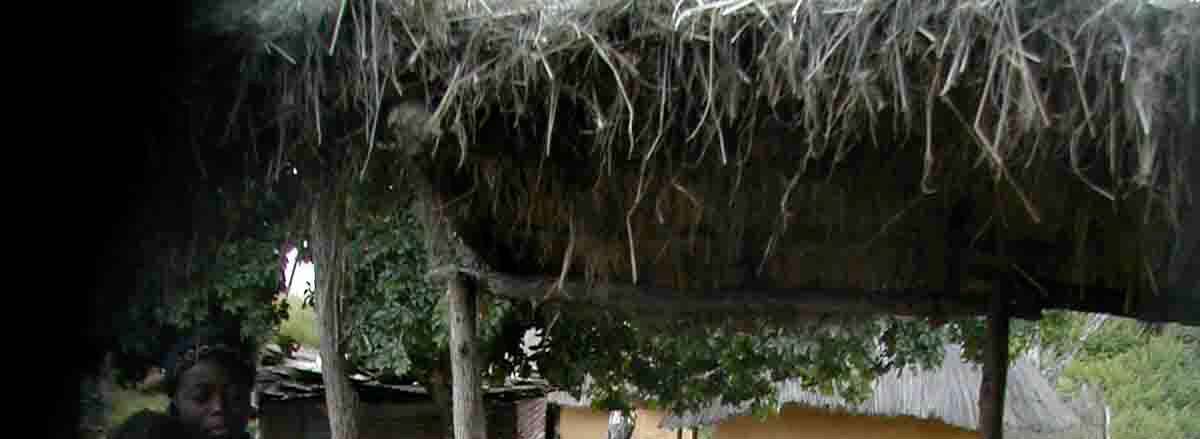
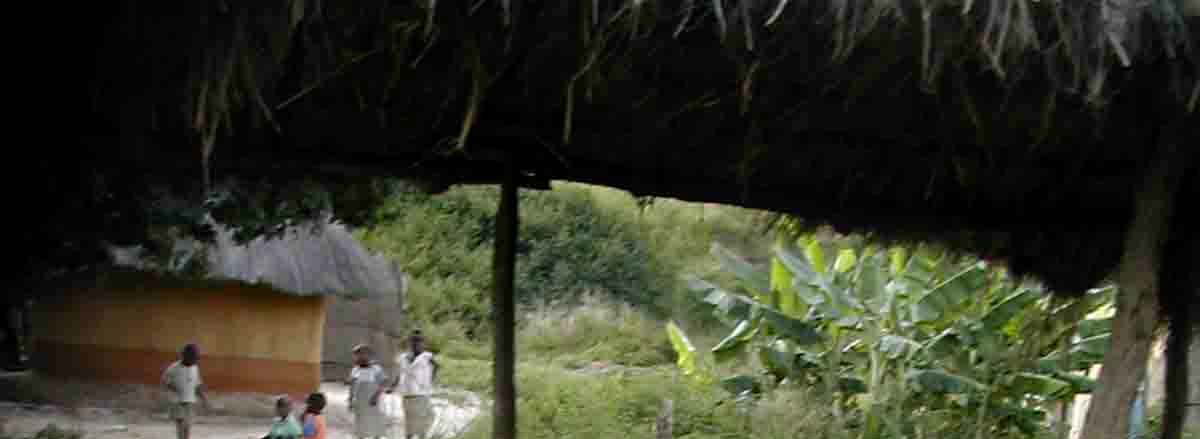
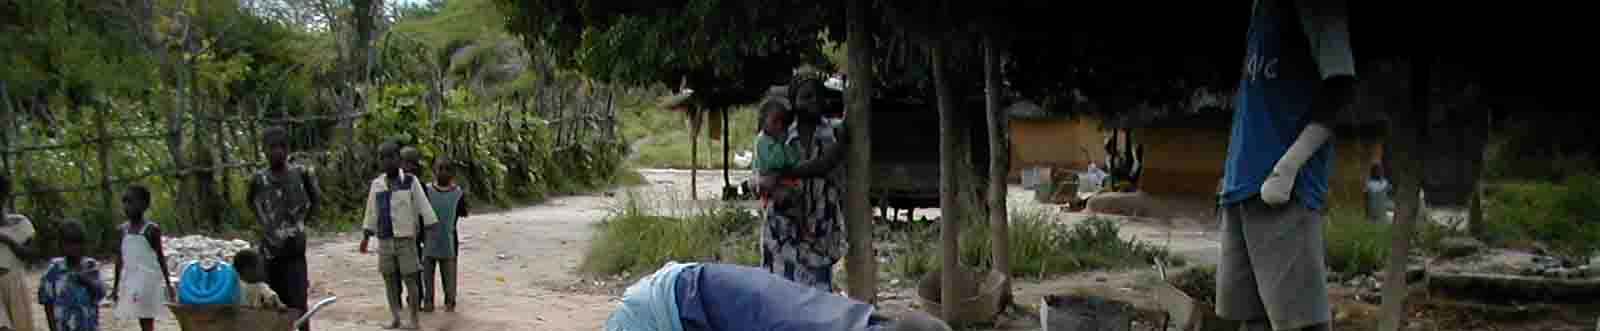
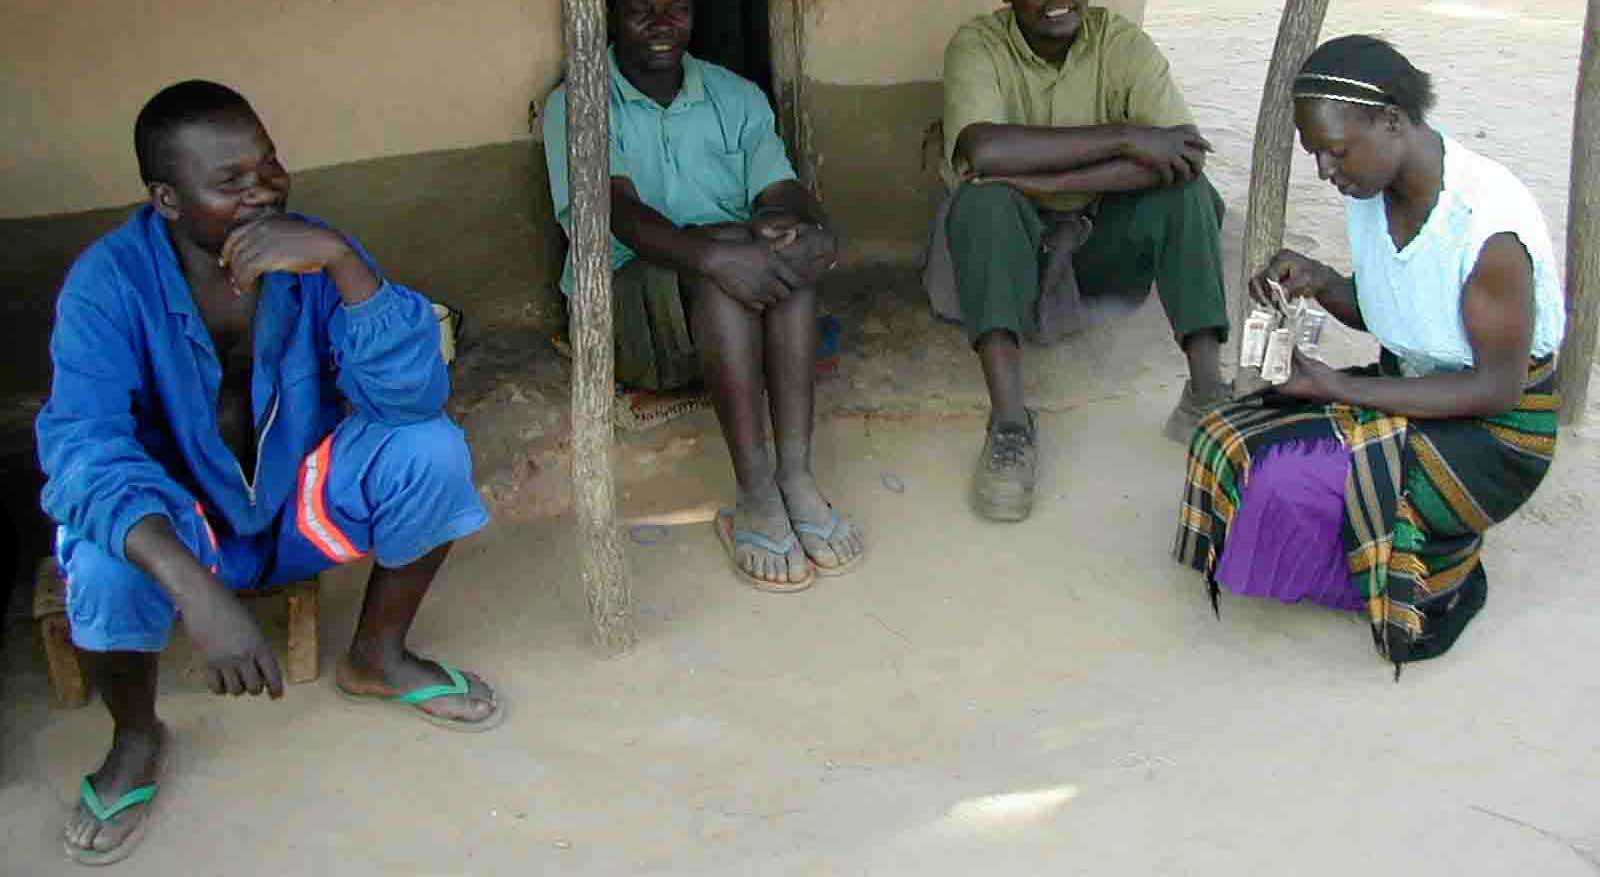
Picture 11 - Amber Rose village.
All areas
The young and strong men, so called healthy workers, are mainly found in the bigger
and technically higher equipped properties. Older people, women of all ages and
children mainly work in the smaller artisanal mining properties. Retorts are not used,
nor any other protection against any kind of mercury contamination. There is no proper
ventilation for the mercury fumes. Housing areas, food stalls and the schools are
nearby to the amalgamation and smelting places. Tailings containing mercury are
everywhere within the village, beside the farming land or beside the local water wells.
The mercury is usually stored in the miner's houses, near to where they and their
families sleep. The mercury is available in Kadoma. The gold is sold to governmental
dealers, or smuggled to South Africa or Botswana by gold buyers.
2.4. PROJECT DESIGN
The "Protocols for Environmental and Health Assessment of Mercury Released by
Artisanal and Small-Scale Gold Miners" were developed by UNIDO in collaboration
with the "Institute of Forensic Medicine" and other international experts (Veiga, 2003).
The "Health Assessment Questionnaire" was partly translated in Shona and was used
(Appendix 2) to examine the general health condition of members of the mining
community and to indicate symptoms of mercury poisoning. History / clinical /
neurological / toxicological tests were used according to the state of the art.
Participants were examined to identify neurological disturbances, behavioral disorders,
motor neurological functions, cognitive capabilities, balance, gait, reflexes etc.. The
data was compiled for statistical purposes and maintained confidentiality regarding all
health related issues.
Team members for the field project were Dr. med. Stephan Boese-O´Reilly
(pediatrician, master of public health, environmental medicine), Dr. med. Felicitas
Dahlmann (physician) and Ms. Beate Lettmeier (pharmacist). Dr. Dennis Shoko was
the National Expert for the Global Mercury Project (UNIDO) with a backup from the
University of Zimbabwe. Mr. Pierre Billaud from BRGM is in charge of the
22
Final Report


Health Assessment Kadoma, Zimbabwe
environmental and health assessment in behalf of BRGM. He accompanied us during
the field project to help organize our project and to complete his environmental
assessment. Assigned to the project were nurses to assist the medical examinations,
Ms. Tapuwa Mwanjira, Ms. Vigilance Parirenyatwa, and Ms. Joan Marembo and Dr.
Edwin Muguti as local medical expert.
The field project took place from the 4th of April 2004 until the 21st of April 2004. The
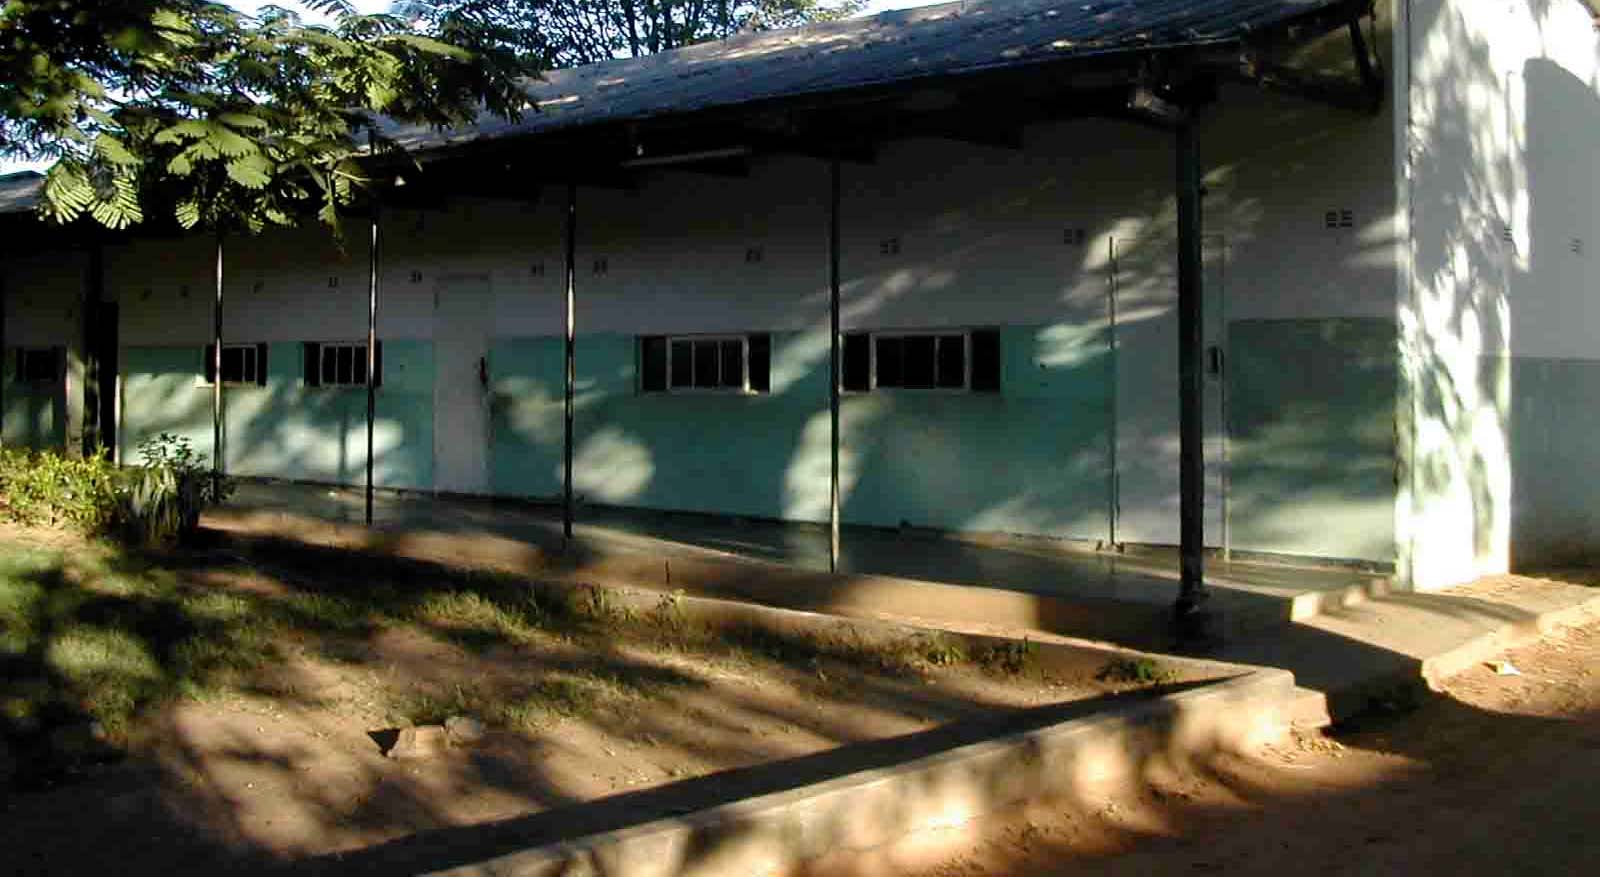
equipment was first set up in the school building near Tix mine (Mayflower Primary
School). The school offered its facilities to perform the examination, which was much
appreciated by the health assessment team. The facilities were sufficient to perform the
examinations (four rooms for the team, electricity, toilet, water), including a mobile
analyzer of Hg in urine. In Mayflower school participants from Tix mill, Brompton mine
and Amber Rose mill were examined.
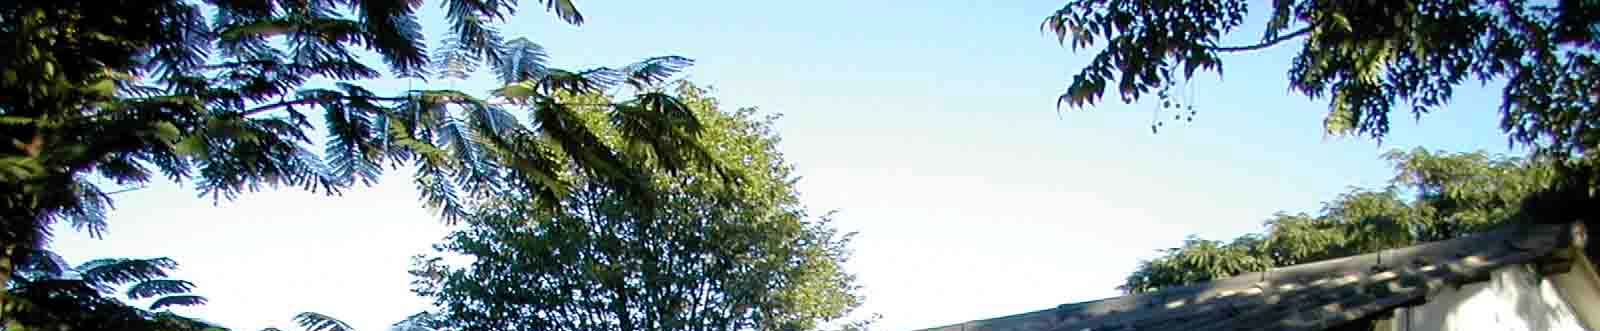
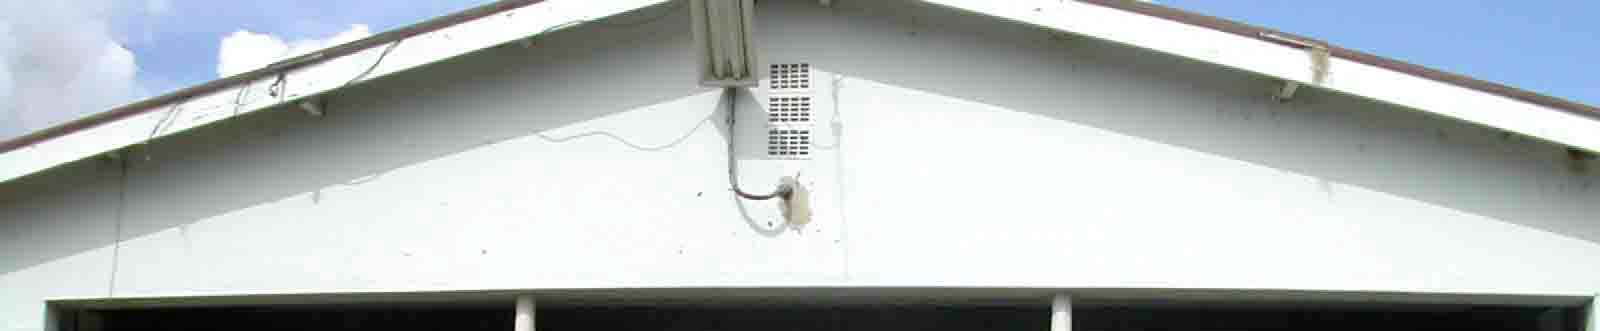
Picture 12 - Mayflower school.
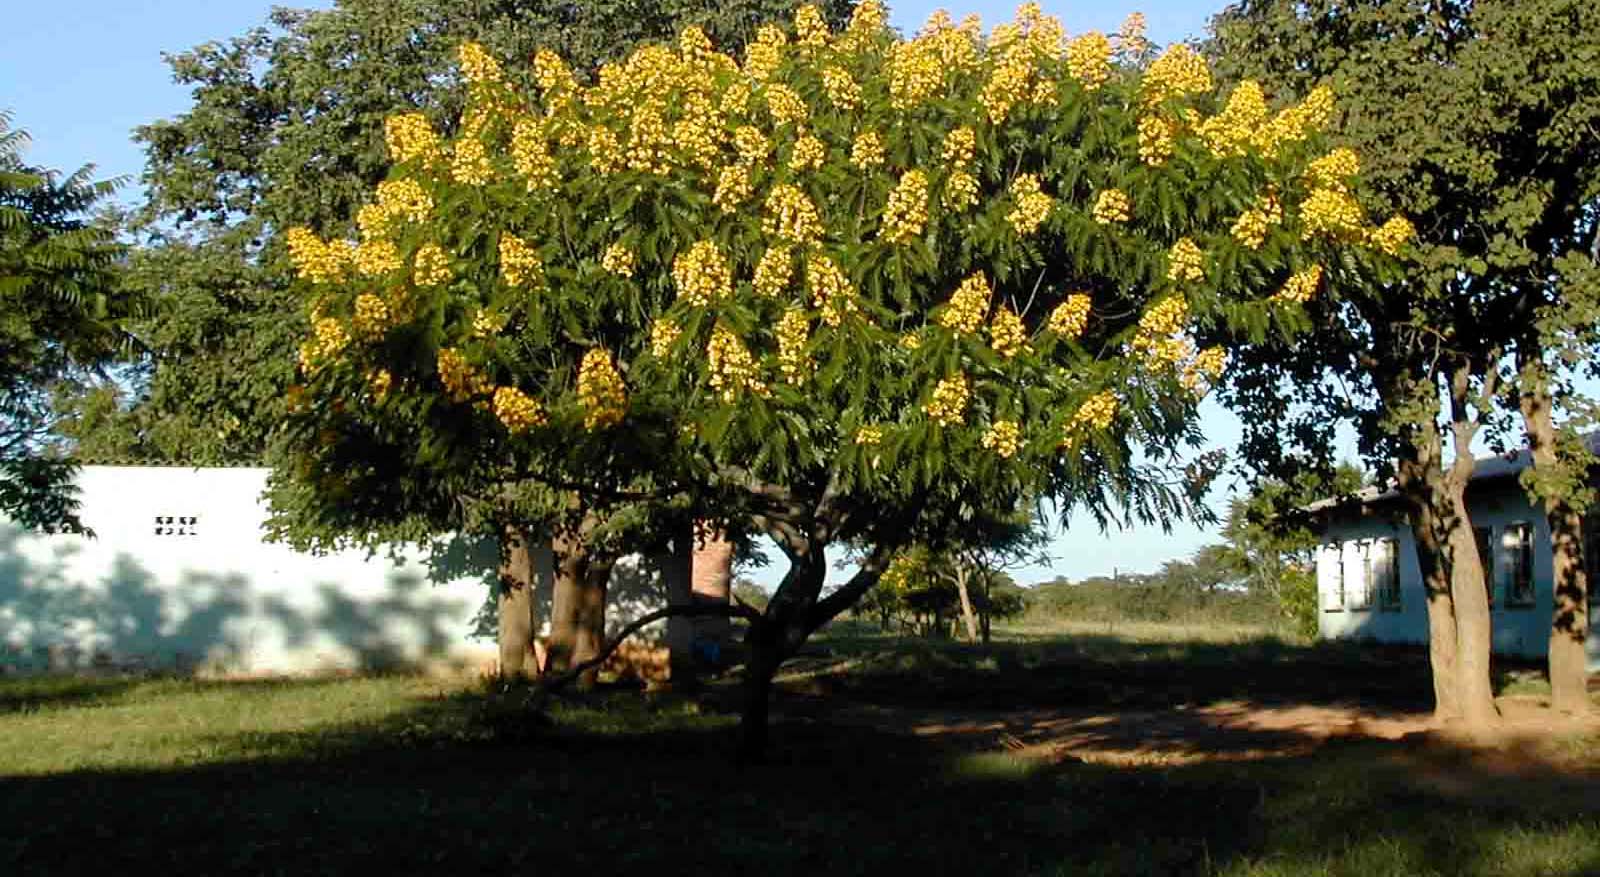
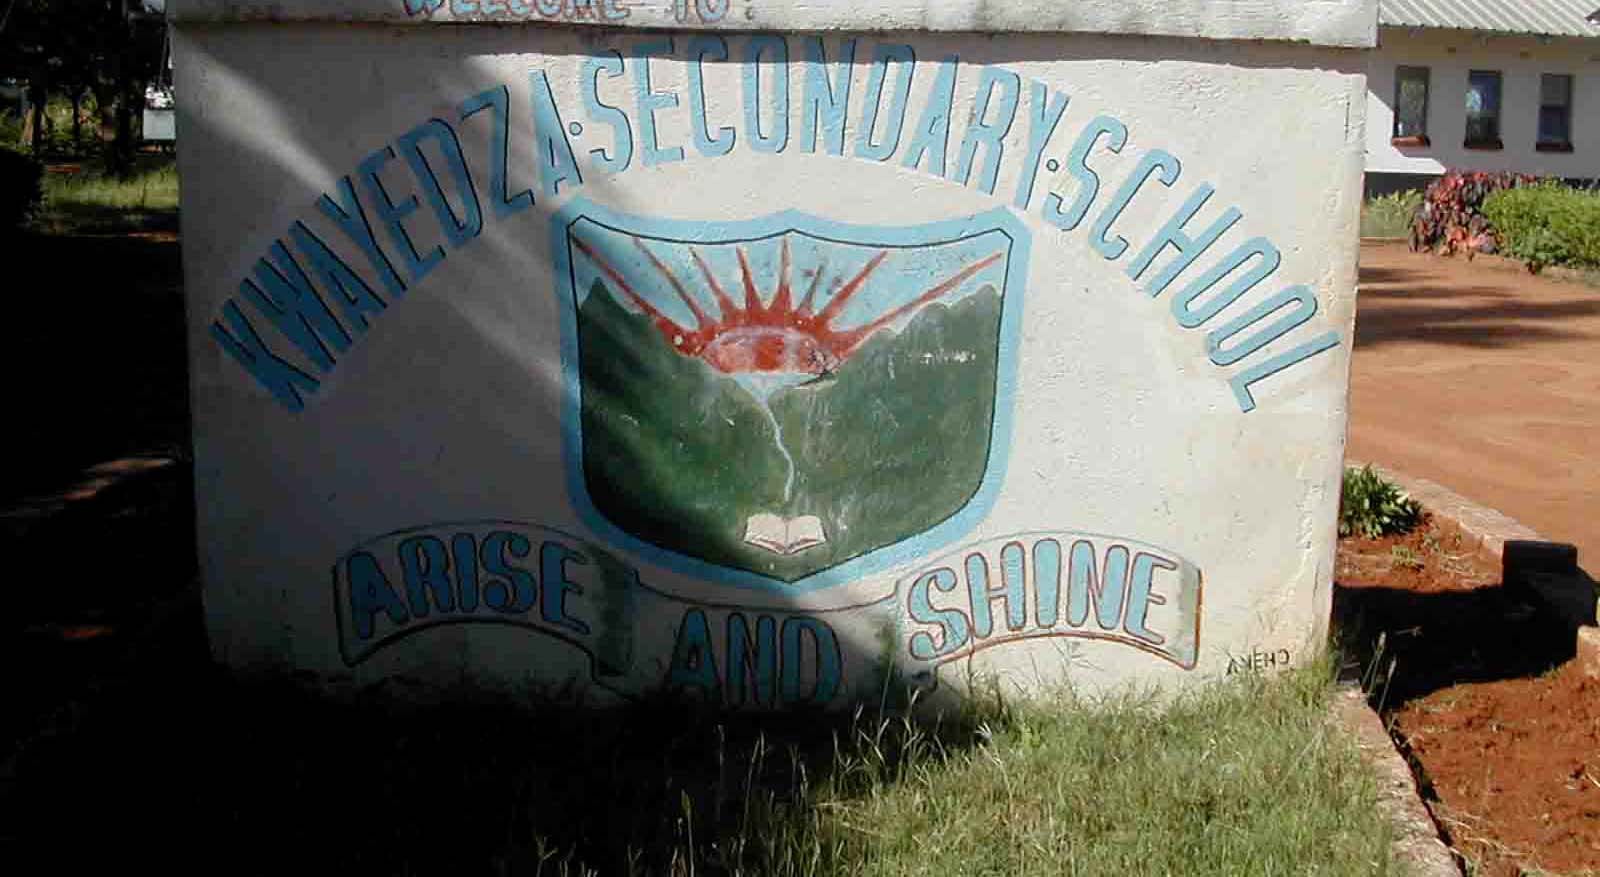
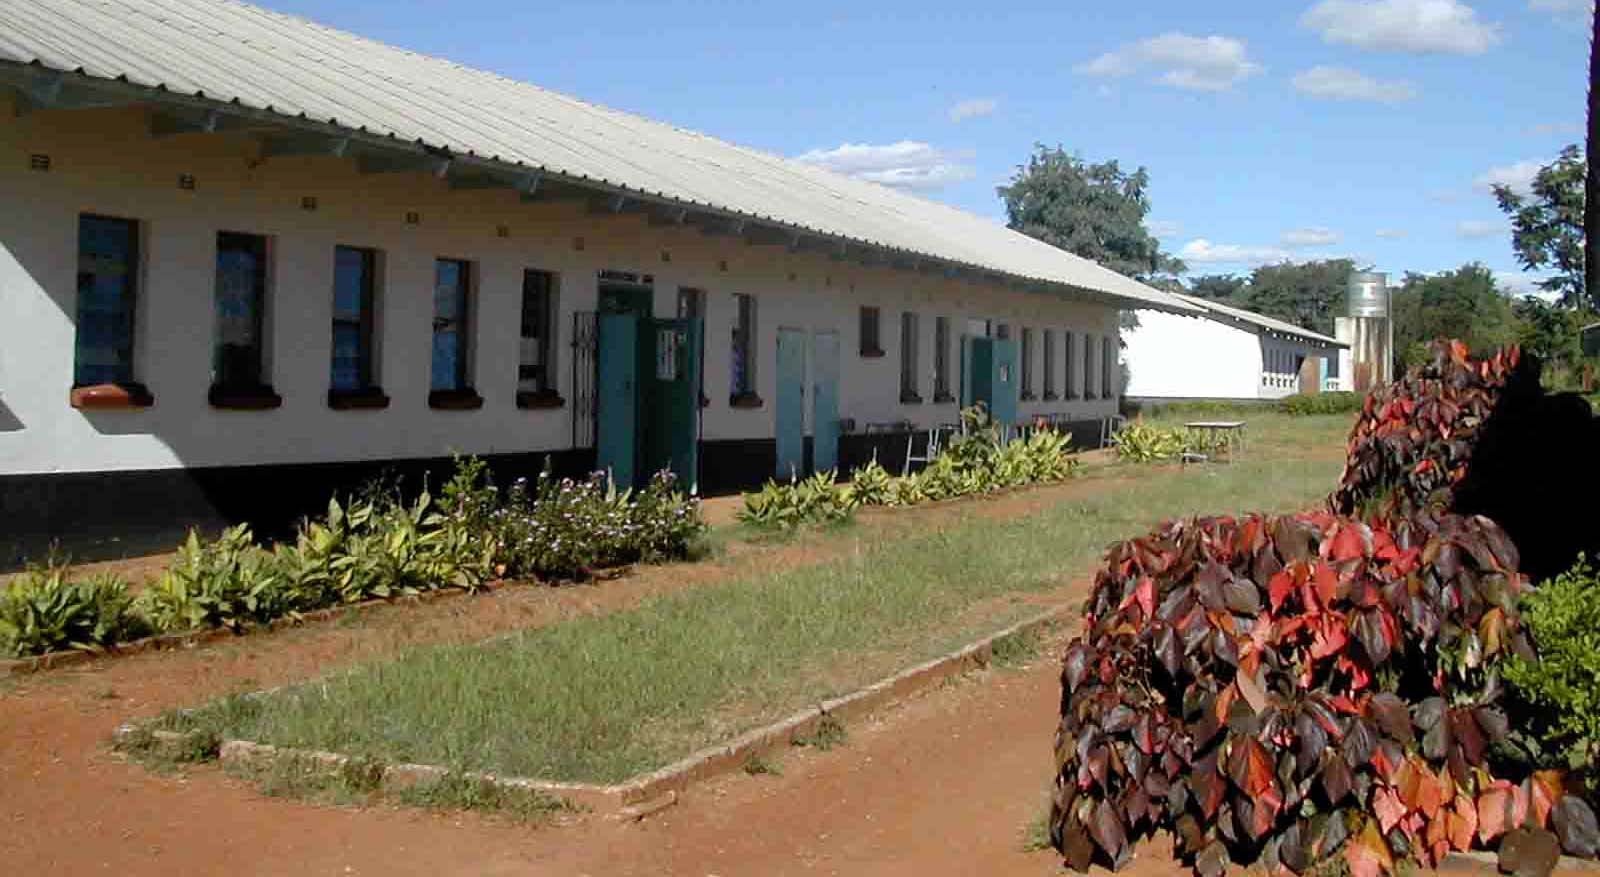
The second place for examinations was in Kwayedza secondary school. The facilities
were very similar. Participants from Glasgow mill, Summit mill, Lilly, Jani and King Chin
were examined there.
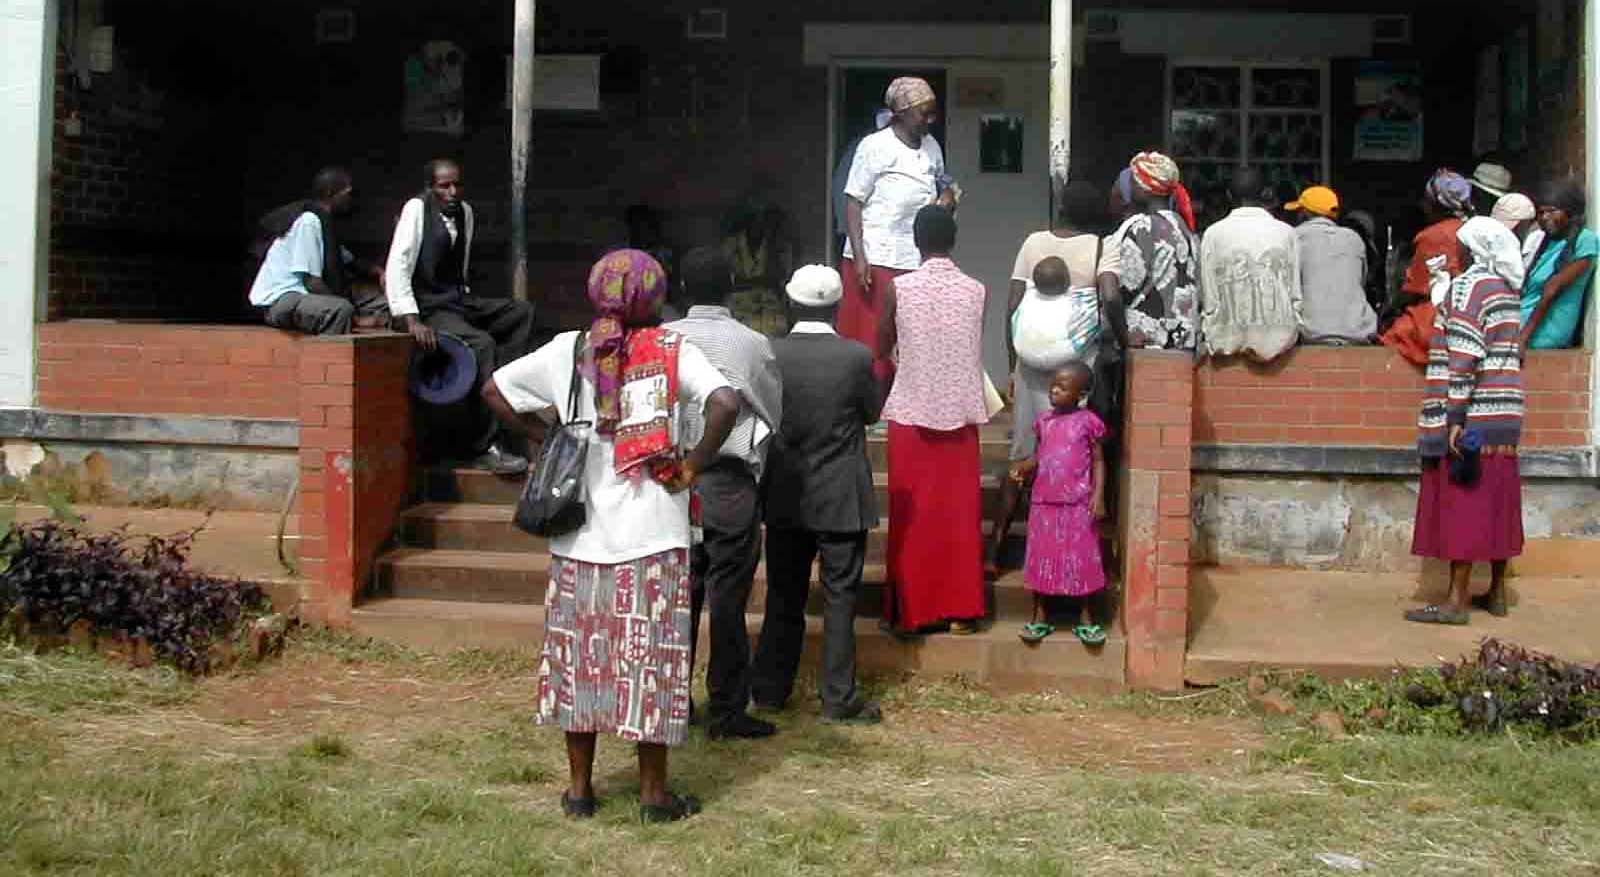
Picture 13 - Kwayedza school.
Final Report
23
Health Assessment Kadoma, Zimbabwe
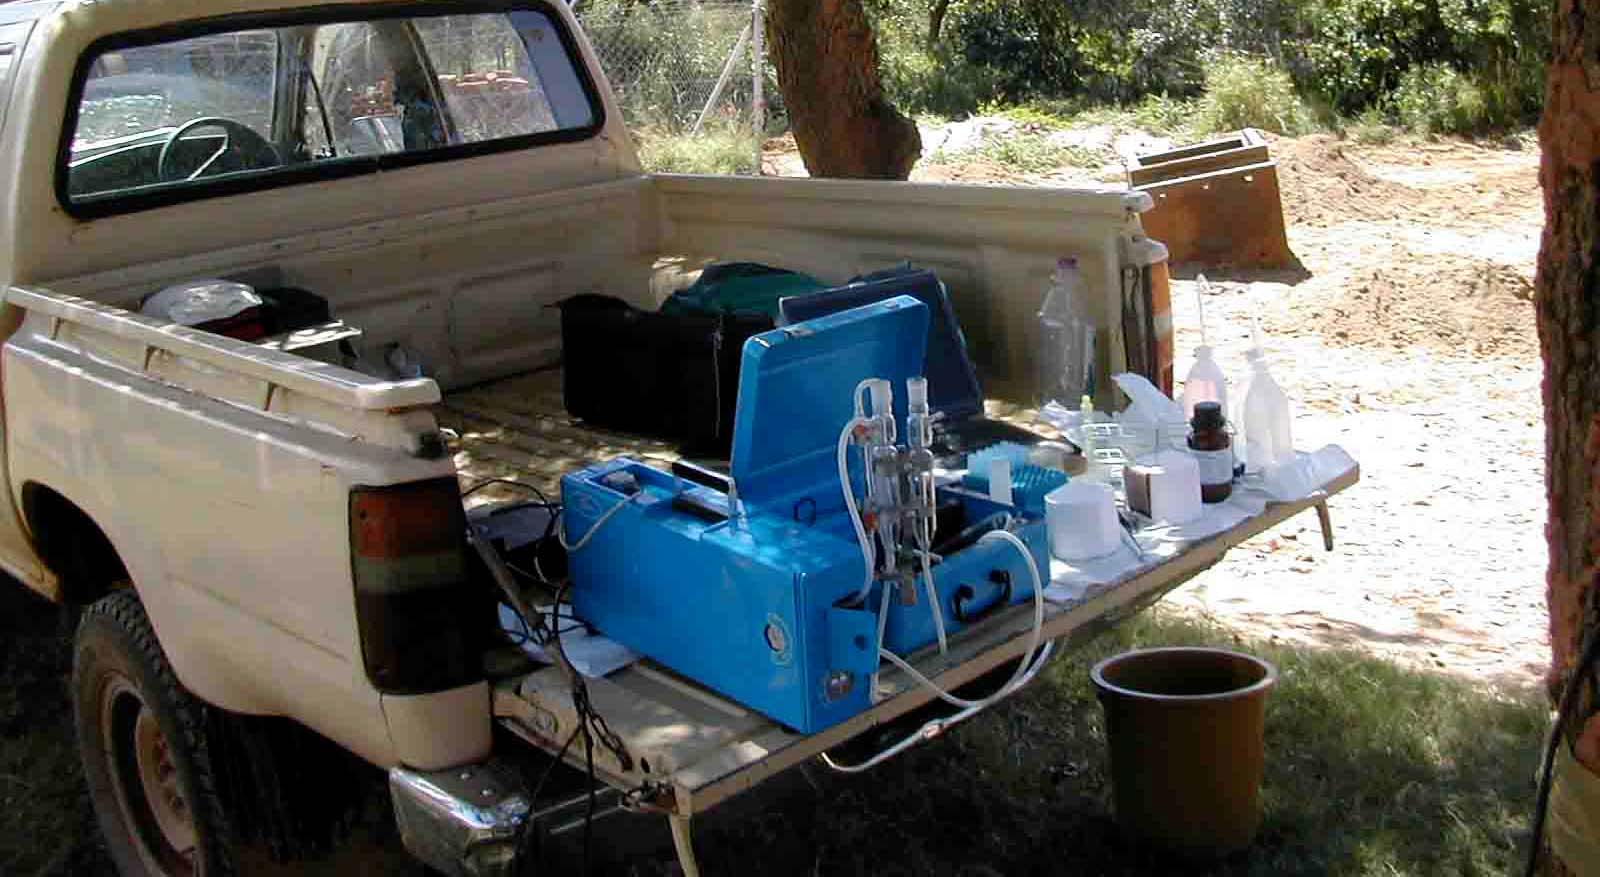
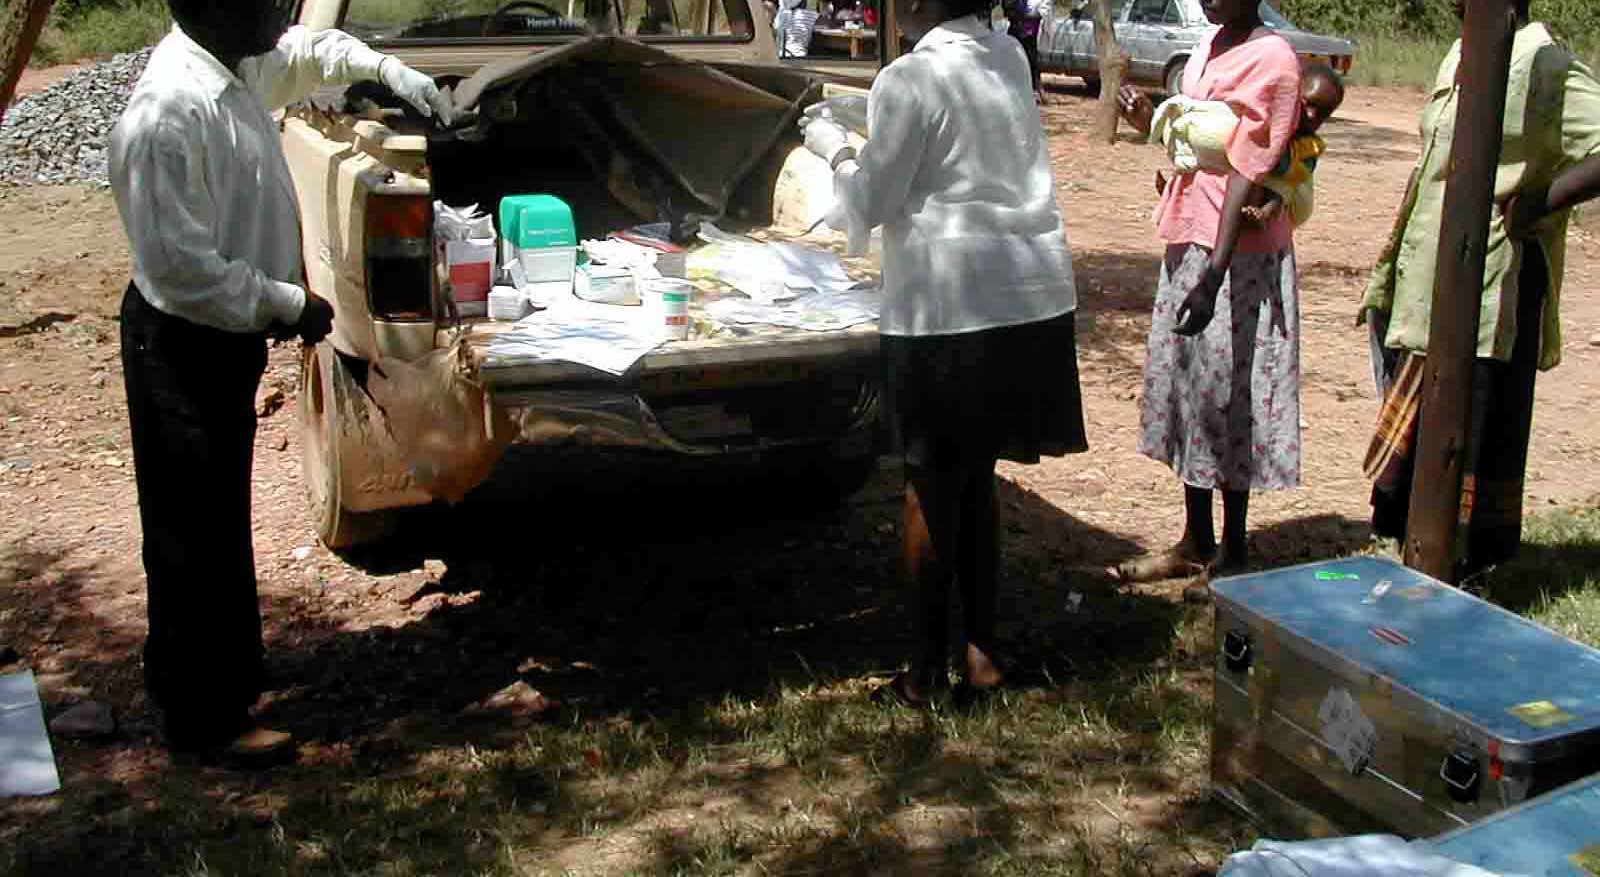
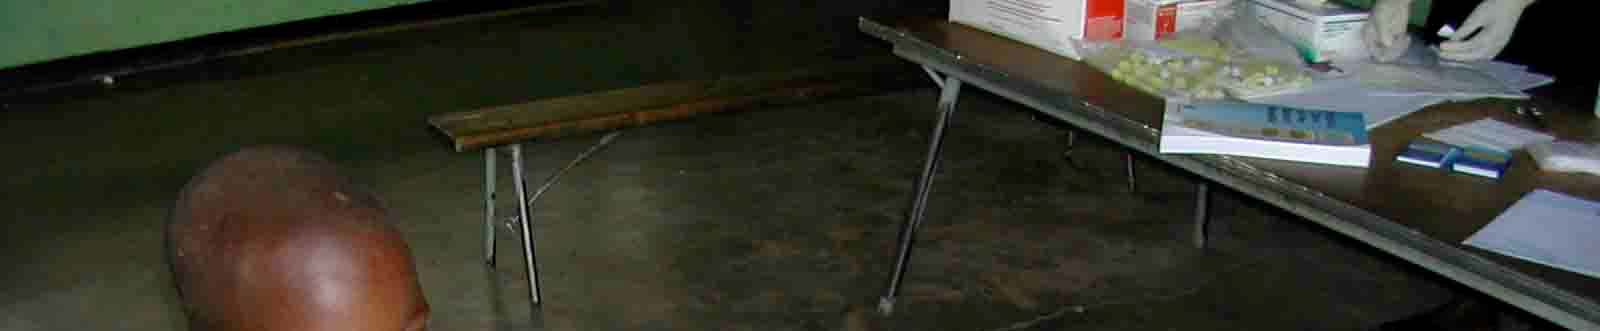
One day the examinations took place in the open. On the mining compound of Amber
Rose mill the equipment was set up onto the two pick-ups, local electricity was used. It
was possible to work there, but the conditions were not as appropriate as in the
schools. Mainly the laboratory equipment was sensitive to the high concentration of
mercury within the area. On the other hand it was much easier for the participants from
the village to see what a health assessment means, and not to be transported
somewhere.
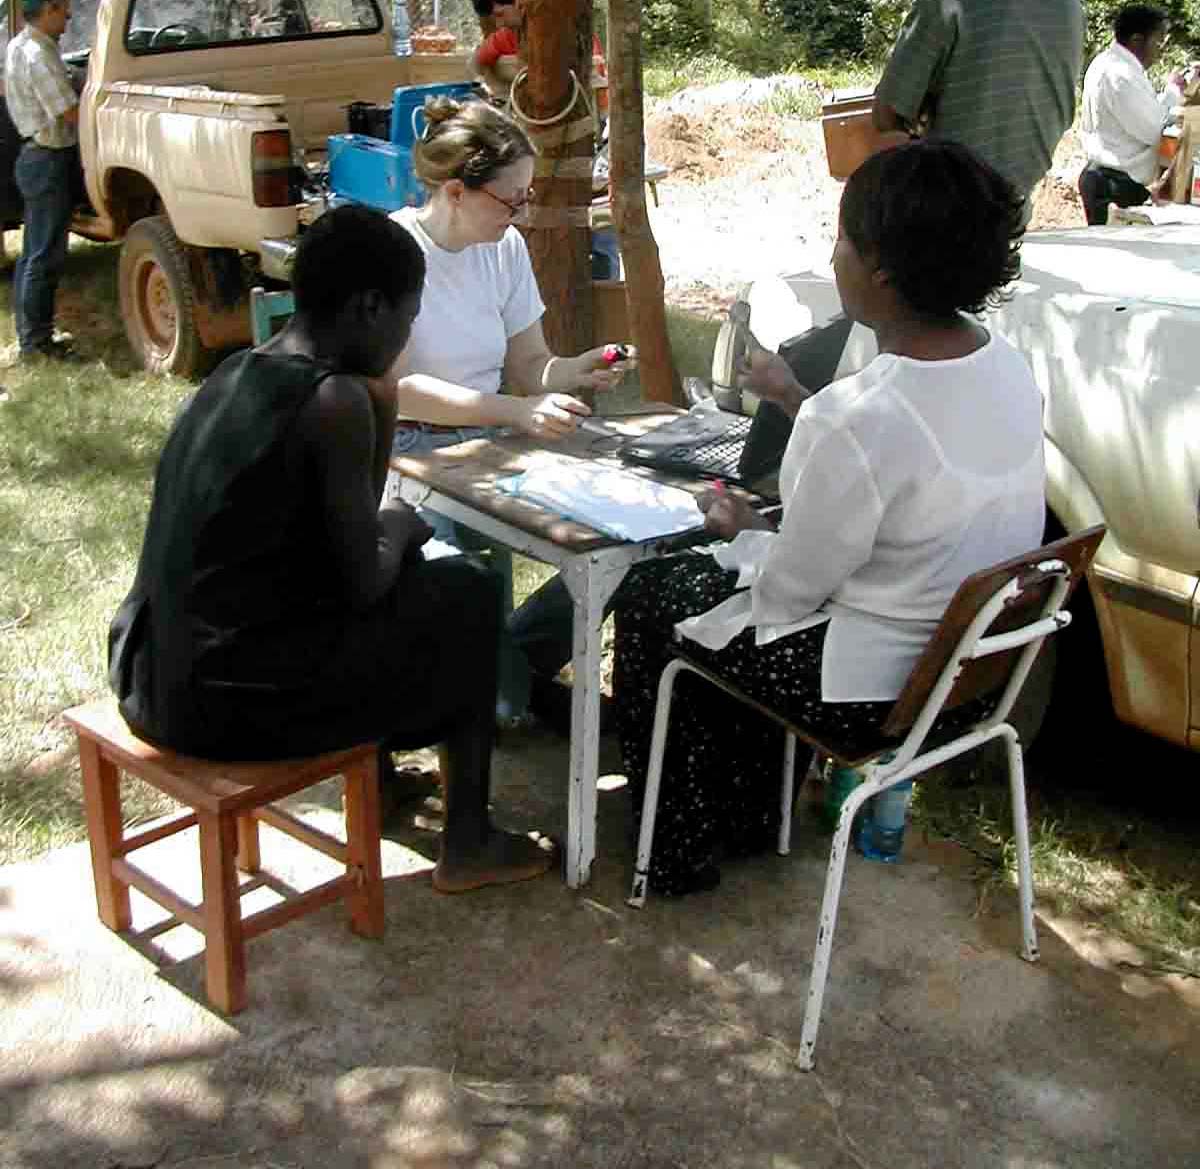
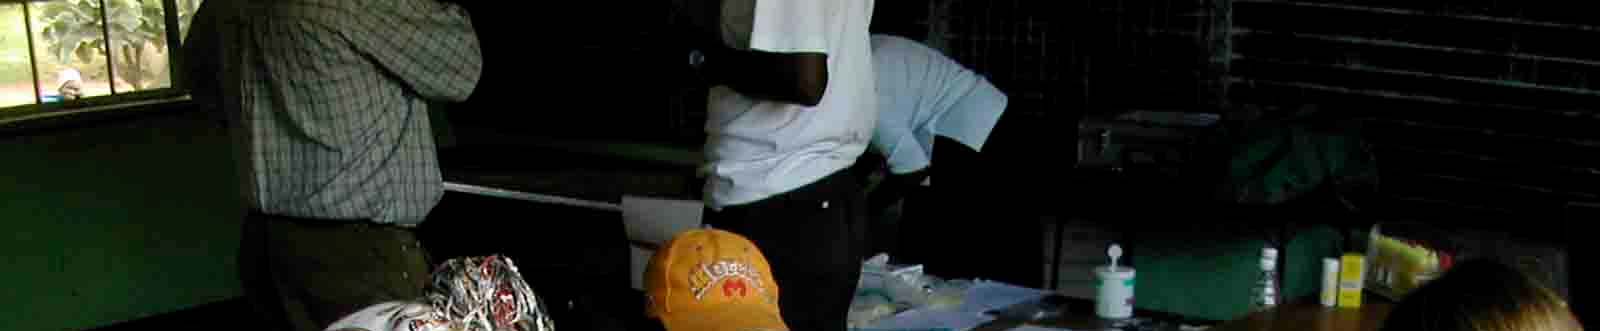
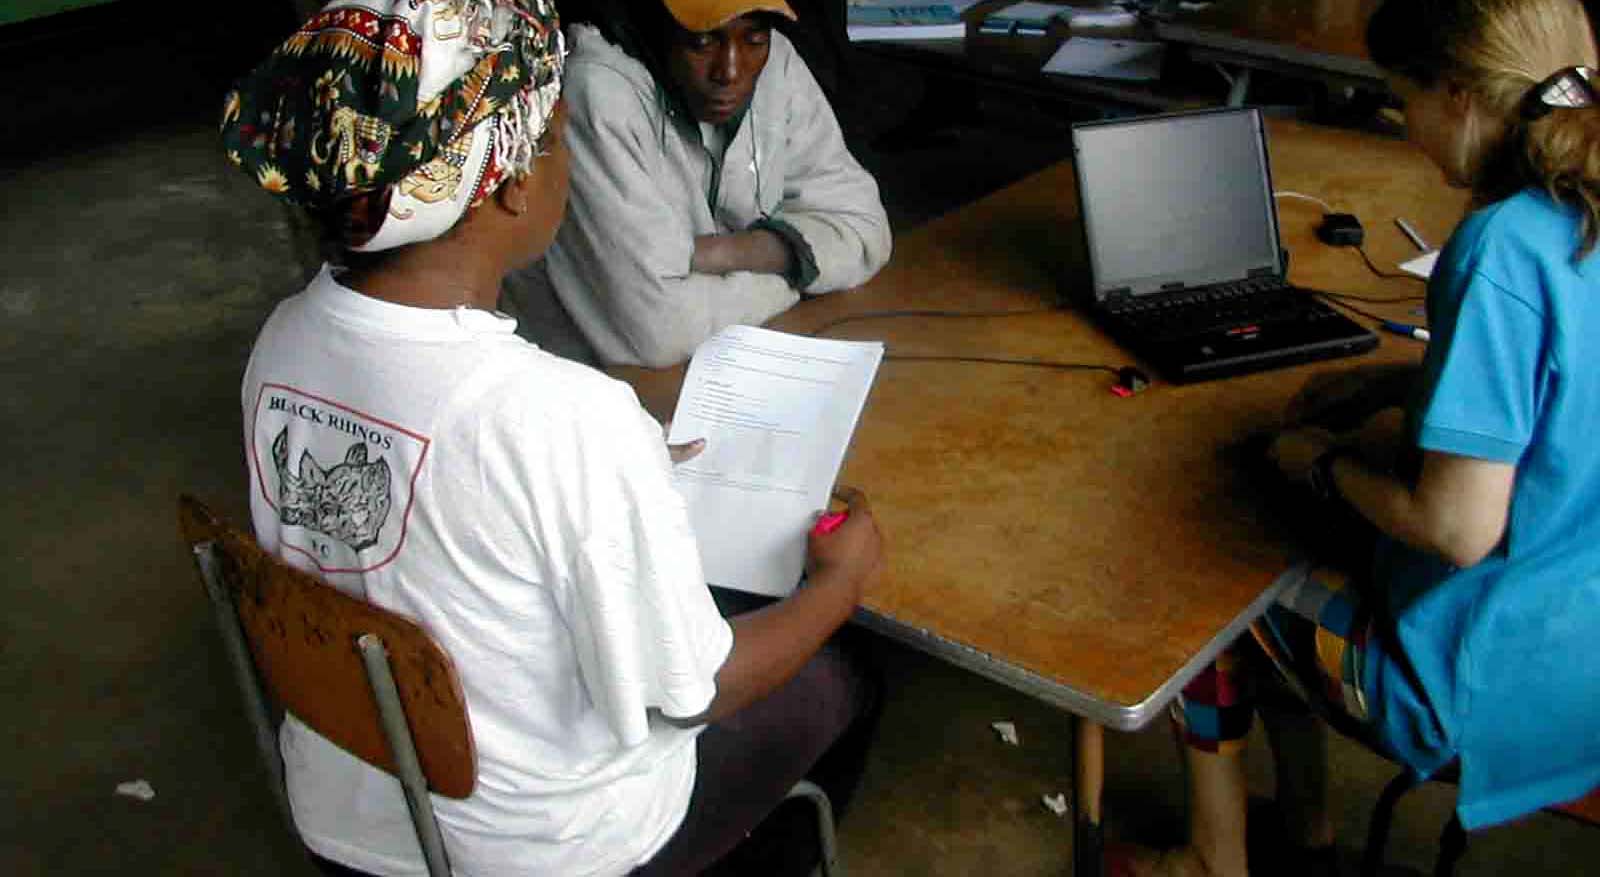
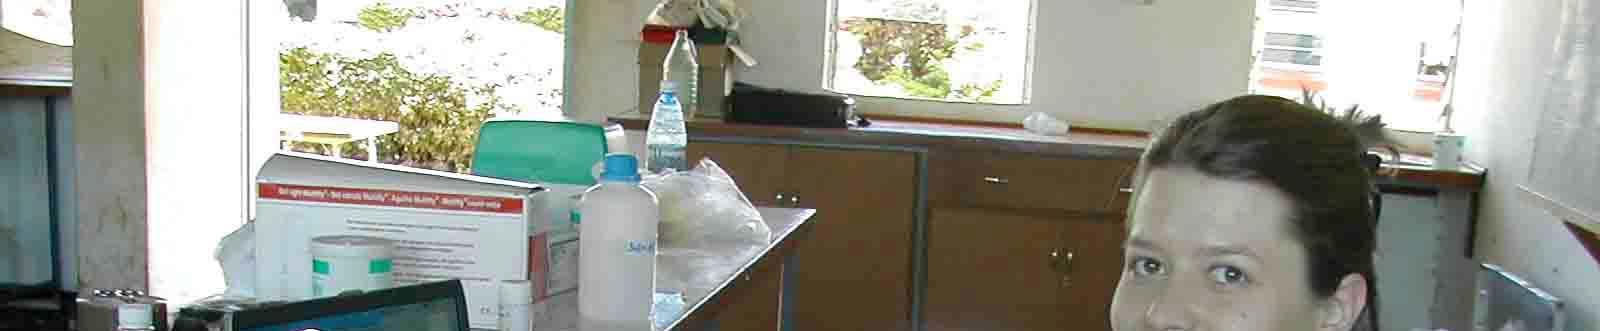
Picture 14 - Mobile field clinic at Amber Rose mill neuro-psychological testing;
history; laboratory; blood sampling.
24
Final Report
Health Assessment Kadoma, Zimbabwe
The control group was examined in Chikwaka. The same method was used, but the
nurses were new. The local health unit supported us. Chikwaka is more than 100 km
away from the mining area, and mercury is not used there.
Blood, urine and hair will be analyzed for mercury at the University of Munich,
Germany.
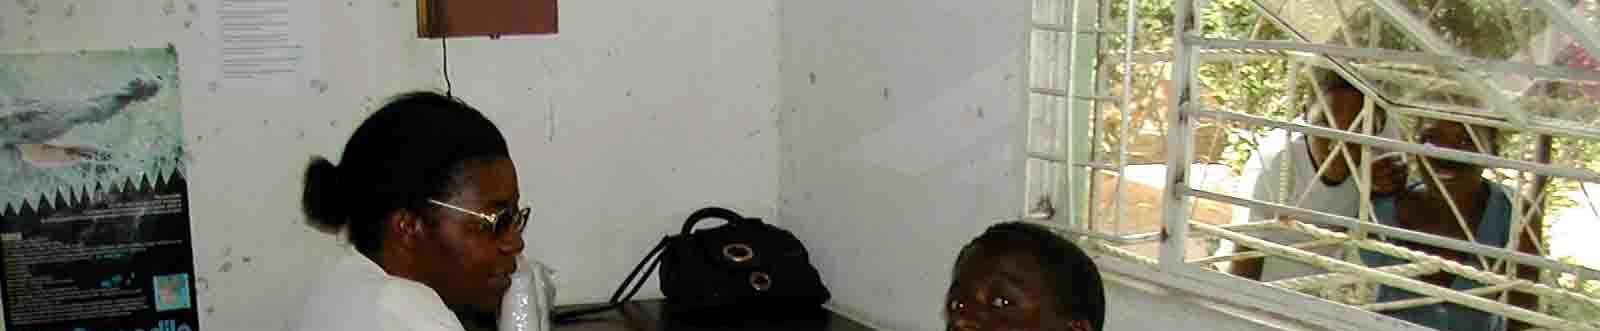
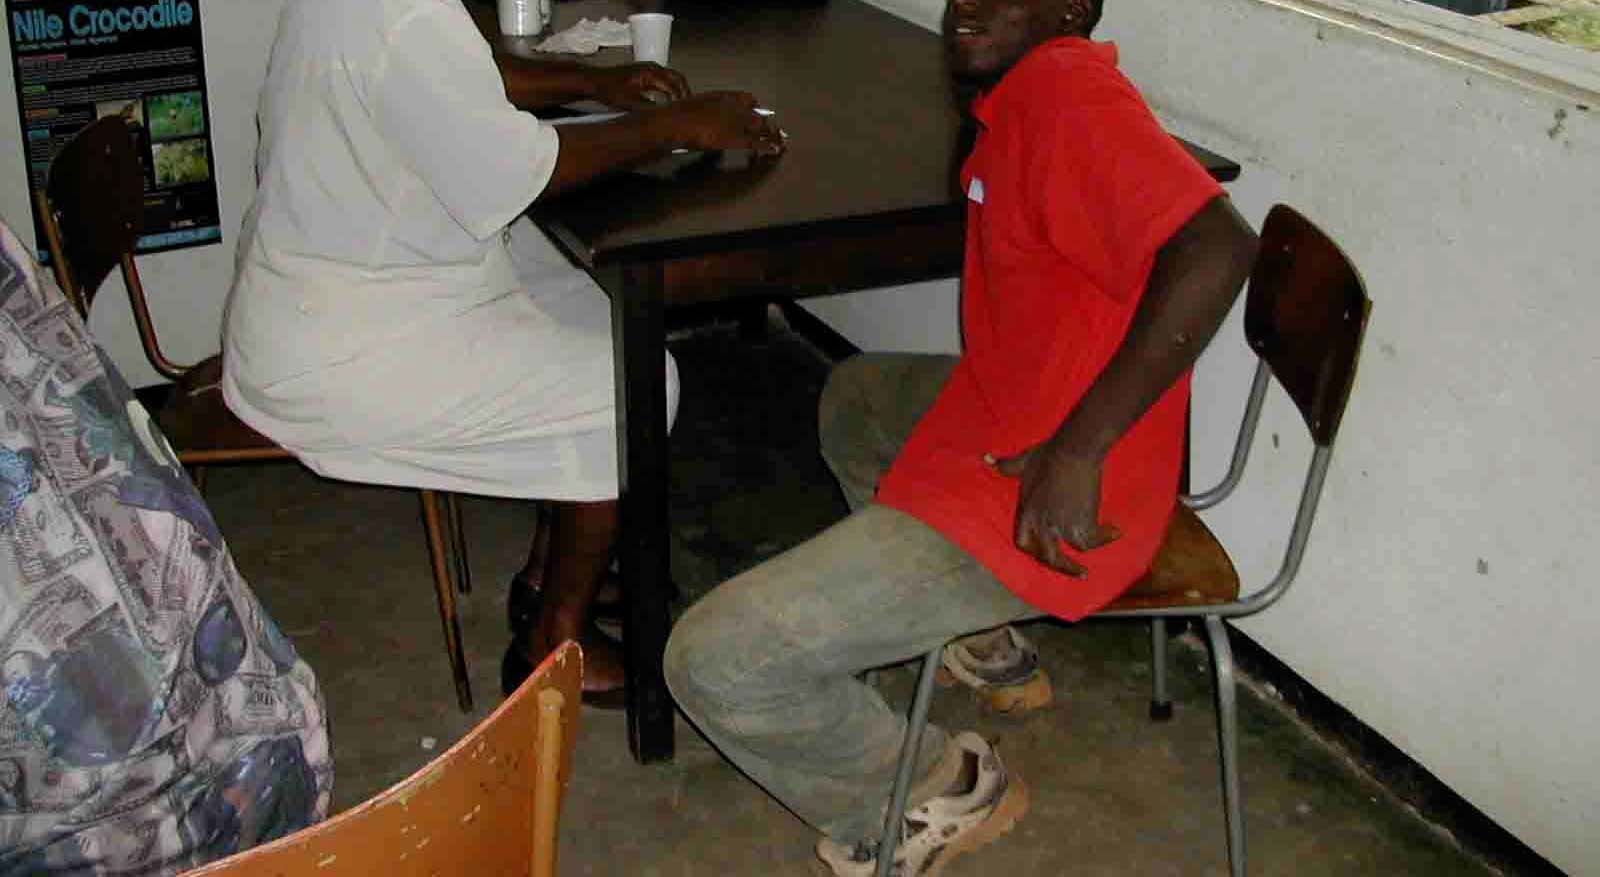
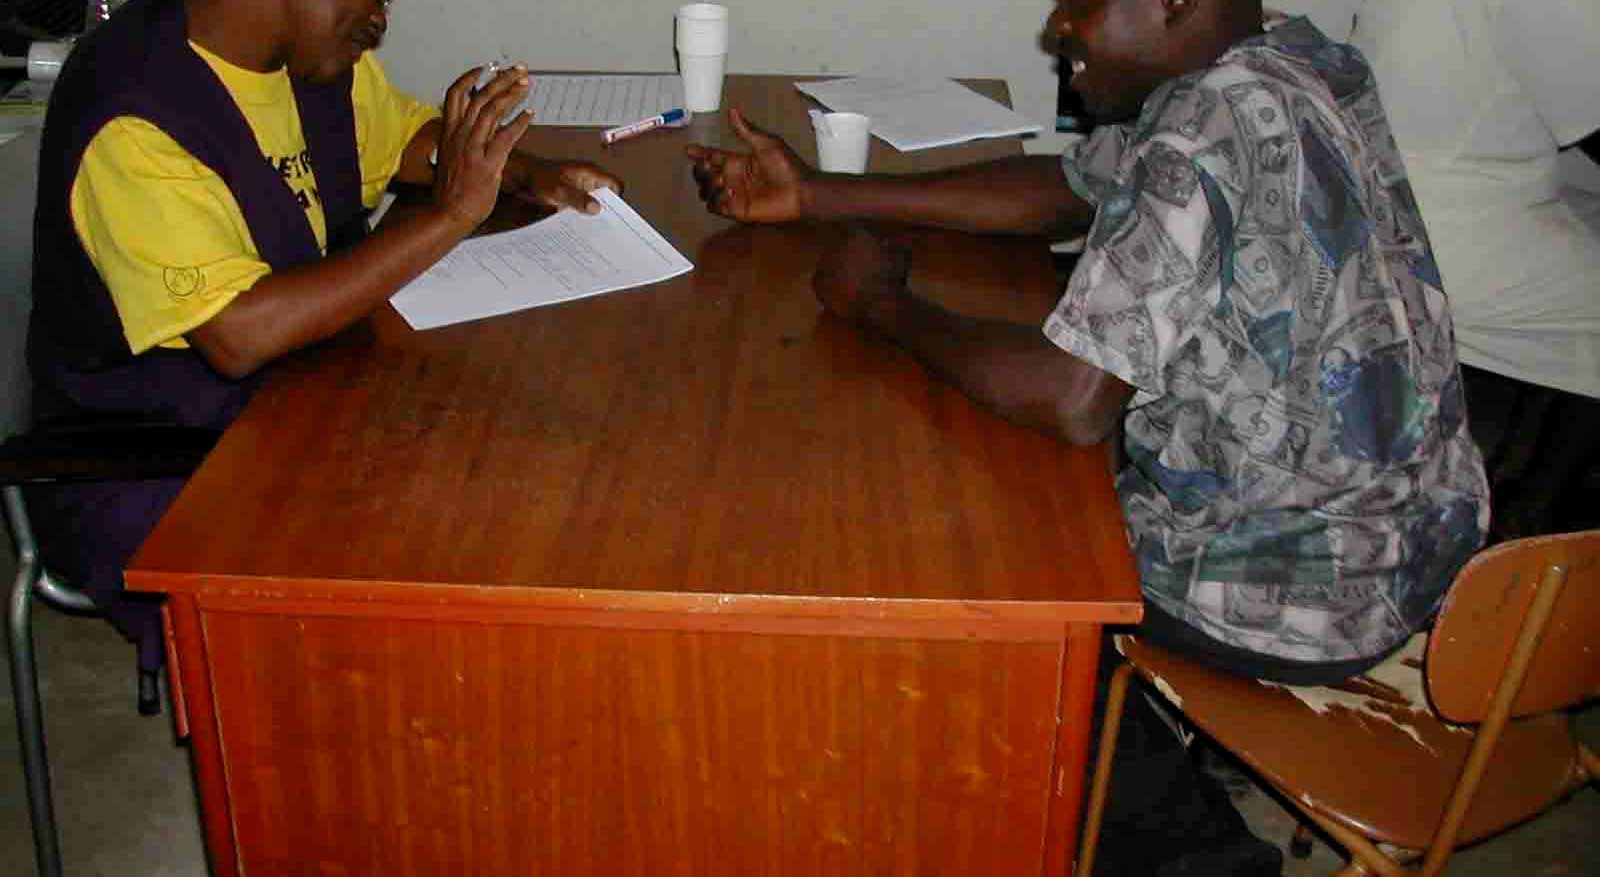
2.4.1. Questionnaire
The participants filled in a questionnaire with assistance from the nurses. Questions
included:
Working with mercury or with mercury polluted tailings?
Burning amalgam in the open?
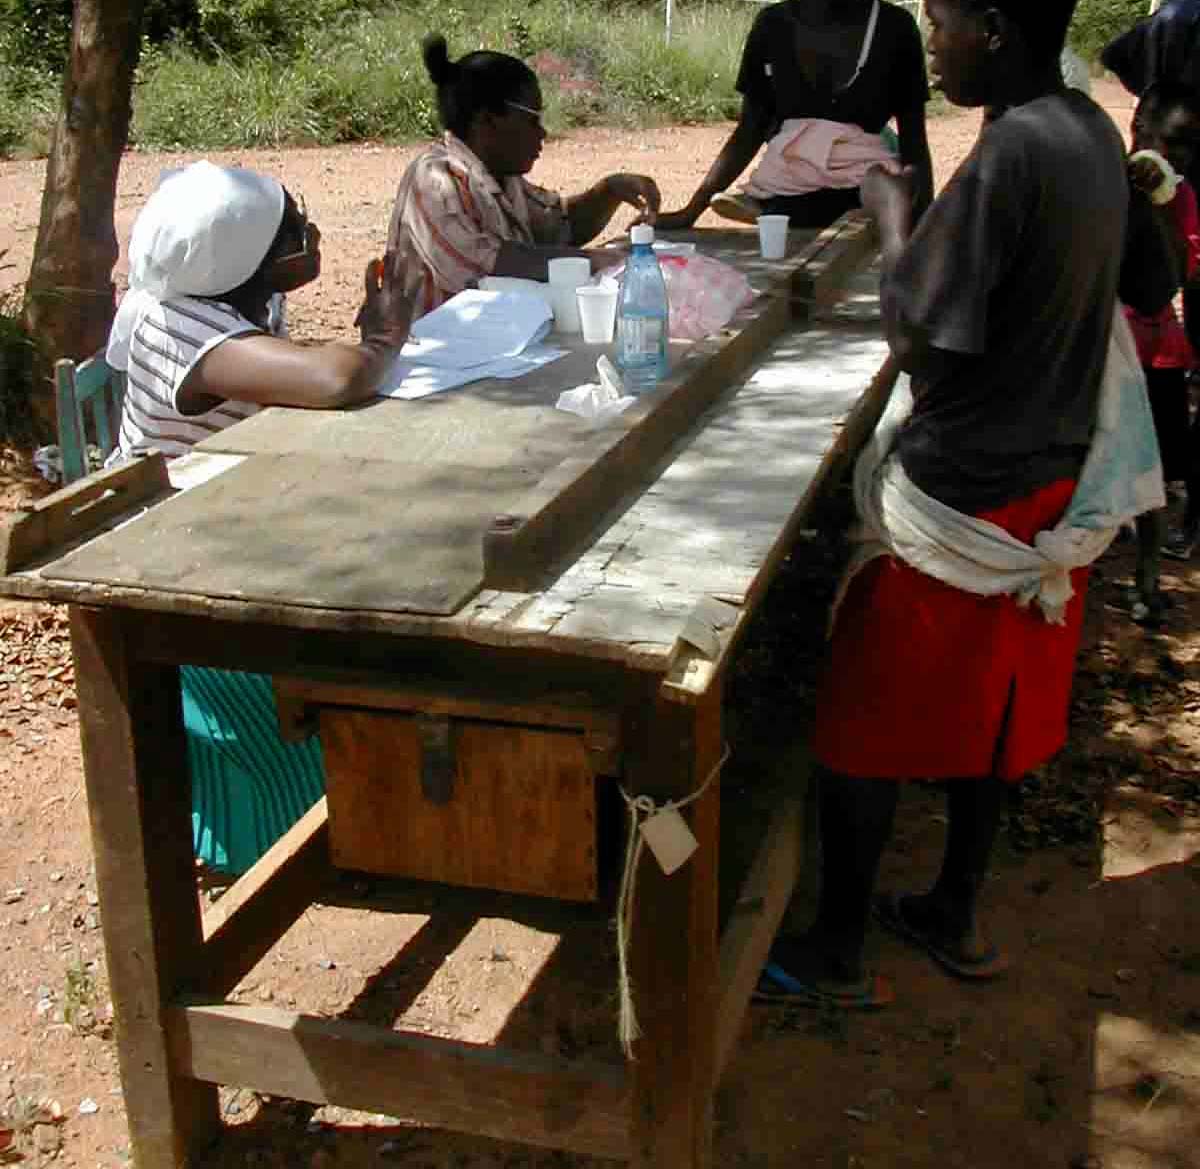
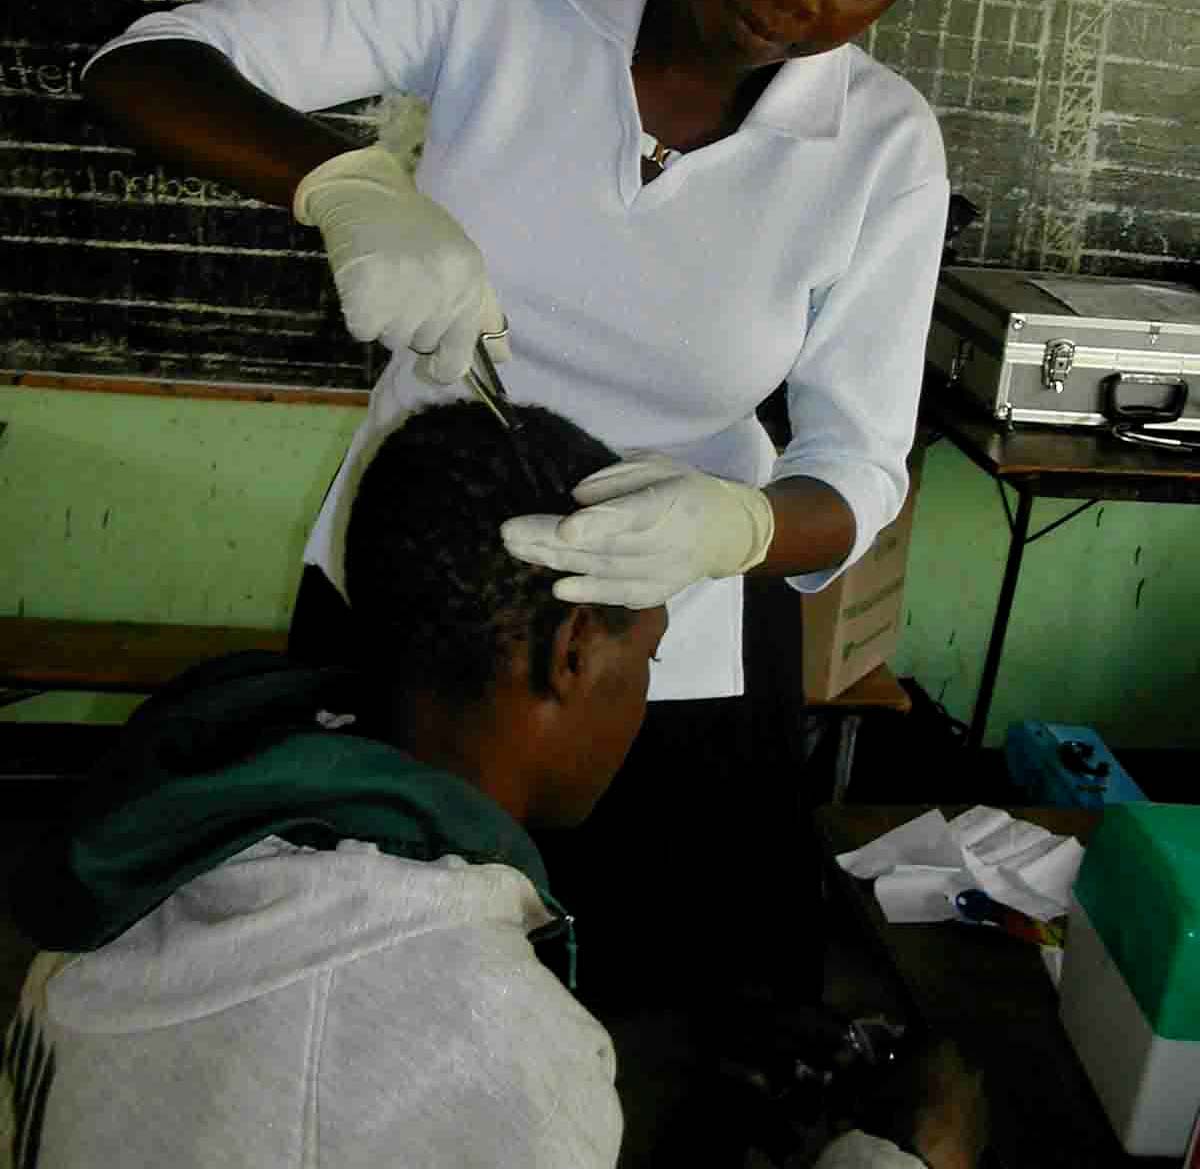
Picture 15 - Nurses taking the history.
- Melting gold in the open or with inadequate fume hoods?
- Drinking
alcohol?
- Having a kind of a metallic taste?
- Suffering from excessive salivation?
- Problems with tremor / shaking at work?
- Sleeping
problems?
2.4.2. Neurological examination
All participants were clinically, mainly neurologically examined. Results were mainly
primarily scored according to ,,Skalen und Scores in der Neurologie" (Masur, 2000):
Final Report
25

Health Assessment Kadoma, Zimbabwe
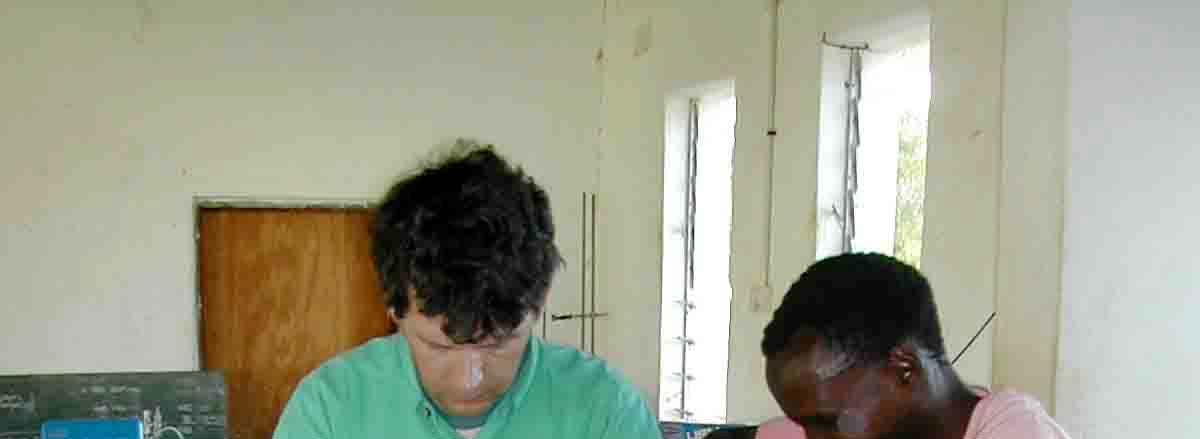
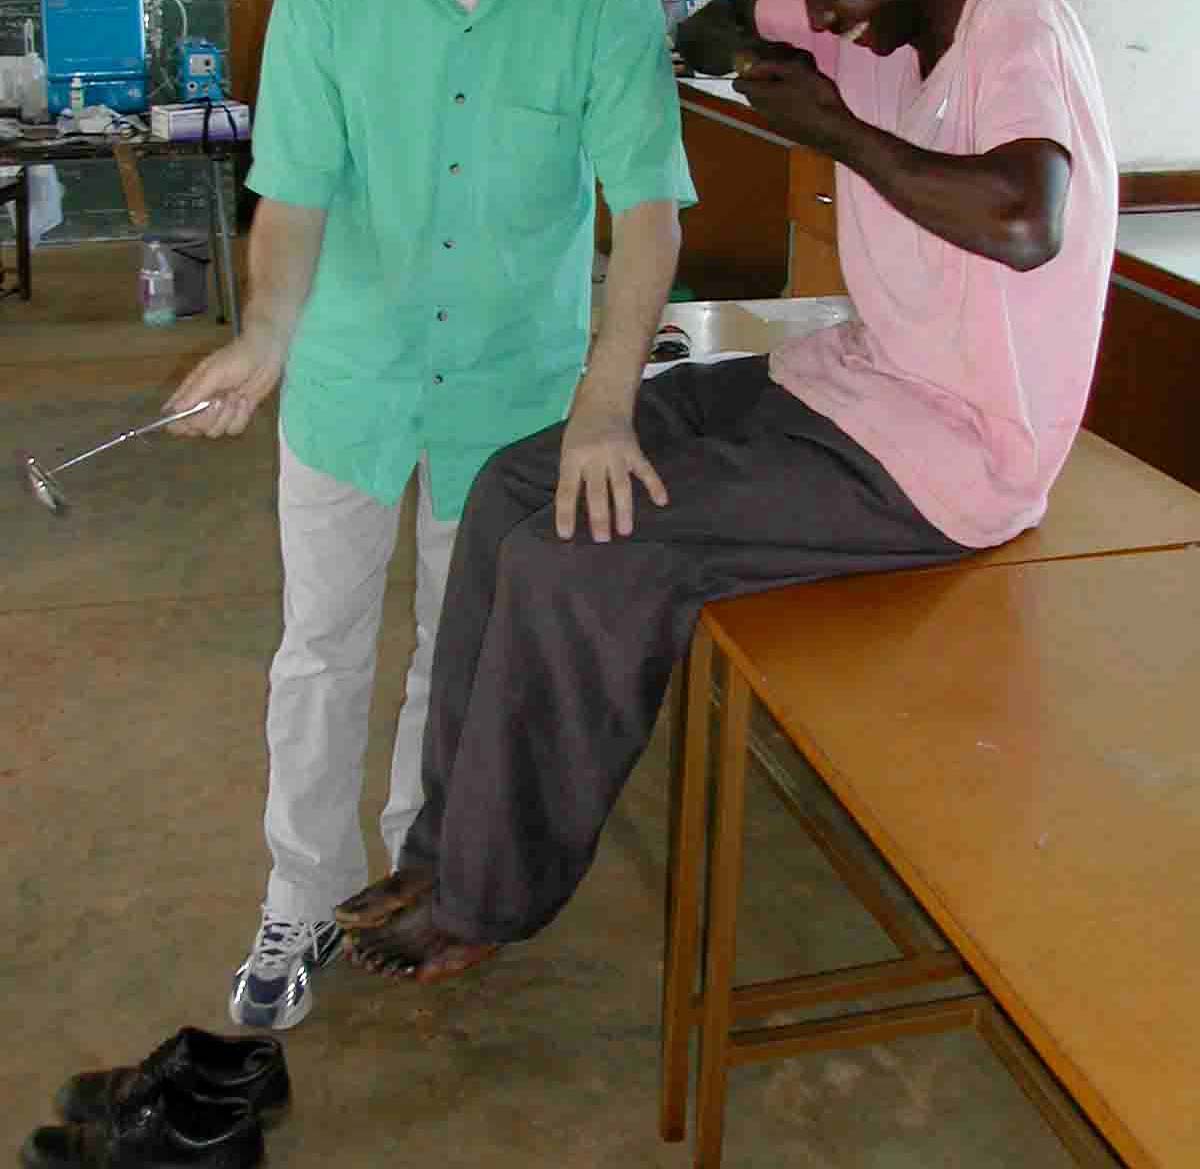
Picture 16 - Neurological examination (PSR reflex; finger-finger-nose test).
26
Final Report
Health Assessment Kadoma, Zimbabwe
- Signs of bluish discoloration of gums,
- Rigidity, ataxia and tremor,
- Test of alternating movements or test for dysdiadochokinesia,
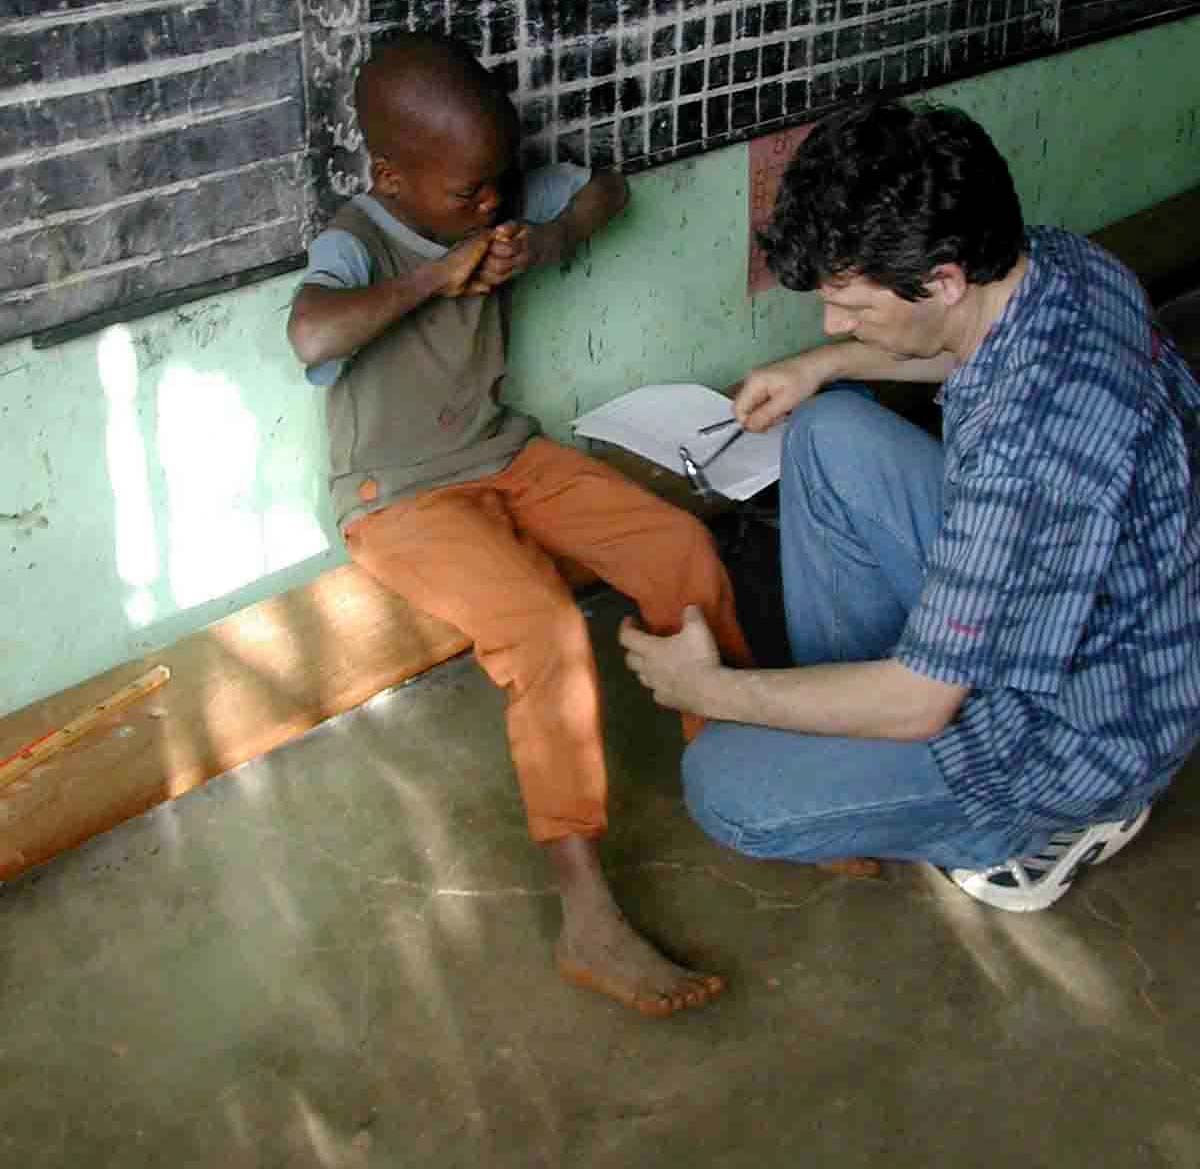
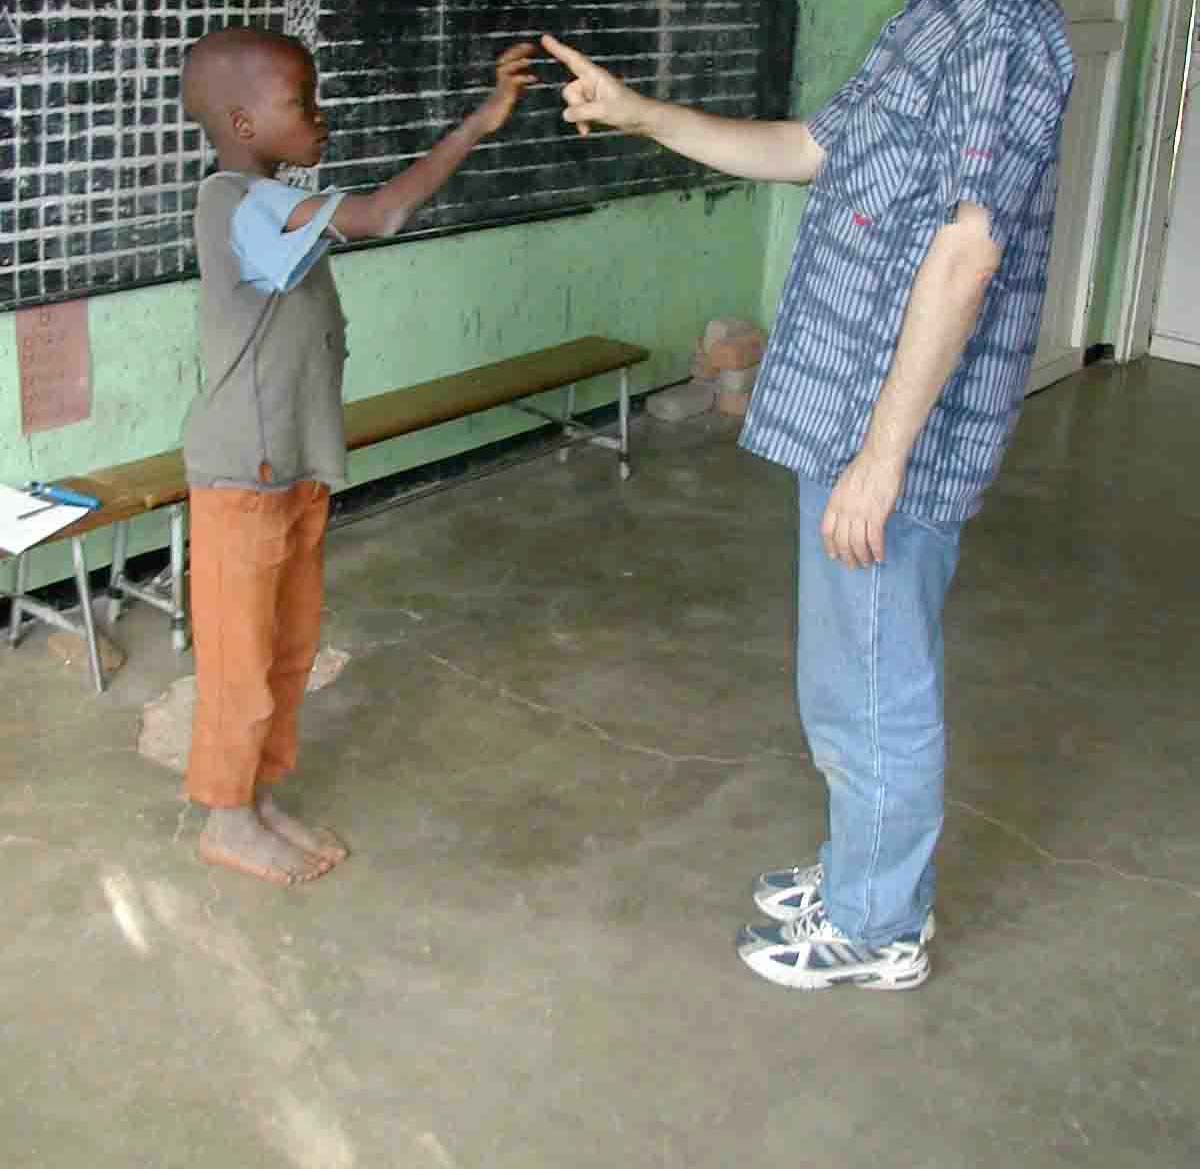
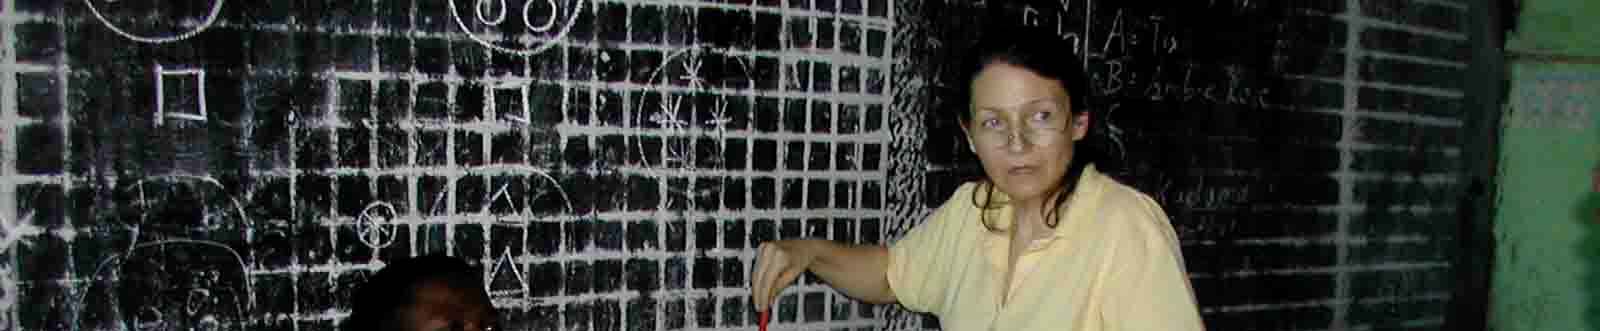
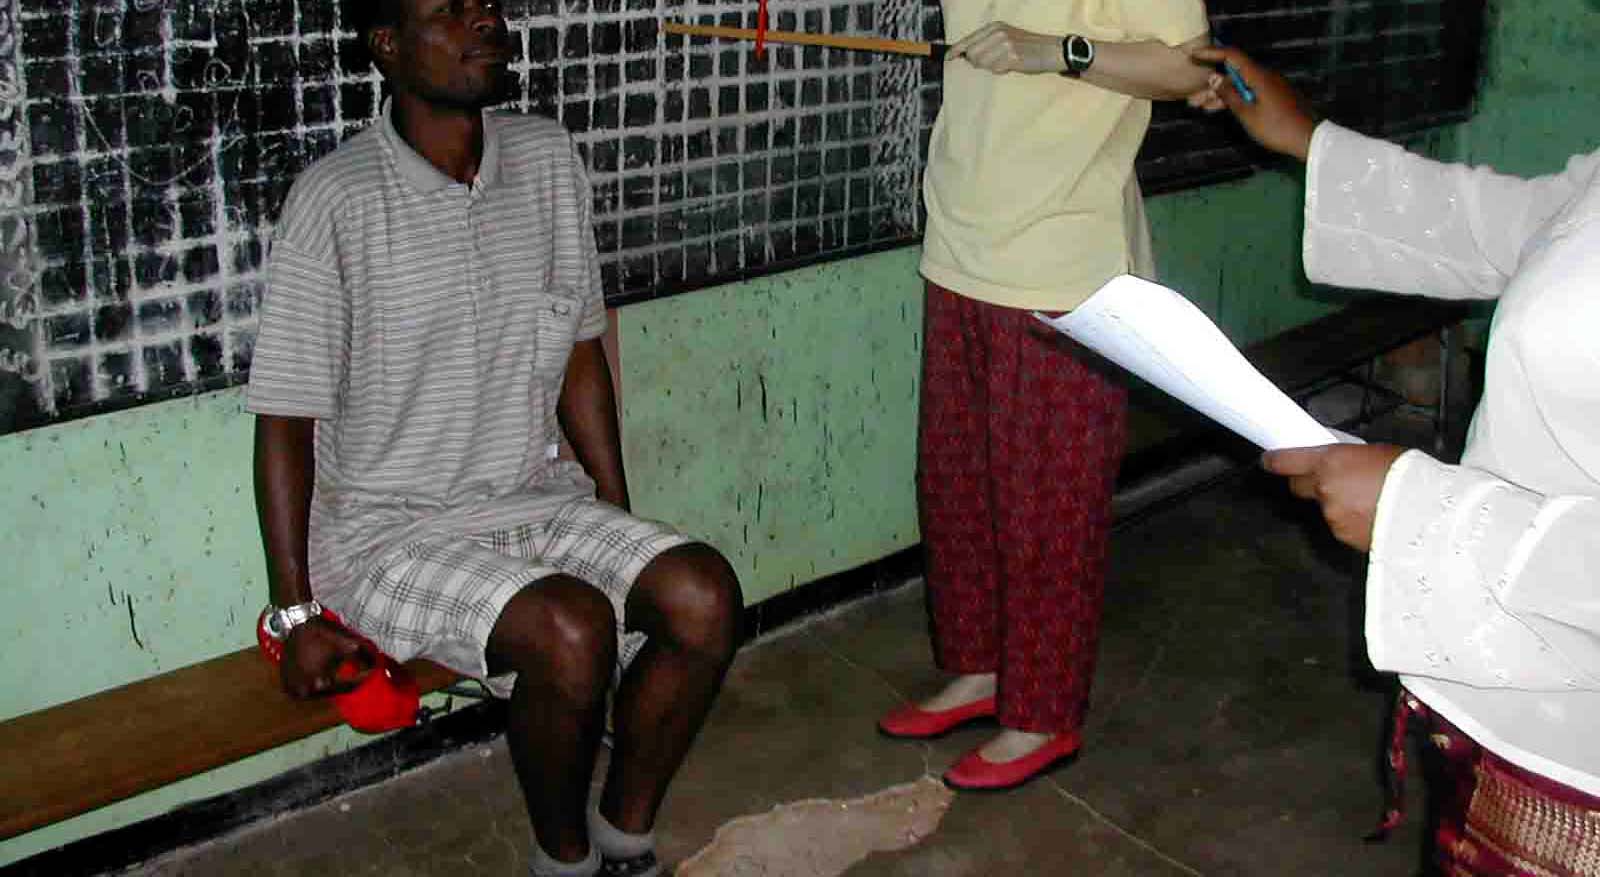
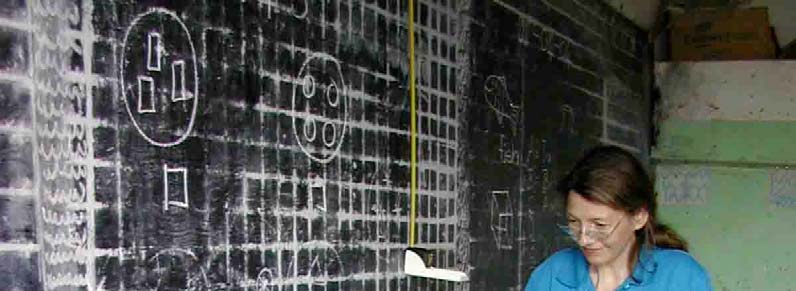
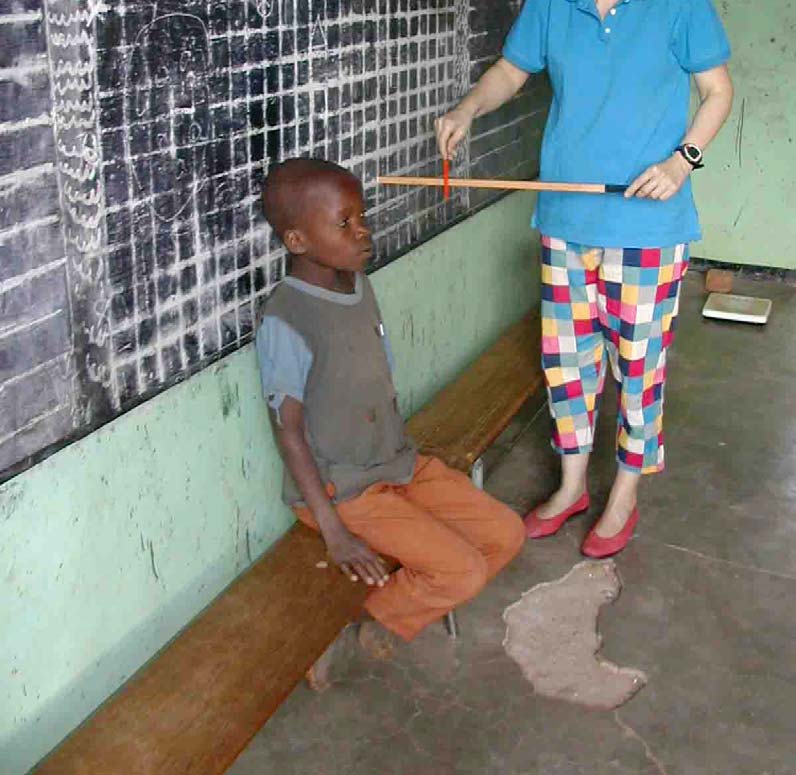
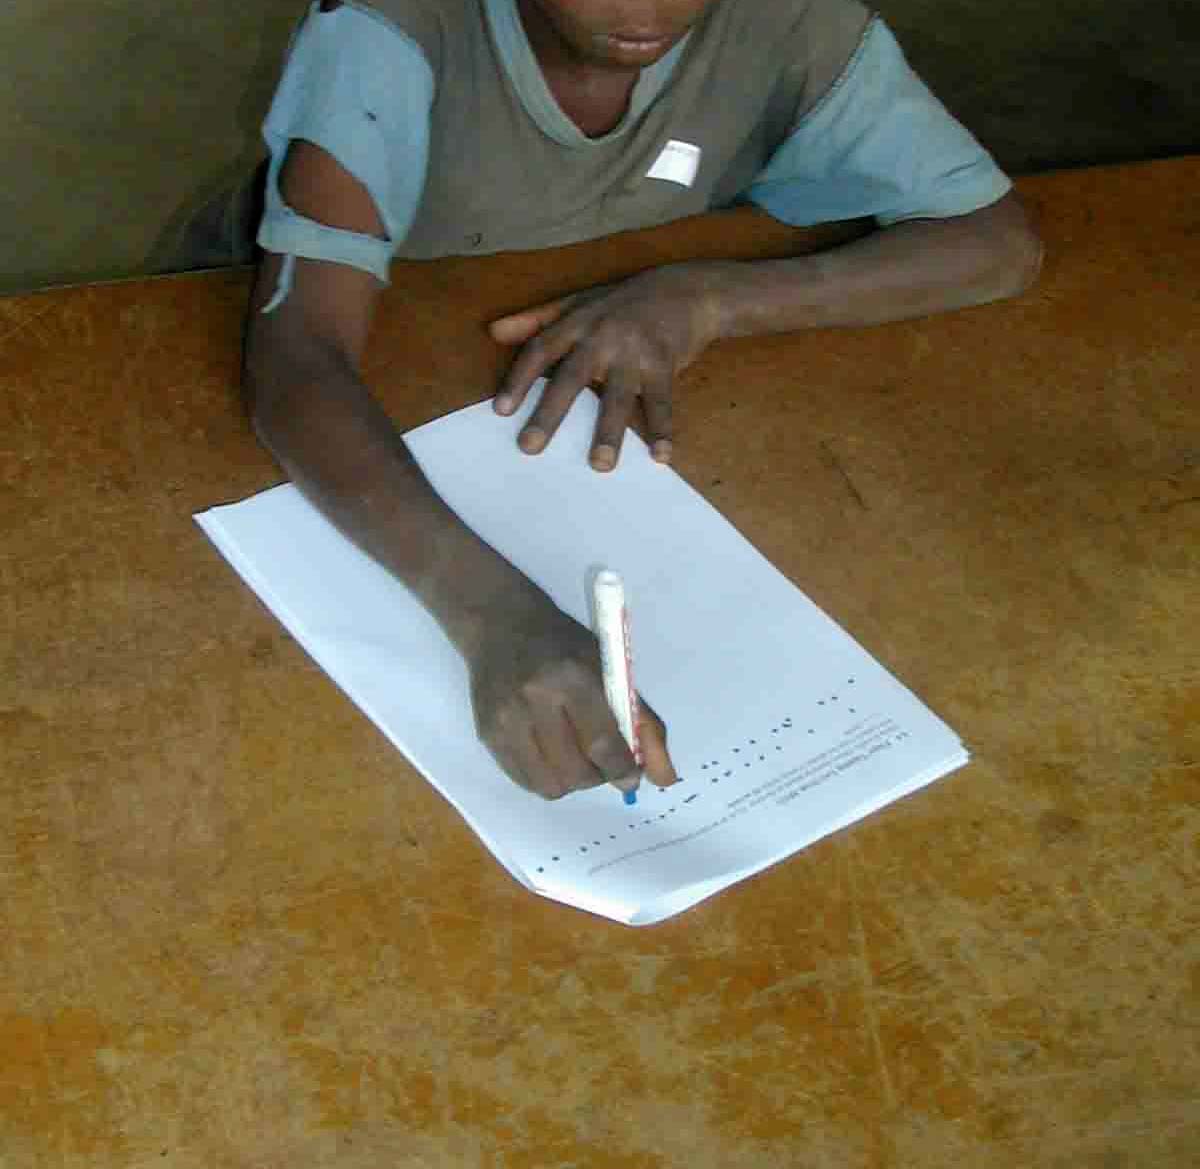
Picture 17 - Visual field test
- Reflexes: knee jerk reflex and biceps reflex.
- Pathological reflexes: Babinski reflex and mento-labial reflex.
- Sensory
examination.
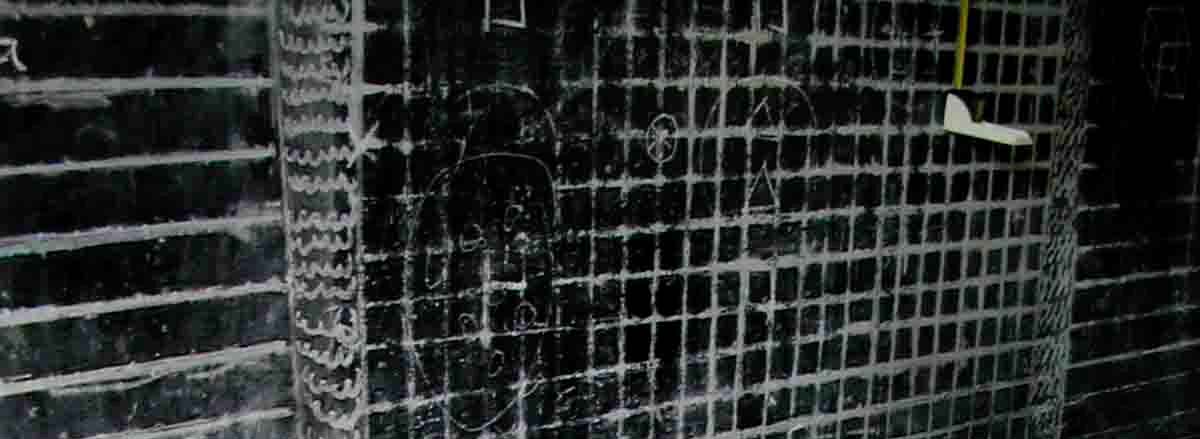
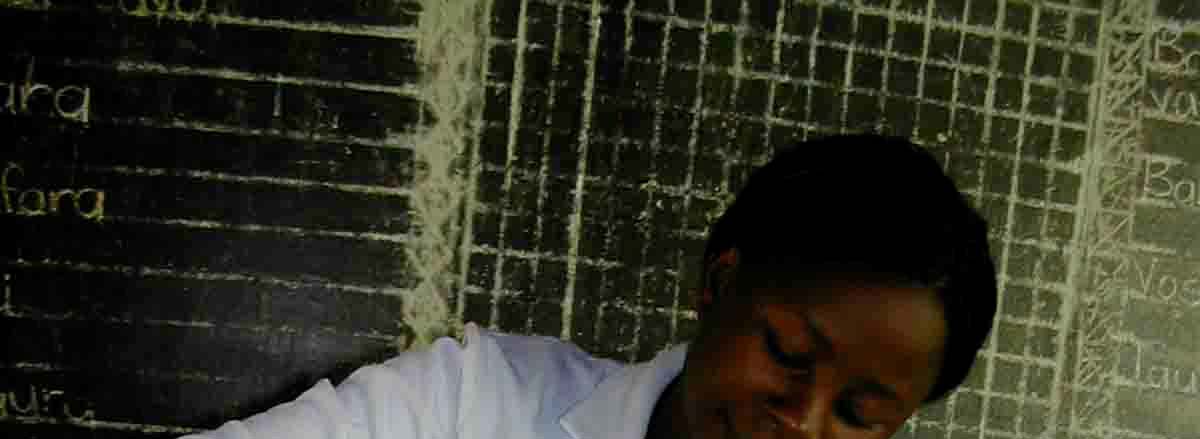
- Test of the field of vision 1.
2.4.3. Neuro-psychological testing
The following tests were carried out (Zimmer, 1984 ; Lockowandt, 1995 ; Masur, 2000):
- Memory disturbances: Digit span test (Part of Wechsler Memory Scale) to test the
short term memory.
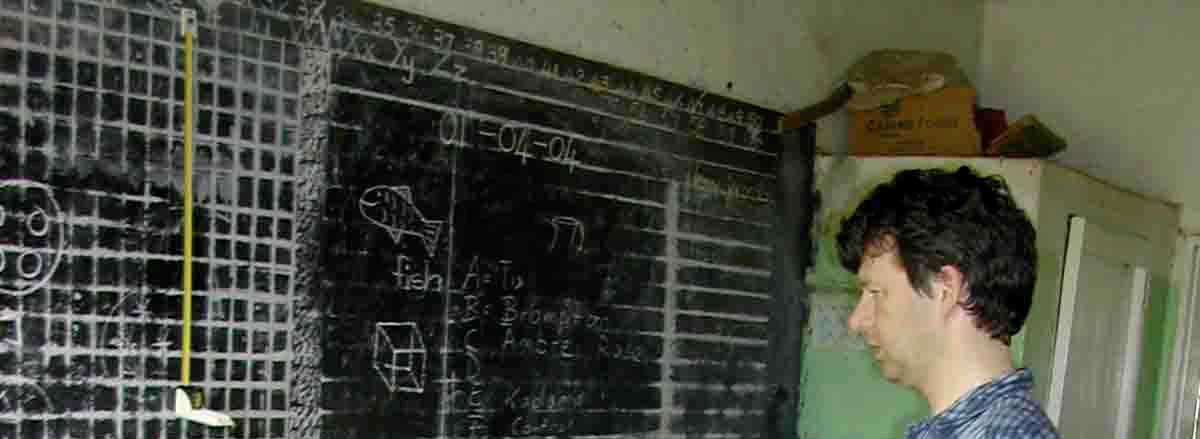
1 The visual field was measured in a very simple way without the need of any electricity: The test person
was sitting in front of a blackboard, when the examination took place in a school building, or in front of a
wall at the examination site out in the field. The person was asked to keep her head leaned on the
blackboard/ wall, where a line of 50 cm had been drawn to the right and to the left from a point in the
middle of the back of her head. Also the distance between the blackboard/ wall and the outer corner of the
person's eye had been measured (cal ed "base line" in the test). Then an inch rule was hold onto the 50
cm point at the right in a 90 degree angle to the blackboard/ wall on level with the person's right eye and a
red ballpoint pen was moved along this ruler until the test person said: "stop!" to show, that the pen
entered her visual field. The inches, in our case "centimetres", the ballpoint pen had been stopped, were
recorded. The same procedure had been performed at the left side of the person: The inch rule on the 50
cm point at the left in a 90 degree angle to the blackboard/ wall on level with the person's left eye, the red
ballpoint pen moved along the ruler until the test person said "stop!". With these parameters the visual field
afterwards can be calculated with mathematical methods.
Final Report
27
Health Assessment Kadoma, Zimbabwe
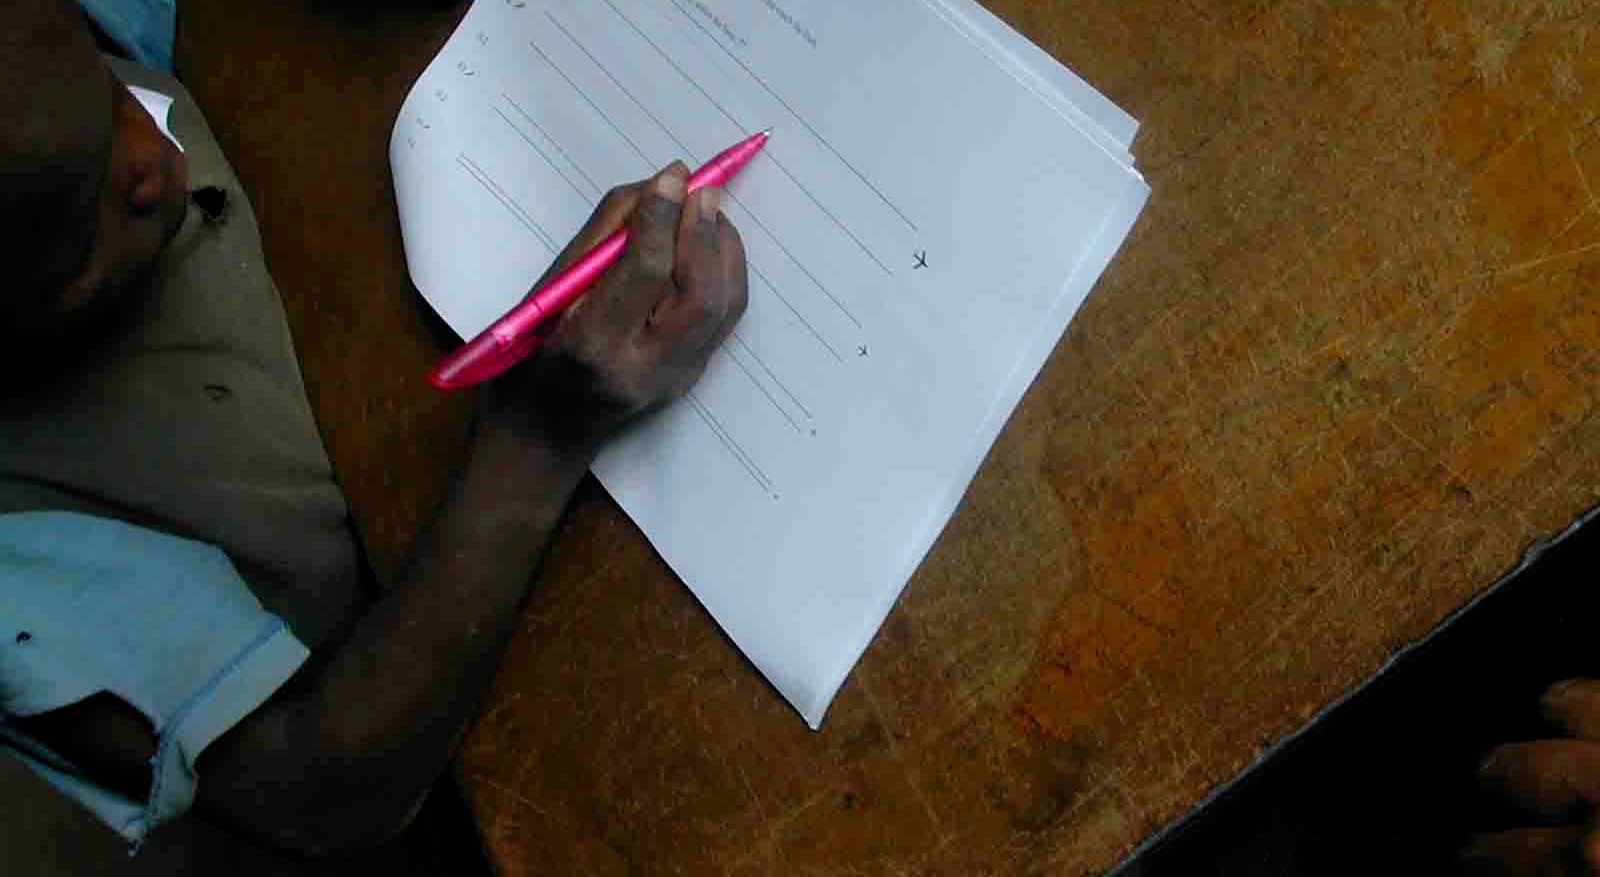
- Match Box Test (from MOT) to test co-ordination, intentional tremor and
concentration.
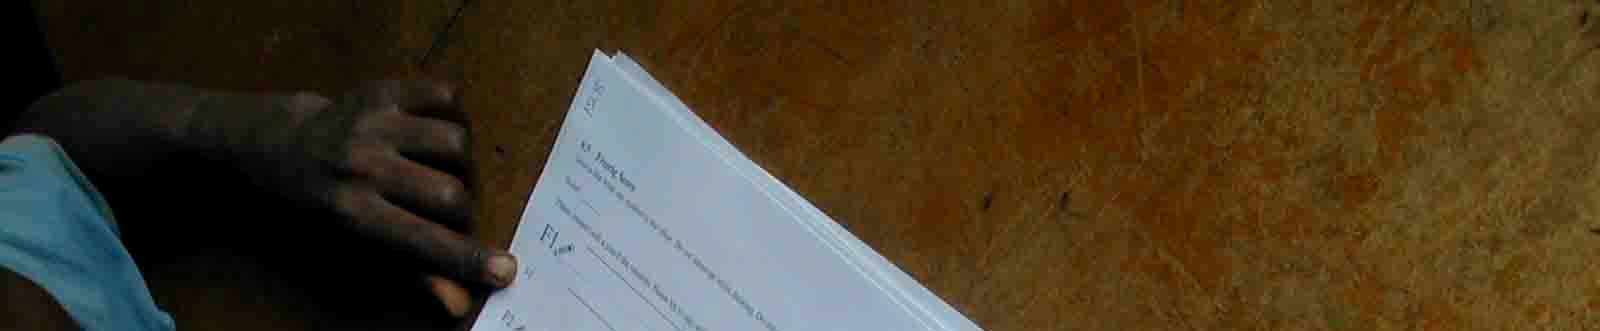
- Frostig Score (subtest Ia 1-9) to test tremor and visual-motoric capacities.
- Pencil Tapping Test (from MOT) to test intentional tremor and co-ordination.
Picture 18 - Match box text, memory test, pencil tapping test, Frostig test.
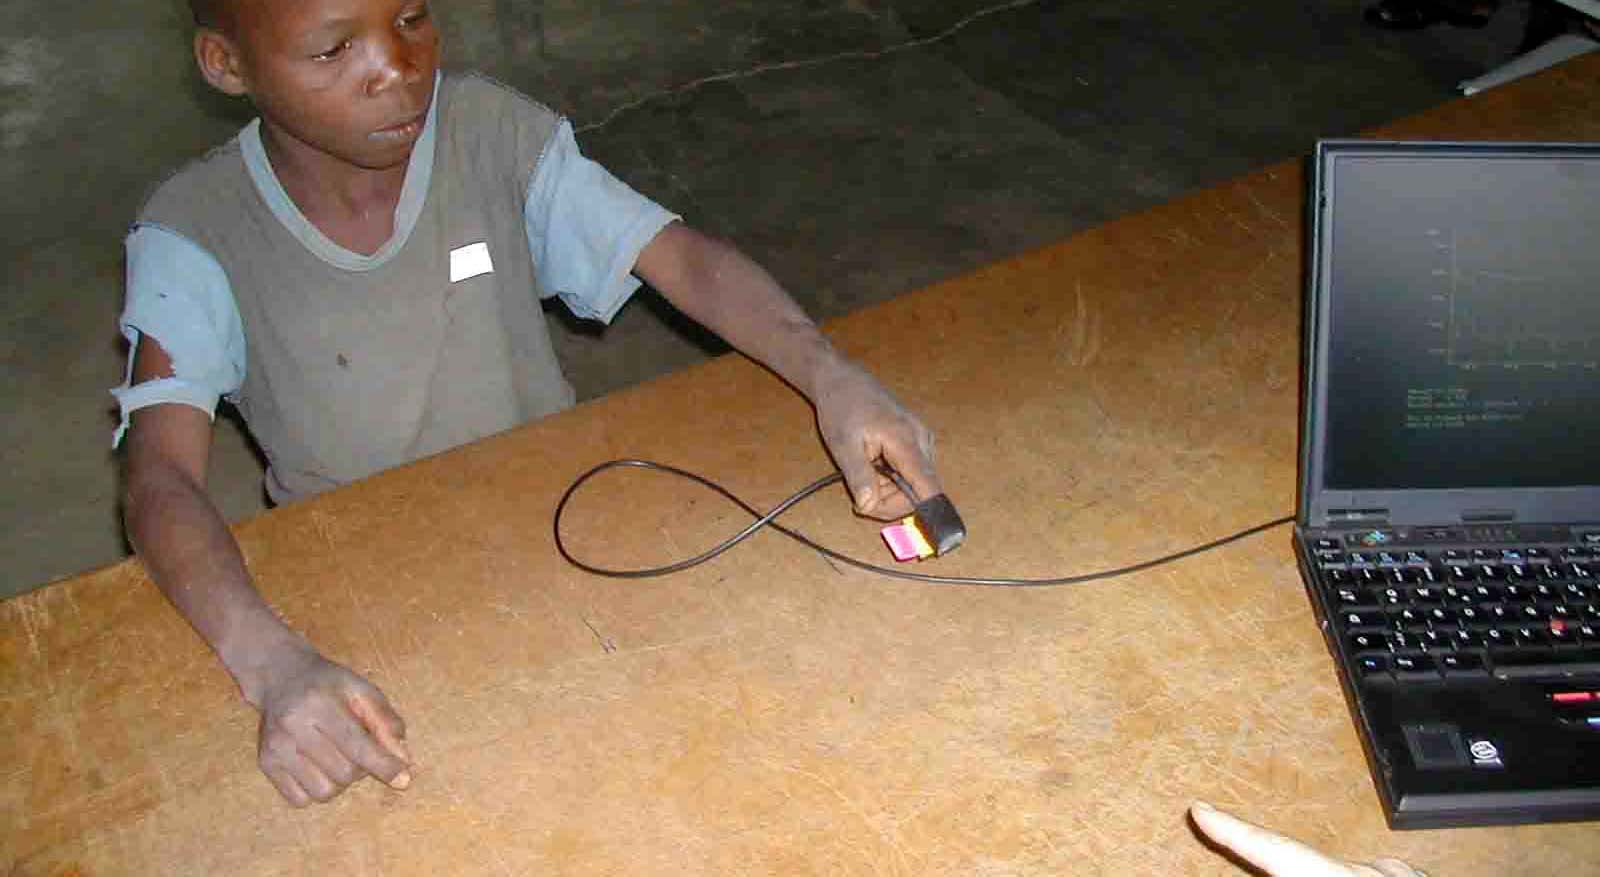
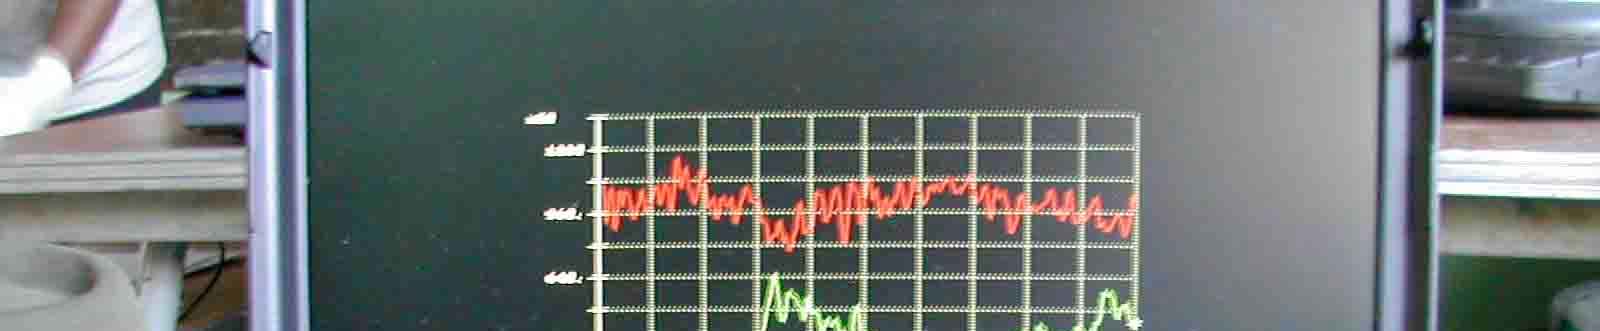
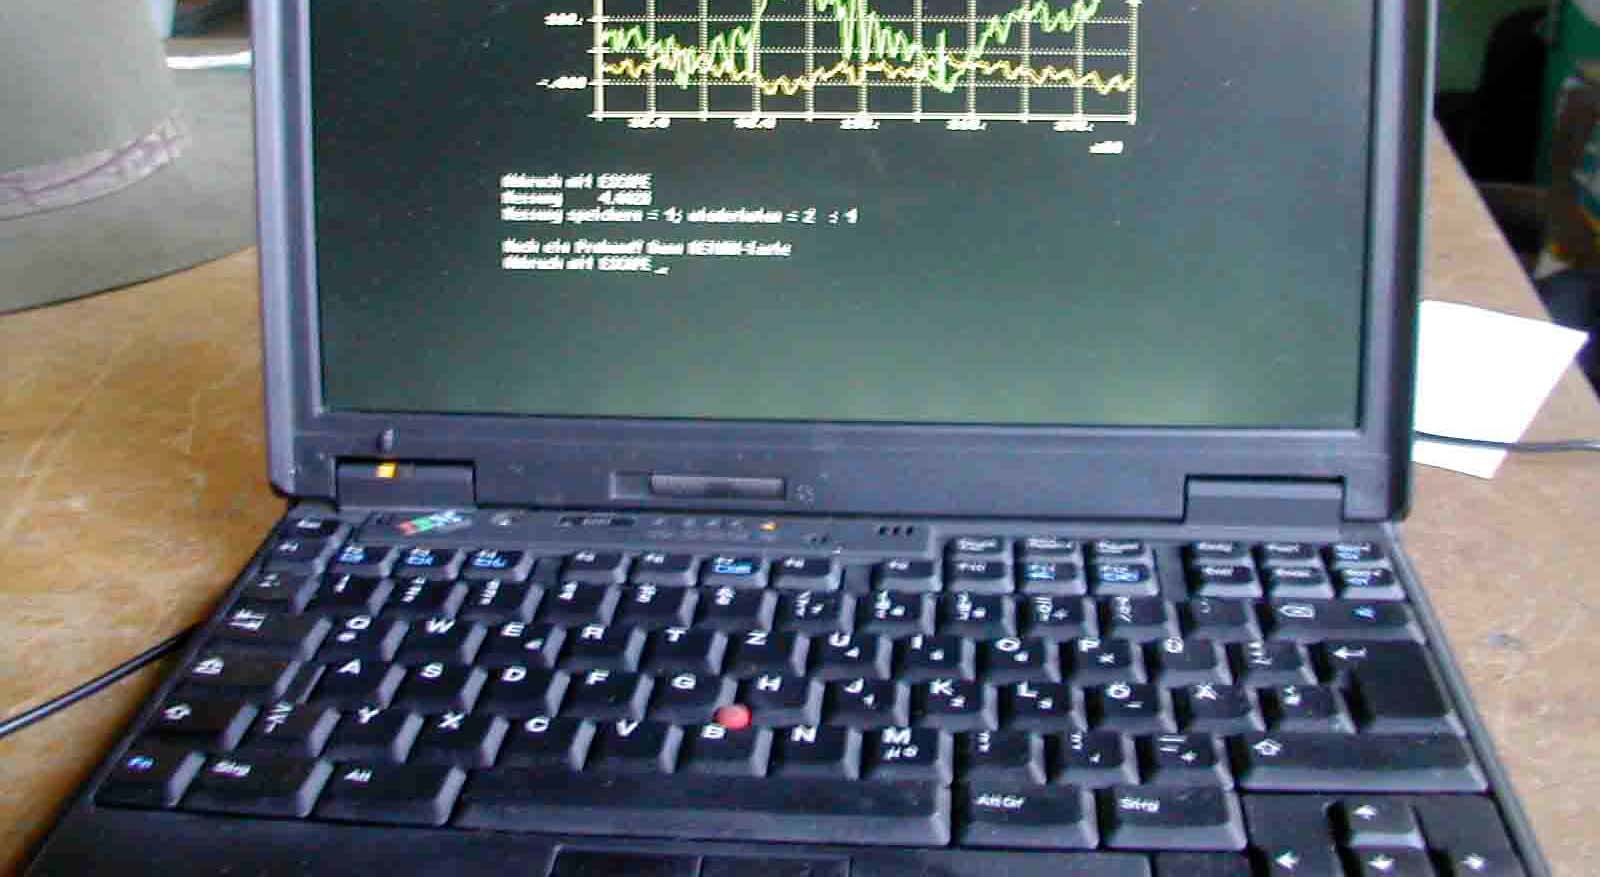
2.4.4. Tremor-meter
A new approach to measure tremor in a more objective way was performed. PD Dr.
Boetzel from the Neurological Clinic, University Hospital in Munich supplied the team
with an instrument to measure tremor. This instrument is still at a developmental stage.
A small sensor was placed on the fingertip (right and then left side) of each participant.
A special electronic unit, developed by the University, measured the signal and the
digital signals were recorded onto a laptop.
28
Final Report
Health Assessment Kadoma, Zimbabwe
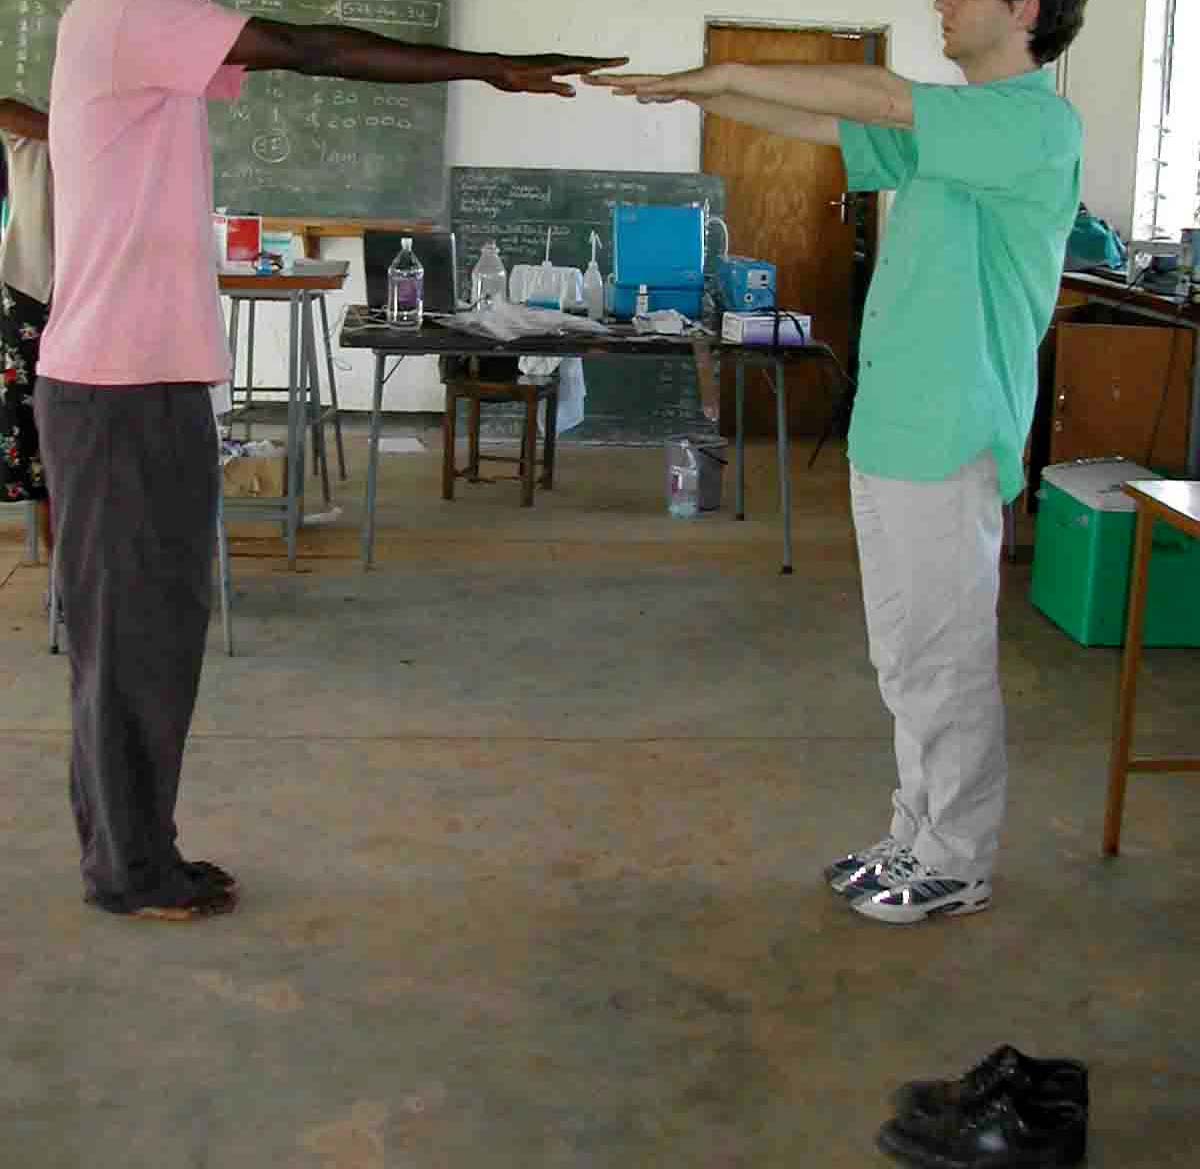
Picture 19 - Tremor-meter.
Three different measurements were performed:
- Arms outstretched for intentional tremor.
- Arms bend with the finger tip pointing to the nose for intentional tremor.
- Arms outstretched - moving fast for 30 cm from left to right and back for movement
analysis.
2.4.5. Laboratory field project
a) Specimens
The following specimens were taken, and two tests (Hg in urine and proteinuria) were
performed immediately:
- Blood (EDTA-blood 10 ml)
- Urine (spontaneous urine sample 10 ml)
Urine protein test
inorganic Hg in urine
- Hair.
The specimen urine and blood were cooled after collection until arrival in the laboratory
in Munich, Germany. Video and photo documentation of the examinations was carried
out.
Final Report
29
Health Assessment Kadoma, Zimbabwe
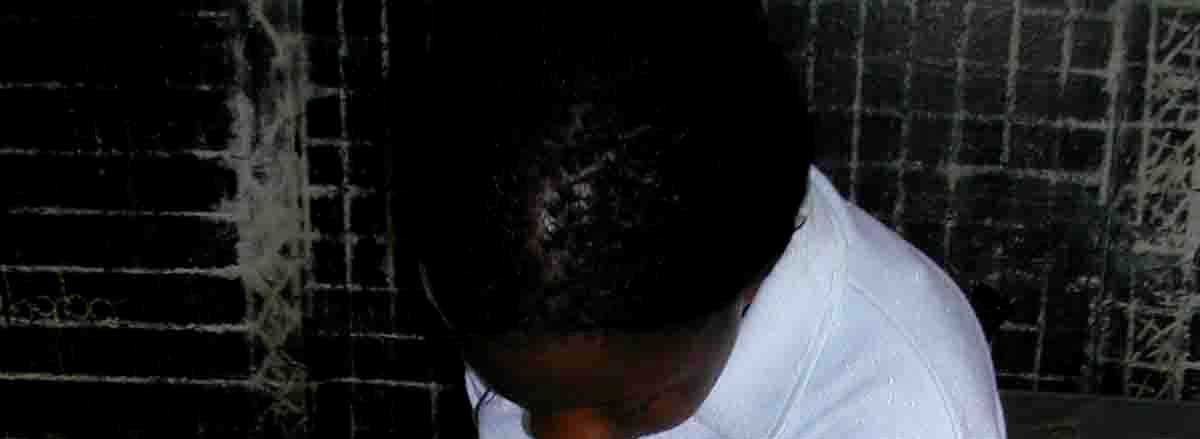
Picture 20 - Hair and urine sampling.
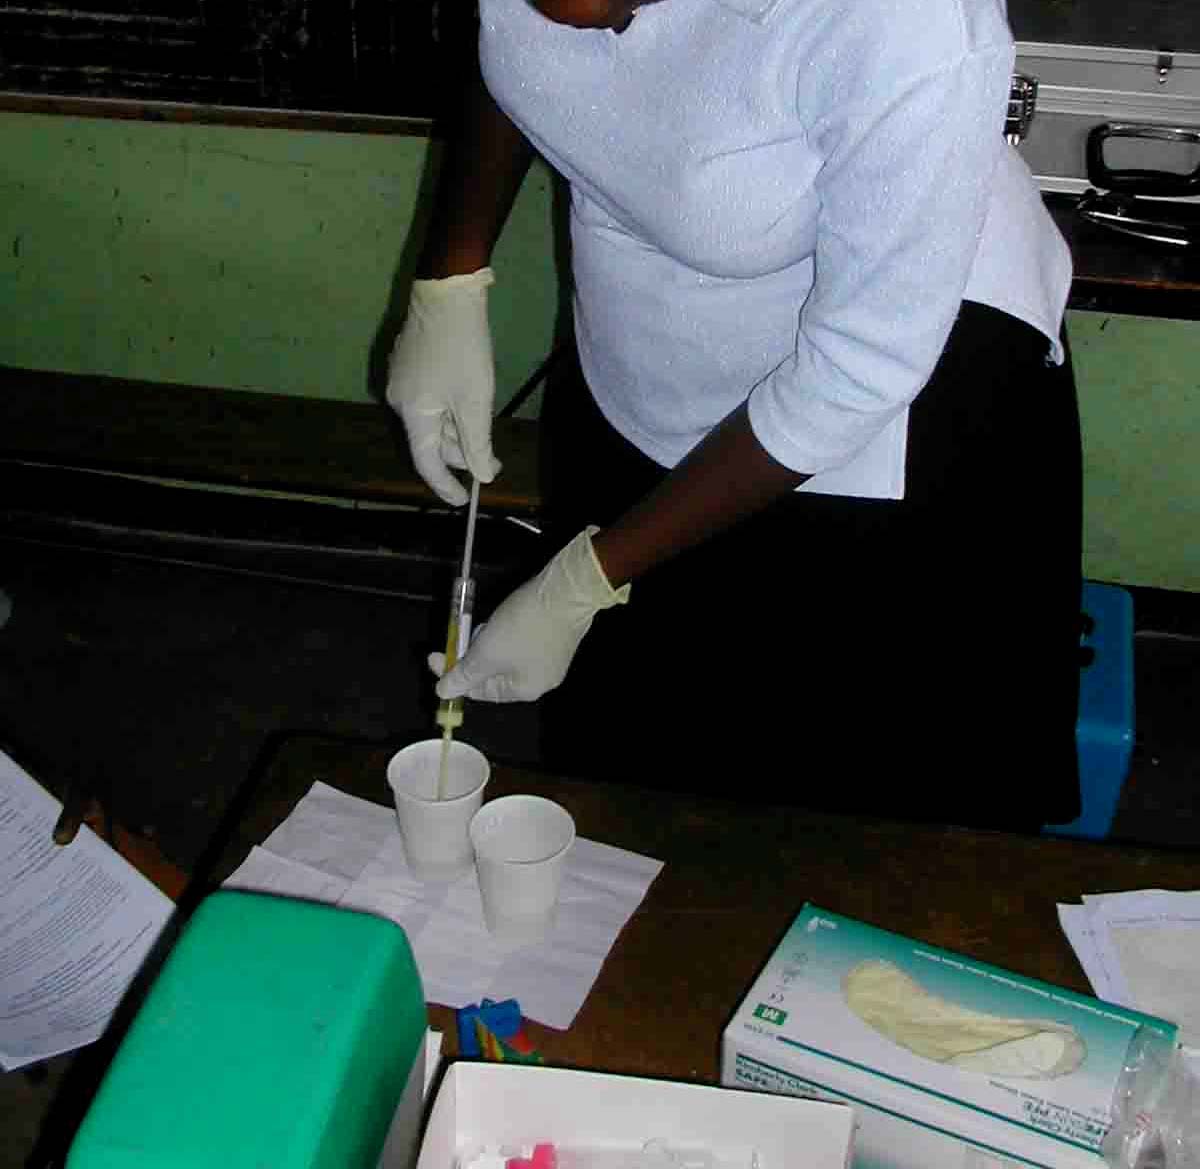
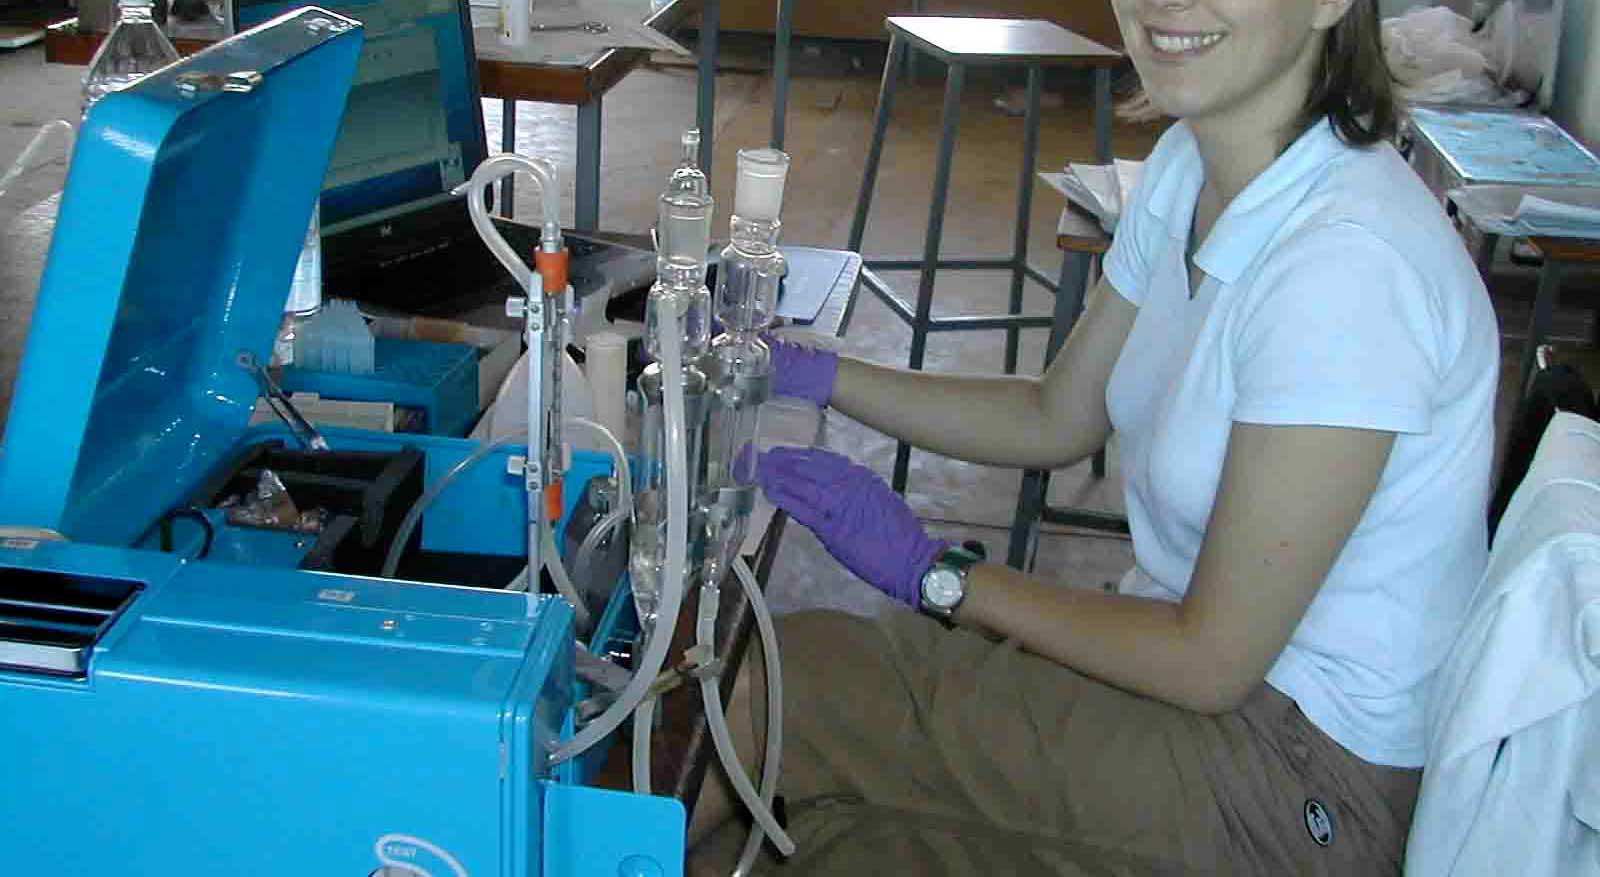
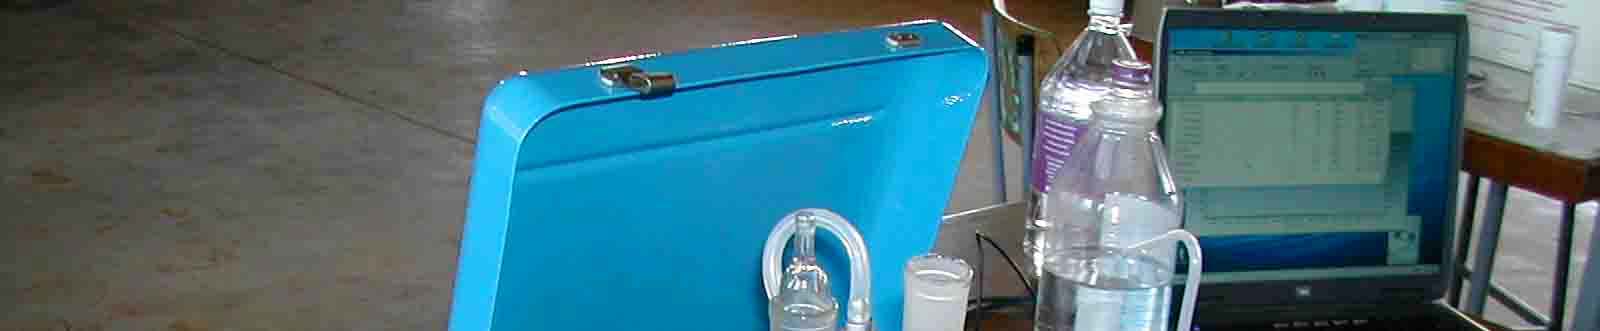
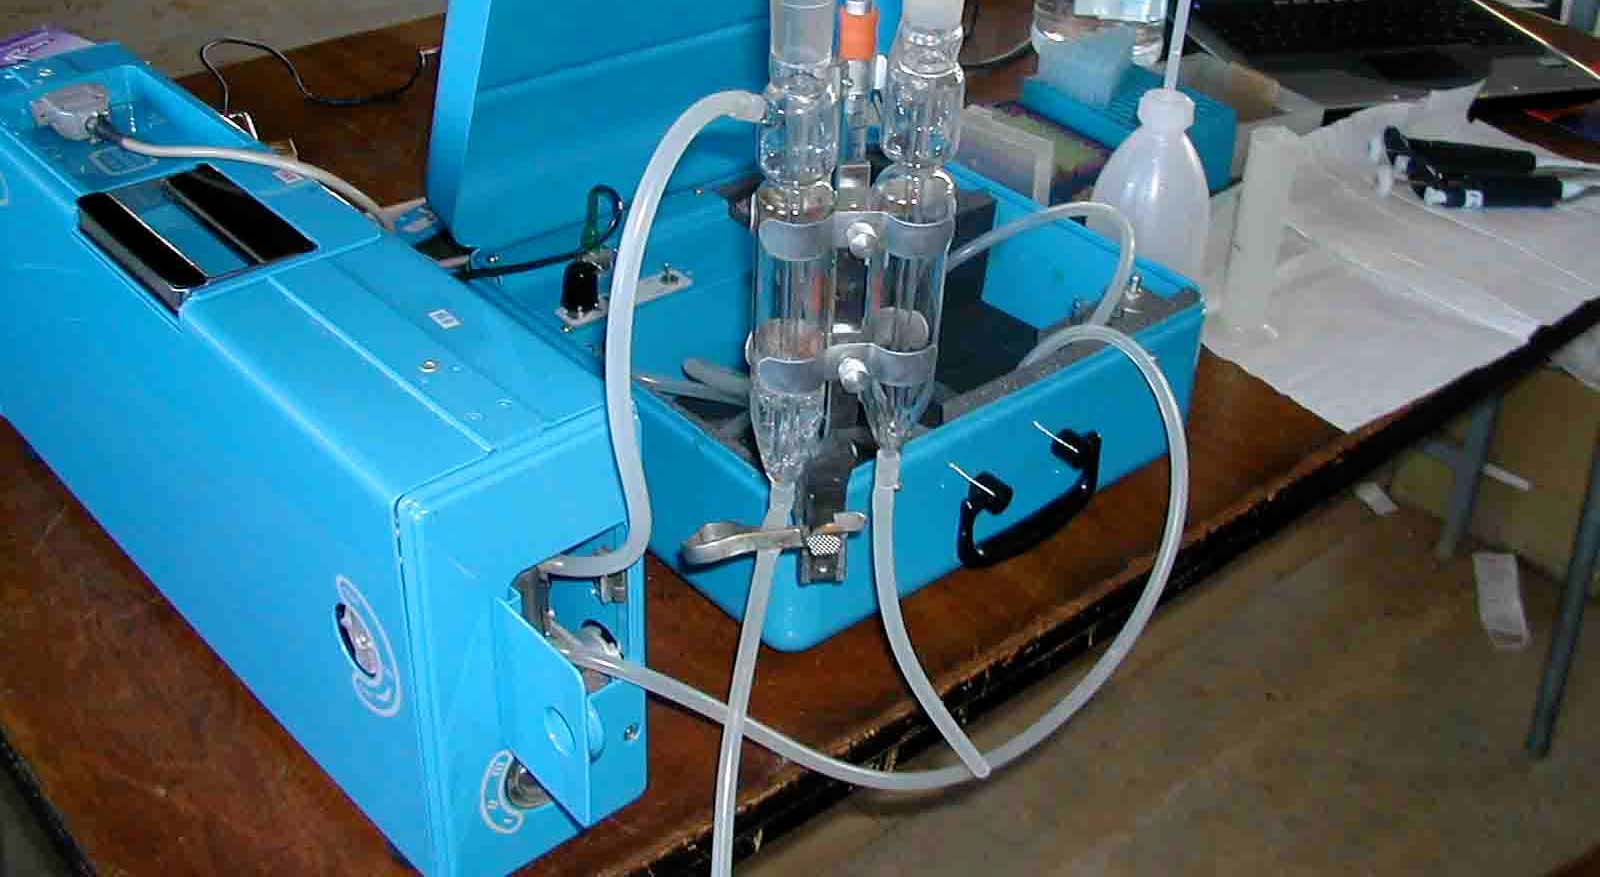
b) Lumex
A mobile Hg analyzer (Lumex RA-915+ with liquid attachment RP-91; Maassen GmbH,
Germany) was used to quantify inorganic mercury in urine with atomic absorption
spectrometry. For this 1 ml or less of the urine was filled with a pipette into the reaction
vessel filled with 10 ml of a tin(II)chloride-solution (5% in a 3% hydrochloric-acid). A
mercuric nitrate solution (100 ng/ml) was used as standard for calibration and control.
All the solutions were prepared with bottled drinking water due to the lack of distilled water.
The urine samples will be re-analyzed in the "Institute of Forensic Medicine", Munich,
Germany, to verify the results.
Picture 21 - Mobile Hg analyser for urine (Lumex).
30
Final Report
Health Assessment Kadoma, Zimbabwe
2.4.6. Test for protein in urine
Proteinuria was tested with a commercial kit (Bayer). The test is based on the error-of-
indicator principle.
Test reagents are 0.3% w/w tetrabromophenol blue; 99.7% w/w buffer and non-reactive
ingredients. At a constant pH, the development of any green color is due to the
presence of protein. Colors range from yellow for "negative" reaction to yellow-green
and blue-green for a "positive" reaction. The test area is more sensitive to albumin than
to globulin, hemoglobin, Bence-Jones proteins and muco-proteine. The test area is
sensitive to 15 mg/dl albumin. The test strip was dipped into the native urine and the
result was taken after 1 minute.
The test is semi-quantitative. Possible results are 0, 10, 20, 30, 100 and 300 mg
Protein/dl urine.
2.5. GENERAL HEALTH PROBLEMS IN KADOMA DISTRICT
Doctors, nurses, engineers, teachers and participants were interviewed on possible health
effects in relation to the mining and milling activities. The data from the two sociological
studies were very useful sources of information (Mtetwa, 2003 and Mtetwa, 2004).
2.5.1. Health care system in Kadoma district
The population is estimated to be 238,122 for the year 2003 (< 1 year of age are 7,620,
< 5 years 35,004, 5-14 years 66,912, > 15 136,206). 56,911 women are in the age
group 15-49, 10,573 women were pregnant.
The health service for the wide spread mining communities is situated in Kadoma town.
Village health workers can be found in the villages. They can treat minor illnesses as
well as primary malaria treatment. They support family planning, including distribution
of condoms. This service is provided free of charge.
The next district hospital is in Kadoma town. General surgery is performed in Kadoma, and
most of the infectious diseases can be treated in Kadoma, otherwise patients have to be
referred to Harare. The medical services in the hospital are charged to the patients. Some
patients cannot afford the charges in the hospital, but even more problematic are the high
medication costs. Kadoma district hospital is soundly built but there is a great lack of
financial resources to maintain the hospital and the equipment. Most of the more
technically advanced laboratory equipment does not function anymore. The pharmacy in
the hospital lacks many essential medication. The pediatric ward, for example cannot
obtain the necessary medication to treat asthma or some kinds of pneumonia. Children die
due to these lack of resources. Also there is no ambulance available to transport injured
miners, the miners cannot afford private transport expenses if they are injured. The staff
fluctuation is also a problem as experienced staff leaves the hospital to work in the private
sector or to work abroad. Our team was urgently asked to provide essential technical and
medical equipment to the hospital.
Final Report
31
Health Assessment Kadoma, Zimbabwe
The public health service is based at the district hospital. Mother and child care, family
planning, follow-up of the chronically ill, providing health information, and
environmental health are the duties of the public health service, all of which are free of
charge.
Several private medical practitioners treat patients in Kadoma. Traditional healers
(herbalists), so-called "machiremba", are part of the health care system.
All health care services have been steadily declining since a few years due to a
drainage of experienced and well trained health care providers to other developed
countries, caused by a lack of financial resources and unfavorable working conditions.
2.5.2. General health data
Health indicators can be used to compare health situations in this case between
countries. Life expectancy at birth is one commonly used health indicator. Life
expectancy for females in 2002 in Zimbabwe was 38.0 years, and for males 37.7 years
(WHO 2004).This is an extremely low life expectancy, even compared to other
countries in the area like Tanzania (47.5 years for females and 45.5 years for males) or
Ghana (58.8 for females, 56.3 for males) and Indonesia (67.9 for females, 64.9 for
males) (WHO 2004).
In 2003, 235,531 people were registered in the Kadoma district . A high percentage of
young people, 14.7 % under 5 years, and 28.1 % between 5 and 14 years were noted
(see table 1).
Number
In %
Total population as of 2003
235531
100
Population under 1 year
7537
3.2
Population under 5 years
34623
14.7
Population 5-14 years
66184
28.1
Population 15+ years
134724
57.2
Women 15 - 49 years
56292
23.9
Pregnant women
10458
4.44
Expected deliveries 4.32
10191
4.32
Table 1 - Kadoma district demographic data (by Mr. Gift from Kadoma District Hospital).
32
Final Report
Health Assessment Kadoma, Zimbabwe
Absolute No % of Total New Cases
1.Acute Respiratory Infections
15385
35.0
2.Malaria
5369
12.2
3.Diarrhoea
4804
10.9
4.Skin Diseases
3785
8.6
5.Diseases of the eye
1840
4.2
6.Symptoms & ill Defined Conditions
1660
3.8
7.Injuries
1638
3,7
8.Nutritional Deficiency
740
1.7
9.Dysentery
226
0.5
10.STD
112
0.3
Remaining Diseases
8340
19.0
Total New Cases
43899
100.0
Table 2 - Main causes of out-patient morbidity (under 5 years) (data from Mr. Gift from Kadoma
District Hospital).
Absolute No
% of Total New Cases
1
Acute Respiratory Infections
44339
21.9
2
Malaria
31887
15.8
3
Skin Diseases
12955
6.4
4
Diarrhoea
12831
6.3
5
Symptoms & ill Defined Conditions
12734
6.3
6
STD
12340
6.1
7
Injuries
11818
5.8
8
Diseases of the Eye
5606
2.8
9
Dental Conditions
2692
1.3
10 Dysentery
1298
0.6
Remaining Diseases
53593
26.5
Total New Cases
202093
100.0
Table 3 - Main causes of out-patient morbidity (all ages) (date from Mr. Gift from Kadoma
District Hospital).
Final Report
33
Health Assessment Kadoma, Zimbabwe
The main causes of out-patient morbidity for children in the Kadoma district are mainly
acute respiratory tract infection, and malaria or diarrhoea (see table 2). The main
causes of disease to be admitted to hospital for children are acute respiratory tract
infection, diarrhoea, problems around birth (perinatal pathology) and malaria (see
table 4). The main causes of death for children are the same as for hospital admission
(see table 6).
The estimated infant mortality rate in Kadoma district with 38.8 deaths per year / 1000
live births is compared to the country wide rate of 70.7 relatively low; to compare
Tanzania 109.2, Ghana 61.6, and Indonesia 39.3 (WHO 2004). Kadoma district seems
to be in the upper region of health indicators within Zimbabwe.
For adults acute respiratory tract infections, malaria and skin diseases are the main
causes of out-patient morbidity (see table 3). Apart from birth deliveries the main
causes to be admitted to hospital for adults are acute respiratory tract infections,
injuries and malaria (see table 5). The main causes of death for adults are AIDS related
diseases, acute respiratory tract infections, diarrhoea, tuberculosis and malaria (see
table 7).
Absolute No
% of Total New Cases
1
Acute Respiratory Infections
741
50.1
2
Diarrhoea
206
13.9
3
Perinatal Pathology
101
6.8
4
Malaria
85
5.8
5
Symptoms & ill Defined Diseases
75
5.1
Total New Cases
1478
100.0
Table 4 - Main causes of in-patient morbidity (under 1 year of age)
(data from Mr. Gift from Kadoma District Hospital).
Absolute No
% of Total New Cases
1
Normal Deliveries
3634
25.5
2
Acute Respiratory Infections
1178
8.3
3
Injuries and Poisonings
1112
7.8
4
Malaria
1041
7.3
5
Aids Related Diseases
809
5.7
Total New Cases
14247
100.0
Table 5 - Main causes of in-patient morbidity (5 years and over) (data from Mr. Gift from
Kadoma District Hospital).
34
Final Report
Health Assessment Kadoma, Zimbabwe
Infant mortality rate
No. of Deaths
/ 1000 live births
1
Acute Respiratory Infections
106
2
Diarrhoea
31
3
Perinatal Pathology
25
4
Malaria
11
5
Symptoms & ill Defined Disease
11
Total Under 1 Deaths
215
Total Live Births
5547
38.8
Table 6 - Top five causes of mortality (under 1 year) (data from Mr. Gift from Kadoma District
Hospital).
No. of Cases
No. of Deaths
Case Fatality Rate (%)
1
Aids Related Diseases
809
208
25.7
2
Acute Respiratory Diseases
1178
159
13.5
3
Diarrhoea
686
123
17.9
4
Tuberculosis
780
123
15.8
5
Malaria
1041
105
10.1
Table 7 - Top five causes of mortality (5 years and over) (data from Mr. Gift from Kadoma
District Hospital).
AGE GROUP IN
YEARS
FEMALE
MALE
HIV Tests No. +ve
% +ve
HIV Tests No. +ve
% +ve
0 - 4
38
22
57.9
44
26
59.1
5 14
45
28
62.2
16
9
56.3
15 -19
25
17
68.0
6
1
16.7
20 - 29
138
101
73.2
126
106
84.1
30 - 39
203
167
82.3
256
194
75.8
40 -49
75
49
65.3
110
62
56.4
50 - 59
28
19
67.9
56
23
41.1
60+
8
5
62.5
23
10
43.5
AGE UNKNOWN
4
0
0.0
36
19
52.8
TOTAL
564
408
72.3
673
450
66.9
Table 8 - HIV/AIDS (data from Mr. Gift from Kadoma District Hospital).
Final Report
35
Health Assessment Kadoma, Zimbabwe
The HIV/AIDS data from Kadoma district is very frightening (see table 8). Most applied
tests were positive (66% in males, 72% in females). The main age group of positive
tests is in the 20-29 and 30-39 year old population-group. These age groups are the
most sexual active age groups. At the same time these younger people are the main
work force at the moment and for the near future. The very high percentage of positive
tested people gives very serious concern to the public health sector, and might explain
the very low life expectancy in Zimbabwe.
2.6. GENERAL HEALTH PROBLEMS IN KADOMA DISTRICT
The main health problems in the mining area seem to be:
Dangerous tunnels, many lethal accidents occur each year in the Kadoma district.
Exact figures seem not to exist. Best estimations are in the range of 50 lethal accidents
per year in the mining areas. Miners reported of collapsing tunnels, due to improper
mining technologies (missing tunnel safety precautions). Medical treatment is not
available in the informal mining area proper, only in the nearby town of Kadoma.
Infectious diseases are widespread. A very high percentage of the surveyed population
had malaria, many of them within the last year. Malaria is diagnosed clinically and
treated orally mainly with Chloroquine and SP (Fansidar). Tuberculosis is endemic, but
not epidemic. Tuberculosis is treated under a governmental program. According to the
WHO scheme daily-observed treatment (DOT) with quadruple treatment for 2 months
(Isoniazid, Rifampicin, Pirazinamid, Etambutol) and follow-up double treatment for 4
months (Isoniazid, Rifampicin) is performed. Bilharzia occurs occasionally, no
screening program is performed at the moment, and treatment with Prazaquantile is
available in the hospital.
Sexually transmitted diseases (STD) are common. Promiscuity and prostitution are
common in the mining areas. Gonorrhea and cancroids are common. No screening is
performed, in the hospital gonorrhea is treated syndromatically with Benzadine-
penicillin, Doxycyclin, Metronidazole and Kanamycin.
HIV/Aids data was not available for the surveyed population. Cases of Aids are known
and treatment of the symptoms is available in the hospital. Antiviral treatment is not
available in the hospital, except for the mother child program. Prescriptions of antiviral
medication are available from the private medical practitioners, but the medication is
too expensive for most patients. Testing for HIV/Aids is voluntary.
Malnutrition in Zimbabwe has increased within the past two years due to drought over a
period the last years. The first food supply donations began last year (2003)
Malnutrition together with the HIV increases the susceptibility for other lethal infections
such as TB and malaria.
The dental status of people differs. Some people have many stumps but many people
have fairly good teeth. Most children have quite good teeth. The dental service in
Kadoma district hospital is closed due to the lack of a dentist.
36
Final Report
Health Assessment Kadoma, Zimbabwe
Insufficient sanitary conditions cause diarrhea. It is a major cause of infant mortality in
the mining areas in Kadoma district.
Pneumonia, upper respiratory infections, skin diseases, eye diseases (cataracts,
conjunctivitis) are other important causes of diseases in the mining areas in Kadoma
district.
The volunteers, we examined, presented diseases such as asthma, skin infections,
scars, hematuria etc.. These conditions should have been diagnosed and treated much
earlier.
Smoking is more common among men than among women. Alcohol consumption
seems to be higher in the informal small-scale mining areas. Drinking is very common
in the villages, mainly for men, since there are no other activities in the small-scale
mining areas for example no TV. The illegal use of smoking "dagga" seems to be done
amongst younger male miners.
2.6.1. Children's health in Kadoma district
A high proportion of the population in the area is children under the age of 12. The
main health problems of children in the Kadoma informal mining areas seem to be
malnutrition and malaria: Due to poor sanitary conditions infectious diseases like
gastro-intestinal infections and malaria are very common and are a risk for children's
health.
Children experience high exposure to mercury in the area. They have access to fluid
mercury and play with this mercury with their hands. They live within the huts where
amalgamation and smelting is carried out and are therefore also exposed to mercury
fumes.
Some children do not attend school. Many children and teenagers work after school or
at weekends. Children begin to work in this area as young as 10 years of age. They
work in the amalgamation and smelting process with direct contact to mercury.
This is child labor at its worst limits, partially physically very hard, partially related to a
high exposure of mercury. Accidents related to work are a health hazard for these
children.
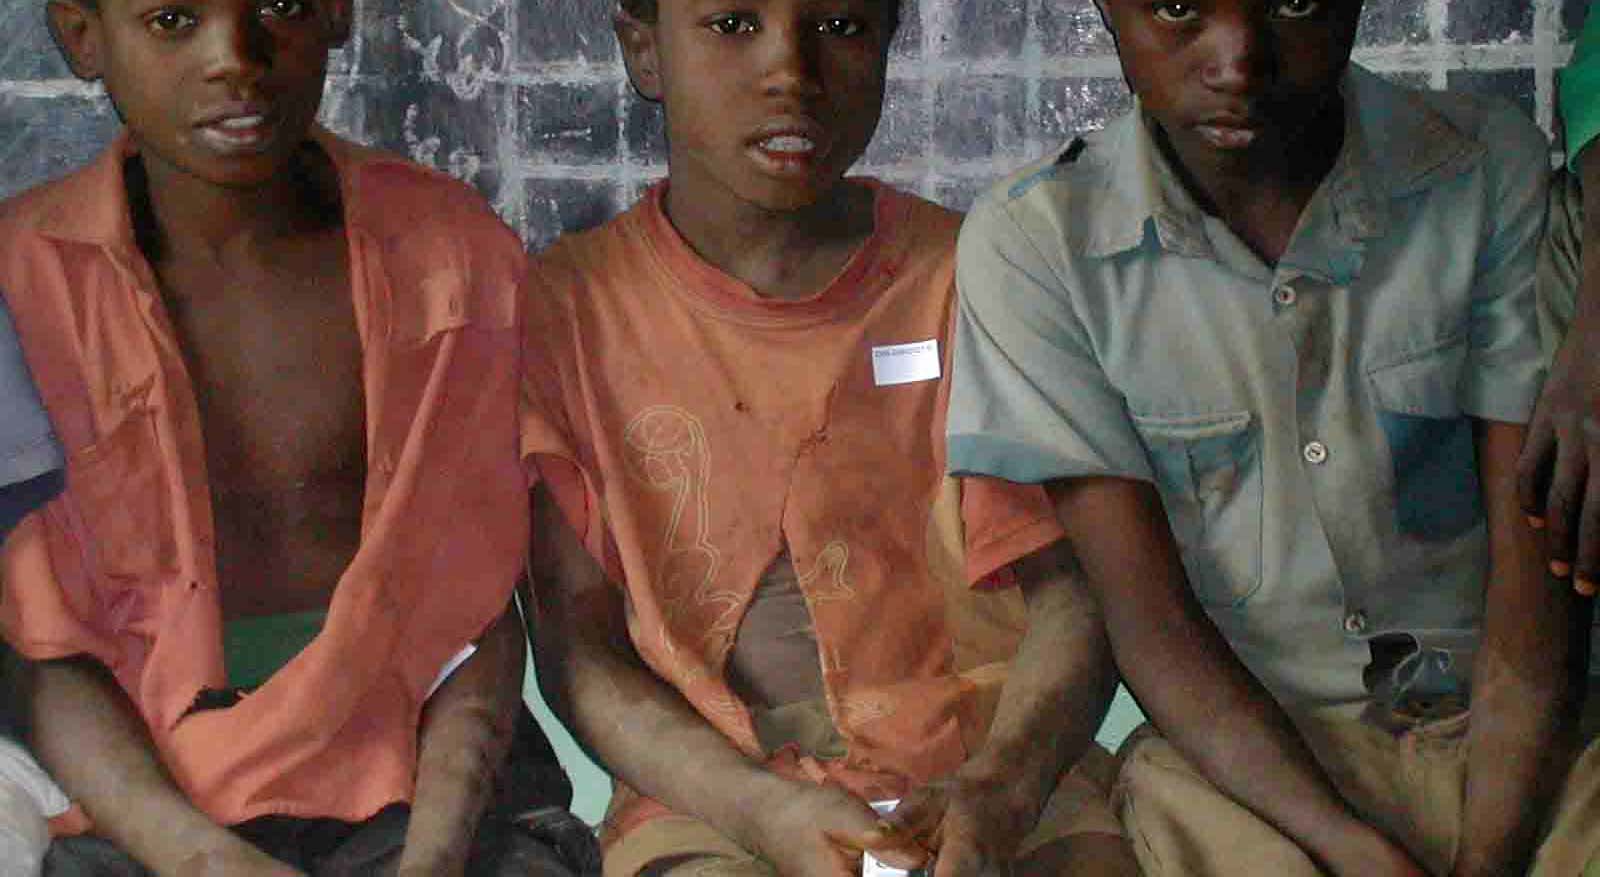
Not only mercury is a health hazard for children working in the mines. Some of the
children also work with cyanide, or with nitric acid. They inhale the toxic gases and are
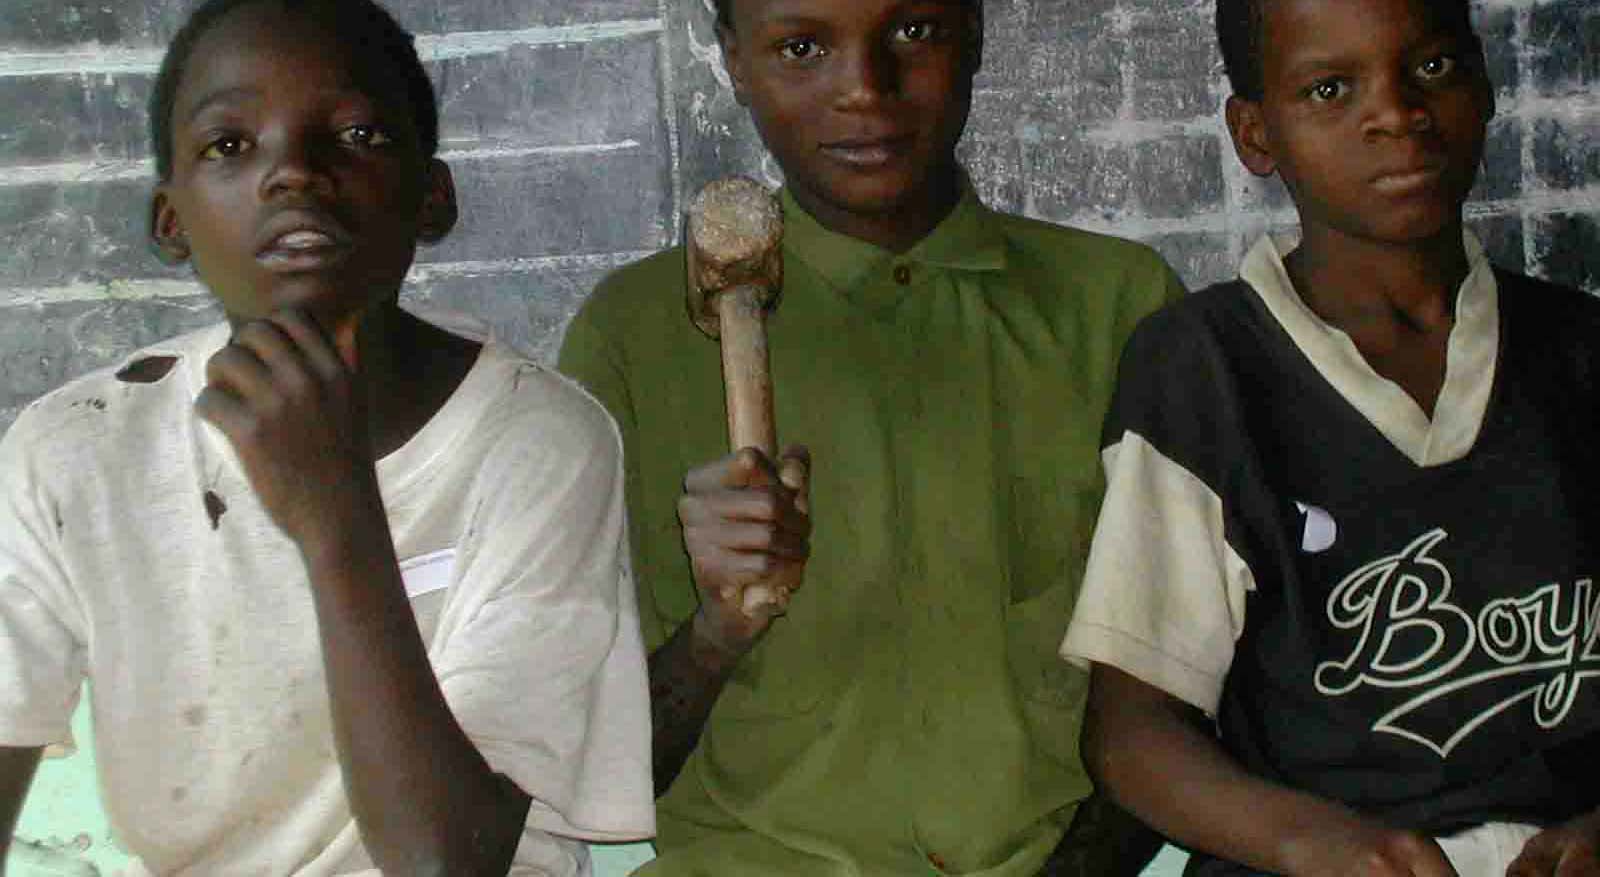
in danger of damaging their respiratory system. The team examined three 8-12 year
old boys who had been coughing heavily in a dry manner. These children were not only
using cyanide but also nitric acid for cleaning the copper plates. Two of them might
have been mentally retarded, their look was almost dull, e.g. the orders for carrying out
the neuro-psychological tests had to be repeated several times until they reacted. The
children would prefer to go to school instead of working as a "panner" or miner, as one
10 year old boy expressed, but they have no choice due to the poverty of their family.
Final Report
37


Health Assessment Kadoma, Zimbabwe
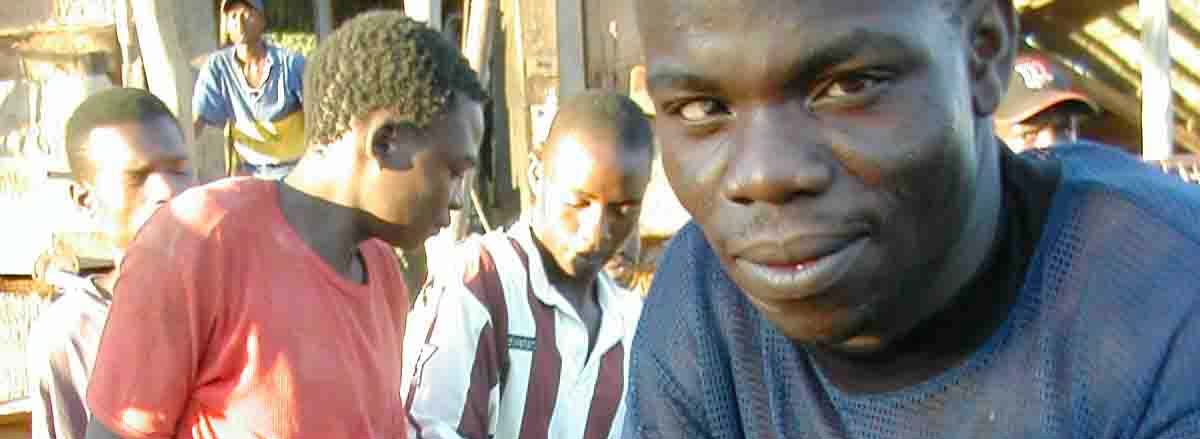
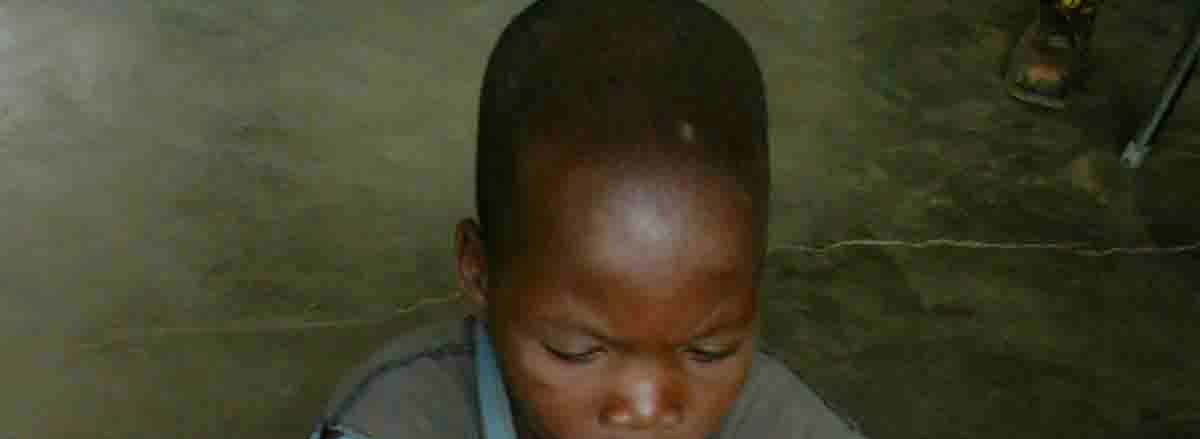
Picture 22 - Children from Kadoma, all working as miners.
2.7. PRELIMINARY CLINICAL RESULTS OF THE HEALTH ASSESSMENT
The health assessment was performed according to the UNIDO health assessment
protocol (Veiga, 2003). The declaration to volunteer was translated in Shona (see
appendix 2). The 3 nurses interviewed all 217 participants. These participants were
physically examined including neurological testing. Specimens (blood, urine, hair) of
nearly all participants were taken at that time. A mobile Hg analyser was used to
determine total mercury in urine. Video and photo documentation was carried out.
2.7.1. Clinical and neurological examination
The clinical impression was, that some workers from Kadoma showed severe
symptoms, related to the classical picture of a mercury intoxication. They reported
sleep disturbances, excessive salivation, tremor, and metallic taste. Intentional tremor,
mainly fine tremor of eye lids, lips and fingers, ataxia, dysdiadochokinesia and altered
tendon reflexes were observed.
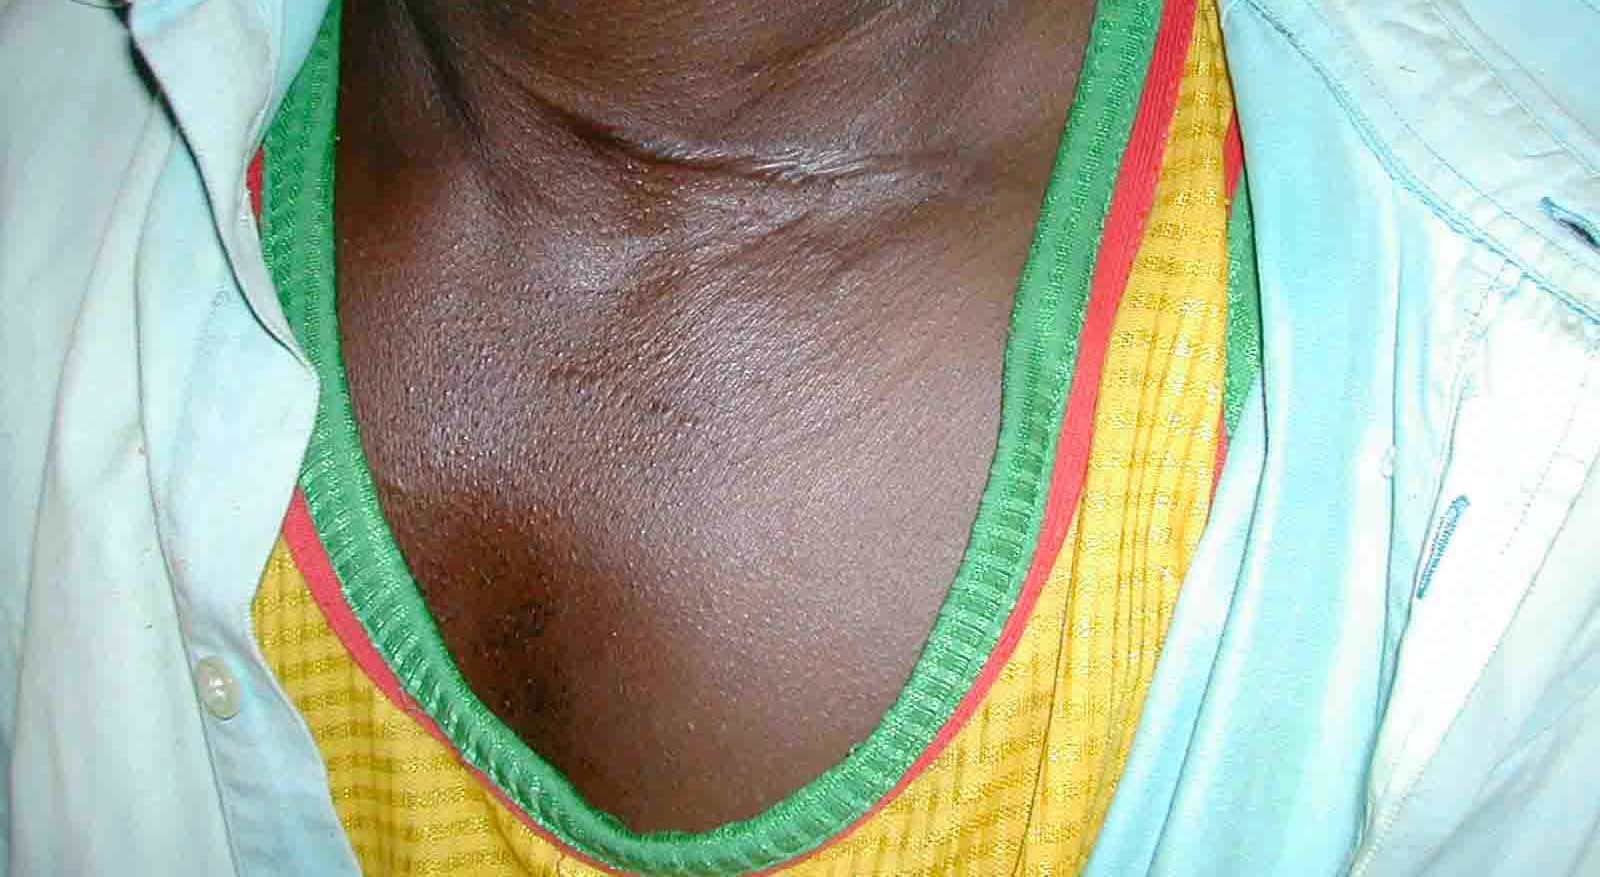
One woman, who had been working since 14 years with mercury showed severe
symptoms of a clinical mercury intoxication with ataxia, strong hypomimia, altered
reflexes and primitive reflexes. A seventeen year old young man, working since the age
of 10, had a very strong tremor of the eyelids, and could not even close the eyes
completely anymore.
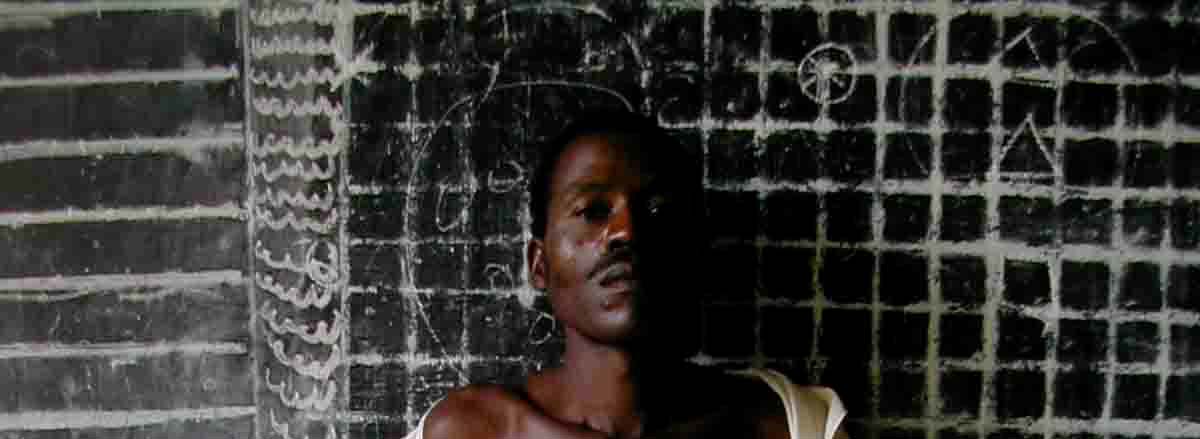
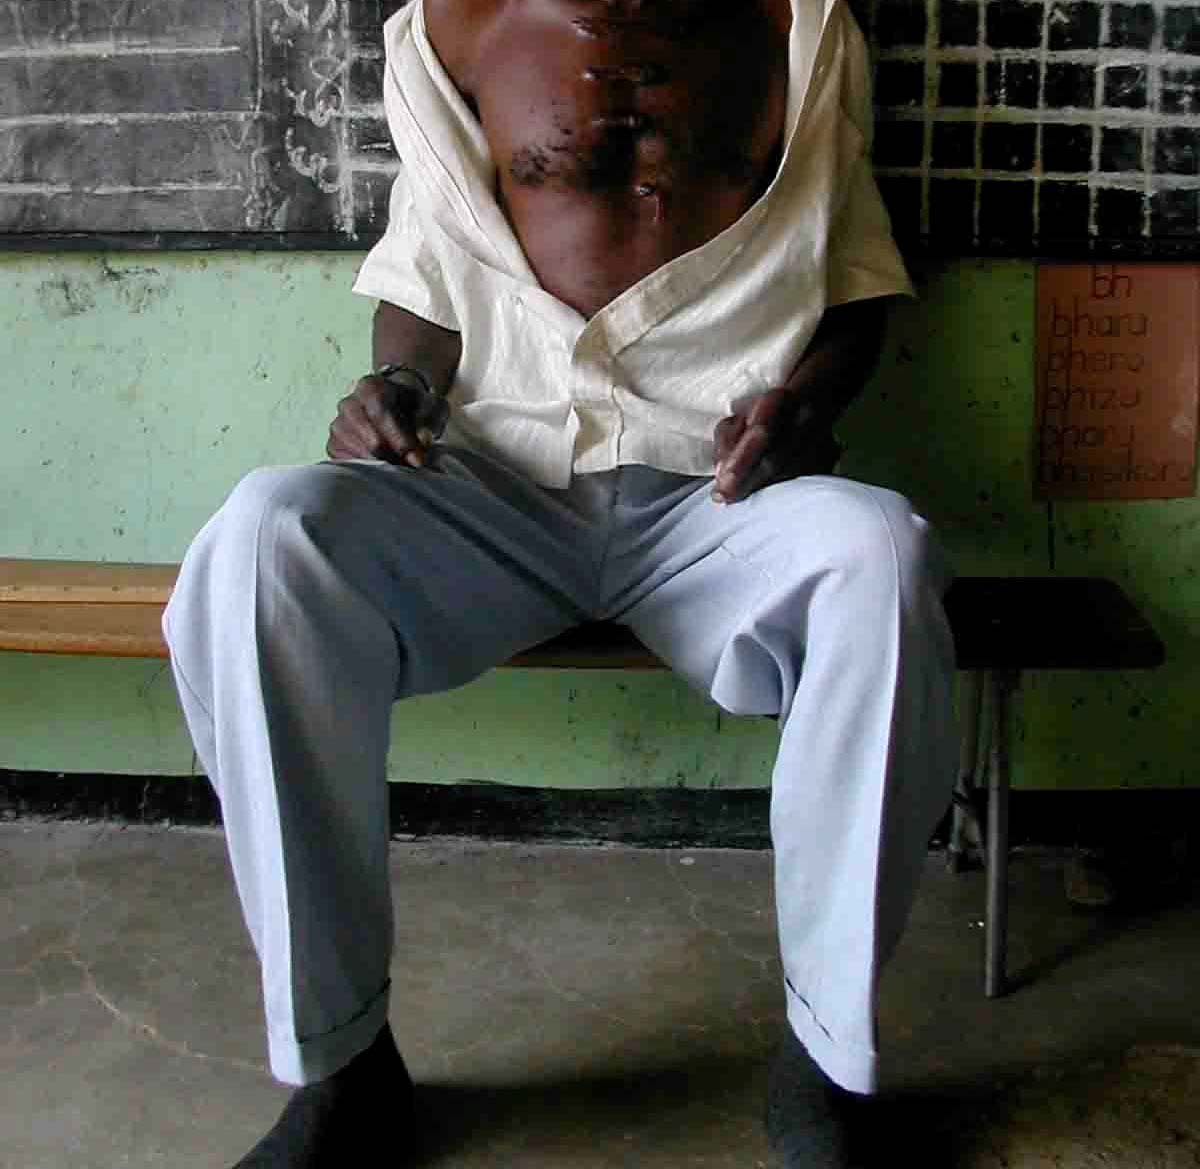
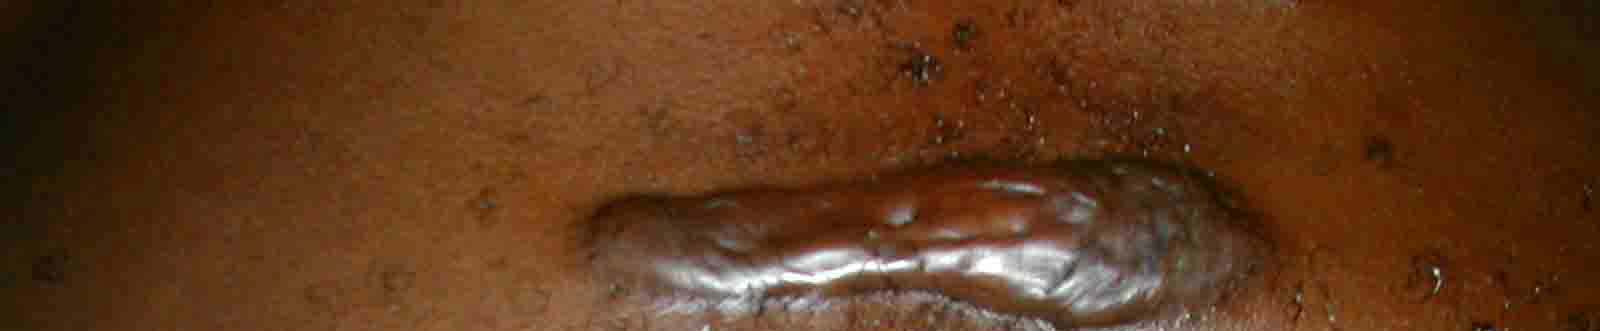
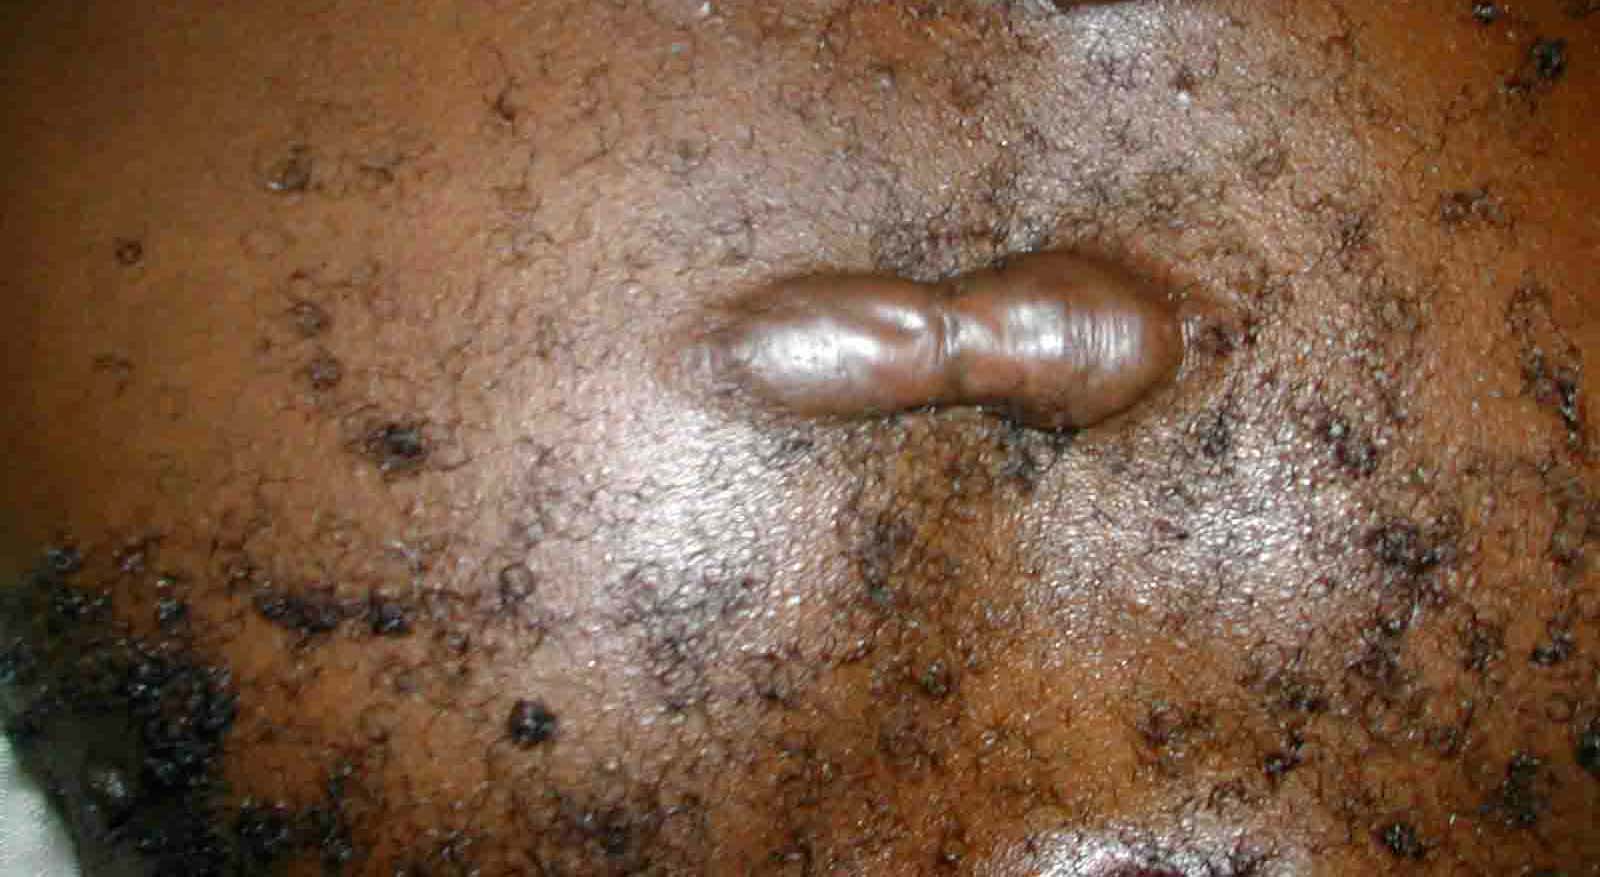
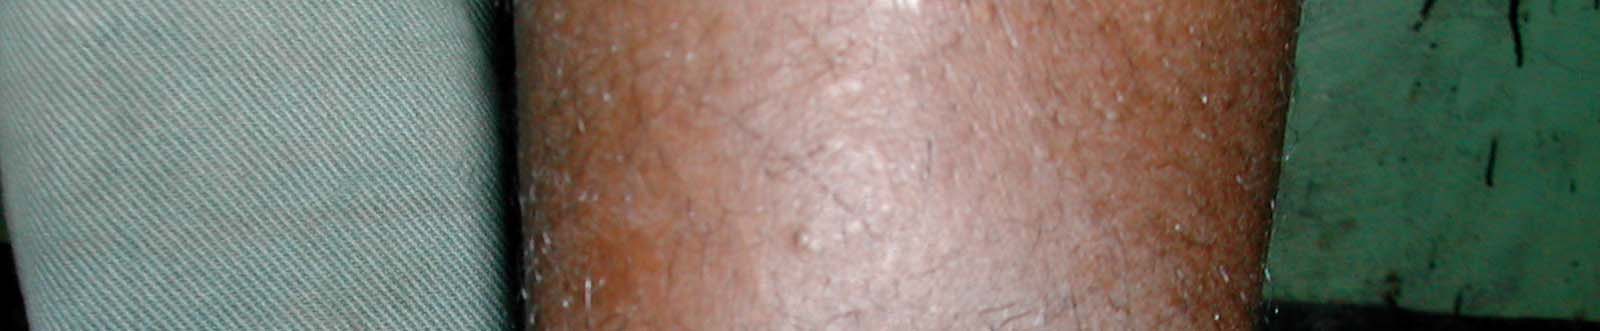
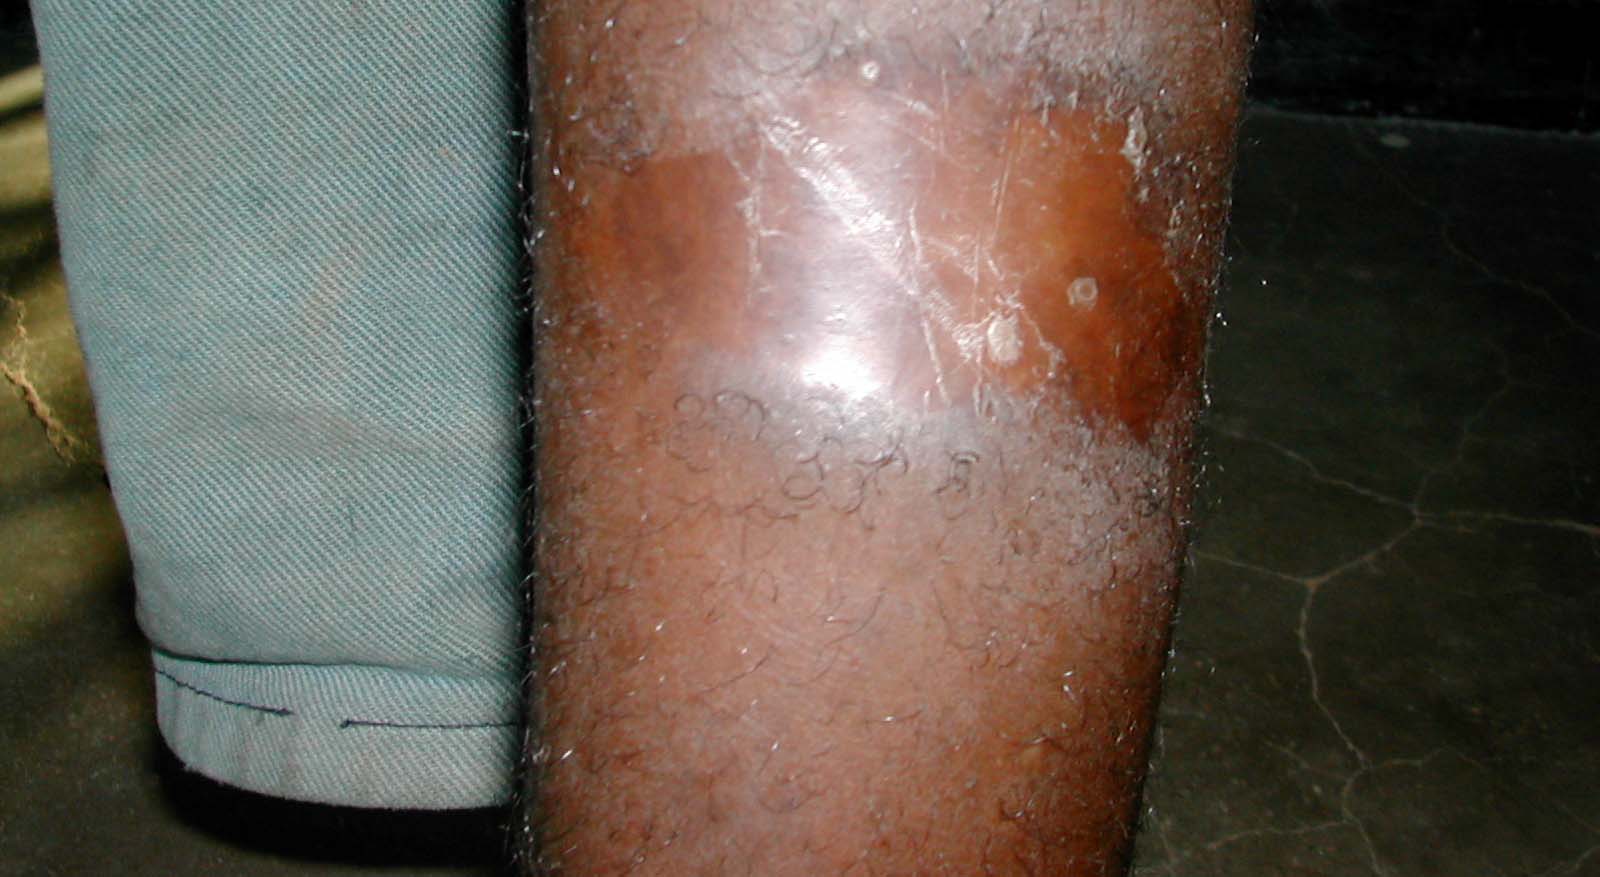
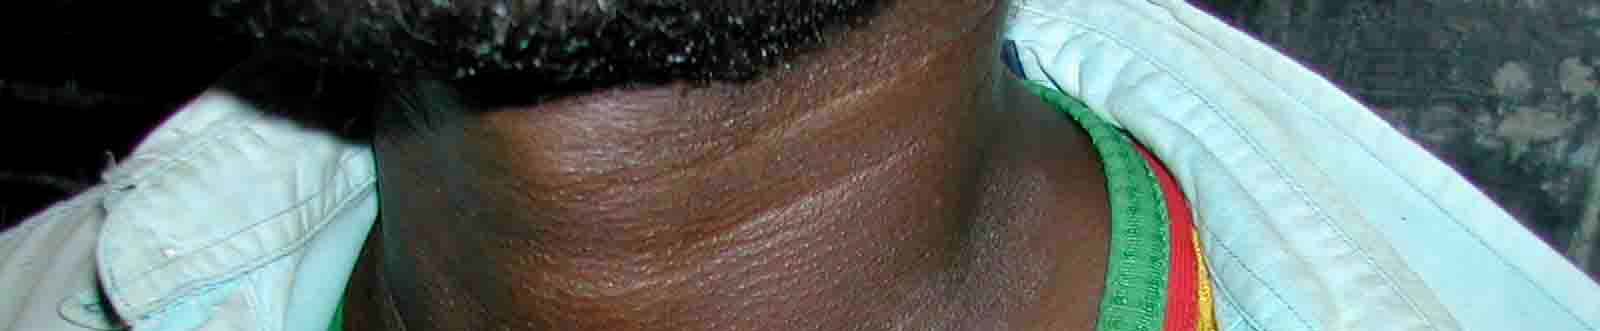
Other health problems observed were keloid formation due to hypertrophic scars. This
is not related to mercury, but shows the lacking capacities of the health care system.
One participant showed a severe scar on his foot due to a mining accident (collapsing
unprotected tunnel). Another participant had a scar at his neck due to a fight in the
mining area.
38
Final Report
Health Assessment Kadoma, Zimbabwe
Picture 23 - Participants with hypertrophic skin, scars due to mining accident,
scar due to a knife injury
It should be noted that many workers from Kadoma were primarily very healthy and
strong young men (healthy worker effect).
Participants who worked for more than 5 to 10 years in the area seemed to have more
severe clinical symptoms. But most miners did not work for that long in this area. It is
possible that we missed the most severe cases. Due to the lack of a highly developed
social system in Zimbabwe, some very sick workers might also have moved back to
their original homes and families elsewhere in Zimbabwe.
Final Report
39

Health Assessment Kadoma, Zimbabwe
2.7.2. Children's health in Kadoma mining area
The health status of the children in the area is poor. Malnourished and undernourished
small children are not uncommon (Kwashiorkor). Many children suffer from skin
problems, diarrhea and upper respiratory tract infections. Malaria is by far the most
serious health hazard for children in this area. Most children were physically fairly fit,
and well socialized.
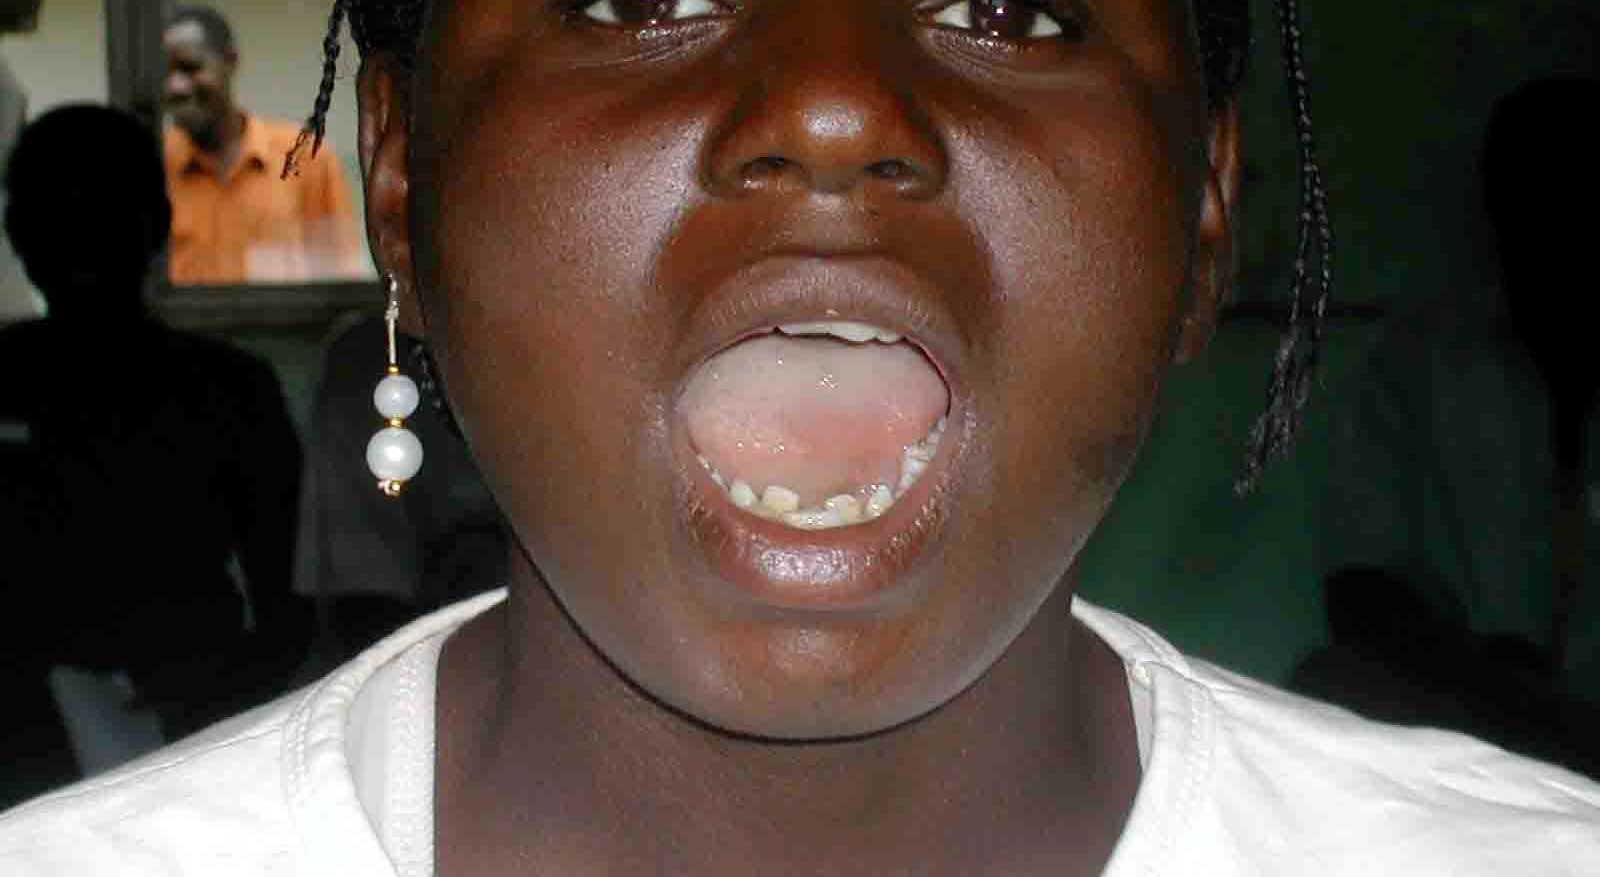
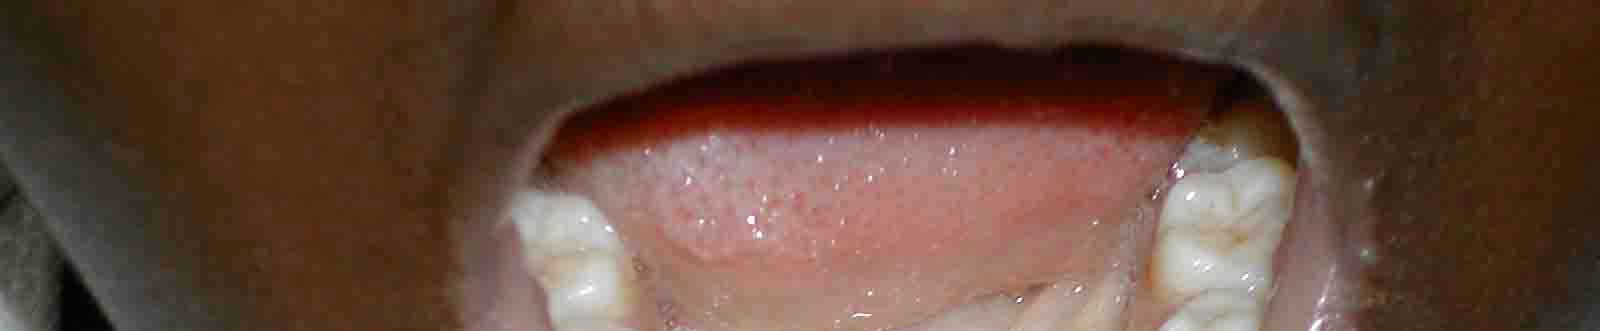
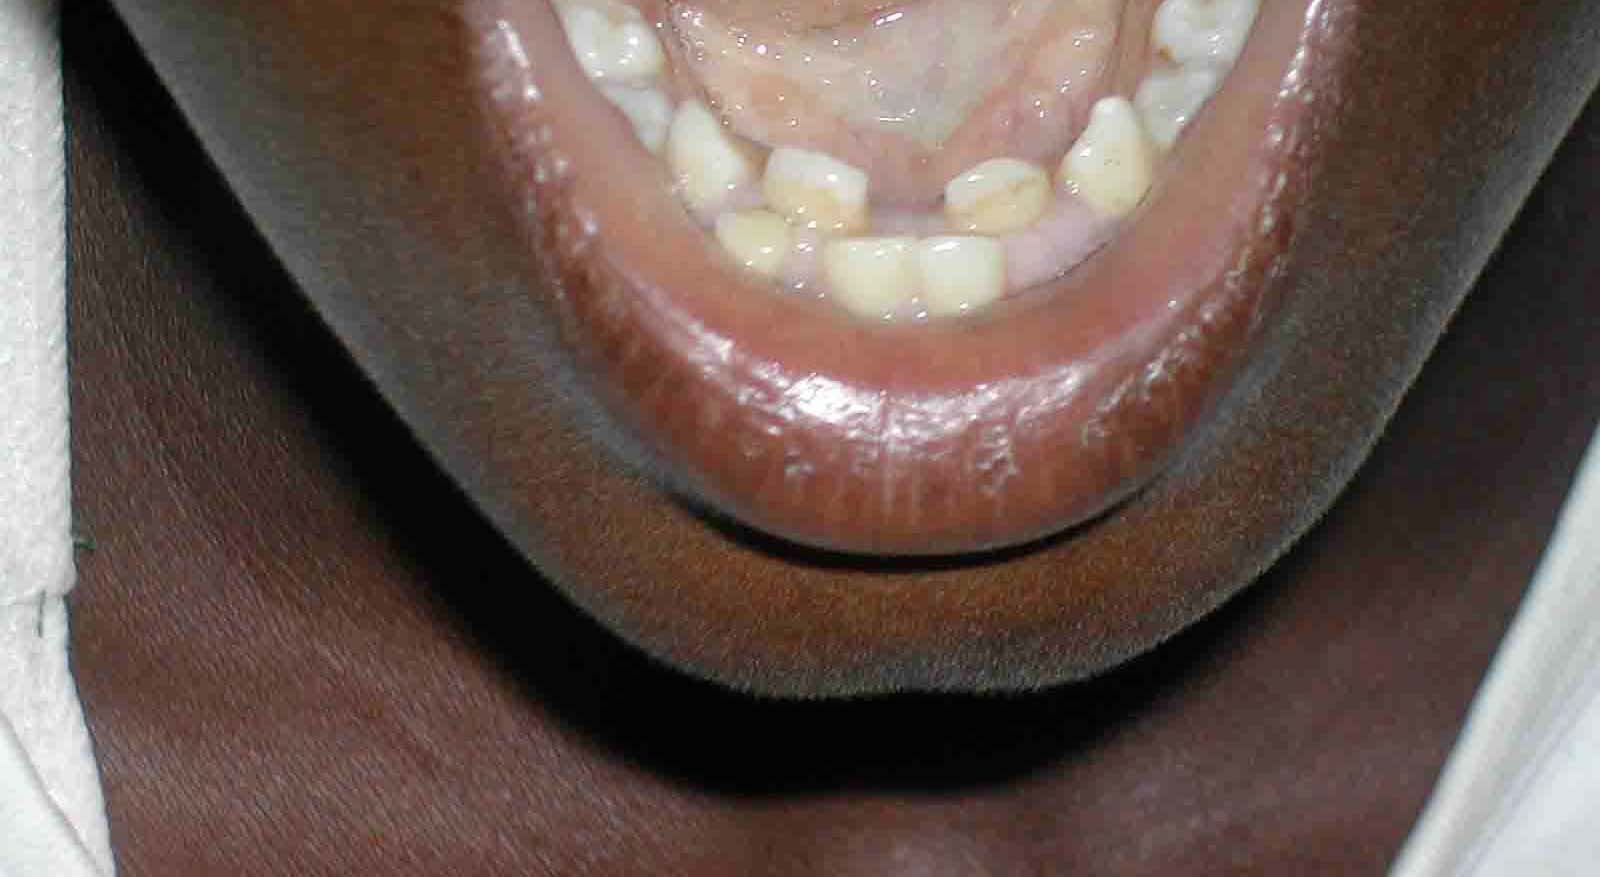
One child showed a dental malformation, a double formation of front teeth. In Minamata
disease skeletal malformations were linked to mercury. A single case cannot be linked
to a special cause, but it would be of great interest to analyze with a different approach
malformations in the area. A first clinical impression was, that some children were
either mentally retarded, or physically retarded.
Picture 24 - Dental malformation.
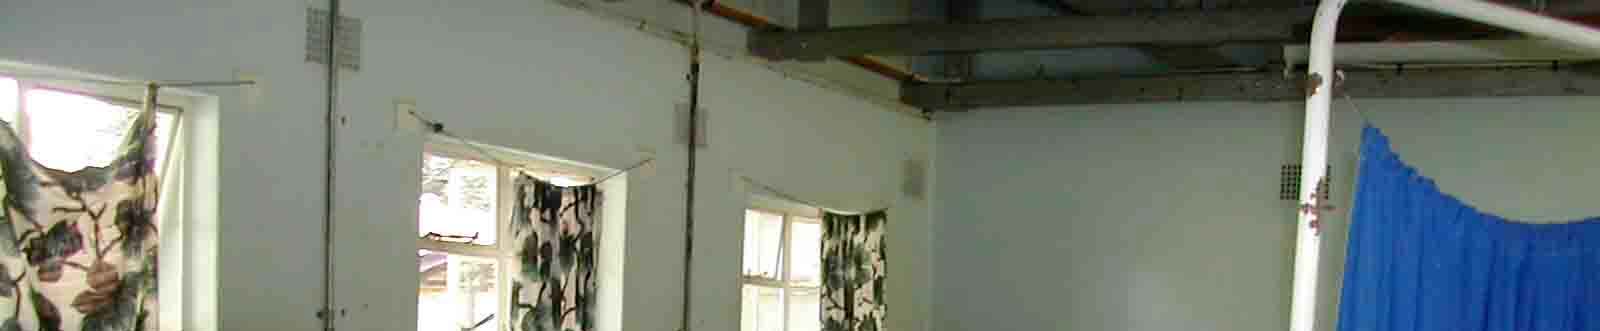
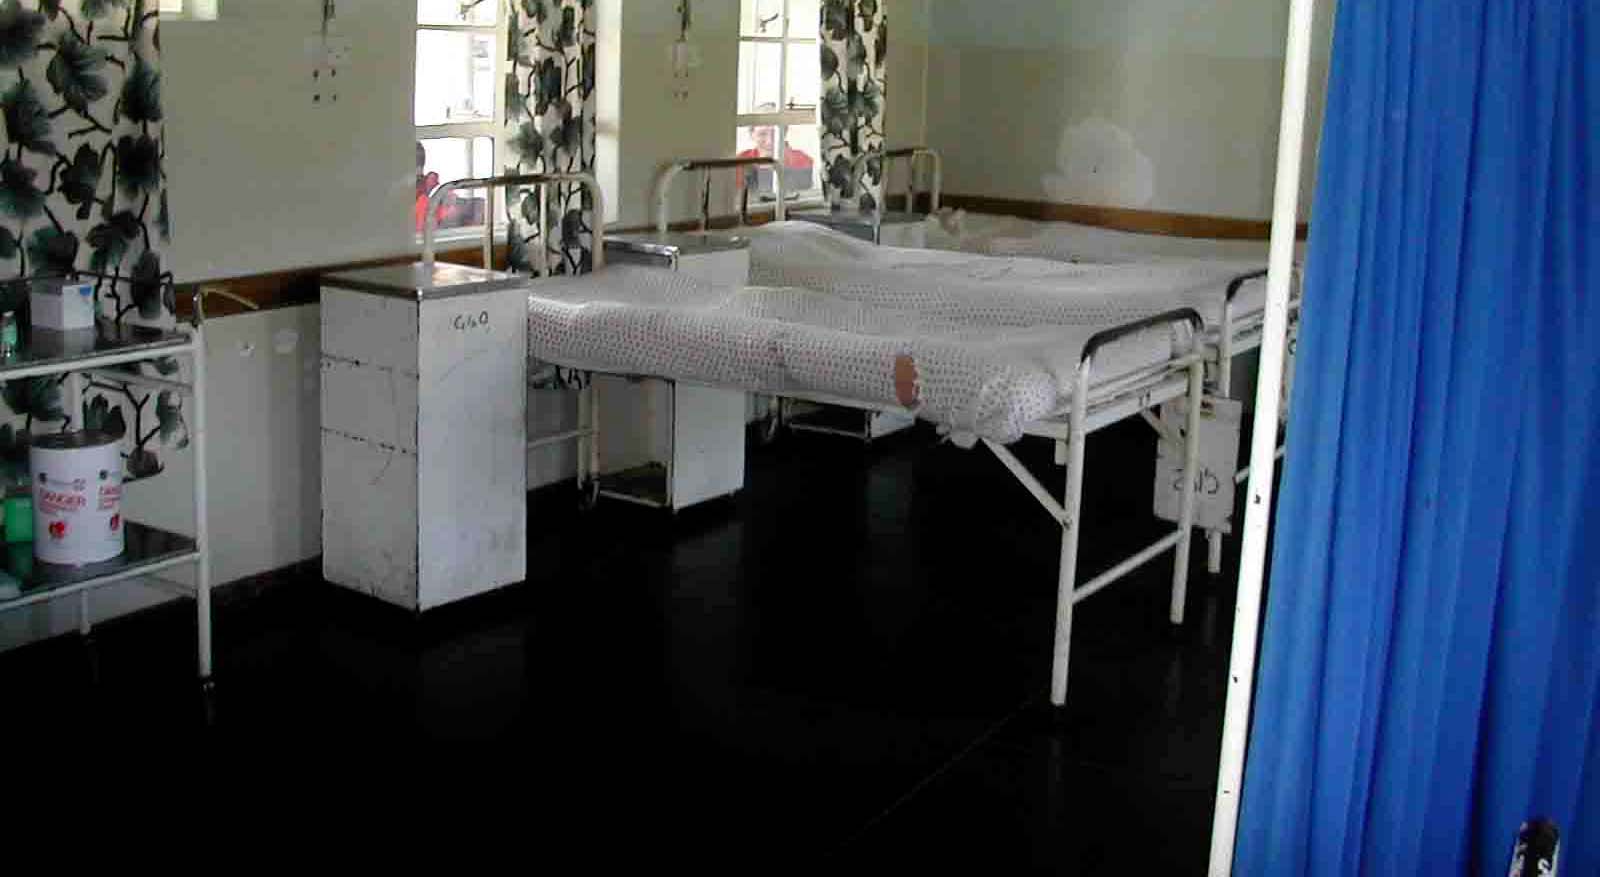
Picture 25 - Control area Chikwaka.
The control group in Katoro was healthy and did not show any special health problems
(55 people).
40
Final Report
Health Assessment Kadoma, Zimbabwe
2.7.3. Hygienic problems
The interviews highlighted some other problems:
In Kadoma town hygienic standards differ within the different town areas. The town is
overcrowded with migrant workers. Most people in the town have access to safe
drinking water. In town there is a waste water system draining to sewage tanks. Waste
collection functions.
In contrast the hygienic condition is poor in the villages where informal small-scale
mining occurs. Water is gained from the river, boreholes, or wells. Water is not safe
due to inappropriate hygienic conditions, and due to mercury leaking into the
waterways. The drinking water is sometimes turbid, which is a sign of insufficient
hygienic quality. Due to mining activities there are many small pools in the area. These
pools are certainly an excellent habitat for transmitters of vector borne diseases, like
Malaria. Most informal small-scale miners to not have any toilet, they just use the bush.
2.7.4. Social problems
In Kadoma district approximately half of the population is directly involved in the mining
and milling activities in the area. Estimations are in the range of 30,000 miners plus
family members, in total approximately 150,000 people. Some miners live with their
families in the mining areas, others live in Kadoma town, where no mining activities
take place.
Only few of the miners have a licensed small-scale mine, most miner work as artisanal
small scale miners. Many of these miners are work migrants. Lack of other employment
and hope of getting "easy money" (gold-rush) are the main reasons to migrate to the
Kadoma area and to begin to work as a small-scale miner. It is possible to get legal
permits for mining in Kadoma at the office of the department of the ministry of mines by
paying an affordable fee.
Living in remote villages means living outside of the security regulations. Since the gold
rush in the year 2000 and later, miners squatted some areas. Mainly old mines, that
were not in use anymore were penetrated. Miners enter the tunnels without any safety
precautions. Occasionally fights break out between miners to get personal access to
the gold promising ores. Sometimes miners exiting the tunnels with ore containing gold
are attacked from other miners. Gold buyers also run the risk of being attacked. Fights
between miners, often drunken, occur often in the villages. There are just very rough
estimations on the death toll of these conflicts, possibly more than 100 miners die each
year due to criminal activities. Neither the police, nor the mining or health authorities
have any exact figures nor do they have any control over the situation. Investigations
by specialists in forensic medicine do not exist.
Some miners are aware of the possibility of environmental and health hazards due the
use of mercury. But due to the lack of job opportunities elsewhere they continue to use
mercury.
Final Report
41
Health Assessment Kadoma, Zimbabwe
2.7.5. General problems during the field project
The infrastructure in the Kadoma district is poor but sufficient to perform the
examination. It is only due to excellent preparation of the field project by UNIDO
Harare, Dennis Shoko and BRGM, Pierre Billaud, that the project was successful at all.
The regional health authorities accepted the project. But on the national level there was
no support for the project. When asked for support before the start of the project, the
Ministry of Health did not support the health assessment. At the end of the project there
was some support from the Ministry of Health due to the intervention of Dr. Muguti, so
that at least the team could export the human bio-monitoring samples.
A problem was the poverty of the population in the area. Many participants suffered
from severe diseases that had not been adequately diagnosed or treated for months
and years due to a lack of resources. During the field project the medical experts
(pediatrician, general practitioner and a surgeon) and the pharmacist diagnosed,
referred or treated many people in Kadoma. Medication was provided free of charge to
the people. This medication was donated by Allacher Apotheke (Munich).
2.7.6. Participation
After the team had finished the examinations at the end of the project, it visited the
workers of Tix mill in their village. As many of the miners had been previously
examined by our team, the acceptance for our team within the village was greater than
expected. On previous projects our teams had been treated with more suspicion. Many
of the Tix miners spoke with the team about the project, about the results of the
examinations and asked, when they would receive the results of their personal mercury
burden of blood and urine.
When the health assessment team came to Tix mill in the first days, the miners were a
little bit suspicious of its intentions. But then most of the people came to the
examination site as if to a feast - often in their best clothes. For them this also seemed
to be a question of honour and dignity.
The people first had to gain confidence in the team and when the team made it's final
visit to the Tix mine community the team members almost seemed to be "old friends".
42
Final Report
Health Assessment Kadoma, Zimbabwe
3. Specimen analysis and statistical results
(Gustav Drasch, Beate Lettmeier)
3.1. LABORATORY METHODS
3.1.1. Material and sample storage
From 273 participants in Zimbabwe 269 blood samples, 273 urine samples and 233
hair samples were taken. The blood samples were taken in EDTA-coated vials. The
urine samples were acidified with acetic acid. To avoid de-gradation, all blood and
urine samples were stored permanently and transported by flight to Germany in an
electric cooling box. Until analysis these samples were stored continuously at 4 °C.
3.1.2. Sample preparation
Hair: 20 mg 200 mg (if available) hair was cut in small pieces and weight exactly.
Missing hair samples are mainly due to the very short hair style of men and children. Some
women refused to give hair samples. All mercury was extracted from the hair samples by
shaking with 10 ml hydrochloric acid 6 N for 15h at room temperature in the dark. Parts of
the elute were analysed by CV-AAS with two different reduction agents (see below).
Intentionally washing steps with water, detergents or organic solvents like acetone
were not performed before the elution. Washing procedures with different solvents are
frequently applied before hair analyses with the aim to remove air-borne heavy metal
pollution from the surface of the hair. But as shown in literature, a distinct differentiation
between air-borne and interior mercury cannot be achieved which such washing
procedures (Kijewski, 1993). Orientating pre-experiments with washing hair samples
from burdened groups supported this assumption. After washing some samples from
the same strain, the results were not reproducible. Therefore the hair samples were
eluted without any further pre-treatment.
Blood, urine: Aliquots of up to 1.0 ml were analysed directly without further pre-
treatment (method see below).
3.1.3. Mercury determination and quality control
The total amount of mercury in the samples (blood, urine, elute from hair) was
determined by means of so-called cold-vapour atomic absorption spectrometry (CV-
AAS), using a Perkin-Elmer 1100 B spectrometer with a MHS 20 and an amalgamation
unit, Perkin-Elmer, Germany. Sodium-borohydride (NaBH4) was applied for the
reduction of all mercury (inorganic and organic bound). NaBH4 reduces inorganic
mercury quicker than organic bound mercury like methyl-mercury. Nevertheless it is
possible with this method, to determine the correct amount of total mercury, because
Final Report
43
Health Assessment Kadoma, Zimbabwe
all nascent mercury vapour is inter-collected on a gold-platinum-net. In a second step
the net is heated and all trapped metallic mercury is released at once and could be
quantified by CV-AAS. The accuracy of the method for inorganic as well as organic
mercury compounds was proved by inorganic and methyl-mercury standard solutions.
The determination limit for total Hg in blood or urine was 0.20 µg/l, for total Hg in hair
0.02 µg/g (calculated for a 100 mg hair sample).
In addition, in the elutes of the hair samples, the amount of inorganic mercury was
determined by CV-AAS, using a Lumex Zeeman mercury analyser RA-915+, Lumex
Ltd., St. Petersburg, Russia. This equipment operates with SnCl2 (tin-II-chloride) for
reduction. With this method, only inorganic mercury can be detected, because under
acid conditions SnCl2 reduces only inorganic mercury and not organic bound mercury
like methyl-mercury. This was proven by inorganic mercury standards (which show a
signal) and methyl-mercury standards (which show no signal at all). The determination
limit for inorganic Hg in hair is 0.05 µg/g (calculated for 100 mg hair).
All analyses were performed under strict internal and external quality control. The
following standard reference materials served as matrix-matched control samples:
human hair powder GBW No. 7601 (certified Hg 0.36 ± 0.05 µg/g) and Seronorm whole
blood No. 201605 (certified Hg 6.8 8.5 µg/l). Since many years the lab participates
successfully in external quality control tests for mercury in human specimen.
3.2. STATISTICAL ANALYSIS
3.2.1. Statistical methods
Statistics were calculated by means of the SPSS 9.0 programme (SPSS-software, Munich,
Germany). As expected, the mercury concentrations in the bio-monitors (blood, urine, hair)
were not distributed normally but left-shifted. Therefore in addition to the arithmetic mean
(only for comparison to other studies) the median (50% percentile) is given. For al
statistical calculations distribution-free methods like the Mann-Whitney-U-test for
comparing two independent groups, the Kruskal-Wallis-test for comparing n independent
groups, the Chi-square test for cross-tables or the Spearman rank test for correlation were
used. "Statistically significant" means an error probability below 5% (p < 0.05).
Some graphs were shows as so-called "box-plots". For a brief explanation: The "box"
represents the inter-quartile (this means from the 25% to the 75% percentile). The
strong line in the box is the median (50% percentile). The "whiskers" show the span.
Outliners are indicated by dots.
3.2.2. Description of mercury levels in urine, blood and hair
In table 9 the total mercury concentrations of all analysed blood, urine and hair
samples are summarised. In 8 blood samples and in 47 urine samples the mercury
concentration was below the detection limit of 0.20 µg/L (equal for blood and urine). For
statistical purposes, in these cases the value was set to ˝ of the detection limit
44
Final Report
Health Assessment Kadoma, Zimbabwe
(0.10 µg/L). In one hair sample the content of total mercury was below the detection
limit (0.02 µg/g). In 196 cases the concentration of inorganic mercury in hair was above
the detection limit of 0.05 µg/g. In these cases the concentration of organic bound
mercury could be calculated by the difference total Hg minus inorganic Hg (table 10).
For comparison the results of the project site in Indonesia (Drasch 2004a) are reported
in the same table 9; further, for blood and urine, the result of a representative
epidemiological study, performed 1990/92 in Germany, an industrial country in Western
Europe (Krause 1996). For a better comparison of the (total) hair values, recently
published own data from Germany are cited (Drasch, 1998). The organic bound Hg in
hair (table 10) was compared to the project in Indonesia, too (Drasch, 2004a).
In recent literature from Europe and Northern America similar Hg concentrations in blood,
urine and hair have been reported (Drasch, 2004a). From populations with a high
consumption of methyl-mercury-contaminated sea food like in Japan, the Faeroes Islands,
the Seychelles or Canadian Inuit higher Hg values in the bio-monitors have been reported
recently e.g. on the International Conferences on "Mercury as a Global Pollutant" 1996 in
Hamburg, Germany, 1999 in Rio de Janeiro, Brazil and 2002 in Minamata, Japan (for
literature in detail see proceedings). From other areas with small scale gold mining like in
the Amazon, Brazil, mercury concentrations, comparable to the found levels, have been
reported e.g. at these congresses or summarised in the book "Mercury from Gold and
Silver Mining: A Chemical Time Bomb?" by de Lacerda and Salomons (1998).
This project
For comparison
Zimbabwe
Indonesia
Germany
(gold mining area)
Hg-blood [µg/l]
case number
269
491
3958
span
< 0.2 100.8
1.45 429
< 0.2 12.2
median
5.62
8.4
0.6
arithmetic. mean
12.55
16.6
0.51
literature
(Krause 1996)
Hg-urine [µg/l]
case number
273
492
4002
span
< 0.2 1530.3
< 0.2 5240
< 0.2 53.9
median
17.06
4.6
0.5
arithmetic. mean
65.32
40.47
1.11
literature
(Krause 1996)
Hg-urine
case number
273
492
4002
[µg/g creatinine]
span
< 0.20 666.8
< 0.20 1697
< 0.1 73.5
median
15.59
2.7
0.4
arithmetic. mean
42.13
17.99
0.71
literature
(Krause 1996)
total Hg-hair [µg/g]
case number
233
488
150
span
< 0.02 112.18
0.33 792
0.04 2.53
median
2.48
2.64
0.25
arithmetic. mean
6.8
9.15
literature
(Drasch 1998)
Table 9 - Concentration of total mercury in blood, urine and hair.
Final Report
45
Health Assessment Kadoma, Zimbabwe
Zimbabwe
Indonesia
(this project)
Organic Hg-hair [µg/g]
case number
211
467
span
< 0.07 16.56
< 0.10 326
median
0.62
1.74
arithmetic. mean
1.53
3.98
Table 10 - Concentration of organic mercury in hair.
All mercury concentrations in the different bio-monitors blood, urine and hair are highly
significant rank correlated (table 2 in appendix 1). Despite this, the individual values
scatter widely (see fig. 5-7).
3.2.3. Exclusion of data
From the total group 19 cases were excluded from further statistical analysis:
- 5 seniors older than 59 years
- 2 participants with severe neurological diseases (1 with Parkinson and 1 with brain
injury caused by car accident)
- 8 participants due to acute high consumption of alcohol
- 3 former miner now living in the control area
- 1 participant discontinued the examinations
It was necessary to exclude these 19 participants for the statistical analysis, as their
symptoms might be due to other reasons.
Nevertheless, for these 19 cases an individual diagnosis of a mercury intoxication was
performed as well.
3.2.4. Forming subgroups due to residence and occupation
To distinguish between the possible sources of mercury burden the remaining 254
participants were subdivided due to residence and occupation criteria to the following
subgroups:
- Chikwaka control group adults:
36 adults from Chikwaka, without any special Hg burden.
- Kadoma, not occupational burdened:
21 adults, living around Kadoma without any special occupational Hg burden.
- Kadoma, other occupational burdened:
19 adult workers (miners and mineral-processors)
- Kadoma, amalgam-burners:
117 adult amalgam-burners from the mining areas
46
Final Report
Health Assessment Kadoma, Zimbabwe
- Kadoma, former occupational burdened:
21 retired workers, still living in the mining areas
- Chikwaka control group children:
12 children from Chikwaka up to 15 years, without any special Hg burden
- Kadoma, children not working with Hg:
12 children (up to 15 years) from the mining areas, not working with mercury
- Kadoma, children working with Hg:
16 children (up to 15 years) from the mining areas, working with mercury
Unless other indicated, all further statistical analysis was performed with these
subgroups.
70
60
50
40
30
20
10
age (years)
0
N =
36
21
19
116
21
12
12
16
control adults
other occup burdened
former miner
children not Hg work
not occup. burdened
amalgam burners
control children
children Hg working
Figure 4 - Age distribution of all volunteers, selected for the statistical evaluation.
Figure 4 shows that the age distribution of the subgroups (as of the adults as of the
children) are comparable.
As expected, there is a surplus of males in most of the occupational burdened groups
(amalgam-burners and children working with mercury; tables 2 and 3 in appendix 1).
This gender difference could not be controlled in field under the given conditions.
Final Report
47
Health Assessment Kadoma, Zimbabwe
Statistical analysis of mercury levels in urine, blood and hair
120
100
80
60
40
20
Hg-blood [µg/L]
0
N =
36
20
19
114
21
12
12
16
control adults
other occup burdened
former miner
children not Hg work
not occup. burdened
amalgam burners
control children
children Hg working
Figure 5 - Total mercury concentration in blood samples.
700
600
500
400
300
200
100
Hg-urine [µg/g creatinine]
0
N =
36
21
19
117
21
12
12
16
control adults
other occup burdened
former miner
children not Hg work
not occup. burdened
amalgam burners
control children
children Hg working
Figure 6 - Total mercury concentration in urine samples.
48
Final Report
Health Assessment Kadoma, Zimbabwe
120
100
80
60
40
20
total Hg-hair [µg/g hair]
0
N =
32
20
19
97
20
5
9
14
control adults
other occup burdened
former miner
children not Hg work
not occup. burdened
amalgam burners
control children
children Hg working
Figure 7 - Total mercury concentration in hair samples.
Statistical testing of the different Hg-burdened subgroups versus mercury concentration in
blood, urine and hair show significant results (tables 2 and 3 in appendix 1, fig. 5 to 7).
As expected, the highest mercury concentration is found in the human bio-monitors of
the highly occupational burdened amalgam-burners and the children working with
mercury, followed by other occupational burdened workers of the Kadoma area. The
mercury levels of the not occupational burdened inhabitants of Kadoma are obviously
lower than of the occupational burdened groups, but significantly higher than in the
control area. Retired workers, still living in the mining area, show still high mercury
levels in the bio-monitors.
The mercury concentration in blood, urine or hair of the control group from Chikwaka is in
the same order of magnitude than in non burdened populations from Western Europe (see
table 1). This is in contrast to the mercury levels of the control population in the Philippines,
investigated by the University of Munich on an UNIDO mission in 1999 and 2000 in the Mt.
Diwata area (Drasch, 2001 ; Böse-O'Reilly, 2003). There an additional high nutritional
burden with methyl mercury from fish and seafood was found. The reversal conclusion is
that almost all mercury in the burdened groups of the Kadoma area in Zimbabwe derived
from gold mining activities (elemental or metal ic mercury).
Figures 8 and 9 show the proportion of spreading of organic and inorganic mercury in
hair. The percentage of organic mercury in the hair samples of the control group is
obviously higher than in the hair samples of the volunteers living in mercury burdened
areas. This means that most of the (low) mercury burden in the control area derives
from nutritional methyl mercury.
Final Report
49
Health Assessment Kadoma, Zimbabwe
The additional occupational burden with mercury vapour raises the percentage of
inorganic mercury in hair from median values of approximately 30% in the control
group to 75 - 80% in the burdened groups.
100%
80%
60%
40%
20%
inorganic Hg in hair
0%
N =
17
20
19
97
20
9
14
control adults
other occup burdened
former miner
children Hg working
not occup. burdened
amalgam burners
children not Hg work
Figure 8 - Percentage of inorganic mercury in hair samples.
100%
80%
60%
40%
20%
organic Hg in hair
0%
N =
17
20
19
97
20
9
14
control adults
other occup burdened
former miner
children Hg working
not occup. burdened
amalgam burners
children not Hg work
Figure 9 - Percentage of organic bound mercury in hair samples.
50
Final Report
Health Assessment Kadoma, Zimbabwe
3.2.5. Mercury Levels compared to Toxicological Threshold Limits
In the international literature only a few threshold limits for mercury in bio-monitors are
recommended. Especially for the exposure to metallic mercury vapour there is not
much data on threshold values available. This metallic mercury vapour is the main
exposure in small scale gold mining areas (Drasch, 2004a). Most studies in this field
are performed in populations with an exclusively methyl-mercury burden from fish or
sea-food, such as the former data from Minamata, or the more recent data from the
Seychelles (Davidson, 1998), the Faeroes Islands (Grandjean, 1997) or even from the
Amazon (Grandjean, 1999). To estimate the toxicological relevance of the burden with
predominantly mercury vapour of the investigated population from Kadoma, the
following threshold limits were used:
a) German human-bio-monitoring (HBM) values for mercury
In 1999 the German Environmental Agency ("Umweltbundesamt") published
recommendations for human-bio-monitoring-values (HBM) for mercury ("Kommission
Human-Bio-monitoring" 1999).
The HBM I was set to be a "check value", this means an elevated mercury
concentration in blood or urine, above which the source of the Hg-burden should be
searched and, as far as possible, eliminated. But even by an exceeding of this HBM I
the authors claimed that a health risk is not to be expected.
In contrast to this, the (higher) HBM II value is an "intervention value". This means, at
blood or urine levels above HBM II, especially over a longer period of time, adverse
health effects cannot be excluded. Therefore interventions are necessary. On the one
hand the source should be found and reduced urgently. On the other hand a medical
check for possible symptoms should be performed. For hair, comparable values are not
established, but the HBM II in blood is directly derived from the assumption of a stable
ratio of mercury in blood and hair (1:300) and the result of the Seychelles study, where
adverse effects could be seen at a mercury concentration in hair above 5 µg/g
(Davidson 1998). Therefore this value was taken in this project as an analogous value
for HBM II for the toxicological evaluation of mercury concentration determined in hair.
It must be kept in mind, that this threshold limit in hair was established in a population
burdened with methyl-mercury from marine food and not with mercury vapour, as is
predominant in the mining areas around Kadoma in Zimbabwe, investigated in this
project.
Final Report
51
Health Assessment Kadoma, Zimbabwe
Hg-blood (µg/l)
Hg-urine
Hg-urine
Hg-hair
(µg/l)
(µg/g creatinine)
(µg/g)
HBM I
5
7
5
HBM II
15
25
20
5 (in analogy)
US EPA
1
bench mark
WHO
50
7
BAT for metallic and inorganic
25
100
Hg
BAT for organic Hg
100
BEI (Biological exposure
15
35
index)
(after working)
(before working)
Table 11 - Toxicologically established threshold limits for mercury in blood, urine and hair (HBM
= Human Bio-Monitoring; BAT = "Biologischer Arbeitsstoff-Toleranzwert" (biological work-
exposure tolerance limit); BEI = Biological Exposure Indices).
In 1991 the WHO expert group stated that mercury in urine is the best indicator for a
burden with inorganic mercury. The maximum acceptable concentration of mercury in
urine was set to 50 µg/l (WHO, 1991). A distinct threshold for mercury in blood was not
given. Mercury in hair is widely accepted as best indicator for the assessment of
contamination in populations exposed to methyl-mercury (de Lacerda 1998). For this, a
maximum allowable concentration of 7.0 µg/g hair was set by the FAO/WHO. In 1997
the US EPA calculated the "benchmark limit" for total Hg in hair to 1 µg/g. This
benchmark was derived from a burden with methyl-mercury from seafood and not with
mercury vapour. US EPA has set a threshold limit for mercury vapour in the ambient
air, but not in bio-monitors (US EPA, 1997).
All these limits and others, former published, are respected at the most recent
recommendation from the German Environmental Agency 1999, as cited above. The
high numbers of recently published investigations on mercury burdened populations
from gold mining areas such as South-America or by sea food as on the Faeroes
Islands or the Seychelles require a continuous re-evaluation of toxicologically defined
threshold limits. Therefore the international latest recommendation from the German
Environmental Agency was taken for further comparison. This was committed with
UNIDO for the total global programme, to obtain comparable results (Veiga, 2003).
b) Occupational threshold limits (BAT, BEI)
Other toxicologically founded limits are occupational threshold limits. Such limits are
established for mercury e.g. in the USA (biological exposure indices BEIs of the
American Conference of Governmental Industrial Hygienists) or Germany (BAT value,
Deutsche Forschungsgemeinschaft (German Scientific Community) 1999).
Very recently the BAT-values for Hg have been cancelled for revision. But for a better
comparison the BAT-values for metallic and inorganic mercury are still taken for this
project for a better comparison to the other health assessment studies in Indonesia and
Tanzania, performed within the "Global Mercury Project" of UNIDO by the Institute of
Forensic Medicine in Munich.
52
Final Report
Health Assessment Kadoma, Zimbabwe
Per definition, these BAT-values are exclusively valid for healthy adult workers under
occupational medical control. The occupational burden must be stopped, if this
threshold is exceeded. These occupational threshold limits are not valid for the total
population, especially not for risk groups like children, pregnant women, and older or ill
persons. Nevertheless, the BAT-values were also taken for a further classifying of the
highest results found in this project. BAT-values for mercury are established only for
blood and urine, but not for hair.
Table 11 gives an overview of the HBM-, BAT- and BEI-values. In the tables 2 and 3 in
appendix 1, the percentage of the exceeding of the HBM II- and BAT-limits in the
various population groups of our project is summarised.
As shown in the next chapters the biological threshold limits should not be
overestimated for the diagnosis. Therefore the question, which of the limits is best for
evaluating the results of this project is only of secondary interest.
3.2.6. Reducing of redundant data for statistical analysis
From the very large data volume (see appendix 2), collected on field by the medical
team, the most relevant facts and test results were selected by pre-investigations (see
tables 2 and 3 in appendix 1). Many test results were primarily scored (for instance: no,
moderate, strong, extreme). For the anamnestic and clinical data these results could be
reduced to a yes/no decision, which enables a statistical analysis and facilitates the
readability of tables 2 and 3 appendix 1 markedly without a relevant loss of information.
The neuro-psychological data (memory, match-box, Frostig, pencil tapping) was
reduced according to a box-plot procedure. With this procedure the results of the
participants could be divided into three categories: The best performing 25% of
participants of each group were given a score of 0 points, the worst performing 25% of
participants were given a score of 2 points and the middle group of participants
received a score of 1 point. In the tables 2 and 3, appendix 1 the results of the
statistical analysis of the transformed anamnestic, clinical and neurological data versus
the different Hg-burdened subgroups, is shown. The significance of the differences was
calculated with Chi-square test. Grey marked fields contain results, differing from the
control group on a statistical significant level (p < 0.05, one-tailed).
In the figures 10 and 11 two anamnestic criteria, "metallic taste" and "excessive
salivation" (only children), are displayed. The figures 12 to 14 show three objective
criteria (bluish discoloration of gingiva, ataxia of gait, dysdiadochokinesia), typical for a
chronic mercury burden. It is striking that in comparison to the control group, many test
results even of the non occupationally Hg-burdened population, living in the mining
areas are considerably worse. The negative results increase even more in the
subgroup of the amalgam burners, which are directly exposed to mercury vapour. The
proportion of children, showing typical symptoms, is elevated in the mining area, too.
Final Report
53
Health Assessment Kadoma, Zimbabwe
Metallic taste
35,0%
31,3%
30,0%
25,0%
17,9%
20,0%
15,0%
10,5%
9,5%
9,5%
8,3%
10,0%
5,6%
5,0%
0,0%
0,0%
control group
not
other
amalgam-
former
control children
children, not
children,
occupational
occupational
burner
occupational
working with
working with
burdened
burdened
burdened
Hg
Hg
Figure 10 - Frequency of the anamnestic parameter "metallic taste".
Children - Excessive salivation
37,5%
40,0%
35,0%
30,0%
25,0%
25,0%
20,0%
15,0%
10,0%
5,0%
0,0%
0,0%
control children
children, not working with Hg
children, working with Hg
Figure 11 - Children; frequency of the anamnestic parameter "excessive salivation".
54
Final Report
Health Assessment Kadoma, Zimbabwe
Adults - Bluish coloration of gingiva
35,0%
31,6%
30,0%
26,3%
23,8%
25,0%
20,0%
15,0%
10,0%
5,6%
5,0%
0,0%
0,0%
control group
not occupational
other occupational
amalgam-burner
former occupational
burdened
burdened
burdened
Figure 12 - Adults; frequency of the anamnestic parameter "bluish coloration of gingiva".
Adults - Ataxia of gait
60,0%
52,4%
50,0%
41,9%
40,0%
30,0%
15,8%
20,0%
14,3%
11,1%
10,0%
0,0%
control group
not occupational
other occupational
amalgam-burner
former occupational
burdened
burdened
burdened
Figure 13 - Adults; frequency of the anamnestic parameter "ataxia of gait".
Final Report
55
Health Assessment Kadoma, Zimbabwe
Dysdiadochokinesia
40,0%
37,5%
33,3%
35,0%
30,0%
26,3%
26,5%
25,0%
23,8%
25,0%
20,0%
15,0%
11,1%
8,3%
10,0%
5,0%
0,0%
control group
not
other
amalgam-
former
control
children, not
children,
occupational
occupational
burner
occupational
children
working with
working with
burdened
burdened
burdened
Hg
Hg
Figure 14 - Frequency of the anamnestic parameter "dysdiadochokinesia".
3.2.7. Scoring of medical results
The evaluation so far showed statistically significant medical test results versus the
different Hg-burdened subgroups. These significant medical test results are typical
clinical signs of chronic mercury intoxication, such as tremor, metallic taste, excessive
salivation, sleeping problems and worsened health problems (Drasch, 1994;
Kommission Human-Bio-monitoring, 1999; Wilhelm, 2000; Drasch, 2004a).
Furthermore ataxia, dysdiadochokinesia, pathological reflexes, coordination problems
and concentration problems are clinical signs of a damaged central and peripheral
nervous system. For a further evaluation of these medical results a medical score was
established. The factors, included in this medical score and the score-points per factor
are shown in table 2. This score was developed from the results of a mercury burdened
group in a gold mining area in the Philippines (Drasch, 2001) and adopted by UNIDO,
to get comparable results (Veiga, 2003). The higher the total medical score is, the more
typical signs of a chronic mercury intoxication were found.
In principle, alcohol abuse may bias the results. Comparing the heavy drinkers among
the amalgam-burners with the other amalgam-burners, there is almost no difference
regarding the Hg-levels in the bio-monitors (fig. 15 and 16). Statistically no significant
differences were found (Mann-Whitney-U-Test). The implication would be similar for
the anamnestic and clinical data of the heavy drinkers in comparison to the other
56
Final Report
Health Assessment Kadoma, Zimbabwe
amalgam-burners. The statistical calculations showed no significant differences (chi-
square-test), too, with one exception: The heavy drinkers reported more frequently
memory problems, a possible bias by alcohol. Beside this, the factor alcohol do not
bias the results.
Statistic testing of the different Hg-burdened subgroups versus the total medical score
sum showed significant results (tables 2 and 3 in appendix 1 and figure 17). The mean
scores of the community of amalgam-burners and children, working with mercury are
higher (= worse) than the control groups. But in comparison to the results of the other
health assessment studies, performed by the Institute of Forensic Medicine, Munich,
within the Global Mercury Project of UNIDO in Indonesia and Tanzania, in Zimbabwe
the difference between the control-group and the Hg-burdened groups was not so
striking. Finding the possible reasons for this may be subject to further comparisons.
120
100
80
60
40
20
Hg-blood [µg/L]
0
N =
89
25
non heavy drinkers
heavy drinkers
Figure 15 - Hg-concentration in blood; comparison of the heavy drinkers with the non heavy
drinkers among the group of amalgam-burners.
Final Report
57
Health Assessment Kadoma, Zimbabwe
600
500
400
300
200
100
Hg-urine [µg/g creatinine]
0
N =
92
25
non heavy drinkers
heavy drinkers
Figure 16 - Hg-concentration in urine; comparison of the heavy drinkers
with the non heavy drinkers among the group of amalgam-burners.
Test
Score Points
Anamnestic data
Metallic taste
0/1
Excessive salivation
0/1
Tremor at work
0/1
Sleeping problems at night
0/1
Health problems worsened since Hg exposed
0/1
Clinical data
Bluish coloration of gingiva
0/1
Ataxia of gait
0/1
Finger to nose tremor
0/1
Dysdiadochokinesia
0/1
Heel to knee ataxia
0/1
Heel to knee tremor
0/1
Mento-labial-reflex
0/1
Proteinuria
0/1
Neuro-psychological tests
Memory test
0/1/2
Matchbox test
0/1/2
Frostig test
0/1/2
Pencil tapping test
0/1/2
Maximum
21
Table 12 - Anamnestic, clinical, neurological and neuro-psychological scoring scale.
58
Final Report
Health Assessment Kadoma, Zimbabwe
14
12
10
8
6
4
2
medical score sum
0
N =
35
21
19
116
21
12
12
16
control adults
other occup burdened
former miner
children not Hg work
not occup. burdened
amalgam burners
control children
children Hg working
Figure 17 - Medical score sum of the different subgroups.
3.2.8. Statistical analysis of mercury levels versus clinical data
Correlation tests between mercury concentrations in the bio-monitors and clinical data
were performed on the subgroup of the amalgam-burners only. These group was
selected, because it is the highest burden group with the highest mercury concentration
in the bio-monitors and the highest frequency of health disturbances, characteristic for
a mercury burden. Performing the same analysis including all investigated persons, or
all volunteers from the gold mining areas, will just "water down" the results.
As can be seen from tables 13 to 17, just a few of the medical data correlate
significantly to the Hg concentration in the bio-monitors (Chi-square-test, Spearman
rank correlation).
Anamnestic data
Hg-Urine
Hg-Blood
total Hg-Hair
MeHg-Hair
(µg/g crea.)
Male/female
+
+
+
+
Age
-
-
-
-
Alcohol consumption
-
-
-
-
Metallic taste
-
-
-
-
Salivation
-
-
-
-
Tremor daily
-
-
-
-
Tremor at work
-
-
-
-
Sleeping problems
-
-
-
-
Health problems worsened since Hg
-
-
-
-
exposed
Lack of appetite
+
-
+
-
Sleep disturbances
-
-
-
-
Easily tired
-
-
-
-
Loss of weight
+
-
+
+
Table 13 - Significant correlations between anamnestic data and mercury concentration in bio-
monitors (group of amalgam-burners only, n = 116).+ = p < 0.05.
Final Report
59
Health Assessment Kadoma, Zimbabwe
Anamnestic data
Hg-Urine
Hg-Blood
Total Hg-Hair
MeHg-Hair
(µg/g crea.)
Rest more
-
-
-
-
Feel sleepy
-
-
+
-
Problems to start things
+
+
+
+
Lack of energy
-
-
-
-
Less strength
-
-
-
-
Weak
-
-
-
-
Problems with concentration
-
-
-
-
Problems to think clear
-
-
-
-
Word finding problems
-
-
-
-
Eyestrain
-
-
-
-
Memory problems
-
-
-
-
Feel nervous
-
-
-
-
Feel sad
-
-
-
-
Headache
-
-
-
-
Nausea
-
-
-
-
Numbness
-
-
-
-
Table 14 - Significant correlations between anamnestic data and mercury concentration in bio-
monitors (group of amalgam-burners only, n = 116).+ = p < 0.05.
Clinical Data
Hg-Urine
Hg-Blood
Total Hg-Hair
MeHg-Hair
(µg/g crea.)
Bluish coloration
-
-
-
-
of gingiva
Gingivitis
-
-
-
-
Ataxia of gait
-
-
-
-
Finger to nose tremor
-
-
-
-
Finger to nose dysmetria
-
-
-
-
Dysdiadocho-kinesia
-
-
-
-
Tremor of eyelid
-
-
-
-
Field of vision
+
-
+
+
Heel to knee ataxia
-
-
-
-
Heel to knee tremor
-
-
-
-
PSR pathologic
-
-
-
-
BSR pathologic
-
-
-
+
ASR pathologic
-
-
-
-
Babinski reflex positive
-
-
-
-
Mento-labial reflex positive
-
-
-
-
Bradykinesia
-
-
-
-
Hypomimia
-
-
-
-
Proteinuria
-
-
-
-
Table 15 - Significant correlations between clinical data and mercury concentration in bio-
monitors (group of amalgam-burners only, n = 116) .+ = p < 0.05.
60
Final Report
Health Assessment Kadoma, Zimbabwe
Neuro-psychological test
Hg-Urine
Hg-Blood
Total Hg-Hair
MeHg-Hair
(µg/g crea.)
Memory test
-
+
-
-
Matchbox test
-
-
-
-
Frostig test
-
-
-
-
Pencil tapping test
-
-
-
-
Table 16 - Significant correlations between neuro-psychological test classes and mercury
concentration in bio-monitors (group of amalgam-burners only, n = 116). + = p < 0.05.
Medical Scores
Hg-Urine
Hg-Blood
Total Hg-Hair
MeHg-Hair
(µg/g crea.)
Anamnestic score
-
-
-
-
Clinical score
-
-
-
-
Neuro-psychological test score
-
+
-
-
Medical score sum
-
+
-
-
Table 17 - Significant correlations between medical scores and mercury concentration in bio-
monitors (group of amalgam-burners only, n = 116). + = p < 0.05.
3.3. DISCUSSION OF THE STATISTICAL ANALYSIS
The relatively poor correlation of classic clinical signs of mercury intoxication to the
mercury concentrations in the bio-monitors (blood, urine, hair, MeHg hair) of the
amalgam-burners may be explained by factors like:
- The mercury concentration in the target tissues, especially the brain, correlates to the
mercury concentration in bio-monitors like urine, blood or hair. This correlation is
statistically significant and good enough to mirror different burden of different groups
(here e.g. workers, non-workers and controls). But the inter-individual differences are so
large that it is rather pointless to conclude the heavy metal burden in the target tissue of
an individual from the concentration in the bio-monitors (Drasch, 1997).
- Most of the amalgam-burners are chronically burdened by mercury and not only acute.
This means that a reversible or even irreversible damage of the central nervous system
may be set months or years before the actual determination of the mercury
concentration in the bio-monitors under a quite different burden. The medical score sum
distinguishes between the control group and the amalgam-burners.
3.4. DECISION FOR THE DIAGNOSIS OF A CHRONIC MERCURY
INTOXICATION
For the different Hg burdened groups (< HBM I; HBM I - HBM II; HBM II - BAT; > BAT)
no striking differences in the results of the medical and neuro-psychological tests could
be seen (for possible reasons, see above). Therefore at least a chronic mercury
intoxication could not be diagnosed on the basis of the blood, urine and/or hair
Final Report
61
Health Assessment Kadoma, Zimbabwe
concentration alone, to what values ever the threshold limits are set (see above). An
intoxication is defined by the presence of the toxin in the body and typical adverse
health effects. Deriving from this interpretation we have tried to find a balanced result
by the combination of mercury concentration in blood, urine and hair and the negative
health effects, as summarised in the medical score sum, as described above in detail
(Drasch, 2001). The medical test scores were divided in three groups, according to the
quartiles (0-25%, 25-75%, 75-100%). Table 18 shows this combination. This definition
of mercury intoxication was committed with UNIDO, to get comparable results in the
different sites in the global project (Veiga, 2003).
Medical Score Sum
0 4
5 9
10 - 21
Hg in all bio-monitors
< HBM I
> HBM I
+
Hg at least in one bio-monitor
> HBM II
+
+
> BAT
+
+
+
Table 18 - Decision for the diagnosis "chronic mercury intoxication".
In principle this means, that the higher the mercury concentration in at least one of the
bio-monitors was, the lower the number of adverse effects for a positive diagnosis of a
mercury intoxication must be and vice versa.
In the present study no case must be classified to be intoxicated with just moderately
elevated mercury levels (i.e. between HBM I and HBM II) and a medical test score sum
in the upper quartile region (score sum 10-21).
24 cases out of 61 with mercury concentrations above the BAT limit showed low
medical sum scores between 0 and 4 (this means without or with just a few clinical
signs). In these cases the exceed of the occupational threshold limit BAT was
predominantly responsible for the classification of an intoxication.
3.5. PREVALENCE OF THE DIAGNOSIS "MERCURY INTOXICATION"
Group
Total number
Number of mercury
% cases, mercury
intoxicated cases
intoxicated
Control adults
36
0
0%
Not occupational burdened
21
1
4.8%
Other occupational burdened
19
12
63.2%
Amalgam-burners
117
82
70.1%
Former occupational burdened
21
5
23.8%
Control children
12
0
0%
Children not working with Hg
12
4
33.3%
Children working with Hg
16
11
68.8%
Table 19 - Frequency of mercury intoxication.
62
Final Report
Health Assessment Kadoma, Zimbabwe
By this classification the results shown in the table 19 and the figure 18 were obtained.
As expected, no volunteer from the control area of Chikwaka has been found to be
mercury intoxicated.
Diagnosis: Mercury Intoxication
80,0%
70,1%
68,8%
70,0%
63,2%
60,0%
50,0%
40,0%
33,3%
30,0%
23,8%
20,0%
10,0%
4,8%
0,0%
0,0%
0,0%
Control adults
not
other
Amalgam-
former
Control
Children not
Children
occupational
occupational
burners
occupational
children
working with
working with
burdened
burdened
burdened
Hg
Hg
Figure 18 - Frequency of the diagnosis "mercury intoxication".
In this study, 70.1% of the amalgam-burners were diagnosed to be mercury
intoxicated. This percentage is markedly higher than we have found recently by
comparable investigations within the Global Mercury Project of UNIDO with the same
protocol in other small scale gold mining areas of Tanzania (25.3%), Sulawesi,
Indonesia (54.1%) and Kalimantan, Indonesia (59.4%).
Some volunteers of the not directly mercury burdened population in Kadoma,
Zimbabwe, are considered to be mercury intoxicated, too (adults: 4.8%; children:
33.3%, here: keep in mind the limited number of 12 cases). The frequency of
intoxication in the group of children working with mercury (68.8%) is as high as of the
adults, occupationally mercury burdened (But again keep in mind the relatively low
number of 16 children working with mercury).
Final Report
63
Health Assessment Kadoma, Zimbabwe
3.6. COMPARISON OF VOLUNTEERS FROM DIFFERENT MINES
Mining areas
Brompton
Amberose
Glasgow
Summir
King Chim
Tix Mine
Mine
Mine
Mine
Mine
Lilly Mine
Jani Mine
Mine
occupation
occupation
occupation
occupatio
occupation
occupation
occupation
occupation
and area
and area
and area
n and area
and area
and area
and area
and area
Anzahl
Anzahl
Anzahl
Anzahl
Anzahl
Anzahl
Anzahl
Anzahl
not occup. burdened
8
8
1
3
other occup burdened
15
4
amalgam burners
43
1
19
18
7
4
21
2
former miner
5
10
1
2
2
children not Hg working
8
4
children Hg working
7
6
2
1
Gesamt
86
1
51
19
10
9
24
2
Table 20 - Distribution of the formed subgroups in the different mining areas.
The volunteers in the Kadoma area derived from one region. But within this region
there is mining in different local mining areas. In these different areas different
techniques for the gold extraction process were used. Therefore, a further
differentiation seems to be of interest.
As shown in table 20, the frequency of the subgroups in the different mining areas
differs widely. Moreover, the number of cases is partially very low. For this reason the
amalgam-burners, presenting the largest subgroup, were selected for a comparison of
the different mining areas.
The figures 19 and 20 reveal the large heterogeneity of the distribution of the amalgam
burners from the different mining areas by age and gender. The number of volunteers
differ widely from mine to mine, too. These differences could not be controlled in field
under the given conditions. Therefore, the following statistical results should just taken
as tendencies and interpreted with care.
The Brompton mine and King Chim mine must be excluded from the comparison,
because the number of volunteers from these areas was too low (1 and 2,
respectively). A sufficient number of amalgam burners could be achieved for Tix mine,
Amberose mine, Glasgow mine, Summit mine, Lilly mine and Jani mine.
64
Final Report
Health Assessment Kadoma, Zimbabwe
60
50
40
30
20
age [years] 10
N =
43
1
18
18
7
4
21
2
Tix Mine
Amberose Mine
Summir Mine
Jani Mine
Brompton Mine
Glasgow Mine
Lilly Mine
King Chim Mine
Figure 19 - Distribution of age versus different mining areas; amalgam-burners only.
Distribution of gender
40
35
35
30
25
20
18
17
male
female
15
13
number of participants
10
8
6
4
4
5
3
3
2
1
1
0
0
0
0
Tix Mine
Brompton
Amberose
Glasgow
Summir
Lilly Mine
Jani Mine
King Chim
Mine
Mine
Mine
Mine
Mine
Figure 20 - Distribution of gender versus different mining areas; amalgam-burners only.
Final Report
65
Health Assessment Kadoma, Zimbabwe
14
12
10
8
6
4
2
medical score sum
0
N =
42
19
18
7
4
21
Tix Mine
Glasgow Mine
Lilly Mine
Amberose Mine
Summir Mine
Jani Mine
Figure 21 - Medical score sum versus different mining areas; amalgam-burners only.
Regarding the median values, the medical score sum is low (good) for Amber Rose
and Summit mine, and higher (worse) for the other mining areas (see Fig. 21).
The mercury concentration in the three biomonitors urine, hair and blood of the
amalgam burners from Jani mine is markedly lower than in the specimen taken from
amalgam burners in other mining areas (see fig. 22 to 24). At a further ranking, the low
case number of the participants from Lilly mine (4) should be kept in mind.
600
500
400
300
200
100
Hg-urine [µg/g creatinine]
0
N =
43
19
18
7
4
21
Tix Mine
Glasgow Mine
Lilly Mine
Amberose Mine
Summir Mine
Jani Mine
Figure 22 - Hg-concentration in urine versus different mining areas; amalgam-burners only.
66
Final Report
Health Assessment Kadoma, Zimbabwe
120
100
80
60
40
20
total Hg hair [µg/g hair]
0
N =
37
17
15
4
1
19
Tix Mine
Glasgow Mine
Lilly Mine
Amberose Mine
Summir Mine
Jani Mine
Figure 23 - Concentration of total Hg in hair versus different mining areas;
amalgam-burner only.
120
100
80
60
40
20
Hg-blood [µg/L]
0
N =
43
19
15
7
4
21
Tix Mine
Glasgow Mine
Lilly Mine
Amberose Mine
Summir Mine
Jani Mine
Figure 24 - Hg-concentration in blood versus different mining areas; amalgam-burner only.
Final Report
67
Health Assessment Kadoma, Zimbabwe
The anamnestic, clinical, neurological and neuro-psychological data of the amalgam
burners from the different mining areas, relevant for the medical score sum are listed in
table 4, appendix 1. Some examples of the comparison of clinical data are shown in the
figures 25 to 27.
Amalgam-burner - Ataxia of gait
75,0%
50,0%
47,4%
47,6%
50,0%
42,9%
40,0%
27,9%
30,0%
20,0%
10,0%
0,0%
Tix Mine
Amberose Mine
Glasgow Mine
Summir Mine
Lilly Mine
Jani Mine
Figure 25 - Frequency of the clinical parameter "ataxia of gait"; amalgam-burner only.
Amalgam-burner - Dysdiadochokinesia
38,1%
40,0%
36,8%
33,3%
35,0%
28,6%
30,0%
25,0%
25,0%
20,0%
15,0%
11,6%
10,0%
5,0%
0,0%
Tix Mine
Amberose Mine
Glasgow Mine
Summir Mine
Lilly Mine
Jani Mine
Figure 26 - Frequency of the clinical parameter "dysdiadochokinesia"; amalgam-burner only.
68
Final Report
Health Assessment Kadoma, Zimbabwe
The rate of mercury intoxication for amalgam-burners is the highest in Lilly mine (but
remind the low number of just 4 cases!). Next are Glasgow and Summit mine. The
lowest incidence was found in Jani mine (see figure 27).
Regarding the selected parameters (clinical data, mercury-levels in biomonitors,
mercury-intoxication) just tendencies could be reflected.
Amalgam-burner - Hg-Intoxication
100,0%
100,0%
88,9%
85,7%
90,0%
80,0%
69,8%
68,4%
70,0%
60,0%
50,0%
42,9%
40,0%
30,0%
20,0%
10,0%
0,0%
Tix Mine
Amberose Mine
Glasgow Mine
Summir Mine
Lilly Mine
Jani Mine
Figure 27 - Frequency of the diagnosis of a mercury intoxication; amalgam-burner only.
To summarize: In Glasgow mine and Summit mine almost all (approximatelx 9 of 10)
amalgam burners are mercury intoxicated. A comparable percentage (85,4%) of
intoxicated amalgam-burners were diagnosed by us in 1999 in the small scale gold
mining region of Mt. Diwata in the Philippines, using the same protocol (Drasch, 2001).
In the Tix mine or Amberose mine approximately 70% of the amalgam burners were
intoxicated. The lowest incidence of mercury intoxications was found for the amalgam
burners in Jani mine: "just" less more than 40%. The burden in the Lilly mine, King
Chim mine and Brompton mine cannot be assessed finally due to the low case
numbers of 4, 2 and 1 volunteer, respectively. Nevertheless it is remarkable, that all 4
volunteers from Lilly mine must be classified as mercury intoxicated.
3.7. INFLUENCE ON NURSED BABIES
One major problem of mercury is a known adverse effect on the growing foetus and
baby due to a high maternal burden and a cross of mercury through the placenta or to
the breast-milk. High numbers of miscarriages, stillbirths and birth defects have been
reported as consequence of the mass intoxication with mercury in Minamata, Japan,
1956 or the Iraq, 1972/73 (Drasch, 2004a). This project in Zimbabwe was not designed
to detect possible adverse effects on the foetus, but as a side result some data on
mercury in breast-milk samples were obtained.
Final Report
69
Health Assessment Kadoma, Zimbabwe
10 samples of mature breast-milk were collected (1 in the control area, Chikwaka and 9
in the mining areas) and analysed for total mercury. In table 21 the cases are shown
individually in decreasing order of the Hg concentration in the breast-milk samples. In
the control-sample from Chikwaka the Hg-concentration is below the detection limit of 1
µg Hg/L breast milk; the range of the breast milk samples from mothers living in the
mining areas is up to 9.70 µg Hg/L. For comparison: In some recent studies from
Germany samples from mature breast-milk maximal mercury concentrations below 2
µg/L have been found (Drasch, 1998).
The highest mercury concentration, determined in this project was 9.7 µg/L. The
mother had been identified as "intoxicated", despite a relatively moderate mercury
concentration in her human bio-monitors. A full nursing of a baby with approximately
850 ml breast milk per day with this mercury concentration of 9.70 µg/L, results in a
daily uptake of approximately 8 µg inorganic mercury. US EPA has calculated the so-
called "Reference Dose" for inorganic mercury to 0.3 µg/ kg body weight and day (US
EPA, 1997). For a 6 kg baby this means a maximum daily uptake of 1.8 µg inorganic
mercury. The real uptake of this baby was approximately 4 times higher. Moreover it
must be considered that the absorption rate for inorganic mercury especially from milk
in the gastro-intestinal tract of babies is markedly higher than of adults (Drasch,
2004a).
Area
Mother's
Hg-
Total-Hg
MeHg-
Hg-U
Hg-B
Mother
Profession
Breastmilk
Hair
Hair
(µg/ g
(µg/L)
intoxicated
(µg/L)
(µg(g)
(µg/g)
creatinine)
Mining area
mineral
9.70
4.57
0.70
39.39
12.00
yes
processor
Mining area
miner
7.75
2.48
0.05
16.25
14.00
no
Mining area
former miner
4.20
2.80
0.07
14.02
4.40
no
Mining area
amalgam-
3.50
2.14
0.53
35.27
7.00
yes
burner
Mining area
amalgam-
2.70
1.93
0.95
6.46
4.48
no
burner
Mining area
mineral
2.40
5.05
0.70
4.32
8.96
yes
processor
Mining area
former miner
1.60
0.83
0.41
8.09
3.70
no
Mining area
other job
< 1.00
1.13
0.47
3.30
2.11
no
Mining area
amalgam-
< 1.00
1.04
0.28
1.07
1.12
no
burner
Control area
farmer
< 1.00
< 0.20
0.21
no
Table 21 - (Total) mercury concentration in breast-milk samples compared to other data
from the mothers.
70
Final Report
Health Assessment Kadoma, Zimbabwe
3.8. SCREENING OF MERCURY URINE CONCENTRATION IN FIELD
In field a mobile Hg analyser (Lumex RA-915+, Lumex Ltd., St. Petersburg, Russia) was
used to screen for inorganic mercury in urine. In the reaction-vessel 5 ml of a solution of
5% tin(II) chloride in hydrochloric acid 3% was filled in and up to 1 ml urine was added. The
formed mercury vapour in the gas phase above the liquid transferred to a quartz cell by a
drawing pump, where it was detected by atomic emission spectrometry. Bottled drinking
water (as to be got locally) was used for all dilutions, and a mercuric nitrate solution for
standard. The detection-limit was approximately 0.5 µg/L urine. As the HBM limits for Hg in
urine are 7 and 25 µg/L, respectively (see table 11), this method seems to be sufficient
sensitive for urine Hg screening in the field. One analysis lasts approximately 3 minutes.
174 urine samples could be analysed with this method in field. Out of them, 45 were below
the detection limit (0.5 µg/L). In 129 cases inorganic mercury concentrations above the
detection-limit could be detected quantitatively.
The correlation between the concentration of inorganic Hg, determined with this
method in field, and the concentration of total Hg, as determined in lab, was excellent
(Spearman-ro = + 0.91, n = 129, statistical highly significant). A scatter plot of the
results above the detection-limits (fig.19) proves the sufficient correspondence of both
methods. In all cases of inorganic Hg-U values in field below the detection limit of
0.5 µg/L, low total Hg-U values (up to 5.5 µg/L) were found in the lab, too. It must kept
in mind that with this field method just inorganic mercury can be detected. But at least
in the mining areas most of the mercury burden of men is inorganic. Furthermore it is
known, that inorganic mercury is much better excreted in urine than organic bound
mercury like methyl-mercury. From this it could be concluded that most mercury in the
urine samples has been in the inorganic form. Nevertheless, as expected, in the mean
the total mercury concentration in urine (as detected in the lab), was higher than the
inorganic mercury concentration determined in field (see regression line in figure 28).
1000
500
400
300
200
100
50
40
30
20
10
field [µg/L]
U
5
4
3
2
ganic Hg-
1
inor
,5
,5
2
4
10
30
50
200
400
1000
1
3
5
20
40
100
300 500
total Hg-U Lab [µg/L]
Figure 28 - Comparison of the concentration of inorganic Hg-U, as determined in field and the total Hg-
U concentration, as determined in the lab (Linear regression line and 90% confidence intervals).
Final Report
71
Health Assessment Kadoma, Zimbabwe
Lab Result
Total
not intoxicated
intoxicated
Field Result
not intoxicated
115
12
127
intoxicated
0
37
37
Total
115
49
164
Table 22 - Comparison of the preliminary classified "mercury intoxicated" in field
and by all lab results.
All data from the medical investigations and from the urine screening were put during
the field project into an excel data sheet . The medical sum score could be calculated
and 37 cases preliminary classified as "mercury intoxicated" by the combination of the
medical sum score and the Hg concentration in urine, as determined in field (according
to table 4 in appendix 1). From the medical sum score and the final lab results, all of
the 37 intoxications could be confirmed. In 12 additional cases, the intoxication was
diagnosed by elevated Hg concentrations in blood and/or hair. Overall, the urine
mercury screening during the field project has proved to be a sound method to get
quick information during the field project on the order of magnitude of the mercury
burden of sub-groups of the population. Together with a computer based evaluation of
the medical results during the field project it was possible to select 3/4 of mercury
intoxicated individuals just during the field mission and to give a primarily estimation of
the local burden situation. Nevertheless, it is necessary to take in addition blood and
hair samples in field and analyze them later in the lab. This is to remind especially in
the case of a predominant burden with methyl-mercury.
72
Final Report
Health Assessment Kadoma, Zimbabwe
4. Summary and Recommendations
(Gustav Drasch, Stephan Boese-O´Reilly)
4.1. SUMMARY
Kadoma is a typical small-scale mining area with approximately 235,000 inhabitants in
the Midlands in Zimbabwe. Artisanal small-scale miners use mercury to extract gold
from the ore. It is estimated that approximately a few hundred thousand people work
and live in similar small scale mining communities all over Zimbabwe.
There is no clean and safe drinking water, no waste disposal for the toxic mercury or
any other waste or human discharge. Hygienic standards are extremely low and are a
reason for many infectious diseases such as diarrhoea, malaria and parasitism.
Accidents in insecure tunnels and amalgamation plants, acute respiratory tract
infections, malaria, tuberculosis, and sexually transmitted diseases including AIDS are
the dominant causes of morbidity and mortality. No proper health service exists in the
mining communities. The District Hospital in Kadoma has very limited means.
The extraction of gold with liquid mercury releases serious amounts of mercury,
especially high toxic mercury fumes into the local environment. The health status of
218 volunteers in Kadoma and 55 from a control area in Chikwaka was assessed with
a standardised health assessment protocol from UNIDO (Veiga, 2003) by an expert
team from the University of Munich/Germany in April 2004.
The mercury levels in the human bio-monitors were much higher in the exposed
population in Kadoma than in the control group (see figure 4, 5 and 6). The exposed
population was divided into sub-groups to compare the levels of exposure. As to be
expected the control group was within a normal range and the amalgam-burners had
the highest exposure levels in all human bio-monitors, while the less exposed
population in the mining areas ranged in between. Child mercury exposure due to living
in the mining areas and working with mercury show similar levels in the bio-monitors as
adult amalgam-burners, children not working but living in the area also have increased
levels, mainly compared to children from the control area. The results of the human
bio-monitoring show clearly the severe exposure of the total population in the mining
areas with mercury; the extreme exposure mainly of amalgam-burners and the
especially severe exposure of children working with mercury. The mercury exposure in
the mining areas is mainly due to exposure with elemental mercury and not due
exposure with methyl-mercury (see figure 8). The relation of inorganic versus organic
mercury in the control population shows the usual exposure of any population, where
most of the mercury exposure derives from the consumption of methyl-mercury
contaminated fish. Whereas in the mining areas the high amounts of inorganic mercury
in hair indicate that the main exposure in the mining areas more then likely derives
from elemental mercury, than from methyl-mercury exposure through contaminated
Final Report
73
Health Assessment Kadoma, Zimbabwe
food. Exposure with elemental mercury derive from handling mercury with bare hands,
but the immanent exposure with mercury vapour might be the more important pathway,
since amalgam-burners show the highest human bio-monitor levels.
Typical symptoms of mercury intoxication were prevalent in the exposed group. The
medical score sum plus the bio-monitoring results made it possible to diagnose in 70%
of the amalgam-burners, 63% of otherwise occupational burdened population and 23%
of former occupational burdened population a chronic mercury intoxication. 5% of the
not occupationally burdened population showed a chronic mercury intoxication and
nobody in the control area was intoxicated. These results confirm severe exposure due
to working with mercury, either by panning with mercury or smelting amalgam.
The different mining areas in Kadoma district use slightly different extraction
technologies. The following differences could be found: In Glasgow mine and Summit
mine almost 90% of the amalgam burners are mercury intoxicated, in Tix mine and
Amber Rose mine approximately 70%. The lowest incidence of mercury intoxications
was found for the amalgam burners in Jani mine: "just" less more than 40%. The
burden in the Lilly mine, King Chim mine and Brompton mine cannot be assessed
finally due to the low case numbers.
Child labour in the mining sites is very common from the age of 10 on, the children
work and play with their bare hands with toxic mercury. Of special notice is, that 0% of
the children from the control area, 33% of children living in the area, but not working
with mercury and 69% of the children working with mercury have a chronic intoxication
with mercury.
Mercury can cause severe damage to the developing brain. From 9 breast milk
samples taken, 4 showed increased levels of mercury.
Poverty is the main reason for the disastrous health status in the small-scale mining
communities. Struggling for pure survival makes mining for gold a necessity to find any
financial resource. The daily fight for survival requires the miners to put their own
health and the health of their children at risk.
A reduction of the release of mercury vapours from small-scale gold mining into the
atmosphere will not only reduce the number of mercury intoxicated people in the
mining area proper, it will reduce the global pollution of the atmosphere with mercury.
Most of the mercury vapours formed by open burning of gold amalgam deposits not
locally but is transported by air on long-range distances all over the globe (Lamborg
2002). The total release of mercury vapour from gold mining is estimated today up to
1,000 metric tons per year (MMSD, 2002), while from all other anthropogenic sources
approximately 1,900 tons were released into the atmosphere (Pirrone, 2001).
These results correspond to former examinations in Zimbabwe, for example the study
from Matchaba-Hove et al. (2001). They found, that "mercury poisoning among gold
panners in Chiweshe and Tafuna communal lands is of public health importance.
Panners should be educated on the possibilities of mercury being a poison. A low cost
74
Final Report
Health Assessment Kadoma, Zimbabwe
and safe technology to separate mercury from the amalgam should be introduced to
the panners".
The result is that mercury is a serious health hazard in the small-scale gold
mining area of Kadoma. The exposure of the whole community to mercury is reflected
in raised mercury levels in the urine, blood and hair. Symptoms of severe damage of
the brain (cerebellum) such as ataxia, tremor and movement disorders were found in
the mining communities. In 70% of the amalgam-burners in Kadoma a mercury
intoxication was diagnosed. The background burden in the control group is in the same
order of magnitude as in western industrial countries.
4.2. CONCLUSIONS AND RECOMMENDATIONS
4.2.1. How to improve "general health"?
Poverty is the main reason for all health and environmental problems.
- At the moment it does not seem to be acceptable that children live in Kadoma small
scale mining areas. Child labour with hazardous chemicals needs to be especially
addressed. Missing sanitary standards and high exposure to mercury are the main
problems. Sanitary standards need urgent improvement.
- The
occupational related health risk of mining should be assessed in more detail
(accidents, drinking water quality, HIV / AIDS, other sexually transmitted diseases,
malaria, tuberculosis). One first step to reduce the health hazards in Kadoma district
might be a proper zoning into industrial areas, commercial areas and housing areas.
Mainly the smelting of amalgam needs to be performed outside the housing areas,
and "away from the nose" of the amalgam-burners. Imposing basic hygienic
standards, such as proper drinking water and reduction of Anopheles mosquitoes is
essential.
- To reduce the obvious risk of accidents in mining sites, raising awareness is
necessary. Introducing proper mining techniques is necessary (e.g. tunnel safety).
- The risk of sexually transmitted diseases could be reduced, if campaigns for safer
sex were more effective.
- To improve the health status of the communities a better financed health service is
urgently required.
4.2.2. How to reduce "mercury as a health hazard"?
Referring to the clinical testing and laboratory results, mercury is a major health hazard
in the area. Some first suggestions are:
- Child labour with highly toxic substances must be stopped immediately. Legal
restrictions on child labour need to be immediately implemented.
- Women in childbearing age need special information campaigns on this risk of
mercury to the foetus and the nursed baby.
Final Report
75
Health Assessment Kadoma, Zimbabwe
- The participants with intoxication need medical treatment. It is necessary to build up
a system to diagnose and treat mercury related health problems in the area.
Capacity building including establishing laboratory facilities in the Kadoma district is
required to analyse mercury in human specimens. The financial aspect of treatment
and the legal problem of importing drugs (chelating agents like DMPS or DMSA, to
sweep mercury out of the body) need to be solved. Funding of preventive
campaigns and for treatment facilities is needed now.
- Training programs for the health care providers in the Kadoma district and other
health centres in mining areas to raise awareness of mercury as a health hazard.
- Continuous clinical training of local health workers, including a standardised
questionnaire and examination flow scheme (MES = mercury examination score).
- Mercury ambulance: A mobile ,,mercury ambulance" might easier reach small-scale
miners, than any local health office. A bus could be used as a mobile mercury
ambulance. Equipped with the necessary medical and laboratory utensils, the bus
could be driven into the mining areas. Two or three specially trained doctors or
nurses could perform the examinations, and begin to carry out treatment. The bus
could also be used for health awareness programs (e.g. video equipment). Miners in
remote areas might welcome any evening entertainment. Soccer videos might
attract more miners to the bus, than much other information material. Why not ask
e.g. sponsors for such a bus (or truck).
4.2.3. How to improve the "knowledge on mercury as a health hazard"
- Assessing in a different study design the possibility of mercury related birth and
growth defects, increased abortion/miscarriage rates, infertility problems, learning
difficulties in childhood or other neuro-psychological problems related to mercury
exposure.
- Assessing in a more detailed study the possible transfer of mercury from mother to
child via breast-milk and the related possible adverse health effects. Females at
childbearing age and before urgently need more awareness to refrain from amalgam
burning, at least during pregnancy and nursing.
4.2.4. How to reduce the "release of mercury into the environment"
- The exposure to mercury for the miners and the community has to be drastically
decreased. Proper mining techniques to reduce the burden of accidents and
mercury exposure are essentially needed. Small-scale miners need all possible
support to introduce cleaner and safer gold mining and extraction technologies.
- The exposure with mercury is avoidable with such simple technology as retorts.
Technical solutions need to go hand in hand with awareness raising campaigns.
- To improve the social, health and environmental situation of artisanal small-scale
gold miners an alliance of local, regional, governmental and intergovernmental
bodies is needed. Cooperation between health, mining and environmental sectors is
needed on local, regional, national and intergovernmental level. E.g. UNIDO and
WHO in Harare could form a nucleus of a national mercury task force.
76
Final Report
Health Assessment Kadoma, Zimbabwe
4.3. LITERATURE
Aaseth J., Jacobsen D., Andersen O., Wickstrom E. (1995) - Treatment of mercury
and lead poisoning with dimercaptosuccinic acid and sodium dimercaptopropane-
sulfonate: A review. Analyst 120, p. 23-38.
Achmadi U.F. (1994) - Occupational exposure to mercury at the gold mining: a case
study from Indonesia. In: Environmental mercury pollution and its health effects in
Amazon River Basin. National Institute Minamata Disease and Inst. Biophysics of the
University Federal do Rio de Janeiro. Rio de Janeiro, p. 10-16.
Akagi H. et al. (1994) - Methyl-mercury pollution in Tapajós River Basin, Amazon.
Environ. Sci. 3, p. 25-32.
Akagi H., Castillo E., Maramba N., Francisco A.T. (1999) - Health assessment for
mercury exposure among children residing near a gold processing and refining plant.
Proc. of the Int Conference Mercury as a Global Pollutant, Rio de Janeiro, Brazil,
p. 421.
Aposhian H.V. et al. (1995) - Mobilization of heavy metals by newer, therapeutically
useful chelating agents. Toxicology 97, p. 23-38.
Barbosa A.C. et al. (1995) - Mercury contamination in the Brazilian Amazon.
Environmental and occupational aspects. Water Air Soil Pollut 80, p. 109-121.
Boese-O'Reilly S., Drasch G., Beinhoff C., Maydl S., Vosko M.R., Roider G. (2003)
- The Mt. Diwata Study on the Philippines 2000 - treatment of mercury intoxicated
inhabitants of a gold mining area with DMPS (2,3-Dimercapto-1-propane-sulfonic acid,
Dimaval ®). The Science of the Total Environment, 307, p. 71-82.
Boischio A.A.P., Henshel D., Barbosa A.C. (1995) - Mercury exposure through fish
consumption by the upper Madeira River population, Brazil. Ecosyst Health 1, p. 177-
192.
Branches F.J.P., Erickson T., Aks S.E., Hryhorczuk D.O. (1993) - The price of gold:
mercury exposure in the Amazon Rain Forest. J. Clin. Toxicol. 31, p. 295-306.
Câmara V.M. (1994) - Epidemiological assessment of the environmental pollution by
mercury due to gold mining in the Amazon River Basin. In: Environmental mercury
pollution and its health effects in Amazon River Basin. National Institute Minamata
Disease and Inst. Biophysics of the University Federal do Rio de Janeiro. Rio de
Janeiro, p. 80-84.
Castillo E.S., Maramba N.F.C., Akagi H., Francisco-Rivera A.T.T. (1999) - Quality
assurance of blood mercury levels among schoolchildren exposed to elemental
mercury in Apokon, Tagum, Davao del Norte, Philippines, 1998. Proc. of the Int
Conference Mercury as a Global Pollutant, Rio de Janeiro, Brazil, p. 422.
Final Report
77
Health Assessment Kadoma, Zimbabwe
Castro M.B., Albert B., Pfeiffer W.C. (1991) - Mercury levels in Yanomami indians
hair from Roraima, Brazil. Proceedings 8th Int. Conference Heavy metals in the
environment. Edinburgh 1, p. 367-370.
Cichini G. et al. (1989) - Effekt von DMPS und D-Penicillamin bei inhalativer
Intoxikation mit metallischem Quecksilber. Intensivmed Notf Med 26, p. 303-306.
Cleary D. et al. (1994) - Mercury in Brazil. Nature, p. 613-614.
Davidson P.W. et al. (1998) - Effects of prenatal and postnatal merthylmercury
exposure from fish consumption on neurodevelopment. J. Am. Med. Assoc. 280,
p. 701-707.
de Lacerda L., Salomons W. (1998) - Mercury from Gold and Silver Mining: A
Chemical Time Bomb? Springer, Berlin, Heidelberg.
Deutsche Forschungsgemeinschaft (ed) (1999) - MAK- und BAT-Werte-Liste 1999.
VCH-Verlagsgesellschaft, Weinheim, Germany.
Drasch G. (1994) - Mercury. In: Seiler HG, Sigel A, Sigel H (eds.): Handbook on
metals in clinical and analytical chemistry. New York: Marcel Dekker, p. 479-494.
Drasch G. et al. (1997) - Are blood, urine, hair, and muscle valid bio-monitoring
parameters for the internal burden of men with the heavy metals mercury, lead and
cadmium? Trace Elem. Electrolytes 14, p. 116-123
Drasch G., Aigner S., Roider G., Staiger F., Lipowsky G. (1998) - Mercury in Human
Colostrum and Early Breast Milk. Ist Dependence on Dental Amalgam and other
Factors. J. Trace Elem. Med. Biol. 12, p. 23-27.
Drasch G., Boese-O´Reilly S., Maydl S., Roider G. (2002) - Scientific comment on
the German human biological monitoring values (HBM values) for mercury.
International Journal Hygiene Environmental Health 205, p. 509-512.
Drasch G., Boese-O'Reilly S., Beinhoff C., Roider G., Maydl S. (2001) - The Mt.
Diwata study on the Philippines 1999 - assessing mercury intoxication of the population
by small scale gold mining. The Science of the Total Environment 267, p. 151-168.
Drasch G., Horvat M., Stoeppler M. (2004) - Mercury. in: Merian E, Anke M, Ihnat M,
Stoeppler M (eds.) Elements and their Compounds in the Environment, Vol. 2. Wiley-
VHC Verlag, Weinheim, Germany.
Florentine M.J., Sanfilippo D.J. (1991) - Elemental mercury poisoning. Clin. Pharm.
10, p. 213-221.
78
Final Report
Health Assessment Kadoma, Zimbabwe
Forsberg B.R. et al. (1994) - High levels of mercury in fish and human hair from the
Rio Negro basin (Brazilian Amazon): natural background or anthropogenic. In:
Environmental mercury pollution and its health effects in Amazon River Basin. National
Institute Minamata Disease and Inst. Biophysics of the University Federal do Rio de
Janeiro. Rio de Janeiro, p. 33-39.
Gonzalez-Ramirez et al. (1998) - DMPS (2,3-Dimercaptopropane-1-sulfonate,
Dimaval) Decreases the Body Burden of Mercury in Humans Exposed to Mercurous
Chloride. J. Pharmacol. Exp. Therap. 287, p. 8-12.
Grandjean P. et al. (1997) - Cognitive deficit in 7-year-old children with prenatal
exposure to methyl-mercury. Neurotoxicol Teratol 19, p. 417-428.
Grandjean P. et al. (1999) - Methyl-mercury Neurotoxicity in Amazonian Children
Downstream from Gold Mining. Environ Health Perspect, 107, p. 587-591.
Kijewski H. (1993) - Die forensische Bedeutung der Mineralstoffgehalte in
menschlichen Kopfhaaren. Schmidt Roemhild Verlag, Lübeck, Germany.
Kommission Human-Biomonitoring des Umweltbundesamtes Berlin - Institut für Wasser-,
Boden- und Lufthygiene des Umweltbundesamtes (1999) Stoffmonographie Quecksilber -
Referenz- und Human-Biomonitoring-Werte (HBM). Bundesgesundheitsblatt: 42:522-532.
Krause C. et al. (1996) - Umwelt-Survey 1990/92, Studienbeschreibung und Human-
Biomonitoring. Umweltbundesamt Berlin, Germany (ed.).
Lamborg C.H., Fitzgerald W.F., O'Donnell J., Torgersen T. (2002) - A non-steady-
state compartment model of global-scale mercury biogeochemistry with
interhemispheric gradients. Geochim Cosmochim Acta 66: p. 1105-1118.
Lockowandt O. (1996) - Frostigs Entwicklungstest der visuellen Wahrnehmung.
Weinheim: Beltz.
Matchaba-Hove R.B., Siziya S., Rusakaniko S., Kadenhe R.M., Dumbu S.,
Chirenda J. (2001) - Mercury poisoning: prevalence, knowledge and frequency of gold
panning and doing retort among alluvial gold panners in Chiweshe and Tafuna
communal lands in Zimbabwe. Cent. Afr. J. Med. 47: p. 251-254.
Malm O. et al. (1995a) - Mercury and methyl-mercury in fish and human hair from
Tapajós River Basin, Brazil. Sci. Tot. Environ. 175, p. 127-140
Malm O. et al. (1995b) - An assessment of Hg pollution in different gold mining areas,
Amzon, Brazil. Sci. Tot. Environ. 175, p. 141-150.
Malm O., Pfeiffer W.C., Souza C.M.M., Reuther R. (1990) - Mercury pollution due to
gold mining in the Madeira River Basin, Brazil. Ambio 19, p. 11-15.
Masur H., Papke K., Althoff S., Oberwittler C. (2005) - Skalen und Scores in der
Neurologie. 2. Auflage, Thieme, Stuttgart.
Final Report
79
Health Assessment Kadoma, Zimbabwe
MMSD (2002) - Breaking New Ground: Mining, Minerals, and Sustainable Development.
International Institute for Environment and Development. Earthscan Publications Ltd,
London, UK. As available at http://www.iied.org/mmsd/finalreport/index.html per
September 2002.
Mtetwa C., Shava S. (2004) - Sociological survey Tix and Ambre Rose Mines,
Harare, UNIDO.
Mtetwa C., Shava S. (2003) - A sociological survey of small-scale artisanal gold mining
in the KadomaChakari area, Harare, UNIDO.
Pirrone N., Munthe J., Barregĺrd L., Ehrlich H.C., Petersen G., Fernandez R.,
Hansen J.C., Grandjean P., Horvat M., Steinnes E., Ahrens R., Pacyna J.M.,
Borowiak A., Boffetta P., Wichmann-Fiebig M. (2001) - Ambient Air Pollution by
Mercury (Hg) Position Paper. Office for Official Publications of the EC. (available on
http://europa.eu.int/comm/environment/air/background.htm#mercury).
US EPA (1997) - Mercury study report to congress. US EPA, Washington, D.C.
Veiga M., Baker R. (2003) - Protocols for Environmental and Health Assessment of
Mercury Released by Artisanal and Small-Scale Gold Miners. UNIDO, Vienna.
WHO (1980) - Recommended health based limits in occupational exposure to heavy
metals. Technical Series Report No 647, Geneva.
WHO (1991) - Environmental Health Criteria 118: Inorganic Mercury. Geneva.
WHO (2004) - Selected health indicators for Zimbabwe.
http://www.who.int/whosis/country/indicators.cfm
Wilhelm M. (2000) - Quecksilber In Boese-O´Reilly S, Kammerer S, Mersch-
Sundermann V, Wilhelm M, Leitfaden Umweltmedizin, 2. Auflage. Urban und Fischer,
München.
World Economic Forum (WEF) (2002) - Global Health Initiative: Private Sector
Intervention Case example. Partnering with African Medical and Research
Foundation (AMREF) to offer HIV prevention and care for 1.500 workers and 120.000
community members for US$ 62 per worker per year. www.weforum.org/globalhealth.
Zimmer R., Volkamer M. (1984) - MOT - Motoriktest. Beltz, Weinheim.
80
Final Report
Health Assessment Kadoma, Zimbabwe
5. Acknowledgements
We would like to thank Dr. Christian Beinhoff and Marcello Veiga from UNIDO/Vienna
for their tremendous support and understanding.
Our national project manager Mr. Shoko receives a very special thank you, since he
organized and was responsible for the excellent performance of the field project. Also
we wish to thank Mr. Allai from UNIDO/Harare very much for his support.
Pierre Billaud from BRGM / France prepared the field project absolutely excellent, and
supported the medical team throughout the project with all his expertise to make it a
very efficient and successful project.
For all their help and understanding we would like to thank very much all the people
from the Local Health Office, especially Tapuwa Mwanjira, Vigilance Parirenyatwa, and
Joan Marembo. Without their tremendous and excellent work the field project would not
have been so successful. Also would we like to thank the District Medical Nurse E.D.
Choto, and the District Medical Officer Dr M. A. Martin that they enabled such
successful field work. The same thank you to Dr Edwin Muguti for his medical
expertise, Spencer Kahwai for his enormous support, Ezekiel Maponga and Felistas
Navhaya for all the daily help.
The Mayflower School, the Kwayedza School, and the mining company in Amber Rose
receive a special thank you for the use of their buildings and for their cooperation.
In Munich we want to thank very much Dr. Gabriele Roider in the Institute of Forensic
Medicine for their great help preparing the mission, and now participating in analyzing
all samples from Zimbabwe.
Thank you also to Mrs. Sigrid Drasch (Allacher Apotheke) for the donation of very
useful medication. A very special thank to Michelle O´Reilly, who supported all the field
projects, and helped very much to make this field report readable.
Finally but most importantly we would like to thank all participants of the medical
examinations and we hope to be able to improve their future living circumstances.
Final Report
81
Health Assessment Kadoma, Zimbabwe
Appendix 1
Tables
Final Report
83
Health Assessment Kadoma, Zimbabwe
-
monitors.
c
e
n
tration in the different bio
con
r
y
e
rcu
s
between the m
rrelation
k
co
an' ran
rm
Table 1 - Spea
Final Report
85
Health Assessment Kadoma, Zimbabwe
Adults in mining areas around Kadoma Zimbabwe
Data or Test
Value or
Chikwaka
KadomaBurdened areas
Score
Control
Not
other
Amalgam-
former
occupational occupational
burner
occupational
burdened
burdened
burdened
Case number
36
21
19
117
21
Anamnestic
data:
Male/female
18/18
2/18
7/12
96/21
8/13
Mean age
28.8
29.0
28.2
27.6
30.6
(years)
Heavy alcohol
2.8%
0%
15.8%
21.4%
9.5%
drinker
Metallic taste
0/1
5.6%
9.5%
10.5%
17.9%
9.5%
Excessive
0/1
11.1%
9.5%
5.3%
13.7%
28.6%
salivation
Tremor at work
0/1
0%
4.8%
5.3%
16.2%
9.5%
Sleeping
0/1
22.2%
0%
15.8%
8.5%
0%
problems
Health
0/1
0%
0%
0%
4.3%
0%
problems
worsened since
Hg exposed
Adults in mining areas around Kadoma Zimbabwe
Data or Test
Value or
Chikwaka
Kadoma
Score
Control
Burdened areas
Not
other
Amalgam-
former
occupational occupational
burner
occupational
burdened
burdened
burdened
Case number
36
21
19
117
21
Anamnestic
data:
Lack of appetite
44.5%
14.3%
31.6%
13.7%
14.3%
Loss of weight
3.8%
0%
0%
2.6%
4.8%
Easily tired
11.1%
19.0%
10.5%
7.7%
4.8%
Rest more
2.8%
19.0%
10.5%
6.0%
4.8%
Feel sleepy
0%
9.5%
5.3%
12.0%
4.8%
Problems to
0%
0%
10.5%
3.5%
0%
start things
Lack of energy
2.8%
14.3%
15.8%
12.0%
9.5%
Less strength
2.8%
14.3%
21.1%
10.3%
9.5%
Weak
5.6%
14.3%
21.1%
11.2%
9.5%
Table 2 - Relevant data of the adults, divided in subgroups. Grey shaded fields in the table
contain results that differ from the control group on a statistically significant level
(p < 0.05, one-tailed Chi-square test).
86
Final Report
Health Assessment Kadoma, Zimbabwe
Adults in mining areas around Kadoma Zimbabwe
Data or Test
Value or
Chikwaka
Kadoma
Score
Control
Burdened areas
Not
other
Amalgam-
former
occupational occupational
burner
occupational
burdened
burdened
burdened
Case number
36
21
19
117
21
Anamnestic data:
Problems with
16.7%
25.0%
31.6%
27.4%
9.5%
concentration
Problems to
5.6%
9.5%
0%
3.4%
0%
think clear
Word finding
0%
0%
0%
0.9%
0%
problems
Eyestrain
5.6%
19.0%
10.5%
20.5%
14.3%
Memory problems
5.6%
19.1%
15.8%
16.2%
4.8%
Feel nervous
8.4%
14.3%
26.3%
14.6%
14.3%
Feel sad
11.1%
28.6%
36.8%
25.2%
23.8%
Headache
25.0%
47.6%
42.1%
26.5%
19.0%
Nausea
0%
14.3%
5.3%
11.1%
9.6%
Numbness
11.2%
19.0%
15.8%
21.4%
9.5%
Adults in mining areas around Kadoma Zimbabwe
Data or Test
Value or
Chikwaka
Kadoma
Score
Control
Burdened areas
Not
other
Amalgam-
former
occupational occupational
burner
occupational
burdened
burdened
burdened
Case number
36
21
19
117
21
Clinical data:
Bluish coloration
0/1
5.6%
0%
26.3%
31.6%
23.8%
of gingiva
Gingivitis
2.8%
0%
0%
0.9%
4.8%
Ataxia of gait
0/1
11.1%
14.3%
15.8%
41.9%
52.4%
Finger to nose
0/1
0%
0%
15.8%
4.3%
0%
tremor
Finger to nose
2.8%
4.8%
5.3%
5.1%
14.3%
dysmetria
Dysdiadochokinesia
0/1
11.1%
23.8%
26.3%
26.5%
33.3%
Tremor of eyelid
44.4%
57.1%
31.6%
43.6%
42.9%
Table 2 (continued).
Final Report
87
Health Assessment Kadoma, Zimbabwe
Adults in mining areas around Kadoma Zimbabwe
Data or Test
Value or
Chikwaka
Kadoma
Score
Control
Burdened areas
Not
other
Amalgam-
former
occupational occupational
burner
occupational
burdened
burdened
burdened
Case number
36
21
19
117
21
Clinical data:
Horizontal field
173.2°
174.3°
167.5°
175.4°
175.3°
of vision
(median)
Heel to knee
0/1
0%
0%
5.3%
14.5%
4.8%
ataxia
Heel to knee
0/1
0%
0%
0%
0.9%
0%
tremor
PSR normal
85.7%
76.2%
78.9%
76.9%
85.7%
BSR normal
97.1%
90.5%
84.2%
81.2%
95.2%
ASR normal
88.6%
76.2%
68.4%
71.8%
61.9%
Mento-labial
0/1
33.3%
23.8%
15.8%
29.1%
28.6%
reflex
pathologic
Bradykinesia
5.7%
9.5%
15.8%
16.2%
9.5%
Hypomimia
2.9%
0%
15.8%
13.7%
9.5%
Proteinuria
0/1
8.3%
9.5%
23.5%
6.3%
0%
Adults in mining areas around Kadoma Zimbabwe
Data or Test
Value or
Chikwaka
Kadoma
Score
Control
Burdened areas
Not
other
Amalgam-
former
occupational occupational
burner
occupational
burdened
burdened
burdened
Case number
36
21
19
117
21
Neuro-
psychological
test
Memory test
0 - 1
13.9%
4.8%
15.8%
8.6%
23.8%
2 - 3
66.7%
61.9%
63.2%
57.8%
42.9%
4
19.4%
33.3%
21.1%
33.6%
33.3%
(worst)
Match box test
13-16
34.3%
33.3%
31.6%
19.0%
33.3%
sec
17-23
42.9%
47.6%
57.9%
49.1%
42.9%
sec
24 44
22.9%
19.0%
10.5%
31.9%
23.8%
sec
(worst)
Table 2 (continued).
88
Final Report
Health Assessment Kadoma, Zimbabwe
Adults in mining areas around Kadoma Zimbabwe
Data or Test
Value or
Chikwaka
Kadoma
Score
Control
Burdened areas
Not
other
Amalgam-
former
occupational occupational
burner
occupational
burdened
burdened
burdened
Case number
36
21
19
117
21
Neuro-
psychological
test
Frostig test
14 - 11
36.1%
66.7%
57.9%
65.5%
47.6%
10 - 9
36.1%
14.3%
31.6%
23.3%
33.3%
8 - 4
27.8%
19.0%
10.5%
11.2%
19.0%
(worst)
Pencil tapping test
71 - 47
28.6%
28.6%
15.8%
37.1%
23.8%
46 - 36
48.6%
33.3%
36.8%
37.9%
66.7%
35 - 11
22.9%
38.1%
47.4%
25.0%
9.5%
(worst)
Adults in mining areas around Kadoma Zimbabwe
Data or Test
Value or
Chikwaka
Kadoma
Score
Control
Burdened areas
Not
other
Amalgam-
former
occupational occupational
burner
occupational
burdened
burdened
burdened
Bio-monitoring
Hg-urine [µg/l]
No.
36
21
19
117
21
median
< 0.2
7.63
18.48
54.49
17.09
> HBM II
0%
19.0%
42.1%
66.7%
33.3%
> BAT
0%
4.8%
5.3%
30.8%
4.8%
max.
8.78
130.19
146.24
1530.32
361.74
Hg-urine [µg/g
No.
36
21
19
117
21
creatinine]
median
< 0.2
6.18
16.81
35.69
11.39
> HBM II
0%
9.5%
42.1%
69.2%
28.6%
max.
3.57
96.07
79.95
547.42
96.41
Table 2 (continued).
Final Report
89
Health Assessment Kadoma, Zimbabwe
Adults in mining areas around Kadoma Zimbabwe
Data or Test
Value or
Chikwaka
Kadoma
Score
Control
Burdened areas
Not
other
Amalgam-
former
occupational occupational
burner
occupational
burdened
burdened
burdened
Bio-
monitoring
Hg-blood [µg/l]
No.
36
20
19
114
21
median
0.43
2.34
10.84
13.18
4.12
> HBM II
0%
0%
31.6%
43.0%
9.5%
> BAT
0%
0%
5.3%
32.5%
4.8%
max.
1.88
10.28
37.40
97.60
55.00
Total Hg-hair
No.
32
20
19
97
20
[µg/g hair]
median
< 0.02
1.63
4.02
4.45
1.88
> 5 µg/g
0%
10.0%
31.6%
45.4%
25.0%
max.
3.25
15.39
75.42
112.18
16.20
Adults in mining areas around Kadoma Zimbabwe
Data or Test
Value or
Chikwaka
Kadoma
Score
Control
Burdened areas
Not
other
Amalgam-
former
occupational occupational
burner
occupational
burdened
burdened
burdened
Case number
36
21
19
117
21
Medical test
median
5
4
5
6
5
score
0-4
40.0%
57.1%
31.6%
31.9%
47.6%
5-9
60.0%
42.9%
63.2%
63.8%
47.6%
10-15
0%
0%
5.3%
4.3%
4.8%
(worst)
HBM II and
BAT
Blood or urine
> HBM II
0%
23.8%
78.9%
79.5%
9.5%
or hair
Blood or urine
> BAT
0%
4.8%
10.5%
43.6%
4.8%
Diagnosis
Hg
No.
0
1
12
82
5
intoxication
(%)
0%
4.8%
63.2%
70.1%
23.8%
Table 2 (continued).
90
Final Report
Health Assessment Kadoma, Zimbabwe
Children in mining areas around Kadoma Zimbabwe
Data or Test
Value or
Chikwaka
Kadoma
Score
Control
Burdened areas
Children
Children, not
Children, working
working with Hg
with Hg
Case number
12
12
16
Anamnestic data:
Male/female
6/6
6/6
15/1
Mean age (years)
12.4
11.3
11.6
Heavy alcohol
0%
0%
0%
drinker
Metallic taste
0/1
0%
8.3%
31.3%
Excessive
0/1
0%
25.0%
37.5%
salivation
Tremor at work
0/1
0%
0%
12.5%
Sleeping problems
0/1
0%
0%
0%
Health problems
0/1
0%
0%
0%
worsened since Hg
exposed
Children in mining areas around Kadoma Zimbabwe
Data or Test
Value or
Chikwaka
Kadoma
Score
Control
Burdened areas
Children
Children, not
Children, working
working with Hg
with Hg
Case number
12
12
16
Anamnestic data:
Lack of appetite
50.0%
8.3%
18.8%
Loss of weight
0%
0%
0%
Easily tired
0%
8.3%
12.5%
Rest more
0%
0%
0%
Feel sleepy
0%
8.3%
6.3%
Problems to start
0%
0%
0%
things
Lack of energy
0%
8.3%
12.5%
Less strength
0%
8.3%
6.3%
Weak
0%
8.3%
12.5%
Table 3 - Relevant data of the children, divided in subgroups. Grey shaded fields in the table
contain results that differ from the control group on a statistically significant level (p < 0.05, one-
tailed Chi-square test).
Final Report
91
Health Assessment Kadoma, Zimbabwe
Children in mining areas around Kadoma Zimbabwe
Data or Test
Value or
Chikwaka
Kadoma
Score
Control
Burdened areas
Children
Children, not
Children, working
working with Hg
with Hg
Case number
12
12
16
Anamnestic data:
Problems with
0%
8.3%
25.0%
concentration
Problems to
0%
0%
0%
think clear
Word finding
8.3%
0%
0%
problems
Eyestrain
33.3%
16.7%
18.8%
Memory problems
8.3%
8.3%
18.8%
Feel nervous
8.3%
0%
6.3%
Feel sad
0%
25.0%
6.3%
Headache
50.0%
33.3%
37.6%
Nausea
16.6%
25.0%
6.3%
Numbness
8.3%
25.0%
6.3%
Children in mining areas around Kadoma Zimbabwe
Data or Test
Value or
Chikwaka
Kadoma
Score
Control
Burdened areas
Children
Children, not
Children, working
working with Hg
with Hg
Case number
12
12
16
Clinical data:
Bluish coloration
0/1
0%
8.3%
18.8%
of gingiva
Gingivitis
0%
0%
Ataxia of gait
0/1
8.3%
8.3%
12.5%
Finger to nose
0/1
0%
0%
0%
tremor
Finger to nose
8.3%
8.3%
0%
dysmetria
Dysdiadochokinesia
0/1
8.3%
25.0%
37.5%
Tremor of eyelid
33.3%
50.0%
37.5%
Table 3 (continued).
92
Final Report
Health Assessment Kadoma, Zimbabwe
Children in mining areas around Kadoma Zimbabwe
Data or Test
Value or
Chikwaka
Kadoma
Score
Control
Burdened areas
Children
Children, not
Children, working
working with Hg
with Hg
Case number
12
12
16
Clinical data:
Horizontal field of
172.0°
174.8°
175.4°
vision (median)
Heel to knee ataxia
0/1
0%
8.3%
6.3%
Heel to knee
0/1
0%
8.3%
0%
tremor
PSR normal
91.7%
75.0%
87.5%
BSR normal
100.0%
83.3%
62.5%
ASR normal
100.0%
83.3%
43.8%
Mento-labial reflex
0/1
25.0%
8.3%
12.5%
pathologic
Bradykinesia
0%
0%
12.5%
Hypomimia
0%
0%
12.5%
Proteinuria
0/1
41.7%
41.7%
43.8%
Children in mining areas around Kadoma Zimbabwe
Data or Test
Value or
Chikwaka
Kadoma
Score
Control
Burdened areas
Children
Children, not
Children, working
working with Hg
with Hg
Case number
12
12
16
Neuro-
psychological
test
Memory test
0 - 1
25.0%
8.3%
0%
2 - 3
41.7%
75.0%
56.3%
4
33.3%
16.7%
43.8%
(worst)
Match box test
10-16 sec
16.7%
16.7%
18.8%
17-24 sec
41.7%
66.7%
50.0%
25 44
41.7%
16.7%
31.3%
sec
(worst)
Table 3 (continued).
Final Report
93
Health Assessment Kadoma, Zimbabwe
Children in mining areas around Kadoma Zimbabwe
Data or Test
Value or
Chikwaka
Kadoma
Score
Control
Burdened areas
Children
Children, not
Children, working
working with Hg
with Hg
Case number
12
12
16
Neuro-
psychological
test
Frostig test
14 - 11
25.0%
41.7%
31.3%
10 - 8
33.3%
50.0%
37.5%
7 - 4
41.7%
8.3%
31.3%
(worst)
Pencil tapping test
71 - 47
16.7%
33.3%
18.8%
46 - 35
33.3%
33.3%
37.5%
34 - 11
50.0%
33.3%
43.8%
(worst)
Children in mining areas around Kadoma Zimbabwe
Data or Test
Value or
Chikwaka
Kadoma
Score
Control
Burdened areas
Children
Children, not
Children, working
working with Hg
with Hg
Bio-monitoring
Hg-urine [µg/l]
No.
12
12
16
median
< 0.2
18.45
17.57
> HBM II
0%
8.3%
43.8%
> BAT
0%
0%
18.8%
max.
0.25
70.53
941.89
Hg-urine [µg/g
No.
12
12
16
creatinine]
median
< 0.2
16.20
29.10
> HBM II
0%
33.3%
56.3%
max.
0.59
56.41
666.87
Table 3 (continued).
94
Final Report
Health Assessment Kadoma, Zimbabwe
Children in mining areas around Kadoma Zimbabwe
Data or Test
Value or
Chikwaka
Kadoma
Score
Control
Burdened areas
Children
Children, not
Children, working
working with Hg
with Hg
Bio-monitoring
Hg-blood [µg/l]
No.
12
12
16
median
0.34
5.52
6.10
> HBM II
0%
0%
37.5%
> BAT
0%
0%
18.8%
max.
0.69
8.16
100.80
Total Hg-hair
No.
5
9
14
[µg/g hair]
median
< 0.02
2.47
3.12
> 5 µg/g
0%
0%
21.4%
max.
0.05
3.42
52.96
Children in mining areas around Kadoma Zimbabwe
Data or Test
Value or
Chikwaka
Kadoma
Score
Control
Burdened areas
Children
Children, not
Children, working
working with Hg
with Hg
Case number
Medical test score
median
5
5
7
0-4
41.7%
41.7%
12.5%
5-9
50.0%
58.3%
75.0%
10-15
8.3%
0%
12.5%
(worst)
HBM II and BAT
Blood or urine or
> HBM II
0%
33.3%
62.5%
hair
Blood or urine
> BAT
0%
0%
31.3%
Diagnosis
Hg intoxication
No.
0
4
11
(%)
0%
33.3%
68.8%
Table 3 (continued and end).
Final Report
95
Health Assessment Kadoma, Zimbabwe
Comparison of the amalgam-burners in different mining areas
Data or Test
Value or
Tix
Amberose Glasgo
Summit
Lilly
Jani
score
Mine
Mine
w Mine
Mine
Mine
Mine
case number
43
18
18
7
4
21
Anamnestic data
metallic taste
0/1
23.3%
10.5%
22.2%
0.0%
0.0%
23.8%
excessive salivation
0/1
18.6%
10.5%
5.6%
0.0%
25.0%
19.0%
tremor at work
0/1
20.9%
0.0%
11.1%
0.0%
50.0%
23.8%
sleeping problems
0/1
9.3%
0.0%
5.6%
14.3%
25.0%
4.8%
health problems
0/1
2.3%
10.5%
5.6%
0.0%
25.0%
0.0%
worsened
Clinical data
bluish coloration of
0/1
34.9%
10.5%
38.9%
0.0%
0.0%
42.9%
gingiva
ataxia of gait
0/1
27.9%
47.4%
50.0%
42.9%
75.0%
47.6%
finger to nose tremor
0/1
7.0%
5.3%
0.0%
0.0%
0.0%
0.0%
Comparison of the amalgam-burners in different mining areas
Data or Test
Value or
Tix
Amberose Glasgo
Summit
Lilly
Jani
score
Mine
Mine
w Mine
Mine
Mine
Mine
case number
43
18
18
7
4
21
Clinical data
dysdiadochokinesia
0/1
11.6%
36.8%
33.3%
28.6%
25.0%
38.1%
heel to knee ataxia
0/1
16.3%
15.8%
11.1%
0.0%
0.0%
23.8%
heel to knee tremor
0/1
2.3%
0.0%
0.0%
0.0%
0.0%
0.0%
mento-labial-reflex
0/1
18.6%
21.1%
44.4%
14.3%
25.0%
47.6%
proteinuria
0/1
9.5%
0.0%
5.6%
0.0%
0.0%
9.5%
neuropsychologi-cal
tests
memory test
0 1
11.9%
15.8%
0.0%
0.0%
25.0%
4.8%
2 3
52.4%
73.7%
44.4%
100.0%
75.0%
38.1%
4
35.7%
10.5%
55.6%
0.0%
0.0%
57.1%
(worst)
Table 4 - Comparison of the amalgam-burners in different mining areas; relevant anamnestic
and clinical data and neuropsychological test for the medical test scoring.
96
Final Report
Health Assessment Kadoma, Zimbabwe
Comparison of the amalgam-burners in different mining areas
Data or Test
Value or
Tix
Amberose
Glasgow
Summit
Lilly Mine
Jani Mine
score
Mine
Mine
Mine
Mine
case number
43
18
18
7
4
21
neuropsychologi-
cal tests
matchboxtest
13 16
14.3%
31.6%
16.7%
57.1%
0.0%
14.3%
sec
17 23
40.5%
47.4%
55.6%
14.3%
50.0%
76.2%
sec
24 44
45.2%
21.1%
27.8%
28.6%
50.0%
9.5%
sec
(worst)
Frostig test
14 11
73.8%
42.1%
72.2%
57.1%
50.0%
61.9%
10 9
19.0%
36.8%
16.7%
28.6%
50.0%
23.8%
8 4
7.1%
21.1%
11.1%
14.3%
0.0%
14.3%
(worst)
Comparison of the amalgam-burners in different mining areas
Data or Test
Value or
Tix
Amberose
Glasgow
Summit
Lilly Mine
Jani Mine
score
Mine
Mine
Mine
Mine
case number
43
18
18
7
4
21
neuropsychologi-
cal tests
Pencil tapping test
71 47
33.3%
42.1%
44.4%
42.9%
50.0%
33.3%
46 36
33.3%
36.8%
27.8%
14.3%
25.0%
61.9%
35 11
33.3%
21.1%
27.8%
42.9%
25.0%
4.8%
(worst)
Table 4 - (continued and end).
Final Report
97
Health Assessment Kadoma, Zimbabwe
Appendix 2
Health assessment questionnaire
Final Report
99
Health Assessment Kadoma, Zimbabwe
Final Report
101
Health Assessment Kadoma, Zimbabwe
102
Final Report
Health Assessment Kadoma, Zimbabwe
Final Report
103
Health Assessment Kadoma, Zimbabwe
104
Final Report
Health Assessment Kadoma, Zimbabwe
Final Report
105
Health Assessment Kadoma, Zimbabwe
106
Final Report
Health Assessment Kadoma, Zimbabwe
Final Report
107
Health Assessment Kadoma, Zimbabwe
108
Final Report
Health Assessment Kadoma, Zimbabwe
Final Report
109
Health Assessment Kadoma, Zimbabwe
110
Final Report
Health Assessment Kadoma, Zimbabwe
Final Report
111
Health Assessment Kadoma, Zimbabwe
112
Final Report
Health Assessment Kadoma, Zimbabwe
Final Report
113
Health Assessment Kadoma, Zimbabwe
114
Final Report
Health Assessment Kadoma, Zimbabwe
Final Report
115
Health Assessment Kadoma, Zimbabwe
116
Final Report
Health Assessment Kadoma, Zimbabwe
Final Report
117
Health Assessment Kadoma, Zimbabwe
Appendix 3
Zimbabwe clinical main data
Final Report
119
Health Assessment Kadoma, Zimbabwe
ID-No.
Area
Occupation
Hg-blood Hg-urine Hg-urine inorg Hg
MeHg
tot-Hg
medical intox
[µg/L]
[µg/L]
[µg/g
[µg/g hair] [µg/g [µg/g hair] score
crea]
hair]
sum
1
Tix Mine
mineral processor
37.40
5.83
51.41
12.35
2.35
14.70
5 intox
2
Tix Mine
mineral processor
21.10
31.99
16.38
3.91
0.11
4.02
8 intox
3
Tix Mine
mineral processor
8.80
146.24
40.04
2.49
0.30
2.79
5 intox
4
Kadoma
gold smelter
51.60
275.50
242.33
13.57
0.94
14.52
9 intox
town
5
Tix Mine
mineral processor
21.10
50.64
79.95
10.20
0.35
10.55
5 intox
6
Tix Mine
mineral processor
18.40
20.09
10.65
2.84
0.14
2.98
5 intox
7
Tix Mine
gold smelter
28.10
15.61
134.11
---
---
---
4 intox
8
Tix Mine
gold smelter
9.36
138.05
54.90
95.62
16.56
112.18
6 intox
9
Tix Mine
gold smelter
39.20
96.35
60.15
33.68
0.18
33.86
2 intox
10
Tix Mine
gold smelter
20.00
11.78
76.10
19.00
0.89
19.89
4
not
intox
11
Tix Mine
gold smelter
18.10
55.66
30.30
---
---
---
4
not
intox
12
Tix Mine
mineral processor
10.24
13.30
36.94
69.94
5.47
75.42
4
not
intox
13
Tix Mine
gold smelter
27.00
86.31
80.86
7.02
0.55
7.57
5 intox
14
Tix Mine
gold smelter
32.60
271.20
106.84
3.60
2.47
6.06
9 intox
15
Tix Mine
gold smelter
30.10
97.67
52.51
4.44
5.46
9.90
8 intox
16
Tix Mine
gold smelter
8.06
25.54
13.87
4.26
0.80
5.06
6 intox
17
Tix Mine
gold smelter
9.00
7.35
3.17
1.03
2.59
3.61
8
not
intox
18
Tix Mine
school child
14.60
56.65
92.43
2.36
3.10
5.46
6 intox
working
19
Tix Mine
school child
3.50
10.17
17.26
---
---
---
6
---
working
20
Tix Mine
mineral processor
18.60
17.53
16.47
2.94
1.77
4.71
4
not
intox
21
Tix Mine
school child
1.23
4.77
5.88
0.38
0.32
0.71
8
---
working
22
Tix Mine
gold smelter
28.80
249.75
283.00
19.96
0.60
20.56
4 intox
23
Tix Mine
other job
1.66
1.63
0.87
0.29
0.09
0.39
4
not
intox
24
Tix Mine
former miner
2.38
0.80
0.37
0.45
0.26
0.71
4
not
(mining area)
intox
25
Kadoma
former miner
2.09
2.01
0.67
0.36
0.29
0.65
9
not
town
(mining area)
intox
26
Tix Mine
former miner
5.22
0.10
0.10
---
---
---
---
---
(mining area)
27
Tix Mine
gold smelter
31.00
3.81
29.35
3.72
5.57
9.29
--- intox
28
Tix Mine
former miner
3.78
5.50
46.18
0.45
0.77
1.23
3
not
(mining area)
intox
29
Tix Mine
gold smelter
74.80
9.12
3.94
16.51
9.73
26.24
--- intox
30
Brompton gold smelter
14.04
4.28
36.93
0.57
1.43
2.00
5 intox
Mine
31
Brompton gold smelter
18.80
1.32
10.42
3.03
0.08
3.11
---
---
Mine
32
Tix Mine
school child not
7.52
70.53
56.41
1.07
0.19
1.26
7 intox
working
33
Tix Mine
gold smelter
17.00
136.46
105.15
1.80
1.13
2.93
3 intox
Final Report
121
Health Assessment Kadoma, Zimbabwe
34
Tix Mine
school child not
5.54
19.26
40.57
1.39
0.50
1.89
5 intox
working
35
Tix Mine
school child
16.16
16.76
82.68
2.81
0.56
3.37
6 intox
working
36
Tix Mine
gold smelter
6.16
0.78
1.54
1.19
0.07
1.26
12 intox
37
Tix Mine
gold smelter
3.86
5.02
4.61
0.73
0.64
1.37
6
not
intox
38
Tix Mine
school child
11.28
116.28
66.19
---
---
---
5 intox
working
39
Tix Mine
school child not
5.54
1.87
4.13
0.63
1.40
2.03
9
not
working
intox
40
Tix Mine
gold smelter
14.84
190.74
105.22
1.69
0.38
2.06
7 intox
41
Tix Mine
gold smelter
13.52
54.49
20.67
0.96
0.70
1.66
7 intox
42
Tix Mine
gold smelter
7.52
46.55
26.70
1.62
0.77
2.39
6 intox
43
Tix Mine
school child
1.00
1.15
0.79
1.05
0.37
1.42
6
---
working
44
Tix Mine
gold smelter
11.56
40.51
70.96
2.48
0.52
2.99
10 intox
45
Tix Mine
mineral processor
10.32
12.38
14.41
2.56
0.62
3.18
3
not
intox
46
Tix Mine
miner
14.00
17.06
16.25
2.42
0.05
2.48
5
not
intox
47
Tix Mine
gold smelter
39.00
3.21
27.41
18.39
0.00
18.08
11 intox
48
Tix Mine
gold smelter
10.16
19.74
14.23
---
---
---
5
not
intox
49
Tix Mine
school child not
4.70
13.38
29.18
1.31
1.23
2.54
5 intox
working
50
Tix Mine
gold smelter
33.30
401.83
124.35
6.37
0.49
6.86
6 intox
51
Tix Mine
gold smelter
7.16
44.43
35.69
---
---
---
5 intox
52
Tix Mine
mineral processor
4.28
40.51
25.90
1.28
1.53
2.81
6 intox
53
Tix Mine
school child not
5.50
9.62
11.06
2.08
0.73
2.81
6
not
working
intox
54
Tix Mine
mineral processor
2.14
6.70
3.34
0.88
0.33
1.22
2
not
intox
55
Tix Mine
gold smelter
4.98
207.78
65.76
1.90
0.53
2.43
5 intox
56
Tix Mine
gold smelter
11.16
80.81
64.19
2.45
1.25
3.70
7 intox
57
Tix Mine
gold smelter
7.84
9.95
14.39
4.48
0.93
5.42
3
not
intox
58
Tix Mine
miner
11.00
36.64
19.29
1.95
1.24
3.19
1
not
intox
59
Tix Mine
other job
3.52
1.84
0.96
0.51
0.27
0.78
1
not
intox
60
Tix Mine
other job
1.85
1.55
1.04
0.76
0.08
0.84
2
not
intox
61
Tix Mine
other job
1.59
3.91
2.29
1.99
0.00
1.97
7
not
intox
62
Tix Mine
mineral processor
2.09
35.86
13.16
0.74
0.12
0.86
7 intox
63
Tix Mine
school child
6.94
18.37
10.78
1.30
1.22
2.52
8
not
working
intox
64
Tix Mine
school child
1.93
196.88
176.46
3.75
0.76
4.51
4 intox
working
65
Tix Mine
gold smelter
4.60
63.14
23.25
19.21
4.25
23.46
4
not
intox
66
Tix Mine
gold smelter
15.52
45.71
63.97
4.46
2.66
7.12
4
not
intox
67
Tix Mine
gold smelter
19.90
186.85
82.27
9.60
0.83
10.43
6 intox
122
Final Report
Health Assessment Kadoma, Zimbabwe
68
Tix Mine
gold smelter
13.92
109.60
57.09
2.40
0.66
3.06
6 intox
69
Tix Mine
gold smelter
11.84
86.12
27.83
1.15
0.47
1.61
6 intox
70
Tix Mine
gold smelter
12.84
12.35
9.62
1.09
3.37
4.45
4
not
intox
71
Tix Mine
other job
8.18
2.65
4.55
2.85
0.00
2.73
5
not
intox
72
Tix Mine
gold smelter
11.84
17.51
23.51
0.60
0.91
1.52
7 intox
73
Tix Mine
former miner
6.42
10.43
5.21
0.79
0.86
1.65
6
not
(mining area)
intox
74
Tix Mine
mineral processor
8.96
4.01
4.32
4.35
0.70
5.05
7 intox
75
Tix Mine
school child not
4.48
18.87
15.58
---
---
---
3
not
working
intox
76
Tix Mine
school child
22.40
292.55
184.05
1.91
2.14
4.05
4 intox
working
77
Tix Mine
school child not
8.16
22.69
35.46
1.99
1.12
3.11
7 intox
working
78
Tix Mine
school child not
6.04
17.43
18.81
0.98
2.44
3.42
4
not
working
intox
79
Tix Mine
mineral processor
16.68
16.77
16.81
1.93
5.21
7.14
10 intox
80
Amberose mineral processor
5.14
7.90
11.07
3.98
0.76
4.75
4
not
Mine
intox
81
Amberose gold smelter
28.20
72.90
116.79
7.41
0.30
7.71
3 intox
Mine
82
Tix Mine
worker at
10.28
7.63
9.53
1.73
0.23
1.95
9
not
cyanidation plant
intox
83
Tix Mine
gold smelter
3.86
9.70
13.99
0.89
0.68
1.57
8
not
intox
84
Amberose mineral processor
10.84
56.44
71.27
2.02
0.29
2.31
9 intox
Mine
85
Amberose gold smelter
15.28
75.50
59.85
3.39
0.15
3.54
5 intox
Mine
86
Tix Mine
gold smelter
44.60
220.74
124.08
12.43
2.63
15.06
4 intox
87
Tix Mine
gold smelter
25.90
38.19
49.67
1.39
1.67
3.06
4 intox
88
Tix Mine
other job
0.67
0.44
0.33
0.53
0.12
0.65
8
not
intox
89
Kadoma
other job
3.02
3.93
1.73
3.03
0.66
3.69
3
not
town
intox
90
Tix Mine
other job
1.93
130.19
96.07
0.38
0.36
0.74
3 intox
91
Tix Mine
gold smelter
2.69
13.96
5.63
---
---
---
5
not
intox
92
Amberose mineral processor
5.32
70.04
28.15
3.10
2.05
5.15
7 intox
Mine
93
Amberose former miner
4.12
36.31
20.03
1.07
0.30
1.37
5 intox
Mine
(mining area)
94
Amberose gold smelter
42.60
165.68
137.07
2.05
10.95
13.00
6 intox
Mine
95
Amberose school child not
4.08
15.72
15.68
1.49
0.98
2.47
6
not
Mine
working
intox
96
Amberose school child not
4.60
21.50
12.25
---
---
---
3
not
Mine
working
intox
97
Tix Mine
gold smelter
3.52
19.81
11.47
1.23
0.41
1.65
9
not
intox
98
Tix Mine
gold smelter
6.92
2.16
4.08
1.13
0.74
1.87
7
not
intox
99
Tix Mine
gold smelter
5.10
68.74
29.14
0.88
0.38
1.26
6 intox
Final Report
123
Health Assessment Kadoma, Zimbabwe
100
Tix Mine
gold smelter
28.60
22.07
11.00
1.40
6.42
7.83
4 intox
101
Tix Mine
former miner
3.64
3.37
1.61
1.39
0.02
1.41
8
not
(mining area)
intox
102
Tix Mine
former miner
55.00
96.24
31.31
2.04
6.90
8.95
6 intox
(mining area)
103
Amberose former miner
19.90
361.74
96.41
4.28
2.17
6.45
3 intox
Mine
(mining area)
104
Amberose gold smelter
25.00
119.14
66.14
---
---
---
7 intox
Mine
105
Amberose gold smelter
29.20
383.69
137.61
5.42
0.24
5.67
7 intox
Mine
106
Amberose gold smelter
79.20
326.13
139.53
---
---
---
4 intox
Mine
107
Amberose gold smelter
21.00
3.63
15.89
2.75
2.21
4.95
4
not
Mine
intox
108
Amberose former miner
9.40
8.85
10.04
1.15
1.35
2.49
4
not
Mine
(mining area)
intox
109
Amberose gold smelter
7.16
44.99
8.87
2.81
0.28
3.09
2
not
Mine
intox
110
Amberose other job
4.36
4.50
1.65
0.99
1.01
2.00
1
not
Mine
intox
111
Amberose other job
3.58
15.09
10.57
4.02
0.00
3.96
7
not
Mine
intox
112
Amberose former miner
3.77
17.90
15.56
1.68
0.12
1.80
3
not
Mine
(mining area)
intox
113
Amberose mineral processor
12.00
18.48
39.39
3.86
0.70
4.57
6 intox
Mine
114
Tix Mine
gold smelter
6.74
18.70
19.36
1.16
2.68
3.84
9
not
intox
115
Tix Mine
gold smelter
6.62
41.90
27.56
7.64
2.77
10.41
8 intox
116
Amberose gold smelter
97.60
592.78
196.45
12.48
0.48
12.96
2 intox
Mine
117
Amberose former miner
5.62
10.69
8.66
13.78
1.10
14.88
8 intox
Mine
(mining area)
118
Amberose school child
36.40
868.04
409.41
13.37
5.86
19.23
6 intox
Mine
working
119
Amberose other job
7.08
5.38
2.63
0.42
1.62
2.04
7
not
Mine
intox
120
Amberose gold smelter
4.14
2.51
2.30
1.13
1.57
2.69
9
not
Mine
intox
121
Amberose school child
9.64
15.30
31.33
0.85
2.03
2.88
7 intox
Mine
working
122
Amberose school child
24.70
97.60
97.62
4.73
0.22
4.95
3
not
Mine
working
intox
123
Amberose school child
56.20
203.89
144.83
9.70
0.15
9.85
4 intox
Mine
working
124
Amberose school child
100.80
941.89
666.87
25.38
3.99
29.37
7 intox
Mine
working
125
Amberose school child
24.00
2.20
0.83
1.64
0.20
1.84
6 intox
Mine
working
126
Amberose school child
48.00
37.31
113.06
11.88
3.42
15.30
8 intox
Mine
working
127
Amberose school child
55.00
41.58
165.66
49.04
3.93
52.96
10 intox
Mine
working
128
Amberose school child not
5.84
21.94
16.71
---
---
---
3
not
Mine
working
intox
129
Amberose gold smelter
8.38
3.56
15.20
1.85
0.00
1.77
3
not
124
Final Report
Health Assessment Kadoma, Zimbabwe
Mine
intox
130
Amberose gold smelter
25.70
32.63
56.95
5.08
1.75
6.83
1 intox
Mine
131
Amberose gold smelter
60.80
9.24
63.16
13.23
5.33
18.56
9 intox
Mine
132
Kadoma
gold smelter
5.62
17.56
10.99
3.09
0.12
3.22
5
not
town
intox
133
Amberose gold smelter
41.60
4.09
51.06
6.25
3.10
9.35
6 intox
Mine
134
Glasgow
gold smelter
22.80
90.35
102.13
9.84
2.90
12.73
8 intox
Mine
135
Glasgow
gold smelter
14.24
226.80
41.03
3.15
0.28
3.43
7 intox
Mine
136
Glasgow
gold smelter
8.64
21.36
13.06
2.86
0.98
3.84
9
not
Mine
intox
137
Glasgow
gold smelter
41.10
156.21
99.21
7.22
0.99
8.21
5 intox
Mine
138
Glasgow
gold smelter
21.90
142.02
71.68
---
---
---
6 intox
Mine
139
Glasgow
gold smelter
6.76
25.87
22.25
3.39
1.06
4.45
7 intox
Mine
140
Glasgow
gold smelter
80.40
228.35
104.03
24.37
12.15
36.52
7 intox
Mine
141
Glasgow
gold smelter
29.20
188.22
120.54
18.28
4.58
22.86
7 intox
Mine
142
Glasgow
gold smelter
9.12
11.78
24.71
3.81
0.90
4.71
4
not
Mine
intox
143
Glasgow
gold smelter
22.80
19.54
47.65
7.74
1.70
9.43
12 intox
Mine
144
Glasgow
gold smelter
34.70
214.15
127.22
2.66
14.35
17.01
9 intox
Mine
145
Kadoma
gold smelter
29.80
313.60
210.61
---
---
---
8 intox
town
146
Glasgow
other job
---
26.89
25.93
2.90
0.98
3.88
3
not
Mine
intox
147
Glasgow
gold smelter
48.00
265.15
127.53
12.46
4.17
16.63
6 intox
Mine
148
Glasgow
gold smelter
45.60 1530.32
547.42
87.45
0.55
87.99
5 intox
Mine
149
Glasgow
gold smelter
13.88
53.69
58.50
4.59
0.29
4.89
6 intox
Mine
150
Glasgow
gold smelter
---
321.06
191.67
56.85
6.44
63.29
7 intox
Mine
151
Glasgow
gold smelter
45.60
342.50
161.21
---
---
---
2 intox
Mine
152
Glasgow
gold smelter
41.00
396.48
154.13
56.88
13.10
69.99
4 intox
Mine
153
Glasgow
gold smelter
---
46.19
19.95
---
---
---
5 intox
Mine
154
Glasgow
gold smelter
---
436.80
219.16
24.28
2.19
26.47
8 intox
Mine
155
Summit
gold smelter
33.90
79.21
78.37
16.08
6.05
22.12
5 intox
Mine
156
Summit
gold smelter
30.10
30.53
69.26
12.73
3.76
16.48
2 intox
Mine
157
Summit
gold smelter
3.56
41.89
8.31
---
---
---
6 intox
Mine
Final Report
125
Health Assessment Kadoma, Zimbabwe
158
Summit
gold smelter
19.30
18.40
13.82
---
---
---
3
not
Mine
intox
159
Summit
gold smelter
29.90
67.24
43.10
5.24
0.02
5.26
7 intox
Mine
160
Summit
gold smelter
33.70
254.65
280.70
18.58
2.30
20.89
9 intox
Mine
161
Summit
gold smelter
61.40
50.31
45.91
---
---
---
4 intox
Mine
162
Summit
school child
5.14
3.10
13.15
---
---
---
8
not
Mine
working
intox
163
Summit
former miner
4.40
37.91
14.02
2.73
0.07
2.80
3
not
Mine
(mining area)
intox
164
Summit
school child
5.26
29.22
31.09
3.93
0.09
4.03
6 intox
Mine
working
165
Summit
gold smelter
30.10
16.59
27.21
9.74
3.41
13.15
3 intox
Mine
166
Lilly Mine
other job
4.96
17.40
19.84
12.28
3.11
15.39
3
not
intox
167
Lilly Mine
school child not
1.28
13.23
6.68
0.32
0.09
0.42
4
not
working
intox
168
Lilly Mine
farmer
3.27
85.33
17.27
4.57
0.55
5.13
2
not
intox
169
Lilly Mine
gold smelter
16.20
377.20
214.89
24.23
7.33
31.56
3 intox
170
Lilly Mine
gold smelter
5.70
26.08
50.81
---
---
---
6 intox
171
Lilly Mine
former miner
6.14
99.68
88.92
---
---
---
6 intox
(mining area)
172
Lilly Mine
former miner
4.12
18.48
18.77
2.03
0.51
2.54
6
not
(mining area)
intox
173
Lilly Mine
gold smelter
4.19
274.21
112.88
---
---
---
9 intox
174
Jani Mine gold smelter
0.60
0.48
0.19
0.40
0.12
0.52
1
not
intox
175
King Chim school child
3.80
5.80
3.48
1.52
0.14
1.66
3
not
Mine
working
intox
176
King Chim gold smelter
7.32
71.83
23.62
27.42
2.65
30.07
8 intox
Mine
177
Lilly Mine
gold smelter
68.20
168.21
264.52
---
---
---
6 intox
178
Jani Mine gold smelter
6.48
59.86
19.52
5.24
0.80
6.04
8 intox
179
Jani Mine gold smelter
12.08
28.16
17.66
0.53
0.43
0.96
8 intox
180
Jani Mine gold smelter
8.12
71.13
25.84
0.97
0.73
1.69
3
not
intox
181
Jani Mine gold smelter
7.14
17.20
21.64
0.50
0.46
0.96
8 intox
182
Jani Mine gold smelter
2.74
13.29
11.50
0.82
0.43
1.25
5
not
intox
183
Jani Mine gold smelter
9.92
61.18
26.54
---
---
---
13 intox
184
Jani Mine gold smelter
8.76
21.04
37.71
1.27
0.25
1.52
9 intox
185
Jani Mine gold smelter
1.72
14.47
9.64
0.83
0.21
1.04
8
not
intox
186
Jani Mine gold smelter
2.81
7.66
2.37
0.43
2.00
2.43
4
not
intox
187
Jani Mine gold smelter
1.23
29.61
20.23
---
---
---
5 intox
188
Jani Mine gold smelter
3.18
0.90
0.89
0.42
0.84
1.25
9
not
intox
189
Jani Mine gold smelter
2.55
2.14
1.29
0.99
1.74
2.73
6
not
intox
190
Jani Mine gold smelter
4.22
4.57
3.56
2.42
0.14
2.56
9
not
126
Final Report
Health Assessment Kadoma, Zimbabwe
intox
191
Jani Mine gold smelter
2.11
8.40
4.48
0.99
0.12
1.11
11 intox
192
Jani Mine gold smelter
1.12
1.70
1.07
0.76
0.28
1.04
6
not
intox
193
Jani Mine former miner
2.97
2.60
2.06
0.50
0.29
0.79
12
not
(mining area)
intox
194
Jani Mine gold smelter
1.62
6.35
4.04
0.35
0.22
0.57
8
not
intox
195
Jani Mine gold smelter
14.28
43.23
35.50
0.78
0.32
1.10
5 intox
196
Jani Mine gold smelter
1.96
15.56
4.29
0.49
0.37
0.86
2
not
intox
197
Jani Mine gold smelter
6.04
109.24
25.05
1.17
0.81
1.98
7 intox
198
Jani Mine former miner
2.82
17.09
9.11
0.81
0.57
1.38
9
not
(mining area)
intox
199
Jani Mine gold smelter
5.16
39.21
18.50
0.87
0.34
1.21
4
not
intox
200
Jani Mine school child
2.42
25.54
27.11
0.32
0.13
0.45
7 intox
working
201
Jani Mine gold smelter
3.15
57.54
25.73
1.74
0.24
1.99
9 intox
202
Amberose former miner
12.80
19.84
11.39
11.09
5.11
16.20
4
not
Mine
(mining area)
intox
203
Amberose school child not
4.44
18.02
11.01
0.99
0.84
1.83
4
not
Mine
working
intox
204
Amberose gold smelter
4.48
2.92
6.46
0.98
0.95
1.93
3
not
Mine
intox
205
Amberose gold smelter
2.84
90.64
33.11
0.87
0.30
1.16
6 intox
Mine
206
Amberose other job
2.27
18.73
6.55
0.79
0.27
1.06
3
not
Mine
intox
207
Amberose former miner
3.92
27.59
16.70
1.63
0.34
1.96
4
not
Mine
(mining area)
intox
208
Amberose former miner
9.28
15.45
7.16
12.51
3.44
15.95
3
not
Mine
(mining area)
intox
209
Amberose former miner
9.48
45.29
21.82
1.81
1.34
3.16
4
not
Mine
(mining area)
intox
210
Amberose gold smelter
7.00
55.25
35.27
1.61
0.53
2.14
8 intox
Mine
211
Amberose gold smelter
7.38
3.93
24.47
4.33
0.85
5.18
11 intox
Mine
212
Amberose former miner
3.70
6.43
8.09
0.42
0.41
0.83
5
not
Mine
(mining area)
intox
213
Amberose school child
3.44
8.24
10.16
1.02
0.34
1.36
10 intox
Mine
working
214
Amberose other job
2.40
40.85
16.04
1.70
0.13
1.83
4
not
Mine
intox
215
Amberose other job
1.38
4.78
2.05
0.46
0.97
1.43
9
not
Mine
intox
216
Amberose other job
1.85
17.63
7.36
---
---
---
9
not
Mine
intox
217
Amberose other job
7.86
10.25
6.18
0.35
0.80
1.15
7
not
Mine
intox
218
Amberose other job
2.11
2.87
3.30
0.66
0.47
1.13
5
not
Mine
intox
219
Chikwaka farmer
0.24
0.10
0.10
0.025
---
0.06
5
not
control
intox
220
Chikwaka other job
0.24
0.10
0.10
0.025
---
0.08
2
not
Final Report
127
Health Assessment Kadoma, Zimbabwe
control
intox
221
Chikwaka other job
0.56
0.10
0.10
0.025
---
0.17
2
not
control
intox
222
Chikwaka other job
0.75
0.10
0.10
0.025
---
0.07
4
not
control
intox
223
Chikwaka farmer
0.32
0.10
0.10
0.025
---
0.03
5
not
control
intox
224
Chikwaka school child not
0.29
0.10
0.10
---
---
---
7
not
control
working
intox
225
Chikwaka farmer
0.45
0.10
0.10
0.025
---
0.09
6
not
control
intox
226
Chikwaka farmer
0.21
0.10
0.10
0.025
---
0.04
6
not
control
intox
227
Chikwaka former miner
0.88
0.10
0.10
0.025
---
0.06
5
not
control
(control area)
intox
228
Chikwaka former miner
0.75
1.90
1.73
0.09
0.11
0.20
4
not
control
(control area)
intox
229
Chikwaka farmer
0.43
0.26
0.17
0.07
0.09
0.16
6
not
control
intox
230
Chikwaka farmer
0.59
0.10
0.10
0.025
---
0.11
6
not
control
intox
231
Chikwaka other job
0.10
0.10
0.10
---
---
--- .
not
control
intox
232
Chikwaka school child not
0.48
0.10
0.10
---
---
---
3
not
control
working
intox
233
Chikwaka school child not
0.24
0.10
0.10
0.025
---
0.02
9
not
control
working
intox
234
Chikwaka school child not
0.40
0.10
0.10
0.025
---
0.05
5
not
control
working
intox
235
Chikwaka other job
0.32
0.10
0.10
0.025
---
0.04
5
not
control
intox
236
Chikwaka farmer
0.24
0.10
0.10
---
---
---
5
not
control
intox
237
Chikwaka other job
0.56
0.10
0.10
---
---
---
3
not
control
intox
238
Chikwaka farmer
0.64
1.00
0.36
0.77
0.24
1.01
5
not
control
intox
239
Chikwaka farmer
0.61
0.10
0.10
0.025
---
0.21
7
not
control
intox
240
Chikwaka farmer
0.61
0.10
0.10
0.025
---
0.01
6
not
control
intox
241
Chikwaka other job
0.37
0.10
0.10
0.025
---
0.10
5
not
control
intox
242
Chikwaka farmer
0.64
0.76
0.61
0.025
---
0.08
6
not
control
intox
243
Chikwaka school child not
0.64
0.10
0.10
0.06
0.21
0.27
2
not
control
working
intox
244
Chikwaka other job
0.24
0.10
0.10
0.025
---
0.07 .
not
control
intox
245
Chikwaka farmer
0.10
0.10
0.10
0.025
---
0.02
7
not
control
intox
246
Chikwaka other job
0.10
0.10
0.10
0.025
---
0.03
6
not
control
intox
247
Chikwaka school child not
1.88
0.10
0.10
0.025
---
0.30
8
not
control
working
intox
248
Chikwaka other job
0.29
0.10
0.10
0.025
---
0.13
4
not
control
intox
128
Final Report
Health Assessment Kadoma, Zimbabwe
249
Chikwaka school child not
0.10
0.10
0.10
0.025
---
0.05
8
not
control
working
intox
250
Chikwaka other job
0.10
0.10
0.10
0.025
---
0.04
4
not
control
intox
251
Chikwaka school child not
0.21
0.25
0.12
---
---
---
5
not
control
working
intox
252
Chikwaka school child not
0.59
0.10
0.10
---
---
---
10
not
control
working
intox
253
Chikwaka farmer
0.56
0.10
0.10
0.025
---
0.30
5
not
control
intox
254
Chikwaka farmer
0.69
0.10
0.10
0.025
---
0.06
6
not
control
intox
255
Chikwaka farmer
0.43
0.10
0.10
0.025
---
0.09
4
not
control
intox
256
Chikwaka other job
0.10
0.10
0.10
0.025
---
0.07
9
not
control
intox
257
Chikwaka school child not
0.10
0.10
0.10
0.025
---
0.04
5
not
control
working
intox
258
Chikwaka school child not
0.10
0.10
0.10
---
---
---
4
not
control
working
intox
259
Chikwaka farmer
0.27
1.81
1.09
---
---
---
6
not
control
intox
260
Chikwaka school child not
0.69
0.10
0.10
---
---
---
4
not
control
working
intox
261
Chikwaka other job
0.27
0.71
0.41
0.025
---
0.03
4
not
control
intox
262
Chikwaka farmer
1.79
0.10
0.10
0.025
---
0.07
4
not
control
intox
263
Chikwaka school child not
0.53
0.10
0.10
0.025
---
0.15
3
not
control
working
intox
264
Chikwaka school child not
0.56
0.10
0.10
---
---
---
1
not
control
working
intox
265
Chikwaka school child not
0.75
0.10
0.10
0.025
---
0.18
2
not
control
working
intox
266
Chikwaka other job
0.59
3.32
2.82
0.08
0.00
0.07
4
not
control
intox
267
Chikwaka school child not
0.37
0.10
0.10
0.025
---
0.04
5
not
control
working
intox
268
Chikwaka school child not
0.24
0.10
0.10
0.025
---
0.04
4
not
control
working
intox
269
Chikwaka farmer
0.29
0.10
0.10
0.025
---
0.02
7
not
control
intox
270
Chikwaka farmer
1.44
0.10
0.10
0.025
---
0.10
3
not
control
intox
271
Chikwaka school child not
0.43
0.10
0.10
---
---
---
8
not
control
working
intox
272
Chikwaka school child not
0.27
0.10
0.10
0.025
---
0.05
7
not
control
working
intox
273
Chikwaka farmer
1.55
8.78
3.57
1.97
1.27
3.25
3
not
control
intox
Final Report
129
Health Assessment Kadoma, Zimbabwe
130
Final Report
Scientific and Technical Centre
Environment and Processes Division
3. avenue Claude-Guillemin
BP 6009 45060 Orléans Cedex 2 France Tél. : +33 (0) 2 38 64 34 34