


Removal of barriers to the introduction
of cleaner artisanal gold mining
and extraction technologies
in the Kadoma-Chakari area, Zimbabwe.
Part A: Environmental Assessment
Final Report
BRGM/RC-53320-FR
September, 2004

Removal of barriers to the introduction
of cleaner artisanal gold mining
and extraction technologies
in the Kadoma-Chakari area, Zimbabwe.
Part A: Environmental Assessment
Final Report
BRGM/RC-53320-FR
September, 2004
UNIDO Contract No. 03/089.
Project No. EG/GLO/01/G34. Activity code: 420C51
P. Billaud, V. Laperche, R. Maury-Brachet,
A. Boudou, D. Shoko, S. Kahwai, Ph. Freyssinet
Checked by:
Approved by:
Original signed by: F. BLANCHARD
Original signed by: D DARMENDRAIL
The quality management system of BRGM is certified according to AFAQ ISO 9001:2000.
Keywords: Mercury, Amalgamation, Gold, Environmental Assessment, Health Assessment,
Artisanal mining, Cleaner technology, Fish, Muscle, Chakari, Kadoma, Zimbabwe.
In bibliography, this report should be cited as follows:
Billaud P., Laperche V, Boudou A., Maury-Brachet R., Shoko D., Kahwai S., Freyssinet Ph.
(2004) ¡ Removal of barriers to the introduction of cleaner artisanal gold mining and extraction
technologies in the Kadoma-Chakari area, Zimbabwe. Part A: Environmental assessment ¡
Final Report. BRGM/RC-53320-FR, 139 p., 65 ill., 4 app., CD with pictures.
® BRGM, 2005. No part of this document may be reproduced without the prior permission of BRGM.
Global mercury project: Environmental assessment Kadoma-Chakari area, Zimbabwe
Executive summary
Introduction
In response to a request from the Government of Zimbabwe and in the framework of
the general project entitled 'Removal of barriers to the introduction of cleaner artisanal
gold mining and extraction technologies', a contract was signed in September 2003
between the United Nations Industrial Development Organisation (UNIDO) and BRGM,
in order to carry out the environmental and health assessment in the Kadoma-Chakari
area. This area is characterised by the presence of thousands of artisanal gold miners
using mercury for gold recovery.
The ultimate aim of the project is to replace mercury amalgamation practice in this area
by alternative technologies, while improving the income and the health of the people
using mercury. It includes a more efficient Hg and gold recovery process, increasing
knowledge and awareness and provides policy advice on the regulation of artisanal
gold mining.
The fieldwork of the environmental assessment of the artisanal gold mining activity in
the Kadoma-Chakari area, selected by UNIDO, was carried out by a joint French
(BRGM) and Zimbabwean team in November 2003 just before the rainy season and
completed in April 2004 during the health assessment survey.
Two fieldwork reports have already been submitted to UNIDO:
- The first one, entitled "Removal of barriers to the introduction of cleaner artisanal
gold mining and extraction technologies in Kadoma-Chakari area. Zimbabwe.
Fieldwork report 1. BRGM/RC-52796-FR", dated December 2003, concerns the
environmental assessment carried out in November 2003.
- The second one, entitled "Health Assessment of small-scale miners in a mercury
contaminated area (Kadoma area. Zimbabwe)" describes the health survey carried
out in April 2004. During this second mission, some additional work was
accomplished for the environmental study.
The final results of the project are given in two separate reports:
- This Final Report (Part A) deals with the environmental survey. It summarises the
fieldwork carried out during the missions of November 2003 and April 2004, the
organisation, the planning and the methodology used for site selection and
sampling. The chemical analysis results are provided site-by-site, followed by the
interpretation, the evaluation of exposure to Hg and the recommendations.
- The Final Report of the health survey (Part B) was completed in November 2004 by
the health team. It summarises the fieldwork carried out in April 2004 and presents
all the specimen analyses and statistical results, with recommendations to improve
the health conditions and reduce hazard relative to the professional use of mercury.
BRGM/RC-53320-FR ¡ Part A: Final report
3
Global mercury project: Environmental assessment Kadoma-Chakari area, Zimbabwe
Site selection
On the basis of the sociological survey, the environmental assessment started by a
preliminary survey north of the town of Kadoma to describe the gold mining and milling
processes implemented by miners and millers and the extent of the milling sites. The
final objective was to select milling sites for the environmental and health survey.
Following the advice of the Kadoma Mine Department, the study was extended south
of Kadoma. Ten milling sites were selected north and south of Kadoma. The detailed
study was completed taking into account the size of the milling centre, the equipment
available for gold processing and its technical status, quality and maintenance, the
number of millers and miners involved, the quantity of mercury used, the presence of
villages near the milling centre, and also the presence of watercourses with a regional
or national impact. According to these parameters, two groups of milling centres could
be determined: the first being representative of gold processing north of Kadoma and
the second representative of the south.
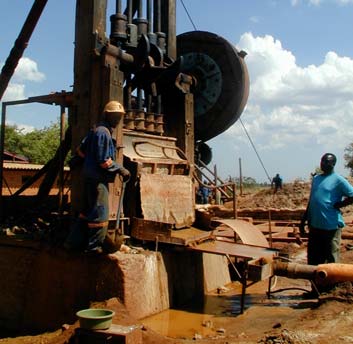
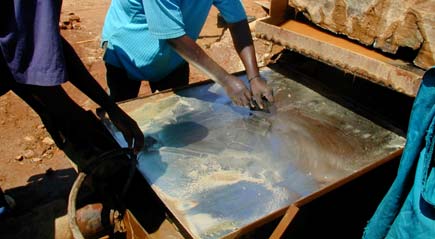
Ore processing and use of mercury
Amalgamation: After extraction by miners, the ore is crushed in custom milling center
with, most of the time, wet stamp mill (with two to four stamps) in batch of 1 to 5 tons.
Jaw-crushers and ball mills are only used in some of the newly equipped mill center.
The pulp produced by the stamp mill through a 48 or 65 mesh screen and composed of
around 20% solids is sent onto a copper-amalgam plate (copper-plate) coated with a
film of mercury.
The quantity of mercury used in the process varies from one place to another, but it is
said that at least 150 g m-2 (3 teaspoons of 45 g each) of mercury are used for this
operation. At the end of the process, when all the batch of ore is crushed, the copper-
plate is scoured with sand or tailings to remove any remaining amalgam. The resulting
bright metallic copper is then rinsed with clean water and washed with a 2 to 3%
solution of cyanide (if available). The millers can use solid Na-cyanide tablets to clean
up the plate by hand without glove or mask protection. Following this procedure, the
amalgam with fine sand particles is collected by hand and then squeezed in a cloth to
remove unused mercury that will be recycled in the next process.
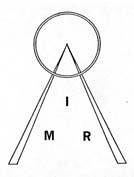
In the milling centre newly equipped with a jaw-crusher and a ball mill, but also in some
of the well-maintained milling centres equipped with a stamp mill, the copper-plate is
replaced by a bowl-concentrator (also called Zimbabwean centrifuge, ABJ bowl or
"speedy bowl") where mercury is added at the beginning of the process at a rate of 25
to 30 g of Hg per ton of ore. At the end of the process the heavy concentrate is
collected at the bottom of the bowl.
Some millers provide the miners with amalgamation barrels, but in many cases, the
miners complete the amalgamation by hand, adding up to 800 g of mercury in plastic
trays. The final separation between the amalgam and heavy minerals is accomplished
by panning. The amalgam is then squeezed in a cloth to remove unused mercury.
4
BRGM/RC-53320-FR ¡ Part A: Final report
Global mercury project: Environmental assessment Kadoma-Chakari area, Zimbabwe
After the copper-plate or the bowl-concentrator, the tailings are evacuated by open
channel or pipes to a settling pond, for clarification and drying. Most of the time, the
water is collected and recycled in the crushing process. Once dry, the tailings are
loaded onto truck and transported to concrete tanks for cyanidation, to recover the
remaining gold.
Roasting: The amalgam is roasted always in the same open places in the milling
centre or back home by the miners. Except at Even Milling Centre and New Plus,
miners, they burn amalgam on a wood fire without further protection. They do not use a
retort or any home-made torch. At low temperatures, the roasting process remains
incomplete resulting in around 20% of residual mercury remaining in the gold beads.
Cyanidation: The rest of the gold contained in the dried tailings, is recovered by vat-
cyanidation. The tailings are leached with Na-cyanide solution for an average of six to
ten days in concrete tanks. The solution that percolates through the tailings is
recovered at the bottom of the tanks where a filtering process (layer of sand) is set up.
The gold-cyanide solution is analysed for gold content using a SnCl2 colorimetric
method. The solution passes through a few columns lined with activated charcoal to
remove the gold from the cyanide solution. After this process, the concentration of the
cyanide solution is adjusted and then re-used in the vats.
Gold extraction from the charcoal is never performed in the milling centre. The millers
send the activated charcoal to other companies that carry out the elution process.
The final tailings of vat-leaching with residual cyanide are generally dumped in outlying
parts of the milling site, but also close to the village, as in the case of Amber Rose. It
can be also used as track construction materials (Tix village).
A general flow sheet summarises the main artisanal gold processing.
Sampling and methodology
In each selected site the sampling locations were determined according to the technical
organisation and composition of the processing equipment, the geomorphology, the
local drainage, the landscape and the proximity of the village. The objective was to
check the source of Hg contamination, its pathways and the level of Hg in the potential
identified targets.
For the environmental survey, a total of 49 soil samples, 39 stream sediment samples,
12 dust samples, 56 tailings samples and seven water samples was collected on the
ten selected sites. Fifty-two fish samples were collected from six sites, in the southern
zone only. Air monitoring was carried out on the three most important sites situated in
the southern zone. All the solid samples were analysed at BRGM laboratories using a
LUMEX RA915+ and 33 duplicate samples of soil, dust and tailings were analysed in
the IMR laboratory in Harare using conventional CV-AAS. Fish samples were analysed
at the University of Bordeaux (LEESA) in France.
BRGM/RC-53320-FR ¡ Part A: Final report
5
Global mercury project: Environmental assessment Kadoma-Chakari area, Zimbabwe
Results
The environmental assessment confirms that miners and panners use large quantities
of Hg in the selected area. The estimation of the quantity of mercury annually
consumed in the Kadoma-Chakari area is difficult according to the lack of available and
official data. It ranges from 1.2 and 17.5 tons of mercury taking into account a range of
100 000 to 700 000 tons of processed ore and 50% of Hg recycling. Amalgamation and
amalgam roasting processes were observed in all sites. Most of the time, these
operations are carried out without any precaution to protect human health. If some
precautions do indeed exist, such as the amalgam roasting room at New Plus and a
shelter for amalgamation at Even Milling Centre, the survey shows that they are not
efficient. At New Plus, the dispersion of Hg in the air during roasting operations is only
shifted several meters further away by the exhaust pipe, but the risk to humans
remains the same. At Even Milling Centre, Hg concentrations continue to be high in the
soil near the shelter provided for amalgamation.
Fish analysis
Total mercury concentrations were measured in 52 fish samples, from six different
species, collected in the Muzvezve River during the sampling campaign in November
2003. This river is roughly 250 km long and flows into Lake Kariba on the Zambezi
River, which constitutes the boundary between Zambia and Zimbabwe in the north-
western part of the country. Fish were captured in six sites along the Muzvezve River.
Sampling sites were determined according to the location of the milling centres (official
gold mining sites) and panning areas (illicit gold mining sites). Mercury determinations
in the dorsal muscle of the fish revealed mercury accumulation for some fish with
concentrations two to four times in excess of the WHO safety limit (0.5 Ág g-1 on a fresh
weight basis or 2.5 Ág g-1 on a dry weight basis). Average mercury concentration in the
52 samples collected was 0.41 ▒ 0.46 Ág g-1 fresh weight. Differences among species
can depend on the diet of the species, with comparatively high levels in the carnivorous
fish (1.05 ▒ 0.44 Ág g-1 Hg fresh weight,) and lower levels in the omnivorous species
(0.12 ▒ 0.09 Ág g-1 Hg fresh weight), except for one omnivorous species that had a
mercury concentration of 0.88 ▒ 0.25 Ág g-1 fresh weight. No sizeable fish was
collected. If the results of the small-sized samples are representative of the area, it is
very likely that most of the fish eaten by the local population along the Muzvezve River
is contaminated with mercury.
Hg hot spot
Two types of "hot spots" are identified, both defined as sites containing high Hg
concentrations relative to the local contamination in soils and sediments.
The first one, called a single-source hot spot, corresponds to a well-delimited pollution
source and is associated with a specific technique used in gold processing, such as
amalgamation, roasting... There is no hot spot with an unknown source. The area
concerned is small ¡ a few hundred square meters ¡ but the consequence in terms of
human exposure is potentially very important for the population of miners.
6
BRGM/RC-53320-FR ¡ Part A: Final report
Global mercury project: Environmental assessment Kadoma-Chakari area, Zimbabwe
The second one, called a multi-source hot spot, corresponds to a wider area
characterised by several but associated single-source Hot Spots. The concerned area
is much more extensive than in the previous case, and the associated pollution can
affect a regional level, spreading far through the mining and milling area with
environmental consequences in a radius exceeding the tens of kilometer scale. The
contamination is more diffuse and may affect the whole population living in the area
and the aquatic environment at a regional scale.
Single-source hot spot: Three main single-source hot spot are found:
- Copper-plate areas are the most contaminated spots as observed in the surrounding
soils within a radius of 10 to 20 m and also in the tailings such as at Tix, New Plus,
Etena, Summit and Glasgow mills. Contamination of soils does not seem to disperse
very far from these emission sources. In contaminated places, the Hg values in the
soils are ten to four hundred times the local background that is 0.02 to 0.12 mg kg-1.
The air monitoring carried out at Tix mill shows a Hg concentration sixty times higher
(108 Ág m-3) than the local background (1.7 Ág m-3) during the operations on the
copper-plate. By comparison, at Amber Rose, where a bowl-concentrator is operated,
the Hg concentration in the air reaches 67 Ág m-3 that is forty times the local
background. At Tix, the loss of Hg in these areas follows two pathways;
À first, the tailings, which flow on the copper-plate throughout the process, and
À second, the air, mainly at the end of the process, when the miners are scraping
and washing the copper-plate.
It is also in this area that the concentration of workers (miners and millers) is the
most important during the process.
- The second single-source Hot Spot corresponds to:
À the free amalgamation sites,
À the bowl-concentrator surrounding area in the mill centre, where miners are up-
grading manually the amalgam mixed with tailings, and
À amalgamation sites such as in the villages (Tix) or on the bank of a reservoir (Claw
Dam) or river (small stream or Muzvezve River) where miners and panners use
pans to concentrate the gold particles and plastic basins to amalgamate the gold.
At Even Milling Centre, which is one of the better and cleaner milling centres, the
Hg concentration in soil (23.55 mg kg-1) is more than one hundred fifty times the
local background 5 metres away from the amalgamation shelter. The dust
collected within a radius of 3 m on the concrete floor around the workers, who
perform amalgamation under the shelter, reaches 74.60 mg kg-1 that is five
hundred times the background.
At the Claw Dam bank, downstream from Tix village, the Hg concentration in
sediments can reach 8 to 10 mg kg-1 that is twenty times the local background at
the sites of digging, panning and amalgamation activities. These kinds of sites are
favourable environments to generate methylmercury (MeHg). These sites are also
known as fishing spots, where fish with high Hg levels were collected.
- The third single-source hot spot corresponds to the free roasting sites or roasting
rooms. High concentrations of Hg were measured during the air monitoring within a
BRGM/RC-53320-FR ¡ Part A: Final report
7
Global mercury project: Environmental assessment Kadoma-Chakari area, Zimbabwe
radius of 1 to 3 meters around the free roasting sites located in the middle of the
village, such as at Tix. The Hg concentration reaches nine to eighty times the local
background of air (0.2 Ág m-3 outside the copper-plate area). Even when a specific
room is built, with specific equipment including an air extractor, to roast the
customers' amalgam, the risk is still present, as at New Plus, where the dust
collected on the concrete floor close to the exhaust pipe reaches 50.5 mg kg-1 Hg.
Multi-source hot spot: Among the sites studied, the multi-source hot spots can be
located:
- At Tix, which is the most important, including the mill, the village, and the area
surrounding the mining and amalgamation activities on the Claw Dam banks. This
area is characterised by a group of scattered single-source hot spots, such as four
copper-plates, many but not well located roasting areas at the entrance to the mill, in
the village itself, and many amalgamation areas along the Claw Dam bank.
Moreover, the same types of activities have been observed during the
environmental assessment in other villages close to Tix, such as Mhisi and May
Flower. Artisanal activity has been in progress for many years. Several tens of
thousands of people are exposed directly or indirectly to this multi-source hot spot.
- At Amber Rose, contamination is less important than in Tix. But the contaminated
tailings are dumped very close to the village and often spread out on the tracks in
the village. Tailings may also contaminate the sediments in the tributaries of the
Muzvezve River. Roasting locations may also contribute to the local contamination
of the environment by their emissions.
- All along the Muzvezve River, where panners use Hg over a distance of at least
7 km corresponding to the studied zone. This distance is certainly longer than that,
but an inventory of the panning areas upstream and downstream from the zone
visited is necessary to ascertain the actual extent. Results of Hg concentration in
carnivorous fishes, which are good bioindicators of the contamination, show the Hg
contamination reached the living aquatic environment.
- The Etena area, in the northern zone can be classified as a multi-source hot spot
according to the Hg concentrations found in the tailings close to the stamp mill, but
also in the soils near the many amalgamation and roasting sites in the village.
Evaluation of exposure
Direct exposures to Hg contamination have been observed for miners and millers men
and sometime women who are working close to the copper-plate. Exposure to mercury
occurs by skin contact, vapour inhalation, and particle ingestion.
Amalgamation and roasting areas are also the sites of direct exposure through the
same way. Young men who are frequently involved in the amalgamation process are
affected.
Passive exposure may be suspected because this artisanal activity is performed in
villages and along the riverbanks. Children and women are frequently present in the
proximity of this activity.
8
BRGM/RC-53320-FR ¡ Part A: Final report
Global mercury project: Environmental assessment Kadoma-Chakari area, Zimbabwe
The following table summarises the exposure pathways and related risks.
Non
Exposure
Professional
Sources
professional
Observations
route
exposure
exposure
Skin contact
***
0
Copper plate
Inhalation
***
*
Most of the milling centre
Dust ingestion
**
*
Free
Skin contact
**
0
All milling centre, villages,
amalgamation
Inhalation
**
*
the Claw Dam bank and
sites
Dust ingestion
**
**
the Muzvezve River
Inhalation
***
*
Mainly at free roasting
sites in milling centres and
Amalgam roasting
villages, but also at
sites
Dust ingestion
*
** (children)
organised roasting rooms
in milling centre.
Fish consumption
** ?
** ?
Depending of the diet
Local contamination with
Drinking water
?
?
Hg cyanide ?
Summary of the exposure pathways and the related risks (probability of occurrence:
***high, **moderate, *possible, 0 none).
Recommendations
The extension of the mining activity in the Kadoma-Chakari area, its economical
importance and the amount of ore processed have reached semi-industrial levels. This
situation justifies an adapted action plan to develop alternative technologies and the
progressive ban of mercury in the mining process in the area.
Recommendations contain first urgent actions to reduce significantly the exposure of
workers and their family to mercury. They concern the ore processing technologies,
practices and actions to rehabilitate and preserve the environment.
Medium- to long- term actions aim at improve the management of the artisanal mining
activity and reduce the environmental impacts.
The support and the management of these short-medium and long-term actions require
the creation of a Task Force involving all the key stakeholders at the local, regional,
national and international level.
BRGM/RC-53320-FR ¡ Part A: Final report
9
Global mercury project: Environmental assessment Kadoma-Chakari area, Zimbabwe
Acknowledgements
This work benefited from the efficient support of Noba Ernest Allai, organisation UNIDO
representative for Zimbabwe and Zambia. He facilitated contact and formalities with the
local authorities, and gave all facilities to D. Shoko to take part in the organisation and
the successful realisation of the two field work projects.
Special thanks go to Dr. Oliver Maponga, Chairman of the Institute of Mining Research,
who gave us advice and scientific and technical assistance during the whole project
and, in particular, allowed Spencer G.T. Kahwai to participate in the project and to
facilitate considerably the two field work missions.
Many thanks are owed to the Kadoma Mine Department for assistance during field
work, and also for the site selection.
We are grateful to Dr Christian Leveque, (CNRS, Meudon, France) who determined the
species and food regimes of the fish collected during the study in Zimbabwe.
The authors greatly appreciated the contribution and the motivation of the Zimbabwean
Team, who made possible the success of work in the Kadoma-Chakari area and also in
Harare.
BRGM/RC-53320-FR ¡ Part A: Final report
11
Global mercury project: Environmental assessment Kadoma-Chakari area, Zimbabwe
Contents
1. Introduction.............................................................................................................19
2. Organisation and schedule....................................................................................21
2.1. PROJECT TEAM ...............................................................................................21
2.1.1.Main team.................................................................................................21
2.1.2.Local workers ...........................................................................................22
2.2. EQUIPMENT......................................................................................................22
2.2.1.Schedule...................................................................................................22
3. Generalities and methodology ..............................................................................25
3.1. GENERAL CONTEXT ¡ AREA SELECTION ....................................................25
3.2. GOLD PROCESSING IN THE KADOMA-CHAKARI AREA ..............................27
3.2.1.Main artisanal gold processing .................................................................27
3.2.2.Individual artisanal gold processing..........................................................32
3.2.3.Mercury consumption in the Kadoma-Chakari area .................................32
3.3. SITE SELECTION AND SAMPLING LOCATION ..............................................34
3.3.1.Milling site selection..................................................................................35
3.3.2.Sampling locations ...................................................................................35
3.3.3.Selected sites for air monitoring ...............................................................36
3.3.4.Fish sampling locations ............................................................................37
3.4. SAMPLING: METHODOLOGY ..........................................................................40
3.4.1.Superficial layer, soil, tailings, sediment and water ..................................40
3.4.2.Fish sampling conditions and procedures ................................................41
3.5. ANALYSIS OF SOLID SAMPLES......................................................................42
3.6. AIR MONITORING.............................................................................................43
3.6.1.Operating principle ...................................................................................43
3.6.2.Problems ..................................................................................................43
3.6.3.Air monitoring at the custom milling centres.............................................44
3.6.4.Air monitoring in the villages.....................................................................45
BRGM/RC-53320-FR ¡ Part A: Final report
13
Global mercury project: Environmental assessment Kadoma-Chakari area, Zimbabwe
3.7. ANALYSIS......................................................................................................... 45
3.7.1.Tailings, soils and sediments ................................................................... 45
4. Results .................................................................................................................... 47
4.1. SOIL, SEDIMENT, TAILINGS AND WATER BY SELECTED AREA ................ 47
4.1.1.Southern zone.......................................................................................... 47
4.1.2.Northern zone .......................................................................................... 63
4.1.3.Main outcomes on solid samples ............................................................. 73
4.1.4.Drinking water .......................................................................................... 76
4.2. AIR MONITORING ............................................................................................ 76
4.2.1.Tix site...................................................................................................... 78
4.2.2.Amber Rose site....................................................................................... 83
4.2.3.Even Milling Centre .................................................................................. 85
4.2.4.Main outcomes for air monitoring............................................................. 85
4.3. FISH SAMPLES ................................................................................................ 87
4.3.1.Fish characterisation ................................................................................ 87
4.3.2.Global biometric characteristics and mercury contamination levels in
fish............................................................................................................ 88
4.3.3.Mercury contamination levels according to the trophic level of fish and
to the sampling sites ................................................................................ 89
4.3.4.Comparison between mercury concentrations in fish muscle in this
study (Zimbabwe) and in other artisanal gold mining sites ...................... 92
4.3.5.Conclusion ............................................................................................... 93
5. Evaluation of exposure to Hg................................................................................ 95
5.1. SINGLE-SOURCE HOT SPOTS....................................................................... 95
5.2. MULTI-SOURCE HOT SPOTS ......................................................................... 97
5.3. EVALUATION OF EXPOSURE......................................................................... 98
6. Recommendations ............................................................................................... 101
6.1. GENERALITIES .............................................................................................. 101
6.2. URGENT ACTIONS ........................................................................................ 101
6.2.1.Actions on ore processing technologies and practices .......................... 102
6.2.2.Actions to rehabilitate and preserve the environment ............................ 102
14
BRGM/RC-53320-FR ¡ Part A: Final report
Global mercury project: Environmental assessment Kadoma-Chakari area, Zimbabwe
6.3. MEDIUM- TO LONG-TERM ACTIONS............................................................103
6.3.1.Improvement in the management of the artisanal mining activity...........103
6.3.2.Reduction of environmental impacts ......................................................103
6.3.3.Support and management of these actions............................................104
7. Conclusion ............................................................................................................105
8. References ............................................................................................................109
List of illustrations
Illustration 1 - Composition of the main project team................................................................21
Illustration 2 - Project schedule as of October 2004. ................................................................23
Illustration 3 - Situation of the Kadoma-Chakari area. ..............................................................25
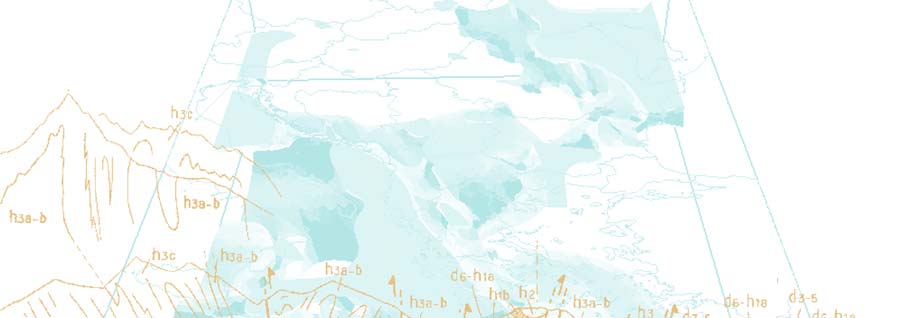
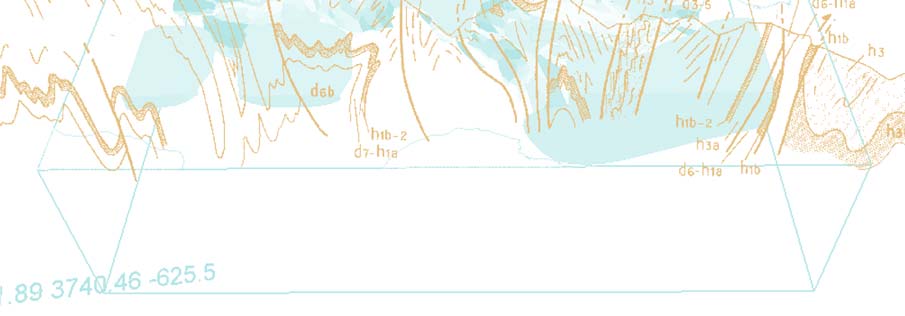
Illustration 4 - General map of the Kadoma-Chakari area showing the localisation of the
north and south zones........................................................................................26
Illustration 5 - General flow sheet of artisanal gold processing in the Kadoma-Chakari
area. ...................................................................................................................28
Illustration 6 - A to F Amalgamation process at Summit mill. ...................................................30
Illustration 7 - Etena Mill - Empty bowl-concentrator with amalgam droplets in the riffles at
the end of the concentration process. ................................................................31
Illustration 8 - Individual artisanal gold processing in different villages. ...................................33
Illustration 9 - List of collected samples. ...................................................................................35
Illustration 10 - List of collected samples site by site. .................................................................36
Illustration 11 - Main biogeochemical steps entailed in gold mining activities using
amalgamation procedures and human population exposure, via the
ingestion of carnivorous fish species, at the top of the aquatic food chain
(from Boudou 2004). ..........................................................................................37
Illustration 12 - The six fishing points on the Muzvezve River, Amber Rose mill (A) and Tix
mill (T )................................................................................................................39
Illustration 13 - The LUMEX RA-915+ analyser equipped with the RP 91C attachment.............42
Illustration 14 - Local sketch of the Tix area. Sampling location and Hg results. .......................48
Illustration 15 - Example of sample locations on the Tix site. .....................................................49
Illustration 16 - Sketch of Tix mill and village. Sampling location and Hg results. ......................51
Illustration 17 - Hg distribution in soil samples following the process at Tix mill.........................53
Illustration 18 - Hg distribution in various tailings samples at Tix mill. ........................................54
BRGM/RC-53320-FR ¡ Part A: Final report
15
Global mercury project: Environmental assessment Kadoma-Chakari area, Zimbabwe
Illustration 19 - Tailings "channel" at Tix mill. ............................................................................. 55
Illustration 20 - Surrounding area of Amber Rose: sampling location. ....................................... 56
Illustration 21 - Site of Amber Rose: sampling location.............................................................. 58
Illustration 22 - Hg content distribution in various samples following the ore process at
Amber Rose. ...................................................................................................... 59
Illustration 23 - Hg content in the Muzvezve River samples....................................................... 61
Illustration 24 - New Plus Mill. Dust sampling on the concrete floor around the roasting
house with an exhaust pipe. .............................................................................. 62
Illustration 25 - Hg content in New Plus samples. ...................................................................... 62
Illustration 26 - Hg distribution in various samples following the process at Summit Mill........... 64
Illustration 27 - Hg distribution in various samples following the process at Glasgow site. ....... 66
Illustration 28 - Hg distribution in various samples following the process at Coetzee site. ........ 67
Illustration 29 - Bowl-concentrator and copper-plate in a closed building at Lilly mill. ............... 68
Illustration 30 - Hg contents in samples collected at Lilly mill..................................................... 68
Illustration 31 - Tailings sample location at Lilly mill................................................................... 69
Illustration 32 - Drinking water installation at Lilly mill. ............................................................... 69
Illustration 33 - Hg contents in the samples of Even Milling Centre. .......................................... 70
Illustration 34 - Dust collection by miners on the concrete floor of the shelter for
amalgamation at Even Milling Centre. ............................................................... 71
Illustration 35 - Roasting room at Even Milling Centre. .............................................................. 72
Illustration 36 - Sampling location at Etena village..................................................................... 72
Illustration 37 - Synthesis of the chemical analyses on TA, SO, SE, SL and WA...................... 74
Illustration 38 - List of the different air monitoring carried out in November 2003...................... 77
Illustration 39 - Mercury monitoring in air at Tix mill. .................................................................. 78
Illustration 40 - Monitoring on the copper-plate at Tix mill (ZI2511A.xls). .................................. 79
Illustration 41 - Deposit of mercury droplets during the air monitoring of the copper-plate at
Tix mill. ............................................................................................................... 80
Illustration 42 - Mercury monitoring in air at Tix village. ............................................................. 80
Illustration 43 - Monitoring in an open area 200 m from Tix mill (ZIB2311F). ............................ 81
Illustration 44 - Monitoring in the bar house in the village close to Tix mill (ZIB2311D.xls). ...... 82
Illustration 45 - Mercury monitoring in air at Amber Rose mill.................................................... 83
Illustration 46 - Air monitoring at Amber Rose mill. (ZIB2711A.xls). .......................................... 84
Illustration 47 - Mercury monitoring in air Amber Rose village. .................................................. 85
Illustration 48 - Mercury monitoring of air at Amber Rose mill.................................................... 85
Illustration 49 - Balance of the sampled fish species and numbers, from the six sampling
points.................................................................................................................. 87
Illustration 50 - Photographs of the six different species caught in the Muzvezve River. .......... 87
16
BRGM/RC-53320-FR ¡ Part A: Final report
Global mercury project: Environmental assessment Kadoma-Chakari area, Zimbabwe
Illustration 51 - Mean biometric data (standard length and body weight), mercury
concentrations in the dorsal muscle and diet for the fish species collected
in the six sampling points. ..................................................................................88
Illustration 52 - Fish species common to the sampling points. ...................................................88
Illustration 53 - Average mercury concentrations in the muscle of all the fish species
collected. ............................................................................................................89
Illustration 54 - Mercury concentrations in the muscle of the 3 fish species collected from
the sampling spot 2. ...........................................................................................90
Illustration 55 - Relationships between fish body weight and standard length and between
fish body weight and mercury concentration in muscle of all the species..........91
Illustration 56 - Mercury concentrations in the muscle of all fish species collected from the
six sampling spots, relationships between fish body weight and mercury
concentrations in muscle....................................................................................92
Illustration 57 - Comparison between mercury concentrations in carnivorous fish collected
during UNIDO missions in Sudan, Zimbabwe and Lao PDR. ............................93
Illustration 58 - Main contamination sources and route to Hg exposure.....................................96
Illustration 59 - Summary of the exposure pathways and the related risks (probability of
occurrence: ***high, **moderate, *possible, 0 none)..........................................99
Illustration 60 - Comparison of measured and certified values of total mercury
concentrations using three standard biological reference materials. ...............128
Illustration 61 - List of samples selected for control analyses (in mg.kg-1). ..............................129
Illustration 62 - Correlation LUMEX < 2 mm versus ALS..........................................................130
Illustration 63 - Correlation LUMEX < 100 Ám versus ALS < 100 Ám. .....................................130
Illustration 64 - Histogram of the control analyses. ...................................................................131
Illustration 65 - Correlation LUMEX < 2 mm vs. LUMEX < 100 Ám..........................................132
List of appendices
Appendix 1 - List of collected samples with results of the chemical analyses...........................113
Appendix 2 - Quality control.......................................................................................................125
Appendix 3 - Biometric data and mercury concentrations in the 52 individual fish....................133
Appendix 4 - Characteristics of each fish specie (identification, diet)........................................137
BRGM/RC-53320-FR ¡ Part A: Final report
17
Global mercury project: Environmental assessment Kadoma-Chakari area, Zimbabwe
1. Introduction
n response to a request from the Government of Zimbabwe and in the framework of
Ithe general project entitled "Removal of barriers to the introduction of cleaner
artisanal gold mining and extraction technologies", a contract was signed in September
2003 between the United Nations Industrial Development Organisation (UNIDO) and
the BRGM, in order to carry out the environmental and health assessment in the
Kadoma-Chakari area. This area is characterised by the presence of thousands of
artisanal gold miners using mercury for the gold recovery.
The ultimate aim of the project is to replace mercury amalgamation practice in this area
by alternative technologies, while improving the income and the health of the people
using mercury. It includes a more efficient Hg and gold recovery process, an increasing
knowledge and awareness and provides policy advice on the regulation of artisanal
gold mining.
In accordance with the decision taken during a meeting with UNIDO in November 2003
in Vienna (Austria), the study has been divided in two field steps. The first one was
completed in November 2003 in order to carry out the environmental survey before the
rainy season, and the second, focussing on the health assessment, was conducted in
April 2004 at the end of the rainy season.
Two fieldwork reports have been submitted to UNIDO:
- The first one entitled "Removal of barriers to the introduction of cleaner artisanal
gold mining and extraction technologies in Kadoma-Chakari area. Zimbabwe.
Fieldwork report 1. BRGM/RC-52796-FR", dated December 2003, describes the
environmental assessment carried out in November 2003.
- The second one, entitled "Health Assessment of small-scale miners in a mercury
contaminated area (Kadoma area. Zimbabwe)" describes the health survey carried
out in April 2004. During this second mission, some additional work was
accomplished for the environmental study.
The final results of the project are given in two separate reports:
- This Final Report (Part A) deals with the environmental survey. After the
presentation of the project team, it summarises the fieldwork carried out during the
November 2003 and April 2004 missions, the organisation and planning, the
methodology used for site selection and the sampling. The chemical analysis results
are given site by site, followed by interpretation and recommendations.
- The health survey Final Report (Part B) was completed in November 2004 by the
health team (Boese-O'Reilly, 2004). It summarises the fieldwork carried out in April
2004 and presents all the specimen analysis and statistical results, with
recommendations to improve health and reduce hazard relative to the use of
mercury.
BRGM/RC-53320-FR ¡ Part A: Final report
19
Global mercury project: Environmental assessment Kadoma-Chakari area, Zimbabwe
2. Organisation and schedule
The fieldwork completed in November 2003 is described in detail in the Field Work
Report BRGM/RC-52796-FR dated December 2003.
Complementary data given hereafter synthesise the entire organisation and schedule
of the work accomplished between November 2003 and August 2004, including the
field work carried out in April 2004.
2.1. PROJECT TEAM
2.1.1. Main team
The project team was composed of two groups, the first for the environmental survey
and the second for the health survey. These two groups received a considerable and
necessary assistance from local people (illus. 1).
Environmental assessment
Name
Organisation
Activity in the project
Dr. Pierre Billaud
Project manager
BRGM OrlÚans
Dr. ValÚrie Laperche
Geochemist
Dr. RÚgine Maury-Brachet
LEESA CNRS, University of Aquatic Ecology and Ecotoxicology
Prof. Alain Boudou
BORDEAUX
Health Assessment
Leader of the health survey.
Dr. Stephan Boese-O'Reilly Institute of Forensic
Paediatrician, master of public
Medicine, Ludwig-
health, Environmental medicine
Dr. Felicitas Dahlmann
Maximilians University,
Physician
Munich
Pharmacist. On site mercury
Beate Lettmeier
analyses
Local team for the environmental and the health assessment
Dr. Dennis Shoko
UNIDO
National Expert
Institute of mining research.
Spencer G. T. Kahwai
Analytical Chemist (+ field works)
University of Zimbabwe
Dr. Edwin Muguti
Medical Expert
Tapuwa Mwanjira
Kadoma hospital
Nurses to assist the medical
Vigilance Parirenyatrwa
Kadoma hospital
examinations
Joan Marembo
Kadoma hospital
Felicitas Navahya
Translator
Ezequiel Maponga
IMR
Driver
Illustration 1 - Composition of the main project team.
The two teams benefited, in the organisation of field work and also during the full time
of the missions, from the efficient assistance of D. Shoko, UNIDO National Expert of
the Global Mercury Project in Zimbabwe.
BRGM/RC-53320-FR ¡ Part A: Final report
21
Global mercury project: Environmental assessment Kadoma-Chakari area, Zimbabwe
Moreover, Dr. O. Maponga, Chairman of the Institute of Mining Research of the
University of Zimbabwe (IMR), granted us the scientific, technical and administrative
support of the Institute and also permitted Spencer G. T. Kahwai, chief of the chemistry
laboratory, to participate in all the fieldwork.
Prof. Alain Boudou (Univ. Bordeaux, LEESA) provided fish sampling kits and analysis
facilities.
The assistance of Dr. L. Christian Leveque (CNRS, Meudon, France) determined the
species and food regimes of the collected fishes.
2.1.2. Local workers
Local workers were hired on each surveyed site to help in the sediment, soil, and tailing
sampling and in the panning operations (see fieldwork report, Billaud and Laperche,
2003).
2.2. EQUIPMENT
The list and origin of the equipment used for the environmental assessment is given in
the Field Report (Billaud and Laperche, 2003). Equipment used for the health
assessment is listed in the Field Report dated June 2004 from the Institute of Forensic
Medicine.
2.2.1. Schedule
According to the briefing meeting held at the UNIDO headquarters in Vienna in
November 2003, the field work was divided into two periods due to the availability of
the health team and the imminence of the rainy season, during which it would have
been difficult to carry out the sampling and health survey.
The first fieldwork was completed in November 2003 just before the rainy season and
concerned the environmental survey. The second mission, corresponding to the health
survey, was scheduled and carried out in April 2004 at the end of the rainy season.
The schedule of the project is summed up in illustration 2.
22
BRGM/RC-53320-FR ¡ Part A: Final report
Global mercury project: Environmental assessment Kadoma-Chakari area, Zimbabwe
Global Mercury Project : Kadoma - Chakari area. Schedule as of 31.08.04
2003
2004
Tasks
Nov
Dec
Jan
Feb
Mar
Apri
May
June
July
Aug
Sep
Oct
Environmental assessment
Main field works
Field work report
Chemical analyses
Additional site sampling
Fish analyses and interpretation
Final report
Health assessment
Field works
Field work report
Analyses (Hair, blood, Urine)
Final report
Illustration 2 - Project schedule as of October 2004.
BRGM/RC-53320-FR ¡ Part A: Final report
23


Global mercury project: Environmental assessment Kadoma-Chakari area, Zimbabwe
3. Generalities and methodology
3.1. GENERAL CONTEXT ¡ AREA SELECTION
The Kadoma ¡ Chakari area, which was selected by UNIDO, is located roughly 150 km
west south west of Harare (illus. 3). Kadoma, the most important city of the area, can
be easily reached from Harare by the wide blacktop road going to Bulawayo. The area
is covered by the topo-sheet No.1829B2 and 1829B4 at 1:50,000 scale.
Kadoma-Chakari region
Illustration 3 - Situation of the Kadoma ¡ Chakari area.
The short preliminary survey carried out during the first days of the field mission in
November 2003 allowed us to sketch in a rough map of the area (illus. 4) showing two
main zones:
BRGM/RC-53320-FR ¡ Part A: Final report
25
Global mercury project: Environmental assessment Kadoma-Chakari area, Zimbabwe
- The northern zone, with the mining town of Chakari in the north and the town of
Kadoma in the south, has a fairly flat relief and no major river between Chakari and
Kadoma. Consequently, no major panning activity was found. The main activities
are farming, with big cotton, maize... producers, large-scale cattle breeding with
extensive farms, and mines. The industrial activity is centred on gold mining and
processing by local and international companies and numerous self-employed
miners and millers scattered throughout the area. The gold deposits are vein and
shear-zone types within the Archaean volcanic-sedimentary belt. The self-employed
miners extract the ore from laterite and semi-weathered rocks and use mercury for
gold amalgamation in the milling centres or in their own villages. The roasting of the
amalgam is done essentially near the milling centre, but also in the villages.
1829B2
Nth
Chakari
Coetzee
North zone
Glasgow
Summit
1829B4
Kadoma
To Harare
Even Milling center
Muzvezve river/lake
Road, Wide tarred
South zone
Road, Narrow tarred
Tix
Alexander
Claw Dam
Milling center
Panners area
Panners
Amber Rose
City
To Bulawayo
Illustration 4 - General map of the Kadoma ¡ Chakari area showing the localisation
of the north and south zones.
- The southern zone is somewhat hilly and crossed by a major river, the Muzvezve
(pronounced Mujeje), flowing to the west-north-west for roughly 250 km, to the Lake
Kariba on the Zambezi River, which forms the boundary between Zambia and
Zimbabwe in the north-western part of the country. In this zone, all the streams are
tributaries of the Muzvezve River. The area is covered by forest and bush. The main
activities are small farms and gold mining. Self-employed and small-scale gold-
mining miners and millers work in the area, and panners are found along the whole
26
BRGM/RC-53320-FR ¡ Part A: Final report
Global mercury project: Environmental assessment Kadoma-Chakari area, Zimbabwe
length of the Muzvezve River. Gold is mined from semi-weathered Archaean
volcanic-sedimentary units, resembling those in the northern zone, but it is also
panned from alluvial deposits and sometimes from old tailings. Miners and millers
are mainly grouped in villages installed close to the milling centres.
3.2. GOLD PROCESSING IN THE KADOMA-CHAKARI AREA
The main preliminary data about the artisanal gold mining and processing in the
Kadoma-Charkari area can be found in the UNIDO report dated October 2003 (Veiga
and Shoko, 2003). Following the first fieldwork carried out in November 2003,
additional information is given in the fieldwork report No.1 (Billaud and Laperche,
2003). Other general information is presented in a more recent document of UNIDO
available on the GMP website (Shoko and Veiga, 2004; Hinton and Veiga, 2004).
Three kinds of artisanal gold processing are conducted in the area. The main one,
which concerns stockpiles of 1 to 5 tons of ore, takes place in custom milling centre
using a copper-amalgam plate or bowl-concentrator for the amalgamation process. It is
carried out by miners or groups of miners who are renting the services of millers. The
second one, which concerns only a small quantity of ore, less than one ton, involves
hand crushing with a hammer and a grinder, followed by panning and amalgamation in
buckets or plastic trays. It concerns isolated miners or women and children of miners.
The last one is performed by panners in the riverbed, where gold is collected though a
sluice, then panned, followed by amalgamation in pan or bucket. For all of these
processes, roasting is the last operation.
More than 20,000 individuals are engaged in artisanal mining in this area. These are
roughly comprised of 3,000 to 5,000 miners, 1,000 to 2,000 millers located in the
recorded 70 milling centres and 15,000 to 20,000 panners.
3.2.1. Main artisanal gold processing
The main artisanal gold processing is summarised in the general flow sheet shown in
illustration 5.
a) Crushing and grinding
After extraction, the ore is sent to the custom milling centre by the miners, where the
work is carried out by batches of 1 to 5 metric tons of ore. Two kinds of equipment are
found. The most frequent one, which is also the oldest, the least expensive but also the
least efficient, is the wet stamp mill (with two to four stamps) having a capacity of 0.2 to
1.5 metric tons/hour. The second equipment, more recent (2002) operating only on one
site (Even Milling Centre), is composed of a jaw-crusher followed by a ball mill. The
crushing capacity is 0.7 to 2 metric tons/hour. The objective of crushing is to free the
gold from its gangue. With the stamp mills, the ore is never ground finely enough to
free the gold or to expose it at the surface of the grain. With this level of crushing, only
30% of the gold is extracted and recovered by the miners.
BRGM/RC-53320-FR ¡ Part A: Final report
27
28
Globa
l mercury pro
ZIMBABWE GLOBAL MERCURY PROJECT
Kadoma - Chakari area
Summary of the beneficiation
from ORE EXCAVATION
feed
j
ect: Environ
from ORE EXCAVATION
ore stock pile
ore stockpile
jaw crusher
barren solution
m
e
n
AC column adsorption
Legend :
stamp mills
tal assessm
feeder
Samples collected
adsorption circuit
º
Soil
Tailings
R
G Air monitoring
ball mill
reagents
Hg in
ent Kad
G
R OF
Bowl concentrator
º
AC column desorption
desorption
Cyanide
solution
o
G
ma-Chak
vapor
Hg in
G
amalgam clean up
Copper plate
OF
R
BRGM/RC-53
G R
Electrolyzer
º
acidified solution
amalgam clean up
OF
acid
fines
a
drag clarifier
r
R
loaded
i are
R
cathodes
Hg out
G
Tailing
º
Hand cloth
ponds
a
filter press
cyanide
AC regeration
recyclied AC
, Z
º
Hg vapor
i
amalgam
mbab
32
tailing ponds
out
heater
0-F
Pregnant
G
solution
fluxes
Hg out
Burner
Vat leaching
Hg vapor
we
R
condenser
¡ Part A: F
Solids
sponge
out
acid HNO3
Furnace
slags
Liquids
liquid
Leaching
impurities +Hg
DORE BAR
Clarifier
fines
fluxes
i
Hg vapor
nal re
out
slags
Furnace
º R
tailing dams
port
DORE
Illustration 5 - General flow sheet of artisanal gold processing in the Kadoma-Chakari area.
Global mercury project: Environmental assessment Kadoma-Chakari area, Zimbabwe
The remaining gold is collected by the millers through a cyanidation process.
Depending on the quantity of the stockpile and the hardness of the ore but also on the
technical status of the stamp mill (quartz takes more time than laterite), the crushing
operation for one batch takes between a few hours to one day.
b) Amalgamation / mineral concentration
Most of the time, the pulp coming from the stamp mill through a 48 or 65 mesh screen
(not always well maintained) and composed of around 20% solids is sent directly to a
copper-plate covered with a film of mercury. In the milling centre newly equipped with a
jaw-crusher and ball mill, but also in some of the well-maintained milling centres
equipped with a stamp mill, the copper-plate is replaced by a bowl-concentrator (also
called Zimbabwean centrifuge, ABJ bowl or "speedy bowl") where mercury is added at
the beginning of the process.
The copper-plate consists of a sheet of pure annealed copper. At the beginning of the
process, the plate is coated with as much mercury as the plate will adsorb. The
quantity of mercury used varies from one place to another, but it is said that at least
150 g m▓ (3 teaspoons of 45 g each) of mercury are used for this operation. This
mercury film immediately amalgamates any gold particles that come in contact with it.
At the end of the process, when all the ore is crushed, the copper-plate is scoured with
sand or tailings to remove any remaining amalgam. The resulting bright metallic copper
is then rinsed with clean water and washed with a 2 to 3% solution of cyanide (if
available). Most of the time, the millers use solid Na-cyanide tablets to clean the plate
by hand with no glove nor mask protection. Following this procedure, amalgam with
fine sand particles is collected by hand and then squeezed in a cloth to remove unused
mercury. The quantity of water necessary to keep the pulp travelling slowly down the
copper-plate depends on the slope of the plate (10%), on the fineness of the crushing,
as well as on the nature of the gold (coarse or fine).
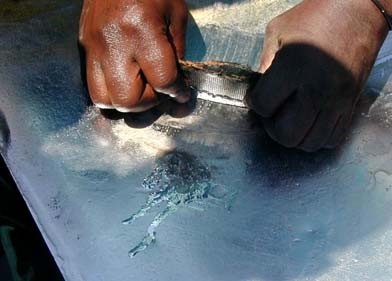
Illustration 6 shows some part of this process.
With bowl-concentrators, the pulp flows directly into the bowl composed of a 120░ cone
containing horizontal ribs (riffles) welded along the inside wall. Rotational forces allow
separate heavy from light particles. The light particles are carried away by the water
flowing out of the upper part of the bowl, while the heavy materials are concentrated at
the bottom of the bowl with amalgam. At the beginning of the process, the miners add
roughly 150 g of Hg directly into the cone (3 teaspoons) to amalgamate the gold
particles. Mercury consumption appears to be roughly 25 to 30 g t-1 of ore in the bowl-
concentrator (Amber-Rose mill). Clean up is accomplished by stopping the rotation of
the bowl, opening the drain at the bottom, and flushing out the concentrate (illus. 7).
About 30 kg of heavy concentrate is produced from a batch of 15 to 20 metric tons of
ore. Some millers provide the miners with amalgamation barrels, but in many cases,
the miners finish the amalgamation by hand, adding up to 800 g of mercury in plastic
trays. The final separation between the amalgam and heavy minerals is accomplished
by panning. The amalgam is then squeezed in a cloth to remove unused mercury.
BRGM/RC-53320-FR ¡ Part A: Final report
29


Global mercury project: Environmental assessment Kadoma-Chakari area, Zimbabwe
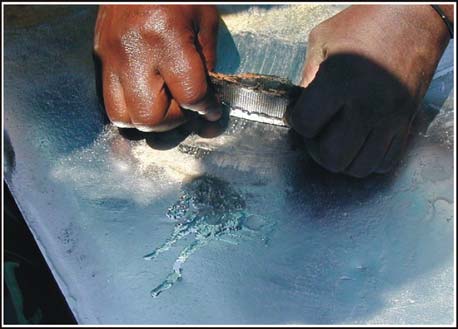
A: Stamp mill and copper plate
B: Copper plate at the end of the process
C: Amalgam recovery on the copper plate
D: Copper plate cleaning by hand
with sand and cyanide tablets
E: Amalgam recovery in a piece of cloth
F: Amalgam after squeezing to remove
unused mercury
Illustration 6 - A to F Amalgamation process at Summit mill.
30
BRGM/RC-53320-FR ¡ Part A: Final report

Global mercury project: Environmental assessment Kadoma-Chakari area, Zimbabwe
After the copper-plate or the bowl-concentrator, the tailings are evacuated by open
channel or pipes to a settling pond, for clarification and drying. Most of the time, the
water is collected and recycled in the crushing process. Once dry, the tailings are
loaded onto a truck and transported to concrete tanks for cyanidation, to recover the
remaining gold.
At New Plus, a sluice box has been installed just after the copper-plate in order to
increase the gold and amalgam recovery by the miners before sending the tailings to
the settling pond.
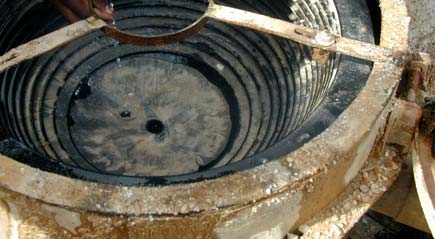
a) General view of the bowl-concentrator
b) Remaining amalgam droplets in the riffles
Illustration 7 - Etena Mill - Empty bowl-concentrator with amalgam droplets in the riffles
at the end of the concentration process.
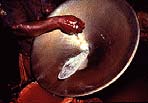
c) Roasting
Following this process, the miners carry away their amalgams for the roasting
operations, these take place in the same open places in the milling centre or back
home. In all the sites visited, except at Even Milling centre and New Plus, miners burn
amalgam on a wood fire without further protection. They do not use a retort or any
home-made torch. At low temperatures, the roasting process remains incomplete
resulting in around 20% of residual mercury remaining in the gold beads.
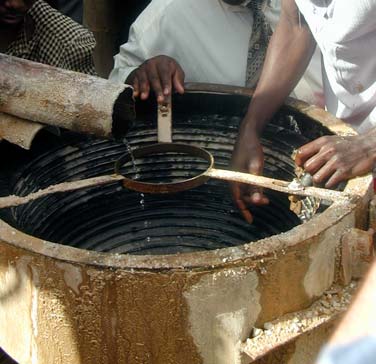
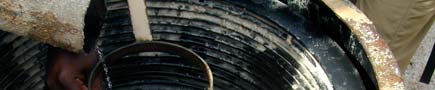
d) Cyanidation
To recover the rest of the gold in the dried tailings, which can contain 70% of the total
gold content of the crude ore, the millers apply vat-cyanidation. The milling centres
have between five and ten concrete tanks for cyanidation. The tailings are leached with
Na-cyanide solution for an average of six to ten days. The solution percolates through
BRGM/RC-53320-FR ¡ Part A: Final report
31
Global mercury project: Environmental assessment Kadoma-Chakari area, Zimbabwe
the tailings and is recovered at the bottom of the tanks, where a filtering process (layer
of sand) is set up. The gold-cyanide solution is analysed for gold content using an
SnCl2 colorimetric method. The solution passes through a few columns lined with
activated charcoal to remove the gold from the cyanide solution. After this process, the
concentration of the cyanide solution is adjusted and then re-used in the vats.
Gold extraction from the charcoal is never performed in the milling centre. The millers
send the activated charcoal to other companies that carry out the elution process. One
of them is installed in Kwe-Kwe, approximately 50 km from the mining area.
The final tailings of vat-leaching with residual cyanide are generally dumped in outlying
parts of the milling site, but also close to the village, as in the case of Amber Rose. It
can be also used as track construction materials (Tix village).
e) Remarks
Despite the poor efficiency of the stamp mill, most of the miners prefer milling centres
with stamp mills over those with ball mills because they think the ball mill is holding
back some parts of the gold. Moreover, they can see all the process steps and they
clean the stamp mill by hand at the end of the process. The cleaning of the ball mill is
done only after grinding several stockpiles of different origins and from different miners.
Nevertheless, it is well known that the gold recovery is better with the ball mill, and the
grinding capacity is between 0.7 and 2 t h-1, instead of 0.2 to 1.5 t h-1 for the stamp
mills.
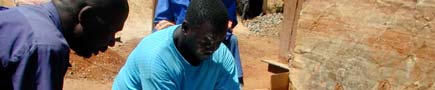
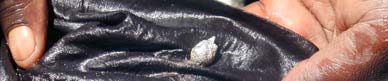
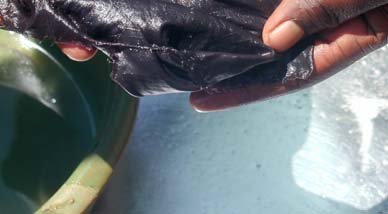
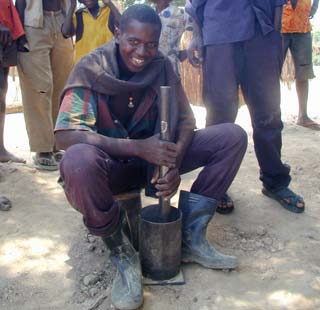
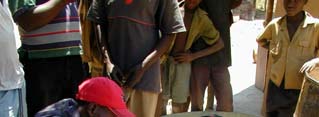
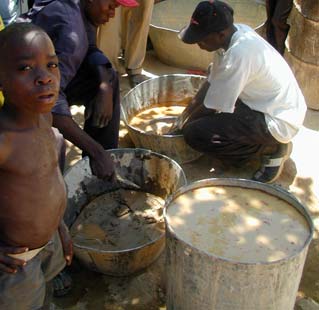
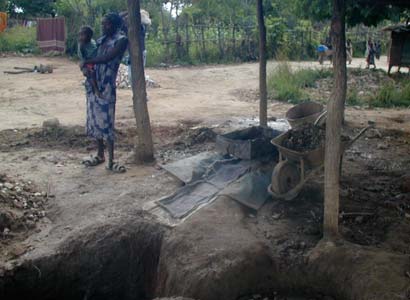
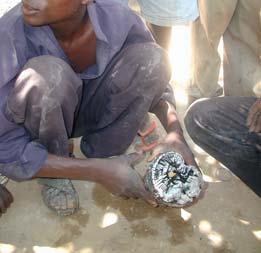
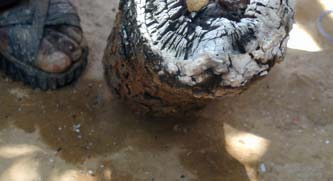
3.2.2. Individual artisanal gold processing
Another kind of gold processing is carried out by isolated miners, women and children,
but on a small quantity of ore (a few hundreds of kg). The ore is crushed with a
hammer directly on the extraction site then carried out in bags to the processing place,
which is generally close to their houses in the village (a few meters away) (illus. 8).
There, the ore is reduced to powder in a small iron grinder before panning. At the end
of the panning process, some mercury is added to the heavy material in the pan or
bowl and mixed by hand to facilitate amalgamation. The panning process is carried out
completely in order to separate the amalgam from the tailings. Amalgam is then
squeezed in a cloth to remove unused mercury before being roasted as described
above.
3.2.3. Mercury consumption in the Kadoma-Chakari area
The assessment of the mercury consumption in the Chakari-Kadoma area is a difficult
exercise because no official statistics are available about the mercury market. No
measurement of the mercury recycling, no information concerning the tonnage of ore
processed in the different milling center or of gold produced by the miners and by the
millers exist. Moreover people are not ready to give clear information about the
mercury and gold market.
32
BRGM/RC-53320-FR ¡ Part A: Final report


Global mercury project: Environmental assessment Kadoma-Chakari area, Zimbabwe
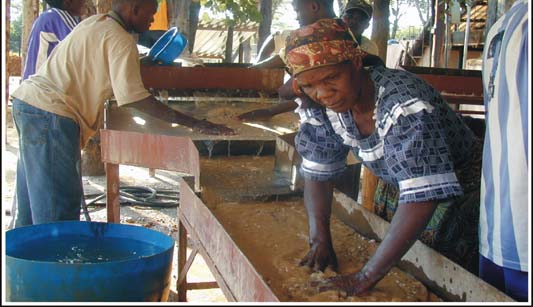
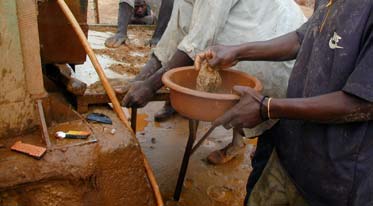
a
b
c
d
a) Ore grinding at Tix village
b) Panning and amalgamation at Tix
c) Small artisanal sluice box at Etena
e
d) Amalgam roasting at Tix village
e) Detail of the amalgam roasting on a wood
fire showing the sponge-like gold "dorÚ"
Illustration 8 - Individual artisanal gold processing in different villages.
BRGM/RC-53320-FR ¡ Part A: Final report
33
Global mercury project: Environmental assessment Kadoma-Chakari area, Zimbabwe
Data that can be used are coming from discussions with miners, millers, agents of the
Kadoma Mine Department and from O. Maponga and also from the literature.
They can be summarised as follows:
- 70 mill sites with 1 to 4 stamp mills (including a few ball mills) have been inventoried
by the Kadoma Mine Department. That represents around 140 stamp mills,
considering an average of 2 stamp mills per milling site.
- An estimation of 12 working hours per day (including breakdowns, stand by periods
for ore supplying, cleaning and maintenance periods...) for 280 working days per
year. So we can estimate 470,400 working hours for all the 140 stamp mills and for
one year in this area.
- As said previously (º 3.2.1.) the capacity of one stamp mill ranges from 0.2 to
1.5 t h-1. So, the annual quantity of ore crushed and ground ranges from 94,000 to
705,600 tons.
- The quantity of mercury used on the copper plate is roughly 150 g for one batch of
ore ranging from 3 to 5 tons. That is 30 to 50 g of mercury per ton of ore.
- The mercury consumption in the bowl concentrator ranges from 25 to 30 g ton-1 of
ore.
- The mercury recycling is estimated at 50%.
Finally the annual quantity of mercury used in this area can range:
- from 94,000 x 25 / 2 = 1,175,000 g of Hg rounded up to 1.2 t;
- to a maximum of 705,600 x 50 / 2 = 17,640,000 g of Hg rounded up to 17.5 t.
3.3. SITE SELECTION AND SAMPLING LOCATION
The strategy for site selection and sampling location was chosen in line with the risk
assessment approach as explained in the field work report and summarised as follows:
- Where are the main sources of mercury pollution in the artisanal gold mining of the
Kadoma-Chakari area, presuming that the visited and studied sites are
representative of this activity in this area?
- What are the main pollution vectors (pathways) that are likely to transfer the mercury
towards a target?
- What are the main target(s) exposed to the direct or indirect effects of the known
pollutant?
This analysis enabled us to classify the sites we visited according to their specific
features and their ability to represent the main local and regional risks arising from the
artisanal mining activity in this area.
34
BRGM/RC-53320-FR ¡ Part A: Final report
Global mercury project: Environmental assessment Kadoma-Chakari area, Zimbabwe
3.3.1. Milling site selection
The site selection was done during the preliminary survey, at the beginning of the first
field work program in November 2003. It is described in detail in Field Work Report
No.1 (Billaud and Laperche, 2003).
The following sites were selected (illus. 4):
- in the northern zone: Summit, Glasgow, Coetzee, Even Milling Centre, and Lilly;
- in the southern zone: Tix, Amber Rose, and a few panning sites along the Muzvezve
River downstream Claw Dam.
During field work in April 2004, some additional sampling focussed on Lilly and Etena
mill in the northern zone and on New Plus mill in the southern zone.
3.3.2. Sampling locations
In each selected area, the sampling locations were determined individually on each site
according to the technical organisation and composition of the processing equipment,
the geomorphology, the local drainage, the landscape and the proximity of the village.
The objective was to check the sources of the Hg pollution, its pathways and the level
of Hg in the potential targets that had been identified (surface or groundwater, plants,
animals or humans). It is important to note that the number of samples collected is
sufficient to provide information on the level, pathway as well as an indication of the
extension of mercury pollution. Nevertheless, the number of samples is insufficient to
allow us to draw up detailed maps of the pollution for each selected area. However, a
comparison of the mercury level in the different types of milling centres and associated
villages is possible and particularly interesting for making recommendations concerning
the reduction or elimination of Hg pollution.
The geographical co-ordinates of the samples were collected with a portable Global
Positioning System GPS (Datum number: Zimbabwe ARC1950) and recorded in an
"Excel" database with all the other information, such as sample number, sample
description, sample location, chemical analysis results... (app. 1). The list of the
collected samples is given in illustration 9.
Sample type
Code
Quantity
Number: from / to
Soil
SO
49
1 to 47*
Superficial layer**
SL
12
1 to 12
Stream sediment
SE
39
1 to 39
Tailings
TA
56
1 to 56
Drinking water
WA
7
1 to 7
*
Sample SO35 is composed of SO351, SO352 and SO35b.
** The superficial layer corresponds to the fine particles (< 2 mm) deposited on the soil and collected with
a paintbrush. It contains dust.
Illustration 9 - List of collected samples.
Illustration 10 gives, site by site, the detail of the collected samples.
BRGM/RC-53320-FR ¡ Part A: Final report
35
Global mercury project: Environmental assessment Kadoma-Chakari area, Zimbabwe
Sample quantity
Site
SO
SL
SE
TA
WA
Summit mill
6
2
6
Glasgow mill
9
1
6
Coetzee mill
5
1
6
Lilly mill
4
1
Even Milling Centre
8
1
6
Tix mill
12
2
14
14
4
Muzvezve River: Alexander farm
6
Muzvezve River: downstream Claw Dam
11
Amber Rose mill
7
3
9
11
2
New Plus mine
1
1
Etena
1
1
1
Total
48
12
40
55
7
Illustration 10 - List of collected samples site by site.
Only drinking water used in the miners' villages or on the milling sites was collected.
The samples were taken from the tap of the water tanks used by the inhabitants.
At Tix mill and village, the drinking water is pumped on the bank of Claw Dam and
transported by a 2-km-long pipe. One sample was collected near the pumping raft and
another at the tap of the water tank in the village.
At the pumping area, miners dig a lot of small pits for ore extraction. This place is also
very close (some tens of meters) to the point where the small watercourse flowing from
Tix village and mill reaches Claw Dam. At Amber Rose mill the drinking water stored in
a tank comes from a borehole drilled outside the milling centre. At Lilly village, the
drinking water comes from a borehole installed close to the tailing dumps in the middle
of the processing area.
3.3.3. Selected sites for air monitoring
Three sites were selected for air monitoring:
- Tix and Amber Rose mills in the southern zone were selected for air monitoring
because they both have villages close by and use different amalgamation
processes. Whereas amalgamation is carried out on copper-plate at Tix mill, bowl-
concentrators are used at Amber Rose mill. Both sites have four stamp mills, drag
clarifiers and a cyanidation process.
- Even Milling Centre in the northern zone was selected for air monitoring because it
is new and well organised. In addition to the ball mill and bowl-concentrator, the
biggest improvement in this centre compared to the others is the well-organised
burning room. The person in charge of roasting uses a torch, and the amalgam is
placed inside an air extractor during roasting. The exhaust air flows out through a
pipe to the forest area just behind the roasting room. It is a custom amalgam burning
site where roasting is done by batch for each miner successively.
36
BRGM/RC-53320-FR ¡ Part A: Final report


Global mercury project: Environmental assessment Kadoma-Chakari area, Zimbabwe
3.3.4. Fish sampling locations
a) Generalities
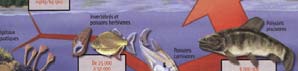
Fish are exposed to mercury present in the aquatic system, either through fresh water, via
the respiratory exposure, or through their diet (Snodgrass et al., 2000), and are therefore
good indicators of mercury contamination in the environment. Besides, they constitute a
substantial proportion of the protein ration for people living along the rivers, and
consequently represent for them a source of exposure to mercury. Additionally there exists
a direct exposure concerning people directly involved in the extraction of gold combined
with this metal. Mercury contamination levels in the water column of rivers and lakes are
generally very low (ng L-1), and mercury is mainly present in inorganic form (HgII). The
trophic route of exposure, via ingestion of metal accumulated in prey, represents a more
important pathway of contamination for most fish species than direct water exposure
(Boudou and Ribeyre, 1997; Mason et al., 1995; Wiener et al., 2002).
The resulting biomagnifications (cumulative trophic transfers of the methylated form of
mercury, MMHg: monomethylmercury ¡ CH3HgX, between prey and predators) can
lead to extremely high mercury concentrations particularly in the different organs of
carnivorous species. Most notable accumulations are met in muscle tissue (Bloom,
1992; Boudou and Ribeyre, 1997). To become part of the biomagnification process, the
elemental form Hg░ used for amalgamation has to be oxidized in the atmosphere
and/or in the water (HgII) and then methylated by bacteria (SRB: sulphur-reducing
bacteria). This process occurs mainly under hypoxic/anoxic conditions (Morel et al.,
1998; Rudd, 1995) (illus. 11).
Hg░
Hg(II)
(I
gol
go dm
d i
m ni
n ng
n
human
(am
(a a
m l
a gam
a )
m
populations
populati
soi
so l
ero
er s
o ion
o
carnivo
carniv rous
fish cons
fish con umption
umpt
Hg
5,000
Hg
0
(II)
Hg░
ngHg
ngH /g
(II)
Hg░
50,
50 00
0 0
ngHg
ngH /g
12,000,00
0 ngHg /g
0 ngHg /
900,00
0ngHg /g
0ngHg /
Hg(II)
Hg░
(I
Hg░
MMHg
Hg░
MM
Ano
An x
o ic zo
z n
o e
n s
e
(water
e column/
n s
/ ed
s iment )
HgS
METHYLATION
HgS
METHYLATIO
(bacter
e ia ¡ SRB
R )
Illustration 11 - Main biogeochemical steps entailed in gold mining activities using amalgamation
procedures and human population exposure, via the ingestion of carnivorous fish species,
at the top of the aquatic food chain (from Boudou 2004).
BRGM/RC-53320-FR ¡ Part A: Final report
37
Global mercury project: Environmental assessment Kadoma-Chakari area, Zimbabwe
b) Site selection
The survey conducted in November 2003 in Zimbabwe focused on the evaluation of
contamination levels of the artisanal gold mining sites along the Muzvezve River in the
south zone of the Kadoma-Chakari area (illus. 12).
The Muzvevze River was chosen for the fish study for the following reasons:
- The river is still running at the end of the dry season, while most of its tributaries are
completely dried up;
- The river crosses an area characterised by many artisanal gold mines and custom
milling centres of different sizes. Among them, two interesting custom milling centres
are operated and studied in the present environmental and health assessment: Tix,
located upstream (18░2689 S and 29░5623 E), and Amber Rose, located
downstream (18░2756 S and 29░4913 E) from Claw Dam. Both custom milling
centres use mercury for gold amalgamation and produce tailings in close proximity
to small watercourses that are tributaries of the Muzvezve River. These tributaries
were dry in November 2003.
Collection took place in six different spots located along the Muzvezve River:
- Upstream from Claw Dam (fishing points 4 and 5, illus. 12) close to the Tix mine.
Point 5 is upstream from the Claw Dam reservoir next to the Mupfuti River, a
tributary of the Muzvezve River. The fishermen caught fish with a bamboo fishing
rod. Point 4 is downstream along the dried-up stream coming from Tix mine at the
beginning of the Claw Dam reservoir. Fish were caught at night with a net, the use
of small-mesh nets being normally forbidden.
- Downstream from the Claw Dam reservoir (fishing points 1 and 2, illus. 12). The
water level in the river was low. At some places, it was possible to cross the river on
foot. These fishing points are situated between the two main milling centres studied
in the environmental assessment. In alluvial mining surroundings, fish live in ponds
resulting from alluvial digging by panners. Water is almost completely drained off by
hand with a plastic basket to catch fish.
- Eight km downstream from Claw Dam (fishing points 3 and 6, illus. 12). Point 3 was
just downstream from the small dam on the Alexander farm. Panners used the same
technique as described above to catch fish. Point 6 is the reservoir of Alexander
farm. This site is directly connected to the gold mining activities because it is located
downstream from Amber Rose mill. Mr. Alexander went fishing for us using nets and
was able to catch six fish, although of the same species. After sampling, the fishes
were given back to his farmers.
Fish from Points 4 and 6 were caught with a net in "deep" water (reservoirs of the Claw
and Alexander dams) and fish from Points 1, 2, 3 and 5 were caught in shallow water.
Villagers fishing at the Point 5 told us that they were not involved in mining activities
and that they were fishing to make some extra money.
38
BRGM/RC-53320-FR ¡ Part A: Final report

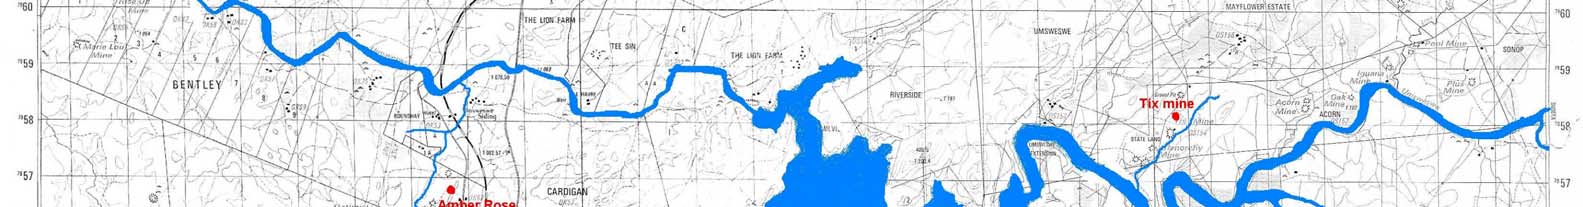
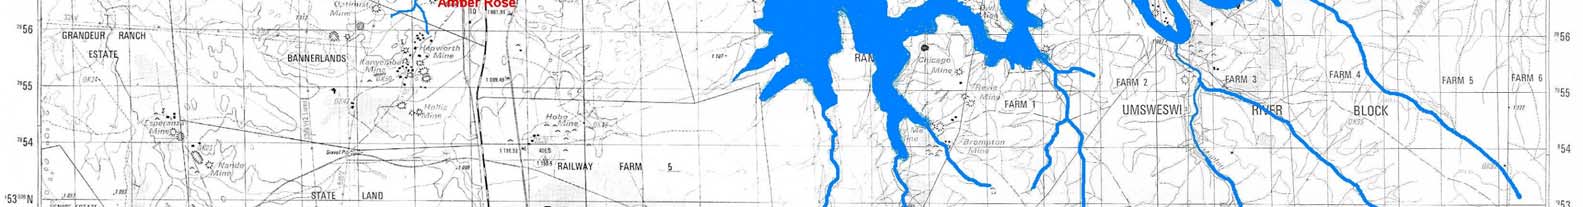
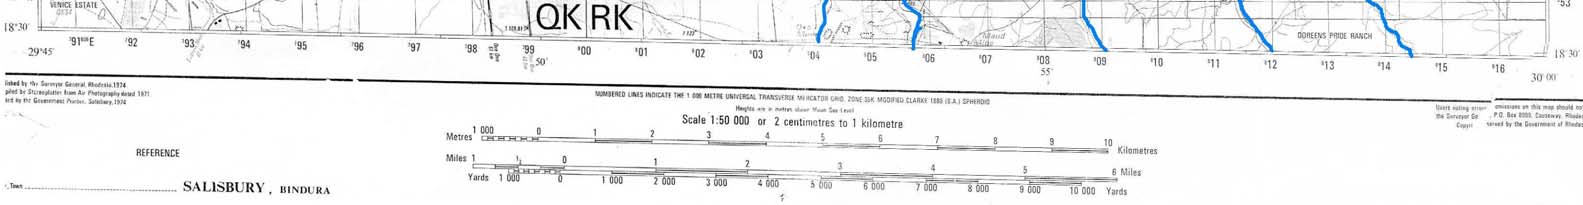

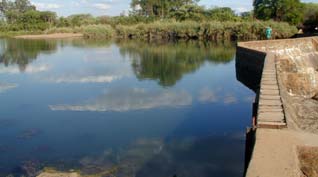

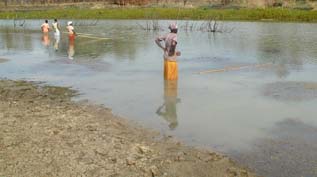

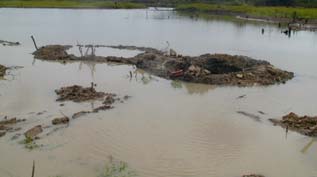
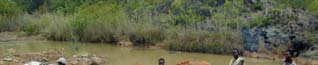
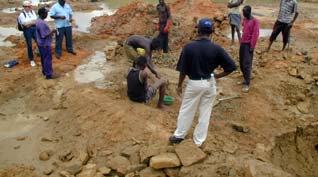
BRGM/RC-53
320-F
Dams
R
¡ Part A: F
6
Globa
2
1
l mercury pro
3
T
i
nal re
port
j
ect: Environ
A
4
5
m
e
n
tal assessm
ent Kad
o
ma-Chak
a
r
i are
a
, Z
Illustration 12 - The six fishing points on the Muzvezve River, Amber Rose mill (A) and Tix mill (T ).
i
mbab
3
we
9
Global mercury project: Environmental assessment Kadoma-Chakari area, Zimbabwe
3.4. SAMPLING: METHODOLOGY
3.4.1. Superficial layer, soil, tailings, sediment and water
Superficial layer (SL): Very fine particles deposited essentially by the wind at the
surface of the soil, or concrete are equivalent of dust. They are found in the village
houses, on the tracks in the village, in the milling centre building and close to the
milling equipment (stamp mill, copper-plate, bowl-concentrator, panning area, roasting
site...). This material, which contains only particles less than 2 mm in size, is collected
with paintbrush at random sampling points (three to five) over an area of 2 to a
maximum of 10 square meters (m▓), in order to obtain a composite sample.
Soil (SO): The topsoil from 0 to 3 cm deep. For each sampling point, the soil was
collected at several points (three to five) over a surface of 2 to 10 m▓ using a small
trowel and dry-sieved in the field to pass 2 mm, also in order to obtain a composite
sample. The sample was divided up to obtain sub-samples of smaller size than the bulk
sample without reducing the size of the individual particles.
Tailings (TA): The crushed or ground rocks that are sent to the settling ponds after the
amalgamation process and then dumped after cyanidation. Tailings were collected all
along the process in order to analyse mercury dispersion site by site:
- just after the copper-plate or bowl-concentrator,
- at different points all along the channel to the pond (if available),
- within the active pond (wet sample),
- within dry ponds from which the tailings will be sent to the cyanidation tanks,
- on the dumps of cyanided tailings.
For each sample, the tailings were collected with a small travel at several points (three
to five) over an area of 1 to 4 m▓ in order to obtain a composite sample.
Small trenches 5 to 10 cm long were dug along the slope of the dump, also to collect a
composite sample.
For some sites, tailings were panned just after the amalgamation process, allowing the
collection of the heavy particles and the analysis of the Hg content, which corresponds
to that lost during the amalgamation process. This operation was always done on the
same quantity of tailings of three 7 litre pans. Moreover, the coarse fraction of tailings
and slime were collected separately for chemical analyses just after the drag-clarifier.
Stream sediment (SE): stream sediment samples were collected:
- on the northern bank of Claw Dam close to Tix mill,
- over 7 km all along the Muzvezve River downstream from Claw Dam during the dry
season, so in the middle of the riverbed,
40
BRGM/RC-53320-FR ¡ Part A: Final report
Global mercury project: Environmental assessment Kadoma-Chakari area, Zimbabwe
- in small Muzvezve River tributaries at the Tix and Amber Rose mills during the dry
season.
For each sample, the sediments were collected with a small trowel at several points
(three to five) over an area of 1 to 4 m▓. The dry sediments were sieved to pass 2 mm.
Packing: The solid samples were collected and stored in new, clean and double-
capped 150 mL plastic bottles imported from France. The numbering was marked on
the double-cap, on the cap and on the bottle itself, to avoid losing the number (erasing)
during the transit operations. For some of them, a duplicate was made for chemical
analysis in the IMR laboratory at Harare. The same type of bottles were used for the
water samples, but sealed with a paraffin wax film (Parafilm)«.
3.4.2. Fish sampling conditions and procedures
a) General condition
The collection of fish samples close to the Muzvezve River met with many logistical
challenges. We were faced with the problem of finding fishermen, miners, panners, or
farmers who might help us to catch fish in order to sample only a small piece of flesh
from each fish, because no fresh fish markets were available in the selected area.
Concerned individuals were informed that the sampling would not alter the quality of
the fish and that the animals would be returned to them after sampling only a small
quantity of flesh. Some of them also asked for compensation payments for their time
lost during fishing and collecting activity instead of gold mining. For panners, who are
clearly engaged in unlawful activities, it was difficult to fish during our absence because
they frequently have problems with the police officers, who regularly chase them away
from the riverbank. Our presence on the site allowed them to carry out this activity. All
the fish sampled were paid for and returned to the owner after sampling.
Despite these time-consuming steps, fifty-two (52) specimens were collected along the
Muzvezve River in November 2003.
b) Sampling procedures
Before sampling fish flesh, standard length (from the nose to the base of the caudal fin)
and body weight were measured, and a picture was taken of each individual fish. Then,
a small piece of dorsal muscle (1.5 x 1.5 cm) was removed and kept in 30-mL plastic
bottles filled with a formalin solution (10% in deionised water). Caps were sealed with
Parafilm«. It was not always possible to reach our goal of five fish per species except
for Tillapia zilli, which is the species most often caught by the panners and miners. For
this latter species, individuals of differing weights and sizes were sampled, thereby
allowing us to investigate relationships between size and mercury contamination.
The samples of fish flesh were collected directly on the spot in front of the owner.
BRGM/RC-53320-FR ¡ Part A: Final report
41


Global mercury project: Environmental assessment Kadoma-Chakari area, Zimbabwe
3.5. ANALYSIS OF SOLID SAMPLES
The LUMEX RA-915+ analyser equipped with the RP 91C attachment (illus. 13) is
intended for measuring mercury in solid samples. The RA-915+ analyser operation is
based on differential Zeeman atomic absorption spectrometry using high-frequency
modulation of polarised light.
A radiation source (mercury lamp) is placed in a permanent magnetic field. The
mercury resonance line, = 254 nm, is split into three polarised Zeeman components
(, - and +).
When radiation propagates along the direction of the magnetic field, a photodetector
detects only the radiation of the - component, one of those falling within the
absorption line profile, another one lying outside.
When no mercury vapour is present in the analytical cell, the radiation intensities of
both components are equal.
When absorbing atoms appear in the cell, the difference between the intensities of the
components increases with increasing mercury vapour concentration. The principle
of the RP-91C attachment is based on the thermal destruction (at 800░C) of a sample
matrix and the reduction of the bound mercury in the sample followed by a volatilisation
and a determination of the amount of elemental mercury formed by the RA 915+
analyser.
RA-915+
Module RP-91C
Illustration 13 - The LUMEX RA-915+ analyser equipped with the RP 91C attachment.
The detection limit is 0.01 mg kg-1. For high concentrations (between 0.5 mg kg-1 up to
1,000 mg kg-1) a specific single-path cell is used in place of the multiple-path cell. After
stabilisation (about 40 minutes) of the equipment (lamp of the RA 915+ and pyrolisis
attachment), a calibration curve was obtained with five points. During mercury
determination, the calibration curve was checked, and the apparatus drift followed
every ten-sample determination, by analysing reference materials (NIST 8407 and LGC
6156). A sample (20 mg to 300 mg) is placed in a quartz spoon and inserted in the
oven (800░C). Signal acquisition is automatically ensured by monitoring software on a
42
BRGM/RC-53320-FR ¡ Part A: Final report
Global mercury project: Environmental assessment Kadoma-Chakari area, Zimbabwe
laptop linked to the LUMEX RA915+. The RA-915+ analyser does not differentiate
between mercury forms; it yields a total mercury concentration.
3.6. AIR MONITORING
3.6.1. Operating principle
The LUMEX RA-915+ analyser without the oven is also intended for measuring the
mercury vapour concentration of ambient air, both in stationary and continuous mode
(without a pre-concentration step in the absorption trap). Currently, there is no
generally available methodology for measuring low levels of mercury in ambient air.
The mercury values for air analysis given in this report are not certified as they are for
solid samples. But they make it possible to make comparison between the different
steps of the process. The RA-915+ analyser (Lumex) requires an external mercury
supply, such as a gas cylinder, for calibration.
After switch-on, it takes about 20 min. to stabilise the light source. When the
measurement mode is started, a zero adjustment is first carried out automatically. Then
the analyser measures and indicates continuously the measured mercury
concentration of the gas as both a numerical value and a graphic chart.
According to the constructor, the detection limit is 2 ng m-3 and the flow rate is 20 L mn-1.
Concentrations less than three times the limit of detection cannot be considered
significantly different. The multi-path cell should not be operated for too long in rooms
with high mercury vapour concentrations (higher than 10,000 ng m-3).
3.6.2. Problems
The RA-915+ analyser is relatively simple to use but it is not always easy to operate on
a mining site, essentially because of the quality of the power supply and of the high
level of mercury concentration measured in this study.
a) Internal battery and main power supply
When fully charged, the battery allows the analyser to operate continuously for
approximately 3.5 hours. The analyser needs to warm up for at least 20 minutes. This
means that unless the analyser is switched off between two monitoring rounds, air
cannot be monitored continuously for more than 3 hours.
It was not always possible to use the main power supply on the site due to its
instability. As a result, most of the time it was only possible to monitor for 1 to 1¢ hrs.
per day. It would be necessary to bring a generator or to connect the LUMEX to the car
battery.
BRGM/RC-53320-FR ¡ Part A: Final report
43
Global mercury project: Environmental assessment Kadoma-Chakari area, Zimbabwe
b) High mercury concentration
The RA-915+ analyser has a multi-path cell, which should not be operated for a long
time in places with a high concentration of mercury vapour (higher than 10,000 ng m-3).
In fact, the mercury concentration frequently exceeded 10,000 ng m-3. In order to avoid
contamination of the multi-path cell, the intake hose of the Lumex was withdrawn each
time the mercury concentration stayed above 10,000 ng m-3 for more than 1 or
2 minutes.
At Even Milling Centre, the efficiency of the air extractor was checked in the closed
roasting room. Momentarily, the mercury concentration was too high, and the multi-
path cell became contaminated. A complete clean up was done (replacement of the
dust filter and cleaning of the cell). For lack of time, it was not possible to return to the
Even Milling Centre for another monitoring operation.
In cases like this, a single-path cell is needed to allow analyses of mercury
concentrations as high as 200,000 ng m-3.
3.6.3. Air monitoring at the custom milling centres
The air monitoring operations did not cover entire sites. Monitoring was mainly carried
out in the areas where we saw workers using mercury.
The objective was to cover each step of the process from ore crushing to amalgam
recovery. This was not always possible, because crushing could sometimes last more
than one day depending on the quantity of the ore pile and the hardness of the ore (as
mentioned before, quartz requires more time than laterite).
At the Tix mill, the monitoring could be performed all along the process, from ore
crushing to amalgam recovery on the copper-plate, including cleaning the copper-plate,
and applying of a fresh coat of mercury. The measurements were made during the
following phases:
- pulp running on the copper-plate;
- scraping off the mercury by hand with a rubber scraper;
- collecting the amalgam, also with the hand;
- scouring with sand and lye to remove any coating or oxidation;
- scrubbing fine sand containing mercury onto the plate (as much mercury as the
plate will adsorb).
At Amber Rose mill, the process involves a bowl-concentrator installed a few meters
away from the stamp mill (~3 m). Some mercury is added inside the bowl, but no
additional mercury is handled during the concentration process. Here, the monitoring is
conducted around the stamp mills:
- on the top of the bowl-concentrator located a few meters away from the stamp mill;
- forty cm above the bowl;
44
BRGM/RC-53320-FR ¡ Part A: Final report
Global mercury project: Environmental assessment Kadoma-Chakari area, Zimbabwe
- on top of the coarse tailings stockpile (after the bowl);
- on top of the slime pond (fine tailings);
- close to the cyanidation tanks;
- close to the office buildings.
At Even Milling Centre:
- in the roasting room.
3.6.4. Air monitoring in the villages
The two villages are quite different. Tix village consists of about a hundred houses built
in a disorganised manner, and the first one to the north is at least 300 m away from the
mills. The villagers are not farmers; they all work as miners all around the village and
near or on the Claw Dam bank. They are also frequently at the Tix mill for the ore
crushing and amalgamation process. At Amber Rose, the village is smaller (less than
30 houses) and situated on the milling site between the mill and the cyanidation tank,
to the north, and the cyanided tailings, in the south. The tracks in the village are
frequently covered with cyanided tailings.
At Tix village, some of the villagers crush, pan and roast their amalgam next to their
houses. No roasting activity, however, was observed at Amber Rose village during the
survey.
Based on these two different contexts, the air monitoring was performed as follows:
- in Amber Rose in two places:
À inside the village,
À at the entrance of the milling site;
- in Tix village in four different places:
À in a public place (bar) in the middle of the village,
À at the southern extremity of the village, opposite the stamp mill,
À next to a roasting place in activity,
À next to a mercury storage place.
3.7. ANALYSIS
3.7.1. Tailings, soils and sediments
All the samples collected in Zimbabwe and brought back to France were analysed with
the Lumex device in the BRGM laboratory at OrlÚans, France.
All samples were sieved at 2 mm in the field. These samples were dried at 40 ░C for a
couple of days then, after homogenisation, each sample was separated into two sub-
BRGM/RC-53320-FR ¡ Part A: Final report
45
Global mercury project: Environmental assessment Kadoma-Chakari area, Zimbabwe
samples. The first sub-samples were directly analysed with the Lumex. The second
sub-samples were ground to less than 100 Ám, to be analysed with the Lumex.
The level of mercury is highly variable in the different samples. In order to avoid any
contamination by a high-mercury sample on a-low mercury sample, uncontaminated
mercury sand was analysed to control the absence of memory effect between two
determinations.
During mercury determination, the calibration curve was checked and the apparatus
drift followed every twenty sample determinations by analysing reference materials.
Fourteen samples (10 % of all the samples taken) were selected and sent to a control
laboratory (Chemex ALS, Canada). The analyses of the Chemex ALS laboratory were
done by CV-AAS (see app. 1).
The quality control done for the Lumex analyses vs. Standard References Materials
(SRM) on the solid samples, and the quality control for the water samples and for the
fish are given in the appendix 2 followed with interlaboratory comparisons.
46
BRGM/RC-53320-FR ¡ Part A: Final report
Global mercury project: Environmental assessment Kadoma-Chakari area, Zimbabwe
4. Results
4.1. SOIL, SEDIMENT, TAILINGS AND WATER BY SELECTED AREA
4.1.1. Southern zone
a) Tix mill
At Tix, the custom milling centre and the village of miners and millers are very close to
each other (less than one kilometer), but separated by a small watercourse that flows
southwards to the Claw Dam reservoir, approximately 2 km away (illus. 14). The
sampling was performed in the milling centre and in the village and, further away,
mainly to the south, up to 3 km downstream from Claw Dam and on the bank of Claw
Dam.
À Surrounding area level
Soil, sediments and tailings
The mining and milling activities in the Tix area are distributed in several spots in the
area:
- One kilometer to the north of Tix mill, the village of May Flower is characterised by
mining (small pits) and artisanal milling (hand crusher), panning (pit) and roasting
activities. One sediment sample (SE33) collected in a small 4 m▓ area panning pit in
the middle of the village shows 41.7 mg kg-1 Hg, attesting to the use of Hg for
amalgamation by the inhabitants.
- One kilometer to the south of Tix mill, very small sluices are visible in the middle of
the village of Mhisi, indicating artisanal (individual) mining, milling and amalgamation
activities (illus. 15A). Tailings collected at the sluice box site show 10.83 mg kg-1 Hg.
Moreover, sediment from the Claw Dam bank situated a few hundred meters from
the village yields a value of 3.17 mg kg-1 Hg.
- One kilometer to the south-west, a large mining activity (digging) can be seen during
the dry season all along the bank of Claw Dam (illus. 15B). During the rainy season
all these pits are totally flooded. The sediments collected along the bank are
contaminated by Hg (8.29 and 8.31 mg kg-1 Hg). If part of the pollution can come
from this mining activity visible during the dry season, it is obvious that another part
is coming from Tix, which is in the upstream drainage (SE16 with 8.29 mg kg-1 Hg).
It is also important to note that the Tix drinking water pumping raft is located in this
area (illus. 15C).
BRGM/RC-53320-FR ¡ Part A: Final report
47
48
Globa
l mercury pro
Tix mil s
North
Legend
35
3.17
37
- Sample number
j
ect: Environ
5650
37
38
0.07
See enlarg ement
43
0.03
10.83
2.41
- Hg value mg kg-1
36
Mhisi
May Flow er school
0.04
351
0.12
Fishing area
- Drinking water tank
20
0.06
39
0.07
19
0.06
m
22
0.11
e
- Cyanidation tank
33
18
n
5630
21
25
0.75
High w ater level
0.12
tal assessm
41.7
0.04Tix Mill area
- Stamp mill
Tix village
24
Low w ater level
0.14
34
26
0.07
10.60
- Works / Office
5610
Claw Dam reservoir
ent Kad
May Flow er
- Village
X position
village
o
- Cyanided tailings
ma-Chak
5590
16
36
8.29
1.14
BRGM/RC-53
Drinking w ater
15
Claw Dam reservoir
pum ping station
w ith artisanal pits
1.40
- Tailings before cyanidation
17
High w ater level
37/ 38
0.49
6.87
a
r
39
i are
Old m ine
5.50
5570
- Forest area
a
, Z
Low w ater level
32
- Smal stream
i
mbab
0-F
32
8.31
R
we
¡ Part A: F
5550
2650
2670
2690
2710
2730
2750
2770
2790
2810
Y position
soil
tailing
sediment
i
nal re
p
Illustration 14 - Local sketch of the Tix area. Sampling location and Hg results.
ort

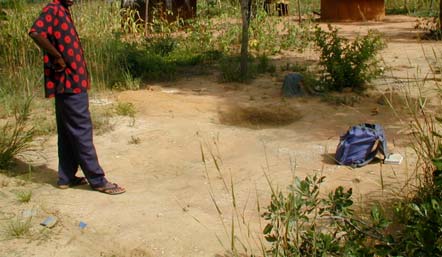

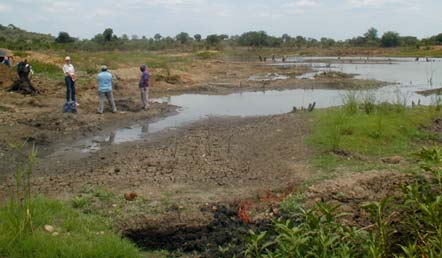
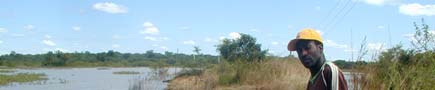
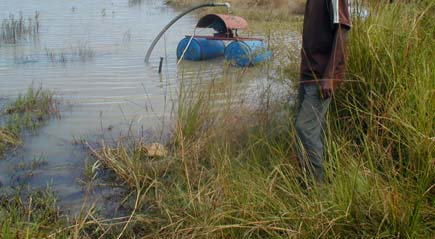

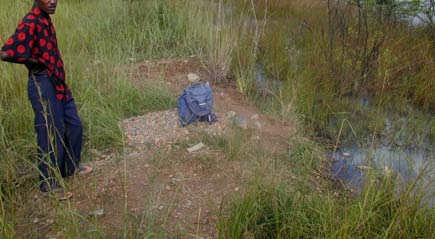
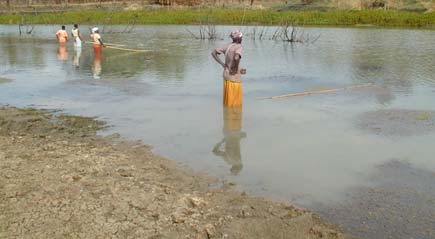
Global mercury project: Environmental assessment Kadoma-Chakari area, Zimbabwe
B: Numerous digging activities at the Claw
A: Mhisi village: Small pit for an artisanal sluice
Dam bank downstream from Tix mill. Fishing
box
area Point 4
C: Drinking water pumping raft at Claw Dam
D: Gold-processing area at Claw Dam bank
downstream from Tix mill
downstream from the old Tix mine
E: Fishing area (Point 5) at Claw Dam
downstream from Tix mill
Illustration 15 - Example of sample locations on the Tix site.
BRGM/RC-53320-FR ¡ Part A: Final report
49
Global mercury project: Environmental assessment Kadoma-Chakari area, Zimbabwe
- Two kilometers towards south, the track runs along the tailing dumps of the old
(closed) underground Tix mine. One part of the "waste", mainly low-grade
abandoned ore and tailings, are locally reprocessed by individuals (hand crushing
with an iron grinder, panning and amalgamation). A large part of these activities are
conducted on the Claw Dam banks. Sediment samples (SE36 to SE39) collected
here close to the processing areas are polluted by Hg (1.14, 1.40, 6.87 and 5.50 mg
kg-1 Hg) (illus. 15D). These places are also used for daily fishing activities by miners
and millers from Tix.
Water samples
- Water samples were collected in different locations. At the drinking water pumping
raft (WA1) at Claw Dam, the Hg concentration is 0.34 Ág l-1, a value under the WHO
limits of 1 Ág l-1 (WHO 1993). This value is confirmed by the sample collected at the
tap of the water tank (WA2) in the middle of Tix village that shows a concentration of
0.33 Ág l-1 Hg. Another water sample (WA6) was collected in the small watercourse
between the mill and the village. It drains the settling ponds and the tailing dumps of
Tix mill and yields one sample with 0.73 Ág l-1 Hg, confirming the presence of Hg in
the tailings. For information purposes, the pregnant cyanided solution (WA7)
collected at the bottom of the cyanidation tanks with the authorisation of the millers,
shows 741 Ág l-1 Hg.
This initial local survey indicates that, in Tix area, there is much scattered artisanal gold
mining activity that complicates the study of the sources and dispersion of the pollution
from Tix mill area itself.
The sediment samples collected in the fishing area along the Claw Dam bank display a
low Hg content of 0.12, 0.06 and 0.12 mg kg-1. (illus. 15E) that can probably be
considered as geochemical background values for such kind of sediments.
À Site level
In Tix mill and Tix village, the solid sampling was carried out in three main locations
with the following main results (illus. 16):
- North of the mill, in the soil, the Hg values reach a maximum of 0.07 mg kg-1 a few
hundred metres from the tailing dumps.
- In Tix village, traces of Hg are found in soil sample SO25, with 0.75 mg kg-1 in the
middle of the village. In the southern part of the village, the Hg value of soil drops to
0.07 mg kg-1which is probably close to the background value.
- In the milling centre, the tailings and soils are clearly contaminated by Hg at different
levels according to the proximity of amalgamation sites (See below).
Two north-south pseudo-sections illustrate the distribution of Hg contents in soils and
tailings in the landscape.
50
BRGM/RC-53320-FR ¡ Part A: Final report
BRGM/RC-53
Tix mill
North
Legend
5660
320-F
37
- Sample number
2.41
- Hg value mg kg-1
R
¡ Part A: F
38
- Drinking water tank
Globa
0.07
5650
37
0.03
200m
- Cyanidation tank
l mercury pro
May Flow er
36
0.04
i
- Stamp mill
nal rep
school
5640
351
0.06
41.5/1.72/1.17/12.97
- Works / Office
o
39
j
19.83
ect: Environ
rt
X position
0.07
27
22
0.11
- Village
26
5630
0.85
25
0.04
0.75
- Cyanided tailings
21
25
0.58
To Kadoma
9.33
Tix mill area 19/20/51/52
53
m
100.9
21
22
e
May Flow er
Tix village
- Tailings before cyanidation
n
24
6.65
tal assessm
village
54
39.33
5620
55
15.73
0.14
23
24
14.90
- Forest area
3.75
0.07
26
To C l a w D a m
- Smal stream
ent Kad
Tix vil age
5610
2655
2665
2675
2685
2695
2705
2715
2725
o
Y position
soil
tailing
sedim ent
stam p mills
ma-Chak
Illustration 16 - Sketch of Tix mill and village. Sampling location and Hg results.
a
r
i are
a
, Z
i
mbab
51
we
Global mercury project: Environmental assessment Kadoma-Chakari area, Zimbabwe
The first pseudo section (illus. 17) displays values in soils:
- Background values in soils are below 0.10 mg kg-1 and are observed from one
hundred meters to more than one kilometer from the artisanal settlements.
- Close to the bottom of the tailing dump after cyanidation, a soil sample (SO27)
shows high values around 19.8 mg kg-1 Hg. This area is drained by a small stream
flowing to Claw Dam.
- High Hg values (105 mg kg-1) were found at the entrance of the site in SL5, close to
the stockpiles, and in SO23 (43.53 mg kg-1 Hg) collected a few metres from the
copper-plate between two stamp mills.
- Relatively moderate contamination were observed 300 m away from of the tailings,
close to the village in SO24 (0.14 mg kg-1 Hg) and also in the village in S025
(0.75 mg kg-1 Hg).
The second pseudo section (illus. 18) illustrates the dispersion of Hg in the tailing
samples with:
- low Hg values (0.85 and 0.58 mg kg-1) in TA26 and TA25 collected on the dumps
after the cyanidation process,
- High Hg content in TA21 (39.33 mg kg-1) collected after the copper-plate.
- High Hg contents along the small channel (200 m long) carrying the tailings from the
drag clarifier to the tailing pond. Fifteen metres from the drag clarifier, TA22
presents a very high anomaly (100.9 mg kg-1 Hg), which is confirmed, 100 m
downstream, by TA54 (14.9 mg kg-1 Hg), and then by TA 55 (15.73 mg kg-1 Hg) at
the inflow of the pond. The Hg grade varies according to the grain size of the
samples (from slime to coarse sand) but also according to the position of the
sampling point in the channel (in the middle of the flow or in small deposit area in
the curve of the channel) (illus. 19). The slime (TA52) contains more Hg
(12.97 mg kg-1 Hg) than the coarse sand (TA20, TA51), with respectively 0.72 and
0.17 mg kg-1 Hg.
- There are moderate Hg contents in the dry tailings (TA23 and TA24), ready to be
collected for vat-cyanidation, with 3.75 and 6.65 mg kg-1 Hg.
Remarks: The gold processing activity is artisanal and discontinuous, carried out in
batches by a succession of miners on different qualities of ores. Thus there is a
significant variation in the quantity and quality of tailings even during a single day of
work. The quantity of mercury used on the copper-plate in each batch of processed ore
is not known, or is recorded anywhere.
Consequently, the Hg contents in tailings may vary tremendously, hour after hour,
throughout the process. It is therefore not possible to give a true picture of the Hg
contents in the tailings without a systematic sampling of the ponds and dumps in
addition to several months monitoring of the tailing flow, to analyse also the seasonal
variation (outside temperature and rainfall).
52
BRGM/RC-53320-FR ¡ Part A: Final report
BRGM/RC-53
Tix Mills: North-South soil sample profile
19.83 mg/kg
Lumex<2mm
43.53 mg/kg
320-F
0,90
105.00 mg/kg
South
North
R
¡ Part A: F
Globa
0,70
l mercury pro
i
nal rep
0,50
o
j
ect: Environ
rt
ean value)
M
0,30
m
Hg mg/kg (
e
n
tal assessm
0,10
SO37
SO39
SO38 SO351 SO36
SO21
SO22
SO27
SL5
SO23
SO24
SO25
SO26
-0,10
ent Kad
Forest area with artisanal gold mining
Tailings dump
Tailings dump
after cyanidation
Stamp mills
after cyanidation
Tix village
o
activities
ma-Chak
-0,30
Sample number
a
r
i are
Illustration 17 - Hg distribution in soil samples following the process at Tix mill.
a
, Z
i
mbab
53
we
54
Globa
l mercury pro
40,00
j
100.90 mg/kg
Lumex<2mm
ect: Environ
North
South
30,00
m
e
n
tal assessm
20,00
ent Kad
o
10,00
Coarse
ma-Chak
Slime
fraction
Hg mg/kg
BRGM/RC-53
a
r
i are
0,00
TA26
TA25
TA21
TA20
TA51
TA52
TA53
TA22
TA54
TA55
TA23
TA24
a
, Z
i
32
mbab
0-F
-10,00
we
R
¡ Part A: F
Tailings dump
Tailings deposits
Tailings ponds
Drag clarifier area
Cu-Plate
after cyanidation
in the open channel to the pond
Stamp mill
i
nal rep
-20,00
Sample number
o
rt
Illustration 18 - Hg distribution in various tailings samples at Tix mill.


Global mercury project: Environmental assessment Kadoma-Chakari area, Zimbabwe
The analytical results on tailings clearly shows the dispersion of Hg in tailings
throughout the process, giving us the possibility to identify the "Hot Spots" and to locate
the source of contamination.
Stamp mill
Copper-plates
Drag Clarifier
Channel
TA22: 100.9 mg.kg-1 Hg
Illustration 19 - Tailings "channel" at Tix mill.
b) Amber Rose mill
At Amber Rose mill, the village of miners and millers is surrounded by tailings and all
the village tracks are covered with tailings (illus. 20). The sampling was detailed in the
milling centre for soils, sediments, tailings, in the village and in the surrounding area,
mainly in the small streams draining the site.
À Surrounding area level
Sediments were collected in two small streams:
- The first one, around 700 m south of Amber Rose, runs across the road. It is
characterised by sediments that look like fine-grained tailings. The bottom
sediments (SE29), brown to reddish, are covered over by 2 cm of white sediments
(SE28). They both contain Hg, with 27.7 and 23.15 mg kg-1 respectively, attesting
that they come from tailing dumps located somewhere in the upstream drainage.
Lack of time did not allow us to check this upstream part.
BRGM/RC-53320-FR ¡ Part A: Final report
55
56
Globa
l mercury pro
Amber Rose mill
j
ect: Environ
Legend
37
- Sample number
m
4950
2.41
e
- Hg value mg kg-1
n
tal assessm
North
- Drinking water tank
4940
- Cyanidation tank
4930
28/29
23.15 / 27.7
- Stamp mil
ent Kad
North
4920
Old Road to Kadoma
- Works / Office
o
ma-Chak
To Kadoma
i
tion
- Village
30 / 31
BRGM/RC-53
4910
0.39 / 1.6
Y pos
- Cyanided tailings
a
r
i are
4900
- Tailings before cyanidation
a
, Z
4890
i
32
See detailed map
mbab
- Forest area
0-F
- Smal stream
we
R
¡ Part A: F
4880
100m
4870
2690
2700
2710
2720
2730
2740
2750
2760
2770
2780
2790
2800
2810
2820
2830
2840
2850
i
nal rep
X position
soil
tailing
sediment
stamp mills
o
rt
Illustration 20 - Surrounding area of Amber Rose: sampling location.
Global mercury project: Environmental assessment Kadoma-Chakari area, Zimbabwe
- The second one, around 500 m north of Amber Rose, crosses the road. It is also
characterised by the presence of transported tailings, brown to reddish, at the
bottom (SE31) and white in the upper part (SE30). The Hg content is slightly lower
than that above, with 1.6 and 0.39 mg kg-1 Hg respectively. It is also difficult to
certify that these tailings (sediments) come from the Amber Rose mill because the
drainage network is not well indicated on the available maps, but also because other
small milling centres are visible along the road.
These two sediment samplings indicate that tailings can be found as sediments in the
drainage structures. The tailings are not systematically stored in tailing dumps. A lot of
them are transported far from the milling centre in the watercourse during the rainy
season or may be carried off voluntarily by the millers when the dumping is not well
organised. Consequently the risk of the dispersion of Hg contained in the tailings is
high.
À Site level
At the site level of Amber Rose mill and village, the solid sampling was carried out in
five places with the following main results (illus. 21):
- In the small watercourse located north of the mill. The sediments collected in two
different places (SE25 and SE26) are polluted and contain respectively 4.26 and
1.23 mg kg-1 Hg. According to the drainage network, we can certify that this pollution
comes from Amber Rose mill, roughly 200 m away.
- In the Amber Rose village, traces of Hg are found in soil samples SO40, SO43,
SO44 and SO45 with respectively 0.67, 14.31, 2.11, and 2.08 mg kg-1. These Hg
concentrations are associated with the large quantity of tailings that are spread out
in the village.
- Roughly 50 to 100 m around the village, in a bush area. Samples SO41, SO42 and
SO46 present a low Hg content, between 0.12 and 0.27 mg kg-1.
- In the milling centre, the tailings and soils are clearly contaminated by Hg at different
levels depending on the proximity of amalgamation sites.
- In the tailing dumps, stored after cyanidation in the southern part of the village,
traces of Hg are found in samples TA39 and TA40 with respectively 1.39 and
2.10 mg kg-1 Hg.
Illustration 22 shows the distribution of Hg contents following the process in various
media (soils and tailings).
- The Hg values range from 0.40 mg kg-1 for TA34 to 6.90 mg kg-1 for TA48 in the
tailings collected just after the bowl-concentrator (overflow).
- The heavy material from the tailings pan concentrate are contaminated with
30.40 mg kg-1 Hg, attesting that part of the mercury used in the bowl-concentrator is
lost during the amalgamation process.
- The tailings stored in settling ponds before cyanidation and dumped after
cyanidation (TA36, TA38, TA50, TA57, TA37, TA39 and TA40) contain relatively
moderate amounts of Hg between 1.04 and 5.30 mg kg-1.
BRGM/RC-53320-FR ¡ Part A: Final report
57
58
Globa
l mercury pro
4925
Amber Rose Mills
Legend
37
- Sample number
North
j
ect: Environ
2.41
- Hg value mg kg-1
4920
- Drinking water tank
- Cyanidation tank
m
To Kadoma
e
n
4915
- Stamp mil
tal assessm
46
0.13
- Works / Office
34/42/48/49
4910
- Village
ent Kad
Mil s area
0.4, 4.5, 10.91, 2.46
45
35
2.08
- Cyanided tailings
9.80
o
X position
50
ma-Chak
- Tailings before cyanidation
4905
5.40
44
BRGM/RC-53
38
37
2.41
2.11
39
- Forest area
36
43
14.3
a
5.30
2.10
r
1.04
40
i are
- Smal stream
4900
Village area
a
26
1.39
, Z
1.23
40
i
32
mbab
0.67
0-F
25
41
50m
0.27
4.26
we
R
4895
¡ Part A: F
42
0.12
50m
4890
i
nal rep
2735
2740
2745
2750
2755
2760
2765
2770
2775
Y position
soil
tailing
sediment
o
rt
Illustration 21 - Site of Amber Rose: sampling location.
BRGM/RC-53
Amber Rose Mill: Hg grade according to the type of activity and media
20,00
320-F
Lumex<2mm
17,50
R
Globa
¡ Part A: F
15,00
l mercury pro
12,50
i
nal re
10,00
)
e
j
p
ect: Environ
ort
7,50
valu
Coarse
5,00
(Mean
fraction
m
/kg
2,50
e
n
mg
Slime
tal assessm
g
H
0,00
TA34 TA42 TA48 TA49
TA38 TA36 TA50 TA37 SO40 SO44 SO45 SO43 SL8 SO41 SO46 TA39 TA40 SO42
-2,50
ent Kad
-5,00
o
ma-Chak
-7,50
Stamp mill
Tailings
Tailings pond
Village
Tailings
Bowl concentrator
d
Cyanidation tank
d
Drag clarifier
-10,00
a
r
i are
Sample number
a
, Z
Illustration 22 - Hg content distribution in various samples following the ore process at Amber Rose.
i
mbab
we
5
9
Global mercury project: Environmental assessment Kadoma-Chakari area, Zimbabwe
- The soils in the village are significantly above natural backgrounds (<0.1 mg kg-1)
and show values below 2.5 mg kg-1 Hg. However a sample (SO43) shows clearly an
abnormal value of 14.31 mg kg-1. The superficial layer covering the soil and
containing mostly the local dust may show abnormal values, like the sample (SL8),
collected in the same place, with 19.77 mg kg-1 Hg.
À Water samples
The drinking water sample (WA3) collected at the bottom of the water tank, installed in
the milling centre by the owner, shows a Hg concentration of 0.01 Ág l-1. The water
comes from a well outside the milling site.
A sample of the pregnant solution (WA5) was collected in the clarifier tank by
permission of the owner. The Hg concentration reaches 110.50 Ág l-1. After passing
through a few column lined with activated charcoal to remove the gold, the solution is
regenerated and recycled in the cyanidation tanks (illus. 5).
c) Muzvezve River
Along the Muzvezve River, stream sediment sampling was performed on a 7 km long
profile, from Claw Dam (downstream from the Tix site) up to the panning area just after
the "Alexander Farm reservoir" and downstream from Amber Rose site. The stream
sediments profile (illus. 23) shows that the highest Hg value (0.76 mg kg-1) is found in a
mud sample (SE9) collected downstream a panning area. The other samples display
low Hg contents, between 0.01 and 0.26 mg kg-1, with a mean at 0.09 mg kg-1 that can
be considered close to the local natural background.
It is important to note that the Hg concentration in sediments is depleted after Claw
Dam (SE3 to SE6), with a mean value of 0.02 mg kg-1. At the other sampling points, the
mean value ranges around 0.12 mg kg-1 (excluding the SE9). This can be explained by
the lack of panning activity (forbidden activity) just below Claw Dam up to the small
dam where the pumping station for the Kadoma drinking water is settled.
d) New Plus mill
New Plus mill was not investigated in detail because of its similarity and proximity to Tix
mill. The only difference lies in the fact that a roasting room is available for the local
customers (illus. 24). If indeed the principle of setting up a roasting room is
appreciable, this installation is not safe at all because all the fumes are rejected directly
outside the building on the site of the milling plant. People staying in the area are then
directly exposed to the smoke and dust rejected by this roasting room. The dust (SL10)
collected on the cement covering the soil around the roasting house contains
50.53 mg kg-1 Hg (illus. 25).
A sample of tailings (TA41) was collected downstream from the drag clarifier installed
after the copper-plate and the sluice. It contains 19.73 mg kg-1 Hg, which is in the same
range of values as in Tix mill.
60
BRGM/RC-53320-FR ¡ Part A: Final report
BRGM/RC-53
Muzvezve River : West-East sampling profile
4,00
Lumex<2mm
320-F
Muzvezve River Flow
West
R
East
¡ Part A: F
3,00
Globa
Downstream
Upstream
7 km
l mercury pro
i
nal re
2,00
Claw Dam
p
at 500m
ort
0.76 mg/kg Hg
Pan concentrate
j
ect: Environ
of river sediments
1,00
Fishing places
Fishing places
m
e
n
Hg mg/kg Mean value
tal assessm
0,00
SE12 SE13 SE14
SE21 SE22
SE24
SE9
SE8 SE11 SE10 SE2
SE1
SE7
SE6
SE5
SE4
SE3
v
v
v
v
v
v
v
v
v
v
v
v
v
ent Kad
-1,00
Area with a lot
Small dam
Area without
Old road
Area with a lot
of panning activities
Alexander Farm
Pumping station
panning activity.
to Kwekwe
of panning activities
Reservoir
o
for Kadoma drinking
Strictly forbidden
ma-Chak
water
by the authorities
-2,00
a
r
Sample number
i are
a
, Z
Illustration 23 - Hg content in the Muzvezve River samples.
i
mbab
6
1
we
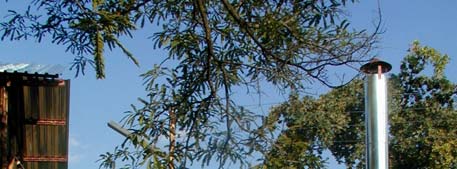
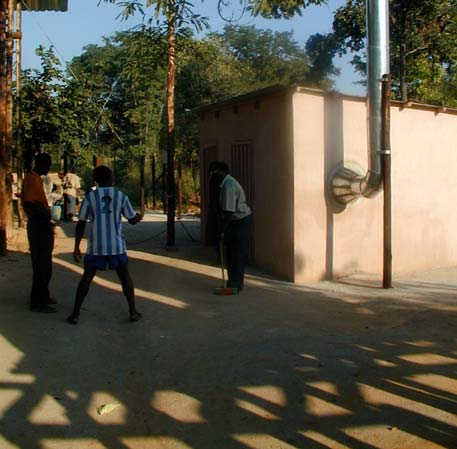
Global mercury project: Environmental assessment Kadoma-Chakari area, Zimbabwe
Roasting house with
Stamp mill
exhaust pipe
Concrete covered
by dust: 50.53
mg.kg-1 Hg
Illustration 24 - New Plus Mill. Dust sampling on the concrete floor
around the roasting house with an exhaust pipe.
New plus and Etena mill sampling profiles
60
Lumex<2mm
New Plus Mill
Etena Mill
50
40
30
ue
Village area
20
g Mean val
/
k
g
m
g
10
H
0
SL10
TA41
SL12
SO47
TA56
-10
Dust on the
Hg roasting
Stamp mill
Roasting area
Panning and
Stamp mill
concrete
room
Cu-Plate
(Fire wood)
amalgamation area
Bowl concentrator
drag clarifier
-20
Sample number
Illustration 25 - Hg content in New Plus and Etena samples.
62
BRGM/RC-53320-FR ¡ Part A: Final report
Global mercury project: Environmental assessment Kadoma-Chakari area, Zimbabwe
4.1.2. Northern zone
a) Summit mill
As in the other sites of the northern zone, the workers of the custom milling centre live
two to three hundred meters away from the processing plant. Illustration 26
summarizes the distribution of Hg contents in the various samples collected at that site.
- The tailings collected downstream from the copper-plate (TA2) and at the inflow of
the settling pond (TA3) contain 7.02 and 14.45 mg kg-1 Hg respectively. This shows
some contamination of the process residues after the copper-plate. The presence of
Hg is confirmed with 32.97 mg kg-1 in the a heavy mineral concentrate sample of
tailings TA4.
- The tailings collected on the tailing dump after cyanidation (TA6) still contain traces
of Hg (2.46 mg kg-1), with consequently a slight pollution of the soils close to the
tailing dumps (SO4 with 1.21 mg kg-1 Hg).
- A few hundred meters from the dumps, the Hg contents in cultivated soils (SO5 and
SO6) are low (0.05 and 0.2 mg kg-1 Hg).
- Soil samples (SO01, SO02, SO03) collected between the mill and the village
(200 m) present traces of Hg, respectively 0.97, 0.11 and 0.33 mg kg-1. The
superficial layer collected in the village SL02 shows some traces of Hg, with
3.96 mg kg-1.
b) Glasgow Mill
Results are displayed on the illustration 27.
- The tailings collected downstream from the copper-plate (TA7) and at the inflow of
the settling pond (TA9) contain respectively 2.42 and 11.60 mg kg-1 Hg, attesting to
the contamination of processing residues from the copper-plate. Moreover, the slime
part of the tailings is particularly polluted with 30.67 mg kg-1 Hg. These Hg
contaminations are confirmed in the crushing and amalgamation area in soil sample
(SO11) and in the superficial layer (SL3) collected near the stamp mill and the
copper-plate. These two samples show, respectively, 21.93 and 28.8 mg kg-1 Hg.
- The tailings collected on the dump after cyanidation (TA11 and TA12) still contain
Hg, respectively 1.35 and 1.10 mg kg-1.
- Soil samples SO12 to SO15, collected close to the tailings dumps, contain low
amounts of Hg (0.05 to 1.14 mg kg-1).
- The soil samples (SO7 and SO8) collected between the mills and the village, 200m
away, present some traces of Hg, respectively 0.21 and 0.52 mg kg-1. The soils
collected in the village (SO9 and SO10) show traces of Hg with 2.08 and
1.50 mg kg-1.
BRGM/RC-53320-FR ¡ Part A: Final report
63
Globa
64
l mercury pro
Summit Mill
j
ect: Environ
40,00
Lumex<2mm
m
e
30,00
n
tal assessm
20,00
ent Kad
o
ma-Chak
10,00
BRGM/RC-53
a
r
i are
Hg mg/kg (mean value)
0,00
a
, Z
SO6
SO5
SO4
TA6
SL1
TA2
TA3
TA5
SO3
SO1
SO2
SL2
i
mbab
32
0-F
we
R
¡ Part A: F
-10,00
Soil
Cyanided Tailings
tailings ponds
Stamp mill
Village
Cu-plate or bowl concentrator
i
nal rep
-20,00
Sample number
o
rt
Illustration 26 - Hg distribution in various samples following the process at Summit Mill.
Global mercury project: Environmental assessment Kadoma-Chakari area, Zimbabwe
c) Coetzee mill
Results are displayed on the illustration 28.
- As for the other milling centres, the heavy mineral part of the tailings (TA13) that has
been concentrated by panning contains high Hg concentrations (69.03 mg kg-1).
- The tailings collected downstream from the copper-plate (TA14) and at the inflow of
the settling pond (TA15) located 50 m away from the copper-plate, contain
respectively 2.31 and 2.34 mg kg-1 Hg, attesting some moderate contamination of
the residues during the amalgamation process. The dried tailings of the ponds
(TA16) confirms that point, with 5.73 mg kg-1 Hg.
- The tailings collected on the dumps after cyanidation, TA17 and TA18, contain also
some traces of Hg with respectively 4.07 and 1.53 mg kg-1.
- Two soil samples collected on the edge of a small stream coming from the tailing
dump are also anomalous. SO19 collected 150 m from the tailings shows
1.10 mg kg-1, and SO20 collected at 200 m contains 2.64 mg kg-1 Hg. The soil
sample collected in the cultivated area 50 m from the tailings presents 0.22 mg kg-1
Hg, which is close to the background level.
- Soil samples (SO16 and SO17) collected respectively in the village and in a forest
area, these two points being nearly 200 m away from the copper-plate, present low
Hg values, respectively 0.13 and 0.21 mg kg-1. This is confirmed by sample SL4 that
contains 0.36 mg kg-1 Hg.
d) Lilly mill
Lilly mill was not studied in detail, but four samples were collected during the main
steps of the process in order to compare this site with the other ones located in the
northern zone. The process in Lilly is slightly different because of the presence of both
a copper-plate and a bowl-concentrator. Moreover, and unlike the other sites, the
stamp mill, the copper-plate and the bowl-concentrator are installed in a closed
building. The poor ventilation of this place can induce a strong concentration of Hg in
the atmosphere that is breathed (illus. 29A and B). It must be verified by an air
monitoring.
À Tailing samples
The tailings (TA44) collected in the building downstream from the bowl-concentrator
shows an Hg content of 3.89 mg kg-1. The tailings TA45 collected outside, in the
tailings channel 10 m away from the building, presents some traces (0.77 mg kg-1)
(illus. 30 and 31A). This observation is confirmed by TA46 collected 5 meters
downstream, with 1.44 mg kg-1 Hg. In the settling pond 80 m downstream, the
concentration of Hg increases, with 12.27 mg kg-1 on a wet sample (illus. 31B).
BRGM/RC-53320-FR ¡ Part A: Final report
65
66
Globa
l mercury pro
Glasgow Mill : North-South sampling profile
j
ect: Environ
30,00
Lumex<2mm
30.67 mg/kg
25,00
m
e
n
tal assessm
20,00
15,00
ent Kad
Slime
o
10,00
ma-Chak
BRGM/RC-53
5,00
a
r
i are
Hg mg/kg mean value
a
, Z
0,00
32
i
mbab
SO15 SO14 SO13 SO12 TA11 TA12 SO11 SL3
TA7
TA8
TA9 TA10
SO7
SO8
SO9 SO10
0-F
R
we
-5,00
¡ Part A: F
Village area
-10,00
Tailings dump
Stamp mill
Tailings pond
Cultivated area
Cu-late
after cyanidation
Drag clarifier
i
nal rep
-15,00
o
rt
Sample number
Illustration 27 - Hg distribution in various samples following the process at Glasgow site.
BRGM/RC-53
Coetzee Mill
30,00
Lumex<2mm
320-F
25,00
R
Globa
¡ Part A: F
20,00
l mercury pro
i
nal rep
15,00
Small drainage
j
ect: Environ
o
rt
10,00
from tailings dump
5,00
m
e
n
tal assessm
Hg mg/kg mean value
0,00
SL4
SO16 SO17
TA14
TA15
TA16
TA17
TA18
SO18 SO19 SO20
-5,00
ent Kad
Tailings ponds
Village area
Stamp mill
Tailings deposit in
Cyanided Tailings
Cultivated area
-10,00
open channel
Cyanidation
o
Cu-Plate
ma-Chak
tank
-15,00
a
Sample number
r
i are
a
, Z
Illustration 28 - Hg distribution in various samples following the process at Coetzee site.
i
mbab
we
67
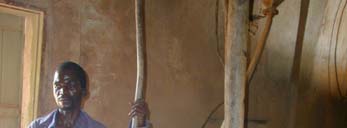
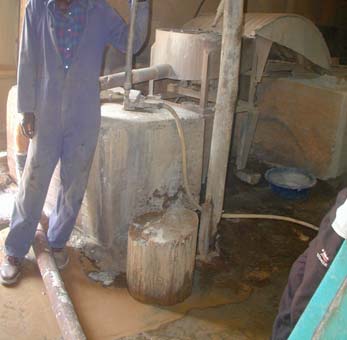
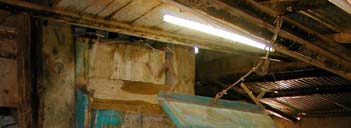
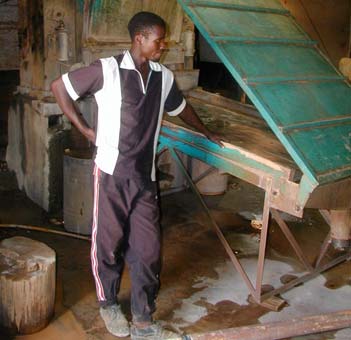
Global mercury project: Environmental assessment Kadoma-Chakari area, Zimbabwe
A: Bowl-concentrator
B: Copper-plate
Illustration 29 - Bowl-concentrator and copper-plate in a closed building at Lilly mill.
Lilly Mill sampling profile
14
Lumex<2mm
12
10
8
ue
6
4
g Mean val
/
k
g
0.63 mg/l Hg
2
Hg m
0
TA44
TA45
TA46
TA47
WA4
-2
v
Tailings dump
Village
-4
Stamp mill
Cyanidation
Open channel with
tailings ponds
after cyanidation
Drinking
Bowl concentrator
tank
well water
tailings deposit
Cu plate
-6
Sample number
Illustration 30 ¡ Hg contents in samples collected at Lilly mill.
68
BRGM/RC-53320-FR ¡ Part A: Final report

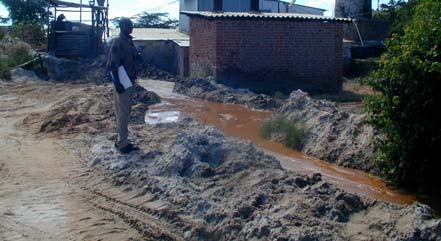
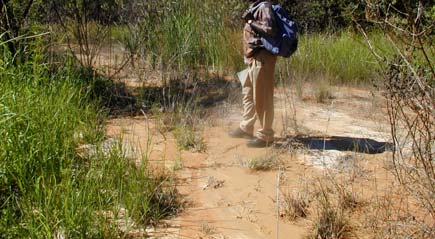

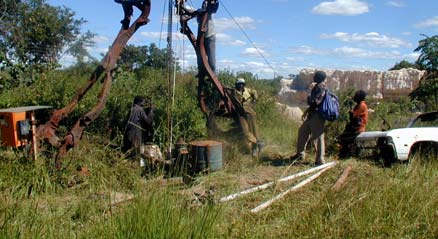
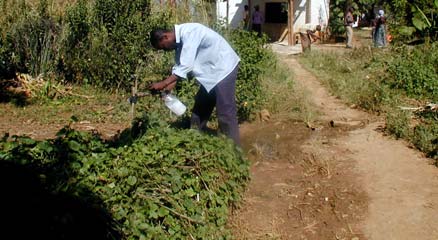
Global mercury project: Environmental assessment Kadoma-Chakari area, Zimbabwe
A: Channel to the settling pond
B: Settling pond (TA47)
(TA45 and TA 46)
with 12.27 mg.kg-1 Hg
Illustration 31 - Tailings sample location at Lilly mill.
À Water samples
The drinking water (WA4) collected at a tap in the village shows 0.63 mg l-1 Hg. This
water is pumped in a well dug by the mill owner, situated roughly 50 m from the
cyanided tailing dumps (illus. 32A and B).
A: A well dug for drinking water, with cyanided
B: Drinking water at a tap in the village
tailings in the background
Illustration 32 - Drinking water installation at Lilly mill.
e) Even Milling Centre
Even Milling Centre was studied more in detail because it was recently installed with
modern equipment and is the only milling centre equipped with a jaw-crusher and a
ball-mill followed with bowl-concentrator. Moreover, a roasting room was built for the
local customers and also an open shelter with a concrete floor for panning and final
amalgamation by the miners.
The Hg content distribution is displayed on illustration 33.
BRGM/RC-53320-FR ¡ Part A: Final report
69
70
Globa
l mercury pro
Even Milling Centre sampling profile
j
ect: Environ
Lumex<2mm
74.60 mg/kg Hg
35,00
m
tailings after pan amalgamation
e
n
tal assessm
25,00
ent Kad
15,00
o
Panning area
ma-Chak
BRGM/RC-53
10m
a
r
i are
hg mg/kg Mean value
5,00
a
. Z
32
i
mbab
0-F
SO31 SO32
SO28
TA27
SL7
TA28
TA30
TA31 SO29 SO30 TA32
TA33 SO33 SO34 SO352
R
we
¡ Part A: F
-5,00
Hg roasting
Tailings pond
Soil
Tailings dump
Forest area
Forest area
room
Bowl concentrator
i
nal re
-15,00
port
sample number
Illustration 33 - Hg contents in the samples of Even Milling Centre.
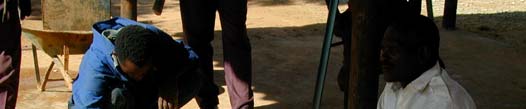
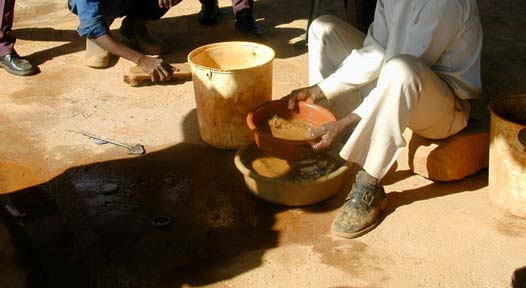
Global mercury project: Environmental assessment Kadoma-Chakari area, Zimbabwe
- The soil sample collected a few meters from the shelter (SO28), where the miners
use mercury, presents a relatively high Hg value of 23.55 mg kg-1. This result is
confirmed on the fine fraction (< 100 Ám) of the same sample that shows, after
grinding, 41.43 mg kg-1. High Hg contents are found in the dust (SL7) collected by
cleaning the concrete floor under the shelter with 74.60 mg kg-1. The same sample
yields 985.40 mg kg-1 Hg on the < 100 Ám fraction (illus. 34). The tailings (TA27)
downstream from the amalgamation in a plastic basin also show a high Hg value of
23.10 mg kg-1 (61.75 mg kg-1 on the < 100 Ám fraction). This area is the most
contaminated area of the milling centre.
- The soil samples near the roasting room (10 m away) (SO31 and SO32), show
respectively 2.71 and 0.47 mg kg-1 Hg (illus. 35).
- The tailings show only a few Hg traces in the channel to the settling pond (TA28), in
the pond itself (TA 30 and TA31) and also in the tailing dump after cyanidation
(TA32 and TA33), with low to moderate Hg values between 0.12 and 1.55 mg kg-1.
- A soil sample (SO33), which is composed of in-situ soil and tailings transported by a
small watercourse, was collected beyond the boundaries of the site. It presents
some traces of Hg (0.62 mg kg-1). Soil samples SO29 and SO30 close to the tailing
ponds (a few meters away) and those collected outside the site (SO34 and SO352),
roughly 50 and 150 m from the tailings, contain a very low Hg level (between 0.02
and 0.13 mg kg-1). These values can be taken as representative of the background
level.
At this site, the hot spot is located in and near the shelter for amalgamation. As the
milling centre is recent, the Hg dispersion remains relatively restricted to the shelter
place and the surrounding soil. Nevertheless, precautions must be taken, mainly at the
amalgamation site, which seems to be the more polluted of the two, presenting the
maximum risk for humans.
Illustration 34 - Dust collection by miners on the concrete floor of the shelter
for amalgamation at Even Milling Centre.
BRGM/RC-53320-FR ¡ Part A: Final report
71

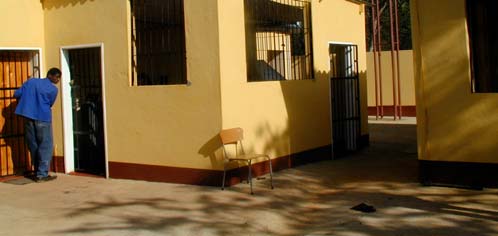
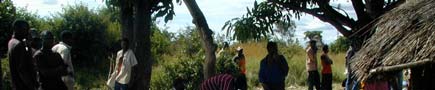
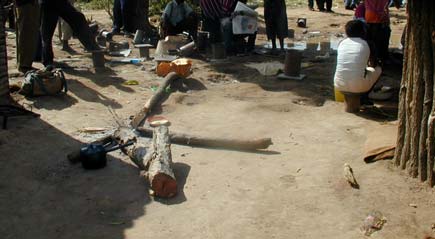

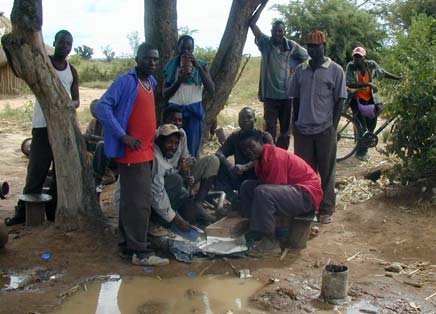
Global mercury project: Environmental assessment Kadoma-Chakari area, Zimbabwe
Exhaust pipe
Illustration 35 - Roasting room at Even Milling Centre.
f) Etena
Etena milling centre was investigated only summarily at the end of the second field
work (April, 2004), to collect additional data in the northern zone and also to visit this
site, described as highly polluted. In the village, many hand crushing sites with an iron
grinder, small sluice or "james-tables", panning and amalgamation areas and also open
roasting places are visible.
The illustration 36 shows relatively high Hg concentration in the dust (SL12) collected
around a roasting area, with 21.50 mg kg-1 (illus. 36A), and in the soil sample SO47
collected in the panning and amalgamation area showing 7.27 mg kg-1 (illus. 36B).
At the custom milling centre, tailings TA56 collected in the overflow of the bowl-
concentrator shows 23.47 mg kg-1, which is confirmed in the second analysis carried
out on the ground sample < 100 Ám (43.20 mg kg-1).
B: Crushing, panning and amalgamation area
A: Roasting area (21.50 mg kg-1 Hg)
(7.27 mg kg-1 Hg)
Illustration 36 - Sampling location at Etena village.
72
BRGM/RC-53320-FR ¡ Part A: Final report
Global mercury project: Environmental assessment Kadoma-Chakari area, Zimbabwe
Despite the small number of sample collected in Etena, the disorganisation of the
artisanal activity and the chemical analyses indicate that this site is highly
contaminated and can be considered as an important hot spot.
4.1.3. Main outcomes on solid samples
À Background values for soils and sediments
At each site we observed a rapid decline in Hg concentration outside the milling centre
in the cultivated and forest areas. This decrease is visible within the first 10 metres and
was verified more than 300 m away from the milling installations. The local background
values range from 0.02 mg kg-1 at Even Milling Centre to 0.22 mg kg-1 at Coetzee mill.
These values are in the range of those published by INERIS (2003), which are 0.03 to
0.15 mg kg-1 as a medium value generally found and are comparable to 0.09 mg kg-1
given by G. Sposito (1989) (illus. 37).
Downstream from Claw Dam, six stream sediment samples collected in a protected
area where panning is strictly forbidden for security reasons, and also without any
milling activity close by, show a Hg concentration between 0.01 and 0.03 mg kg-1.
These values can be used as Hg background values for sediments in this area, that
stay in the range of the reference value of 0.2 mg kg-1 (illus. 37).
À Soils at the processing sites
The soils collected close to the copper-plate are systematically contaminated. The
highest Hg concentration is found at Tix mill, with 43.53 mg kg-1. In the other places,
the Hg content ranges between 7.27 mg kg-1 (Etena) and 21.93 mg kg-1 (Glasgow). It
was not possible to collect soil samples systematically on all the sites visited due to the
presence of large amounts of tailings dumped all around the equipment. The value of
23.55 mg kg-1 recorded at Even Milling Centre does not indicate a contamination
associated with the main process of amalgamation by the bowl-concentrator but rather
a contamination due to the presence of miners performing an additional amalgamation
in pans and plastic basins under the shelter. Globally it seems that the Hg pollution is
more important around the copper-plate than around the bowl-concentrator.
À Tailings
As the tailing sampling was conducted over a short period of time, the results obtained
are indicative of the quality of the process but can not be used to determine a
quantitative balance of Hg in the process. In order to obtain such a balance, the tailings
will need to be monitored during the different steps over at least several weeks.
All the tailings collected during the different steps of the process, from the copper-plate
or bowl-concentrator to the settling ponds no more than 300 m away, contain medium
to high Hg concentration: 0.12 mg kg-1 at Even Milling Centre to 39.33 mg kg-1 at Tix
mill.
BRGM/RC-53320-FR ¡ Part A: Final report
73
74
Globa
l mercury pro
Synthesis of the chemical analyses on tailings, sediment, soil and water samples. Min ¡ Max values in mg kg-1 otherwise specified
Sample Type
Summit
Glasgow
Coetzee
Lilly
Etena
Even
Tix
Amber
New plus
Muzvezve
Reference /
Background
TA: Copper-plate/bowl-
7.02 ¡ 14.45
2.42 ¡ 11.60
2.31 ¡ 2.34
0.77 ¡ 3.89
23.47
0.12 ¡ 1.55
14.9 ¡ 100.9
0.4 ¡ 6.9
19.73
j
concentrator to settling
ect: Environ
ponds
TA: Settling ponds
5.73
1.44
3.75 ¡ 6.65
1.04 ¡ 5.30
TA: Dumps
2.46
1.10 ¡ 1.35
1.53 ¡ 4.05
0.58 ¡ 0.85
1.39 ¡ 2.10
TA: Pan concentrates
32.97
2.42
69.03
41.5
30.40
TA: Slime
30.67
12.97
m
TA: Coarse fraction
0.17 ¡ 0.72
e
n
TA: In stream
0.39 ¡ 27.7
tal assessm
SO: Close to copper-
21.93
7.27
23.55 (2)
43.53
0.03 ¡ 0.15 (5)
plate
0.09 (6)
SO: Background ?
0.05 ¡ 0.2
0.05 ¡ 1.14
0.13 ¡ 0.22
0.02 ¡ 0.13
0.12 ¡ 0.27
SO: Roasting area
0.47 ¡ 2.71 (3)
50.53 (13)
ent Kad
SO: Village
0.11 ¡ 0.97
1.50 - 2.08
0.07 ¡ 0.75
0.67 ¡ 14.31
SL: Village
3.96
21.50 (1)
19.77
SL: Copper-plate
28.8
74.60 (14)
105
SE: Claw Dam
0.06 ¡ 0.12
<0.4 (5)
o
ma-Chak
(15)
0.7 PEL (US)
0.49 ¡ 8.29
0.3 LEL
BRGM/RC-53
(16)
(Canada)
1.14 ¡ 10.60
2 SEL
(17)
(Canada)
a
r
i area, Z
SE: Small drainage
1.10 ¡ 2.64
1.23 ¡ 4.26
(4)
SE: Muzvezve
0.01 ¡ 0.03
0.01 ¡ 0.76
i
mba
32
WA: Drinking water
0.63 Ág l-1
0.33 ¡ 0.34
0.01 Ág l-1
1 (7) 1 (8)
0-F
Ág l-1
Ág l-1
0.5 (9)
b
WA: Surface water
0.73 Ág l-1
0.0005 ¡ 0.015
w
R
Ág l-1
(10)
e
¡ Part A: F
0.002 ¡ 0.012
(11)
0.00001 ¡
0.006 (12)
1. Roasting area in the village. 2. Close to the shelter for amalgamation. 3. Soil in the forest area near the roasting room. 4. Tailings in small stream. 5. INERIS (France) 2003
i
nal re
6. G. Sposito The chemistry of soils. 1989 7. UNEP 1994 International Drinking Water Guidelines 8. EU Limit values. 1992 Council Directive 76/464/EEC.
9. EU Guide values. 1992 Council Directive 76/464/EEC 10. INERIS (France) 2003 for groundwater (mean values). 11. INERIS (France) 2003 for lakes (Mean values).
port
12. INERIS (France) 2003 for rivers (Mean values). 13. Dust on the concrete close to the roasting room. 14. On the concrete under the amalgamation shelter.
15. Low water level (dry season). 16. Low water level. Digging area (dry season). 17. High water level (rainy season)
PEL : Probable Effect Level; LEL : Low Effect Level; SEL : Strong Effect Level
Illustration 37 - Synthesis of the chemical analyses on TA, SO, SE, SL and WA.
Global mercury project: Environmental assessment Kadoma-Chakari area, Zimbabwe
The lowest values are found first in Even Milling Centre (0.12 mg kg-1) and at Amber
Rose (0.40 mg kg-1). They are both using bowl-concentrator and are well managed.
The highest values are located in Tix mill (39.33 mg kg-1) and in New Plus
(19.73 mg kg-1), where the copper-plate technology is used, confirming the fact that the
loss of Hg is higher with a copper-plate than with a bowl-concentrator.
After vat-cyanidation, the dumped tailings display an Hg concentration between 0.58 to
4.05 mg kg-1. The lowest value is found at Tix mill and the highest at Coetzee mill. It is
important to note that parts of these tailings containing Hg are used to cover the soil of
the tracks, even in the villages (Amber Rose, Tix).
The fine particles of tailings (slime) present a higher Hg concentration than in the
coarse fraction, with 12.97 mg kg-1 as opposed to 0.17 to 0.72 mg kg-1 at Tix mill. The
slime from Glasgow shows 30.67 mg kg-1 Hg. The mercury lost during the
amalgamation process is associated with the fine particles in the tailings.
The Hg grade of the tailings from the stamp mill to the settling ponds seems showing a
random distribution. For example, at Tix, the Hg concentration in tailings at the inflow of
the pond is higher than for the tailings downstream from the copper plate. This can be
explained by the following phenomenon:
- The channel through which the tailings flow between the copper-plate and the
settling pond is neither straight nor constant in slope. Consequently, the heavy
particles of the tailings including Hg droplets, are liable to be deposited in some
preferential spots all along the channel, thereby creating areas with high Hg
contents.
- Each stamp mill of a milling centre works simultaneously on different type of ore,
originating from different locations. Each miner does not use the same quantity of
Hg, depending on the gold content and also on its professional habits. So the Hg
grade of the tailings is always changing hours after hours.
À Sediments
In the Muzvezve River, the Hg concentration ranges from 0.01 to 0.26 mg kg-1, with a
moderate peak of 0.76 mg kg-1. Panners use Hg at some spots but contamination
remains moderate. Tailings with moderate Hg contents (1.23 to 4.26 mg kg-1) were
found in small tributaries of the Muzvezve River in the Amber Rose area. It can be a
fortuitous or voluntary action of the millers to let the tailings flow into the downstream
drainage. The important runoff of the Muzvezve River may dilute the contamination in
the riverbed.
At Claw Dam reservoir, which is the main fishing place, all samples show contaminated
levels ranging from 1.40 to 10.60 mg kg-1, caused by the nearby milling centre, ancient
mining activity and the numerous isolated panning and amalgamation areas on the
banks of the reservoir.
BRGM/RC-53320-FR ¡ Part A: Final report
75
Global mercury project: Environmental assessment Kadoma-Chakari area, Zimbabwe
In conclusion, most of the small watercourses running close to the tailing dumps that
were sampled show moderate to high Hg contamination from 1 to 10 mg kg-1.
À Superficial layers and dust samples
All the samples of the superficial layer or dust collected in the milling centre close to the
amalgamation process with copper-plate show very high Hg concentrations ranging
from 28.8 mg kg-1 at Glasgow to 105 mg kg-1 at Tix. At Even Milling Centre,
74.6 mg kg-1 Hg are found in the dust collected on the floor of the shelter used for
amalgamation by individual miners. The dust collected on the concrete floor around the
roasting room at New Plus mill is highly contaminated too (50.53 mg kg-1).
The village of Amber Rose presents locally high Hg concentrations (up to 20 mg kg-1).
Mostly because contaminated tailings are used to consolidate tracks and to fill up holes
in the soil. Local soil or dust may be contaminated too by isolated spots of amalgam
roasting. The same conclusions can be proposed for Summit village.
We were not authorized to enter in the house of miners to collect and analyse domestic
dust.
4.1.4. Drinking water
The lowest value of 0.01 Ág l-1 is found at Amber Rose, where the water comes from a
well situated outside the milling area.
Conversely, the highest value of 0.63 Ág l-1 is found at Lilly mill, where the water is
pumped from a dug well situated close to the tailings dump.
At Tix, the drinking water reaches 0.33 Ág l-1 Hg. It is pumped at Claw Dam in a place
characterised by the inflow of the small stream coming from the village and the mill and
also by the presence of many digging places and possibly panning and amalgamation
spots.
These last two examples demonstrate the direct relation between milling activity and
the dispersion of mercury in the surface and groundwater, and consequently the risk for
human beings.
4.2. AIR MONITORING
The list of the different analyses performed in November 2003 are presented in
illustration 38. The preliminary results were already presented in Field Work Report
No.1 (Billaud and Laperche, 2003).
The monitoring sequences were performed to estimate the air quality breathed by the
population under different typical situations. For this, the intake hose of the RA-915+
analyser was installed approximately at nose height of the persons involved in the
mining activities.
76
BRGM/RC-53320-FR ¡ Part A: Final report
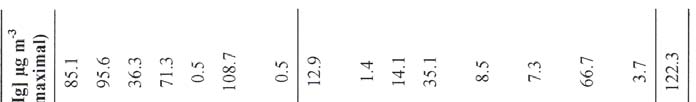
Global mercury project: Environmental assessment Kadoma-Chakari area, Zimbabwe
3.
b
e
r
200
vem
out in No
rried
ca
ring
air monito
nt
8
¡ List of the differe
Illustration 3
Illustration 38 ¡ List of the different air monitoring carried out in November 2003.
BRGM/RC-53320-FR ¡ Part A: Final report
77
Global mercury project: Environmental assessment Kadoma-Chakari area, Zimbabwe
For background air monitoring in open (spaces) the intake hose of the RA 915+
analyser was held approximately 1-1.2 m above the ground.
Comment: the monitoring were performed with the LUMEX RA915+ under field
conditions. At this stage, there is no existing validation of this device for air monitoring
in the literature or performed by BRGM. Thus Hg air concentrations are consistent for
comparison site by site, but absolute Hg concentration values have to be considered as
indicative values.
4.2.1. Tix site
a) Tix mill ¡ amalgamation on a copper-plate
At Tix mill, two amalgamation operations were monitored. In the first operation, the
miners were working slower than usual (~40 min) to take time to explain the process to
us, so each step could have been analysed in detail. During the second operation, we
did not interfere so that the whole process took about half the time of the first operation.
Consequently the measures taken during the second operation are more
representative of the real conditions.
The mercury concentrations measured are given for each processing step, but they
should be considered cautiously (illus. 39 et 40). Four copper-plates were working
simultaneously, but not at the same processing step. The RA 915+ unit was installed
between two copper-plates. Mercury was present everywhere.
Mercury in Ág m-3
M
Q50
min
max
First amalgamation
11.8
16.8
3.9
-0.6
87.9
1: Pulp running on the copper-plate
23.3
14.7
14.7
1.2
83.9
2: Scraping amalgam with rubber scraper
15.5
18.4
9.0
-0.5
66.9
3: Opening of the amalgam container
23.6
16.2
19.7
1.3
87.9
4: Cleaning with sand
5.1
7.5
2.4
-0.5
42.5
5: Water running on the copper-plate
2.4
1.9
2.2
-0.5
12.5
6: Cleaning with gravel
8.7
9.6
5.1
-0.7
54.9
Second amalgamation
18.1
20.3
10.6
-0.4
107.7
7: From phases 2 to 3
21.6
25.1
10.0
-0.4
107.7
8: From phases 4 to 5
15.5
15.3
10.8
-0.4
90.2
The mercury concentration statistics (Ág m-3) were calculated separately for the different phases of the process
using the copper-plate: average value (m), median (Q50), standard deviation (), minimum (min) and maximum
(max). Two amalgamations were performed: the first from phase 1 to 6 and the second amalgamation from
phase 7 and 8. The intake hose of the RA- 915+ analyser was positioned on the top of the copper-plate except
during the phase 3 where it was held below the copper-plate.
Illustration 39 - Mercury monitoring in air at Tix mill.
The values are higher for the second amalgamation because no interruption was
observed during the process. The mercury concentration is lower when the pulp is
running and when the copper-plate is covered with sand. Under these conditions,
mercury is not in direct contact with the air.
78
BRGM/RC-53320-FR ¡ Part A: Final report
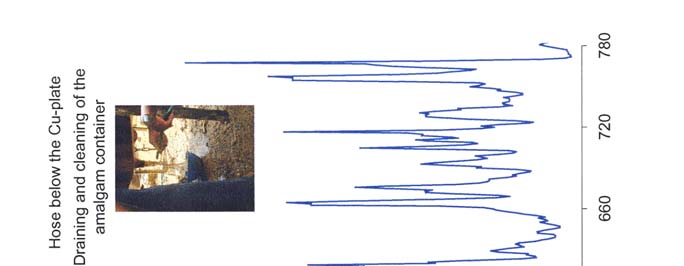
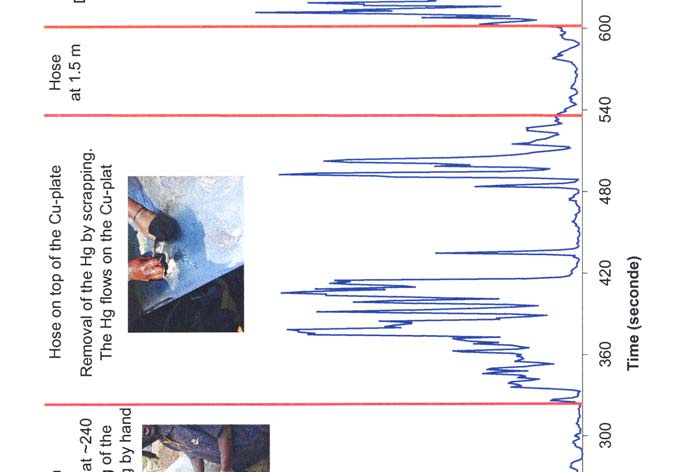
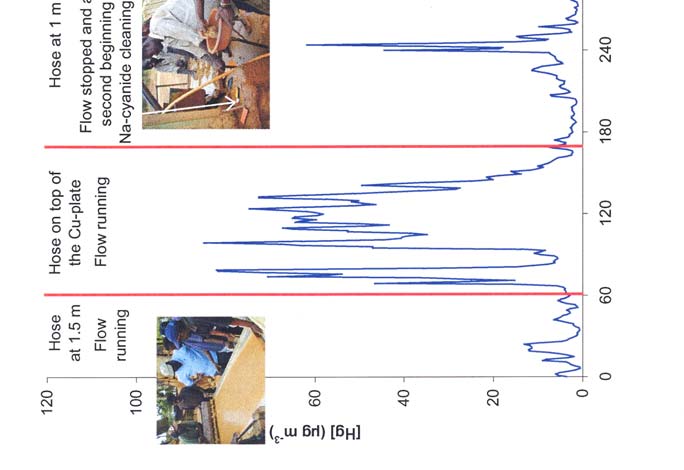
Global mercury project: Environmental assessment Kadoma-Chakari area, Zimbabwe
x
ls).
511A.
te at Tix mill (ZI2
r-pla
coppe
g
on the
rin
0
- Monito
Illustration 4
Illustration 40 - Monitoring on the copper-plate at Tix mill (ZI2511A.xls).
BRGM/RC-53320-FR ¡ Part A: Final report
79
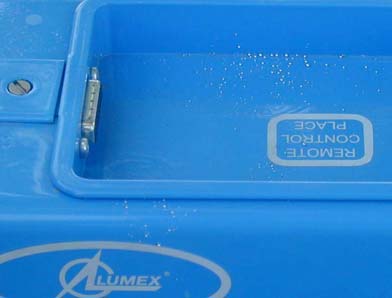
Global mercury project: Environmental assessment Kadoma-Chakari area, Zimbabwe
During the second amalgamation, the miners (two to four individuals) were very active
around the copper-plate. Sometimes, when they were scraping the amalgam, we
observed liquid mercury flowing on the copper-plate.
The average mercury concentration around the copper-plates is 18.1
▒
20.3 Ág m-3, with a maximum of 107.7 Ág m-3. Two meters from the copper-plate, the
mercury concentration decreases to 1.7 ▒ 1.5 Ág m-3, with a maximum of 5.5 Ág m-3.
During the one-hour monitoring session at Tix mill, mercury condensation was
observed on the metal unit of the RA 915+ analyser. We even could collect a few Hg
droplets on the instrument and on the metal box (illus. 41A and B).
A: Mercury droplets on the LUMEX
B: Mercury droplets on the metal box
Illustration 41 - Deposit of mercury droplets during the air monitoring
of the copper-plate at Tix mill.
b) Tix village
Three background air monitoring sessions were conducted inside the village and in its
vicinity. The first one took place on Sunday, November 23rd, 2003, 150 m from the
stamp mill and at 800 m, in the north western part of the village. The stamp mills were
not working, and no miners were working in the area. The average mercury
concentration measured at this time was 0.2 ▒ 0.1 Ág m-3, with a maximum of
0.43 Ág m-3. We measured the same concentration on a working day at the end of the
village (~1000 m down from the stamp mills) (illus. 42 and 43).
Mercury in Ág m-3
m
Q50
min
max
Background 800 m (north) up to the village
0.2
0.1
0.1
0.0
0.4
Background in the village (meeting room)
1.0
0.7
0.9
0.0
7.5
Background at the south part of the village
0.1
0.1
0.1
0.0
0.5
Roasting operation in the village
9.9
12.0
5.8
-1.8
78.2
The mercury concentration statistics (Ág m-3) were calculated separately for the different monitoring
operations inside and in the vicinity of the village. Average value (m), median (Q50), standard deviation (),
minimum (min) and maximum (max).
Illustration 42 - Mercury monitoring in air at Tix village.
80
BRGM/RC-53320-FR ¡ Part A: Final report
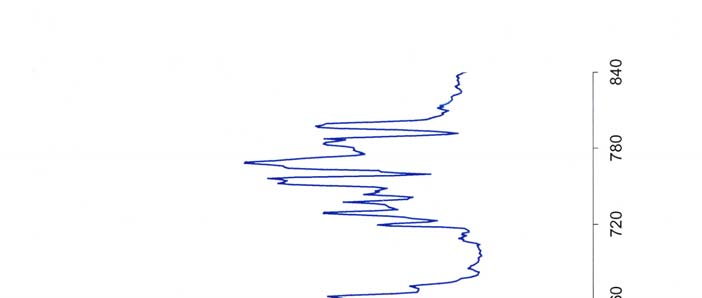
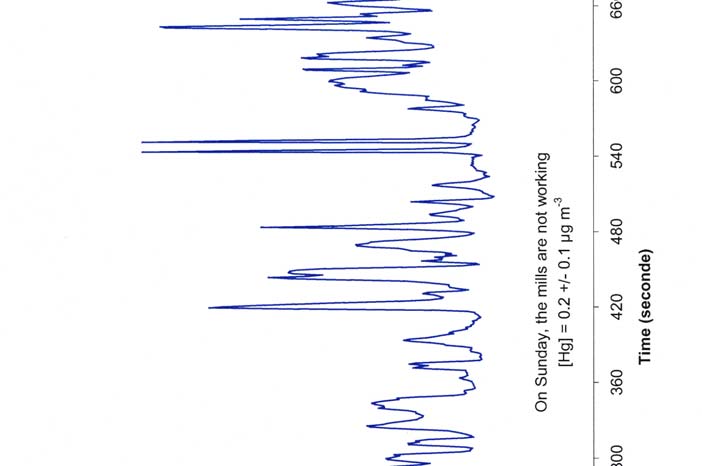
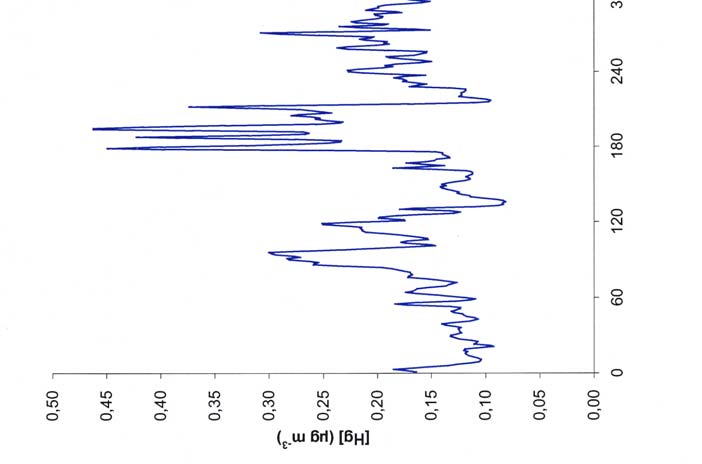
Global mercury project: Environmental assessment Kadoma-Chakari area, Zimbabwe
).
n area 200 m from Tix mill (ZIB2311F
Illustration 43 - Monitoring in an ope
Illustration 43 - Monitoring in an open area 200 m from Tix mill (ZIB2311F).
BRGM/RC-53320-FR ¡ Part A: Final report
81
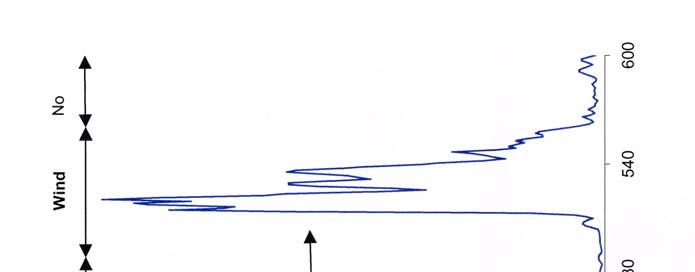
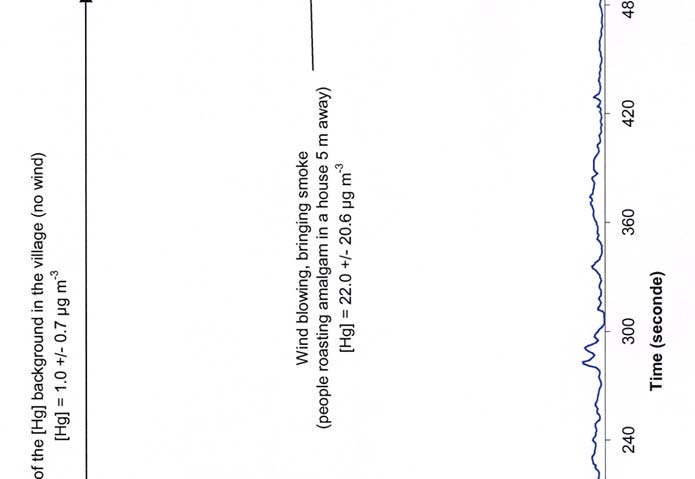
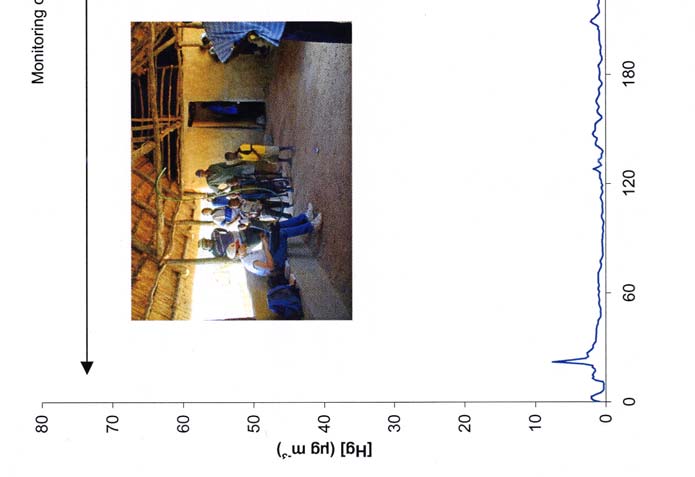
Global mercury project: Environmental assessment Kadoma-Chakari area, Zimbabwe
x
l
s
).
11D.
close to Tix mill (ZIB23
age
in the vill
o
u
s
e
g
in the bar h
rin
4
- Monito
Illustration 4
Illustration 44 - Monitoring in the bar house in the village close to Tix mill (ZIB2311D.xls).
82
BRGM/RC-53320-FR ¡ Part A: Final report
Global mercury project: Environmental assessment Kadoma-Chakari area, Zimbabwe
The third measurement was conducted in the middle of the village, in a meeting-room
(bar). The walls were less than 1 m high, with a 1 m open space between the walls and
the roof. The intake hose of the RA 915+ analyser was suspended from a wooden
beam to analyse the air the people in the room were breathing.
The average mercury concentration was 1.0 ▒ 0.7 Ág m-3, with a maximum of
7.5 Ág m-3 (illus. 44). Suddenly, the mercury concentration increased abruptly to reach
a maximum of 78 Ág m-3, as a result of a villager roasting an amalgam in his kitchen,
close to the meeting-room.
4.2.2. Amber Rose site
a) Amber Rose mill
Air monitoring was carried out on the top of two bowl-concentrators, one with a cover
and one without.
No difference was observed in the mercury concentration for these two conditions. The
average mercury concentration, at the top of the bowl-concentrator is 15.6 ▒
10.6 Ág m-3, with a maximum of 66.7 Ág m-3. At 0.4 m above or 1 m away, the mercury
concentration decreases to 1.6 ▒ 1.5 Ág m-3, with a maximum between 7.3 to 8.9 Ág m-3
(illus. 45).
Mercury in Ág m-3
m
Q50
min
max
On top of the bowl-concentrator
15.6
10.6
16.2
0.2
66.7
0.4 m above the bowl-concentrator
1.6
1.2
1.3
0.2
7.3
1 m from the bowl-concentrator
1.7
1.8
1.1
0.0
8.9
Top of the slime pond (fine tailings)
5.7
4.5
4.4
0.0
35.1
Top of the coarse tailings stockpile
2.2
1.6
1.7
-0.1
8.1
Between the CN tanks and the C columns
1.1
1.2
0.9
0.0
14.1
The mercury concentration statistics (Ág m-3) were calculated separately for the different monitoring events
on the site. Average value (m), median (Q50), standard deviation (), minimum (min) and maximum (max).
Illustration 45 - Mercury monitoring in air at Amber Rose mill.
The mercury concentration increases around the slime pond and the coarse stockpile
to decrease again 20 m away from the bowl-concentrator between the carbon (C)
columns and the cyanide (CN) tanks (illus. 46).
b) Amber Rose village
At an equal distance from the stamp mills, we held two background monitoring
sessions; one at the sites entrance and one inside the village.
BRGM/RC-53320-FR ¡ Part A: Final report
83
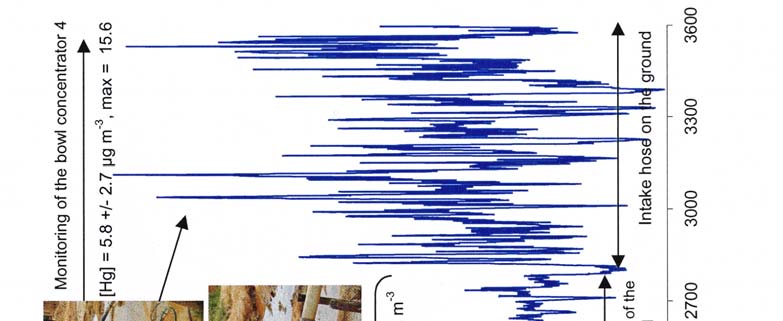
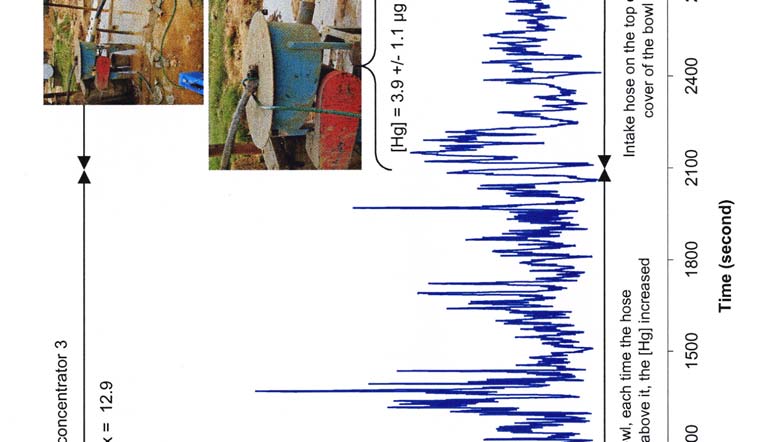
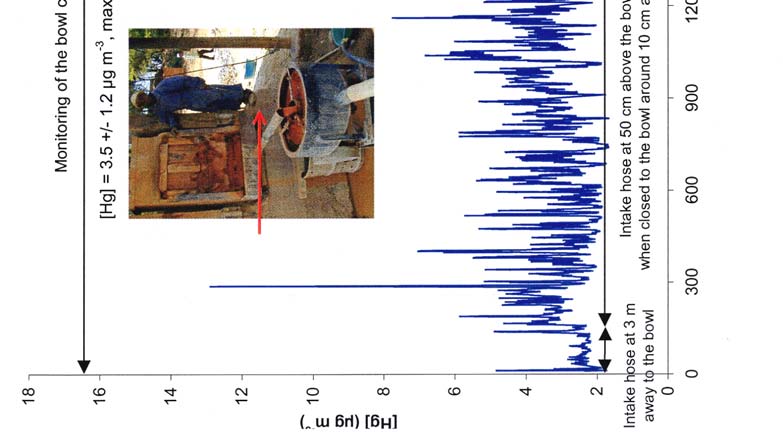
Global mercury project: Environmental assessment Kadoma-Chakari area, Zimbabwe
s
).
at Amber Rose mill (ZIB2711A.xl
Illustration 46 - Air monitoring
Illustration 46 - Air monitoring at Amber Rose mill. (ZIB2711A.xls).
84
BRGM/RC-53320-FR ¡ Part A: Final report
Global mercury project: Environmental assessment Kadoma-Chakari area, Zimbabwe
The mercury concentrations are lower than in the mill area (illus. 47). The average
mercury concentration inside the village is 0.2 ▒ 0.2 Ág m-3, with a maximum of 1.3 Ág
m-3. At the site entrance, the average is 0.4 ▒ 0.5 Ág m-3, with a maximum of 3.6 Ág m-3.
We did not see anybody crushing or roasting inside the village at the time of our visit.
The manager of the milling centre told us that the miners burn amalgams on wood fires
in the milling centre in an open area under trees near the stamp mill.
Mercury in Ág m-3
M
Q50
min
max
Inside the village
0.2
0.2
0.1
-0.1
1.3
Entrance to the site
0.4
0.5
0.2
-0.1
3.6
The mercury concentration statistics (Ág m-3) were calculated separately for the monitoring operations
inside and around the village. Average value (m), median (Q50), standard deviation (), minimum (min) and
maximum (max).
Illustration 47 - Mercury monitoring at air Amber Rose village.
4.2.3. Even Milling Centre
The monitoring sessions were conducted inside the roasting room during a burning
event (illus. 48). The intake hose of the RA 915+ analyser was installed on the shoulder
of the person in charge of the roasting, almost 0.4 m from the extractor opening. The
mercury concentration in the room was low: 0.8 ▒ 0.6 Ág m-3.
The mercury concentration increased sharply to reach a maximum of 122 Ág m-3 when
we put the intake hose close to the extractor opening. We could not do any additional
monitoring because there was too much mercury in the air and the instrument was
saturated and needed to be cleaned.
Mercury in Ág m-3
M
Q50
min
max
Inside the roasting room
0.8
0.6
0.7
-0.3
3.6
Close to the extractor
34.4
30.3
27.3
-5.1
122.3
The mercury concentration statistics (Ág m-3) were calculated separately for the monitoring sessions
inside the roasting room. Average value (m), median (Q50), standard deviation (), minimum (min)
and maximum (max).
Illustration 48 - Mercury monitoring of air at Even Milling Centre.
4.2.4. Main outcomes for air monitoring
A few individuals were involved with the use of the copper-plate. However, the miners
were continuously close to the copper-plate. During the process with the bowl-
concentrator, nobody was close to the bowl; the closest person was the miner filling the
stamp, 3 m away from the bowl.
In the villages, the average mercury concentrations in the air were below 0.4 and
1.0 Ág m-3 for outdoor and indoor conditions, respectively. When the villagers were
roasting at home, the mercury concentrations could reach 10 Ág m-3 but only for less
BRGM/RC-53320-FR ¡ Part A: Final report
85
Global mercury project: Environmental assessment Kadoma-Chakari area, Zimbabwe
than 10 min. This time exposure is very short compared to WHO guideline; exposure
limit for workers exposed to mercury is 25 Ág m-3 average air concentration for an 8
hour shift (WHO, 1994).
There was an important difference between the sites using copper-plates and the sites
using bowl concentrators.
If the average mercury concentrations in air were similar in both processes
(~20 Ág m-3), the bowl concentrator seemed to be safer to use because nobody needed
to be close to the concentrator during the process. The miners were breathing high
mercury contents "only" when they were flushing the concentrate at the end of the
process. Unfortunately, no flushing was performed during the afternoon we were
monitoring air quality at Amber Rose. Miners using bowl concentrators were exposed
to high mercury concentration maybe once or a few times per day.
When miners used copper-plates, they were continuously breathing high mercury
concentrations (scrapping, scrubbing and rinsing with solution Na-cyanide solution).
Time exposure of the miners ranges from a few hours to a day and the average
mercury concentration was ~20 Ág m-3. These values are close to the WHO (1994)
exposure limit for workers (25 Ág m-3 average air concentration for an 8 hour shift). We
do not know how often the miners come to the site to grind and amalgam their ores.
At Even Milling Centre, the air monitoring data from inside the roasting room indicated
a good efficiency of the air extractor. The person in charge of the roasting was exposed
to average air concentrations lower than 0.8 Ág m-3. This person was involved in
roasting activities for a few hours a day and 5 or 6 days a week. This average mercury
concentration exposure was low compared to WHO limits (1994).
It must be pointed out that no air monitoring was done inside the house of the villagers
because they did not allow us to come inside. They let us sample around their house
and in their garden only.
86
BRGM/RC-53320-FR ¡ Part A: Final report
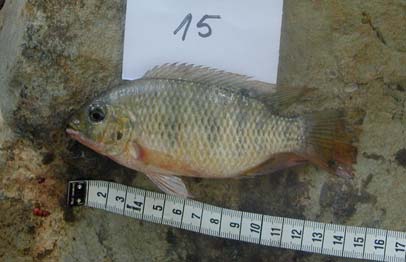
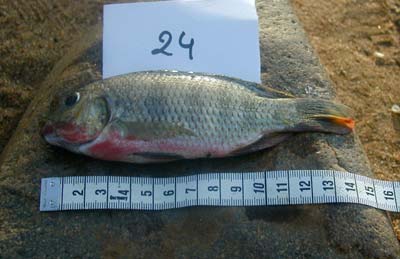


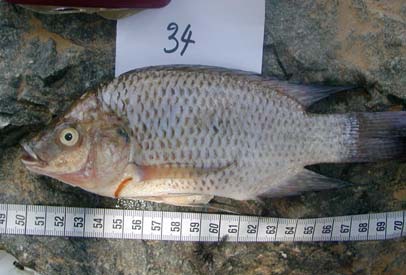
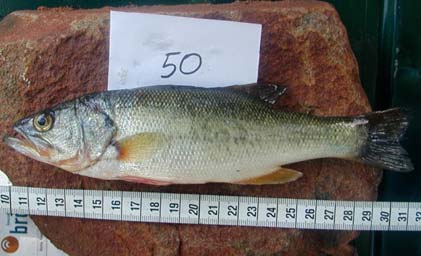
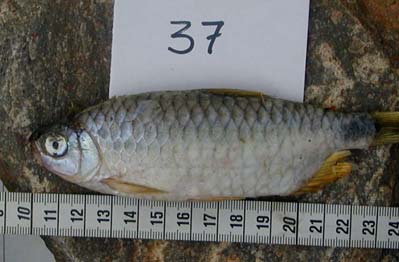
Global mercury project: Environmental assessment Kadoma-Chakari area, Zimbabwe
4.3. FISH SAMPLES
4.3.1. Fish characterisation
Six different species were collected, with a total of 52 individuals: Tillapia zilli, Tillapia
rendali, Oreochromis macrochir, Laboe cylindricus, Brycinus imberi and Micropterus
salmonides (illus. 49 and 50).
Sampling point
1
2
3
4
5
6
TOTAL
Number of species
1
3
4
1
1
1
6
Number of fish
10
11
5
10
10
6
52
Illustration 49 - Balance of the sampled fish species and numbers, from the six sampling points.
Tillapia zilli
Tillapia rendali
Laboe cylindricus
Oreochromis macrochir
Micropterus salmonides
Brycinus imberi
Illustration 50 - Photographs of the six different species caught in the Muzvezve River.
BRGM/RC-53320-FR ¡ Part A: Final report
87
Global mercury project: Environmental assessment Kadoma-Chakari area, Zimbabwe
4.3.2. Global biometric characteristics and mercury contamination levels
in fish
Mean biometric data (total body weight, standard length and mercury concentrations
measured in the dorsal muscle) are shown in illustration 51 for the six sampling points
and the different species. Biometric data and mercury concentrations measured in the
52 individual fish are given in appendix 3.
Food
Sampling
Standard
Body weight
[Hg] Ág g-1
Family
Genus
Species
N
regime
point
length (cm)
(g, fw)
(fw)
Brycinus
Omnivorous
Characiformes
Brycinus
5
13 ▒ 0
59 ▒ 10
0.88 ▒ 0.07
10
imberi
carnivorous
Labeo
Omnivorous
Cypriniformes
Cyprinidae
2
12 ▒ 1
43 ▒ 13
0.19 ▒ 0.01
4
cylindricus
herbivorous
Labeo
Omnivorous
Cypriniformes
Cyprinidae
3
14
50
0.26
1
cylindricus
herbivorous
Micropterus
Only
Gnathostomes Centrachidae
2
14 ▒ 1
55 ▒ 7
0.83 ▒ 0.18
2
salmonides
Carnivorous
Micropterus
Only
Gnathostomes Centrachidae
6
18 ▒ 1
112 ▒ 19
1.13 ▒ 0.20
6
salmonides
Carnivorous
Oreochromis Omnivorous
Perciforme
Cichlidae
3
12
50
0.19
1
macrochir
herbivorous
Oreochromis Omnivorous
Perciforme
Cichlidae
4
16 ▒ 0
129 ▒ 17
0.04
10
macrochir
herbivorous
Omnivorous
Perciforme
Cichlidae
Tilapia zillii
1
8 ▒ 1
33 ▒ 5
0.07 ▒ 0.01
6
herbivorous
Omnivorous
Perciforme
Cichlidae
Tilapia zillii
2
15 ▒ 5
118 ▒ 119
0.15 ▒ 0.03
5
herbivorous
Omnivorous
Perciforme
Cichlidae
Tilapia zillii
3
10 ▒ 2
30 ▒ 10
0.31 ▒ 0.04
2
herbivorous
Omnivorous
Perciforme
Cichlidae
Tilapia rendali
3
11.8
40
0.36
1
herbivorous
Data are means ▒ standard error and N = number of fish.
Illustration 51 - Mean biometric data (standard length and body weight), mercury concentrations
(wet weight) in the dorsal muscle and diet for the fish species collected in the six sampling
points.
Only one or two species were found per sampling location except at spot n░ 2, where
three species were caught (illus. 52).
Genus
Species
Sampling spot
N
2
4
Cyprinidae
Labeo cylindricus
3
1
2
2
Centrachidae
Micropterus salmonides
6
6
3
1
Cichlidae
Oreochromis macrochir
4
10
1
6
Cichlidae
Tilapia zillii
2
5
Illustration 52 - Fish species common to the sampling points.
88
BRGM/RC-53320-FR ¡ Part A: Final report
Global mercury project: Environmental assessment Kadoma-Chakari area, Zimbabwe
The fish caught were very small, with only one fish among the 52 longer than 20 cm.
Size differences emerged between fishes of the same species collected at different
sampling points, probably due to differences in age and/or nutritional intake. Thus,
marked differences appeared in Tilapia zillii between body weights with 32.5 ▒ 5.0 g
fresh weight value at sampling spot 1 and 330.0 g fresh weight value for a big
specimen at sampling spot 2, the other fishes being all in the same range at that site:
65.0 ▒ 12.9 g fresh weight.
Mercury contamination levels in different fishes ranged from low to high; however,
average concentration for the 52 fishes collected was 0.41 ▒ 0.46 Ág g-1 on a fresh
weight basis. Assuming that a value of 5 is attributed to the fresh weight / dry weight
ratio, we can consider that safety standard defined by the WHO is 0.50 Ág g-1 on a
fresh weight basis or 2.50 Ág g-1 on a dry weight basis (WHO, 1990).
Thus, mean concentrations for species at specific sampling locations ranged from
0.04 ▒ 0.002 Ág g-1 fresh weight for Oreochromis macrochir (n = 10), at sampling point
4, to 1.13 ▒ 0.49 Ág g-1 fresh weight for Micropterus salmonides (n = 6) at sampling
point 6 (illus. 53).
Omnivorous
Carnivorous
1,4
1,2
1,0
)
f w 0,8
-1 g
]
(Ág 0,6
g
Safety standard is 0.5 Ág g-1 on the fresh weight basis (WHO, 1990)
[H
0,4
0,2
0,0
5
2
3
3
4
1
2
3
2
6
Brycinus
Labeo
Labeo
Oreochromis Oreochromis Tilapia zillii Tilapia zillii Tilapia zillii M icropterus M icropterus
imberi
cylindricus
cylindricus
macrochir
macrochir
salmonides
salmonides
Illustration 53 - Average mercury concentrations in the muscle of all the fish species collected.
4.3.3. Mercury contamination levels according to the trophic level of fish
and to the sampling sites
Data from sampling point 2 downstream from Claw Dam (illus. 54) revealed differences
between fish species according to their food regime. The average concentration for the
carnivorous species (Micropterus salmonides) was 0.83 ▒ 0.11 Ág g-1 fresh weight. This
is six to seven times higher than the concentration determined for the omnivorous
species. One of them has a high value of 2.00 Ág g-1.
BRGM/RC-53320-FR ¡ Part A: Final report
89
Global mercury project: Environmental assessment Kadoma-Chakari area, Zimbabwe
These results support the hypothesis that mercury concentrations measured in fish
muscle in contaminated areas vary depending on the diet of the species and its
position along the trophic chain as already reported in literature (Durrieu et al., 2004;
Roulet and Maury-Brachet, 2001; Veiga et al., 1999; Wiener et al., 2002).
Omnivorous
Carnivorous
1
1
)
fw-1 1
g g
Á
( 0
g]
[
H
0
0
L. cylindricus
T. zillii
M. salmonides
Illustration 54 - Mercury concentrations in the muscle of the 3 fish species collected
from the sampling spot 2.
The highest mean Hg concentrations (average of 1.05 Ág g-1) were found in
predaceous Micropterus salmonides followed by the omnivorous species Brycinus
imberi, Tilapia rendali, Labeo cylindricus, Tilapia zillii and Oreochromis macrochir (0.88,
0.36, 0.21, 0.12, 0.05 Ág g-1, respectively). The high Hg level (0.88 Ág g-1) shown by
omnivorous species Brycinus imberi might possibly be due to the local environment
(shallow water and close proximity to numerous mines, or panning areas (illus. 12) and
to the fact that its diet is closer to a carnivorous fish regime than the other omnivorous
fish which are more herbivorous (app. 4).
Relationships between fish body weights and Hg concentrations in the muscle do not
show differences for each species collected (illus. 55). These relationships are
established from a small number of samples, and therefore cannot be considered as
representative. Bioaccumulation levels appeared independent of the fish weight in
relation probably with the small number of samples that do not allow to define a reliable
statistical relationship. But mercury concentrations in fish seemed to depend more on
their diet than on where they were fished. Thus, in Illustration 56, two distinct
populations can be identified according to diet in this study. This comment is not
confirmed for the omnivorous species Brycinus imberi considered as similar to
carnivorous, as already mentioned above (app. 4).
90
BRGM/RC-53320-FR ¡ Part A: Final report
Global mercury project: Environmental assessment Kadoma-Chakari area, Zimbabwe
Tilapia zillii
Tilapia zillii
400
0,4
y = 0,1267x2,463
R2 = 0,9825
)
w 300
0,3
,
f
g
(
-1 g
ght 200
0,2
]
Ág
g
[H
100
0,1
body wei
0
0,0
0
5
10
15
20
25
30
0
50
100
150
200
250
300
350
body lenght (cm)
body weight (g, fw)
Oreochromis macrochir
Oreochromis macrochir
200
0,2
)
w 150
,
f
g
-1
(
ght 100
0,1
g] Ág g
[H
50
body wei
0
0,0
11
12
13
14
15
16
17
0
20
40
60
80
100
120
140
160
body lenght (cm)
body weight (g, fw)
Labeo cylindricus
Labeo cylindricus
60
0,3
)
w 50
,
f
g
-1
0,2
(
g
ght 40
]
Ág
g
[H 0,1
30
body wei
20
0,0
10
11
12
13
14
30
40
50
60
70
body lenght (cm)
body weight (g, fw)
Brycinus imberi
Brycinus imberi
90
1,5
) 80
1,2
, fw
70
-1
t
(g
g 0,9
h
ig
e
]
Ág
60
g
w
0,6
y
[H
d
o
b 50
0,3
40
0,0
12
13
14
40
50
60
70
80
90
body lenght (cm)
body weight (g, fw)
Micropterus salmonides
Micropterus salmonides
150
2,4
y = 0,0456x2,6923
)
R2 = 0,924
2,0
w
,
f 100
g
1,6
(
-1 g
ght
1,2
]
Ág
g
50
[H 0,8
body wei
0,4
0
0,0
12
14
16
18
20
30
60
90
120
150
body lenght (cm)
body weight (g, fw)
Illustration 55 - Relationships between fish body weight and standard length and between fish
body weight and mercury concentration in muscle (fresh weight) of all the species.
BRGM/RC-53320-FR ¡ Part A: Final report
91
Global mercury project: Environmental assessment Kadoma-Chakari area, Zimbabwe
3
Site 2 omni.
Site 2 carni.
2
Site 3 omni.
Site 4 omni.
Site 5 B. imberi.
Site 6 carni.
Carnivorous fishes
, fw) 2
-1
a
t
ion (Ág g
tr
e
n
onc 1
Hg c
1
Omnivorous fishes
0
0
50
100
150
200
250
300
350
body lenght (cm)
Illustration 56 - Mercury concentrations in the muscle of all fish species collected from the six
sampling spots, relationships between fish body weight and mercury concentrations in muscle.
However, numerous earlier field studies conducted in European countries and North-
America/Canada had shown a significant positive correlation between Hg
concentrations in fish muscle and biometric criteria (body weight or standard length),
suggesting an increase in bioaccumulation as a function of the age of the fish. More
recent studies performed in Amazonia (South America: Brazil and French Guiana)
reported inconsistent results (no positive or negative correlation) between bio-
accumulation and fish species, food regime or developmental stages (alevins/adults)
(Roulet et al., 1999; Frery et al., 2001; Durrieu et al., 2004).
4.3.4. Comparison between mercury concentrations in fish muscle
in this study (Zimbabwe) and in other artisanal gold mining sites
Mercury concentrations in fish muscle and biometric criteria (standard length and body
weight) are shown in illustration 57 for carnivorous species collected in Sudan,
Zimbabwe and Lao PDR, during the UNIDO surveys (2003/2004). Results point
towards a high contamination levels in fish in Zimbabwe, with mean Hg concentrations
ten times greater than in Sudan for fish of similar size.
Fish caught in the Mekong River and its tributary (Nam Ou) in Lao PDR were also less
contaminated despite the fact that the body weight of fish in Lao PDR is
92
BRGM/RC-53320-FR ¡ Part A: Final report
Global mercury project: Environmental assessment Kadoma-Chakari area, Zimbabwe
14 times bigger than the fish in Zimbabwe. However, the quantities of mercury used in
artisanal gold mining areas in Zimbabwe are much higher compared to those used in
Lao PDR and Sudan, with about 1 kg of Hg used per milling centre and per day in
Zimbabwe and 1 kg of Hg used per village per year only in Lao PDR.
Standard
Body weight
Country
Family
Genus
Species
Food regime
[Hg] (Ág g-1)
N
length (cm)
(g g-1)
Sudan
Alestiidae
Hydrocinus
Forskalii
Carnivorous
21.3 ▒ 1.5
116.4 ▒ 21.4
0.139 ▒ 0.015
5
Sudan
Centroponidae
Lates
Niloticus
Carnivorous
14.1 ▒ 0.7
55.7 ▒ 8.7
0.142 ▒ 0.010
6
Sudan
Mornyridae
Marcusenius
Senegalensis
Carnivorous
21.0 ▒ 1.0
105.0 ▒ 7.0
0.021 ▒ 0.005
2
Sudan
Mornyridae
Mormyrus
Nicoticus
Carnivorous
24.0 ▒ 1.0
122.0 ▒ 16.0
0.020 ▒ 0.001
2
Sudan
Schilbeidae
Schilbe
Intermedius
Carnivorous
15.6 ▒ 1.1
47.2 ▒ 10.1
0.081 ▒ 0.014
5
Sudan
Schilbeidae
Schilbe
Intermedius
Carnivorous
23.4 ▒ 0.7
133.5 ▒ 3.6
0.108 ▒ 0.017
4
Zimbabwe
Centrachidae
Micropterus
Salmonides
Carnivorous
14.15 ▒ 1.49
55.0 ▒ 7.1
0.834 ▒ 0.110
2
Zimbabwe
Centrachidae
Micropterus
Salmonides
Carnivorous
18.00 ▒ 1.01
111.67 ▒ 19.41
1.127 ▒ 0.494
6
Lao PDR
Kop
Carnivorous
38
400
0.220
1
Lao PDR
Oad
Carnivorous
53
1820
0.038
1
Lao PDR
Dang Deng
Carnivorous
45.5
610
0.120
1
Lao PDR
Kop
Carnivorous
48.5
680
0.489
1
Lao PDR
Sangoa
Carnivorous
70
3280
0.242
1
Lao PDR
Kheung
Carnivorous
23
160
0.065
1
Lao PDR
Sangoa
Carnivorous
52.5
970
0.139
1
Illustration 57 - Comparison between mercury concentrations in carnivorous fish collected
during UNIDO missions in Sudan, Zimbabwe and Lao PDR.
In a similar UNIDO study, in an artisanal gold mining area in Ghana (Babut et al.,
2003), no relationship was established either between fish tissue mercury
concentration and fish size. Contamination levels of fish muscle ranged between 0.02
and 0.15 Ág g-1 fresh weight, and are comparable to Lao PDR results but lower than
Zimbabwe results.
Data from several rivers in French Guiana (Durrieu et al., 2004) show higher
contamination levels, with mercury concentrations in the muscle of carnivorous/
piscivorous species reaching maximal values close to 3 Ág g-1 fresh weight, with almost
all piscivorous fishes exceeding the WHO safety limit (0.5 Ág g-1, wet weight).
Other studies conducted in gold mining areas in Colombia, Tanzania, France and
Brazil showed, on the other hand, a wide range of mercury contamination levels in fish
muscle (Alho and Viera, 1997; Bidone et al., 1997; Castilhos et al., 1998; FrÚry et al.,
1999; Ikingura and Akagi, 1996; Malm, 1998; Olivero and Solano, 1998 and Olivero et
al., 1998) varying between less than 0.01 Ág g-1 fresh weight in some species in
Colombia (Olivero and Solano, 1998) to more than 16 Ág g-1 in soga species in
Tanzania (Ikingura and Akagi, 1996).
4.3.5. Conclusion
The range of sample size per species being too limited and consequently specific to
one range of weight and age, the results can not be interpreted as in term of Hg
bioaccumulation factor per species.
One third of the fish (18/52) exceeded the WHO safety limit of 0.5 Ág g-1 fresh weight.
The average Hg concentration was 0.41 ▒ 0.46 Ág g-1. The average concentration for
carnivorous species was 1.05 ▒ 0.44 Ág g-1, but a young specimen reached
BRGM/RC-53320-FR ¡ Part A: Final report
93
Global mercury project: Environmental assessment Kadoma-Chakari area, Zimbabwe
2 Ág g-1 despite its light weight (110 g), whereas the oldest fishes could weigh up to
10,000 g. One omnivorous species (Brycinus imberi) exceeded the WHO safety limit,
but, on the one hand, all the fish of this species were caught at the same point
characterised by high contamination levels and it had a particular diet composed
predominantly of animal prey rather than vegetal.
If the results of the small-sized samples are representative of the area, it is very likely
that most of the fish consumed by the local population along the Muzvezve River is
significantly contaminated by mercury and above WHO safety standard (i.e. Hg >
0.5 Ág g-1 fresh weight).
94
BRGM/RC-53320-FR ¡ Part A: Final report
Global mercury project: Environmental assessment Kadoma-Chakari area, Zimbabwe
5. Evaluation of exposure to Hg
During this study, two types of "hot spots" were identified, both defined as sites
containing high Hg concentrations relative to the local contamination in soils and
sediments.
The first one, called a single-source hot spot, corresponds to a well-delimited pollution
source and is associated with a specific technique used in gold processing, such as
amalgamation, roasting... In our case, there is no hot spot with an unknown source.
The area concerned is small ¡ a few hundred square meters ¡ but the consequence in
terms of human exposure is potentially very important for the population of miners.
The second one, called a multi-source hot spot, corresponds to a wider area
characterised, in most cases, by several but associated single-source Hot Spots. The
concerned area is much more extensive than in the previous case, and the associated
pollution can affect a regional level, spreading far through the mining and milling area
with environmental consequences in a radius exceeding the tens of kilometer scale.
The contamination is more diffuse and may affect the whole population living in the
area and the aquatic environment at a regional scale.
5.1. SINGLE-SOURCE HOT SPOTS
The illustration 58 summarises the main contamination sources of Hg in the gold
processing system and the potential routes of exposure.
Three main single-source hot-spot are found:
- Copper-plate areas, are the most contaminated spots as observed in the tailings
such as at Tix, New Plus, Etena, Summit and Glasgow mills, but also in the
surrounding soils within a radius of 10 to 20 m. Contamination of soils does not
seem to disperse very far from these emission sources. In contaminated places, the
Hg values in the soils are ten to four hundred times the local background that is 0.02
to 0.12 mg kg-1. This is confirmed by the high Hg content in the dust or superficial
layers collected in Tix and Glasgow mills. The air monitoring carried out at Tix mill
shows a Hg concentration sixty times higher than the local background (1.7 Ág m-3)
during the operations on the copper-plate. By comparison, at Amber Rose, where a
bowl-concentrator is operated, the Hg concentration in the air reaches 67 Ág m-3 that
is forty times the local background. At Tix, the loss of Hg in these areas follows two
pathways;
À first, the tailings, which flow on the copper-plate throughout the process, and
À second, the air, mainly at the end of the process, when the miners are scraping
and washing the copper-plate.
It is also in this area that the concentration of workers (miners and millers) is the
most important during the process.
BRGM/RC-53320-FR ¡ Part A: Final report
95


Global mercury project: Environmental assessment Kadoma-Chakari area, Zimbabwe
Ore excavation
Single source hot spots
Crushing
Ball mill
Stamp mill
Concentration
Hg in
evaporation
Bowl concentrator
Copper plate
Soil
contamination
Tailing
evaporation
Amalgamation
Tailings
contamination
Remove of
Hg excess
Dust
Tailings
dissemination
Soil
contamination
ponds
Erosion,
sediments
Roasting
Cyanidation
evaporation
tank
Dust
Tailings
dissemination
dumps
Accumulation in
Release in
Erosion,
sediments
streams
sediments
Reuse
Main course, rivers,
Soil
Claw Dam
contamination
Road material
in villages
Biological chain
Illustration 58 - Main contamination sources and route to Hg exposure.
96
BRGM/RC-53320-FR ¡ Part A: Final report
Global mercury project: Environmental assessment Kadoma-Chakari area, Zimbabwe
- The second single-source hot spot corresponds to:
À the free amalgamation sites that are widely distributed along the drainage but also
close to the water tank in the milling center,
À the bowl-concentrator surrounding area in the mill centre, where miners are up-
grading manually the amalgam mixed with tailings collected at the bottom of the
bowl-concentrator (Even Milling Centre), and
À amalgamation sites such as in the villages (Tix) or on the bank of a reservoir (Claw
Dam) or river (small stream or Muzvezve River) where miners and panners use
pans to concentrate the gold particles and plastic basins to amalgamate the gold.
At Even Milling Centre, which is one of the better and cleaner milling centres, the Hg
concentration in soil (23.55 mg kg-1) is more than one hundred fifty times the local
background 5 meters away from the amalgamation shelter. The dust collected within
a radius of 3 m on the concrete floor around the workers, who perform
amalgamation under the shelter, reaches 74.60 mg kg-1 that is five hundred times
the background.
At the Claw Dam bank, downstream from Tix village, the Hg concentration in
sediments can reach 8 to 10 mg kg-1 that is twenty times the local background at the
sites of digging, panning and amalgamation activities. These kinds of sites are
favourable environments to generate methylmercury (MeHg). These sites are also
known as fishing spots, where fish with high Hg levels were collected.
- The third single-source hot spot corresponds to the free roasting sites or roasting
rooms. High concentrations of Hg were measured during the air monitoring within a
radius of 1 to 3 meters around the free roasting sites located in the middle of the
village, such as at Tix. The Hg concentration reaches nine to eighty times the local
background of air (0.2 Ág m-3 outside the copper-plate area). Even when a specific
room is built, with specific equipment including an air extractor, to roast the
customers' amalgam, the risk is still present, as at New Plus, where the dust
collected on the concrete floor close to the exhaust pipe reaches 50.53 mg kg-1 Hg.
This place is located at the entrance of the mill where many workers are walking
around or waiting.
5.2. MULTI-SOURCE HOT SPOTS
Among the sites studied, the multi-source hot spots can be located:
- At Tix, which is the most important, including the mill, the village, and the area
surrounding the mining and amalgamation activities on the Claw Dam banks. This
area is characterised by a group of scattered single-source Hot Spots, such as four
copper-plates, many but not well located roasting areas at the entrance to the mill, in
the village itself, and many amalgamation areas along the Claw Dam bank.
Moreover, the same types of activities have been observed during the
environmental assessment in other villages close to Tix, such as Mhisi and May
Flower. Artisanal activity has been in progress for many years. Several tens of
thousands of people are exposed directly or indirectly to this multi-source hot spot.
BRGM/RC-53320-FR ¡ Part A: Final report
97
Global mercury project: Environmental assessment Kadoma-Chakari area, Zimbabwe
- At Amber Rose, contamination is less important than in Tix. But the contaminated
tailings are dumped very close to the village and often spread out on the tracks in
the village. Tailings may also contaminate the sediments in the tributaries of the
Muzvezve River. Roasting locations may also contribute to the local contamination
of the environment by their emissions.
- All along the Muzvezve River, where panners use Hg over a distance of at least
7 km corresponding to the studied zone. This distance is certainly longer than that,
but an inventory of the panning areas upstream and downstream from the zone
visited is necessary to ascertain the actual extent. Results of Hg concentration in
carnivorous fishes, which are good bioindicators of the contamination, show the Hg
contamination reached the living aquatic environment.
- The Etena area, in the northern zone can be classified as a multi-source Hot Spot
according to the Hg concentrations found in the tailings close to the stamp mill, but
also in the soils near the many amalgamation and roasting sites in the village.
5.3. EVALUATION OF EXPOSURE
Direct and passive exposures to mercury have been observed. Illustration 59
summarises the main exposure routes and their probability of occurrence.
À Exposure for miners and millers
People using or working close to the copper-plate are the most exposed. Large
amounts of mercury are used in that process. People are in close contact with mercury
and work in strongly contaminated environment. Most of the time, young men are
working there, but we have also seen women, as in New Plus mill. Exposure to
mercury can occur under several conditions:
- skin contact, when they clean up the copper plate, refill the plate with mercury, etc;
- inhalation, it was estimated that people breath during occupation, an atmosphere
around 20 Ág/m3 of vaporized mercury with peak contents of probably several
hundreds of micrograms per cubic meter; the amalgam recovery step is the most
dangerous;
- inhalation of mercury vapours can be coupled with cyanide vapours, as people use
cyanide solution or tablets during the cleaning phase of the copper-plate;
- dust ingestion and inhalation. Tailings and slimes are contaminated after the copper-
plate step and the process generates dust.
The amalgamation areas are scattered both in the milling center and in the villages and
near the riverbanks. The miners complete manually the amalgamation process on the
material collected on the copper-plates or at the bottom of the bowl-concentrator.
98
BRGM/RC-53320-FR ¡ Part A: Final report
Global mercury project: Environmental assessment Kadoma-Chakari area, Zimbabwe
Non
Exposure
Professional
Sources
professional
Observations
route
exposure
exposure
Skin contact
***
0
Copper plate
inhalation
***
*
Most of the milling centre
Dust ingestion
**
*
Free
Skin contact
**
0
All milling centre, villages, the
amalgamation
inhalation
**
*
Claw Dam bank and the
sites
Dust ingestion
**
**
Muzvezve River
Inhalation
***
*
Mainly at free roasting sites in
Amalgam
milling centres and villages,
roasting sites
Dust ingestion
*
** (children)
but also at organised roasting
rooms in milling centre.
Fish
** ?
** ?
Depending on the diet
consumption
Local contamination with Hg
Drinking water
?
?
cyanide ?
Illustration 59 - Summary of the exposure pathways and the related risks (probability of
occurrence: ***high, **moderate, *possible, 0 none).
During this process, exposure to mercury can occur under several conditions:
- skin contact when completing the panning process;
- inhalation when roasting, as the process is performed outdoor on limited amounts of
mercury, it seems that exposure is less important than for people working artisanal
plants (copper plants, bowl concentrator...);
- dust ingestion, as contaminated tailings are dispersed in various places.
À Passive exposure
As part of the artisanal mining process is performed in villages and riverbanks, passive
exposure may be suspected. Children and women are frequently present and take part
in the activity. Sites like New Plus are characteristic of that situation, mainly around the
roasting room.
Dust ingestion (particularly for children) and inhalation are the most probable routes of
exposure for non miners.
À Additional mercury intake
We demonstrated that a significant part of the fishes are contaminated, Hg
concentrations are above WHO safety standards. The sociological survey ordered by
UNIDO and performed in the same area does not allow us to evaluate the daily intake
of mercury by food consumption. However our field observations show that local
people consume fishes from Claw Dam, the Muzvezve local and its tributaries. We do
not know if local fishing represents the main source of proteins, but this intake should
be taken into consideration in the risk analysis.
BRGM/RC-53320-FR ¡ Part A: Final report
99
Global mercury project: Environmental assessment Kadoma-Chakari area, Zimbabwe
The analyses of the tailings samples after cyanidation show also some contamination.
Hg may be complexed with cyanides and may contaminate the surface water or even
the groundwater, particularly during the rainy season. This point should be verified in a
further step, because strong contamination of tailings dumps may create severe local
contamination for the aquatic life and the quality of drinking water.
100
BRGM/RC-53320-FR ¡ Part A: Final report
Global mercury project: Environmental assessment Kadoma-Chakari area, Zimbabwe
6. Recommendations
6.1. GENERALITIES
The artisanal gold processing in the Kadoma region involves thousands of people with
different educational levels, scattered over a very wide area. The outcomes of the
environmental assessment clearly demonstrated the important use of mercury in the
area generates high level risks for human health and the environment. This is in
agreement with the outcomes of the health assessment (see Boese-O'Reilly et al.,
2004).
The extension of the mining activity in the Kadoma-Chakari area, its economical
importance and the amount of ore processed have reached semi-industrial levels. This
situation justifies an adapted action plan to develop alternative technologies and the
progressive ban of mercury in the mining process in the area.
The improvement of the life quality and the acquisition of the best available techniques
for gold mining and processing require time, training and financing. The implementation
of a real Environmental Management Plan (EMP) is necessary. Three levels of actions
can be proposed: urgent actions to reduce the immediate or direct risks to human
health, complementary data acquisition and medium- to long-term actions to improve
life quality, including proper management of natural resources. All these proposed
actions have the following objectives:
- To reduce on a short term basis the high levels of exposure for workers.
- To implement cleaner technologies.
- To increase the knowledge and awareness amongst artisanal miners and millers.
- To assess the extent of Hg pollution in the single-source and multi-source hot spots.
- To rehabilitate the polluted sites (soil cleaning, tailing containment...).
- To analyse the consequences of the urgent actions.
- To improve life quality.
- To improve the management of the mining resources.
6.2. URGENT ACTIONS
Urgent actions have to be taken in the single-source hot spots to reduce significantly
the exposure of workers to mercury. Action should focus on (1) the copper-plate
equipment, (2) the amalgamation areas and (3) the roasting sites. Several actions are
suggested, although these are not exhaustive:
BRGM/RC-53320-FR ¡ Part A: Final report
101
Global mercury project: Environmental assessment Kadoma-Chakari area, Zimbabwe
6.2.1. Actions on ore processing technologies and practices
Replacement of the copper-plates by alternative equipment that could be in a first step
a bowl-concentrator. Discussion with local authorities should be initiated to
demonstrate the dangerousness of the copper-plate process.
Action should be taken by the local authorities to reduce the exposure of workers who
are the most exposed around the copper-plates (use of gloves and masks...),
education on safe procedures for these workers.
An awareness raising campaign should be urgently organised for the miners and
millers to show them the impact on health of their professional occupation. This would
allow initiating a process in order to modify local practices and adopt safe procedures
for workers and their families.
Amalgam roasting operations should be performed in a specific room per milling site,
equipped with an air extractor and air filter to recover most of the mercury dispersed in
the air during this operation. The location of this room should be selected in an
appropriate place allowing the control of the environment and avoiding new
contamination of the surrounding soils,
Exhaust pipes of the present roasting rooms should be adapted to improve the
recovery of mercury and avoid its dissemination in the environment (i.e. at Even Milling
Centre and New Plus mill).
Roasting operations should be prohibited in villages. Free roasting places for
independent miners (using small amounts of Hg) should be settled.
6.2.2. Actions to rehabilitate and preserve the environment
The drinking-water pumping raft of Tix should be removed to an another site, away
from the gold mining and local processing area. Another solution is to dig a well after
checking the groundwater quality.
The stability of the cyanided tailing dumps and the effluent released from these dumps
should be controlled, particularly during the rainy season,
An awareness raising campaign should be initiated about the contamination of local
fishes from the Muzvezve River. The communication should insist on the
dangerousness to consume local carnivorous fishes. Similar communication actions
were implemented successfully in Brazil.
102
BRGM/RC-53320-FR ¡ Part A: Final report
Global mercury project: Environmental assessment Kadoma-Chakari area, Zimbabwe
6.3. MEDIUM- TO LONG-TERM ACTIONS
6.3.1. Improvement in the management of the artisanal mining activity
A regional strategy should be designed with regional and national authorities to
improve the management of the artisanal gold mining activity, with the objectives of
creating employment and stabilising the population involved in this activity. This may
require changes in the policy and legislation dealing with mining activities, to promote
the use of alternative technologies, to control the flux of mercury, and the artisanal
mining activity.
Policy action should focus in the area of Kadoma on the reduction of mercury use by
the use of alternative technologies that are adequate with the ore volumes that are
processed. The implementation of Transportable Demonstration Units (TDUs)
proposed by the Global Mercury Project Team should represent the core of that action.
Develop awareness raising campaigns for the miners and millers on good practices
and mitigation of risks in the use of Hg. Training sessions on the best available
techniques in artisanal gold mining and processing should be proposed.
Promotion campaigns on the use of retorts should be adapted for individual miners that
use small amounts of mercury.
6.3.2. Reduction of environmental impacts
This environmental assessment provided preliminary information at the regional scale.
However, it was demonstrated that significant contamination was observed in various
components of the environment (tailings, soils, sediments) and the aquatic life is
already affected. The evaluation of the contamination shows that people may be
exposed (at least passively) on a long-term basis because their close environment is
contaminated. A regional strategy has to be defined to decrease the release of Hg to
the environment.
A regional policy should be designed and implemented to improve the recycling of
mercury from the shops to the miners. It is improbable that independent miners using
small amounts of mercury could be forced to change their process. An adapted policy
on the Hg market should be implemented to control the import of Hg, and improve the
recycling of Hg. An experiment of free Hg replacement could be tested in the Kadoma
region in order to check if such kind of policy could decrease the Hg release to the
environment.
A regional environmental management plan (EMP) should be designed with the
collaboration of national and local institutions (Associations or representatives of
artisanal miners and millers, local and national authorities...) to define a strategy of
remediation and monitoring actions, define priorities of action at regional scale. The
EMP should focus on the monitoring of Hg concentration in soils, sediments and
tailings in the identified single-source hot spots.
BRGM/RC-53320-FR ¡ Part A: Final report
103
Global mercury project: Environmental assessment Kadoma-Chakari area, Zimbabwe
An exhaustive inventory of the mining, milling and panning areas should be carried out
at a national level. Results should be summarised in a national database, not only for
the Kadoma-Chakari area but also for all the states of Zimbabwe.
Analytical facilities for Hg control in solids and fishes (LUMEX...) should be
implemented in Kadoma to ensure the effectiveness of the EMP.
A monitoring strategy of professional exposure should be implemented in close co-
ordination with the health authorities.
6.3.3. Support and management of these actions
The support and the management of these short-medium and long-term actions require
the creation of a Task Force involving all the key stakeholders such as the following:
- Associations or representatives of artisanal miners and millers,
- Local authorities (Mine, Environment, Health...),
- A UNIDO representative and national expert,
- National authorities (all the involved governmental organisations),
- Local and international universities and institutes involved in this subject,
- NGOs.
104
BRGM/RC-53320-FR ¡ Part A: Final report
Global mercury project: Environmental assessment Kadoma-Chakari area, Zimbabwe
7. Conclusion
he fieldwork of the environmental assessment of the artisanal gold mining activity
Tin the Kadoma-Chakari area, selected by UNIDO, was carried out in November
2003 just before the rainy season and completed in April 2004 during the health
assessment survey. The team was composed of a BRGM staff, the UNIDO National
expert of the Global Mercury project and the Chief of the chemical Laboratory of IMR
(Institute of Mining Reseach) of the University of Zimbabwe.
On the basis of the outcomes of the previous sociological survey, the environmental
assessment started on sites located at the North of Kadoma. Following the advice of
the Kadoma Mine Department, the study was extended to the South of Kadoma. Ten
milling sites were then selected north and south of Kadoma. The site selection was
based on the following criteria: the size of the milling centre, the type of ore processing,
the population involved in the activity, the quantity of mercury used, the presence of a
village near the milling centre, and also the presence of environmental targets (rivers,
lake...).
The sampling strategy focused on soils, sediments, tailings, dust, air monitoring, and
fishes. Air monitoring was carried out on the three most important sites, Tix, Amber and
Even Milling center. All the samples, including the fish, were analysed in France and
thirty-three duplicate samples of soil, dust and tailings were analysed in the IMR
laboratory in Harare.
The environmental assessment confirms that a large quantity of Hg is used by miners
and panners in the selected area. Probably between 1.2 to 17.5 tons of mercury are
used and released to the environment annually. The range is very wide according to
the difficulties to get information about the quantity of processed ore and the mercury
market and recycling in this area. The Mercury is used for amalgamation on all sites.
Most of the time these operations are carried out without any precaution to protect the
workers. If some precautions do exist, this survey shows that they are neither sufficient
nor satisfactory.
Hot spots, corresponding to sites containing high concentrations of Hg relative to the
local background levels in soils and sediments are identified and classified as single-
source or as multi-source hot spots.
The single-source hot spots correspond to a well-delimited pollution source and are
associated with specific tools such as copper-plate and technique such as
amalgamation or roasting used in gold processing. In the visited sites, all pollution
sources are known. The areas concerned are relatively small, a few hundred square
meters, but these sites induce a strong exposure to mercury for the local workers.
Multi-source hot spots, on the other hand, correspond to much wider areas
characterised by several associated single-source hot spots. The contamination can
BRGM/RC-53320-FR ¡ Part A: Final report
105
Global mercury project: Environmental assessment Kadoma-Chakari area, Zimbabwe
affect a local level and extend widely throughout the mining and milling area. The
environmental impacts can spread out over a distance exceeding tens of kilometers
around the emission sources. Potential impact may even affect the neighbouring
countries.
The most important single source hot spot is situated around the copper-plate inside
the milling centres where the Hg concentration in soil reaches ten to four hundred times
the local background. This level of Hg pollution is the consequence of the dispersion of
Hg vapour in the air around the copper-plate followed by condensation and
impregnation of fine soil particles. Moreover, a substantial quantity of Hg is lost with the
tailings downstream from the copper-plate.
Free amalgamation places are also described as single-source hot spot. They are
found where water is available for the panning operation, at the milling centre, in the
village, on the river or lake banks. If there is indeed little Hg dispersion in the air during
the process, a large quantity of Hg is lost with the tailings and consequently reaches
the surface water and the biological chain.
A third of single-source hot spots is represented by roasting places. A large quantity of
mercury is lost during the open air roasting operations that are carried out by miners at
the milling centre and very frequently in the village. Miners, but also women and
children may be exposed during that process.
Tix site is characteristic of a multi-source hot spot. It is the most polluted area among
all the visited and studied sites. Tix site presents four copper-plates at the milling
centre, and numerous amalgamation places and roasting sites scattered in the milling
centre, in the village and in the country around. Both semi-industrial and ancient
artisanal mining activities induced a strong contamination in the area. Risk is increased
because of the dissemination of contamination to the Muzvezve River that supplies
water and food at a regional scale and runs to the Zimbabwe border. Abnormal Hg
concentrations are found in sediments and fishes collected downstream from the Tix
sites. Several tens of thousands of people are directly or indirectly concerned by this
multi-source hot spot.
The site of Amber Rose is also classified as a multi-source hot spot. The difference
with Tix comes from the lack of copper-plate and the exposed population is lower in
Amber Rose than in Tix.
The Muzvezve River itself, downstream from Claw Dam, is also considered as a multi
source hot spot because it is the location of amalgamation and roasting sites for many
independent miners. Local tributaries may also provide contaminated sediments from
Tix and Amber Rose and other milling centres. Aquatic life is affected by mercury
contamination. One third of the fish (18/52) display Hg concentrations exceeding the
WHO safety limit of 0.5 Ág g-1 fresh weight. The average Hg concentration is
0.41 Ág g-1. For the carnivorous species, it rises up to 1.06 Ág g-1, and a young
specimen of them displays 2 Ág g-1 despite its light weight (110 g). If the results of the
small-sized samples are representative of the area, it is very likely that most of the fish
106
BRGM/RC-53320-FR ¡ Part A: Final report
Global mercury project: Environmental assessment Kadoma-Chakari area, Zimbabwe
eaten by the local population along the Muzvezve River are contaminated with
mercury.
Direct exposures to Hg contamination have been observed for miners and millers men
and sometime women who are working close to the copper-plate. Exposure to mercury
occurs by skin contact, vapour inhalation, and particle ingestion.
Amalgamation and roasting areas are also the sites of direct exposure through the
same way. Children who are frequently involved in the amalgamation process are
affected.
Passive exposure may be suspected because this artisanal activity is performed in
villages and along the riverbanks. Young men and women are frequently present in the
proximity of this activity.
The extension of the mining activity in the Kadoma-Chakari area, its economical
importance and the amount of ore processed have reached semi-industrial levels. This
situation justifies an adapted action plan to develop alternative technologies and the
progressive ban of mercury in the mining process in the area.
Recommendations contain first urgent actions to reduce significantly the exposure of
workers and their family to mercury. They concern the ore processing technologies,
practices and actions to rehabilitate and preserve the environment.
Medium- to long- term actions aim at improving the management of the artisanal
mining activity and reduce the environmental impacts.
BRGM/RC-53320-FR ¡ Part A: Final report
107
Global mercury project: Environmental assessment Kadoma-Chakari area, Zimbabwe
8. References
Alho C.J.R., Vieira L.M. (1997) - Fish and wildlife resources in the Pantanal wetlands
of Brazil and potential disturbances from the release of environmental contaminants.
Environmental Toxicology and Chemistry 16, p. 71-74.
Babut M., Sekyi R., Potin-Gautier M., et al. (2001) - Assistance in Assessing and
Reducing Mercury Pollution Emanating from Artisanal Gold Mining in Ghana - Phase I:
Part II - Conduct of surveys on river systems & overall conclusions. UNIDO, Vienna,
32 p.
Bidone E.D., Castilhos Z.C., Cid de Souza T.M., Lacerda L.D. (1997) - Fish
contamination and human exposure to mercury in the Tapajos river basin, Para state,
Amazon, Brasil: a screening approach. Bulletin of Environmental Contamination and
Toxicology 59, p. 194-201.
Billaud P., Laperche V. (2003) - Removal of barriers to the introduction of cleaner
artisanal gold mining and extraction technologies in the Kadoma - Chakari area.
Zimbabwe. Fieldwork Report 1. BRGM/RC-52796-FR, 72 p.
Bloom N.S. (1992) - On the chemical form of mercury in edible fish and marine
invertebrate tissue. Can. J. Fish. Aquat. Sci. 49, p. 1010-1017.
Boese-O┤Reilly S., Dahlmann F., Lettmeier B., Drasch G. (2004) - Removal of
barriers to the Introduction of Cleaner Artisanal Gold Mining and Extraction
Technologies in Kadoma, Zimbabwe. Part B ¡ Health assessment. Institute of Forensic
Medicine, Ludwig-Maximilians University, Munich, Final Draft Report, 97 p.
Boudou A. (2004) - Artisanal goldmining: environmental issues. 7th International
Conference on Mercury as a Global Pollutant, Round-Table 4, Ljubjana, Slovenia, July
2004.
Boudou A., Ribeyre F. (1997) - Mercury in the foodweb: accumulation and transfer
mechanisms. In: Sigel, A., Sigel, H. (Eds.), Mercury and its effects on environment and
biology, Marcel Dekker, New York, USA, p. 289-320.
Castilhos Z.C., Bidone E.D., Lacerda L.D. (1998) -ncrease of the background human
exposure to mercury through fish consumption due to gold mining at the Tapajos River
region, Para State, Amazon. Bulletin of Environmental Contamination and Toxicology
61, p. 201-209.
Durrieu G., Maury-brachet R., Boudou A. (2004) - Gold miningand mercury
contamination of the piscivorous fish Hoplias aimara in French Guiana (Amazon basin).
Ecotoxicol. Environ. Saf. (in press).
BRGM/RC-53320-FR ¡ Part A: Final report
109
Global mercury project: Environmental assessment Kadoma-Chakari area, Zimbabwe
FrÚry N., Jouan M., Maillot E., Deheeger M., Boudou A. (1999) - Exposition au
mercure de la population amÚrindienne Wayana de Guyane - EnquÛte alimentaire.
Institut National de Veille Sanitaire, Paris. 41 p.
Frery N., Maury-Brachet R., Maillot E., Deheeger M., de Merona B., Boudou A.
(2001) - Gold miningactivities and mercury contamination of native Amerindian
communities in French Guiana: key role of fish in dietary uptake. Environ. Health.
Perspect. 109, p. 449-456.
Ikingura J.R., Akagi H. (1996) - Monitoring of fish and human exposure to mercury
due to gold mining in Lake Victoria goldfields, Tanzania. The Science of the Total
Environment 191, p. 59-68.
INERIS (2003) ¡ Fiche de donnÚes toxicologiques et environnementales des
substances chimiques. www.ineris.fr
Malm O. (1998) - Gold mining as a source of mercury exposure in the Brazilian
Amazon. Environmental Research 77, p. 73-78.
Mason R., Reinfelder J.R., Morel F.M.M. (1995) - Bioaccumulation of mercury and
methylmercury. Wat. Air Soil Pollut. 80, 915-921.
Morel F.M.M., Kraepiel A.M.L., Amyot M. (1998) - The chemical cycle and
bioaccumulation of mercury. Ann. Rev. Ecol. Syst. 29, p. 543-566.
Olivero J., Solano B. (1998) - Mercury in environmental samples from a waterbody
contaminated by gold mining in Colombia, South America. Science of The Total
Environment 217, p. 83-89.
Olivero J., Solano B., Acosta I. (1998) - Total Mercury in Muscle of Fish from Two
Marshes in Goldfields, Colombia. Bulletin of Environmental Contamination and
Toxicology 61, p. 182-187.
Roulet M., Lucotte M., Farella N., et al. (1999) - Effects of recent human colonization
on the presence of mercury in Amazonian ecosystems. Water Air Soil. Pollut. 112,
p. 297-313.
Roulet M., Maury-Brachet R. (2001) - Le mercure dans les organismes aquatiques
amazoniens. In: Carmouze, J.P., Lucotte M., Boudou A. (Eds.). Le mercure en
Amazonie, IRD, Paris, France, p. 203-271.
Rudd J.W.M. (1995) - Sources of methylmercury to freshwater ecosystems: a review.
Wat. Air Soil Pollut. 80, p. 697-713.
Shoko D., Veiga M. (2004) ¡ Information about the Project Sites in Zimbabwe. Global
Mercury Project report. January 2004, 19 p.
110
BRGM/RC-53320-FR ¡ Part A: Final report
Global mercury project: Environmental assessment Kadoma-Chakari area, Zimbabwe
Snodgrass J.W., Jagoe C.H., Bryan Jr. A.L., Brant H.A., Burger J. (2000) - Effects
of trophic status and wetland morphology, hydroperiod, and water chemistry on
mercury concentrations in fish. Canadian Journal of Fisheries Aquatic Sciences 57,
p. 171-180.
Sposito G. (1989) ¡ The Chemistry of Soils. Oxford University Press. New York. ISBN
0-19-504615-3
Veiga M. M., Hinton J., Lilly C. (1999) - Mercury in the Amazon: a comprehensive
review with special emphasis on bioaccumulation and bioindicators. Proc. NIMD
Forum'99, p. 19-39.
Veiga M., Shoko D. (2003) - Information about the Project Sites (Kadoma-Chakari
Region) Global Mercury Project report. October 2003, 14 p.
WHO (World Health Organisation) (1990) - Environmental health criteria,
101:methylmercury. WHO/IPCS, Geneva, Switzerland.
Wiener J.G., Krabbenhoft D.P., Heinz G.H. Scheuhammer A.M. (2002) -
Ecotoxicology of mercury. In: Hoffman D.J., Rattner B.A., Burton G.A., Cairns J. (Eds.),
Handbook of Ecotoxicology, CRC Press, Boca Raton, USA, p. 409-463.
BRGM/RC-53320-FR ¡ Part A: Final report
111
Global mercury project: Environmental assessment Kadoma-Chakari area, Zimbabwe
Appendix 1
List of collected samples
with results of the chemical analyses
BRGM/RC-53320-FR ¡ Part A: Final report
113
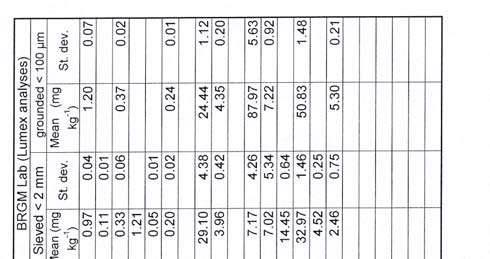
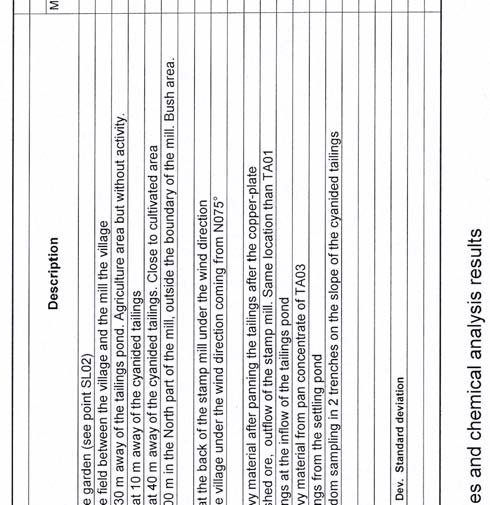
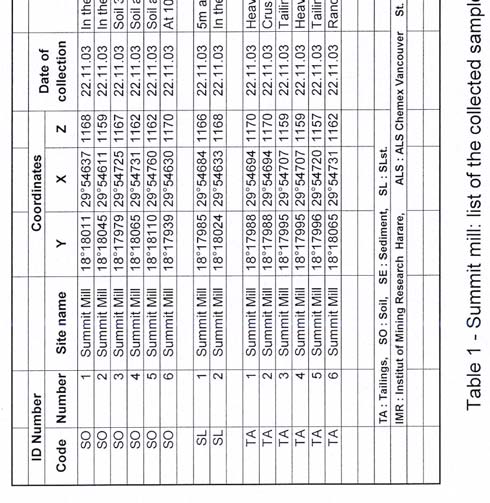
Global mercury project: Environmental assessment Kadoma-Chakari area, Zimbabwe
BRGM/RC-53320-FR ¡ Part A: Final report
115
Global mercury project: Environmental assessment Kadoma-Chakari area, Zimbabwe
emical analysis results
d ch
s an
mple
d
sa
cte
:
List of the colle
o
w mill
Table 2 - Glasg
116
BRGM/RC-53320-FR ¡ Part A: Final report
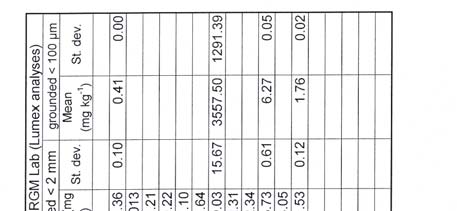
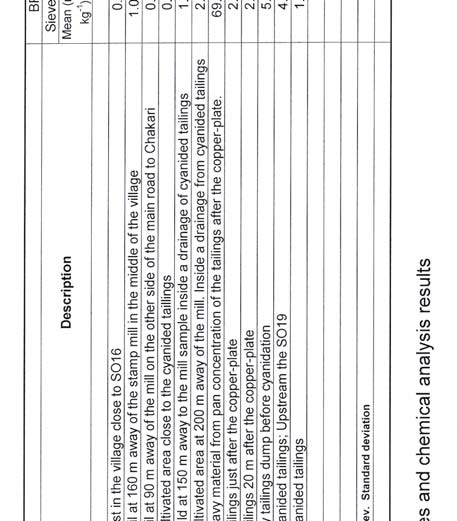
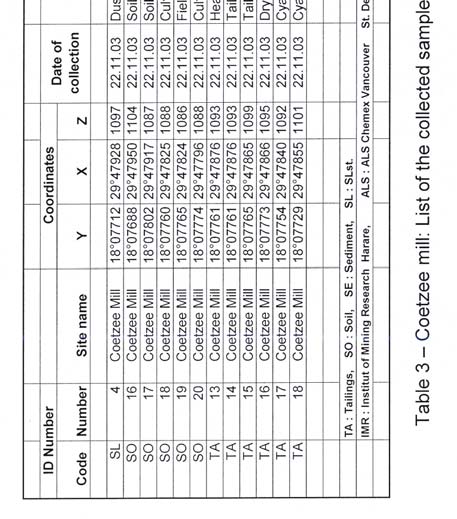
Global mercury project: Environmental assessment Kadoma-Chakari area, Zimbabwe
BRGM/RC-53320-FR ¡ Part A: Final report
117
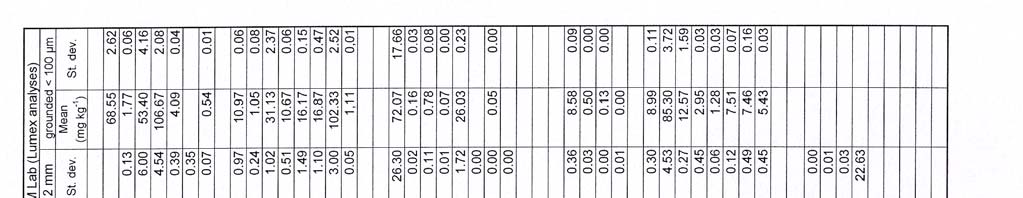
Global mercury project: Environmental assessment Kadoma-Chakari area, Zimbabwe
118
BRGM/RC-53320-FR ¡ Part A: Final report
Global mercury project: Environmental assessment Kadoma-Chakari area, Zimbabwe
s
ult
s re
y
si
c
al anal
chemi
s and
p
le
e
d
sam
ct
colle
of
r
e
:
List
g
cent
5
¡ Even Millin
Table
BRGM/RC-53320-FR ¡ Part A: Final report
119
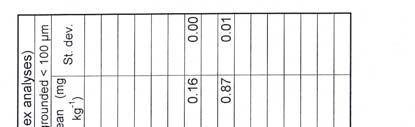
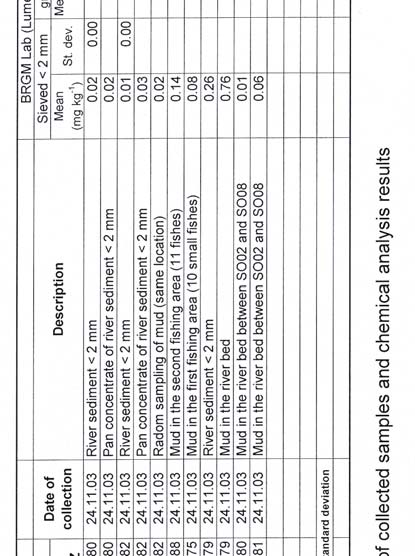
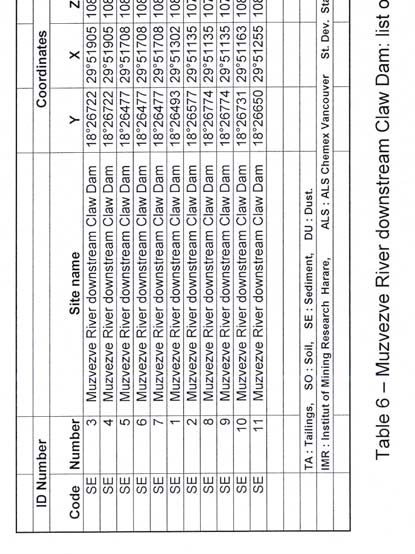
Global mercury project: Environmental assessment Kadoma-Chakari area, Zimbabwe
120
BRGM/RC-53320-FR ¡ Part A: Final report
Global mercury project: Environmental assessment Kadoma-Chakari area, Zimbabwe
s
sult
s re
y
si
al
c
al an
p
l
e
s and chemi
i
st of collected sam
: L
r Dam
x
a
nde
ver Ale
zve Ri
Table 7 ¡ Muzve
BRGM/RC-53320-FR ¡ Part A: Final report
121
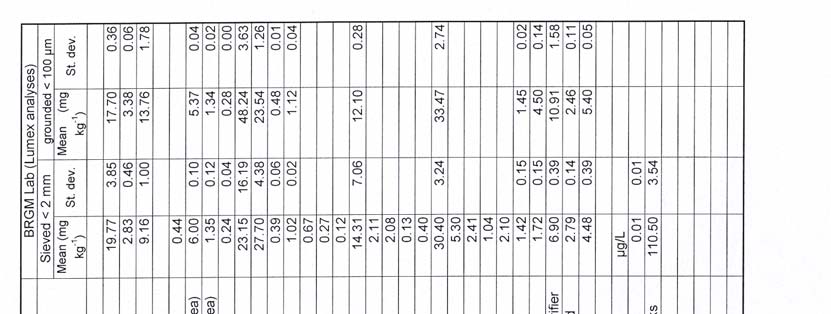
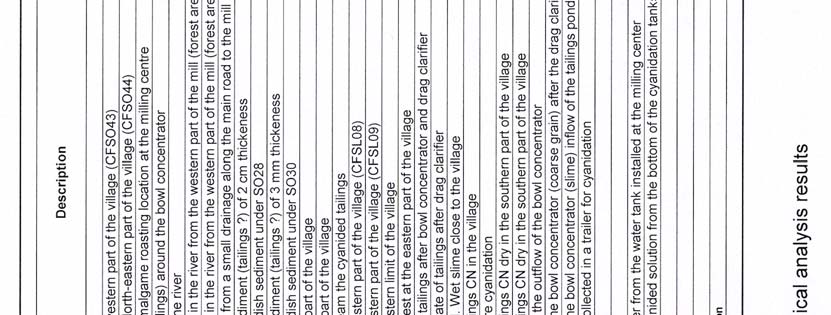
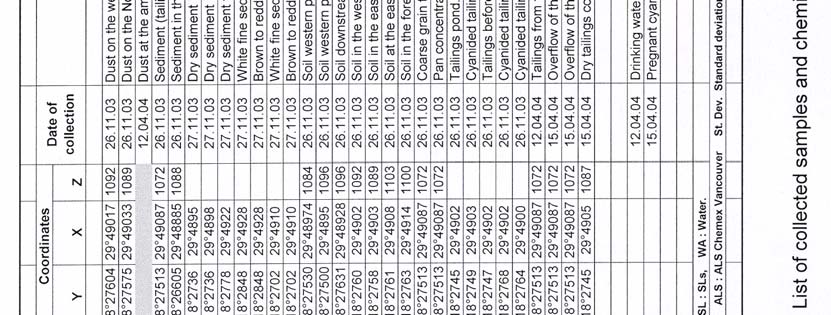
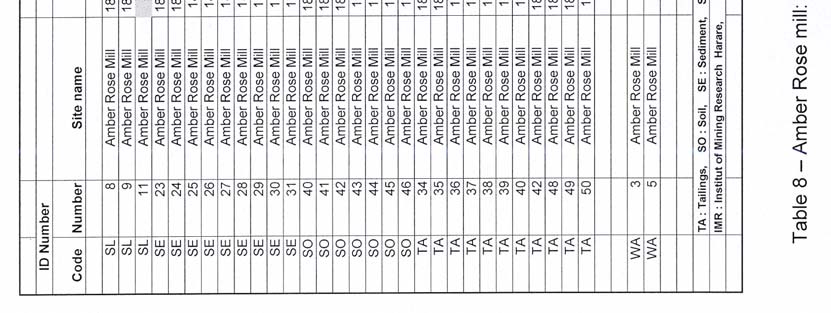
Global mercury project: Environmental assessment Kadoma-Chakari area, Zimbabwe
122
BRGM/RC-53320-FR ¡ Part A: Final report
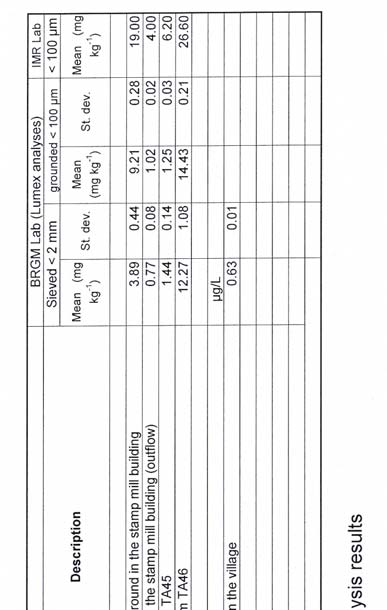
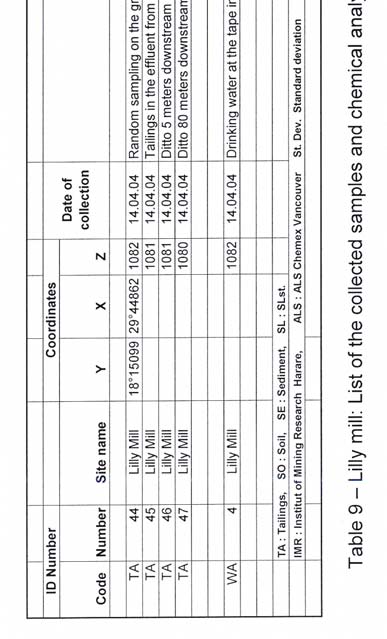
Global mercury project: Environmental assessment Kadoma-Chakari area, Zimbabwe
BRGM/RC-53320-FR ¡ Part A: Final report
123
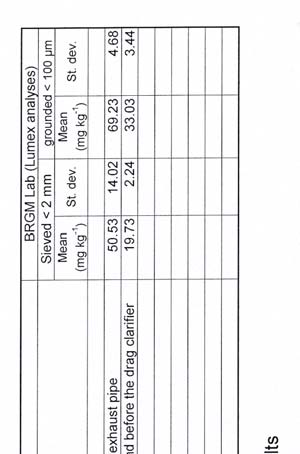
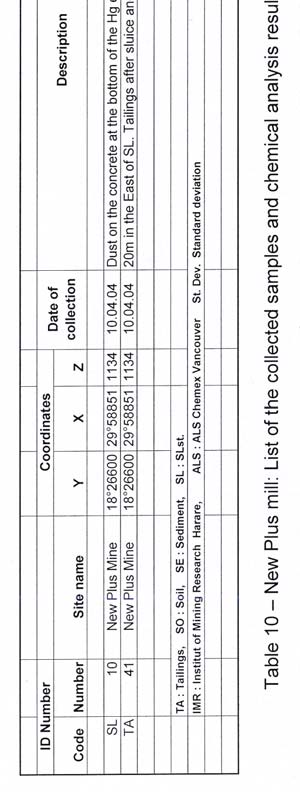
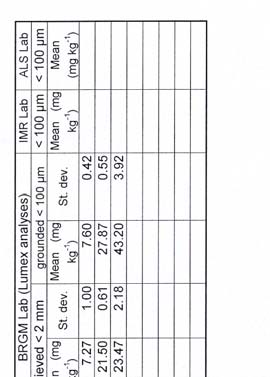
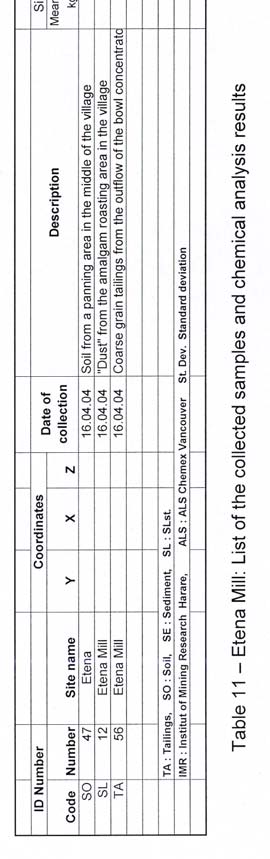
Global mercury project: Environmental assessment Kadoma-Chakari area, Zimbabwe
124
BRGM/RC-53320-FR ¡ Part A: Final report
Global mercury project: Environmental assessment Kadoma-Chakari area, Zimbabwe
Appendix 2
Quality control
BRGM/RC-53320-FR ¡ Part A: Final report
125
Global mercury project: Environmental assessment Kadoma-Chakari area, Zimbabwe
1. QUALITY CONTROL OF LUMEX ANALYSES VS. STANDARD
REFERENCES MATERIALS (SRM)
The analyser can be calibrate in two ways:
- calibration by a single standard sample;
- calibration by several standard samples.
We chose the calibration by a single standard sample at 10,100 ng g-1, but we selected
several standard samples to check the quality of the calibration curve.
A- To obtain the calibration curve, we weighed a different amount of the single
standard sample several times as shown below:
Mass
[Hg]
Calibration curve
N
Standard
mg
ng g-1
Peak area
12000
1
Std__10100
17.8
1798
62500
9000
2
Std__10100
26.7
2697
87700
-1
3
Std__10100
37.6
3798
119000
ng g
6000
g]
[
H
4
Std__10100
47.0
4747
151000
3000
5
Std__10100
71.5
7222
250000
0
6
Std__10100
111.7
11282
381000
0
100000
200000
300000
400000
area
B- Quality control of the calibration curve
We used five samples: a sand without any mercury and four SRM with different
mercury concentrations at 32, 102, 1,000 and 10,100 ng g-1.
The results (see illustrations below) showed that the Lumex underestimates the
mercury content in the samples by 8 to 10 % for mercury concentrations lower than
1,000 ng g-1. For higher mercury concentrations, the result is correct.
y = 1,0286x
[Hg]
R2 = 0,9999
10000
Sample
ng g-1
%
sand
2.2
Std__32
29.0
-10.3
(measured value)
100
-1
Std__102
93.0
-9.7
Std__1000
922.0
-8.5
g] ng g
[H
Std__10100 10400.0
+2.9
1
1
100
10000
[Hg] ng g-1 (standard value)
BRGM/RC-53320-FR ¡ Part A: Final report
127
Global mercury project: Environmental assessment Kadoma-Chakari area, Zimbabwe
2. WATER
The mercury analyses on water were performed in the BRGM laboratory using as per
the European method EN13506 "Determination of mercury by atomic fluorescence
spectrometry".
Samples were first prepared by adding a bromide-bromate mixture. They then were
analysed by a system composed of a continuous flow system, a gas-liquid separator
and an atomic fluorescence detector. Elemental mercury vapour was generated in the
system by reduction with tin chloride (SnCl2). The device used is the atomic
fluorescence spectrometer MERLIN from PSA. All reagents were of mercury-free
quality.
The accuracy of mercury analyses is frequently checked by inter-laboratory
comparisons and by an intra-laboratory control chart. Detection limit is less than
5 ng l-1.
3. FISH
All analyses were performed in the "Laboratoire d'Ecophysiologie et Ecotoxicologie des
SystÞmes Aquatiques" (LEESA), CNRS, University of Bordeaux, France.
Total Hg concentrations in dorsal fish muscle samples were determined by flameless
atomic absorption spectrometry. Analyses were carried out automatically after drying
by thermal decomposition at 750░C, under an oxygen flow (AMA 254, Leco-France).
Each series of measurements included three standard biological reference materials
(TORT-2, lobster hepatopancreas; DORM-2, dogfish muscle; and DOLT-2, dogfish
liver, from NRCC-CNRC, Ottawa, Canada) for quality control (illus. 60).
The detection limit (DL) for total Hg was derived as three standard deviations from
blank measurement: DL on a dry-weight basis was 1.4 ng g-1. The method precision
(relative standard deviation, %RSD) of total Hg determinations, estimated from
5 replicates of fish muscle samples, was 5%.
All dorsal muscle concentrations were reported on a dry-weight basis (40░C over two
days).
TORT-2
DORM-2
DOLT-2
Total Hg
Certified value
0.27 ▒ 0.06
4.64 ▒ 0.26
2.14 ▒ 0.28
(Ág g-1)
Measured value
0.27 ▒ 0.04
4.78 ▒ 0.33
2.08 ▒ 0.12
Illustration 60 - Comparison of measured and certified values of total mercury concentrations
using three standard biological reference materials.
128
BRGM/RC-53320-FR ¡ Part A: Final report
Global mercury project: Environmental assessment Kadoma-Chakari area, Zimbabwe
4. SOIL, SEDIMENT, TAILINGS AND WATER BY SELECTED AREA
4.1. Inter-laboratory comparison
On the basis of all the chemical analyses carried out at BRGM, at IMR and in the ALS
laboratories (app. 1), several comparisons were performed in order to check the quality
of the result of the Lumex versus those of the control laboratory (ALS) and then to
check the difference between the analyses performed with the Lumex on the < 2 mm
fraction as compared to the ground sample < 100 Ám. The final objective was to define
the best granulometric size to be retained for a preliminary diagnosis of the pollution
and to confirm the usefulness of the Lumex as a field tool to detect polluted areas (hot
spots).
a) Correlation Lumex - ALS
The samples analysed in the ALS control laboratory are listed in illustration 61.
Voluntarily, the samples selected for verification come from different environments:
superficial layers, soils, stream sediments and tailings, and they display a wide range
of values.
BRGM LUMEX
ALS
Sample
< 2 mm
< 100 Ám
< 100 Ám
SL5
105
103.33
85.80
SL6
1.19
1.11
2.29
SE16
8.29
8.58
7.68
SE17
0.49
0.50
0.67
SE18
0.12
0.13
0.38
SO24
0.14
0.16
0.22
SO25
0.75
0.78
1.02
SO26
0.07
0.07
0.15
SO36
0.04
0.05
0.10
TA20
1.72
1.77
3.23
TA21
39.33
53.40
24.30
TA22
100.90
106.67
89.20
TA23
3.75
4.09
5.46
TA25
0.58
0.54
0.79
Illustration 61 - List of samples selected for control analyses (in mg kg-1).
The good correlation found between LUMEX < 2 mm and ALS < 100 Ám values (illus.
62 and 63) also exists between LUMEX < 100 Ám and ALS < 100 Ám. Only sample
TA21 shows a small difference.
On the 14 samples checked and for a range of values ranging between 0.10 and
120 mg kg-1, it seems that the values obtained with the LUMEX for the < 2 mm fraction
is 10% above the values obtained at the ALS laboratory (illus. 64). Nevertheless, due
to the small quantity of samples analysed, this observation must be confirmed by
conducting more analyses, before it can be generalised.
BRGM/RC-53320-FR ¡ Part A: Final report
129
Global mercury project: Environmental assessment Kadoma-Chakari area, Zimbabwe
100,00
90,00
y = 0,8344x
R2 = 0,991
80,00
70,00
60,00
S
L
g A
50,00
mg/k
g
H
40,00
30,00
20,00
ALS< 100 Ám
LinÚaire (ALS< 100 Ám)
10,00
LinÚaire (ALS< 100 Ám)
0,00
0,00
20,00
40,00
60,00
80,00
100,00
120,00
Hg mg/kg Lumex<2mm
Illustration 62 - Correlation LUMEX < 2 mm versus ALS.
100,00
90,00
y = 0,7941x
R2 = 0,9696
80,00
70,00
60,00
k
g ALS
50,00
Hg mg/
40,00
30,00
20,00
SÚrie1
LinÚaire (SÚrie1)
10,00
0,00
0,00
20,00
40,00
60,00
80,00
100,00
120,00
Hg mg/kg Lumex
Illustration 63 - Correlation LUMEX < 100 Ám versus ALS < 100 Ám.
130
BRGM/RC-53320-FR ¡ Part A: Final report
Global mercury project: Environmental assessment Kadoma-Chakari area, Zimbabwe
Control analyses
100,00
80,00
g
60,00
Hg mg/k
40,00
20,00
0,00
DU5
DU6
SE16
SE17
SE18
SO24
SO25
SO26
SO36
TA20
TA21
TA22
TA23
TA25
Sample number
Lumex < 2 mm
Lumex<100Ám
ALS< 100 Ám
Illustration 64 - Histogram of the control analyses.
b) Correlation LUMEX < 2 mm versus LUMEX < 100 Ám
A second and broader control of the LUMEX field analyses was completed on 57 % of
the total collected samples. After the analyses of Hg on the < 2 mm fraction,
93 samples were ground < 100 Ám and analysed with the LUMEX in the BRGM
laboratory (app. 1). Although the population of the superficial samples is limited to 10
samples, the correlation is satisfactory (illus. 65A). We also obtained a good correlation
for the 21 stream sediments, for the 18 soils and for the 37 tailings (illus. 65 B, C and
D).
Conclusion: The quality control analyses completed first in the ALS lab, and then on
the ground sample < 100 Ám confirm the validity of the LUMEX analyses done on the
< 2 mm fraction. The results obtained with the LUMEX can not be taken as absolute,
but good enough to be used as an indicator of Hg pollution. In view of our objective, the
LUMEX can be considered to be a good field equipment to establish a preliminary
diagnosis on a site polluted by Hg (preliminary survey).
BRGM/RC-53320-FR ¡ Part A: Final report
131
Globa
132
l mercury pro
A: Correlation Lumex < 2mm vs. Lumex < 100 Ám for 10 dust samples of superficial layer (SL)
B: Correlation Lumex < 2 mm vs. Lumex < 100 Ám for 21 stream sediment samples (SE)
120,00
30,00
j
ect: Environ
y = 1,0436x
y = 0,9319x
R2 = 0,9591
R2 = 0,9194
100,00
25,00
m
m
80,00
20,00
m
15,00
e
60,00
n
tal assessm
40,00
mg/kg Lumex < 100 Á 10,00
g
Hg mg/kg Lumex <100 Á
H
20,00
5,00
ent Kad
0,00
0,00
0,00
20,00
40,00
60,00
80,00
100,00
120,00
0,00
5,00
10,00
15,00
20,00
25,00
30,00
Hg mg/kg Lumex <2 mm
SÚrie1
LinÚaire (SÚrie1)
Hg mg/kg Lumex < 2 mm
SÚrie1
LinÚaire (SÚrie1)
o
ma-Chak
C: Correlation Lumex < 2 mm vs. Lumex < 100 Ám for 18 soil samples (SO)
BRGM/RC-53
D: Correlation Lumex < 2 mm vs. Lumex < 100 Ám for 37 tailings samples (TA)
a
r
80,00
i are
140,00
y = 1,2194x
70,00
R2 = 0,9288
a
y = 1,463x
120,00
, Z
R2 = 0,9308
60,00
i
mbab
32
m
100,00
m
0-F
50,00
ex < 100 Á
80,00
we
R
40,00
ex < 100 Á
¡ Part A: F
/
k
g Lum
60,00
g 30,00
/
k
g Lum
m
g
g
H
Hg m
20,00
40,00
10,00
20,00
i
nal re
0,00
0,00
0,00
5,00
10,00
15,00
20,00
25,00
30,00
35,00
40,00
45,00
50,00
0,00
20,00
40,00
60,00
80,00
100,00
120,00
port
Hg mg/kg Lumex < 2 mm
SÚrie1
LinÚaire (SÚrie1)
Hg mg/kg Lumex < 2 mm
SÚrie1
LinÚaire (SÚrie1)
Illustration 65 - Correlation LUMEX < 2 mm vs. LUMEX < 100 Ám.
Global mercury project: Environmental assessment Kadoma-Chakari area, Zimbabwe
Appendix 3
Biometric data and mercury concentrations
(in Ág g-1 wet weight) in the 52 individual fish
BRGM/RC-53320-FR ¡ Part A: Final report
133
Global mercury project: Environmental assessment Kadoma-Chakari area, Zimbabwe
Standard
Body
[Hg] Ág g-1 Sampling
Family
Genus
Species
Food regime
lenght
weight
(g, fw)
spot
(cm)
(g, fw)
perciforme
cichlidae
Tilapia zillii
Omnivorous
8.80
30
0.050
1
perciforme
cichlidae
Tilapia zillii
Omnivorous
9.60
40
0.076
1
perciforme
cichlidae
Tilapia zillii
Omnivorous
9.20
30
0.064
1
perciforme
cichlidae
Tilapia zillii
Omnivorous
9.00
30
0.067
1
perciforme
cichlidae
Tilapia zillii
Omnivorous
6.60
<
0.083
1
perciforme
cichlidae
Tilapia zillii
Omnivorous
6.70
<
0.071
1
perciforme
cichlidae
Tilapia zillii
Omnivorous
7.20
<
0.061
1
perciforme
cichlidae
Tilapia zillii
Omnivorous
7.00
<
0.070
1
perciforme
cichlidae
Tilapia zillii
Omnivorous
7.00
<
0.056
1
perciforme
cichlidae
Tilapia zillii
Omnivorous
7.20
<
0.124
1
perciforme
cichlidae
Tilapia zillii
Omnivorous
24.50
330
0.173
2
perciforme
cichlidae
Tilapia zillii
Omnivorous
12.60
70
0.105
2
perciforme
cichlidae
Tilapia zillii
Omnivorous
13.40
80
0.100
2
perciforme
cichlidae
Tilapia zillii
Omnivorous
12.50
60
0.108
2
perciforme
cichlidae
Tilapia zillii
Omnivorous
11.50
50
0.247
2
Micropterus
gnathostomes
centrachidae
Carnivorous
15.20
60
0.912
2
salmonides
Micropterus
gnathostomes
centrachidae
Carnivorous
13.10
50
0755
2
salmonides
Labeo
cypriniformes
cyprinidae
Omnivorous
12.10
40
0.166
2
cylindricus?
Labeo
cypriniformes
cyprinidae
Omnivorous
12.20
60
0.187
2
cylindricus?
Labeo
cypriniformes
cyprinidae
Omnivorous
11.10
40
0.183
2
cylindricus?
Labeo
cypriniformes
cyprinidae
Omnivorous
10.90
30
0.232
2
cylindricus?
Labeo
cypriniformes
cyprinidae
Omnivorous
13.80
50
0.261
3
cylindricus?
Oreochromis
perciforme
cichlidae
Omnivorous
12.00
50
0.189
3
macrochir ?
perciforme
cichlidae
Tillapia rendali ? Omnivorous
11.80
40
0.361
3
perciforme
cichlidae
Tilapia zillii
Omnivorous
9.50
30
0.321
3
perciforme
cichlidae
Tilapia zillii
Omnivorous
8.80
20
0.243
3
Oreochromis
perciforme
cichlidae
Omnivorous
16.30
130
0.046
4
macrochir ?
Oreochromis
perciforme
cichlidae
Omnivorous
16.20
110
0.043
4
macrochir ?
Oreochromis
perciforme
cichlidae
Omnivorous
16.30
90
0.040
4
macrochir ?
Oreochromis
perciforme
cichlidae
Omnivorous
16.30
140
0.053
4
macrochir ?
Oreochromis
perciforme
cichlidae
Omnivorous
16.20
130
0.038
4
macrochir ?
Oreochromis
perciforme
cichlidae
Omnivorous
15.50
150
0.038
4
macrochir ?
Oreochromis
perciforme
cichlidae
Omnivorous
16.00
140
0.036
4
macrochir ?
Oreochromis
perciforme
cichlidae
Omnivorous
16.20
140
0.030
4
macrochir ?
Oreochromis
perciforme
cichlidae
Omnivorous
15.50
130
0.030
4
macrochir ?
Oreochromis
perciforme
cichlidae
Omnivorous
15.60
130
0.030
4
macrochir ?
BRGM/RC-53320-FR ¡ Part A: Final report
135
Global mercury project: Environmental assessment Kadoma-Chakari area, Zimbabwe
Standard
Body
[Hg] Ág g-1 Sampling
Family
Genus
Species
Food regime
lenght
weight
(g. fw)
spot
(cm)
(g. fw)
characiformes
brycinus
Brycinus imberi
Omnivorous
12.90
50
0.829
5
characiformes
brycinus
Brycinus imberi
Omnivorous
12.20
60
0.496
5
characiformes
brycinus
Brycinus imberi
Omnivorous
12.20
60
1.187
5
characiformes
brycinus
Brycinus imberi
Omnivorous
13.00
60
0.963
5
characiformes
brycinus
Brycinus imberi
Omnivorous
13.00
80
0.570
5
characiformes
brycinus
Brycinus imberi
Omnivorous
13.20
60
0.989
5
characiformes
brycinus
Brycinus imberi
Omnivorous
13.70
70
1.221
5
characiformes
brycinus
Brycinus imberi
Omnivorous
12.60
50
0.888
5
characiformes
brycinus
Brycinus imberi
Omnivorous
13.30
50
0.747
5
characiformes
brycinus
Brycinus imberi
Omnivorous
13.40
50
0.901
5
Micropterus
gnathostomes
centrachidae
Carnivorous
19.60
130
0.869
6
salmonides
Micropterus
gnathostomes
centrachidae
Carnivorous
17.50
110
2.00
6
salmonides
Micropterus
gnathostomes
centrachidae
Carnivorous
17.00
100
0.634
6
salmonides
Micropterus
gnathostomes
centrachidae
Carnivorous
18.90
140
0.915
6
salmonides
Micropterus
gnathostomes
centrachidae
Carnivorous
17.50
90
0.953
6
salmonides
Micropterus
gnathostomes
centrachidae
Carnivorous
17.50
100
1.383
6
salmonides
136
BRGM/RC-53320-FR ¡ Part A: Final report
Global mercury project: Environmental assessment Kadoma-Chakari area, Zimbabwe
Appendix 4
Characteristics of each fish specie
(identification, diet)
BRGM/RC-53320-FR ¡ Part A: Final report
137
Global mercury project: Environmental assessment Kadoma-Chakari area, Zimbabwe
Family
Genus
Species
Diet
Diet composition
Omnivorous
Insects, tiny fishes, crustaceans and vegetable
Characiformes
Brycinus
Brycinus imberi
carnivorous
matters
Omnivorous
Cypriniformes
Cyprinidae
Labeo cylindricus
Plants, phytoplankton, periphyton and diatoms
herbivorous
Micropterus
Only
Gnathostomes
Centrachidae
Fishes, crayfish and frog
salmonides
Carnivorous
Oreochromis
Omnivorous
Detritus, plants, zooplankton, phytoplankton and
Perciforme
Cichlidae
macrochir
herbivorous
diatoms
Omnivorous
Perciforme
Cichlidae
Tilapia zillii
Plants, zooplankton and invertebrate
herbivorous
Omnivorous
Perciforme
Cichlidae
Tilapia rendali
Plants, algae, zooplankton insects and crustaceans
herbivorous
BRGM/RC-53320-FR ¡ Part A: Final report
139
Scientific and Technical Centre
Environment and Processes Division
3, avenue Claude-Guillemin - BP 6009
45060 OrlÚans Cedex 2 ¡ France ¡ Tel.: +33 (0)2 38 64 34 34