


Final Report for an Assessment of
the Environment and Health in
the Rwamagasa area, Tanzania.
UNIDO Project EG/GLO/01/G34
Environmental Protection Programme
Commissioned Report CR/04/129
BRITISH
GEOLOGICAL
SURVEY
COMMISSIONED REPORT CR/04/129
Final Report for an Assessment of the
Environment and Health in the
Rwamagasa area, Tanzania. UNIDO
Project EG/GLO/01/G34
J D Appleton, H Taylor, T R Lister & B Smith; British Geological Survey
G Drasch & S Boese-O'Reilly; Institute of Forensic Medicine, Ludwig-
Maximilians-University, Munich
Key words
Mercury, Tanzania, Rwamagasa,
Artisanal, Gold, Mining.
Front cover
Cover picture Covered
amalgamation pond and sluices
at tailings reprocessing site
adjacent to the mbuga of the
River Isingile.
Bibliographical reference
APPLETON, J D, TAYLOR H.,
LISTER T R & SMITH, B.
(BGS); DRASCH, G & BOESE-
O'REILLY, S (Ludwig-
Maximilians-University,
Munich) 2004. Final Report for
an Assessment of the
Environment and Health in the
Rwamagasa area, Tanzania.
UNIDO Project
EG/GLO/01/G34. British
Geological Survey
Commissioned Report,
CR/04/129. 306 pp.
© NERC 2004
Keyworth, Nottingham British Geological Survey 2004
BRITISH GEOLOGICAL SURVEY
The full range of Survey publications is available from the BGS
Keyworth, Nottingham NG12 5GG
Sales Desks at Nottingham and Edinburgh; see contact details
0115-936 3241
Fax 0115-936 3488
below or shop online at www.thebgs.co.uk
e-mail: sales@bgs.ac.uk
The London Information Office maintains a reference collection
www.bgs.ac.uk
of BGS publications including maps for consultation.
Shop online at: www.thebgs.co.uk
The Survey publishes an annual catalogue of its maps and other
Murchison House, West Mains Road, Edinburgh EH9 3LA
publications; this catalogue is available from any of the BGS Sales
Desks.
0131-667 1000
Fax 0131-668 2683
e-mail: scotsales@bgs.ac.uk
The British Geological Survey carries out the geological survey of
Great Britain and Northern Ireland (the latter as an agency
London Information Office at the Natural History Museum
service for the government of Northern Ireland), and of the
(Earth Galleries), Exhibition Road, South Kensington, London
surrounding continental shelf, as well as its basic research
SW7 2DE
projects. It also undertakes programmes of British technical aid in
geology in developing countries as arranged by the Department
020-7589 4090
Fax 020-7584 8270
for International Development and other agencies.
020-7942 5344/45
email: bgslondon@bgs.ac.uk
The British Geological Survey is a component body of the Natural
Forde House, Park Five Business Centre, Harrier Way,
Environment Research Council.
Sowton, Exeter, Devon EX2 7HU
01392-445271
Fax 01392-445371
Geological Survey of Northern Ireland, 20 College Gardens,
Belfast BT9 6BS
028-9066 6595
Fax 028-9066 2835
Maclean Building, Crowmarsh Gifford, Wallingford,
Oxfordshire OX10 8BB
01491-838800
Fax 01491-692345
Parent Body
Natural Environment Research Council, Polaris House,
North Star Avenue, Swindon, Wiltshire SN2 1EU
01793-411500
Fax 01793-411501
www.nerc.ac.uk
Foreword
This final report is a published product of a study by the British Geological Survey (BGS) and the
Institute of Forensic Medicine, Ludwig-Maximilians-University, Munich carried out on behalf of UNIDO
as part of Project No. EG/GLO/01/G34 "Removal of Barriers to the Introduction of Cleaner Artisanal
Gold Mining and Extraction Technologies.
The report comprises (1) an Executive Summary jointly compiled by the BGS and the Institute of
Forensic Medicine, Ludwig-Maximilians-University, Munich; (2) an Assessment of the Environment in
the Rwamagasa area (BGS Commissioned Report CR/04/014R); and (3) a Medical Investigation of 250
people living in the Rwamagasa area (compiled by the Institute of Forensic Medicine, Ludwig-
Maximilians-University, Munich)
BGS Report CR/04/129 (Issue 1.0) for UNIDO Contract 03/088
i
BGS Report CR/04/129 (Issue 1.0) for UNIDO Contract 03/088
ii
Contents
Executive Summary
Part 1: Assessment of the Environment in the Rwamagasa area,
Tanzania (British Geological Survey)
Part 2: Assessment of Health in the Rwamagasa area, Tanzania
(Institute of Forensic Medicine, Ludwig-Maximilians-University, Munich)
BGS Report CR/04/129 (Issue 1.0) for UNIDO Contract 03/088
iii
BGS Report CR/04/129 (Issue 1.0) for UNIDO Contract 03/088
iv
Executive Summary
Introduction
Artisanal gold mining is one of the major sources of mercury contamination, especially in developing
countries. Whilst the gold extraction process (known as amalgamation) is a simple technology, it is
potentially very harmful to the environment and can contaminate air, soil, rivers and lakes with mercury.
The health of the miners and other people living within the area affected by mercury contamination may
be negatively affected through inhalation of mercury vapour or contaminated dusts, direct contact with
mercury, through eating fish and other food, and through the ingestion of waters and soils affected by the
mercury contamination.
In response to this problem, the Global Environmental Facility (GEF) of the UN approved funding for the
project Removal of Barriers to the Introduction of Cleaner Artisanal Gold Mining and Extraction
Technologies (also referred to as the Global Mercury Project (GMP)) in March 2002. The Global
Mercury Project was started to help demonstrate ways of overcoming barriers to the adoption of best
practices, waste minimization strategies and pollution prevention measures that limit contamination of
international waters and their associated environments.
In August 2003, the British Geological Survey (BGS), acting under the Natural Environment Research
Council, signed a contract (No. 03/088) with the United Nations Industrial Development Organization
(UNIDO) to carry out limited Environmental and Health surveys and assessments in the Rwamagasa
artisanal gold mining area in the Republic of Tanzania. Rwamagasa was selected by UNIDO as the
demonstration site for Tanzania. The environmental assessment was executed by the BGS whilst the
medical and toxicological investigations were subcontracted to the Institut für Rechtsmedizin der
Ludwig-Maximilians-Universität München, Germany. The regional health authorities in Geita supported
the medical investigations, whilst the environmental assessment was carried out in collaboration with
staff from the Geita Mines Office and from the Kigoma and Mwanza offices of the Tanzania Fisheries
Research Institute (TAFIRI), with the enthusiastic assistance of Mr Aloyce Tesha, Assistant to the
UNIDO Country Focal Point.
Rwamagasa is located in Geita District, which has an area of 7,825 km˛, 185 villages, and a population
around 712,000 (census of 2002). The number of artisanal miners in the Geita District is unknown by it is
estimated to be as many as 150,000, most of whom are illegal panners. Primary artisanal workings in the
Rwamagasa area are centred on quartz veins in sheared, ferruginous, chlorite mica schists. Grab samples
of vein and wall rock grade 6-62 g/t Au. The only legal mining in the Rwamagasa area is carried out
within the boundaries of the Primary Mining Licence held by Blue Reef Mines where approximately 150
people are involved in mining and mineral processing activities. This is the only site in the Rwamagasa
BGS Report CR/04/129 (Issue 1.0) for UNIDO Contract 03/088
area where primary ore is being mined underground. All other mineral processing activity of any
significance is concentrated at the northern margin of Rwamagasa, especially on the land sloping down to
the Isingile River. In this area, there are about 30 groups of historic and active tailings dumps and about
ten localities where small (200 litre) ball mills are operating. The number of people actively involved, at
one particular time, in ball milling, sluicing and amalgamation is probably no more than 300.
Amalgam is burned in a small charcoal fire, which releases Hg to the atmosphere. Retorts are not used.
Amalgamation mainly takes place adjacent to amalgamation ponds, which are usually formed of concrete,
but sometimes have only wood walls even though environmental legislation dictates that the Hg
contaminated mineral concentrates and tailings should be stored in concrete lined structures.
The Blue Reef Mine is reported to produce about 1 kg Au per month whereas artisanal miners re-working
tailings produce about 0.5 kg per month. On this basis, approximately 27 kg of Hg will be released to the
environment from the Rwamagasa area each year. Of this, atmospheric emissions from amalgam burning
will be about 14 kg from the Blue Reef mine site and 7 kg from the other amalgamation sites. About 2 to
3 kg Hg will remain in heavy mineral tailings in the amalgamation ponds, which are frequently
reprocessed. It is reported that the number of miners working in the Rwamagasa area was much larger in
the past, so the historical release of mercury would probably have been higher than at present.
The young and strong men, so called healthy workers, are mainly found in the bigger and more
technically equipped properties. Older people, women of all ages and children mainly work in the smaller
artisanal mining properties. Retorts are not used, neither is there any other protection, such as ventilation,
against any kind of mercury contamination. Housing areas, food stalls and the schools are located close to
the sites where amalgamation and burning of the amalgam is carried out. Mineral processing tailings
containing mercury are found within the village adjacent to cultivated land or near local water wells.
Mercury is usually stored in the miner's houses in small soft-drink bottles, near to where they and their
families sleep. The mercury is mainly obtained from Nairobi in Kenya and the gold is either used for
jewellery in Tanzania or sold to Dubai.
Hygiene standards are extremely low and are a reason for many infectious diseases such as diarrhoea,
typhoid and parasitism. There is no effective waste disposal system for either mercury, sanitary or other
domestic waste.
Road accidents, accidents in insecure tunnels and amalgamation plants, malaria, tuberculosis, and
sexually transmitted diseases including AIDS are the dominant causes of morbidity and mortality. No
special health service exists for the mining community the nearest dispensary is about 10 km away. A
local dispensary is under construction, but the construction has been stopped due to lack of money. The
village lacks social welfare services and a police post for security. The nearest district hospital is in Geita.
All non-minor illnesses have to be transferred to Geita hospital, which is adequately equipped for a
district hospital.
BGS Report CR/04/129 (Issue 1.0) for UNIDO Contract 03/088
Environmental assessment field programme
The objective of the environmental assessment was to (i) identify hotspots in the project demonstration
sites, (ii) conduct specified geochemical and toxicological studies and other field investigations in order
to assess the extent of environmental pollution in surrounding water bodies and (iii) devise intervention
measures. Although Rwamagasa is located only 37 km to the south of Lake Victoria, streams draining the
Rwamagasa `mining hotspot' actually drain SW into the Nikonga River, and then for a further 430 km via
the Moyowosi swamps and the River Malagarasi before reaching Lake Tanganyika near Ilagala, about 50
km to the SSE of Kigoma. One of the major objectives of the project is to assess the impact of mercury
contamination on international waters as well as in the vicinity of the `mining hotspot', so the field
programme was carried out in two areas: (a) the Rwamagasa `mining hotspot' sub-area and (b) the Lake
Tanganyika River Malagarasi sub-area (see Figure ES-1). Dispersion of Hg from Rwamagasa to Lake
Tanganyika is probably relatively unlikely because contaminant Hg will be adsorbed by organic material
in the extensive Moyowozi and Njingwe Swamps and flooded grassland area, located from 120 km to 350
km downstream of Rwamagasa. Whereas the swamps will act as a potential biomethylation zone, they
will also act as an environmental sink for Hg contamination, which is likely to inhibit migration of Hg
into the lower reaches of the Malagarasi River and Lake Tanganyika. The swamp area was inaccessible
within the logistical and budgetary constraints of the current project.
The environmental field programme was carried out during the dry season at which time there was little
evidence that large quantities of contaminated tailings were being washed into the Isingile River.
However, waste water and tailings from amalgamation `ponds' were observed at one site to be
overflowing onto an area where vegetables were being grown. If large quantities of Hg contaminated
tailings are dispersed onto the seasonal swamp (mbuga) area adjacent to the Isingile River during the wet
season, then this may lead to the significant dispersion of Hg both into the aquatic system and onto
agricultural sites being used for rice, maize, and vegetable cultivation.
Previous studies in the Lake Victoria Goldfields area indicate that dispersion of Hg from tailings is
relatively restricted, not least because Fe-rich laterites and seasonal swamps (mbugas) act as natural
barriers or sinks attenuating the widespread dispersion of Hg in sediments and soils.
A field programme was carried out in SeptemberOctober 2003 leading to the collection of a total of 38
water, 26 drainage sediment, 151 soil, 66 tailings, 21 vegetable and 285 fish samples. Preparation and
analysis of the samples was carried out in the UK and Canada. Analytical data for duplicate field samples,
replicate analyses and recovery data for Certified Reference Materials indicate a level of analytical
precision and accuracy that is appropriate for this type of environmental survey. Cd, Cu, Pb and Zn were
determined in drainage sediment, tailings and soil samples, in addition to Hg and As (which were
specified in the ToR and BGS's proposal) on the basis that these could be useful indicators of
mineralization and/or anthropogenic contamination. The range of chemical substances determined in the
samples collected, and the range of media sampled should not be considered to represent a comprehensive
environmental survey. In addition, the results reported here refer only to the sites sampled at the time of
BGS Report CR/04/129 (Issue 1.0) for UNIDO Contract 03/088
the survey and should not be extrapolated to infer that elevated levels of contamination are not present at
other sites or elsewhere in the district or region. The results presented reflect the level of resources
available for the environmental assessment.
Figure ES-1. Location of the River Malagarasi and Rwamagasa sub-areas in northwest Tanzania.
Nature and extent of the mercury pollution in the river system adjacent to the hot spot area
At the time of sampling, mercury in filtered drainage water samples ranged from 0.01 to 0.03 µg/L in the
R. Malagarasi and from 0.01 to 0.07 µg/L in the Rwamagasa area. None of the filtered water samples
exceeded any of the Tanzanian Water Quality Standards or other national and international water quality
standards, or criteria, for drinking water, protection of aquatic biota or the protection of human health.
Arsenic in filtered water ranged from 0.1 to 2.4 µg/L and none of the samples collected exceeded any
water quality standards or criteria.
Hg concentrations in the fine fraction of streams sediments from the River Malagarasi at Ilagala range up
to 0.65 mg/kg, which is rather high for an area that does not appear to be unduly affected by
anthropogenic contamination. Concentration of Hg in the fine fraction, together with adsorption of Hg
onto Fe and organic material, may in part explain these relatively enhanced Hg concentrations, but these
hypotheses need to be verified by further studies. Other possible sources include the geothermal springs at
Uvinza or contamination of sediment by mercuric soap, which may be used by some people for skin
lightening.
In the Rwamagasa area, Hg in the fine fraction of drainage sediments ranges from 0.08 to 2.84 mg/kg,
although Hg does not exceed the Toxic Effects Threshold (1 mg Hg/kg) of the Canadian Sediment
Quality Criteria for the Protection of Aquatic Life for more than 2 km downstream from the major
BGS Report CR/04/129 (Issue 1.0) for UNIDO Contract 03/088
mineral processing centre located to the south of the Isingile River. Toxic Effects Thresholds for As, Cd,
Cu, Pb and Zn are not exceeded in drainage sediments from the Rwamagasa area.
Environmental assessment of the "hot spot" area based on sampling of mineral processing wastes
and soils
There is little difference between mercury concentrations in samples taken from historic (dry) primary
tailings piles (mean 5 mg/kg) and samples taken from recent sluice box tailings (mean 3 mg/kg). Hg in
tailings samples from the amalgamation ponds and amalgamation pond tailings (mean 86 mg/kg) are on
average about 20 times higher. The high level of Hg in the primary and sluice box tailings is the result of
recycling/reprocessing of amalgamation pond tailings. An association between Cd-Cu-Hg-Zn probably
reflects contamination from mercury used in amalgamation combined with metals that are possibly
derived from the ball mills and galvanised roof sheets. Correlations between arsenic and iron probably
reflect the influence of trace quantities of arsenopyrite and pyrite in the gold ore. Both these hypotheses
need to be verified.
At the time of the survey, generally low concentrations of Hg occurred in most of the analyzed soils used
for cassava, maize, and rice cultivation, as well as mbuga and unclassified soils located away from the
urban centre of Rwamagasa and associated mineral processing areas. Higher concentrations are found in
urban soils and also in mbuga and vegetable plot soils adjacent to the Isingile River, close to the mineral
processing areas. Hg in the urban soils is probably mainly derived from air borne transport and deposition
of Hg released during the burning of amalgam, although this has not been verified. High Hg appears to
occur in the mbuga and vegetable plot soils where these are impacted by Hg-contaminated water and
sediment derived from mineral processing activities located on the southern side of the Isingile River. In
these soils there is a clear association between Cd-Cu-Zn, which reflects contamination from metals that
are possibly derived from the ball mills and/or galvanized roof sheets. An association between As, Cu and
Fe probably reflects the influence of the weathering products of arsenopyrite and pyrite found in the gold
ore, although this needs to be verified.
Mercury exceeds (1) the maximum permissible concentration of Hg in agricultural soil in the UK (1
mg/kg) in 12 soil samples; (2) the Canadian Soil Quality Guideline for agricultural soils (6.6 mg/kg) in
three samples; and (3) the UK soil guideline value for inorganic Hg for allotments (8 mg/kg) in two
samples.
Cadmium and zinc exceed the maximum permissible concentrations for agricultural soil in the UK (3 mg
Cd/kg and 200 mg Zn/kg) in only a few soil samples. Arsenic exceeds the Canadian Soil Quality
Guideline for agricultural soils (12 mg/kg) in nine agricultural and urban soils.
Soil profile data demonstrate that surface contamination by mineral processing waste in some agricultural
soils affects the root zone. Hoeing of the soils is likely to result in mixing of surface Hg contamination
throughout the root zone, although this has not been verified.
BGS Report CR/04/129 (Issue 1.0) for UNIDO Contract 03/088
Nature and extent of the mercury pollution in agricultural produce, especially in those being part of
the main diet
Hg in vegetable and grains samples collected from the agricultural areas potentially impacted by mercury
contamination are mainly below the detection limit of 0.004 mg/kg Hg with concentrations of 0.007 and
0.092 mg/kg Hg recorded in two yam samples and 0.035 mg/kg Hg in one rice sample. A positive
correlation between Hg in agricultural crops and soil was not detected during the present survey. Hg in
beans, onions and maize samples purchased at Rwamagasa market are below the detection limit (<0.004
mg Hg/kg) whilst two dehusked rice samples contain 0.011 and 0.131 mg/kg Hg. The concentrations of
Hg in rice are similar to those recorded in rice grown on the highly contaminated soils of the Naboc
irrigation system on the island of Mindanao in the Philippines.
Mercury in fish: biomarkers for mercury methylation and potential food sources
The main fish species used as bioindicators of mercury contamination included perch (Lates spp),
tigerfish (Brycinus spp), tilapia (Oreochromis spp), catfish (Clarias spp). Fish tissue THg data indicates
that the sites sampled in the immediate area of mining activities at Rwamagasa, are the worst affected
(Figure ES-2) and should be considered environmental `hotspots' and sites of biomethylation. Many fish
tissue samples from these sites fail export market standards (0.5 mg/kg) and also exceed the WHO
recommended standard for the protection of health of vulnerable groups (0.2 mg/kg). Mercury in fish
collected from the Nikonga River, approximately 25 km downstream from Rwamagasa, have low Hg
concentrations. This suggests that the impact of mercury contamination on aquatic biota is relatively
restricted, which is confirmed by the generally low mercury concentrations in drainage sediment and
mbuga soils at distances more than about 6 km downstream of the main mineral processing area (or
`hotspot'). However, this observation will need to be verified by more detailed studies. Fish length vs.
mercury concentration plots for fish from the River Malagarasi and Malagarasi delta area of Lake
Tanganyika (collected from Uvinza and Ilagala) confirm generally low mercury concentrations that are
similar to levels found in similar species in Lake Victoria (Figure ES-3). All fish samples collected from
the Malagarasi River area are below the WHO threshold for vulnerable groups (0.2 mg/kg). This suggests
that mercury contamination from the Rwamagasa artisanal gold mining centre does not have a significant
impact on fish stocks in either the lower reaches of the River Malagarasi or the International Waters of
Lake Tanzania.
BGS Report CR/04/129 (Issue 1.0) for UNIDO Contract 03/088
Figure ES-2. Average mercury concentration (mg/kg) in catfish (Clarias spp.), Rwamagasa area.
4.0
3.5
3.0
500 µg/kg
2.5
200 µg/kg
g/kg 2.0
µ
1.5
Log THg
Barbus and Haplochromis Pond 1 and 2
Barbus, Brycinus and Haplochromis Pond 4 and 6
1.0
Brycinus and Hydrocynus Ilagala
Lates malagarasi Ilagala
Barbus Uvinza
0.5
Lates nitolicus LVEMP
Linear (Barbus, Brycinus and Haplochromis Pond 4 and 6)
Linear (Lates nitolicus LVEMP)
0.0
0.0
0.2
0.4
0.6
0.8
1.0
1.2
1.4
1.6
1.8
-0.5
Log L cm
Figure ES-3 Hg (µg/kg) related to length (cm) in piscivorous, insectivorous and planktivorous fish from (a) the
Rwamagasa area, (b) River Malagarasi Lake Tanganyika (Ilagala, Uvinza) and (c) Lake Victoria (Lake Victoria
Environmental Management Project, Machiwa et al. 2003).
BGS Report CR/04/129 (Issue 1.0) for UNIDO Contract 03/088
Exposure to environmental mercury
None of the water samples collected from the river network, or associated drainage ponds exceeded the
WHO or local Tanzanian guideline values of 1 µg Hg/l for drinking water. Whilst this suggests that
mineral processing operations have not contaminated local surface waters and shallow groundwaters it
does not indicate whether drinking water used by the local people has been contaminated with Hg or other
non-related substances. More extensive monitoring of drinking water sources (which was not the focus of
the current investigations) should be considered as a component of any subsequent follow up work.
The only samples of filtered water collected during the survey that contained relatively high Hg
concentrations (max. 0.45 µg Hg/l) were from amalgamation ponds. This highlights the need for careful
management of waste-waters from these ponds and monitoring of any nearby drinking water supplies.
The average mercury concentration recorded for samples of rice grain grown on soils potentially
impacted by mercury contamination was 0.026 µg/g (dry wt.). Consequently, the amount of mercury
entering the body, assuming an average consumption of 300g rice/day is 0.055 mg THg/week (equivalent
to 0.46 µg MeHg/kg bw/week), which is much lower than the Provisional Tolerable Weekly Intake
(PTWI) of 0.3 mg for total mercury and 1.6 µg/kg bw/week for methyl mercury in the diet set by the
WHO and the FAO. These are likely to maximum inputs because most people in the Rwamagasa area
will consume less than 300 g rice/day because they will also consume cassava and maize, which are
generally grown on soils with low Hg. This observation needs to be verified by more detailed studies.
The vast majority of people in the Rwamagasa area principally eat Tilapia (Oreochromis spp.), Perch
(Lates spp.) and dagaa (dagan; Rastrineobola spp. and equivalents) from Lake Victoria. Catfish (Clarias
spp; kamare, mumi) is eaten by less than 10% of those people. Consumption of 250g perch, 500g tilapia
and 250g of catfish each week would result in an intake of 27 µg THg/week (equivalent to 0.35 µg
MeHg/kg bw/week) for residents of Ilagala-Uvinza area, 44 µg THg/week (equivalent to 0.58 µg
MeHg/kg bw/week) for Rwamagasa residents consuming only fish from Lake Victoria, 56 µg THg/week
(equivalent to 0.75 µg MeHg/kg bw/week) for people in the Rwamagasa background area consuming
tilapia and perch from Lake Victoria and catfish from the local streams, and 259 µg THg/week
(equivalent to 3.45 µg MeHg/kg bw/week) for people in the Rwamagasa area consuming tilapia and perch
from Lake Victoria and catfish from mining impacted streams. Apart from the latter group, these inputs
related to fish consumption are well below the WHO/FAO Provisional Tolerable Weekly Intake (PTWI)
of 300 µg for total mercury and 1.6 µg MeHg/kg bw/week in the diet. It appears that only those people
consuming catfish from the Isingile River, and other mining contaminated locations such as Tembomine,
are likely to be at risk of exceeding the PTWI for mercury.
People consuming 300g/day of rice grown on the mercury contaminated Isingile mbuga soils and 1kg of
fish from Lake Victoria would have a combined estimated MeHg input of 1.04 µg MeHg kg bw/week,
which is two thirds of the methyl mercury PTWI.
BGS Report CR/04/129 (Issue 1.0) for UNIDO Contract 03/088
Whereas it is not known whether individuals practice geophagia in the Rwamagasa area, elevated
exposures to Hg could result from the occasional deliberate and habitual consumption of contaminated
soils and dusts. For example, the Provisional Tolerable Weekly Intake (PTWI) of 0.3 mg for total
mercury in the diet set by the WHO and the FAO, which is equivalent to 26 µg THg/day for a 30kg child
would be exceeded by an individual practising geophagia (central estimate and worst-case) or on a case
by case basis by an individual occasionally consuming soil/dust (worst-case). The practice of geophagy
by pregnant females would be of particular concern in this regard given the sensitivity of the foetus to
mercury.
The inadvertent ingestion of dusts and soils even those having Hg concentrations significantly above the
regional background, and hence considered to be moderately contaminated, does not appear to lead to a
significant excess exposure to mercury. For example comparison of exposures due to inadvertent
ingestion of soils and/or dusts (0.72 to 1.8 µg THg/day or 5 to 13 µg THg/week) is typically less than
individual exposure via other dietary sources water, rice and fish.
However, given the uncertainties involved in estimating inadvertent dust and soil intake in the rural
Rwamagasa environment, exposure via this route, in addition to more classical geophagic behaviour,
should be considered when planning remedial/intervention measures. Such measures could include the
marking and fencing off of waste tips and areas of enhanced contamination and improvements in hygiene
(washing of hands and food preparation such as the drying of cassava and other crops directly on the
ground and the use of soil as a desiccant to aid the storage of groundnuts and beans). Whilst geophagy
does have an important cultural and possibly nutritional benefit, the resulting levels of potential exposure
to young adults and pregnant woman are high enough to suggest that this practice should be positively
discouraged within the mining districts. If it was demonstrated that geophagy is practiced in the
Rwamagasa area, the importation of geophagic materials into local markets from outside the
contaminated region should be encouraged and the negative effects of using local soils conveyed though
local woman's groups and childhood development officers.
Medical investigation methodology
The extraction of the gold with liquid mercury releases serious amounts of mercury, especially high toxic
mercury fumes into the local environment. The health status of 211 volunteers in Rwamagasa artisanal
gold mining area and 41 non-exposed people from a nearby control area in Katoro, located 30 km distant
from Rwamagasa was assessed with a standardised health assessment protocol from UNIDO (UNIDO
2003) by an expert team from the University of Munich, Germany in October/November 2003. The health
assessment protocol was developed by UNIDO in collaboration with the Institut für Rechtsmedizin der
Ludwig-Maximilians-Universität München, Germany and other international experts. The "Health
Assessment Questionnaire" was partly translated in Swahili to be used to examine the general health
condition of members of the mining community and to indicate symptoms of mercury poisoning. State of
BGS Report CR/04/129 (Issue 1.0) for UNIDO Contract 03/088
the art anamnestic, clinical, neurological, neuro-psychological and toxicological tests were used. All
participants were examined to identify neurological disturbances, like ataxia, tremor and coordination
problems. The data was compiled for statistical purposes and confidentiality regarding all health related
issues was maintained.
Results of the medical investigation
Mercury concentrations in the bio-monitors urine, blood and hair were significantly higher statistically in
the exposed population from Rwamagasa compared with the Katoro control group, but only some
amalgam burners showed mercury levels above the toxicological threshold limit HBM II in urine (Figure
ES-4), blood and hair. A speciation of mercury in hair demonstrates that mainly inorganic mercury
(including mercury vapour) contributes to the high body burden of the artisanal miners. Low mercury
concentrations in all bio-monitors (especially: blood) of volunteers not occupationally exposed to
mercury in Rwamagasa indicate that there is no relevant secondary exposure of humans to mercury in this
area by air, drinking water or food, especially locally caught fish.
Only a few statistically significant correlations were detected between Hg concentrations in bio-monitors
(urine, blood and hair) and anamnestic/clinical data for the amalgam-burners sub-group. Significant
correlations included those between the anamnestic data (i) "tremor at work" with Hg in urine, blood and
total Hg in hair and (ii) Hg in blood with tiredness, lack of energy, weakness, and problems with
concentration and clear thinking. The only significant correlation between a classical clinical indicator
and Hg in biomonitors was "Heel to knee tremor" with Total Hg in hair whilst significant correlations
with the "Matchbox test" were found with Hg in urine and blood. Whereas on a group basis Hg in the
target tissue (i.e. brain) correlates well with Hg in urine, blood and hair of people with significantly
different levels of occupational or environmental exposure, the poor correlations between classical
clinical indicators of mercury intoxication and Hg in bio-indicators within the group of amalgam-burners
in the present study probably reflects large inter-individual differences (i.e. an individual's biomonitor Hg
level may not directly indicate their target tissue (brain) Hg burden). In an individual who has suffered
from chronic exposure to Hg, damage to the central nervous system may have occurred months or years
before the biomonitor samples were analysed. Biomonitor data indicate an individual's recent body-
burden whereas the clinical indicators probably indicate an individual's past or cumulative Hg burden.
This would explain why the former occupationally exposed group shows a high median medical score
whilst the group's biomonitor Hg levels are only slightly elevated. When the results of individual
anamnestic, clinical and neurological tests are summed together, significant correlations exist (i) between
Hg in urine and blood with the anamnestic score and (ii) between Hg in urine and the sum of all the
anamnestic, clinical and neurological tests. It was shown that for the Rwamagasa amalgam-burner group,
which is predominantly exposed to inorganic Hg (including Hg vapour), the Hg concentration in urine is a
sound predictor for a Hg intoxication.
BGS Report CR/04/129 (Issue 1.0) for UNIDO Contract 03/088
Typical symptoms of mercury intoxication were prevalent in the exposed group. For example, combining
the medical score with the bio-monitoring results made it possible to diagnose chronic mercury
intoxication in 25 out of 99 amalgam burners, and in 3 out of 15 former amalgam burners (Figure ES-5).
Table ES-1 shows the mercury concentrations in biomonitors for the group of intoxicated amalgam
burners.
Hg-blood
Hg-Urine
T-Hg-Hair
MeHg-Hair
(µg/l)
(µg/g crea.)
(µg/g)
(µg/g)
N
25 25 20 18
median
8.6 13.2 4.1 0.77
maximum 33.3 36.8 48.7 5.25
Table ES-1: Mercury concentrations in biomonitors of the 25 intoxicated amalgam burners (in some cases hair
samples were not available)
40
30
HBM II
20
)
g crea.
10
HBM I
Lab (µg/
g
-U
H
0
N =
31
9
23
96
67
12
Katoro control group
Rwama. not occup.
Rwama. other occup.
Katoro former occup.
Rwama. amalg.-burner
Rwama. former occup.
Figure ES-4: Total mercury concentration in urine (µg Hg/g creatinine), determined in laboratory (expanded y-axis;
occup. = occupational)
BGS Report CR/04/129 (Issue 1.0) for UNIDO Contract 03/088
Diagnosis: Mercury Intoxication
30%
25%
20%
15%
10%
5%
0%
Katoro, control
group
Katoro, former
occupational
Rwamagasa, not
burdened
occupational
Rwamagasa,
burdened
amalgam-burner
Rwamagasa,
other
Rwamagasa,
occupational
former
burdened
occupational
burdened
Figure ES-5: Frequency of the diagnosis of mercury intoxication in the different sub-groups.
Within the other population groups in Rwamagasa (i.e. people not occupationally exposed to mercury)
and in the Katoro control group no cases of mercury intoxication were diagnosed. The percentage of cases
diagnosed with mercury intoxication within the amalgam burners was lower in Rwamagasa than in the
comparable small-scale gold mining area of Mt. Diwata in the Philippines, for example, where 85% of the
amalgam burners were intoxicated (Drasch 2001). The difference in the level of intoxication cannot be
explained by a different (i.e. a safer) amalgam burning technique in Rwamagasa. Moreover, it must kept
in mind, that the maximal burden (as expressed in the top mercury concentrations found in the bio-
monitors) was comparable to Mt. Diwata. The impression gained during the field programme was that
this difference might be explained just by a lower amount of mercury used for gold extraction in the
Rwamagasa area, reflecting the lower level of gold production. This results in a lower number people
exhibiting high levels of mercury intoxication.
Child labour in the Rwamagasa mining sites is very common from the age of 10. The children work and
play with their bare hands with toxic mercury. This is very important because mercury can cause severe
damage to the developing brain.
Nursed babies of amalgam burning mothers are at special risk. Extremely high mercury concentrations
were detected in two out of five breast-milk samples from nursing mothers who worked as amalgam
burners. In addition to a placental transfer of mercury during pregnancy from the mother to the foetus (as
has been proved in other studies) this high mercury burden of nursed babies should be a cause of great
concern.
BGS Report CR/04/129 (Issue 1.0) for UNIDO Contract 03/088
Poverty is the main reason for the poor health status of the small-scale mining communities. Struggling
for survival frequently makes gold mining a necessity in order to obtain financial resources. The daily
fight for survival makes the miners put their own health and the health of their children at risk.
A reduction of the release of mercury vapours from small-scale gold mining like in Tanzania into the
atmosphere should not only reduce the number of mercury intoxicated people in the mining area but it
will also reduce global atmospheric pollution, because a significant proportion of mercury vapours
formed by burning of amalgam in the open-air may be transported long-range distances (Lamborg, 2002).
The total release of mercury vapour from artisanal gold mining is currently estimated to be up to 1,000
metric tons per year (MMSD, 2002), while approximately 1.900 tons of mercury from all other
anthropogenic sources were released into the atmosphere (Pirrone, 2001).
Mercury is undoubtedly a serious health hazard in the small-scale gold mining area of Rwamagasa.
Working for many years in the amalgamation process, especially amalgam burning has resulted in severe
symptoms of mercury intoxication. The exposure of the whole community to mercury is reflected in
raised mercury levels in the urine, and the detection of the first symptoms of brain damage such as ataxia,
tremor and movement disorders. Mercury intoxication (according to the definition of UNIDO (UNIDO
2003)) was diagnosed in 25% of the amalgam burners from Rwamagasa. In addition, intoxication was
also detected in some people that had formerly worked with mercury and amalgam. People from
Rwamagasa who are not directly involved in amalgam burning, have a higher mercury burden than the
control group, although the majority of these people are not intoxicated. The background mercury burden
in the Katoro control group is the same order of magnitude as in western industrial countries.
Recommendations for monitoring water quality and biota
Monitoring is expensive and costs can be reduced if the main exposure routes are known. Hence there is a
need for a more intensive study to link exposures from various pathways to mercury levels in blood prior
to the development of monitoring or remediation strategies.
Monitoring in the environmental survey followed, as closely as was practicable, the internationally
accepted protocols recommended by UNIDO (2003). It is recommended that water monitoring be carried
out in the Rwamagasa drainage system during the wet season in order to test for mercury dispersion in
solution and in the suspended sediment. The short term and medium term temporal variation in these
pollution indicators should also be investigated.
Continuous monitoring equipment capable of determining Hg at low concentrations in drainage systems
is, as far as the authors of this report are aware, not available commercially. So any monitoring system
would be periodic rather than continuous. Quarterly monitoring will probably be adequate for the Isingile
and Nikonga Rivers for a period of two years. If no significant Hg concentrations are detected during that
period, and there are no significant changes in the amount of mineral processing and associated factors,
then annual monitoring, following the USEPA recommendations, will probably be adequate.
BGS Report CR/04/129 (Issue 1.0) for UNIDO Contract 03/088
The only effective option to prevent continuing Hg pollution of the Isingile River and surrounding
agricultural areas is to require (a) the removal of all the existing mineral processing waste currently
located close to the Isingile River and (b) the termination of all mineral processing activities in the
vicinity.
Monitoring of drinking water from wells in the Rwamagasa area was not carried out during the current
survey, but should be considered when designing any future water quality monitoring systems.
Monitoring of biota (fish and agricultural crops) has been carried out as part of the current study and
could be carried out periodically using the UNIDO sampling protocols (UNIDO, 2003), which document
procedures for the periodic monitoring of aquatic biota. Periodic monitoring of agricultural crops could
also be carried out, although the results of this study indicate that little Hg is present in most of the crops.
Due to time and funding constraints, the current study was able to sample only a relatively limited
number of sites. For this reason it is recommended that a more comprehensive survey should be carried
out, in order to verify the results presented in this study.
Recommendations for the remediation and possible rehabilitation of mercury `hot spots'
The present survey did not detect any concentrations of Hg in solution that would require remediation, as
they did not exceed water quality standards. Should future water quality monitoring detect concentrations
that require remediation, then a number of remediation technologies may be appropriate.
From a practical point of view, there would be little justification in trying to remediate and rehabilitate the
Hg contaminated bottom sediments of the Isingile River until (a) the releases of Hg contaminated mineral
processing tailings from the Rwamagasa area have been terminated, (2) the risk of future contamination
of the drainage system by progressive or catastrophic releases of Hg contaminated processing waste has
been eradicated. It is, however, relatively unlikely that the tailings piles located adjacent and to the south
of the Isingile are a potential source of catastrophic contamination as the waste piles are relatively small
and the slopes are relatively gentle. However, both (i) the highly contaminated amalgamation pond
tailings and (ii) the primary and sluice box tailings that have been contaminated with mercury as a result
of reprocessing the amalgamation pond tailings are probably the main source of potential mercury
contamination in the Rwamagasa area and dispersal of these tailings needs to be avoided. Removal of the
tailings to a safe containment facility, underlain and covered with lateritic material (hydrous ferric oxides)
should be considered. As far as the authors are aware, no clean-up goals for mercury have been set in
Tanzania, although this needs to be verified.
The principal remediation-rehabilitation options for Hg-contaminated soils and sediments in the Isingile
River Rwamagasa area include (i) excavation of Hg-contaminated soil and disposal to an off-site secure
landfill or depository, (ii) electroleaching, comprising wet extraction followed by electrolytic preparation
of the leachate is an emerging and potential alternative cleanup method that is reported to offer a cheaper
BGS Report CR/04/129 (Issue 1.0) for UNIDO Contract 03/088
and more environmentally friendly alternative to thermal treatment or the acid leaching process. The cost
of these potential remediation options has not been estimated.
Specific practical remediation measures cannot be recommended until a much more detailed assessment
has been made of Hg concentrations in the agricultural soils, their uptake by crops and transfer into the
human food chain. On the basis of evidence collected during this survey, it appears that significant
amounts of mercury are not adsorbed into the grain of the agricultural plants. If this can be confirmed by
more detailed site specific studies (involving further collection and analysis of soil and rice grain samples
from exactly the same sites, for example) it may be possible to confirm that there is little or no potential
for a direct negative impact on human health caused by the consumption of rice and other crops grown on
these relatively high Hg soils. Mercury uptake by other crops (such as maize or cassava) grown on soils
that are currently used for rice should also be evaluated in case such a change in agricultural practices
would increase the potential exposure of the local population.
Recommendations for reduction of the release of mercury into the environment
The exposure to mercury for the miners and the community has to be drastically decreased. Proper mining
techniques to reduce the accidents and mercury exposure are essential. Small-scale miners need all
possible support to introduce cleaner and safer gold mining and extraction technologies.
The Local Mines Office in Geita needs to ensure that the small scale miners follow relevant mining and
environmental regulations and approved practices, such as making sure that all amalgamation is carried
out in cemented ponds and that all tailings from these amalgamation ponds are stored in appropriate
cemented storage areas that prevent dispersal of mercury contamination onto adjacent land and into water
courses.
Exposure to mercury vapour is avoidable with the application of simple technological improvements such
as retorts. Technical solutions need to go hand in hand with awareness raising campaigns.
An alliance of local, regional, governmental and intergovernmental bodies is needed to improve the
social, health and environmental situation of artisanal small-scale gold miners. Cooperation between
health and environmental sectors is needed on local, regional, national and intergovernmental level; for
example, UNIDO and WHO in Dar es Salaam could form a nucleus of a national mercury task force.
Recommendations for reduction of mercury as a health hazard
The clinical testing and laboratory results indicate that mercury is a major health hazard in the
Rwamagasa area especially for those artisanal miners who burn amalgam. A lower, but significant, level
of Hg intoxication is observed in those residents of Rwamagasa who have no occupational exposure.
In order to reduce the level of risk from mercury it is suggested that:
BGS Report CR/04/129 (Issue 1.0) for UNIDO Contract 03/088
1. Child labour with highly toxic substances must be stopped immediately. Legal restrictions on
child labour need to be implemented immediately.
2. Women of childbearing age need special information campaigns on the risk of mercury to the
foetus and the nursed baby and advice on how to avoid, or at least reduce, exposure.
3. Participants in the medical assessment diagnosed with mercury intoxication need medical
treatment. A system is required for the diagnosis and treatment of mercury related health-
problems. Capacity building, including establishing laboratory facilities to analyse mercury in
human specimens is required. The financial aspect of treatment and the legal problem of
importing drugs (such as chelating agents like DMPS or DMSA, required to remove mercury
from the body) need to be solved. Funding of preventive campaigns and for treatment facilities is
now needed.
4. Training programs for the health care providers in the district in Geita and other health centres in
mining areas is required to raise awareness of mercury as a health hazard and advise people how
they can reduce their own and their children's environmental and occupational exposure to
mercury.
5. Clinical training of local health workers, including the use of a standardised questionnaire and
examination flow scheme (MES = mercury examination score). Particular attention needs to be
paid to collecting information on individual's environmental and occupational exposure as this
will aid the detailed assessment of exposure routes and the design of strategies that will help to
reduce mercury exposure.
6. A mobile "mercury ambulance" might ensure that small-scale miners can be reached more
efficiently than from a permanent local health office. A "mercury ambulance" equipped with the
necessary medical and laboratory utensils bus could be driven into the artisanal mining areas.
Two or three specially trained doctors or nurses could perform the examinations, and begin to
carry out treatment. The ambulance could also be used for health awareness programs (e.g. video
equipment). Miners in remote areas might welcome evening entertainment and soccer videos
might attract more miners to the "mercury ambulance", than much other information material.
Sponsors could be sought for a "mercury ambulance", which could be based on a truck or bus
chassis.
Recommendations to increase awareness of the risks of mercury
(a) Assess in a different study design the possibility of mercury related birth and growth defects,
increased abortion/miscarriage rates, infertility problems, learning difficulties in childhood or other
neuro-psychological problems related to occupational and/or environmental mercury exposure.
BGS Report CR/04/129 (Issue 1.0) for UNIDO Contract 03/088
(b) Assess in a more detailed study the possible transfer of mercury from the environment to, mother to
child via breast-milk and related possible adverse health effects. Females at childbearing age and before
urgently require more awareness to refrain from amalgam burning, at least during pregnancy and nursing.
If this is not possible, a discussion whether to provide them with milk powder and high purity drinking
water together with training them to prepare hygienically appropriate formula food for their babies needs
to be based on a larger data base and a different epidemiological approach.
(c) Assess the relative importance of the main potential sources of exposure for people in Rwamagasa
who are not occupationally exposed to mercury (i.e. airborne Hg-vapour; ingestion of Hg-contaminated
dust through hand-to-mouth contact or on unwashed or inadequately washed food; ingestion of locally
grown Hg-contaminated crops; Hg-contaminated fish from local streams; deliberate occasional or
habitual consumption of soil (geophagia)). This has not been evaluated adequately and requires further
integrated investigation by a team of environmental, public health, medical and toxicological specialists.
Recommendations for improvement of general health.
Poverty is considered to be the main reason for most of the health and environmental problems in the
Rwamagasa area. At the moment it does not seem to be acceptable that children live in Rwamagasa
because of inadequate sanitary standards and high exposure to mercury. The improvement of sanitary
standards is needed urgently.
The relative occupational health risks of mining should be assessed in more detail (accidents, malaria,
drinking water quality, sexually transmitted diseases, tuberculosis, HIV / AIDS). One option to reduce the
health hazards in Rwamagasa might be a proper zoning into industrial areas, commercial areas and
housing areas. The imposition of basic hygienic standards, such as proper drinking water and reduction of
Anopheles mosquitoes would also lead to an improvement in the health of the local people. Raising safety
awareness and the introduction of appropriate mining techniques (such as better tunnel safety) will help to
reduce the risk of accidents at mining sites. The risk of sexually transmitted diseases could be reduced if
campaigns for safer sex were more effective. An appropriate health service is urgently required to
improve the health status of the Rwamagasa community.
References
Drasch G, Boese-O'Reilly S, Beinhoff C, Roider G, Maydl S. 2001. The Mt. Diwata study on the
Philippines 1999 - assessing mercury intoxication of the population by small scale gold mining. Science
of the Total Environment 267, 151-168
BGS Report CR/04/129 (Issue 1.0) for UNIDO Contract 03/088
Lamborg CH, Fitzgerald WF, O'Donnell J, Torgersen T. 2002 A non-steady-state compartment model of
global-scale mercury biogeochemistry with interhemispheric gradients. Geochim Cosmochim Acta
66:1105-1118.
MMSD, 2002. Breaking New Ground: Mining, Minerals, and Sustainable Development. International Institute for
Environment and Development. Earthscan Publications Ltd, London, UK. As available at
http://www.iied.org/mmsd/finalreport/index.html per September 2002.
Pirrone N, Munthe J, Barregĺrd L, Ehrlich HC, Petersen G, Fernandez R, Hansen JC, Grandjean P, Horvat M, Steinnes E,
Ahrens R, Pacyna JM, Borowiak A, Boffetta P, Wichmann-Fiebig M. 2001. Ambient Air Pollution by Mercury (Hg)
Position Paper. Office for Official Publications of the EC. (available on
http://europa.eu.int/comm/environment/air/background.htm#mercury).
UNIDO, 2003. Protocols for Environmental and Health Assessment of Mercury Released by Artisanal and Small-
Scale Gold Miners. UNIDO, Vienna.
BGS Report CR/04/129 (Issue 1.0) for UNIDO Contract 03/088
Part 1
Assessment of the Environment in the Rwamagasa
area, Tanzania
by
British Geological Survey
BGS Report CR/04/129 (Issue 1.0) for UNIDO Contract 03/088
BGS Report CR/04/129 (Issue 1.0) for UNIDO Contract 03/088


Final Report for Assessment of
Environment in the Rwamagasa
area, Tanzania. UNIDO Project
EG/GLO/01/G34.
Environmental Protection Programme
Commissioned Report CR/04/014R
BGS Report CR/04/129 (Issue 1.0) for UNIDO Contract 03/088
BGS Report CR/04/129 (Issue 1.0) for UNIDO Contract 03/088
BRITISH
GEOLOGICAL
SURVEY
COMMISSIONED REPORT CR/04/014R
Final Report for Assessment of
Environment in the Rwamagasa area,
Tanzania. UNIDO Project
EG/GLO/01/G34.
J D Appleton, H Taylor, T R Lister & B Smith
Key words
Mercury, Tanzania, Rwamagasa,
Artisanal, Gold, Mining.
Front cover
Cover picture Sluicing &
amalgamation site in the centre
of Rwamagasa village.
Bibliographical reference
APPLETON, J D, TAYLOR H.,
LISTER T R & SMITH, B.
2004. Final Report for
Assessment of Environment in
the Rwamagasa area, Tanzania.
UNIDO Project
EG/GLO/01/G34. British
Geological Survey
Commissioned Report,
CR/04/014R. 159 pp.
© NERC 2004
Keyworth, Nottingham British Geological Survey 2004
BGS Report CR/04/129 (Issue 1.0) for UNIDO Contract 03/088
BRITISH GEOLOGICAL SURVEY
The full range of Survey publications is available from the BGS
Keyworth, Nottingham NG12 5GG
Sales Desks at Nottingham and Edinburgh; see contact details
0115-936 3241
Fax 0115-936 3488
below or shop online at www.thebgs.co.uk
e-mail: sales@bgs.ac.uk
The London Information Office maintains a reference collection
www.bgs.ac.uk
of BGS publications including maps for consultation.
Shop online at: www.thebgs.co.uk
The Survey publishes an annual catalogue of its maps and other
Murchison House, West Mains Road, Edinburgh EH9 3LA
publications; this catalogue is available from any of the BGS Sales
Desks.
0131-667 1000
Fax 0131-668 2683
e-mail: scotsales@bgs.ac.uk
The British Geological Survey carries out the geological survey of
Great Britain and Northern Ireland (the latter as an agency
London Information Office at the Natural History Museum
service for the government of Northern Ireland), and of the
(Earth Galleries), Exhibition Road, South Kensington, London
surrounding continental shelf, as well as its basic research
SW7 2DE
projects. It also undertakes programmes of British technical aid in
geology in developing countries as arranged by the Department
020-7589 4090
Fax 020-7584 8270
for International Development and other agencies.
020-7942 5344/45
email: bgslondon@bgs.ac.uk
The British Geological Survey is a component body of the Natural
Forde House, Park Five Business Centre, Harrier Way,
Environment Research Council.
Sowton, Exeter, Devon EX2 7HU
01392-445271
Fax 01392-445371
Geological Survey of Northern Ireland, 20 College Gardens,
Belfast BT9 6BS
028-9066 6595
Fax 028-9066 2835
Maclean Building, Crowmarsh Gifford, Wallingford,
Oxfordshire OX10 8BB
01491-838800
Fax 01491-692345
Parent Body
Natural Environment Research Council, Polaris House,
North Star Avenue, Swindon, Wiltshire SN2 1EU
01793-411500
Fax 01793-411501
www.nerc.ac.uk
BGS Report CR/04/129 (Issue 1.0) for UNIDO Contract 03/088
Foreword
This draft final report is an interim published product of a study by the British Geological Survey (BGS)
carried out on behalf of UNIDO as part of Project No. EG/GLO/01/G34 "Removal of Barriers to the
Introduction of Cleaner Artisanal Gold Mining and Extraction Technologies.
Acknowledgements
A large number of individuals contributed to the planning and execution of the field programme. In
addition to the collection of data, many individuals have freely given their advice, and provided the local
knowledge so important to the effective execution of the field programme.
The assistance of the UNIDO (Vienna) Coordinating Unit staff, Dr Christian Beinhoff, Dr Marcello
Veiga, Ludovic Bernaudat, and M. Latrech is gratefully acknowledged. The completion of the field
programme in Tanzania would not have been possible without the assistance of Felix Ugbor (UNIDO
Country Representative), Victor Akim (National Programme Officer), William Smith (UNIDO driver).
Fish sampling in the Kigoma area was greatly assisted by the Tanzania Fisheries Institute (TAFIRI)
Centre Director Mr D Chitamweba and technician Mr Kashushu. Fish sampling in the Rwamagasa area
was carried out with the assistance and advice of Dr Oliva Mkumbo, technician Wabeya and driver Miko.
TAFIRI (Mwanza) loaned the project a Land Rover to assist with the fish-sampling programme. Geita
Mines Officer Mr John Nayopa provided advice and assistance with obtaining an export permit for the
environmental samples whilst technicians Kulwa Kabadi and Joseph Manaku assisted with the field-
sampling programme. Rwamagasa Village Executive Officer, Mr Doto Kaparatus ensured good
collaboration from the miners and farmers.
Advice on mercury contamination and artisanal gold mining was kindly provided by the following
individuals during a series of meetings held in Dar es Salaam and Mwanza: Mr Gray L Mwakalukwa
(Commissioner for Minerals and UNIDO Country Focal Point); Mr M Z Mraba (Zonal Mines Officer,
Mwanza); Professor Yunus D Mgaya and Dr John F Machiwa (Faculty of Aquatic Sciences and
Technology, University of Dar es Salaam); Dr Ben Ngatunga (Deputy Director, Tanzania Fisheries
Research Institute, TAFIRI, Kyela); Dr Diamantino P Azevedo, John Bomani and Manfred Akstinat
(Southern and Eastern Africa Mineral Centre SEAMIC); Samuel Msangi (Principal Environmental
Management Officer) and Mr Mwaipopo (Directorate of Environmental Compliance & Enforcement,
National Environment Management Council, NEMC); Ms Kisanga (Department of the Environment,
Vice Presidents Office) and Emmanuel W Jengo (Executive secretary, Tanzania Chamber of Mines).
Professor Mruma (Head of the Geology Department, University of Dar es Salaam) kindly provided nitric
acid and deionised water as well as advice on past and current research activities carried out by staff in his
BGS Report CR/04/129 (Issue 1.0) for UNIDO Contract 03/088
i
Department. Dr F K Mwanisi, District Medical Officer, Geita kindly agreed to collaborate with the
Medical assessment being carried out by sub-contractors led by Prof Gustav Drasch, University of
Munich, Germany. Mr Korodias Shoo (Environment Officer) and Mr Graeme McIlveen (Manager,
Safety, health & Environment) at Geita Mine are thanked for permitting project staff to store fish, water,
and sediment samples in the Environment Dept. fridge and freezer.
Last, but not least, the BGS would like to acknowledge with gratitude the enthusiastic assistance, advice
and cooperation of Mr Aloyce Tesha, Assistant to the Country Focal Point, before, during and after the
field programme. The project driver, Omar S Makulu, is thanked for his skilful and careful driving.
The advice and assistance of Mark Allen and colleagues, BGS (sediment, soil and tailings sample
preparation), Barbara Vickers, BGS (water analysis), Andrew Scott, Laboratory Manager Environment,
Direct Laboratory Services Ltd., Wolverhampton, UK (fish and vegetable analysis), Rick McCaffrey,
Clarence Leong and Wai Szeto, ACME Analytical Laboratories, Vancouver, Canada (soil, sediment and
tailings analysis) is gratefully acknowledged. The report was edited by Professor Barry Smith (BGS,
Environment Protection Programme Manager) and Dave Holmes (BGS, Head of Environment and
Hazards Directorate).
BGS Report CR/04/129 (Issue 1.0) for UNIDO Contract 03/088
ii
Contents
Foreword .......................................................................................................................................................i
Acknowledgements.......................................................................................................................................i
Contents...................................................................................................................................................... iii
Summary ......................................................................................................................................................1
1
Introduction .........................................................................................................................................1
2
Background ..........................................................................................................................................4
2.1 Introduction .................................................................................................................................4
2.2 River Malagarasi .........................................................................................................................5
2.3 Rwamagasa .................................................................................................................................7
3
Sampling and analytical methods.....................................................................................................10
3.1 Sampling ...................................................................................................................................10
3.1.1
Drainage sediment and water ............................................................................................... 10
3.1.2
Mineral processing waste (Tailings)..................................................................................... 12
3.1.3
Soil........................................................................................................................................ 15
3.1.4
Crops..................................................................................................................................... 17
3.1.5
Fish ....................................................................................................................................... 18
3.2 Sample preparation and analysis ...............................................................................................23
3.2.1
Water .................................................................................................................................... 23
3.2.2
Sediments, tailings and soils................................................................................................. 24
3.2.3
Fish and vegetables............................................................................................................... 27
4
Mercury in water, sediment, tailings, soil, crops and fish..............................................................30
4.1 Water .........................................................................................................................................30
4.2 Drainage sediment.....................................................................................................................33
4.3 Mineral processing waste material (Tailings) ...........................................................................38
4.4 Soil ............................................................................................................................................42
BGS Report CR/04/129 (Issue 1.0) for UNIDO Contract 03/088
iii
4.5 Agricultural crops......................................................................................................................50
4.6 Fish............................................................................................................................................52
4.6.1
Introduction .......................................................................................................................... 52
4.6.2
Results by site and species.................................................................................................... 54
4.6.3
Length mercury relationships ............................................................................................ 59
4.6.4
Summary............................................................................................................................... 62
5
Exposure to Environmental Mercury..............................................................................................63
5.1 Drinking Water..........................................................................................................................63
5.2 Foodstuffs..................................................................................................................................64
5.2.1
Locally produced rice, maize, cassava and vegetables......................................................... 64
5.2.2
Fish ....................................................................................................................................... 65
5.3 Inadvertent and deliberate ingestions of soil and dust ..............................................................67
5.3.1
Inadvertent ingestion of small quantities of soil and dust .................................................... 68
5.3.2
Occasional deliberate consumption of soil and dust (pica) .................................................. 69
5.3.3
Geophagia............................................................................................................................. 69
5.3.4
Predicted Exposures from soil/dust ingestion....................................................................... 70
5.3.5
Discussion and conclusions .................................................................................................. 71
6
Monitoring systems for water quality and biota.............................................................................72
6.1 Water quality.............................................................................................................................72
6.1.1
Introduction .......................................................................................................................... 72
6.1.2
Monitoring of water quality in the Nikonga River system ................................................... 75
6.2 Biota ..........................................................................................................................................78
7
Measures for the remediation and possible rehabilitation of the "hot spot" ...............................79
7.1 River system..............................................................................................................................79
7.1.1
Water .................................................................................................................................... 79
7.1.2
Sediment ............................................................................................................................... 79
7.2 Soil ............................................................................................................................................80
8
Role of government departments, the mining industry and research institutions.......................84
8.1 Ministry of Energy and Minerals ..............................................................................................84
BGS Report CR/04/129 (Issue 1.0) for UNIDO Contract 03/088
iv
8.2 National Environment Management Council............................................................................86
8.3 Department of the Environment................................................................................................86
8.4 United Nations Industrial Development Organisation ..............................................................87
8.5 University of Dar es Salaam......................................................................................................87
8.6 Tanzania Fisheries Research Institute .......................................................................................87
8.7 Southern and Eastern African Mineral Centre ..........................................................................88
8.8 Lake Victoria Environmental Management Project (LVEMP).................................................88
9
Summary and recommendations......................................................................................................89
9.1 Sample preparation and analysis ...............................................................................................89
9.2 Mercury in water sediment, tailings, soil, crops and fish..........................................................90
9.3 Exposure to environmental mercury .........................................................................................91
9.4 Monitoring systems for water quality and biota........................................................................93
9.5 Measures for the remediation and possible rehabilitation of mercury `hot spots' ....................94
10 References...........................................................................................................................................96
Appendix 1 ...............................................................................................................................................102
Terms of Reference ...........................................................................................................................102
Appendix 2 ...............................................................................................................................................107
Table A-2-1 Fish data: species, dimensions, location and sample type.............................................107
Appendix 3 ...............................................................................................................................................113
Table A-3-1 Replicate analyses of sediment, tailings and soil samples ............................................113
Table A-3-1 Replicate analyses of sediment, tailings and soil samples (contd)................................114
Table A-3-2 Analytical and precision (RPD) data for soil and tailings duplicate samples ...............115
Table A-3-3 Analytical data for duplicate sediment samples............................................................117
Table A-3-4 Replicate analytical data for ACME Internal Standard DS51 .......................................117
Table A-3-5 Comparison of Hg determinations by BGS and ACME ...............................................118
Table A-3-6 Hg CV-AAS data for ACME Internal Standard DS5 ...................................................118
Table A-3-7 Hg results for standard reference materials BCR 422 (Cod muscle) and BCR-060
(Lagarosiphon major (Aquatic plant)). .............................................................................................119
Table A-3-8 Analytical precision (%Relative Percent Difference, %RPD) for fish and vegetable
samples ..............................................................................................................................................120
BGS Report CR/04/129 (Issue 1.0) for UNIDO Contract 03/088
v
Table A-3-9 Combined sampling and analytical precision (Relative Percent Difference) for duplicate
fish samples .......................................................................................................................................121
Appendix 4 ...............................................................................................................................................122
Table A-4-1 Rwamagasa, sediment, soil and tailings samples: location and analytical data ............122
Table A-4-2 Ilagala-Uvinsa sediment samples: location and analytical data ....................................127
Table A-4-3 Hg (µg/L) in filtered water samples, Rwamagasa area .................................................127
Table A-4-4 Hg (µg/L) in filtered water samples, Kigoma area .......................................................128
Table A-4-5 As (µg/L) in filtered water samples, Rwamagasa area .................................................128
Appendix 5
: PLATES........................................................................................................................129
BGS Report CR/04/129 (Issue 1.0) for UNIDO Contract 03/088
vi
Summary
Introduction
Artisanal gold mining is one of the major sources of mercury contamination, especially in developing
countries. Whereas the gold extraction process (known as amalgamation) is a simple technology, it is
potentially very dangerous and contaminates the air, soil, rivers and lakes with mercury. The health of the
miners and other people living within the area affected by mercury contamination may be negatively
affected through inhalation of mercury vapour, direct contact with mercury and through eating fish and
other food affected by the mercury contamination.
In response to this problem, the Global Environmental Facility (GEF) of the UN approved funding for the
project Removal of Barriers to the Introduction of Cleaner Artisanal Gold Mining and Extraction
Technologies1 (also referred to as the Global Mercury Project (GMP)) in March 2002. The Global
Mercury Project was started to help demonstrate ways of overcoming barriers to the adoption of best
practices, waste minimization strategies and pollution prevention measures that limit contamination of the
international waters environment.
In August 2003, the British Geological Survey (BGS), acting under the Natural Environment Research
Council, signed a contract (No. 03/088) with the United Nations Industrial Development Organization
(UNIDO) to carry out limited Environmental and Health surveys and assessments in the Rwamagasa
artisanal gold mining area in the Republic of Tanzania. Rwamagasa2 was selected by UNIDO as the
demonstration site for Tanzania. The environmental assessment, to which this report refers, was executed
by the BGS whilst the medical assessment was subcontracted to the Institut für Rechtsmedizin der
Ludwig-Maximilians-Universität München, and is the subject of separate reports.
The Environmental Assessment reported here is part fulfilment of the project's objectives to (i) identify
hotspots in the project demonstration sites, (ii) conduct specified geochemical and toxicological studies
and other field investigations in order to assess the extent of environmental pollution in surrounding water
bodies and (iii) devise intervention measures. The general scope of the Environmental Assessment is
given in the Terms of Reference (Appendix 1). The methodology, approach and work plan are detailed in
the BGS Proposal dated 25 February 2003, as clarified by e-mail messages of 7 April 2003, which the
1 http://www.gefweb.org/Documents/Project_Proposals_for_Endorsem/PP_Archives/Global_-
_Gold_Mining_project.pdf
2 printed as Lwamgasa on the 1:50,000 scale Busanda (Sheet 46/1) topographic map; also named elsewhere as
Ruamagaza and Rwamagaza.
BGS Report CR/04/129 (Issue 1.0) for UNIDO Contract 03/088
vii
BGS submitted to UNIDO in response to UNIDO's Request for Proposal No. P.2003/007 of 23 January
2003. Although Rwamagasa is located only 37 km to the south of Lake Victoria, streams draining the
Rwamagasa `mining hotspot' actually drain SW into the Nikonga3 River, and then for a further 430 km
via the Moyowosi swamps and the River Malagarasi before reaching Lake Tanganyika near Ilagala, about
50 km to the SSE of Kigoma. One of the major objectives of the project is to assess the impact of mercury
contamination on International waters as well as in the vicinity of the `mining hotspot', so the field
programme was carried out in two areas: (a) the Rwamagasa `mining hotspot' sub-area and (b) the Lake
Tanganyika River Malagarasi sub-area.
This final report is the second report for a study by the British Geological Survey (BGS) carried out on
behalf of UNIDO as part of Project No. EG/GLO/01/G34 "Removal of Barriers to the Introduction of
Cleaner Artisanal Gold Mining and Extraction Technologies".
Field programme
A field programme was carried out in SeptemberOctober 2003 leading to the collection of a total of 38
water, 26 drainage sediment, 151 soil, 66 tailings, 21 vegetable and 285 fish samples. Preparation and
analysis of the samples was carried out in the UK and Canada. Analytical data for duplicate field samples,
replicate analyses and recovery data for Certified Reference Materials indicate a level of analytical
precision and accuracy that is appropriate for this type of environmental survey. Cd, Cu, Pb and Zn were
determined in drainage sediment, tailings and soil samples, in addition to Hg and As (which were
specified in the ToR and BGS's proposal) on the basis that these could be useful indicators of
mineralization and/or anthropogenic contamination. The elements determined in the samples collected
should not be considered to represent a comprehensive environmental survey. In addition, the results
reported here refer only to the sites sampled at the time of the survey and should not be extrapolated to
infer that elevated levels of contamination are not present at other sites or elsewhere in the district or
region. The results presented reflect the level of resources available for the environmental assessment.
Nature and extent of the mercury pollution in the river system adjacent to the hot spot area
At the time of sampling, mercury in filtered drainage water samples ranged from 0.01 to 0.03 µg/L in the
R. Malagarasi and from 0.01 to 0.07 µg/L in the Rwamagasa area. None of the filtered water samples
exceeded any of the Tanzanian Water Quality Standards or other national and international water quality
standards, or criteria, for drinking water, protection of aquatic biota or the protection of human health.
3 printed as Nyikonga on the 1:50,000 scale Busanda (Sheet 46/1) topographic map; Nikonga was the spelling
verified for the geological maps printed by the Mineral Resources Division, Tanzania.
BGS Report CR/04/129 (Issue 1.0) for UNIDO Contract 03/088
viii
Arsenic in filtered water ranged from 0.1 to 2.4 µg/L and none of the samples collected exceeded any
water quality standards or criteria.
Hg concentrations in the fine fraction of streams sediments from the River Malagarasi at Ilagala range up
to 0.65 ppm, which is rather high for an area that does not appear to be unduly affected by anthropogenic
contamination. Concentration of Hg in the fine fraction, together with adsorption of Hg onto Fe and
organic material, may in part explain these relatively enhanced Hg concentrations, but these hypotheses
need to be verified by further studies. Other possible sources include the geothermal springs at Uvinza or
contamination of sediment by mercuric soap used for skin lightening.
In the Rwamagasa area, Hg in the fine fraction of drainage sediments ranges from 0.08 to 2.84 ppm,
although Hg does not exceed the Toxic Effects Threshold (1 ppm) of the Canadian sediment Quality
Criteria for the Protection of Aquatic Life for more than 2 km downstream from the major mineral
processing centre located to the south of the Isingile River. Toxic Effects Thresholds for As, Cd, Cu, Pb
and Zn are not exceeded in drainage sediments from the Rwamagasa area.
Environmental assessment of the "hot spot" area based on sampling of mineral processing waste
and soils
There is little difference between mercury concentrations in samples taken from historic (dry) tailings
piles (mean 5 ppm) and samples taken from recent sluice box tailings (mean 3 ppm). Hg in tailings
samples from the amalgamation ponds and amalgamation pond tailings (mean 86 ppm) are on average
about 20 times higher. An association between Cd-Cu-Hg-Zn probably reflects contamination from
mercury used in amalgamation combined with metals that are possibly derived from the ball mills and
galvanised roof sheets. Correlations between arsenic and iron probably reflect the influence of trace
quantities of arsenopyrite and pyrite in the gold ore. Both these hypotheses need to be verified.
At the time of the survey, generally low concentrations of Hg occurred in most of the analyzed soils used
for cassava, maize, and rice cultivation, as well as mbuga and unclassified soils located away from the
urban centre of Rwamagasa and associated mineral processing areas. Higher concentrations are found in
urban soils and also in mbuga and vegetable plot soils adjacent to the Isingile River, close to the mineral
processing areas. Hg in the urban soils is probably mainly derived from air borne transport and deposition
of Hg released during the burning of amalgam, although this has not been verified. High Hg appears to
occur in the mbuga and vegetable plot soils where these are impacted by Hg-contaminated water and
sediment derived from mineral processing activities located on the southern side of the Isingile River. In
these soils there is a clear association between Cd-Cu-Zn, which reflects contamination from metals that
are possibly derived from the ball mills and/or galvanized roof sheets. An association between As, Cu and
Fe probably reflects the influence of the weathering products of arsenopyrite and pyrite found in the gold
ore, although this needs to be verified.
BGS Report CR/04/129 (Issue 1.0) for UNIDO Contract 03/088
ix
Mercury exceeds (1) the maximum permissible concentration of Hg in agricultural soil in the UK (1
mg/kg) in 12 soil samples; (2) the Canadian Soil Quality Guideline for agricultural soils (6.6 mg/kg) in
three samples; and (3) the UK soil guideline value for inorganic Hg for allotments (8 mg/kg; Environment
Agency, 2002) in two samples.
Cadmium and zinc exceed the maximum permissible concentrations for agricultural soil in the UK (3 mg
Cd/kg and 200 mg Zn/kg) in only a few soil samples. Arsenic exceeds the Canadian Soil Quality
Guideline for agricultural soils (12 mg/kg) in nine agricultural and urban soils.
Soil profile data demonstrate that surface contamination by mineral processing waste in some agricultural
soils affects the root zone. Hoeing of the soils is likely to result in mixing of surface Hg contamination
throughout the root zone, although this has not been verified.
Evaluate the nature and extent of the mercury pollution in agricultural produce, especially in those
being part of the main diet
Hg in vegetable and grains samples collected from the agricultural areas potentially impacted by mercury
contamination are mainly below the detection limit of 0.004 ppm Hg with concentrations of 0.007 and
0.092 ppm Hg recorded in two yam samples and 0.035 ppm Hg in one rice sample. A positive correlation
between Hg in agricultural crops and soil was not detected during the present survey. Hg in beans, onions
and maize samples purchased at Rwamagasa market are below the detection limit (<0.004 mg Hg/kg)
whilst two dehusked rice samples contain 0.011 and 0.131 ppm Hg. The concentrations of Hg in rice are
similar to those recorded in rice grown on the highly contaminated soils of the Naboc irrigation system,
Mindanao.
Mercury in fish: biomarkers for mercury methylation and potential food sources
The fish tissue THg data indicates that the sites sampled in the immediate area of mining activities at
Rwamagasa, are the worst affected and should be considered environmental `hotspots' and sites of
biomethylation. Many fish tissue samples from these sites fail export market standards (0.5 ppm) and also
exceed the WHO recommended standard for the protection of health of vulnerable groups (0.2 ppm).
Mercury in fish collected from the Nikonga River, approximately 25 km downstream from Rwamagasa,
have low Hg concentrations. This suggests that the impact of mercury contamination on aquatic biota is
relatively restricted, which is confirmed by the generally low mercury concentrations in drainage
sediment and mbuga soils at distances more than about 6 km downstream of the main mineral processing
area (or `hotspot'). However, this observation will need to be verified by more detailed studies. Fish from
the River Malagarasi and Malagarasi delta area of Lake Tanganyika collected from Uvinza and Ilagala are
generally low and similar to mercury concentrations found in similar species in Lake Victoria. All fish
samples collected from the Malagarasi are below the WHO threshold for vulnerable groups (0.2 ppm).
BGS Report CR/04/129 (Issue 1.0) for UNIDO Contract 03/088
x
Exposure to environmental mercury
None of the water samples collected from the river network, or associated drainage ponds exceeded the
WHO or local Tanzanian guideline values of 1 µg/l Hg for drinking water. Whilst this suggests that
mineral processing operations have not contaminated local surface waters and shallow groundwaters it
does not indicate whether drinking water used by the local people has been contaminated. More extensive
monitoring of drinking water sources (which was not the focus of the current investigations) should be
considered as a component of any subsequent follow up work.
The only samples of water collected during the survey that contained relatively high Hg concentrations
(max. 0.45 µg Hg/l) were from amalgamation ponds. This highlights the need for careful management of
waste waters from these ponds and monitoring of any nearby drinking water supplies.
The average mercury concentration recorded for samples of rice grain grown on soils potentially
impacted by mercury contamination was 0.026 µg/g (dry wt.). Consequently, the amount of mercury
entering the body, assuming an average consumption of 300g rice/day is 0.055 mg THg/week (equivalent
to 0.46 µg MeHg/kg bw/week), which is much lower than the Provisional Tolerable Weekly Intake
(PTWI) of 0.3 mg for total mercury and 1.6 µg/kg bw/week for methyl mercury in the diet set by the
WHO and the FAO. These are likely to maximum inputs because most people in the Rwamagasa area
will consume less than 300 g rice/day because they will also consume cassava and maize, which are
generally grown on soils with low Hg. This observation needs to be verified by more detailed studies.
The vast majority of people in the Rwamagasa area principally eat Tilapia (Oreochromis spp.), Perch
(Lates spp.) and dagaa (dagan; Rastrineobola spp. and equivalents) from Lake Victoria. Catfish (Clarias
spp; kamare, mumi) is eaten by less than 10% of those people. Consumption of 250g perch, 500g tilapia
and 250g of catfish each week would result in an intake of 27 µg THg/week (equivalent to 0.35 µg
MeHg/kg bw/week) for residents of Ilagala-Uvinza area, 44 µg THg/week (equivalent to 0.58 µg
MeHg/kg bw/week) for Rwamagasa residents consuming only fish from Lake Victoria, 56 µg THg/week
(equivalent to 0.75 µg MeHg/kg bw/week) for people in the Rwamagasa background area consuming
tilapia and perch from Lake Victoria and catfish from the local streams, and 259 µg THg/week
(equivalent to 3.45 µg MeHg/kg bw/week) for people in the Rwamagasa area consuming tilapia and perch
from Lake Victoria and catfish from mining impacted streams. Apart from the latter group, these inputs
related to fish consumption are well below the WHO/FAO Provisional Tolerable Weekly Intake (PTWI)
of 300 µg for total mercury and 1.6 µg MeHg/kg bw/week in the diet. It appears that only those people
consuming catfish from the Isingile River, and other mining contaminated locations such as Tembomine,
are likely to be at risk of exceeding the PTWI for mercury.
People consuming 300g/day of rice grown on the mercury contaminated Isingile mbuga soils and 1kg of
fish from Lake Victoria would have a combined estimated MeHg input of 1.04 µg MeHg kg bw/week,
which is two thirds of the methyl mercury PTWI.
BGS Report CR/04/129 (Issue 1.0) for UNIDO Contract 03/088
xi
Elevated exposures to Hg can result from the occasional deliberate and habitual consumption of
contaminated soils and dusts. For example, the Provisional Tolerable Weekly Intake (PTWI) of 0.3 mg
for total mercury in the diet set by the WHO and the FAO, which is equivalent to 26 µg THg/day for a
30kg child is exceeded by an individual practising geophagia (central estimate and worst-case) or on a
case by case basis by an individual occasionally consuming soil/dust (worst-case). The practice of
geophagy by pregnant females is of particular concern in this regard given the sensitivity of the foetus to
mercury.
The inadvertent ingestion of dusts and soils even those having Hg concentrations significantly above the
regional background, and hence considered to be moderately contaminated, does not appear to lead to a
significant excess exposure to mercury. For example comparison of exposures due to inadvertent
ingestion of soils and/or dusts (0.72 to 1.8 µg THg/day or 5 to 13 µg THg/week) is typically less than
individual exposure via other dietary sources water, rice and fish.
However, given the uncertainties involved in estimating inadvertent dust and soil intake in the rural
Rwamagasa environment, exposure via this route, in addition to more classical geophagic behaviour,
should be considered when planning remedial/intervention measures. Such measures could include the
marking and fencing off of waste tips and areas of enhanced contamination and improvements in hygiene
(washing of hands and food preparation such as the drying of cassava and other crops directly on the
ground and the use of soil as a desiccant to aid the storage of groundnuts and beans). Whilst geophagy
does have an important cultural and possibly nutritional benefit, the resulting levels of potential exposure
to young adults and pregnant woman are high enough to suggest that this practice should be positively
discouraged within the mining districts. To this end the importation of geophagic materials into local
markets from outside the contaminated region should be encouraged and the negatives effects of using
local soils conveyed though local woman's groups and childhood development officers.
Monitoring systems for water quality and biota
Monitoring in the current survey followed, as closely as was practicable, the internationally accepted
protocols recommended by Veiga and Baker (2003). It is recommended that water monitoring be carried
out in the Rwamagasa drainage system during the wet season in order to test for mercury dispersion in
solution and in the suspended sediment. The short term and medium term temporal variation in these
pollution indicators should also be investigated.
Continuous monitoring equipment capable of determining Hg at low concentrations in drainage systems
is, as far as the authors of this report are aware, not available commercially. So any monitoring system
would be periodic rather than continuous. Quarterly monitoring will probably be adequate for the Isingile
and Nikonga Rivers for a period of two years. If no significant Hg concentrations are detected during that
period, and there are no significant changes in the amount of mineral processing and associated factors,
then annual monitoring, following the USEPA recommendations, will probably be adequate.
BGS Report CR/04/129 (Issue 1.0) for UNIDO Contract 03/088
xii
The only effective option to prevent continuing Hg pollution of the Isingile River and surrounding
agricultural areas is to require (a) the removal of all the existing mineral processing waste currently
located close to the Isingile River and (b) the termination of all mineral processing activities in the
vicinity.
Monitoring of drinking water from wells in the Rwamagasa area was carried out during the current
survey, but should be considered when designing any future water quality monitoring systems.
Monitoring of biota (fish and agricultural crops) has been carried out as part of the current study and
could be carried out periodically using the UNIDO sampling protocols (Veiga and Baker, 2003), which
document procedures for the periodic monitoring of aquatic biota. Periodic monitoring of agricultural
crops could also be carried out, although the results of this study indicate that little Hg is present in most
of the crops. Due to time and finding constraints, the current study was able to sample only a relatively
limited number of sites. For this reason it is recommended that a more comprehensive survey should be
carried out, in order to verify the results presented in this study.
Measures for the remediation and possible rehabilitation of mercury `hot spots'
The present survey did not detect any concentrations of Hg in solution that would require remediation as
they did not exceed water quality standards. Should future water quality monitoring detect concentrations
that require remediation, then a number of remediation technologies may be appropriate.
From a practical point of view, there would be little justification in trying to remediate and rehabilitate the
Hg contaminated bottom sediments of the Isingile River until (a) the releases of Hg contaminated mineral
processing tailings from the Rwamagasa area have been terminated, (2) the risk of future contamination
of the drainage system by progressive or catastrophic releases of Hg contaminated processing waste has
been eradicated. It is, however, relatively unlikely that the tailings piles located adjacent and to the south
of the Isingile are a potential source of catastrophic contamination as the waste piles are small and the
slopes are relatively gentle. As far as the authors are aware, no clean-up goals for mercury have been set
in Tanzania, although this needs to be verified.
The principal remediation-rehabilitation options for Hg-contaminated soils and sediments in the Isingile
River Rwamagasa area include (i) excavation of Hg-contaminated soil and disposal to an off-site secure
landfill or depository, (ii) electroleaching, comprising wet extraction followed by electrolytic preparation
of the leachate is an emerging and potential alternative cleanup method that is reported to offer a cheaper
and more environmentally friendly alternative to thermal treatment or the acid leaching process. The cost
of these potential remediation options has not been estimated.
Specific practical remediation measures cannot be recommended until a much more detailed assessment
has been made of Hg concentrations in the agricultural soils. On the basis of evidence collected during
this survey, it appears that significant amounts of mercury are not adsorbed into the grain of the
BGS Report CR/04/129 (Issue 1.0) for UNIDO Contract 03/088
xiii
agricultural plants. If this can be confirmed by more detailed surveys (involving further collection and
analysis of soil and rice grain samples from exactly the same areas, for example) it may be possible to
confirm that there is little or no potential for a direct negative impact on human health caused by the
consumption of rice and other crops grown on these relatively high Hg soils. Should this be the case,
there would be no compelling reason to prevent the continued cultivation of rice and other agricultural
crops on the Hg-contaminated soils.
Interactions between government departments, mining industry and research institutions
The report outlines the responsibilities of the various government departments in relation to artisanal gold
mining, the setting of environmental standards and environmental monitoring. Responsibility for
administration, implementation and enforcement of regulations under the Mining Act (1998) and
Minerals Regulations (1999) in the Geita Rwamagasa area is delegated to the Ministry's Local Mines
Office which is responsible for the extremely difficult task of ensuring that the small scale miners follow
relevant mining and environmental regulations and approved practices, such as ensuring that all
amalgamation is carried out in cemented ponds and that all tailings from these amalgamation ponds are
stored in appropriate cemented storage areas that prevent dispersal of mercury contamination onto
adjacent land and into water courses. Observations during the field project indicated that many small-
scale miners in the Rwamagasa area do not follow these regulations. Most of the research on the impact
of mercury contamination related to artisanal gold mining in Tanzania has been funded by UNIDO and
JICA. The World Bank-GEF funded Lake Victoria Environmental Monitoring Project is executed
principally by staff from the Tanzania Fisheries Research Institute (TAFIRI) and the University of Dar es
Salaam. The analytical laboratories of the Southern and Eastern African Mineral Centre (SEAMIC) also
contributes to these research activities.
BGS Report CR/04/129 (Issue 1.0) for UNIDO Contract 03/088
xiv
1 Introduction
Artisanal gold mining provides income to some of the world's poorest people, many of whom are women
and children, but it is also one of the major sources of mercury contamination, especially in developing
countries. It is estimated that 2 kilograms of mercury are released into the environment for every kilogram
of gold produced by artisanal and small-scale miners. Whereas the gold extraction process (known as
amalgamation) is a simple technology, it is potentially very dangerous and contaminates the air, soil,
rivers and lakes with mercury. The health of the miners and other people living within the area affected
by mercury contamination is negatively affected through inhalation of mercury vapour, direct contact
with mercury and through eating fish and other food affected by the mercury contamination.
UNIDO has provided technical assistance to the small-scale gold mining sector in developing countries
since 1985. Projects dealing with the introduction of cleaner technologies and mercury pollution
abatement have assessed the environmental and health impacts of mercury pollution caused by artisanal
gold miners in Venezuela, Ghana and the Philippines. It is now accepted that the environmental and
health impacts resulting from the use of mercury in the processing of gold within the artisanal mining
sector and their effects on International Water bodies are similar in nature in most developing countries
and that solutions to these problems require concerted and coordinated global responses.
In response to this requirement, the Global Environmental Facility (GEF) of the UN approved funding for
the project Removal of Barriers to the Introduction of Cleaner Artisanal Gold Mining and Extraction
Technologies4 (also referred to as the Global Mercury Project (GMP)) in March 2002. UNDP acts as the
Implementing Agency while UNIDO is responsible for project execution. The Global Mercury Project
was started to help demonstrate ways of overcoming barriers to the adoption of best practices, waste
minimization strategies and pollution prevention measures that limit contamination of the international
waters environment. The project is funded by GEF, UNDP and UNIDO and is complemented by a suite
of ongoing activities, which are financed through either the participating countries' own resources and/or
bilateral programs. The project aims to help remove barriers that inhibit artisanal miners from applying
cleaner and efficient technology. The project also aims to demonstrate the application of cleaner
technology and train miners in order to enhance the application of cleaner technology and thus reduce
pollution and minimize waste resulting from the currently applied poor practices.
UNIDO selected a pilot suite of six developing countries (Brazil, Indonesia, Laos, Sudan, Tanzania and
Zimbabwe) located in several key trans-boundary river/lake basins. It is estimated that nearly 2.0 million
people are directly involved in artisanal mining activities in the six pilot countries whilst the livelihoods
of more than 10 million depend on these activities. UNIDO conducted preliminary investigations in the
4 http://www.gefweb.org/Documents/Project_Proposals_for_Endorsem/PP_Archives/Global_-
_Gold_Mining_project.pdf
BGS Report CR/04/129 (Issue 1.0) for UNIDO Contract 03/088
1
six pilot countries to establish the intensity of the artisanal mining activities and their impacts on the
international water bodies. A demonstration site was selected in each country.
The ultimate goals of the GEF/UNDP/UNIDO Global Mercury Project are:
1. to reduce mercury pollution of international waters by emissions emanating from small-scale
gold mining,
2. to introduce cleaner technologies for gold extraction and to train people in their application,
3. to develop capacity and regulatory mechanisms that will enable the sector to minimize
mercury pollution,
4. to introduce environmental and health monitoring programmes,
5. to build capacity of local laboratories to assess the extent and impact of mercury
pollution.
The objective of the GEF/UNDP/UNIDO GMP is to replace mercury amalgamation in the project
demonstration sites to the extent possible with new technology while improving the income of the miners
through more efficient gold recovery, increasing knowledge and awareness and providing policy advice
on the regulation of artisanal gold mining with due consideration of gender policies. Beneficiaries will be
the miners, governments, local institutions and people living in areas impacted by mercury contamination.
The project is organised to fulfil seven major objectives:
1. Project coordination and support; establish country program management structures and
Task Forces
2. Increase artisanal mining knowledge and awareness
3. Establish human exposure to mercury and pollution impacts of the affected areas
4. Establish technological requirements
5. Introduce efficient and clean technology
6. Assist Governments to develop implementable policies and legislation
7. Self-financing and donor conferences.
In August 2003, the British Geological Survey (BGS), acting under the Natural Environment Research
Council, signed a contract (No. 03/088) with the United Nations Industrial Development Organization
(UNIDO) to carry out Environmental and Health surveys and assessments in the Rwamagasa artisanal
gold mining area in the Republic of Tanzania (see Terms of Reference in Appendix 1). Rwamagasa5 was
selected by UNIDO as the demonstration site for Tanzania. The environmental assessment, to which this
report refers, was executed by the BGS whilst the medical assessment was subcontracted to the Institut
5 printed as Lwamagasa on the 1:50,000 scale Busanda (Sheet 46/1) topographic map; also named elsewhere as
Ruamagaza and Rwamagaza.
BGS Report CR/04/129 (Issue 1.0) for UNIDO Contract 03/088
2
für Rechtsmedizin der Ludwig-Maximilians-Universität München, and will be the subject of separate
reports.
The Environmental Assessment is part fulfilment of the project's objectives to (i) identify hotspots in the
project demonstration sites, (ii) conduct geochemical and toxicological studies and other field
investigations in order to assess the extent of environmental pollution in surrounding water bodies and
(iii) devise intervention measures.
BGS Staff involved in the execution of the field programme were Dr J D Appleton (Project Manager &
Geochemist), Mr T R Lister (Geochemist), Dr Helen Taylor (Aquatic Ecologist/Chemist). This report was
prepared by Don Appleton and Helen Taylor, with contributions from Bob Lister.
BGS Report CR/04/129 (Issue 1.0) for UNIDO Contract 03/088
3
2 Background
2.1 INTRODUCTION
The project proposal and work schedule was based initially on information on the Rwamagasa small-scale
mining site in Geita district provided by UNIDO (L. Bernaudat) and from other readily accessible
sources. This information indicated that there would be two main potential sources of mercury
contamination. The first was from the main amalgamating area at the small-scale Blue Reef Mine, which
is separately fenced and totally cemented. The second, and possibly more important source of
contamination was from independent artisanal miners reported to sluice and amalgamate on the banks of
the River Isingile, to the north of Rwamagasa.
Although Rwamagasa is located only 37 km to the south of Lake Victoria, streams draining the
Rwamagasa `mining hotspot' actually drain SW into the Nikonga River, and then for a further 430 km via
the Moyowosi swamps and the River Malagarasi before reaching Lake Tanganyika near Ilagala, about 50
km to the SSE of Kigoma (Figure 1). One of the major objectives of the project is to assess the impact of
mercury contamination on International waters as well as in the vicinity of the `mining hotspot', so the
field programme was carried out in two areas: (a) the Rwamagasa `mining hotspot' sub-area and (b) the
Lake Tanganyika River Malagarasi sub-area (see Figure 2).
The Rwamagasa `hotspot' is located about 3 km to the SE of the Buckreef Mine camp (Figure 3) and
within the Buckreef/Rwamagasa gold prospect, which is currently being evaluated by the Perth-based
Spinifex Gold (now named East Africa Mines). Nearby, Geita Mines has reserves of 6.4 Moz Au and
production was 540,000 in 2001. Barrick's Bulyanhulu mine, which contains one of the largest gold
reserves in East Africa, began commercial production in 2001. Bulyanhulu mine has resources of over 10
Moz with production forecast to start at 450,000 oz/year at cash costs of $130/oz and a life of mine of 15
years.
According to the Spinifex Gold Annual Report for 2002, an exploration program in the Buckreef/
Rwamagasa area commenced in September 2002 involving 60,000 m of drilling and collection of over
10,000 soil samples. Artisanal workings in the Rwamagasa area were reported to be focussed on quartz
veins in sheared, ferruginous, chlorite mica schists. Grab samples of vein and wall rock grade 6-62 g/t Au
(Spinifex Ltd 2002 Annual Report). Gold-bearing shear zones are reported to trend NW-SE and E-W. As
would be expected, some conflict between the large-scale and artisanal mining activities has been
reported in this area. Spinifex is actively promoting the prospect and apparently looking for prospective
purchasers.
Background information on mercury contamination associated with artisanal gold mining in Tanzania is
available in a number of published reports and scientific papers (Appel et al., 2000; Asanao et al., 2000;
BGS Report CR/04/129 (Issue 1.0) for UNIDO Contract 03/088
4
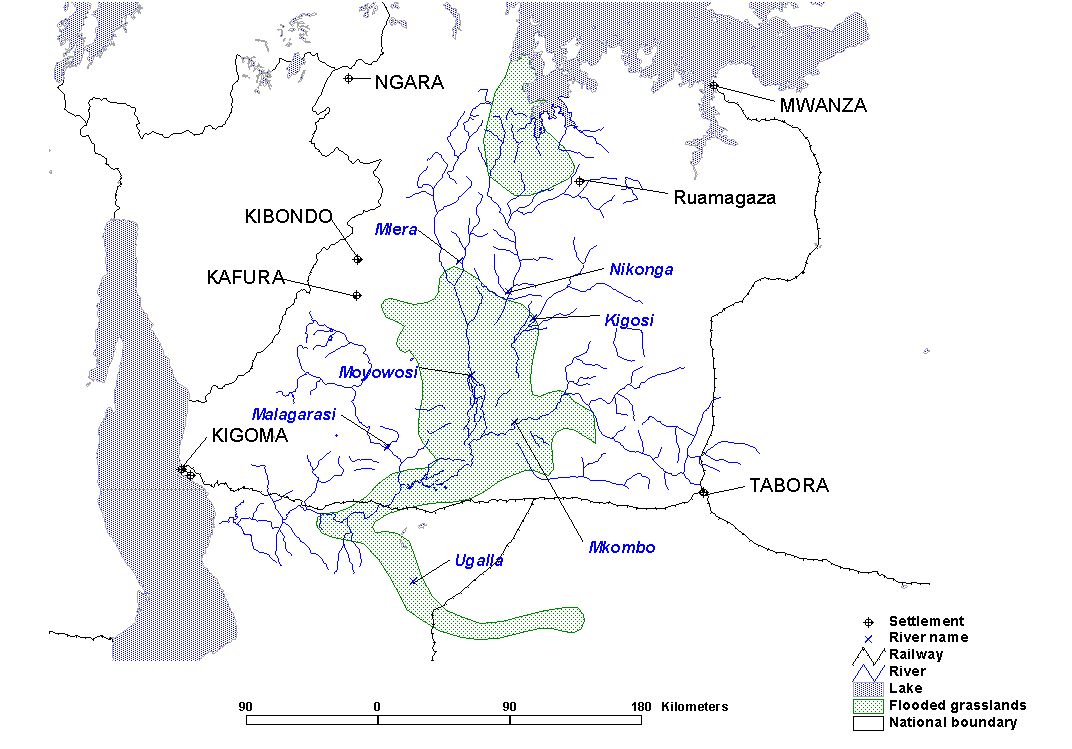
Campbell et al., 2003a,b; Harada et al., 1999; Ikingura and Akagi, 1996; Ikingura and Akagi, 2002;
Kinabo, 1996; Kinabo, 2002a,b; Kinabo and Lyimo, 2002; Kishe and Machiwa, 2003; Machiwa et al.,
2003; Mutakyhwa, 2002; Semu et al., 1989; Sindayigaya, 1994; University of Dar es Salaam, 1994; van
Straaten 2000a,b). For background information on the geology and mineralization, see van Straaten
(1984), Barth (1990) and Borg (1994).
Figure 1. Sub-areas for environmental assessment. BLUE BOX = Lake Tanganyika - River Malagarasi sub-area:
Lower section of River Malagarasi and International waters of Lake Tanganyika; RED BOX Rwamagasa sub-area:
Upper section of Nikonga River downstream of Ruamagaza (Rwamagasa)
2.2 RIVER
MALAGARASI
The principle objective of water, sediment and fish sampling in the lower reaches of the River Malagarasi
and obtaining fish samples from the delta zone in Lake Tanganyika was to evaluate whether mercury
contamination from the Rwamagasa and adjoining mining areas is dispersed as far as Lake Tanganyika.
The GEF Global Mercury Project focuses on the impact of mercury contamination on International water
bodies so it was essential that samples were collected from the above-mentioned locations.
BGS Report CR/04/129 (Issue 1.0) for UNIDO Contract 03/088
5
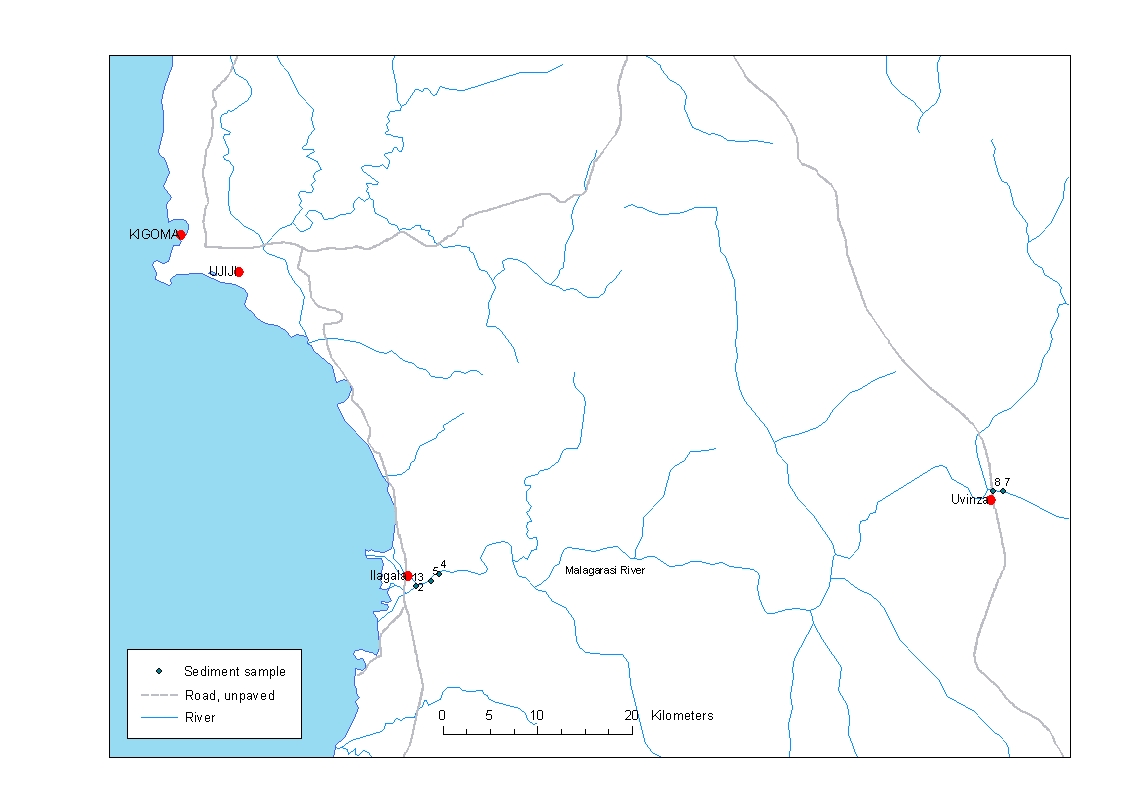
Dispersion of mercury from the Rwamagasa area to Lake Tanganyika may be unlikely because
contaminant mercury would expected to be adsorbed by organic material in the extensive Moyowozi and
Njingwe Swamps and flooded grassland area, located from 120 km to 350 km downstream of
Rwamagasa. The Malagarasi-Moyowozi-Sagara-Ugalla swamps cover an area of approximately 25,000
km2 (see Figure 1). Whereas the swamps will act as a potential methylation zone, they will also act as an
environmental sink for mercury contamination and this is likely to prevent migration of Hg into the lower
reaches of the Malagarasi River and Lake Tanganyika, some 430 km downstream from Rwamagasa. The
swamp area was inaccessible within the logistical and budgetary constraints of the current project. It
should be noted that if elevated mercury concentrations occur in the river sediment, water and fish
samples collected from the lower reaches of the Malagarasi River and Lake Tanganyika, this will not
prove that artisanal gold mining is the source of the Hg. A much more rigorous, time-consuming and
expensive field programme would be required to assess the source of elevated mercury levels, should
these be found.
Stream sediment, water, and fish were collected from the lower reaches of the Malagarasi River near
where it enters Lake Tanganyika (Ilagala, Figure 2) and also from near Uvinza, approximately 60 km
upstream. Fish samples were collected in close collaboration with national fisheries experts from the
Kigoma offices of the Tanzania Fisheries Research Institute (TAFIRI).
Figure 2. Location of sediment and water samples sites on the River Malagarasi
BGS Report CR/04/129 (Issue 1.0) for UNIDO Contract 03/088
6
2.3 RWAMAGASA
A description of the Rwamagasa small-scale mining site in Geita district was provided to the BGS team
by L. Bernaudat (UNIDO). "The site is important in size; shops of all kind can be found. The mining area
is away from the residential part and fenced. A roof covers every pit. The miners have stopped grinding
the ore themselves because the machines to do it properly are far too expensive. The service of grinding
the ore is provided by Merameta, a joint venture between the Government and private investors from
South Africa. The miners call the company, when they have enough ore in stock. Meremata provides the
ball mills and takes the machinery back when the ore has been crushed. In exchange, the miners have to
sell the gold to Merameta. This company provides also generators for the water pumps. The processing
area is fenced and equipped with cemented ponds. The amalgamating area itself is separately fenced and
totally cemented. Unfortunately, no processing activity could be observed during the visit. The only
existing retort was broken. On this site, only men seem to work for the mine. Women hold the shops in the
village and provide the miners with food. Surprisingly, the cooking takes place in the processing area
where amalgam is burned as well. In the village, a few ball mills have been seen in operation. A young
boy was observed when crushing the ore with a hammer, but he was stopped and replaced by an adult
when the UNIDO group was noticed by the villagers. These independent miners cause serious pollution.
During the visit, some miners were seen when sluicing/amalgamating directly at the shore of the river. At
this huge site, the best as well as the worst artisanal methods could be observed only a few hundreds of
meters apart. It seems that the awareness campaign initiated by UNIDO has not reached everyone."
The situation found in the area is now somewhat different. The Meremata organisation no longer
functions in Rwamagasa. The only legal mining is carried out within the boundaries of the PML held by
Blue Reef Mines (Plates 1 to 6) where it is reported that approximately 150 people are involved in the
mining and mineral processing activities. This is the only site in the Rwamagasa area where primary ore
is being mined underground6. All other mineral processing activity of any significance is concentrated at
the northern margin of Rwamagasa, especially on the land sloping down to the Isingile River. In this area,
there are estimated to be about 30 groups of historic and active tailings dumps and up to ten localities
where ball mills are operating. The number of people actively involved, at one particular time, in ball
milling, sluicing and amalgamation (assuming about 5-10 people work at each of 10 ball milling sites; 5
people work at each of 20 active sluicing sites; and 5 people work at each of about 10 active
amalgamation sites) is probably no more than 300. This observation needs to be verified by more detailed
studies.
At Blue Reef mine and other amalgamation ponds, miners were seen to mix the mercury used for
amalgamation with their bare hands (see Plates 7 to 12 for sequence of photos illustrating amalgamation
process). Amalgam is burned in the open air, usually in a small charcoal fire, which releases the mercury
6 This report does not include artisanal mining in the Iseni area, which lies approximately 5 km to the east of
Rwamagaza village.
BGS Report CR/04/129 (Issue 1.0) for UNIDO Contract 03/088
7
to the atmosphere (Plate 13). Amalgamation mainly takes place adjacent to amalgamation ponds, which
are usually formed of concrete, but sometimes have only wood walls. According to environmental
legislation, the mercury contaminated mineral concentrates and tailings should be stored in a concrete
lined structure. However, it was seen and reported that mercury contaminated tailings are frequently
reprocessed by digging out tailings from the amalgamation ponds (see, for example, Plate 14). These are
dried, re-ground in a ball mill and sluiced prior to amalgamation. Re-processing the amalgamation
tailings will result in dispersion of mercury into the local vicinity of the mineral processing areas where
this activity is carried out (i.e. mainly on the slopes going N. down to the R. Isingile mbuga). It is
reported that reprocessing of amalgamation tailings is carried out within the confines of the mineral-
processing centre at the Blue Reef mine.
The socio-economic report states that "Usually the ore is taken home to be manually crushed either by the
members of family or labourers. After the ore is crushed to a certain size, the ore is taken to the ball mill,
which is usually a modified tractor with a wheel hub connected to the ball mill. The ball mills are set up
in the residential areas and the owner of the crusher provides mercury for amalgamation." BGS staff
observed that ball mills driven by small petrol engines are now crushing most of the ore and re-processed
tailings. Crushers based on modified tractors are rare. Most of the ball mills seen are located on the
northern margin of Rwamagasa, on the slopes leading down to the Isingile River. There are also similar
ball mills located within the confines of the Blue Reef Mine processing centre (Plates 5 and 6). No "gold
shops", where gold is re-heated to remove excess mercury, were found or reported in the Rwamagasa
area. In addition, it appears that mercury is not added to rock being crushed in ball mills so this will tend
to reduce the potential for contamination. The only retort seen was in the mine office at the Blue reef
mine and this was not being used because the glass bowl was broken.
Apart from Hg vapour released when the amalgam is burned, the main potential source of contamination
to the aquatic environment is from mercury-contaminated tailings being reprocessed by the artisanal
miners operating in the area immediately to the north of Rwamagasa (Plates 15 to 17). The field
programme was carried out during the dry season so there was little evidence that large quantities of
contaminated tailings are being washed into the Isingile River. This is in strong contrast to many other
artisanal mining sites, such as the Naboc River, in the Philippines, for example (Appleton, 2000).
Wastewater and tailings from amalgamation `ponds' was observed at one site to be overflowing onto an
area where vegetables are being grown (see Plate 14).
Previous studies in the Lake Victoria Goldfields area indicate that dispersion of mercury from tailings is
low, not least because Fe-rich laterites and seasonal swamps (mbugas) will act as natural barriers or sinks
preventing the widespread dispersion of Hg in sediments and soils. Dispersion of Hg in ground and
surface water during the dry season is reported to be very restricted (van Straaten, 2000). There were few
visible signs that indicate extensive dispersion of Hg-contaminated tailings into the drainage system of
the Rwamagasa area (Figure 3). Contamination of drainage sediment solely from operations in the
Rwamagasa area will impact the Isingile drainage system down to the confluence with the stream
BGS Report CR/04/129 (Issue 1.0) for UNIDO Contract 03/088
8
draining south from Buck Reef mine. Downstream of this point, contamination may be derived from other
sources as well as artisanal mining in the Tembomine area.
If large quantities of contaminated sediment are dispersed onto the mbuga area adjacent to the Isingile
River during the wet season then this may lead to the significant dispersion of contaminant mercury both
into the aquatic system and onto agricultural sites being used for rice, maize, and vegetable cultivation.
The results of the sediment and soil sampling programme should reveal the extent and magnitude of this
dispersion.
The only evidence that mercury may be impacting animals was seen at one site where ducks were seen
swimming in water that had overflown from an amalgamation pond (Plate 19).
The socio-economic survey did not provide an adequate reconstruction of the mining history of the area
so it was not possible to use this source to identify the likely extent and magnitude of metallic Hg
contamination in the mining hotspot area. A semi-quantitative estimation of this was achieved by using
the presence of tailings to indicate the locations of historic and present mineral processing sites and thus
the likely sources of Hg contamination. In particular, the main Hg amalgamation ponds were located and
sampled. Whereas collection of information on gold production in the area was outside the terms of
reference of this environmental project, discussions with Geita Mines Officer Mr John Nayopa revealed
that the Blue Reef Mine produces about 1 kg per month whilst the artisanal miners re-working tailings
(mainly in the area along the northern border of Rwamagasa, adjacent to the Isingile River) produce about
0.5 kg per month. If these figures are correct, approximately 27 kg of mercury will be released to the
environment from the Rwamagasa area each year. Of this, approximately 14 kg will be emitted to the
atmosphere from amalgam burning within the Blue Reef mine site. Because the Blue Reef mine is located
well away from surface drainage, it is estimated that very little Hg from this source will enter the river
system through water-born dispersion of Hg-contaminated tailings. Approximately 7 kg of mercury will
be released to the atmosphere from the other amalgamation sites and 2 to 3 kg to heavy mineral tailings in
the amalgamation ponds (which are often reprocessed).
BGS Report CR/04/129 (Issue 1.0) for UNIDO Contract 03/088
9
3 Sampling and analytical methods
Project and field work planning was based on (i) an evaluation of the sociological survey report on the
Rwamagasa mining community produced by a National Expert (Wagner, 2003) and (ii) all other readily
available sources of information. The operational plan for the field programme was designed to fulfil the
ToR (Appendix 1) and is described in the Field Report (Appleton, Lister and Taylor, 2003).
3.1 SAMPLING
3.1.1 Drainage sediment and water
In the River Malagarasi near Ilagala, sediment samples were collected using a Van Veen grab sampler
deployed from a boat (Plate 20) and the fixed-cable ferry. Sub-samples were placed in a pan (Plate 21)
and thoroughly mixed prior to wet sieving through 2mm and 150µm mesh. At the second site on the
Malagarasi River, near Uvinza, it was not practical to use the Van Veen sampler so sediment was
obtained from appropriate sites along the bank of the river and wet sieved (Plate 22). The sample sites
were well away from the influence of the salt mines, Uvinza town and the Lugufu Refugee Centre
The streams in the Rwamagasa area were either completely dry or ponded (Plates 23 to 26) so there was
no active dispersion of potentially contaminated sediment in suspension. For this reason no suspended
particulate samples were collected.
Bottom sediment samples, each of 150-200 grams, were collected by wet screening up to 5 kg of river or
stream-bed sediment through 2mm and <150 µm sieves, using a minimal amount of water to avoid the
loss of fine silt and clay fractions. Samples were sealed in plastic securitainers to avoid evaporative losses
and oxidation. The approximate weight percentages of the >2mm, 2mm to >150µm, and <150µm size
fractions were noted at each site.
Duplicate sediment samples were collected at four sites (A69/70; A-82/203; A85/106; and A86/216).
Background samples from areas known to be well away from artisanal gold mining were collected from
streams in the Munekesi area (A-87) and from the Nyamsenga (A-104) (se Figure 3). Sample site A-69/70
is located about 300 m upstream from the nearest processing site so should not be impacted by tailings
contamination. There could, of course, be contamination by airborne mercury vapour at this site.
Stream water pH, temperature, Eh and conductivity were determined in the field using a series of
temperature-compensated electrodes and meters (Plate 27). Most of the water samples for analysis at the
BGS were collected using 25 mm diameter, 0.45 µm MilliporeTM cellulose acetate membranes into 30 ml
HPDE bottles (NalgeneTM). Coarse prefilters were used in conjunction with the 0.45 mm cellulose disks
on all obviously turbid samples. A few samples were filtered through 50 mm diameter Sartorius Sartolab
P 0.45 µm disposable SFCA membranes using 50 ml disposable syringes and collected into 30 ml LPDE
BGS Report CR/04/129 (Issue 1.0) for UNIDO Contract 03/088
10
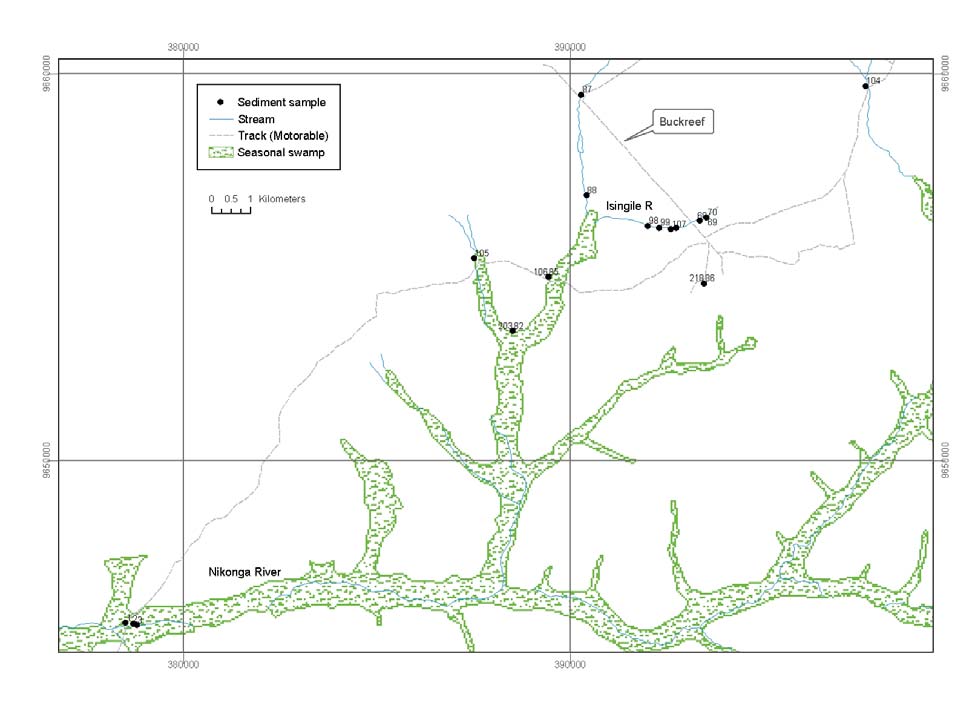
bottles (NalgeneTM). At each site, two 30 ml samples, filtered and preserved with 0.3 ml conc. HNO3 +
0.3 ml 0.2 vol.% K2CrO7 were collected for total Hg analysis.
In the Rwamagasa area, where there is some possibility of arsenopyrite being associated with the gold
mineralization, one or two 30 ml samples of filtered water preserved with 1% v/v HNO3 were collected
for the determination of arsenic.
A number of "Blank" water samples were made using deionised water from the BGS laboratories mixed
with the nitric acid used to preserve the water samples. Data for these Blanks was used to correct the Hg
and As data as it was demonstrated that the nitric acid provided by the University of Dar es Salaam was
not totally free of As and Hg. It was not practicable to transport concentrated nitric acid from the UK as
transportation is prohibited in passenger aircraft. Water samples were kept cool after collection and
preserved with acid within 8 hours after collection. The samples were then stored in a refrigerator before
being transported back to the UK for analysis.
Figure 3. Distribution of wet-sieved (<150µm) stream sediment samples collected from the Rwamagasa area
BGS Report CR/04/129 (Issue 1.0) for UNIDO Contract 03/088
11
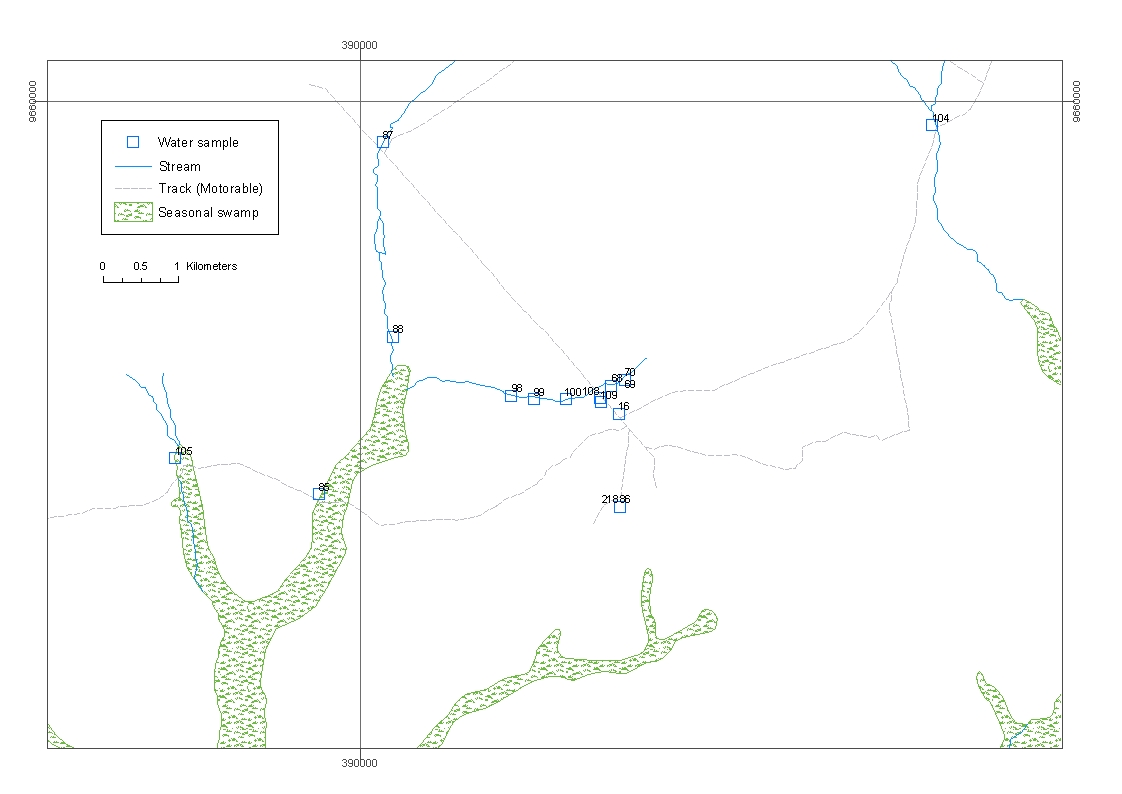
Figure 4. Distribution of filtered water samples collected from the Rwamagasa area
3.1.2 Mineral processing waste (Tailings)
One of the major objectives of the environmental assessment is to Determine the level and extent of
metallic Hg contamination in the mining/mineral processing/amalgamation `hotspot' area. An assessment
of the potential environmental impact and `hazard' associated with mineral processing tailings, especially
in the area located immediately south of the River Isingile and within the built-up area of Rwamagasa,
was based on a representative selection of channel (Plate 28) and composite samples collected from the
numerous tailings piles and a selection of the mercury amalgamation `ponds' (Plates 29 to 38). Tailings
samples were collected by thoroughly mixing a 2-3 kg composite of sub-samples in a large fibreglass pan,
before obtaining a 250g split by cone-and-quartering. Samples were sealed in plastic securitainers to
avoid evaporative losses and oxidation.
Locations of the different types of tailings samples are illustrated in Figures 5 and 6. The volume (m-3) of
each tailings pile (or group of piles) at a sample site was estimated (see Figures 7 and 8).
BGS Report CR/04/129 (Issue 1.0) for UNIDO Contract 03/088
12
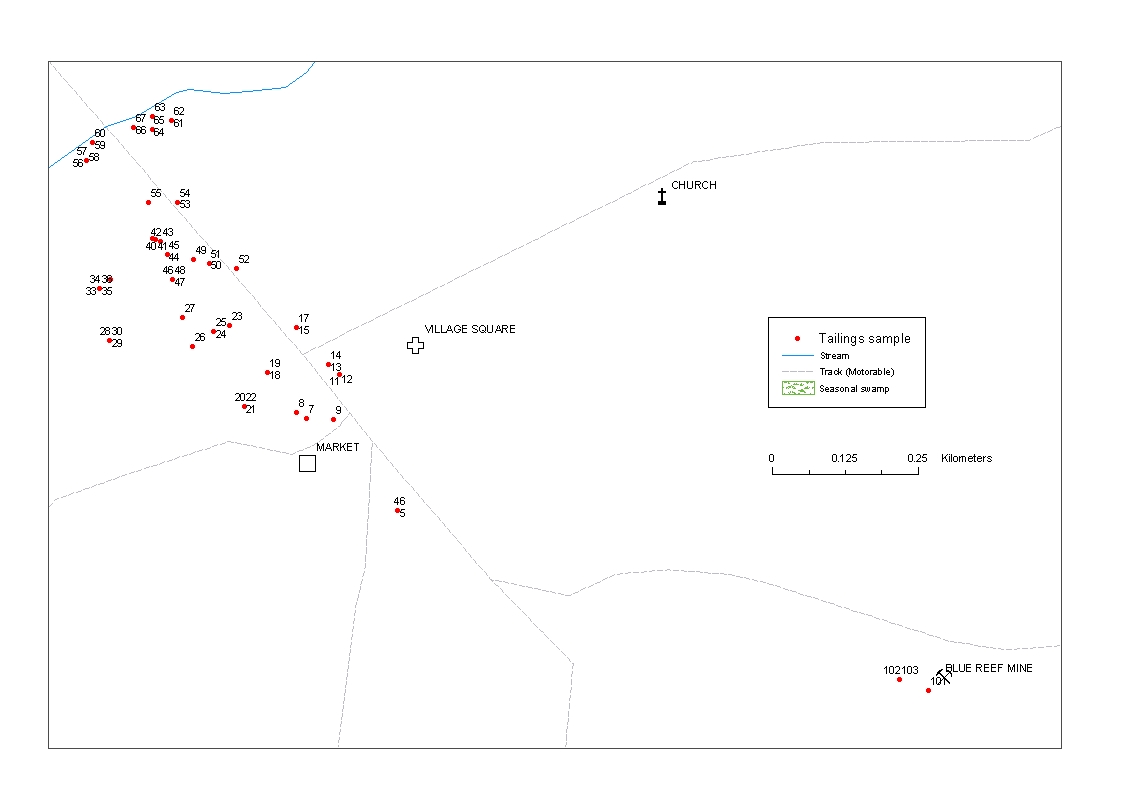
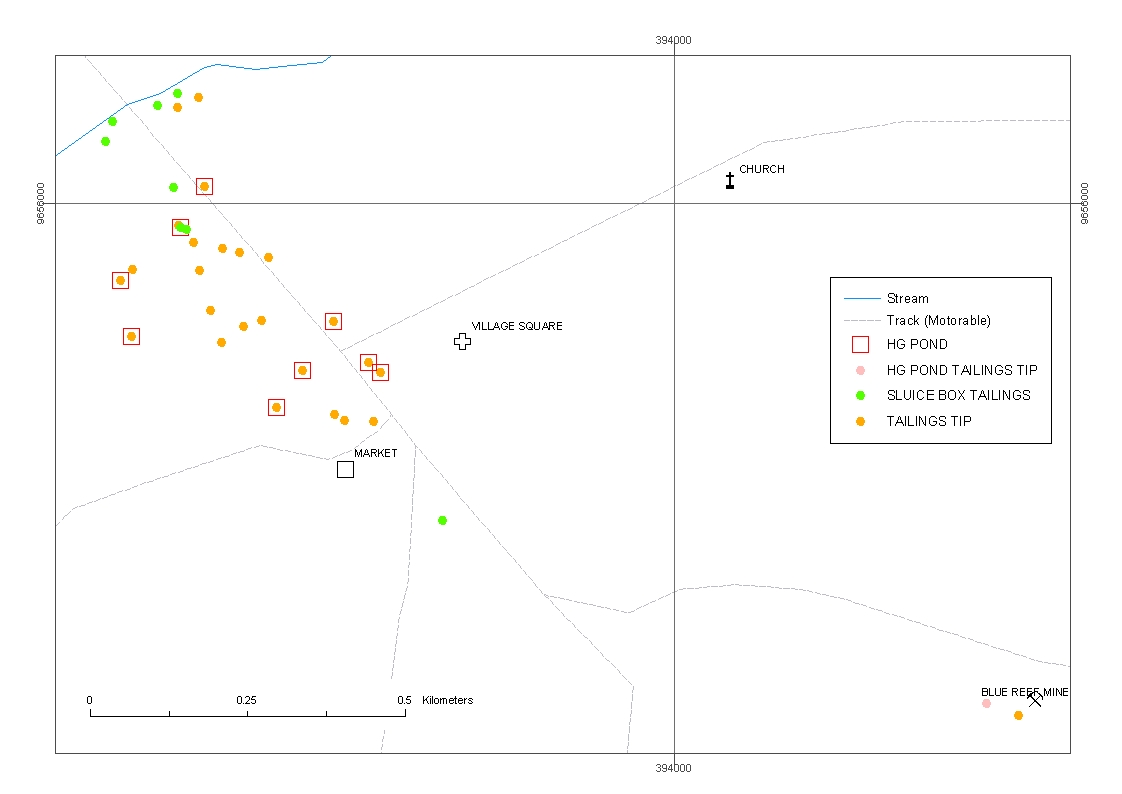
Figure 5. Location of tailings samples in the Rwamagasa area.
Figure 6. Distribution and classification of tailings sample types in the Rwamagasa area.
BGS Report CR/04/129 (Issue 1.0) for UNIDO Contract 03/088
13
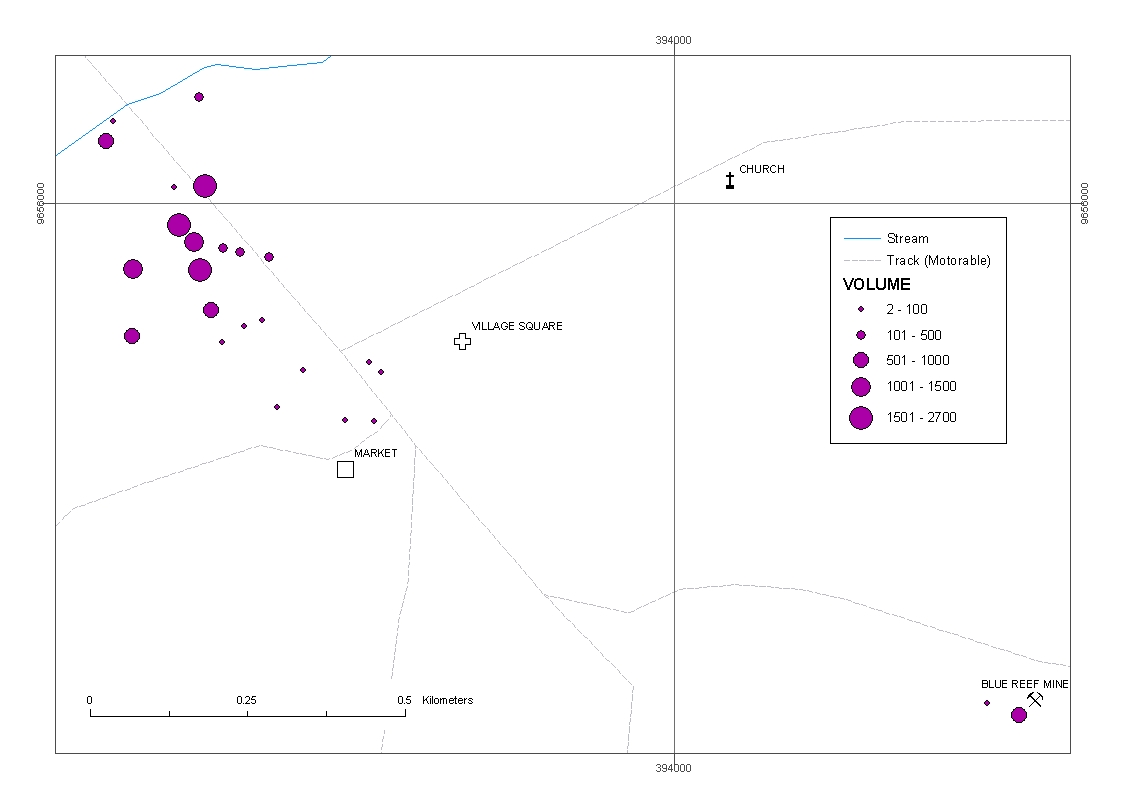
Figure 7. Approximate volumes (m-3) of tailings tips in the Rwamagasa area.
12
10
8
c
y
n
ue
6
e
q
Fr
4
2
0
2
100
500
1000 1500 2000 2500 3000 More
Figure 8. Histogram of approximate tailings tip volumes (m-3) in the Rwamagasa area.
BGS Report CR/04/129 (Issue 1.0) for UNIDO Contract 03/088
14
3.1.3 Soil
A representative number of topsoil samples (0-10 or 5-15 cm depth, depending on the situation) were
collected in the Rwamagasa area and adjacent agricultural land (Figures 9 and 10). Hg analysis of these
samples may help to indicate the level and extent of contamination caused by the airborne dispersion of
Hg vapour as well as the dispersion of wind and water borne Hg-contaminated tailings. Hg results for soil
samples may indicate whether Hg vapour is preferentially dispersed in relation to the predominant wind
direction(s). The distribution of soil samples classified by land use is illustrated in Figure 11.
Soil samples were collected by mixing sub-samples taken from points within an area of about 100 m2. In
some cases the resultant bulk sample was relatively inhomogeneous (Plate 39) so careful disaggregation
and mixing of the bulk sample was carried out prior to cone-and-quartering (Plate 40) to obtain a
relatively homogeneous sample of 250-350g. Samples were sealed either in plastic securitainers or in a
Kraft paper bag sealed within a plastic bag in order to avoid evaporative losses and oxidation. It was
impractical and in most cases unnecessary to sieve the soil through a 2mm mesh in the field. Many soils
were damp and very clayey so would not pass though a 2 mm sieve. Removal of the +2mm fraction will
be carried out in the laboratory following drying and disaggregation. Duplicate samples were taken at a
number of sites to estimate sampling precision.
Three profiles (A245-248; A267-271; A279-284; Figure 10) in the mbuga soils were sampled at 10 cm
intervals to determine the vertical variation of Hg in agricultural land adjacent to the main mineral
processing area. The profile A-279 to A-284 is illustrated in Plate 41.
In addition to the determination of Hg, the soil samples were also analysed for organic matter and aqua
regia soluble Fe in order to assess the impact of adsorption onto organic matter in the organic-clay-rich
vertisols (mbuga) and Fe-Al hydroxides in the ferrallitic soils (ferric luvisols and ferric acrisols; FAO
classification) that characterise much of the Rwamagasa area. The mbuga soils are reported to be
chemically rich; characterised by high content of smectite, shrink-swell clay; are very sticky and plastic
when wet and very hard with a cracked surface when dry. They appear in some parts to have a high
content of organic material. Medium to dark brown (sometimes orange brown) ferric soils (reported to be
mainly ferric acrisols with argic B horizon, low nutrient retention properties, cation exchange capacity
dominated by aluminium ions) characterise the interfluvial areas underlain by `greenstone' belt rocks.
Areas underlain by granite have much paler coloured, sandy and quartz-rich soils.
The final major objective of the environmental assessment was to Investigate the situation of the
agricultural sites in the vicinity of the Rwamagasa small-scale mining activities and take samples. This
was achieved by collecting composite surface soil samples (0-10 or 5-15 cm, depending on the situation)
from (i) a detailed grid covering the area between the main artisanal mining mineral processing area at the
northern edge of Rwamagasa and extending across the mbuga area of the River Isingile (Figures 10 and
11), (ii) along a profile crossing the R. Isingile mbuga about 1 km downstream (sites A-219-224), and (iii)
along two profiles across mbuga areas (a) located further down the Isingile drainage system (sites A81-
BGS Report CR/04/129 (Issue 1.0) for UNIDO Contract 03/088
15
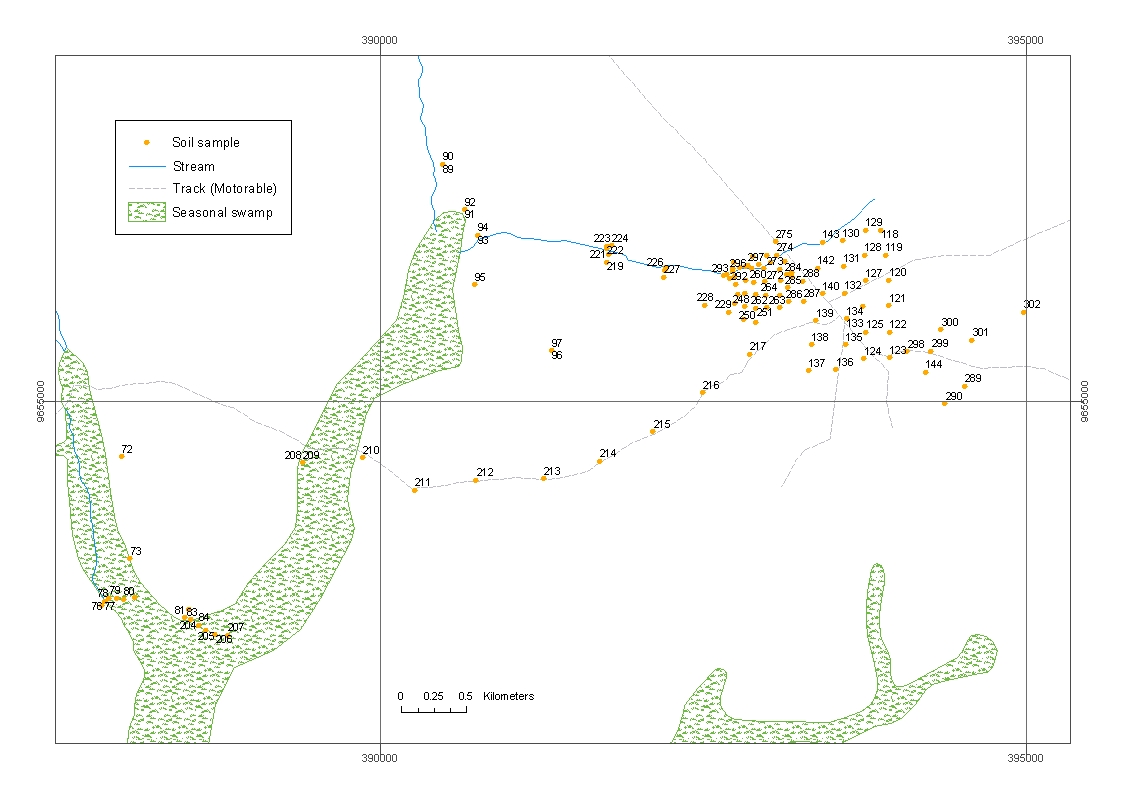
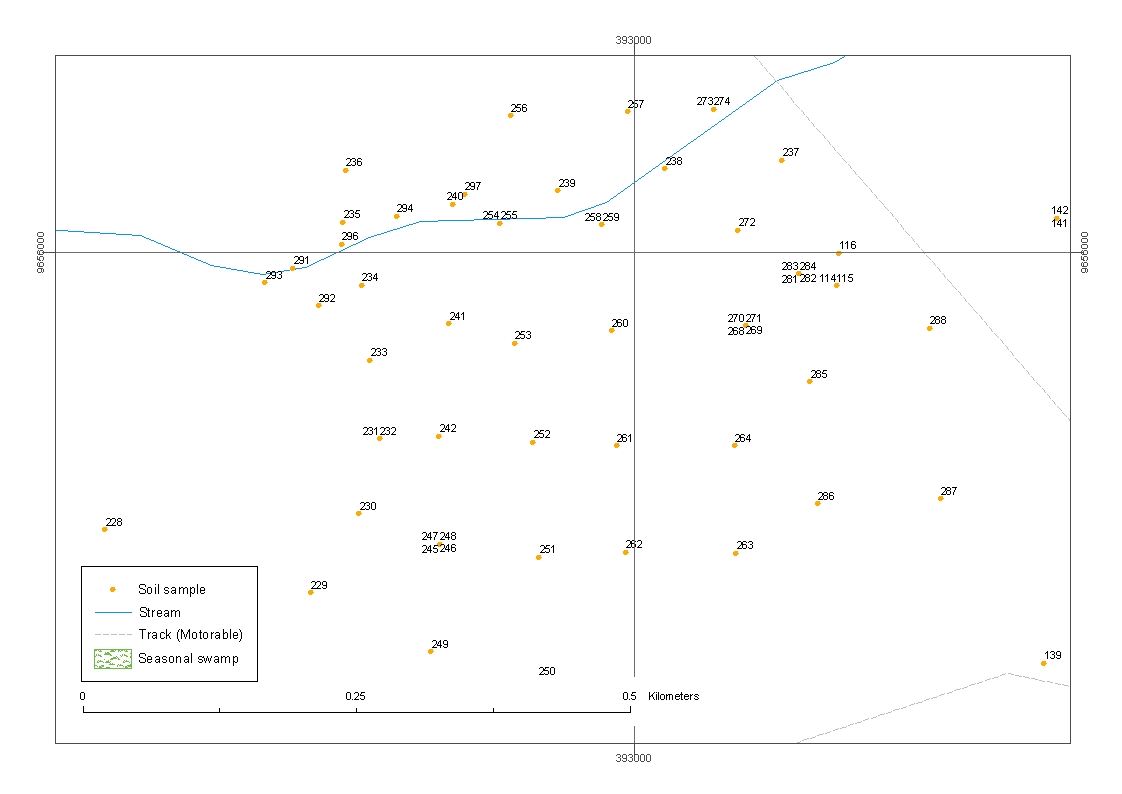
84, A204-207) and (b) across the mbuga draining south from Tembomine (sites A76-80) (see Figures 9
and 11). Some of these samples were collected from dry rice paddies.
Figure 9. Distribution of soil samples collected in the Rwamagasa area (see Figure 8 below for detailed soil grid).
Figure 10. Distribution of high-density soil sampling grid (refer to Figure 7 above).
BGS Report CR/04/129 (Issue 1.0) for UNIDO Contract 03/088
16
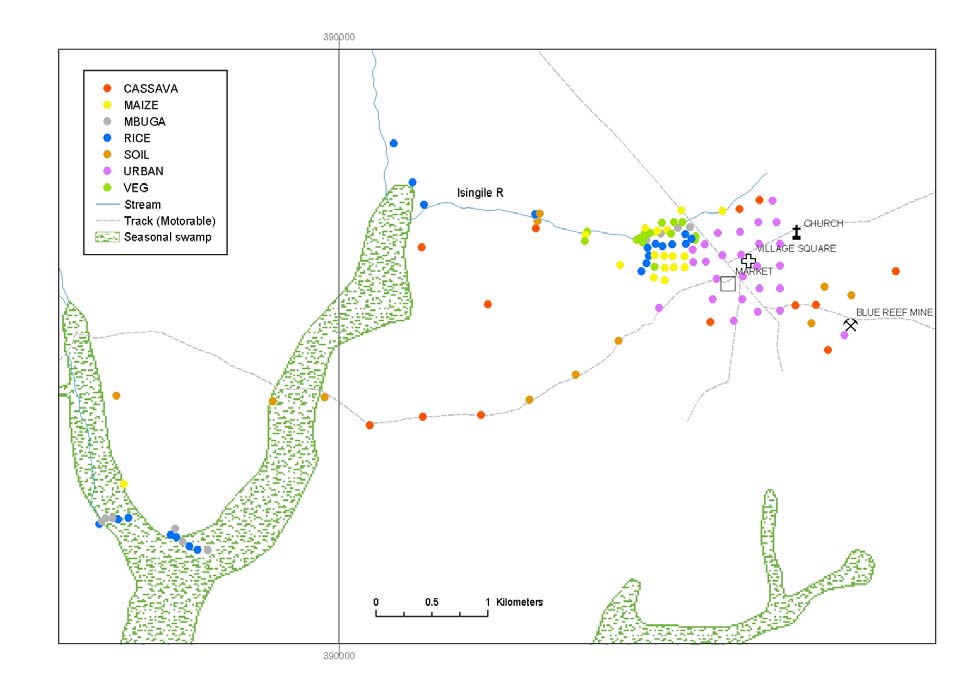
Figure 11. Soil samples classified by land use (legend self explanatory, except SOIL = unclassified)
3.1.4 Crops
The objective to Evaluate the nature and extent of the mercury pollution in agricultural produce,
especially in those being part of the main diet was achieved by collecting for analysis vegetable and crop
samples from two localities within the R. Isingile mbuga (Figure 12). Vegetable samples A110-113 were
collected from a site within 5-10 m of an amalgamation pond where water, that is presumed to be Hg
contaminated, was overflowing onto the cultivated ground (Plates 14 and 42). Other vegetable samples
were obtained from vegetable gardens located on the northern side of the R. Isingile mbuga (sites 292-
297, Figure 12; Plates 45 and 46) where potentially contaminated water from the R. Isingile was being
used for irrigation. At most of these sites a soil sample was collected from the root zone in the immediate
vicinity of where the vegetables sample was being grown. A number of rice samples reported to have
been grown on the R. Isingile mbuga were also obtained and a range of vegetable samples reputed to be
grown at the same location were purchased from the Rwamagasa market.
A potentially important pathway of mercury into the human food chain is linked to the cooking of food in
processing areas where amalgam is burned. This was not observed during the field programme so could
not be investigated.
BGS Report CR/04/129 (Issue 1.0) for UNIDO Contract 03/088
17
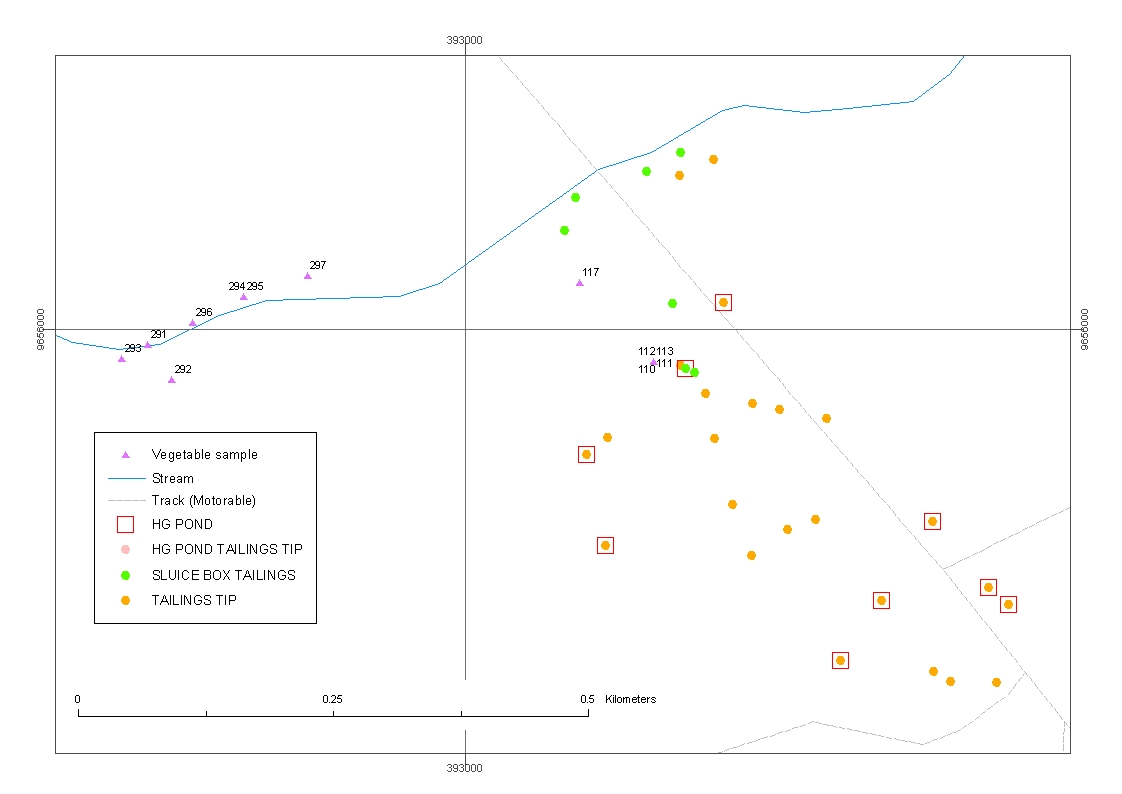
Figure 12. Location of vegetable samples compared with the distribution of tailings in the Rwamagasa area.
3.1.5 Fish
3.1.5.1 RIVER MALAGARASI
Identification of the most appropriate and practical species for monitoring was discussed with experts
from TAFIRI7 focussing on piscivores, species consumed by the local population, and food chain species
with relatively restricted domains that should provide a good indication of the availability of methyl
mercury in the food chain. An assessment of the levels of Hg in fish can allow the exposure of potentially
affected human populations to be assessed and also act as bioindicators so that Hg contamination
`hotspots' may be identified.
Fish reported to originate from the delta area, at and close to the mouth of the Malagarasi River, and also
from deeper water in Lake Tanganyika were purchased from Ilagala market (Table 1, Plates 47 and 48).
The fish had been caught using nets. Lake Tanganyika is an important source of fish both internationally
and locally8.
7 Identification of species was aided by TAFIRI staff with reference to Eccles (1992)
8 See documentation from the Lake Tanganyika Biodiversity Project at http://www.ltbp.org/OVIEW.HTM
BGS Report CR/04/129 (Issue 1.0) for UNIDO Contract 03/088
18
With assistance from Mr Kashushu, senior TAFIRI technician at Kigoma, 32 fish samples were
purchased from Ilagala market. These comprised, from Lake Tanganyika, Lates malagarasi (n = 5) and
Oreochromis tanganicae (n = 5) and from the Malagarasi River delta, Hydrocyon vittatus (n = 2),
Brycinus rhodopleura (n = 6), Auchenoglanis occidentalis (n = 5) and Clarias gariepinus (n = 6).
Examples of each species were photographed. Fish were processed in the field on the day of collection.
The samples from both the Malagarasi River and Lake Tanganyika include a range omnivorous and
piscivorous species (Table 1; Plates 49 to 55)
Attempts were made to (i) standardize sampling (especially the length of fish collected and analysed); and
(ii) collect omnivorous fish to highlight mercury methylation and the potential health hazard to people
consuming the fish. It transpired that it was neither logistically possible nor appropriate to collect benthic
invertebrates for Hg determination in this area. The length and weight of each fish sample was recorded
(Appendix 3).
At Uvinza, 9 fish samples (Table 2) were collected from the Malagarasi River by seine net by a local
fisherman (Plate 56) under the supervision of TAFIRI and BGS staff. These comprised Oreochromis
tanganicae (n = 4), Barbus tropidolepsis (n = 4, Plate 57) and Ctenopharyngodon idella (n = 1; Plate 58).
Fish were sacrificed and processed in the field on the day of collection.
Table 1. Fish species from Ilagala market (fish caught by net)
Species Common
name
Origin
Eating
Habits
Lates malagarasi
perch/lates Lake
Tanganyika Piscivorous
Hydrocyon vittolus
tigerfish Malagarasi
River
delta
Piscivorous
Brycinus rhodopleura
tigerfish Malagarasi
River
delta
Piscivorous
Oreochromis tanganicae
tilapia Lake
Tanganyika
Omnivorous
Auchenoglanis occidentalis
Malagarasi
River
delta
Omnivorous
Clarias gariepinus
catfish Malagarasi
River
delta
Omnivorous
BGS Report CR/04/129 (Issue 1.0) for UNIDO Contract 03/088
19
Table 2. Fish species from the River Malagarasi near Uvinza
Species
Common name Collection Method
Eating Habits
Oreochromis tanganicae
tilapia seine
net Omnivorous
Barbus tropidolepsis
seine
net
Omnivorous
Ctenopharyngodon idella grass carp
rod & line
Omnivorous
3.1.5.2 RWAMAGASA
Whereas soil and sediment analysis will provide indications of the potential for methylation, only an
assessment of the levels of Hg in fish/invertebrate samples, particularly fish, can indicate the extent and
magnitude of biomethylation in the aquatic environment. Collection of a wide range of fish species in the
Rwamagasa area was difficult due to the very dry conditions and restricted amount of water, which was
generally confined to ponds. Fish samples were collected from the remaining small ponds by dam and
drain, rod and line or by seine or gill net (Plates 24 and 25). The majority of the fish collected from the
Rwamagasa area were the omnivorous catfish Clarias (Plate 59), Haplochromis spp (Plate 60) or Barbus
spp (Plate 61) although some small specimens of the solely piscivorous Brycinus were collected from one
site.
The distribution of fish sample sites is illustrated in Figure 13. Species collected from each site and their
eating habits are summarised in Table 3.
Sixteen fish samples (Clarias gariepinus (n = 2) and Barbus spp (n = 14)) were collected from
Rwamagasa Pond 1 (0392479/9656023) and a further 20 fish samples were collected from Pond 2
(located about 150 metres to the west of Pond 1). These included C. gariepinus (n = 3), Barbus spp (n =
2) and Haplochromis spp (n = 15).
C. gariepinus (n = 41) and Haplochromis spp (n = 11) were collected by dam/drain from Pond 4
(0393271/9654374), located to the south of Rwamagasa and potentially impacted by historic mineral
processing activities and potentially contaminated acid (? mine) water.
Ten C. gariepinus were collected from Pond 5 (located about 150 m upstream of the main road from
Rwamagasa to Buckreef Mine) by dam/drain and rod and line. This site is close to an area where tailings
are being reprocessed by sluicing, but apparently not impacted by potential contamination from
amalgamation ponds.
Pond 6 (0389192/9654784) samples comprise Haplochromis spp (n = 8), Barbus spp (n = 12), and
Brycinus (n = 6) and Clarias spp (n = 20).
BGS Report CR/04/129 (Issue 1.0) for UNIDO Contract 03/088
20
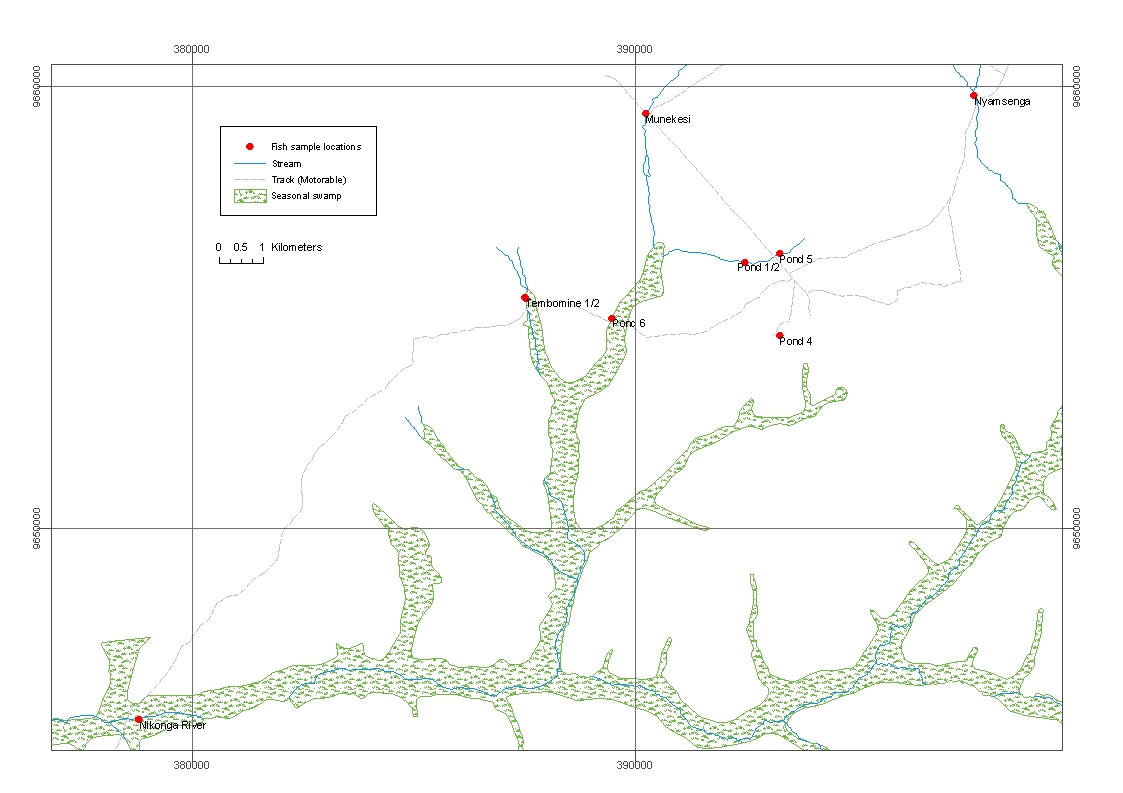
Figure 13. Distribution of fish sample sites in the Rwamagasa area.
The Nikonga River site will be impacted by potential contamination not only from the Rwamagasa, Iseni,
Tembomine, Nyamtonde, Nyamalulu, and Nyamalimbe artisanal mining areas but also by contamination
from the major historic artisanal mining activities at Nyarugusu. Very little water was present at this site
(Plate 23) and all the fish were collected by damming and draining ponds. Samples from this site
comprise C alluadi (n = 14), Synodontis victoriae (n = 1) and gastropods (n = 5).
Finally, fish samples were collected from two `background' sites considered to be located well way from
potential contamination by artisanal mining. Thirty seven C. alluadi were collected from the Nyamsenga
`background' site by dam/drain, and five samples of C. gariepinus were obtained from the Munekesi
`background' site (0390255/9659366).
For comparative purposes, twenty-five C. gariepinus were collected from the Tembomine site
(0387526/9655219 to 0387538/9655215).
In addition, five Oreochromis nitolicus samples were purchased from Rwamagasa market. These
originate from Lake Victoria and form a significant part of the diet for some of the local population.
Fish samples collected during the period 23 and 26 September were frozen whole on the day of collection
and stored until they could be processed.
The recommendations for fish sampling made in the UNIDO Protocols (Veiga and Baker , 2003) were
followed as closely as practicable, but this was constrained by two factors. The first factor is that funds
BGS Report CR/04/129 (Issue 1.0) for UNIDO Contract 03/088
21
are available for the analysis of only about 180 fish samples. The second factor was that most of the
streams in the immediate vicinity of the artisanal mining were ponded and not flowing. The only fish
species available in significant numbers were Haplochromis spp (3-5 cm), Barbus spp. and Clarias spp.
(5 to 42 cm) With very small fish, it is impractical to remove muscle tissue. In these cases, the fish were
gutted, the head and tail removed and the fish washed with deionised water before freezing. Where
individual fish are very small (3-7cm), composite samples comprising 2 to 5 individual fish of the same
species, same length range and from the same site were submitted for analysis (see Appendix 2). The
samples comprise muscle tissue, skin and bone. Analytical data for these samples will give an average Hg
content for a site/length/species combination and reduce the number of samples for analysis from more
than 250 to about 180. No published data has been encountered that describes the distribution of Hg in
Clarias fish skin, muscle tissue, gills, and liver. Published data indicates that there is no significant
difference in the bioaccumulation of Cu, Mn, Pb, Cr, Ni, Fe or Al in skin compared with muscle (of
Clarias) but Zn appears to be 2 to 3 times higher in skin compared with muscle.
Fish of a few cm in size are usually analysed without any processing (removal of head, tail and guts) but
Randy Baker (UNIDO consultant; personal communication) confirmed that it is acceptable to adopt the
procedure used in the current field programme provided that all samples, now and in the future for the
same species, are treated the same. Baker suggests that because a size-Hg relationship cannot be derived
for small fish, they should be treated more like invertebrate samples. Baker considers that small fish are
ideal biomonitors and suggested the fish should be stratified into say, three size categories: small (<3 cm),
medium (3-5 cm) and larger (5 -8 cm; or whatever categories are appropriate) and pool groups of 3 to 5
fish per composite. He suggested that ideally a minimum of 5 composites per size and sampling area
should be analysed for total Hg and compared to a reference area sample - which ideally, has the same
species, size range and composites available. Simple statistics should then indicate whether the fish
exposed to the impact of artisanal mining have consistently higher Hg than reference area fish, and
whether there are any size related issues. Adopting this strategy should ensure that the most information is
obtained within the constraints imposed by (i) the types and sizes of fish available and (ii) the available
budget.
BGS Report CR/04/129 (Issue 1.0) for UNIDO Contract 03/088
22
Table 3. Rwamagasa fish and invertebrate samples
Collection
Site Species
Common
name
Method
Eating Habits
Pond1
Clarias gariepinus
catfish seine
net
Omnivorous
Barbus spp
seine
net
Omnivorous
Pond 2
Clarias gariepinus
catfish dam/drain
Omnivorous
Haplochromis spp
dam/drain
Omnivorous
Pond 4
Clarias gariepinus
catfish dam/drain
Omnivorous
Haplochromis spp
dam/drain
Omnivorous
Pond 5
Clarias gariepinus
catfish dam/drain
Omnivorous
Pond 6
Clarias spp
catfish rod
&
line
Omnivorous
Haplochromis spp
rod
&
line
Omnivorous
Barbus spp
rod
&
line
Omnivorous
Brycinus spp (rhodopleura?)
rod
&
line
Piscivorous
Nikonga River
Cynodontis victoriae
dam/drain
Omnivorous
Gastropoda spp
dam/drain
Herbivorous
Clarias alluadi (see notes)
catfish dam/drain
Omnivorous
Tembomine
Clarias gariepinus
catfish dam/drain
Omnivorous
Munekesi
Clarias gariepinus
catfish dam/drain
Omnivorous
Nyamsenga
Clarias alluadi
catfish dam/drain
Omnivorous
Rwamagasa
Market
Oreochromis niloticus
tilapia Lake
Victoria
Omnivorous
3.2
SAMPLE PREPARATION AND ANALYSIS
3.2.1 Water
Hg analysis was by cold vapour atomic fluorescence spectroscopy (CVAFS) to a practical detection limit
of 20-30 ng/l. Water samples were subjected to a bromination stage, prior to analysis, to break down any
organo-mercury compounds. Mercury was determined in four duplicate water samples and the second
bottle from eight sample sites. The results indicate an acceptable level of reproducibility (Figure 14).
Arsenic was determined by hydride generation AFS to a practical detection limit of 0.25 µ/L (ppb).
BGS Report CR/04/129 (Issue 1.0) for UNIDO Contract 03/088
23
0.070
0.060
n
0.050
a
t
i
o
i
n
t
e
r
m 0.040
d de
n 0.030
2
L)
g/
µ 0.020
(
g
H
0.010
0.000
0.000
0.010
0.020
0.030
0.040
0.050
0.060
0.070
Hg (µg/L) 1st determination
Figure 14. Hg is duplicate filtered water samples ( duplicate sample; second bottle)
3.2.2 Sediments, tailings and soils
Bottom sediment, mineral processing tailings and soil samples were dried in a previously cleaned drying
cabinet set at a temperature of 30°C. This is slightly below the temperature of 40°C recommended by the
U.K. Standing Committee of Analysts (Mercury in waters, effluents, soils and sediments etc. additional
methods 1985). The USEPA recommends that solid samples should be dried at less than 60°C in order to
avoid Hg loss by volatilisation. Mercury loss by volatilisation during the drying process is always a
potential problem, but drying at less than 40°C should have helped to minimise this loss. The only
alternative is to digest and analyse samples and then recalculate Hg concentrations after determining loss
of weight on drying. Unfortunately, this procedure prevents the adequate homogenisation of sediment and
soil samples prior to analysis.
Dried bottom sediment, tailings and soil samples were disaggregated and ground in a Tema mill (agate)
for a few seconds. The homogenised partly ground material was split by cone and quartering and
approximately 30-50g was ground to <150 µm in an Frisch planetary ball mill (agate) for 30 minutes.
Samples (1g) for Hg determination were digested at room temp for 30 minutes in aqua regia, then placed
in a hot water bath at 90 - 95°C for one hour, allowed to cool for 2 hours and made up to 10 ml with 5%
HCl prior to determination by CV-AAS. When Hg exceeded the practical upper limit for CV-AAS (10
ppm), Hg was determined by ICP-ES.
Determination of As, Cd, Cu, Fe, Pb and Zn was by ICP-ES to practical detection limits of 2 ppm As, 0.5
ppm Cd, 1 ppm Cu, 0.01% Fe, 3 ppm Pb and 1 ppm Zn. 0.5 g of sample was leached in 3 ml 2-2-2- HCl-
HNO3-H2O) at 95°C for one hour, diluted to 10 ml and analysed by ICP-ES.
BGS Report CR/04/129 (Issue 1.0) for UNIDO Contract 03/088
24
Total Organic Carbon (Total C minus graphite C and carbonate) was determined by LECO analysis to a
practical detection limit of 0.02%.
Replicate analytical determinations indicate a generally acceptable precision although this varies with
concentration, as would be expected (Tables A-3-1, A-3-4, A-3-6). The precision data for field duplicate
soil and tailings samples are also acceptable for this type of study (Figures 15 and 16; and Table A-3-2).
140000
120000
y = 1.0819x
100000
R2 = 0.9401
e
pl
a
m
80000
nd s
2
60000
ppb)
Hg (
40000
20000
0
0
20000
40000
60000
80000
100000
120000
140000
Hg (ppb) 1st sample
Figure 15. Hg (ppb) in duplicate tailings samples
8000
7000
y = 0.956x
R2 = 0.9876
6000
e
pl 5000
a
m
nd s 4000
2
ppb)
3000
Hg (
2000
1000
0
0
1000
2000
3000
4000
5000
6000
7000
8000
Hg (ppb) 1st sample
Figure 16. Hg (ppb) in duplicate soil samples
BGS Report CR/04/129 (Issue 1.0) for UNIDO Contract 03/088
25
Some of the field duplicate sediment samples indicate significant variability in Zn and also Hg (Table A-
3-3), which might reflect inhomogeneous particulate distribution in the sediments of anthropogenic Zn
(from galvanised roof material, for example, and possibly also from ball mills) and Hg (from
amalgamation). This inhomogeneity is to be expected and is also apparent in one pair of tailings duplicate
samples (A011 and A012; Table A-3-2). More detailed investigations would be required to confirm these
observations.
Accuracy of the ICP-ES and Organic Carbon (TOC) data is good, with recoveries of 96-102% (Table A-
3-4). ACME Analytical Laboratories Ltd. recorded a recovery of 95% for CV-AAS determination of Hg
based on CANMET-STSD-4 (Table A-3-5). Slightly higher Hg concentrations were determined by ICP-
MS at the ACME Analytical Laboratories in six samples that had previously been analysed by CV-AAS
(Table A-3-5).
Repeat determination of Hg in twelve sediment and soil samples from the Naboc area in Mindanao
(Appleton, 2000) in which Hg had previously been determined by CV-AFS (BGS) confirm that the
accuracy of the Hg analyses for the present study is adequate (Table A-3-5 and Figure 17). Mercury
analyses at BGS were carried out by CV-AFS, using 1 g milled sub-samples, digested at <50oC in aqua
regia. Mercury was then determined by CV-AFS to a practical detection limit for solid samples of 0.02
mg/kg.
90
80
70
y = 0.9268x
60
R2 = 0.9935
50
) ACME CV-AAS
g 40
30
Hg (mg/k
20
10
0
0
10
20
30
40
50
60
70
80
90
100
Hg (mg/kg) BGS CV-AFS
Figure 17. Comparison of Hg determined in a range of sediment and soil samples from the Naboc area, Mindanao
(Appleton, 2000) by BGS (CV-AFS) and ACME Laboratories Ltd (CV-AAS <10 ppm Hg; ICP-AAS >10 ppm Hg).
BGS Report CR/04/129 (Issue 1.0) for UNIDO Contract 03/088
26
3.2.3 Fish and vegetables
Homogenised fish samples were prepared using a food processor. Vegetables were macerated in the food
processor to produce a fine pulp. In both cases, the whole sample was prepared in order to ensure a
representative sub-sample for analysis. The freshly macerated material was analysed and a 50g subsample
was frozen for possible future analysis. Mercury in 150 mg of prepared sample was measured directly
using a Leco AMA 254 Advanced Mercury Analyser to a reporting limit is 0.004 mg/kg. In this method
an aliquot of sample is combusted in pure oxygen and all evolved gasses are passed through a gold
amalgamator, which collects and pre concentrates any mercury present. Mercury vapour released from the
amalgamator by thermal decomposition is quantified by atomic absorption spectrophotometry.
The procedures adopted for control of analytical performance are compliant with standards described by
IUPAC Guidelines on internal Quality Control, i.e. a minimum of 10% of all samples analysed for quality
purposes; all analytical methods used are traceable, validated and controlled; continuous evaluation of
analytical system performance; defined quality procedures for sample receipt, preparation and analysis;
each sample is allocated unique laboratory reference and registered onto Laboratory Information
Management System; rigorous result approval and reporting stages.
Analytical accuracy was monitored using Certified Reference Materials (BCR 422 Cod muscle and BCR-
060 Aquatic plant) which were analysed on average once with every batch of 8 analytical samples. The
Direct Laboratory Services Ltd working range for BCR-060 (0.300 - 0.380 mg/kg) is the same as the
official BCR range. The laboratory working range for BCR-422 (0.525 - 0.603 mg/kg) is slightly wider
than the official BCR range because the analytical method used has a slightly greater uncertainty for the
sample type. These results (Table A-3-7) were used to calculate recovery figures which are in the range
94-103% for BCR-422 (cod muscle) and 90-93% for BCR-060 (Aquatic plant).
The Commission Regulation of the European Community No 466/2001 sets maximum levels for certain
contaminates in foodstuffs. For mercury the levels set vary depending on the species of fish. For most
predatory fish the allowed maximum concentration is 1.0 mg/kg (wet weight) and for non-predatory fish
0.50 mg/kg, although for vulnerable groups a limit of 0.20 mg/kg has been recommended (WHO, 1989).
All samples that exceeded the 0.50 mg/kg limit were reanalysed and replicate values reported. The EC
Directive sets a limit of 0.10 mg/kg for mercury in all vegetables except leafy vegetables, brassicas, fresh
herbs and fungi for which the maximum allowed value is 0.30 mg/kg. Only one vegetable sample, which
approached, but did not exceed, the 0.10 mg/kg threshold was re-analysed. Replicates were deemed to be
acceptable if values fell within five percent of the mean value. The analytical precision (Relative Percent
Difference) at concentrations greater than 0.5 mg/kg was +/- 2.6% and the average %RPD was 0.1%
(Figure 18 and Table A-3-7).
BGS Report CR/04/129 (Issue 1.0) for UNIDO Contract 03/088
27
3.0
2.5
)
/
kg
(mg 2.0
Hg
n
atio
y = 1.0023x
Original vs.
in 1.5
Replicate 1
R2 = 0.999
m
Orginal vs.
y = 0.9973x
replicate 2
R2 = 0.9989
1.0
licate Deter
Rep
Replicate 1
0.5
Replicate 2
Linear (Replicate 1)
Linear (Replicate 2)
0.0
0.0
0.5
1.0
1.5
2.0
2.5
3.0
Original Determination Hg (mg/kg)
Figure 18. Original vs. First and Second Replicates determinations of Hg (mg/kg) in fish and vegetable samples
Duplicate samples of 20 fish were analysed for Hg. Whereas there is a broad agreement between
determinations for duplicate samples (Figures 19 and 20) and the average combined sampling and
analytical precision (%RPD) is ±15% for samples containing >0.1 mg/kg Hg, the precision at low
concentrations (<0.1 mg/kg) is less satisfactory, ranging from 67% to +176% (Tables 4 and A-3-9). The
reason for these relatively high RPD at low Hg concentrations is not known and would require further and
more detailed investigation in future studies.
Table 4. Combined sampling and analytical precision (%RPD) for duplicate fish samples (n=20)
%RPD*
Average -13
Minimum -67
Maximum 34
Average(>0.1) -1
min (>0.1 mg/kg)
-12
max (>0.1 mg/kg)
15
Average (<0.1 mg/kg)
-4
min. (<0.1 mg/kg)
-67
max. (<0.1 mg/kg)
176
* %RPD = 100*(Original-Replicate)/((Original-Replicate)/2)
BGS Report CR/04/129 (Issue 1.0) for UNIDO Contract 03/088
28
1.4
1.2
y = 0.9937x
1.0
R2 = 0.9855
0.8
licate
p
u 0.6
) d
/
kg
(mg 0.4
Hg
0.2
0.0
0.0
0.2
0.4
0.6
0.8
1.0
1.2
1.4
Hg (mg/kg) original
Figure 19. Hg data for duplicate fish samples
0.20
0.18
0.16
0.14
y = 1.0605x
0.12
licate
R2 = 0.9227
p
u
) d 0.10
/
kg
0.08
(mg
Hg
0.06
0.04
0.02
0.00
0.00
0.02
0.04
0.06
0.08
0.10
0.12
0.14
0.16
0.18
0.20
Hg (mg/kg) original
Figure 20. Hg data for duplicate fish samples with <0.2 mg/kg Hg
BGS Report CR/04/129 (Issue 1.0) for UNIDO Contract 03/088
29
4 Mercury in water, sediment, tailings, soil, crops and
fish
4.1 WATER
Hg in filtered water samples from Ilagala on the River Malagarasi ranges from 0.01 to 0.03 µg/L and
from 0.02 to 0.03 µg/L at Uvinza. In the Rwamagasa area, Hg in filtered waters samples in ponds on the
Isingile River and other drainage channels in the immediate vicinity of Rwamagasa (Figure 21) do not
exceed concentrations detected at the two back ground sites (0.04-0.05 µg/L) apart from one sample with
0.07 µg/L (A100) located about 1 km downstream of the nearest Hg amalgamation ponds. A further 0.5
km downstream, Hg declined to 0.04 µg/L. Hg in one well located within Rwamagasa village, which was
not used for the abstraction of drinking water, contained 0.01 µg/L Hg. Hg in filtered water from a Hg
amalgamation pond (samples A108 and A109) contained 0.43 and 0.45 µg/L. These concentrations are
lower than those recorded in drainage water samples from other artisanal gold mining areas, such as the
Naboc River, Mindanao (Appleton, 20000.This reflects the smaller scale of mineral processing activities
in the Rwamagasa area and the fact that Hg is not added to ball mills.
Hg in filtered stream and river water does not exceed any of the Tanzanian Water Quality Standards or
other Water Quality Standards or Criteria for drinking water, protection of aquatic biota or protection of
human health (Table 6). As would be expected, Hg in filtered water samples from the Hg amalgamation
ponds exceeds all water quality standards (Table 6). Release of some of this mercury polluted water onto
soils and into the River Isingile drainage system is inevitable, especially during the rainy season.
Arsenic in filtered water samples from the Rwamagasa area ranged from 0.1 to 0.5 in background areas to
an average of 0.97 µg/L in the Isingile and associated drainage systems, rising to a maximum of 2.4 µg/L
(Figure 22). Concentrations of 0.5-1.5 µg/L were recorded in the filtered Hg amalgamation pond water
and 0.1 µg/L in a well. None of these arsenic concentrations exceed any water quality criteria (Table 6).
Mercury in filtered water correlates significantly with pH and arsenic in filtered water does not
correlation significantly (95% CL) with pH, Eh or conductivity (Table 7).
BGS Report CR/04/129 (Issue 1.0) for UNIDO Contract 03/088
30
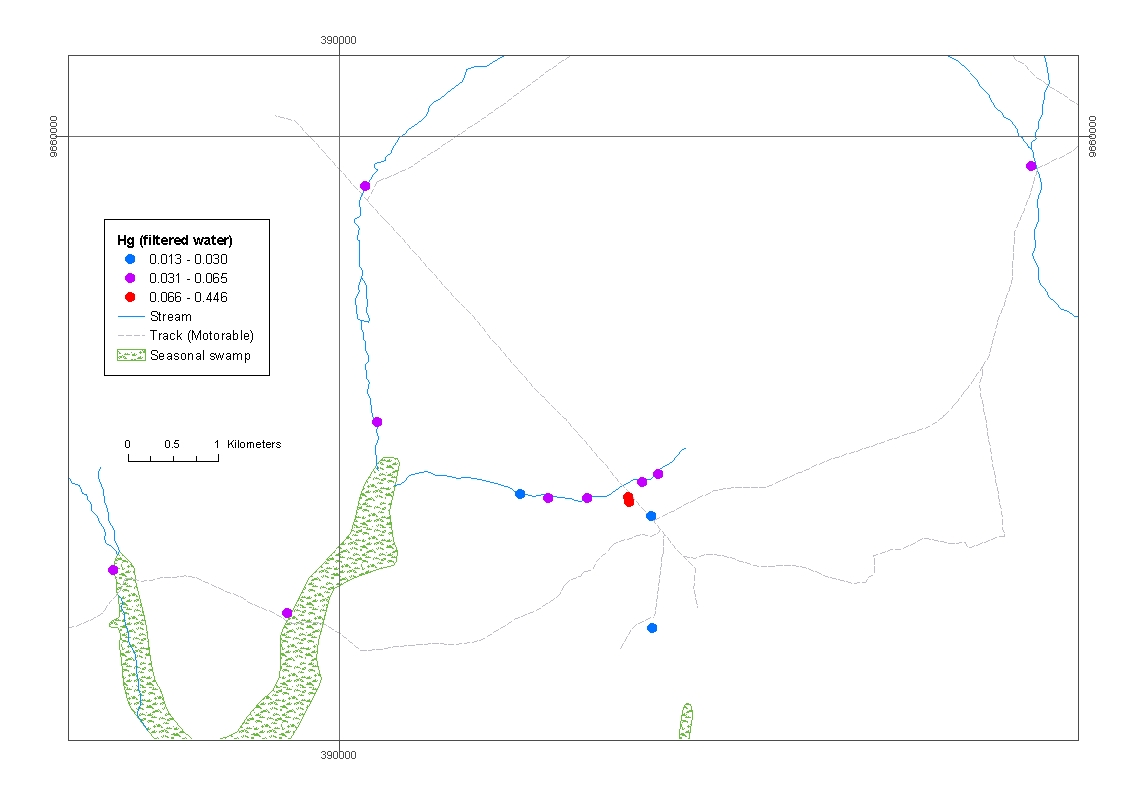
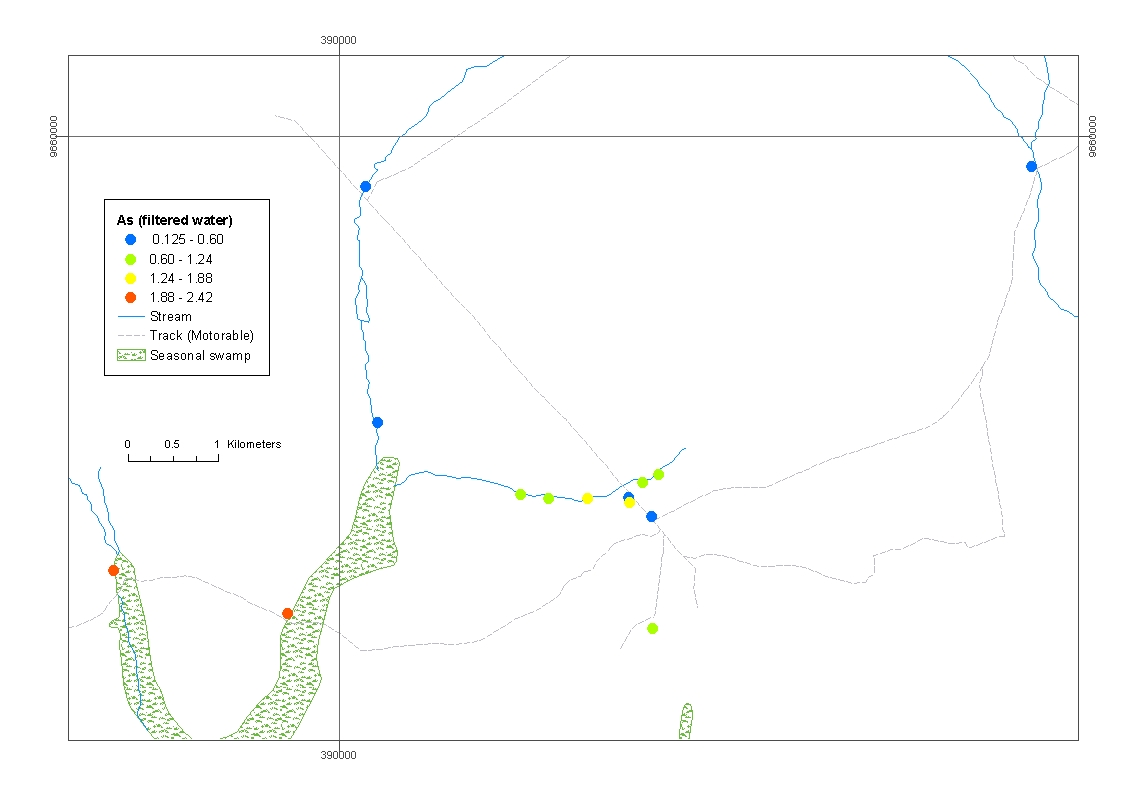
Figure 21 Mercury in filtered water (µg/L)
Figure 22. Arsenic in filtered water (µg/L)
BGS Report CR/04/129 (Issue 1.0) for UNIDO Contract 03/088
31
Table 5 Summary statistics for filtered water samples from Rwamagasa drainage system
Hg µg/l Conductivity
Eh
pH
As µg/l
Mean 0.04
394
169
7.23
0.97
Median 0.04
380
172
7.37
0.77
Standard Deviation
0.01
124
75
0.74
0.67
Kurtosis -0.12
-1
0
0.55
1.19
Skewness 0.57
0
0
0.46
1.31
Range 0.04
341
250
2.67
2.30
Minimum 0.03
242
41
6.18
0.13
Maximum 0.07
583
291
8.85
2.42
Table 6. Comparison of average (min.-max.) As and Hg concentrations in filtered water samples from the lower
River Malagarasi (n=7) and the Rwamagasa area drainage system (n=13), Rwamagasa Hg amalgamation ponds
(n=2) with Tanzania Water Quality Standards (upper section) and other Water Quality Criteria (lower section)
(concentrations in µg/l)
Tanzania Water Standards
Malagarasi Rwamagasa area-
Rwamagasa area- Hg
Drinking
Water for domestic animals,
Irrigation
River
drainage
amalgamation ponds
water
fisheries, shell-cultures,
water
recreation
As nd
0.87
(0.13-2.42)
0.54-1.50 na
na
na
Hg 0.02
(0.01-
0.04 (0.01-0.07)
0.43-0.45
1
1
5
0.03)
Freshwater1
Salt
Human
Shellfish
US
WHO
EEC
health1,5
Directive
water1
(79/923/E
EPA
DW8
DW
Max.
Cont.
Max.
Cont.
EC)4
MCL7
MAC9
Conc.2
Conc.3 Conc.2 Conc.3
As 360 190 69 36 18
3000
10
10 50
Hg 1.4
0.776
1.8
0.94
0.14
1 (0.4)
2
1
1
nd = not determined; na = not available
1 EPA National recommended water quality criteria for protection of aquatic organisms and their uses - Correction USEPA
Office of Water, EPA 822-Z-99-01 April 1999 (developed pursuant to section 304(a) of the US Clean Water Act). The criteria
refer to the inorganic form only. Freshwater aquatic life criteria vary with total hardness and pollutant's water effect ratio (WER).
Values quoted here correspond to total hardness of 100 mg/l and a WER of 1.0
2 Criteria maximum concentration (CMC) = the highest concentration of a pollutant to which aquatic life can be exposed for a
short period of time (1-hour average) without deleterious effects.
3 Criteria continuous concentration (CCC) = the highest concentration of a pollutant to which aquatic life can be exposed for an
extended period of time (4 days) without deleterious effects
4 UK-DOE "I" (imperative) values recommended for compliance with EC Shellfish Waters Directive (79/923/EEC) (NRA, 1994;
prop. revised imperative standards in brackets, DETR Consultation doc., 17/6/98)
5 Human health (10-6 risk for carcinogens) for consumption of water and aquatic organism. For 10-5 risk, move decimal point one
place to the right.
6 If the CCC exceeds 0.012 µg/l more than once in a 3 year period in the ambient water, the edible portion of aquatic species of
concern must be analysed to determine whether the concentration of methyl mercury exceeds the FDA action level of 1.0 mg/kg.
7 EPA National Primary Drinking Water Regulations (40 CFR Parts 9, 141 and 142 [WH-FRL-6934-9] RIN 2040-AB75 National
Primary Drinking Water Regulations; Arsenic and Clarifications to Compliance and New Source Contaminants Monitoring,
January 2001)
8 WHO, 1993.
9 Council of European Union Directive (98/83/EC of 3/11/98) on the quality of water intended for human consumption
10 value applies to a sample of water intended for human consumption obtained by an adequate sampling method at the tap and
taken as to be representative of a weekly average value ingested by consumers.
BGS Report CR/04/129 (Issue 1.0) for UNIDO Contract 03/088
32
Table 7. Pearson Correlation coefficients between Hg (µg/L), Conductivity, Eh, pH and A (µg/L) in Rwamagasa
drainage water samples (n=13; r95% = 0.48)
Conductivity
0.20
Eh
0.21 -0.04
pH 0.70
0.55
0.15
As
µg/l
0.26
0.45 0.08 0.20
Hg
µg/l
Conductivity
Eh
pH
4.2 DRAINAGE
SEDIMENT
In the absence of samples of suspended solids, the assessment of the extent and magnitude of dispersion
of Hg from mineral processing activities into the drainage system and Hg mobility is based on (i) the
determination of Hg in the fine (<150µm) fraction of river sediments collected from low energy, organic-
rich sites; and (ii) the observation of indicators of river water organic (humic) substances. The potential
bioavailability and mobility of Hg can be evaluated through characterization of the chemistry of drainage
sediments, for example by determining Fe (to the assess likelihood that Hg is strongly adsorbed) and
organic matter-TOC (to assess the potential for both adsorption and biomethylation).
The chemistry of the fine (<150µm) fraction of stream sediments from Ilagala and Uvinza is summarised
in Table 8. Concentrations of As, Cd, Cu, Pb and Zn are generally low, apart from K002 in which high Zn
(186 ppm) may indicate anthropogenic contamination. Hg concentrations range up to 0.655 ppm, which is
rather high for an area that does not appear to be unduly affected by anthropogenic contamination.
"Natural" background concentrations of Hg in the fine fraction of stream sediments reported in the
literature generally range up to 0.5 ppm (Babut et al., 2001); the concentration upstream of gold
processing in Ecuador range from 0.44 ppm in the Ponce Enriquez area (Appleton et al., 2001) to 0.5 ppm
at Nambija (Ramirez Requelme et al., 2003); 0.6 ppm at Carson River (Gustin et al., 1994); <0.45 ppm at
Red Devil Mine, Alaska (Gray et al., 1996); 0.5 ppm at Almaden, Spain (Berzas Nevado et al., 2003) and
up to 1 ppm in Tuscany (Ferrara et al., 1991) although these are up to more than an order of magnitude
above the level normally given for "global background" (0.01 to 0.05 ppm). Babut et al (2001) observed
that sediment samples upstream of an artisanal gold mining area in Ghana contained 0.64 and 6.3 ppm,
which the authors suggested were caused by atmospheric transport and deposition.
The sediment samples collected upstream of Uvinsa have relatively low Hg (0.17-0.24 ppm) compared
with the samples from Ilagala which range from 0.10 to 0.66 ppm. The Ilagala samples contain higher Fe
and TOC (Table 8 and Figure23) compared with the Uvinza samples, which would partially explain the
higher Hg concentrations. Concentrations reported for the River Malagarasi will be enhanced due to the
concentration effect of analysing the fine fraction, which comprises 15-50% of the bulk sediment at
Ilagala and only about 3% at Uvinza. The enhanced Fe concentrations may in part reflect the impact of
the Bukoban sedimentary rocks and andesitic basalts thought which the River Malagarasi passes in the
BGS Report CR/04/129 (Issue 1.0) for UNIDO Contract 03/088
33
transect between Uvinza and Ilagala. Other possible sources of Hg include the geothermal springs at
Uvinza (James, 1967; Tiercelin et al., 1993) and anthropogenic contamination related to the use of large
quantities of charcoal in the salt plant at Uvinza, though this would be expected to impact on the Uvinza
sediments as well. Contamination by mercuric soap used for skin-lightening may also be a factor at
Ilagala. The Hg concentrations in the Ilagala sediments are below the Toxic Effects Threshold (1ppm,
Table 9) although they are above the Minimal Effects Threshold (0.2 ppm).
Table 8. Stream sediment data for lower Malagarasi River (concentrations in ppm (mg/kg) except Fe (%) and TOC
(%)
<2mm 2mm- <150µm
(%) 150µm
(%)
Sample Area (%)
Cu Pb Zn
Fe As
Hg TOC Cd
K 001
LM
0 50 50
49 10 42 4.14 1 0.455 2.90 <0.5
K 002
LM
0 60 40
49 11 186 4.17 1 0.655 3.62 <0.5
K 003
LM
0 80 20
44 10 50 3.95 1 0.160 2.70 <0.5
K 004
LM
0 70 30
55 10 49 4.40 1 0.615 3.00 <0.5
K 005
LM
5 80 15
42 12 37 3.96 3 0.095 3.31 <0.5
K 007
UV
2 95 3
9 6 11 1.11 1 0.165 0.86 <0.5
K 008
UV
15 82 3
7 7 11 1.04 1 0.240 0.80 <0.5
Ilagala
Average LM
48 11 73 4.12 1 0.396 3.11 <0.5
Minimum LM
42 10 37 3.95 1 0.095 2.70 <0.5
Maximum LM
55 12 186 4.40 3 0.655 3.62 <0.5
Geomean LM
48 11 59 4.12 1 0.308 3.09
Standard deviation LM
5 1 64
0.18 1 0.257 0.36
Uvinza
Minimum UV
7 6 11 1.04 1 0.165 0.80 <0.5
Maximum UV
9 7 11 1.11 1 0.240 0.86 <0.5
Table 9. Comparison of heavy metals in bottom sediments from Background, Rwamagasa, and Nikonga R. areas
compared with Sediment Quality Criteria for Protection of Aquatic Life (concentrations in mg/kg).
Malagarasi Background
Rwamagasa
Rwamagasa
Nikonga
Sediment Quality Criteria!
River
areas
area
area
River
range range range average range No Minimal
Toxic
effects
effects
effects
threshold
threshold
threshold
n. 7 2 11 11
3
As 1-3
1 1-16
6 1 3 7 17
Cd <0.5 <0.5
<0.5-0.7 <0.5 <0.5 0.2 0.9
3
Cu 7-55 5-13 20-108
64 2-12 28 28 86
Hg 0.10-0.66
0.08-0.09 0.04-2.84
0.84
0.09-
0.05 0.2 1
0.19
Pb 6-12 8-18 9-38
15 3-11 23 53 170
Zn 11-186
12-20 29-325
88 5-13
100
150
540
Note: 1 Sediment Quality Criteria for Protection of Aquatic Life (Environment Canada, 1992 quoted in Haines et al., 1994).
BGS Report CR/04/129 (Issue 1.0) for UNIDO Contract 03/088
34
5
5
4
4
3
3
)
)
%
%
(
C
Fe (
TO
2
2
Ilagala (Fe)
1
Ilagala (TOC)
1
Uvinza (TOC)
Uvinza (Fe)
0
0
0
100
200
300
400
500
600
700
Hg (ppb)
Figure 23. Variation of Hg (ppb) with Fe (%) and TOC (%) at Iligala and Uvinza, Malagarasi River
In the Rwamagasa area, Hg in the fine fraction of stream sediments ranges from 0.08 to 0.09 ppm at the
two background sites. Sediments of the River Isingile impacted by Hg contamination from mineral
processing and amalgamation range from 0.04 to 2.84 ppm with an average of 0.84 ppm (Table 10 and
Figure 24). Hg in stream sediment declines to 0.09 to 0.19 ppm in the Nikonga River, about 23 km
downstream of Rwamagasa. The Hg concentration at this site on the Nikonga River is surprisingly low
considering that it could be impacted impacted by mercury contamination derived from the Rwamagasa,
Iseni, Tembomine, Nyamtonde, Nyamalulu, and Nyamalimbe artisanal mining areas and also by
contamination from the major historic artisanal mining activities at Nyarugusu.
Correlation coefficients for the Rwamagasa stream sediments (Table 11) indicate an association between
Cu-Fe-As, which is probably a geochemical signature for the Au mineralization. Less strong correlations
with Hg reflect the impact of amalgamation, and the association with TOC reflects adsorption of Cu and
Hg onto organic material. Correlations with Zn appear to be influenced by the impact of metallic Zn
contamination that could be derived from both galvanised roof sheets and also from either the lining or
solder in ball mills. Further studies are required to confirm this.
Heavy metal concentrations are conventionally assessed with respect to the Toxic Effects Threshold for
the Protection of Aquatic Life (Table 9). Hg exceeds the toxic effects threshold by a factor of up to 3 in
bottom sediment, which is much lower than factors of 55 in bottom sediment and 166 in suspended
sediment recorded for the Naboc River in Mindanao (Appleton, 2000). Hg does not exceed 1 ppm for
BGS Report CR/04/129 (Issue 1.0) for UNIDO Contract 03/088
35
more than about 2 km downstream of the major mineral processing sites to the south if the Isingile River.
This very restricted dispersion contrast sharply with that recorded in other areas such as Mindanao where
Hg is still 2 ppm some 100 km downstream of the Diwalwal artisanal mining settlement (Appleton et al.,
1999). The toxic effects thresholds for As, Cd, Cu, Pb and Zn are not exceeded in bottom sediments from
the Rwamagasa area (Table 9).
Table 10. Stream sediment data for Rwamagasa area (concentrations in ppm except Fe (%) and TOC (%))
Sub-area and
2 mm
sample
+2mm 150µm <150µm
number Statistic
(%)
(%)
(%) Cd Cu Pb Zn Fe As Hg
TOC
Background
87
5
90
5 <0.5
5
8
12
0.6
1
0.09
1.3
104
2
50
48 <0.5
13
18
20
0.8
1
0.08
2.6
average
4
70
27 <0.5
9
13
16
0.7
1
0.08
2.0
Rwamagasa
area
68
1
40
60 <0.5
82
13
59
4.8
4
3.02
4.5
69-70
1
50
50 <0.5
70
9
65
3.8
2
0.16
6.3
82-203
3
68
30 <0.5
20
12
175
1.3
2
0.19
2.1
85-106
5
73
25 <0.5
52
9
31
5.1
6
0.12
2.6
86-218
8
38
55 <0.5
59
26
325
3.4
1
0.58
3.7
88
5
90
5 <0.5
40
10
29
3.4
1
0.04
1.3
98
5
55
40 <0.5
77
14
44
6.4
9
0.39
3.8
99
5
40
55 <0.5
106
38
80
7.0
16
1.21
2.3
100
5
35
60
0.7
108
11
90
5.4
13
2.84
4.1
105
3
25
72 <0.5
40
15
35
3.1
6
0.67
3.2
107
5
40
55 <0.5
51
9
37
4.2
7
0.08
3.3
average
4
50
46
64
15
88
4.4
6
0.84
3.4
minimum
1
25
5 <0.5
20
9
29
1.3
1
0.04
1.3
maximum
8
90
72
0.7
108
38
325
7.0
16
3.02
6.3
geometric
mean
3 47
39
58
13
64
4.0 4
0.36
3.1
standard
deviation
2 19
19
28
9
89
1.6 5
1.09
1.3
Nikonga
1
0
15
85 <0.5
12
11
13
0.9
1
0.09
2.8
2
10 80
10 <0.5
5
5
5
0.3 1
0.19
1.1
3
10 60
30 <0.5
2
3
8
0.2 1
0.11
0.2
average
7
52
42 <0.5
6
6
9
0.4
1
0.13
1.3
BGS Report CR/04/129 (Issue 1.0) for UNIDO Contract 03/088
36
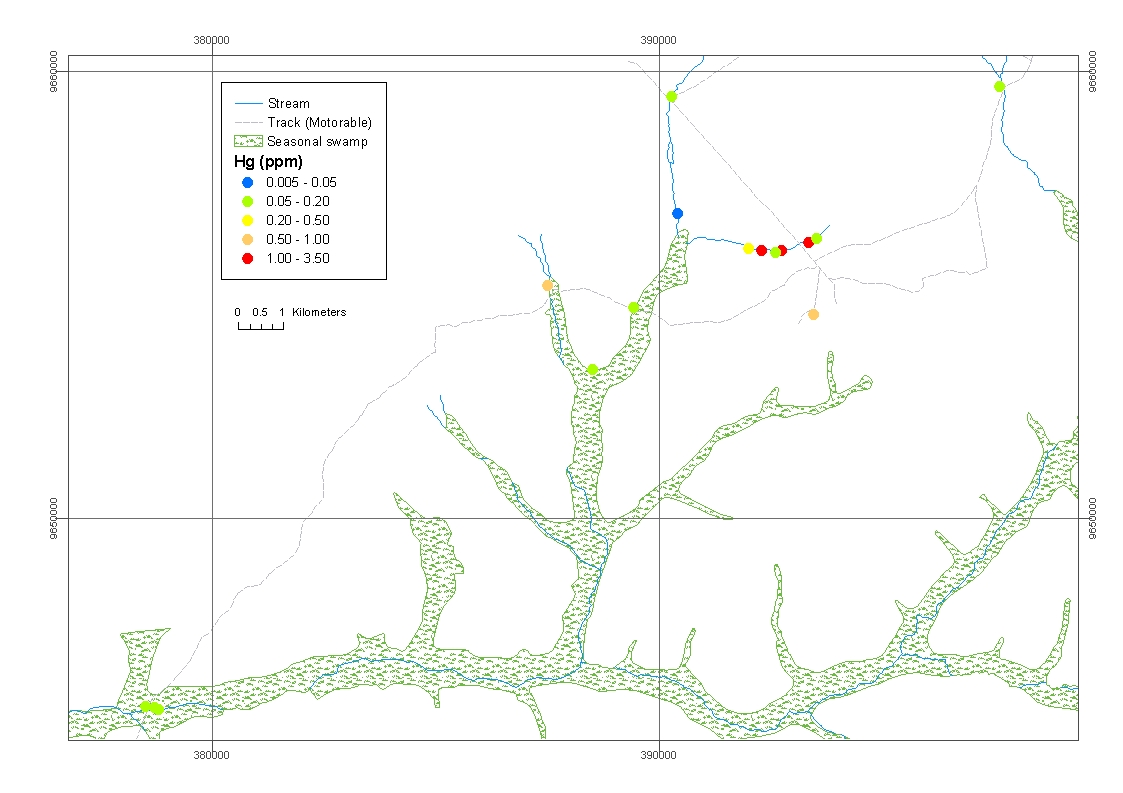
Table 11. Pearson correlation coefficients for Rwamagasa stream sediments (n=16; significance levels: r95% 0.43;
r99% 0.57)
Pb
0.52
Zn
0.29
0.48
Fe
0.93
0.49 0.18
As
0.79
0.53 0.00
0.80
Hg ppm
0.69
0.23 0.16
0.49
0.52
TOC
0.64
0.18 0.29
0.54
0.23
0.41
Cu
Pb
Zn
Fe
As
Hg
Figure 24. Mercury in stream sediment samples
It is assumed that methylation could take place during the dry season in the ponds that are found along the
course of the River Isingile (see, for example, Plates 24 & 26); in the drainage channels that are used to
channel irrigation water for vegetable cultivation; and, in the wet season, on the flooded seasonal swamp
areas of the mbugas and rice paddy fields observed at various points as far downstream as site A-82
(Figure 3).
BGS Report CR/04/129 (Issue 1.0) for UNIDO Contract 03/088
37
4.3 MINERAL
PROCESSING
WASTE MATERIAL (TAILINGS)
Summary statistics for grouped tailings samples indicate that there is little difference between Hg
concentrations in samples taken from historic (dry) tailings piles (geometric mean, GM 5 ppm) and
samples taken from recent sluice box tailings (GM 3 ppm; Table 12, Figure 25). Hg in tailings samples
from the amalgamation ponds and amalgamation pond tailings (GM 86 ppm) are on average about 20
times higher. The distribution of Hg in historic tailings tips, recent sluice box tailings and amalgamation
pond tailings is illustrated in Figures 26 and 27.
Correlation coefficients for the Rwamagasa tailings (historic and sluice box) indicate an association
between Cd-Cu-Hg-Zn (Table 13), which reflects contamination from mercury used in amalgamation
with metals that are possibly derived from the ball mills. Relatively high concentrations of Cd and Zn
occur especially in the tailings samples collected from amalgamation ponds (Figures 28 - 29 and Table
12). Ball mills are typically made of soldered metal plates so there may be Cd and Zn in the solder would
be expected to contaminate tailings. Cadmium is used extensively as a protective coating on iron and
steel, and as an alloying agent with other metals. Cadmium is also used in batteries and occurs as a
contaminant in zinc for galvanized roof sheets and steel piping. Correlations between As and Fe might
indicate an influence of trace quantities of arsenopyrite and pyrite in the gold ore. This interpretation is
confirmed by factor analysis results, which suggest Cd-Cu-Zn (ball mill contamination), As-Fe
(mineralization) and Hg (amalgamation) associations (Table 14).
Table 12. Summary statistics for grouped tailings samples (concentrations ppm except Fe)
Sample
As
Cd
Cu
Fe (%)
Hg
Pb
Zn
Sluice box tailings (32)
Average 24.4
0.7
106.5
4.6
6.9
21.4
110.5
Minimum 2.0
0.3
57.0
2.3
0.2
1.5
49.0
Maximum 46.0
6.1
353.0
7.5
39.0
101.0
513.0
Standard Deviation
9.2
1.1
52.1
1.2
9.9
17.6
82.7
Geometric mean
22.1
0.5
99.5
4.4
3.0
16.7
96.0
Tailings tips (13)
Average 18.7
2.8
140.7
4.1
9.5
11.3
315.3
Minimum 6.0
0.3
61.0
2.7
0.7
1.5
38.0
Maximum 26.5
15.7
380.0
5.6
56.5
34.0
1588.0
Standard Deviation
6.0 5.4
108.9
0.7
14.8
7.6
544.3
Geometric mean
17.5
0.8
116.1
4.1
5.0
9.3
124.3
Hg pond tailings (10)
Average 34.1
3.9
157.1
4.4
101.1
31.9
395.5
Minimum 8.5
0.3
76.0
2.6
28.5
2.3
42.0
Maximum 62.5
22.1
333.5
5.6
193.0
95.0
1971.0
Standard Deviation
17.3
6.8
75.2
0.8
53.7
26.6
593.8
Geometric mean
29.6
1.5
144.3
4.3
86.3
21.3
205.1
BGS Report CR/04/129 (Issue 1.0) for UNIDO Contract 03/088
38
200
150
.
ppm 100
g
H
50
0
1
2
3
GROUP
Figure 25. Box and whisker plot for Hg in tailings samples grouped by sample type [Groups: 1= Hg amalgamation
pond tailings; 2= Sluice box tailings; 3= Historic tailings tip (mainly sluice box tailings). Box limits are 25th and
75th percentiles; Whiskers are drawn to the nearest value not beyond a standard span from the quartiles. Any points
beyond this value (outliers) are drawn individually. The standard span is 1.5 * (Inter-quartile Range). Negative
values are treated as if 0 was specified].
Table 13. Pearson correlation coefficients for Rwamagasa tailings samples not including amalgamation pond tailings
(n=45; significance levels: 99% 0.35; 99.95% 0.48)
Cd -0.48
Cu -0.24 0.82
Fe
0.52 -0.41 -0.11
Hg -0.07 0.54 0.63 -0.19
Pb
0.43 -0.28 -0.09 0.54 -0.04
Zn -0.48 1.00 0.84 -0.38 0.57 -0.27
As Cd Cu Fe Hg Pb
BGS Report CR/04/129 (Issue 1.0) for UNIDO Contract 03/088
39
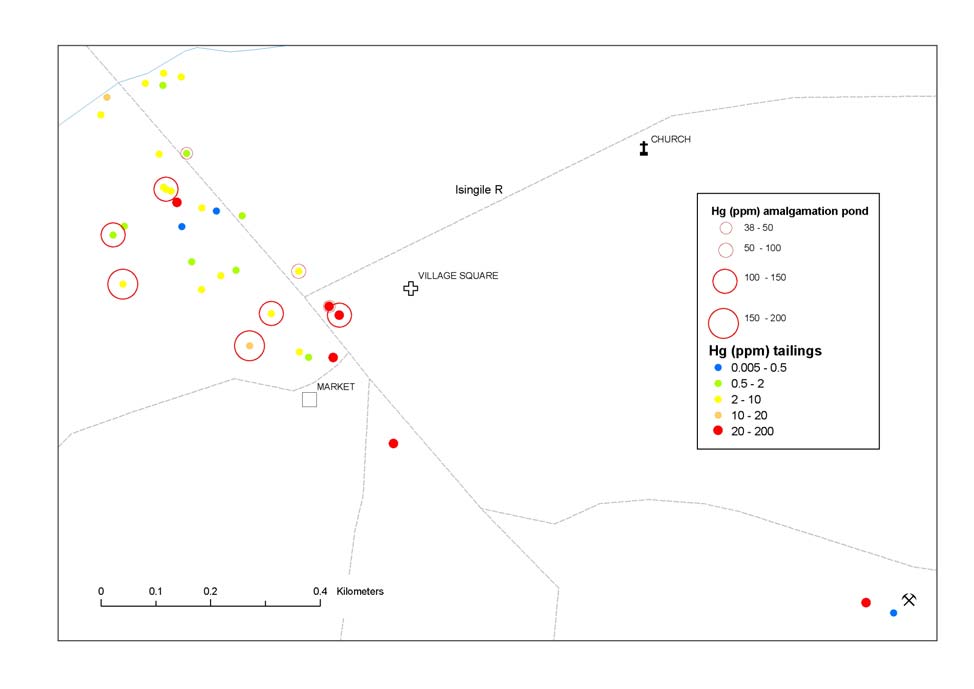
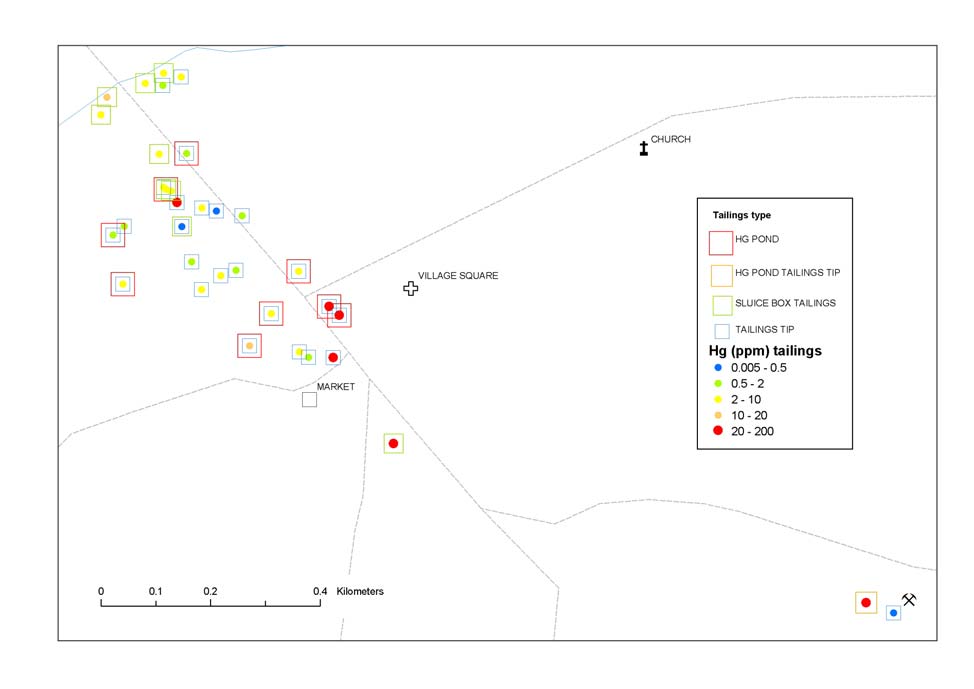
Figure 26. Hg (ppm) in tailings (filled coloured dots) and amalgamation ponds (open circles), Rwamagasa area.
Figure 27. Hg (ppm) in tailings (coloured filled circles) and tailings sample types (open squares), Rwamagasa area.
BGS Report CR/04/129 (Issue 1.0) for UNIDO Contract 03/088
40
3
2
101876
5
4
3
2
Cd
100876
5
4
3
2
1
2
3
GROUP
Figure 28. Box and whisker plot for Cd (ppm) in tailings samples grouped by sample type [Groups: 1= Hg
amalgamation pond tailings; 2= Sluice box tailings; 3= Tailings tip (mainly sluice box tailings tip)]
2
103
8
7
6
5
4
3
Zn
2
102
8
7
6
5
4
3
2
1
2
3
GROUP
Figure 29. Box and whisker plot for Zn (ppm) in tailings samples grouped by sample type [Groups: 1= Hg
amalgamation pond tailings; 2= Sluice box tailings; 3= Tailings tip (mainly sluice box tailings tip)]
BGS Report CR/04/129 (Issue 1.0) for UNIDO Contract 03/088
41
Table 14: Factor scores for 3-Factor principal component model with varimax rotation for Rwamagasa tailings
samples
Factor 1
Factor 2
Factor 3
As -0.245
0.729
0.392
Cd
0.936
-0.316
Cu
0.868
Fe -0.166
0.132
0.774
Hg 0.171
0.814
Zn
0.962
-0.278
%
of
variance 45% 20% 16%
4.4 SOIL
Generally low concentrations of Hg occur in most of the cassava, maize, rice, mbuga, and unclassified
soils whilst higher concentrations are found in the urban, mbuga and vegetable plot soils. In the former
case, Hg is probably mainly derived from air borne transport and deposition of Hg released during the
burning of amalgam, although this has not been verified. High Hg occurs in the mbuga and vegetable plot
soils where these appear to be impacted by Hg-contaminated water and sediment derived from mineral
processing activities located on the southern side of the Isingile River (Tables 15-16, Figures 30-31).
Correlation coefficients (Table 17) and factor scores (Table 18) for the Rwamagasa soil samples indicate
an association between Cd-Cu-Zn, which reflects contamination from metals that are possibly derived
from the ball mills. Relatively high concentrations of Cd and Zn occur especially in soils impacted by
mineral processing waste (Figure 17 and 18) and it is assumed that these metals are derived principally
from ball mills and galvanized roof sheets. Correlations and factor analysis associations between As, Cu
and Fe may reflect the influence of trace quantities of arsenopyrite and pyrite in the gold ore in soils that
have been impacted by mineral processing waste (Figure 19), although some of the higher As
concentrations may reflect a higher background over the mineralised greenstone rocks. As-Cd-Fe-Hg-Zn
would all be expected to be concentrated in similar situations as a result of contamination by mineral
processing waste.
Hg exceeds (1) the maximum permissible concentration of Hg in agricultural soil in the UK (1 mg/kg) in
12 soil samples;(2) the Canadian Soil Quality Guideline for agricultural soils (6.6 mg/kg) in three
samples; (3) the UK soil guideline value for inorganic Hg for allotments (8 mg/kg; Environment Agency,
2002) in two samples. The proposed Dutch Intervention value (SRC - "serious risk concentration") for
inorganic Hg (36 mg/kg; RIVM, 2001); the USEPA soil ingestion Soil Screening Level (SSL) for
inorganic Hg (23 mg/kg); and the USEPA SSL for inhalation of volatiles (10 mg/kg; USEPA, 1996); the
Dutch proposed human health SRC of 210 mg/kg or the USEPA generic SSL for plant uptake (270
mg/kg), which implies that the plant uptake pathway is not regarded as a major contributor to exposure
compared with soil ingestion (USEPA, 1996) are not exceeded in any soil samples collected during the
BGS Report CR/04/129 (Issue 1.0) for UNIDO Contract 03/088
42
present survey from the Rwamagasa area. The level of contamination of agricultural and urban soils is
therefore significantly less both in magnitude and extent than in other areas, such as the Naboc irrigation
systems (Appleton, 2000).
Cd and Zn exceed the maximum permissible concentrations for agricultural soil in the UK (3 mg Cd/kg
and 200 mg Zn/kg) in one urban soil; Cu (135 mg Cu/kg) in three urban and one mbuga soils; and Pb in
no soil samples (300 mg Pb/kg). The Dutch SRCs for human health (24-28 mg Cd/kg) and the USEPA
SSLs for soil uptake (400-622 mg Pb/kg; USEPA, 1996) are not exceeded in any of the samples
collected. Arsenic exceeds the Canadian Soil Quality Guideline for agricultural soils (12 mg/kg) in nine
agricultural and urban soils and exceeds the UK soil guideline value for inorganic As for allotments (20
mg/kg; Environment Agency, 2002) in five samples of maize, mbuga, vegetable plot and urban soils.
Table 15. Summary statistics for soils from the Rwamagasa area classified by soil use (concentrations ppm except
Fe(%) and TOC(%))
Cassava
Maize
Mbuga
Rice Unclassified
Urban
Vegetable
Count
13 18
13
25
11 26 17
Min
As
1 1
1
1
1 1 1
Max
As
12 22
23
10
10 67
30.5
Avg
As
5 4
7
4
4 9 8
Min Cd1
0.3 0.3
0.3
0.3
0.3 0.3 0.3
Max Cd1
0.3 0.3
1.3
1.1
0.3 6.2 1.1
Avg Cd1
0.3 0.3
0.4
0.3
0.3 0.5 0.3
Min
Cu
25 11
10
14
30 22
22.5
Max Cu
56
60
176
119.5
73
226
126
Avg
Cu
42 36
51
40
47 60 59
Min Fe (%)
2.87
1.05
1.05
1.03
2.42
2.56
1.53
Max Fe (%)
7.47
8.70
8.88
6.57
7.13
10.39
6.89
Avg Fe (%)
5.18
3.55
3.83
3.35
5.57
5.57
4.58
Min Hg
0.005
0.005
0.005
0.005
0.010
0.010
0.005
Max Hg
0.065
0.085
9.205
5.078
0.055
8.855
6.770
Avg Hg
0.029
0.039
0.923
0.262
0.029
0.540
0.862
Min
Pb
6 1.5
4
1.5
5 1.5 3.5
Max
Pb
13 11
14
15
12 16 15
Avg
Pb
10 6
9
9
9 8 9
Min Zn
13
8
10
12
13
11
17
Max Zn
33
65
161
138
28
651
116.5
Avg
Zn
21 26
38
30
20 76 51
Min TOC (%)
1.33
1.07
1.62
0.78
1.21
0.31
1.60
Max TOC (%)
4.87
5.90
4.00
4.60
3.56
3.24
6.25
Avg TOC (%)
2.82
2.38
2.89
3.02
2.70
2.11
3.57
1Cd <0.5 given a value of 0.25 (0.3)
BGS Report CR/04/129 (Issue 1.0) for UNIDO Contract 03/088
43
Table 16. Pearson correlation coefficients for Rwamagasa soils (n = 123; significance levels: 99% 0.21; 99.95%
0.30)
As
Cd
0.09
Cu
0.61 0.66
Fe
0.40
0.06
0.52
Hg
0.51
0.28
0.62
0.15
Pb -0.02
-0.14
-0.01
0.18
0.18
Zn
0.25
0.93
0.77
0.16
0.36
-0.12
TOC -0.21
-0.15
-0.07
-0.02
-0.11
0.26
-0.10
As Cd Cu Fe Hg Pb Zn
TOC
Table 17: Factor scores for 3-Factor principal component model with varimax rotation for Rwamagasa soil samples
(n=123)
Factor 1
Factor 2
Factor 3
As
0.845
-0.266
Cd
0.968
-0.147
Cu
0.631 0.781
Fe
0.495
0.132
Hg 0.242
0.570
Pb -0.100
0.170
0.614
Zn
0.914
0.252 -0.111
TOC
-0.110
0.452
% of variance
28%
25%
9%
101.0097654
3
2
100.009765
)
4
m
3
p
p
2
(
Hg 10-1.0097654
3
2
10-2.00976
1
2
3
4
5
6
7
GROUP
Figure 30. Hg is <2mm soil samples classified by land use [Group (no. of samples): 1 = cassava (13), 2 = maize
(18); 3 = rice 25); 4 = vegetable (17); 5 = unclassified (11); 6 = mbuga (13); 7 = urban (26)]
BGS Report CR/04/129 (Issue 1.0) for UNIDO Contract 03/088
44
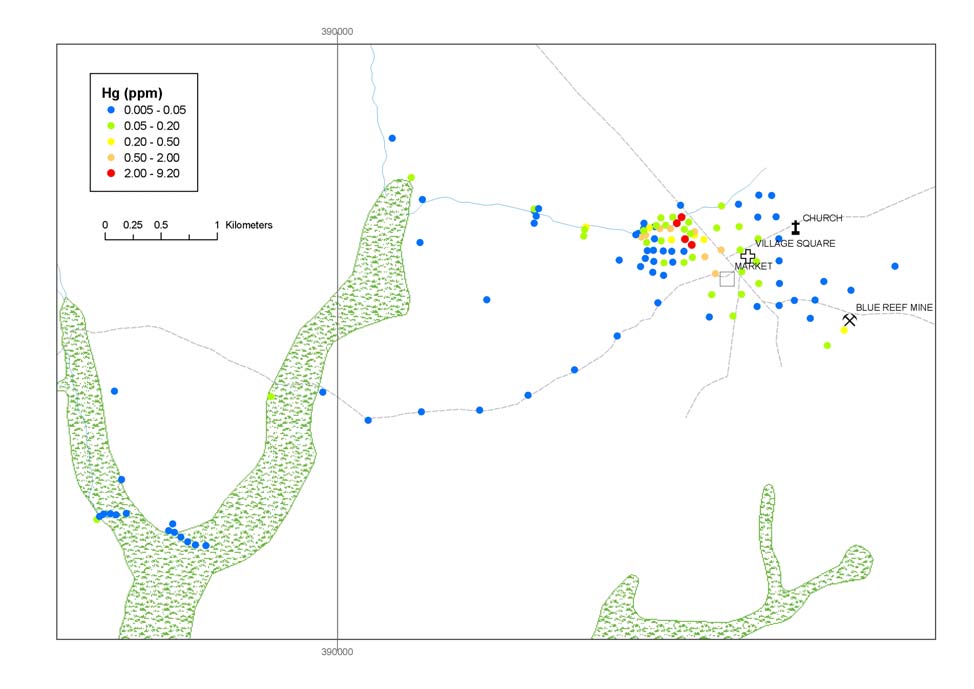
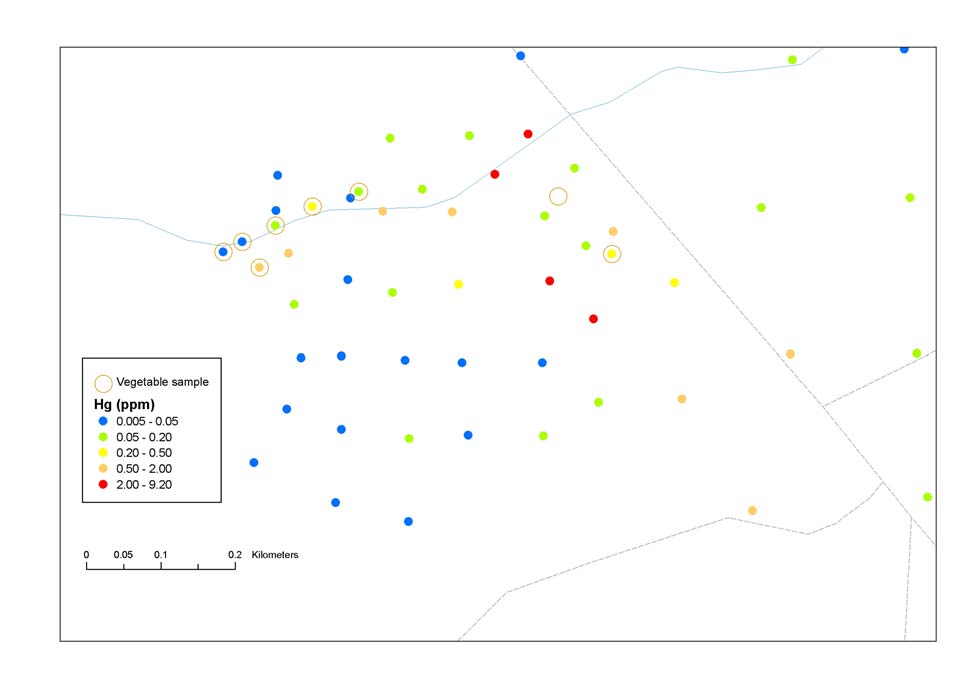
Figure 31. Hg (ppm) in soils, Rwamagasa area.
Figure 32. Hg (ppm) in soils, detailed sampling grid, Rwamagasa area.
BGS Report CR/04/129 (Issue 1.0) for UNIDO Contract 03/088
45
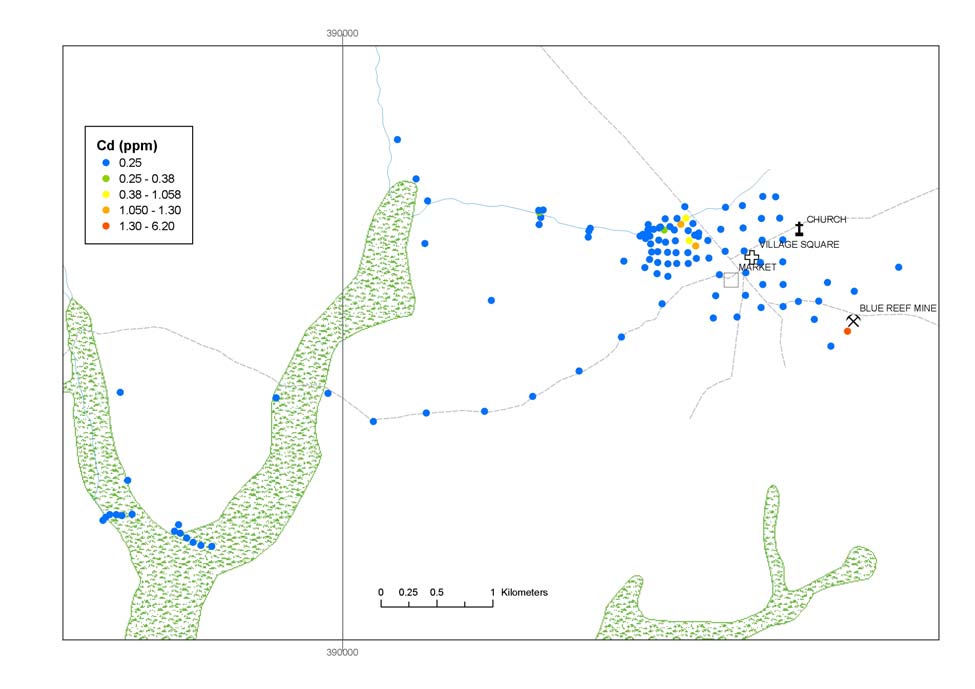
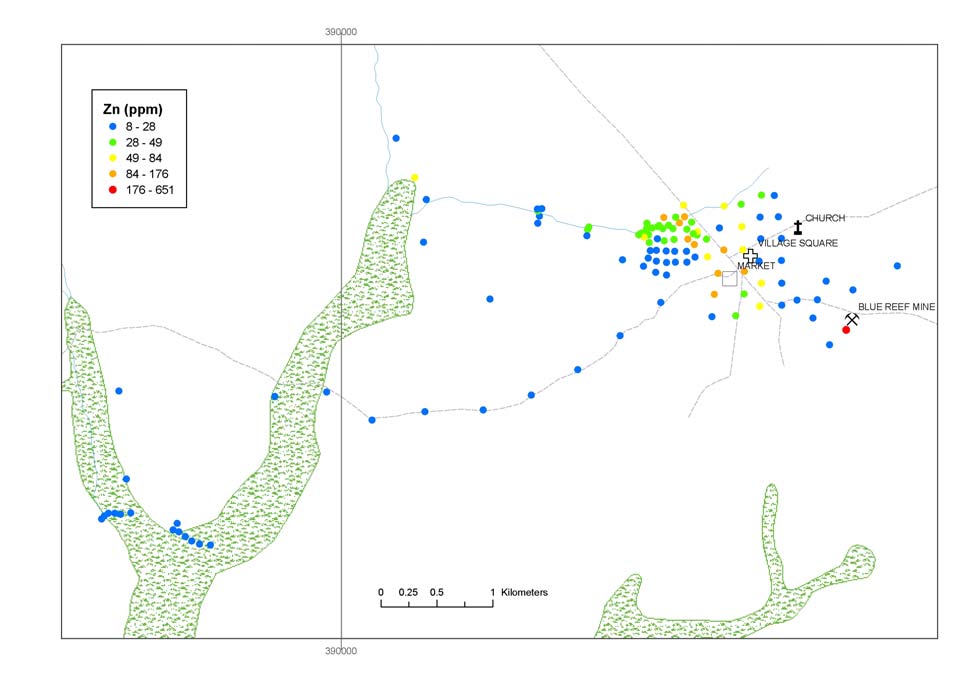
Figure 33. Cd (ppm) in soils, Rwamagasa area.
Figure 34. Zn (ppm) in soils, Rwamagasa area.
BGS Report CR/04/129 (Issue 1.0) for UNIDO Contract 03/088
46
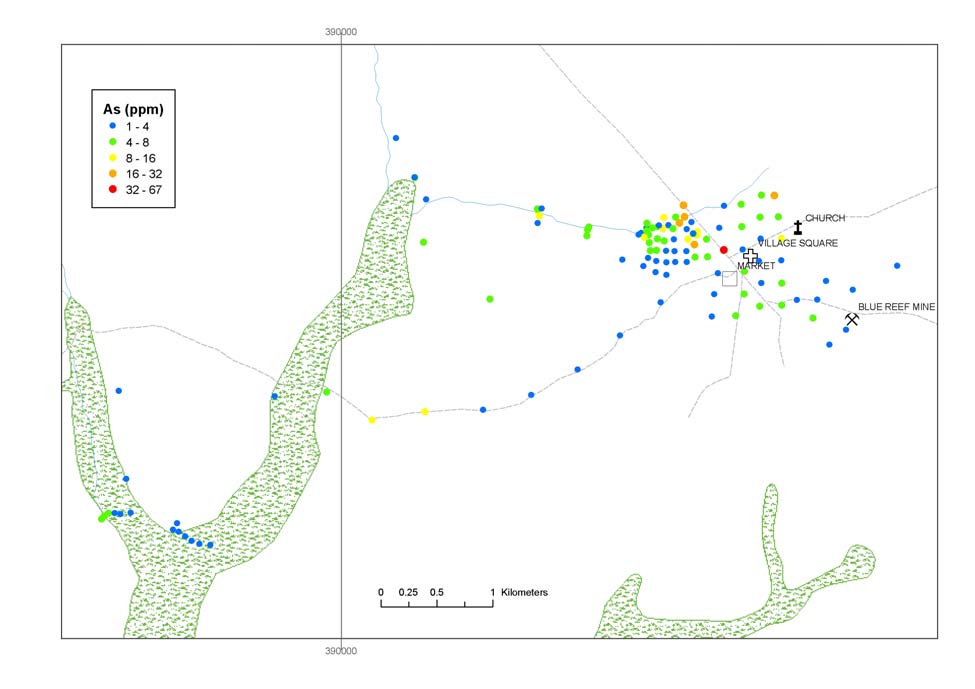
Figure 35. As (ppm) in soils, Rwamagasa area.
BGS Report CR/04/129 (Issue 1.0) for UNIDO Contract 03/088
47
Table 18. As, Cd, Cu, Hg, Pb and Zn in surface soils from the Rwamagasa area (classified by land use) compared
with soil quality guideline and limit values (concentrations in ppm (mg/kg)).
Cassava
Maize
Mbuga
Rice
Soil
Urban Vegetable
Count 13 18 13 25
11
26
17
As 1-12
1-22
1-23
1-10
1-10
1-67
1-31
Cd1 0.3
0.3
0.3-1.3
0.3-1.1
0.3
0.3-6.2
0.3-1.1
Cu 25-56
11-60
10-176
14-120
30-73
22-226
23-126
Hg 0.005-0.07 0.005-0.09 0.005-9.2 0.005-5.1 0.010-0.06 0.010-8.9 0.005-6.8
Pb 6-13
2-11
4-14
2-15
5-12
2-16
4-15
Zn 13-33
8-65
10-161
12-138
13-28
11-651
17-117
EC (UK)
Canadian
Limit
Human Health Soil Quality Guidelines
UK Soil Guideline Values
Values1
Residential
Residential
Agricultural,
with plant without plant
Commercial
residential/parkland Commercial Industrial
uptake
uptake Allotments
/industrial
As 12
12
12
20
20
20
500
na
Cd
14 49
2100 22 30
22 1400
1-3 (3)
50-140
Cu
na na
na na na na na
(135)
Hg
6.6 24
50 8 15 8 480
1-1.5 (1)
50-300
Pb
140 260
740 450 450 450 750
(300)
150-300
Zn na
na
na
na
na
na
Na
(200)
1 Limit values for concentrations of heavy metals in soils (EC Directive 86/278/EEC on the protection of the environment, and in particular of the
soil, when sewage sludge is used in agriculture. Permitted range (value adopted by the UK in brackets)
2 pH 7; 1 ppm (mg/kg) at pH6 and 8 ppm (mg/kg) at pH 8
na = not available.
Hg and other elements in soil profile 1 (A244-248, Table 19), which is located some distance from
mining contaminated areas (Figure 10) exhibits generally low Hg concentrations which decline with
depth in parallel with Cu, Zn, TOC and Fe. In this case the trace element concentrations are almost
certainly controlled by Fe and TOC rather than surface contamination. Strong surface contamination by
Cu, Pb, Zn, Cd, As and Hg is seen in the top 10 cm of Profile 2 (A267-271; location on Figure 10; data in
Table 19). TOC declines with depth whereas Fe declines and then increases with depth, which probably
explains why the trace elements do not decline below a depth of 10 cm as they will tend to increase as Fe
increases and decline as TOC declines. Profile 3 (A279-284; location in Figure 10; data in Table 19)
exhibits high Hg concentrations in the top 20 cm of the profile followed by a sharp decline to nearly
background levels at greater depths (Figure 36). TOC mirrors the Hg distribution whereas Fe generally
increases with depth. Cu, Pb, Zn and Cd are also enriched in the top 20 cm of the profile. Profiles 2 and 3
demonstrate that surface contamination by mineral processing waste affects the chemistry of the root
zone, and hoeing of the soil will lead to the homogenisation of this contamination within the root zone.
BGS Report CR/04/129 (Issue 1.0) for UNIDO Contract 03/088
48
Hg (ppm), Fe (%), TOC (%)
0
0
1
2
3
4
5
6
-10
-20
)
-30
e
pth (cm
D
-40
-50
Hg (ppm)
TOC (%)
Fe (%)
-60
Figure 36. Vertical variation in Hg (ppm), TOC (%) and Fe (%) in soil profile A279-A284 (see Figure 10 for
location)
Table 19. Chemistry of soil profile samples (see Figure 10 for locations; concentrations ppm (mg/kg) except Fe and
TOC))
Sample
Cu
Pb
Zn Fe (%)
As
Hg TOC (%)
Cd Depth*
Profile 1
A 244
14
3
11
1.07
1
0.025
2.15
0.25
-5
A 245
14
3
11
1.05
2
0.02
2.3
0.25
-15
A 246
13
1.5
7
0.93
1
0.015
1.18
0.25
-25
A 247
10
3
5
0.78
1
0.005
0.65
0.25
-35
A 248
9
1.5
4
0.57
1
0.01
0.52
0.25
-45
Profile 2
A 267
119
13
113
4.62
8
4.29
3.27
0.8
-5
A 268
36
4
32
2.73
2
0.05
1.51
0.25
-15
A 269
36
6
28
2.79
3
0.02
1.2
0.25
-25
A 270
39
6
31
3.6
2
0.025
1.11
0.25
-35
A 271
48
5
41
5.45
1
0.04
0.83
0.25
-45
Profile 3
A 279
69
12
73
4.21
7
2.65
3.34
0.5
-5
A 280
66
8
72
3.43
7
1.825
3.82
0.5
-15
A 281
45
4
28
3.89
8
0.2
1.73
0.25
-25
A 282
45
4
27
4.37
8
0.04
0.92
0.25
-35
A 283
51
6
35
4.96
6
0.065
0.66
0.25
-45
A 284
53
5
37
5.15
9
0.03
0.58
0.25
-55
*mid-point of 10 cm sampling interval
BGS Report CR/04/129 (Issue 1.0) for UNIDO Contract 03/088
49
4.5 AGRICULTURAL
CROPS
In addition to the food crops listed in the socio-economic report (maize, cassava, sweet potatoes and
bananas) vegetables, including onions, tomatoes, yams, cabbage, spinach, peppers, and beans are
cultivated on the mbuga (seasonal swamp) bordering the Isingile River, to the N of Rwamagasa. This area
is close to the main artisanal mineral processing area located at the northern edge of Rwamagasa village
and is clearly contaminated, at least in part, with mercury. The vegetables are sold in the local market and
constitute a significant part of the diet of the local people. Cotton and paddy were reported to be cash
crops in the district, but only paddy was observed in the vicinity of Rwamagasa.
The vegetable and rice plots and some of the maize plots located on the mbuga area immediately north of
Rwamagasa are irrigated using water from the Isingile R. (which was ponded at the end of the dry season,
and not flowing). Although the filtered water samples collected during the present survey had low
concentrations, some of the sediments and soils contain relatively high Hg concentrations.
Hg in vegetable and grains samples collected from the agricultural areas potentially impacted by Hg
contamination are mainly below the detection limit of 0.004 ppm Hg with concentrations of 0.007 and
0.092 ppm Hg recorded in two yam samples and 0.035 ppm Hg in one rice sample (Table 20). A positive
correlation between Hg in agricultural crops and soil was not detected during the present survey (Table
20).
Hg in beans, onions and maize samples purchased at Rwamagasa market are below the detection limit
(<0.004 mg Hg/kg) whilst two dehusked rice samples contain 0.011 and 0.131 ppm Hg (Table 21)
Table 20. Hg in vegetable and grain samples with associated soil sample
Hg (ppm) in
Soil sample number
Hg (ppm) in
Number Description
vegetable or grain
soil
105 Yam
0.007
105* 0.67
110 Yam
0.092
114, 115
0.66
111 Maize
<
0.004
114, 115
0.66
112 Cabbage
<
0.004
114, 115
0.66
113 Onions
<
0.004
114, 115
0.66
117 Rice
0.035 between 237 & 272
0.12
291 Onion
<
0.004
291 0.05
292 Yam
<
0.004
292 1.56
293 Cabbage
<
0.004
293 0.005
294A
Beans Fresh
< 0.004
294 0.275
294B
Beans Fresh
< 0.004
294 0.275
295
Beans Fresh
< 0.004
294 0.275
296 Tomatoes
<
0.004
296 0.085
297 Maize
<
0.004
297 0.055
* sediment sample
BGS Report CR/04/129 (Issue 1.0) for UNIDO Contract 03/088
50
Table 21. Hg in vegetable and grain samples from Rwamagasa market
Number Description
Hg (ppm)
303
Maize Dry
< 0.004
304 Rice
0.011
305 Rice
0.031
306 Onions
<
0.004
307
Dry Green Beans
< 0.004
308
Dry Green Beans
< 0.004
309
Dry White Beans
< 0.004
310
Dry Mixed Beans
< 0.004
The concentrations of Hg in rice are similar to those recorded for rice grown on the highly contaminated
soils of the Naboc irrigation system (average 0.016, range 0.008 to 0.050 ppm Hg, wet weight; Appleton,
2000). Machiwa et al. (2003) reported similar concentrations of Hg in rice growing in Hg contaminated
ground at Saragurwa (0.04 ppm) with much higher concentrations at Nyarugusu (0.09 ppm), Nungwe
(0.13 ppm), Nyangalamila (0.25 ppm) and Lwamgasa (Rwamagasa, 0.29 ppm). All these values were
converted from dry weight (dw) basis to wet weight (ww) basis by dividing by 1.3, which is the wet/dry
weight ration for rice from the Naboc area (Appleton et al., in preparation). Comparison with data for the
Quingzhen and Wanshan areas in China (Horvat et al., 2003) indicates that the rice Hg concentrations
recorded by Machiwa et al., (2003) are unusually high in relationship to the Hg concentrations recorded
in soils and sediments. Machiwa et al. (2003) observed that there was no significant difference in Hg
concentrations between samples grown in areas impacted by the washing of gold ore and areas where no
gold washing was carried out. Machiwa et al., (2003) recorded 1.42 ppm (ww) in a yam sample from
Samina, which is more than an order of magnitude greater than the maximum recorded during the present
survey (0.092 ppm).
BGS Report CR/04/129 (Issue 1.0) for UNIDO Contract 03/088
51
4.6 FISH
4.6.1 Introduction
Fish muscle tissue samples should ideally be considered separately from whole fish (from which the head,
tail and guts have been removed). A size-Hg relationship cannot be readily derived for small fish, which
should be treated as biomonitors, the Hg concentrations of which can be used to indicate whether fish
exposed to the impact of artisanal mining have consistently higher Hg than fish of the same species and
size range from `background' or `reference' areas. Muscle tissue and whole fish samples for the same
species and in adequate numbers, were obtained at only two sites (Clarias alluadi, Nymamsenga; Clarias
gariepinus, Rwamagasa Pond 4). Average length and Hg data are presented in Tables 22-23 and
individual fish data are plotted in Figure 38, together with data for Clarias gariepinus from Tembomine,
which is the only site from which sufficient samples with a range of sizes were obtained to establish a Hg-
length relationship. Although there are only three samples of muscle tissue from Nyamsenga, Hg in these
is slightly higher than in the whole fish samples. The relationship between muscle and whole fish samples
from Pond 4 is less systematic. In the following discussion of the results, whole fish and muscle tissue
samples from the same site are plotted as one sample population.
With the exception of a laboratory study by Ikingura and Akagi (2002), in which a non-indigenous gold
fish (presumably a carp species) were exposed to Hg spiked sediments, studies of Hg in fish tissues
collected in this region have focussed on assessing human exposure through fish consumption.
Consequently most published data is derived from the fish populations of Lake Victoria, and these have
been shown to be largely unaffected by Hg from the Lake Victoria Gold Fields (LVGF) (Machiwa et al.,
2003).
Hg concentrations are described with reference to the international marketing limit for the export of fish
to the European Union, the United States and Canada, which is based on the FAO/WHO guideline level
of 0.5 ppm wet weight total Hg (THg). To protect vulnerable groups (frequent fish consumers, pregnant
women and those under 15 yrs old), the WHO has recommended a lower guideline level of 0.2 ppm wet
weight. Mean total wet-weight Hg concentrations are summarised by area, site and species in Tables 22
to 25.
Table 22. Total Hg concentrations in fish in the Rwamagasa background areas.
Site
Species
Sample type
Mean L Mean Hg & range ppm (µg/g) n
mm
Munekesi
Clarias gariepinus Muscle tissue
201
0.119 (0.048-0.199)
4
Clarias gariepinus Whole fish
136
0.150 (0.138-0.161)
2
Nyamsenga
Clarias alluadi
Muscle tissue
161
0.134 (0.078-0.231)
3
Clarias alluadi
Whole fish
93
0.083 (0.044-0.115)
11
BGS Report CR/04/129 (Issue 1.0) for UNIDO Contract 03/088
52
Table 23. Total Hg concentrations in fish and gastropods in the Rwamagasa area.
Site
Species
Sample type
Mean L
Mean Hg & range
n
mm
ppm (µg/g)
Rwamagasa
Oreochromis
Muscle tissue
171
0.009 (0.002-0.031)
5
market
niloticus
Rwamagasa
Barbus spp
Whole fish
54
1.05 (0.684-1.53)
5
Pond 1
Clarias gariepinus Muscle tissue
142
1.61 (1.24-1.97)
2
Rwamagasa
Clarias gariepinus Whole fish
67
1.67
1
Pond 2
Haplochromis spp Whole fish
30
2.06 (0.995-2.65)
5
Rwamagasa
Clarias gariepinus Muscle tissue
173
0.336 (0.163-0.637)
7
Pond 4
Clarias gariepinus Whole fish
111
0.222 (0.092-0.510)
12
Haplochromis spp Whole fish
47
0.323 (0.195-0.443)
4
Rwamagasa
Clarias gariepinus Whole fish
119
0.779 (0.189-1.64)
4
Pond 5
Rwamagasa
Barbus spp
Whole fish
42
0.301 (0.285-0.318)
4
Pond 6
Brycinus spp
Whole fish
67
0.338 (0.206-0.398)
6
Clarias
Whole fish
85
0.267 (0.187-0.431)
4
alluadi
Clarias gariepinus Whole fish
134
0.538 (0.339-0.792)
5
Haplochromis spp Whole fish
33
0.167 (0.145-0.189)
2
Nikonga River Clarias alluadi
whole fish
86
0.071 (0.055-0.084)
5
Cynodontis
whole fish
44
0.265
1
victoriae
Gastropoda
muscle tissue
41
0.040 (0.019-0.069)
5
Table 24. Total Hg concentrations in fish at Tembomine.
Site
Species
Sample type
Mean L
Mean Hg & range
n
mm
ppm (µg/g)
Tembomine
Clarias gariepinus Muscle tissue
227
0.792 (0.173-1.84)
25
BGS Report CR/04/129 (Issue 1.0) for UNIDO Contract 03/088
53
Table 25. Total Hg concentrations in fish in the Lake Tanganyika area.
Site
Species
Sample type
Mean L
Mean Hg & range
n
mm
ppm (µg/g)
Uvinza
Barbus
Muscle tissue
122
0.030 (0.021-0.033)
4
tropidolepsis
Oreochromis
Muscle tissue
121
0.046 (0.014-0.074)
4
tanganicae
Ilagala Market Auchenoglanis
Muscle tissue
233
0.014 (0.005-0.034)
5
occidentalis
Brycinus
Muscle tissue
201
0.028 (0.025-0.032)
3
rhodopleura
Clarias gariepinus Muscle tissue
282
0.022 (0.002-0.042)
6
Hydrocynus vittatus Muscle tissue
197
0.034 (0.023-0.044)
8
Lates malagarasi
Muscle tissue
202
0.025 (0.011-0.043)
5
Oreochromis
Muscle tissue
140
0.013 (0.007-0.021)
5
tanganicae
10000
4.0
ppb
3.5
y = 1.2665x + 1.1439
R2 = 0.2681
3.0
1000
500 ppb
2.5
200 ppb
100
2.0
Log THg ppb
1.5
10
1.0
C gariepinus Tembomine
C gariepinus Pond 4 (muscle)
C gariepinus Pond 4 (whole fish)
0.5
C alluadi Nyamsenga (muscle)
C alluadi Nyamsenga (whole fish)
Linear (C gariepinus Tembomine)
0.0
0.0
0.2
0.4
0.6
0.8
1.0
1.2
1.4
1.6
1.8
Log L cm
Figure 37 Hg (ppb) related to length (cm) for muscle tissue and whole fish samples collected at the same sites in the
Rwamagasa area.
4.6.2 Results by site and species
At the two sites selected for background samples in the Rwamagasa area (Munekesi and Nyamsenga,
Table 22) only one specimen, with at 0.231 ppm Hg, of the twenty Clarias alluadi sampled had tissue
THg concentrations exceeding the WHO recommended guideline for vulnerable groups (0.2 ppm) and all
were below the export guideline (0.5 ppm).
BGS Report CR/04/129 (Issue 1.0) for UNIDO Contract 03/088
54
Samples of Oreochromis nitolicus were obtained from Rwamagasa market and were reported to originate
from Lake Victoria. Fresh fish is very limited in Rwamagasa, making the collection of samples of locally
consumed fish difficult, hence only nile tilapia, a detritivore/herbivore that occasionally consumes
invertebrates and smaller tilapia, were available. The mean THg concentration of the market fish was
well below both guideline levels at 0.009 ppm and also considerably lower than the levels found in the
background Clarias spp samples from Munekesi and Nyamsenga. Higher levels of Hg have been found
in O. nitolicus from Lake Victoria (Harada et al 1999, Campbell et al 2003a), but on the whole the level
found here is consistent with the findings of other studies of Lake Victoria fishes (Machiwa et al 2003,
Kahatano et al 1997, Ikingura 1996) and those of other lakes in this region (Campbell et al 2003b).
THg concentrations in fish collected from the reaches of the Isingile river closest to Rwamagasa (Ponds 1
and 2, Figure 13), consistently exceeded guideline values for export markets (Table 23). All of the
specimens collected were very small, most likely because of their juvenile status although possibly
augmented by poor growth. The predominantly insectivorous Barbus spp. from Pond 1 showed the lowest
tissue concentrations at 1.05 ppm but were still twice the export guideline value. Both Ikingura (1996)
and Kahatano (1997) found much lower levels (<0.020 ppm) in comparatively large insectivorous African
tetra collected from Nungwe Bay and Mwakitolyo Mine/Mwanza, but this may reflect of differences in
the specific ecological niches and feeding behaviour of the different species. Larger specimens of the
Barbus genus collected from Lakes Baringo and Naivasha by Campbell (2003b) contained THg
concentrations up to 0.100 ppm, an order of magnitude lower than those collected in Rwamagasa.
Clarias gariepinus from both Pond 1 and 2 showed similar average tissue Hg concentrations at over three
times the guideline level, despite the different tissue sampling methods that were used. The tissue THg
levels found in these two ponds are particularly high (Table 23 and Figure 38) and, in the case of this
species, may be due to its sediment dwelling and feeding behaviour, and its ability to survive in poor
quality water from which it may accumulate Hg. Few studies in this region have studied fish tissue THg
as a means of identifying environmental hotspots, therefore little data is available for smaller fishes
affected by Hg contamination. However, van Straaten (2000) reported a tissue concentration of 2.55 ppm
THg for a single specimen of Clarias spp caught in a tailings pond in the Kahama District in northern
Tanzania but no other data (size, length or weight) was reported. The sediment THg data indicates that
these two Rwamagasa ponds are affected by tailings; the mean sediment THg was 0.798 ppm compared
with 0.080 ppm across the two Rwamagasa background areas (Table 26). The elevated tissue
concentrations of some specimens, compared with the sediment concentrations in these two ponds, might
be interpreted as an indication of bioconcentration. However, due to the poor conditions for fish
sampling, insufficient data is available to allow closer examination using length-THg relationships.
Haplochromis spp. are generally planktivores; those collected from Pond 2 showed the highest THg
levels, at over four times the guideline, of the four species represented in Ponds 1 and 2. That there
appears to be a marked difference between the tissue concentrations of Barbus and Haplochromis may be
a reflection of differences in very specific ecological niches. Larger Haplochromis spp. caught in the
Mara and Mwanza regions of Lake Victoria showed maximum tissue THg levels of 0.420 ppm, which
BGS Report CR/04/129 (Issue 1.0) for UNIDO Contract 03/088
55
exceed the recommended level but are permissible for export (Machiwa et al, 2003). By comparison
Campbell found a tissue level of a single small specimen of Haplochromis spp. caught in Lake Naivasha
to be 0.005 ppm.
Where affected waters have been studied only top predator, piscivorous fishes have tended to contain Hg
levels as high as those found in the planktivorous and omnivorous species in Ponds 1 and 2. For example,
in a review of THg concentrations in fishes from Lake Victoria, levels up to 1.2 ppm were detected in
large nile perch in the Mwanza Gulf (Campbell et al 2003a). Similarly high levels of Hg have also been
observed in large piscivorous fish collected from a hydroelectric reservoir in Canada, although Tanzanian
reservoir fishes examined in the same study showed very low levels of Hg (Ikingura and Akagi 2003).
Average Hg concentrations of C. gariepinus collected from Pond 5 also exceeded the export guideline
and almost all specimens exceeded the recommended guideline. Individual specimens ranged from 0.189
to 1.64 ppm THg (mean 0.779 ppm). However, the fish were clearly stressed, either as a result of their
capture or of the quality of their environment, and in poor condition. The Tembomine fish THg levels
were comparable to the samples from Pond 5, although individual specimens spanned a much wider size
range (Table 24). These levels are comparable to those found in the same species collected from the
Isagana (Isanga) River, which is affected by the Bulyankulu and Katende Mines, and Winam Gulf in
Kenya (Campbell et al., 2003a) although based on their reported weights (no length data was reported),
those fish were considerably larger than those tested here. The sediment THg levels indicate that both
Pond 5 (3.02 ppm) and Tembomine (0.670 ppm) were also affected by tailings. In Campbell's review
(2003a) similar concentrations were found in stream sediments in which the catfish were caught at
Bulyankulu Mine.
By comparison, C. gariepinus and Haplochromis spp. collected from Pond 4, which is isolated from the
Isingile River channel, showed tissue THg concentrations exceeding the recommended guideline but
below the export guideline. The tissue of C. gariepinus contained higher THg concentrations (0.336 ppm)
than the composited whole fish samples (0.222 ppm). This is most likely a reflection of the length
dependency of fish tissue Hg concentrations rather than of the sampling method used. Sediment levels at
Pond 4 ranged between 0.315 and 0.850 ppm (Table 26).
The water quality of Pond 6 is influenced both by the Isingile River and by the outflow from Buckreef.
Sediment concentrations were relatively low compared with those closer to Rwamagasa. Tissue THg
concentrations varied with species with the piscivorous Brycinus spp. and insectivorous Barbus spp.
tissue levels between the two guideline values. C. gariepinus showed the highest mean concentrations
and were above the export guideline, despite the relatively low sediment concentrations. Again this is
most likely a reflection of its sediment dwelling behaviour as Kahatano et al (1997) were able to compare
sediment dwelling omnivores with predatory species in the LVGF and also found higher tissue THg
levels in the catfish compared with predatory species. Specimens of C. alluadi showed tissue Hg
concentrations greater than 0.200 ppm but lower than those of C. gariepinus. This may be attributable to
the ability of C. gariepinus to survive out of water for longer periods than C. alluadi and this species is
BGS Report CR/04/129 (Issue 1.0) for UNIDO Contract 03/088
56
able to migrate from pools in which the water level is very low. C. gariepinus collected from Pond 6 may
have migrated downstream from areas affected by mining activities.
Fish collected from the Nikonga River typically contained tissue Hg levels comparable to those of the O.
nitolicus from Lake Victoria, i.e. well below the recommended guideline. The gastropods tested also
contained very low levels of Hg (Table 23), which is probably a consequence of this species herbivorous
grazing feeding characteristics. Similarly all the samples collected from the Lake Tanganyika area
(Uvinza and Ilagala, Table 25) had tissue THg levels well below the recommended guideline and were
comparable to those of the Lake Victoria O. nitolicus samples. The exception was the single specimen of
Cynodontis collected from the Nikonga River, again a benthic feeder, which may have taken on Hg from
the sediment as it fed. In much larger specimens from Lake Victoria Machiwa et al (2003) found THg
concentrations of <0.080 ppm. Of the samples collected at Uvinza, the insectivore Barbus tropidolepsis
had lower tissue Hg levels compared with O. tanganicae.. The Ilagala market samples on the other hand
showed the more common pattern of slightly higher tissue THg in the top predators i.e. Lates malagarasi,
Brycinus rhodopleura and Hydrocynus vittatus compared with the other omnivorous species sampled.
Table 26. Total Hg concentrations in sediments at fish sampling points
Site
Mean Hg & range
ppm (µg/g)
Rwamagasa Pond 1 & 2
0.798 (0.385-1.21)
Rwamagasa Pond 4
0.583 (0.315-0.850)
Rwamagasa Pond 5
3.02
Rwamagasa Pond 6
0.120 (0.085-0.175)
Nikonga River
0.128 (0.090-0.190)
Tembomine 0.670
Munekesi and Nyamsenga
0.080 (0.075-0.085)
BGS Report CR/04/129 (Issue 1.0) for UNIDO Contract 03/088
57
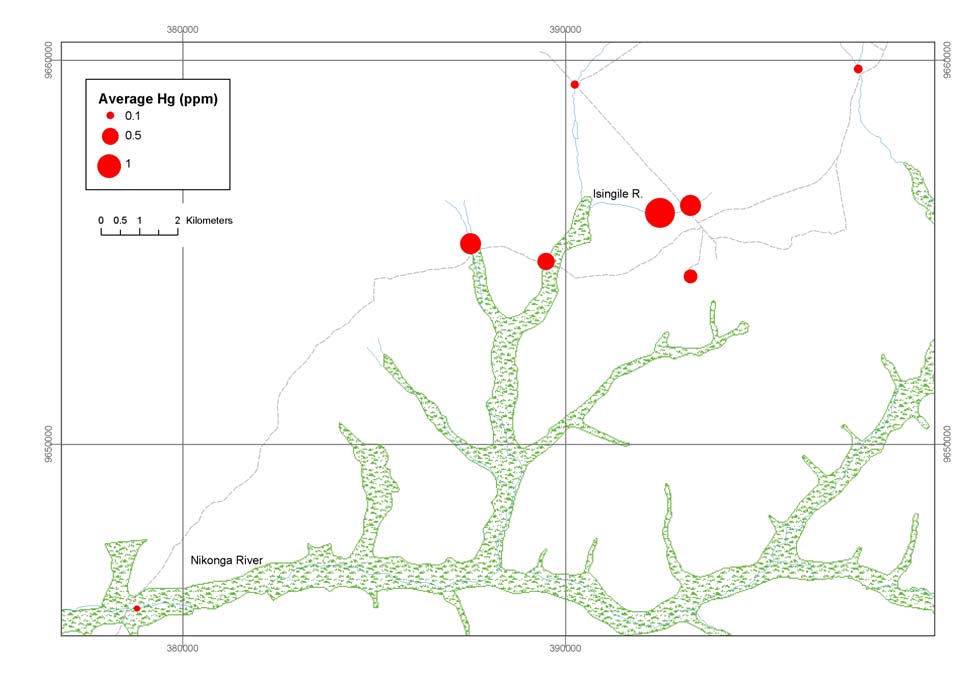
Figure 38. Average Hg (ppm) in Clarias spp. for fish sampling sites in the Rwamagasa area
BGS Report CR/04/129 (Issue 1.0) for UNIDO Contract 03/088
58
Table 27. Average concentration of Hg (ppb) in fish from the Rwamagasa area, Malagarasi River Lake
Tanganyika (Uvinza & Ilagala) and Lake Victoria
Species (common or local
Area Mean
Hg
Source
name)
(ng/g, ppb)
Lates spp. (perch)
Ilagala
25
1
Lake Victoria
123
2
Nungwe Bay, Lake Victoria
10
3
Lake Victoria (Mara and Mwanza)
61
4
Lake Tanganyika (Burundi)
<50
5
Oreochromis spp (tilapia) Ilagala
13
1
Uvinza
46
1
Rwamagasa Market (Lake Victoria)
9
1
Lake
Victoria
19
2
Nungwe Bay, Lake Victoria
2
3
Lake Victoria (Mara and Mwanza)
84
4
Clarias spp. (catfish)
Ilagala
22
1
Rwamagasa background areas
100 1
(Munekesi & Nyamsenga)
Rwamagasa
Pond
1
1610
1
Rwamagasa
Pond
4
336
1
Tembomine
792
1
Lake
Victoria
19
2
Nungwe Bay, Lake Victoria
2
3
Lake Victoria (Mara and Mwanza)
132
4
Rastrineobola spp. (dagaa)
Lake Victoria
23
2
Barbus spp. (dagaa)
Rwamagasa Pond 1
1050
1
Barbus spp. (dagaa)
Rwamagasa Pond 6
301
1
Brycinus spp. (tigerfish)
Ilagala
28
1
Lake Victoria (Mara and Mwanza)
92
4
Haplochromis spp (furu)
Rwamagasa Pond 2
2060
1
Rwamagasa
Pond
4
323
1
Lake Victoria (Mara and Mwanza)
154
4
Source of data: 1= this study; 2 = Campbell et al., 2003; 3 = Ikingura and Akagi, 1996; 4 = Machiwa et al., 2003; 5 =
Sindayigaya et al., 1994.
4.6.3 Length mercury relationships
Data from the Lake Victoria Environmental Management Project (LVEMP) (Machiwa et al 2003) are
compared with the fish tissue data for Rwamagasa and Lake Tanganyika in Figures 39 to 41 in which
species and area are plotted separately but data is compared according to the species' broad trophic status.
These comparisons are tentative as the LVEMP data was digitised from a dry weight basis and then
BGS Report CR/04/129 (Issue 1.0) for UNIDO Contract 03/088
59
transformed to wet weight concentrations using Machiwa's mean conversion factors of 0.290 (L.
nitolicus), 0.256 (O. nitolicus) and 0.242 (C. gariepinus).
Figure 39 shows data for Clarias spp. Where individual samples were composited for analysis, the mean
length is plotted against concentration. The Ilagala samples plot within the LVEMP data indicating that
this region of the Malagarasi River are not affected by Hg contamination. There is also some apparent
overlap between the background samples from the Munekesi and Nyamsenga background areas but the
difference in size ranges between the two data sets makes direct comparisons uncertain. Clarias spp. from
the Rwamagasa area were consistently higher but the difference does not appear to be significant. It was
not possible to derive length-Hg relationships from the data because of the narrow range of fish sizes and
small numbers of individuals for each species available in the many of the sites. Also the selection of a
standardised size from the data obtained here is unlikely to be relevant, particularly for the Rwamagasa
area where the local population rarely consumes smaller fish. Furthermore, for the majority of species
and sites, insufficient data are available to allow a valid statistical analysis. The exception may be
Tembomine, which is outside the study area and was tested as a comparison.
Piscivores and other predators are compared in Figure 40. The Ilagala samples compare well with the
LVEMP's unaffected Lates nitolicus data set. All the Rwamagasa samples (Brycinus, Barbus and
Haplochromis) are grouped which may indicate it is possible to treat them as one population based on
their broad feeding habits.
O. nitolicus samples from Rwamagasa market and O. tanganicae obtained in Ilagala in the Lake
Tanganyika area (Figure 41) plot with the LVEMP data for O. nitolicus from Lake Victoria, the main
difference between the datasets being the size range over which samples were collected.
10000
4.0
ppb
3.5
y = 1.2665x + 1.1439
R2 = 0.2681
1000
3.0
500 ppb
y = 0.5872x + 1.7779
2.5
R2 = 0.095
200 ppb
100
2.0
g ppb
C gariepinus Tembomine
C gariepinus Rwamagaza Ponds 1, 2 and 5
C al uadi Rwamagaza Pond 6
1.5
Log TH
C gariepinus Rwamagaza Ponds 4 and 6
C. gariepinus Munekesi
y = 1.2731x - 0.3152
C alluadi Nikonga
R2 = 0.0552
10
1.0
C al uadi Nyamsenga
C gariepinus Ilagala
Auchenoglanis Ilagala
0.5
C gariepinus LVEMP ww
Linear (C gariepinus LVEMP ww)
Linear (C gariepinus Tembomine)
Linear (C gariepinus Rwamagaza Ponds 4 and 6)
0.0
0.0
0.2
0.4
0.6
0.8
1.0
1.2
1.4
1.6
1.8
Log L cm
-0.5
Figure 39 Hg (ppb) related to length (cm) in Clarias sp.
BGS Report CR/04/129 (Issue 1.0) for UNIDO Contract 03/088
60
4.0
3.5
3.0
500 ppb
2.5
200 ppb
2.0
Haplochromis Rwamagaza Pond 2
Haplochromis Rwamagaza Pond 4 + 6
1.5
Barbus Rwamagaza Pond 1
Barbus Rwamagaza Pond 6
Log THg ppb
Brycinus Rwamagaza Pond 6
1.0
Barbus Uvinza
y = 1.8032x - 1.0248
Brycinus Ilagala
R2 = 0.2551
Hydrocynus Ilagala
0.5
Lates malagarasi Ilagala
Lates nitolicus LVEMP ww
Linear (Lates nitolicus LVEMP ww)
0.0
0.0
0.2
0.4
0.6
0.8
1.0
1.2
1.4
1.6
1.8
-0.5
Log L cm
-1.0
Figure 40 Hg (ppb) related to length (cm) in piscivores, insectivores and planktivores from the Rwamagasa area,
River Malagarasi Lake Tanganyika (Ilagala, Uvinza) and Lake Victoria (LVEMP, Machiwa, 2003)
4.0
3.5
3.0
500 ppb
y = 1.8889x - 0.6256
2.5
200 ppb
R2 = 0.2503
2.0
Log THg ppb 1.5
1.0
O nitolicus Rwamagaza Market
O tanganicae Ilagala
O tanganicae Uvinza
0.5
O nitolicus LVEMP ww
Linear (O nitolicus LVEMP ww)
0.0
0.0
0.2
0.4
0.6
0.8
1.0
1.2
1.4
1.6
1.8
Log L cm
Figure 41 Hg (ppb) related to length (cm) in Oreochromis spp from the Rwamagasa area, River Malagarasi Lake
Tanganyika (Ilagala) and Lake Victoria (LVEMP, Machiwa, 2003)
BGS Report CR/04/129 (Issue 1.0) for UNIDO Contract 03/088
61
4.6.4 Summary
The fish tissue THg data indicates that the sites sampled in the immediate area of mining activities at
Rwamagasa, in particular Ponds 1, 2 and 5 are the worst affected and should be considered environmental
or contamination `hotspots' and sites of biomethylation. Tembomine is also a `hotspot' as a result of local
mining activity. Many fish tissues from these sites fail export market standards (0.5 ppm). Ponds 4 and 6
are moderately affected and depending on the species, fish from these sites fail the recommended
standard for vulnerable groups (0.2 ppm). The Nikonga River fish samples were slightly elevated
compared with the Lake Tanganyika (Ilagala) samples but are below the WHO threshold for vulnerable
groups (0.2 ppm). The influence of the Rwamagasa mining activity on the THg of fish tissues collected at
Lake Tanganyika is negligible as the levels were comparable to tissue levels found in Lake Victoria in
this study and those of other authors.
BGS Report CR/04/129 (Issue 1.0) for UNIDO Contract 03/088
62
5 Exposure to Environmental Mercury
5.1 DRINKING
WATER
WHO guidelines for drinking water (1993) state that mercury is present in the inorganic form in surface
and ground waters at concentrations usually of less than 0.5 µg/litre and that mean dietary intake of
mercury in various countries ranges from 2 to 20 µg per day per person.
In 1972, JECFA established a provisional tolerable weekly intake (PTWI) of 5 µg/kg of body weight of
total mercury (equivalent to 300 µg THg per week for a person weighing 60kg), of which no more than
3.3 µg/kg of body weight (equivalent to 200 µg MeHg per week for a person weighing 60kg) should be
present as methylmercury. In 1988, JECFA reassessed methylmercury, as new data had become available,
and confirmed the previously recommended PTWI of 3.3 µg/kg of body weight for the general
population, but noted that pregnant women and nursing mothers were likely to be at greater risk from the
adverse effects of methylmercury. To be on the conservative side, this PTWI for methylmercury was
used to derive a guideline value for inorganic mercury in drinking-water. As the main exposure is from
food, a 10% allocation of the PTWI to drinking-water was made. The WHO guideline value (1993) for
total mercury was consequently set at 0.001 mg/litre (rounded figure). In June 2003, experts from the
FAO and WHO met and have revised the PTWI for methyl mercury down to 1.6 µg/kg of body weight
per week, the drinking water guideline value has not yet been revised to take this into account,
FAO/WHO (2003).
According to the medical investigation all the 250 participants in the Rwamagasa area claimed they
obtained drinking water from shallow, most likely hand-dug wells (personal communication from
Stephan Böse-O'Reilly, 2004). Drawing of washing and cooking water from shallow wells by bucket
was observed during the environmental survey, but not the abstraction of drinking water. In deriving its
guideline values WHO assume the ingestion of 2 litres of water per day (WHO, 1993) there was no direct
evidence to suggest this value was significantly higher in the Rwamagasa area.
Data summarized in Table 5 above indicate that none of the drainage samples collected from the river
network, or associated drainage ponds exceeded the WHO or local Tanzanian guideline values of 1 µg/l
Hg for drinking water. Whilst this suggests that mineral processing operations have not contaminated
local surface waters and shallow groundwaters it does not indicate whether drinking water used by the
local people has been contaminated. More extensive monitoring of drinking water sources (which was not
BGS Report CR/04/129 (Issue 1.0) for UNIDO Contract 03/088
63
the focus of the current investigations) should be considered as a component of any subsequent follow up
work.
The only samples of water collected during the survey that contained excess amounts of Hg were from
amalgamation ponds. This highlights the need for careful management of waste waters from these ponds
and monitoring of any nearby drinking water supplies.
5.2 FOODSTUFFS
According to the sociological report (Wagner, 2003) "Food consumption and nutrients patterns indicated
the possible status of nutrient intake by the Rwamagasa community. The highest numbers of respondents
(36%) take meat once a week and 7% eat meat every day, while 36% eat fish twice a week and 6% eat
fish everyday. Moreover, 31% eat chicken at least once a week, 17% eat eggs once a week, 38% drink
milk everyday, 36% eat bean everyday, 50% eat vegetables everyday and 27% each fruits everyday."
Unfortunately, the socio-economic report did not provide information on the source of fish (local or
imported from Lake Victoria) nor the relative proportions of the different species consumed. At the time
of the field survey (September), all fish available in the market appeared to have been imported from
Lake Victoria. Only catfish were found in any numbers in the local streams and most of these were sold
as bait for perch fishing in Lake Victoria. It appears that the local people eat these fish only under
extreme circumstances (unpublished information provided by Stephan Böse O'Reilly, 2004).
5.2.1 Locally produced rice, maize, cassava and vegetables
The maximum likely dietary intake of rice by the local residents in the Rwamagasa area is provisionally
estimated to be 300g (air- dried) per person per day, although this may be an over estimate as the local
people also usually consume cassava and maize. The average Hg concentration recorded for samples of
rice grain grown in the study area was 0.026 µg/g (dry wt.), so the amount of mercury entering the body,
assuming an average consumption of 300g rice per day, is 7.8 µg THg /day or 0.055 mg THg/week. This
value is much lower than the Provisional Tolerable Weekly Intake (PTWI) of 0.3 mg for Total mercury in
the diet set by the WHO and the FAO (1972). If 50% of the Hg in Rwamagasa rice is MeHg (see Horvat
et al., 2003), then the total weekly MeHg intake from rice would be 27.5 µg MeHg which is equivalent to
0.46 µg MeHg/ kg bw/week. This is lower than the MeHg PTWI of 1.6 µg/ kg body weight/ week
recommended by JECFA in June 2003. However, adults consuming Rwamagasa rice at the upper limit of
the Hg concentration range recorded in the current survey (0.035 µg/g) would have a weekly intake of
73.5µg THg which is equivalent to 0.6 µg MeHg/kg bw/week (assuming a body weight of 60kg and that
the rice contains 50% of the THg is MeHg). This is likely to be a maximum input because most people in
the Rwamagasa area will also consume cassava and maize, which are grown on soils with low Hg.
No information is provided on the relative proportions of rice, maize, cassava and yams consumed in the
area in either the sociological report (Wagner, 2003) or the report on the medical assessment (Drasch et
al., 2004). Because of this it is impossible to calculate Hg inputs from each of these staple food sources.
BGS Report CR/04/129 (Issue 1.0) for UNIDO Contract 03/088
64
Yams are generally relatively expensive and probably constitute less than 10% of dietary intake from
staple crops (based on the extent of the area cultivated). An individual consuming 30 g/day of yam with
the highest Hg concentration recorded in the current survey (0.09 mg THg /kg) would have a weekly
intake from yam of 0.315 µg THg/kg bw/week, equivalent to 0.16 µg MeHg/kg bw/week, assuming that
50% of Hg in yam is MeHg.
5.2.2 Fish
Fish and fish products are the dominant source of methylmercury in the diet and levels greater than 1200
µg/kg have been found in edible marine species such as tuna and swordfish. Similar levels have also been
recorded in fish from polluted freshwaters. Data from the medical assessment (Drasch et al., 2004)
indicate that 4% of the 252 cases ate fish once a month, 69% ate fish at least once a week and 27% ate
fish at least once a day. Of those that ate fish at least once a day, 78% ate only one fish meal a day, 15%
twice a day and 7% three fish meals a day. The vast majority of cases principally ate Tilapia
(Oreochromis spp.), Perch (Lates spp.) and dagaa (dagan; Rastrineobola spp. and equivalents). Catfish
(Clarias spp; kamare, mumi) was eaten by only 9% (15 out of 173) of the cases who ate fish at least once
a week and only 7% (5 out of 68) of cases who ate more than one fish meal a day.
98% of cases stated that the fish they consumed came from an area distant from the mining impacted area
or from the market, so most of it is highly likely to have come from Lake Victoria. Of the 5 cases that
stated that some of the fish came from mining impacted areas, the fish consumed was principally tilapia,
perch and dagaa (likely to be from Lake Victoria) with hongue, kanago and furu (Haplochromis spp.)
mentioned as the other fish species. None mentioned that catfish from mining impacted areas was eaten,
although we came across at least one family living outside Rwamagasa village, who ate catfish from the
mining contaminated Isingile River.
Average Hg concentrations in fish from the Rwamagasa area, the River Malagarasi-Lake Tanganyika
(Ilagala-Uvinza) and Lake Victoria are given in Table 28. Consumption of 250g perch, 500g tilapia and
250g of catfish each week would result in an intake of 27 µg THg/week (0.35 µg MeHg/kg bw/week) for
residents of Ilagala-Uvinza, 44 µg THg/week (0.58 µg MeHg/kg bw/week) for people depending totally
on fish from Lake Victoria, 56 µg THg/week (0.75 µg MeHg/kg bw/week) for people in the Rwamagasa
background area consuming tilapia and perch from Lake Victoria and catfish from the local streams, and
259 µg THg/week (3.45 µg MeHg/kg bw/week) for people in the Rwamagasa area consuming tilapia and
perch from Lake Victoria and catfish from mining impacted streams (Table 29). Apart from the latter
group consuming catfish from mining impacted stream (259 µg THg/week), these inputs related to fish
consumption are below the Provisional Tolerable Weekly Intake (PTWI) of 300 µg for total mercury and
1.6 µg /kg bw/week for MeHg in the diet recommended by JECFA. In the relatively unlikely situation
where people were consuming solely catfish from mining impacted streams, these cases would have an
estimated weekly intake of 730 µg MeHg/week (Table 28), which is equivalent to 12.2 µg MeHg/kg
bw/week - more than seven times the JECFA PTWI for MeHg. This situation is unlikely to occur with
people living in Rwamagasa but may occur occasionally in people living close to the Isingile River and
BGS Report CR/04/129 (Issue 1.0) for UNIDO Contract 03/088
65
near Tembomine, for example. Only those people consuming catfish from the Isingile River are likely to
be at risk of exceeding the PTWI for MeHg.
People consuming 300g/day of rice grown on the Hg contaminated Isingile mbuga and 1kg/day of fish
from Lake Victoria would have a combined estimated MeHg input of 1.04 µg MeHg /kg bw/week (0.46
µg MeHg/kg bw/week from rice and 0.58 µg MeHg/kg bw/week from fish) which is two thirds of the
MeHg PTWI.
Table 28. Average concentration of Hg (µg/g) in fish from the Rwamagasa area, Malagarasi River Lake
Tanganyika (Uvinza & Ilagala) and Lake Victoria eaten people in the Rwamagasa and Ilagala areas (see Table 27
for further details).
Potential Hg input related to
consumption of 1kg fish/week
Species consumed
Source of fish
Hg
Hg
Hg (µg
Hg (µg
(ng/g)
(µg/g)
THg/week)1
MeHg/week)2
Perch (Lates spp.) Ilagala
25
0.025
25
22
Lake
Victoria
65
0.065
65
52
Tilapia (Oreochromis
Ilagala 30
0.030 30 24
spp.)
Lake
Victoria
29
0.029
29
23
Catfish (Clarias spp.) Ilagala
22 0.022
22
18
Rwamagasa
100 0.100
100
80
background
Rwamagasa
912 0.912
912
730
mining
impacted
Lake
Victoria
51
0.051
51
41
Dagaa (Rastrineobola
Lake Victoria
23
0.023
23
18
spp. and Haplochromis
spp.)
Rwamagasa
675 0.675
675
540
mining
impacted
1 based on consumption of 250g fish, four times a week (i.e. 1 kg/week); 2 MeHg = 0.8*THg
BGS Report CR/04/129 (Issue 1.0) for UNIDO Contract 03/088
66
Table 29. Average THg (µg/week) and MeHg (µg/week) potentially consumed by people in the Rwamagasa and
Ilagala areas based on weekly consumption of 250g Perch, 500g Tilapia and 250g Catfish (see Table 28 for further
details).
Potential Hg input related to
consumption of 1kg fish/week
wet weight (g) fish
Hg (µg
Hg (µg
Area and species consumed Source of fish
consumed/week
THg/week)
MeHg/week) 1
Ilagala-Uvinza
Perch (Lates spp.)
Ilagala
250
6
5
Tilapia (Oreochromis spp.) Ilagala
500
15
12
Catfish (Clarias spp.)
Ilagala
250
6
4
Total Hg per week
27
21
Lake Victoria
Perch (Lates spp.)
Lake Victoria
250
16
13
Tilapia (Oreochromis spp.) Lake Victoria
500
15
12
Catfish (Clarias spp.)
Lake Victoria
250
13
10
Total Hg per week
44
35
Rwamagasa (background area)
Perch (Lates spp.)
Lake Victoria
250
16
13
Tilapia (Oreochromis spp.) Lake Victoria
500
15
12
Rwamagasa
Catfish (Clarias spp.)
background 250
25
20
Total Hg per week
56
45
Rwamagasa (mining impacted area)
Perch (Lates spp.)
Lake Victoria
250
16
13
Tilapia (Oreochromis spp.) Lake Victoria
500
15
12
Rwamagasa
Catfish (Clarias spp.)
mining impacted
250 228 182
Total Hg per week
259
207
1 MeHg = 0.8*THg
5.3
INADVERTENT AND DELIBERATE INGESTIONS OF SOIL AND DUST
Whilst exposure via foods and drinking water have traditionally been considered to be major sources of
exposure to potentially toxic elements such as mercury the development of risk assessment methodologies
for contaminated sites and mine workings has highlighted the importance of the inadvertent and
deliberate ingestion of soils and dusts (e.g. Ferguson et al., 1998; Williams et al., 1998). For example in
deriving the UK's guideline values for Hg in soil approximately 80% of the total exposure is apportioned
to the inadvertent ingestion of contaminated soils and dusts (Environment Agency, 2002)
However, the amount of soil and/or dust that is ingested has been discussed extensively in the literature
(e.g. Simon 1998). Some studies considered to be influential (e.g. Kimborough et al 1984) have been
criticised for using ultraconservative soil ingestion rates with little empirical support (Paustenbach et al.,
1986; Gough 1991). More recent research has been dominated by mass-balance studies of `conservative
tracer elements', i.e. chemical elements that are present in soil but which are not significantly absorbed by
passage through the gut (Calabrese 1989; Davies 1990; van Wijnen et al 1990).
BGS Report CR/04/129 (Issue 1.0) for UNIDO Contract 03/088
67
The ingestion of soil and/or dust occurs both within and outside the household environment and to
improve on the accuracy of predicting exposure it is desirable to establish, where possible, the
concentration of Hg in both environments. Alternatively, a general relationship between indoor dust and
outdoor soil contaminant concentrations may have to be assumed. For example, Keenan et al (1989) and
Murphy et al (1989) have reported the proportion of locally derived soil particles in indoor dust to be in
the order of 75% to 100%. This estimate was based mainly on a study of land contamination around a
series of smelters. However, some studies such as those by Franzen et al (1988) and Steele et al (1990)
indicated that in mining communities the proportion was much less than this (typically indoor
concentrations were 14% to 15% of soil concentrations). However, data used in these studies was
obtained in European and North American mining communities and would not be expected to reflect the
situation in northern Tanzania. It is therefore (conservatively) assumed for the purposes of this study that
locally derived soil particles account for all of the household dust.
Three distinct categories of soil ingestion may be considered, and these are discussed below along with
suggested quantities of ingested material. From these examples it can be clearly seen that the amount of
soil and/or dust ingested varies greatly, and that it is essential that the likely magnitude of geophagic
activity is assessed in potentially exposed populations. During surveys of geophagic behaviour, it is
essential that great care is exercised to prevent false-negative results being obtained due to cultural taboos
associated with this practice (e.g. being considered to be improper or of lower social status).
5.3.1 Inadvertent ingestion of small quantities of soil and dust
It is likely that all members of an exposed population will have intakes by this route, although exposure is
likely to be greatest for children under seven years old. Sources of soil and dust are likely to be derived
from both outdoors and indoors, and the relative magnitude of exposure will depend greatly on the habits
and behaviour of an individual. Despite the wide number of studies, considerable uncertainties still exist
in data relating to this activity (e.g. Simon 1998). This is in part due the difficulty in the methodological
use of tracers to estimate such quantities, and also the highly individualistic nature of exposure. Median
inadvertent soil ingestion rates derived from tracer studies performed in the USA range from 25 to 81 mg
soil/day for children (Davies, 1990; Calabrese (1989) and from 0.5 to 517 mg soil/day for adults
(Calabrese et al., 1990), although it should be noted that a high level of uncertainty applies to these
estimates. It should be noted that these values are generally higher than those suggested by WHO (20 mg
per day; WHO 2001) and those used in a recent assessment of mercury exposure in the Lake Victoria area
(35 mg/day adults, 50 mg/day children; Campbell et al., 2003a). It is equally important to consider that
these inadvertent ingestion estimates may be lower than those encountered in the Rwamagasa area where
people working in and close to the mineral processing centres will be exposed to a dusty environment
(Drasch et al., 2004).
BGS Report CR/04/129 (Issue 1.0) for UNIDO Contract 03/088
68
5.3.2 Occasional deliberate consumption of soil and dust (pica)
Most young children indulge in this type of exploratory behaviour for a relatively short time, although
there is hardly any quantitative information on the amount of soil deliberately ingested during these
activities. This is due in part to the difficulty in separating the occasional consumption of soil from the
habitual practice of soil ingestion (geophagy), and from exposures that typically occur during the
mouthing of other objects. For a group of 64 US children studied by Calabrese et al (1991) the median
soil ingestion rate ranged from 9 to 96 mg per day according to tracer measurements, but one child (a
three-and-a-half-year-old girl) ingested much greater quantities (up to 13.6 g per day). Earlier estimates of
the amount of soil deliberately ingested as five grams per day (USEPA, 1984) and ten grams per day
(USEPA, 1989) have generally been based purely on `judgement'. As this behaviour is by definition
occasional, it is unrealistic to use yearly or indeed daily consumption as a quantitative way of expressing
occasional exposure. It is more realistic to use an exposure per event. For the purpose of this exercise it is
assumed that the event is of one day duration.
5.3.3 Geophagia
The term geophagia refers to the persistent and purposeful consumption of soil and/or dust, often in
relatively large quantities. It is typically associated with children and pregnant females who may be
subject to nutrient deficiencies. Geophagia should be considered as being distinct from pica (see above),
which relates to the inadvertent ingestion of soil/dusts when mouthing or eating unusual objects, and
should not be considered as only occurring in rural environments. Geophagia has been studied in both the
UK and North America within the wider context of pica (e.g. Cooper 1957; Barltrop 1966; Bicknell 1975;
Morgan et al 1988). However, as Lacey (1990) comments `The body of literature on pica is so fragmented
that it is difficult to find a precise summary of the knowns and unknowns about the condition. There is
little consistency in defining pica, classifying substances ingested, identifying key characteristics of
practitioners, recommending treatment or projecting outcomes'. The fragmentary nature of this
information therefore makes it extremely difficult to calculate exposure of populations or individuals via
this route. The situation elsewhere is even more complicated, particularly in tribal cultures where
geophagy is commonly practised. For example, studies by Geissler et al (1998) indicated that a large
proportion of male and female children in Kenya practise geophagy up to the age of 16 years, with an
average soil consumption rate of 25 g per day. Geophagy has also been recorded as being prevalent in
Tanzania amongst pregnant females on the coastal plains (Antleman et al, 2000) and slopes of Mount
Kilimanjaro (Knusden, 2002) and its presence is therefore likely to be widely established throughout
Tanzania. No information on soil eating was collected during the medical assessment in the Rwamagasa
area (Drasch et al., 2004).
BGS Report CR/04/129 (Issue 1.0) for UNIDO Contract 03/088
69
5.3.4 Predicted Exposures from soil/dust ingestion
The calculation of chemical exposure from soil and dust ingestion uses the following formula:
D = Conc. x ingrate
where
D
=
exposure (mg per day)
Conc.
=
concentration of mercury in soil or dust (mg per kg)
ingrate
=
soil ingestion rate for infants (kg per day)
It should be noted that this calculation does not include dust inhaled transferred to the gut and assumes
that all of the ingested Hg is of a similar bioavailability to the forms of Hg administered during animal
experiments from which the tolerable daily intakes have been derived. Unfortunately, tests to define the
actual bioaccessibility of Hg in contaminated soils, such as those described in Smith et al. (2000) have yet
to be validated for Hg.
5.3.4.1 INADVERTENT INGESTION OF SMALL QUANTITIES OF SOIL AND DUST
Concentration of Hg in soil and dust = 9 mg per kg
(Representative of upper Hg concentration in soils and average Hg in tailing tips)
Central estimate soil ingestion rate = 0.080 g soil per day
Worst-case soil ingestion rate = 0.200 g soil per day
Chemical exposure = central estimate 0.72 µg Hg per day and worst case 1.8 µg Hg per day.
5.3.4.2 OCCASIONAL DELIBERATE CONSUMPTION OF SOIL AND DUST
Concentration of Hg in soil and dust = 9 mg per kg
(Representative of upper Hg concentration in soils and average Hg in tailing tips)
Central estimate soil ingestion = 0.096 g soil per event
Worst case soil ingestion = 13.6 g soil per event
Chemical exposure = central estimate 0.86 µg per event and worst case 120 µg Hg per event.
BGS Report CR/04/129 (Issue 1.0) for UNIDO Contract 03/088
70
5.3.4.3 GEOPHAGIA
Concentration of Hg in soil and dust = 9 mg per kg
(Representative of upper Hg concentration in soils and average Hg in tailing tips)
Central estimate soil ingestion via geophagy = 26 g soil per day
Worst-case soil ingestion via geophagy = 85 g soil per day
Chemical exposure = central estimate 230 µg Hg per day and worst case 770 µg Hg per day
5.3.5 Discussion and conclusions
From the results presented above it is clear that elevated exposures to Hg can result from the occasional
deliberate and habitual consumption of contaminated soils and dusts. For example, the Provisional
Tolerable Weekly Intake (PTWI) of 0.3 mg for total mercury (THg) in the diet set by the WHO and the
FAO, which is equivalent to 26 µg THg/day for a 30kg child is exceeded by an individual practising
geophagia (central estimate and worst-case) or on a case by case basis by an individual occasionally
consuming soil/dust (worst-case). The recorded practice of geophagy by pregnant females is of particular
concern in this regard given the sensitivity of the foetus to mercury.
The inadvertent ingestion of dusts and soils even those having Hg concentrations significantly above the
regional background, and hence considered to be moderately contaminated, does not appear to lead to a
significant excess exposure to mercury. For example comparison of exposures due to inadvertent
ingestion of soils and/or dusts (0.72 to 1.8 µg THg/day or 5 to 13 µg THg/week) is typically less than
individual exposure via other dietary sources water, rice and fish (see preceding sections). This is
consistent with the observations made by Campbell et al (2003a) and is subject to similar observations of
Hg bioavailability. However, given the uncertainties involved in estimating inadvertent dust and soil
intake in the rural Rwamagasa environment, exposure via this route, in addition to more classical
geophagic behaviour, should be considered when planning remedial/intervention measures. Such
measures could include the marking and fencing off of waste tips and areas of enhanced contamination
and improvements in hygiene (washing of hands and food preparation such as the drying of cassava and
other crops directly on the ground and the use of soil as a desiccant to aid the storage of groundnuts and
beans). Whilst, as pointed out by Campbell et al (2003a) and others, geophagy does have an important
cultural and possibly nutritional benefit the resulting levels of potential exposure to young adults and
pregnant woman are high enough to suggest that this practice should be positively discouraged within the
mining districts. To this end the importation of geophagic materials into local markets from outside the
contaminated region should be encouraged and the negatives effects of using local soils conveyed though
local woman's groups and childhood development officers.
BGS Report CR/04/129 (Issue 1.0) for UNIDO Contract 03/088
71
6 Monitoring systems for water quality and biota
6.1 WATER
QUALITY
6.1.1 Introduction
Any protocol for monitoring water quality in drainage systems impacted by mining and mineral
processing needs to be designed with the objective of identifying short-term temporal variations related to
fluctuations in the flux of processing wastes entering river systems, as well as long-term variation in
water quality related to major changes in processing technologies and regimes. Ideally the system needs
to be capable also of identifying sporadic water contamination incidents, although this may be extremely
difficult where continuous monitoring is not a practical option.
The main sequential stages in the planning and execution of a monitoring programme are indicated
in Figure 42. The major objectives of a water-quality monitoring programme are likely to be to:
- establish an understanding of the baseline;
- determine contaminant concentrations in the drainage water and their relation to water quality
criteria (WQC) and compliance with water quality standards (WQS);
- determine contaminant concentrations in the suspended and bottom sediment and their relation to
sediment quality criteria (SQC);
- determine the potential impacts of contaminants on aquatic biota and humans.
Such monitoring programmes are normally carried out by government agencies in fulfilment of their
environmental protection responsibilities.
The following steps will help to ensure the successful execution of a water-quality monitoring
programme:
1. Evaluate the prior history and the existing database for the area. Identify relevant data and the
need for additional data.
2. Identify areas of potential environmental concern. If appropriate, subdivide the area into project
segments on the basis of an assessment of the level of environmental concern within the area.
This may be an iterative process that starts before sampling, using available information, and that
is refined after sampling, based on new data.
3. Determine the number of samples to be collected, the sampling frequency and select sampling
locations.
4. Determine what sampling methods will be used.
5. Define procedures for sample handling, preservation, and storage
BGS Report CR/04/129 (Issue 1.0) for UNIDO Contract 03/088
72
6. Define procedures for analysis.
7. Identify logistical considerations and safety precautions.
8. Establish a QA/QC protocol. This is essential to ensure that there will be sufficient and
appropriate data of known and documented quality to make reliable conclusions.
Define objectives of monitoring
programme
Select sampling locations
Select number of samples and
time of sampling
Select appropriate sampling
Modify
methods and determinands
design of
sampling
programme
if results
indicate
Select methods for preservation of
this is
samples(if appropriate)
necessary
Select optimum analytical
methods
Analyse samples (use appropriate
QA/QC procedures)
Interpret results
Figure 42: Major sequential stages in the planning and execution of a monitoring programme (adapted from Figure
5, SCA, 1996)
BGS Report CR/04/129 (Issue 1.0) for UNIDO Contract 03/088
73
Important points to be considered at the design stage include:
- any environmental evaluation is only as complete and reliable as the sampling (and sample
handling and storage) upon which it is based. Inadequacies or biases in sampling will limit the
accuracy and usefulness of the results.
- careful planning can reduce the need to repeat costly sampling and analytical procedures.
Full discussion with all relevant personnel involved in the management, field sampling, laboratory
analysis, and data management/analysis will help to ensure the efficient design and execution of the
monitoring program and effective communication between participating groups.
The following procedure may be used to determine the sampling frequency and time of sampling for a
monitoring programme designed to characterise water quality (adapted from SCA, 1996, Figure 8):
1. Define the objectives of the monitoring programme with respect to acceptable error and
information required (e.g. mean, median concentration). User of monitoring results defines the
permitted magnitude and duration of deviations from the control or guideline concentration
2. Determine probability of occurrence of deviations from the control limit or guideline value by
either:
- (A) if historical monitoring data are available, determine the average concentration, type
of frequency distribution and standard deviation. Evaluate data for trends and cycles.
- Or (B) if historical data are not considered to provide a useful indication of future trends
and concentrations, set the sampling interval greater than the shortest period for which
unacceptable water quality can be tolerated.
3. Compare average and standard deviation with control limit or guideline value.
4. Consider implications of cyclic variations, trends, and periods of abnormal variability.
5. Calculate the number of samples required to estimate the mean or median concentration (depends
on standard deviation, mean or median concentration and confidence limits required).
6. Select times for sampling
7. Select initial sampling frequency according to frequency distribution, cycles and trends.
8. Execute programme based on selected sampling frequency and times.
9. Review sampling programme and, if necessary, consider means of reducing sampling frequency
BGS Report CR/04/129 (Issue 1.0) for UNIDO Contract 03/088
74
From this information it is possible to determine the number of samples and frequency of sampling
required. The volume of sample is determined by the need to obtain samples that are both representative
and sufficiently large for the analytical method to be used to determine contaminant concentrations.
A range of manual and instrumental sampling procedures may be employed. It is important to emphasise
the importance of maintaining high quality during the sampling programme by the use of field blanks and
duplicates as well as the evaluation of potential sources of sample contamination (for example through the
use of low purity preservative acids or sample containers that contain metals (e.g. Zn in water bottle cap
inserts).
Factors to consider for the selection of sampling locations (Fig. 43) include:
·
Location of (postulated) source(s) of contamination
·
Extent and duration of operation of contaminating processes
·
Characteristics of the drainage system
·
Predicted spatial distribution of contaminants in relation to sources
·
Impacts of water systems
·
Influence of the rate of flow
·
Accessibility of sampling locations
·
Methods of determining exact location of sampling sites
Periodic releases of contaminants in solution or as suspended matter may be detectable only for a
relatively short period until the contaminant flux passes through the drainage system. Bottom or
interfacial sediments are often the best sample media for non-biological sampling. However, biomarkers
are generally more effective because stress induced by short-term exposure is detectable long after the
ambient contaminant level has declined. This is particularly true where species death is involved. From
dose-response data it is possible to tentatively infer exposure magnitude and/or time.
A more extensive discussion of sampling frequency, sampling procedures (including handling,
preservation and storage), analysis, and quality control are given in a number of reports from which the
reader may obtain detailed guidance (U.K. Environment Agency, 1998; APHA, 1995, ASTM 1994a, U.S.
EPA, 1986, 1995; SCA, 1996).
6.1.2 Monitoring of water quality in the Nikonga River system
In general, it is clear from the new data collected during the current survey, that:
(1) it does not appear likely that mercury will exceed water quality criteria in the Nikonga river
system, unless, of course, there is a significant movement of Hg contaminated mineral
processing waste into the Isingile River caused by unusually heavy rain fall.
BGS Report CR/04/129 (Issue 1.0) for UNIDO Contract 03/088
75
(2) No water quality criteria are currently exceeded or likely to be exceeded in the lower
Malagarasi River, unless further studies indicate that there are significant concentrations of Hg
in brines at Uvinza.
(3) It was not possible to test whether there is significant short and /or medium term temporal
variation in contaminant load in the Isingile-Nikonga River system because there was no flow
at the time of the field survey.
(4) Surrogate discharge and contaminant load indicators such as the suspended sediment load
(TSS) were not determined or investigated for the same reason.
Generic guidelines for water quality monitoring are given in this section and in Section 6.1 above.
Monitoring in the current survey followed, as closely as was practicable, the internationally accepted
protocols recommended in Veiga and Baker (2003). It is recommended that water monitoring is carried
out during the wet season to test for Hg in solution and in the suspended sediment, including studies of
the short term and medium term temporal variation in these pollution indicators.
Continuous monitoring equipment capable of determining Hg at low concentrations is, as far as the
authors of this report are aware, not available commercially. So any monitoring system would be periodic
rather than continuous.
The USEPA recommends that monitoring of surface drinking water sources (including wells) should be
annual unless Hg is detected at levels of >2 µg/L, in which case sampling should be every quarter. The
level of Hg detected in filtered water samples from the Isingile stream reached a maximum level of 0.07
µg/L (Table 5). On this basis it may be concluded that the quarterly monitoring will probably be adequate
for the Isingile and Nikonga Rivers for a period of two years. If no significant Hg concentrations are
detected during that period, and there are no significant changes in the amount of mineral processing and
associated factors, then annual monitoring, following the USEPA recommendations, will probably be
adequate. Peaks of relatively high Hg in filtered water are less likely to be released from the mineral
processing plants in this area than is the case in some other areas (e.g. Diwalwal in the Philippines;
Appleton, 2000). No practical periodic monitoring system can be guaranteed to identify abnormal pulses
of contaminant discharge, which could occur at any time during the day or night if they were related to a
sudden influx of Hg contaminated mineral processing waste caused by abnormal rainfall events.
The only effective option to prevent the continuing Hg pollution of the Isingile stream and surrounding
agricultural areas is to require (a) the removal of all the existing mineral processing waste currently
located close to the Isingile River and (b) the termination of all mineral processing activities in the
vicinity.
BGS Report CR/04/129 (Issue 1.0) for UNIDO Contract 03/088
76
Define objectives of monitoring programme
Collect available information on drainage system.
Execute reconnaissance of drainage system.
Select provisional sampling locations
Revise
objectives if
necessary
Execute orientation monitoring survey to check
homogeneity of selected sites.
Assess temporal variance related to climate and other
factors (e.g. variance of contaminant flux related to
mineral processing activities)
Select
alternative
sites
Location homogeneous
Location non-homogeneous
Ensure sampling site at location
avoids boundaries within drainage
system (e.g. not too close to
confluences etc.)
Use several sampling sites close
to chosen location if suitable
alternative sampling site not
available
No
Is cost of programme within budget?
Yes
Execute sampling programme
Review sampling programme
Figure 43: Major stages in the selection of sampling sites/locations for a monitoring programme (adapted from
Figure 6, SCA, 1996)
BGS Report CR/04/129 (Issue 1.0) for UNIDO Contract 03/088
77
6.2 BIOTA
Monitoring of biota (fish and agricultural crops) has been carried out as part of the current study and
could be carried out periodically using the methods outlined in Section 3 above, which follow, as closely
as practicable, the UNIDO sampling protocols (Veiga and Baker, 2003). Fish monitoring is used to assess
Hg bioavailability and the transfer of Hg from mineral processing waste, drainage sediment and soil into
aquatic biota and plants. The second purpose of monitoring aquatic biota, and especially fish, is to
evaluate the potential impact on the health of people consuming fish from Hg contaminated rivers,
streams and ponds. Monitoring agricultural crops, especially those grown on land impacted by Hg-
contaminated mineral processing waste, can be used to assess the uptake of Hg by these crops and the
potential impact on the health of people consuming the crops. The protocols for the periodic monitoring
of aquatic biota are comprehensively documented in Veiga and Baker (2003). Periodic monitoring of
agricultural crops could also be carried out, although the results of this study indicate that little Hg is
present in most of the crops. Due to time and funding constraints, the current study was able to sample
only a relatively limited number of sites. For this reason it is recommended that a more comprehensive
survey should be carried out, in order to verify the results presented in this study.
BGS Report CR/04/129 (Issue 1.0) for UNIDO Contract 03/088
78
7 Measures for the remediation and possible
rehabilitation of the "hot spot"
7.1 RIVER
SYSTEM
The contract implies that it should be possible - using the results of the current investigations to identify
pollution "hot-spots" in the Isingile and Nikonga river systems as well as in surface soils adjacent to the
rivers. Some general comments on pollution "hot-spots" are given in Sections 3 and 4 above.
7.1.1 Water
The present survey did not detect any concentrations of Hg in solution that would require remediation as
they did not exceed water quality standards (see section 4.1 above). Should future water quality
monitoring detect concentrations that require remediation, then the following remediation technologies
may be appropriate.
Whereas the US EPA states that coagulation/filtration, granulated activated carbon, lime softening,
reverse osmosis and chlorination are the best available technologies (BATs) for the treatment of Hg
contaminated water required for drinking, these treatments are only recommended if the influent Hg
concentration is less than 10 µg/L. Chemical precipitation as the sulphide at an alkaline pH followed by
filtration, carbon adsorption and ion exchange is the demonstrated BAT for waters contaminated with
high concentrations of inorganic mercury. Where the Hg is present in waters as organo-mercury or the Hg
is in an organic matrix, then chemical oxidation has to be carried out prior to the processing stages
recommended for waters contaminated with inorganic mercury (Smith et al., 1995).
7.1.2 Sediment
From a practical point of view, there would be little sense in trying to remediate and rehabilitate the Hg
contaminated bottom sediments of the Isingile River until (a) the releases of Hg contaminated mineral
processing tailings from the Rwamagasa area have been terminated, (2) the risk of future contamination
of the drainage system by progressive or catastrophic releases of Hg contaminated processing waste has
been eradicated. It is, however, relatively unlikely that the tailings piles located adjacent and to the south
of the Isingile are a potential source of catastrophic contamination as the waste piles are small and the
slopes are relatively gentle.
The most urgent requirement is to prevent further additions of Hg to the river bottom sediment by
stopping or at least strictly controlling mineral processing activities and the use of Hg in the Rwamagasa
area. The cessation or strict control of mining processing activities at Rwamagasa would lead to a
significant reduction in the Hg-contaminated mineral processing waste. Unpolluted sediment derived
BGS Report CR/04/129 (Issue 1.0) for UNIDO Contract 03/088
79
from soil run-off would progressively cover contaminated bottom sediment in the Isingile and Nikonga
Rivers, thereby helping to prevent further downstream transfer.
One costly and possibly impractical option would be to dredge contaminated sediments from the Isingile
River and place them in disposal areas protected by secure dykes and covered with clean sediment or
soils. There may be potential for ground water contamination if this action was followed. Best
Demonstrated Available Technologies (BDATs) for remediation of Hg contaminated sediments are
discussed in the following section on soils. Specific practical remediation measures cannot be
recommended until a more detailed assessment has been made of the drainage sediments.
7.2 SOIL
The EPA Draft Mercury Action Plan (November 1998) highlighted the need to address the potential for
mercury contamination of watersheds that drain abandoned mine sites, and the need to fully research the
extent and nature of Hg contamination associated with gold mining sites including the characterisation
and mapping of sites, and the study of downstream impacts. The document observes that common
disposal options currently include:
- coverage of the contaminated soils with clean soil, or some other material, or excavation and
transportation of the contaminated soil to a secure off-site depository or landfill.
- permanent stabilisation of mercury.
The scientific feasibility and costs of the process are not specified. This latter approach would be more
suited to industrial sites rather than in the situation in the Rwamagasa area where agricultural soils are
contaminated by mercury.
No records of remediation of mercury contaminated soils or river sediment from mining areas has been
encountered apart from the Carson River Mercury Superfund Site in the US. Elevated mercury levels
were discovered on the Carson River drainage basin in the 1970's downstream of pre-1900 ore milling
sites where amalgamation had been used for gold extraction. The U.S. EPA carried out various
evaluations during the period 1990 to 1996, but remediation appears to have been restricted to excavation
and treatment (by cyanidation) of mercury-laden tailings from limited areas followed by back filling with
clean soil. The objective of this work was to prevent exposure of people to soil with Hg concentrations
greater than 25 ppm (mg/kg). There were also plans to excavate mercury-contaminated soils from
residential yards with disposal of the soil to a municipal or hazardous waste landfill, dependent on the Hg
concentration. The objective was to address the incidental soil ingestion pathway that was of potential
concern to populations near the impacted areas. Another pathway of potential concern was through the
consumption of fish or waterfowl from the Carson River system. In 1995, no remedial action was
attempting to address this pathway. The principal remedial action at this site was, therefore, the
excavation of approximately 5000 cubic yards of contaminated soils followed by the implementation of
institutional controls on-site. It has been estimated that approximately 700,000 m3 of contaminated
materials at the site contain 31,500 kg of Hg and 18,200 oz of Au, 1,205,800 oz of Ag, worth
BGS Report CR/04/129 (Issue 1.0) for UNIDO Contract 03/088
80
approximately $12 million, which would defray the cost of clean-up operations. Hg in tailings is reported
to be in the range 3 - 1610 ppm.
The Best Demonstrated Available Technologies (BDATs) for mercury wastes identified by the U.S. EPA
are:
1. thermal recovery through retorting, sometimes following pyrometallurgical recovery, is the
BDAT for waste that has a total Hg concentration greater than 260 ppm. The US EPA plans to
evaluate other options for high level waste because (i) the supply of recycled mercury is
increasing while the demand is decreasing and (ii) there are concerns over potential emissions
from retorting (Smith et al, 1995; USEPA, 1997). Hempel and Thöming (1999), in their review
paper, seem to imply that thermal treatment of soil can be effective at lower concentrations but
they do not give any specific indication on the likely effectiveness of the process when soil Hg
ranges from <0.01 to 9 ppm, as in the Rwamagasa agricultural soils.
2. acid leaching for soils with a total Hg content less than the thermal mercury recovery limit (260
mg/kg). Hg in the acid leachate has to be treated to precipitate mercury (Smith et al, 1995;
USEPA, 1997).
In the US, soil clean-up goals for both total and leachable Hg vary from 1 to 21 mg/kg above a
background range of 0.01 to 0.30 mg/kg (USEPA, 1997, Table 2). The California Total Threshold Limit
Concentration, for example is 20 mg/kg, which is above the mean and median concentration of Hg in the
agricultural soils in the Rwamagasa area. The California Soluble Threshold Leachate Concentration is
200 µg/L. As far as the author is aware, no clean-up goals have been set in Tanzania, the UK or the EC.
The principal remediation-rehabilitation options for Hg-contaminated soils and sediments in the Isingile
River Rwamagasa area include:
1. Excavation of Hg-contaminated soil and disposal to an off-site secure landfill or depository
2. Electroleaching, comprising wet extraction followed by electrolytic preparation of the leachate is
an emerging and potential alternative cleanup method that is reported to offer a cheaper and more
environmentally friendly alternative to thermal treatment or the acid leaching process.
Electroleaching is reported to have the advantage of larger thermodynamic separation factors,
lower capital costs and no air pollution problems (Hempel and Thöming, 1999). The process is
reported to be capable of reducing total Hg by 90% at the 5 mg/kg level to 99.7% at 100 mg/kg.
In both cases, Hg is reduced to less than 1 mg/kg after leaching (Thöming J and Franke S, 1998;
Hempel and Thöming, 1999; Thöming et al., 1999; Thöming et al., 2000). It is understood that
this remediation process has been tested principally in laboratory/bench-scale trials on a range of
contaminated soils including those from chlor-alkali plants and artisanal gold mining sites.
BGS Report CR/04/129 (Issue 1.0) for UNIDO Contract 03/088
81
Thöming (pers. comm. 22 February 2000) advised the senior author that a few years ago he was asked to
make recommendations for remediation of Brazilian artisanal gold mining tailings. Such tailings offer the
possibility of simultaneously recovering remaining traces of gold if they are treated by electroleaching. It
is understood that a huge amount of Brazilian funds were invested in pilot-plant tests but that no reliable
data was obtained on the efficacy of this remediation method.
The cost of these potential remediation options has not been estimated.
Other potential remediation options include:
(i)
physical treatment by wet classification, although this would be of limited use as this method
is only effective if the soils contains high quantities of sand and gravel;
(ii) immobilization
by:
· physical
barriers
· geohydrological
isolation
· solidification
and
stabilization
· chemical
immobilization.
(iii) extraction of Hg from soil using chelating agents;
(iv) biological treatment technologies including:
·
Methylation (tested at the bench scale for arsenic but apparently not for mercury)
·
Phytoremediation of mercury- and methylmercury-polluted soils using genetically
engineered plants
·
use of genetically engineered bacteria.
Unfortunately, these technologies do not appear to be applicable to the Hg contaminated soils of the
Rwamagasa area. Many have been tested only in the laboratory and not in field scale trials so their
efficacy cannot be evaluated. Hempel and Thöming (1999) observe in their review of remediation
techniques that whereas there are a large number of techniques available to immobilize mercury in soils,
these are not of proven long-term stability. In addition, subsequent clean-up of chemically stabilized soils
may be very expensive and in some cases impossible.
Specific practical remediation measures can not be recommended until a much more detailed assessment
has been made of Hg concentrations in the agricultural soils. On the basis of evidence collected during
this survey, it appears that significant amounts of Hg are not adsorbed into the grain of the agricultural
plants. If this can be confirmed by more detailed surveys (involving further collection and analysis of soil
and rice grain samples from exactly the same areas, for example) it may be possible to confirm that there
is little or no potential for a direct negative impact on human health caused by the consumption of rice
BGS Report CR/04/129 (Issue 1.0) for UNIDO Contract 03/088
82
grown on these high Hg soils. Should this be the case, there would be no compelling reason to prevent the
continued cultivation of rice and other agricultural crops on the Hg-contaminated soils.
Should there be a change of land use from rice paddy to corn cultivation, for example, then the adsorption
of Hg by other crops and its potential impact on human health would need to be investigated more
thoroughly.
BGS Report CR/04/129 (Issue 1.0) for UNIDO Contract 03/088
83
8 Role of government departments, the mining industry
and research institutions
8.1
MINISTRY OF ENERGY AND MINERALS
The responsibilities of the Ministry of Energy and Minerals are defined by the Mining Act (1998) and the
Mining Regulations (1999). The Government recognizes the need to put into place an internationally
competitive investment environment for the mineral sector that will contribute towards industrial
development, employment creation, social and economic infrastructure development (particularly for the
rural areas); income generation, foreign exchange earning and government revenue. The Mineral Sector
Policy Objectives are (i) to encourage, promote and facilitate exploration and utilization of mineral
resources; (ii) to increase the countries foreign exchange earnings; (iii) to increase government revenue;
(iv) to ensure environmental protection and management; (v) to ensure that government services and the
institutional framework are adequate; (vi) to increase gainful and secure employment in the mineral
sector; (vii) to promote forward and backward linkages in the mineral based industries; (viii) to facilitate
development of mineral based local services and supply industries and (ix) to promote appropriate
technological advancements related to the mineral sector. However, the Government of Tanzania also
recognises that mineral sector activities shall be carried out on the basis of safe and environmentally
sound practices (for sustainability). In order to accomplish these objectives, the Government will (i)
develop an enabling legal, regulatory, fiscal and institutional environment for private sector mining
investment; (ii) strengthen the ability of the state to effectively carry out its regulatory, promotional
(investment and marketing) functions; (iii) establish and ensure compliance with environmental, health
and safety guidelines; (iv) carry out geological mapping, maintain an up-to-date mineral resource
database, and promote the development of Tanzania's mineral potential; (v) reinforce the provision of
extension services and assistance to artisanal and small-scale miners so that safe and environmentally-
sound mining and processing practices can be adopted; (vi) facilitate the development of adequate
industrial infrastructure for mining development.
The Government of Tanzania wishes to promote the use of best practices in environmental management
systems in mining development and is adopting a number of strategies to achieve this including: (i)
establishment of comprehensive environmental management programmes for the mining industry; (ii)
establishment of effective environmental regulations and procedures for monitoring compliance; (iii)
setting up and strengthening the institutional capacity especially the field offices (zonal and district mines
offices) for monitoring and enforcing environmental regulations; (iv) requiring new projects to carry out
baseline environmental studies and prepare environmental impact assessment and environmental action
plans; (v) instigating environmental audits to evaluate the performance of existing mines and identify
areas for improvement; (vi) specifying procedures for determining environmental liability; (vii) providing
BGS Report CR/04/129 (Issue 1.0) for UNIDO Contract 03/088
84
rules of setting up reclamation funds to reinstate land to alternative uses after mining; (viii) setting
appropriate guidelines for allowing the conduct of mining in restricted areas such as forests, national
parks, sources of water and other designated areas; and (ix) abating the use of toxic chemicals and
pollutants by promoting environment friendly technologies.
Legal mining is controlled by Reconnaissance, Prospecting, and Mining Licences, Environmental
Assessments and Environmental Management Plans. Regulations covering the artisanal mining sector
include the Mining Act, Section 14 and Regulation 16 in the Mining (Minerals Rights) Regulations,
p.82). Small-scale miners operate legally only if they hold a Primary Mining Licence (PML). Only the
Blue Reef Mine has a PML in the Rwamagasa area whilst the majority of the artisanal miners appear to
operate illegally.
The Mining Act, 1998 Act No.5 of 1998 is the Principal Legislation governing the application and grant
of mineral rights (mining and exploration licenses), and trading of minerals. The Mining (Environmental
Management and Protection) Regulations, 1999 is one of seven sets of subsidiary legislation and rules
made under the Mining Act, 1998. Sections 38 (5) and 64 of the Mining Act, 1998 describe the
framework of environmental considerations during the licensing process. The Act requires an applicant to
commission independent consultants of International standing short-listed by the applicant and approved
by the Government to undertake an environmental impact assessment (EIA) on the proposed mining
operations. The EIA includes environmental risk assessment to assist the project proponent to produce an
Environmental Management Plan acceptable to the Government. The Mining (Environment Management
and Protection) Regulations, 1999 describe in details the principles outlined in sections 38(5) and 64 of
the Mining Act 1998. Holders of Mining Licences have a duty to take all appropriate measures for
environmental protection (Mining Act 1998, 49(2)(c) and 53(2)(c)). The approval process for a new
mining project comprises project screening and scoping, together with the evaluation of the EIA and EMP
by experts from the National Environment Management Council (NEMC), the Vice Presidents Office
Division of Environment, the Ministry of Water, the Ministry of Natural Resources and Tourism, the
Ministry of Lands and Human Settlement and the Ministry of Energy and Minerals (Minerals Division).
In addition, representations from the Regional Administration, Local Government Authorities and the
public are sought and considered during the approval process. The approved Environmental Management
Plan is reviewed by government experts at the end of a 2-year period and thereafter every five years.
Responsibility for administration, implementation and enforcement of regulations under the Mining Act
(1998) and Minerals Regulations (1999) in the Geita Rwamagasa area is delegated to the Ministry's
Local Mines Office. The Local Mines Office is responsible for the extremely difficult task of ensuring
that the small scale miners follow relevant mining and environmental regulations and approved practices,
such as ensuring that all amalgamation is carried out in cemented ponds and that all tailings from these
amalgamation ponds are stored in appropriate cemented storage areas that prevent dispersal of mercury
contamination onto adjacent land and into water courses. Observations during the field project indicated
that many small- scale miners in the Rwamagasa area do not follow these regulations.
BGS Report CR/04/129 (Issue 1.0) for UNIDO Contract 03/088
85
8.2
NATIONAL ENVIRONMENT MANAGEMENT COUNCIL
The National Environment Management Act, 1983 established the National Environment Management
Council (NEMC), which advises the Government on all matters relating to the environment and
formulates policy on environmental management. It is also responsible for coordinating the activities of
all institutions concerned with environmental matters; evaluating existing and proposed policies and
activities on pollution control and enhancement of environmental quality; recommending measures to
ensure Government policies take adequate account of environmental effects; and formulating proposals
for legislation in the area of environmental issues and recommending their implementation by the
Government.
The National Environment Management Act, (No. 19 of 1983) establishes the office of the Director
General of the NEMC who is required to consider the "means and initiate steps for the protection of the
environment and for preventing, controlling, abating or mitigating pollution; and investigate problems of
environmental management, among others." The NEMC reviews development projects in the country in
order to ensure that they conform to requisite environmental standards.
In 1997, the NEMC prepared Environmental Impact Assessment Guidelines and Procedures that are
particularly important because they incorporate public participation and access to information in respect
of projects with likely environmental impacts, such as mining.
8.3
DEPARTMENT OF THE ENVIRONMENT
The National Environmental Policy9, formulated and administered by the Department of the
Environment, has as its principle objective "the prevention, reduction, control and elimination of damage,
and minimisation of the risk from the generation, management, transportation, handling and disposal of
hazardous wasters, other wastes and emissions." The environmental problems associated with small scale
and artisanal gold mining is highlighted because of the use of mercury. The National Environmental
Policy states that a number of policies "shall be undertaken to minimise pollution arising from the mining
sector:
(a) overall project cycle of mining (including reclamation and restoration of land after use
shall be adequately managed to minimise adverse environmental impacts;
(b) mining discharges to grounds and water shall be controlled;
(c) preventive and clean up measures from accidents shall be formulated and implemented;
(d) air pollution from mining areas shall be controlled;
(e) strict regulations shall be put in place to control the use of mercury in mining activities,
use of retorts will be promoted; and
9 National Environmental Policy. Vice President's Office, Dar es Salaam, December 1997.
BGS Report CR/04/129 (Issue 1.0) for UNIDO Contract 03/088
86
(f) regular and periodic environmental audits shall be maintained to ensure the adoption of
environmentally sound practices in mining operations"
It is assumed that these policies apply to both large scale and artisanal mining. The Instruments for
Environmental Policy comprise Environmental Impact Assessment, Environmental Legislation,
Economic Instruments such as adoption of the polluter-pays principle, Environmental Standards and
Indicators, adoption of the Precautionary Approach and International Cooperation. Standards exist for
drinking water (1 µg Hg/L, water for use in feeding domestic animals, fisheries, shell cultures, recreation
(1 µg Hg/L); irrigation water (5 µg Hg/L) and water for industrial activities (5 µg Hg/L) (UNEP, 2002).
8.4
UNITED NATIONS INDUSTRIAL DEVELOPMENT ORGANISATION
UNIDO has provided technical assistance to the small-scale gold mining sector in developing countries
since 1985. UNIDO is responsible for the execution of the GEF funded project Removal of Barriers to the
Introduction of Cleaner Artisanal Gold Mining and Extraction Technologies (also referred to as the
Global Mercury Project (GMP)) that is being carried out in six developing countries located in several
key trans-boundary river/lake basins. Project coordination and support is executed globally through the
UNIDO head office in Vienna. Local management and coordination is carried out by the UNIDO
Assistant Country Focal Point, Mr A Tesha.
8.5
UNIVERSITY OF DAR ES SALAAM
Research related to artisanal gold mining at the University of Dar es Salaam is carried out principally by
the Department of Geology (Professor Mruma, Prof. Ikingura, and Dr Kinabo) and the Faculty of
Aquatic Sciences and Technology (Professor Yunus D Mgaya and Dr John F Machiwa). Dr Machiwa is
responsible for a major on-going research project that he is carrying out on behalf of the Lake Victoria
Environmental Management Project (LVEMP)10. This is carried out in collaboration with the Tanzania
Fisheries Research Institute.
8.6
TANZANIA FISHERIES RESEARCH INSTITUTE
The Fisheries Department, Ministry of Agriculture and Rural Development, Dar-es-Salaam, Tanzania
includes the Tanzania Fisheries Research Institute (TAFIRI), which is a parastatal organization
established in 1980 to cater for fisheries research in the country. TAFIRI comprises five centres: Mwanza
and Soti on Lake Victoria; Kigoma on Lake Tanganyika; Kyela on Lake Nyasa (Malawi) and Dar es
Salaam on the Indian Ocean, which is also the Institute's headquarters.
10 "Impact of gold mining in the Lake Victoria basin on mercury levels in the environment" by JF Machiwa, MA
Kishe, HG Mbilinga, A Mdamo, and O Mnyanza, Report for the Lake Victoria Environmental Management Project;
March 2003.
BGS Report CR/04/129 (Issue 1.0) for UNIDO Contract 03/088
87
Collaboration with TAFIRI for the present study was approved in principle by Dr Ben Ngatunga (Deputy
Director, Tanzania Fisheries Research Institute, TAFIRI, Kyela), although it was left to BGS to organise
the practicalities with TAFIRI staff based in Kigoma and Mwanza.
8.7
SOUTHERN AND EASTERN AFRICAN MINERAL CENTRE
The Southern and Eastern Africa Mineral Centre (SEAMIC) is an independent regional service and
research centre established in 1977 under the umbrella of the United Nations Economic Commission for
Africa (UNECA). SEAMIC offers laboratory testing and analysis services and has well equipped sample
preparation and analytical laboratories. The possibility of having the environmental samples from the
present survey prepared and analysed at SEAMIC was given serious consideration but was rejected,
mainly because SEAMIC has not yet been able to obtain appropriate accreditation.
8.8
LAKE VICTORIA ENVIRONMENTAL MANAGEMENT PROJECT (LVEMP11)
Lake Victoria Environmental Management Project (LVEMP) is a comprehensive environmental program
for the conservation of Lake Victoria and its basin. It is a regional Project formed under a Tripartite
Agreement signed on 5th August 1994 by the three riparian countries the Republic of Kenya, United
Republic of Tanzania, and the Republic of Uganda; which provided for its preparation and
implementation
The major objective of the LVEMP is to restore a healthy, varied lake ecosystem that is inherently stable
and able to support, in a sustainable way, the increasing activities in the lake and its catchment for the
benefit of the people of the riparian countries as well as the international community.
The LVEMP was initially a five-year project running from July 1997 to June 2002. The project is funded
by a credit from the International Development Association (IDA) and a grant from the Global
Environmental Facility (GEF) through the World Bank to a total of US$70.0 million for the three East
African countries. Out of this, the United Republic of Tanzania is receiving US$ 20.4 million over a
period of five years. Kenya and Uganda are receiving US$ 24.3 million and US$ 25.3 million
respectively.
One of the principle objectives of the project is to harmonize national and regional management programs
in order to achieve the reversal of environmental degradation of Lake Victoria and establishing a lake
wide water quality and rainfall monitoring system with agreed parameters to generate information on
eutrophication management and pollution control. The LVEMP appears to have been extended for an
additional time period as work on the project was in progress during 2003.
11http://www.lvemp.org/ and http://www.lvemp.org/L_Whats new/gold_mining.htm
BGS Report CR/04/129 (Issue 1.0) for UNIDO Contract 03/088
88
9 Summary and recommendations
9.1
SAMPLE PREPARATION AND ANALYSIS
(a) Results for Hg determination in duplicate water samples indicate an acceptable level of
reproducibility
(b) Replicate analytical determinations indicate a generally acceptable precision although this varies with
concentration, as would be expected. The precision data for field duplicate soil and tailings samples
are also acceptable for this type of study
(c) Some of the field duplicate sediment samples indicate significant variability in Zn and also Hg, which
might reflect inhomogeneous particulate distribution in the sediments of anthropogenic Zn (from
galvanised roof material, for example, and possibly also from ball mills) and Hg (from
amalgamation). This inhomogeneity is to be expected and is also apparent in one pair of tailings
duplicate samples.
(d) Accuracy of the ICP-ES and Organic Carbon (TOC) data is good, with recoveries of 96-102%. A
recovery of 95% for CV-AAS determination of Hg based on CANMET-STSD-4.
(e) Repeat determination of Hg in twelve sediment and soil samples from the Naboc area in Mindanao in
which Hg had previously been determined by CV-AFS (BGS) confirm that the accuracy of the Hg
analyses for the present study is adequate
(f) Analytical accuracy for Hg in fish and vegetable was monitored using Certified Reference Materials
BCR 422 (Cod muscle) and BCR-060 (Aquatic plant). Recovery figures were in the range 94-103%
for BCR-422 and 90-93% for BCR-060. The analytical precision (Relative Percent Difference) at
concentrations greater than 0.5 mg/kg was +/- 2.6% and the average %RPD was 0.1%.
(g) Duplicate samples of 20 fish analysed for Hg indicate a broad agreement and the average combined
sampling and analytical precision (%RPD) is ±15% for samples containing >0.1 mg/kg Hg. However,
the precision at low concentrations (<0.1 mg/kg) is less satisfactory, ranging from 67% to +176%.
The reason for these relatively high RPD at low Hg concentrations is not known and would require
further and more detailed investigation in future studies.
BGS Report CR/04/129 (Issue 1.0) for UNIDO Contract 03/088
89
9.2
MERCURY IN WATER SEDIMENT, TAILINGS, SOIL, CROPS AND FISH
(a) Mercury in filtered water samples ranges from 0.01 to 0.07 µg/L. No filtered water samples exceeded
any of the Tanzanian Water Quality Standards or other national and international water quality
standards or criteria for drinking water, protection of aquatic biota or protection of human health.
(b) Arsenic in filtered water ranged from 0.1 to 2.4 µg/L. No samples exceeded any water quality
standards or criteria.
(c) Hg concentrations in the fine fraction of streams sediments from the River Malagarasi at Ilagala range
up to 0.65 ppm, which is rather high for an area that does not appear to be unduly affected by
anthropogenic contamination. Concentration of Hg in the fine fraction, together with adsorption of
Hg onto Fe and organic material, may in part explain these relatively enhanced Hg concentrations.
Other possible sources include the geothermal springs at Uvinza or contamination of sediment by
mercuric soap used for skin lightening.
(d) In the Rwamagasa area, Hg in the fine fraction of drainage sediments ranges from 0.08 to 2.84 ppm,
although Hg does not exceed the Toxic Effects Threshold (1 ppm) for more than 2 km downstream
from the major mineral processing centre to the south of the Isingile River. The Toxic Effects
Thresholds for As, Cd, Cu, Pb and Zn are not exceeded in drainage sediments from the Rwamagasa
area.
(e) There is little difference between Hg concentrations in samples taken from historic (dry) tailings piles
(geometric mean, GM 5 ppm) and samples taken from recent sluice box tailings (GM 3 ppm). Hg in
tailings samples from the amalgamation ponds and amalgamation pond tailings (GM 86 ppm) are on
average about 20 times higher. An association between Cd-Cu-Hg-Zn probably reflects
contamination from mercury used in amalgamation with metals that are possibly derived from the ball
mills. Ball mills are typically made of soldered metal plates so there may be Cd and Zn in the solder
would be expected to contaminate tailings. Cadmium is used extensively as a protective coating on
iron and steel, and as an alloying agent with other metals. Cadmium is also used in batteries and
occurs as a contaminant in zinc for galvanized roof sheets and steel piping. Correlations between As
and Fe probably reflect the influence of trace quantities of arsenopyrite and pyrite in the gold ore.
Further studies are required to confirm these hypotheses
(f) Generally low concentrations of Hg occur in most of the cassava, maize, rice, mbuga, and
unclassified soils whilst higher concentrations are found in the urban, mbuga and vegetable plot soils.
In the urban soils, Hg might be derived mainly from air borne transport and deposition of Hg released
during the burning of amalgam whereas in the mbuga and vegetable plot soils high Hg appears to
occur where these are impacted by Hg-contaminated water and sediment derived from mineral
processing activities located on the southern side of the Isingile River. There is a clear association
between Cd-Cu-Zn, which reflects contamination from metals that are possibly derived from the ball
mills and/or galvanized roof sheets. Associations between As, Cu and Fe may reflect the influence of
trace quantities of arsenopyrite and pyrite in the gold ore.
BGS Report CR/04/129 (Issue 1.0) for UNIDO Contract 03/088
90
(g) Hg exceeds (1) the maximum permissible concentration of Hg in agricultural soil in the UK (1
mg/kg) in 12 soil samples;(2) the Canadian Soil Quality Guideline for agricultural soils (6.6 mg/kg)
in three samples; (3) the UK soil guideline value for inorganic Hg for allotments (8 mg/kg;
Environment Agency, 2002) in two samples. The level of contamination of agricultural and urban
soils is significantly less both in magnitude and extent than in other areas, such as the Naboc
irrigation systems on the island of Mindanao, Philippines.
(h) Cd and Zn exceed the maximum permissible concentrations for agricultural soil in the UK (3 mg
Cd/kg and 200 mg Zn/kg) in only a few soil samples. Arsenic exceeds the Canadian Soil Quality
Guideline for agricultural soils (12 mg/kg) in nine agricultural and urban soils.
(i) Soil profile data demonstrate that surface contamination by mineral processing waste in some
agricultural soils affects the root zone. Hoeing of the soils will lead to mixing of the Hg
contamination throughout the root zone.
(j) Hg in vegetable and grains samples collected from the agricultural areas potentially impacted by Hg
contamination are mainly below the detection limit of 0.004 ppm Hg with concentrations of 0.007
and 0.092 ppm Hg recorded in two yam samples and 0.035 ppm Hg in one rice sample. A positive
correlation between Hg in agricultural crops and soil was not detected during the present survey. Hg
in beans, onions and maize samples purchased at Rwamagasa market are below the detection limit
(<0.004 mg Hg/kg) whilst two dehusked rice samples contain 0.011 and 0.131 ppm Hg. The
concentrations of Hg in rice are similar to those recorded in rice grown on the highly contaminated
soils of the Naboc irrigation system, Mindanao.
(k) The fish tissue THg data indicates that the sites sampled in the immediate area of mining activities at
Rwamagasa, are the worst affected and should be considered environmental or contamination
`hotspots' and sites of biomethylation. Tembomine is also a `hotspot' as a result of local mining
activity. Many fish tissues from these sites fail export market standards (0.5 ppm). Fish from these
sites fail the WHO recommended standard for vulnerable groups (0.2 ppm). The Nikonga River fish
samples were slightly elevated compared with the Lake Tanganyika (Ilagala) samples but are below
the WHO threshold for vulnerable groups (0.2 ppm). The influence of the Rwamagasa mining activity
on the THg of fish tissues collected at Lake Tanganyika appears to be negligible as Hg concentrations
are comparable to tissue levels found in Lake Victoria fish.
9.3
EXPOSURE TO ENVIRONMENTAL MERCURY
(a) None of the water samples collected from the river network, or associated drainage ponds exceeded
the WHO or local Tanzanian guideline values of 1 µg/l Hg for drinking water. Whilst this suggests
that mineral processing operations have not contaminated local surface waters and shallow
groundwaters it does not indicate whether drinking water used by the local people has been
contaminated. More extensive monitoring of drinking water sources (which was not the focus of the
current investigations) should be considered as a component of any subsequent follow up work.
BGS Report CR/04/129 (Issue 1.0) for UNIDO Contract 03/088
91
(b) The only samples of water collected during the survey that contained relatively high Hg
concentrations (max. 0.45 µg Hg/l) were from amalgamation ponds. This highlights the need for
careful management of waste waters from these ponds and monitoring of any nearby drinking water
supplies.
(c) The average Hg concentration recorded for samples of rice grain grown in the study area was 0.026
µg/g (dry wt.), so the amount of mercury entering the body, assuming an average consumption of
300g rice per day, is 7.8 µg Hg /day. The total intake from rice is equivalent to 0.055 mg/week which
is much lower than the Provisional Tolerable Weekly Intake (PTWI) of 0.3 mg for total mercury in
the diet set by the WHO and the FAO (1972). If 50% of the Hg in Rwamagasa rice is MeHg, then the
total weekly MeHg intake from rice would be 27.5 µg MeHg which is equivalent to 0.46 µg MeHg/
kg bw/week. Individuals consuming Rwamagasa rice at the upper limit of the Hg concentration range
(0.035 µg/g) would have a weekly intake of 0.6 µg MeHg/ kg bw/week, compared with the MeHg
PTWI of 1.6 µg MeHg/kg bw/week recommended by JECFA in June 2003. This is likely to be a
maximum input because most people in the Rwamagasa area will also consume cassava and maize,
which are grown on soils with low Hg.
(d) The vast majority of people in the Rwamagasa area principally eat Tilapia (Oreochromis spp.), Perch
(Lates spp.) and dagaa (dagan; Rastrineobola spp. and equivalents) from Lake Victoria. Catfish
(Clarias spp; kamare, mumi) is eaten by less than 10% of those people.
(e) Consumption of 250g perch, 500g tilapia and 250g of catfish each week would result in an intake of
27 µg THg/week (equivalent to 0.35 µg MeHg/kg bw/week) for residents of Ilagala-Uvinza, 44 µg
THg/week (equivalent to 0.58 µg MeHg/kg bw/week) for people depending totally on fish from Lake
Victoria, 56 µg THg/week (equivalent to 0.75 µg MeHg/kg bw/week) for people in the Rwamagasa
background area consuming tilapia and perch from Lake Victoria and catfish from the local streams,
and 259 µg THg/week (equivalent to 3.45 µg MeHg/kg bw/week) for people in the Rwamagasa area
consuming tilapia and perch from Lake Victoria and catfish from mining impacted streams. Apart
from the latter group consuming catfish from mining impacted stream (259 µg Hg/week), these inputs
related to fish consumption are well below the JECFA (WHO/FAO) Provisional Tolerable Weekly
Intake (PTWI) of 300 µg for total mercury and 1.6 µg /kg bw/week for methyl mercury (JECFA
2003). Only those people consuming catfish from the Isingile River are likely to be at risk of
exceeding the PTWI.
(f) People consuming 300g/day of rice grown on the Hg contaminated Isingile mbuga and 1kg of fish
from Lake Victoria would have a combined estimated MeHg input of 1.04 µg MeHg/kg bw/week
which is two thirds of the MeHg PTWI.
(g) Elevated exposures to Hg can result from the occasional deliberate and habitual consumption of
contaminated soils and dusts. For example, the Provisional Tolerable Weekly Intake (PTWI) of 0.3
mg for total mercury in the diet set by the WHO and the FAO, which is equivalent to 26 µg THg/day
for a 30kg child is exceeded by an individual practising geophagia (central estimate and worst-case)
or on a case by case basis by an individual occasionally consuming soil/dust (worst-case). The
BGS Report CR/04/129 (Issue 1.0) for UNIDO Contract 03/088
92
practice of geophagy by pregnant females is of particular concern in this regard given the sensitivity
of the foetus to mercury.
(h) The inadvertent ingestion of dusts and soils even those having Hg concentrations significantly above
the regional background, and hence considered to be moderately contaminated, does not appear to
lead to a significant excess exposure to mercury. For example comparison of exposures due to
inadvertent ingestion of soils and/or dusts (0.72 to 1.8 µg THg/day or 5 to 13 µg THg/week) is
typically less than individual exposure via other dietary sources water, rice and fish.
(i) However, given the uncertainties involved in estimating inadvertent dust and soil intake in the rural
Rwamagasa environment, exposure via this route, in addition to more classical geophagic behaviour,
should be considered when planning remedial/intervention measures. Such measures could include
the marking and fencing off of waste tips and areas of enhanced contamination and improvements in
hygiene (washing of hands and food preparation such as the drying of cassava and other crops
directly on the ground and the use of soil as a desiccant to aid the storage of groundnuts and beans).
Whilst geophagy does have an important cultural and possibly nutritional benefit the resulting levels
of potential exposure to young adults and pregnant woman are high enough to suggest that this
practice should be positively discouraged within the mining districts. To this end the importation of
geophagic materials into local markets from outside the contaminated region should be encouraged
and the negatives effects of using local soils conveyed though local woman's groups and childhood
development officers.
9.4
MONITORING SYSTEMS FOR WATER QUALITY AND BIOTA
(a) Monitoring in the current survey followed, as closely as was practicable, the internationally accepted
protocols recommended in Veiga and Baker (2003). It is recommended that water monitoring is
carried out during the wet season to test for Hg in solution and in the suspended sediment, including
studies of the short term and medium term temporal variation in these pollution indicators.
(b) Continuous monitoring equipment capable of determining Hg at low concentrations is, as far as the
authors of this report are aware, not available commercially. So any monitoring system would be
periodic rather than continuous. Quarterly monitoring will probably be adequate for the Isingile and
Nikonga Rivers for a period of two years. If no significant Hg concentrations are detected during that
period, and there are no significant changes in the amount of mineral processing and associated
factors, then annual monitoring, following the USEPA recommendations, will probably be adequate.
(c) The only effective option to prevent the continuing Hg pollution of the Isingile stream and
surrounding agricultural areas is to require (a) the removal of all the existing mineral processing
waste currently located close to the Isingile River and (b) the termination of all mineral processing
activities in the vicinity.
BGS Report CR/04/129 (Issue 1.0) for UNIDO Contract 03/088
93
(d) Monitoring of biota (fish and agricultural crops) has been carried out as part of the current study and
could be carried out periodically using the UNIDO sampling protocols (Veiga and Baker, 2003),
which document procedures for the periodic monitoring of aquatic biota. Periodic monitoring of
agricultural crops could also be carried out, although the results of this study indicate that little Hg is
present in most of the crops. Due to time and finding constraints, the current study was able to sample
only a relatively limited number of sites. For this reason it is recommended that a more
comprehensive survey should be carried out, in order to verify the results presented in this study.
9.5 MEASURES FOR THE REMEDIATION AND POSSIBLE REHABILITATION OF
MERCURY `HOT SPOTS'
(a) The present survey did not detect any concentrations of Hg in solution that would require remediation
as they did not exceed water quality standards. Should future water quality monitoring detect
concentrations that require remediation, then a number of remediation technologies may be
appropriate.
(b) From a practical point of view, there would be little sense in trying to remediate and rehabilitate the
Hg contaminated bottom sediments of the Isingile River until (a) the releases of Hg contaminated
mineral processing tailings from the Rwamagasa area have been terminated, (2) the risk of future
contamination of the drainage system by progressive or catastrophic releases of Hg contaminated
processing waste has been eradicated. It is, however, relatively unlikely that the tailings piles located
adjacent and to the south of the Isingile are a potential source of catastrophic contamination as the
waste piles are small and the slopes are relatively gentle.
(c) In the US, soil clean-up goals for both total and leachable Hg vary from 1 to 21 mg/kg above a
background range of 0.01 to 0.30 mg/kg The California Total Threshold Limit Concentration, for
example is 20 mg/kg, which is above the mean and median concentration of Hg in the agricultural
soils in the Rwamagasa area. As far as the author is aware, no clean-up goals have been set in
Tanzania, the UK or the EC.
(d) The principal remediation-rehabilitation options for Hg-contaminated soils and sediments in the
Isingile River Rwamagasa area include (i) excavation of Hg-contaminated soil and disposal to an
off-site secure landfill or depository, (ii) electroleaching, comprising wet extraction followed by
electrolytic preparation of the leachate is an emerging and potential alternative cleanup method that is
reported to offer a cheaper and more environmentally friendly alternative to thermal treatment or the
acid leaching process. The cost of these potential remediation options has not been estimated.
(e) Other technologies, such as physical treatment by wet classification, extraction of Hg using chelation
agents, or biological treatment, do not appear to be particularly applicable to the Hg contaminated
soils of the Rwamagasa area. Many have been tested only in the laboratory and not in field scale trials
so their efficacy cannot be evaluated.
BGS Report CR/04/129 (Issue 1.0) for UNIDO Contract 03/088
94
(f) Specific practical remediation measures can not be recommended until a much more detailed
assessment has been made of Hg concentrations in the agricultural soils. On the basis of evidence
collected during this survey, it appears that significant amounts of Hg are not adsorbed into the grain
of the agricultural plants. If this can be confirmed by more detailed surveys (involving further
collection and analysis of soil and rice grain samples from exactly the same areas, for example) it
may be possible to confirm that there is little or no potential for a direct negative impact on human
health caused by the consumption of rice grown on these high Hg soils. Should this be the case, there
would be no compelling reason to prevent the continued cultivation of rice and other agricultural
crops on the Hg-contaminated soils.
(g) Should there be a change of land use from rice paddy to corn cultivation, for example, then the
adsorption of Hg by other crops and its potential impact on human health would need to be
investigated more thoroughly.
BGS Report CR/04/129 (Issue 1.0) for UNIDO Contract 03/088
95
10 References
Adeloju, S B, Dhinsdsa, H S and Tandon, R K. 1994. Evaluation of some wet decomposition methods for mercury determination
in biological and environmental materials by cold vapour atomic absorption spectroscopy. Analytica Chimica Acta, 285: 359-
364.
Antelman, G., Msamanga, G.I., Spiegelman, D., Urassa, E, J, N., Narh, R., Hunter, D.J., and Fawzi, W.W. (2000) Nutritional
Factors and Infectious Disease Contribute to Anemia among Pregnant Women with Human Immunodeficiency Virus in
Tanzania, Journal of Nutrition. 2000;130:1950-1957
APHA, 1995. Standard Methods for the Examination of Water and Wastewater, 19th Edition. (American Public Health
Association: Washington)
Appel, P.W.U. et al., 2000. An integrated approach to mineral exploration and environmental assessment in southern and eastern
Africa - a pilot study in Tanzania. 2000/16, Danmarks og Grřnlands Geologiske Undersřgelse.
Appleton, J D, Lister, R and Taylor, H. 2003. . Field Report for Assessment of Environment in Rwamagasa area, Tanzania.
UNIDO Project EG/GLO/01/G34. British Geological Survey Commissioned Report, CR/03/252R. 84pp.
Appleton, J D, Weeks J M, Calvez J P S and Beinhoff, C (in preparation). Impacts of mercury contaminated mining waste on soil
quality, crops, bivalves and fish in the Naboc River area, Mindanao, Philippines.
Appleton, J. D., (2000). A study of the extent of mercury and related chemical pollution along the Naboc River, Monkayo, Davao
del Norte; Hijo River, Apokon ore processing site; and their neighbouring areas (rice fields and banana plantations) A report for
UNIDO Project DP/PHI/98/00511-02, British Geological Survey, 108 pp.
Appleton, J.D., Williams T M, Breward, N, Apostol, A., Miguel, J. & Miranda, C. 1999. Mercury contamination associated with
artisanal gold mining on the island of Mindanao, the Philippines. Science of the Total Environment. 228, 95-109.
Asano, S. et al., 2000. Acute inorganic mercury vapor inhalation poisoning. Pathology International, 50(3): 169-174.
ASTM. 1994. Standard Guide for Collection, Storage, Characterization, and Manipulation of Sediment for Toxicological Testing.
Method E1391-90. In: Annual Book of ASTM Standards, Water and Environmental Technology, Volume 11.04. American
Society for Testing and Materials, Philadelphia, PA.
Babut, M., R. Sekyi, et al. (2001). US/GHA/99/123 - Assistance in Assessing and Reducing Mercury Pollution Emanating from
Artisanal Gold Mining in Ghana - Phase I. Part II - Conduct of surveys on river systems & overall conclusions. Lyon,
CEMAGREF: 29 pp.
Barth, H., 1990. Explanatory notes on the 1:500,000 provisional map of the Lake Victoria goldfields, Tanzania. Geologisches
Jahrbuch. Reihe B: Regionale Geologie Ausland, 72: 1-59.
Barltrop D (1966). The prevalence of pica. American Journal of Diseases of Children 112, 116123
Berzas Nevado, J. J., L. F. Garcia Bermejo, et al. 2003. Distribution of mercury in the aquatic environment at Almaden, Spain.
Environmental Pollution 122(2): 261-271.
Bicknell J (1975). Pica: a Childhood Symptom. Butterworths: London
Borg, G., 1994. The Geita gold deposit in NW Tanzania; geology, ore petrology, geochemistry and timing of events. In:
Anonymous (Editor), Metallogenesis of selected gold deposits in Africa. Geologisches Jahrbuch. Reihe D: Mineralogie,
Petrographie, Geochemie, Lagerstaettenkunde. Schweizerbart in Komm., Stuttgart, Federal Republic of Germany, pp. 545-595.
Calabrese E J (1989). How much soil do young children ingest: an epidemiological study. Regulatory Toxicology and
Pharmacology 10, 113123
BGS Report CR/04/129 (Issue 1.0) for UNIDO Contract 03/088
96
Calabrese E J, Stanek E J & Gilbert C E (1990). Adult soil ingestion estimates. In Petroleum Contaminated Soils 3, School of
Public Health, Environmental Health Sciences Programme (eds Kostecke P T & Calabrese Lewis E J), pp. 349356. Lewis:
Amherst, USA
Calabrese E J, Stanek E J & Gilbert C E (1991). Evidence of soil pica behaviour and quantification of soil ingested. Human and
Experimental Toxicology 10, 245249
Campbell, L. M., D. G. Dixon, et al. 2003a. A review of mercury in Lake Victoria, East Africa: Implications for human and
ecosystem health. Journal of Toxicology and Environmental Health, Part B-Critical Reviews 6(4): 325-356.
Campbell, L. M., O. Osano, et al. 2003b. Mercury in fish from three rift valley lakes (Turkana, Naivasha and Baringo), Kenya,
East Africa. Environmental Pollution 125(2): 281-286.
Cooper M (1957) Pica. Thomas: Springfield, Illinois, USA
Davies S (1990). Quantitative estimates of soil ingestion in normal children, between the ages of 2 and 7 years: Population-based
estimates using aluminium, silicon and titanium as soil tracer elements. Archives of Environmental Health 45, 112122
Drasch, G., and Böse-O'Reilly, S. 2004. Medical investigation of 250 people living in the Rwamagasa area, Geita District in the
United Republic Of Tanzania. Final report, UNIDO Project EG/GLO/01/G34, Institute of Forensic Medicine, Ludwig-
Maximilians University, Munich, Germany.
Eccles, D.H., 1992. Field guide to the freshwater fishes of Tanzania. FAO species identification sheets for fishery purposes.
FAO, Rome
Environment Agency 1998. Improved Environmental Monitoring. Manual of Best Practice for the Design of Water Quality
Monitoring Programmes. R&D Technical Report E59. 514 pp. (authors RJ Wyatt JC, Ellis I Milne & JA Gunby)
Environment Agency 2002. Soil guideline values for inorganic mercury contamination. (Bristol, UK: Environment Agency)
FAO/WHO (2003) Summary and conclusions of the sixty-first meeting of the Joint FAO/WHO Expert Committee on Food
Additives (JECFA), Rome, 10-19 June 2003; JECFA/61/SC
Ferrara, R., B. E. Maserti, et al. 1991. Mercury in abiotic and biotic compartments of an area affected by a geochemical anomaly
(Mt. Amiata, Italy). Water, Air and Soil Pollution 56: 219-233.
Franzen D, Sackman A, Oale R & Chopin M (1988). Analytical results report for ambient air and residential characterisation at
Prospect Square, Park City, Utah. Report prepared for US EPA Hazardous Site Evaluation Division. USEPA: Washington, USA
Geissler P W, Mwaniki D L, Thiongo F, Michaelsen K F & Friis H (1998). Geophagy, iron status and anaemia among primary
school children in Western Kenya. Tropical Medicine & International Health 3(7), 529534
Gough M (1991). Human exposures from dioxin in soil a meeting report. Journal of Toxicology and Environmental Health 32,
205245
Gray, J. E., M. A. L, et al. 1996. Environmental geochemistry of mercury deposits in south-western Alaska: mercury contents in
fish, stream-sediment, and stream-water samples. US Geological Survey Bulletin 2152: 17-29.
Gustin, M. S., G. E. Taylor, Jr., et al. 1994. High levels of mercury contamination in multiple media of the Carson River drainage
basin of Nevada: implications for risk assessment. Environmental Health Perspectives. 102(9): 772-8.
Haines ML, Brydges K, MacDonald MJ, Smith SL, MacDonald DD. 1994. A review of environmental quality criteria and
guidelines for priority substances in the Fraser River Basin. Supporting Documentation. DOE FRAP 1994-31. Vancouver:
Environment Canada.
Harada, M., S. Nakachi, et al. 1999. Monitoring of mercury pollution in Tanzania: relation between head hair mercury and health.
Science of the Total Environment. 227(2-3): 249-256.
BGS Report CR/04/129 (Issue 1.0) for UNIDO Contract 03/088
97
Hempel M & Thöming J. 1999. Remediation techniques for Hg-contaminated sites. pp 113-130 in R Ebinghaus et al. (Editors)
Mercury Contaminated Sites. Characterisation, Risk-Assessment and Remediation. (Berlin: Springer-Verlag)
Horvat, M., N. Nolde, et al. 2003. Total mercury, methylmercury and selenium in mercury polluted areas in the province
Guizhou, China. Science of the Total Environment 304(1-3): 231-256.
Ikingura and Akagi 2002. Proceedings of the International Workshop on Health and Environmental Effects of Mercury, Impacts
of Mercury from Artisanal Gold Mining in Africa. University of Dar es Salaam, 19-20 November 2002. 56-65.
Ikingura, J. R. and H. Akagi, 2003. Total mercury and methylmercury levels in fish from hydroelectric reservoirs in Tanzania.
Science of the Total Environment 304(1-3): 355-368.
Ikingura, J. R. and H. Akagi. 1996. Monitoring of fish and human exposure to mercury due to gold mining in the Lake Victoria
goldfields, Tanzania. Science of the Total Environment 191(1-2): 59-68.
Ikingura, J.R., Mutakyahwa, M.K.D. and Kahatano, J.M.J., 1997. Mercury and mining in Africa with special reference to
Tanzania. Water Air and Soil Pollution, 97(3-4): 223-232.
James, T C. 1967. Thermal springs in Tanzania. Transactions of the Institution of Mining and Metallurgy, Section B, 76, B1-B18.
Kahatano et al 1997. Study of Mercury Levels in Fish and Humans in Mwakitolyo Mine and Mwanza Town in the Lake Victoria
Goldfields, Tanzania. In Landner L (ed) 1997. Small Scale Mining in African Countries. Prospects, Policy and Environmental
Impacts. 159-170.
Keenan R E, Sauer M M, Lawrence F H & Crawford D W (1989). Examination of potential risks from exposure to dioxin in
sludge used to reclaim abandoned strip mines. In The Risk Assessment of Environmental Hazards: A Text Book of Case Studies
(ed Paustenbauch D J), 935998. John Wiley: New York
Kimborough R D, Falk H, Stehr P & Fries G (1984). Health implications of 2,3,7,8-tetrachlorodibenzeno-p-dioxin (TCDD)
contamination of residential soil. Journal of Toxicology and Environmental Health 14, 4793
Kinabo, C. and Lyimo, E., 2002. Preliminary studies of mercury contamination in various food crops at Mgusu mining village in
Geita, Tanzania, Proceedings of the International Workshop on Health and Environmental Effects of Mercury - Impacts of
Mercury from Artisanal Gold Mining in Africa. National Institute for Minamata Disease, Japan & University of Dar es Salaam,
Tanzania, University of Dar es Salaam, Tanzania, pp. 204-214.
Kinabo, C., 1996. Mercury pollution associated with artisanal mining on Lake Victoria Goldfield, in Tanzania. In: R. Ebinghaus,
G. Petersen and U. von Tuempling (Editors), Fourth international conference on mercury as a global pollutant; book of abstracts.
GKSS-Forschungszentrum, Geesthacht, Federal Republic of Germany, pp. 335.
Kinabo, C., 2002. Comparative analyses of Hg-concentration in domestic ducks (Anser sp.) from Mgusu mining village in Geita,
Mwanza and Dar es Salaam, Proceedings of the International Workshop on Health and Environmental Effects of Mercury -
Impacts of Mercury from Artisanal Gold Mining in Africa. National Institute for Minamata Disease, Japan & University of Dar
es Salaam, Tanzania, University of Dar es Salaam, Tanzania, pp. 215-222.
Kinabo, C.P., 2002. Comparative analyses of mercury contents in cosmetics and soaps used in the city of Dar es Salaam,
Proceedings of the International Workshop on Health and Environmental Effects of Mercury - Impacts of Mercury from
Artisanal Gold Mining in Africa. National Institute for Minamata Disease, Japan & University of Dar es Salaam, Tanzania, pp.
173-186.
Kishe, M.A. and Machiwa, J.F., 2003. Distribution of heavy metals in sediments of Mwanza Gulf of Lake Victoria, Tanzania.
Environment International, 28(7): 619-625.
Knusden, J.W (2002) Akula Udongo (Earth Eating Habit): A social and cultural practice amongst Chagga women on the slopes
of Mount Kilimanjaro, African Journal of Indigenous Knowledge Systems, Volume 1.
Lacey E P (1990). Broadening the perspective of pica: literature review. Public Health Reports 105, 2935
BGS Report CR/04/129 (Issue 1.0) for UNIDO Contract 03/088
98
Machiwa, JF, Kishe, MA, Mbilinyi HG, Mdamo A and Mnyanza O. 2003. Impact of gold mining in Lake Victoria Basin on
mercury levels in the environment. Lake Victoria Environmental Management Project Report. 46pp.
Morgan H, Smart G A & Sherlock J C (1988). Intakes of metals. The Science of the Total Environment 75, 71100
Murphy B L, Toole A P & Bergstrom P D (1989). Health risk assessment for arsenic contaminated soil. Environmental
Geochemistry and Health 11, 163169
Mutakyahwa, M.K.D., 2002. Mercury contamination due to gold mining in Tanzania, Proceedings of the International Workshop
on Health and Environmental Effects of Mercury - Impacts of Mercury from Artisanal Gold Mining in Africa. National Institute
for Minamata Disease, Japan & University of Dar es Salaam, Tanzania, pp. 21-29.
Nakagawa R, Yumita Y (1998). Change and behaviour of residual mercury in paddy soils and rice of Japan. Chemoshpere, 37,
1483-1487
NEMC, 1993/1994. A report on the effects of mercury pollution caused by small scale mining activities in Lake Victoria region.
Department of Geology, University of Dar es Salaam / National Environmental Management Council.
NRA, 1994. Implementation of the EC Shellfish Waters Directive. NRA Water Quality Series No. 16.
Paustenbach D J, Shu H P & Murray F J (1986). A critical examination of assumptions used in risk assessments of dioxin
contaminated soils. Regulatory Toxicology and Pharmacology 6, 284307
Ramirez Requelme, M. E., J. F. F. Ramos, et al. 2003. Assessment of Hg-contamination in soils and stream sediments in the
mineral district of Nambija, Ecuadorian Amazon (example of an impacted area affected by artisanal gold mining). Applied
Geochemistry 18(3): 371-381.
RIVM (2001). Technical Evaluation of Intervention Values for Soil/Sediment and Groundwater. RIVM Report 711701023.
Bilthoven, The Netherlands, National Institute of Public Health and the Environment.
SCA (Standing Committee of Analysts), 1980. General principles of sampling and accuracy of results. (Methods for the
examination of waters and associated materials). London: HMSO 58pp.
SCA (Standing Committee of Analysts), 1996. General principles of sampling waters and associated materials. (Methods for the
examination of waters and associated materials). London: HMSO.
Semu, E., Guttormsen, D. and Bakken, L., 1989. Microbial-Populations and Activity in 2 Soils of Tanzania as Influenced by
Mercury. Mircen-Journal of Applied Microbiology and Biotechnology, 5(4): 533-542.
Simon S L (1998). Soil ingestion by humans: a review of history, data, and aetiology with application to risk assessment of
radioactively contaminated Soil. Health Physics 74(6), 647672
Sindayigaya, E., Van Cauwenbergh, R., Robberecht, H. and Deelstra, H., 1994. Copper, zinc, manganese, iron, lead, cadmium,
mercury and arsenic in fish from Lake Tanganyika, Burundi. The Science of The Total Environment, 144(1-3): 103-115.
Smith L A et al., 1995. Remedial options for contaminated sites (Boca Raton: CRC Press)
Smith, B., Rawlins, B. G., Cordeiro, M. J. A. R., Hutchins, M. G., Tiberindwa, J. V., Sserunjogi, L., and Tomkins, A. M. 2000.
The bioaccessibility of essential and potentially toxic trace elements in tropical soils from Mukono District, Uganda. J. Geol. Soc.
157:885891.
Steele M J, Beck B D, Murphy B L & Strauss H S (1990). Assessing the contribution from lead in mining wastes to blood lead.
Regulatory Toxicology and Pharmacology 11, 158190
Thöming J & Frankes S, 1998. Decontamination of mercury polluted soils by electroleaching: assessment of the ecological clean-
up benefit, Contaminated Soil '98, 1123-1124.)
BGS Report CR/04/129 (Issue 1.0) for UNIDO Contract 03/088
99
Thöming J, Sobral L & Wilken RD. 1999. Electroleaching: a mobile cleanup process for mercury contaminated materials. pp
441-455 in R Ebinghaus et al. (Editors) Mercury Contaminated Sites. Characterisation, Risk-Assessment and Remediation.
(Berlin: Springer-Verlag)
Thöming J, Stichnother H, Mangold S & Calmano W. 2000. Hydrometallurgical approaches to soil remediation - process
optimization applying heavy metal speciation. Land Contamination & Reclamation, 8 (1), 43-55.
Tiercelin JJ et al., 1993. Hydrothermal vents in Lake Tanganyika, East African Rift system. Geology, 21: 499-502.
UNEP, 2002. Global mercury assessment. Geneva, UNEP Chemicals. 260p.
University of Dar es Salaam, 1994. Monitoring of mercury and other heavy metal pollution in gold mining areas around lake
Victoria, Tanzania. Final report, Department of Geology, University of Dar es Salaam, Dar es Salaam. 55 pp.
USEPA (1984). Risk analysis of TCDD Contaminated Soil. US EPA, Office of Health and Environmental Assessment, Report
EPA/620/884/031. Washington, DC
USEPA (1989). Exposure Factors Handbook. US EPA, Office of Health and Environmental Assessment, Report EPA/600/8
89/043: Washington, DC
USEPA 1997 Technology alternatives for the remediation of soils with As, Cd, Cr, Hg, and Pb. USEPA, Engineering Bulletin,
EPA/540/S-97/500, August 1997.
USEPA, 1996. Soil Screening Guidance: Technical Background Document. EPA/540/R95/128.
USEPA. 1986. Test Methods for Evaluating Solid Waste. U.S. Environmental Protection Agency, Office of Solid Waste and
Emergency Response, Washington, DC.
USEPA. 1995. QA/QC Guidance for Sampling and Analysis of Sediments, Water, and Tissues for Dredged Material Evaluations.
Phase I - Chemical Evaluations. EPA-823-B-95-001. U.S. Environmental Protection Agency, Office of Water, Washington, DC.
van Straaten, H.P., 1984. Gold mineralization in Tanzania; a review. In: R.P. Foster (Editor), Gold '82; the geology, geochemistry
and genesis of gold deposits. A.A. Balkema, Rotterdam, Netherlands, pp. 673-685.
van Straaten, P., 2000. Human exposure to mercury due to small scale gold mining in northern Tanzania. Science of the Total
Environment, 259(1-3): 45-53.
van Straaten, P., 2000. Mercury contamination associated with small-scale gold mining in Tanzania and Zimbabwe. Science of
the Total Environment, 259(1-3): 105-113.
van Wijnen J H, Clausing P & Brunekreef B (1990). Estimated soil ingestion by children. Environmental Research 51, 147162
Veiga, M.M. and Baker, R. 2003. Protocols for Environmental & Health Assessment of Mercury Released by Artisanal and
Small-Scale Gold Miners (ASM), UNIDO, Vienna.
Wagner, S. 2003. SOCIO-ECONOMIC SURVEY OF RWAMAGASA MINING SITE IN GEITA DISTRICT, Report of
Sociologist/National Expert WID to UNIDO, July 2003
WHO (1972). Evaluation of mercury, lead, cadmium and the food additives amaranth, diethylpyrocarbonate, and octyl gallate.
WHO Food Additives Series, No. 4.
WHO (1976). Environmental Health Criteria 1: Mercury, Geneva, World Health Organisation, 131 pp.
WHO (1989). Environmental Health Criteria 86: Mercury Environmental aspects, Geneva, World Health Organisation, 115 pp.
WHO (1990). Environmental Health Criteria 101: Methylmercury, Geneva, World Health Organisation, 144 pp.
WHO (1991). Environmental Health Criteria 118. Inorganic Mercury, Geneva, World Health Organisation, 115 pp.
WHO (1993) Guidelines for drinking-water quality, 2nd ed., Vol. 1. Recommendations, Geneva, World Health Organization,
1993. p. 51.
BGS Report CR/04/129 (Issue 1.0) for UNIDO Contract 03/088
100
Williams T. M., Rawlins, B.G., Smith, B. and Breward, N. (1998) In-vitro determination of arsenic bioavailability in
contaminated soil and mineral beneficiation waste from Ron Phibun, southern Thailand: A basis for improved human risk
assessment. Environmental Geochemistry and Health 20(4), 169-177
BGS Report CR/04/129 (Issue 1.0) for UNIDO Contract 03/088
101
Appendix 1
TERMS OF REFERENCE
EG/GLO/01/G34
TERMS OF REFERENCE OF SUBCONTRACT ON
ASSESSMENT OF HEALTH AND ENVIRONMENT
Background Information
Mercury is one of the most toxic substances in the world causing significant damage to the environment
and to the health of people who handle it. Mercury, which is used mostly by artisanal gold miners, is
absorbed by the human organism through drinking water, food or breathed air. Artisanal mining activities
provide income to the world's poorest populations and ethnic minorities; a great majority of the miners
being women and children. For every gram of gold recovered, about two grams of mercury are released
into the environment - often resulting in the death of men, women and children and in a permanently
ruined habitat. The relevant simplicity and effectiveness of the technology, known as amalgamation,
mask its dangers. This process can be improved with procedures using inexpensive and highly efficient
devices that can be manufactured locally and at low cost.
The objective of the GEF/UNDP/UNIDO Project is to replace mercury amalgamation in the project
demonstration sites to the extent possible with new technology while improving the income of the miners
through more efficient recovery, increasing knowledge and awareness and providing policy advice on the
regulation of artisanal gold mining with due consideration for gender issues.
The ultimate goals of the GEF/UNDP/UNIDO Project are:
1)
to reduce mercury pollution of international waters by emissions emanating from small-scale gold
mining;
2)
to introduce cleaner technologies for gold extraction and to train people in their application;
3)
to develop capacity and regulatory mechanisms that will enable the sector to minimize mercury
pollution;
4)
to introduce environmental and health monitoring programmes;
5)
to build capacity of local laboratories to assess the extent and impact of mercury pollution.
BGS Report CR/04/129 (Issue 1.0) for UNIDO Contract 03/088
102
The primary target beneficiaries will be artisanal miners - men and women alike. The secondary
beneficiaries will be governments, local institutions and the society at large due to the very nature and
extent of the damage caused by artisanal mining.
The activities will mainly be directed towards the introduction of safe and high-yield extraction methods
that could pre-empt the use of mercury - i.e. introduction of new technology and its dissemination;
training of miners in the application of new technology, training of local manufacturers; awareness
creation on the protection of the environment as well as policy advice to governments and local
institutions.
Scope of services
It is expected that the preparatory work, field work, analyses and the evaluation of results will be
completed over a period of 3 months within 30 working days. The field work is expected to be 8 to 10
days in Lao PDR, Sudan, Tanzania and Zimbabwe where one site has been selected and 20 days in Brazil
and Indonesia where two project demonstration sites are identified.
The field work will be prepared by National Experts covering the areas of public health and mining. Their
salaries will be paid by the Project; i.e. their services are not part of the sub-contract. The National
Experts will accompany and assist the team of the sub-contractor during the field work.
Cost of transportation in the field incurring to sub-contractor through use of air-taxi and/or speed-boat
have to be included in the sub-contract. The distances to overcome in the field are listed for each country
in the following table.
BGS Report CR/04/129 (Issue 1.0) for UNIDO Contract 03/088
103
EG/GLO/01/G34 Selected Project Demonstration Sites
Brazil
Indonesia
Lao
PDR
Sudan
Tanzania
Zimbab
we
Site 1
Creporizinho located in
Bawan area at Kahayan
Mekong River
Gugob
Rwamagasa
Chakari
the garimpo area in Para. River/Kalimantan
Can be reached with a Accessible
from - 1h30 by boat from - 80km from Al Damazin - 3h from Geita on dirt - Approx. 120km from
one-engine plane, access Palangkaraya (having
speed boat station Ban (2h)
road
Harare (1h30)
to mining site requires 4 airport) by 3-hours drive Don/Luang Prabang
- Village of miners
- Village of miners
- Sites located 200m
wheel- drive and one-
on a speedboat.
- 1,000 miners working - Hard rock and alluvial - Usage of mercury in from the main road
hour drive from landing -
600
dredging during Feb-March, less mining
cemented ponds
- Processing on site
strip. Creporizinho has operations on 100 km
during other months
- Processing in the
- Usage of retorts - Burning of amalgam
the infrastructure of a - Using mercury
- Using mercury
village
mandatory, but often not
small village.
- Heat treatment of - Child labor witnessed
- Burning in individual applied.
Gold in small gold veins, amalgam at the shore (for
household
mercury used in open example in floating
circuit.
restaurants)
Site 2
San
Francisco
(Săo North Sulawesi, 20 km
Domingos) located in the away from Manado and
garimpo area of Para. from there easily
Can be reached with a accessible by car,
N/A
N/A
N/A
N/A
one- engine plane from Hard rock mining.
either Itaituba or
Run of mine crushed in
Creporizinho. Garimpo in drums and mixed with
2km distance from the mercury-Final mercury
landing strip. Garimpo containing tailings
consists only of residence discharded into a river
of owner and a shanty draining to the ocean 20
town of garimpeiros.
km away from the coast.
In the mining area some
Air taxi for the flight thousand small-scale
Itaituba, Creporizinho, gold miners
San Fancisco, Santarem
costed US$1,500 in 2001.
BGS Report CR/04/129 (Issue 1.0) for UNIDO Contract 03/088
104
Part A: ASSESSMENT OF HEALTH
The services of the subcontractor must encompass the following activities:
· Refine and develop a UNIDO questionnaire on general health condition of members of the
mining community and on indications for symptoms of mercury poisoning;
· Cooperate with Ministry of Health in assessing the health condition of people affected by
mercury poisoning;
· Advise on most suitable sampling techniques for the survey;
· Develop protocols and interact with local health institutions and the National Expert on Health,
i.e. the nurse seconding the Sub-contractor;
· Based on the sociological survey of the selected mining community undertaken by a National
Expert, take and analyze human specimens from a pre-determined cohort of approx. 200 people
in the hot spot area and 50 persons from a non-exposed group;
· Based on analytical results, advise on the health risk of people living near mining operations and
gold shops where gold is melted;
· Conduct anamnestic/clinical/neurological/toxicological test programme according to the state of
the art;
· Check for neurological disturbances, behavioral disorders, motor neurological functions,
cognitive capabilities, balance, gait, reflexes etc;
· Deliberate with health authorities on appropriate medical treatment;
· Maintain accurate medical records to assure compliance with examinations;
· Compile data for statistical purposes and maintain confidentiality regarding all health-related
issues;
· Encourage communicable disease prevention practices, and;
· Prepare a report summarizing facts and conclusions.
Reports
(a) A Draft Final Report in English, to be submitted to UNIDO/Contract Section in three (3)copies,
not later than 1 month after receipt of last samples.
(b) A Final Report of 100 pages, in English, in seven (7) copies and a diskette (MS Word),
submission 3 weeks after discussion of draft report and its results with UNIDO Chief Technical
Advisor.
Part B: ASSESSMENT OF ENVIRONMENT IN HOT SPOT AREA
The services of the subcontractor must encompass the following activities:
· Based on the sociological survey of the selected mining community undertaken by a National
Expert, take and analyze inorganic and biological (food) samples;
· Meet officials of Government and mining related institutions and discuss present situation of the
environment in the selected gold mining area. Coordinate field work with the national team.
BGS Report CR/04/129 (Issue 1.0) for UNIDO Contract 03/088
105
· Investigate the situation of the habitat/agricultural sites in the vicinity of the selected small-scale
mining activities and take samples;
· Analyse biological samples;
· Evaluate the nature and extent of the mercury pollution in produce, especially in those being part
of the main diet;
· Propose a monitoring system for continuous biological sampling and analyses;
· Prepare a concise report on all findings and data on biological sampling including
recommendations;
· Investigate the situation of the environment in the spot area and take samples from waters,
sediments and soils, where pollution can be assumed;
· Analyze inorganic samples. Expected number of samples is at least 500, but not exceeding most
probably 750 per country. The exact number of samples within these limits will be determined
during project implementation;
· Evaluate the nature and extent of the mercury pollution in the river system adjacent to the hot
spot area;
· Propose a monitoring system for continuous water quality assessment;
· Formulate measures for the remediation and possible rehabilitation of hot spot;
· Advise on necessary interactions between government departments, mining industry and research
institutions;
· Prepare a concise report on all findings and data on environmental sampling including
recommendations.
Reports
(a)
A Draft Final Report in English, to be submitted to UNIDO/Contract Section in three (3) copies,
not later than 3 month after receipt of last samples.
(b)
A Final Report in English of 100 pages including annexes, in seven (7) copies and a
diskette (MS Word), submission 3 weeks after discussion of draft report and its results
with UNIDO Chief Technical Advisor.
BGS Report CR/04/129 (Issue 1.0) for UNIDO Contract 03/088
106
Appendix 2
TABLE A-2-1 FISH DATA: SPECIES, DIMENSIONS, LOCATION AND SAMPLE TYPE
Sample No. Species
L cm W cm Lab No.
Location
Sample type
101
Lates malagarasi
26.5
3.5 F101
Illagala (Malagarasi R.) muscle tissue
102
Clarias gariepinus
26.5
4.5 F102
Illagala (Malagarasi R.) muscle tissue
103
Oreochromis tanganicae
13.5
2.5 F103
Illagala (Malagarasi R.) muscle tissue
104
Auchenoglanis occidentalis 27.0
5.0 F104
Illagala (Malagarasi R.) muscle tissue
105
Brycinus rhodopleura
24.5
3.0 F105
Illagala (Malagarasi R.) muscle tissue
106
Auchenoglanis occidentalis 18.7
2.2 F106
Illagala (Malagarasi R.) muscle tissue
107
Clarias gariepinus
27.0
4.0 F107
Illagala (Malagarasi R.) muscle tissue
108
Clarias gariepinus
26.0
4.0 F108
Illagala (Malagarasi R.) muscle tissue
109
Clarias gariepinus
26.5
4.0 F109
Illagala (Malagarasi R.) muscle tissue
110
Clarias gariepinus
35.0
5.5 F110
Illagala (Malagarasi R.) muscle tissue
111
Auchenoglanis occidentalis 18.5
2.5 F111
Illagala (Malagarasi R.) muscle tissue
112
Clarias gariepinus
28.0
4.5 F112
Illagala (Malagarasi R.) muscle tissue
113
Auchenoglanis occidentalis 26.5
4.7 F113
Illagala (Malagarasi R.) muscle tissue
114
Oreochromis tanganicae
13.5
2.2 F114
Illagala (Malagarasi R.) muscle tissue
115
Oreochromis tanganicae
12.5
2.2 F115
Illagala (Malagarasi R.) muscle tissue
116
Oreochromis tanganicae
15.3
2.5 F116
Illagala (Malagarasi R.) muscle tissue
117
Auchenoglanis occidentalis 25.7
4.5 F117
Illagala (Malagarasi R.) muscle tissue
118
Oreochromis tanganicae
15.3
2.5 F118
Illagala (Malagarasi R.) muscle tissue
119
Lates malagarasi
19.0
2.2 F119
Illagala (Malagarasi R.) muscle tissue
120
Lates malagarasi
19.5
2.5 F120
Illagala (Malagarasi R.) muscle tissue
121
Lates malagarasi
17.5
2.0 F121
Illagala (Malagarasi R.) muscle tissue
122
Hydrocynus vittatus
21.5
2.5 F122
Illagala (Malagarasi R.) muscle tissue
123
Hydrocynus vittatus
18.0
1.0 F123
Illagala (Malagarasi R.) muscle tissue
124
Hydrocynus vittatus
20.2
2.2 F124
Illagala (Malagarasi R.) muscle tissue
125
Hydrocynus vittatus
18.6
2.2 F125
Illagala (Malagarasi R.) muscle tissue
126
Brycinus rhodopleura
17.9
2.0 F126
Illagala (Malagarasi R.) muscle tissue
127
Hydrocynus vittatus
20.5
2.0 F127
Illagala (Malagarasi R.) muscle tissue
128
Brycinus rhodopleura
18.0
2.1 F128
Illagala (Malagarasi R.) muscle tissue
129
Hydrocynus vittatus
20.0
2.0 F129
Illagala (Malagarasi R.) muscle tissue
130
Hydrocynus vittatus
18.0
1.9 F130
Illagala (Malagarasi R.) muscle tissue
131
Hydrocynus vittatus
20.4
1.9 F131
Illagala (Malagarasi R.) muscle tissue
132
Lates malagarasi
18.7
2.2 F132
Illagala (Malagarasi R.) muscle tissue
1001
Clarias gariepinus
19.0
3.8 F1001
Munekesi bk. area
muscle tissue
1002
Clarias gariepinus
18.8
1.8 F1002
Munekesi bk. area
muscle tissue
1003
Clarias gariepinus
19.5
2.0 F1003
Munekesi bk. area
muscle tissue
1004
Clarias gariepinus
23.0
2.4 F1004
Munekesi bk. area
muscle tissue
1005
Clarias gariepinus
13.0
1.5 F1005
Munekesi bk. area
muscle bone skin
1006
Clarias gariepinus
14.2
1.5 F1006
Munekesi bk. area
muscle bone skin
601
Clarias alluadi
12.3
2.1 F6013104 Nyamsenga bk. area
muscle bone skin
604
Clarias alluadi
11.4
1.9 F6013104 Nyamsenga bk. area
muscle bone skin
631
Clarias alluadi
11.9
1.8 F6013104 Nyamsenga bk. area
muscle bone skin
602
Clarias alluadi
8.0
0.8 F6020610 Nyamsenga bk. area
muscle bone skin
606
Clarias alluadi
8.0
0.8 F6020610 Nyamsenga bk. area
muscle bone skin
610
Clarias alluadi
8.0
1.0 F6020610 Nyamsenga bk. area
muscle bone skin
603
Clarias alluadi
10.0
1.0 F6031429 Nyamsenga bk. area
muscle bone skin
614
Clarias alluadi
10.0
0.9 F6031429 Nyamsenga bk. area
muscle bone skin
BGS Report CR/04/129 (Issue 1.0) for UNIDO Contract 03/088
107
Sample No. Species
L cm W cm Lab No.
Location
Sample type
629
Clarias alluadi
10.0
0.8 F6031429 Nyamsenga bk. area
muscle bone skin
605
Clarias alluadi
16.0
1.5 F605
Nyamsenga bk. area
muscle tissue
608
Clarias alluadi
5.1
0.6 F6083625 Nyamsenga bk. area
muscle bone skin
625
Clarias alluadi
7.0
0.7 F6083625 Nyamsenga bk. area
muscle bone skin
636
Clarias alluadi
6.4
0.7 F6083625 Nyamsenga bk. area
muscle bone skin
616
Clarias alluadi
12.9
2.0 F6162120 Nyamsenga bk. area
muscle bone skin
620
Clarias alluadi
13.5
2.2 F6162120 Nyamsenga bk. area
muscle bone skin
621
Clarias alluadi
13.3
2.0 F6162120 Nyamsenga bk. area
muscle bone skin
617
Clarias alluadi
9.0
0.9 F6171937 Nyamsenga bk. area
muscle bone skin
619
Clarias alluadi
9.0
1.0 F6171937 Nyamsenga bk. area
muscle bone skin
637
Clarias alluadi
9.0
1.1 F6171937 Nyamsenga bk. area
muscle bone skin
618
Clarias alluadi
8.7
1.0 F6222418 Nyamsenga bk. area
muscle bone skin
622
Clarias alluadi
8.5
0.8 F6222418 Nyamsenga bk. area
muscle bone skin
624
Clarias alluadi
8.5
1.0 F6222418 Nyamsenga bk. area
muscle bone skin
623
Clarias alluadi
16.2
1.9 F623
Nyamsenga bk. area
muscle tissue
626
Clarias alluadi
16.0
2.0 F626
Nyamsenga bk. area
muscle tissue
612
Clarias alluadi
8.1
0.8 F6281227 Nyamsenga bk. area
muscle bone skin
627
Clarias alluadi
8.1
0.9 F6281227 Nyamsenga bk. area
muscle bone skin
628
Clarias alluadi
8.0
0.8 F6281227 Nyamsenga bk. area
muscle bone skin
611
Clarias alluadi
9.4
1.0 F6301115 Nyamsenga bk. area
muscle bone skin
615
Clarias alluadi
9.6
1.2 F6301115 Nyamsenga bk. area
muscle bone skin
630
Clarias alluadi
9.3
1.1 F6301115 Nyamsenga bk. area
muscle bone skin
613
Clarias alluadi
10.4
1.2 F6333413 Nyamsenga bk. area
muscle bone skin
633
Clarias alluadi
10.2
1.0 F6333413 Nyamsenga bk. area
muscle bone skin
634
Clarias alluadi
10.3
0.8 F6333413 Nyamsenga bk. area
muscle bone skin
607
Clarias alluadi
7.4
0.8 F635320709 Nyamsenga bk. area
muscle bone skin
609
Clarias alluadi
7.5
0.8 F635320709 Nyamsenga bk. area
muscle bone skin
632
Clarias alluadi
7.3
0.9 F635320709 Nyamsenga bk. area
muscle bone skin
635
Clarias alluadi
7.2
1.0 F635320709 Nyamsenga bk. area
muscle bone skin
1201
Oreochromis niloticus
19.5
3.5 F1201 Rwamagasa
market
muscle
tissue
1202
Oreochromis niloticus
17.5
3.5 F1202 Rwamagasa
market
muscle
tissue
1203
Oreochromis niloticus
19.0
4.0 F1203 Rwamagasa
market
muscle
tissue
1204
Oreochromis niloticus
15.0
3.0 F1204 Rwamagasa
market
muscle
tissue
1205
Oreochromis niloticus
14.7
3.0 F1205 Rwamagasa
market
muscle
tissue
301
Clarias gariepinus
14.0
2.1 F301
Rwamagasa Pond 1
muscle tissue
302
Clarias gariepinus
14.4
2.3 F302
Rwamagasa Pond 1
muscle tissue
306
Barbus spp
5.0
0.5 F3061114 Rwamagasa Pond 1
muscle bone skin
311
Barbus spp
5.0
0.5 F3061114 Rwamagasa Pond 1
muscle bone skin
314
Barbus spp
5.0
0.5 F3061114 Rwamagasa Pond 1
muscle bone skin
307
Barbus spp
5.2
0.6 F3071013 Rwamagasa Pond 1
muscle bone skin
310
Barbus spp
5.2
0.5 F3071013 Rwamagasa Pond 1
muscle bone skin
313
Barbus spp
5.2
0.5 F3071013 Rwamagasa Pond 1
muscle bone skin
305
Barbus spp
6.1
0.7 F30905
Rwamagasa Pond 1
muscle bone skin
309
Barbus spp
6.0
0.7 F30905
Rwamagasa Pond 1
muscle bone skin
304
Barbus spp
5.5
0.5 F3150804 Rwamagasa Pond 1
muscle bone skin
308
Barbus spp
5.4
0.6 F3150804 Rwamagasa Pond 1
muscle bone skin
315
Barbus spp
5.3
0.7 F3150804 Rwamagasa Pond 1
muscle bone skin
303
Barbus spp
5.6
0.5 F3160312 Rwamagasa Pond 1
muscle bone skin
312
Barbus spp
5.6
0.8 F3160312 Rwamagasa Pond 1
muscle bone skin
316
Barbus spp
5.5
0.6 F3160312 Rwamagasa Pond 1
muscle bone skin
402
Haplochromis spp
3.3
0.4 F4021213 Rwamagasa Pond 2
muscle bone skin
412
Haplochromis spp
3.3
0.4 F4021213 Rwamagasa Pond 2
muscle bone skin
413
Haplochromis spp
3.3
0.4 F4021213 Rwamagasa Pond 2
muscle bone skin
403
Haplochromis spp
4.1
0.6 F4050803 Rwamagasa Pond 2
muscle bone skin
405
Haplochromis spp
3.8
0.7 F4050803 Rwamagasa Pond 2
muscle bone skin
408
Haplochromis spp
3.8
0.6 F4050803 Rwamagasa Pond 2
muscle bone skin
407
Haplochromis spp
2.7
0.3 F410071615 Rwamagasa Pond 2
muscle bone skin
410
Haplochromis spp
2.6
0.3 F410071615 Rwamagasa Pond 2
muscle bone skin
415
Haplochromis spp
2.9
0.4 F410071615 Rwamagasa Pond 2
muscle bone skin
BGS Report CR/04/129 (Issue 1.0) for UNIDO Contract 03/088
108
Sample No. Species
L cm W cm Lab No.
Location
Sample type
416
Haplochromis spp
2.8
0.4 F410071615 Rwamagasa Pond 2
muscle bone skin
404
Haplochromis spp
2.3
0.3 F4110409 Rwamagasa Pond 2
muscle bone skin
409
Haplochromis spp
2.3
0.4 F4110409 Rwamagasa Pond 2
muscle bone skin
411
Haplochromis spp
2.2
0.3 F4110409 Rwamagasa Pond 2
muscle bone skin
401
Haplochromis spp
3.1
0.4 F417061401 Rwamagasa Pond 2
muscle bone skin
406
Haplochromis spp
3.0
0.3 F417061401 Rwamagasa Pond 2
muscle bone skin
414
Haplochromis spp
3.0
0.4 F417061401 Rwamagasa Pond 2
muscle bone skin
417
Haplochromis spp
2.9
0.4 F417061401 Rwamagasa Pond 2
muscle bone skin
418
Clarias gariepinus
6.9
0.9 F4191820 Rwamagasa Pond 2
muscle bone skin
419
Clarias gariepinus
5.5
0.9 F4191820 Rwamagasa Pond 2
muscle bone skin
420
Clarias gariepinus
7.8
0.9 F4191820 Rwamagasa Pond 2
muscle bone skin
502
Haplochromis spp
3.0
0.5 F5020409 Rwamagasa Pond 4
muscle bone skin
504
Haplochromis spp
3.5
0.5 F5020409 Rwamagasa Pond 4
muscle bone skin
509
Haplochromis spp
3.5
0.4 F5020409 Rwamagasa Pond 4
muscle bone skin
503
Haplochromis spp
4.6
0.7 F5060803 Rwamagasa Pond 4
muscle bone skin
506
Haplochromis spp
4.3
0.5 F5060803 Rwamagasa Pond 4
muscle bone skin
508
Haplochromis spp
4.5
0.5 F5060803 Rwamagasa Pond 4
muscle bone skin
511
Haplochromis spp
7.0
1.1 F511
Rwamagasa Pond 4
muscle bone skin
505
Haplochromis spp
4.0
0.4 F512070510 Rwamagasa Pond 4
muscle bone skin
507
Haplochromis spp
3.8
0.4 F512070510 Rwamagasa Pond 4
muscle bone skin
510
Haplochromis spp
4.0
0.4 F512070510 Rwamagasa Pond 4
muscle bone skin
512
Haplochromis spp
3.7
0.6 F512070510 Rwamagasa Pond 4
muscle bone skin
513
Clarias gariepinus
16.4
2.6 F513
Rwamagasa Pond 4
muscle tissue
514
Clarias gariepinus
11.2
1.8 F514
Rwamagasa Pond 4
muscle tissue
518
Clarias gariepinus
16.8
1.9 F518
Rwamagasa Pond 4
muscle tissue
515
Clarias gariepinus
10.3
1.7 F5202315 Rwamagasa Pond 4
muscle bone skin
520
Clarias gariepinus
10.0
0.8 F5202315 Rwamagasa Pond 4
muscle bone skin
523
Clarias gariepinus
10.0
1.5 F5202315 Rwamagasa Pond 4
muscle bone skin
521
Clarias gariepinus
19.5
2.5 F521
Rwamagasa Pond 4
muscle tissue
525
Clarias gariepinus
22.5
3.3 F525
Rwamagasa Pond 4
muscle tissue
526
Clarias gariepinus
18.5
2.9 F526
Rwamagasa Pond 4
muscle tissue
517
Clarias gariepinus
10.6
1.9 F5283617 Rwamagasa Pond 4
muscle bone skin
528
Clarias gariepinus
10.3
1.3 F5283617 Rwamagasa Pond 4
muscle bone skin
536
Clarias gariepinus
10.5
1.2 F5283617 Rwamagasa Pond 4
muscle bone skin
529
Clarias gariepinus
12.1
2.0 F529414340 Rwamagasa Pond 4
muscle bone skin
540
Clarias gariepinus
12.5
1.7 F529414340 Rwamagasa Pond 4
muscle bone skin
541
Clarias gariepinus
12.3
1.4 F529414340 Rwamagasa Pond 4
muscle bone skin
543
Clarias gariepinus
12.3
1.7 F529414340 Rwamagasa Pond 4
muscle bone skin
530
Clarias gariepinus
9.5
1.0 F5323035 Rwamagasa Pond 4
muscle bone skin
532
Clarias gariepinus
9.2
1.8 F5323035 Rwamagasa Pond 4
muscle bone skin
535
Clarias gariepinus
9.9
0.5 F5323035 Rwamagasa Pond 4
muscle bone skin
519
Clarias gariepinus
8.4
0.6 F5331931 Rwamagasa Pond 4
muscle bone skin
531
Clarias gariepinus
9.1
1.1 F5331931 Rwamagasa Pond 4
muscle bone skin
533
Clarias gariepinus
8.2
0.9 F5331931 Rwamagasa Pond 4
muscle bone skin
524
Clarias gariepinus
11.2
1.5 F534142442 Rwamagasa Pond 4
muscle bone skin
534
Clarias gariepinus
11.1
1.4 F534142442 Rwamagasa Pond 4
muscle bone skin
542
Clarias gariepinus
11.5
1.5 F534142442 Rwamagasa Pond 4
muscle bone skin
538
Clarias gariepinus
4.5
1.2 F538
Rwamagasa Pond 4
muscle bone skin
516
Clarias gariepinus
10.8
1.9 F5393716 Rwamagasa Pond 4
muscle bone skin
537
Clarias gariepinus
10.7
1.3 F5393716 Rwamagasa Pond 4
muscle bone skin
539
Clarias gariepinus
10.6
1.2 F5393716 Rwamagasa Pond 4
muscle bone skin
545
Clarias gariepinus
15.0
1.8 F54551
Rwamagasa Pond 4
muscle bone skin
551
Clarias gariepinus
15.1
2.3 F54551
Rwamagasa Pond 4
muscle bone skin
501
Clarias gariepinus
14.5
1.9 F5464901 Rwamagasa Pond 4
muscle bone skin
546
Clarias gariepinus
14.2
1.8 F5464901 Rwamagasa Pond 4
muscle bone skin
549
Clarias gariepinus
14.3
2.1 F5464901 Rwamagasa Pond 4
muscle bone skin
544
Clarias gariepinus
13.1
1.9 F5474448 Rwamagasa Pond 4
muscle bone skin
547
Clarias gariepinus
13.0
2.0 F5474448 Rwamagasa Pond 4
muscle bone skin
548
Clarias gariepinus
13.3
1.7 F5474448 Rwamagasa Pond 4
muscle bone skin
BGS Report CR/04/129 (Issue 1.0) for UNIDO Contract 03/088
109
Sample No. Species
L cm W cm Lab No.
Location
Sample type
522
Clarias gariepinus
13.7
1.8 F5502227 Rwamagasa Pond 4
muscle bone skin
527
Clarias gariepinus
13.9
1.7 F5502227 Rwamagasa Pond 4
muscle bone skin
550
Clarias gariepinus
13.5
1.9 F5502227 Rwamagasa Pond 4
muscle bone skin
552
Clarias gariepinus
16.1
2.0 F552
Rwamagasa Pond 4
muscle tissue
701
Clarias gariepinus
9.7
1.0 F70201
Rwamagasa Pond 5
muscle bone skin
702
Clarias gariepinus
9.5
1.2 F70201
Rwamagasa Pond 5
muscle bone skin
703
Clarias gariepinus
15.0
1.5 F70310
Rwamagasa Pond 5
muscle bone skin
710
Clarias gariepinus
15.1
2.0 F70310
Rwamagasa Pond 5
muscle bone skin
705
Clarias gariepinus
10.0
1.7 F70509
Rwamagasa Pond 5
muscle bone skin
709
Clarias gariepinus
10.0
1.8 F70509
Rwamagasa Pond 5
muscle bone skin
704
Clarias gariepinus
12.5
2.0 F707040608 Rwamagasa Pond 5
muscle bone skin
706
Clarias gariepinus
13.2
1.8 F707040608 Rwamagasa Pond 5
muscle bone skin
707
Clarias gariepinus
12.2
1.8 F707040608 Rwamagasa Pond 5
muscle bone skin
708
Clarias gariepinus
13.2
2.0 F707040608 Rwamagasa Pond 5
muscle bone skin
802
Haplochromis spp
4.5
0.6 F803050602 Rwamagasa Pond 6
muscle bone skin
803
Haplochromis spp
3.5
0.5 F803050602 Rwamagasa Pond 6
muscle bone skin
805
Haplochromis spp
3.6
0.6 F803050602 Rwamagasa Pond 6
muscle bone skin
806
Haplochromis spp
4.0
0.7 F803050602 Rwamagasa Pond 6
muscle bone skin
801
Haplochromis spp
2.7
0.5 F808070104 Rwamagasa Pond 6
muscle bone skin
804
Haplochromis spp
3.2
0.6 F808070104 Rwamagasa Pond 6
muscle bone skin
807
Haplochromis spp
2.5
0.3 F808070104 Rwamagasa Pond 6
muscle bone skin
808
Haplochromis spp
2.1
0.3 F808070104 Rwamagasa Pond 6
muscle bone skin
809
Barbus spp
4.7
0.9 F8091018 Rwamagasa Pond 6
muscle bone skin
810
Barbus spp
4.7
0.7 F8091018 Rwamagasa Pond 6
muscle bone skin
818
Barbus spp
5.0
1.0 F8091018 Rwamagasa Pond 6
muscle bone skin
814
Barbus spp
3.7
0.5 F8142019 Rwamagasa Pond 6
muscle bone skin
819
Barbus spp
3.9
0.7 F8142019 Rwamagasa Pond 6
muscle bone skin
820
Barbus spp
3.8
0.5 F8142019 Rwamagasa Pond 6
muscle bone skin
811
Barbus spp
4.4
0.7 F8151611 Rwamagasa Pond 6
muscle bone skin
815
Barbus spp
4.2
0.8 F8151611 Rwamagasa Pond 6
muscle bone skin
816
Barbus spp
4.2
0.8 F8151611 Rwamagasa Pond 6
muscle bone skin
812
Barbus spp
4.1
0.7 F8171213 Rwamagasa Pond 6
muscle bone skin
813
Barbus spp
4.1
0.7 F8171213 Rwamagasa Pond 6
muscle bone skin
817
Barbus spp
4.0
0.6 F8171213 Rwamagasa Pond 6
muscle bone skin
821
Brycinus
6.4
0.8 F821
Rwamagasa Pond 6
muscle bone skin
822
Brycinus
6.5
1.0 F822
Rwamagasa Pond 6
muscle bone skin
823
Brycinus
7.5
1.2 F823
Rwamagasa Pond 6
muscle bone skin
824
Brycinus
6.0
0.8 F824
Rwamagasa Pond 6
muscle bone skin
825
Brycinus
6.0
0.9 F825
Rwamagasa Pond 6
muscle bone skin
826
Brycinus
7.8
1.2 F826
Rwamagasa Pond 6
muscle bone skin
841
Clarias gariepinus
12.0
1.8 F8445041 Rwamagasa Pond 6
muscle bone skin
844
Clarias gariepinus
11.0
1.9 F8445041 Rwamagasa Pond 6
muscle bone skin
850
Clarias gariepinus
11.9
1.4 F8445041 Rwamagasa Pond 6
muscle bone skin
845
Clarias gariepinus
13.8
1.4 F8474845 Rwamagasa Pond 6
muscle bone skin
847
Clarias gariepinus
13.5
1.5 F8474845 Rwamagasa Pond 6
muscle bone skin
848
Clarias gariepinus
13.7
1.7 F8474845 Rwamagasa Pond 6
muscle bone skin
846
Clarias gariepinus
13.0
1.4 F851524649 Rwamagasa Pond 6
muscle bone skin
849
Clarias gariepinus
13.0
1.5 F851524649 Rwamagasa Pond 6
muscle bone skin
851
Clarias gariepinus
12.5
1.4 F851524649 Rwamagasa Pond 6
muscle bone skin
852
Clarias gariepinus
12.5
1.8 F851524649 Rwamagasa Pond 6
muscle bone skin
853
Clarias gariepinus
14.5
2.0 F8535455 Rwamagasa Pond 6
muscle bone skin
854
Clarias gariepinus
14.5
2.0 F8535455 Rwamagasa Pond 6
muscle bone skin
855
Clarias gariepinus
14.9
1.9 F8535455 Rwamagasa Pond 6
muscle bone skin
842
Clarias gariepinus
14.1
2.0 F8564243 Rwamagasa Pond 6
muscle bone skin
843
Clarias gariepinus
14.5
1.8 F8564243 Rwamagasa Pond 6
muscle bone skin
856
Clarias gariepinus
14.0
1.8 F8564243 Rwamagasa Pond 6
muscle bone skin
857
Clarias alluadi
12.3
1.4 F857
Rwamagasa Pond 6
muscle bone skin
858
Clarias alluadi
6.5
0.5 F858
Rwamagasa Pond 6
muscle bone skin
859
Clarias alluadi
8.9
1.0 F859
Rwamagasa Pond 6
muscle bone skin
BGS Report CR/04/129 (Issue 1.0) for UNIDO Contract 03/088
110
Sample No. Species
L cm W cm Lab No.
Location
Sample type
860
Clarias alluadi
6.2
0.7 F860
Rwamagasa Pond 6
muscle bone skin
827
Clarias alluadi
11.3
1.8 F8272931 Nikonga R.
muscle bone skin
829
Clarias alluadi
11.3
1.8 F8272931 Nikonga R.
muscle bone skin
831
Clarias alluadi
12.0
1.5 F8272931 Nikonga R.
muscle bone skin
828
Clarias alluadi
8.5
1.8 F8283233 Nikonga R.
muscle bone skin
832
Clarias alluadi
8.5
0.8 F8283233 Nikonga R.
muscle bone skin
833
Clarias alluadi
8.6
1.0 F8283233 Nikonga R.
muscle bone skin
830
Clarias alluadi
9.5
1.0 F83530
Nikonga R.
muscle bone skin
835
Clarias alluadi
9.3
1.2 F83530
Nikonga R.
muscle bone skin
834
Clarias alluadi
7.2
0.6 F8383437 Nikonga R.
muscle bone skin
837
Clarias alluadi
8.0
0.9 F8383437 Nikonga R.
muscle bone skin
838
Clarias alluadi
6.7
0.7 F8383437 Nikonga R.
muscle bone skin
836
Clarias alluadi
6.2
0.7 F8394036 Nikonga R.
muscle bone skin
839
Clarias alluadi
6.0
0.7 F8394036 Nikonga R.
muscle bone skin
840
Clarias alluadi
6.0
0.5 F8394036 Nikonga R.
muscle bone skin
915
Cynodontis victoriae
4.4
0.9 F915
Nikonga R.
muscle bone skin
916
Gastropoda
3.9
3.5 F916
Nikonga R.
muscle inc. foot.
917
Gastropoda
4.5
4.2 F917
Nikonga R.
muscle inc. foot.
918
Gastropoda
4.6
4.2 F918
Nikonga R.
muscle inc. foot.
919
Gastropoda
4.8
4.0 F919
Nikonga R.
muscle inc. foot.
920
Gastropoda
2.9
2.2 F920
Nikonga R.
muscle inc. foot.
1101
Clarias gariepinus
18.5
2.1 F1101 Tembomine
muscle
tissue
1102
Clarias gariepinus
19.5
2.5 F1102 Tembomine
muscle
tissue
1103
Clarias gariepinus
22.5
3.8 F1103 Tembomine
muscle
tissue
1104
Clarias gariepinus
26.0
4.0 F1104 Tembomine
muscle
tissue
1105
Clarias gariepinus
26.0
4.0 F1105 Tembomine
muscle
tissue
1106
Clarias gariepinus
20.0
2.5 F1106 Tembomine
muscle
tissue
1107
Clarias gariepinus
42.0
5.5 F1107 Tembomine
muscle
tissue
1108
Clarias gariepinus
23.0
3.8 F1108 Tembomine
muscle
tissue
1109
Clarias gariepinus
21.0
2.5 F1109 Tembomine
muscle
tissue
1110
Clarias gariepinus
24.0
3.7 F1110 Tembomine
muscle
tissue
1111
Clarias gariepinus
21.0
2.8 F1111 Tembomine
muscle
tissue
1112
Clarias gariepinus
23.5
2.8 F1112 Tembomine
muscle
tissue
1113
Clarias gariepinus
17.0
2.4 F1113 Tembomine
muscle
tissue
1114
Clarias gariepinus
28.9
3.6 F1114 Tembomine
muscle
tissue
1115
Clarias gariepinus
20.8
2.7 F1115 Tembomine
muscle
tissue
1116
Clarias gariepinus
19.5
2.4 F1116 Tembomine
muscle
tissue
1117
Clarias gariepinus
24.0
3.0 F1117 Tembomine
muscle
tissue
1118
Clarias gariepinus
22.0
3.3 F1118 Tembomine
muscle
tissue
1119
Clarias gariepinus
21.2
2.8 F1119 Tembomine
muscle
tissue
1120
Clarias gariepinus
16.1
2.2 F1120 Tembomine
muscle
tissue
1121
Clarias gariepinus
16.0
2.8 F1121 Tembomine
muscle
tissue
1122
Clarias gariepinus
25.5
4.0 F1122 Tembomine
muscle
tissue
1123
Clarias gariepinus
17.0
2.5 F1123 Tembomine
muscle
tissue
1124
Clarias gariepinus
20.0
3.1 F1124 Tembomine
muscle
tissue
1125
Clarias gariepinus
31.3
5.0 F1125 Tembomine
muscle
tissue
201
Oreochromis tanganicae
11.6
2.2 F201 Uvinza
(Malagarasi R.) muscle tissue
202
Barbus tropidolepsis
14.2
2.8 F202 Uvinza
(Malagarasi R.) muscle tissue
203
Barbus tropidolepsis
10.2
1.6 F203 Uvinza
(Malagarasi R.) muscle tissue
204
Barbus tropidolepsis
12.5
2.0 F204 Uvinza
(Malagarasi R.) muscle tissue
205
Barbus tropidolepsis
11.9
1.7 F205 Uvinza
(Malagarasi R.) muscle tissue
206
Oreochromis tanganicae
10.8
2.2 F206 Uvinza
(Malagarasi R.) muscle tissue
207
Oreochromis tanganicae
14.0
2.9 F207 Uvinza
(Malagarasi R.) muscle tissue
208
Oreochromis tanganicae
12.1
2.0 F208 Uvinza
(Malagarasi R.) muscle tissue
209
Ctenopharyngodon idella 22.5
2.6 F209 Uvinza
(Malagarasi R.) muscle tissue
BGS Report CR/04/129 (Issue 1.0) for UNIDO Contract 03/088
111
BGS Report CR/04/129 (Issue 1.0) for UNIDO Contract 03/088
112
Appendix 3
TABLE A-3-1 REPLICATE ANALYSES OF SEDIMENT, TAILINGS AND SOIL SAMPLES
Original
Replicate
A 003 RE A 003
%RPD
Cu ppm
2
1
67
Pb ppm
3
3
0
Zn ppm
8
7
13
Fe %
0.16
0.16
0
As
ppm
< 2
< 2
Hg ppb
105
110
-5
ORG/C %
0.16
0.16
0
A 040 RE A 040
%RPD
Cu ppm
108
115
-6
Pb ppm
23
33
-36
Zn ppm
82
83
-1
Fe %
4.97
5.44
-9
As ppm
63
67
-6
Hg ppb
127000
123000
3
ORG/C %
nd
nd
A 080 RE A 080
%RPD
Cu ppm
28
29
-4
Pb ppm
13
9
36
Zn ppm
27
27
0
Fe %
2.93
2.92
0
As ppm
4
6
-40
Hg ppb
10
15
-40
ORG/C %
3.76
3.6
4
A 120 RE A 120
%RPD
Cu ppm
48
49
-2
Pb ppm
9
9
0
Zn ppm
13
14
-7
Fe %
8.58
8.37
2
As ppm
12
9
29
Hg ppb
30
25
18
ORG/C %
1.8
1.89
-5
A 210 RE A 210
%RPD
Cu ppm
42
41
2
Pb ppm
6
4
40
Zn ppm
14
13
7
Fe %
4.3
4.29
0
As ppm
6
6
0
Hg ppb
25
20
22
ORG/C %
3.3
3.21
3
BGS Report CR/04/129 (Issue 1.0) for UNIDO Contract 03/088
113
TABLE A-3-1 REPLICATE ANALYSES OF SEDIMENT, TAILINGS AND SOIL SAMPLES
(CONTD)
Original
Replicate
A 240
RE A 240
%RPD
Cu ppm
49
51
-4
Pb ppm
5
5
0
Zn ppm
38
40
-5
Fe %
4.86
4.99
-3
As ppm
5
7
-33
Hg ppb
30
30
0
ORG/C %
1.92
1.97
-3
A 270
RE A 270
%RPD
Cu ppm
39
39
0
Pb ppm
6
9
-40
Zn ppm
31
31
0
Fe %
3.6
3.58
1
As ppm
2
3
-40
Hg ppb
25
20
22
ORG/C %
1.11
1.21
-9
A 300
RE A 300
%RPD
Cu ppm
36
35
3
Pb ppm
9
10
-11
Zn ppm
21
20
5
Fe %
6.24
6.31
-1
As ppm
3
<
2
Hg ppb
45
40
12
ORG/C %
2.46
2.4
2
BGS Report CR/04/129 (Issue 1.0) for UNIDO Contract 03/088
114
TABLE A-3-2 ANALYTICAL AND PRECISION (RPD) DATA FOR SOIL AND TAILINGS
DUPLICATE SAMPLES
%RPD
Sample
Dup Cu Pb Zn Fe As
Hg
ORGC Cd
Cu Pb Zn Fe As Hg
ORGC Cd
ppm
ppm
ppm
%
ppm
ppb
% ppm
A 243 DS
31
4 23 1.98
3
25
2.35 0.25
76 29 71 60 100
0
9
0
A
244
DS 14 3 11
1.07 1 25
2.15 0.25
A
005 DT 368 1.5 1476 2.72 8 54000
nd 13.9
-6
0 -1 -1 0 -9
-1
A
006 DT 392 1.5 1487 2.75 8 59000
nd
14
A
011 DT 176 51 243 5.5 40 83000
nd 2.1
47 46 59 57 76 -35
47
A 012 DT 109 32 133 3.06 18 118000
nd 1.3
A
020 DT 115 22 143 8.54 21 13910
nd 0.5
10 -4
4 29 5 -26
-18
A
021 DT 104 23 137 6.38 20 18000
nd 0.6
A 040 DT 108 23 82 4.97 63 127000
nd 0.25
-15 -20 -11 -3 2
7
0
A
041
DT
126
28 92
5.1
62
118000
nd 0.25
A 057 DT
67 10 43 3.58 18
2780
nd 0.25
2
0 -5 -1 -5
0
0
A
058
DT 66
10 45
3.63
19 2785
nd 0.25
Average
7
4
9 16
15
-12
6
A 089 SS
19 14 15 1.81
1
15
2.87 0.25
0
0
0
5
0
0
1
0
A
090
SS 19
14 15
1.72 1 15
2.83 0.25
A 096 SS
43 12 16 5.98
7
65
2.64 0.25
-2 40
0 -2 55 89
-13
0
A
097
SS 44 8 16
6.09 4 25
3.01 0.25
A 133 SS
88
6 101 7.37
7
145
1.96 0.25
1
0
1 -3 -13
-3
-8
0
A
134
SS 87 6
100
7.58 8 150
2.12 0.25
A 141 SS
30
5 23 2.91
3
80
2 0.25
3 -33 19
6 100 21
1
0
A
142
SS 29 7 19
2.73 1 65
1.99 0.25
A 208 SS
27
8 17 2.13
2
20
2.18 0.25
-20 -40 -30 -24 -40 -127
-23
0
A
209
SS 33
12 23
2.71 3 90
2.74 0.25
A 221 SS
90
9 36 9.17 14
25
1.55 0.25
5 -20 -3
7
7
0
-8 -67
A
222
SS 86
11 37
8.58
13 25
1.68 0.5
A 231 SS
51
3 27 3.83
7
30
2.8 0.25
0 -80 -4
2
0
0
-3
0
A
232
SS 51 7 28
3.76 7 30
2.88 0.25
A 254 SS
70
7 44 5.34 10
1185
3.28 0.25
4 -13 -2
1 11
5
17 -67
A
255
SS 67 8 45
5.27 9 1125
2.76 0.5
A
258 SS 66 12 37 4.2 5 1260
4.72 0.25
-13
0 -13 -8 22 -15
0
0
A
259
SS 75
12 42
4.57 4 1460
4.74 0.25
A
265 SS 117 9 133 4.52 11 4875
2.69 0.9
-4 -11 -7 -5 20 -8
7 -29
A
266
SS 122
10
143
4.73 9 5280
2.51 1.2
A
273 SS 123 10 115
5.72 31 7160
1.65
1
-5 22 -3 -2 3 12
7 -10
A
274
SS 129 8
118
5.81
30 6380
1.54 1.1
Average -3 -12 -4 -2
15
-2
-2 -16
A 024 ST 153 20 112 6.56 25
4630
nd 0.25
-1 22
0
0 -4
7
0
A
025
ST 154
16
112
6.57
26 4325
nd 0.25
A
029 ST 88 12 78
4.75 40 6015
nd 0.5
-2 -22 -11
4 3 -10
-18
A
030
ST 90
15 87
4.58
39 6675
nd 0.6
A 042 ST 142 12 117 4.38 26
5335
nd
1
-6 -8 -3
0 -4 37
0
A
043
ST 151
13
121
4.4
27 3685
nd
1
A 046 ST
91 14 113 4.54 20
2620
nd 0.8
0
7
2 -9 -5 -11
29
A
047
ST 91
13
111
4.98
21 2915
nd 0.6
A
059 ST 125 8 181 4.22 18 12540
nd 1.6
4 13 11 -6 0 -3
6
A
060 ST 120 7 162 4.5 18 12870
nd 1.5
A
102 ST 332 1.5 1956 2.47 7 26000
nd 22.1
-1 -67 -2 -9 -35 -18
0
A 103 ST 335
3 1986 2.71 10 31000
nd 22.1
Average -1 -9
0 -4
-8
0
3
DS = Field Duplicate Soil; DT = Field Duplicate Tailings; SS= Field Subsample Duplicate Soil; ST = Field
Subsample Duplicate Tailings
BGS Report CR/04/129 (Issue 1.0) for UNIDO Contract 03/088
115
BGS Report CR/04/129 (Issue 1.0) for UNIDO Contract 03/088
116
TABLE A-3-3 ANALYTICAL DATA FOR DUPLICATE SEDIMENT SAMPLES
Sample Number
Cd
Cu
Pb
Zn
Fe
As
Hg ppb Hg ppm ORGC
69 <0.5 75
9
68
4.0
2
180 0.18
6.27
70 <0.5 65
9
62
3.5
1
140 0.14
6.30
AVERAGE <0.5 70
9
65
3.8
2
160 0.16
6.29
82 <0.5 16 11
13
1.1
3
40 0.04
1.83
203 <0.5 24 13
336
1.4
1
335 0.34
2.36
AVERAGE <0.5 20 12
175
1.3
2
188 0.19
2.10
85 <0.5 54 11
36
5.1
3
65 0.07
1.73
106 <0.5 49
6
25
5.1
8
175 0.18
3.49
AVERAGE <0.5 52
9
31
5.1
6
120 0.12
2.61
86 <0.5 58 18
57
3.4
1
315 0.32
3.18
218 <0.5 59 33
592
3.5
1
850 0.85
4.23
AVERAGE <0.5 59 26
325
3.4
1
583 0.58
3.71
TABLE A-3-4 REPLICATE ANALYTICAL DATA FOR ACME INTERNAL STANDARD DS51
ELEMENT Cu
Pb
Zn
Fe
As
ORG/C
ppm Ppm ppm % ppm %
143 24
130
2.98
18
2.00
147 24
131
3.04
19 Nd
146 26
138
3.02
19
2.01
147 25
133
3.00
18
2.01
147 23
134
3.00
19
2.01
146 23
135
3.01
17
2.02
146 24
135
3.00
18
2.02
139 24
131
3.00
17
2.01
Average 145
24
133
3.01
18
2.01
Minimum 139
23
130
2.98
17
2.00
Maximum 147
26
138
3.04
19
2.02
Range 8
3
8
0.06
2
0.02
Geometric Mean
145
24
133
3.01
18
2.01
Standard Deviation
2.8
1.0
2.7
0.02
0.8
0.01
Recommended value
142
25
137
2.94
18
2.0
% Recovery
102%
96%
97%
102%
100%
100%
1 DS5 was certified against CANMET Reference Materials TILL-4, LKSD-4 and STD-1.
BGS Report CR/04/129 (Issue 1.0) for UNIDO Contract 03/088
117
TABLE A-3-5 COMPARISON OF HG DETERMINATIONS BY BGS AND ACME
Sample
Number BGS BGS BGS BGS ACME
ACME
ACME ACME
ACME
CV-AFS
CV-AFS
CV-AFS CV-AFS CV-AAS1 CV-AAS CV-AAS1 CV-AAS1 ICP-MS
average
average
UNBS 012
12.6
12.60
10.01
11.17
10.59
UNBS 026
28.3
27.1
27.70
27
27
27
UNS 106
69.2
66.3
71.4
68.97
67
74
71
UNS 108
4.84
4.7
4.55
4.70
2.88
3.51
3.20
4.31
UNS 109
35.6
30.5
30.4
32.17
33
33
33
UNS 117
21
19.2
20.2
20.13
21
22
22
UNS
124
0.07 0.06
0.065 0.065
0.05 0.06 0.08
UNS 127
1.24
1.24
0.795
1.00
0.90
1.05
UNS 134
5.8
5.80
4
4.60
4.30
4.88
UNS 159
0.15
0.15
0.095
0.09
0.09
0.13
UNS
163
8.47
8.47 6.14 5.65 7.31 6.37
7.19
UNS 168
42.5
42.50
36
38
37
UNS 174
88.8
88.8
88.80
80
84
82
CANMET STSD-4
Recommended value for aqua regia Hg = 0.93
0.88
0.85
1 concentrations above 10 ppm determined by ICP-ES
TABLE A-3-6 HG CV-AAS DATA FOR ACME INTERNAL STANDARD DS5
ELEMENT
Hg1
ppb
125
110
110
100
105
120
115
95
Average 110
Minimum 95
Maximum 125
Range 30
Geometric Mean
110
Standard Deviation
10
Coefficient of variation (%)
9
1 DS5 not certified for CV-AAS
BGS Report CR/04/129 (Issue 1.0) for UNIDO Contract 03/088
118
TABLE A-3-7 HG RESULTS FOR STANDARD REFERENCE MATERIALS BCR 422 (COD
MUSCLE) AND BCR-060 (LAGAROSIPHON MAJOR (AQUATIC PLANT)).
SRM
Hg %Recovery
SRM Hg %Recovery
BCR-422
0.538 96.2
BCR-060
0.305 89.7
BCR-422
0.542 97.0
BCR-060
0.307 90.3
BCR-422
0.537 96.1
BCR-060
0.317 93.2
BCR-422 0.525
93.9
BCR-422 0.55
98.4
BCR-422 0.525
93.9
BCR-422 0.543
97.1
BCR-422 0.539
96.4
BCR-422 0.54
96.6
BCR-422 0.537
96.1
BCR-422 0.536
95.9
BCR-422 0.534
95.5
BCR-422 0.578
103.4
BCR-422 0.533
95.3
BCR-422 0.544
97.3
BCR-422 0.528
94.5
BCR-422 0.528
94.5
BCR-422 0.54
96.6
BCR-422 0.553
98.9
BCR-422 0.528
94.5
BCR-422 0.556
99.5
BCR-422 0.554
99.1
BCR-422 0.571
102.1
Average
0.542 96.9
0.310 91.1
Minimum 0.525 93.9
0.305 89.7
Maximum 0.578
103.4
0.317
93.2
Standard
Deviation
0.014 2.4
0.006 1.9
Coeff. Of Variation 2.519
2.5
2.076
2.1
Official
min.
0.543
0.30
Official
max.
0.559
0.34
Official
average
0.575
0.38
Average
recovery
97%
91%
BGS Report CR/04/129 (Issue 1.0) for UNIDO Contract 03/088
119
TABLE A-3-8 ANALYTICAL PRECISION (%RELATIVE PERCENT DIFFERENCE, %RPD)
FOR FISH AND VEGETABLE SAMPLES
Sample ID
Mercury mg/kg Replicate 1 Replicate 2 %RPM Rep. 1 %RPD rep. 2
F301 1.240
1.208
1.266
2.6
-2.1
F302 1.970
1.960
1.986
0.5
-0.8
F525 0.637
0.650
0.624
-2.0
2.1
F552 0.497
0.502
0.491
-1.0
1.2
F858 0.431
0.429
0.432
0.5
-0.2
F1101 0.544
0.546
0.542
-0.4
0.4
F1102 0.559
0.555
0.562
0.7
-0.5
F1103 1.016
1.010
1.022
0.6
-0.6
F1104 1.236
1.252
1.219
-1.3
1.4
F1105 0.852
0.851
0.852
0.1
0.0
F1106 0.952
0.959
0.944
-0.7
0.8
F1107 1.250
1.253
1.240
-0.2
0.8
F1108 0.616
0.617
0.614
-0.2
0.3
F1109 0.628
0.631
0.624
-0.5
0.6
F1110 1.136
1.148
1.123
-1.1
1.2
F1111 0.638
0.624
0.652
2.2
-2.2
F1112 0.798
0.814
0.782
-2.0
2.0
F1114 0.906
0.896
0.916
1.1
-1.1
F1115 1.021
1.011
1.030
1.0
-0.9
F1117 1.194
1.194
1.193
0.0
0.1
F1118 0.763
0.751
0.775
1.6
-1.6
F1120 0.715
0.727
0.703
-1.7
1.7
F1122 0.656
0.649
0.663
1.1
-1.1
F1124 1.837
1.796
1.878
2.3
-2.2
F1125 0.825
0.808
0.842
2.1
-2.0
F1506 0.870
0.882
0.858
-1.4
1.4
F1507 0.737
0.725
0.749
1.6
-1.6
F1508 1.307
1.329
1.285
-1.7
1.7
F30905 0.684
0.678
0.690
0.9
-0.9
F70310 0.622
0.616
0.627
1.0
-0.8
F70509 0.665
0.662
0.668
0.5
-0.5
F3061114 1.532
1.521
1.543
0.7
-0.7
F3071013 1.081
1.077
1.081
0.4
0.0
F3150804 0.943
0.931
0.954
1.3
-1.2
F3160312 1.027
1.017
1.037
1.0
-1.0
F4021213 1.621
1.597
1.645
1.5
-1.5
F4050803 2.559
2.612
2.506
-2.0
2.1
F4110409 2.649
2.707
2.590
-2.2
2.3
F4191820 1.669
1.709
1.628
-2.4
2.5
F5331931 0.510
0.508
0.512
0.4
-0.4
F8445041 0.541
0.553
0.528
-2.2
2.4
F8474845 0.792
0.807
0.776
-1.9
2.0
F8564243 0.547
0.548
0.546
-0.2
0.2
F410071615 2.471
2.445
2.496 1.1
-1.0
F417061401 0.995
0.989
1.001 0.6
-0.6
F707040608 1.640
1.656
1.625 -1.0
0.9
A110 Yam
0.092
0.091
0.092
1.1
0.0
average
%RPD
0.1
0.1
%RPD = 100*(Original-Replicate)/((Original-Replicate)/2)
BGS Report CR/04/129 (Issue 1.0) for UNIDO Contract 03/088
120
TABLE A-3-9 COMBINED SAMPLING AND ANALYTICAL PRECISION (RELATIVE
PERCENT DIFFERENCE) FOR DUPLICATE FISH SAMPLES
Original
Duplicate
Original Hg (mg/kg) Duplicate Hg (mg/kg) %RPD
110 1511
0.002
0.004
-67
1202 1502
0.002
0.002
0
113 1515
0.01
0.012
-18
117 1519
0.012
0.013
-8
107 1510
0.015
0.018
-18
105 1520
0.025
0.021
17
112 1513
0.025
0.032
-25
101 1514
0.026
0.019
31
209 1509
0.028
0.055
-65
120 1518
0.031
0.031
0
1201 1503
0.031
0.002
176
104 1517
0.034
0.024
34
122 1512
0.034
0.043
-23
119 1521
0.043
0.073
-52
1004 1501
0.048
0.073
-41
526 1504
0.163
0.152
7
521 1505
0.187
0.208
-11
1122 1507
0.656
0.737
-12
1103 1506
1.016
0.87
15
1107 1508
1.25
1.307
-4
%RPD
Average
-13
Minimum
-67
Maximum
34
Average(>0.1)
-1
min (>0.1 mg/kg)
-12
max (>0.1 mg/kg)
15
average (<0.1 mg/kg)
-4
min. (<0.1 mg/kg)
-67
max. (<0.1 mg/kg)
176
%RPD = 100*(Original-Replicate)/((Original-Replicate)/2)
BGS Report CR/04/129 (Issue 1.0) for UNIDO Contract 03/088
121
Appendix 4
TABLE A-4-1 RWAMAGASA, SEDIMENT, SOIL AND TAILINGS SAMPLES: LOCATION
AND ANALYTICAL DATA
Number
Type
Easting
Northing
As
Cd
Cu
Fe
Hg
Pb
Zn
TOC
1 SEDIMENT
31.90671
-3.20417 1
0.25 12 0.87
0.090 11 13 2.77
2 SEDIMENT
31.90851
-3.20446 1
0.25 5 0.28 0.190 5 5 1.07
3 SEDIMENT
31.90932
-3.20479 1
0.25 2 0.16 0.105 3 8 0.16
4 TAILINGS
32.04276
-3.11665 6 15.70 377
3.21
15.000
5 1588
5 TAILINGS
32.04276
-3.11665 8 13.90 368
2.72
54.000
2 1476
6 TAILINGS
32.04276
-3.11665 8 14.00 392
2.75
59.000
2 1487
7 TAILINGS
32.04136
-3.11522 28
0.25 99
6.88
1.525 101
85
8 TAILINGS
32.04121
-3.11513 21
0.25 92
4.75
3.605 23
76
9 TAILINGS
32.04177
-3.11523 25
0.25 118
3.32
39.000 22
92
10 TAILINGS
32.04187
-3.11453 38
1.20 103
4.02
23.000 24
136
11 TAILINGS
32.04187
-3.11453 40
2.10 176
5.50
83.000 51
243
12 TAILINGS
32.04187
-3.11453 18
1.30 109
3.06
118.000 32
133
13 TAILINGS
32.04170
-3.11438 39
1.70 120
4.45
50.000 95
192
14 TAILINGS
32.04170
-3.11438 25
1.80 127
3.76
35.000 32
200
15 TAILINGS
32.04120
-3.11380 12
0.80 108
4.66
2.825 11
144
17 TAILINGS
32.04120
-3.11380 18
2.00 231
4.49
81.000
5
260
18 TAILINGS
32.04075
-3.11450 23
1.40 96
4.54
2.640 16
169
19 TAILINGS
32.04075
-3.11450 27
8.10 179
4.30
104.000 36
803
20 TAILINGS
32.04039
-3.11503 21
0.50 115
8.54
13.910 22
143
21 TAILINGS
32.04039
-3.11503 20
0.60 104
6.38
18.000 23
137
22 TAILINGS
32.04039
-3.11503 55
1.00 146
4.43
165.000 48
153
23 TAILINGS
32.04017
-3.11378 22
0.25 95
4.02
1.055 21
49
24 TAILINGS
32.03992
-3.11387 25
0.25 153
6.56
4.630 20
112
25 TAILINGS
32.03992
-3.11387 26
0.25 154
6.57
4.325 16
112
26 TAILINGS
32.03960
-3.11410 22
0.25 83
5.02
3.130 17
53
27 TAILINGS
32.03944
-3.11364 29
0.25 91
5.01
1.945 27
61
28 TAILINGS
32.03831
-3.11401 49
0.70 109
5.56
193.000 23
100
29 TAILINGS
32.03831
-3.11401 40
0.50 88
4.75
6.015 12
78
30 TAILINGS
32.03831
-3.11401 39
0.60 90
4.58
6.675 15
87
31 TAILINGS
32.03833
-3.11305 21
0.50 77
3.55
1.735 12
63
32 TAILINGS
32.03833
-3.11305 18
0.25 88
4.38
1.395 16
54
33 TAILINGS
32.03815
-3.11320 23
0.25 90
4.21
0.690 34
39
34 TAILINGS
32.03815
-3.11320 30
0.60 103
4.69
18.170 30
108
35 TAILINGS
32.03815
-3.11320 14
0.60 57
2.69
1.455
8
89
36 TAILINGS
32.03815
-3.11320 34
1.30 117
4.72
128.000 28
159
37 TAILINGS
32.03898
-3.11241 44
0.90 135
7.00
7.195 25
150
38 TAILINGS
32.03898
-3.11241 25
0.60 80
3.84
4.630 10
96
39 TAILINGS
32.03902
-3.11244 23
0.90 92
3.85
7.940 11
119
BGS Report CR/04/129 (Issue 1.0) for UNIDO Contract 03/088
122
Number
Type
Easting
Northing
As
Cd
Cu
Fe
Hg
Pb
Zn
TOC
40 TAILINGS
32.03902
-3.11244 63
0.25 108
4.97
127.000 23
82
41 TAILINGS
32.03902
-3.11244 62
0.25 126
5.10
118.000 28
92
42 TAILINGS
32.03910
-3.11247 26
1.00 142
4.38
5.335 12
117
43 TAILINGS
32.03910
-3.11247 27
1.00 151
4.40
3.685 13
121
44 TAILINGS
32.03920
-3.11266 20
1.00 92
4.07
8.230 20
110
45 TAILINGS
32.03920
-3.11266 39
1.40 353
6.38
21.000 42
168
46 TAILINGS
32.03928
-3.11306 20
0.80 91
4.54
2.620 14
113
47 TAILINGS
32.03928
-3.11306 21
0.60 91
4.98
2.915 13
111
48 TAILINGS
32.03928
-3.11306 26
0.25 95
5.12
0.420 36
64
49 TAILINGS
32.03961
-3.11275 19
0.25 97
4.35
4.410 39
95
50 TAILINGS
32.03985
-3.11280 23
0.25 149
5.04
1.780 18
84
51 TAILINGS
32.03985
-3.11280 15
0.25 74
3.62
0.165 11
77
52 TAILINGS
32.04027
-3.11288 46
0.25 78
4.14
0.645 24
58
53 TAILINGS
32.03936
-3.11185 19
0.25 76
4.22
38.000 15
42
54 TAILINGS
32.03936
-3.11185 21
0.25 80
4.27
1.730 15
61
55 TAILINGS
32.03891
-3.11186 15
0.25 61
3.99
2.320 10
38
56 TAILINGS
32.03795
-3.11121 23
0.25 95
4.87
5.795 13
66
57 TAILINGS
32.03795
-3.11121 18
0.25 67
3.58
2.780 10
43
58 TAILINGS
32.03795
-3.11121 19
0.25 66
3.63
2.785 10
45
59 TAILINGS
32.03805
-3.11092 18
1.60 125
4.22
12.540
8
181
60 TAILINGS
32.03805
-3.11092 18
1.50 120
4.50
12.870
7
162
61 TAILINGS
32.03927
-3.11058 19
0.50 83
3.65
2.715
8
90
62 TAILINGS
32.03927
-3.11058 20
0.80 78
4.51
2.445
8
111
63 TAILINGS
32.03898
-3.11052 22
1.70 148
5.56
8.030 10
214
64 TAILINGS
32.03897
-3.11072 20
0.25 68
4.96
1.175
7
67
65 TAILINGS
32.03897
-3.11072 28
0.50 78
3.46
1.560
6
80
66 TAILINGS
32.03868
-3.11069 21
0.25 82
4.53
2.510
9
55
67 TAILINGS
32.03868
-3.11069 19
0.25 77
3.64
2.295 10
52
68 SEDIMENT
32.04030
-3.11041 4
0.25 82 4.82
3.020 13 59 4.50
69 SEDIMENT
32.04188
-3.10963 2
0.25 75 3.97
0.180 9 68 6.27
70 SEDIMENT
32.04188
-3.10963 1
0.25 65 3.54
0.140 9 62 6.30
72 SOIL
31.99214
-3.12494 1
0.25 43 5.11
0.025 5 13 2.56
73 SOIL
31.99272
-3.13209 2
0.25 29 2.95
0.010 10 10 3.20
74 SOIL
31.99072
-3.13532 5
0.25 38 2.84
0.055 15 26 4.60
75 SOIL
31.99094
-3.13506 7
0.25 33 2.84
0.040 13 26 2.99
76 SOIL
31.99094
-3.13506 12
0.25 37 3.65
0.090 12 30 3.17
77 SOIL
31.99094
-3.13506 3
0.25 37 2.81
0.030 14 29 3.91
78 SOIL
31.99094
-3.13506 8
0.25 34 2.90
0.045 12 27 3.40
79 SOIL
31.99127
-3.13486 5
0.25 33 3.15
0.015 11 23 4.00
80 SOIL
31.99226
-3.13493 4
0.25 28 2.93
0.010 13 27 3.76
81 SOIL
31.99649
-3.13621 1
0.25 20 1.47
0.035 12 12 2.11
82 SEDIMENT
31.99686
-3.13608 3
0.25 16 1.14
0.040 11 13 1.83
83 SOIL
31.99695
-3.13636 1
0.25 14 1.06
0.030 11 12 2.41
84 SOIL
31.99747
-3.13675 2
0.25 13 1.43
0.005 8 10 3.05
85 SEDIMENT
32.00508
-3.12349 3
0.25 54 5.08
0.065 11 36 1.73
86 SEDIMENT
32.04130
-3.12501 1
0.25 58 3.38
0.315 18 57 3.18
87 SEDIMENT
32.01278
-3.08087 1
0.25 5 0.62 0.085 8 12 1.33
88 SEDIMENT
32.01396
-3.10443 1
0.25 40 3.38
0.035 10 29 1.34
89 SOIL
32.01449
-3.10452 1
0.25 19 1.81
0.015 14 15 2.87
90 SOIL
32.01449
-3.10452 1
0.25 19 1.72
0.015 14 15 2.83
BGS Report CR/04/129 (Issue 1.0) for UNIDO Contract 03/088
123
Number
Type
Easting
Northing
As
Cd
Cu
Fe
Hg
Pb
Zn
TOC
91 SOIL
32.01600
-3.10769 5
0.25 58 4.77
0.090 11 42 2.61
92 SOIL
32.01600
-3.10769 3
0.25 62 4.63
0.095 13 56 3.76
93 SOIL
32.01691
-3.10949 4
0.25 46 5.06
0.020 10 19 3.24
94 SOIL
32.01691
-3.10949 1
0.25 42 4.39
0.015 12 14 4.33
95 SOIL
32.01670
-3.11295 7
0.25 55 6.86
0.040 10 17 3.36
96 SOIL
32.02206
-3.11757 7
0.25 43 5.98
0.065 12 16 2.64
97 SOIL
32.02206
-3.11757 4
0.25 44 6.09
0.025 8 16 3.01
98 SEDIMENT
32.02824
-3.11159 9
0.25 77 6.42
0.385 14 44 3.80
99 SEDIMENT
32.03094
-3.11199 16
0.25 106 6.96
1.210 38 80 2.26
100 SEDIMENT
32.03486
-3.11198 13
0.70 108 5.39
2.835 11 90 4.07
101 TAILINGS
32.05098
-3.11946 2
6.10 179
2.28
0.265
2
513
102 TAILINGS
32.05053
-3.11929 7 22.10 332
2.47
26.000
2 1956
103 TAILINGS
32.05053
-3.11929 10 22.10 335
2.71
31.000
3 1986
104 SEDIMENT
32.07893
-3.07891 1
0.25 13 0.78
0.075 18 20 2.61
105 SEDIMENT
31.98780
-3.11910 6
0.25 40 3.08
0.670 15 35 3.16
106 SEDIMENT
32.00511
-3.12350 8
0.25 49 5.12
0.175 6 25 3.49
107 SEDIMENT
32.03365
-3.11236 7
0.25 51 4.23
0.075 9 37 3.26
114 SOIL
32.03874
-3.11237 12
0.25 77 5.05
0.950 7 62 3.49
115 SOIL
32.03874
-3.11237 13
0.25 45 4.83
0.365 7 37 2.90
116 SOIL
32.03876
-3.11210 11
0.25 65 4.94
1.380 7 64 2.85
118 SOIL
32.04497
-3.10917 18
0.25 53 10.39
0.035 9 26 2.76
119 SOIL
32.04530
-3.11091 6
0.25 35 4.40
0.020 7 17 1.48
120 SOIL
32.04554
-3.11267 12
0.25 48 8.58
0.030 9 13 1.80
121 SOIL
32.04554
-3.11445 4
0.25 36 3.92
0.025 4 16 2.63
122 SOIL
32.04557
-3.11628 7
0.25 69 9.79
0.030 9 27 2.60
123 SOIL
32.04555
-3.11808 5
0.25 42 5.95
0.030 13 19 1.46
124 SOIL
32.04378
-3.11816 6
0.25 36 5.44
0.040 13 60 1.50
125 SOIL
32.04392
-3.11630 3
0.25 40 4.51
0.070 11 84 3.16
126 SOIL
32.04373
-3.11450 1
0.25 51 5.01
0.060 7 22 2.05
127 SOIL
32.04388
-3.11268 4
0.25 35 2.97
0.070 5 13 2.03
128 SOIL
32.04383
-3.11092 6
0.25 22 3.21
0.010 8 11 2.13
129 SOIL
32.04392
-3.10915 7
0.25 44 3.71
0.020 12 33 3.28
130 SOIL
32.04228
-3.10988 8
0.25 47 7.47
0.020 11 32 4.87
131 SOIL
32.04235
-3.11169 5
0.25 33 2.92
0.085 7 65 3.24
132 SOIL
32.04243
-3.11358 3
0.25 29 2.56
0.180 5 60 2.01
133 SOIL
32.04256
-3.11533 7
0.25 88 7.37
0.145 6 101 1.96
134 SOIL
32.04256
-3.11533 8
0.25 87 7.58
0.150 6 100 2.12
135 SOIL
32.04252
-3.11717 7
0.25 36 6.88
0.070 9 31 1.50
136 SOIL
32.04185
-3.11891 6
0.25 49 7.22
0.095 10 39 2.48
137 SOIL
32.03994
-3.11899 2
0.25 44 5.06
0.005 6 17 1.33
138 SOIL
32.04013
-3.11718 4
0.25 39 5.75
0.165 7 139 2.50
139 SOIL
32.04044
-3.11549 2
0.25 60 4.86
0.570 8 104 2.74
140 SOIL
32.04090
-3.11359 67
0.25 180 8.35
1.440 2 120 0.31
141 SOIL
32.04055
-3.11181 3
0.25 30 2.91
0.080 5 23 2.00
142 SOIL
32.04055
-3.11181 1
0.25 29 2.73
0.065 7 19 1.99
143 SOIL
32.04093
-3.11001 1
0.25 56 3.42
0.075 7 57 5.90
144 SOIL
32.04806
-3.11911 5
0.25 39 6.26
0.020 6 19 1.21
200 SOIL
31.99180
-3.13485 4
0.25 34 3.32
0.005 8 25 2.28
201 SOIL
31.99308
-3.13482 2
0.25 22 2.17
0.005 6 22 2.80
202 SOIL
31.99683
-3.13567 1
0.25 14 1.05
0.005 4 10 1.66
BGS Report CR/04/129 (Issue 1.0) for UNIDO Contract 03/088
124
Number
Type
Easting
Northing
As
Cd
Cu
Fe
Hg
Pb
Zn
TOC
203 SEDIMENT
31.99683
-3.13607 1
0.25 24 1.43
0.335 13 336 2.36
204 SOIL
31.99695
-3.13636 1
0.25 14 1.03
0.020 11 14 1.88
205 SOIL
31.99800
-3.13711 1
0.25 16 1.44
0.015 11 13 2.53
206 SOIL
31.99863
-3.13737 1
0.25 16 1.54
0.010 8 15 2.16
207 SOIL
31.99949
-3.13743 3
0.25 10 1.08
0.005 8 10 1.87
208 SOIL
32.00471
-3.12539 2
0.25 27 2.13
0.020 8 17 2.18
209 SOIL
32.00471
-3.12539 3
0.25 33 2.71
0.090 12 23 2.74
210 SOIL
32.00888
-3.12505 6
0.25 42 4.30
0.025 6 14 3.30
211 SOIL
32.01253
-3.12732 10
0.25 27 2.87
0.010 6 13 1.78
212 SOIL
32.01679
-3.12663 12
0.25 27 4.06
0.010 11 17 1.60
213 SOIL
32.02149
-3.12651 3
0.25 25 3.83
0.015 10 21 3.55
214 SOIL
32.02537
-3.12529 4
0.25 47 7.10
0.020 12 21 3.56
215 SOIL
32.02912
-3.12325 3
0.25 54 5.61
0.020 11 23 2.94
216 SOIL
32.03254
-3.12052 4
0.25 54 5.51
0.010 11 24 2.65
217 SOIL
32.03581
-3.11784 2
0.25 44 5.10
0.050 12 22 2.15
218 SEDIMENT
32.04130
-3.12501 1
0.25 59 3.49
0.850 33 592 4.23
219 SOIL
32.02589
-3.11140 3
0.25 56 6.55
0.030 13 19 3.52
220 SOIL
32.02603
-3.11084 10
0.25 73 7.13
0.020 10 28 2.11
221 SOIL
32.02590
-3.11042 14
0.25 90 9.17
0.025 9 36 1.55
222 SOIL
32.02590
-3.11042 13
0.50 86 8.58
0.025 11 37 1.68
223 SOIL
32.02587
-3.11025 5
0.25 70 6.57
0.060 7 27 4.42
224 SOIL
32.02622
-3.11022 3
0.25 65 6.87
0.025 7 17 3.28
225 SOIL
32.03003
-3.11172 8
0.25 72 5.52
0.425 11 49 3.68
226 SOIL
32.02992
-3.11193 6
0.25 60 5.65
0.055 5 34 1.25
227 SOIL
32.02986
-3.11244 5
0.25 56 6.89
0.090 11 20 3.57
228 SOIL
32.03272
-3.11438 1
0.25 38 2.53
0.005 6 18 3.20
229 SOIL
32.03441
-3.11490 4
0.25 33 2.86
0.005 2 17 4.32
230 SOIL
32.03481
-3.11425 3
0.25 28 2.06
0.045 7 26 3.21
231 SOIL
32.03498
-3.11363 7
0.25 51 3.83
0.030 3 27 2.80
232 SOIL
32.03498
-3.11363 7
0.25 51 3.76
0.030 7 28 2.88
233 SOIL
32.03490
-3.11298 6
0.25 50 3.71
0.160 7 40 3.22
234 SOIL
32.03483
-3.11236 7
0.25 66 4.32
1.335 7 47 3.23
235 SOIL
32.03468
-3.11184 3
0.25 51 3.99
0.050 12 39 3.10
236 SOIL
32.03470
-3.11141 6
0.25 49 4.24
0.035 6 30 3.33
237 SOIL
32.03829
-3.11133 3
0.25 48 4.97
0.080 4 37 3.22
238 SOIL
32.03733
-3.11140 23
1.30 176 6.99
9.205 12 161 3.14
239 SOIL
32.03645
-3.11158 4
0.25 59 4.57
0.085 8 48 2.53
240 SOIL
32.03558
-3.11169 5
0.25 49 4.86
0.030 5 38 1.92
241 SOIL
32.03555
-3.11268 6
0.25 31 4.41
0.030 8 19 2.41
242 SOIL
32.03547
-3.11361 7
0.25 23 1.94
0.005 4 11 1.07
243 SOIL
32.03547
-3.11450 3
0.25 31 1.98
0.025 4 23 2.35
244 SOIL
32.03547
-3.11450 1
0.25 14 1.07
0.025 3 11 2.15
245 SOIL
32.03547
-3.11450 2
0.25 14 1.05
0.020 3 11 2.30
246 SOIL
32.03547
-3.11450 1
0.25 13 0.93
0.015 2 7 1.18
247 SOIL
32.03547
-3.11450 1
0.25 10 0.78
0.005 3 5 0.65
248 SOIL
32.03547
-3.11450 1
0.25 9 0.57 0.010 2 4 0.52
249 SOIL
32.03540
-3.11539 2
0.25 29 2.24
0.030 2 23 2.64
250 SOIL
32.03628
-3.11562 1
0.25 30 3.58
0.040 5 21 2.15
251 SOIL
32.03629
-3.11461 2
0.25 18 1.64
0.055 5 13 1.67
252 SOIL
32.03624
-3.11366 4
0.25 20 2.09
0.020 5 10 1.55
BGS Report CR/04/129 (Issue 1.0) for UNIDO Contract 03/088
125
Number
Type
Easting
Northing
As
Cd
Cu
Fe
Hg
Pb
Zn
TOC
253 SOIL
32.03609
-3.11284 8
0.25 46 3.99
0.175 6 33 3.81
254 SOIL
32.03597
-3.11185 10
0.25 70 5.34
1.185 7 44 3.28
255 SOIL
32.03597
-3.11185 9
0.50 67 5.27
1.125 8 45 2.76
256 SOIL
32.03606
-3.11096 16
0.25 52 5.11
0.055 6 114 4.24
257 SOIL
32.03702
-3.11093 5
0.25 50 5.16
0.070 5 41 2.88
258 SOIL
32.03681
-3.11186 5
0.25 66 4.20
1.260 12 37 4.72
259 SOIL
32.03681
-3.11186 4
0.25 75 4.57
1.460 12 42 4.74
260 SOIL
32.03689
-3.11274 2
0.25 54 4.95
0.270 8 40 2.32
261 SOIL
32.03693
-3.11369 1
0.25 11 1.05
0.015 2 8 1.13
262 SOIL
32.03700
-3.11457 2
0.25 24 2.65
0.050 7 14 1.83
263 SOIL
32.03791
-3.11458 4
0.25 38 8.70
0.055 11 19 2.18
264 SOIL
32.03790
-3.11369 1
0.25 21 2.16
0.050 3 12 1.60
265 SOIL
32.03799
-3.11270 11
0.90 117 4.52
4.875 9 133 2.69
266 SOIL
32.03799
-3.11270 9
1.20 122 4.73
5.280 10 143 2.51
267 SOIL
32.03799
-3.11270 8
0.80 119 4.62
4.290 13 113 3.27
268 SOIL
32.03799
-3.11270 2
0.25 36 2.73
0.050 4 32 1.51
269 SOIL
32.03799
-3.11270 3
0.25 36 2.79
0.020 6 28 1.20
270 SOIL
32.03799
-3.11270 2
0.25 39 3.60
0.025 6 31 1.11
271 SOIL
32.03799
-3.11270 1
0.25 48 5.45
0.040 5 41 0.83
272 SOIL
32.03793
-3.11191 3
0.25 50 4.09
0.155 7 36 3.52
273 SOIL
32.03773
-3.11091 31
1.00 123 5.72
7.160 10 115 1.65
274 SOIL
32.03773
-3.11091 30
1.10 129 5.81
6.380 8 118 1.54
275 SOIL
32.03764
-3.10996 22
0.25 51 4.78
0.030 10 65 3.19
276 SOIL
32.03843
-3.11227 6
0.25 56 3.71
1.145 7 54 3.63
277 SOIL
32.03843
-3.11227 4
0.25 51 4.75
0.095 7 32 0.78
279 SOIL
32.03843
-3.11227 7
0.50 69 4.21
2.650 12 73 3.34
280 SOIL
32.03843
-3.11227 7
0.50 66 3.43
1.825 8 72 3.82
281 SOIL
32.03843
-3.11227 8
0.25 45 3.89
0.200 4 28 1.73
282 SOIL
32.03843
-3.11227 8
0.25 45 4.37
0.040 4 27 0.92
283 SOIL
32.03843
-3.11227 6
0.25 51 4.96
0.065 6 35 0.66
284 SOIL
32.03843
-3.11227 9
0.25 53 5.15
0.030 5 37 0.58
285 SOIL
32.03852
-3.11316 29
1.20 136 5.11
8.855 15 176 0.65
286 SOIL
32.03858
-3.11417 5
0.25 40 5.67
0.075 11 25 2.46
287 SOIL
32.03959
-3.11413 7
0.25 57 5.57
1.135 16 84 2.65
288 SOIL
32.03950
-3.11272 8
0.25 47 5.38
0.290 9 34 3.08
289 SOIL
32.05076
-3.12008 3
6.20 226 4.96
0.390 2 651 1.44
290 SOIL
32.04942
-3.12130 2
0.25 36 3.90
0.065 12 24 3.22
291 SOIL
32.03427
-3.11222 1
0.25 50 3.88
0.050 8 39 3.72
292 SOIL
32.03448
-3.11253 11
0.25 69 4.55
1.560 15 55 3.81
293 SOIL
32.03404
-3.11234 2
0.25 51 3.70
0.005 8 49 6.25
294 SOIL
32.03512
-3.11179 6
0.25 52 4.71
0.275 11 42 4.59
296 SOIL
32.03467
-3.11202 5
0.25 44 4.07
0.085 8 36 3.38
297 SOIL
32.03568
-3.11161 1
0.25 51 4.87
0.055 10 41 2.42
298 SOIL
32.04678
-3.11767 2
0.25 48 6.10
0.045 13 25 1.83
299 SOIL
32.04844
-3.11763 3
0.25 36 4.42
0.035 9 21 2.58
300 SOIL
32.04915
-3.11614 3
0.25 36 6.24
0.045 9 21 2.46
301 SOIL
32.05131
-3.11685 2
0.25 37 4.68
0.050 8 24 3.14
302 SOIL
32.05487
-3.11489 1
0.25 55 6.51
0.040 10 23 2.86
BGS Report CR/04/129 (Issue 1.0) for UNIDO Contract 03/088
126
TABLE A-4-2 ILAGALA-UVINSA SEDIMENT SAMPLES: LOCATION AND ANALYTICAL
DATA
AREA
NUMBER
EASTING
NORTHING
As
Cd
Cu
Fe
Hg Pb Zn
ORGC
K 1
29.84243
-5.21052
1
0.3
49
4.14
455
10
42
2.90
K
2
29.84243
-5.21052 1 0.3 49 4.17 655 11 186
3.62
K 3
29.84243
-5.21052
1
0.3
44
3.95
160
10
50
2.70
K 4
29.86371
-5.19843
1
0.3
55
4.40
615
10
49
3.00
K
5 29.85630
-5.20530 3 0.3 42 3.96 95 12 37 3.31
K 7
30.40343
-5.10650
1
0.3
9
1.11
165
6
11
0.86
K 8
30.39016
-5.11111
1
0.3
7
1.04
240
7
11
0.80
TABLE A-4-3 HG (µG/L) IN FILTERED WATER SAMPLES, RWAMAGASA AREA
Sample Number
Hg µg/l Source
16 0.01
Well
68 0.05
Drainage
69 0.04
Drainage
85 0.05
Drainage
86 0.04
Drainage
87 0.04
Drainage
88 0.05
Drainage
98 0.03
Drainage
99 0.04
Drainage
100 0.07
Drainage
104 0.05
Drainage
105 0.05
Drainage
108
0.43 Hg amalgamation pond
109
0.45 Hg amalgamation pond
Summary statistics (drainage and well)
Average 0.04
Minimum 0.01
Maximum 0.07
Geometric Mean
0.04
Standard Deviation
0.01
BGS Report CR/04/129 (Issue 1.0) for UNIDO Contract 03/088
127
TABLE A-4-4 HG (µG/L) IN FILTERED WATER SAMPLES, KIGOMA AREA
Sample Number
Hg µg/l
1 0.01
2 0.02
3 0.01
4 0.02
5 0.02
7 0.03
8 0.02
Summary statistics
Average 0.02
Minimum 0.01
Maximum 0.03
Geometric Mean
0.02
Standard Deviation
0.00
TABLE A-4-5 AS (µG/L) IN FILTERED WATER SAMPLES, RWAMAGASA AREA
Sample Number
As µg/l
16 0.13
68 0.71
69 0.86
70 0.77
71 0.13
85 2.22
86 0.65
87 0.51
88 0.36
98 0.89
99 1.18
100 1.26
104 0.13
105 2.42
108 0.54
109 1.50
218 0.62
Average 0.87
Minimum 0.13
Maximum 2.42
Geometric Mean
0.63
Standard Deviation
0.67
BGS Report CR/04/129 (Issue 1.0) for UNIDO Contract 03/088
128
Appendix 5 : PLATES
BGS Report CR/04/129 (Issue 1.0) for UNIDO Contract 03/088
129
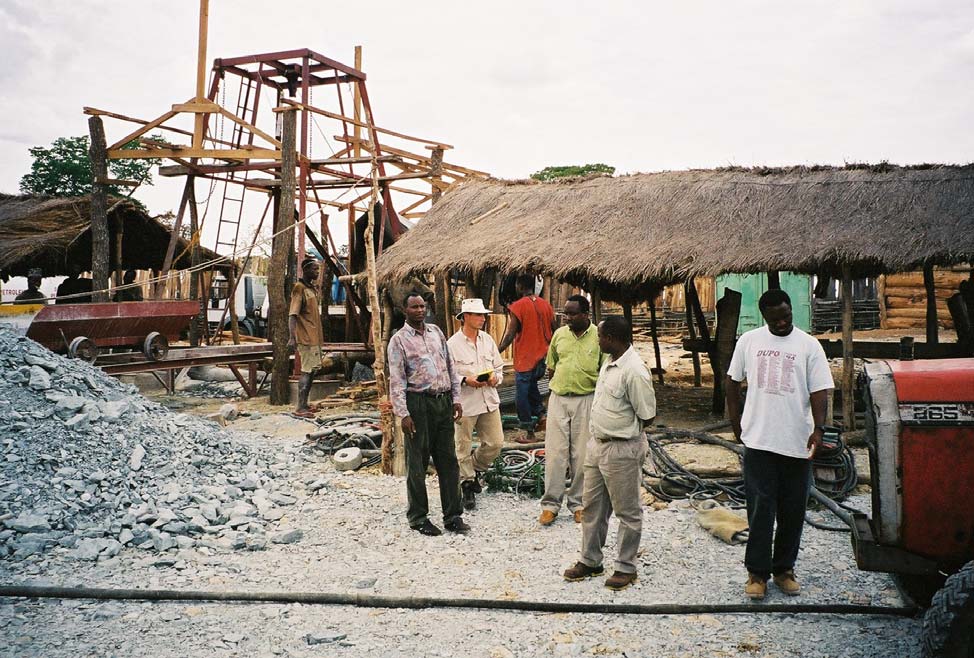
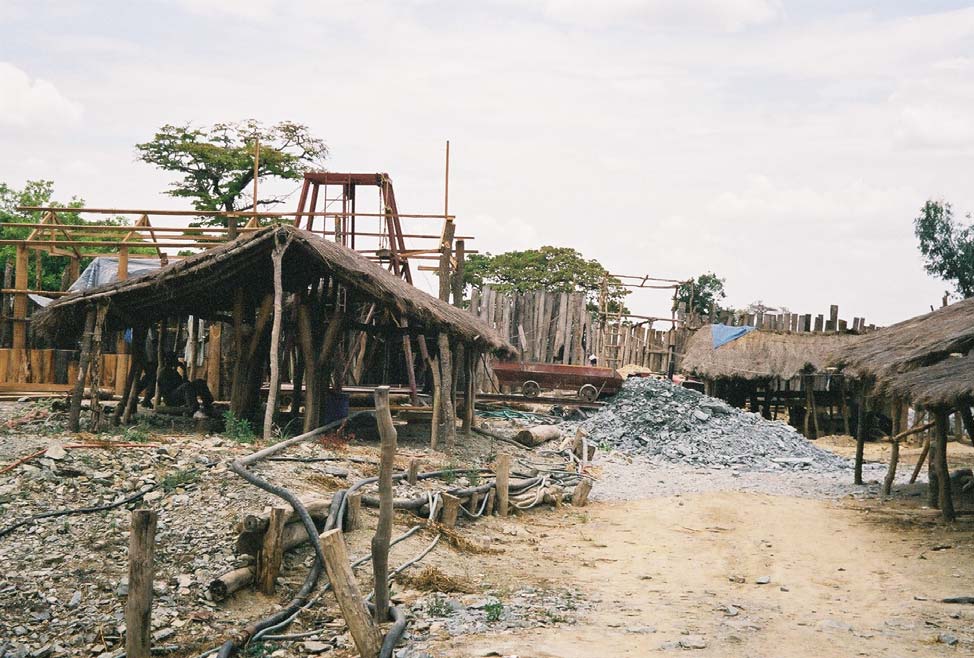
Plate 1. View of pit head and waste rock tip, Blue Reef Mine, Rwamagasa
Plate 2. Blue Reef Mine, Rwamagasa
BGS Report CR/04/129 (Issue 1.0) for UNIDO Contract 03/088
130
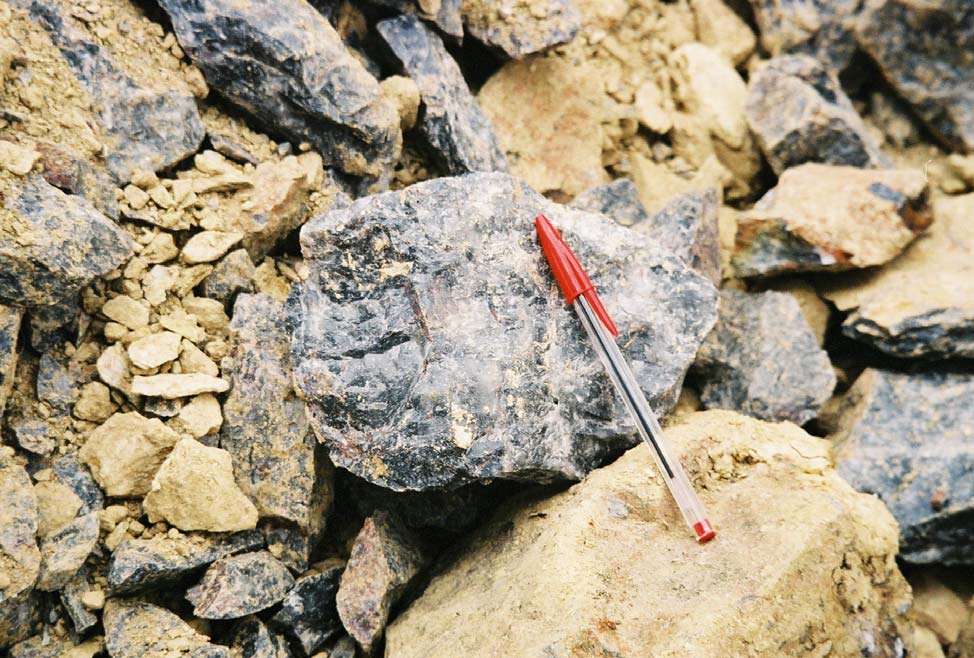
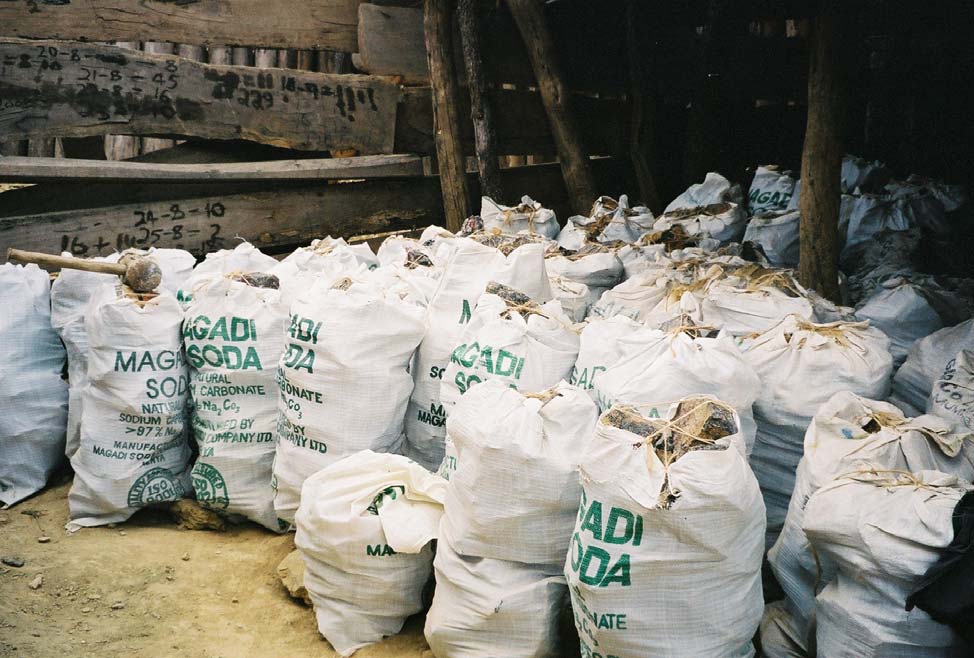
Plate 3. Gold and sulphide-bearing quartz from Blue reef Mine, Rwamagasa
Plate 4. Gold bearing quartz ore awaiting mineral processing, Rwamagasa mine.
BGS Report CR/04/129 (Issue 1.0) for UNIDO Contract 03/088
131
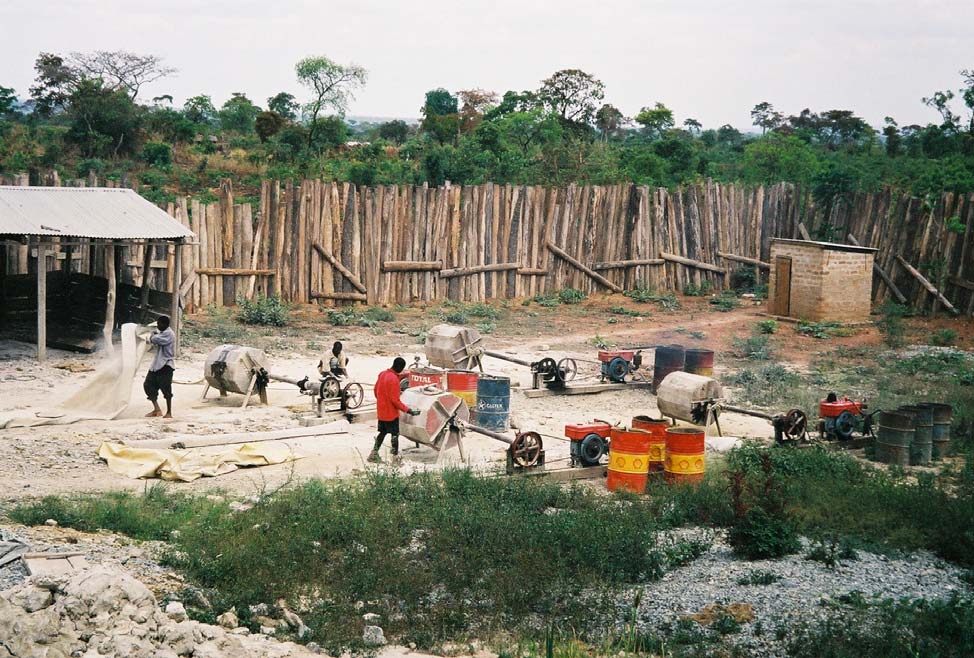
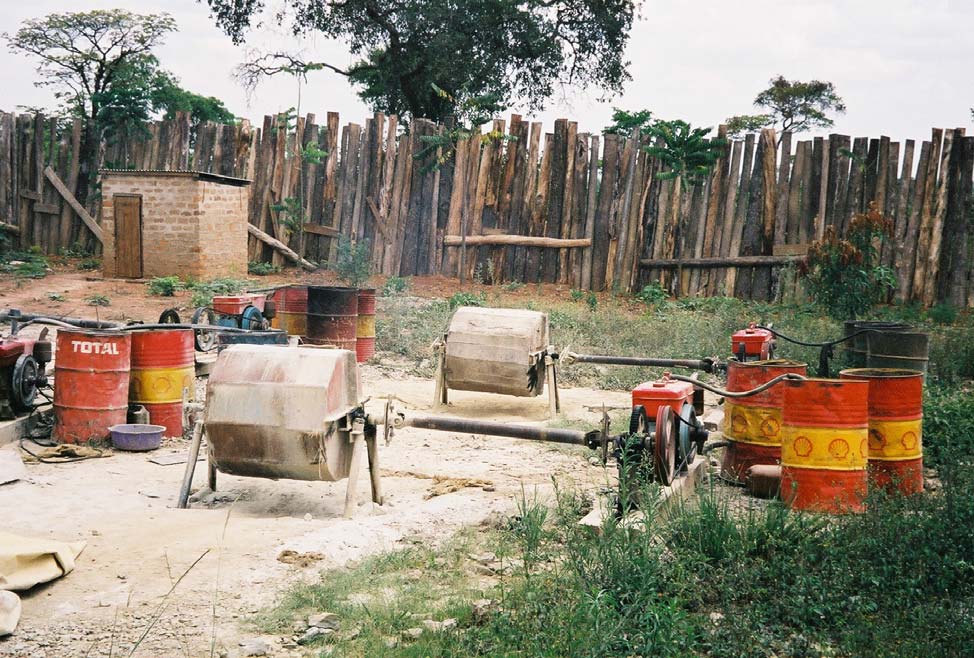
Plate 5. Ball mills in fenced mineral processing compound, Blue Reef mine, Rwamagasa
Plate 6. Petrol motordriven ball mills in fenced mineral processing compound, Blue Reef mine, Rwamagasa
BGS Report CR/04/129 (Issue 1.0) for UNIDO Contract 03/088
132
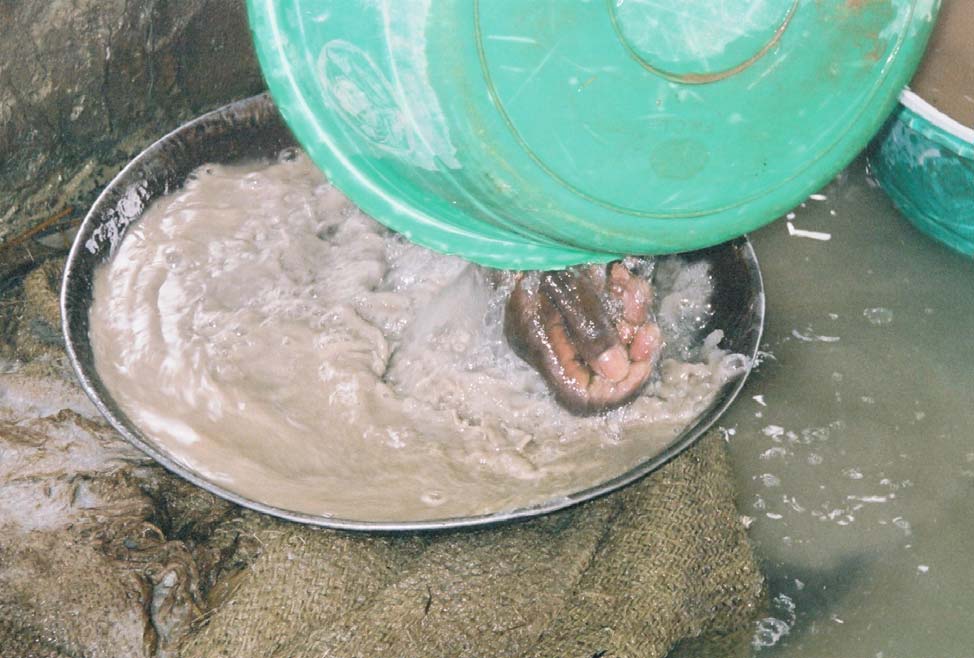
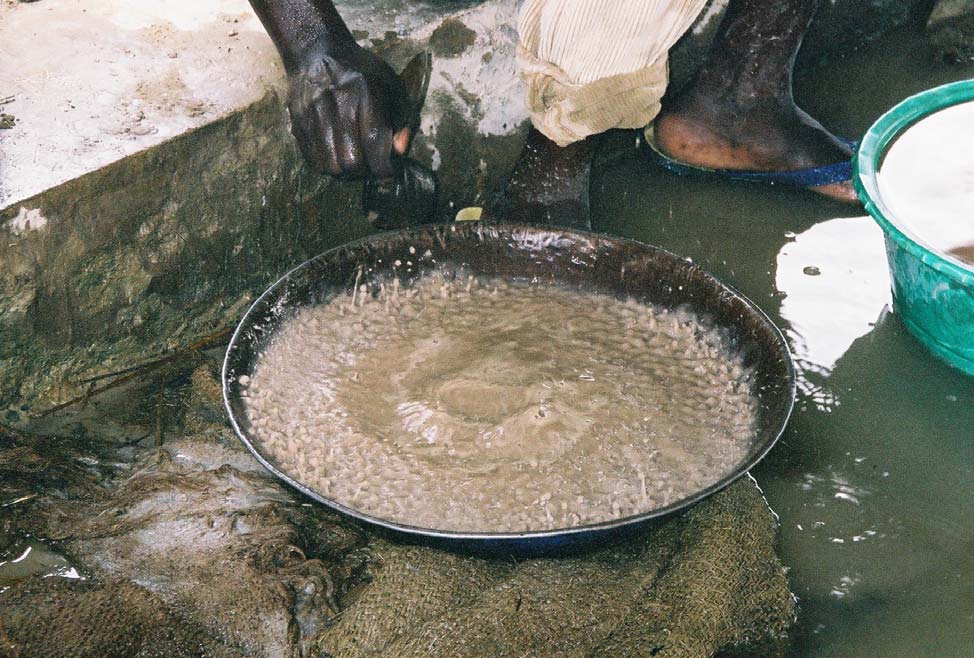
Plate 7. Artisanal miner using bare hands to mix mercury with sluice heavy mineral concentrate (Blue Reef Mine)
Plate 8. Agitating pan to promote settling of amalgam and mercury, Blue Reef Mine
BGS Report CR/04/129 (Issue 1.0) for UNIDO Contract 03/088
133
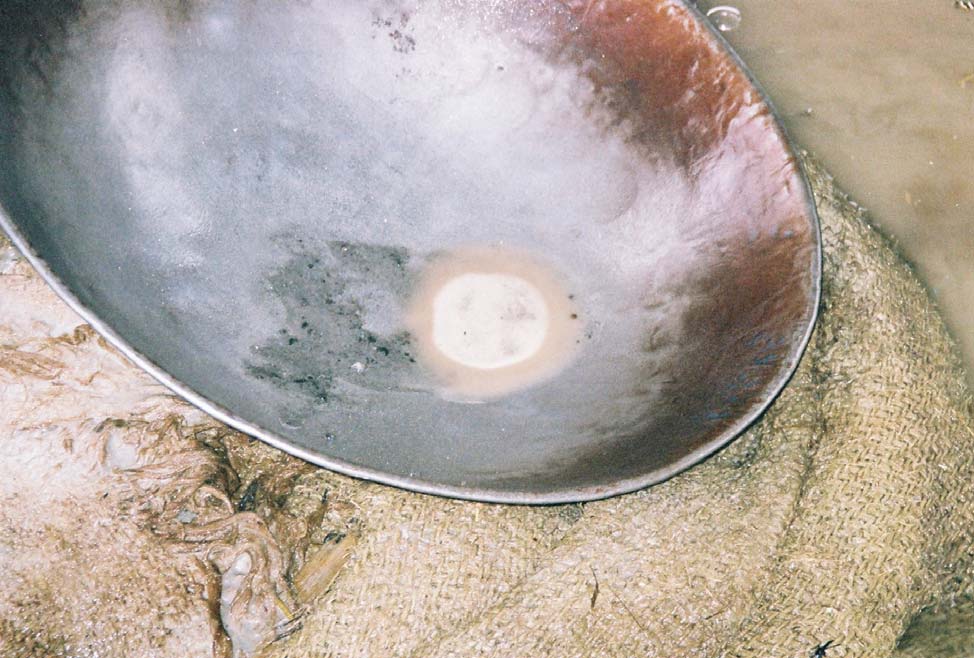
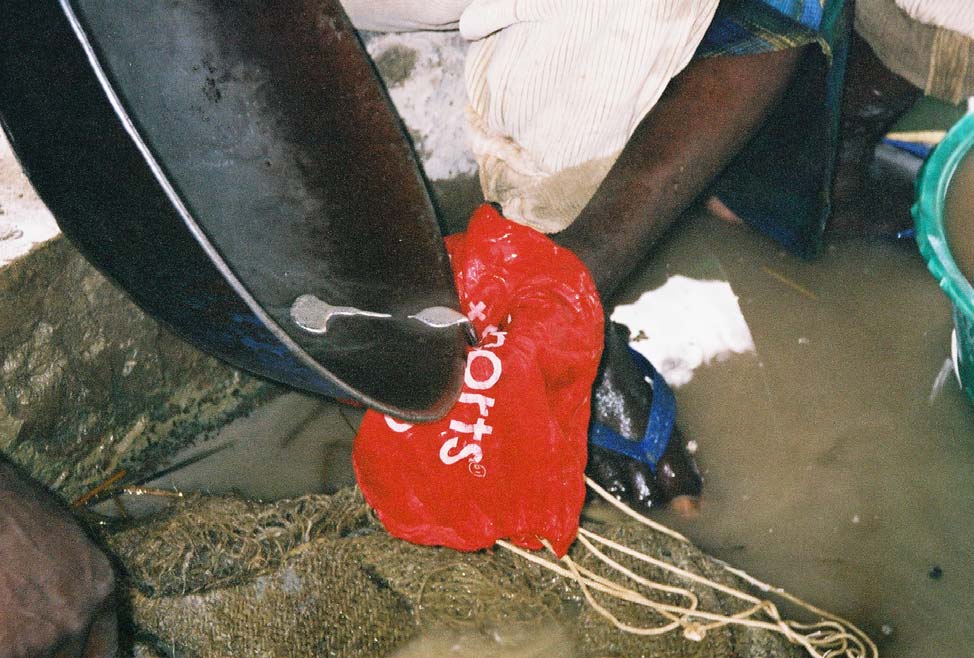
Plate 9. Residual mercury and amalgam at end of amalgamation process (Blue Reef Mine)
Plate 10. Decanting mercury and amalgam into cloth for removal of excess mercury by squeezing (Blue Reef Mine)
BGS Report CR/04/129 (Issue 1.0) for UNIDO Contract 03/088
134
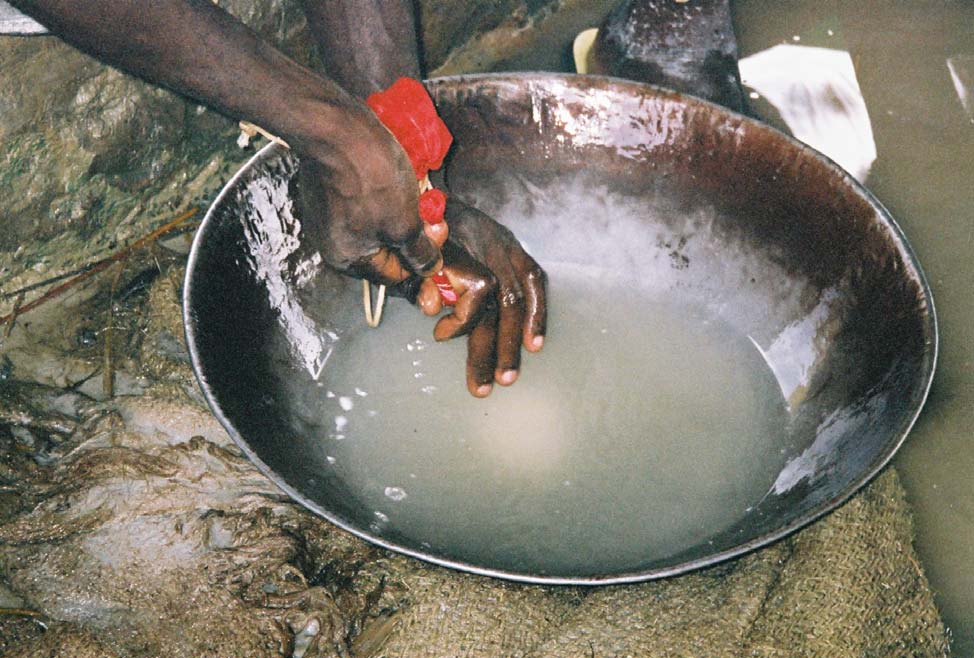
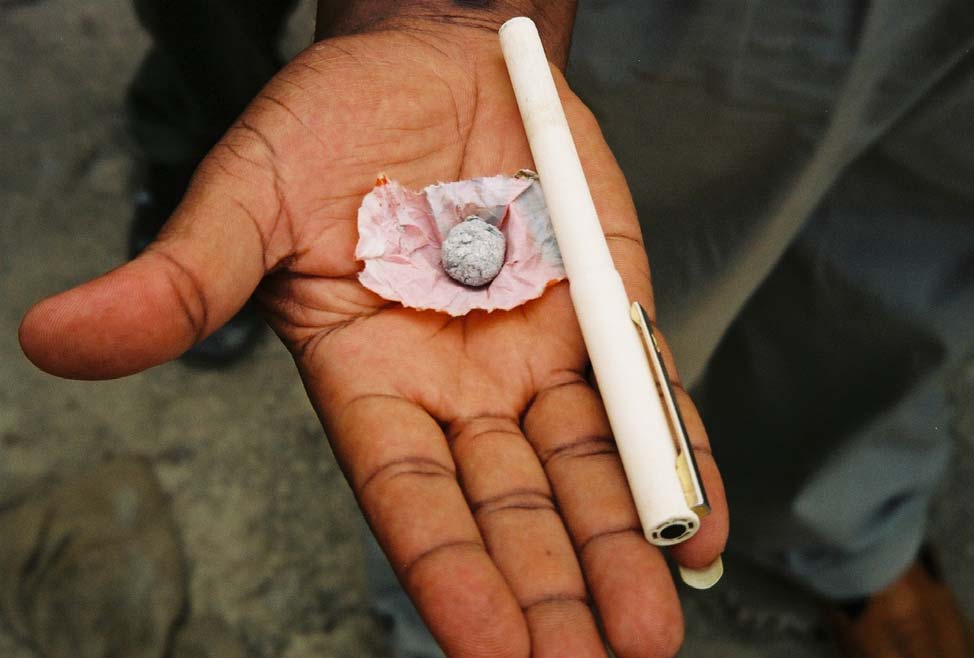
Plate 11. Squeezing cloth to remove excess mercury (Blue Reef Mine)
Plate 12. Amalgam placed in paper for burning in charcoal fire (Blue reef mine).
BGS Report CR/04/129 (Issue 1.0) for UNIDO Contract 03/088
135
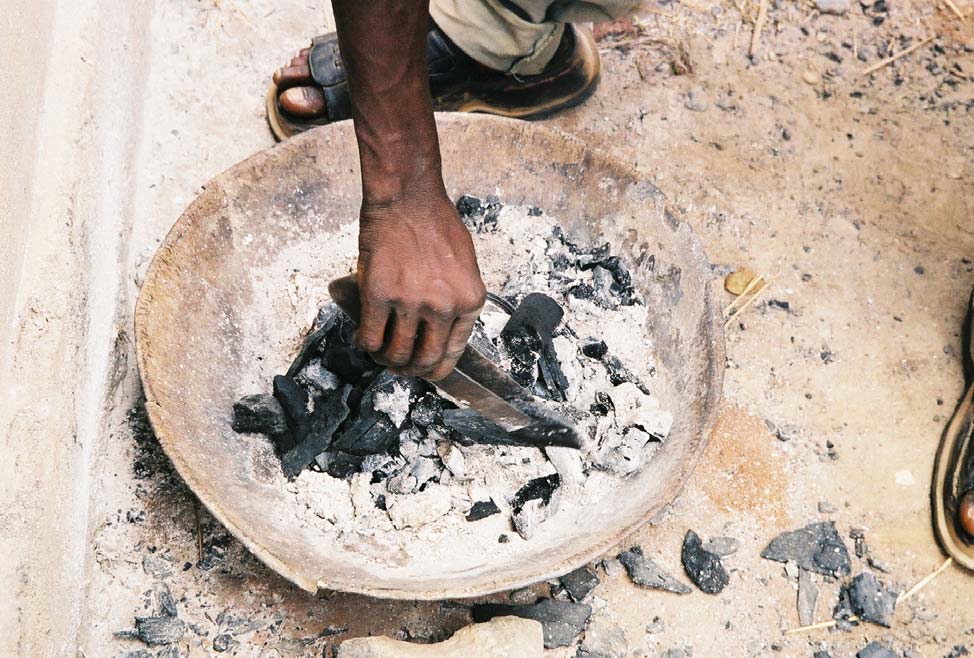
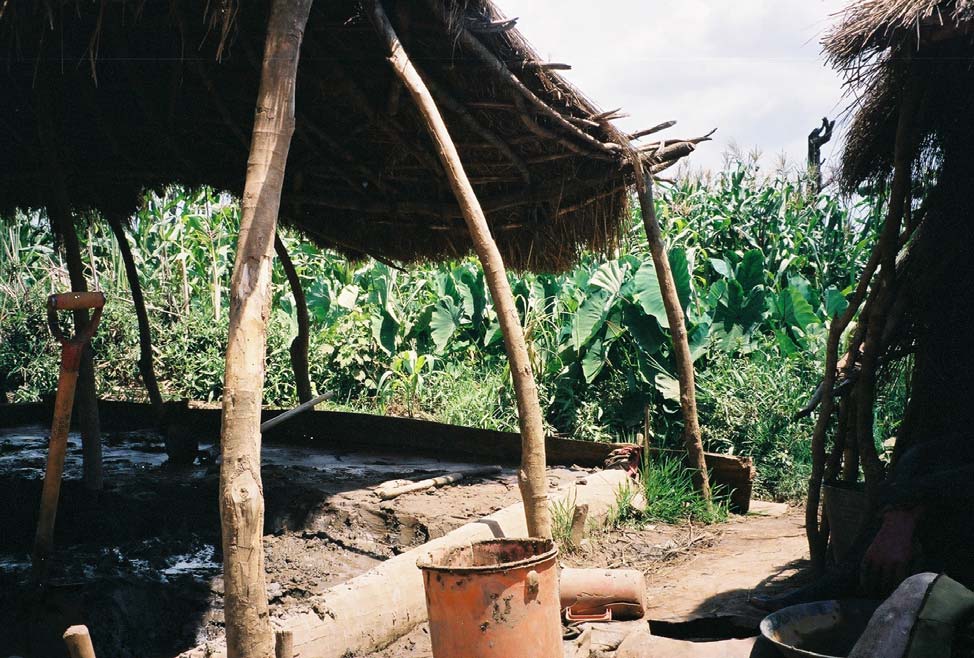
Plate 13. Burning amalgam in charcoal fire to drive off mercury (Blue Reef mine)
Plate 14. Wood used to retain amalgamation tailings pond at site A41-A42. Note the mercury contaminated heavy
mineral tailings are being removed for re-processing. Note also, proximity of amalgamation pond to cultivated
are where yams, maize and beans are being grown. There was evidence at the site that water-borne tailings
contaminate the cultivated area.
BGS Report CR/04/129 (Issue 1.0) for UNIDO Contract 03/088
136
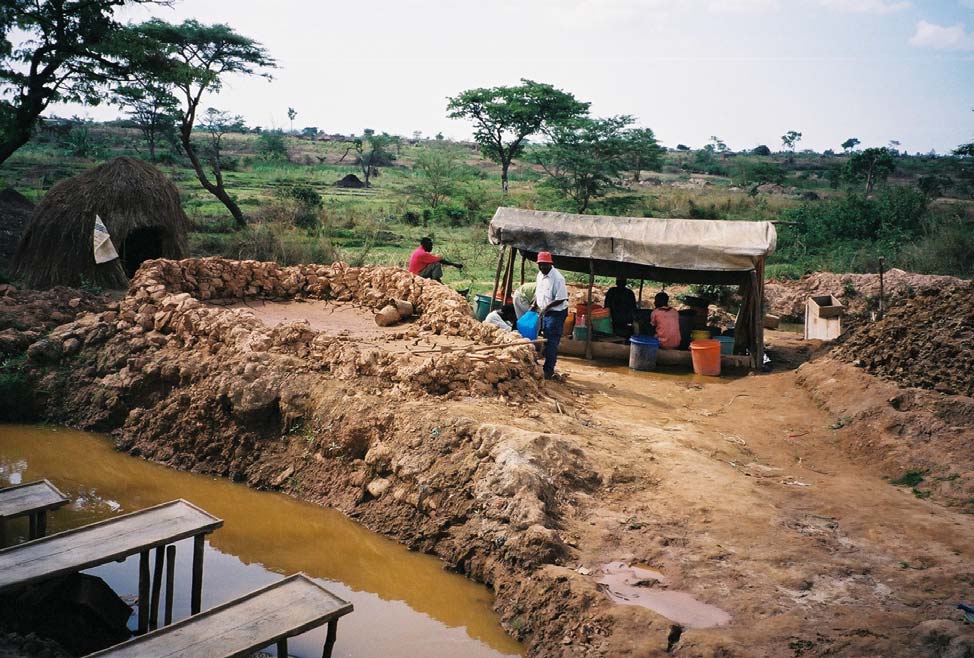
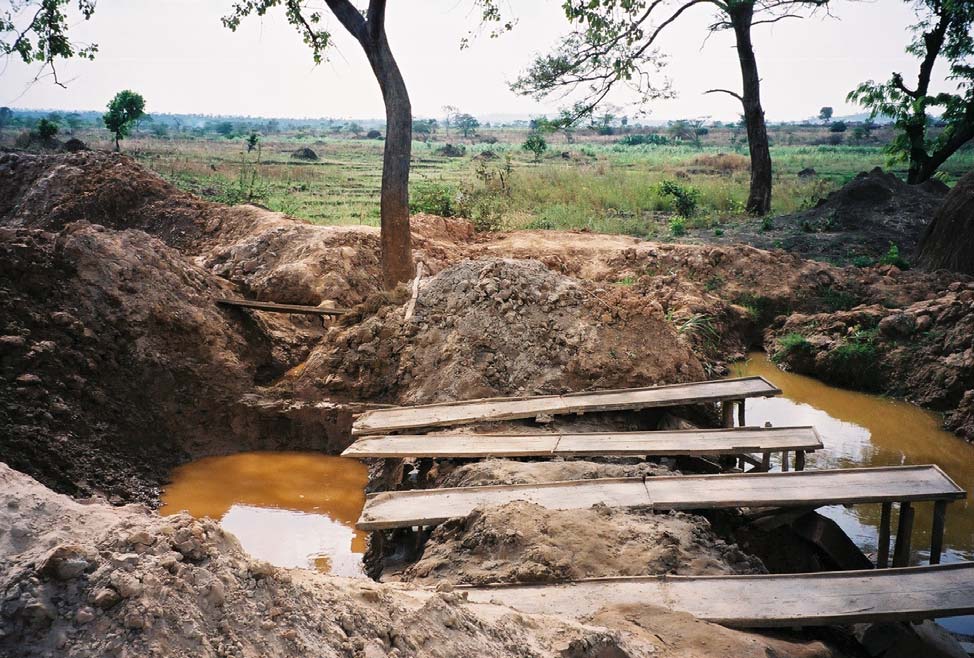
Plate 15. Covered amalgamation pond and sluices at tailings reprocessing site (A031) overlooking the mbuga of the
River Isingile.
Plate 16. Sluices at historic tailings reprocessing site (A031) overlooking the mbuga of the River Isingile.
BGS Report CR/04/129 (Issue 1.0) for UNIDO Contract 03/088
137
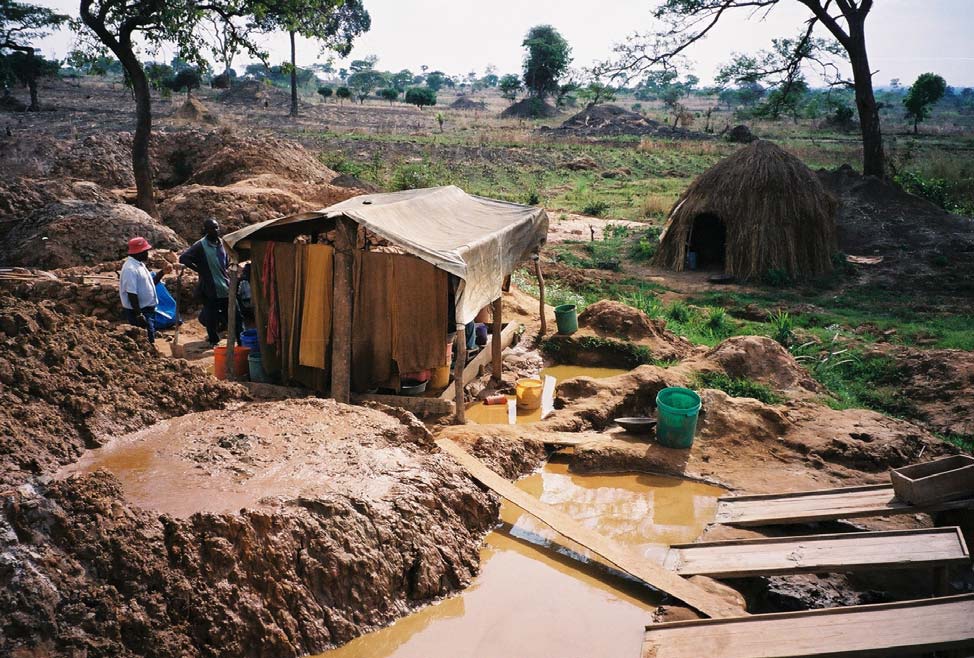
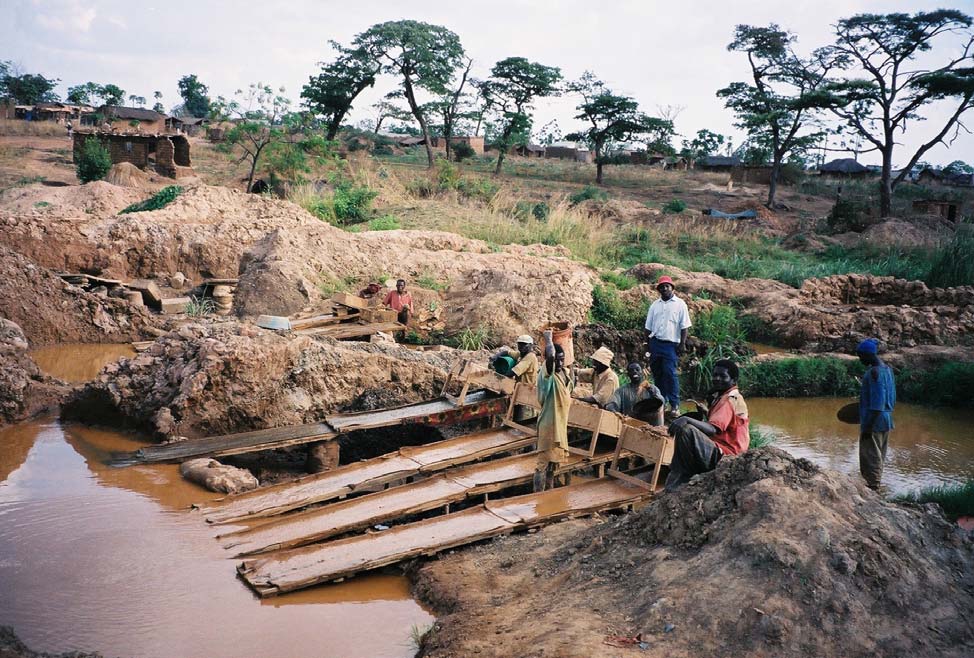
Plate 17. Covered amalgamation pond and sluices at tailings reprocessing site (A031) overlooking the mbuga of the
River Isingile.
Plate 18. Sluices at tailings reprocessing site (A42-43) on the slope to the north of Rwamagasa village.
BGS Report CR/04/129 (Issue 1.0) for UNIDO Contract 03/088
138
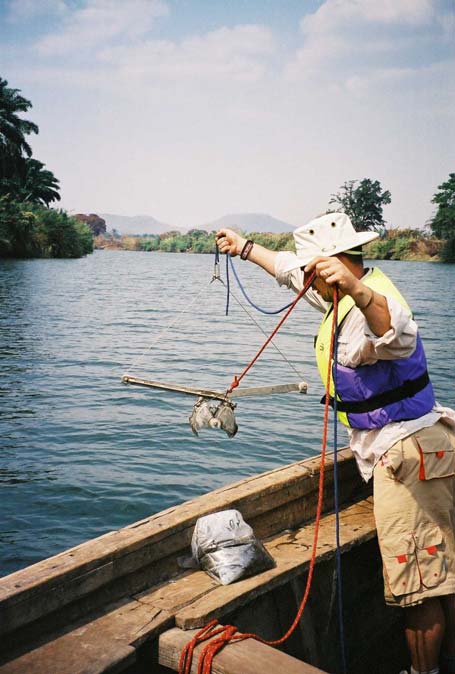
Plate 34. Ducklings paddling in water that had overflown from an amalgamation pond (tailings sample site A20-22)
Plate 20. Deploying the Van Veen grab sampler, Malagarasi River, near Ilagala.
BGS Report CR/04/129 (Issue 1.0) for UNIDO Contract 03/088
139
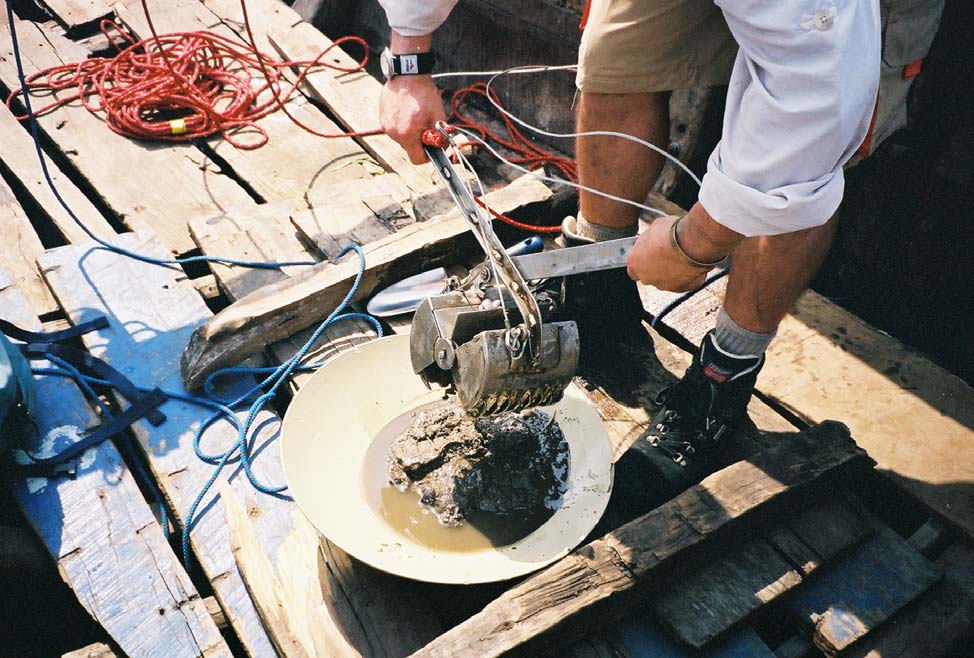
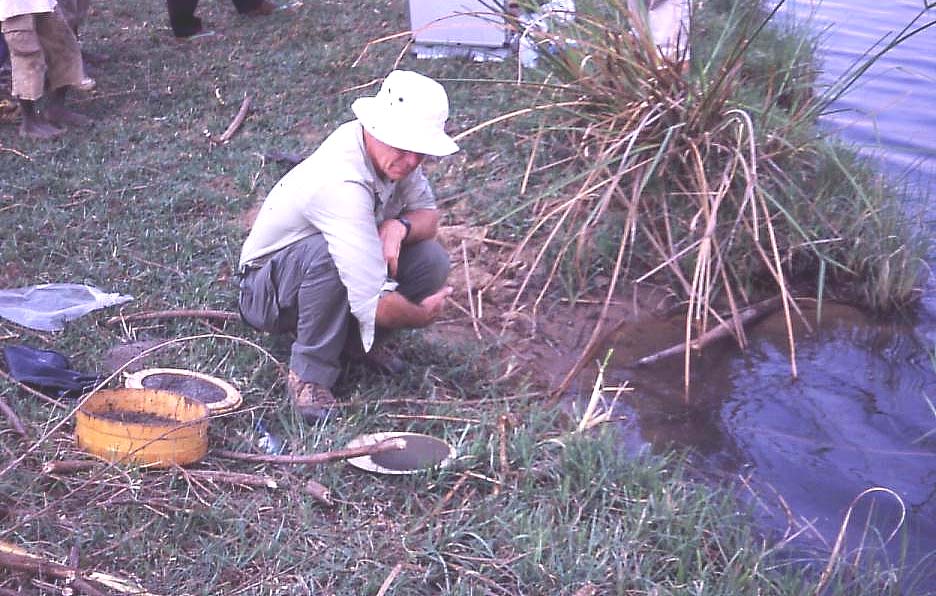
Plate 21 Emptying sub-sample of bottom sediment from Van Veen grab sampler, Malagarasi River, near Ilagala
Plate 22 River sediment sampling about 1 km upstream from Uvinsa, Malagarasi River. Sediment in pan has been
wet-sieved through 2mm and 150µm sieves.
BGS Report CR/04/129 (Issue 1.0) for UNIDO Contract 03/088
140
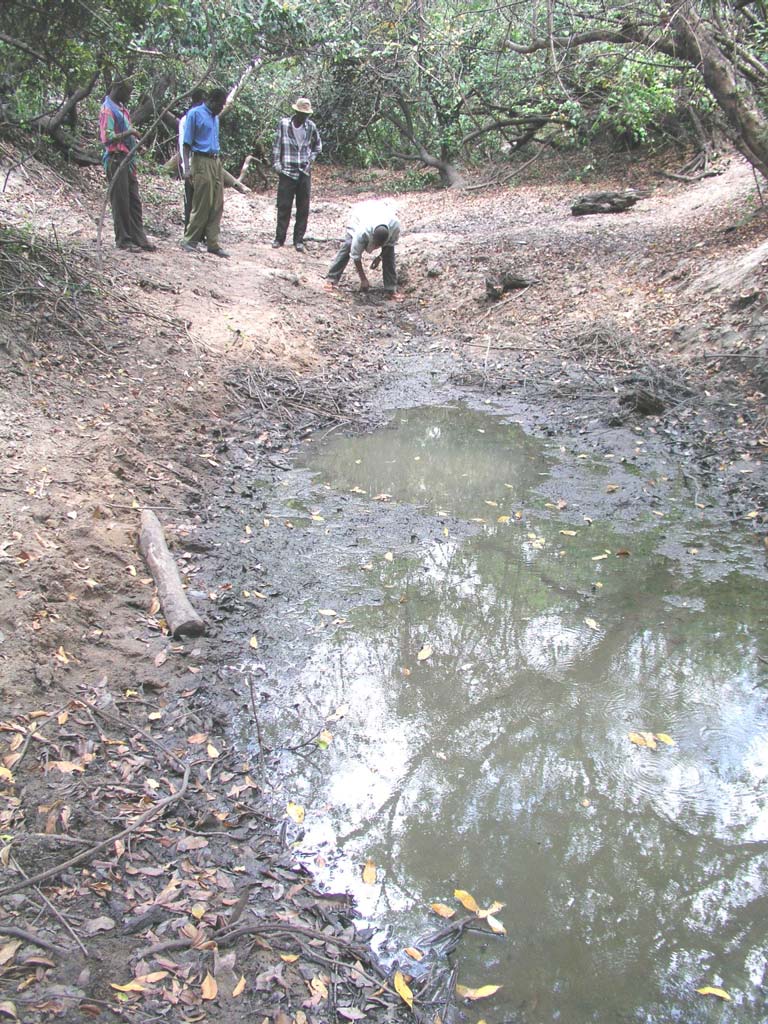
Plate 23. Nikonga River (stream sediment site A1 to A3 (Figure 10)
BGS Report CR/04/129 (Issue 1.0) for UNIDO Contract 03/088
141
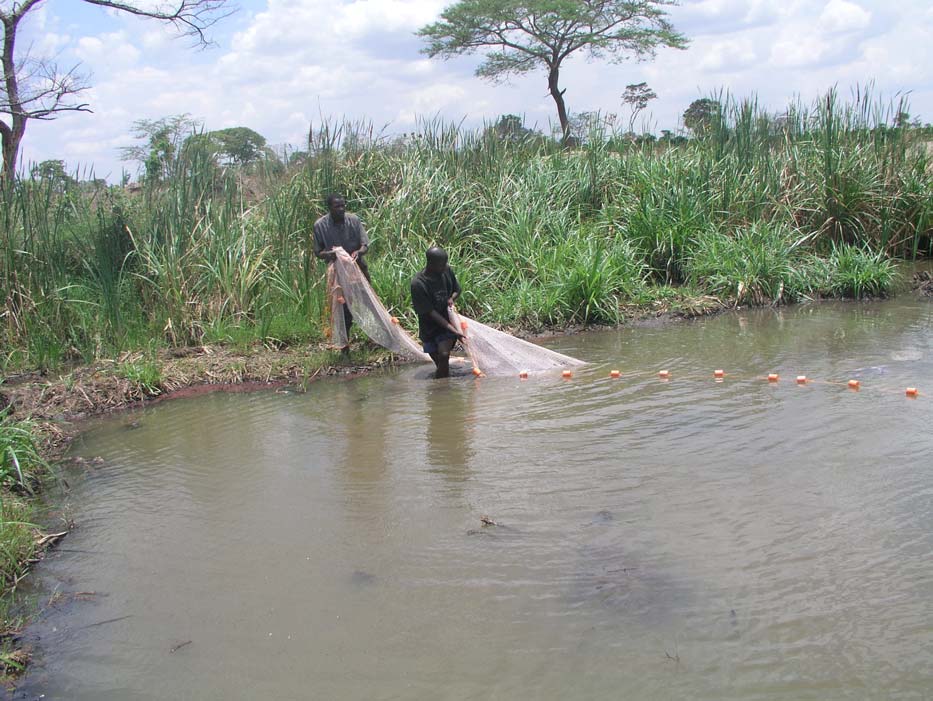
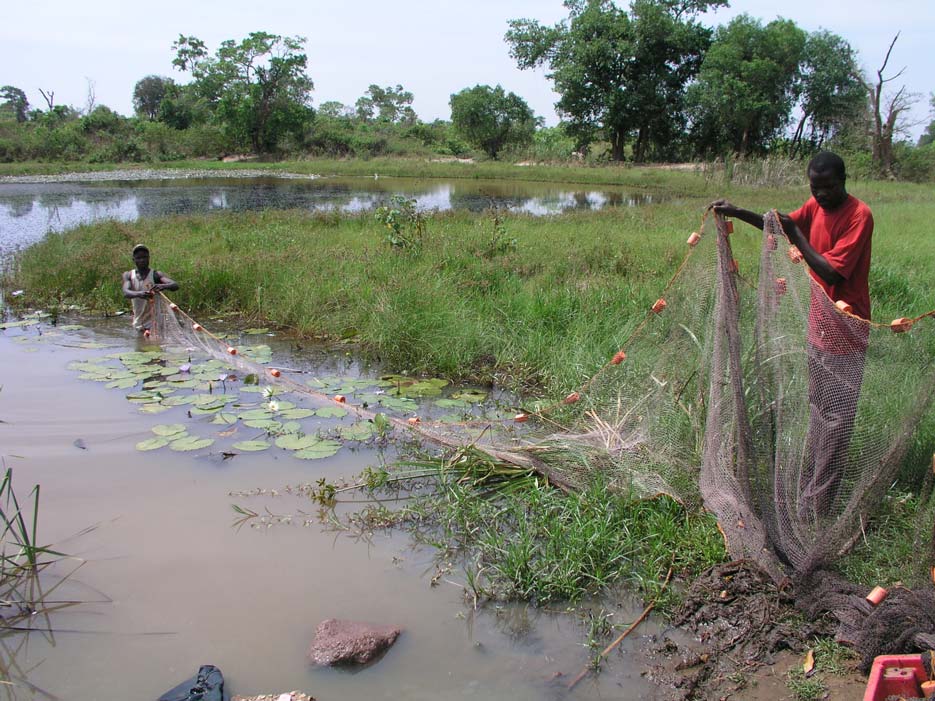
Plate 24. Attempting to catch fish at Pond 1, Isingile River (see location map, Figure 11)
Plate 25. Attempting to catch fish by netting Pond 4 (see location map, Figure 11)
BGS Report CR/04/129 (Issue 1.0) for UNIDO Contract 03/088
142
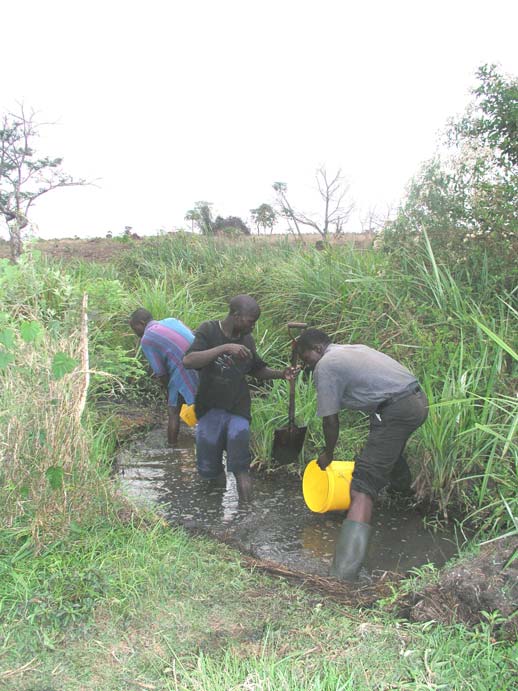
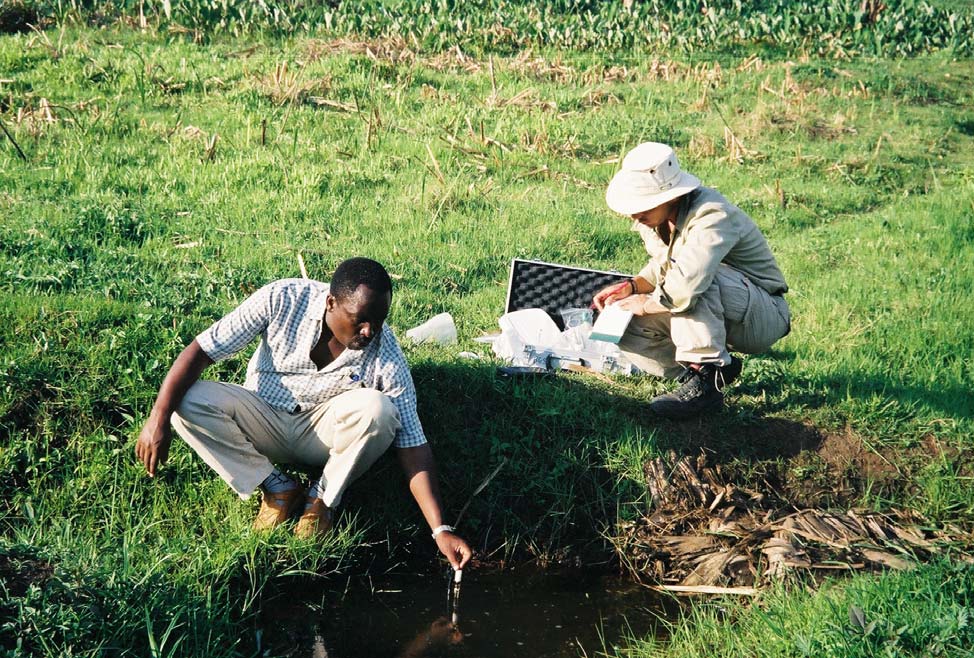
Plate 26. Attempting to catch fish by draining Pond 2, Isingile River (see location map, Figure 11)
Plate 27. Measuring water pH, Eh and conductivity at site A69 (see Figure 9).
BGS Report CR/04/129 (Issue 1.0) for UNIDO Contract 03/088
143
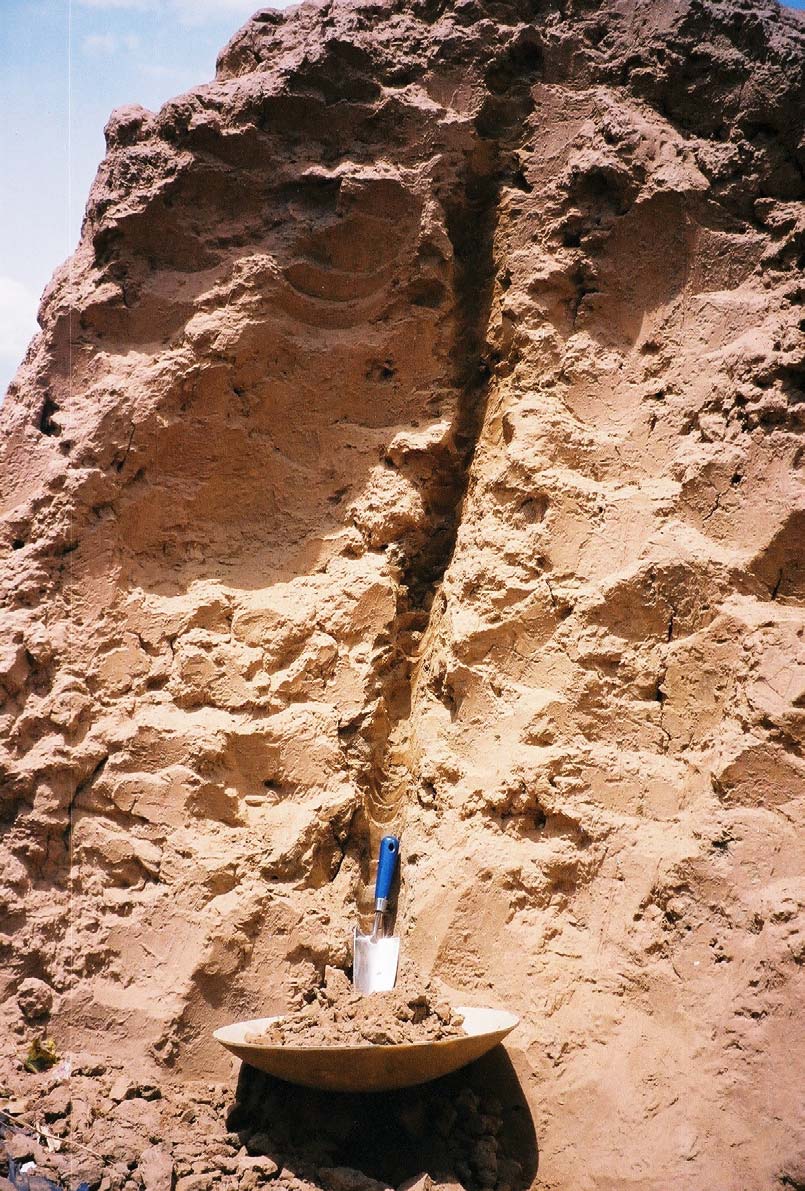
Plate 28. Channel sampling of tailings pile being reworked (site A23)
BGS Report CR/04/129 (Issue 1.0) for UNIDO Contract 03/088
144
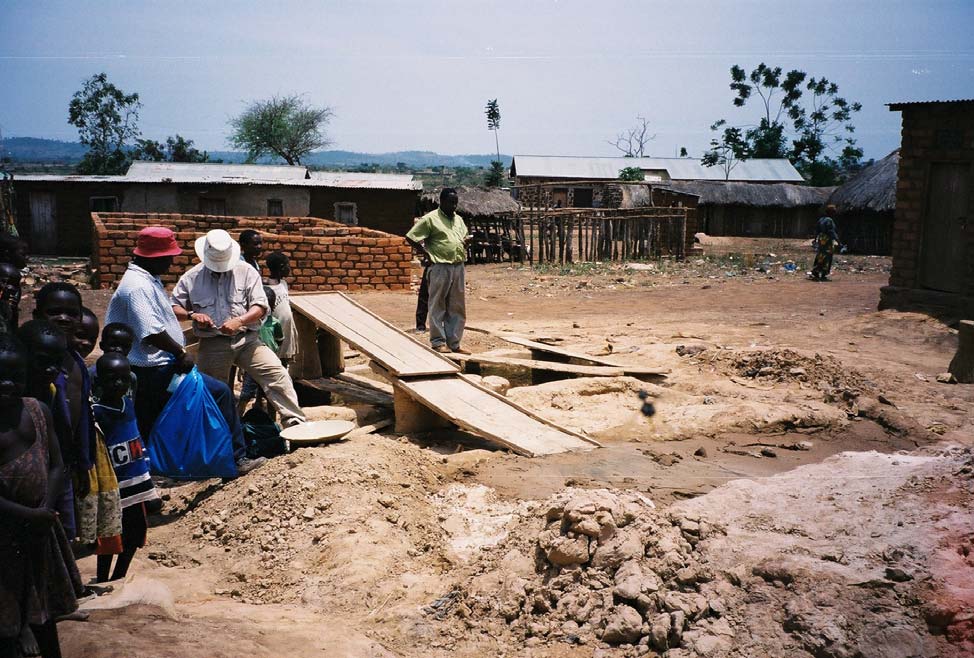
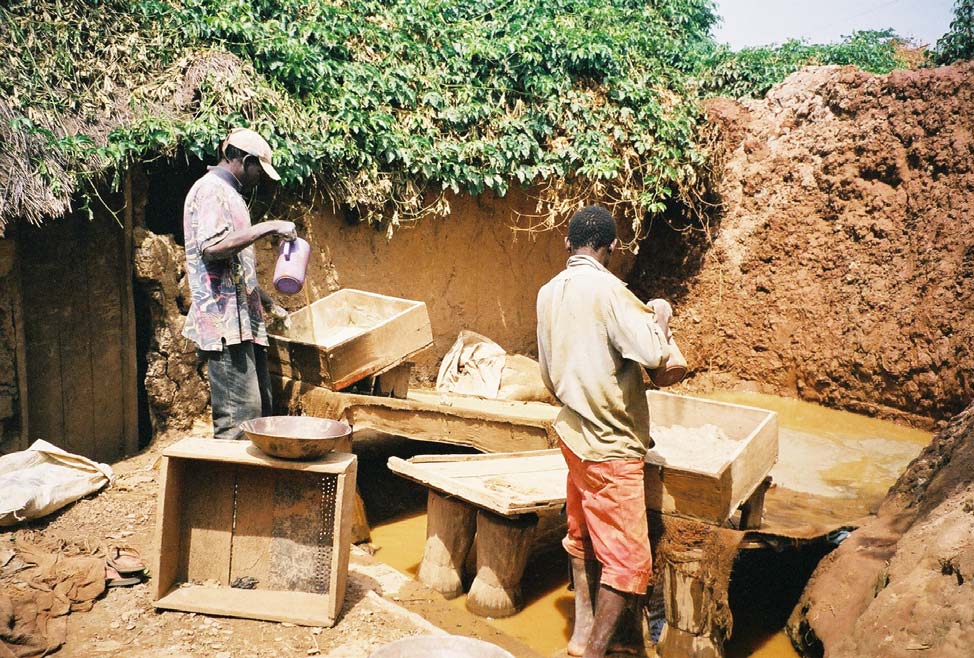
Plate 29. Historic sluicing and amalgamation site in the built-up area of Rwamagasa (site A13-14)
Plate 30. Sluicing crushed primary ore in the back-yard of a house in the centre of Rwamagasa village (site A7)
BGS Report CR/04/129 (Issue 1.0) for UNIDO Contract 03/088
145
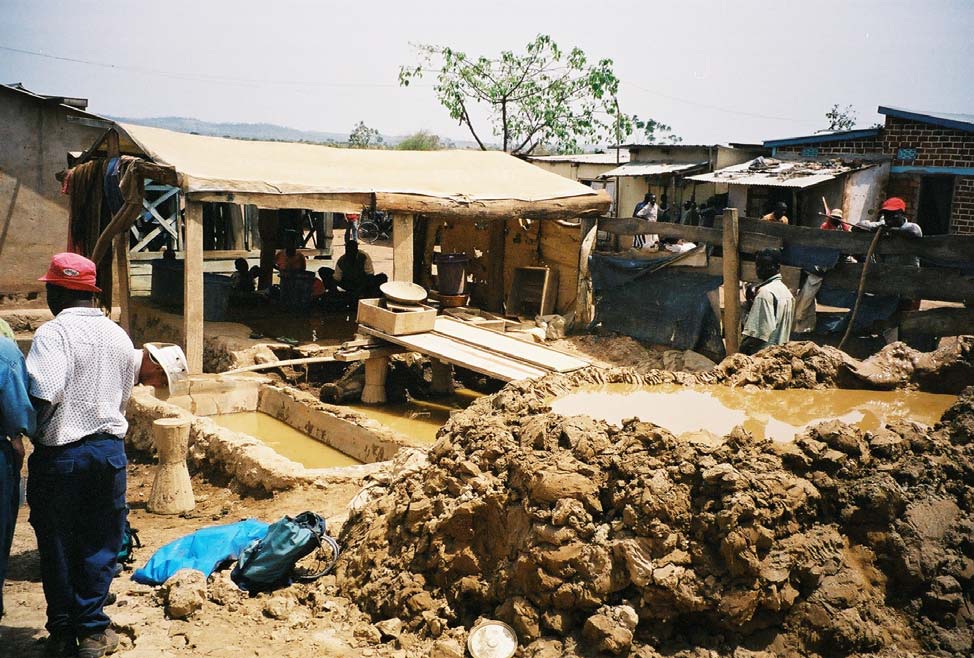
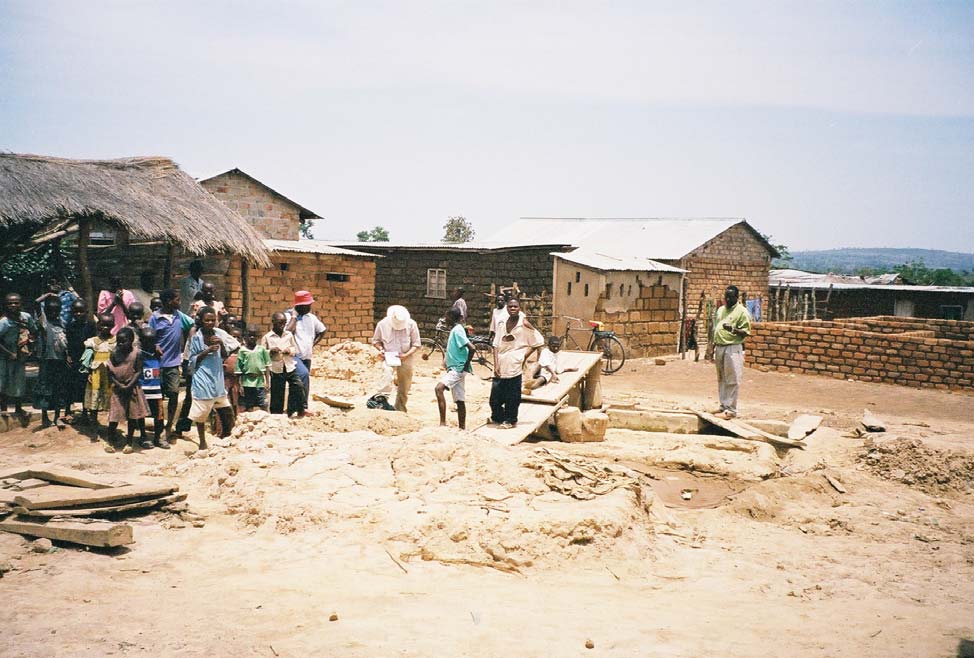
Plate 31. Sluicing and covered amalgamation pond located within the built-up part of Rwamagasa (site A9)
Plate 32. Historic sluicing site within Rwamagasa village (site A14)
BGS Report CR/04/129 (Issue 1.0) for UNIDO Contract 03/088
146
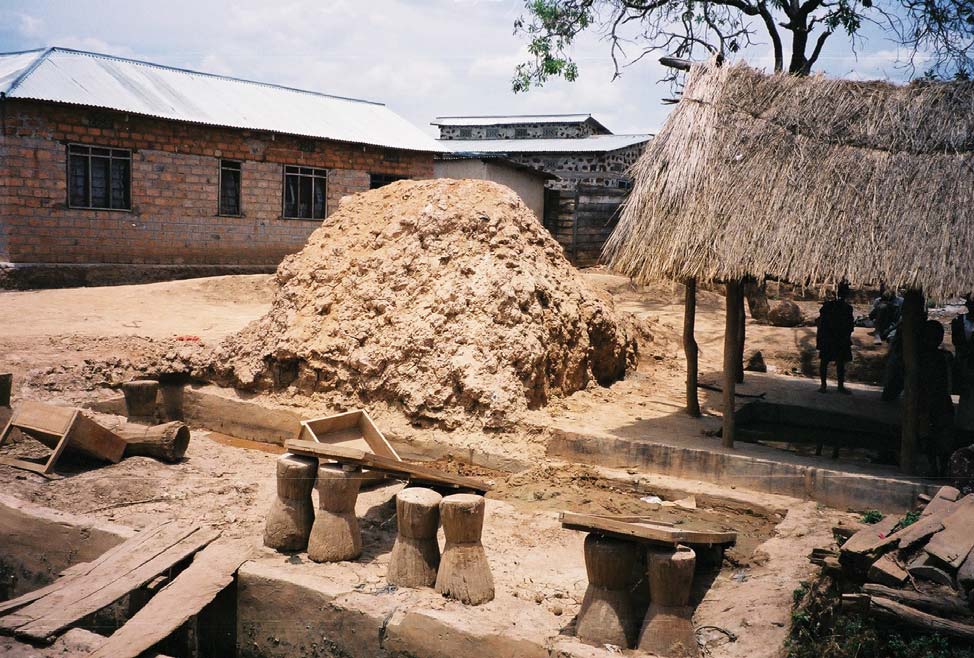
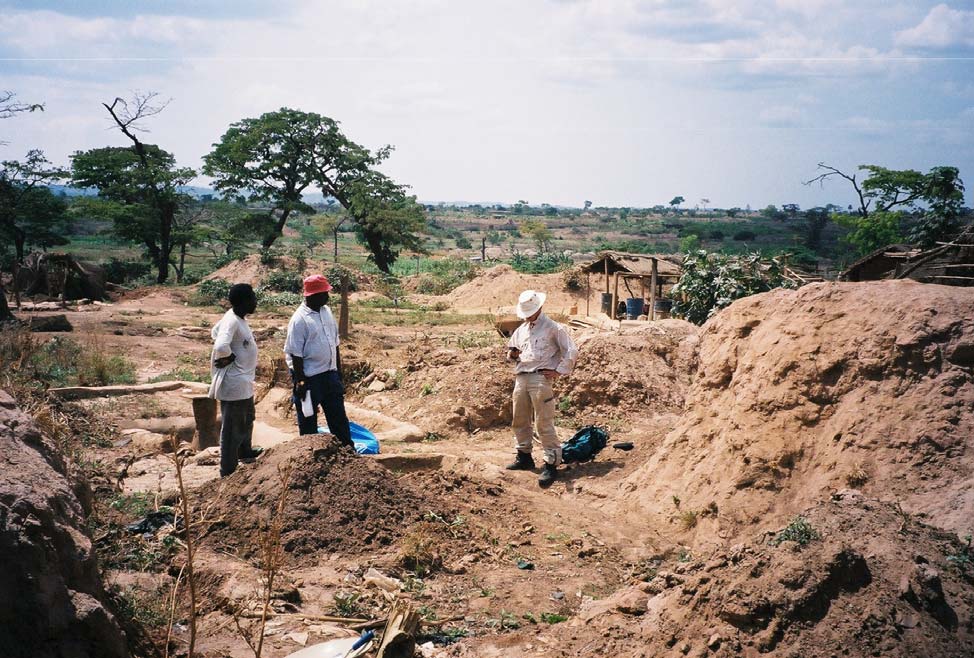
Plate 33. Historic sluicing site and covered amalgamation pond within Rwamagasa village (site A20)
Plate 34. Tailings piles on slope down to the Isingile River (site A29)
BGS Report CR/04/129 (Issue 1.0) for UNIDO Contract 03/088
147
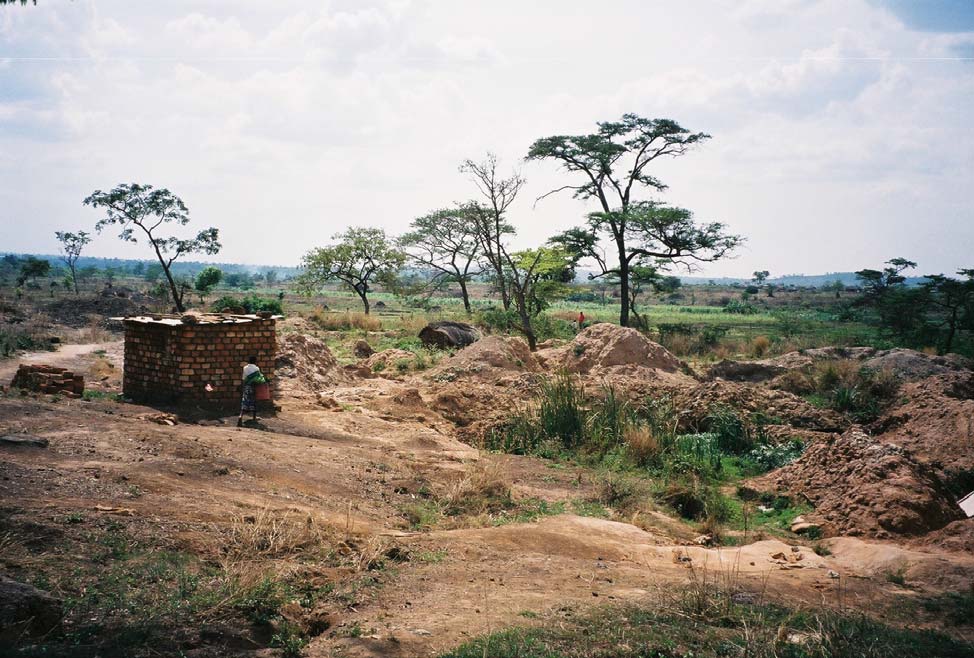
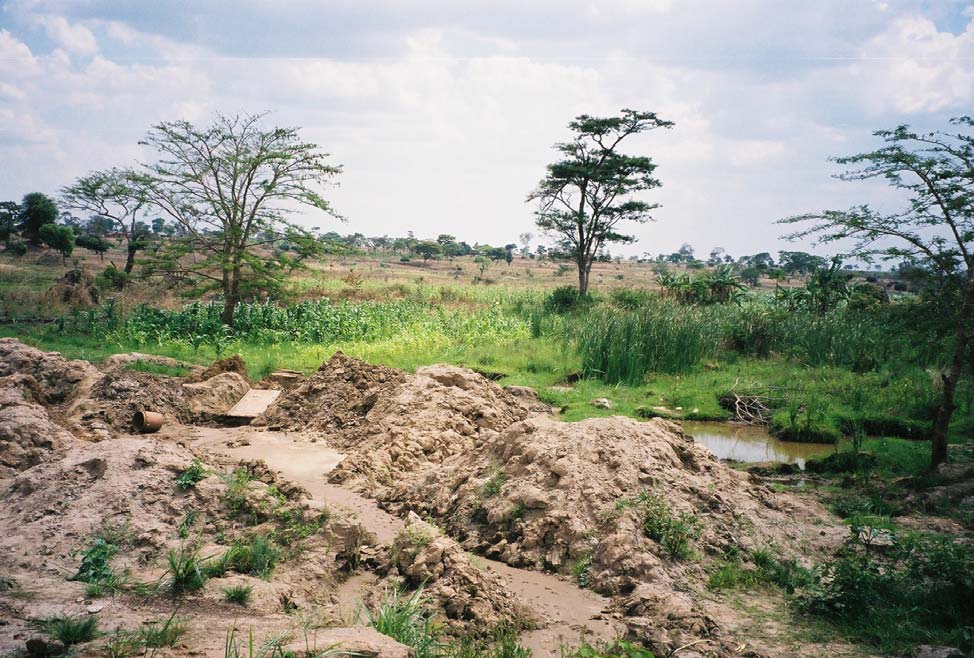
Plate 35. Tailings heaps at site A31 on slope overlooking the River Isingile mbuga.
Plate 36. Historic sluicing site and tailings heaps located at edge of River Isingile mbuga, about 100m west of
motorable track from Rwamagasa to Buck Reef.
BGS Report CR/04/129 (Issue 1.0) for UNIDO Contract 03/088
148
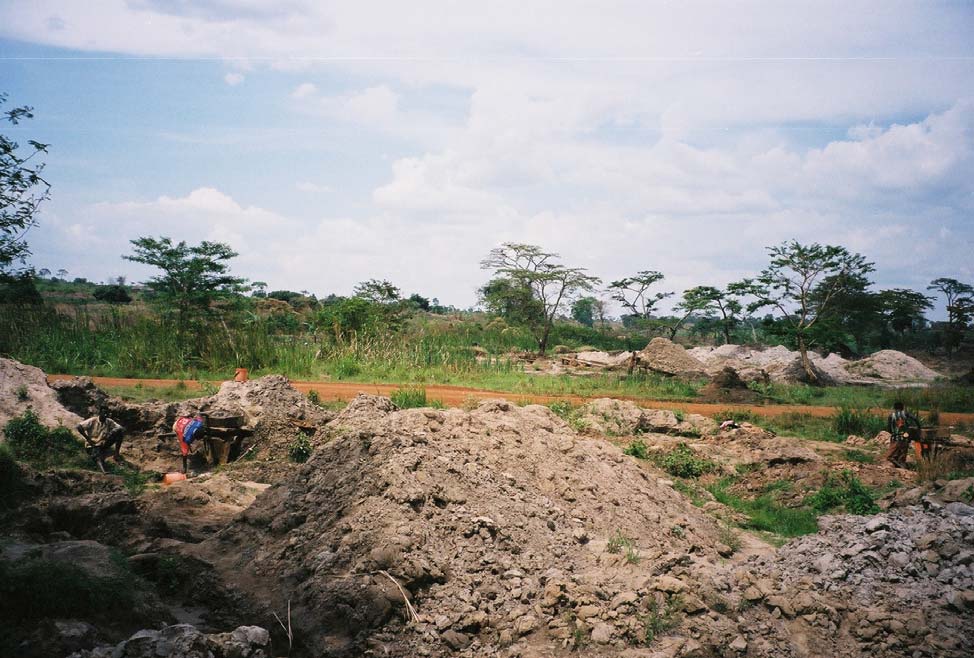
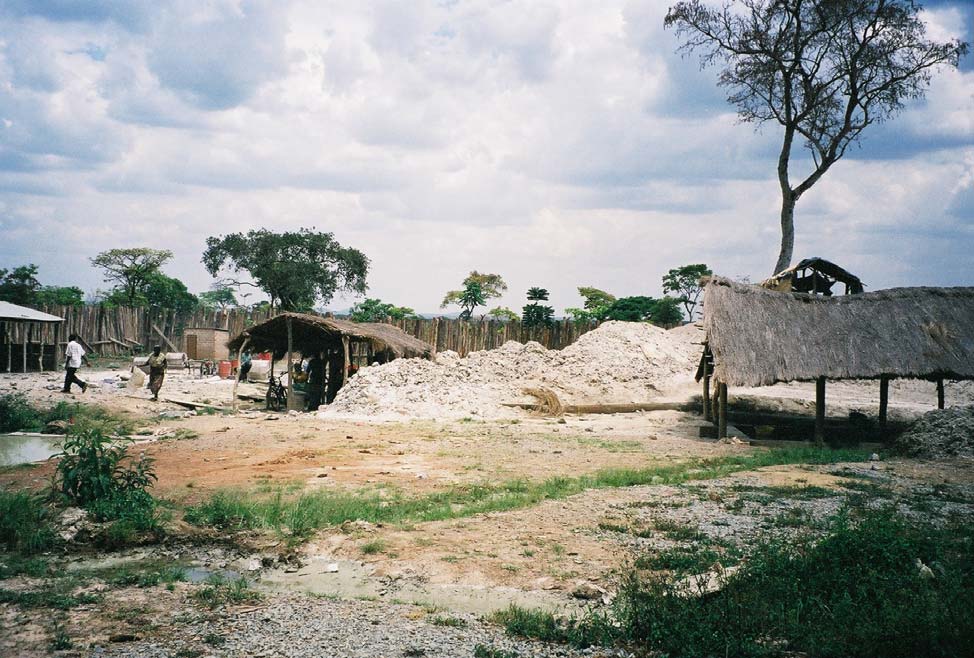
Plate 37. Historic sluicing site and tailings heaps located either side of motorable track from Rwamagasa to Buck
Reef, about 100m south of River Isingile.
Plate 38. Tailings piles and covered amalgamation pond within the Blue reef mine mineral processing compound.
BGS Report CR/04/129 (Issue 1.0) for UNIDO Contract 03/088
149
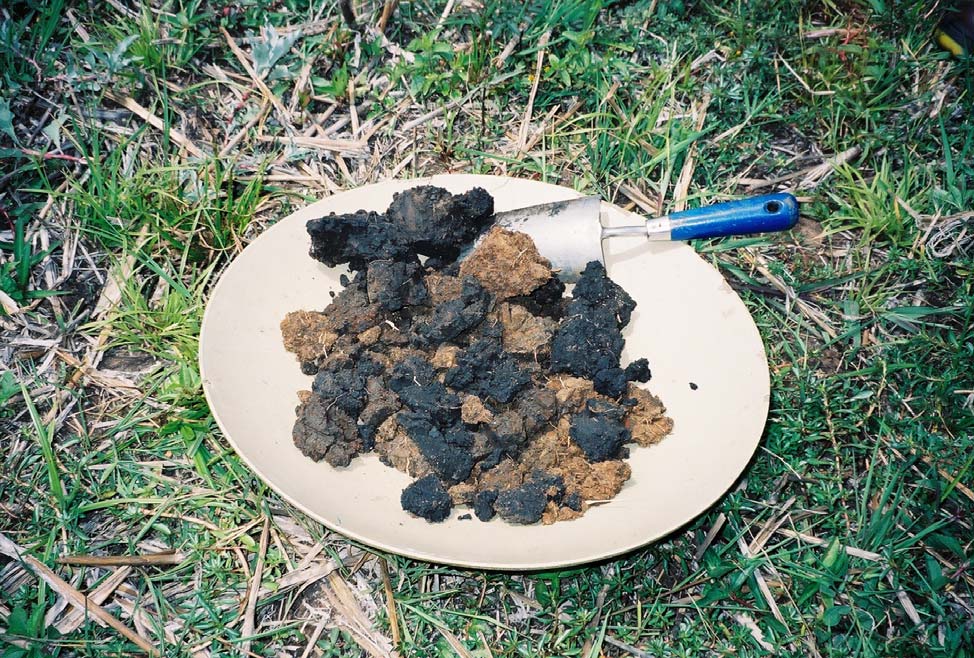
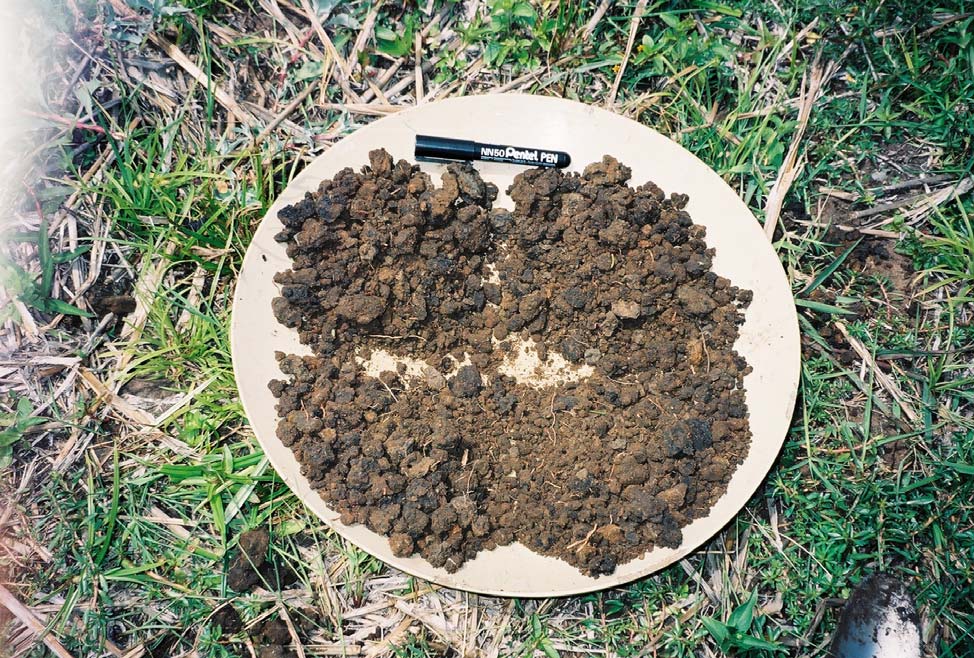
Plate 39. Inhomogeneous soil sample prior to disaggregation and mixing (site A69)
Plate 40. Homogenised and quartered soil sample after disaggregation and mixing (see Plate 46 above)
BGS Report CR/04/129 (Issue 1.0) for UNIDO Contract 03/088
150
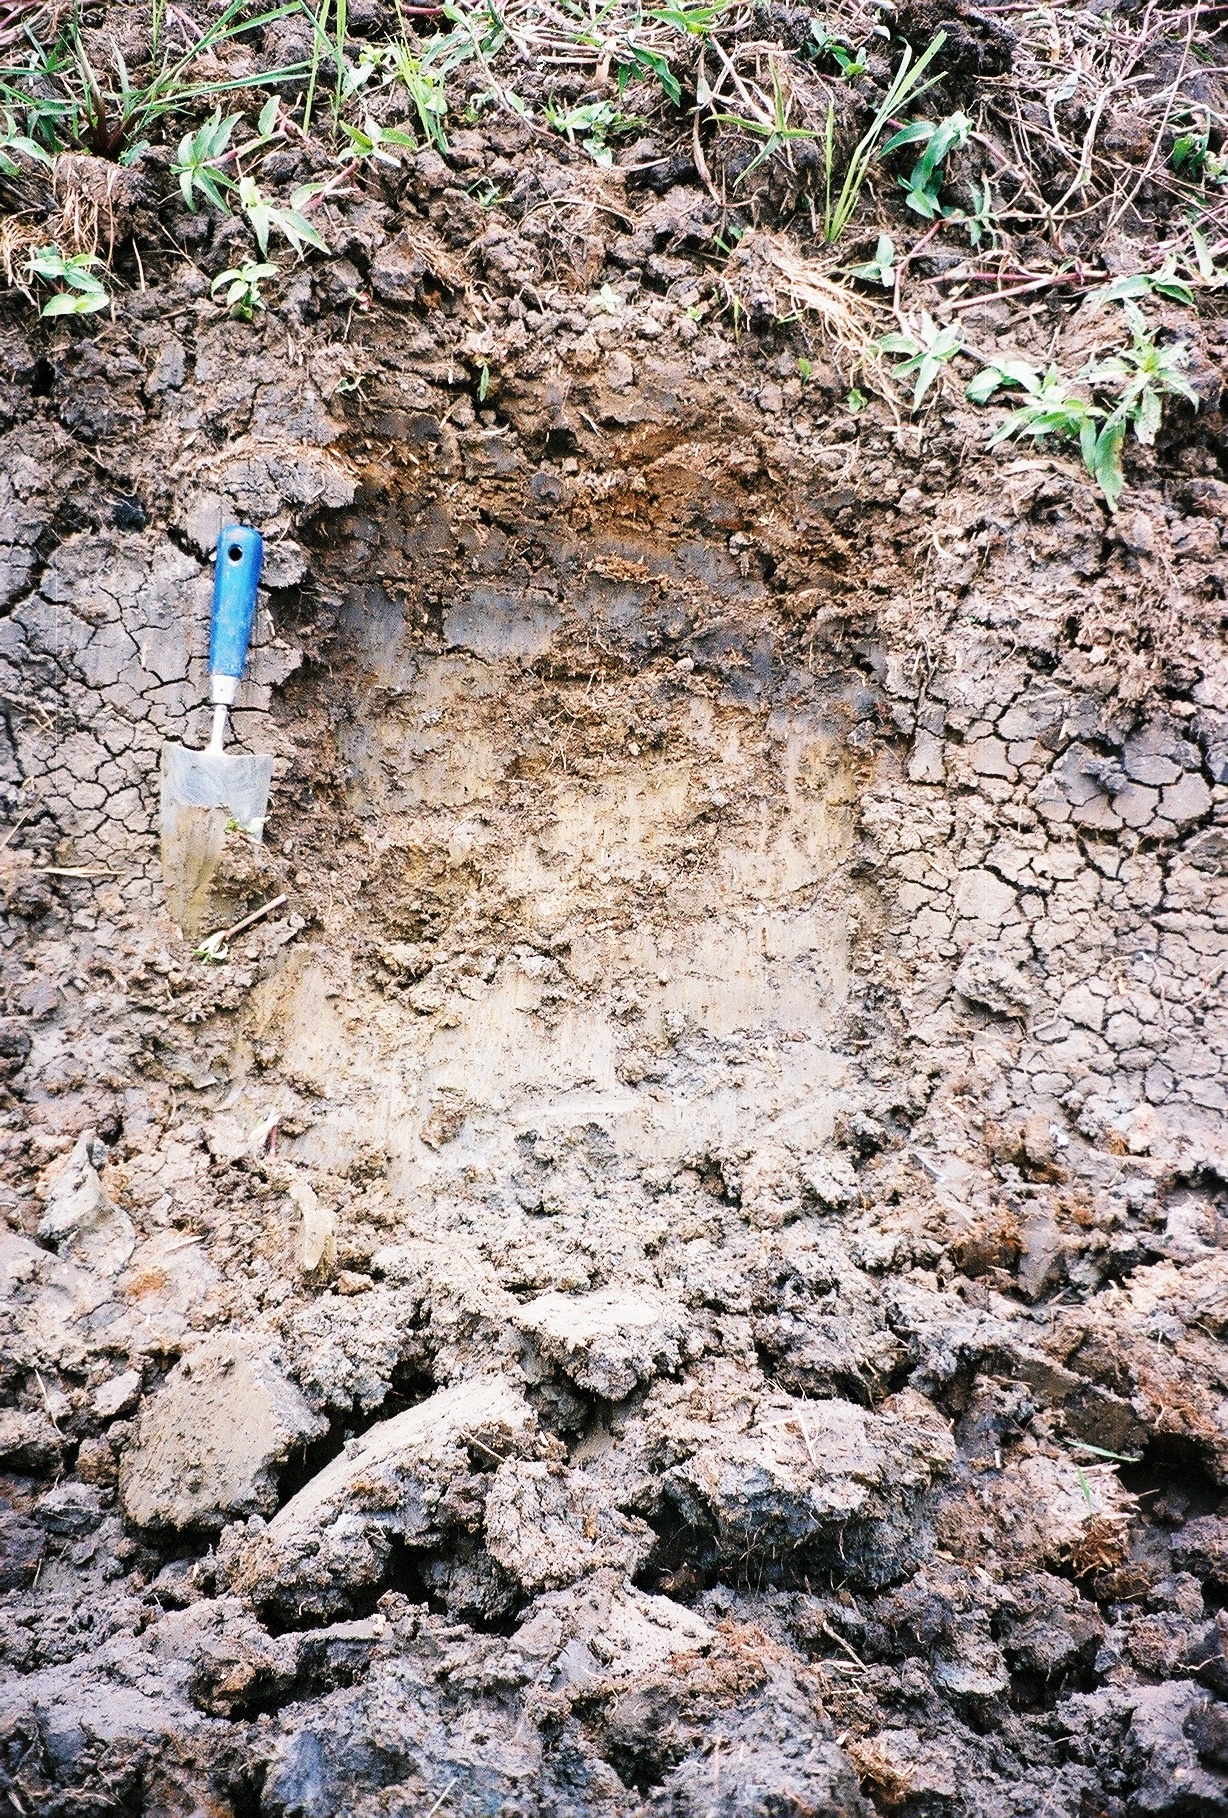
Plate 41. Soil profile (samples A279 (0-10cm) to A284 (50-60 cm))
BGS Report CR/04/129 (Issue 1.0) for UNIDO Contract 03/088
151
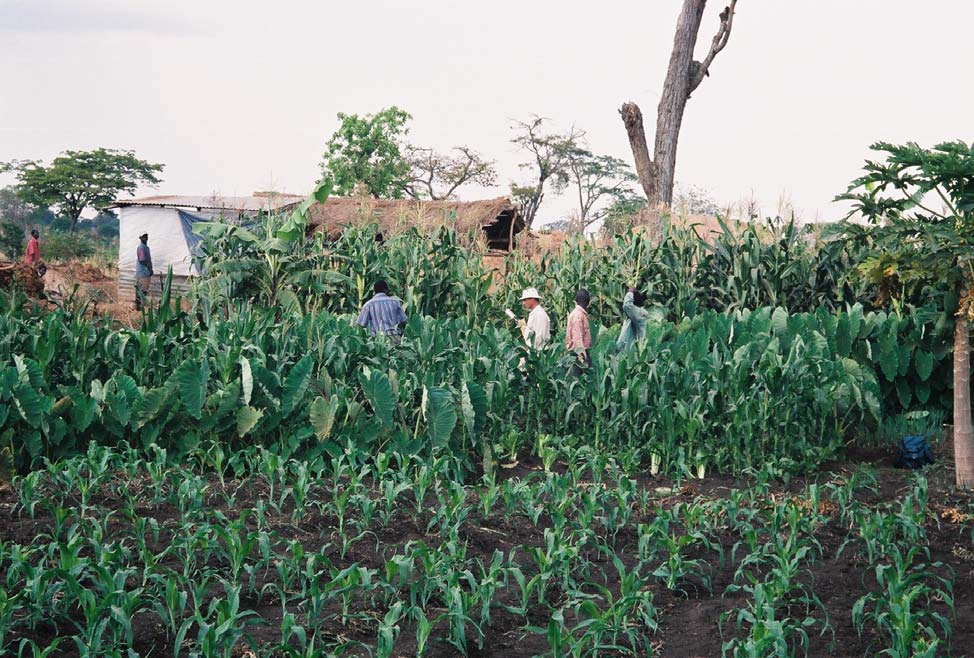
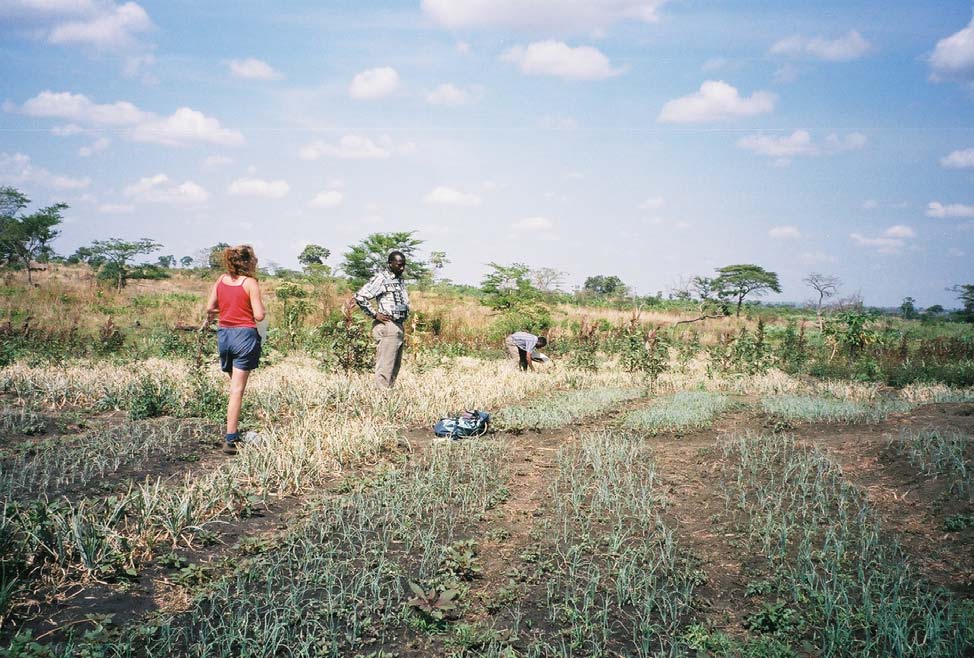
Plate 42. Collecting crop samples (A110-A113) from an area impacted by overflow water from an amalgamation
pond (site A37-A39)
Plate 43. Onions being cultivated at a site immediately to the N. of the River Isingile and irrigated with potentially
contaminated stream water (site A291)
BGS Report CR/04/129 (Issue 1.0) for UNIDO Contract 03/088
152
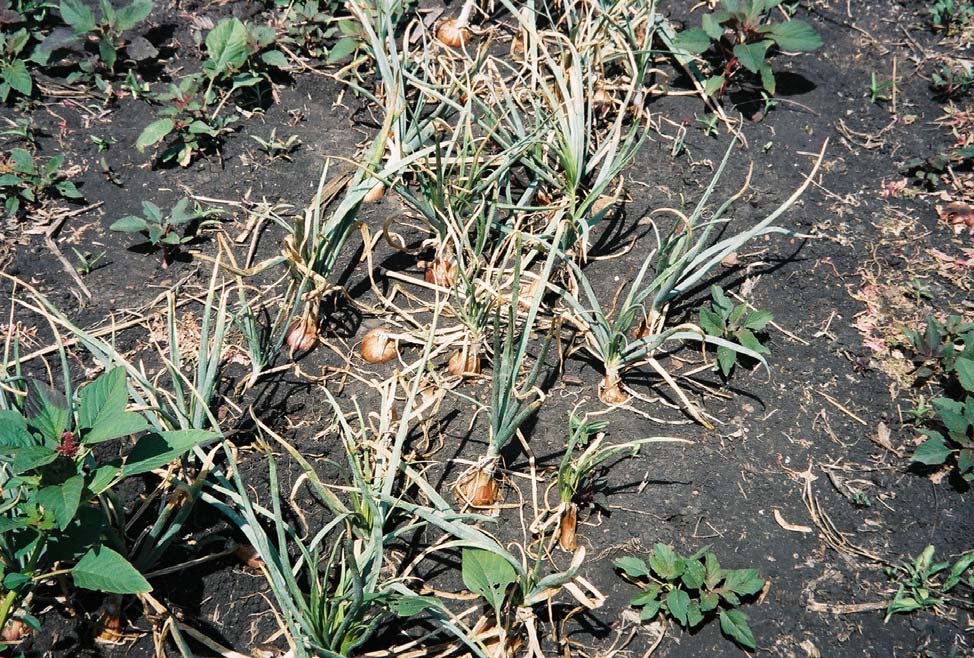
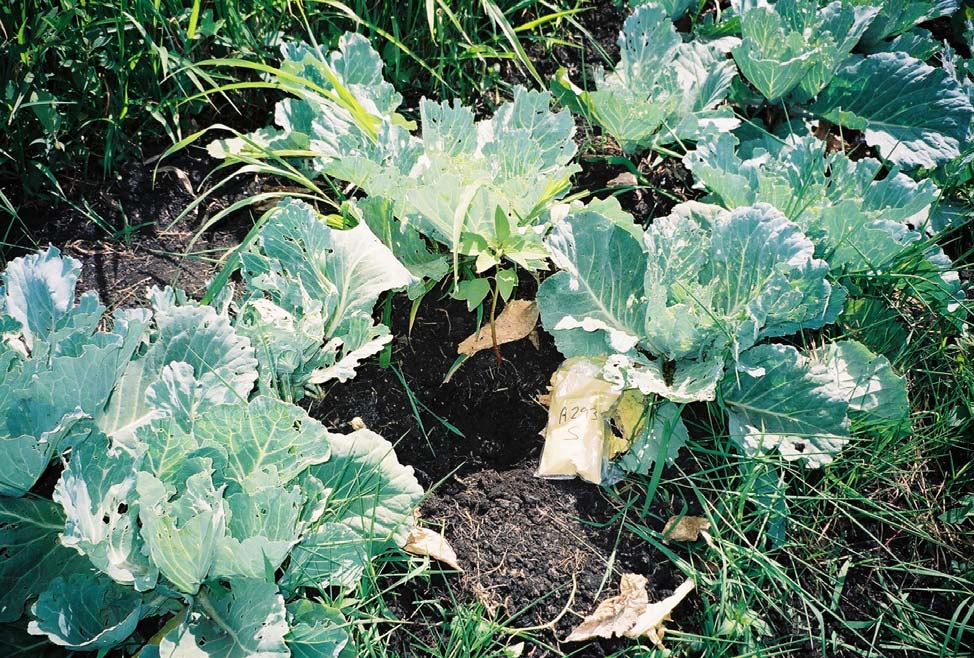
Plate 44. Onions being cultivated at a site immediately to the N. of the River Isingile and irrigated with potentially
contaminated stream water (site A291)
Plate 45. Cabbages being cultivated at a site immediately to the N. of the River Isingile and irrigated with potentially
contaminated stream water (site A293).
BGS Report CR/04/129 (Issue 1.0) for UNIDO Contract 03/088
153
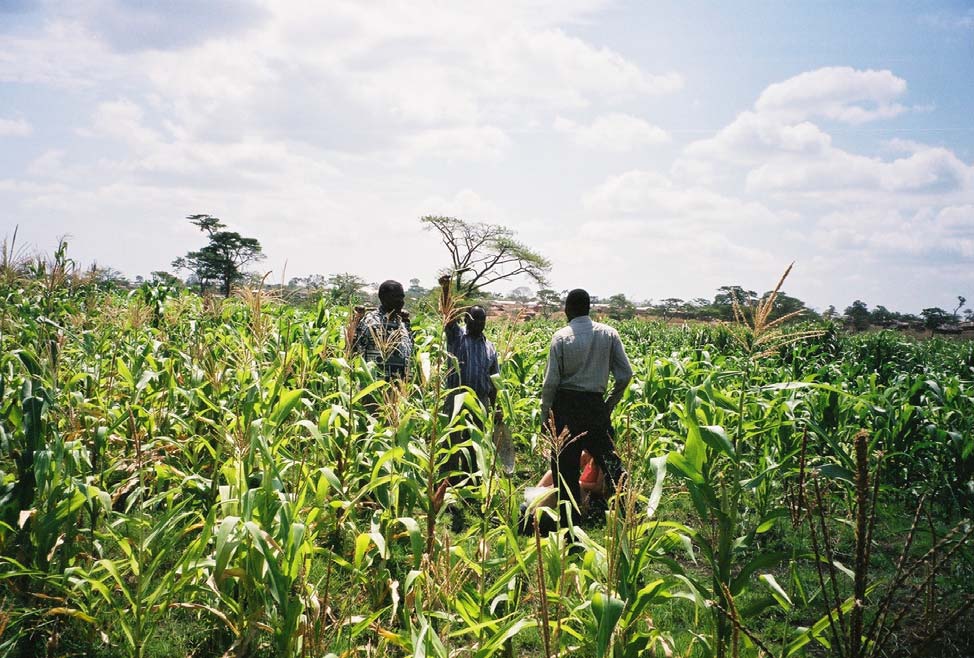
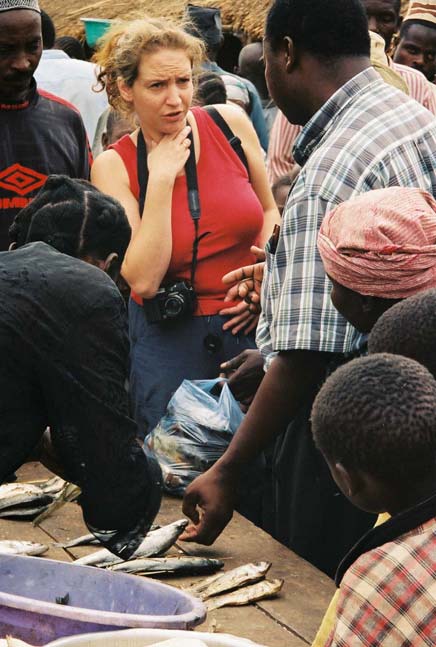
Plate 46. Maize being cultivated at a site immediately to the N. of the River Isingile and irrigated with potentially
contaminated stream water (site A297).
Plate 47 Purchasing fish samples from the market, Ilagala
BGS Report CR/04/129 (Issue 1.0) for UNIDO Contract 03/088
154
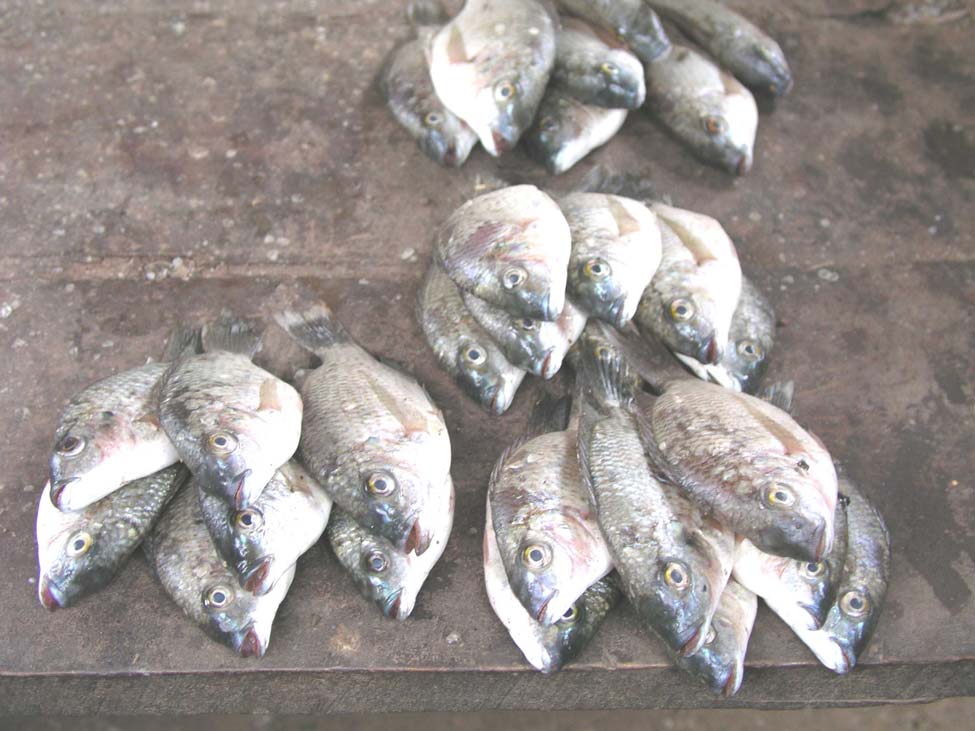


Plate 48 Oreochromis tanganicae (Tilapia), Ilagala market.
Plates 49 and 50. Clarias gariepinus
BGS Report CR/04/129 (Issue 1.0) for UNIDO Contract 03/088
155
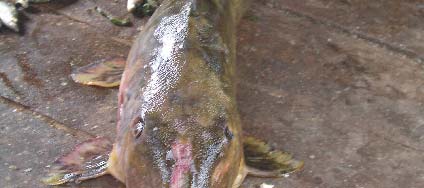
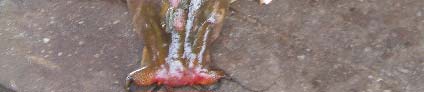


Plates 51 & 52. Auchenoglanis occidentalis
Plate 53. Lates Malagarasi
Plate 54. Oreochromis tanganicae
BGS Report CR/04/129 (Issue 1.0) for UNIDO Contract 03/088
156


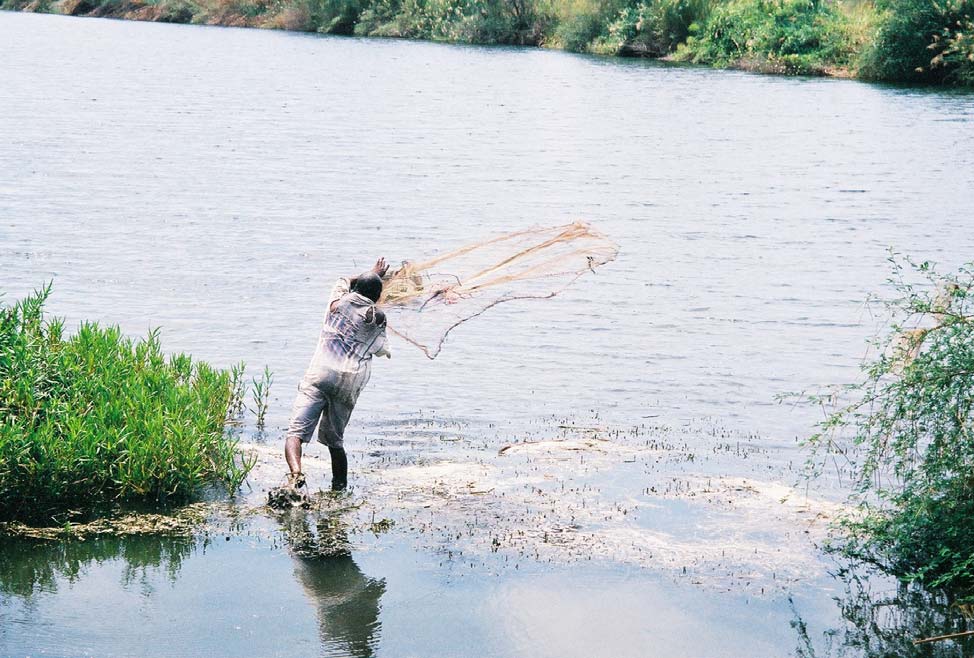
Plate 55. Brycinus rhodopleura
Plate 56. Catching fish using a net, Malagarasi River about 1 km upstream from Uvinza.
BGS Report CR/04/129 (Issue 1.0) for UNIDO Contract 03/088
157


Plate 57. Barbus tropidolepsis
Plate 58. Ctenopharyngodon idella
BGS Report CR/04/129 (Issue 1.0) for UNIDO Contract 03/088
158


Plate 59. Clarias alluadi
Plate 60. Haplochromis spp
Plate 61. Barbus spp
BGS Report CR/04/129 (Issue 1.0) for UNIDO Contract 03/088
159
BGS Report CR/04/129 (Issue 1.0) for UNIDO Contract 03/088
160
Part 2
Assessment of Health in the Rwamagasa area,
Tanzania
by
Institute of Forensic Medicine, Ludwig-Maximilians-University, Munich
BGS Report CR/04/129 (Issue 1.0) for UNIDO Contract 03/088
BGS Report CR/04/129 (Issue 1.0) for UNIDO Contract 03/088
1
Medical Investigation of 250 People living in the
Rwamagasa Area, Geita District
in the
UNITED REPUBLIC OF TANZANIA
Institute of Forensic Medicine, Ludwig-Maximilians-University,
Munich, 21st of May 2004
Final Report
by Gustav Drasch and Stephan Boese-O´Reilly
Removal of Barriers to the Introduction of Cleaner Artisanal Gold
Mining and Extraction Technologies
UNIDO (United Nations Industrial Development Organization)
GEF (Global Environment Facility)
UNDP (United Nations Development Programme)
UNIDO
British Geological Survey
Project EG/GLO/01/G34
Subcontract GA/03F/36
BGS Report CR/04/129 (Issue 1.0) for UNIDO Contract 03/088
BGS Report CR/04/129 (Issue 1.0) for UNIDO Contract 03/088
MI-2
Contents
Study Setting and Clinical Examinations (Stephan Boese-O´Reilly) .....................................5
Introduction...............................................................................................................................5
Rwamagasa small scale mining area Geita district...........................................................6
Study Design ..........................................................................................................................10
Field Project ...........................................................................................................................10
Questionnaire .....................................................................................................................11
Neurological examination ...................................................................................................11
Neuro-psychological testing ...............................................................................................12
Specimens..........................................................................................................................13
Laboratory ..........................................................................................................................13
Test for protein in urine ......................................................................................................13
Problems during the field project........................................................................................14
General Health Situation in Rwamagasa ...............................................................................15
Health care system in the Geita district..............................................................................15
General health problems ....................................................................................................16
Children's health.................................................................................................................19
Hygienic and social problems.............................................................................................20
Clinical and neurological impression ..................................................................................21
Specimen Analysis and Statistical Results (Gustav Drasch) ..............................................23
Laboratory Methods ...............................................................................................................23
Material and sample storage ..............................................................................................23
Sample preparation ............................................................................................................23
Mercury determination and quality control .........................................................................24
Statistical Analysis..................................................................................................................25
Statistical methods .............................................................................................................25
BGS Report CR/04/129 (Issue 1.0) for UNIDO Contract 03/088
MI-3
Description of mercury levels in urine, blood and hair........................................................25
Exclusion of data ................................................................................................................28
Forming subgroups due to residence and occupation .......................................................29
Reducing of redundant data for statistical analysis ............................................................31
Scoring of medical results ..................................................................................................35
Statistical analysis of mercury levels in urine, blood and hair ............................................37
Statistical analysis of mercury levels versus clinical data...................................................43
Discussion of the Statistical Analysis .....................................................................................48
Mercury Levels compared to Toxicological Threshold Limits.................................................49
German human-bio-monitoring (HBM) values for mercury.................................................49
Occupational threshold limits (BAT, BEI) ...........................................................................51
Decision for the Diagnosis of a Chronic Mercury Intoxication ................................................52
Prevalence of the Diagnosis "Mercury Intoxication" ...............................................................53
Influence on Nursed Babies ...................................................................................................55
Screening of Mercury Urine Concentration in Field................................................................58
Summary and Recommendations (G. Drasch and S. Boese-O´Reilly)................................61
Summary 61
Recommendations .................................................................................................................15
How to improve General Health? .......................................................................................17
How to reduce Mercury as a Health Hazard? ....................................................................15
How to improve the Knowledge on Mercury as a Health Hazard.......................................16
How to reduce the Release of Mercury into the Environment ............................................15
Literature:...................................................................................................................................66
Acknowledgement.....................................................................................................................70
Appendix 1:................................................................................................................................71
Appendix 2: Health assessment questionnaire......................................................................85
BGS Report CR/04/129 (Issue 1.0) for UNIDO Contract 03/088
MI-4
Study Setting and Clinical Examinations
(Stephan Boese-O´Reilly)
INTRODUCTION
The aim of the subcontract was to undertake a medical investigation of approximately 250
people living in the Rwamagasa area, Geita District in the United Republic of Tanzania. The
ultimate aim of the whole UNIDO project is to replace mercury amalgamation in the project
demonstration sites with new technology,
while improving the income of the miners
through more efficient recovery, increasing
knowledge and awareness, and providing
policy advice on the regulation of artisanal
gold mining with due consideration for
gender issues.
BGS Report CR/04/129 (Issue 1.0) for UNIDO Contract 03/088
MI-5
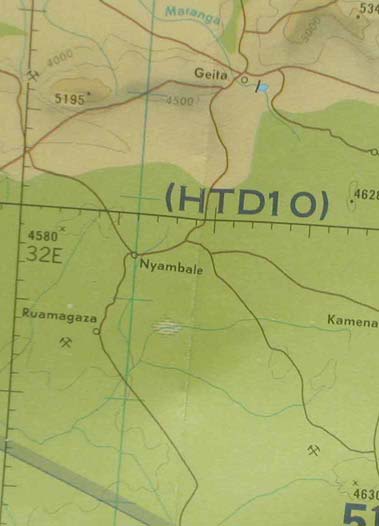

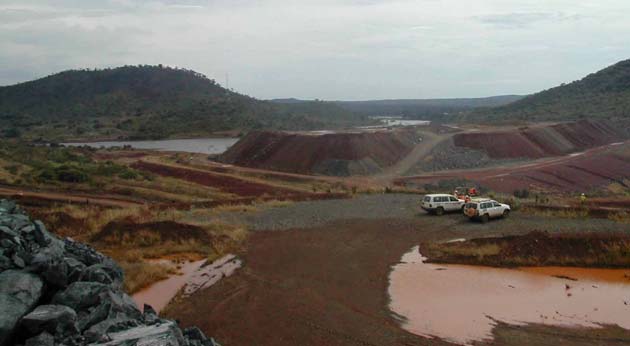
Rwamagasa small scale mining area Geita district
Tanzania is in East Africa. Geita District is near Lake Victoria (Mwanza Region). Farming is
the main activity of the rural population.
. Geita
There is one big employer in the area, a big gold mining company (Geita Gold Mine).
Geita Gold Mine
BGS Report CR/04/129 (Issue 1.0) for UNIDO Contract 03/088
MI-6

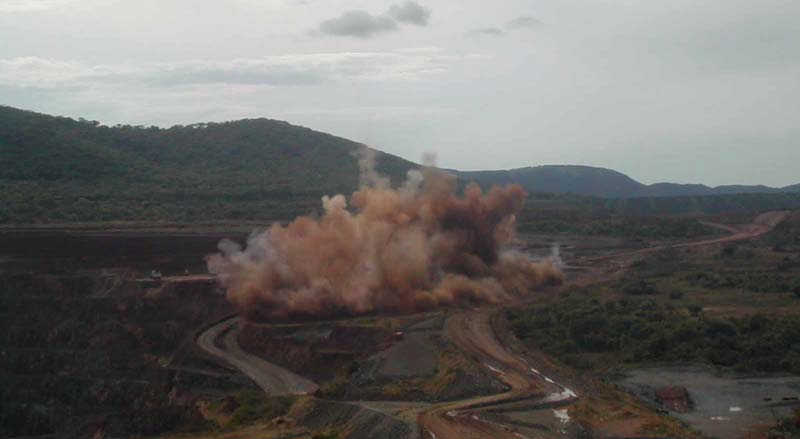
Geita Gold Mine (GGM) is a joint venture of Ashanti Goldfields and Anglo American and
Tanzania's biggest gold mine. GGM employs approx. 1.900 workers. By large scale mining
GGM extracts 500.000 ounces of gold per year (Raging Bull 13.4.2003,
www.ragingbull.lycos.com).
Geita Gold Mine
Rwamagasa village is approx. 45 km southwest from Geita on off-roads. The area is slightly
hilly, semi-dry, and covered by grassland and woodland. The Rwamagasa mining area itself
is logged, and the surface is open at many spots, either for tunnels or for amalgamation
areas. Mining operations have been carried out in this area since 1972, and activities
increased in 1998 (Wagner 2003). The infrastructure is poor. All roads are in a very bad
condition, traveling for the people is difficult and time-consuming. The two schools in
Rwamagasa have 1650 pupils, but only half of the pupils attend school daily. Some children
begin school at very late age 10 years or above. Many drop out early. Illiteracy is approx
10% in female adults, and 5% in male adults in Rwamagasa village (Wagner 2003).
BGS Report CR/04/129 (Issue 1.0) for UNIDO Contract 03/088
MI-7

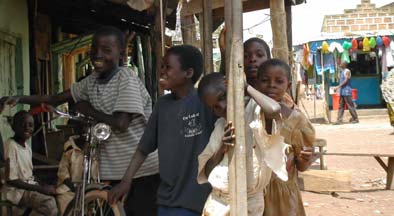

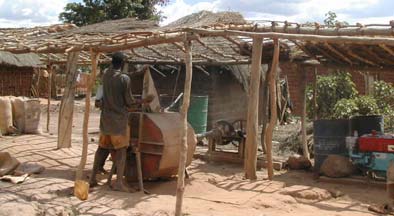
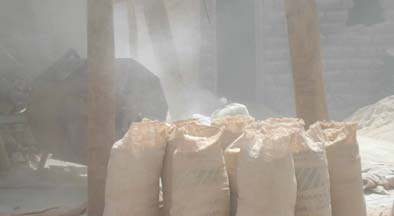
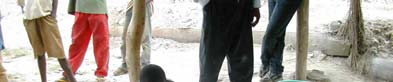
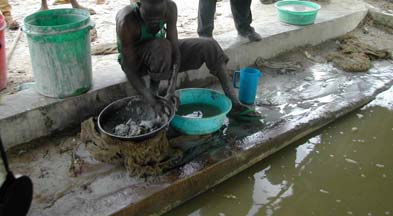
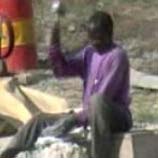
Some miners work in small-scale mining
companies, which are licensed. Equipped with generators and other technical equipment
miners work in tunnels to extract the ore. The tunnels have a small diameter. The miners try
to follow veins, so tunnels are curved, and tend to be very steep. Miners work in shifts. The
ore is crushed by workers with hammers, and then powdered in ball mills.
Rwamagasa village hammering rocks, ball mills and panning
BGS Report CR/04/129 (Issue 1.0) for UNIDO Contract 03/088
MI-8
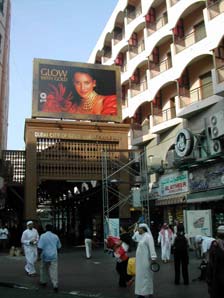
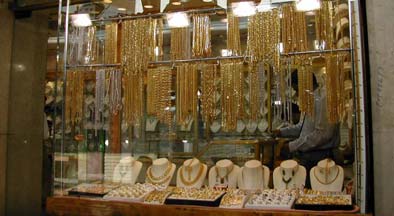
The ore is then diluted with water. The miners try to concentrate the gold containing
materials using a sluice box with a rough cloth.
The concentrated material is then panned, and at this stage liquid mercury is added to the
ore. After panning the still liquid amalgam is squeezed through some fine cloth. Sometimes
the miners use their mouth to hold the cloth whilst squeezing stronger. The proper amalgam
is formed now. The amalgam is either sold to gold dealers, or burnt. The burning takes place
in the kitchen or nearby, over a wooden fire. Artisanal miners work in smaller units, they
mainly concentrate on the crushing of the ore, running of ball mills, the amalgamation
process and burning of the amalgam. The artisanal miners have very limited equipment and
tools.
The young and strong men, so called healthy workers, are mainly found in the bigger and
technically higher equipped properties. Older people, women of all ages and children mainly
work in the smaller artisanal mining properties. Retorts are not used, or any other protection
against any kind of mercury contamination. There is no proper
ventilation for the mercury fumes. Housing areas, food stalls and the
schools are nearby to the amalgamation and burning places. Tailings
containing mercury are
everywhere within the
village, beside the farming
land or beside the local
water wells The mercury is
usually stored in the miner's houses in small soft
drink bottles, near to where they and their families
sleep. The mercury is traded from Nairobi, Kenya.
The gold is either used for jewelry in Tanzania or sold to Dubai.
Dubai gold market
BGS Report CR/04/129 (Issue 1.0) for UNIDO Contract 03/088
MI-9
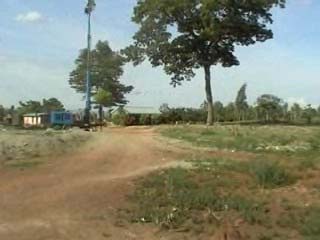
10.1 STUDY
DESIGN
The "Protocols for Environmental and
Health Assessment of Mercury Released
by Artisanal and Small-Scale Gold Miners"
were developed by UNIDO in collaboration
with the Institute of Forensic Medicine,
LMU of Munich, and other international
experts (Veiga 2003). The declaration to
volunteer was translated in Swahili (see
appendix 2). The "Health Assessment Questionnaire" was partly translated in Swahili
(Appendix 2) to be used to examine the general health condition of members of the mining
community and to indicate symptoms of mercury poisoning. Anamnestic / clinical /
neurological / toxicological tests were used according to the state of the art. Participants
were examined to identify neurological disturbances, behavioral disorders, motor
neurological functions, cognitive capabilities, balance, gait, reflexes etc.. The data was
compiled for statistical purposes and maintain confidentiality regarding all health related
issues. All participants were physically examined including neurological testing.
FIELD PROJECT
The field project took place from the 19th of October 2003 until the 9th of November 2003. The
equipment was set up in the office building of Blue Reef Mining Company. The mining
company offered its facilities to perform the examination, which was much appreciated by the
health assessment team. The facilities were sufficient to perform the examinations, including
a mobile analysis of Hg in urine samples (four rooms for the team, electricity, toilet, water).
Team members for the field project were Dr. med. Stephan Boese-O´Reilly (pediatrician,
master of public health, environmental medicine), Stefan Maydl (physician), Katalin Drasch
(pharmacist). Mrs. Katrin Hupe (journalist) accompanied the team in agreement with BGS
and UNIDO. Mr. Tesha was the Assistant Country Focal Point to UNIDO and comes from the
Tanzanian Ministry of Energy and Mineral Resources. Assigned to the project were nurses to
assist the medical examinations, Mrs. Mwajuma Libuburu, Mr. Sosthenes T. Mchunguzi, Mrs.
Asila Rashid and Mrs. Felister Malima. These four nurses interviewed all 252 participants.
A mobile Hg analyzer was used to determine total mercury in urine.
BGS Report CR/04/129 (Issue 1.0) for UNIDO Contract 03/088 MI-10
Video and photo documentation was carried out.
The control group was examined in Katoro. The same method and team as in Rwamagasa
was used. The local health unit supported us. Katoro is approx 30 km away from the mining
area, and mercury is not used there.
Blood, urine and hair were analyzed for mercury later at the Ludwig-Maximilians-University of
Munich, Germany.
Questionnaire
The participants filled in a questionnaire with assistance from the nurses. Questions
included:
· Working with mercury or with mercury polluted tailings?
· Burning amalgam in the open?
· Melting gold in the open or with inadequate fume hoods?
· Drinking alcohol?
· Having a kind of a metallic taste?
· Suffering from excessive salivation?
· Problems with tremor / shaking at work?
· Sleeping problems?
Neurological examination
All participants were clinically, mainly neurologically examined. Results were mainly primarily
scored according to ,,Skalen und Scores in der Neurologie" (Masur 1995):
· Signs of bluish discoloration of gums
· Rigidity, ataxia and tremor
· Test of alternating movements or test for dysdiadochokinesis
· Test of the field of vision
· Reflexes: knee jerk reflex and biceps reflex
BGS Report CR/04/129 (Issue 1.0) for UNIDO Contract 03/088 MI-11
· Pathological reflexes: Babinski reflex and mento-labial reflex
· Sensory examination
Neuro-psychological testing
The following tests were carried out (Zimmer 1984, Lockowandt 1995, Masur 1996):
· Memory disturbances: Digit span test (Part of Wechsler Memory Scale) to test
the short term memory
· Match Box Test (from MOT) to test co-ordination, intentional tremor and
concentration
· Frostig Score (subtest Ia 1-9) to test tremor and visual-motoric capacities
· Pencil Tapping Test (from MOT) to test intentional tremor and co-ordination
BGS Report CR/04/129 (Issue 1.0) for UNIDO Contract 03/088 MI-12
Specimens
The following specimens were taken, and two tests (Hg in urine and proteinuria) were
performed immediately:
· Blood (EDTA-blood 10 ml)
· Urine (spontaneous urine sample 10 ml)
· Hair
The specimen urine and blood were cooled permanently after collection until arrival in the
laboratory in Munich, Germany.
Laboratory
A mobile Hg analyzer was used (Hg-254 NE, Seefelder Messtechnik, Seefeld, Germany). It
is possible to quantify inorganic mercury in urine. 1 ml urine was diluted with 100 ml water
(bottled drinking water). A 2 ml solution of 10% tin(II)chloride in 6N hydrochloric acid was
added to the water-urine solution. The sample was analyzed by atomic emission
spectrometry. Bottled drinking water was used as zero standard, and a mercuric nitrate
solution as standard. In 231 of 252 cases it was possible to analyze the sample. One urine
sample can be analyzed in approximately 3 minutes. At the last day it was not possible to
work with the analyzer, due to problems with an adequate electric power supply in Katoro. All
urine samples were re-analyzed in the "Institute of Forensic Medicine", Munich, Germany.
Test for protein in urine
Proteinuria was tested with a commercial kit (Bayer). The test is based on the error-of-
indicator principle.
Test reagents are 0,3 % w/w tetrabromophenol blue; 99,7 % w/w buffer and non-reactive
ingredients. At a constant pH, the development of any green color is due to the presence of
protein. Colors range from yellow for "Negative" reaction to yellow-green and blue-green for a
"positive" reaction. The test area is more sensitive to albumin than to globulin, hemoglobin,
Bence-Jones proteins and muco-proteine. The test area is sensitive to 15 mg/dl albumin. The
test strip was dipped into the native urine and the result was taken after 1 minute.
BGS Report CR/04/129 (Issue 1.0) for UNIDO Contract 03/088 MI-13
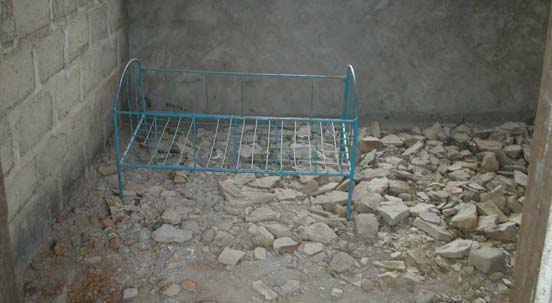
The test is semi-quantitative. Possible results are 0, 10, 20, 30, 100 and 300 mg Protein / dl
urine.
Problems during the field project
The sociological report (Wagner 2003) was an excellent source of information. Mr. Tesha
and Mr. Kabadi selected the volunteers well, so that these volunteers are a good
representation of the population in Rwamagasa.
The infrastructure in Rwamagasa area is very poor, just sufficient to perform the
examination. It is only due to excellent preparation of the field project by UNIDO
Dar es Salaam, Mr. Tesha and Don Appleton, that the project was successful at all.
The regional health authorities supported the project. But on the national level there was no
support for the project. When asked for support before the start of the project, the Ministry of
Health did not support the health assessment.
Many participants especially men had no or nearly no hair on their head, near under their
axils or in the genital region. So sometimes only very little hair was gained or even none.
BGS Report CR/04/129 (Issue 1.0) for UNIDO Contract 03/088 MI-14

GENERAL HEALTH SITUATION IN RWAMAGASA
Nurses, engineers, teachers and participants were interviewed on possible health effects in
relation to the mining activities.
Health care system in the Geita district
The population is estimated to be "26,990,
comprised of 13,879 males and 13,111 females,
with 5,017 households having an average size of
5.4 people in Rwamagasa" ward (Wagner 2003).
Large families with 6-12 children are common. A
mayor part of the population is directly involved in
the mining activities in the village.
Rwamagasa future health center
Many of these inhabitants are work migrants. Only few of the miners have a licensed small-
scale mine, most miner work as artisanal small scale miners. Most mining families also farm
land mainly for private consumption.
Poverty is the main problem of Rwamagasa area. 64% have a monthly income below 50
US$ per month (Wagner 2003).
There is no health service for the approximately 27.000 people in Rwamagasa. The next
dispensary is 10-20 km away. A local dispensary is under construction, but the building has
been stopped due to lack of money. The village lacks social welfare services and a police
post for security.
The next district hospital is in Geita. All non-minor illnesses have to be transferred to Geita
hospital, which is adequately equipped for a district hospital.
BGS Report CR/04/129 (Issue 1.0) for UNIDO Contract 03/088 MI-15

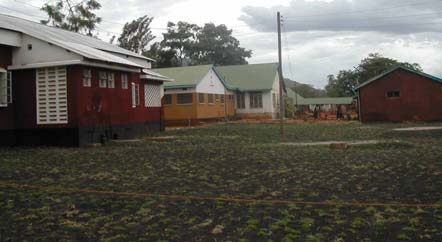
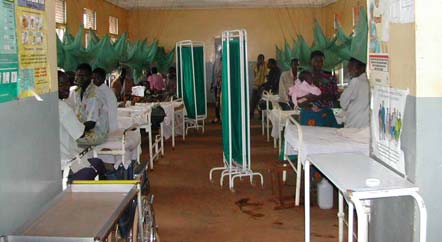
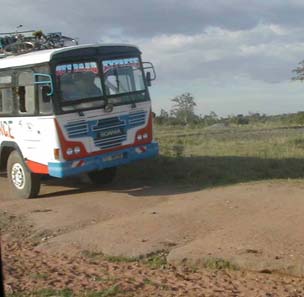
Geita District Hospital
Traditional healers (herbalists) and so-called "witch doctors" are an essential part of the
health system.
General health problems
The main health problems in the area seem to be:
· Dangerous tunnels, lethal accidents occur each year in Rwamagasa. Miners reported of
being caught in collapsing tunnels for hours before their colleagues rescued them.
Lacking rescue and medical facilities cause insufficient
medical treatment. This leads to secondary healing
wounds and skin defects.
· Bicycle, bus, and truck accidents are common. The road
conditions are very bad, most cars and trucks are in a
very bad technical condition. On the off-road cars, and
trucks share the narrow roads (at night very dark) with
bicycles, pedestrians and all kind of cattle. There is no
infrastructure to rescue and treat any kind of accident.
· Infectious diseases are widespread. Nearly everybody in the surveyed population had
malaria, many of them within the last year. Malaria is diagnosed clinically and treated
orally mainly with Fansidar SP (Sulfadoxine/Pyrimethamine). Tuberculosis is endemic, but
BGS Report CR/04/129 (Issue 1.0) for UNIDO Contract 03/088 MI-16
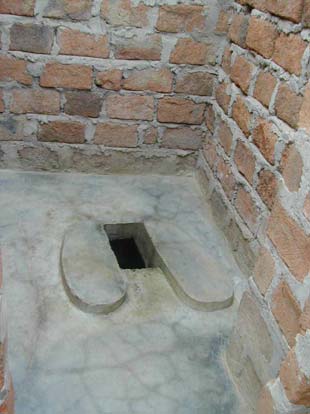
not epidemic. Tuberculosis is treated under a governmental program. According to the
WHO scheme daily-observed treatment (DOT) with quadruple treatment for 2 months
(Isoniazid, Rifampicin, Pirazinamid, Etambutol) and follow-up double treatment for 4
month (Isoniazid, Rifampicin) is performed. Typhoid fever, leprosy, polio, cholera and
tetanus occur occasionally.
· Sexually transmitted diseases (STD) are common. Promiscuity and prostitution are very
common. 35% of the mine workers in Geita town had multiple sex partners during the last
3 months; 54% mine workers had sex with a prostitute at least once a year and 30% of
them did not regularly use condoms (WEF 2002). According to an AMREF survey 19% of
the male population in Geita between the ages of 16 and 45 are HIV positive. Almost 39%
of the female sex workers are HIV positive. The rate of Hepatitis B and Hepatitis C cases
is unknown. Syphilis and Gonorrhea are common.
· The dental status of people differs. Some people have many stumps; other people have
fairly good teeth. Most children have fairly good teeth.
· Due to insufficient sanitary conditions diarrhea is common. But it is not a major cause of
mortality.
· Pneumonia, parasitism, skin diseases, eye diseases and upper respiratory infections are
other important diseases in Rwamagasa.
· The volunteers, we examined, presented diseases such as skin infections, scares,
hernias, dysuria etc.. These conditions should have been diagnosed and treated much
earlier.
· Smoking is more common among men then women.
BGS Report CR/04/129 (Issue 1.0) for UNIDO Contract 03/088 MI-17
No.
RANK
<5 YEARS
5 YEARS AND ABOVE
Diseases No.
of
% of all
Diseases No.
of % of all
cases
disease
cases
diseases
s
1. Malaria
79,065 63% Malaria
102,316 53.3%
2. A.R.I.
18,935 15.2% A.R.I.
34,002 18.04%
3. Diarrhea
12,737 10.3% Diarrhea
35,026 18.6%
4. Pneumonia 9,560 7.8% Pneumonia 7,649 4.06%
5. U.T.I
3,509 2.8% U.T.I
8,554
4.6%
6.
HIV/AIDS
575
0.3%
7.
TB
265
0.14%
Total
123,806 100%
188,387 100%
Top Outpatient Diagnoses 2002 in Geita District (Wagner 2003)
RANK
Disease
<5 YEARS
5 YEARS AND
ABOVE
No
of
% of all
No of
% of all
Cases
Diagnosis
Cases
diagnosis
GEITA 1
Malaria 2210 56.5% 1037 51%
2.
Diarrhea
247
6.3%
153
7.5%
3.
Pneumonia
632
16.1%
454
22.4%
4.
Anemia
771
19.7%
175
9%
5.
Meningitis 11 0.3% 25 0.05%
6.
Others
39
0.9%
184
9.07%
TOTAL
3910 100% 2028 100%
Top Inpatient Admission Diagnoses (Wagner 2003).
Source: District Medical Officer, Geita District
BGS Report CR/04/129 (Issue 1.0) for UNIDO Contract 03/088 MI-18
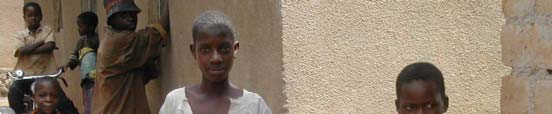
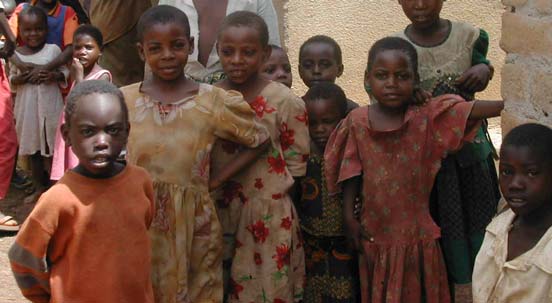
Children's health
A high proportion of the population in the area is children under the age of 12. The main
health problems of children in
Rwamagasa seem to be: High
exposure to mercury in the area.
Children to have access to fluid
mercury, they play with this
mercury with their hands. They live
within the houses where panning or
amalgam burning is carried out;
therefore they are also exposed to
mercury fumes.
Many children do not go to school.
Many children and teenagers work after school or at weekends. Children begin to work in this
area as young as 10 years. They work in the amalgamation and burning process with direct
contact to mercury.
28 children and teenagers were examined (age 10 to 17, average 15,4 years; 6 females, 22
males). 19 reported to work with mercury, 9 did not work with mercury. 7 reported to perform
burning of amalgam. The age they started to work was between 10 and 15 (average 13,4).
They were working between 1 and 6 six, on average 2,3 years.
This is child labor at its worst limits, partially physically very hard, partially related to high
exposure of mercury. Accidents related to work are a health hazard for these children.
Due to poor sanitary conditions infectious diseases like gastro-intestinal infections and
malaria are very common and are a risk for children's health.
BGS Report CR/04/129 (Issue 1.0) for UNIDO Contract 03/088 MI-19
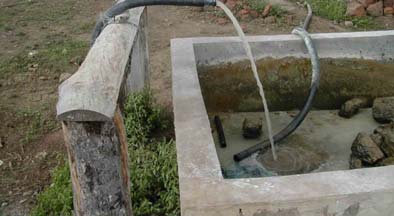
Hygienic and social problems
The interviews showed some other problems: The
hygienic condition is disastrous, only 625 out of
848 households have pit latrines (Wagner 2003).
Water is gained from boreholes, or wells. Water is
not safe due to inappropriate hygienic conditions,
and due to mercury leaking into the often-shallow
wells. The drinking water is sometimes turbid,
which is a sign of insufficient hygienic quality. Due
to mining activities there are many small pools in
the area. These pools are certainly an excellent habitat for transmitters of vector borne
diseases, like Malaria.
The main problem was the striking poverty of the population in the area. During the field
project the medical experts (pediatrician, gynecologist) and the pharmacist diagnosed,
referred or treated many people in Rwamagasa. Medication was provided free of charge to
the people. This medication was donated by two pharmacies in Munich free of charge
(Allacher Apotheke, St. Heinrich Apotheke). Our limits became very clear quickly. A 1 ˝ year
old child, suffering from a pneumonia and malaria came to our attention. The child was
already very sick, when the parents came to the dispensary in Katoro as the family did not
have the funds to obtain medical assistance nor medication. We organized the immediate
transport to Geita district hospital. But it was too late, the child died during the night. His
death is due to poverty, and not to the disease itself.
Many miners, as well as children are aware of the possibility of environmental and health
hazards due the use of mercury. But due to poverty and lacking job opportunities they
continue to use mercury. A more detailed report is Susan Wagner's "Socio-economic survey
of Rwamagasa mining site in Geita district".
Small-scale miners are mobile men with money, and they form a high-risk group for
spreading the virus in the community and into other areas. The AIDS / HIV topic needs to be
discussed further.
BGS Report CR/04/129 (Issue 1.0) for UNIDO Contract 03/088 MI-20

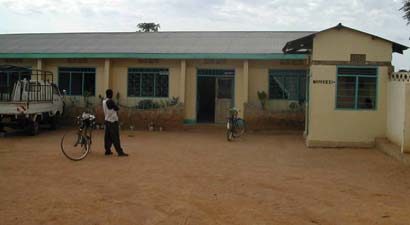

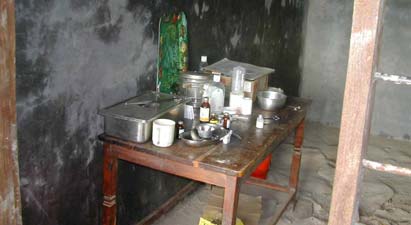
Clinical and neurological impression
The clinical impression was, that a fair amount of
workers from Rwamagasa showed severe
symptoms, well related to the classical picture of
mercury intoxication. They reported sleep
disturbances, excessive salivation, tremor and
metallic taste. Intentional tremor, mainly fine tremor
of eye lids, lips and fingers, ataxia,
dysdiadochokinesia and altered tendon reflexes
were observed. It should be noted that many workers from Rwamagasa were primarily very
healthy and strong young men (healthy worker effect).
Participants who worked for more than 5 to 10 years in the area seemed to have more
severe clinical symptoms. It is possible that we missed the most severe cases. Due to a lack
of a highly developed social system in Tanzania, some very sick workers might also have
moved back to their original homes and families elsewhere in Tanzania.
The health status of the children in the area is poor. Malnourished and undernourished small
children are common (Kwashiokor). Many children suffer from skin problems, diarrhea and
upper respiratory tract infections. Malaria is by far the most serious health hazard for children
in the area. Most children were physically fit, and
well socialized.
The control group in Katoro was healthy and did
not show any special health problems (41 people).
Katoro Health Center
BGS Report CR/04/129 (Issue 1.0) for UNIDO Contract 03/088 MI-21
BGS Report CR/04/129 (Issue 1.0) for UNIDO Contract 03/088 MI-22
Specimen Analysis and Statistical Results
(Gustav Drasch)
LABORATORY
METHODS
Material and sample storage
From 252 participants in Tanzania 252 blood samples, 249 urine samples and 212 hair
samples were taken. The blood samples were taken in EDTA-coated vials. The urine
samples were acidified with hydrochloric acid. To avoid de-gradation, all blood and urine
samples were stored permanently and transported by flight to Germany in an electric cooling
box. Until analysis these samples were stored continuously at 4 °C.
Sample preparation
Hair: As mentioned above, most people from the investigated area had thin, short and curly
hair. Therefore only extreme small hair quantities could be received for mercury analysis. In
most cases, just one working-up procedure could be performed from the total available hair
sample for the total mercury analysis. Another working up procedure with a second hair
sample for the determination of methyl-mercury (as planned) was not possible. Therefore a
method was developed to determine both total mercury and inorganic mercury in parallel
from one working-up procedure. For this, 20 mg 200 mg (if available) hair was cut in small
pieces and weight exactly. All mercury was extracted from the hair samples by shaking with
10 ml hydrochloric acid 6 N for 15h at room temperature in the dark. Parts of the elute were
analysed by CV-AAS with two different reduction agents (see below).
Intentionally washing steps with water, detergents or organic solvents like acetone were not
performed before the elution. Washing procedures with different solvents are frequently
applied before hair analyses with the aim to remove air-borne heavy metal pollution from the
surface of the hair. But as shown in literature, a distinct differentiation between air-borne and
interior mercury cannot be achieved which such washing procedures (Kijewski 1993).
Orientating pre-experiments with washing hair samples from burdened groups supported this
BGS Report CR/04/129 (Issue 1.0) for UNIDO Contract 03/088 MI-23
assumption. After washing some samples from the same strain, the results were not
reproducible. Therefore the hair samples were eluted without any further pre-treatment.
Blood, urine: Aliquots of up to 1.0 ml were analysed directly without further pre-treatment
(method see below).
Mercury determination and quality control
The total amount of mercury in the samples (blood, urine, elute from hair) was determined by
means of so-called cold-vapour atomic absorption spectrometry (CV-AAS), using a Perkin-
Elmer 1100 B spectrometer with a MHS 20 and an amalgamation unit, Perkin-Elmer,
Germany. Sodium-borohydride (NaBH4) was applied for the reduction of all mercury
(inorganic and organic bound). NaBH4 reduces inorganic mercury quicker than organic
bound mercury like methyl-mercury. Nevertheless it is possible with this method, to
determine the correct amount of total mercury, because all nascent mercury vapour is inter-
collected on a gold-platinum-net. In a second step the net is heated and all trapped metallic
mercury is released at once and could be quantified by CV-AAS. The accuracy of the method
for inorganic as well as organic mercury compounds was proved by inorganic and methyl-
mercury standard solutions. The determination limit for total Hg in blood or urine was 0.20
µg/l, for total Hg in hair 0.02 µg/g (calculated for a 100 mg hair sample).
In addition, in the elutes of the hair samples, the amount of inorganic mercury was
determined by CV-AAS, using a Lumex Zeeman mercury analyser RA-915+, Lumex Ltd., St.
Petersburg, Russia. This equipment operates with SnCl2 (tin-II-chloride) for reduction. With
this method, only inorganic mercury can be detected, because under acid conditions SnCl2
reduces only inorganic mercury and not organic bound mercury like methyl-mercury. This
was proven by inorganic mercury standards (which show a signal) and methyl-mercury
standards (which show no signal at all). The determination limit for inorganic Hg in hair is
0.05 µg/g (calculated for 100 mg hair).
All analyses were performed under strict internal and external quality control. The following
standard reference materials served as matrix-matched control samples: human hair powder
GBW No. 7601 (certified Hg 0.36 ± 0.05 µg/g) and Seronorm whole blood No. 201605
(certified Hg 6.8 8.5 µg/l). Since many years the lab participates successfully in external
quality control tests for mercury in human specimen.
BGS Report CR/04/129 (Issue 1.0) for UNIDO Contract 03/088 MI-24
STATISTICAL
ANALYSIS
Statistical methods
Statistics were calculated by means of the SPSS 9.0 programme (SPSS-software, Munich,
Germany). As expected, the mercury concentrations in the bio-monitors (blood, urine, hair)
were not distributed normally but left-shifted. Therefore in addition to the arithmetic mean
(only for comparison to other studies) the median (50% percentile) is given. For all statistical
calculations distribution-free methods like the Mann-Whitney-U-test for comparing two
independent groups, the Kruskal-Wallis-test for comparing n independent groups, the Chi-
square test for cross-tables or the Spearman rank test for correlation were used. "Statistically
significant" means an error probability below 5% (p < 0.05).
Some graphs were shows as so-called "box-plots". For a brief explanation: The "box"
represents the inter-quartile (this means from the 25% to the 75% percentile). The strong line
in the box is the median (50% percentile). The "whiskers" show the span. Outliners are
indicated by dots.
Description of mercury levels in urine, blood and hair
In table 1 the mercury concentrations of all analysed blood, urine and hair samples are
summarised. In all blood samples the mercury concentration was above the detection limit of
0.20 µg/L. In 30 urine samples the mercury concentration was below the detection limit of
0.20 µg/L. For statistical purposes, in these cases the value was set to ˝ of the detection
limit (0.10 µg/L). In all hair samples the content of total mercury was above the detection limit
(0.02 µg/g). In 123 cases the concentration of inorganic mercury was above the detection
limit of 0.05 µg/g. In these cases the concentration of organic bound mercury could be
calculated by the difference total Hg minus inorganic Hg (table 2).
For comparison the results of a recent study in a small scale gold mining area of the
Philippines (Drasch 2001) are reported in the same table; further, for blood and urine, the
result of a representative epidemiological study, performed 1990/92 in Germany, an
industrial country in Western Europe (Krause 1996). For a better comparison of the hair
values, recently published own data from Germany are cited (Drasch 1998). In recent
literature from Europe and Northern America similar Hg concentrations in blood, urine and
hair have been reported (Drasch 2004). From populations with a high consumption of methyl-
mercury-contaminated sea food like in Japan, the Faeroes Islands, the Seychelles or
BGS Report CR/04/129 (Issue 1.0) for UNIDO Contract 03/088 MI-25
Canadian Inuit higher Hg values in the bio-monitors have been reported recently e.g. on the
International Conferences on "Mercury as a Global Pollutant" 1996 in Hamburg, Germany,
1999 in Rio de Janeiro, Brazil and 2002 in Minamata, Japan (for literature in detail see
proceedings). From other areas with small scale gold mining like in the Amazon, Brazil,
mercury concentrations, comparable to the found levels, have been reported e.g. at these
congresses or summarised in the book "Mercury from Gold and Silver Mining: A Chemical
Time Bomb?" by de Lacerda and Salomons (1998).
BGS Report CR/04/129 (Issue 1.0) for UNIDO Contract 03/088 MI-26
This study
for comparison
Philippines
Tanzania
(gold mining
Germany
area)
Hg-blood (µg/l)
case number
252
323
3958
span
0.22 33.3
< 0.25 107.6
< 0.2 12.2
median
1.7
8.2
0.6
arithm.
mean
2.92
11.48
0.51
literature
(Drasch 2001)
(Krause 1996)
Hg-urine (µg/l)
case number
249
313
4002
span
< 0.20 - 224
< 0.25 294
< 0.2 53.9
median
1.18
2.5
0.5
arithm.
mean
6.82
11.08
1.11
literature
(Drasch 2001)
(Krause 1996)
Hg-urine
case number
248
313
4002
(µg/g crea)
span
< 0.20 106.6
< 0.1 196.3
< 0.1 73.5
median
0.79
2.4
0.4
arithm.
mean
3.85
8.40
0.71
literature
(Drasch 2001)
(Krause 1996)
total Hg-hair
case number
212
316
150
(µg/g)
span
0.08 48.74
0.03 37.76
0.04 2.53
median
0.55
2.72
0.25
arithm.
mean
1.62
4.14
literature
(Drasch 2001)
(Drasch 1998)
Table 1: Concentration of total mercury in blood, urine and hair
BGS Report CR/04/129 (Issue 1.0) for UNIDO Contract 03/088 MI-27
Tanzania
(this study)
organic Hg-hair
case number
123
(µg/g)
span
0.10 5.25
median
0.44
arithm.
mean
0.62
Table 2: Concentration of organic mercury in hair
All mercury concentrations in the different bio-monitors blood, urine and hair are highly
significant rank correlated (table 3 in appendix 1). Despite this, the individual values scatter
widely (see figures 8-10a).
Exclusion of data
From the total group 10 cases were excluded from further statistical analysis:
· 3 children below 10 years of age
· 4 seniors older than 59 years
· 3 participants with severe neurological diseases.
Their age or disease might have biased the result of their neurological investigations and/or
their neuro-psychological tests.
Nevertheless, for these 10 cases the decision about an individual diagnosis of mercury
intoxication (see below) was made as well .
BGS Report CR/04/129 (Issue 1.0) for UNIDO Contract 03/088 MI-28
Forming subgroups due to residence and occupation
To distinguish between the possible sources of mercury burden, we formed subgroups. The
remaining 242 participants were subdivided due to residence and occupation criteria. The
following subgroups were formed:
1. Katoro control group: 31 volunteers from Katoro, without special Hg burden.
2. Katoro, former occupational Hg burdened: 9 participants living in the control area of
Katoro, but have been former worked in the burdened area of Rwamagasa. As a
persistent Hg burden could not be excluded in these cases, there were separated from
the control group.
3. Rwamagasa, no Hg occupation: 24 participants, living in Rwamagasa without any
special occupational Hg-burden.
4. Rwamagasa, amalgam-burners: 99 amalgam-burners from the mining area (3-5 of
them may also melt gold).
5. Rwamagasa, other occupation: 67 workers (25 ball-millers, 28 miners, 14 children
working with mercury)
6. Rwamagasa, former occupational burdened: 12 retired workers, still living in the
mining area
In group 5 (other Hg occupation) ball-millers, miners and children, working with mercury
were compiled. A further differentiation to the sub-groups results in no further information,
because (i) most miners work on the ball-mills, too, and (ii) the number of the subgroups (25,
28, 14) are too small for a sound statistical evaluation. Furthermore, in non volunteer of
group 5 a mercury intoxication was diagnosed (see table 13).
Unless other indicated, all further statistical analysis was performed with these subgroups.
The mean age and the age distribution (figure 1) of all sub-groups are similar. As expected,
there is a surplus of males in the occupational burdened groups (amalgam-burners and
BGS Report CR/04/129 (Issue 1.0) for UNIDO Contract 03/088 MI-29
former occupational burdened volunteers) (table 4 in appendix 1). This gender difference
could not be controlled in field under the given conditions.
70
60
50
40
30
20
10
Age (years)
0
N =
31
9
24
99
67
12
Katoro control group
Rwama. not occup.
Rwama. other occup.
Katoro former occup.
Rwama. amalg.-burner
Rwama. former occup
Figure 1: Age distribution of all volunteers, selected for the statistical evaluation
In principle, alcohol abuse may bias the results, because alcohol abuse causes neurological
deficiencies similar to a mercury intoxication like tremor, ataxia, etc. There are no indications
for a higher rate of alcohol abuse, neither in the control area of Katoro nor in the burdened
area of Rwamagasa. The percentage of heavy drinker is similar (table 4 in appendix 1). This
self-information of the volunteers fits to the impression of the medical team in field. Moreover,
the alcohol consumption pattern of the intoxicated and non-intoxicated group (as classified
BGS Report CR/04/129 (Issue 1.0) for UNIDO Contract 03/088 MI-30
by us, see table 4 in appendix 1) does not differ on a statistical significant level (Chi-square
test).
Reducing of redundant data for statistical analysis
From the extremely large data volume (see appendix 2), collected in field by the medical
team, the relevant facts and test results were selected by pre-investigations (see table 4 in
appendix 1). Many test results were primarily scored (for instance: no, moderate, strong,
extreme). For the anamnestic and clinical data these results could be reduced to a yes/no
decision, which enables a statistical analysis and facilitates the readability of table 4 in
appendix 1 markedly without a relevant loss of information. The neuro-psychological data
(memory, match-box, Frostig, pencil tapping) was reduced according to a box-plot
procedure. With this procedure the results of the participants could be divided into three
categories: The best performing 25% of participants of each group were given a score of 0
points, the worst performing 25% of participants were given a score of 2 points and the
middle group of participants received a score of 1 point. In table 4 in appendix 1 the results of
the statistical analysis of the transformed anamnestic, clinical and neurological data versus
the different Hg-burdened subgroups, is shown. The significance of the differences was
calculated with Chi-square test. Grey marked fields contain results, differing from the control
group on a statistical significant level (p < 0.05, one-tailed).
BGS Report CR/04/129 (Issue 1.0) for UNIDO Contract 03/088 MI-31
Lack of Energy
30%
25%
20%
15%
10%
5%
0%
Katoro, control
group
Katoro, former
occupational
Rwamagasa, not
burdened
occupational
Rwamagasa,
burdened
amalgam-burner
Rwamagasa,
other
Rwamagasa.,
occupational
former
burdened
occupational
burdened
Figure 2: Frequency of the anamnestic statement "lack of energy"
Ataxia of Gait
20%
15%
10%
5%
0%
Katoro, control
group
Katoro, former
occupational
Rwamagasa, not
burdened
occupational
Rwamagasa,
burdened
amalgam-burner
Rwamagasa,
other
Rwamagasa.,
occupational
former
burdened
occupational
burdened
Figure 3: Frequency of the clinical parameter "ataxia of gait"
BGS Report CR/04/129 (Issue 1.0) for UNIDO Contract 03/088 MI-32
Dysdiadochokinesis
45%
40%
35%
30%
25%
20%
15%
10%
5%
0%
Katoro, control
group
Katoro, former
occupational
Rwamagasa, not
burdened
occupational
Rwamagasa,
burdened
amalgam-burner
Rwamagasa,
other
Rwamagasa,
occupational
former
burdened
occupational
burdened
Figure 4: Frequency of the clinical parameter "dysdiadochokinesia"
Bluish Disoloration of Gingiva
60%
50%
40%
30%
20%
10%
0%
Katoro, control
group
Katoro, former
occupational
Rwamagasa, not
burdened
occupational
Rwamagasa,
burdened
amalgam-burner
Rwamagasa,
other
Rwamagasa,
occupational
former
burdened
occupational
burdened
Figure 5: Frequency of the clinical parameter "bluish discoloration of gingiva"
BGS Report CR/04/129 (Issue 1.0) for UNIDO Contract 03/088 MI-33
Pathologic AS Reflexes
60%
50%
40%
30%
20%
10%
0%
Katoro, control
group
Katoro, former
occupational
Rwamagasa, not
burdened
occupational
Rwamagasa,
burdened
amalgam-burner
Rwamagasa,
other
Rwamagasa,
occupational
former
burdened
occupational
burdened
Figure 6: Frequency of the clinical parameter "pathologic achilles reflexes"
Match Box Test, grouped
100%
90%
80%
70%
60%
50%
14-18 sec
19-25 sec
40%
26-47 sec
30%
20%
10%
0%
Katoro, control
Katoro, former Rwamagasa, not
Rwamagasa,
Rwamagasa,
Rwamagasa.,
group
occupational
occupational
amalgam-burner other occupational
former
burdened
burdened
burdened
occupational
burdened
Figure 7: Matchbox test, grouped (blue is good, green is middle, red is bad).
BGS Report CR/04/129 (Issue 1.0) for UNIDO Contract 03/088 MI-34
In the figures 2-6 one subjective (lack of energy) and some objective (ataxia,
dysdiadochokinesia, bluish coloration of the gingiva, pathologic achilles reflexes) criteria,
typical for a chronic mercury burden are figured graphically. In table 7 the grouped results of
the matchbox test, a neuro-psychological test is shown. (For a quick explanation: In this test
matches have to be sorted in a box as quick as possible).
It is striking that in comparison to the control group from Katoro, many test results even from
the non occupationally Hg-burdened population, living in the burdened area of Rwamagasa
are considerably worse. The negative results increase even more in the occupational Hg-
burdened group of amalgam-burners. The results of the former occupational burdened
groups from Katoro and Rwamagasa should not be over-interpreted, due to the low case
numbers (9 and 12, respectively) and the missing homogeneity of these groups.
Scoring of medical results
The evaluation so far showed statistically significant medical test results versus the different
Hg-burdened subgroups. These significant medical test results are typical clinical signs of
chronic mercury intoxication, such as tremor, metallic taste, excessive salivation, sleeping
problems, memory disturbances and proteinuria (Drasch 1994, Kommission Human-
Biomonitoring 1999, Wilhelm 2000, Drasch 2004). Furthermore ataxia, dysdiadochokinesia,
pathological reflexes, co-ordination problems and concentration problems are clinical signs of
a damaged central and peripheral nervous system. For a further evaluation of these medical
results a medical score was established. The factors, included into this medical score and
the score-points per factor are shown in table 5. This score was developed from the results
of a mercury burdened group in a gold mining area in the Philippines (Drasch 2001) and
adopted by UNIDO, to get comparable results (Veiga 2003). The higher the score is in total,
the worse the health problems of a participant were.
Statistic testing of the different Hg-burdened subgroups versus the total medical score sum
showed once again significant results. The results are shown in table 4, appendix 1 and in
figure 8 graphically as a box-plot. The mean scores of all other groups are higher than the
control group from Katoro.
BGS Report CR/04/129 (Issue 1.0) for UNIDO Contract 03/088 MI-35
Test
Score Points
Anamnestic data
Metallic taste
0/1
Excessive salivation
0/1
Tremor at work
0/1
Sleeping problems at night
0/1
Health problems worsened since Hg exposed
0/1
Clinical data
Bluish coloration of gingiva
0/1
Ataxia of gait
0/1
Finger to nose tremor
0/1
Dysdiadochokinesia 0/1
Heel to knee ataxia
0/1
Heel to knee tremor
0/1
Mento-labial-reflex 0/1
Proteinuria 0/1
Neuro-psychological tests
Memory test
0/1/2
Matchbox test
0/1/2
Frostig test
0/1/2
Pencil tapping test
0/1/2
Maximum 21
Table 5: Anamnestic, clinical, neurological and neuro-psychological scoring scale
BGS Report CR/04/129 (Issue 1.0) for UNIDO Contract 03/088 MI-36
16
14
12
10
8
6
4
2
Medical Score Sum
0
N =
30
9
24
99
65
12
Katoro control group
Rwama. not occup.
Rwama. other occup.
Katoro former occup.
Rwama.amalg.-burner
Rwama. former occup.
Figure 8: Medical score sum of different sub-groups
Statistical analysis of mercury levels in urine, blood and hair
Statistical testing of the different Hg-burdened subgroups versus mercury concentration in
blood, urine and hair show significant results (table 3, figures 9 - 11a ). While the majority of
the values even of the burdened groups are in a moderate region, some amalgam-burners
show extreme high mercury concentration in the bio-monitors. These extreme values were
comparable to results from other studies from gold mining areas like the Philippines (Drasch
2001, Boese-O´Reilly 2002) or Brazil (Cleary 1994), but the frequency of such high burdened
persons was lower in Rwamagasa.
BGS Report CR/04/129 (Issue 1.0) for UNIDO Contract 03/088 MI-37
40
35
30
25
20
HBM II
15
10
HBM I
5
Hg-B (µg/L)
0
N =
31
9
24
99
67
12
Katoro control group
Rwama. not occup.
Rwama. other occup.
Katoro former occup.
Rwama. amalg.-burner
Rwama. former occup.
Figure 9: (Total) mercury concentration in blood
BGS Report CR/04/129 (Issue 1.0) for UNIDO Contract 03/088 MI-38
120
100
80
60
)
ea.
40
g cr
g/
µ
20
Lab (
g
-
U
H
0
N =
31
9
23
96
67
12
Katoro control group
Rwama. not occup.
Rwama. other occup.
Katoro former occup.
Rwama. amalg.-burner
Rwama. former occup.
Figure 10: (Total) mercury concentration in urine, determined in laboratory
40
30
HBM II
20
)
ea.
g cr
10
g/
µ
HBM I
Lab (
g
-
U
H
0
N =
31
9
23
96
67
12
Katoro control group
Rwama. not occup.
Rwama. other occup.
Katoro former occup.
Rwama. amalg.-burner
Rwama. former occup.
Figure 10a (expanded y-axis): (Total) mercury concentration in urine,
determined in laboratory
BGS Report CR/04/129 (Issue 1.0) for UNIDO Contract 03/088 MI-39
60
50
40
30
g/g)
20
10
total Hg in Hair (µ
0
N =
24
6
21
80
63
10
Katoro control group
Rwama. not occup.
Rwama. other occup.
Katoro former occup.
Rwama. amalg.-burner
Rwama. former occup.
Figure 11: Total mercury concentration in hair
5,0
4,0
3,0
2,0
1,0
total Hg in Hair (µg/g)
0,0
N =
24
6
21
80
63
10
Katoro control group
Rwama. not occup.
Rwama. other occup.
Katoro former occup.
Rwama. amalg.-burner
Rwama. former occup.
Figure 11a (expanded y-axis): Total mercury concentration in hair
BGS Report CR/04/129 (Issue 1.0) for UNIDO Contract 03/088 MI-40
As expected, the highest mercury concentration is found in the bio-monitors of the Hg-
occupational burdened group of amalgam-burners, followed by other inhabitants of the
Rwamagasa area. The mercury concentration in blood, urine or hair of the control group from
Katoro is in the same order of magnitude as in non-burdened populations in Western Europe
(see table 1). This is in contrast to the gold mining area of Mt. Diwata in the Philippines
(Drasch 2001, Boese-O'Reilly 2003), where an additional high nutritional burden with methyl-
mercury from fish and seafood was found. The reversal conclusion is that almost all mercury
in the burdened groups of Rwamagasa derived from gold mining activities. Some of the
retired workers, still living in Rwamagasa or now in Katoro, show still high mercury
concentrations in the bio-monitors.
20
18
16
14
12
10
8
6
4
2
inorganic Hg
µg Hg/ g Hair
0
organic Hg
Figure 12: Available speciation of mercury in hair of volunteers from all sub-groups
(n = 118)
BGS Report CR/04/129 (Issue 1.0) for UNIDO Contract 03/088 MI-41
Figure 12 shows the result of the mercury speciation in hair. It is striking that especially in
cases with higher total mercury concentration in hair most of this mercury is inorganic bound.
Only in some few cases a higher burden with organic bound mercury like methyl-mercury
was found at all. Just in one single case with a higher total mercury concentration (total Hg
6.28 µg/g, see figure 12) this consists predominantly (83.4%) of organic mercury.
100%
80%
60%
40%
20%
Organic Hg in Hair
0%
N =
5
12
60
36
Katoro control group
Rwama.amalg.-burner
Rwama. not occup.
Rwama. other occup.
Figure 13: Percentage of organic bound mercury in hair
Accordingly, the percentage of organic bound mercury in the hair samples of the control
group from Katoro is high (median 76.5 %) (figure 13). This means that most of the - low -
mercury burden in the control area derived from nutritional methyl-mercury. As expected, the
additional occupational burden of the amalgam-burners with (inorganic) mercury vapour
reduces the percentage of organic bound mercury in hair to a median value of 50.8 %. (The
BGS Report CR/04/129 (Issue 1.0) for UNIDO Contract 03/088 MI-42
two groups of the retired workers are not shown in figure 13, as the number of cases, in
which a speciation could be performed, was too low.)
Statistical analysis of mercury levels versus clinical data
Correlation tests between mercury concentrations in the bio-monitors and clinical data were
performed on the sub-group of the amalgam-burners only (n = 99). This group was selected,
because it was the highest burden group with highest mercury concentration in the bio-
monitors and highest frequency of health disturbances, characteristic for a mercury burden.
Performing the same analysis including all investigated persons, or all volunteers from
Rwamagasa, will just "water down" the results.
As can seen from the tables 6 -10, just some few of the medical data correlate significantly to
the Hg concentration in the bio-monitors (Chi-square-test, Spearman rank correlation).
BGS Report CR/04/129 (Issue 1.0) for UNIDO Contract 03/088 MI-43
Hg-Urin
Hg-Blood total
Hg-Hair MeHg-Hair
AnamnesticData
(µg/g crea.)
Male/female
- - - -
Age
- - - -
Alcohol
- - - -
consumption
Metallic taste
- - - -
Salivation
- - - -
Tremor daily
-
*
- -
Tremor at work
*
*
*
-
Sleeping
*
- - -
problems
Health problems
- - - -
worsened since
Hg exposed
Lack of appetite
-
*
- -
Sleep
- - - -
disturbances
Easily tired
- - - -
Loss weight
- - - -
Table 6: Significant correlations between anamnestic data and mercury concentration in bio-
monitors (group of amalgam-burners only, n = 99). * = p < 0.05.
BGS Report CR/04/129 (Issue 1.0) for UNIDO Contract 03/088 MI-44
Hg-Urine
Hg-Blood Total
Hg-
MeHg-Hair
AnamnesticData
(µg/g crea.)
Hair
Rest more
-
*
- -
Feel sleepy
-
*
*
-
Problems to start
things
-
*
- -
Lack of energy
*
*
- -
Less strength
- - - -
Weak
-
*
*
*
Problems with
-
*
- -
concentration
Problems to
*
*
- -
think clear
Word finding
- - - -
problems
Eyestrain
*
- - -
Memory
- - - -
problems
Feel nervous
*
- - -
Feel sad
- - - -
Headache
- - - -
Nausea
*
*
- -
Numbness
- - - -
Table 7: Significant correlations between anamnestic data and mercury concentration in bio-
monitors (group of amalgam-burners only, n = 99). * = p < 0.05.
BGS Report CR/04/129 (Issue 1.0) for UNIDO Contract 03/088 MI-45
Hg-Urine
Hg-Blood Total
Hg-Hair MeHg-Hair
Clinical Data
(µg/g crea.)
Bluish coloration
- - - -
of gingiva
Gingivitis
- - - -
Ataxia of gait
- - - -
Finger to nose
- - - -
tremor
Finger to nose
- - - -
dysmetria
Dysdiadocho-
- - - -
kinesia
Tremor of eyelid
- - - -
Field of vision
- - - -
Heel to knee
- - - -
ataxia
Heel to knee
- - *
-
tremor
PSR pathologic
- - - -
BSR pathologic
- - - -
ASR pathologic
- - - -
Babinski reflex
- - - -
prositive
Mento-labial
- - - -
reflex positive
Bradykinesia
- - - -
Hypomimia
- - - -
- - - -
Proteinuria
Table 8: Significant correlations between clinical data and mercury concentration in bio-
monitors (group of amalgam-burners only, n = 99) . * = p < 0.05.
BGS Report CR/04/129 (Issue 1.0) for UNIDO Contract 03/088 MI-46
Neuro-
Hg-Urine
Hg-Blood Total
Hg-
MeHg-Hair
psychological
(µg/g crea.)
Hair
test
Memory test
- - - -
Matchbox test
*
*
- -
Frostig test
- - - -
Pencil tapping
- - - -
test
Table 9: Significant correlations between neuro-psychological test classes and mercury
concentration in bio-monitors (group of amalgam-burners only, n = 99).
* = p < 0.05.
Medical Scores
Hg-Urine
Hg-Blood Total
Hg-
MeHg-Hair
(µg/g crea.)
Hair
Anamnestic
*
*
- -
score
Clinical score
- - - -
Neuro-
- - - -
psychological
test score
Medical score
*
- - -
sum
Table 10: Significant correlations between medical scores and mercury concentration in bio-
monitors (group of amalgam-burners only, n = 99). * = p < 0.05.
BGS Report CR/04/129 (Issue 1.0) for UNIDO Contract 03/088 MI-47
DISCUSSION OF THE STATISTICAL ANALYSIS
The relatively poor correlation of classic clinical signs of mercury intoxication to the mercury
concentrations in the bio-monitors (blood, urine, hair, MeHg hair) of the amalgam-burners
may be explained by factors like:
· The mercury concentration in the target tissues, especially the brain,
correlates to the mercury concentration in bio-monitors like urine, blood or
hair. This correlation is statistically significant and good enough to mirror
different burden of different groups (here e.g. workers, non-workers and
controls). But the inter-individual differences are so large that it is rather
pointless to conclude the heavy metal burden in the target tissue of an
individual from the concentration in the bio-monitors (Drasch 1997).
· Most of the amalgam-burners are chronically burdened by mercury and not
only acute. This means that a reversible or even irreversible damage of the
central nervous system may be set months or years before the actual
determination of the mercury concentration in the bio-monitors under a quite
different burden. The medical score sum distinguishes well between the
control group and Rwamagasa amalgam-burners. But former occupationally
exposed participants still show a high medical score median (see figure 8). So
even the bio-monitor values are lower (see figure 9 to 11) the symptoms,
expressed as medical score sum remain.
BGS Report CR/04/129 (Issue 1.0) for UNIDO Contract 03/088 MI-48
MERCURY LEVELS COMPARED TO TOXICOLOGICAL THRESHOLD LIMITS
In the international literature only a few threshold limits for mercury in bio-monitors are
recommended, especially for an at least predominant burden with mercury vapour, as could
be expected in the investigated population (Drasch 2004). Most studies in this field are
performed in populations with a exclusively methyl-mercury burden from fish or sea-food, like
the former data from Minamata, or the more recent data from the Seychelles (Davidson
1998), the Faeroes Islands (Grandjean 1997) or even from the Amazon (Grandjean 1999).
To estimate the toxicological relevance of the burden with predominantly mercury vapour of
the investigated population from Rwamagasa, the following threshold limits were used:
German human-bio-monitoring (HBM) values for mercury
In 1999 the German Environmental Agency ("Umweltbundesamt") published
recommendations for human-bio-monitoring-values (HBM) for mercury ("Kommission
Human-Biomonitoring" 1999).
The HBM I was set to be a "check value", this means an elevated mercury concentration in
blood or urine, above which the source of the Hg-burden should be searched and, as far as
possible, eliminated. But even by an exceeding of this HBM I the authors claimed that a
health risk is not to be expected.
In contrast to this, the (higher) HBM II value is an "intervention value". This means, at blood
or urine levels above HBM II, especially for a longer time, adverse health effects cannot be
excluded. Therefore interventions are necessary. On the one hand the source should be
found and reduced urgently. On the other hand a medical check for possible symptoms
should be performed. For hair, comparable values are not established, but the HBM II in
blood is directly derived from the assumption of a stable ratio of mercury in blood and hair
(1:300) and the result of the Seychelles study, where adverse effects could be seen at
mercury concentration in hair above 5 µg/g (Davidson 1998). Therefore this value was taken
in our study as an analogous value for HBM II for the toxicological evaluation of mercury
concentration determined in hair. It must be kept in mind, that this threshold limit in hair was
established in a population burdened with methyl-mercury from marine food and not with
BGS Report CR/04/129 (Issue 1.0) for UNIDO Contract 03/088 MI-49
mercury vapour, as is predominant in the Rwamagasa area of Tanzania, investigated in this
study.
Hg-blood (µg/l)
Hg-urine
Hg-urine
Hg-hair
(µg/l)
(µg/g crea)
(µg/g)
HBM I
5
7
5
HBM II
15
25
20
5 (in analogy)
US EPA
1
bench mark
WHO
50
7
BAT for metallic and
25 100
inorganic Hg
BAT for organic Hg
100
BEI (Biological
15
35
exposure index)
(after working)
(before working)
Table 11: Toxicologically established threshold limits for mercury in blood, urine and hair
(HBM = Human Bio-Monitoring; BAT = "Biologischer Arbeitsstoff-Toleranzwert" (biological
work-exposure tolerance limit); BEI = Biological Exposure Indices)
In 1991 the WHO expert group stated that mercury in urine is the best indicator for a burden
with inorganic mercury. The maximum acceptable concentration of mercury in urine was set
to 50 µg/l (WHO 1991). A distinct threshold for mercury in blood was not given. Mercury in
hair is widely accepted as best indicator for the assessment of contamination in populations
exposed to methyl-mercury (de Lacerda 1998). For this, a maximum allowable concentration
of 7.0 µg/g hair was set by the FAO/WHO. In 1997 the US EPA calculated the "benchmark
limit" for total Hg in hair to 1 µg/g. This benchmark was derived from a burden with methyl-
mercury from seafood and not with mercury vapour. US EPA has set a threshold limit for
mercury vapour in the ambient air, but not in bio-monitors (US EPA 1997).
All these limits and others, former published, are respected at the most recent
recommendation from the German Environmental Agency 1999, as cited above. The high
numbers of recently published investigations on mercury burdened populations from gold
mining areas like in South-America or by sea food like on the Faeroes Islands or the
BGS Report CR/04/129 (Issue 1.0) for UNIDO Contract 03/088 MI-50
Seychelles require a continuous re-evaluation of toxicologically defined threshold limits.
Therefore the international latest recommendation from the German Environmental Agency
was taken for further comparison. This was committed with UNIDO for the total global
programme, to get comparable results (Veiga 2003).
Occupational threshold limits (BAT, BEI)
Other toxicologically founded limits are occupationally threshold limits. Such limits are
established for mercury e.g. in the USA (biological exposure indices BEIs of the American
Conference of Governmental Industrial Hygienists) or Germany (BAT value, Deutsche
Forschungsgemeinschaft (German Scientific Community) 1999). For a better comparison
with the HBM-values (which are, to our knowledge, only established in Germany) the
German BAT-values for metallic and inorganic mercury are taken for this study. From the
definition, these BAT-values are exclusively valid for healthy adult workers under
occupational medical control. The occupational burden must be stopped, if this threshold is
exceeded. These occupational threshold limits are not valid for the total population,
especially not for risk groups like children, pregnant women, and older or ill persons.
Nevertheless, the BAT-values were taken for a further classifying of our highest results, too.
BAT-values for mercury are established only for blood and urine, but not for hair.
Table 11 gives an overview of the HBM-, BAT- and BEI-values. In Table 4 in appendix 1 the
percentage of the exceeding of the HBM II- and BAT-limits in the various population groups
of our study is summarised.
As shown in the next chapter the biological threshold limits should not be overestimated for
the diagnosis. Therefore the question, which of the limits is best for evaluating the results of
this study is only of secondary interest.
BGS Report CR/04/129 (Issue 1.0) for UNIDO Contract 03/088 MI-51
DECISION FOR THE DIAGNOSIS OF A CHRONIC MERCURY INTOXICATION
For the different Hg burdened groups (< HBM I; HBM I - HBM II; HBM II - BAT; > BAT) no
striking differences in the results of the medical and neuro-psychological tests could be seen
(for possible reasons, see above). Therefore at least a chronic mercury intoxication could not
be diagnosed on the basis of the blood, urine and/or hair concentration alone, to what values
ever the threshold limits are set (see above). An intoxication is defined by the presence of
the toxin in the body and typical adverse health effects. Deriving from this interpretation we
have tried to find a balanced result by the combination of mercury concentration in blood,
urine and hair and the negative health effects, as summarised in the medical score sum, as
described above in detail (Drasch 2001). The medical test scores were divided in three
groups, according to the quartiles (0-25%, 25-75%, 75-100%). Table 12 shows this
combination. This definition of mercury intoxication was committed with UNIDO, to get
comparable results in the different sites in the global project (Veiga 2003).
Medical Score Sum
0 4
5 9
10 - 21
Hg in all bio-monitors
< HBM I
> HBM I
+
Hg at least in one bio-monitor
> HBM II
+ +
>
BAT
+ + +
Table 12: Decision for the diagnosis "chronic mercury intoxication"
In principle this means, that the higher the mercury concentration in at least one of the bio-
monitors was, the lower the number of adverse effects for a positive diagnosis of a mercury
intoxication must be and vice versa.
Cases with only moderately elevated mercury levels (i.e. between HBM I and HBM II) are
taken for positive, too, if the medical test scores are in the upper quartile region (score sum
10-21).
BGS Report CR/04/129 (Issue 1.0) for UNIDO Contract 03/088 MI-52
The case, that a mercury concentration above the occupational threshold limit BAT alone
(this means without clinical signs, i.e. medical score 0-4) is responsible for the classification
of intoxication, can be neglected. All four cases found in this study in Tanzania with mercury
concentrations above the BAT value (3 amalgam-burners, 1 retired worker in Rwamagasa)
exceeded the medical score sum of 4 by far (individual medical sore sums: 7, 7, 10, 11)
PREVALENCE OF THE DIAGNOSIS "MERCURY INTOXICATION"
Group Total
Number of mercury
% cases, mercury
number
intoxicated cases
intoxicated
Katoro, control group
31
0
0 %
Katoro, former occupational
9 0
0
%
burdened
Rwamagasa, not occupational
23 (1) (4.2 %)
burdened
0
0 %
Rwamagasa,
99 25 25.3
%
amalgam-burners
Rwamagasa,
67 0
0
%
other occupational burden
Rwamagasa, former
12 (2) (16.7 %)
occupational burdened
3
20.0 %
Table 13: Frequency of mercury intoxication
By this classification the results shown in table 13 and figure 14 were obtained. As expected,
no volunteer from the control area of Katoro has been found to be mercury intoxicated. 25.3
% of the amalgam-burners in Rwamagasa have to be classified as mercury intoxicated. This
percentage is markedly lower, as we have found with the same protocol in the Mt. Diwata
region of the Philippines (Drasch 2001, Boese-O'Reilly 2003), where 85,4% (!) of the
BGS Report CR/04/129 (Issue 1.0) for UNIDO Contract 03/088 MI-53
amalgam-burners were classified to be mercury intoxicated. The difference cannot be
explained by a different, i.e. a safer burning technique in Rwamagasa. In Rwamagasa as on
Mt. Diwata the gold amalgam is burned in open crucibles, heated just on an open fire or by a
blowtorch, hold on it.
Diagnosis: Mercury Intoxication
30%
25%
20%
15%
10%
5%
0%
Katoro, control
group
Katoro, former
occupational
Rwamagasa, not
burdened
occupational
Rwamagasa,
burdened
amalgam-burner
Rwamagasa,
other
Rwamagasa,
occupational
former
burdened
occupational
burdened
Figure 14: Frequency of the diagnosis of mercury intoxication in the different sub-groups
Hg-Blood
Hg-Urine
t-Hg-Hair
MeHg-Hair
(µg/l)
(µg/g crea.)
(µg/g)
(µg/g)
N
25 25 20 18
median
8.6 13.2 4.1 0.8
maximum 33.3 36.8 48.7 5.3
Table 14: Mercury concentrations in biomonitors of the intoxicated amalgam burners (in
some cases hair samples were not available).
BGS Report CR/04/129 (Issue 1.0) for UNIDO Contract 03/088 MI-54
Table 14 shows the mercury concentrations in the bio-monitors of the intoxicated amalgam
burners.
Just 1 volunteer from Rwamagasa out of 23, which had declared to be not occupational
burdened was found to be intoxicated, too. This man had a total mercury concentration in
hair of 15.8 µg/g, while t-Hg-Hair of all other non-occupational burdened volunteers from
Rwamagasa (n = 22) did not exceed 2 µg/g. His Hg-U (4.7 µg/L) and Hg-B (1.9 µg/L) was
below HBM I. From this it can be assumed, that he was formerly occupational mercury
burdened but now a farmer, as indicated by him. Therefore this case should be shifted to the
group of former occupational burdened volunteers. In Rwamagasa none of the other 22 not
occupational burdened volunteers and none of the 67 volunteers occupationally burdened in
another way than amalgam burning (miners and ball millers) are found to be mercury
intoxicated. 2 (plus 1, see above) out of 12 retired workers in Rwamagasa have to be
classified as mercury intoxicated.
INFLUENCE ON NURSED BABIES
One major problem of mercury is a known adverse effect on the growing foetus and baby
due to a high maternal burden and a cross of mercury through the placenta or to the breast-
milk. High numbers of miscarriages, stillbirths and birth defects have been reported as
consequence of the mass intoxication with mercury in Minamata, Japan, 1956 or the Iraq,
1972/73 (Drasch 2004). This study in Tanzania was not designed to detect possible adverse
effects on the foetus, but as a side result some data on mercury in breast-milk samples were
obtained.
16 samples of mature breast-milk were collected and analysed for total mercury. In table 15
these cases are shown individually in decreasing order of the Hg concentration in the breast-
milk samples. For comparison: In some recent studies from Germany in samples from
mature breast-milk maximal mercury concentrations below 2 µg/L have been found (Drasch
1998). As expected, the one sample from the control group and the two from non-
occupational burdened mothers from Rwamagasa were well below this limit; most of the milk
samples from occupational burdened or former burdened mothers, too. But two out of five of
the breast-milk samples from active female amalgam-burners show extreme high mercury
BGS Report CR/04/129 (Issue 1.0) for UNIDO Contract 03/088 MI-55
concentrations (48.5 and 149.6 µg/L). Both mothers had been identified as "intoxicated" and
had high total mercury concentration in hair, too. As expected, most of the mercury in their
hair is inorganic (90.8% and 88.4%), deriving from a burden with mercury vapour. Therefore
these cases cannot be compared directly to mothers from the Seychelles or the Faeroes
Islands, which are predominantly burdened by methyl-mercury from fish. But even if most of
the mercury in these breast-milk samples is inorganic, it gives rise to great concern: A full
nursing of a baby with approximately 850 ml breast-milk per day with a Hg milk concentration
of 50 150 µg/L (as found in these amalgam-burners), results in a daily uptake of 40 to 120
µg inorganic mercury.
BGS Report CR/04/129 (Issue 1.0) for UNIDO Contract 03/088 MI-56
Hg-Breast
t-Hg-
Me-Hg-
Hg-U
Hg-B
Mother's
Mother
milk (µg/L)
Hair
Hair
(µg/L)
(µg/L)
Profession
intoxicated
(µg/g)
(µg/g)
149,6 21,75 2,01
3,1 11,36 Amalgam-burner
yes
48,5 40,83 4,72 20,35 11
Amalgam-burner
yes
7,25 0,63 0,22 2,05 2,35 Katoro former occup.
no
3,4 0,36 1,12 2,18
Rwamagasa other occup.
no
1,75 14 4,4 Amalgam-burner no
1,15 3,74 0,82 1,8 1,99
Rwamagasa other occup.
no
0,5 0,36 0,3 0,54 0,83
Rwamagasa other occup.
no
0,5 0,43
0,1 1,6
Rwamagasa other occup.
no
0,5 0,66 0,6 0,31 1,89
Rwamagasa other occup.
no
0,5 0,23
1,85
Amalgam-burner no
0,5 0,42 0,37 0,1 0,94 Amalgam-burner
no
0,5
0,36
0,1
1
Katoro control group
no
0,4 0,55
0,5 2,03
Rwamagasa other occup.
no
0,4 0,32 0,26 0,1 0,89
Rwamagasa not occup.
no
0,3 0,4 0,31 0,29 1,2
Rwamagasa other occup.
no
0,3 0,39
1,2 1,53
Rwamagasa not occup.
no
Table 15: (Total) mercury concentration in breast-milk samples, compared to other data from
the mothers.
BGS Report CR/04/129 (Issue 1.0) for UNIDO Contract 03/088 MI-57
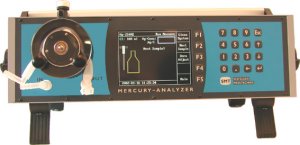
US EPA has calculated the so-called "Reference Dose" for inorganic mercury to 0.3 µg/ kg
body weight and day (US EPA 1997). For a 6 kg baby this means a maximum daily uptake of
1.8 µg inorganic mercury. The real uptake of these two babies of the amalgam-burners was
20 to 60 times higher. Moreover it must be considered that the absorption rate for inorganic
mercury especially from milk in the gastro-intestinal tract of babies is markedly higher than of
adults (Drasch 2004).
SCREENING OF MERCURY URINE CONCENTRATION IN FIELD
In field a mobile Hg analyzer (Hg-254 NE, Seefelder Messtechnik, Seefeld, Germany) was
used to screen for inorganic mercury in urine. In a baker, 1ml urine was diluted with 100 ml
water (bottled drinking water). A 2 ml solution of 10% tin(II)chloride in 6N hydrochloric acid
was added , the system closed, and the formed mercury vapour in the gas phase above the
liquid transferred in a closed loop to a quartz cell, where it was detected by atomic emission
spectrometry. Bottled drinking water (as to be got locally) was used for zero standard, and a
mercuric nitrate solution for standard. The limit for a quantitative detection was approximately
2 µg/L urine. As the HBM limits for Hg in urine are 7 and 25 µg/L, respectively (see table 11),
this method seems to be sufficient sensitive for urine Hg screening in the field. One analysis
lasts approximately 3 minutes. 231 urine samples could be analysed with this method in field.
At the last day in the control area of Katoro it was not possible to work with this system, due
to problems with an inadequate electric power supply.
BGS Report CR/04/129 (Issue 1.0) for UNIDO Contract 03/088 MI-58
300
200
100
50
40
30
20
10
5
4
3
2
inorg. Hg-U Field (µg/L)
1
1
2
3 4 5
10
20
30 40 50
10
2
300
00
0
total Hg-U Lab (µg/L)
Figure 16: Comparison of the concentration of inorganic Hg-U, as determined in field and the
total Hg-U concentration, as determined in the lab.
The correlation between the concentration of inorganic Hg, determined with this method in
field, and the concentration of total Hg, as determined in lab, was excellent (Spearman-ro = +
0.72, statistical highly significant). A scatter plot (figure 16) proves the sufficient
correspondence of both methods in the region above the detection limit of the field method (2
µg/L). It must kept in mind that with this field method just inorganic mercury can be detected.
But at least in the Rwamagasa area of Tanzania most of the mercury burden of men is
inorganic. Furthermore it is known, that inorganic mercury is much better urinary excreted
than organic bound mercury like methyl-mercury. From this it could be concluded that most
BGS Report CR/04/129 (Issue 1.0) for UNIDO Contract 03/088 MI-59
mercury in the urine samples has been in the inorganic form. Nevertheless, as expected, in
the mean the total mercury concentration in urine (as detected in the lab), was higher than
the inorganic mercury concentration determined in field (see regression line in figure 16).
All data from the medical investigations and from the urine screening were put during the
field project into an excel data sheet . The medical sum score could be calculated and 17
cases preliminary classified as "mercury intoxicated" by the combination of the medical sum
score and the Hg concentration in urine, as determined in field (according to table 12). From
the medical sum score and the final lab results, 16 out of these 17 intoxications could be
confirmed. Only in one case the primarily field diagnosis could not be confirmed. The total
number of finally (i.e. after the Hg determination in all three bio-monitors in the lab)
diagnosed intoxications from all cases was 29. In the remaining 12 cases, the intoxication
was diagnosed by elevated Hg concentrations in blood and/or hair. Overall, the urine
mercury screening during the field project has proved to be a sound method to get quick
information during the field project on the order of magnitude of the mercury burden of sub-
groups of the population. Together with a computer based evaluation of the medical results
during the field project it was possible in more than one half of the cases to find out mercury
intoxicated individuals just during the field mission and to give a primarily estimation of the
local burden situation.
BGS Report CR/04/129 (Issue 1.0) for UNIDO Contract 03/088 MI-60
Summary and Recommendations
(G. Drasch and S. Boese-O´Reilly)
SUMMARY
Rwamagasa is a typical small-scale mining village with approximately 27.000 inhabitants in
Geita District, near Lake Victoria/Tanzania. Artisanal small-scale miners use mercury to
extract the gold from the ore. It is estimated that approx. 150.000 to 300.000 people work
and live in similar small scale mining communities all over Tanzania.
There is no clean and safe drinking water, no waste disposal for the toxic mercury or any
other waste or human discharge. Hygienic standards are extremely low and are a reason for
many infectious diseases such as diarrhoea, typhoid and parasitism.
Road accidents, accidents in insecure tunnels and amalgamation plants, malaria,
tuberculosis, and sexually transmitted diseases including AIDS are the dominant causes of
morbidity and mortality. No health service exists for the mining community.
The extraction of the gold with liquid mercury releases serious amounts of mercury,
especially high toxic mercury fumes into the local environment. The health status of 211
volunteers in Rwamagasa and 41 from a near by control area in Katoro was assessed with a
standardised health assessment protocol from UNIDO (Veiga 2003) by an expert team from
the University of Munich/Germany in October/November 2003.
The mercury levels in the bio-monitors urine, blood and hair were statistically significant
higher in the exposed population in Rwamagasa then in the control group, but only amalgam-
burners showed mercury levels above the toxicological threshold limit HBM II in urine, blood
and hair. Mainly inorganic mercury contributes to the high body burden of the workers.
Typical symptoms of mercury intoxication were prevalent in the exposed group. The medical
score sum plus the bio-monitoring results made it possible to diagnose in 25 out of 99
amalgam-burners the diagnosis of a chronic mercury intoxication, and in 3 out of 15 former
amalgam-burners. Within the other population in Rwamagasa and in the control group there
was no case of a mercury intoxication. The percentage of intoxications among amalgam-
BGS Report CR/04/129 (Issue 1.0) for UNIDO Contract 03/088 MI-61
burners was lower in Rwamagasa than e.g. in the comparable small scale gold mining area
of Mt. Diwata in the Philippines, where 85.4 % of the amalgam-burners were intoxicated
(Drasch 2001). The difference cannot be explained by a different, i.e. a safer burning
technique in Rwamagasa. Moreover, it must kept in mind, that the maximal burden (as
expressed in the top mercury concentrations found in the bio-monitors) was comparable to
Mt. Diwata. The impression in the field was that this difference may be explained just by a
lower consumption of liquid mercury in Rwamagasa, due to a lower output of gold from the
ore. This results in a lower number of higher burdened, intoxicated persons.
Child labour in the mining sites is very common from the age of 10 on, the children work and
play with their bare hands with toxic mercury. Mercury can cause severe damage to the
developing brain.
Nursed babies of amalgam-burning mothers are at special risk. In two out of five breast-milk
samples of nursing amalgam-burners extremely high mercury concentrations were detected.
In addition to a placental transfer of mercury during pregnancy from the mother to the foetus
(as has been proved in other studies) this high mercury burden of nursed babies give rise to
great concern.
Poverty is the main reason of the disastrous health status of the small-scale mining
communities. Struggling for pure survival makes mining for gold a necessity to find any
financial resource. The daily fight of survival makes the miners put their own health and the
health of their children at risk.
A reduction of the release of mercury vapours from small-scale gold mining like in Tanzania
into the atmosphere will not only reduce the number of mercury intoxicated people in the
mining area proper. It will reduce the global pollution of the atmosphere with mercury,
because most of the mercury vapour formed by open burning of gold amalgam is not
deposited locally, but is transported by air on long-range distances all over the globe
(Lamborg 2002). The total release of mercury vapour from gold mining is estimated today up
to 1,000 metric tons per year (MMSD 2002), while from all other anthropogenic sources
approximately 1.900 tons were released into the atmosphere (Pirrone 2001).
The primary result is, that mercury is a serious health hazard in the small-scale gold mining
area of Rwamagasa. Working for many years in the amalgamation or burning process,
especially amalgam-burning resulted in severe symptoms of mercury intoxication. The
exposure of the whole community to mercury is reflected in raised mercury levels in the
BGS Report CR/04/129 (Issue 1.0) for UNIDO Contract 03/088 MI-62
urine, and first symptoms of brain damage like ataxia, tremor and movement disorders. In
25% of the amalgam-burners from Rwamagasa a mercury intoxication (according to the
definition of UNIDO (Veiga 2003)) was diagnosed. Some of the former occupational
burdened persons were intoxicated, too. People from Rwamagasa, not directly involved in
amalgam burning, are higher mercury burdened than the control group, but at least in the
majority, still not intoxicated. The background burden in the control group is in the same
order of magnitude as in western industrial countries.
RECOMMENDATIONS
How to improve General Health?
Poverty is the main reason for all health and environmental problems.
· At the moment it does not seem to be acceptable that children live in Rwamagasa.
Missing sanitary standards and high exposure to mercury are the main reasons. Sanitary
standards need urgent improvement.
· The occupational related health risk of mining should be assessed in more detail
(accidents, malaria, drinking water quality, sexually transmitted diseases, tuberculosis,
HIV / AIDS). One first step to reduce the health hazards in Rwamagasa might be a proper
zoning into industrial areas, commercial areas and housing areas. And imposing basic
hygienic standards, such as proper drinking water and reduction of Anopheles
mosquitoes.
· To reduce the obvious risk of accidents in mining sites, raising awareness is necessary.
Introducing proper mining techniques is necessary (e.g. tunnel safety).
· The risk of sexually transmitted diseases could be reduced, if campaigns for safer sex
were more effective.
· To improve the health status of the communities a proper health service is urgently
required.
BGS Report CR/04/129 (Issue 1.0) for UNIDO Contract 03/088 MI-63
How to reduce Mercury as a Health Hazard?
Referring to the clinical testing and laboratory results, mercury is a major health hazard in the
area. Some first suggestions are:
· Child labour with highly toxic substances must be stopped immediately. Legal restrictions
on child labour need to be immediately implemented.
· Women in childbearing age need special information campaigns on this risk of mercury to
the foetus and the nursed baby.
· The participants with intoxication need medical treatment. It is necessary to build up a
system to diagnose and treat mercury related health problems in the area. Capacity
building including establishing laboratory facilities to analyse mercury in human
specimens is required. The financial aspect of treatment and legal problem of importing
drugs (chelating agents like DMPS or DMSA, to sweep mercury out of the body) need to
be solved. Funding of preventive campaigns and for treatment facilities is now needed.
· Training programs for the health care providers in the district in Geita and other health
centres in mining areas to raise awareness of mercury as a health hazard.
· Clinical training of local health workers, including a standardised questionnaire and
examination flow scheme (MES = mercury examination score)
· Mercury ambulance: A mobile ,,mercury ambulance" might easier reach small-scale
miners, than any local health office. A bus could be used as a mobile mercury ambulance.
Equipped with the necessary medical and laboratory utensils, the bus could be driven into
the mining areas. Two or three specially trained doctors or nurses could perform the
examinations, and begin to carry out treatment. The bus could also be used for health
awareness programs (e.g. video equipment). Miners in remote areas might welcome any
evening entertainment. Soccer videos might attract more miners to the bus, than much
other information material. Why not ask e.g. sponsors for such a bus (or truck).
How to improve the Knowledge on Mercury as a Health Hazard
· Assessing in a different study design the possibility of mercury related birth and growth
defects, increased abortion/miscarriage rates, infertility problems, learning difficulties in
childhood or other neuro-psychological problems related to mercury exposure
BGS Report CR/04/129 (Issue 1.0) for UNIDO Contract 03/088 MI-64
· Assessing in a different study in more detail the possible transfer of mercury from mother
to child via breast-milk and related possible adverse health effects. Females at
childbearing age and before need urgently more awareness to refrain from amalgam
burning, at least during pregnancy and nursing. If this is not possible, a discussion
whether to provide them with milk powder and mercury free water (!), and training them to
prepare hygienically unobjectionable formula food for their babies needs to be based on a
larger data base and a different epidemiological approach.
How to reduce the Release of Mercury into the Environment
· The exposure to mercury for the miners and the community has to be drastically
decreased. Proper mining techniques to reduce the burden of accidents and mercury
exposure are essentially needed. Small-scale miners need all possible support to
introduce cleaner and safer gold mining and extraction technologies.
· The exposure with mercury is avoidable with such simple technology as retorts. Technical
solutions need to go hand in hand with awareness raising campaigns.
· To improve the social, health and environmental situation of artisanal small-scale gold
miners an alliance of local, regional, governmental and intergovernmental bodies is
needed. Cooperation between health and environmental sectors is needed on local,
regional, national and intergovernmental level. E.g. UNIDO and WHO in Dar es Salaam
could form a nucleus of a national mercury task force.
BGS Report CR/04/129 (Issue 1.0) for UNIDO Contract 03/088 MI-65
Literature:
Aaseth J, Jacobsen D, Andersen O, Wickstrom E (1995) Treatment of mercury and lead
poisoning with dimercaptosuccinic acid and sodium dimercaptopropane-sulfonate: A review.
Analyst 120, 23-38
Achmadi UF (1994) Occupational exposure to mercury at the gold mining: a case study from
Indonesia. In: Environmental mercury pollution and its health effects in Amazon River Basin.
National Institute Minamata Disease and Inst. Biophysics of the University Federal do Rio de
Janeiro. Rio de Janeiro, pp 10-16
Akagi H et al (1994) Methyl-mercury pollution in Tapajós River Basin, Amazon. Environ Sci
3, 25-32
Akagi H, Castillo E, Maramba N, Francisco AT (1999) Health assessment for mercury
exposure among children residing near a gold processing and refining plant. Proc. of the Int
Conference Mercury as a Global Pollutant, Rio de Janeiro, Brazil, p. 421
Aposhian HV et al (1995) Mobilization of heavy metals by newer, therapeutically useful
chelating agents. Toxicology 97, 23-38
Barbosa AC et al (1995) Mercury contamination in the Brazilian Amazon. Environmental and
occupational aspects. Water Air Soil Pollut 80, 109-121
Boese-O'Reilly S, Drasch G, Beinhoff C, Maydl S, Vosko MR, Roider G (2003): The Mt.
Diwata Study on the Philippines 2000 - treatment of mercury intoxicated inhabitants of a gold
mining area with DMPS (2,3-Dimercapto-1-propane-sulfonic acid, Dimaval ®). The Science
of the Total Environment, 307, 71-82
Boischio AAP, Henshel D, Barbosa AC (1995) Mercury exposure through fish consumption
by the upper Madeira River population, Brazil. Ecosyst Health 1,177-192
Branches FJP, Erickson T, Aks SE, Hryhorczuk DO (1993) The price of gold: mercury
exposure in the Amazon Rain Forest. J Clin Toxicol 31, 295-306
Câmara VM (1994) Epidemiological assessment of the environmental pollution by mercury
due to gold mining in the Amazon River Basin. In: Environmental mercury pollution and its
health effects in Amazon River Basin. National Institute Minamata Disease and Inst.
Biophysics of the University Federal do Rio de Janeiro. Rio de Janeiro, pp 80-84
BGS Report CR/04/129 (Issue 1.0) for UNIDO Contract 03/088 MI-66
Castillo ES, Maramba NFC, Akagi, H, Francisco-Rivera ATT (1999) Quality assurance of
blood mercury levels among schoolchildren exposed to elemental mercury in Apokon,
Tagum, Davao del Norte, Philippines, 1998. Proc. of the Int Conference Mercury as a Global
Pollutant, Rio de Janeiro, Brazil, p. 422
Castro MB, Albert B, Pfeiffer WC (1991) Mercury levels in Yanomami indians hair from
Roraima, Brazil. Proceedings 8th Int. Conference Heavy metals in the environment.
Edinburgh 1, 367-370
Cichini G et al (1989) Effekt von DMPS und D-Penicillamin bei inhalativer Intoxikation mit
metallischem Quecksilber. Intensivmed Notf Med 26, 303-306
Cleary D et al. (1994) Mercury in Brazil. Nature, 613-614
Davidson PW et al (1998) Effects of prenatal and postnatal merthylmercury exposure from
fish consumption on neurodevelopment. J Am Med Assoc 280, 701-707
de Lacerda L, Salomons W (1998) mercury from Gold and Silver Mining: A Chemical Time
Bomb? Springer, Berlin, Heidelberg
Deutsche Forschungsgemeinschaft (ed) (1999) MAK- und BAT-Werte-Liste 1999. VCH-
Verlagsgesellschaft, Weinheim, Germany
Drasch G (1994): Mercury. In: Seiler HG, Sigel A, Sigel H (eds.): Handbook on metals in
clinical and analytical chemistry. New York: Marcel Dekker, 479-494.
Drasch G et al. (1997) Are blood, urine, hair, and muscle valid bio-monitoring parameters for
the internal burden of men with the heavy metals mercury, lead and cadmium? Trace Elem
Electrolytes 14, 116-123
Drasch G, Aigner S, Roider G, Staiger F, Lipowsky G (1998) Mercury in Human Colostrum
and Early Breast Milk. Ist Dependence on Dental Amalgam and other Factors. J Trace Elem
Med Biol 12, 23-27
Drasch G, Boese-O´Reilly S, Maydl S, Roider G (2002): Scientific comment on the German
human biological monitoring values (HBM values) for mercury. International Journal Hygiene
Environmental Health 205, 509-512.
Drasch G, Boese-O'Reilly S, Beinhoff C, Roider G, Maydl S (2001): The Mt. Diwata study on
the Philippines 1999 - assessing mercury intoxication of the population by small scale gold
mining. The Science of the Total Environment 267, 151-168
BGS Report CR/04/129 (Issue 1.0) for UNIDO Contract 03/088 MI-67
Drasch G, Horvat M, Stoeppler M (2004) Mercury. in: Merian E, Anke M, Ihnat M, Stoeppler
M (eds.) Elements and their Compounds in the Environment, Vol. 2. Wiley-VHC Verlag,
Weinheim, Germany
Florentine MJ, Sanfilippo DJ (1991) Elemental mercury poisoning. Clin Pharm 10, 213-221
Forsberg BR et al. (1994) High levels of mercury in fish and human hair from the Rio Negro
basin (Brazilian Amazon): natural background or anthropogenic. In: Environmental mercury
pollution and its health effects in Amazon River Basin. National Institute Minamata Disease
and Inst. Biophysics of the University Federal do Rio de Janeiro. Rio de Janeiro, pp 33-39
Gonzalez-Ramirez et al (1998) DMPS (2,3-Dimercaptopropane-1-sulfonate, Dimaval)
Decreases the Body Burden of Mercury in Humans Exposed to Mercurous Chloride. J
Pharmacol Exp Therap 287, 8-12
Grandjean P et al (1997) Cognitive deficit in 7-year-old children with prenatal exposure to
methyl-mercury. Neurotoxicol Teratol 19,417-428
Grandjean P et al (1999) Methyl-mercury Neurotoxicity in Amazonian Children Downstream
from Gold Mining. Environ Health Perspect 107, 587-591
Kijewski H (1993) Die forensische Bedeutung der Mineralstoffgehalte in menschlichen
Kopfhaaren. Schmidt Roemhild Verlag, Lübeck, Germany
Kommission Human-Biomonitoring des Umweltbundesamtes Berlin - Institut für Wasser-,
Boden- und Lufthygiene des Umweltbundesamtes (1999) Stoffmonographie Quecksilber -
Referenz- und Human-Biomonitoring-Werte (HBM). Bundesgesundheitsblatt: 42:522-532.
Krause C et al (1996) Umwelt-Survey 1990/92, Studienbeschreibung und Human-
Biomonitoring. Umweltbundesamt Berlin, Germany (ed.)
Lamborg CH, Fitzgerald WF, O'Donnell J, Torgersen T (2002) A non-steady-state
compartment model of global-scale mercury biogeochemistry with interhemispheric
gradients. Geochim Cosmochim Acta 66:1105-1118.
Lockowandt O (1996) Frostigs Entwicklungstest der visuellen Wahrnehmung. Weinheim:
Beltz
Malm O et al (1995a) Mercury and methyl-mercury in fish and human hair from Tapajós
River Basin, Brazil. Sci Tot Environ 175, 127-140
Malm O et al (1995b) An assessmant of Hg pollution in different gold mining areas, Amzon,
Brazil. Sci Tot Environ 175, 141-150
BGS Report CR/04/129 (Issue 1.0) for UNIDO Contract 03/088 MI-68
Malm O, Pfeiffer WC, Souza CMM, Reuther R (1990) Mercury pollution due to gold mining in
the Madeira River Basin, Brazil. Ambio 19,11-15
Masur H, Papke K, Althoff S, Oberwittler C (1995) Skalen und Scores in der Neurologie.
Thieme, Stuttgart
MMSD (2002) Breaking New Ground: Mining, Minerals, and Sustainable Development.
International Institute for Environment and Development. Earthscan Publications Ltd, London, UK.
As available at http://www.iied.org/mmsd/finalreport/index.html per September 2002.
Pirrone N, Munthe J, Barregĺrd L, Ehrlich HC, Petersen G, Fernandez R, Hansen JC, Grandjean
P, Horvat M, Steinnes E, Ahrens R, Pacyna JM, Borowiak A, Boffetta P, Wichmann-Fiebig M
(2001) Ambient Air Pollution by Mercury (Hg) Position Paper. Office for Official Publications of
the EC. (available on http://europa.eu.int/comm/environment/air/background.htm#mercury).
Ramirez GB, Vince Cruz CR, Pagulayan O, Ostrea E, Dalisay C (1999) The Tagum study I:
Mercury levels in mother's blood, transitional milk, cord blood, baby's hair and meconium.
Pediatrics, submitted for publication
US EPA (1997) Mercury study report to congress. US EPA, Washington, D.C.
Veiga M, Baker R (2003): Protocols for Environmental and Health Assessment of Mercury
Released by Artisanal and Small-Scale Gold Miners. UNIDO, Vienna.
Wagner S (2003): Socio-economic survey of Rwamagasa mining site in Geita district.
UNIDO, Dar es Salaam
WHO (1980) Recommended health based limits in occupational exposure to heavy metals.
Technical Series Report No 647, Geneva
WHO (1991) Environmental Health Criteria 118: Inorganic Mercury. Geneva
Wilhelm M (2000): Quecksilber In Boese-O´Reilly S, Kammerer S, Mersch-Sundermann V,
Wilhelm M: Leitfaden Umweltmedizin, 2. Auflage. Urban und Fischer, München
World Economic Forum (WEF) (2002): Global Health Initiative: Private Sector Intervention
Case example. Partnering with African Medical and Research Foundation (AMREF) to offer
HIV prevention and care for 1.500 workers and 120.000 community members for US$ 62 per
worker per year. www.weforum.org/globalhealth.
Zimmer R, Volkamer M (1984) MOT - Motoriktest. Beltz, Weinheim
BGS Report CR/04/129 (Issue 1.0) for UNIDO Contract 03/088 MI-69
Acknowledgement
We would like to thank Dr. Christian Beinhoff and Marcello Veiga from UNIDO/ Vienna for
their tremendous support and patience. For their support and understanding we thank very
much Mr. Felix Ugbor and Victor Akim from UNIDO Dar es Salaam.
Our national project manager Mr. Tesha receives a very special thank you, since he
organized and was responsible for the excellent performance of the field project. All the other
staff from the Department of Ministry of Energy and Minerals was very helpful and
supportive.
For all their help and understanding we would like to thank very much all the people from the
Local Health Office, especially Mrs. Mwajuma Libuburu, Mr. Sosthenes T. Mchunguzi, Mrs.
Asila Rashid; Mrs. Felister Malima. Without their tremendous and excellent work the field
project would not have been successful. Also would we like to thank the district nursing
officer, Mrs. Cathleen Mapunda and the district medical officer Dr. Francis Mwanisi that they
enabled such successful field work.
Mr. Ludwig Watson Rodriquez from Blue Reef Mining Company receives a special thank you
for his office buildings and cooperation.
Omari S. Makula and William Smith were excellent drivers.
In Munich we want to thank very much Dr. Gabriele Roider and Beate Lettmeier in the
Institute of Forensic Medicine for their great help preparing the mission, and analysing all
samples from Tanzania.
Thank you as well to Mrs. Sigrid-Renate Drasch (Allacher Apotheke, Munich) and Mr. and
Mrs. Koller (St. Heinrich Apotheke, Munich) for the donation of very useful medication. A very
special thank to Michelle O´Reilly, who helped very much to make this report readable.
Finally we would like to thank all participants of the medical examinations and we hope to be
able to improve their future living circumstances.
BGS Report CR/04/129 (Issue 1.0) for UNIDO Contract 03/088 MI-70
Appendix 1:
ro = + 0.75
Hg-B
**
(N = 248)
ro = + 0.70
ro = + 0.78
t-Hg-Hair
**
**
(N = 208)
(N = 212)
ro = + 0.70
ro = + 0.70
ro = + 0.88
inorganic-Hg-Hair
**
**
**
(N = 121)
(N = 123)
(N = 123)
ro = + 0.40
ro = + 0.53
ro = + 0.72
ro = + 0.42
organic-Hg-Hair
**
**
**
**
(N = 121)
(N = 123)
(N = 123)
(N = 123)
Hg-U Lab
Hg-B t-Hg-Hair
inorganic-Hg-Hair
(µg/ g crea)
Table 3: Spearman' rank correlations (ro) between the mercury concentration in the different bio-monitors.
** = p < 0.01 (one-tailed), N = case number
BGS Report CR/04/129 (Issue 1.0) for UNIDO Contract 03/088
MI-71
Value or
Katoro
Rwamagasa
Data or Test
score
(Control Area)
(Burdened Area)
former
not
other
former
control group occupational occupational
amalgam-
occupational occupational
burdened
burdened
burners
burdened
burdened
Case
number
31 9 24 99 67 12
Anamnestic
data:
Male/female
12/19
6/3
11/13
82/17
35/32
9/3
Mean
age
(years) 32.4 32.4 29.7 34.6 29.4 34.8
Heavy alcohol drinker
0/1
6.5%
11.1%
4.2%
8.1%
6.0%
8.3%
Metallic taste
0/1
3.2%
0%
8.3%
4.0% 3.0% 0%
Salivation
0/1 16.1% 22.2% 8.3% 29.3% 13.4% 16.7%
Tremor at work
0/1
9.7%
0%
4,2%
21.2%
6.0%
8,3%
Sleeping
problems 0/1 19.4% 22.2% 20.8% 28.3% 22.4% 25.0%
Health problems
0/1 0% 0% 0% 21.2%
6.0%
16.7%
worsened since Hg
exposed
Value or
Katoro
Rwamagasa
Data or Test
score
(Control Area)
(Burdened Area)
BGS Report CR/04/129 (Issue 1.0) for UNIDO Contract 03/088
MI-72
former
not
other
former
control group occupational occupational
amalgam-
occupational occupational
burdened
burdened
burners
burdened
burdened
Case
number
31 9 24 99 67 12
Anamnestic
data:
Lack of appetite
25.8%
33.3%
20.8%
34.3%
14.9%
25.0%
Loss of weight
0
0
0
1.0%
1.5%
0
Easily tired
22.6%
33.3%
33.3%
52.5%
31.3% 25.0%
Rest more
19.4%
11.1%
8.3%
24.5%
30.3%
8.3%
Feel
sleepy
12.9% 22.2% 8.3% 20.2% 20.9% 25.0%
Problems to start
0 0 8.3%
9.2%
4.5%
16.7%
things
Lack of energy
9,7%
11,1%
20,8%
25.3%
28.4%
16,7%
Less strength
9,7%
11,1%
12,5%
25.3%
22.4% 16,7%
Weak
12.9%
33.3%
25.0%
24.5%
31.3%
16.7%
BGS Report CR/04/129 (Issue 1.0) for UNIDO Contract 03/088
MI-73
Value or
Katoro
Rwamagasa
Data or Test
score
(Control Area)
(Burdened Area)
former
not
other
former
control group occupational occupational
amalgam-
occupational occupational
burdened
burdened
burners
burdened
burdened
Case
number
31 9 24 99 67 12
Anamnestic
data:
Problems with
9.7%
0
8.3% 20.2% 14.9% 16.7%
concentration
Problems to
9.7% 0 12.5%
22.2%
19.4% 16.7%
think clear
Word finding problems
0
0
0
8.1%
0 0
Eyestrain
16.1%
33.3%
16.7%
38.4%
28.4% 33.3%
Memory problems
32.3%
11.1%
20.8%
43.4%
23.9%
0
Feel nervous
16.1%
11.1%
12.5%
19.2%
9.0%
0
Feel sad
22.6%
22.2%
25.0%
43.4%
31.3% 25.0%
Headache
61.3% 77.8% 58.3% 47.5% 52.2% 50.0%
Nausea
29.0% 33.3% 33.3% 26.3% 19.4% 25.0%
Numbness
35.5% 44.4% 25.0% 40.4% 38.8% 50.0%
BGS Report CR/04/129 (Issue 1.0) for UNIDO Contract 03/088
MI-74
Value or
Katoro
Rwamagasa
Data or Test
score
(Control Area)
(Burdened Area)
former
not
other
former
control
occupational occupational
amalgam-
occupational occupational
group
burdened
burdened
burners
burdened
burdened
Case
number
31 9 24 99 67 12
Clinical
data:
Bluish coloration
0/1 16,1% 44,4%
58,3%
36.4%
44.8%
50,0%
of gingiva
Gingivitis
0
0
0
3.0%
0
0
Ataxia of gait
0/1
3,2%
11,1%
12,5%
17.2%
10.4% 8,3%
Finger to nose tremor
0/1
9,7%
11,1%
4,2%
14.1%
4.5%
8,3%
Finger to nose
0/1 6,4% 0% 4,2% 7.1% 3.0% 16,7%
dysmetria
Dysdiadochokinesia 0/1 19,4% 44,4% 16,7% 29.3% 32.8% 33,3%
Tremor of eyelid
0/1
19,4%
0%
29,2%
32.3%
20.9%
0%
BGS Report CR/04/129 (Issue 1.0) for UNIDO Contract 03/088
MI-75
Value or
Katoro
Rwamagasa
Data or Test
score
(Control Area)
(Burdened Area)
former
not
other
former
control
occupational occupational
amalgam-
occupational occupational
group
burdened
burdened
burners
burdened
burdened
Case
number
31 9 24 99 67 12
Clinical
data:
Horizontal field of
170° 163° 163° 164° 164° 162°
vision (median)
Heel to knee ataxia
0/1
6.5%
0%
20.8%
18.2%
9.0%
16.7%
Heel to knee tremor
0/1
0%
0%
0%
2.0%
0%
0%
PSR normal
0/1
80,6%
66,7%
66,7%
63.9%
69.7% 68,2
BSR normal
0/1
100%
77,8%
70,8%
78.8%
76.1%
83,3%
ASR normal
0/1
96,8%
77,8%
45,8%
52.6%
56.1%
50,0%
Babinski reflex path.
0/1
6,5%
0%
0%
4.0%
0%
16,7%
Mento-labial reflex
0/1 32.4% 33.3% 37.5% 36.4% 17.9% 33.3%
pathologic
Sensory disturbance
0/1
0%
11,1%
4,2%
16.0%
1.5% 0%
Bradykinesia 0/1
3,2%
0%
12,5%
12.2%
11.9%
8,3%
Hypomimia 0/1
6,5%
0%
12,5%
18.4%
13.4% 16,7%
9.7% 0% 4.2%
19.2%
11.9%
41.7%
Proteinuria
BGS Report CR/04/129 (Issue 1.0) for UNIDO Contract 03/088
MI-76
Value or
Katoro
Rwamagasa
Data or Test
score
(Control Area)
(Burdened Area)
former
not
other
former
control
occupational occupational
amalgam-
occupational occupational
group
burdened
burdened
burners
burdened
burdened
Case
number
31 9 24 99 67 12
Neuro-psychological
test
Memory test
0-2
19.4%
22.2%
12.5%
10.1%
9.0%
8.3%
3 35.5% 55.6% 33.3% 48.5% 49.3% 25.0%
4 45.2%
22.2%% 54.2% 41.4% 41.8% 66.7%
Match box test
14-18 sec
45.2%
11.1%
16.7%
15.2%
24.2%
8.3%
19-25
sec
35.5%
66.7%
50.0%
58.6%
60.6%
58.3%
26-47
sec
19.4%
22.2%
33.3%
26.3%%
15.2%%
33.3%
BGS Report CR/04/129 (Issue 1.0) for UNIDO Contract 03/088
MI-77
Value or
Katoro
Rwamagasa
Data or Test
score
(Control Area)
(Burdened Area)
former
not
other
former
control
occupational occupational
amalgam-
occupational occupational
group
burdened
burdened
burners
burdened
burdened
Case
number
31 9 24 99 67 12
Neuro-psychological
test
Frostig test
16-12
25.8%
44.4%
29.2%
29.3%
28.4%
41.7%
11-9
67.7%
22.2%
37.5%
40.4%
38.8%
25.0%
8-0
6.5%
33.3%
33.3%
30.3%
32.8%
33.3%
Pencil tapping test
85-64
30.0%
33.3%
12.5%
21.4% 25.8% 25.0%
63-51
53.3%
55.6%
37.5%
52.0% 51.5% 50.0%
50-27
16.7%
11.1%
50.0%
26.5% 22.7% 25.0%
BGS Report CR/04/129 (Issue 1.0) for UNIDO Contract 03/088
MI-78
Value or
Katoro
Rwamagasa
Data or Test
score
(Control Area)
(Burdened Area)
former
not
other
former
control
occupational occupational
amalgam-
occupational occupational
group
burdened
burdened
burners
burdened
burdened
Bio-monitoring
Hg-urine
(µg/l) No.
31 9 23 97 67 12
median
0.31
0.91
0.58
6.36
0.85
1.13
> HBM II
0
0
0
15 (15.4%)
0 1
(8.3%)
> BAT
0
0
0
1 (1.0%)
0
1 (8.3%)
max.
1.8 6.8 11.4 147.2 9.7 224.0
Hg-urine (µg/g crea)
No.
31
9
23
96
67
12
median
0.22
0.26
0.49
3.59
0.58
0.48
> HBM II
0
0
0
6 (6.3%)
0 1
(8.3%)
max.
0.9 2.0 11.6 36.8 7.0 106.6
BGS Report CR/04/129 (Issue 1.0) for UNIDO Contract 03/088
MI-79
Value or
Katoro
Rwamagasa
Data or Test
score
(Control Area)
(Burdened Area)
former
not
other
former
control
occupational occupational
amalgam-
occupational occupational
group
burdened
burdened
burners
burdened
burdened
Bio-monitoring
Hg-blood
No.
31 9 24 99 67 12
median
0.98
1.37
1.50
2.58
1.58
1.70
> HBM II
0
0
0
6 (6.1%)
0 1
(8.3%)
> BAT
0
0
0
2 (2.0%)
0
0
max.
2.3 2.4 5.8 33.3 6.1 17.9
Total Hg-hair
No.
24 6 21 80 63 10
median
0.36 0.36 0.46
0.79
0.46
0.49
> 5 µg/g
0 0
1
(4.8%)
9 (11.3%)
2
(20.0%)
max.
0.68 0.63 15.75 48.74 4.07 18.75
BGS Report CR/04/129 (Issue 1.0) for UNIDO Contract 03/088
MI-80
Value or
Katoro
Rwamagasa
Data or Test
score
(Control Area)
(Burdened Area)
former
not
other
former
control
occupational occupational
amalgam-
occupational occupational
group
burdened
burdened
burners
burdened
burdened
31 9 24 99 67 12
median
5 7 7 7 6 7
Medical test score
0-4
40.0%
33.3%
8.3%
9.1%
23.1% 8.3%
5-9
56.7%
66.7%
79.2%
72.7%
70.8% 83.3%
10-21
3.3%
0%
12.5%
18.2%
6.2% 8.3%
HBM II and BAT
Blood or urine or hair
> HBM II
0 0
1
(4.2%)
22 (22.2%)
0
2 (16.7%)
Blood or urine
> BAT
0
0
0 3
(3.0%) 0 1 (8.3%)
31 9 24 99 67 12
Diagnosis
Hg intoxication
No. (%)
0% 0%
1
(4.2%)
25 (25.3%)
0%
2 (16.7%)
Table 4: Relevant data of the sub-groups. Grey shaded fields in the table contain results that differ from the control group on a statistically
significant level (p < 0.05, one-tailed Chi-square test
BGS Report CR/04/129 (Issue 1.0) for UNIDO Contract 03/088
MI-81
BGS Report CR/04/129 (Issue 1.0) for UNIDO Contract 03/088
MI-82
Appendix 2: Health Assessment Questionnaire
BGS Report CR/04/129 (Issue 1.0) for UNIDO Contract 03/088
MI-83
BGS Report CR/04/129 (Issue 1.0) for UNIDO Contract 03/088
MI-84
Global Mercury Project- Protocols for Environmental and Health Assessment
ID Nr:_________
Health Assessment Questionnaire
by Dr. Stephan Boese O'Reilly, Prof. Dr. Gustav Drasch, Stefan Maydl, Dr.
Milan Vosko
Ludwig-Maximilians University, Munich, Germany.
and Dr. Claude Casellas, Prof. Dr. André Rambaud
University of Montpellier, France
Marcello Veiga, UNIDO Vienna, Austria
Removal of Barriers to the Introduction of Cleaner Artisanal Gold
Mining and Extraction Technologies
United Nations Industrial Development Organization (UNIDO)
Global Environment Facility (GEF)
United Nations Development Programme (UNDP)
Health Assessment
Jina:
Name: ________________________________________________________
I hereby declare that I want to take part in the UNIDO project. I will be questioned about
my living circumstances and health problems related to mercury. I will be medically
examined including neurological examination. Blood, urine and a small amount of hair
will be taken. The UNIDO will inform me after the laboratory analysis about my personal
results. The assessment is done respecting the "Recommendation for Conduct of Clinical
Research" (World Health Organization Declaration of Helsinki).
>>Nakubali kushiriki katika Mradi wa UNIDO kwa kuulizwa maswali yanayohusiana na
maisha yangu kwa ujumla na matatizo ya kiafya yanayohusiana na zebaki. Nitachunguzwa
kiafya kwa kuchukuliwa damu, mkojo, na kiasi kidogo cha nywele. Matokeo ya
uchunguzi huo nitafahamishwa binafsi na kwa siri kwa kuzingatia taratibu zote za
Kimataifa>>
(Jina la eneo na tarehe)
Local and Date: _____________________ _________________________________
Signature (Sahihi)
(in case of children signature of parents/guardian)
(kwa watoto sahihi ya mzazi au mlezi)
Witnesses (if needed) (Shahidi kama itahitajika):
________________________________ and ________________________________
(Name) (Jina):
(Name) (Jina):
MI-85
Global Mercury Project- Protocols for Environmental and Health Assessment
ID Nr:_________
1 Personal Data
1.1 Participant ID Number: ______________________
1.1.1 Family Name:
.....................................................................................
1.1.2 Surname
.................................................................................
1.1.3 Date of Birth: ........................................
1.1.3.1
Age:
..........................................
(years)
1.1.4 Gender:
0 Female
1 Male
1.1.5 Address: ........................................................................................................
...............................................................................................................
1.1.6 (if possible local codes, like settlement A,B, C ....)
2 General
Questionnaire
2.1.1 Date of interview:.............................
2.1.2 Name of the interviewer for this section:.........................................
2.1.3 Code of the interviewer ___________
(please give every interviewer a code, like A,B,C)
2.2 Work
Exposure
2.2.1 How long have you been living in this area? ______ year(s)
2.2.2 Occupation (Detailed description of the job)
A
Miner, but no exposure to mercury
B
Miner, with exposure to mercury, such as amalgamation, but no smelter
C
Gold smelter, or gold buyer
D
Worker at a cyanidation plant, but no contact to mercury
E Farmer
F Office
Job
G Driver
H
School child (not working)
J Other
job...................................................................
K
School child (working in mining area, with exposure to mercury)
2.2.3 Have you ever worked in the _____________ area?
0 ____ No
1 ____ Yes
2.2.3.1 If yes, for how many _______ year(s)?
2.2.4 Have you ever worked as a miner with direct contact with mercury?
0 ____ No
1 ____ Yes
2.2.4.1 If from when to when: ___________________________________
= _______ years of mercury contact
MI-86
Global Mercury Project- Protocols for Environmental and Health Assessment
ID Nr:_________
2.2.5 Have you ever worked burning amalgam or melting gold?
0 ____ No
1 ____ Yes
2.2.5.1 If yes, from when to when: _______________________________
= _______ years of mercury contact
2.2.6 Have you been using retort?
1 ____ No
0 ____ Yes
2.2.7 Have you stored mercury containers or flasks?
0 ____ Never
1 ____ At work
2 ____ At home
2.2.8 Have you kept your dirty working clothes at your home?
0 ____ No
1 ____ Yes
2.2.9 For how many years have you been working with mercury?
0 ____ not applicable (have not working directly with mercury)
1 ____ year(s)
2.3 Diet
Issues
2.4 Fish eating habits
2.4.1 How frequently do you eat fish?
0 ____ Never
1 ____ At least once a month
2. ____ At least once a week
3. ____ At least once a day
2.4.2 If at least once a day, how much fish to you eat?
2.4.2.1 ________ meals per day
2.4.3 Name the types of fish you consume regularly. If possible, indicate the
type of fish that you eat the most:
Fish Name
2.4.3.1 ________________________
2.4.3.2 ________________________
2.4.3.3 ________________________
2.4.3.4 ________________________
2.4.3.5 ________________________
2.4.3.6 ________________________
2.4.3.7 ________________________
2.4.3.8 ________________________
2.4.3.9 ________________________
Please code the fishes like A, B, D, E, F, ....(Please use useful list of fish according to
local habits)
2.4.4 Do you know where the fish come from?
0 _____ from areas distant from mining
1 _____ from areas impacted by mining
9 _____ don't know the origin of the fish (buy in the market)
MI-87
Global Mercury Project- Protocols for Environmental and Health Assessment
ID Nr:_________
2.4.5 Can you name the river and local where you catch most fish you have
consumed?
A ____ No
B____ Yes, the river (or lake or pool) is _______________________________
(Please give the areas codes, like C, D, E, F ...)
2.5 Other dietary issues
2.5.1
Name the place where you obtain drinking water:
__________________ (Please give the areas codes, like C, D, E, F ...)
2.5.2 Do you consume from local production chicken, ducks or eggs?
0 ____ Never
1 ____ At least once a month
2 ____ At least once a week
3 ____ At least once a day
2.5.3 Do you consume from local production meat?
0 ____ Never
1 ____ At least once a month
2 ____ At least once a week
3 ____ At least once a day
2.5.4 Do you consume from local production vegetables, fruits?
0 ____ Never
1 ____ At least once a month
2 ____ At least once a week
3 ____ At least once a day
2.6 Confounders
2.6.1 Do you smoke?
0 ____ Never
1 ____ Rarely (0-10 cigarettes per day)
2 ____ Medium (10-20 cigarettes per day)
3 ____ Lots (more then 20 cigarettes per day)
2.6.2 Do you drink alcohol?
0 ____ Never
1 ____ at least once a month
2 ____ at least once a week
3 ____ at least once a day
2.6.3 Have you been constantly handling gasoline and kerosene?
0 ____ No
1 ____ Yes
2.6.3.1 If yes, how many years you have been doing this? ______ (years)
2.6.4 Have you been constantly handling insecticides or pesticides?
0 ____ No
1 ____ Yes
2.6.4.1 If yes, how many years you have been doing this? ______ (years)
2.6.5 Do you use whitening soap (for lightening the skin)?
0 ____ No
1 ____ Yes
MI-88
Global Mercury Project- Protocols for Environmental and Health Assessment
ID Nr:_________
2.6.6 How is your current financial situation?
0 ____ (OK)
1 ____ (medium)
2 ____ (bad)
2.6.7 How is your current social life? (friends, family, hobby activities, etc.)
0 ____ (OK)
1 ____ (medium)
2 ____ (bad)
3 Health Problems not related to mercury
3.1.1 Date of interview:.............................
3.1.2 Name of the interviewer for this section:.........................................
3.1.3 Code of the interviewer __________
3.2 Are you healthy now?
0 ____ Yes
1 ____ No
Why not? ___________________________________________________________
3.3 Do you have fever at the moment?
0 ____ No
1 ____ Yes
3.4 Did you loose weight within the last year?
0 ____ No
1 ____ Yes
3.5 Did you cough within the last year for more then for 3 month?
0 ____ No
1 ____ Yes
3.6 Have you ever had malaria?
0 ____ No
1 ____ Yes
3.6.1 If yes, how many time ago you had your last malaria? _______ (days or
weeks or months or years)
3.7 Africa
3.7.1 Have you ever had sleeping sickness?
0 ____ No
1 ____ Yes
3.7.2 Do you have HIV /AIDS?
0 ____ No
1 ____ Yes
since when _________ years
3.7.3 Do you or did you suffer from Leprosy?
0 ____ No
1 ____ Yes
MI-89
Global Mercury Project- Protocols for Environmental and Health Assessment
ID Nr:_________
3.8 Have you ever had any other major infectious disease?
0 ____ No
1 ____ Yes
3.8.1 Which disease (problem)? ____________________________
3.9 Have you ever had kidney disease except urinary tract infection?
0 ____ No
1 ____ Yes
3.9.1 Which disease (problem)? ____________________________
3.10 Have you ever had hepatitis or any other hepatic disorder?
0 ____ No
1 ____ Yes
3.10.1 Which disease (problem)? ____________________________
3.11 Have you ever had severe respiratory problems (asthma, pneumonia)?
0 ____ No
1 ____ Yes
3.11.1 Which disease (problem)? ____________________________
3.12 Did you ever have tuberculosis?
0 ____ No
1 ____ Yes
3.12.1 When did this happen ? _______________ (days or weeks or months or
years) ago
3.13 Have you ever had any neurological disorders (epilepsy, stroke,
Parkinson etc.) or mental disorders?
0 ____ No
1 ____ Yes
3.13.1 Which disease (problem)? ____________________________
3.14 Did you have any serious accidents (did you have to go to hospital)?
0 ____ No
1 ____ Yes, but not severe (less then 1 hour unconsciousness)
2 ___ Yes, and it was severe (more then 1 hour unconsciousness)
3.14.1 When did this happen ? _______________ (days or weeks or months or
years) ago
3.15 Exclusion criteria from statistical evaluation
Severe neurological disease such as Parkinson, stroke or severe accident (brain injury),
birth trauma, tetanus, polio, diabetes, hyperthyroidism or any acute severe disease, etc...
To be filled in by project doctor.
0 ____ No
1 ____ Yes
Why this individual should be excluded from the assessment:
__________________________________________________________________
MI-90
Global Mercury Project- Protocols for Environmental and Health Assessment
ID Nr:_________
3.16 Do you breastfeed (for women only)
0 ____ No
1 ____ Yes
3.17 Are you pregnant (for women only)
0 ____ No
1 ____ Yes
4 Health Questions related to mercury exposure
4.1.1 Date of interview:.............................
4.1.2 Name of the interviewer for this section:.........................................
4.1.3 Code of the interviewer ___________
(please give every interviewer a code, like A,B,C)
4.2 Has the actual or former health problem worsened since exposure to
mercury occurred?
0 _____ No mercury exposure
1 _____ Mercury exposure, but no worsening effects
2 ____ Yes, mercury exposure and worsening
4.3 How is your appetite?
0 ____ (OK)
1 ____ (medium)
2 ____ (bad)
4.4 Did you loose hair within the last year?
0 ____ No or only rarely
1 ____ Yes, slight to moderate
2 ____ Yes, marked to sever
4.5 Sleep
disturbances
How do you feel after a usual night of sleep?
0 ____ (OK)
1 ____ (medium)
2 ____ (bad)
4.6 Do you feel a kind of a metallic taste?
0 ____ Never
1 ____ at least once a month
2 ____ at least once a week
3 ____ at least once a day
4.7 Do you suffer from excessive salivation?
0 ____ Never
1 ____ at least once a month
2 ____ at least once a week
3 ____ at least once a day
MI-91
Global Mercury Project- Protocols for Environmental and Health Assessment
ID Nr:_________
4.8 Have you had any problems with tremor (shaking)?
(Clinical Tremor Rating Scale)
0 ____ I have no tremor or tremor does not interfere with my job
1 ____ I am able to work, but I need to be more careful than the average person
2 ____ I am able to do everything, but with errors; poorer than usual performance because
of tremor
3 ____ I am unable to do a regular job, I may have changed to a different job due to
tremor; it limits some housework, such as ironing
4 ____ I am unable to do any outside job; housework very limited
4.9 Fatigue
Score to estimate the state of fatigue (Wessely S, Powell R: Fatigue syndrome)
4.9.1 Have you got tired easily?
0 ____ Same as usual
1 ____ Worse then usual
2 ____ Much worse than usual
4.9.2 Do you need to rest more?
0 ____ Same as usual
1 ____ Worse then usual
2 ____ Much worse than usual
4.9.3 Do you feel sleepy or drowsy?
0 ____ Same as usual
1 ____ Worse then usual
2 ____ Much worse than usual
4.9.4 Can you no longer start anything?
0 ____ Same as usual
1 ____ Worse then usual
2 ____ Much worse than usual
4.9.5 Do you always lack energy?
0 ____ Same as usual
1 ____ Worse then usual
2 ____ Much worse than usual
4.9.6 Do you have less strength in your muscles?
0 ____ Same as usual
1 ____ Worse then usual
2 ____ Much worse than usual
4.9.7 Do you feel weak?
0 ____ Same as usual
1 ____ Worse then usual
2 ____ Much worse than usual
4.9.8 Can you start things without difficulties, but get weak as you go on?
0 ____ Same as usual
1 ____ Worse then usual
2 ____ Much worse than usual
MI-92
Global Mercury Project- Protocols for Environmental and Health Assessment
ID Nr:_________
4.9.9 Physical fatigue sum: ___________ score sum (4.9.1 to 4.9.8)
4.9.10 Do you have problems concentrating?
0 ____ Same as usual
1 ____ Worse then usual
2 ____ Much worse than usual
4.9.11 Do you have problems thinking clearly?
0 ____ Same as usual
1 ____ Worse then usual
2 ____ Much worse than usual
4.9.12 Do you have problems to find correct words when you speak?
0 ____ Same as usual
1 ____ Worse then usual
2 ____ Much worse than usual
4.9.13 Do you have problems with eyestrain?
0 ____ Same as usual
1 ____ Worse then usual
2 ____ Much worse than usual
4.9.14 Do you have problems with memory?
0 ____ Same as usual
1 ____ Worse then usual
2 ____ Much worse than usual
4.9.15 Mental fatigue sum: ____________ score sum (4.9.10 to 4.9.14)
4.10 Well being
4.10.1 Do you feel nervous?
0 ____ Never
1 ____ at least once a month
2 ____ at least once a week
3 ____ at least once a day
4.10.2 Do you feel sad?
0 ____ Never
1 ____ at least once a month
2 ____ at least once a week
3 ____ at least once a day
4.10.3 Do you have palpitations?
Feeling the heart beating
0 ____ Never
1 ____ at least once a month
2 ____ at least once a week
3 ____ at least once a day
4.10.4 Do you have a headache?
0 ____ Never
1 ____ at least once a month
2 ____ at least once a week
3 ____ at least once a day
MI-93
Global Mercury Project- Protocols for Environmental and Health Assessment
ID Nr:_________
4.10.5 Do you have nausea?
0 ____ Never
1 ____ at least once a month
2 ____ at least once a week
3 ____ at least once a day
4.10.6 Do you feel numbness, prickling, aching at any location of your body?
Mainly perioral dysesthesia and sensory impairment of the glove and-stocking type
0 ____ Never
1 ____ at least once a month
2 ____ at least once a week
3 ____ at least once a day
5 Clinical neurological examination
5.1.1 Date of neurological examination:.............................
5.1.2 Name of the neurological examiner:.........................................
5.1.3 Code of the examiner ___________
5.2 Mouth and Teeth Conditions
5.2.1 Clinical signs of stomatitis
0 ____ No
1 ____ Yes
5.2.2 Clinical signs of gingivitis
0 ____ No
1 ____ Yes
5.2.3 Bluish discoloration of the gums
0 ____ No
1 ____ Slight
2 ____ Yes, obvious
5.2.4 How many teeth with dental fillings (Amalgam)?
0 ____ None
(n) ___ One or more how many _______
5.2.5 Examination of the eyes:
0 _____ No changes
1 _____ Bluish colored iris ring
2 _____ Kayser-Fleischer ring
5.3 Walking
Person is asked to walk up and down, first with eyes open, then with eyes closed.
5.3.1 Ataxia of gait (walking)
Examiner is watching for signs of ataxia (Klockgether Score p 435)
0 ___ Absent
1 ___ Slight (ataxia only visible when walking on tandem or without visual feedback)
2 ___ Moderate (ataxia visible in normal walking; difficulties, when walking on tandem)
3 ___ Marked (broad-based, staggering gait; unable to walk on tandem)
4 ___ Severe (unable to walk without support; wheelchair bound)
5 ___ Most severe (bedridden)
MI-94
Global Mercury Project- Protocols for Environmental and Health Assessment
ID Nr:_________
5.3.2 Rigidity of gait (walking)
Examiner is watching the gait, the swing of the arms, general posture and rates
0 ____ Normal
1 ____ Mild diminution in swing while the patient is walking
2 ____ Obvious diminution in swing suggesting shoulder rigidity
3 ____ Stiff gait with little or no arm swinging noticeable
4 ____ Rigid gait with arms slightly pronated; this would also include stopped-shuffling
gait with propulsion and retropulsion
5.4 Standing
5.4.1 Tremor - finger to nose test
Person is asked to stand still, legs together arms outstretched. Eyes closed. Finger tip
should touch the nose. Examiner is watching and rates the tremor (modified Clinical
Tremor Rating Scale)
0 ____ None
1 ____ Slight to moderate (amplitude < 0,5 cm 1cm); may be intermittent, may be
intermittent
2 ____ Marked amplitude (1-2 cm)
3 ____ Severe amplitude (> 2 cm)
5.4.2 Dysmetria - finger to nose test
Person is asked to stand still, legs together arms outstretched. Eyes closed. Finger tip
should touch the nose. Examiner is watching and rates the dysmetria
0 ____ Normal
1 ____ Moderate pathologic
2 ____ Severe pathologic
5.4.3 Dysdiadochokinesis
Person is asked to twist hands very quickly (alternating movements of the wrists
(Klockgether Score)
0 ____ Absent
1 ____ Slight (minimal slowness of alternating movements)
2 ____ Moderate (marked slowness of alternating movements)
3 ____ Severe (severe irregularity of alternating movements)
4 ____ Most severe (inability to perform alternating movements)
5.4.4 Tremor eye lid
Eyes closed. Examiner is watching and rates the tremor (Davao Pool score)
0 ____ None
1 ____ Slight
2 ____ Marked
5.5 Lying - Reflexes
Person is asked to lie on the examination bench.
5.5.1 Mentolabial reflex (Positive pyramidal sign)
0 ____ Negative
1 ____ Positive
5.5.2 Babinski reflex (Positive pyramidal signs)
0 ____ Negative
1 ____ Positive
MI-95
Global Mercury Project- Protocols for Environmental and Health Assessment
ID Nr:_________
5.5.3 Sucking reflex (Positive pyramidal signs)
0 ____ Negative
1 ____ Positive
5.5.4 Grasp reflex
0 ____ Negative
1 ____ Positive
5.5.5 PSR (quadrizeps reflex)
A No
reflex
B Hyporeflexia
C Normal
D Hyperreflexia
E Clonus
5.5.6 BSR (bizeps brachii reflex)
A No
reflex
B Hyporeflexia
C Normal
D Hyperreflexia
E Clonus
5.5.7 AR (Achilles reflex, ankle jerk)
A No
reflex
B Hyporeflexia
C Normal
D Hyperreflexia
E Clonus
5.6 Lying other tests
5.6.1 Intentional Tremor - heel-to-shin test
Person is asked to touch with his heel the knee of the other leg. Then to move with the heel
along the shin to the foot. Repeat and do it with both sides. Eyes first open, then closed.
Rate tremor during heel-to-shin test (Klockgether Score)
0 ____ Absent
1 ____ Slight (slight terminal tremor)
2 ____ Moderate (marked terminal tremor)
3 ____ Marked (kinetic tremor throughout intended movements)
4 ____ Severe (severe kinetic tremor heavily interfering with everyday life)
5 ____ Most severe (maximal form of kinetic tremor making intended movements
impossible)
5.6.2 Ataxia - heel-to-shin test
Rate ataxia (Klockgether Score)
0 ____ Absent
1 ____ Slight (slight hypermetria in heel-to-shin test)
2 ____ Moderate (hypermetria and slight ataxic performance of heel-to-shin test)
3 ____ Marked (marked swaying: unable to stand with feet together)
4 ____ Severe (pronounced ataxia in performing heel-to-shin test)
5 ____ Most severe (unable to perform heel-to-shin test)
MI-96
Global Mercury Project- Protocols for Environmental and Health Assessment
ID Nr:_________
5.6.3 Sensory disturbances
Sensory disturbances such as sensory impairment of the glove and-stocking type
0 ____ Absent
1 ____ Present
5.6.3.1 Comments_____________________________________________________________
5.6.4 Bradykinesia
Rate your observation whether there was any sign of bradykinesia during the examination
(slower active movements, absent or altered synkinesia of upper extremities during gait)
0 ____ Absent
1 ____ Present
5.7 Hypo-mimia
Rate your observation whether there you observed an hypo mimic expression of the face
during the examination)
0 ____ Absent
1 ____ Present
6 Specific
Tests
6.1.1 Date of the specific test:.............................
6.1.2 Name of the tester:.........................................
6.1.3 Code of the tester ___________
6.2 Memory Disturbances (Wechsler)
6.2.1 Forward digit span test (part of Wechsler Memory Scale)
Please repeat each column of numbers. Score longest series correctly repeated forward
Score
Test
4
6-4-3-9
4
7-2-8-6
3
4-2-7-3-1
3
7-5-8-3-6
2
6-1-9-4-7-3
2
3-9-2-4-8-7
1
5-9-1-7-4-2-3
1
4-1-7-9-3-8-6
0
5-8-1-9-2-6-4-7
0
3-8-2-9-5-1-7-4
6.3 Match Box Test (from MOT)
Put 20 matches on a table , half of each on one side of an open matchbox, approx. 15 cm
away. Take the time until all matches are put into the box. Use left and right hand
alternatively.
______ seconds
6.4 Finger Tapping Test (from MOT)
Sitting at a table. Elbows should be placed on the table. Try to do as many points as
possible on a piece of paper with a pencil. Count the amount of points within 10 seconds.
_______ points
MI-97
Global Mercury Project- Protocols for Environmental and Health Assessment
ID Nr:_________
6.5 Frostig
Score
Draw a line from one symbol to the other. Do not interrupt while drawing. Do not touch the lines.
Score: ______
Please connect with a pencil the symbols. Please try to stay within the lines. ??
F1
0-2
F2
0-2
F3
0-2
F4
0-2
MI-102
Global Mercury Project- Protocols for Environmental and Health Assessment
ID Nr:_________
F5
0-2
F6
0-2
Please connect the symbols with a straight line.
F7
F8
0-2
MI-103
Global Mercury Project- Protocols for Environmental and Health Assessment
ID Nr:_________
6.6 Visual field test
left ____ cm
right ____ cm
base line ____ cm
6.7 Objective tremor assessment
Result _________________________
6.8 Weight
in
________kg
6.9 Height in _______ cm
7 Specimens
7.1.1 Date of the specimen...............................................................................
7.1.2 Time of the specimen sampling....................................................
7.1.3 Name of the specimen taker:.............................
7.1.4 Code ___________
7.2 Blood (EDTA-blood 10 ml)
0 ____ Yes
1 ____ No
7.3 Urine (spontaneous urine sample 10 ml)
0 ____ Yes
1 ____ No
7.3.1 Proteinuria
0 ____ negative
1 ____ positive ____ score
7.3.2 Urine total mercury (field test) (additional)
____ Result ____ unit
7.4 Hair
0 ____ Yes, sample collected
1 ____ No
7.5 Others (breast milk)
0 ____ Yes, sample collected
1 ____ No sample
MI-104