Centro de Tecnologia Mineral
Ministério da Cięncia e Tecnologia
Coordenaçăo de Desenvolvimento Sustentável
ENVIRONMENTAL AND HEALTH ASSESSMENT IN TWO
SMALL-SCALE GOLD MINING AREAS INDONESIA
FINAL REPORT
SULAWESI AND KALIMANTAN
Saulo Rodrigues Pereira Filho
Project Leader
Ronaldo Luiz Correa dos Santos
Roberto C. Villas Bôas
Zuleica Carmen Castilhos
Allegra Viviane Yallouz
Bernhard Peregovich
Débora Maia Pereira
Flavia M.F. Nascimento
Luiz Roberto M. Pedroso
CETEM
Stephan Boese-O'Reilly
Gustav Drasch
Alexandra Dittmann
Sven Illig
Stefan Maydl
Beate Lettmeier
University of Munich
RT2004-016-00 Technical Final Report to UNIDO - RESERVED
July/2004


Brazilian Ministry of Science and Technology
Centre For Mineral Technology CETEM
Institute of Forensic Medicine, Ludwig-
Maximilians University, Munich, Germany
ENVIRONMENTAL AND HEALTH ASSESSMENT IN TWO SMALL-
SCALE GOLD MINING AREAS INDONESIA
TECHNICAL FINAL REPORT
SULAWESI AND KALIMANTAN
Center for Mineral Technology
Ref.: Report Requested by UNIDO, United Nations Industrial
Development Organization, No. P. 2003/007
EG/GLO/01/G34 Removal of Barriers to the Introduction
of Cleaner Artisanal Gold Mining and Extraction
Technologies
July / 2004
Project Staff
CETEM Centro de Tecnologia Mineral
Saulo Rodrigues Pereira Filho
Project Leader
Ronaldo Luiz Correa dos Santos
Roberto Cerrini Villas Bôas
Zuleica Carmen Castilhos
Allegra Viviane Yallouz
Bernhard Peregovich
Débora Maia Pereira
Flavia Maria de Fátima Nascimento
Luiz Roberto Martins Pedroso
University of Munich
Stephan Boese-O'Reilly
Gustav Drasch
Alexandra Dittmann
Sven Illig
Stefan Maydl
Beate Lettmeier
Photos: Dr. Bernhard Peregovich
Acknowledgements
Dr. Gildo de A. Sá Cavalcanti de Albuquerque (in memorian)
CETEM's Director
Dr. Christian Beinhoff
Chief Technical Advisor
Global Mercury Project
UNIDO United Nations Industrial Development Development Organization
Dr. Marcello M. Veiga
Small Scale Mining Expert
Global Mercury Project
UNIDO United Nations Industrial Development Development Organization
Dr. Fernando A. Freitas Lins
Focal Point Brazil - Global Mercury Project
Prof. Dr. Roberto C. Villas Bôas
Assistant Focal Point Brazil - Global Mercury Project
Dr. Arnaldo Alcover Neto
Head of Mineral Analysis Coordination
Luiz Roberto Martins Pedroso
Chemist
Flavia Maria de Fátima Nascimento
Hydrogeologist
Sandra Helena Ribeiro, Gaspar Barbosa Alexandre, Jorge Anronio Pinto de
Moura, Luiz Fernando M. Bandeira, Jorge Luiz Florindo da Cruz
Analytical Technicians
José Augusto Ferreira Junior
Mineral Technician
CETEM's Administration, specially, Mr. Aloisio Moura da Silva
Ms. Fátima Engel
Editing and Coordination of Report Edition
Summary
Executive Summary .........................................................................3
1. Introduction .............................................................................. 15
1.1. Location of the Study Areas in Indonesia ................................... 17
1.1.1. North Sulawesi Talawaan ............................................ 17
1.1.2. Central Kalimantan Galangan....................................... 20
2. Materials and Methods............................................................... 22
2.1. Environmental Assessment .................................................... 22
2.1.1. Sampling strategy....................................................... 22
2.1.2. Sample Preparation and Analyses.................................. 23
2.1.3. Statistical Analyses ..................................................... 24
2.2. Health Assessment ................................................................ 24
2.2.1. Material and sample storage......................................... 24
2.2.2. Study Setting and Clinical Examinations ......................... 24
2.2.3. Health Project in the Field ............................................ 23
2.2.4. Questionnaire............................................................. 26
3. Results and Discussion .............................................................. 30
3.1. Environmental Assessment ...................................................... 31
3.1.1. Geology and Mineral Processing in North Sulawesi
(Talawaan)................................................................. 31
3.2 Geology and Mineral Processing in Central Kalimantan
(Galangan) ........................................................................... 35
3.3. Biogeochemistry of Mercury in North Sulawesi (Talawaan
Watershed)........................................................................... 38
3.4. Biogeochemistry of Mercury in Central Kalimantan (Galangan
Mining Site) .......................................................................... 47
3.5. Mercury in Fish ...................................................................... 54
3.5.1. Human exposure to mercury due to fish consumption .......... 64
3.6. Mercury semiquantitative determination in fish samples in
Manado, Indonesia Training of local users ................................. 66
3.7. Health Assessment ................................................................. 69
3.7.1. General health situation ................................................. 69
3.7.2. Health Assessment Clinical Impression........................... 74
3.7.3. Description of mercury levels in urine, blood and hair .......... 77
3.7.4. Statistical analysis of mercury levels in urine, blood and
hair............................................................................. 82
3.7.5. Control Groups.............................................................. 89
3.7.6. Burdened Groups ........................................................... 91
3.7.7. Mercury Levels compared to Toxicological Threshold
Limits.......................................................................... 91
3.7.8. Scoring of medical results............................................... 98
3.7.9. Statistical analysis of mercury levels versus clinical
data .......................................................................... 100
3.7.10. Discussion of the Statistical Analysis............................. 105
3.7.11. Decision for the Diagnosis of a Chronic Mercury
Intoxication................................................................ 106
3.7.12. Influence on Nursed Babies .......................................... 109
3.7.13. Screening of Mercury Urine Concentration in Field .......... 112
4. Conclusions and Recommendations ......................................... 114
5. References .............................................................................. 123
Acknowledgement ....................................................................... 129
Appendix 1 Tables
Appendix 2 - Health assessment questionnaire
Appendix 3 - Pictures
Appendix 4 - Hg concentrations in sediments, tailings and soils -
Kalimantan and Sulawesi
RT2004-016-00 CETEM/MCT
Executive Summary
The present report describes the results achieved in two small scale gold
mining areas in Indonesia, North Sulawesi (Talawaan) and Central Kalimantan
(Galangan) - as part of the environmental and health assessment (E&HA)
conducted by the Brazilian Centre for Mineral Technology (CETEM) and the
German Institute of Forensic Medicine (IFM) of the University of Munich,
under the general coordination of the United Nations Industrial Development
Organization (UNIDO). The E&HA is a part of the GEF/UNIDP/UNIDO
Global Mercury Project - Removal of Barriers to the Introduction of Cleaner
Artisanal Gold Mining and Extraction Technologies.
The aim of the subcontract was to undertake two environmental and
medical investigations in the Galangan area (Central Kalimantan), and in the
Talawaan area (North Sulawesi), both in Indonesia. The ultimate aim of the
whole UNIDO project is to reduce mercury losses in the project demonstration
sites by means of introducing new technologies, while improving the income of
the miners through more efficient recovery, increasing knowledge and
awareness, and providing policy advice on the regulation of artisanal gold
mining with due consideration for gender issues.
In order to identify sites with high concentration of mercury (hotspots) a
sampling campaign of soils, sediments and biota was conducted, consisting of
768 samples. The present report describes results of mercury analyses in
sediments, soils, tailings, water and biological indicators, as well as clinical
examinations and mercury levels in 500 people living in the Indonesian gold
mining areas. An integrated approach has been applied to describe the
distribution and behavior of mercury in the environment and its health effects,
in order to provide a better understanding of the whole impact caused by
mercury emissions and exposure.
A research team comprising 11 research scientists from CETEM (7
members) and IFM (4 members) commenced with the work in Indonesia in
August 2003 and accomplished the sampling campaign within 30 days.
Environmental Assessment
North Sulawesi - Talawaan
North Sulawesi is a region of the Sulawesi Island in the Celebes Sea.
Manado is the capital of North Sulawesi, and has approx. 600.000 inhabitants.
Manado Bay is surrounded by some famous islands, for example
Bunaken Island. Bunaken National Marine park is well known for its beautiful
coral reefs, which are a tourist attraction. Three small rivers drain into this bay.
They origin from the Talawaan watershed, approx. 20 to 30 km away from
Manado.
3
RT2004-016-00 CETEM/MCT
Tatelu is a small village in the Talawaan watershed with approximately
2.000 inhabitants. Next to the village is the mineral processing area. The ore is
excavated in the mountains. A group of 15-20 miners live in very basic camps
beside their tunnel.
The study area includes the drainage basins of the Talawaan and Tatelu
River. The drainages flow through the main gold processing units where
mercury is widely used and released. About one third of the coastline of the
area is within the boundary of the Bunaken National Marine Park. The coastal
environment includes mangrove areas and coral reefs.
According to Turner (2002), the North Arm of Sulawesi is a classic
oceanic island arc that includes porphyry Cu and volcanic-hosted epithermal
Au-Ag deposits. The Ratatotok Au district, located 100 km to the Southwest of
Manado, is hosted in Miocene carbonate rocks deposited in a Northeastern-
trending graben, and covered by andesitic volcanic and volcaniclastic rocks.
Carbonates are silicified, decalcified, dolomitized, and have anomalous
concentrations of Hg, As, Sb, Tl and low base-metals, as Zn, Cu and Pb (all <
100 ppm). Therefore, one may realize that a naturally anomalous Hg
background is to be found in North Sulawesi.
It is estimated that 130 milling operations are working in the Talawaan
watershed (Tatelu region). They purchase 10 to 15 kg of
mercury/month/milling unit. A unit with 12 mills recovers 4 to 6 g of gold per
cycle. Generally there are two cycles per day. The mills operate 8 hours/day, 6
days/week.
Most miners are currently storing amalgamation tailings in plastic sacks
to be sold to cyanidation plants. Since a certain portion of the gold is not
recovered from the gold ore by the amalgamation process, the wastes of the
processing sites are collected in sacks and transported by cars to nearby located
cyanidation plants, where the material is chemically processed to extract the
gold left in the amalgamation wastes.
According to a mass balance based on both analytical determinations in
amalgamation wastes and interviews with the miners, the estimated ratio Hglost
: Auproduced in Talawaan falls into the extremely high range of 40 to 60, which is
30 to 40 times higher than average ratios found in SSM worldwide (Veiga and
Baker, 2003; Rodrigues-Filho et al, 2004).
Assuming that 9.6 to 14.4 kg of Hg are lost per unit/month, not less than
15 to 22 tonnes of mercury are being released annually in the entire area of
Tatelu. This characterizes an alarming mercury burden to the environment in
North Sulawesi.
4
RT2004-016-00 CETEM/MCT
North Sulawesi
Nearly no suspended matter can be found in drainages of the Talawaan
watershed due to the ,,young" nature of the rivers, except in the most
dowstream region where a plain supplies the rivers with some silt/clay
material. Moreover this scarcity of clay minerals might reflect the young age of
volcanic activities, since the volcanic rocks have been exposed to weathering for
a relatively short geological time.
Also the extraction process used does contribute to the low contents of
suspended sediments found in the region, since most of the tailings are
recovered to be reprocessed in the cyanidation plants.
A sampling campaign of soils, sediments, water and biota was conducted
in the Talawaan watershed, consisting of 298 samples split into 156 fish
samples, and 142 samples of sediments, soils, water, plants and other aquatic
organisms, covering the whole study area. The study area was divided into 7
sub-areas from the most upstream are down to the estuary.
The most upstream sampling site is located close to the spring of
Talawaan river where no mining activity was reported. Unexpectedly, Hg
levels in those samples were 600 times higher than Hg background levels
usually found in sediments in tropical regions (Rodrigues-Filho et al., 2004).
Mercury levels at the spring of the Talawaan River average 60 µg/g in the
sediment fraction < 74 µm (see Figure 16).
A likely explanation for this anomalous Hg level in unaffected sediments
is related to the proximity of the inactive volcano of Mount Kablat, whose
former activity might have generated the conditions for the formation of gold
deposits in the Tatelu region, as well as their associated Hg enrichment. This
Au-Hg association has been observed in other similar gold deposits in North
Sulawesi (Turner, 2002). Another study on mercury contamination of the
Talawaan Watershed also indicates abnormal Hg levels, up to 2.0 µg/g, in
sediments close to its spring (Martens, 2000), whereas no information on the
target grain size fraction has been indicated. However, further investigations on
the mineralogy of these sediments are required to confirm this hypothesis.
The main mining sites are located approximately 5 km downstream close
to the confluence of the Tatelu River and the Talawaan River, where a dam
reservoir has been built for water supply of rice plantations. At this place an
increase of Hg levels in sediments has been observed as a consequence of Hg
releases from amalgamation wastes to the rivers. Mercury concentrations reach
up to 480 µg/g and average 154 µg/g in the sediment fraction < 74 µm (see
Figures 16 and 21).
Mining tailings consisting of amalgamation wastes containing up to
1250 µg/g and an average of Hg concentration of 317 µg/g (see Figures 17 and
21), must be regarded as mining hotspots. Obviously, not all of amalgamation
tailings are transported to the cyanidation plants, since plenty of them were
5
RT2004-016-00 CETEM/MCT
found all over the river banks. Mercury levels found in tailings of this area are
in the same order of magnitude of the values encountered in mining hotspots of
gold mining sites in Brazil (Rodrigues-Filho et al., 2004).
Further downstream and close to the estuary Hg levels in sediments
drop to a mean concentration of 6.7 µg/g, which is even lower than those
encountered in the most upstream part of the river, indicating a dilution effect
caused by runoff of catchment soils (see Figure 16).
As for the assessment of Hg bioavailability by using bioindicators other
than fish, like aquatic plants and mollusks, there is indication that Hg is being
taken up by living organisms in the Talawaan River, as shown by the
distribution of Hg in aquatic plants and mollusks (see Figures 19 and 20).
Mercury uptake by aquatic plants is particularly evident in cyanidation
tailings, where Hg concentrations reach up to 370 µg/g (see Figure 19). This is
likely a consequence of increasing Hg mobility and biovailability through the
formation of mercury-cyanide complexes after cyanidation of highly
contaminated amalgamation wastes.
The mean Hg level in aquatic plants of the Talawaan River, 32.3 µg/g, is
13 times higher than the one observed in the most contaminated SSM site in
Brazil, according to a previous study (Rodrigues-Filho et al., 2004).
Mollusks also indicate an abnormally high Hg bioavailability in the
Talawaan River, with a mean Hg concentration of 2.6 µg/g (see Figure 20). This
mean value is three times higher than the highest Hg concentration found in a
previous study on contaminated coastal sites of the USA (O´Connor, 1993).
Therefore, it is assumed that both factors are contributing to the
indicated high Hg bioavailability, namely an anomalous Hg background in the
area and the cyanidation of amalgamation wastes forming soluble mercury
complexes.
A reduced number of water samples were checked for assessing their
quality in relation to guidelines for drinking water. At the main mining sites,
Hg level in water reachs 1.8 µg/L, while down to the estuarine region Hg levels
drop to a mean value of 0.1 µg/L, which falls below the maximum limit of Hg
for drinking water established by the World Health Organization (WHO, 1980).
This is in accordance with the above mentioned hypothesis, since close to the
cyanidation plant Hg is clearly forming soluble complexes, becoming therefore
susceptible to methylation.
Central Kalimantan (Galangan)
Due to the topographic flat character of the sedimentary basin in the
study area of Central Kalimantan (former Borneo Island), its main rivers,
Katingan and Kahayan, exhibit a strong meandering stream, while the local
6
RT2004-016-00 CETEM/MCT
wetland in Galangan flows gently to two different river basins, to the Katingan
River to Southeast and to the Cempaga River to Southwest.
A 1 km wide forest separates the mining sites from the Katingan River.
The mining area consists of a flat plain seasonally flooded, covered by alluvial,
Quaternary-Tertiary sediments mostly sand and gravel with a thicknesss
ranging from 2 to 10 m above peaty layers. The occurrence of peaty layers is an
indication for a former wetland forest, which now lies some meters above the
groundwater table. Therefore, it seems to be very plausible, that the main part
of the waters from the mining site soaks into its sediments, before it is drained
by means of groundwater run off into the adjacent rivers.
The landscape in Galangan resembles a desert, with some isolated trunks
and stumps of giant trees after deforestation of the rain forest. No significant
vegetation remained and the soil is reduced to a white, fine sand. The alluvial
gold ore deposit consists of a Quaternary-Tertiary (Pleistocene) sedimentary
sequence.
Gold mining is carried out following traditional methods also used in the
Brazilian gold mining areas (secondary deposits) in the Amazon region. In open
pits the gold bearing layers are excavate by a jet of water. The diluted pulp is
then pumped to a carpeted sluices box with an inclination of some 15°, in which
gold particles are supposed to settle down in the carpet due to their high
density. Due to the high turbulence of the pulp flow a considerable part of the
gold is lost to the tailings.
Manual amalgamation of the concentrate is done in ponds consisting of
flooded open pits excavated beside miners' residences. This practice leads to Hg
pollution of the habitat. Amalgam is panned following traditional practice in
wooden pans, whereas excess mercury is squeezed through a piece of cloth
regaining it for further reuse. All families use water from the open pits for
taking bath and washing clothes.
According to a mass balance based on both analysis of amalgamation
wastes and interviews with the miners, the ratio Hglost : Auproduced in Galangan
is estimated of being in the range of 1.5 to 2, which is an average ratio found in
SSM worldwide (Veiga and Baker, 2003; Rodrigues-Filho et al, 2004). Assuming
that 150 to 300 g of mercury are lost per unit/month, 1 to 2 tonnes of mercury
are being released annually to the entire area.
Amalgam is burned in gold shops, commercial stores in a chimney-like
construction, which leads the mercury vapor just outside the house by an outlet
pipe. The gold shops are located in the middle of the village. There is no proper
ventilation for the mercury fumes, where in the rainy season 15 kg of gold is
sold to 20 gold shops and melted in the village, releasing at least 200 kg/annum
of mercury in the village. Housing areas, food stalls and a school are just
nearby.
According to local authorities about 500 processing units exist in the
entire mining area, each one with 4 to 6 miners, who work 10 hours a day,
during 6 days a week. Some 3 to 8 g of gold are recovered per unit/day.
7
RT2004-016-00 CETEM/MCT
A sampling campaign of soils, sediments, water and biota was conducted
in the Galangan mining site, Katingan Watershed, consisting of 470 samples
split into 264 fish samples, and 206 samples of sediments, soils, water, plants
and other aquatic organisms, covering the whole study area, in order to address
the identification and location of mercury hotspots.
Mercury concentrations in sediments of the Katingan River are in general
significantly lower than in the Talawaan River in North Sulawesi. This is likely
related to both a less polluting mineral processing technique used in Galangan
and an existing lower Hg background in the Katingan Basin. This is indicated
by relatively low Hg levels present in sediments that have been deposited many
years before starting SSM activities in the region. Lower sections of sediment
cores taken in riversides and floodplains of the Katingan River are assumed to
mirror the existing sedimentological conditions prior to the start of the gold
rush (see Figure 23).
Distribution of mercury concentrations in a sediment core from the
Katingan River, upstream of mining sites, shows significantly lower levels,
averaging 0.38 µg/g, than in the cores taken downstream of the mining areas,
averaging 2.87 µg/g, 2.19 µg/g and 2.33 µg/g, respectively in sediment cores
A301, A501 and A601. Therefore, the Hg range found in core 201 indicates an
existing increased Hg background for this study area (see Figures 23 to 26).
Moreover, the sediment cores taken downstream have a similar varying
distribution of Hg levels with depth, showing a common peak of Hg
concentration between depths from 6 to 12 cm, ranging from 8 µg/g in core
A301 to 21 µg/g in core A501, and to 4 µg/g in core 601 (see Figures 24 to 26).
This Hg peak is likely related to a major Hg release from the mining sites some
years ago that probably mirrors a more intense Hg use at the beginning of the
gold rush in 1998.
The distribution of mercury concentrations in individual sediment
samples from the Galangan mining site resembles the levels found along the
downstream section of the Katingan River, as presented in Figure 27. This a
clear indication that sediments from both the mining site and the lower
Katingan River are closely related to each other as a consequence of mercury
discharges from SSM operations.
Nevertheless, those Hg concentrations in the Galangan region are at least
one order of magnitude lower than in the Talawaan region.
The prevailing sandy composition of the mining tailings that is driven by
the type of alluvial deposit with almost no silt-clay fraction is a likely
explanation for the relatively low levels, since Hg released during
amalgamation finds no particulate surface to be adsorbed on, leading to Hg
concentrations even lower than in river sediments (see Figure 28).
On the other hand, although a relatively moderate Hg contamination
degree in amalgamation tailings is to be reported for Galangan, there are strong
indications that mercury finds a favorable condition for becoming highly
8
RT2004-016-00 CETEM/MCT
mobile as indicated by the abnormally high levels found in the organic fine
cover of the tailings, composed basically of algae. This is an indication that
mercury is being dissolved by the organic dark waters of Galangan, which is a
potentially favorable condition for increasing mercury bioavailability through
methylation (see Figure 28).
Mercury in Fish North Sulawesi and Central Kalimantan
The occurrence of fish was investigated in 7 sub-areas, in the Talawaan
mining area, North Sulawesi. Along the Talawaan River, 156 fish specimens of
11 species were collected (gabus, gete-gete, gold fish, guruo, kesa, lalimata,
mujair, nilem, payanka, sepot, supit), one specimen (gold fish) from fish-
farming, while 26 specimens of 5 marine species were bought at the fish market
in Manado (cakalang, deho, tudę, bobara and malalugis).
In Central Kalimantan, 264 fish specimens of 25 species (banta, baung,
bawal, darap, gabus, gold fish, gurame, juah, kalatau, kalui, kapar, karandang,
kelabau, lais, lais lintang, lawang, nilem, papayu, patin, putin, saluang, sapat,
tahuman, tekung, tongkol) were collected. Five specimens of five species were
bought at the fish market in Palangkaraya. It is important to realize that some
specimens came from fish farming inside the Katingan river, such as patin and
tahuman species.
The present results show that total mercury concentrations in fish from
North Sulawesi are higher than in fish from Central Kalimantan area and the
Table 6 shows the minimum and maximum values for Hg in fish in both areas.
The resulted mean of Hg from Central Kalimantan is 0.21±0.36 µg/g (N=264)
and its maximum value is 1.83 µg/g, while in North Sulawesi mean Hg level is
0.58±0.45 µg/g (N=130) and its maximum value reaches 2.60 µg/g.
It is well known that freshwater biota is able to accumulate Hg from
natural and anthropogenic sources. Maximum background levels for Hg in
uncontaminated freshwater fish are in the range of 0.1 to 0.3 µg/g, although
considerably higher levels can be found in large predators.
The mean concentration of Hg (0.36 µg/g) in fish species from this work
was within that range and lower than 0.5 µg/g, the Hg concentration in fish
recommended by WHO (1990) as limit for human protection by Hg exposure by
fish consumption. However, we have to take into account that these species are
smaller and lighter than fish from other aquatic systems influenced by gold
mining, such as Amazon region (CETEM/IEC, 2004). In addition, among the
analyzed fish, 81 specimens, 21% of total fish sampled (389 fish) presented Hg
concentrations above 0.5 µg/g. Whereas in Central Kalimantan less than 10% of
fish samples showed Hg levels above that limit, in North Sulawesi this
percentage amounted to more than 45%. It should be considered that fish from
North Sulawesi are smaller and lighter than fish from Central Kalimantan,
9
RT2004-016-00 CETEM/MCT
suggesting that Hg bioavaliability in Manado can be higher than in Central
Kalimantan.
In North Sulawesi, Hg levels in fish from Toldano river (reference area-
T6) showed the lowest mercury levels, averaging 0.02 µg/g, while T2, a dam
reservoir close to the mining sites, showed the highest mercury levels in fish,
0.85 µg/g being considered as the most contaminated site in the area. The Hg
levels in the reference site are quite low, although they are from the
hydroelectric power plant lake, mentioned, sometimes, as an environment that
may show high mercury methylation rate.
In Central Kalimantan area, fish from flooded open pits in mining site
areas showed the highest Hg levels. These open pits are used for gold
processing and, also, for fishing, bathing and domestic wastes collected. While
the average of Hg in fish from the whole study area are quite low, the Hg levels
in fish from the flooded open pits in the small-scale mining area are considered
as the most contaminated sites. As miners and their families are living close to
those open pits and might often consume those fish, this characterizes a
potential pathway for methylmercury exposure to the local population.
By employing a risk assessment to human health, toxicological, rather
than simply statistical, significance of the contamination can be ascertained. At
a screening level, a Hazard Quotient (HQ) approach (USEPA, 1989), assumes
that there is a level of exposure (i.e., RfD = Reference of Dose) for non-
carcinogenic substances below which it is unlikely for even sensitive
populations to experience adverse health effects. The MeHg RfD value is 1E-04
mg.Kg-1.d-1 (IRIS 1995) and its uncertainty factor is 10 and its confidence level
is medium. Uncertainties of the RfD statistics have been reported, suggesting an
under-estimation of RfD for Hg presented in IRIS, 1995 (Smith and Farris 1996).
However, other authors suggest that there is no safe human exposure to MeHg
and that of all living species, human appear to have weakest defenses against
MeHg (Clarkson 1996). Considerable gaps in our knowledge about this remain.
Our approach, therefore, is to use the human risk assessment proposed
by USEPA, at a screening level. HQ is defined as the ratio of a single substance
exposure level (E) to a reference of dose (E/RfD). When HQ exceeds unity,
there may be concern for potential health effects. The estimated exposure level
was obtained by multiplication of 95th percentil upperbound estimate of mean
Hg concentration considering all fish as suggested by USEPA (1989), by the
adult human ingestion rate for local populations. Most of the works about
riverside population assume consumption rate close to 0.2 Kg.d-1.
As a matter of fact most people in North Sulawesi consume fish from the
market, mainly marine fish or freshwater from fish farming, rather than those
small fish from the study sites.
In Central Kalimantan, it should be taken into account that miners living
close to the P4 study site may consume fish caught in flooded open pits. As they
are not a riverside population, but considering the poverty, one could assume
that the fish consumption rate close to 0.05 Kg.d-1. Finally, the intake dose is
10
RT2004-016-00 CETEM/MCT
estimated by dividing that product by 70 kg, considering an average weight of a
human adult. Although total mercury was quantified in fish, it has been
demonstrated that about 75-95% of total mercury is methylmercury in fish
muscles. Thus, in a conservative approach, it has been assumed that total
mercury in fish represents methylmercury. The resultant HQs for MeHg fall
above the unit for North Sulawesi considering the fish market consumption. For
Central Kalimantan, both total and P4 sampling site, HQ resulted above the
unity, 2.4 and 9.9, respectively, which means that the population is subject to
potential health hazards due to fish consumption. This conclusion is fully in
agreement with indications of mercury exposure achieved by the health
assessment.
Health Assessment North Sulawesi and Central Kalimantan
There is no clean and safe drinking water, no waste disposal for the toxic
mercury or any other waste or human discharge in both study areas. Hygienic
standards are extremely low and are a reason for many infectious diseases such
as diarrhoea, typhoid and parasitism.
Road accidents, accidents in insecure tunnels and amalgamation plants,
malaria, tuberculosis, and sexually transmitted diseases are the dominant
causes of morbidity and mortality. HIV seems to increase within the mobile
men with money ("MMM") subgroup, esp. single male miners. But no accurate
data on the incidence of AIDS exists. Smoking is a very common, unhealthy
habit of the men.
The health centre in Kereng Pangi and Tatelu are able to offer some basic,
but adequate health services in the area. But they are not equipped for the
occupational health hazards in gold mining areas (accidents, mercury).
The extraction of the gold with liquid mercury releases serious amounts
of mercury, especially high toxic mercury fumes into the local environment.
The health status of 492 volunteers in Sulawesi and Kalimantan was assessed
with a standardised health assessment protocol from UNIDO (Veiga 2003) by
an expert team from the University of Munich/Germany in August/September
2003. 23 people had to be excluded from the further statistical evaluation due to
neurological diseases or their age. 222 people come from Sulawesi, and 247
from Kalimantan (see as also Table 5).
For statistical purposes a control group was selected in Air Mandidi
(Sulawesi), the adults and children there showed low levels of mercury in all
bio-monitors and a low medical score, indicating that they were not exposed to
mercury (see Figure 3, 5, 7). In Kalimantan a control group, mainly women
were selected approx. 35 km away in Tangkiling, a village situated at a different
river system. The urine levels of this group were low during the analysis,
performed during the field project. The urine levels were confirmed in the later
re-analysis in the University laboratory (see Figure 4). But unexpectedly the
blood and hair analysis showed increased levels of mercury in these
11
RT2004-016-00 CETEM/MCT
participants (see Figure B6 and 8). Nevertheless, this is in accordance with the
indications from the environmental assessment, namely a elevated Hg
background in sediments, a reatively high Hg mobility and a high Hg
biovailability, which is likely related to existing dark water rivers in the area.
The medical score sum between the control group in Sulawesi, and the
group in Tangkiling also differs (see Figure 18 and 19). Fish eating habits
contribute to the internal exposure leading to the hypothesis that the population
in Tangkiling is exposed through fish from the local river (see Figure 9, 10. 11).
For the statistical analysis Tangkiling was considered to be another exposed
area, and only the control group from Air Mandidi (Sulawesi) was used for all
statistical comparisons.
The mercury levels in the bio-monitors urine, blood and hair were
significantly higher in all exposed populations than in the control group (see
Figure B3 to B10). Mainly amalgam-smelters showed mercury levels above the
toxicological threshold limit HBM II in urine, blood and hair. Mainly inorganic
mercury contributes to the high body burden of the workers.
Some few cases, all from Galangan in Kalimantan, showed extreme high
mercury concentrations in blood and extreme high concentrations of organic
bound mercury in hair. This may be explained by fishing in heavily mercury
contaminated pit holes in this mining area, as observed from the results of Hg
in fish from the flooded open pits.
Typical symptoms of mercury intoxication were prevalent in the exposed
groups. The medical score sum plus the bio-monitoring results made it possible
to stablish in Tatelu (Sulawesi) in 33 out of 61 amalgam-smelters the diagnosis
of a chronic mercury intoxication, and in 4 out of 17 mineral processors. Within
the other population in Tatelu 2 out of 18 people showed a mercury
intoxication. In the control group there was no case of a mercury intoxication.
In Kereng Pangi (Kalimantan) in 41 out of 69 amalgam-smelters the
diagnosis of a chronic mercury intoxication was made, and in 13 out of 30
mineral processors. Within the other population in Kereng Pangi 23 out of 67
people showed a mercury intoxication. In the Tangkiling group 8 out of 36
people were found to be intoxicated, and 4 out of 10 former miners.
Children working with mercury were found as intoxicated in 9 out of 51
children in Tatelu, and 2 out of 8 children in Kereng Pangi. Children not
working, but living in the exposed areas were intoxicated in 5 out of 27 cases in
Kereng Pangi and in no case in Tatelu. None of the children from the control
area are intoxicated.
The percentage of intoxications among amalgam-smelters is similar in
Tatelu (54,1%) and Kereng Pangi (59,4%). In Rwamagasa / Tanzania 25,3% of
amalgam smelters were found to be intoxicated, and in the gold mining area of
Mt. Diwata in the Philippines, 85.4 % of the amalgam-smelters were intoxicated
(Drasch 2004b, Drasch 2001). The difference cannot be explained by a different,
i.e. a safer burning technique in Rwamagasa. Moreover, it must kept in mind,
that the maximal burden (as expressed in the top mercury concentrations found
12
RT2004-016-00 CETEM/MCT
in the bio-monitors) was even higher than in Mt. Diwata. In the less exposed
population and the children, the rates of intoxication are much higher in Kereng
Pangi.
An explanation for these differences cannot be found only in the
amalgam smelting techniques. The main difference between Tatelu and Kereng
Pangi is, that in Tatelu the general population does not live within the mining
area itself, so they are less exposed. And the difference to Mt. Diwata is that the
Galangan area around Kereng Pangi is flat compared the mountainous area of
Mt. Diwata. The difference to Tanzania might be explained by the much lower
exposure to liquid mercury in Rwamagasa, due to a lower output of gold from
the ore.
Child labour in the mining sites is very common from the age of 10 years
of age and upwards, the children work and play with their bare hands with
toxic mercury. Mercury can cause severe damage to the developing brain. It is a
dramatic outcome, that already 17,6% of the children working with mercury in
Tatelu and 25% of the children working in Kereng Pangi with mercury,
respectively 18,5% of the children living in Kereng Pangi, had a mercury
intoxication. E.g. in Kereng Pangi some gold-smelting shops (Toko Mas) are
situated opposite the mosque and one school.
Nursed babies of mothers living in Kereng Pangi are at special risk. In 10
out of 15 breast-milk samples of nursing mothers, mercury levels were above
comparison levels of 2 µg/l. In two cases the levels were extremely high, well
above reference dose levels of US-EPA.. In addition to a placental transfer of
mercury during pregnancy from the mother to the foetus (as has been proved in
other studies) this high mercury burden of nursed babies is a new, up to now
unknown health hazard in mining communities.
Poverty is a main reason for the bad health status of the small-scale
mining communities. Struggling for pure survival makes mining for gold a
necessity to find any financial resource. The daily fight of survival forces the
miners put their own health and the health of their children at risk.
A reduction of the release of mercury vapours from small-scale gold
mining as in Indonesia into the atmosphere will not only reduce the number of
mercury intoxicated people in the mining area proper. It will reduce the global
pollution of the atmosphere with mercury, because most of the mercury vapour
formed by the open burning of gold amalgam is not deposited locally, but is
transported by air over long-range distances all over the globe (Lamborg 2002).
The total release of mercury vapour from gold mining is estimated today up to
1,000 metric tons per year (MMSD 2002), while from all other anthropogenic
sources approximately 1.900 tons were released into the atmosphere (Pirrone
2001).
The primary result is, that mercury is a serious health hazard in the
small-scale gold mining areas of Tatelu (Sulawesi) and Kereng Pangi
(Kalimantan). Working for many years in the amalgamation or burning process,
especially amalgam-burning resulted in severe symptoms of mercury
13
RT2004-016-00 CETEM/MCT
intoxication. The exposure of the whole community to mercury is reflected in
raised mercury levels in the urine, and symptoms of brain damage like ataxia,
tremor and movement disorders. In over 50% of the amalgam-smelters from
both areas a mercury intoxication (according to the definition of UNIDO (Veiga
2003)) was diagnosed. Former miners, mineral processors and the general
population in the mining areas were also intoxicated. Especially frightening are
high levels of mercury in breast milk samples in Kereng Pangi (Kalimantan),
and the high incidence of child labour. This high incidence of child labour
ensues in the very early child mercury intoxication in both areas.
The background burden in the control group in Air Mandidi (Sulawesi)
is in the same order of magnitude as in western industrial countries.
Although mercury is heavily burdening the environment in North
Sulawesi, health hazards due to methylmercury exposure, as indicated by
results in fish, hair, blood and breast milk, are more likely occurring in Central
Kalimantan. This may be explained by a combination of factors, namely the
adverse living conditions in Galangan that make the population dependent on
fishing in flooded open pits; a high mercury bioavailability in dark water
systems, and an increased mercury background in the local environment, as
indicated by the environmental assessment. In contrast, there is a lack of
pathways between methylmercury present in the environment and the local
population in North Sulawesi, since the availability of fish in the Talawaan
River is very limited, resulting in consumption from marine fish. On the other
hand, it is predictable that the huge mercury burden found in both biological
and inorganic samples from the Talawaan River is also, to a certain extent,
taken up by the marine biota occuring in the Manado Bay.
14
RT2004-016-00 CETEM/MCT
1. Introduction
The present report describes the results achieved in two small scale gold
mining areas in Indonesia in North Sulawesi and Central Kalimantan - as
target areas of the environmental and health assessment (E&HA) conducted by
the Centre for Mineral Technology (CETEM) and the Institute of Forensic
Medicine (IFM-University of Munich) under the general coordination of the
United Nations Industrial Development Organization (UNIDO). The E&HA is a
part of the GEF/UNIDP/UNIDO Global Mercury Project - Removal of Barriers
to the Introduction of Cleaner Artisanal Gold Mining and Extraction
Technologies.
In order to identify sites with high concentration of mercury (hotspots) a
sampling campaign of soils, sediments and biota was conducted, consisting of
768 samples split into 420 biological indicators as fish, plants and shells, and 348
inorganic indicators as sediments, soils and water. The present report describes
characteristics of environmental samples and results of mercury analyses in
samples from Indonesian gold mining areas in Talawaan (North Sulawesi) and
Galangan (Central Kalimantan). An attempt to describe the distribution of
mercury and to achieve an environmental assessment of mercury pollution is
presented. A research team comprizing 11 scientists from CETEM (7 members)
and IFM (4 members) proceeded to Indonesia in September 2003 and has
accomplished the sampling campaign within 35 days.
The Health Assessment project is part of a major UNIDO project to
remove "Barriers to the Introduction of Cleaner Artisanal Gold Mining and
Extraction Technologies", which is performed in six countries. The main
funding comes from GEF through UNDP to UNIDO. The University of Munich
is subcontractor to CETEM for the health assessment in Indonesia.
The aim of the subcontract was to undertake two medical investigations
of approximately 250 people living in the Karang Pangi area (Kalimantan), and
of approximately 250 people living in the Tatelu area (Sulawesi), both in
Indonesia. The ultimate aim of the whole UNIDO project is to reduce mercury
losses in the project demonstration sites by means of introducing new
technologies, while improving the income of the miners through more efficient
recovery, increasing knowledge and awareness, and providing policy advice on
the regulation of artisanal gold mining with due consideration for gender
issues.
Over 100 years ago, the Dutch complained of artisanal gold mining in the
nearby Ratatotok region in the North Sulawesi, and illegal miners still operate
in that region. In 1997, the awarding of a gold mine concession to the Aurora
Mining Co. of Australia in the Dimembe Sub-district in the North Sulawesi
Province, northeast of Manado City, gave rise to a gold rush of artisanal miners
to the area and this rush has expanded to include thousands of miners
(Limbong et al., 2003). According to this author, fluctuation of Hg levels in
water and sediment in relation to the sampling sites and gold processing plant
15
RT2004-016-00 CETEM/MCT
locations within the Talawaan Watershed provide insight into the pathway of
Hg dispersion from gold processing plants throughout the river system.
Increasing Hg levels in fish samples provided strong indication of a high
bioaccumulation within this contaminated area.
Mercury
Mercury is a silvery-white shiny heavy metal, liquid at room
temperature. Mercury exists in different forms:
- Metallic (elemental) mercury (Hg0)
- Liquid in room temperature (less toxic), as mercury vapor highly toxic
- Inorganic mercury (salt of Hg2+)
The lungs absorb 80% of mercury vapour. Target organs are the brain
(cerebellum) and the kidney. Mercury is a neurotoxin, nephrotoxin and
teratogen. Mercury can cause acute and chronic intoxication.
Chronology of the Field Work in Indonesia
August 2nd 2003 (Munich Jacarta) IFM´s staff proceeded to Jacarta;
August 4th 2003 (Jacarta Palankaraya/Kalimantan) IFM´s staff proceeded to
Palenkaraya, and on the next day to the Central Kalimantan mining area;
August 15th 2003 (Palenkaraya Manado) IFM´s staff transfer to Manado;
August 17th 2003 (Manado Talawaan) IFM´s staff proceeded to the Talawaan
area;
August 29th 2003 (Talawaan Manado) IFM´s staff transfer to Manado;
August 30th 2003 (Rio de Janeiro Jacarta) CETEM´s staff proceeded to
Jacarta, and one day later to Manado;
September 1st 2003 IFM´s and CETEM´s staff meeting with Indonesian
Projects´s counterparts in Manado for Field Work Briefing;
September 2nd 2003 (Manado Talawaan) CETEM´s staff proceeded to the
Talawaan area; IFM´s staff proceeded back to the office;
September 12th 2003 (Talawaan Manado) CETEM´s staff transfer to Manado;
September 13th 2003 (Manado Palenkaraya) CETEM´s staff transfer to
Palankaraya, and one day later to the Central Kalimantan mining area;
September 25th 2003 (Palenkaraya Jacarta Rio de Janeiro) CETEM´s staff
proceeded to Jacarta, and one day later back to the office for laboratory work
and Field Work Report.
16
RT2004-016-00 CETEM/MCT
1.1. Location of the Study Areas in Indonesia
A large number of artisanal gold mining workers in Indonesia indicates
that this activity has great importance as an informal employment opportunity
in rural areas. However all related processes of separating gold ores using
mercury are undertaken with a low level of technical knowledge and skills, no
regulation, and with disregard for the safety of human health and environment.
The situation is generating serious potential health and environmental risks.
According to official estimates of Department of Energy and Mineral Resources,
there were more than 500 locations where some 100,000 illegal small-scale gold
miners were active in 2000, whereas more than 500,000 people depend on this
activity for their livelihood (Aspinall, 2001). Artisanal and small scale gold
mining covers West and Central Java, Sumatra, Central and East Kalimantan,
North Sulawesi and others, while nearly 180 tonnes of mercury are released to
the environment annually (UNIDO, 2002).
1.1.1. North Sulawesi - Talawaan
North Sulawesi is a region in the Celebes Sea. Manado is the capital of
North Sulawesi, and has approx. 600.000 inhabitants.
Manado is beautifully situated directly at the sea, and Manado Bay is
surrounded by some famous islands, for example Bunaken island. Bunaken
National Marine park is well known for its beautiful coral reefs, which are a
tourist attraction. Three small rivers drain into this bay. They origin from the
Talawaan watershed, approx. 20 to 30 km away from Manado. These rivers
come from the Klabat mountain in the mining area of Tatelu. The countryside is
very hilly, and dominated by palm trees, and intensive farming. Gold fish is
cultivated in fish ponds in the Talawaan area.
Tatelu is a small village with approx. 2.000 inhabitants. Next to the
village is the mining area. The ore is mined up in the mountains. A group of 15-
20 miners live in very basic camps beside their tunnel.
The tunnels have a small diameter, just enough that one person can fit in,
and are dug by hand. Tunnels are not very deep, approx. 20-35 meters. The
miners try to follow veins, so tunnels are curved, and tend to be very steep.
Miners work in shifts.
Although mainly young men work and live here, some women and a
few children also live near the tunnels. The ore is carried out in sacks, and the
sacks are brought downhill (approx. 30 minutes away) with the support of
buffalo carts.
The processing area is still dominated by men, but many women and
quite a few children live here too. Numbers of active miners in the mountain
and in the valley seem to vary, most estimations were close to 2.000 active
miners.
In the Talawaan region, located at the Northern part of Sulawesi Island,
the main mining area (N 001° 31` 51,2" E 124° 58` 53,2") lies in the Dimembe
17
RT2004-016-00 CETEM/MCT
sub-district, between the villages of Talawaan and Tatelu besides a small creek,
draining into Talawaan River and supplying water for small scale gold mining
(SSM) activities.
The Talawaan watershed drains from the peak of Mount Klabat (the
highest point with 1.995 m), into the western coast of Kabupaten Minahasa and
Kota Manado. Mining activity is extended throughout an area of 34.400 ha.
The study area includes the drainage basins of the Talawaan and Tatelu
River. The drainages flow through the main gold processing units where
mercury is widely used and released. About one third of the coastline of the
area is within the boundary of the Bunaken National Marine Park. The coastal
environment includes mangrove areas and coral reefs.
Over 100 years ago, there were artisanal gold mining activities in the
nearby Ratatotok region in North Sulawesi, whereas illegal miners still operate
in that region. In 1997, the awarding of a gold mine concession to the Aurora
Mining Co. of Australia in the Dimembe Sub-district in the North Sulawesi
Province, northeast of Manado City, gave rise to a gold rush of artisanal miners
to the area and this rush has expanded to encompass thousands of miners
(Limbong et al., 2003).
The distance from the peak of Mount Klabat to the sea is approximately
20 km. Talawaan and Bailang Rivers flow through the main center of the
mining area (Figure 1). Land use in the Talawaan Watershed is primarily
agricultural and is dominated by plantations of coconut, clove, and nutmeg.
There are also associated areas of irrigated rice cultivation and fishponds.
Cattle, pigs, goats, chickens and ducks are reared in the region.
There is no important industry located along the banks of the main rivers
(Martens, 2000). Fishing is carried out in the coastal areas, and crabs and
molluscs are also collected in the area for human consumption. There are also
small aquaculture activities around brackish water in the area.
The population of the area is estimated to reach approximately 150,000
inhabitants (Martens, 2000). The majority of households in the area are
dependent upon agriculture as their main source of income and sustenance, but
the number of individuals involved in gold mining has increased rapidly since
1998.
The mining areas are located in the villages of Tatelu, Warukapas,
Rondor, and Talawaan of the Dimembe sub-district. By June 2001, there were
approximately 400 gold processing plants in the entire area, while nowadays it
is estimated a number of 130 units in the Tatelu area alone. The processing
plants are mostly built close to river margins. Processing plants are primarily
located in the upper part of the watershed. This mining area is more accessible
than other mining areas in the North Sulawesi Province, since it is located in an
agricultural area near the villages, and is also close to Manado, the capital of the
province.
18
RT2004-016-00 CETEM/MCT
According to results obtained by Limbong et al. (2003) the fluctuation of
Hg levels in water and sediments in relation to the sampling sites and gold
processing plant locations within the Talawaan Watershed provide insight into
the pathway of Hg dispersion from gold processing plants throughout the river
system. Increasing Hg levels in fish samples provided strong indication of a
high bioaccumulation within the area. According to the authors, environmental
contamination due to Hg from artisanal gold mining activities is elevated.
Therefore, reduction of Hg emission from the processing plants should be of
immediate concern. A regular monitoring program would be necessary in order
to better elucidate the rate of bioaccumulation and biomagnification. Such a
program would also facilitate a more detailed risk assessment regarding human
health issues.
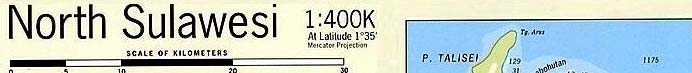
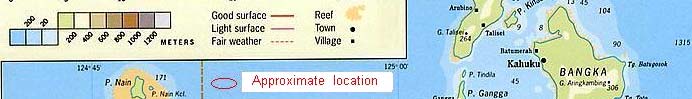
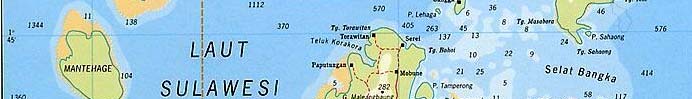
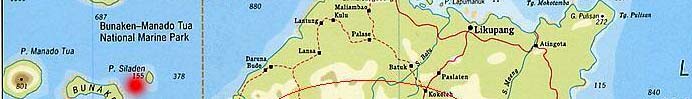
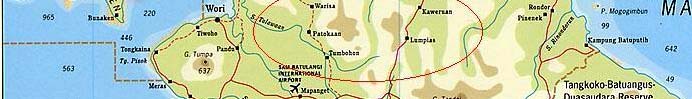
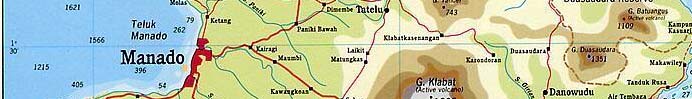
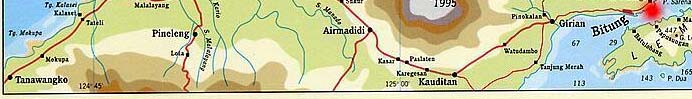
TALAWAAN
Figure 1 - Approximate location of the Talawaan Watershed. Source:
perso.wanadoo.fr/pnoel/ map_sula.htm
19
RT2004-016-00 CETEM/MCT
1.1.2. Central Kalimantan - Galangan
Katingan District, located in the southern-central part of the Island of
Kalimantan, also known as Borneo Island, the main mining site is Galangan
(001° 59' 16,4" S 113° 17' 09,1" E), also known as Ampalit, lying on the right
margin of the Katingan river which drains into the Java Sea about 200 km to the
South (Figure 2).
Galangan mining site is located just 7 km away from Kereng Pangi
village, district of Katingan, which provides infrastructure for miners in
Galangan.. This region can be reached by automobile, taking 90 minutes from
Palangkaraya (the capital city of Central Kalimantan Province). The geographic
coordinates of this region are from 01°56,563' S to 02°00,349' S and 113°16,565' E
to 113°17,182' E.
In Central Kalimantan from Palangkaraya airport it takes approximately
40 minutes by car to Tangkiling (control area), and another 30 minutes to
Kasongan (District capital). Another 20 minutes further to the west is located
the village of Kereng Pangi (mining town).
The climate is wet tropical with mean daily temperatur of 32 °C and two
main seasons, a dry season helding from May to September and a rainy season
from October to April. The approximate precipitation in the rainy season reachs
271-418 mm, whereas in the dry season these values decrease to 33-179 mm.
The earliest incidence of small scale mining activity in Central
Kalimantan has begun at Tewah-north of Palangkaraya, upstream of Kahayan
River, in 1987. Illegal miners worked at several places in the area belonging to
the mining company PT. Tambang Tewah Perkasa. The places known as
Gudang Setengah, Sumurmas, and Batu api were target, whereas the
Sumurmas village formed due to the mining activity. The Indonesian
Government has undertaken various programs and implemented law
enforcement to regulate their activity. Nevertheless, from these locations illegal
mining spread all over Central Kalimantan, one of them known as Galangan (J.
Dwipriambodo Report, 2003).
Galangan is on the eastside of the Contract Work Area of PT. Ampalit
Mas Perdana (Gold Mining Company) that recently stopped its activities in the
area.
The small scale gold mining activity has begun in this area in 1998, while
at the end of 1999 there were at least 437 processing units. In the middle of year
2000 more miners came and so this number increased to more than 500 units
(according to the monitoring data of August 2000, Mines and Energy Office of
Central Kalimantan). Since each unit is operated by 4-6 worker, so there are at
least 2,500 workers directly involved in the mining activity in this area.
Most miners came to Galangan from outside this island, most of them
from Java, South Kalimantan and Madura, before ethnical conflict of 2001,
when hundreds of miners were killed, being the remaining miners from
20
RT2004-016-00 CETEM/MCT
Madura expeled. The causes of this gold rush in Galangan can be described as a
combination of the following factors:
- impact of the Indonesian economic crisis in the middle of 1997 that
caused significant unemployment;
- Easy
accessibility;
- Relatively simple technology and low capital cost.
Figure 2 - Map of study areas in the Galangan Mining site (Central
Kalimantan)
21
RT2004-016-00 CETEM/MCT
2. Materials and Methods
2.1. Environmental Assessment
2.1.1. Sampling estrategy
A sampling campaign of soils, sediments and biota was conducted,
consisting of 768 samples split into 420 biological indicators as fish, plants and
shells, and 348 inorganic indicators, as sediments, soils and water in order to
address both the identification and evaluation of mercury hotspots.
Amalgamation tailings dumped into drainage systems originate hotspots of
metallic mercury (mining hotspot), where abnormally high concentrations are to
be found in the heavy fraction of sediments.
Due to its typical heterogeneous distribution, one may face enormous
difficulties in locating a mining hotspot of mercury and its dispersion patterns
downstream in a given mining area, as conventional geochemical exploration
techniques have been used unsuccessfully in previous studies. Therefore, the
introduction of novel sampling and analytical methods has been required,
including in situ mercury analyses by either a semi-quantitative colorimetric
method or a quantitative field analyser.
Individual and composite substrate (soil and sediment) samples were
collected with an plastic shovel, labeled, and stored in plastic bags. Composite
samples were obtained mixing sub-samples in the plastic bags.
Sampling and analysis of total suspended solids (TSS) and water in
aquatic systems play a pivotal role in assessing mercury mobility and the
nature of pollution. Mercury transported either in solution or onto suspended
particles may be deposited in riverside deposits forming mercury sinks, which
are potential sources for mercury remobilization, since mercury is adsorbed
onto fine particles and prone to form soluble complexes, mainly in the presence
of humic substances. Therefore, high contents of organic matter in sediments
have been sought during sampling.
Simple sampling methods, consisting of pan concentrates for mercury
analysis were also used for locating mercury hotspots. Another approach
enables the reconstruction of the local mining history and the identification of
amalgamation tailings, through establishing confidence among miners and
researchers, so that they agree to indicate places where former activities have
been conducted.
Some physiochemical parameters are considered important for assessing
the mobility of mercury in the environment, and its eventual bioaccumulation
and/or biomagnification in fish, mainly as methilmercury. Therefore,
physiochemical parameters of water, such as temperature, electrical
conductivity, pH and dissolved oxygen were determined in the drainage waters
by multi-electrodes.
22
RT2004-016-00 CETEM/MCT
Since sampling of TSS by filtering through 0.45 µm membranes has been
reported in some cases as controvertial, due to its unefficiency of recovering
enough solid material for analysis, it was sought naturally settled TSS samples
where favorable hydrodynamic conditions were to be found.
Fish samples were collected by gill-netting and fishing line with a fish-
hook. Each specimen was weighed (Wt), and its length (Lt) was measured at the
time of collection.
Plant samples were collected manually or using a shovel to dig out the
roots, washed several times, labeled, stored in plastic bags and frozen.
Approximately three replicates of each specimen were collected. In laboratory,
plants samples were washed with tap water and cleaned with a small brush to
remove potential aerial superficial mercury contamination. Roots, stems and
leaves were analyzed separately. Wet materials were used to obtain total
mercury concentrations in plant parts. Water contents in plant samples were
utilized to transform wet weight concentration to dry weight concentration.
2.1.2. Sample Preparation and Analyses
Preparation of sediment, soil and tailing samples consisted of
homogenization followed by wet sieving for separating grain size fractions
above and below 200 # (74 µm). After that, each fraction has been dried at 40 °C
for analysis.
After removing the individual axial muscle (fillet) of fish, each sample
was placed in polyethylene bags and in ice boxes, and frozen after reaching
hotel facilities.
The method used in the laboratory for the determination of total mercury
in environmental samples (soils, sediments, fish) follows the methodology
developed by Akagi and Nishimura (1991). It involves acid digestion followed
by reduction to elemental mercury, aeration and measurement of mercury
absorption with cold vapor atomic absorption spectrometry.
The sample digestion procedure insures complete digestion of organic
materials and at the same time avoiding mercury loss by using a combination of
acids and oxidizing agents. This combination involves a mixture of nitric,
perchloric and sulfuric acids. Additionally, water is added to protein-rich
samples, to avoid frothing upon heating. The sample is then heated at 250oC for
20 minutes. The sample solution is reduced by staneous chloride, generating
elemental mercury vapor, which is then circulated in a closed system.
Absorbance is measured when equilibrium of mercury vapor between gas and
liquid phases is reached. The use of a syringe with needle when adding the
reducing agent avoids loss of mercury by vaporization. The detection limit of
the method is 0.5 ng Hg.
Hg was analyzed in the fish muscle through Atomic Absorption
Spectrophotometer (KK.Sanso SS) using a Vapor Generation Accessory-VGA
(CVAAS). For the analysis of Hg-total, approximately 0.5 g of tissue was
23
RT2004-016-00 CETEM/MCT
weighed in 50-ml-vol flasks, to which was added 2 ml of HNO3-HClO4 (1:1), 5
ml of H2SO4, and 1 ml of H2O (Hg free), and heated on a hot plate to 230-250°C
for 20 minutes. After cooling, the digested sample solution was made up to 50
ml with water. An aliquot (5 ml) of digested sample solution was introduced in
the Automatic Mercury Analyzer Hg 3500. The difference in duplicate sample
analyses was less than 10% (precision of measurements was 90%). The accuracy
of analyses was estimated with analyses of biological tissue standard reference
materials from International Atomic Energy Agency. The results indicated that
sample preparation and analytical procedures consistently produced accurate
measures of Hg concentrations.
2.1.3. Statistical Analyses
Statistical significance between Hg concentrations and allometric
parameters (weight and length) among fish from different SSM sites were tested
using parametric Student's T-test after Levene's test for equality of variance, or,
if the underlying assumptions for parametric testing are not met, a
nonparametric test of significance, the Mann-Whitney U-test was employed.
The significant level considered was the probability level 0.05. Correlation
analyses were determined with both the Pearson correlation coefficient and/or
the Spearman rank correlation coefficient. Significance of the correlation was
determined with a two-tailed Student's t test. One-way ANOVA followed by
Duncan pos-hoc were performed when appropriate for testing differences
among groups.
Quality assurance/quality control (QA/QC) concerns were addressed
through the use of analytical duplicates. Analytical duplicates were included
with each sample, and duplicate analyses for each sample were checked to
assure that the relative percent difference between duplicates was no greater
than 10%.
2.2. Health Assessment
2.2.1. Material and sample storage
From 492 participants in Indonesia 491 blood samples, 492 urine samples
and 488 hair samples were taken. The blood samples were taken in EDTA-
coated vials. The urine samples were acidified with acetic acid. To avoid de-
gradation, all blood and urine samples were stored permanently and
transported by flight to Germany in an electric cooling box. Until analysis these
samples were stored continuously at 4 °C.
2.2.2. Study Setting and Clinical Examinations
The "Protocols for Environmental and Health Assessment of Mercury
Released by Artisanal and Small-Scale Gold Miners" were developed by
24
RT2004-016-00 CETEM/MCT
UNIDO in collaboration with the Institute of Forensic Medicine, LMU of
Munich, and other international experts (Veiga 2003).
The declaration to volunteer was translated in Bahasa Indonesia as well
as the "Health Assessment Questionnaire" (Appendix 2). The questionnaire
was used to examine the general health condition of members of the mining
communities and to indicate symptoms of mercury poisoning. Anamnestic /
clinical / neurological / toxicological tests were used according to the state of
the art. Participants were examined to identify neurological disturbances,
behavioural disorders, motor neurological functions, cognitive capabilities,
balance, gait, reflexes etc.. The data was compiled for statistical purposes and
maintain confidentiality regarding all health related issues. All participants
were physically examined including neurological testing.
2.2.3. Health Project in the Field
The health project in the field took place from the 2nd of August 2003
until the 8th of September 2003. In Kalimantan the equipment was set up in the
health centre of Kereng Pangi, in Sulawesi in the village hall of Tatelu. Both
facilities were sufficient to perform the examinations, including a mobile
analysis of Hg in urine samples (examination rooms for the team, electricity,
toilet, water).
Team members for the health project in the field were Dr. med. Stephan
Boese-O´Reilly (paediatrician, master of public health, environmental
medicine), Stefan Maydl (physician), Alexandra Dittmann (pharmacist) and
Sven Illig (Physician). Mrs. Selinawati was the Assistant Country Focal Point to
UNIDO and comes from the Indonesian Ministry of Energy and Mineral
Resources. Assigned to the project were nurses to assist the medical
examinations, Asnedi, Muhlis Afatzli, Lesi, Gunarti, Emilia and Susanti in
Kalimantan including Dr. Robertus Pamuryanto; and in Sulawesi J. Palit,
Perumahan Banua Buha Asri and Mrs. Marly Gumalag. These nurses
interviewed all participants.
A mobile Hg analyser was used to determine total mercury in urine.
Video and photo documentation was carried out.
The control group for Kereng Pangi / Kalimantan was examined in
Tangkiling. The control group for Tatelu / Sulawesi was examined in Air
Mandidi. The same methods and teams as in the gold-mining areas were used.
The local health unit in Tangkiling supported the examination. Tangkiling is
approx 35 km away from the mining area, and mercury is not used in the
village. In Air Mandidi the local school and drinking water company supported
the examination. Air Mandidi is approx. 30 km away from the mining area, and
mercury is not used in the area.
Blood, urine and hair were analysed for mercury later at the Ludwig-
Maximilians-University of Munich, Germany.
25
RT2004-016-00 CETEM/MCT
2.2.4. Questionnaire
The participants filled in a questionnaire with assistance from the nurses.
Questions included:
Working with mercury or with mercury polluted tailings?
Burning amalgam in the open?
Melting gold in the open or with inadequate fume hoods?
Drinking alcohol?
Having a kind of a metallic taste?
Suffering from excessive salivation?
Problems with tremor / shaking at work?
Sleeping problems?
Neurological examination
All participants were clinically, mainly neurologically examined. Results
were mainly primarily scored according to ,,Skalen und Scores in der
Neurologie" (Masur 1995):
Signs of bluish discoloration of gums
Rigidity, ataxia and tremor
Test of alternating movements or test for dysdiadochokinesia
Test of the field of vision
Reflexes: knee jerk reflex and biceps reflex
Pathological reflexes: Babinski reflex and mento-labial reflex
Sensory examination
Neuro-psychological testing
The following tests were carried out (Zimmer 1984, Lockowandt 1995,
Masur 1996):
Memory disturbances: Digit span test (Part of Wechsler Memory Scale) to test
the short term memory
Match Box Test (from MOT) to test co-ordination, intentional tremor and
concentration
Frostig Score (subtest Ia 1-9) to test tremor and visual-motoric capacities
Pencil Tapping Test (from MOT) to test intentional tremor and co-ordination
26
RT2004-016-00 CETEM/MCT
Visual field test
The visual field was measured in a very simple way without the need of
any electricity. It was added to the health assessment protocol.
Tremor-meter
A new approach to measure tremor in a more objective way was
performed. PD Dr. Boetzel from the Neurological Clinic, University Hospital in
Munich supplied the team with an instrument to measure tremor. This
instrument is still at a developmental stage. A small sensor was placed on the
fingertip (right and then left side) of each participant. A special electronic unit,
developed by the University, measured the signal and the digital signals were
recorded onto a laptop.
Three different measurements were performed:
Arms outstretched for intentional tremor
Arms bend with the finger tip pointing to the nose for intentional tremor
Arms outstretched - moving fast for 30 cm from left to right and back for
movement analysis.
Due to a few technical problems not all participants could be tested.
There are no results yet available.
The second objective way, the video tapping of finger tremor still needs
to be evaluated, but was good to perform.
Specimens
The following specimens were taken, and two tests (Hg in urine and
proteinuria) were performed immediately:
Blood (EDTA-blood 10 ml)
Urine (spontaneous urine sample 10 ml)
Hair
If a woman was breastfeeding, she was asked for a breast milk sample (to
analyse for mercury).
The specimens urine, blood and breast milk were cooled permanently
after collection until arrival in the laboratory in Munich, Germany.
Laboratory
A mobile Hg analyser was used (Hg-254 NE, Seefelder Messtechnik,
Seefeld, Germany). It is possible to quantify inorganic mercury in urine. 1 ml
urine was diluted with 100 ml water (bottled drinking water). A 2 ml solution
of 10% tin(II)chloride in 6N hydrochloric acid was added to the water-urine
27
RT2004-016-00 CETEM/MCT
solution. The sample was analysed by atomic emission spectrometry. Bottled
drinking water was used as zero standard, and a mercuric nitrate solution as
standard. In most cases it was possible to analyse the sample. One urine sample
can be analysed in approximately 3 minutes. All urine samples were re-
analysed in the "Institute of Forensic Medicine", Munich, Germany.
Test for protein in urine
Protein in urine was tested with a commercial kit (Teco diagnostics
URS10). The test is based on the error-of-indicator principle. Test reagents are
0,3 % w/w tetrabromophenol blue; 99,7 % w/w buffer and non-reactive
ingredients. At a constant pH, the development of any green colour is due to
the presence of protein. Colours range from yellow for "Negative" reaction to
yellow-green and blue-green for a "Positive" reaction. The test area is more
sensitive to albumin than to globulin, haemoglobin, Bence-Jones proteins and
muco-protein. The test area is sensitive to 15 mg/dl albumin. The test strip was
dipped into the native urine and the result was taken after 1-2 minutes. The test
is semi-quantitative. Possible results are 0, trace, 30, 100 and 300 mg Protein / dl
urine.
Sample preparation
Hair: 20 mg 200 mg (if available) hair was cut in small pieces and weight
exactly. All mercury was extracted from the hair samples by shaking with 10 ml
hydrochloric acid 6 N for 15h at room temperature in the dark. Parts of the elute
were analysed by CV-AAS with two different reduction agents (see below).
Intentionally washing steps with water, detergents or organic solvents
like acetone were not performed before the elution. Washing procedures with
different solvents are frequently applied before hair analyses with the aim to
remove air-borne heavy metal pollution from the surface of the hair. But as
shown in literature, a distinct differentiation between air-borne and interior
mercury cannot be achieved which such washing procedures (Kijewski 1993).
Orientating pre-experiments with washing hair samples from burdened groups
supported this assumption. After washing some samples from the same strain,
the results were not reproducible. Therefore the hair samples were eluted
without any further pre-treatment.
Blood, urine: Aliquots of up to 1.0 ml were analysed directly without further
pre-treatment (method see below).
Mercury determination and quality control
The total amount of mercury in the samples (blood, urine, elute from
hair) was determined by means of so-called cold-vapour atomic absorption
spectrometry (CV-AAS), using a Perkin-Elmer 1100 B spectrometer with a MHS
20 and an amalgamation unit, Perkin-Elmer, Germany. Sodium-borohydride
28
RT2004-016-00 CETEM/MCT
(NaBH4) was applied for the reduction of all mercury (inorganic and organic
bound). NaBH4 reduces inorganic mercury quicker than organic bound
mercury like methyl-mercury. Nevertheless it is possible with this method, to
determine the correct amount of total mercury, because all nascent mercury
vapour is inter-collected on a gold-platinum-net. In a second step the net is
heated and all trapped metallic mercury is released at once and could be
quantified by CV-AAS. The accuracy of the method for inorganic as well as
organic mercury compounds was proved by inorganic and methyl-mercury
standard solutions. The determination limit for total Hg in blood or urine was
0.20 µg/l, for total Hg in hair 0.02 µg/g (calculated for a 100 mg hair sample).
In addition, in the elutes of the hair samples, the amount of inorganic
mercury was determined by CV-AAS, using a Lumex Zeeman mercury
analyser RA-915+, Lumex Ltd., St. Petersburg, Russia. This equipment operates
with SnCl2 (tin-II-chloride) for reduction. With this method, only inorganic
mercury can be detected, because under acid conditions SnCl2 reduces only
inorganic mercury and not organic bound mercury like methyl-mercury. This
was proven by inorganic mercury standards (which show a signal) and methyl-
mercury standards (which show no signal at all). The determination limit for
inorganic Hg in hair is 0.04 µg/g (calculated for 100 mg hair).
All analyses were performed under strict internal and external quality
control. The following standard reference materials served as matrix-matched
control samples: human hair powder GBW No. 7601 (certified Hg 0.36 ± 0.05
µg/g) and Seronorm whole blood No. 201605 (certified Hg 6.8 8.5 µg/l). Since
many years the lab participates successfully in external quality control tests for
mercury in human specimen.
Statistical methods
Statistics were calculated by means of the SPSS 9.0 programme (SPSS-
software, Munich, Germany). As expected, the mercury concentrations in the
bio-monitors (blood, urine, hair) were not distributed normally but left-shifted.
Therefore in addition to the arithmetic mean (only for comparison to other
studies) the median (50% percentile) is given. For all statistical calculations
distribution-free methods like the Mann-Whitney-U-test for comparing two
independent groups, the Kruskal-Wallis-test for comparing n independent
groups, the Chi-square test for cross-tables or the Spearman rank test for
correlation were used. "Statistically significant" means an error probability
below 5% (p < 0.05).
Some graphs were shows as so-called "box-plots". For a brief
explanation: The "box" represents the inter-quartile (this means from the 25% to
the 75% percentile). The strong line in the box is the median (50% percentile).
The "whiskers" show the span. Outliners are indicated by dots.
29
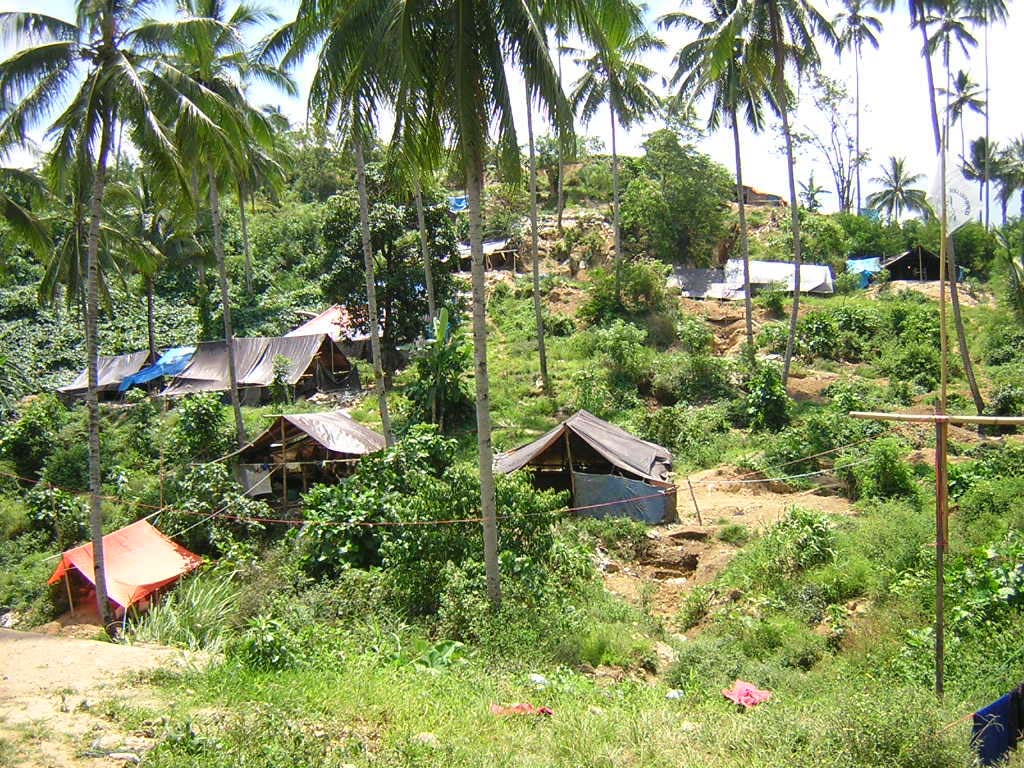
RT2004-016-00 CETEM/MCT
3. Results and Discussion
3.1. Environmental Assessment
3.1.1. Geology and Mineral Processing in North Sulawesi
(Talawaan)
According to Turner (2002), the North Arm of Sulawesi is a classic
oceanic island arc that includes porphyry Cu and volcanic-hosted epithermal
Au-Ag deposits. The Ratatotok Au district, located 100 km to the Southwest of
Manado, is hosted in Miocene carbonate rocks deposited in a Northeastern-
trending graben, and covered by andesitic volcanic and volcaniclastic rocks.
Carbonates are silicified, decalcified, dolomitized, and have anomalous
concentrations of Hg, As, Sb, Tl and low base-metals, as Zn, Cu and Pb (all <
100 ppm). Acessory minerals include cinnabar (Hg sulphide). As for the gold
deposit in Talawaan, a similar mineral and chemical composition is likely to
occur, due to geological and structural features of this gold deposit. Therefore,
one may realize that a naturally anomalous Hg background is to be found in
North Sulawesi.
In Talawaan, primary ore deposits are mined in a hilly area (Figure 3)
located 1 km from the processing site, through mostly vertical shafts and
tunnels - some of them up to 17 m deep and very narrow (Figure 4) Miners are
operating for 6 years and extract from 0.5 to 1 tonne/day of partially weathered
ore. The material is crushed to 1/2" by stomp mills to be delivered to the
milling units.
Figure 3 - The hilly mining site in Talawaan (Tatelu)
30
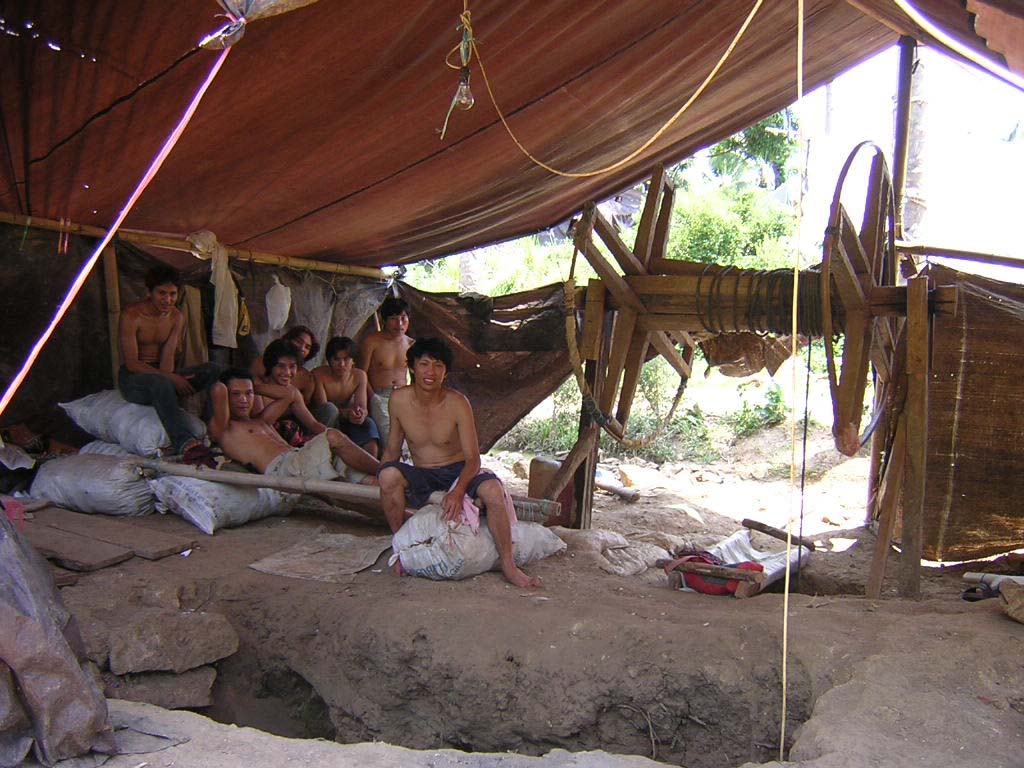
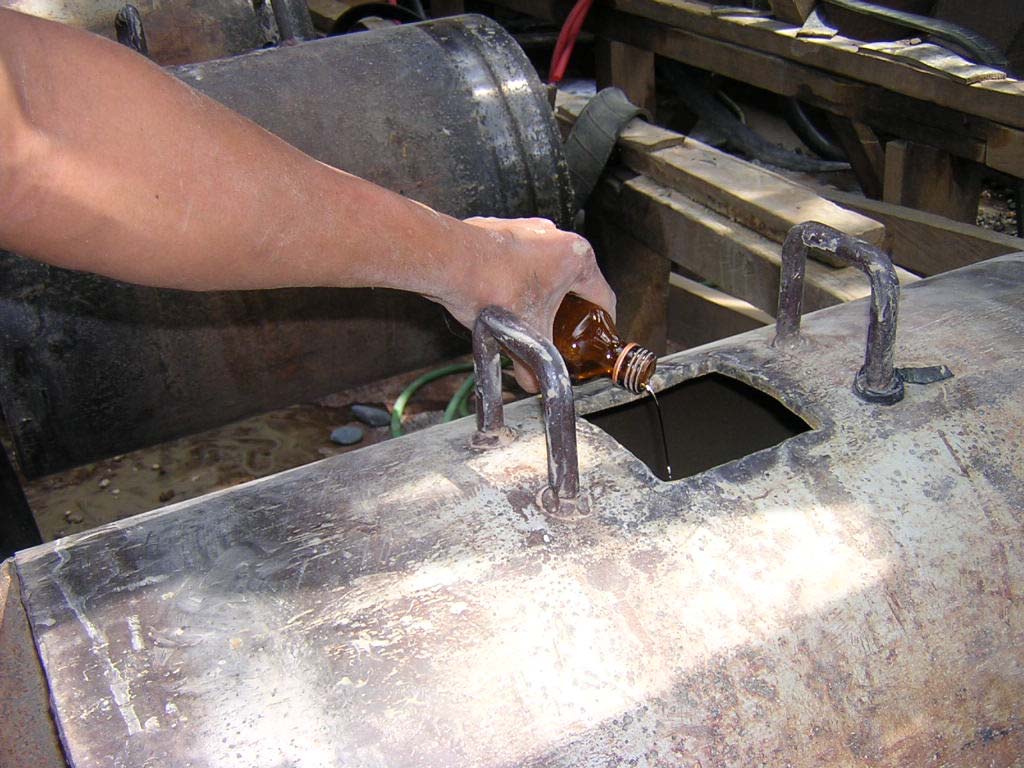
RT2004-016-00 CETEM/MCT
Figure 4 - Young miners and entrance of a shaft in Talawaan (Tatelu)
The ore, after filled in sacks and pulled up through a rope elevator,
manually operated, is transported on simple wooden sleighs, draged by cows
or oxes to the processing site. There, the ore is spread and dried in the sun,
before it is crushed manually or by stomp mills, in order to reduce the
processing time in the ball mills. Then the crushed ore is fed into ball mills for
simultaneous grinding and amalgamation. Some 30 40 kg of ore are loaded
into steel-made cylinders (a type of ball mill, called ,,trommel") together with
hard stones (river pebbles), some water and about 1 kg of mercury (Figure 5).
Figure 5 - Pouring mercury into the ball mill
31
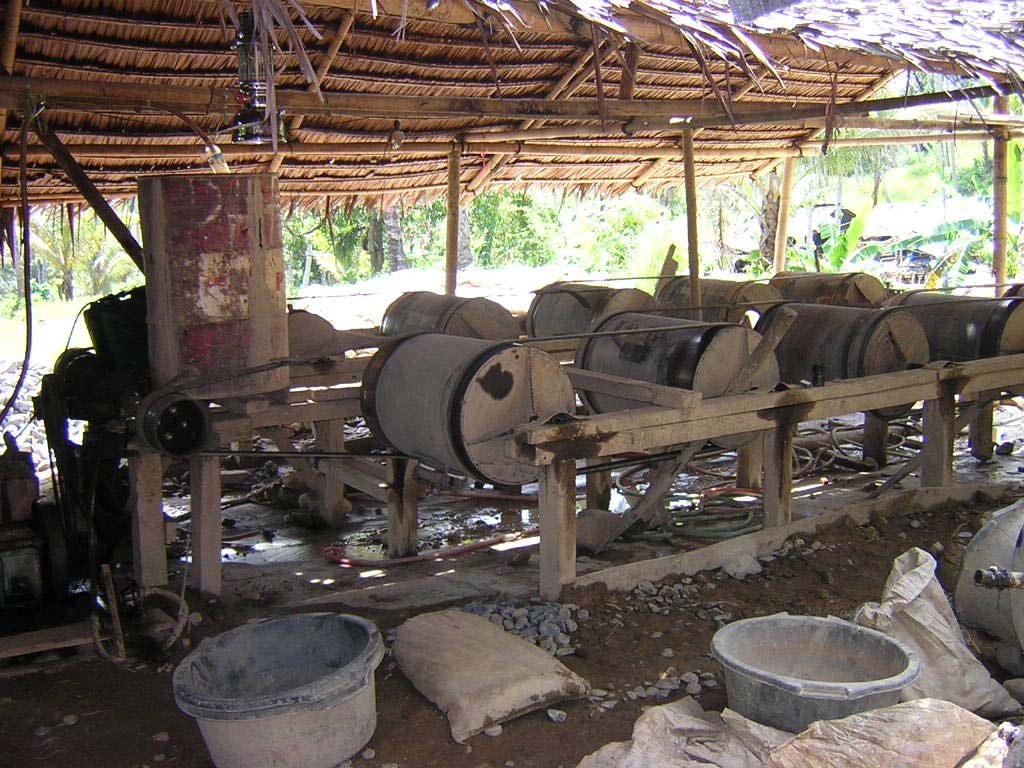
RT2004-016-00 CETEM/MCT
It was estimated 130 milling operations in the Talawaan watershed
(Tatelu region) and found out that mill operators have purchased from 10 to 15
kg of mercury/month/milling unit. A unit with 12 mills recovers 4 to 6 g of
gold per cycle. Generally there are two cycles per day. The mills operate 8
hours/day, 6 days/week. The price of mercury sold by the material suppliers in
Tatelu is US$ 9/kg.
Each of those processing plants operates 10 to 12 "trommels" in an
integrated system (Figure 6). The "trommels" diameter of 50 cm and lenght of
80 cm - are driven by an internal combustion engine via belts and rotate for 3 to
4 hours. Each steel mill, with diameter of 48 cm and length of 50 cm and has
capacity of milling 40 kg of ore per batch. Then the grinding step is interrupted
and about 1 kg of mercury per mill is added and the mill rotates for an
additional hour. The ground product becomes finer than 200 mesh (0.047 mm).
The grinded and amalgamated ore is poured out of the "trommels" with
water into bowls for settling down the heavy metal alloy (mercury and gold-
amalgam) in the bottom (Figure 7). Water is added again to remove the light
fraction, leaving the amalgamated gold. Mercury amalgam is separated from
the ore by panning ins a plastic bowl followed by manual squeezing in a piece
of fabric. No proper panning is employed in this operation, so that huge
amounts of Hg are expected to being released from those processing sites.
Most miners are currently storing amalgamation tailings in plastic sacks
to be sold to cyanidation plants. Since a certain portion of the gold is not
recovered from the gold ore by the amalgamation process, the wastes of the
processing sites are collected into sacks and transported by cars to nearby
located cyanidation plants, where the material is chemically processed to
extract the gold left in the amalgamation wastes.
Figure 6 - A typical processing unit with a set of ball mills ("trommels")
32
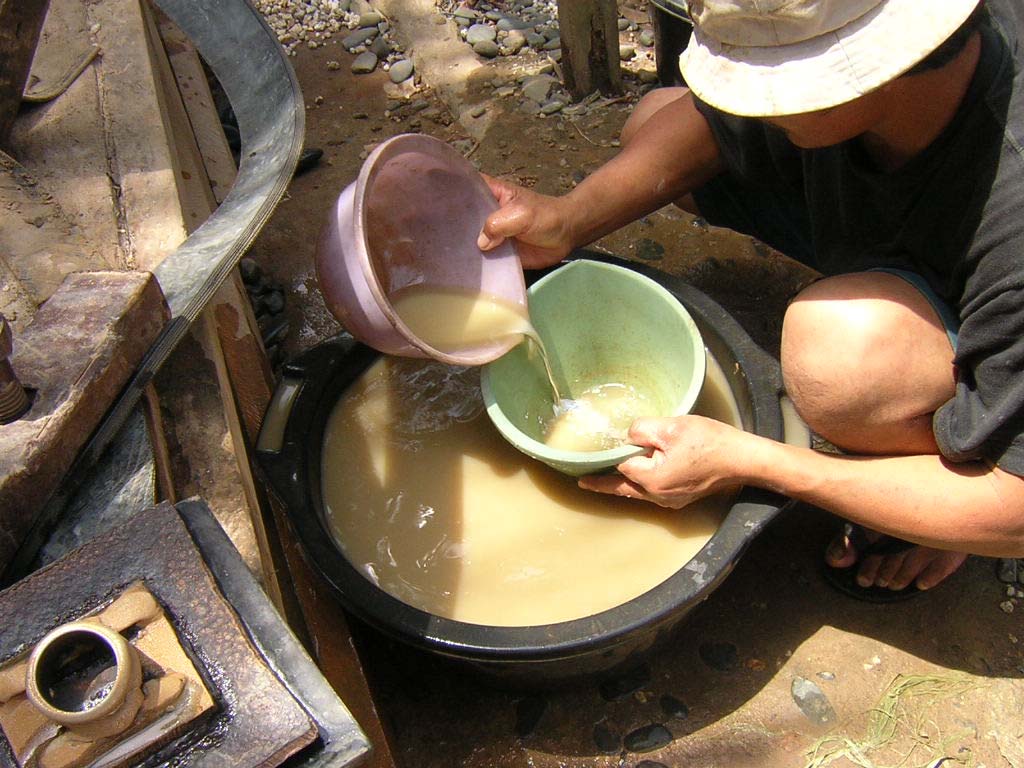
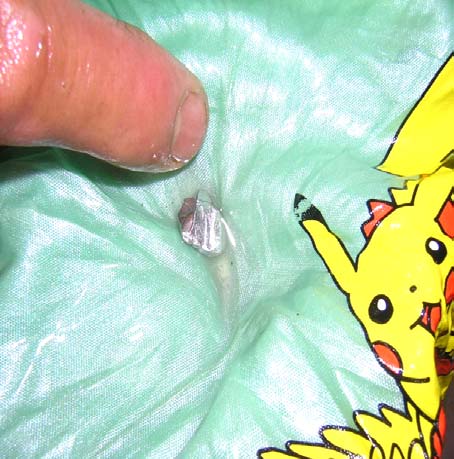
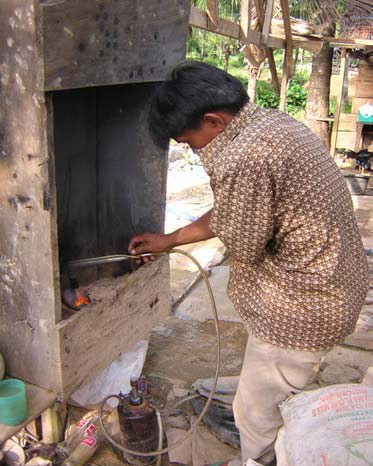
RT2004-016-00 CETEM/MCT
Figure 7 - Recovery of Hg-Au amalgam by rough "panning"
A possible explanation for this carelessness in dealing with amalgam
recovery is related to a subsequent chemical treatment of amalgamation tailings
in cyanidation tanks, which recovers the Au lost during amalgamation, and
partially Hg.
The resulting amalgam is usually burned in open air (Figure 8). No
retorts are used in this operation, being the only tentative protection to the
operator the covering of mouth and nose with a part of the shirt or, rarely, with
a mask for dust filtering. For the roasting process, borax is added to reduce the
melting point of gold and to remove impurities from the final product.
Figure 8 - Amalgam Hg-Au and its burning in open air
33
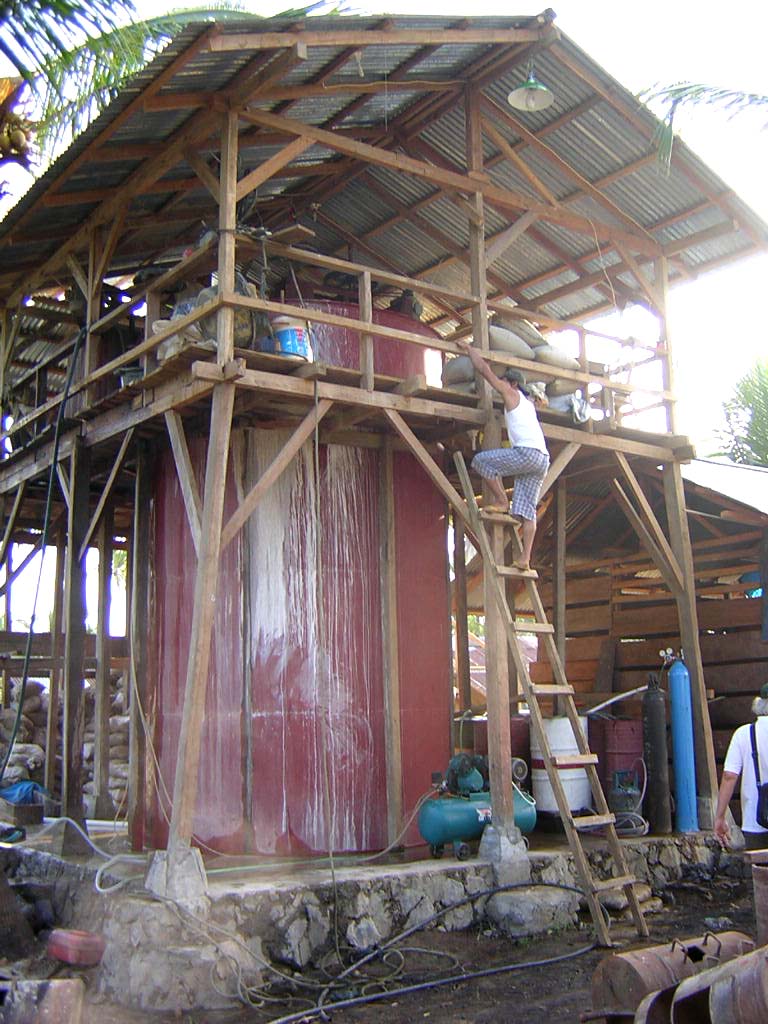
RT2004-016-00 CETEM/MCT
Mercury Loss
The estimated ratio Hglost : Auproduced falls in the extremely high range of
40 to 60, which is 30 to 40 times higher than average ratios found in SSM
worldwide.
Assuming that 9.6 to 14.4 kg of Hg are lost per unit/month, not less than
15 to 22 tonnes of mercury are being released annually in the entire area of
Tatelu. This characterizes an alarming mercury burden to the environment in
North Sulawesi.
In Talawaan, a cyanidation unit comprises a cylindrical vertical tank,
containing a volume of about 20 to 30 m3 (Figure 9). The owner of the visited
cyanidation unit pays Rp 3500 (US$ 0.40) per sack of 40 kg of amalgamation
tailings. To leach 20 tonnes of material 100 to 200 mg/L NaCN is added at pH
11, adjusted with lime and controlled once a day. The pulp (ca. 40% solids) is
agitated, while an air compressor provides the ventilation to the pulp during
the leaching process, lasting around 2 days. Approximately 500 g of residual
mercury are regained by settling down in each tank per batch. According to
average Hg concentrations found in amalgamation wastes, this Hg recovery
represents only 10 to 20% of the Hg burden contained in those wastes.
Figure 9 - A cyanidation tank in Talawaan (Tatelu)
34
RT2004-016-00 CETEM/MCT
Some 100 to 150 kg of activated charcoal are added into the leaching
tank. After 3 batches (i. e. ca. 60 tons of processed material) the charcoal is
recovered by screening and the tailings are deposited in a large non-lined
tailing pond for tentative neutralization. The Au-Hg-loaded activated charcoal
is burned in open drums to recover 500 g of gold in average per cycle, whereas
Hg is released again to the atmosphere.
Miners indicated that occasionally sodium hypochlorite is added to
destroy residual cyanide, but they count with natural cyanide degradation
(sunshine) to do the work. Operators do not have knowledge on elution
processes to extract gold from the loaded activated charcoal.
It is clear that the sedimentation tank collects a small part of the residual
mercury from the amalgamation tailings, while a major amount of mercury is
leached in the cyanidation process and part stays with the cyanidation tailings
as mercury cyanide complex. The workers are not aware about the mercury
vapor exposure when they burn Au-Hg-loaded activated charcoal.
3.2 Geology and Mineral Processing in Central Kalimantan
(Galangan)
Due to the topographic flat character of the sedimentary basin, its main
rivers, Katingan and Kahayan, exhibit a strong meandering stream, while the
local wetland in Galangan flows gently to two different river basins, to the
Katingan River to Southeast and to the Cempaga River to Southwest.
A 1 km wide forest remains separating the mining operations from the
Katingan River. The mining area consists of a flat plain seasonally flooded,
covered by alluvial, Quaternary-Tertiary sediments mostly sand and gravel
with thicknesss ranging from 2 to 10 m above peaty layers. The occurrence of
peaty layers is an indication of a former wetland forest, which now lies some
meters above the groundwater table. Therefore, it seems to be very plausible,
that the main part of the waters from the mining site soaks into its sediments,
before it is drained by means of groundwater run off into the adjacent rivers.
The landscape in Galangan resembles a desert, with some isolated trunks
and stumps of giant trees after deforestation of the rain forest (Figure 10). No
significant vegetation remains and the soil is reduced to a white, fine sand. The
alluvial gold ore deposit consists of a Quaternary-Tertiary (Pleistocene)
sedimentary sequence.
35
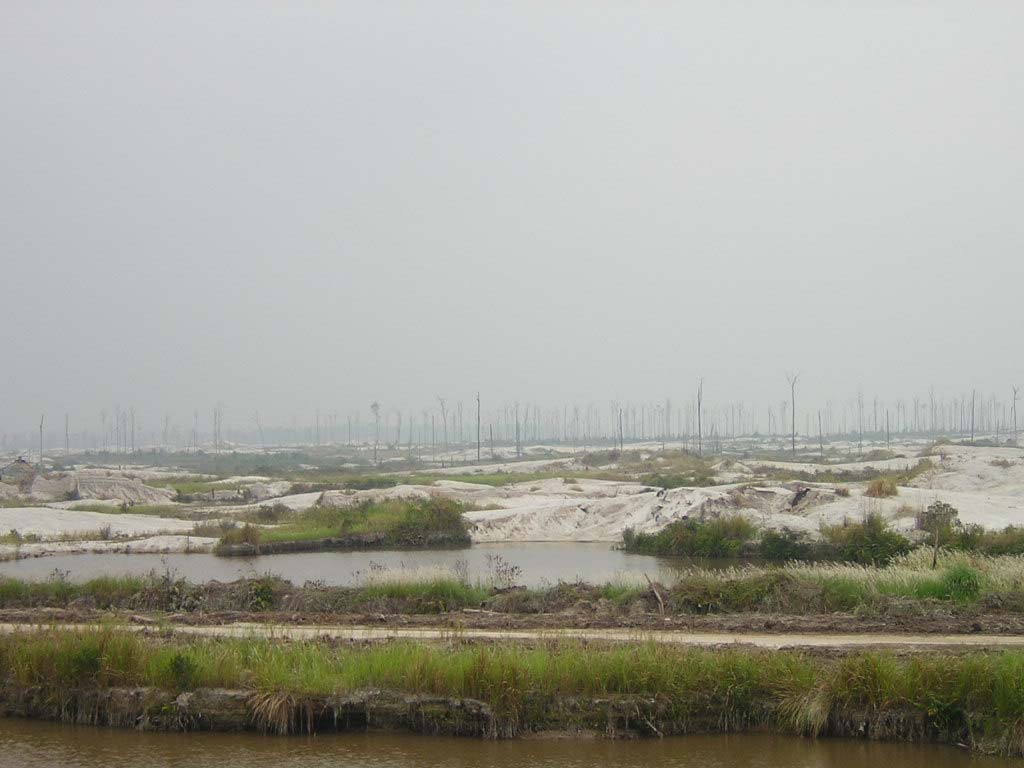
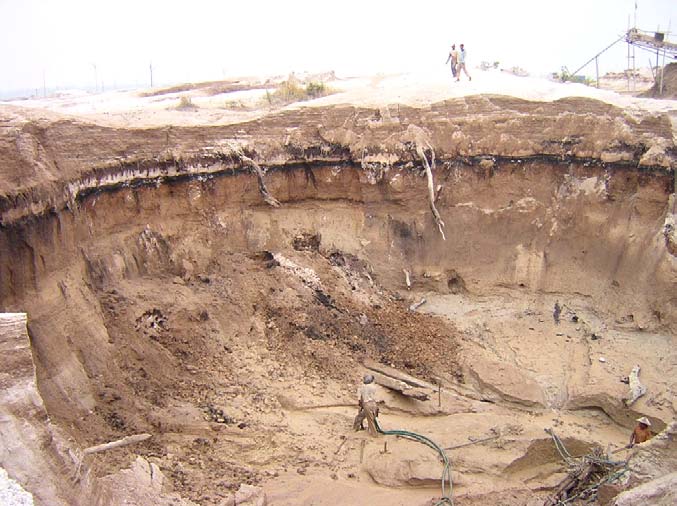
RT2004-016-00 CETEM/MCT
Figure 10 - Lanscape in the minin site of Galangan (Central Kalimantan)
Mining is carried out following traditional methods also used in the
Brazilian gold mining areas (secondary deposits) in the Amazon region. In open
pits the gold bearing layers are hosted down by means of hydraulic monitors
(Figure 11). The diluted pulp is then pumped to a two-staged carpeted sluices
box with an inclination of some 15°, on which gold particles are supposed to
settle down in the carpet due to their high density (Figure 12). Due to the high
turbulence of the pulp flow a considerable part of the gold is lost to the tailings.
Figue 11 - Hydraulic mining in Galangan
36
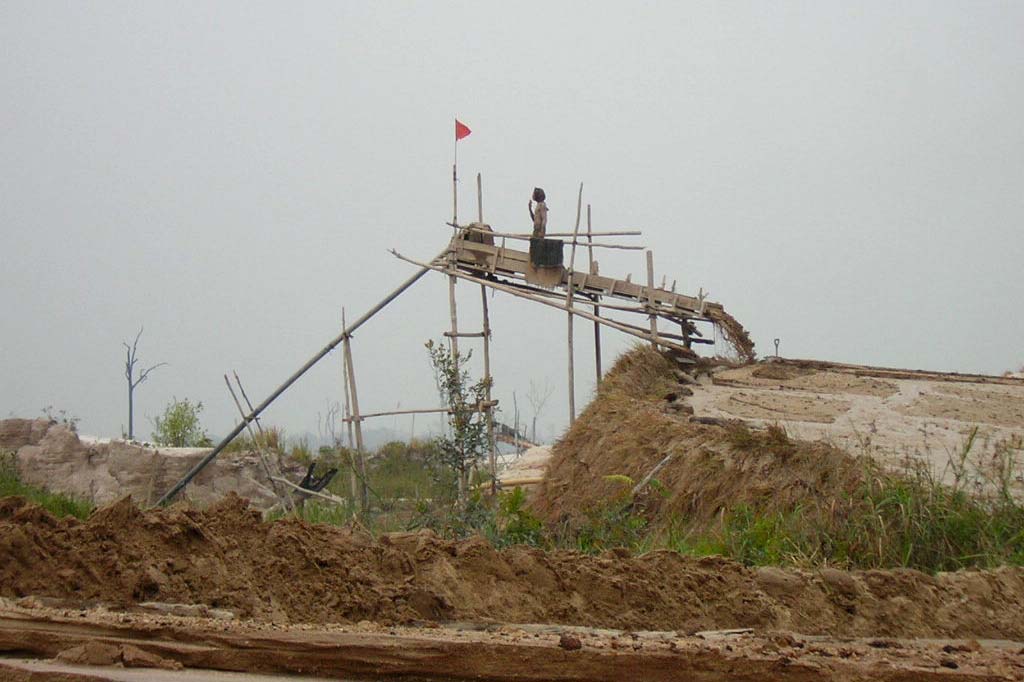
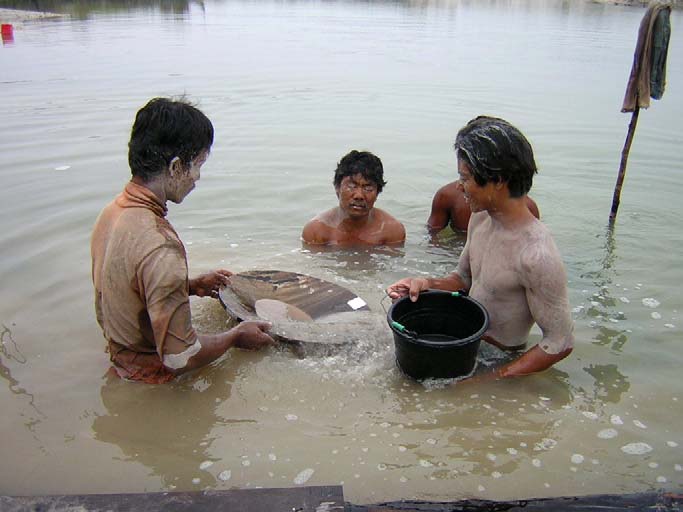
RT2004-016-00 CETEM/MCT
Figure 12 - Sluice Box in action
Mercury is purchased from gold dealers in Kereng Pangi at a price of
US$ 10/kg (2.5 times higher that the international market). We could not find
out the origin of this mercury. A rough calculation of the miner's operating cost
was done through interviews. Mercury represents less than 0.6% of their cost
and diesel for the electric 4" pumps represents more than 90%.
Manual amalgamation of the concentrate is done in ponds consisting of
flooded open pits excavated beside the miner's residences, being Hg-
contaminated tailings left in those ponds. Amalgam is panned following
traditional practice in wooden pans, whereas excess mercury is squeezed
through a piece of cloth regaining it for further reuse. All families use water
from the open pits to take bath and wash clothes (Figure 13).
Figure 13 - Panning of amalgamated Au concentrate into flooded open pits
37
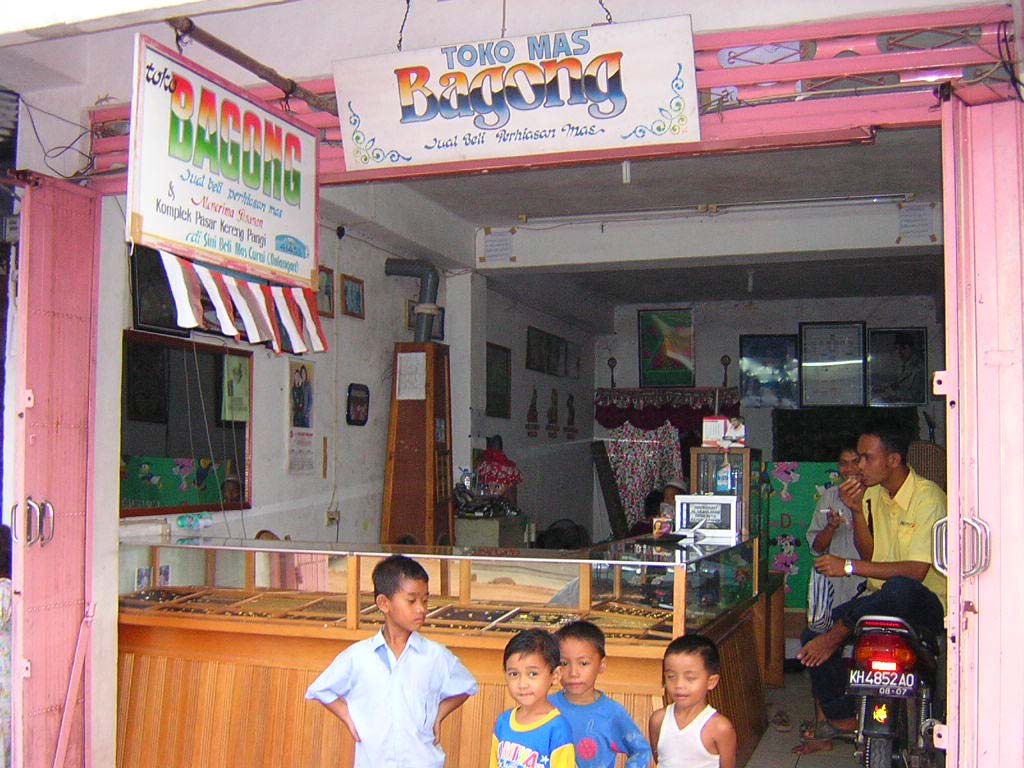
RT2004-016-00 CETEM/MCT
Mercury Loss
The ratio Hglost : Auproduced in Galangan is estimated in the range of 1.5 to
2. Assuming that 150 to 300 g of mercury are lost per unit/month, 1 to 2 tonnes
of mercury are being released annually in the entire area.
Amalgam is burned in gold shops, commercial stores in a chimney-like
construction, which leads the mercury vapor just outside the house by an outlet
pipe. The gold shops are situated in the middle of the village (Figure 14). There
is no proper ventilation for the mercury fumes, where in the rainy season 15 kg
of gold is sold to 20 gold shops and melted in the village, releasing at least 200
kg/annum of mercury in the village. Housing areas, food stalls and a school are
just nearby.
According to local authorities about 500 processing units exist in the
entire mining area, each one with 4 to 6 miners, who work 10 hours a day,
during 6 days a week. Some 3 to 8 g of gold are recovered per unit/day.
The ore grade is around 0.3 to 0.5 g/tonne (according to Mr Mansur
Geiger, geologist from Kalimantan Surya Kencana). The concentrate of 10 hours
of operation is amalgamated in ponds excavated beside the miner's residences.
Miners use 100 to 200 mL of mercury (which is around 1 to 2 kg) to amalgamate
5 to 10 kg of concentrate.
Figure 14 - Typical gold shop in Kereng Pangi
3.3. Biogeochemistry of Mercury in North Sulawesi (Talawaan
Watershed)
Samples of sediments, soils, tailings, dust, water and bioindicators were
taken in the main mining sites as well as along the affected drainage basins in
the Talawaan watershed. Remarkably for the whole area is the volcanic nature
38
RT2004-016-00 CETEM/MCT
of rocks, soils and sediments. Therefore, one may realize that a naturally
anomalous Hg background is to be found in the study area, as reported by
geological investigations in volcanic-hosted epithermal Au-Ag deposits
occurring in nearby areas in North Sulawesi (Turner, 2002).
Nearly no suspended matter is to be found in drainages of the Talawaan
watershed due to the ,,young" nature of the rivers, except in the most
downstream region where a plain supplies the rivers with some silt/clay
material. Moreover this scarcity of clay minerals might reflect the young age of
volcanic activities, since the volcanic rocks have been exposed to weathering for
a relatively short geological time.
Also the type of mining process contribute to this sedimentological
feature, since relatively small amounts of gold ore are worked and most of the
tailings are recovered to be reprocessed in the cyanidations plants, where
tailings are confined into ponds. As a result little turbidity could be observed in
the creeks and rivers draining the mining region. Larger rivers like Talawaan
pours even clear water into the sea.
A sampling campaign of soils, sediments, water and biota was conducted
in the Talawaan watershed, consisting of 298 samples split into 156 fish
samples, and 142 samples of sediments, soils, water, plants and other aquatic
organisms, covering the whole study area (Figure 15) . The sudy area was
divided into 7 sub-areas from the most upstream are down to the estuary.
The description of the study sites in the North Sulawesi, Talawaan
Watershed, is presented in Table 1.
Table 1 - Study sites in the Talawaan aquatic ecosystems, localization and
brief description (D).
Study
Site
Localization
D
Located upstream of the gold mining areas; 01°30'51,2"N
T1
Spring
rice plantation and fish farming activities
124°58'52,7" E
It is located about 5 Km downstream of T1,
with some gold mining processing units
located surrounding. Tatelu river, its 01°31'50,5"N
T2
Dam
tributary flows to Talawaan close this 124°57'36,0"E
sampling site. The water from the dam is
used to rice plantation and fish farming
It is located downstream of cyanidation 01°33'10,64"N
T3
After dam
plants
124°56'20,1" W
Close
T4
About 3 km upstream estuarine region
estuarine
Estuarine
T5
Estuarine region, high fishing activity
region
Toldano river, which is located in another
Control watershed. Fish collected in the
Dam
T6
hydroelectric power plant dam
Posto
Manado
Fish market, in Manado city
T7
city
39
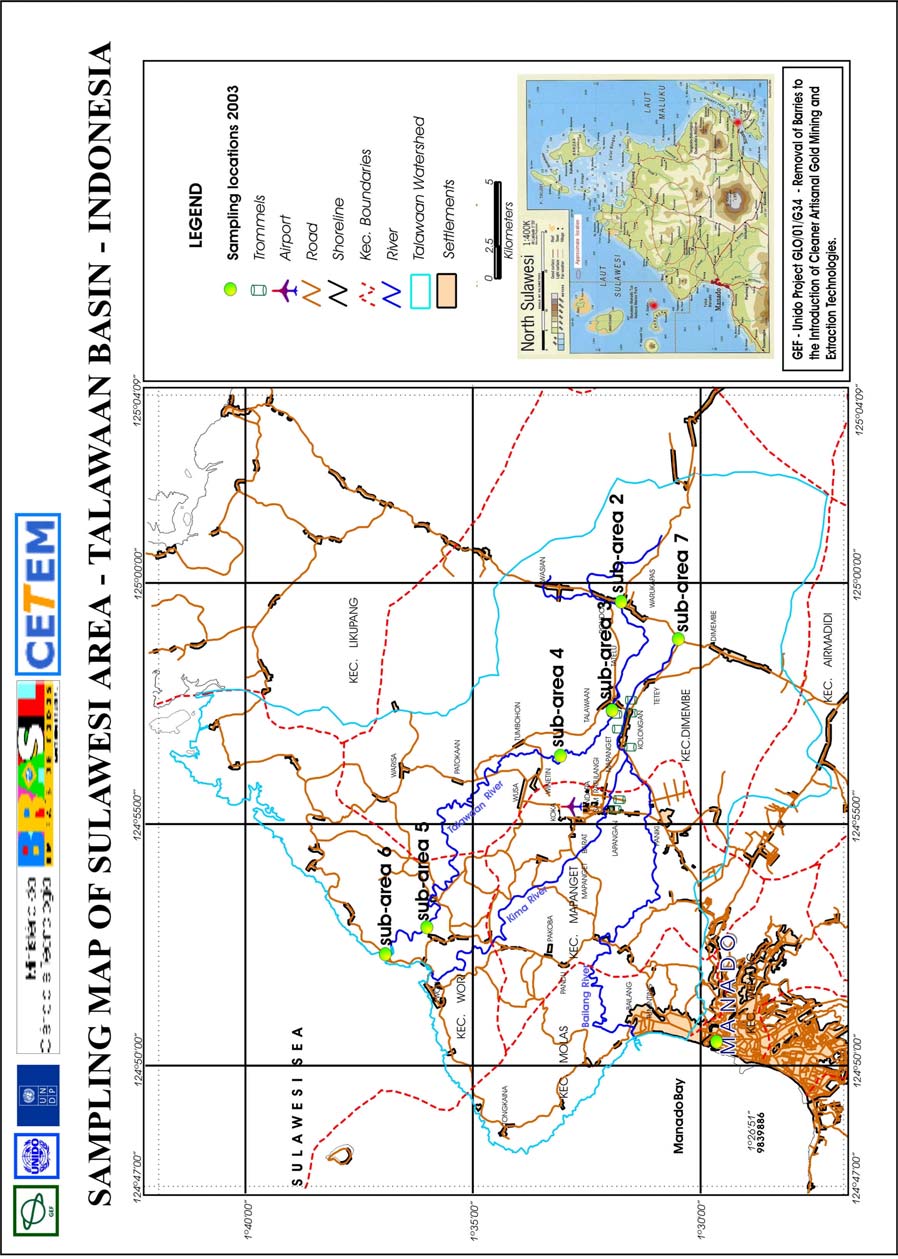
RT2004-016-00 CETEM/MCT
Figure 15 - Location of Biogeochemical Sampling along the Talawaan
Watershed
40
RT2004-016-00 CETEM/MCT
The most uptream sampling site, sub-area T1, is located close to the
spring of Talawaan river where no mining activity is to be reported. Therefore,
sediment samples from sub-area T1 are believed to mirror Hg levels in
sediments unaffected by gold mining activities. Unexpectedly, Hg levels in
those samples were 600 times higher than Hg background levels usually found
in sediments in tropical regions (Rodrigues-Filho et al., 2004). Mercury levels at
the spring of the Talawaan River average 60 µg/g in the sediment fraction < 74
µm (Figure 16).
A likely explanation for this anomalous Hg level in unaffected sediments
is related to the proximity of the inactive volcano of Mount Kablat, whose
former activity might have generated the conditions for the formation of gold
deposits in the Tatelu region, as well as their associated Hg enrichment. This
Au-Hg association has been observed in other similar gold deposits in North
Sulawesi (Turner, 2002). Another study on mercury contamination of the
Talawaan Watershed also indicates abnormal Hg levels, up to 2.0 µg/g, in
sediments close to its spring (Martens, 2000), whereas no information on the
target grain size fraction has been indicated. However, further investigations on
the mineralogy of these sediments are required to confirm this hypothesis.
Approximately 5 km downstream, it is located the main mining sites,
sub-area T2, close to the confluence of the Tatelu River and the Talawaan River,
where a dam reservoir has been built for water supply to rice plantations. There
an increase of Hg levels in sediments has been observed, as a consequence of
Hg releases from amalgamation wastes to the rivers. Mercury concentrations
reach up to 480 µg/g and average 154 µg/g in the sediment fraction < 74 µm
(Figures 16 and 21).
Likewise, mining tailings consisting of amalgamation wastes present Hg
levels that characterize a mining hotspot with up to 1250 µg/g and an average
Hg concentration of 317 µg/g (Figures 17 and 21). Although it was said that
amalgamation tailings are forwarded to cyanidation plants, this might not be
always the case, since plenty of amalgamation tailings are spread all over the
river banks in the sub-area T2. Mercury levels found in tailings of this area are
in accordance with the values encountered in mining hotspots of gold mining
sites in Brazil (Rodrigues-Filho et al., 2004).
Further downstream and close to the estuary Hg levels in sediments
drop to a mean concentration of 6.7 µg/g, which is even lower than those
encountered in the most upstream part of the river, indicating a dilution effect
caused by runoff of catchment soils (Figure 16).
As a consequence of Hg atmospheric deposition on soils close to
operations of amalgam burning, it was observed Hg levels in soils up to 690
µg/g, with an average of 270 µg/g in the mining sites (Figure 18). Further
downstream Hg levels decrease to a mean value of 14.6 µg/g, indicating that
Hg released from the mining sites to the atmosphere present a relatively short
residence time as Hg vapour, being mostly precipitated on soils in the vicinities
of its source. This can be assumed since Hg level in a soil sample (A249)
41
RT2004-016-00 CETEM/MCT
collected upstream of the mining sites, with 25 µg/g, resembles the Hg levels
found further downstream up to the estuary (Figure 18).
As for the assessment of Hg bioavailability through using bioindicators
other than fish, like aquatic plants and mollusks, it has been indicated that Hg is
being taken up by living organisms in the Talawaan River, as shown by the
distribution of Hg in aquatic plants and mollusks (Figures 19 and 20).
Mercury uptake by aquatic plants is particularly evident in cyanidation
tailings, where Hg concentrations reach up to 370 µg/g (Figure 19). This is
likely a consequence of increasing Hg mobility and biovailability through the
formation of mercury-cyanide complexes after cyanidation of highly
contaminated amalgamation wastes.
The mean Hg level in aquatic plants of the Talawaan River, 32.3 µg/g, is
13 times higher than the one observed in the most contaminated SSM site in
Brazil, according to a previous study (Rodrigues-Filho et al., 2004).
Mollusks also indicate an abnormally high Hg bioavailability in the
Talawaan River, with a mean Hg concentration of 2.6 µg/g (Figure 20). This
mean value is three times higher than the highest Hg concentration found in a
previous study on contaminated coastal sites of the USA (O´Connor, 1993).
Therefore, it is assumed that both factors are contributing to this
indicated high Hg bioavailability, namely an anomalous Hg background in the
area and the cyanidation of amalgamation wastes forming soluble mercury
complexes.
A reduced number of water samples were checked for assessing their
quality in relation to guidelines for drinking water. In the sub-area T2, where
the main mining sites are located, Hg level in water reachs 1.8 µg/L, while
down to the estuarine region Hg levels drop to a mean value of 0.1 µg/L, which
falls below the maximum limit of Hg for drinking water established by the
Brazilian environmental legislation. This is in accordance with the above
mentioned hypothesis, since close to the cyanidation plant Hg is clearly forming
soluble complexes, becoming therefore susceptible to methylation.
42
RT2004-016-00 CETEM/MCT
Hg
(ppm)
Tatelu Mining Site
Hg Average = 91 ppm
500
Stardard Deviation = 95 ppm
Distance from Spring to the Estuary = 20 km
400
Talawaan Spring
MediumTalawaan River
300
DownstreamTalawaan
(Estuary)
200
Kima River
100
0
101 102 201 202 203 204 205 206 207 208 209 210 211 212 213 214 215 216 217 218 219 220 221 222 223 224 225 226 227 301 302 303 401 402 501 502 503 504 505 601 602 603 701 702
A A A A A A A A A A A A A A A A A A A A A A A A A A A A A A A A A A A A A A A A A A A A
Figure 16 - Distribution of Hg concentrations in sediments along the
Talawaan river
g (ppm )
1400
Hg Ave rage = 317,6
Tatelu Mining Site
ppm
1200
Hg HOTSPOTS in Mining Tailings
1000
800
600
400
200
0
A228
A230
A232
A234
A236
A238
A240
A242
A244
A246
Figure 17 - Mercury Hotspots in Mining Tailings Tatelu Mining Site
43
RT2004-016-00 CETEM/MCT
Hg (ppm)
Mining Site
Talawaan Watershed
700
Hg Average = 59 ppm
Stardard Deviation = 151.6 ppm
600
500
400
Soils 2 km Downstream from Mining Site
Soils close to Estuary
300
200
100
0
A249 A250 A251 A252 A253 A254 A255 A256 A257 A258 A259 A260 A261 A262 A263 A264 A265 A506 A507 A604 A605 A606 A607
Figure 18 - Mercury distribution in soils of the Talawaan Watershed
Hg (ppm )
400
Hg Average = 317.6 ppm
Stardard Deviation = 336.8 ppm
350
M ercury in Aquatic P lant
(Cyanidation P lant)
300
M ining Site M ining Site
2 km downstream
250
200
150
100
50
0
A267
A269
A271
A273
A275
A277
A279
A281
A305
A307
Figure 19 - Mercury in plant tissues growing close to mining operations and
downstream
44
RT2004-016-00 CETEM/MCT
Hg (ppm)
Talawaan River
9
8
Hg Average = 2,6 ppm
Stardard Deviation = 3,5 ppm
7
Mercury in Mollusks
6
5
4
3
Estuary
2
1
0
A308
A309
A310
A311
A610
Figure 20 - Mercury in mollusks collected downstream of mining operations
45
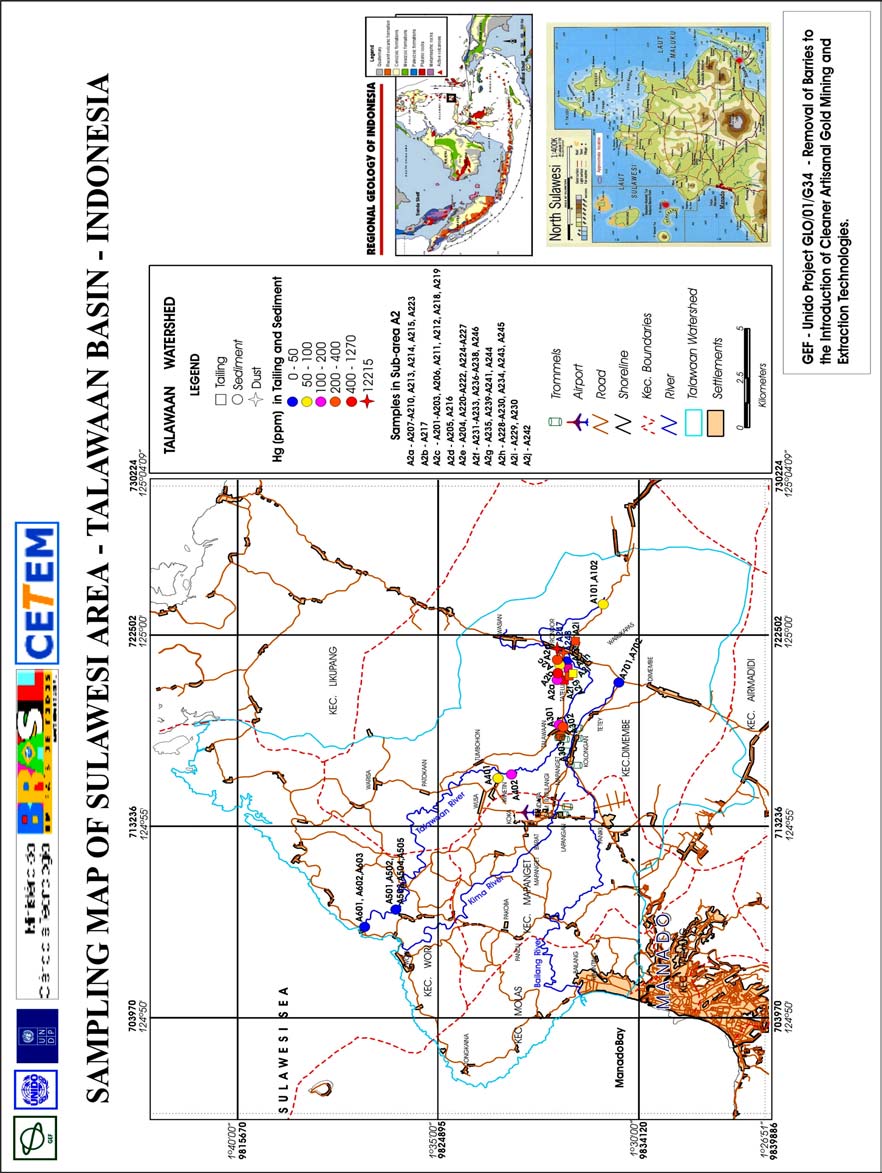
RT2004-016-00 CETEM/MCT
Figure 21 - Mercury distribution in sediments and tailings along the
Talawaan Watershed
46
RT2004-016-00 CETEM/MCT
3.4. Biogeochemistry of Mercury in Central Kalimantan
(Galangan Mining Site)
A sampling campaign of soils, sediments, water and biota was conducted
in the Galangan mining site, Katingan watershed, consisting of 470 samples
split into 264 fish samples, and 206 samples of sediments, soils, water, plants
and other aquatic organisms, covering the whole study area, in order to address
the identification and location of mercury hotspots.
Investigation from instant matrices like air and water were minimized,
since total mercury usually occurs in extremely low levels, or even are
undetectable. Therefore, records of mercury emissions, like soils and sediments
together with bioindicators, have been preferred for assessing mobility and
biovailability of mercury in the environment.
The description of the study sites in the Central Kalimantan, Katingan
District is presented in Table 2.
Table 2 - Study sites in the Central Kalimantan aquatic ecosystems and the
localization.
Study
Site
Localization
P1
Katingan river, upstream of the
mining sites, close to Kosangan
district
P2
Katingan river, downstream of the 01°59'34,1"S
mining site Galangan, close to 113°25'26,2" E
Petakbehandang
P3
Control area 1
P4
Flooded open pit in mining site areas 02°00'19,2"S
113°17'10,8" E
P5
Fish market from Palangkaraya; fish
maily from Kahayan river
P6
Kalamanan river, close to Samba
region
P7
Control area 2; close to Orangotangos
reservoir, large lake with river
contribution
Mercury Sources
Distribution of mean mercury concentrations in sediments of the
Katingan River (study areas P1 and P2), as well as in the Galangan mining site
itself (study area P4), sub-area 1, is presented in Figure 22.
Mercury concentrations in sediments are in general significantly lower in
this region than in Talawaan, North Sulawesi. This is likely related to both a
47


RT2004-016-00 CETEM/MCT
less polluting mineral processing technique used in Galangan and an existing
lower Hg background in the Katingan Basin, as indicated by relatively low Hg
levels present in sediments that have been deposited many years before starting
SSM activities in the region. Lower sections of sediment cores taken in
riversides and floodplains of the Katingan River are assumed to mirror the
existing sedimentological conditions prior to disclosure of the gold rush (Figure
23).
P1
P4
P2
P4
Figure 22 - Mean mercury concentrations in sediments of the study area
Central Kalimantan
Distribution of mercury concentrations in samples of a sediment core
from area P2, Katingan River upstream of mining sites, is presented in Figure
23.. Since this core shows significantly lower levels, averaging 0.38 ppm, than in
the cores taken downstream of the mining areas, averaging 2.87 ppm, 2.19 ppm
and 2.33 ppm, respectively in sediment cores A301, A501 and A601, the Hg
range found in core 201 indicates an existing Hg background for this study area
(Figures 23 to 26).
Moreover, the sediment cores taken downstream have a similar varying
distribution of Hg levels with depth, showing a common peak of Hg
concentration between depths from 6 to 12 cm, ranging from 8 ppm in core
A301 to 21 ppm in core A501, and to 4 ppm in core 601 (Figures 24 to 26). This
Hg peak is likely related to a major Hg release from the mining sites some years
ago that probably mirrors a more intense Hg use at the beginning of the gold
rush.
Likewise, variations of Hg levels ranging from 0.1 ppm to 1.2 ppm
within core A201, which is 1.11 m long, likely reflect a varying Hg background
in sediments having as driven force an oscillating Hg contribution from the
48
RT2004-016-00 CETEM/MCT
atmosphere to the aquatic system with time (Figure 23). Since SSM operations
started in 1998 in Galangan, Hg levels in deeper core sections might reflect an
important contribution from natural Hg sources to the regional environment,
among which volcanic activity and mineralogy are to be highlighted.
A wide range of mercury concentrations within unaffected sediment
sections, from 0.1 to 1.2 ppm, averaging 0.38 ppm, indicates an uncommon
situation that geochemically has no correspondence to previous studies
conducted in the Brazilian Amazon (Rodrigues-Filho and Maddock, 1997,
Rodrigues-Filho et al., 2002).
Depth
0 - 3 cm
Sediment core A201
3 - 6 cm
6 - 14 cm
14 - 16 cm
16 - 23 cm
23 - 27 cm
27 - 30 cm
30 - 34 cm
Hg Average = 0.38 ppm
34 - 37 cm
Stardard Deviation = 0.37 ppm
37 - 43 cm
43 - 49 cm
49 - 58 cm
58 - 66 cm
66 - 74 cm
74 - 76 cm
76 - 81 cm
81 - 87 cm
94 - 96 cm
96 - 104 cm
104 - 107 cm
107 - 111 cm
0,00
0,20
0,40
0,60
0,80
1,00
Hg
1,20
(ppm)
Figure 23 - Mercury concentrations in samples of a sediment core from the
Katingan River upstream, area P1
Depth
Sediment core A301
0 - 2 cm
2 - 4 cm
Hg Average = 2.87 ppm
Stardard Deviation = 3.32 ppm
4 - 6 cm
6 - 8 cm
8 - 10 cm
A302
0
1
2
3
4
5
6
7
8
9
Hg (ppm)
Figure 24 - Mercury concentrations in samples of a sediment core from the
Katingan River downstream, between areas P1 and P2
49
RT2004-016-00 CETEM/MCT
Depth
0 - 2 cm
Sediment core A501
Hg Average = 2.19 ppm
Stardard Deviation = 7.47 ppm
2 - 4 cm
4 - 6 cm
6 - 8 cm
8 - 10 cm
10 - 12 cm
12 - 14 cm
0
2
4
6
8
10
12
14
16
18
20 Hg
22
(ppm)
Figure 25 - Mercury concentrations with depth in a sediment core from the
Katingan River downstream, area P2
Depth
Sediment core A601
0 - 3 cm
3 - 6 cm
6 - 9 cm
9 - 12 cm
12 - 15 cm
Hg Average = 2.33 ppm
Standard Deviation = 1.57 ppm
15 - 18 cm
18 - 21 cm
21 - 24 cm
24 - 27 cm
0
1
2
3
4
5
Hg (ppm)
Figure 26 - Mercury concentrations with depth in a sediment core from the
Katingan River downstream, area P2
50
RT2004-016-00 CETEM/MCT
Mercury Releases
The distribution of mercury concentrations in individual sediment
samples from the Galangan mining site resembles the levels found along the
downstream section of the Katingan River, as presented in Figure 27. This a
further indication that sediments from both the mining site and the lower
Katingan River are closely related to each other as a consequence of mercury
discharges from SSM operations.
Nevertheless, those Hg concentrations in the Galangan region are at least
one order of magnitude lower than in Talawaan.
Hg
(ppm)
4
Hg in Sediments of Galangan
Hg Average = 1.20 ppm
Mining Site
Stardard Deviation = 0.79 ppm
3
2
1
0
A101
A102
A103
A105
A108
A109
A110
A111
A112
A113
A114
A115
A116
A117
A118
A119
A120
A122
A123
A124
A125
A126
A127
A128
A131
A132
A133
A134
A135
A136
A137
A138
A139
A140
A141
A142
A143
A144
A145
A146
A147
A148
A149
A150
A151
A152
A153
A154
A155
A156
A157
A158
A159
A160
A161
A162
A163
Figure 27 - Mercury concentrations in individual samples of current
sediments from the Galangan mining site
A similar situation of Hg contamination in mining hotspots is to be
reported for the mining tailings in the mining site in Galangan, as presented in
Figure 28, but to a much lesser extent than in Talawaan, principally as a
consequence of the mining techniques employed and the local geological setting
that indicate a relatively low mercury availability to the environment. This
general contamination degree in mining tailings is also lower than the existing
one in Brazilian SSM sites (Rodrigues-Filho et al, 2004).
The prevailing sandy composition of the mining tailings that is driven by
the type of alluvial deposit with almost no silt-clay fraction is a likely
explanation for this relatively low levels, since Hg released during
amalgamation finds no particulate surface to be adsorbed on, leading to Hg
concentrations even lower than in river sediments (Figure 28).
On the other hand, although a relatively low Hg contamination degree in
amalgamation tailings is to be reported, there are strong indications that
mercury finds a favorable condition for becoming highly mobile as indicated by
51
RT2004-016-00 CETEM/MCT
the abnormally high levels found in the organic fine cover of the tailings,
composed basically of algae. This is an indication that mercury is being
dissolved by the organic dark waters of Galangan, which is a potentially
favorable condition for increasing mercury bioavailability through methylation
(Figure 28).
40
Hg Average = 1.28 ppm
Hg
Stardard Deviation = 10.54 ppm
(ppm )
35
Hg in Tailings - Hotspots
30
25
20
Organic cover
15
Sandy Tailings
10
5
0
A164 A165 A166 A167 A168 A169 A170 A171 A172 A104 A129 A130 A106 A107 A121
Figure 28 - Mercury concentrations in individual samples of mining tailings
from the Galangan mining site
Despite of their high mercury concentrations, the so called mining
hotspots have been characterized elsewhere as having low mobility and
bioavailability provided that prevailing hydrochemical parameters in SSM sites
favor the thermodynamic stability of metallic mercury in most aquatic systems.
This seems not to be the case in the Galangan mining site, since metallic
mercury is likely being oxidized, forming soluble complexes to become
available to methylation.
The distribution of mercury concentrations in water samples from both
the mining site and the Katingan River supports the recommendation of not
carrying out an extensive survey based on water samples (Figure 29). From
these results, one could indicate a low mercury mobility in the aquatic system
of Galangan, since they fall in a frequently found range (Rodrigues-Filho et al,
2002). However, in contrast, as indicated by the very high Hg levels in organic
layers, mercury mobility and potential bioavailability should be reported as
abnormally high. This indicated high Hg bioavailability is most likely related to
the organic acid content of the dark water drainages in Galangan.
52


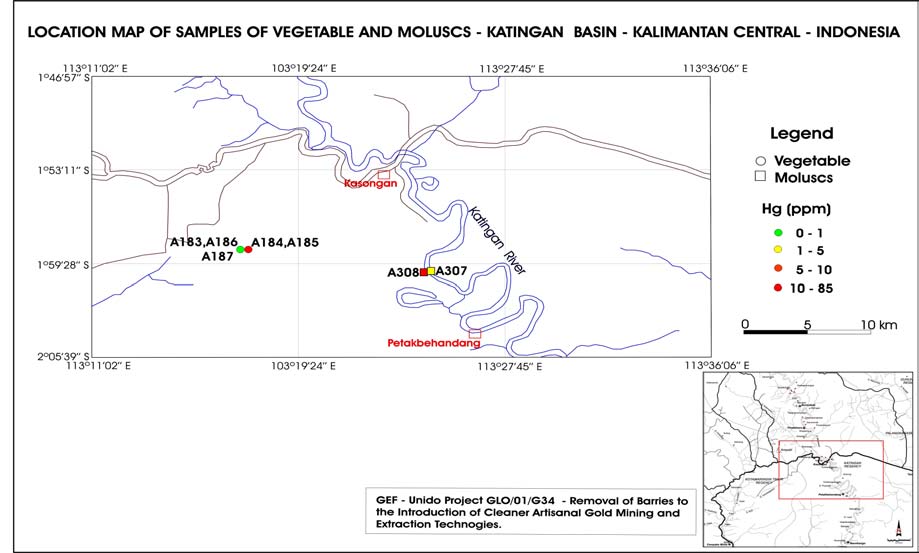
RT2004-016-00 CETEM/MCT
P 4
Figure 29 - Mercury concentrations in water samples from the study area
Katingan River and Galangan mining site
Distribution of mercury concentrations in samples of aquatic plants and
mollusks from both the mining site and the Katingan River is presented in
Figure 30.
Figure 30 - Mercury concentrations in samples of aquatic plants and
mollusks from the study area Katingan River and Galangan mining site
53
RT2004-016-00 CETEM/MCT
3.5. Mercury in Fish
The Talawaan river, belonging to the Talawaan watershed, also known
as Tatelu region was chosen also considering that previous work (YBCA et al.,
2003) showed abnormally high mercury levels in fish from the Talawaan
watershed.
It was investigated the fish presence at 7 sub-areas in North Sulawesi, in
the Talawaan mining area. Along the Talawaan river, it was collected 156 fish
specimens of 11 species (gabus, gete-gete, gold fish, guruo, kesa, lalimata,
mujair, nilem, payanka, sepot, supit), one specimen (gold fish) from fish-
farming, while 26 specimens of 5 marine species were bought at the fish market
in Manado (cakalang, deho, tudę, bobara and malalugis).
In Central Kalimantan, a total of 264 fish specimens of 25 species (banta,
baung, bawal, darap, gabus, gold fish, gurame, juah, kalatau, kalui, kapar,
karandang, kelabau, lais, lais lintang, lawang, nilem, papayu, patin, putin,
saluang, sapat, tahuman, tekung, tongkol) were collected. Thirty-three
specimens of six species were bought at the fish market in Palangkaraya. It is
important to realize that some specimens came from fish farming inside the
Katingan river, such as patin and tahuman species.
It is generally agreed that Hg concentrations in carnivorous fish are
higher than in non-carnivorous species (e.g., Watras and Huckabee 1994), due
to the indirect Hg bioaccumulation or biomagnification. Some fish species were
captured in several sites in reasonable number, as gabus and tahuman, which
are classified as carnivorous species. Others, as banta and saluang, feed on
benthos and plankton. So, carnivorous species and other species that feed on
benthos were collected, as advised by Protocol. On the other side, the Protocol
also advises to collect fish according to standardized lenghts for spatial and
temporal comparison, but this could not be followed due to scarcity of different
fish lengths of a given species.
Fish samples were collected by gill-netting and fishing line with a fish-
hook. Each specimen was weighed (Wt), and its length (Lt) was measured at the
time of collection. After removing the individual axial muscle (fillet), each
sample was placed in polyethylene bags and in ice boxes, and frozen after
reaching hotel facilities. The Table 3 shows general information about the fish
collection in the study sites.
Table 3 - SSM areas, number of sites and number of fish specimens
Number of
Garimpo areas
Number of Sites
samples
North Sulawesi
7
156
Central
7 264
Kalimantan
TOTAL 14
420
54
RT2004-016-00 CETEM/MCT
A total of 389 fish were collected, excluding the fish-market specimens
from Manado (n=24), which are mainly from marine aquatic system or
freshwater fishfarming. The popular and scientific names, food habit and
number of fish specimens collected in both areas are shown in Tables 4 and 5.
Table 4 - Popular and scientific names of species collected in the North
Sulawesi, Manado city, Talawaan watershed (T); food habits (FH ) when
available, and number of specimens collected (n) in each site and total
number
Popular name Scientific name
FH T1 T2 T3 T4 T5 T6 T7 Total
gabus
Ophiocephalus striatus
C 2 2
gete-gete
Ambassis sp
C 2 8 10
gold fish
Cyprios carpio
O
1 4 5
guruo
Mugil cephalus
H
6 7 24
37
kesa
Anabas sp
O
3 3
lalimata
Caranx sp
C 8 8
Oreochromis
mujair
mossambicus
O
5 14
4 23
nilem
Osteochilus hasselti
O
18
18
payanka
Ophiocara sp
C 12 11 1 2 26
sepot
-
- 1 1
supit
-
- 1 1
cakalang
Katsuwonus pelamis
C 4 4
deho
-
- 4 4
tudę
-
- 5 5
bobara
-
- 4 4
malalugis
Decapterus kurroides
C 5 5
TOTAL 1 35 35 20 33 6 26 156
55
RT2004-016-00 CETEM/MCT
Table 5 - Popular and scientific names of species collected in Central
Kalmantă, food habits (FH ) when available, and number of specimens
collected (n) in each site and total number
Popular
name Scientific
name
FH P1 P2 P3 P4 P5 P6 P7 n
banta
Labipbardus sp.
O 38 2 7 47
baung
Macrones microcanthus
- 2 1 14 1 18
bawal
Colossoma macropomum
O 5 5
darap
-
- 1 1
gabus
Ophiocephalus striatus
C 5 18
1 24
gold fish
Cyprios carpio
O 11
4 15
gurame
Osphrenemus goramy
O 3 1 4
juah
Luciosoma sp
- 2 2
kalatau
-
- 28
28
kapar
-
- 4 2 6
kerandang
Channa pleurophthalmus
- 1 1
kelabau
Osteochilus melanopleurus
O
1 1
lais
Kryptopterus lais
- 1 5 1 7
lais lintang
Bagrichthys sp.
- 1 1
lawang
Pangasius nieuwenhuisii
- 18
1 19
nilem
Osteochilus hasselti
O 10
10
papayu
Anabas testudineus
C 4 1 5
patin
Pangasius pangasius
C 1 12
4 17
putin
Liza vaigienses
O
2 2
saluang
Rasbora sp.
O
4 22
1 27
sapat
Trisoppterus sp.
- 4 4
tahuman
Channa micropeltes
C 15
15
tekung
-
- 2 2
tongkol
Euthynnus affinis
C 3 3
TOTAL
86 69 37 25 33 9 5 264
FH= omnivorous=O, carnivorous=C; herbivorous=H)
The results of total mercury in fish from North Sulawesi and Central
Kalimantan garimpo's areas are shown in Table 6.
56
RT2004-016-00 CETEM/MCT
Table 6 - Results of total Hg in fish from both study areas
(arithmetical mean±standard deviation and range -maximum and minimum
values; wet weight)
Mercury
Garimpo area
N
Range
(µg/g)
North Sulawesi
130
0.58±0.45
0.01-2.60
Central Kalimantan 264
0.25±0.70
0.004-9.83
Central Kalimantan 263
0.21±0.36
0.004-1.83
Total 389
0.36±0.64
0.004-2.60
The present results show that total mercury concentrations in fish from
North Sulawesi are higher than in fish from Central Kalimantan area and the
Table 6 shows the minimum and maximum values for Hg in fish in both areas.
Considering that highest level was characterized as an extreme outlier, it was
excluded. Therefore, one specime from P4 was excluded, resulting a total of 24
specimes from P4. The resulted mean of Hg from Central Kalimantan is
0.21±0.36 µg/g (N=263) and its maximum value is 1.83 µg/g, while in North
Sulawesi mean Hg level is 0.58±0.45 µg/g (N=130) and its maximum value
reachs 2.60 µg/g. Figure 1 shows mean mercury concentrations in fish from
these areas.
Comparisons with global means of Hg in fish, however, may result in a
certain misinterpretation, since observations on given species of marine and
freshwater fish indicate that all tissue concentrations of mercury increase with
increasing age (as inferred from length) of fish (WHO, 1990); it is also strongly
affected by fish species and size (length and weight).
The results of total mercury in fish, length and weight from North
Sulawesi and Central Kalimantan garimpo's areas are shown in Table 7.
Table 7 - Results of total Hg in muscles (wet weight), length and weight of
fish from both study areas (arithmetical mean and standard deviation)
Mercury
Length
Weight
Garimpo área
N
N
N
(µg/g)
(cm)
(g)
North Sulawesi
130
0.58±0.45*
130
9.36±2.84*
130
27.0±46.5*
Central
263
0.21±0.36
263
16.59±13.8
263
170.7±311.3
Kalimantan
Total 394
0.33±0.43
393
14.20±11.89
393
123.25±264.66
N= number of specimens. Student's t-test; * p<0.0001, between areas
57
RT2004-016-00 CETEM/MCT
0,7
0,6
0,5
0,4
0,3
Hg in fish (ug/g)
0,2
0,1
N=130
N=263
0
North Sulawesi
Central Kalimanta
Figure 31 - Hg levels in fish from North Sulawesi and Central Kalimantan
It is well known that freshwater biota is able to accumulate Hg from
natural and anthropogenic sources. Maximum background levels for Hg in
uncontaminated freshwater fish are in the range of 0.1 to 0.3 µg/g, although
considerably higher levels can be found in large predators. The mean
concentration of Hg (0.36 µg/g) in fish species from this work was within that
range and lower than 0.5 g/g, the Hg concentration in fish recommended by
WHO (1990) as limit for human protection by Hg exposure by fish
consumption. However, we have to take into account that these species are
smaller and lighter than fish from other aquatic systems influenced by gold
mining, such as Amazon region (CETEM/IEC, 2004). In addition, among the
analyzed fish, 81 specimens, 21% of total fish sampled (389 fish) presented Hg
concentrations above 0.5 µg/g. Whereas in Central Kalimantan less than 10% of
fish samples showed Hg levels above that limit, in North Sulawesi this
percentage increases to more than 45%. It should be considered that fish from
North Sulawesi are smaller and lighter than fish from Central Kalimantan,
suggesting that Hg bioavaliability in Manado can be higher than in Central
Kalimantan.
Tables 8 and 9 present total Hg concentrations in individual fish species
(µg/g) from different sites in North Sulawesi and Central Kalimantan,
respectively, and the mean Hg levels in fish from different sites.
58
RT2004-016-00 CETEM/MCT
Table 8 - Total Hg concentrations (arithmetical mean±standard deviation) in
individual fish species (µg/g ) from North Sulawesi garimpo's areas,
Talawaan river watershed
Mercury (µg/g)
Popular name T1 (n) T2 (n)
T3 (n)
T4 (n)
T5 (n)
T6 (n)
T7 (n)
gabus
1.49±0.4
(2)
gete-gete
0.60±0.0 0.51±0.3
(2)
(8)
gold fish
0.04 (1)
guruo
0.26±0.0
0.57±0.3 0.33±0.1
(6)
(7)
(24)
kesa
1.2±0.40
(3)
lalimata
0.37±0.3
(8)
mujair
0.68±0.3
0.31±0.1
0.01±0.0
(5)
(14)
(4)
nilem
0.90±0.4
(18)
2.60
payanka
0.84±0.3
0.73±0.3
0.03±0.0
(12)
(11)
(1)
(2)
1.2
sepot
(1)
0.64
supit
(1)
bobara
0.017±0.0
(3)
cakalang
0.06±0.01
(3)
deho
0.05±0.03
(3)
gold fish
0.03±0.009
(5)
malalugis
0.01±0.003
(5)
tudę
0.03±0.01
(5)
0.04
TOTAL
0.85±0.41 0.54±0.39 0.68±0.63 0.38±0.18 0.02±0.01 0.03±0.02
(1)
(35)
(35)
(20)
(33)
(6)
(24)
N= number of specimens
59
RT2004-016-00 CETEM/MCT
Table 9 - Total Hg concentrations (arithmetical mean±standard deviation) in
individual fish species (µg/g ) from Central Kalimantan garimpo's areas
Popular name/
Mercury (µg/g)
Scientific name
P1 (n)
P2 (n)
P3 (n)
P4 (n)
P5 (n)
P6 (n)
P7 (n)
Banta
0.06±0.04
0.03±0.001
1.29±0.34
(38)
(2)
(7)
0.22
0.3
Baung
0.18±0.02
0.19±0.07
(2)
(1)
(14)
(1)
Bawal
0.01±0.002
(5)
0.08
Darap
(1)
0.21
Gabus
0.16±0.03
1.21±0.42
(5)
(17)
(1)
gold fish
0.02±0.003
0.01±0.001
(11)
(4)
Gurame
0.01±0.006
(3)
Juah
0.19±0.04
(2)
Kalatau
0.17±0.04
(28)
0.19
Kalui
(1)
Kakapar
0.12±0.03
0.26±0.02
(4)
(2)
0.15
Karandang
(1)
0.11
Kelabau
(1)
0.09
0.14
Lais
0.25±0.03
(1)
(5)
(1)
0.05
lais lintang
(1)
0.04
Lawang
0.04±0.03
(18)
(1)
Nilem
0.02±0.02
(10)
0.20
Papayu
0.18±0.10
(4)
(1)
0.004
Patin
0.01±0.002
0.09±0.02
(1)
(12)
(4)
Putin
0.04±0.02
(2)
0.11
Saluang
0.16±0.07
0.11±0.06
(4)
(22)
(1)
Sapat
0.09±0.02
(4)
Tahuman
0.22±0.50
(15)
Tekung
0.08±0.01
(2)
Tongkol
0.06±0.002
(3)
TOTAL
0.05±0.05
0.12±0.09
0.16±0.05
1.24±0.39
0.10±0.09
0.23±0.04 0.16±0.0
(86)
(69)
(37)
(24)
(33)
(9)
8 (5)
N= number of specimens
60
RT2004-016-00 CETEM/MCT
According to statistical analysis (One-way Anova; Duncan) the Hg levels
in fish from Taldano river (reference area-T6) showed the lowest mercury
levels, while T2, a dam, showed the highest mercury levels in fish, and it could
be considered as the most contaminated site. There are some gold mining
processing units surrounding this site. The Hg levels in the reference site are
quite low, although they are from the hydroelectric power plant lake,
mentioned, sometimes, as an environment that may show high mercury
methylation rate. In addition, T3 and T4 showed higher mercury levels in fish
than the reference area (T6). Although T5, an estuarine environment, showed
Hg levels not significantly different of the reference area (T6), it should
considered as a result linked more with the spread of data than the similarity of
data. T7, the fish market in Manado, showed very low Hg levels in marine fish.
In Central Kalimantan area, fish from flooded open pits in mining site
areas (P4) showed the highest Hg levels. These open pits are used for gold
processing and, also, for fishing, bathing and domestic wastes collected. P1
(Katingan river, upstream of gold mining area), P5 (Palangkaraya's fish
market, where fish are mainly from Kahayan river) and P7 (reference area 2)
showed similar and lowest Hg levels than P4, while P6 (Kalamanan, close to
Samba region, near the gold mining area) showed higher Hg levels. Fish from
P3 (control area 1) showed Hg levels higher than P1. While the average of Hg
in fish from this area are quite low, the Hg levels in fish from P4, the flooded
open pits surrounding garimpos´s area might be considered as the most
contaminated site. In addition, miners and their families are living close to
those open pits and might consume largely these fish.
Figures 32 e 33 show the total Hg levels in fish from different sites.
1,4
1,2
1
0,8
0,6
Mercury in fish (ug/g) 0,4
0,2
0
T1
T2
T3
T4
T5
T6
P1
P2
P3
P4
P5
P6
P7
Figure 32 - Hg levels in fish from distinct sites in North Sulawesi and Central
Kalimantan
61
RT2004-016-00 CETEM/MCT
From Tables 8 and 9, it should be noted that few species were caught in
more than 2 or 3 sites in reasonable number, meaning that search for specific
fish indicator may be a difficult task. As in the same way of some gold mining
areas in Amazon or tropical region, these results suggest that, in order to find
an indicator of Hg contamination, a search for a site-specific fish species, with
more than one species for different sites, could be a suitable approach for
spatial analysis. For temporal analysis, one suggest to choose specific species
founded in distinct sites.
In North Sulawesi, gete-gete, gruo, mujair and payaka are species caught
in more than one site. Comparing the Hg levels among sites, gete-gete showed
no differences between T4 and T5, while guruo from T4 showed higher Hg
levels than specimens from T3 and T5. Mujair from T6 showed lower Hg levels
than from T3, which showed lower Hg levels than mujair from T2. Payanka
from T2 and T3 showed higher Hg levels than those from T6. Concluding, the
fish species analyzes corroborate with the global means and indicate that T2 as
the most contaminated site. However, as shown in Figure 32, the mean of
mercury in specific fish species showed the tendency of high mercury levels in
fish from all sampling sites and one could suggest that the mercury levels in
fish from this area are similar among them, which may reflect the extent of
mercury contamination.
In order to search the fish indicator in North Sulawesi, linear correlation
was investigated and the results showed Payanka a significant positive
relationship between Hg levels and length (0.498; p<0.01; n=26) and weight
(0.627; p<0.001; n=26). No other species showed positive significant correlation.
According with the present results only Payanka could be used as fish
bioindicator of mercury contamination in this area.
Figure 33 shows the mean of Hg levels in several fish species from
different study sites in North Sulawesi area.
1,6
T1
T2
1,4
T3
1,2
T4
T5
1
T6
0,8
0,6
Mercury in fish (ug/g)
0,4
0,2
0
Gabus
Gete-
Gold fish
Guruo
Kesa
Lalimata
Mujair
Nilem
Payanka
Sepot
Supit
gete
Figure 33 - Hg levels in different fish species from distinct sites in North
Sulawesi area
62
RT2004-016-00 CETEM/MCT
In Central Kalimantan, banta, gabus, gold fish, patin and saluang are
species caught in reasonable number in more than one site. However,
considering all of specimens collected, as shown in Figure 34, the mean of
mercury in specific fish species showed the highest mercury levels in fish from
P4. Banta and gabus showed higher Hg levels in specimens from flooded open
pits (P4) than from Katingan river, upstream of gold mining area (P1) or from
Katingan river, downstream of the mining site Galangan (P2), respectively,
although fish from these sites are higher and heavier than specimens from P4.
Hg levels in gold fish from Katingan river (P1) are higher than in specimens
from Kahayan river (P5), although they are smaller and lighter than fish from
Katingan river. Patin from Kahayan river (P5) showed higher Hg levels than
specimens from Katingan river downstream of gold mining (P2) but they are
higher and heavier. It suggests that Katingan river should more contaminated
than Kahayan river. Finally, saluang showed no differences in Hg levels
between specimens from P1 and P2; upstream and downstream of gold mining
areas in Katingan river.
In order to search the fish indicator in Central Kalimantan, linear
correlation was investigated by using nontransformed and logtransformed data
for banta, gold fish, lawang and nilem from P1, gabus, patin, saluang and
tahuman from P2, kalatu from P3, banta and gabus from P4 and baung, bawal
and lais from P6. Since the results showed small differences between
nontransformed or logtransformed data, only results for nontransformed data
are presented. There is a positive significant correlation for banta from P1
between Hg levels and length (0.4291; p<0.01, n=38) and weight (0.4628;
p<0.005, n=38) and lawang from P1 between Hg levels and length (0.4697;
p<0.05, n=18). For gabus from P2, positive correlation between Hg levels and
length (0.9; p<0.05, n=5) and weight (0.9; p<0.5, n=5) were significant. Kalatau
showed a positive relationship between Hg levels and length (0.4245; p<0.05,
n=28) and weight (0.412; p<0.05, n=28) and lais, from P6, showed positive
correlation between Hg levels and weight (0.8866; p<0.05, n=5). One could
suggest these fish species as the indicator fish for temporal analysis of Hg
contamination in these distinct sites.
63
RT2004-016-00 CETEM/MCT
1,4
1,2
P1
p2
1
p3
p4
0,8
p6
p7
0,6
Mercury in fish (ug/g) 0,4
0,2
0
s
g
rap
ang
ang
tin
Banta Baung Da
Juah
Gabus
Nilem
Gold fish
Kalatau
Kalui Kakapar and Kelabau Lai lintan Law
Papayu
Patin
Pu Saluang Sapat
Kar
Tahuman Tekung
Lais
Figure 34 - Hg levels in different fish species from distinct sites in Central
Kalimantan area
3.5.1. Human exposure to mercury due to fish consumption
By employing the risk assessment to human health, toxicological, rather
than simply the statistical, significance of the contamination can be ascertained.
At a screening level, a Hazard Quotient (HQ) approach (USEPA, 1989), assumes
that there is a level of exposure (i.e., RfD = Reference of Dose) for non-
carcinogenic substances below which it is unlikely for even sensitive
populations to experience adverse health effects. The MeHg RfD value is 1E-04
mg.Kg-1.d-1 (IRIS 1995) and its uncertainty factor is 10 and its confidence level
is medium. Uncertainties of the RfD statistics have been reported, suggesting an
under-estimation of RfD for Hg presented in IRIS, 1995 (Smith and Farris 1996).
However, other authors suggest that there is no safe human exposure to MeHg
and that of all living species, human appear to have weakest defenses against
MeHg (Clarkson 1996). Considerable gaps in our knowledge about this remain.
Our approach, therefore, is to use the human risk assessment proposed by
USEPA, at screening level. HQ is defined as the ratio of a single substance
exposure level (E) to a reference of dose (E/RfD). When HQ exceeds unity,
there may be concern for potential health effects. The estimated exposure level
was obtained by multiplication of 95th percentil upperbound estimate of mean
Hg concentration considering all fish as suggested by USEPA (1989), by the
adult human ingestion rate for local populations. Most of the works about
riverside population assume consumption rate close to 0.2 Kg.d-1. However,
one could considered reasonable suppose that in North Sulawesi most people
consume fish from market, mainly marine fish or freshwater from fish farming,
rather than those small fish from the study sites. There fore, it could be
64
RT2004-016-00 CETEM/MCT
reasonable to assume a fish comsuption rate close to 0.05 kg.d-1 related to
freshwater fish.
In Central Kalimantan, it should consider that miners living close to the
P4 study site may consume fish caught in those flooded open pits. As they are
not riverside population, but considering the poverty, one could assume the
fish consumption rate close to 0.05 Kg.d-1. Finally, the intake dose is estimated
by dividing that product by 70 kg, considering the weight average human
adult. Although total mercury was quantified in fish, it has been demonstrated
that about 75-95% of total mercury is methylmercury in fish muscles. Thus, in a
conservative approach, it has been assumed that total mercury in fish
represents methylmercury. The resultant HQs for MeHg are shown in Table 10.
Table 10 MeHg Hazard Quotient due to fish ingestion in North Sulawesi
(NS) and Central Kalimantan (CK) sampling sites
Garimpo's area
RfD
Intake Dose
HQ
NS- total
1E-04
4.64E-04
4.6
NS- Fish market
1E-04
2.86 E-05
0.3
CK-total 1E-04
2.43E-04
2.4
CK-P4 1E-04
9.93E-04
9.9
CK-fish market
1E-04
9.29E-05
0.9
HQ resulted above the unit for North Sulawesi total sampling, but the
fish market consumption. For Central Kalimantan, both total and P4 sampling
site, HQ resulted above the unity, 2.4 and 9.9, respectively, which means that
population are under hazards due to fish consumption. On the other hand, fish
market showed HQ below the unit, suggesting that hazards for consuming fish
from Katingan river may be increased compared to consumption of specimens
from Kahayan river. The population that may consume fish from the flooded
open pits (P4) are under the highest estimated hazards (HQ=9.9) and the local
population should be advised for avoiding consumption of fish from those
pounds. The picture will be even wont if one consider the usual fish
comsuption in the riverside population (close to 0.2 kg/d), increasing the
hazard quotient to close 40, which means that population is sender higher
health hazard.
In a previous study (Bidone et al. 1997) showed the estimates of Hg
concentration in blood and in hair from contaminated site, using the single-
compartment model (WHO 1990) through which the steady-state Hg
concentration in blood (C) in µg.l-1 is related to the average daily dietary intake
(d) in µg of Hg, as follows: C = 0.95 * d. Hair concentrations of Hg are
proportional to blood concentrations at the time of the formation of the hair
strand, and blood-to-hair ratio in humans is about 1 to 250, but appreciable
individual differences have been found (WHO, 1990). A synthesis of the
estimates to Hg concentration in blood and in hair using the single-
compartment model for North Sulawesi (total and fish market) and Central
Kalimantan (total, P4 and fish market) is shown in Table 11.
65
RT2004-016-00 CETEM/MCT
Table 11 - Hg concentration in fish; estimated average Hg daily intake (d);
estimated blood Hg concentration (b) and estimated hair Hg
concentration (h).
Hg in fish*
d
b
h
Garimpo's areas
(µg.g-1)
(µg.d-1)
(µg.l-1)
(µg.g-1)
NS-total 0.65
32.5
30.8
7.7
NS-Fish market
0.04
2.0
1.9
0.5
CK-total 0.34
17.0
16.1
4.0
CK-P4 1.39
69.5
66.0
16.5
CK-Fish market
0.13
6.5
6.2
1.5
* = 95 percent upper confidence limit on the arithmetic mean
The background level in hair falls in the range of 1-2 µg/g (WHO, 1990).
Hazardous effects on fetus are likely when 20 µg/g is analyzed in the hair of
pregnant women. WHO (1990) reports that 50 µg/g Hg in hair is an adequate
threshold to observe clinical effects and that child-bearing women with Hg
concentrations in hair above 70 ug/g exhibit more than 30% risk of having
neurological disorder in the offspring. Levels of 10 µg/g must be considered as
the upper limit guideline for pregnant women (WHO, 1990). Recent evaluation
considers 5 µg/g Hg in hair a safety guideline for pregnant women (Yagev,
2002), whereas 6µg/g has been considered the Limit of Biological Tolerance
(LBT) for general population (WHO, 1990).
The estimated Hg levels in hair in CK total is higher than the LBT, but
lesser than the upper limit guideline for pregnant women. The NS and CK fish
market are close to the levels found in non exposed population. CK total
showed Hg in hair below 5 µg/g Hg, a safety guideline for pregnant women
and below the LBT(6µg/g). CK-P4 showed the highest levels, higher than the
upper limit guideline for pregnant women, but lesser than levels associated
with threshold to observe clinical effects.
Hg levels in blood and in hair of the average population were estimated
by using the one-compartment model associated to the results of Hg levels in
blood in the population of NS (30.8 µg/L) and of CK (16.1 µg/L) and the Hg
levels in hair of both populations, respectively. The Hg in blood resulted close
to 23µg/L and about 6µg/g in hair. These results showed good correspondence
with the Hg determination in blood and hair of the population (see 3.7.3. Most
of the population from both areas showed Hg levels in blood below 25µg/L
and in hair below 10 µg/g, except the amalgam smelters of both areas, which
showed higher levels of Hg in blood and in hair, besides identified groups as
critical for Hg exposure. In addition, it should be considered that up to 60% of
Hg found in the hair of the amalgam smelters refers to inorganic mercury.
66
RT2004-016-00 CETEM/MCT
3.6. Mercury semiquantitative determination in fish samples
in Manado, Indonesia Training of local users
Mercury analysis in soil and sediment samples, though the
spectrophotometry methodology of atomic absortion, presents some
operational difficulties as to the distance to the sampling object, analytical costs
and readiness, specially when the necessary number of samples is very large.
The distance from the field to the laboratory facilities usually implies in long-
term, high-costs packaging, conservation and transportation procedures that
brings great difficulty to the analytical procedure of a large number of samples.
Therefore, CETEM developed an analytical field procedure that fulfills
all the above conditions. The proposed method consists of a semi-quantitative
colorimetric method.
To determine mercury concentration in fish, 10 g of sample is digested
with an oxidant mixture, containing sulfuric acid, nitric acid and vanadium
pentoxide (Figure 35a). To the clear solution obtained, containing ionic
mercury, a reduction reagent (acid solution of stannous chloride) is added and
elemental mercury formed is forced by an air stream (Figure 35b). The mercury
steam is forced to go covered with emulsion containing cuprous iodide. The
color intensity formed by the complex is proportional to the mercury
concentration in the sample.
a
b b
Figure 35 - Digestion system Figure 35b - Determination system
At the end of the operation, the operator is capable to classify the sample
according to the WHO recommendations, by comparing it with the color
developed in similar analytical systems, containing standard solutions. Figure
36 shows the range of colors resulting from the analytical tests.
67
RT2004-016-00 CETEM/MCT
0 ng/g
300 ng/g
600 ng/g
1000 ng/g
Figure 36 - Similar colors to those developed in the detecting papers
After determination, fish samples can be classified into 3 groups
according to Table 12.
Table 12 - Sample classification according to mercury content and the WHO
recommendations
Classification
Mercury content (ng/g) of fish
Proper for frequent
Lower than 300
consumption
Proper for eventual
Between 300 and 600
consumption
Not proper for consumption
Higher than 600
The semiquantitative method was compared to the conventional
analytical method (CVAAS), whose performance was checked using Standard
Reference Materials of fish muscle and liver fish (Squalus acanthias) produced
and distributed by National Research Council Canadá (NRC-CNRC), named
DORM-1 and DOLT-2. Participation on the Mercury Quality Assurance
Program (MQAP), coordinated by Canadian Food Inspection Agency has been
used for the quality assurance of the quantitative method since January 2000.
A similar work developed in Itaituba, Brazil, was developed in Manado,
Indonesia. The training was performed in the laboratory of the Balai
Laboratorium Kesehatan Manado, that was arranged by the host
institution(Yayasan Bina Cipta Aquatech). Eleven participants from local
institutes (Yayasan Bina Cipta Aquatech, Faculty of Fisheries and Marine
Science, Sam Ratulangi University, Loka Budidaya Air Tawar, Provincial
Environmental Impact Protection Agency Environmental Health Academic and
Provincial Health Agency, Balai Laboratorium Kesehatan ) were trained in the
method and participate in a small application study.
The technical activities were developed in the period 09/09 to
09/20/2003 by Allegra Viviane Yallouz and Débora Maia Pereira, from CETEM.
The training was done focusing on theoretical concepts, practical works,
and good lab practices. Each participant received the detailed work instructions
in English. For further training, this instructions manual was already translated
into Indonesia language by Dr Limbong.
68
RT2004-016-00 CETEM/MCT
The training program was performed in a similar mode that done in
Itaituba: the theoretical concepts were discussed using posters placed on the lab
walls and during formal lecture and round table discussion. The main content
was:
- Comparison with usual methods
- The importance of mercury determination in fish
- The different toxicology of mercury species
- The chemical pathways of mercury in the environment
- Method's
applicability
- Method's advantages and limitations
- WHO recommendations and the Brazilian Laws regarding mercury level
in fish
- Quality assurance of the results
- Possible
applications
The practical training was performed giving individual training for each
participant starting with a practical demonstration of the use. Then, each
operator participated on an exhaustive practical training in the use of the
determination system until the complete domain of the system using mercury
aqueous solutions with well known concentration.
3.7. Health Assessment
3.7.1. General health situation
Doctors, nurses, engineers, teachers and participants were interviewed
to identify possible health effects in relation to the mining activities.
The sociological report gave some valuable information about the
population in Kalimantan (Rachmadhi P 2003). But the information for
Sulawesi was completely misleading. Contrary to the report not only young
men worked in the mining areas. Older men, and quite a few women worked
there too. The main problem of the Sulawesi area, the intensive child labour
was not mentioned at all. It might be doubted, whether the sociologist was at all
profoundly investigating in the area.
The infrastructure in Karang Pangi is poor, but sufficient to perform the
examination. In Tatelu the infrastructure is more favourable.
The regional health authorities supported the project in Kalimantan. But
on the national level there was no support for the project. When asked for
support before the start of the project, the Ministry of Health did not support
the health assessment.
69
RT2004-016-00 CETEM/MCT
Health care system in the Central Kalimantan mining area of Galangan
At the moment 8.200 people are living in the village of Kereng Pangi, and
approx. 1.200 in the widespread mining area of Galangan (2.000 ha). Most of the
miners are men in their twenties and thirties, less women live in the mining
area, and the children in the mining area are mainly young. In the village of
Kereng Pangi the male/female ratio is nearly equal (4.300 male/ 3.900 female).
200 neonates (0-1 years of age), 800 children (1-6 years) and 1.200 children 6-12
years live in the area.
There is one local health centre in Kereng Pangi. Doctor (Dr. Robertus
Pamuryanto) has 9 nurses and 2 midwifes. The centre is responsible for mother-
child care, including pregnancy and immunization programmes (DPT, Polio,
BCG, Hepatitis B). Diseases such as Malaria and Tuberculosis can be treated
there. But the diagnostic procedures such as microbiological tests or x-ray have
to be carried out in the next hospital. The health centre is poorly equipped. It is
not equipped to treat any serious accident. It is absolutely not equipped to
diagnose mercury intoxication, nor can it treat such a condition. Traditional
healers (dunkun) are an essential part of the health system.
The next hospital is in Kasongan. Severe cases have to be transferred to
Palangkaraya. HIV test can only be performed in Indonesia in two laboratories
in Jakarta
General health problems (Galangan area)
The main health problems in the area seem to be:
- Dangerous open pits, approx. 4 lethal accidents occur each month in
Galangan.
- Car, motorbike and truck accidents are very common. The traffic conditions
are difficult, many cars, motorbikes and trucks are in a bad technical
condition. On the road fast cars such as jeeps and trucks share the mainly
narrow roads (at night very dark) or off roads with motorbikes, bicycles and
pedestrians. There is no infrastructure to rescue and treat any kind of severe
accident.
- Infectious diseases, mainly malaria is widespread. Malaria is diagnosed
clinically and treated orally with Chloroquine and Quinine. Tuberculosis is
with an estimated rate of 5-10 cases in a population of approx. 10.000
endemic, but not epidemic. Tuberculosis is treated under a governmental
programme. According to the WHO scheme daily observed treatment (DOT)
with quadruple treatment for 2 months (Isoniazid, Rifampicin, Pirazinamid,
Etambutol) and follow-up double treatment for 4 month (Isoniazid,
Rifampicin) is performed.
- Asthma is fairly common as well. Mainly young people, children as well as
workers do or did suffer from Asthma. Oral treatment is prevailed
70
RT2004-016-00 CETEM/MCT
(Salbutamol). The asthma incidence is higher then expected. The asthma
incidence in Kalimantan is higher then in Sulawesi.
- Sexually transmitted diseases (STD) seem to be common. It is estimated that
more then 120 sex workers are working in Galangan. 2 HIV positive
prostitutes are reported (without treatment). The amount of Hepatitis B and
Hepatitis C cases is unknown due to missing laboratory facilities, but
Hepatitis seems to be prevalent. Syphilis is common, the sex workers receive
regular antibiotic treatment (Kanamycin). One of the nurses of the local
health centre is in charge of the sex workers. Safer sex campaigns are
unknown.
- The dental status of most people is disastrous. Old people usually only have
ruins or stumps left, most adults have severely damaged teeth. Some
children have fairly good teeth, other children have a mouth full of rotten
teeth.
- Due to insufficient sanitary conditions diarrhoeal diseases are very common.
But it is not a major cause of mortality.
- Pneumonia, parasitism, skin diseases, hypertension, upper respiratory
infectious and are other important diseases in Galangan.
- Since the population is very young, heart diseases and cancers are rare.
- Smoking is an epidemic habit of nearly all adult men.
Children's health (Galangan area)
25% of the population in the area are children under the age of 12. The
main health problems of children in Galangan seem to be:
High exposure to mercury in the area. Children to have access to fluid
mercury, they play with this mercury with their hands. They live within the
houses where panning or amalgam smelting is carried out, therefore they are
also exposed to mercury fumes.
At the age of 15 teenagers start to work in the area as miners with contact
to mercury. In Kereng Pangi most children do go to school. In remote areas of
Galangan not all children go to school, and begin to work in the mining areas at
a very young age. This is child labour at its worst limits, partially physically
very hard, partially related to high exposure of mercury. Accidents related to
work are a health hazard for these children.
Due to poor sanitary conditions infectious diseases like gastro-intestinal
infections and malaria are very common and are a risk for children's health.
Infant mortality can be estimated, in 2002 5 children died in a population
of approx 1.200 children.
71
RT2004-016-00 CETEM/MCT
Hygienic and social problems (Galangan area)
The interviews showed some other problems:
- Poor sanitary conditions are a health hazard.
- The drinking water in Kereng Pangi is sometimes turbid, which is a sign of
insufficient hygienic quality. The drinking water is taken from 400 different
deep wells within the settlements.
- 10 % of the houses and huts in Kereng Pangi have no toilets. Proper disposal
systems for waste including excrement's are missing. Waste is disposed
outside the houses and burned.
- In the hilly landscape of Galangan many small water pools exist, containing
mercury from panning processes. Human excrements run from the huts into
these pools. This water is used for drinking purposes in the area. The water
in Galangan area should not be used for drinking purposes.
- The pools are certainly an excellent habitat for transmitters of vector borne
diseases, like Malaria.
- 90 % of the huts in Galangan have no toilets. Proper disposal systems for
waste including excrement's are missing. Waste is disposed into the pools or
just dumped.
- Dark fumes emitted from motorcycles, trucks and burning waste. These
fumes contain small particles and PIC's (products of incomplete combustion)
and are causing damage to the upper and lower airways.
- Small scale gold mining operations are illegal. Legalisation does not seem to
be of major public interest.
- Corruption is still common, and small scale miners are more vulnerable to
corruption, since their work is considered as illegal.
Health care system in the Northern Sulawesi mining area of Tatelu
At the moment 18.000 people are live in the villages of the Dimembe
district (Tatelu, Talawaan, and 17 others villages). 2.000 children (0-5 years) live
in the area. The amount of miners is estimated between 200 and 2.000 next to
Tatelu. Since the mining area is still expanding, 2.000 miners might be a good
estimation. Most of the miners are men over 15 years, mainly in their twenties
and thirties, fewer women live in the mining area, and even less children.
There is one local health centre in Tatelu. Doctor Louisa M. Pongajouw
has 16 nurses and 9 midwifes for the Dimembe district. Three private doctors
and 1 dentist are working in the area as well. The centre is responsible for
mother-child care, including pregnancy and immunization programme (DPT,
Polio, BCG, Hepatitis B). Disease such as Malaria and Tuberculosis can be
treated. The health centre is fairly equipped, it is equipped to diagnose
tuberculosis, but it can not treat any serious accident. It is not equipped to
diagnose mercury intoxication, nor can it treat such a condition.
72
RT2004-016-00 CETEM/MCT
Health promotion is a task of the health centre. Two campaigns to raise
awareness for the mercury as a health hazard took place in the last years. Public
servants and miners were informed about the health risks. No actual program is
running.
The next hospital is in Manado.
General health problems (Tatelu area)
The main health problems in the area seem to be:
- Due to inappropriate security measures, tunnels collapse. Approx. 2-5 lethal
accidents happen each year in the Tatelu mining area in these dangerous
tunnels.
- Car, motorbike and truck accidents are very common, as in Kalimantan.
- Infectious diseases, mainly malaria is widespread. Malaria is diagnosed
clinically and treated orally with Chloroquine and Quinine. Tuberculosis is
with an estimated rate of 9 cases in a population of approx. 18.000 endemic,
but not epidemic. Tuberculosis is treated under a governmental programme.
According to the WHO scheme daily observed treatment (DOT).
- Sexually transmitted diseases (STD) seem to be common. There are an
unknown number of sex workers in Tatelu. 1 HIV positive case is known.
The amount of Hepatitis B and Hepatitis C cases is unknown due to missing
laboratory facilities, but Hepatitis seems to be prevalent. Gonorrhoea is
common.
- The dental status of most people is very bad, as in Kalimantan.
- Due to insufficient sanitary conditions diarrhoeal diseases are very common.
But it is not a major cause of mortality. Typhus outbreaks are common, many
children have already had typhus. Cholera outbreaks occur too.
- Skin diseases, parasitism, and upper respiratory infectious are other
important diseases in Dimembe.
- Smoking is an epidemic habit of nearly all adult men.
Children's health (Tatelu area)
The main health problems of children in Tatelu seem to be:
- High exposure to mercury in the area. Children to have access to fluid
mercury, they play with his mercury with their bare hands. They live within
the houses where panning or amalgam smelting is carried out, therefore they
are also exposed to mercury fumes.
- A large number of children, some as young as 8 years of age, work away
from their family homes. They work in the mining area. These children earn
some money after school by performing various kinds of work, for example
working in tunnels, carrying sacks with ore, hammering ore to pieces,
73
RT2004-016-00 CETEM/MCT
emptying ball mills, squeezing towels and searching for amalgam, even
smelting is performed by these children. This is extreme child labour at very
early years of life, partially physically very hard, partially related to high
exposure of mercury. Accidents related to work are a health hazard for these
children.
- Due to poor sanitary conditions infectious diseases like gastro-intestinal
infections and malaria are very common and are a risk for children's health.
- Neonatal mortality can be estimated, in 2002 4 children died in a population
of approx 200 children. After the neonatal age child death occurs only very
rarely.
Hygienic and social problems (Tatelu area)
The interviews showed some other problems:
- Poor sanitary conditions are a health hazard.
- The drinking water in Tatelu and the other villages is not very safe. 90% of
the people drink spring water. Many houses in Tatelu have no toilets. Proper
disposal systems for waste including excrement's are missing. Waste is
disposed outside the houses and burned.
- In the mining area the miners do not have access to safe drinking water,
some drinking water already contains mercury. The water in the mining area
should not be used for drinking purposes.
- The huts and camps in Tatelu have no toilets. Proper disposal systems of
waste including excrement's are missing. Waste is just dumped.
- The former outbreaks of typhus and cholera seem a consequence of these bad
hygienic standards.
- Dark fumes are emitted from the engines for power generators and ball mills,
motorcycles, trucks and of burning waste. These fumes contain small
particles and PIC's (products of incomplete combustion) and cause damage
to the upper and lower airways
- Small scale gold mining operations are illegal. Legalisation does not seem to
be of any public interest.
- Corruption is still common, and small scale miners are more vulnerable to
corruption, since their work is considered illegal.
- HIV / Aids Illegal small-scale miners are mobile men with money, and they
form a high risk group for spreading the virus in the community and into
other areas. Shortly before the field project started, UN-AIDS asked kindly to
perform a HIV test for all participants. There was no time left to change the
health assessment protocol, to include all necessary investigations for AIDS.
But mainly the missing treatment opportunities for HIV positive participants
made it ethically impossible to carry out a HIV test in this project. In
Kalimantan Dr. Robertus Pamuryanto is a part of the regional AIDS task
74
RT2004-016-00 CETEM/MCT
force and would welcome testing the participants. The AIDS / HIV topic
needs to be discussed further.
3.7.2. Health Assessment Clinical Impression
The questionnaire from the UNIDO health assessment protocol was
translated in Bahasa Indonesia (see appendix). All 496 participants filled in a
questionnaire with the help of the nurses. All participants were physically
examined including neurological testing. Specimens (blood, urine, hair) of all
participants were taken at that time. A mobile Hg analyser was used to
determine total mercury in urine. Video and photo documentation was carried
out.
Clinical and neurological examination Central Kalimantan
Our clinical impression was, that a fair amount of workers from
Galangan and Kereng Pangi showed severe symptoms, well related to the
classical picture of mercury intoxication. They reported about fatigue, tremor,
memory problems, loss of weight, metallic taste and sleeping disturbances.
Intentional tremor, mainly fine tremor of eye lids, lips and fingers, severe
ataxia, dysdiadochokinesia and altered tendon reflexes were observed. It
should be noted that the workers from Galangan were primarily very healthy
and strong young men (healthy worker effect). Participants who worked for
more than 5 years in the area seemed to have more severe clinical symptoms.
We might not have seen the most severe cases, since the people from the
Galangan area had to come to Kereng Pangi for the examination. Due to a lack
of a highly developed social system in Indonesia, some very sick workers might
also have moved back to their original homes and families elsewhere in
Indonesia.
The participants from Kereng Pangi, showed clinical signs of mercury
intoxication, mainly if they were working in "Toko Mas", the gold shops where
the amalgam is heated to extract the gold.
The children in general were fairly healthy. The nutritional status of the
children was good. Many children suffered from Asthma. The children were
physically very fit, and very well socialised. But some of the children showed
neurological symptoms such as ataxia, that might be due to the high mercury
exposure in their surrounding.
The control group in Tangkiling was fairly healthy and did not show any
special health problems (53 people, mainly women).
Clinical and neurological examination Northern Sulawesi
Some miners from the Tatelu area showed severe symptoms of the
classical picture of mercury intoxication. They reported about general health
being worse since working with mercury, metallic taste and salivation
75
RT2004-016-00 CETEM/MCT
problems. Intentional tremor, mainly fine tremor of eye lids, lips and fingers,
ataxia and dysdiadochokinesia were observed. The workers from Tatelu are
primarily very healthy and strong young men (healthy worker effect). Since
Tatelu is a new mining area, most miners had worked less then 5 years with
mercury.
The participants from Tatelu village, that did not work with mercury,
showed not many clinical signs of mercury intoxication.
The children in general were very healthy. The nutritional status of the
children was good. The children were physically very fit, and very well
socialised. Many of the children did work in the mining areas and had a
different length of exposure to mercury.
Children with exposure to mercury already showed neurological
symptoms such as ataxia or dysdiadochokinesia and light tremor.
The control group in Air Mandidi consisted of 32 children (11-12 years of
age) and 21 young workers from a water company. Both control groups did not
have mercury levels above HBMI. Both groups were healthy and did not show
any special health problems.
Mobile Laboratory
For the first time a mobile Hg analyser was used in an UNDIO mercury
health assessment project. It is possible to quantify total mercury in urine. The
urine was dissolved with Hydrochloric acid. ZnCl was added, and the sample
was analysed. Bottled mineral water was used as zero standard, and a mercuric
nitrate as standard solution.
In nearly all cases it was possible to analyse the sample. From a clinical
perspective the results are promising. All urine samples will be once more
analysed in the Institute of Forensic Medicine. After that this field method can
be well compared against a standard reference method.
Differences between the two field projects.
It was very challenging to perform two projects in Indonesia. Comparing
the field projects, some first differences between the two projects are obvious.
In Kalimantan the local health unit took a very active part. The local
doctor was very engaged and effective in mobilizing the participants, may be
due to his excellent connection and acceptance in the area. The interview part of
the questionnaire was performed by the local nurses (questionnaire 1-4). A
problem was, that too many different nurses performed the interview. They just
wanted to help, without being properly trained to do the interview.
In Sulawesi the local health unit was not a part of the examination. The
examination took place in a village hall. The local head of the village promised
to mobilize the participants, but was only successful with some villagers and
76
RT2004-016-00 CETEM/MCT
school children, but not with miners. The miners were difficult to mobilize,
direct contact between the health team and the miners was a good way to
mobilize them. The interview section was performed by members of the local
Department of Energy, or laboratory technicians, but not nurses. The quality of
the interviews varies therefore, and we have a strong bias due to the
interviewer in all the questionnaire section, The quality of the interviews is
good enough to make the decision about an intoxication, but it might not be
good enough to improve the quality of the health assessment.
Another problem is, that the miners are regarded as illegal miners. Just
some years ago the Department of Energy collaborated in with the police to
forcefully remove the miners from the mining sites in Tatelu / Sulawesi. As a
result it is difficult to approach the miners with an health assessment team, that
is accompanied by many uniformed officials either from the community or the
Department of Energy. Mainly in Sulawesi the miners mistrusted the health
assessment, even more since they "were examined for free, and even received a
small per diem, instead of paying the doctor". In future projects, the health
assessment should be strongly connected to the local health unit, and all other
officials, should remain more in the background.
The language barrier was enormous, since hardly anybody in the mining
areas speaks or understands English. In Kalimantan we had one interpreter, but
in Sulawesi the pre-selected interpreter herself admitted having only passive
English language knowledge. In Kalimantan part of the participants where
Dayaks, and some of them did not understand Bahasa Indonesia, but only their
local dialect. Since the health assessment depends a lot on communication
between the expert team and the participants, for future projects the interpreter
question has to be handled by UNIDO with more care. A careful training of a
few, well selected nurses and interpreters is necessary in the first few days.
The support from Mansur Geiger, from P.T Kalimantan Surya Kencana,
and his enormous knowledge of the area was very helpful. In Sulawesi we did
not experience such an expert advice.
3.7.3. Description of mercury levels in urine, blood and hair
In Table 13 the total mercury concentrations of all analysed blood, urine
and hair samples are summarised. In all blood samples the mercury
concentration was above the detection limit of 0.20 µg/L. In 6 urine samples the
mercury concentration was below the detection limit of 0.20 µg/L. For statistical
purposes, in these cases the value was set to ˝ of the detection limit (0.10 µg/L).
In all hair samples the content of total mercury was above the detection limit
(0.02 µg/g). In 467 cases the concentration of inorganic mercury in hair was
above the detection limit of 0.04 µg/g. In these cases the concentration of
organic bound mercury could be calculated by the difference total Hg minus
inorganic Hg (Table 14).
77
RT2004-016-00 CETEM/MCT
Table 13 - Concentration of total mercury in blood, urine and hair
This project
For comparison
Philippines (gold
Indonesia
Germany
mining area)
case number
491
323
3958
span
1.45 429
< 0.25 107.6
< 0.2 12.2
median 8.4 8.2 0.6
Hg-blood (µg/l) arithmetic.
16.6 11.48 0.51
mean
literature
(Drasch 2001)
(Krause 1996)
case number
492
313
4002
span
< 0.20 5 240
< 0.25 294
< 0.2 53.9
median 4.6 2.5 0.5
Hg-urine (µg/l) arithmetic.
40.47 11.08 1.11
mean
literature
(Drasch 2001)
(Krause 1996)
case number
492
313
4002
span
< 0.20 1 697
< 0.1 196.3
< 0.1 73.5
median 2.7
Hg-urine (µg/g
2.4 0.4
creatinine)
arithmetic.
17.99 8.40 0.71
mean
literature
(Drasch 2001)
(Krause 1996)
case number
488
316
150
span
0.33 - 792
0.03 37.76
0.04 2.53
median 2.64
Total Hg-hair
2.72 0.25
(µg/g)
arithmetic.
9.15 4.14
mean
literature
(Drasch 2001)
(Drasch 1998)
Table 14 - Concentration of organic mercury in hair
Indonesia
Tanzania
(this project)
case number
467
123
span
< 0.10 - 326
0.10 5.25
Organic Hg-hair median 1.74 0.44
(µg/g)
arithmetic.
3.98 0.62
mean
For comparison the results of a recent project in a small scale gold
mining area of the Philippines (Drasch 2001) are reported in the same Table 13;
further, for blood and urine, the result of a representative epidemiological
study, performed 1990/92 in Germany, an industrial country in Western
78
RT2004-016-00 CETEM/MCT
Europe (Krause 1996). For a better comparison of the (total) hair values, recently
published own data from Germany are cited (Drasch 1998). The organic bound
Hg in hair (Table 14) was compared to a similar project, just finished in
Tanzania (Drasch 2004b).
In recent literature from Europe and Northern America similar Hg
concentrations in blood, urine and hair have been reported (Drasch 2004a).
From populations with a high consumption of methyl-mercury-contaminated
sea food like in Japan, the Faeroes Islands, the Seychelles or Canadian Inuit
higher Hg values in the bio-monitors have been reported recently e.g. on the
International Conferences on "Mercury as a Global Pollutant" 1996 in
Hamburg, Germany, 1999 in Rio de Janeiro, Brazil and 2002 in Minamata, Japan
(for literature in detail see proceedings). From other areas with small scale gold
mining like in the Amazon, Brazil, mercury concentrations, comparable to the
found levels, have been reported e.g. at these congresses or summarised in the
book "Mercury from Gold and Silver Mining: A Chemical Time Bomb?" by de
Lacerda and Salomons (1998).
All mercury concentrations in the different bio-monitors blood, urine and
hair are highly significant rank correlated (table 3 and 4 in appendix 1). Despite
this, the individual values scatter widely (see Figures 3-8a).
Exclusion of data
From the total group 23 cases were excluded from further statistical
analysis:
- 16 seniors older than 59 years
- 7 participants with severe neurological diseases.
Their age or disease might have biased the result of their neurological
investigations and/or their neuro-psychological tests.
Nevertheless, for these 23 cases the decision about an individual
diagnosis of mercury intoxication (see below) was made as well .
Forming subgroups due to residence and occupation
To distinguish between the possible sources of mercury burden, we
formed subgroups. The remaining 469 participants (222 from Sulawesi, 247
from Kalimantan) were subdivided due to residence and occupation criteria.
The following subgroups were formed (Table 15).
79
RT2004-016-00 CETEM/MCT
Table 15 - Number of participants per sub-group
Sulawesi
Kalimantan
Control adults
22
36
Former miner (in control area)
0
10
Not occupational burdened
18
67
Mineral processors
17
30
Amalgam-burners 61
69
Control children
31
0
Children not working with Hg
22
27
Children working with Hg
51
8
Sum 222
247
A) Sulawesi
- Control group adults: 22 adults from Air Mandidi, without known special
Hg burden.
- Not occupational burdened: 18 adults living in the mining area of Tatelu
without any special occupational Hg-burden.
- Mineral processors: 17 adult mineral processors, living in the mining area of
Tatelu.
- Amalgam-burners: 61 adults, amalgam-burners living in the mining area of
Tatelu.
- Control group children: 31 children from Air Mandidi without special Hg
burden.
- Children not Hg work: 22 children living in the mining area of Tatelu
without any special occupational Hg-burden.
- Children working with Hg: 51 children living in the mining area of Tatelu,
working with mercury.
B) Kalimantan
- Control group adults: 36 adults from Tangkiling without known special Hg
burden.
- Former miners: 10 adults, former miners, now living in the control area of
Tangkiling.
- Not occupational burdened: 67 adults living in the mining area of Galangan
without any special occupational Hg-burden.
- Mineral processors: 30 adult mineral processors living in the mining area of
Galangan.
80
RT2004-016-00 CETEM/MCT
- Amalgam-burners: 69 adults, amalgam-burners, living in the mining area of
Galangan.
- Children not Hg work: 27 children living in the mining area of Galangan
without any special occupational Hg-burden.
- Children working with Hg: 8 children living in the mining area of Galangan,
working with mercury.
Unless otherwise indicated, all further statistical analysis was performed
with these subgroups.
In Figures 38 and 39 the age distribution of all sub-groups is displayed.
As expected, there is a surplus of males in the occupational burdened groups
(amalgam-burners and former occupational burdened volunteers) (tables 6 and
7 in appendix 1). This gender difference could not be controlled in field under
the given conditions.
Sulawesi
70
60
50
40
30
20
10
age (yeras)
0
N =
22
18
17
61
31
22
51
control adults
mineral processors
control children
children Hg working
not occup. burdened
amalgam-smelters
children not Hg work
Figure 38 - Age distribution of all volunteers from Sulawesi, selected for the
statistical evaluation
81
RT2004-016-00 CETEM/MCT
Kalimantan
70
60
50
40
30
20
10
age (yeras)
0
N =
35
10
67
30
69
27
8
control adults
not occup. burdened
amalgam-smelters
children Hg working
former miner
mineral processors
children not Hg work
Figure 39 - Age distribution of all volunteers from Kalimantan, selected for
the statistical evaluation
3.7.4. Statistical analysis of mercury levels in urine, blood and
hair
Statistical testing of the different Hg-burdened subgroups versus
mercury concentration in blood, urine and hair show significant results (tables
6 to 8 in appendix 1), Figures 40 to 45a.
82
RT2004-016-00 CETEM/MCT
Sulawesi
500
400
300
200
100
Hg-B (µg/L)
0
N =
21
18
17
61
31
22
51
control adults
mineral processors
control children
children Hg working
not occup. burdened
amalgam-smelters
children not Hg work
Sulawesi
50
40
30
20
10
Hg-B (µg/L)
0
N =
21
18
17
61
31
22
51
control adults
mineral processors
control children
children Hg working
not occup. burdened
amalgam-smelters
children not Hg work
Figure 40 and 40a (expanded y-axis) - (Total) mercury concentration in blood
samples from Sulawesi
83
RT2004-016-00 CETEM/MCT
Kalimantan
500
400
300
200
100
Hg-B (µg/L)
0
N =
36
10
67
30
69
27
8
control adults
not occup. burdened
amalgam-smelters
children Hg working
former miner
mineral processors
children not Hg work
Kalimantan
50
40
30
20
10
Hg-B (µg/L)
0
N =
36
10
67
30
69
27
8
control adults
not occup. burdened
amalgam-smelters
children Hg working
former miner
mineral processors
children not Hg work
Figure 41 and 41a (expanded y-axis) - (Total) mercury concentration in blood
samples from Kalimantan
84
RT2004-016-00 CETEM/MCT
Sulawesi
1800
1600
1400
1200
1000
800
600
400
200
Hg-U Lab (µg/g crea.)
0
N =
22
18
17
61
31
22
51
control adults
mineral processors
control children
children Hg working
not occup. burdened
amalgam-smelters
children not Hg work
Sulawesi
70
60
50
40
30
20
10
Hg-U Lab (µg/g crea.)
0
N =
22
18
17
61
31
22
51
control adults
mineral processors
control children
children Hg working
not occup. burdened
amalgam-smelters
children not Hg work
Figure 42 and 42a (expanded y-axis) - (Total) mercury concentration in urine
samples from Sulawesi
85
RT2004-016-00 CETEM/MCT
Kalimantan
1800
1600
1400
1200
1000
800
600
400
200
Hg-U Lab (µg/g crea.)
0
N =
36
10
67
30
69
27
8
control adults
not occup. burdened
amalgam-smelters
children Hg working
former miner
mineral processors
children not Hg work
Kalimantan
70
60
50
40
30
20
10
Hg-U Lab (µg/g crea.)
0
N =
36
10
67
30
69
27
8
control adults
not occup. burdened
amalgam-smelters
children Hg working
former miner
mineral processors
children not Hg work
Figure 43 and 43a (expanded y-axis) - (Total) mercury concentration in urine
samples from Kalimantan
86
RT2004-016-00 CETEM/MCT
Sulawesi
1000
800
600
400
200
0
total Hg-Hair (µg/g)
N =
21
18
17
60
31
22
50
control adults
mineral processors
control children
children Hg working
not occup. burdened
amalgam-smelters
children not Hg work
Sulawesi
20
18
16
14
12
10
8
6
4
2
total Hg-Hair (µg/g)
0
N =
21
18
17
60
31
22
50
control adults
mineral processors
control children
children Hg working
not occup. burdened
amalgam-smelters
children not Hg work
Figure 44 and 44a (expanded y-axis) - Total mercury concentration in hair
samples from Sulawesi.
87
RT2004-016-00 CETEM/MCT
Kalimantan
1000
800
600
400
200
total Hg-Hair (µg/g)
0
N =
36
10
67
30
68
27
8
control adults
not occup. burdened
amalgam-smelters
children Hg working
former miner
mineral processors
children not Hg work
Kalimantan
20
18
16
14
12
10
8
6
4
2
total Hg-Hair (µg/g)
0
N =
36
10
67
30
68
27
8
control adults
not occup. burdened
amalgam-smelters
children Hg working
former miner
mineral processors
children not Hg work
Figure 45 and 45a (expanded y-axis) - Total mercury concentration in hair
samples from Kalimantan
88
RT2004-016-00 CETEM/MCT
3.7.5. Control Groups
The mercury concentration in the blood, urine or hair of the Sulawesi control
group is in the same order of magnitude as in non-burdened populations in
Western Europe (see Table 15), Figure 46. In contrast to this, the mercury
concentration in blood and hair of the "control group" in Kalimantan is
markedly higher (Figures 41a and 45a). Moreover it must be taken into
consideration that this highly burdened population in Central Kalimantan live
far from the coast, whilst the low burdened Sulawesi control group is a coastal
population. High mercury concentrations in blood and hair, moderate in urine
(Figure 43a) and a ratio of approximately 9:1 between organic and inorganic
mercury in hair (see Figure 10) indicate a burden by methyl-mercury.
Sulawesi
100%
80%
60%
40%
20%
% inorganic Hg in hair
0%
N =
16
18
17
59
24
20
45
control adults
mineral processors
control children
children Hg working
not occup. burdened
amalgam-smelters
children not Hg work
Figure 46 - Percentage of inorganic mercury in hair samples from Sulawesi
Kalimantan
100%
80%
60%
40%
20%
% inorganic Hg in hair
0%
N =
36
10
67
30
67
27
8
control adults
not occup. burdened
amalgam-smelters
children Hg working
former miner
mineral processors
children not Hg work
Figure 47 - Percentage of inorganic mercury in hair samples from Kalimantan
89
RT2004-016-00 CETEM/MCT
Figure 48 shows the dependence of the mercury concentration found in
the blood of this population to the frequency of fish consumption. For mercury
in hair, the dependence is comparable (not shown). This results in the
assumption that there must be a local source of mercury which contaminates
the river. In the aquatic food chain this primarily inorganic mercury is
methylated and accumulates in this even higher toxic form in fish. Our team
acknowledged indications of further gold mining activities upstream from
Tangkiling. These mining activities are usually illegal, and new mining
activities are frequent (gold-rush area). Whatever the reason may be for the
increased burden in this area, the region can not qualify asan unpolluted
"control area". Moreover, the population from Tangkiling showed more
frequent neurological deficiencies than e.g. the control group from Air Mandidi
on Sulawesi (see table 7 in appendix 1). Therefore it was decided to compare all
burdened groups to the control group from Sulawesi and to interpret the
population from Tangkiling as a further burdened group.
Control Group from Tangkiling, Central Kalimantan
25
20
15
10
5
Hg-B (µg/L)
0
N =
10
26
weekly
daily
Frequency of Fish Eating
Figure 48 - Dependence of the mercury concentration found in the blood of
the Tangkiling "control group" , Central Kalimantan to the frequency of fish
consumption
As known from literature (Drasch 2004a) and recent experiences in other
gold mining areas such as the Philippines (Drasch 2001), an increased methyl
mercury burden from food results in increased mercury concentrations in blood
and hair, but not, or just moderate elevated mercury levels, in urine. This
explains why it was not possible for us to detect the methyl mercury burden in
Tangkiling by our urine screening on field. This situation underlines the
necessity to analyse not only urine samples but urine and blood and/or hair for
mercury to pin-point populations possibly burdened by methyl-mercury. It
90
RT2004-016-00 CETEM/MCT
must be stressed that similar problems could occur with populations living
downstream from other gold mining areas.
3.7.6. Burdened Groups
As expected, the highest mercury concentration was found in the bio-
monitors of the Hg-occupational burdened group of amalgam-burners,
followed by other inhabitants of the gold mining areas (see Figures 40 to 45a
and tables 6 to 8 in appendix 1). The mercury blood concentrations of the
burdened groups in Kalimantan and Sulawesi are comparable, the mean Hg
urine concentrations also. But there are some extreme high single Hg urine
values in Kalimantan of up to almost 1.700 µg/g creatinine, in contrast to peak
levels of "just" 230 µg/g creatinine in Sulawesi. For hair the situation is similar:
Comparable mean mercury values in Kalimantan and Sulawesi but extreme
high top concentrations in Kalimantan - up to an almost unbelievable 800 µg/g.
Perhaps these extreme hair values result from an external contamination by
mercury vapour, but the extreme high urine and the high blood concentrations
cannot be explained by a contamination. In combination with the high
percentage of inorganic mercury in hair (see Figures 46 and 47) they indicate a
massive burden with mercury vapour (and inorganic mercury) as in the two
gold mining areas of Tatelu in Sulawesi and Galangan in Kalimantan.
Some few cases, all from Galangan in Kalimantan, showed extreme high
mercury concentrations in blood and extreme high concentrations of organic
bound mercury in hair (Table 16). This may be explained by fishing in heavily
mercury contaminated pit holes in this mining area, as observed by our team.
Table 16 - Cases with extreme high concentrations of organic Hg in hair and
(total) Hg in blood.
Hg-U
total
inorganic
organic % organic
Case
Hg-B
(µg/g
Hg-Hair
Hg-Hair
Hg-Hair
Hg in
number
(µg/L)
creatinine)
(µg/g)
(µg/g)
(µg/g)
Hair
1 104 114 792 466 326
41,2
%
2 262 145 373 180 1943
51,9
%
3 55 292 158 75 83
52,6
%
4 604 254 62 32 30
48,5
%
5 128 106 42 20 22
53,1
%
3.7.7. Mercury Levels compared to Toxicological Threshold
Limits
In the international literature only a few threshold limits for mercury in
bio-monitors are recommended. Especially for the exposure to metallic mercury
vapour there is not much data on threshold values available. This metallic
mercury vapour is the main exposure in small scale gold mining areas (Drasch
91
RT2004-016-00 CETEM/MCT
2004a). Most studies in this field are performed in populations with an
exclusively methyl-mercury burden from fish or sea-food, such as the former
data from Minamata, or the more recent data from the Seychelles (Davidson
1998), the Faeroes Islands (Grandjean 1997) or even from the Amazon
(Grandjean 1999). To estimate the toxicological relevance of the burden with
predominantly mercury vapour of the investigated population from Tatelu in
Sulawesi and Galangan in Kalimantan, the following threshold limits were
used.
German human-bio-monitoring (HBM) values for mercury
In 1999 the German Environmental Agency ("Umweltbundesamt")
published recommendations for human-bio-monitoring-values (HBM) for
mercury ("Kommission Human-Biomonitoring" 1999).
The HBM I was set to be a "check value", this means an elevated
mercury concentration in blood or urine, above which the source of the Hg-
burden should be searched and, as far as possible, eliminated. But even by an
exceeding of this HBM I the authors claimed that a health risk is not to be
expected.
In contrast to this, the (higher) HBM II value is an "intervention value".
This means, at blood or urine levels above HBM II, especially over a longer
period of time, adverse health effects cannot be excluded. Therefore
interventions are necessary. On the one hand the source should be found and
reduced urgently. On the other hand a medical check for possible symptoms
should be performed. For hair, comparable values are not established, but the
HBM II in blood is directly derived from the assumption of a stable ratio of
mercury in blood and hair (1:300) and the result of the Seychelles study, where
adverse effects could be seen at a mercury concentration in hair above 5 µg/g
(Davidson 1998). Therefore this value was taken in our project as an analogous
value for HBM II for the toxicological evaluation of mercury concentration
determined in hair. It must be kept in mind, that this threshold limit in hair was
established in a population burdened with methyl-mercury from marine food
and not with mercury vapour, as, with some exceptions, is predominant in the
gold mining areas in Indonesia, investigated in this project.
In 1991 the WHO expert group stated that mercury in urine is the best
indicator for a burden with inorganic mercury. The maximum acceptable
concentration of mercury in urine was set to 50 µg/l (WHO 1991). A distinct
threshold for mercury in blood was not given. Mercury in hair is widely
accepted as best indicator for the assessment of contamination in populations
exposed to methyl-mercury (de Lacerda 1998). For this, a maximum allowable
concentration of 7.0 µg/g hair was set by the FAO/WHO. In 1997 the US EPA
calculated the "benchmark limit" for total Hg in hair to 1 µg/g. This benchmark
was derived from a burden with methyl-mercury from seafood and not with
mercury vapour. US EPA has set a threshold limit for mercury vapour in the
ambient air, but not in bio-monitors (US EPA 1997).
92
RT2004-016-00 CETEM/MCT
All these limits and others, former published, are respected at the most
recent recommendation from the German Environmental Agency 1999, as cited
above. The high numbers of recently published investigations on mercury
burdened populations from gold mining areas such as South-America or by sea
food as on the Faeroes Islands or the Seychelles require a continuous re-
evaluation of toxicologically defined threshold limits. Therefore the
international latest recommendation from the German Environmental Agency
was taken for further comparison. This was committed with UNIDO for the
total global programme, to obtain comparable results (Veiga 2003).
Occupational threshold limits (BAT, BEI)
Other toxicologically founded limits are occupational threshold limits.
Such limits are established for mercury e.g. in the USA (biological exposure
indices BEIs of the American Conference of Governmental Industrial
Hygienists) or Germany (BAT value, Deutsche Forschungsgemeinschaft
(German Scientific Community) 1999). For a better comparison with the HBM-
values (which are, to our knowledge, only established in Germany) the German
BAT-values for metallic and inorganic mercury are taken for this project. From
definition, these BAT-values are exclusively valid for healthy adult workers
under occupational medical control. The occupational burden must be stopped,
if this threshold is exceeded. These occupational threshold limits are not valid
for the total population, especially not for risk groups like children, pregnant
women, and older or ill persons. Nevertheless, the BAT-values were also taken
for a further classifying of our highest results. BAT-values for mercury are
established only for blood and urine, but not for hair.
Table 16 gives an overview of the HBM-, BAT- and BEI-values. In the
tables 6-8 in appendix 1, the percentage of the exceeding of the HBM II- and
BAT-limits in the various population groups of our project is summarised.
Table 16 - Toxicologically established threshold limits for mercury in blood,
urine and hair (HBM = Human Bio-Monitoring; BAT = "Biologischer
Arbeitsstoff-Toleranzwert" (biological work-exposure tolerance limit); BEI =
Biological Exposure Indices)
Hg-blood
Hg-urine
Hg-urine
Hg-hair
(µg/l)
(µg/l)
(µg/g creatinine)
(µg/g)
HBM I
5
7
5
HBM II
15
25
20
5 (in analogy)
US EPA
1
bench mark
WHO
50
7
BAT for metallic and
25 100
inorganic Hg
BAT for organic Hg
100
15
BEI (Biological
35
(after
exposure index)
(before working)
working)
93
RT2004-016-00 CETEM/MCT
As shown in the next chapters the biological threshold limits should not
be overestimated for the diagnosis. Therefore the question, which of the limits
is best for evaluating the results of this project is only of secondary interest.
Reducing of redundant data for statistical analysis
From the very large data volume (see appendix 2), collected on field by
the medical team, the most relevant facts and test results were selected by pre-
investigations (see tables 6 to 8 in appendix 1). Many test results were
primarily scored (for instance: no, moderate, strong, extreme). For the
anamnestic and clinical data these results could be reduced to a yes/no
decision, which enables a statistical analysis and facilitates the readability of the
tables 6 to 8, appendix 1 markedly without a relevant loss of information. The
neuro-psychological data (memory, match-box, Frostig, pencil tapping) was
reduced according to a box-plot procedure. With this procedure the results of
the participants could be divided into three categories: The best performing
25% of participants of each group were given a score of 0 points, the worst
performing 25% of participants were given a score of 2 points and the middle
group of participants received a score of 1 point. In the tables 6 and 7.appendix
1, the results of the statistical analysis of the transformed anamnestic, clinical
and neurological data versus the different Hg-burdened subgroups, is shown.
The significance of the differences was calculated with Chi-square test. Grey
marked fields contain results, differing from the control group on a statistical
significant level (p < 0.05, one-tailed).
In Figure 50 one anamnestic criteria ("health situation worsened since
mercury exposed") is shown for adults from Sulawesi. In the Figures 51 to 54
two objective (dysdiadochokinesia, ataxia of gait) criteria, typical for a chronic
mercury burden are Figured graphically. In Figure 55 the grouped results of the
matchbox test, a neuro-psychological test, for the children is shown. (For a
quick explanation: In this test matches have to be sorted in a box as quick as
possible).
It is striking that in comparison to the control groups, many test results
even from the non occupationally Hg-burdened population, living in the
burdened areas are considerably worse. The negative results increase even
more in the occupational Hg-burdened group of amalgam-burners. The results
of the former occupational burdened group from Kalimantan should not be
over-interpreted, due to the low case number (10) and the missing homogeneity
of this group.
94
RT2004-016-00 CETEM/MCT
Adults from Sulawesi, Health Problems worsened since Hg exposed
80%
70%
60%
50%
40%
30%
20%
10%
0%
Not occupational
burdened
Mineral processors
Amalgam burners
Figure 50 - Adults from Sulawesi, frequency of the anamnestic parameter
"health problems" worsened since mercury exposed
Adults from Sulawesi, Dysdiadochokinesia
45%
40%
35%
30%
25%
20%
15%
10%
5%
0%
Control group
Not occupational
burdened
Mineral processors
Amalgam burners
Figure 51 - Adults from Sulawesi, frequency of the clinical parameter
"dysdiadochokinesia"
95
RT2004-016-00 CETEM/MCT
Adults from Kalimantan, Dysdiadochokinesia
45%
40%
35%
30%
25%
20%
15%
10%
5%
0%
Control group
Tangkiling
Former
occupational
Not occupational
burdened
burdened
Mineral processors
Amalgam burners
Figure 52- Adults from Kalimantan, frequency of the clinical parameter
"dysdiadochokinesia"
Adults from Kalimantan, Ataxia of Gait
60%
50%
40%
30%
20%
10%
0%
Control group
Tangkiling
Former
occupational
Not occupational
burdened
burdened
Mineral processors Amalgam burners
Figure 53 - Adults from Kalimantan, frequency of the clinical parameter
"ataxia of gait"
96
RT2004-016-00 CETEM/MCT
Children, Ataxia of Gait
30%
25%
20%
15%
10%
5%
0%
Control
group
Sulawesi
not occup.
Sulawesi
occup.
Kalimantan
burdened
Kalimantan
burdened
not occup.
burdened
occup.
burdened
Figure 54 - Children, frequency of the clinical parameter "ataxia of gait"
Matchbox-Test, Children
100%
90%
80%
70%
60%
50%
10-16 sec
17-22 sec
40%
23-45 sec
30%
20%
10%
0%
Control group Sulawesi not
Sulawesi
Kalimantan not
Kalimantan
occup.
occup.
occup.
occup.
burdened
burdened
burdened
burdened
Figure 55 - Children, Matchbox test, grouped (blue is good, green is middle,
red is bad)
97
RT2004-016-00 CETEM/MCT
3.7.8. Scoring of medical results
The evaluation so far showed statistically significant medical test results
versus the different Hg-burdened subgroups. These significant medical test
results are typical clinical signs of chronic mercury intoxication, such as tremor,
metallic taste, excessive salivation, sleeping problems, memory disturbances,
and proteinuria (Drasch 1994, Kommission Human-Biomonitoring 1999,
Wilhelm 2000, Drasch 2004a). Furthermore ataxia, dysdiadochokinesia,
pathological reflexes, coordination problems and concentration problems are
clinical signs of a damaged central and peripheral nervous system. For a further
evaluation of these medical results a medical score was established. The factors,
included in this medical score and the score-points per factor are shown in
Table 17. This score was developed from the results of a mercury burdened
group in a gold mining area in the Philippines (Drasch 2001) and adopted by
UNIDO, to get comparable results (Veiga 2003). The higher the total score
relates to the increase of the poor health situation of each participant is.
Table 17 - Anamnestic, clinical, neurological and neuro-psychological scoring
scale
Test Score
Points
Anamnestic data
Metallic taste
0/1
Excessive salivation
0/1
Tremor at work
0/1
Sleeping problems at night
0/1
Health problems worsened since Hg exposed
0/1
Clinical data
Bluish coloration of gingiva
0/1
Ataxia of gait
0/1
Finger to nose tremor
0/1
Dysdiadochokinesia 0/1
Heel to knee ataxia
0/1
Heel to knee tremor
0/1
Mento-labial-reflex 0/1
Proteinuria 0/1
Neuro-psychological tests
Memory test
0/1/2
Matchbox test
0/1/2
Frostig test
0/1/2
Pencil tapping test
0/1/2
Maximum 21
98
RT2004-016-00 CETEM/MCT
Statistic testing of the different Hg-burdened subgroups versus the total
medical score sum showed once again significant results. The results are shown
in the tables 6 to 8, appendix 1 and in the Figures 56 and 57 graphically as a
box-plot. In Sulawesi as in Kalimantan, the mean scores of all other groups are
higher (= worse) than the control groups.
Sulawesi
20
18
16
14
12
10
8
6
4
2
Medical Score Sum
0
N =
22
18
17
60
31
22
51
control adults
mineral processors
control children
children Hg working
not occup. burdened
amalgam-smelters
children not Hg work
Figure 56 - Medical score sum of different sub-groups in Sulawesi
Kalimantan
20
18
16
14
12
10
8
6
4
2
Medical Score Sum
0
N =
36
10
67
30
69
26
8
Tangkiling
not occup. burdened
amalgam-smelters
children Hg working
former miner
mineral processors
children not Hg work
Figure 57 - Medical score sum of different sub-groups in Kalimantan.
99
RT2004-016-00 CETEM/MCT
3.7.9. Statistical analysis of mercury levels versus clinical
data
Correlation tests between mercury concentrations in the bio-monitors
and clinical data were performed on the sub-groups of the amalgam-burners
from both areas only. These groups were selected, because they were the
highest burden groups with the highest mercury concentration in the bio-
monitors and the highest frequency of health disturbances, characteristic for a
mercury burden. Performing the same analysis including all investigated
persons, or all volunteers from the gold mining areas, will just "water down"
the results.
As can be seen from tables 18 to 25, just a few of the medical data
correlate significantly to the Hg concentration in the bio-monitors (Chi-square-
test, Spearman rank correlation).
Table 18 - Significant correlations between anamnestic data and mercury
concentration in bio-monitors (group of amalgam-burners from Sulawesi
only, n = 61). * = p < 0.05.
Hg-Urine
Anamnestic data
(µg/g
Hg-Blood total
Hg-Hair
MeHg-Hair
creatinine.)
Male/female - - - -
Age -
-
-
-
Alcohol
- - - -
consumption
Metallic taste
-
-
-
-
Salivation -
-
-
-
Tremor daily
-
-
-
-
Tremor at work
-
-
-
-
Sleeping problems
-
-
-
-
Health problems
worsened since Hg
- - - -
exposed
Lack of appetite
-
-
-
-
Sleep disturbances
-
-
-
-
Easily tired
-
-
-
-
Loss weight
-
-
-
-
Rest more
-
-
-
-
Feel sleepy
-
-
-
-
Problems to start - - - -
things
Lack of energy
-
-
-
-
Less strength
-
-
-
-
100
RT2004-016-00 CETEM/MCT
Table 18 (Cont.)- Significant correlations between anamnestic data and
mercury concentration in bio-monitors (group of amalgam-burners from
Sulawesi only, n = 61). * = p < 0.05.
Anamnestic data
Hg-Urine
Hg-Blood Total
Hg-Hair
MeHg-Hair
(µg/g
creatinine.)
Weak -
- - -
Problems with
- -
- -
concentration
Problems to
- -
- -
think clear
Word finding
- -
- -
problems
Eyestrain - -
-
-
Memory problems
-
-
*
*
Feel nervous
-
-
-
-
Feel sad
-
-
-
-
Headache - -
-
-
Nausea - - - -
Numbness -
-
-
-
Table 19 - Significant correlations between clinical data and mercury
concentration in bio-monitors (group of amalgam-burners from Sulawesi
only, n = 61) . * = p < 0.05.
Hg-Urine
Clinical Data
(µg/g
Hg-Blood Total
Hg-Hair
MeHg-Hair
creatinine.)
Bluish coloration
- - - -
of gingiva
Gingivitis -
-
-
-
Ataxia of gait
-
-
-
-
Finger to nose
- - - -
tremor
Finger to nose
* * * -
dysmetria
Dysdiadochokinesia -
-
-
-
Tremor of eyelid
-
-
-
-
Field of vision
-
-
-
-
Heel to knee ataxia
-
-
-
-
Heel to knee tremor
-
-
-
-
PSR pathologic
-
-
-
-
BSR pathologic
-
-
-
*
ASR pathologic
-
-
-
-
101
RT2004-016-00 CETEM/MCT
Table 19 (Cont.) - Significant correlations between clinical data and mercury
concentration in bio-monitors (group of amalgam-burners from Sulawesi
only, n = 61) . * = p < 0.05.
Babinski reflex - - - -
positive
Mento-labial reflex
- - - -
positive
Bradykinesia - - - -
Hypomimia - - -
-
Proteinuria -
-
-
-
Table 20 - Significant correlations between neuro-psychological test classes
and mercury concentration in bio-monitors (group of amalgam-burners from
Sulawesi only, n = 61). * = p < 0.05.
Hg-Urine
Neuro-psychological
(µg/g
Hg-Blood Total
Hg-Hair
MeHg-Hair
test
creatinine.)
Memory test
*
- - -
Matchbox test
-
-
-
-
Frostig test
*
* * -
Pencil tapping test
-
-
-
-
Table 21 - Significant correlations between medical scores and mercury
concentration in bio-monitors (group of amalgam-burners from Sulawesi
only, n = 61). * = p < 0.05.
Medical Scores
Hg-Urine
Hg-Blood Total
Hg-Hair
MeHg-Hair
(µg/g
creatinine.)
Anamnestic
- - - -
score
Clinical score
-
-
-
-
Neuro-
- - - -
psychological
test score
Medical score
- - - -
sum
102
RT2004-016-00 CETEM/MCT
Table 22 - Significant correlations between anamnestic data and mercury
concentration in bio-monitors (group of amalgam-burners from Kalimantan
only, n = 69). * = p < 0.05.
Hg-Urine
Anamnestic data
(µg/g
Hg-Blood total
Hg-Hair
MeHg-Hair
creatinine.)
Male/female
*
*
- -
Age -
-
-
-
Alcohol
- - -
-
consumption
Metallic taste
-
-
-
*
Salivation - *
*
*
Tremor daily
-
-
-
-
Tremor at work
-
-
-
-
Sleeping
- - -
-
problems
Health problems
worsened since
*
- - -
Hg exposed
Lack of appetite
-
-
-
-
Sleep
- - -
-
disturbances
Easily tired
-
-
-
-
Loss weight
-
-
-
-
Rest more
-
*
*
-
Feel sleepy
*
*
*
-
Problems to start
*
- - -
things
Lack of energy
*
*
*
-
Less strength
*
*
*
-
Weak
*
*
*
-
Problems with
- - - -
concentration
Problems to
- - - -
think clear
Word finding
*
*
*
*
problems
Eyestrain - - *
-
Memory
-
*
*
*
problems
Feel
nervous
- - - *
Feel
sad - - - -
Headache - - - -
Nausea - - - -
Numbness
*
- - -
103
RT2004-016-00 CETEM/MCT
Table 23 - Significant correlations between clinical data and mercury
concentration in bio-monitors (group of amalgam-burners from Kalimantan
only, n = 69) . * = p < 0.05.
Clinical data
Hg-Urine
Hg-Blood Total
Hg-Hair
MeHg-Hair
(µg/g
creatinine.)
Bluish coloration
- - -
-
of gingiva
Gingivitis - - -
-
Ataxia of gait
-
-
-
-
Finger to nose
- - -
-
tremor
Finger to nose
- - -
*
dysmetria
Dysdiadocho-
- - -
-
kinesia
Tremor of eyelid
-
-
-
-
Field of vision
-
-
-
-
Heel to knee ataxia
-
-
-
-
Heel to knee
- - -
-
tremor
PSR
pathologic
- - -
-
BSR pathologic
-
*
- -
ASR pathologic
-
-
-
-
Babinski reflex
- - -
-
prositive
Mento-labial reflex
- - -
-
positive
Bradykinesia - - -
*
Hypomimia - - -
-
Proteinuria - - -
-
104
RT2004-016-00 CETEM/MCT
Table 24 - Significant correlations between neuro-psychological test classes
and mercury concentration in bio-monitors (group of amalgam-burners from
Kalimantan only, n = 69). * = p < 0.05.
Neuro-
Hg-Urine
Hg-Blood Total
Hg-Hair MeHg-Hair
psychological test
(µg/g
creatinine.)
Memory test
*
- -
-
Matchbox test
-
-
-
-
Frostig test
*
*
*
-
Pencil tapping test -
-
-
-
Table 25 - Significant correlations between medical scores and mercury
concentration in bio-monitors (group of amalgam-burners from Kalimantan
only, n = 69). * = p < 0.05.
Hg-Urine
Medical Scores
(µg/g
Hg-Blood Total
Hg-Hair MeHg-Hair
creatinine.)
Anamnestic score
-
-
-
*
Clinical score
-
-
-
-
Neuro-
psychological test - -
- -
score
Medical score sum -
-
-
-
3.7.10. Discussion of the Statistical Analysis
The relatively poor correlation of classic clinical signs of mercury
intoxication to the mercury concentrations in the bio-monitors (blood, urine,
hair, MeHg hair) of the amalgam-burners may be explained by factors like:
The mercury concentration in the target tissues, especially the brain,
correlates to the mercury concentration in bio-monitors like urine, blood or hair.
This correlation is statistically significant and good enough to mirror different
burden of different groups (here e.g. workers, non-workers and controls). But
the inter-individual differences are so large that it is rather pointless to conclude
the heavy metal burden in the target tissue of an individual from the
concentration in the bio-monitors (Drasch 1997).
Most of the amalgam-burners are chronically burdened by mercury and
not only acute. This means that a reversible or even irreversible damage of the
central nervous system may be set months or years before the actual
determination of the mercury concentration in the bio-monitors under a quite
different burden. The medical score sum distinguishes well between the control
group and the amalgam-burners.
105
RT2004-016-00 CETEM/MCT
3.7.11. Decision for the Diagnosis of a Chronic Mercury
Intoxication
For the different Hg burdened groups (< HBM I; HBM I - HBM II; HBM
II - BAT; > BAT) no striking differences in the results of the medical and neuro-
psychological tests could be seen (for possible reasons, see above). Therefore at
least a chronic mercury intoxication could not be diagnosed on the basis of the
blood, urine and/or hair concentration alone, to what values ever the threshold
limits are set (see above). An intoxication is defined by the presence of the toxin
in the body and typical adverse health effects. Deriving from this interpretation
we have tried to find a balanced result by the combination of mercury
concentration in blood, urine and hair and the negative health effects, as
summarised in the medical score sum, as described above in detail (Drasch
2001). The medical test scores were divided in three groups, according to the
quartiles (0-25%, 25-75%, 75-100%). Table 26 shows this combination. This
definition of mercury intoxication was committed with UNIDO, to get
comparable results in the different sites in the global project (Veiga 2003).
Table 26 - Decision for the diagnosis "chronic mercury intoxication".
Medical Score Sum
0 4
5 9
10 - 21
Hg in all bio-monitors
< HBM I
> HBM I
+
Hg at least in one bio-monitor > HBM II
+
+
>
BAT + + +
In principle this means, that the higher the mercury concentration in at
least one of the bio-monitors was, the lower the number of adverse effects for a
positive diagnosis of a mercury intoxication must be and vice versa.
Cases with only moderately elevated mercury levels (i.e. between HBM I
and HBM II) are taken for positive, too, if the medical test scores are in the
upper quartile region (score sum 10-21).
The case, that a mercury concentration above the occupational threshold
limit BAT alone (this means without clinical signs, i.e. medical sum score 0-4) is
responsible for the classification of intoxication, is rare. Just five cases out of 48
with mercury concentrations above the BAT limits showed medical sum scores
below 4.
106
RT2004-016-00 CETEM/MCT
Prevalence of the Diagnosis "Mercury Intoxication"
By this classification the results shown in the Tables 27 and 28 and the
Figures 58 60 were obtained. As expected, no volunteer from the control area
of Air Mandidi in Northern Sulawesi has been found to be mercury intoxicated.
In contrast to this, more than 20% of the "control group" from Tangkiling in
Central Kalimantan had to be classified as mercury intoxicated. The markedly
higher frequency of most clinical signs of a mercury intoxication in this area is
in good agreement with the elevated mercury level in the bio-monitors, as
found in this population. It must be derived from a methyl-mercury exposure,
probably by fish, in this area.
Table 27 - Frequency of mercury intoxication in Sulawesi.
Total
Number of mercury
% cases, mercury
Group
number
intoxicated cases
intoxicated
Control adults in Air 22 0
0
Mandidi
Not occupational Burdened
18 2
11.1%
in Tatelu
Mineral processors in 17 4 23.5%
Tatelu
Amalgam-burners in Tatelu
61
33
54.1%
Control children in Tatelu
31
0
0
Children not working with
22 0
0
Hg in Tatelu
Children working with Hg
51 9
17.6%
in Tatelu
Table 28 - Frequency of mercury intoxication in Kalimantan (* = should not
be over interpreted due to low case numbers).
Total
Number of mercury
% cases, mercury
Group
number
intoxicated cases
intoxicated
Population in Tangkiling
36
8
22.2%
Former miner, now living in
10 4 40.0%
*
Tangkiling
Not occupational burdened
67 23
34.3%
in Kereng Pangi
Mineral processors in 30 13 43.3%
Kereng Pangi
Amalgam-burners in
69 41
59.4%
Kereng Pangi
Children not working with
27 5
18.5%
Hg in Kereng Pangi
Children working with Hg
8 2 25.0%
*
in Kereng Pangi
107
RT2004-016-00 CETEM/MCT
Adults from Sulawesi, Diagnosis: Mercury Intoxication
60%
50%
40%
30%
20%
10%
0%
Control group adults
Not occupational
burdened
Mineral processors
Amalgam burners
Figure 58 - Adults from Sulawesi, frequency of the diagnosis "mercury
intoxication".
Adults from Kalimantan, Diagnosis: Mercury Intoxication
60%
50%
40%
30%
20%
10%
0%
Tangkiling
Former
occupational
Not
Mineral
burdened
occupational
burdened
processors
Amalgam
burners
Figure 59 - Adults from Kalimantan, frequency of the diagnosis "mercury
intoxication".
108
RT2004-016-00 CETEM/MCT
Children, Diagnosis: Mercury Intoxication
25%
20%
15%
10%
5%
0%
Control group Sulawesi not
occup.
Sulawesi
Kalimantan not
burdened
occup.
occup.
Kalimantan
burdened
burdened
occup.
burdened
Figure 60 - Children, frequency of the diagnosis "mercury intoxication".
Within the groups of amalgam burners in Sulawesi and Kalimantan the
frequencies of mercury intoxications are similar. More than half of the amalgam
burners were diagnosed to be mercury intoxicated (54.1% and 59.4%). This
percentage is high but in comparison to the region of Mt. Diwata in the
Philippines (Drasch 2001, Boese-O'Reilly 2003), significantly lower. Using the
same protocol, we found the percent of diagnosed mercury intoxicated
amalgam burners in this area totalled 85,4% (!). In contrast, the maximal
mercury burden (as expressed in the top mercury concentrations found in the
bio-monitors) was remarkably higher in Indonesia, especially in Galangan in
Kalimantan, than on Mt. Diwata (see tables 6 and 7, appendix 1).
The frequency of intoxications in the not directly mercury burdened
populations in the gold mining areas ("not occupational burdened" and the
mineral processors) is higher in the gold mining area of Galangan in
Kalimantan than in the gold mining area of Tatelu in Sulawesi (see tables 6 and
7, appendix 1).
In both gold mining regions mercury intoxicated children were found,
especially those who worked with mercury (table 8, appendix 1). The lower
percentage of intoxications in comparison to the adults results possibly from the
shorter period of time, the children are exposed.
3.7.12. Influence on Nursed Babies
One major problem of mercury is a known adverse effect on the growing
foetus and baby due to a high maternal burden and a cross of mercury through
109
RT2004-016-00 CETEM/MCT
the placenta or to the breast-milk. High numbers of miscarriages, stillbirths and
birth defects have been reported as consequence of the mass intoxication with
mercury in Minamata, Japan, 1956 or the Iraq, 1972/73 (Drasch 2004a). This
project in Indonesia was not designed to detect possible adverse effects on the
foetus, but as a side result some data on mercury in breast-milk samples were
obtained.
22 samples of mature breast-milk were collected (19 in Kalimantan and 3
in Sulawesi) and analysed for total mercury. In Table 29 the cases from
Kalimantan are shown individually in decreasing order of the Hg concentration
in the breast-milk samples. In the three samples from the Sulawesi mining area
concentrations of 1.8, 1.5 and 1.3 µg Hg/ L milk were found. For comparison: In
some recent studies from Germany samples from mature breast-milk maximal
mercury concentrations below 2 µg/L have been found (Drasch 1998).
Approximately half of the samples from Kalimantan are in this normal
background region. But at least one sample from the mining area shows an
extreme high mercury concentration (43.2 µg/L). The mother had been
identified as "intoxicated", despite a relatively moderate mercury concentration
in her bio-monitor. A full nursing of a baby with approximately 850 ml breast-
milk per day with this mercury concentration of 43.3 µg/L, results in a daily
uptake of approx. 37 µg inorganic mercury. US EPA has calculated the so-called
"Reference Dose" for inorganic mercury to 0.3 µg/ kg body weight and day (US
EPA 1997). For a 6 kg baby this means a maximum daily uptake of 1.8 µg
inorganic mercury. The real uptake of this baby was 20 times higher. Moreover
it must be considered that the absorption rate for inorganic mercury especially
from milk in the gastro-intestinal tract of babies is markedly higher than of
adults (Drasch 2004a).
110
RT2004-016-00 CETEM/MCT
Table 29 - (Total) mercury concentration in breast-milk samples from
Kalimantan, compared to other data from the mothers.
Hg-
Total-Hg MeHg-
Hg-U
Mother's
Hg-B
Mother
Area
Breastmilk
Hair
Hair
(µg/ g
Profession
(µg/L) intoxicated
(µg/L)
(µg(g)
(µg/g) creatinine)
Mining area
other job
43.2
4.19
2.82
11.1
42.4
yes
Mining area
other job
14.1
103.19
51.09
53.0
27.7
yes
Mining area
other job
9.5
4.41
2.24
5.0
8.5
no
Mining area
other job
5.9
1.93
1.25
5.3
9.7
no
Mining area
other job
5.2
1.18
0.36
11.8
14.9
yes
Mining area
other job
4.6
2.06
1.42
4.5
6.4
no
Mining area
other job
4.4
1.56
0.90
2.3
10.5
no
Mining area
other job
3.8
3.21
2.50
2.7
9.0
no
Mining area
other job
3.5
2.46
1.82
3.2
4.5
no
Mining area
other job
3.2
2.20
1.58
2.8
6.0
no
Mining area
other job
1.9
0.94
0.22
1.5
3.8
no
Mining area
other job
1.3
2.55
1.69
1.8
6.2
no
Mining area
other job
1.3
22.82
4.98
19.2
36.5
yes
amalgam-
Mining area
1.2 3.19
2.67 3.
9 6.1 no
burner
mineral
Mining area
1.1 5.35
2.28 4.1 5.2 yes
processor
Tangkiling other
job 2.4
2.86 2.08 4.4 12.2
no
Tangkiling other
job 1.9
1.96 1.79 0.7 10.8
no
Tangkiling other
job 0.5
1.03 0.94 0.3 5.7
no
Tangkiling other
job 0.5
1.03 0.92 0.5 4.8
no
The second case (Hg-Milk = 14.1 µg/L) gave even more rise to concern:
This mother showed extreme high concentrations of total mercury (103 µg/g)
and methyl-mercury (51 µg/g) in her hair. She belongs to the small group
which was found to be extreme burdened by methyl-mercury, probably due to
the consumption of fish from the mercury contaminated pit holes (see above).
This single case can be directly compared to mothers from the Seychelles or the
Faeroes Islands, which are predominantly burdened by methyl-mercury from
fish. Her mercury hair concentration is by a factor of 100 (!) higher than the
safety limit, as calculated by US EPA (1997) for methyl mercury in maternal
hair.
111
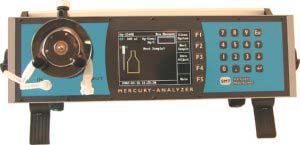
RT2004-016-00 CETEM/MCT
3.7.13. Screening of Mercury Urine Concentration in Field
Figure 61 - Hg analyser Hg-254 NE, Seefelder Messtechnik, Seefeld,
Germany.
On field a mobile Hg analyser (Hg-254 NE, Seefelder Messtechnik,
Seefeld, Germany) was used to screen for inorganic mercury in urine. In a
beaker, 1ml urine was diluted with 100 ml water (bottled drinking water). A 2
ml solution of 10% tin(II)chloride in 6N hydrochloric acid was added , the
system closed, and the formed mercury vapour in the gas phase above the
liquid transferred in a closed loop to a quartz cell, where it was detected by
atomic emission spectrometry. Bottled drinking water (as to be got locally) was
used for zero standard, and a mercuric nitrate solution for standard. The limit
for a quantitative detection was approximately 2 µg/L urine. Due to
practicability, an upper limit of 200 µg/L was established for field application.
As the HBM limits for Hg in urine are 7 and 25 µg/L, respectively (see Table
17), this method seems to be sufficient sensitive for urine Hg screening in the
field. One analysis lasts approximately 3 minutes. 465 urine samples could be
analysed with this method in field. Out of them, 265 were below the detection
limit (2 µg/L) and 10 above (200 µg/L). In 190 cases inorganic mercury
concentrations between 2 and 200 µg/L could be detected quantitatively.
112
RT2004-016-00 CETEM/MCT
400
300
200
100
50
40
30
20
10
5
4
3
inorg. Hg-U Field (µg/L)
2
2
4
10
30
50
200
400
3
5
20
40
100
300
total Hg-U Lab (µg/L)
Figure 62 - Comparison of the concentration of inorganic Hg-U, as
determined in field and the total Hg-U concentration, as determined in the
lab (Linear regression line and 90% confidence intervals).
The correlation between the concentration of inorganic Hg, determined
with this method in field, and the concentration of total Hg, as determined in
lab, was excellent (Spearman-ro = + 0.85, n = 190, statistical highly significant).
A scatter plot of the results between 2 200 µg/L (Figure 62) proves the
sufficient correspondence of both methods. In 10 cases urine concentrations
higher than 200 µg/L were measured in field. In all these cases this was proved
in the lab with total Hg-U concentrations far above 200 µg/L (330 5,240 µg/L).
In all cases of inorganic Hg-U values in field below the detection limit of 2
µg/L, low total Hg-U values (up to 10 µg/L) were found in the lab, too. It must
kept in mind that with this field method just inorganic mercury can be detected.
But at least in the mining areas of Kalimantan and Sulawesi most of the
mercury burden of men is inorganic. Furthermore it is known, that inorganic
mercury is much better urinary excreted than organic bound mercury like
methyl-mercury. From this it could be concluded that most mercury in the
urine samples has been in the inorganic form. Nevertheless, as expected, in the
mean the total mercury concentration in urine (as detected in the lab), was
higher than the inorganic mercury concentration determined in field (see
regression line in Table 30).
113
RT2004-016-00 CETEM/MCT
Table 30 - Comparison of the preliminary classified "mercury intoxicated" in
field and by all lab results.
Field Result
Total
intoxicated not
intoxicated
intoxicated 82 61 143
Lab. Result
not intoxicated
4
318
322
Total 86
379
465
All data from the medical investigations and from the urine screening
were put during the field project into an excel data sheet . The medical sum
score could be calculated and 86 cases preliminary classified as "mercury
intoxicated" by the combination of the medical sum score and the Hg
concentration in urine, as determined in field (according to Table 30). From the
medical sum score and the final lab results, 82 out of these 86 intoxications
could be confirmed. Only in 4 (!) cases the primarily field diagnosis could not
be confirmed. In this cases in field a higher Hg concentration was determined
than afterwards in the lab. The total number of finally (i.e. after the Hg
determination in all three bio-monitors in the lab) diagnosed intoxications was
143. In the remaining 61 cases, the intoxication was diagnosed by elevated Hg
concentrations in blood and/or hair. Overall, the urine mercury screening
during the field project has proved to be a sound method to get quick
information during the field project on the order of magnitude of the mercury
burden of sub-groups of the population. Together with a computer based
evaluation of the medical results during the field project it was possible in more
than one half of the cases to find out mercury intoxicated individuals just
during the field mission and to give a primarily estimation of the local burden
situation. Nevertheless, the remaining 61 cases of intoxication underline the
necessity to take in addition blood and hair samples in field and analyse them
later in the lab. This is to remind especially in the case of a predominant burden
with methyl-mercury like in the "control area" of Tangkiling in Central
Kalimantan.
4. Conclusions and Recommendations
Although mercury is heavily burdening the environment in North
Sulawesi, health hazards due to methylmercury exposure, as indicated by
results in fish, hair, blood and breast milk, are more likely occurring in Central
Kalimantan. This may be explained by a combination of factors, namely the
adverse living conditions in Galangan that make the population dependent on
fishing in flooded open pits; a high mercury bioavailability in dark water
systems, and an increased mercury background in the local environment, as
indicated by the environmental assessment. In contrast, there is a lack of
pathways between methylmercury present in the environment and the local
114
RT2004-016-00 CETEM/MCT
population in North Sulawesi, since the availability of fish in the Talawaan
River is very limited, resulting in consumption from marine fish. On the other
hand, it is predictable that the huge mercury burden found in both biological
and inorganic samples from the Talawaan River is also, to a certain extent,
being taken up by the marine biota living in the Manado Bay.
It was estimated 130 milling operations in the Talawaan watershed
(Tatelu region) and found out that mill operators have purchased from 10 to 15
kg of mercury/month/milling unit. A unit with 12 mills recovers 4 to 6 g of
gold per cycle. Generally there are two cycles per day. The mills operate 8
hours/day, 6 days/week.
According to a mass balance based on both analytical determinations in
amalgamation wastes and interviews with the miners, the estimated ratio Hglost
: Auproduced in Talawaan falls in the extremely high range of 40 to 60, which is 30
to 40 times higher than average ratios found in SSM worldwide (Veiga and
Baker, 2003; Rodrigues-Filho et al, 2004).
Assuming that 9.6 to 14.4 kg of Hg are lost per unit/month, not less than
15 to 22 tonnes of mercury are being released annually in the entire area of
Tatelu. This characterizes an alarming mercury burden to the environment in
North Sulawesi.
A sampling campaign of soils, sediments, water and biota was conducted
in the Talawaan watershed, consisting of 298 samples split into 156 fish
samples, and 142 samples of sediments, soils, water, plants and other aquatic
organisms, covering the whole study area. The sudy area was divided into 7
sub-areas from the most upstream are down to the estuary.
The most uptream sampling site is located close to the spring of
Talawaan river where no mining activity is to be reported. Unexpectedly, Hg
levels in those samples were 600 times higher than Hg background levels
usually found in sediments in tropical regions (Rodrigues-Filho et al., 2004).
A likely explanation for this anomalous Hg level in unaffected sediments
is related to the proximity of the inactive volcano of Mount Kablat, whose
former activity might have generated the conditions for the formation of gold
deposits in the Tatelu region, as well as their associated Hg enrichment. This
Au-Hg association has been observed in other similar gold deposits in North
Sulawesi (Turner, 2002).
Approximately 5 km downstream, there an increase of Hg levels in
sediments as a consequence of Hg releases from amalgamation wastes to the
rivers. Mercury concentrations reach up to 480 µg/g and average 154 µg/g in
the sediment fraction < 74 µm.
Further downstream and close to the estuary Hg levels in sediments
drop to a mean concentration of 6.7 µg/g, which is even lower than those
encountered in the most upstream part of the river, indicating a dilution effect
caused by runoff of catchment soils.
115
RT2004-016-00 CETEM/MCT
As for the assessment of Hg bioavailability through using bioindicators
other than fish, like aquatic plants and mollusks, it has been indicated that Hg is
being taken up by living organisms in the Talawaan River, as shown by the
distribution of Hg in aquatic plants and mollusks. Mercury uptake by aquatic
plants is particularly evident in cyanidation tailings, where Hg concentrations
reach up to 370 µg/g. This is likely a consequence of increasing Hg mobility
and biovailability through the formation of mercury-cyanide complexes after
cyanidation of highly contaminated amalgamation wastes.
Therefore, it is assumed that both factors are contributing to this
indicated high Hg bioavailability, namely an anomalous Hg background in the
area and the cyanidation of amalgamation wastes forming soluble mercury
complexes.
Central Kalimantan (Galangan)
Gold mining is carried out following traditional methods also used in the
Brazilian gold mining areas (secondary deposits) in the Amazon region. In open
pits the gold bearing layers are hosted down by means of hydraulic monitors.
Manual amalgamation of the concentrate is done in ponds consisting of flooded
open pits excavated beside the miner's residences, being Hg-contaminated
tailings left in those ponds.
According to a mass balance based on both analytical determinations in
amalgamation wastes and interviews with the miners, the ratio Hglost :
Auproduced in Galangan is estimated in the range of 1.5 to 2, which is an average
ratio found in SSM worldwide (Veiga and Baker, 2003; Rodrigues-Filho et al,
2004). Assuming that 150 to 300 g of mercury are lost per unit/month, 1 to 2
tonnes of mercury are being released annually in the entire area.
Amalgam is burned in gold shops, commercial stores in a chimney-like
construction, which leads the mercury vapor just outside the house by an outlet
pipe. The gold shops are situated in the middle of the village. There is no
proper ventilation for the mercury fumes, where in the rainy season 15 kg of
gold is sold to 20 gold shops and melted in the village, releasing at least 200
kg/annum of mercury in the village. Housing areas, food stalls and a school are
just nearby.
Mercury concentrations in sediments of the Katingan River are in general
significantly lower than in the Talawaan River in North Sulawesi. This is likely
related to both a less polluting mineral processing technique used in Galangan
and an existing lower Hg background in the Katingan Basin. This is indicated
by relatively low Hg levels present in sediments that have been deposited many
years before starting SSM activities in the region. Lower sections of sediment
cores taken in riversides and floodplains of the Katingan River are assumed to
mirror the existing sedimentological conditions prior to disclosure of the gold
rush.
116
RT2004-016-00 CETEM/MCT
Distribution of mercury concentrations in a sediment core from the
Katingan River, upstream of mining sites, shows significantly lower levels,
averaging 0.38 µg/g, than in the cores taken downstream of the mining areas,
averaging 2.87 µg/g, 2.19 µg/g and 2.33 µg/g, respectively in sediment cores
A301, A501 and A601. Therefore, the Hg range found in core 201 indicates an
existing Hg background for this study area.
Moreover, the sediment cores taken downstream have a similar varying
distribution of Hg levels with depth, showing a common peak of Hg
concentration between depths from 6 to 12 cm. This Hg peak is likely related to
a major Hg release from the mining sites some years ago that probably mirrors
a more intense Hg use at the beginning of the gold rush in 1998.
A wide range of mercury concentrations within unaffected sediment
sections, from 0.1 to 1.2 µg/g, averaging 0.38 µg/g, indicates an uncommon
situation that geochemically has no correspondence to previous studies
conducted in the Brazilian Amazon (Rodrigues-Filho and Maddock, 1997,
Rodrigues-Filho et al., 2002). This is likely due to the geological setting in
Indonesia.
The distribution of mercury concentrations in individual sediment
samples from the Galangan mining site resembles the levels found along the
downstream section of the Katingan River. This a clear indication that
sediments from both the mining site and the lower Katingan River are closely
related to each other as a consequence of mercury discharges from SSM
operations. Nevertheless, those Hg concentrations in the Galangan region are at
least one order of magnitude lower than in the Talawaan region.
The prevailing sandy composition of the mining tailings that is driven by
the type of alluvial deposit with almost no silt-clay fraction is a likely
explanation for the relatively low levels, since Hg released during
amalgamation finds no particulate surface to be adsorbed on, leading to Hg
concentrations even lower than in river sediments.
On the other hand, although a relatively moderate Hg contamination
degree in amalgamation tailings is to be reported for Galangan, there are strong
indications that mercury finds a favorable condition for becoming highly
mobile as indicated by the abnormally high levels found in the organic fine
cover of the tailings, composed basically of algae. This is an indication that
mercury is being dissolved by the organic dark waters of Galangan, which is a
potentially favorable condition for increasing mercury bioavailability through
methylation.
Mercury in Fish North Sulawesi and Central Kalimantan
The present results show that total mercury concentrations in fish from
North Sulawesi are higher than in fish from Central Kalimantan area. The
resulted mean Hg level from Central Kalimantan is 0.21±0.36 µg/g (N=263) and
117
RT2004-016-00 CETEM/MCT
its maximum value is 1.83 µg/g, while in North Sulawesi mean Hg level is
0.58±0.45 µg/g (N=130) and its maximum value reachs 2.60 µg/g.
The mean concentration of Hg (0.36 µg/g) in fish species from this work
was within that range and lower than 0.5 µg/g, the Hg concentration in fish
recommended by WHO (1990) as limit for human protection by Hg exposure by
fish consumption.
In North Sulawesi, Hg levels in fish from Toldano river (reference area-
T6) showed the lowest mercury levels, averaging 0.02 µg/g, while T2, a dam
reservoir close to the mining sites, showed the highest mercury levels in fish,
0.85 µg/g being considered as the most contaminated site in the area. However,
we have to take into account that these species are smaller and lighter than fish
from other aquatic systems influenced by gold mining, such as Amazon region,
suggesting that Hg bioavaliability in Manado can be higher than in Central
Kalimantan.
In Central Kalimantan area, fish from flooded open pits in mining site
areas showed the highest Hg levels. These open pits are used for gold
processing and, also, for fishing, bathing and domestic wastes collected. While
the average of Hg in fish from the whole study area are quite low, the Hg levels
in fish from the flooded open pits surrounding garimpos´s area are considered
as the most contaminated site. As miners and their families are living close to
those open pits and might often consume those fish, this charaterizes a potential
pathway for methylmercury exposure to the local population.
By employing the risk assessment to human health, toxicological, rather
than simply statistical, significance of the contamination can be ascertained. At a
screening level, a Hazard Quotient (HQ) approach (USEPA, 1989), assumes that
there is a level of exposure (i.e., RfD = Reference of Dose) for non-carcinogenic
substances below which it is unlikely for even sensitive populations to
experience adverse health effects.
In Central Kalimantan, it should be considered that miners living close to the P4
study site may consume fish caught in those flooded open pits. As they are not
riverside population, but considering the poverty, one could assume the fish
consumption rate close to 0.05 Kg.d-1. The resultant HQs for MeHg fall above
the unit for North Sulawesi considering the fish market consumption. For
Central Kalimantan, both total and P4 sampling site, HQ resulted above the
unity, 2.4 and 9.9, respectively, which means that population are subject to
potential health hazards due to fish consumption. This conclusion is fully in
agreement with the indications achieved by the health assessment.
Health Assessment North Sulawesi and Central Kalimantan
The extraction of the gold with liquid mercury releases serious amounts
of mercury, especially high toxic mercury fumes into the local environment.
The health status of 492 volunteers in Sulawesi and Kalimantan was assessed
with a standardised health assessment protocol from UNIDO (Veiga 2003) by
118
RT2004-016-00 CETEM/MCT
an expert team from the University of Munich/Germany in August/September
2003.
In Kalimantan a control group, mainly women, shows unexpectedly
increased Hg levels in blood and hair. Nevertheless, this is in accordance with
the indications from the environmental assessment, namely a elevated Hg
background in sediments, a reatively high Hg mobility and a high Hg
biovailability, which is likely related to existing dark water rivers in the area.
The mercury levels in the bio-monitors urine, blood and hair were
significantly higher in all exposed populations than in the control group.
Mainly amalgam-smelters showed mercury levels above the toxicological
threshold limit HBM II in urine, blood and hair. Mainly inorganic mercury
contributes to the high body burden of the workers.
Some few cases, all from Galangan in Kalimantan, showed extreme high
mercury concentrations in blood and extreme high concentrations of organic
bound mercury in hair. This may be explained by fishing in heavily mercury
contaminated pit holes in this mining area, as observed from the results of Hg
in fish from the flooded open pits.
Typical symptoms of mercury intoxication were prevalent in the exposed
groups. The medical score sum plus the bio-monitoring results made it possible
to diagnose in Tatelu (Sulawesi) in 33 out of 61 amalgam-smelters the diagnosis
of a chronic mercury intoxication, and in 4 out of 17 mineral processors. Within
the other population in Tatelu 2 out of 18 people showed a mercury
intoxication. In the control group there was no case of a mercury intoxication.
In Kereng Pangi (Kalimantan) in 41 out of 69 amalgam-smelters the
diagnosis of a chronic mercury intoxication was made, and in 13 out of 30
mineral processors. Within the other population in Kereng Pangi 23 out of 67
people showed a mercury intoxication. In the Tangkiling group 8 out of 36
people were found to be intoxicated, and 4 out of 10 former miners.
Children working with mercury were found as intoxicated in 9 out of 51
children in Tatelu, and 2 out of 8 children in Kereng Pangi. Children not
working, but living in the exposed areas were intoxicated in 5 out of 27 cases in
Kereng Pangi and in no case in Tatelu. None of the children from the control
area intoxicated.
The percentage of intoxications among amalgam-smelters is similar in
Tatelu (54,1%) and Kereng Pangi (59,4%). In Rwamagasa / Tanzania 25,3% of
amalgam smelters were found to be intoxicated, and in the gold mining area of
Mt. Diwata in the Philippines, 85.4 % of the amalgam-smelters were intoxicated
(Drasch 2004b, Drasch 2001). The difference cannot be explained by a different,
i.e. a safer burning technique in Rwamagasa. Moreover, it must kept in mind,
that the maximal burden (as expressed in the top mercury concentrations found
in the bio-monitors) was even higher than in Mt. Diwata. In the less exposed
population and the children, the rates of intoxication are much higher in Kereng
Pangi.
119
RT2004-016-00 CETEM/MCT
A hypothesis for these differences is not to be found in the various
amalgam smelting techniques. The main difference between Tatelu and Kereng
Pangi is, that in Tatelu the general population does not live within the mining
area itself, so they are less exposed. And the difference to Mt. Diwata is that the
Galangan area around Kereng Pangi is flat compared the mountainous area of
Mt. Diwata. The difference to Tanzania might be explained by the much lower
exposure to liquid mercury in Rwamagasa, due to a lower output of gold from
the ore.
Nursed babies of mothers living in Kereng Pangi are at special risk. In 10
out of 15 breast-milk samples of nursing mothers, mercury levels were above
comparison levels of 2 µg/l. In two cases the levels were extremely high, well
above reference dose levels of US-EPA.. In addition to a placental transfer of
mercury during pregnancy from the mother to the foetus (as has been proved in
other studies) this high mercury burden of nursed babies is a new, up to now
unknown health hazard in mining communities.
Poverty is a main reason for the bad health status of the small-scale
mining communities. Struggling for pure survival makes mining for gold a
necessity to find any financial resource. The daily fight of survival forces the
miners put their own health and the health of their children at risk.
A reduction of the release of mercury vapours from small-scale gold
mining as in Indonesia into the atmosphere will not only reduce the number of
mercury intoxicated people in the mining area proper. It will reduce the global
Hg pollution in the atmosphere.
Mercury is a serious health hazard in the small-scale gold mining areas
of Tatelu (Sulawesi) and Kereng Pangi (Kalimantan). Working for many years
in the amalgamation or burning process, especially amalgam-burning resulted
in severe symptoms of mercury intoxication. The exposure of the whole
community to mercury is reflected in raised mercury levels in the urine, and
symptoms of brain damage like ataxia, tremor and movement disorders. In over
50% of the amalgam-smelters from both areas a mercury intoxication (according
to the definition of UNIDO (Veiga 2003)) was diagnosed. Former miners,
mineral processors and the general population in the mining areas were also
intoxicated. Especially frightening is the high levels of mercury in breast milk
samples in Kereng Pangi (Kalimantan), and the high incidence of child labour.
This high incidence of child labour ensues in the very early child mercury
intoxication in both areas.
How to improve General Health?
Poverty is a main reason for the health and environmental problems.
· At the moment it does not seem to be acceptable that children live in Kereng
Pangi or in the mining areas in Tatelu. Missing sanitary standards and high
exposure to mercury are the main reasons. Sanitary standards need urgent
improvement in Kereng Pangi and in the mining areas of Tatelu.
120
RT2004-016-00 CETEM/MCT
· The occupational related health risk of mining should be assessed in more
detail (accidents, malaria, drinking water quality, sexually transmitted
diseases, tuberculosis, HIV / AIDS). One first step to reduce the health
hazards in Kereng Pangi might be a proper zoning into industrial areas,
commercial areas and housing areas. In Tatelu mainly the workers living on
the ground of the ball-mills and in the area of the tunnels are at risk.
Imposing basic hygienic standards, such as proper drinking water and
reduction of Anopheles mosquitoes in Tatelu mining are and Galangan field
area is essential.
· To reduce the obvious risk of accidents in mining sites, raising awareness is
necessary. Introducing proper mining techniques is necessary (e.g. tunnel
safety in Tatelu and open pit safety in Galangan).
· The risk of sexually transmitted diseases could be reduced, if campaigns for
safer sex were introduced
· Smoking habits are very difficult to influence, at least on a local level.
· To improve the health status of the communities the local health service
capacities need to be improved.
How to reduce Mercury as a Health Hazard?
Referring to the clinical testing and laboratory results, mercury is a major
health hazard in the areas. Some first suggestions are:
· Child labour with highly toxic substances must be stopped immediately.
Legal restrictions on child labour need to be immediately implemented.
· Women in childbearing age need special information campaigns on this risk
of mercury to the foetus and the nursed baby.
· The participants with intoxication need medical treatment. It is necessary to
build up a system to diagnose and treat mercury related health problems in
the area. Capacity building including establishing laboratory facilities to
analyse mercury in human specimens is required. The financial aspect of
treatment and legal problem of importing drugs (chelating agents like DMPS
or DMSA, to sweep mercury out of the body) need to be solved. Funding of
preventive campaigns and for treatment facilities is now needed.
· Training programs for the health care providers in the Tatelu area and in
Kereng Pangi, an other health centres in mining areas to raise awareness of
mercury as a health hazard. Awareness raising about HIV risk, e.g. by needle
sharing in vaccination programs or safer sex campaigns are needed as well.
· Clinical training of local health workers, including a standardised
questionnaire and examination flow scheme (MES = mercury examination
score)
· Mercury ambulance: A mobile ,,mercury ambulance" might easier reach
small-scale miners, than any local health office. As suggested by Mr.
121
RT2004-016-00 CETEM/MCT
Masayoshi Matsushita (UNIDO Jakarta) a bus or a boat could be used as a
mobile mercury ambulance. Equipped with the necessary medical and
laboratory utensils, a bus could be driven into the mining areas. Two or three
specially trained doctors or nurses could perform the examinations, and
begin to carry out treatment. A bus could also be used for health awareness
programs (e.g. video equipment). Miners in remote areas might welcome any
evening entertainment. Soccer videos might attract more miners to a bus,
than much other information material. Why not ask e.g. sponsors for such a
bus (or truck).
How to improve the Knowledge on Mercury as a Health
Hazard?
· Assessing in a different study design the possibility of mercury related birth
and growth defects, increased abortion/miscarriage rates, infertility
problems, learning difficulties in childhood or other neuro-psychological
problems related to mercury exposure
· Assessing in a different project in more detail the possible transfer of
mercury from mother to child via breast-milk and related possible adverse
health effects. Females at childbearing age and before need urgently more
awareness to refrain from amalgam burning sites, at least during pregnancy
and nursing. If this is not possible, a discussion whether to provide them
with milk powder and mercury free water (!), and training them to prepare
hygienically unobjectionable formula food for their babies needs to be based
on a larger data base and a different epidemiological approach.
How to reduce the Release of Mercury into the Environment?
· The exposure to mercury for the miners and the community has to be
drastically decreased. Proper mining techniques to reduce the burden of
accidents and mercury exposure are essentially needed. Small-scale miners
need all possible support to introduce cleaner and safer gold mining and
extraction technologies.
· The exposure with mercury is avoidable with such simple technology as
retorts. Technical solutions need to go hand in hand with awareness raising
campaigns. Technical cooperation, e.g. with GTZ, might be useful.
· To improve the social, health and environmental situation of artisanal small-
scale gold miners an alliance of local, regional, governmental and
intergovernmental bodies is needed. Cooperation between health and
environmental sectors is needed on local, regional, national and
intergovernmental level. E.g. UNIDO and WHO in Jakarta could form a
nucleus of a national mercury task force.
122
RT2004-016-00 CETEM/MCT
5. References
Aaseth J, Jacobsen D, Andersen O, Wickstrom E (1995) Treatment of mercury
and lead poisoning with dimercaptosuccinic acid and sodium
dimercaptopropane-sulfonate: A review. Analyst 120, 23-38
Achmadi UF (1994) Occupational exposure to mercury at the gold mining: a
case study from Indonesia. In: Environmental mercury pollution and its
health effects in Amazon River Basin. National Institute Minamata Disease
and Inst. Biophysics of the University Federal do Rio de Janeiro. Rio de
Janeiro, pp 10-16
Aspinall, 2001. Clive Small-Scale Mining in Indonesia Mining, Minerals and
Sustainable Development No. 79 September 2001. 30p.
http://www.iied.org/mmsd/mmsd_pdfs/asm_indonesia.pdf
Akagi and Nishimura 1991. Speciation of Mercury in the Environment. In:
Advances in Mercury Toxicology, T.Suzuki et al. (eds.).
Akagi H et al (1994) Methyl-mercury pollution in Tapajós River Basin, Amazon.
Environ Sci 3, 25-32
Akagi H, Castillo E, Maramba N, Francisco AT (1999) Health assessment for
mercury exposure among children residing near a gold processing and
refining plant. Proc. of the Int Conference Mercury as a Global Pollutant,
Rio de Janeiro, Brazil, p. 421
Aposhian HV et al (1995) Mobilization of heavy metals by newer,
therapeutically useful chelating agents. Toxicology 97, 23-38
Barbosa AC et al (1995) Mercury contamination in the Brazilian Amazon.
Environmental and occupational aspects. Water Air Soil Pollut 80, 109-121
Beinhoff, C. (2002). Strategy of the Organization to Achieve Sustainability in
projects Related to Mercury Pollution of International Waters Caused by
Small-Scale Gold Mining. In: Villas-Bôas, R.C. and Beinhoff, C. (ed).
Indicators of Sustainability for the Mineral Extraction Industry. Rio de
Janeiro UNIDO/UBC/CETEM/ CNPq, Rio de Janiero, Brazil. 491-511 p.
Beinhoff, C. (2001). Back-to-Office Mission Report. Brazil Trip. Vienna. 6 p.
Bidone ED, Castilhos ZC, Cid de Souza TM, Lacerda LD (1997) Fish
contamination and human exposure to mercury in the Tapajós River
Basin, Pará State, Amazon, Brazil: a screening approach. Bull Environ
Contam Toxicol 59: 194-201.
Boese-O'Reilly S, Drasch G, Beinhoff C, Maydl S, Vosko MR, Roider G (2003):
The Mt. Diwata Study on the Philippines 2000 - treatment of mercury
intoxicated inhabitants of a gold mining area with DMPS (2,3-Dimercapto-
1-propane-sulfonic acid, Dimaval ®). The Science of the Total
Environment, 307, 71-82
123
RT2004-016-00 CETEM/MCT
Boischio AAP, Henshel D, Barbosa AC (1995) Mercury exposure through fish
consumption by the upper Madeira River population, Brazil. Ecosyst
Health 1,177-192
Branches FJP, Erickson T, Aks SE, Hryhorczuk DO (1993) The price of gold:
mercury exposure in the Amazon Rain Forest. J Clin Toxicol 31, 295-306
Câmara VM (1994) Epidemiological assessment of the environmental pollution
by mercury due to gold mining in the Amazon River Basin. In:
Environmental mercury pollution and its health effects in Amazon River
Basin. National Institute Minamata Disease and Inst. Biophysics of the
University Federal do Rio de Janeiro. Rio de Janeiro, pp 80-84
Castilhos, Z.C. and Bidone, E.D., 1999. Freshwater Mercury Aquatic Criteria
Protective of Human Health and Commercial Fish. Case Study: Tapajós
River Basin, Amazon, Brazil. In Book of Abstracts of the Proc. 5th
International Conference on Mercury as a Global Pollutant", p.398. Rio de
Janeiro, May 23-28, 1999.
Castilhos, Z.C.; Bidone, E.D.; Hartz, S., 2001. Bioaccumulation of Hg by
Tucunaré (Cichla ocellaris) from Tapajós River Region, Brazilian Amazon.
A Field Dose-Response Approach. Bull. Envir. Contam. Toxicol. v. 66, p.
631-637.
Castilhos, Z.C. and Lima, C.A., 2001. Mercury as an Environmental Problem:
Human Health Risk and Aquatic Ecosystems Contamination Assessment.
In:Mercury in the Tapajos Basin. p. 75-94.
Castillo ES, Maramba NFC, Akagi, H, Francisco-Rivera ATT (1999) Quality
assurance of blood mercury levels among schoolchildren exposed to
elemental mercury in Apokon, Tagum, Davao del Norte, Philippines,
1998. Proc. of the Int Conference Mercury as a Global Pollutant, Rio de
Janeiro, Brazil, p. 422
Castro MB, Albert B, Pfeiffer WC (1991) Mercury levels in Yanomami indians
hair from Roraima, Brazil. Proceedings 8th Int. Conference Heavy metals in
the environment. Edinburgh 1, 367-370
CETEM/IEC (2004). Environmental and Health Assessment in Two Small Scale
Gold Mining Areas of the Brazilian Amazon. Final Report of the Global
Mercury Project, First Phase, issued to UNIDO. Vienna, 154 pp.
Cichini G et al (1989) Effekt von DMPS und D-Penicillamin bei inhalativer
Intoxikation mit metallischem Quecksilber. Intensivmed Notf Med 26, 303-
306
Clarkson,T.W. (1994) The toxicology of mercury and its compounds. In: Watras
CJ, Huckabee JW (ed) Mercury pollution: Integration and synthesis. Lewis
Publishers, Boca Raton, Florida, USA, p. 631-640
Cleary D et al. (1994) Mercury in Brazil. Nature, 613-614
124
RT2004-016-00 CETEM/MCT
Davidson PW et al (1998) Effects of prenatal and postnatal merthylmercury
exposure from fish consumption on neurodevelopment. J Am Med Assoc
280, 701-707
Deutsche Forschungsgemeinschaft (ed) (1999) MAK- und BAT-Werte-Liste
1999. VCH-Verlagsgesellschaft, Weinheim, Germany
Drasch G (1994): Mercury. In: Seiler HG, Sigel A, Sigel H (eds.): Handbook on
metals in clinical and analytical chemistry. New York: Marcel Dekker, 479-
494.
Drasch G et al. (1997) Are blood, urine, hair, and muscle valid bio-monitoring
parameters for the internal burden of men with the heavy metals mercury,
lead and cadmium? Trace Elem Electrolytes 14, 116-123
Drasch G, Aigner S, Roider G, Staiger F, Lipowsky G (1998) Mercury in Human
Colostrum and Early Breast Milk. Ist Dependence on Dental Amalgam
and other Factors. J Trace Elem Med Biol 12, 23-27
Drasch G, Boese-O´Reilly S, Maydl S, Roider G (2002): Scientific comment on
the German human biological monitoring values (HBM values) for
mercury. International Journal Hygiene Environmental Health 205, 509-
512.
Drasch G, Boese-O'Reilly S (2004b) Medical Investigation of 250 People living in
the Rwamagasa Area, Geita District in the United Republic of Tanzania
Final Report to UNIDO
Drasch G, Boese-O'Reilly S, Beinhoff C, Roider G, Maydl S (2001): The Mt.
Diwata study on the Philippines 1999 - assessing mercury intoxication of
the population by small scale gold mining. The Science of the Total
Environment 267, 151-168
Drasch G, Horvat M, Stoeppler M (2004a) Mercury. in: Merian E, Anke M, Ihnat
M, Stoeppler M (eds.) Elements and their Compounds in the Environment,
Vol. 2. Wiley-VHC Verlag, Weinheim, Germany
Florentine MJ, Sanfilippo DJ (1991) Elemental mercury poisoning. Clin Pharm
10, 213-221
Gonzalez-Ramirez et al (1998) DMPS (2,3-Dimercaptopropane-1-sulfonate,
Dimaval) Decreases the Body Burden of Mercury in Humans Exposed to
Mercurous Chloride. J Pharmacol Exp Therap 287, 8-12
Grandjean P et al (1997) Cognitive deficit in 7-year-old children with prenatal
exposure to methyl-mercury. Neurotoxicol Teratol 19,417-428
Grandjean P et al (1999) Methyl-mercury Neurotoxicity in Amazonian Children
Downstream from Gold Mining. Environ Health Perspect 107, 587-
591Hacon, S. (1996). Exposiçăo ao mercúrio da populaçăo de Alta Floresta,
Mato Grosso. PhD thesis, Universidade federal Fluminense, Niterói-RJ,
134 pp.
125
RT2004-016-00 CETEM/MCT
Hikmann Manaf (1999) The Environmental Impact of Small Scale Mining in
Indonesia. Abstract of the 3rd Environmental Cooperation workshop for
Sustainable Development on Mining Activities, Cairns
Huckabee, J.W.; Elwood, J.W.; Hildebrand, S.G. (1979) Accumulation of mercury
in freshwater biota. In: Nriagu JO (ed). The biogeochemistry of mercury in
the environment, Elsevier, North Holland, Amsterdam, p. 277-302
IRIS- Integrated Risk Information System (1995) EPA, Office of Research and
Development, Washington, DC
Kijewski H (1993) Die forensische Bedeutung der Mineralstoffgehalte in
menschlichen Kopfhaaren. Schmidt Roemhild Verlag, Lübeck, Germany
Kommission Human-Biomonitoring des Umweltbundesamtes Berlin - Institut
für Wasser-, Boden- und Lufthygiene des Umweltbundesamtes (1999)
Stoffmonographie Quecksilber - Referenz- und Human-Biomonitoring-
Werte (HBM). Bundesgesundheitsblatt: 42:522-532.
Krause C et al (1996) Umwelt-Survey 1990/92, Studienbeschreibung und
Human-Biomonitoring. Umweltbundesamt Berlin, Germany (ed.)
Lacerda LD, Salomons W (1998) mercury from Gold and Silver Mining: A
Chemical Time Bomb? Springer, Berlin, Heidelberg Lacerda, L.D &
Marins, R.V., 1997. Anthropogenic Mercury Emissions to the Atmosphere
in Brazil: The Impact of Gold Mining, J. Geochemical Exploration, v. 58, p.
223-229
Lamborg CH, Fitzgerald WF, O'Donnell J, Torgersen T (2002) A non-steady-
state compartment model of global-scale mercury biogeochemistry with
interhemispheric gradients. Geochim Cosmochim Acta 66:1105-1118.
Limbong, D., Kumampung, J., Rimper, J., Arai, T., Miyazaki, N. 2003.
Emissions and environmental implications of mercury from artisanal gold
mining in north Sulawesi, Indonesia The Science of the Total
Environment 302 (2003) 227236.
Lockowandt O (1996) Frostigs Entwicklungstest der visuellen Wahrnehmung.
Weinheim: Beltz
Malm O, Pfeiffer WC, Souza CMM, Reuther R (1990) Mercury pollution due to
gold mining in the Madeira River Basin, Brazil. Ambio 19,11-15
Martens, H. (2000). Mercury Pollution Awareness and Control A case study at
small-scale gold mining sites in Ratatok and Tatelu Districts of North
Sulawesi, Indonesia. Canadian International Development Agency and
Environmental Impact Management Agency, Indonesia. Project No.
471/18270. Montreal, 64 pp.
Masur H, Papke K, Althoff S, Oberwittler C (1995) Skalen und Scores in der
Neurologie. Thieme, Stuttgart
Melamed, R., Trigueiro, F.E., Villas Boas, R.C. (1999). The Role of Humic Acid
on Mercury Solubility, Complexation and Sorption. In Proc. 6th
126
RT2004-016-00 CETEM/MCT
International Conference on Mercury as a Global Pollutant, 340, Rio de Janeiro
(abstract).
MMSD (2002) Breaking New Ground: Mining, Minerals, and Sustainable
Development. International Institute for Environment and Development.
Earthscan Publications Ltd, London, UK. As available at
http://www.iied.org/mmsd/finalreport/index.html per September 2002.
O´Connor, T.P (1993)The National Oceanic and Atmospheric Administration
(NOAA) National Status and Trends Mussel Watch Program: national
monitoring of chemical contamination in the coastal United States. Pages
331-349 in C.R. Cothern and N.P. Ross, eds. Environmental statistics,
assessment, and forecasting. Lewis Publishers, Boca Raton, FL.
Osbourn, D. (1979) Seasonal changes in fat, protein and metal content of the
liver of starling Sturnus vulgaris. Environ. Pollut. 19: 145-155, 1979.
Pirrone N, Munthe J, Barregĺrd L, Ehrlich HC, Petersen G, Fernandez R,
Hansen JC, Grandjean P, Horvat M, Steinnes E, Ahrens R, Pacyna JM,
Borowiak A, Boffetta P, Wichmann-Fiebig M (2001) Ambient Air Pollution
by Mercury (Hg) Position Paper. Office for Official Publications of the
EC. (available on ttp://europa.eu.int/comm/environment/air/
background.htm#mercury).
Rachmadhi P (2003) A Social-health Perspective of the Miners in Talawaan and
Galangan, Indonesia 2003. University of Indonesia, Faculty of Public
Health, Jakarta
Ramirez GB, Vince Cruz CR, Pagulayan O, Ostrea E, Dalisay C (1999) The
Tagum study I: Mercury levels in mother's blood, transitional milk, cord
blood, baby's hair and meconium. Pediatrics, submitted for publication
Rodrigues-Filho, S.; Castilhos, Z.; Santos, R.; Egler, S.; Yallouz, A.; Nascimento,
F.; Pedroso, L.R.; Pereira, D.; Santos, E.; Brabo, E. (2004). Environmental
and Health Assessment in Two Small Scale Gold Mining Areas of the
Brazilian Amazon. Final Report of the Global Mercury Project, First Phase,
issued to UNIDO. Vienna, 154 pp.
Rodrigues-Filho, S.; Ribeiro Jr.; Villas Boas, R.C. (2001). Hg Geochemical
Dynamics as a Reference for Environmental Control in Gold Mining Sites.
In: Mercury in the Tapajos Basin. p. 51-62. Ed. Villas Boas, Beinhoff, Silva.
GEF/UNIDO/CYTED/CETEM/IMAAC publication. Rio de Janeiro.
Rodrigues-Filho, S. and Müller, G. (1999). A Holocene Sedimentary Record
from Lake Silvana, SE Brazil: Evidence for Paleoclimatic Changes from
Mineral, Trace-Metal and Pollen Data. Lecture Notes in Earth Sciences,
Vol. 88. Springer-Verlag. Heidelberg, New York, Tokyo. 96 pp.
Rodrigues-Filho, S. and Maddock, J.E.L. (1997). Mercury pollution in two gold
mining areas of the Brazilian Amazon. Journal of Geochemical Exploration,
58: 231-240.
127
RT2004-016-00 CETEM/MCT
Schoeny, R. Use of genetic toxicology data in U.S.EPA risk assessment: the
mercury study report as an example. Environ Health Perspect. 104 (Suppl.
3): 663-673, 1996
Smith JC, Farris FF (1996) Methylmercury pharmacokinetics in man: a
reevaluation. Toxicol Appl Pharmacol 137:245-252
Turner, S.J. (2002). Mesel SRDH Deposit and Low-Sulfidation Gold Veins in the
Ratatotok District, North Sulawesi, Indonesia. Geological Society of
America, Denver Annual Meeting (October 27-30, 2002).
http://gsa.confex.com/gsa/2002AM/finalprogram/abstract_46246.htm
UNIDO, 2002. Global Mercury Project Proposal. Vienna. 90 p.
UNEP, 2002- Global Mercury Assessment. Geneve, 258 p.
USEPA- Environmental Protection Agency (1989) Risk Assessment Guidence
For Superfund vol 1. chapt.6, pp. 1-54
USEPA (1986) Environmental Protection Agency . Risk Assessment Guidence
For Superfund
USEPA (1997) Mercury report to Congress. Volumes V and VI.
U.S. EPA (2001) Water Quality Criteria- Methylmercury. www.epa.gov.
Veiga, M.M. and Fernandes, F.R.C., 1991. Aspectos Gerais do Projeto Poconé.In:
Poconé, um Campo de Estudos do Impacto Ambiental do Garimpo, p.1-
25. Ed. M.M. Veiga e F.C.R. Fernandes. Rio de Janeiro, CETEM/CNPq.
Veiga,M.M.; Meech,J.A.; Ońate,N., 1994. Mercury Pollution from Deforestation.
Nature, v. 368, p.816-817.
Veiga, M.M. 1997. Introducing New Technologies for Abatement of Global
Mercury Pollution in Latin America. Rio de Janeiro
UNIDO/UBC/CETEM/ CNPq, Rio de Janiero, Brazil 94 p.
Veiga,M.M. and Beinhoff, C. 1997. UNECA Centers, a Way to Reduce Mercury
Emissions from Artisanal Gold Mining and Provide Badly Needed
Training. UNEP (United Nations Environment Programme) - Industry and
Environment, Oct-Dec. 1997, 20, (4): 49-51.
Veiga, M., Scoble, M. and M. L. McAllister, 2001. Mining with Communities.
Natural Resources Forum, UNEP, Pergamon, 25, pp. 191-202.
Veiga, M.M., and Hinton, J.J., 2002, Abandoned Artisanal Gold Mines in the
Brazilian Amazon, A Legacy of Mercury Pollution, Natural Resources
Forum, 26:1, February, 2002.
Veiga M. and Baker R (2003): Protocols for Environmental and Health
Assessment of Mercury Released by Artisanal and Small-Scale Gold
Miners. UNIDO, Vienna.
Villas Boas, R.C. (2001). Mercury in Brazil as Result of Garimpo Operations. In:
Mercury in the Tapajos Basin. p. 9-30. Ed. Villas Boas, Beinhoff, Silva.
GEF/UNIDO/CYTED/CETEM/IMAAC publication. Rio de Janeiro.
128
RT2004-016-00 CETEM/MCT
Watras CJ, Huckabee JW (1994) Mercury pollution: Integration and synthesis.
Lewis Publishers, USA, 727p
WHO (1980) Recommended health based limits in occupational exposure to
heavy metals. Technical Series Report No 647, Geneva
WHO (1989) Evaluation of certain food additives and contaminants. 33th report
of the Joint FAO/WHO Expert Committee on Food Additives, Geneva,
WHO series 775.
WHO (1990) Environmental Health Criteria 101: Methylmercury. Geneva,
World Health Organization.
WHO (1991) Environmental Health Criteria 118: Inorganic Mercury. Geneva
Wilhelm M (2000): Quecksilber In Boese-O´Reilly S, Kammerer S, Mersch-
Sundermann V, Wilhelm M: Leitfaden Umweltmedizin, 2. Auflage. Urban
und Fischer, München
Yagev, Y. (2002) Eating Fish during Pregnancy: Risk of Exposure to Toxic Levels
of Methylmercury. http://www.motherisk.org/updates/oct02.php3
Yallouz, A.V., 2001. Semiquantitative Mercury Determination in Fish and the
Possibility of Poisoningt Prevention. In: Book of Abstracts 6th Int. Conf.
Mercury as a Global Pollutant, Minamata, Japan, Oct, 2001, p. 80.
Zimmer R, Volkamer M (1984) MOT - Motoriktest. Beltz, Weinheim
Acknowledgement
First of all we would like to thank Dr. Christian Beinhoff and Marcello
Veiga from UNIDO/ Vienna for their tremendous support and patience. For
their support and understanding we thank very much Mr. Masayoshi
Matsushita and Mr. Nahruddin Alie from UNIDO Jakarta.
Our national project manager Mrs. Selinawati receives a very special
thank you, since she organized and was responsible for the two time
consuming field projects. All the other staff from the Department of Energy in
Kalimantan and Sulawesi were very helpful and supportive as well as Dr.
Daniel Linbong.
For all their help and understanding we would like to thank very much
all the people from the Local Health Office, especially Dr. Robertus
Pamuryanto, Asnedi, Muhlis Afatzli, Lesi, Gunarti, Emilia and Susanti in
Kareng Pangi.
For all their help during the field project in Sulawesi we would like to
thank J. Palit, Perumahan Banua Buha Asri, Marly Gumalag, Mariana Randuk,
Johnny Pangkey, Martinus Aramanna and Ronald March Tampubolon from
Manado.
129
RT2004-016-00 CETEM/MCT
Mansur Geiger, from P.T Kalimantan Surya Kencana, supported us
tremendously with his knowledge and engagement.
In Munich we want to thank very much Dr. Gabriele Roider in the
Institute of Forensic Medicine for the help A very special thank to Michelle
O´Reilly, who tolerated us all during the project, and helped very much to
make the field report readable.
Finally we would like to thank all participants of the medical
examinations and we hope to be able to improve their future living
circumstances.
130
Appendix 1
Health Tables
Table 3 - Sulawesi: Spearman' rank correlations (ro) between the mercury
concentration in the different bio-monitors.
** = p < 0.01 (one-tailed), N = case number
ro = + 0.76
Hg-B
**
(N = 221)
r
r
Total
o = + 0.77
o = + 0.79
Hg-Hair
**
**
(N = 219)
(N = 219)
r
r
r
Inorganic
o = + 0.83
o = + 0.68
o = + 0.828
Hg-Hair
**
**
**
(N = 199)
(N = 199)
(N = 199)
r
r
r
r
Organic
o = + 0.28
o = + 0.45
o = + 0.61
o = + 0.19
Hg-Hair
**
**
**
**
(N = 199)
(N = 199)
(N = 199)
(N = 199)
Hg-U Lab
(µg/ g creatinine)
Hg-B t-Hg-Hair
inorganic-Hg-Hair
Table 4 - Kalimantan: Spearman' rank correlations (ro) between the mercury
concentration in the different bio-monitors.
** = p < 0.01 (one-tailed), N = case number
ro = + 0.42
Hg-B
**
(N = 247)
r
r
Total
o = + 0.56
o = + 0.71
Hg-Hair
**
**
(N = 246)
(N = 246)
r
r
r
Inorganic
o = + 0.80
o = + 0.41
o = + 0.68
Hg-Hair
**
**
**
(N = 245)
(N = 245)
(N = 245)
r
r
r
r
Organic
o = + 0.18
o = + 0.63
o = + 0.75
o = + 0.19
Hg-Hair
**
**
**
**
(N = 245)
(N = 245)
(N = 245)
(N = 245)
Hg-U Lab
Inorganic
(µg/ g creatinine)
Hg-B t-Hg-Hair Hg-Hair
Table 6 - Adults from Sulawesi. Relevant data of the sub-groups. Grey shaded fields in
the table contain results that differ from the control group on a statistically significant
level (p < 0.05, one-tailed Chi-square test).
Adults from Sulawesi
Value or
Control
Not
Mineral
Amalgam-
Data or Test
Score
adults
occupational processors
burners
burdened
Case
number 22 18 17 61
Anamnestic
data:
Male/female
18/4
3/15
1/16
52/9
Mean age (years)
27.5
36.9
36.0
35.6
Heavy alcohol
0 5.6% 0 23.0%
drinker
Metallic
taste
0/1
0 0 0
4.9%
Excessive
0/1 0 16.7% 5.9% 6.6%
salivation
Tremor at work
0/1
0
0
17.6%
11.5%
Sleeping problems
0/1
9.1%
16.7%
52.9%
26.2%
Health problems
worsened since
0/1 0 11.1% 64.7%
78.7%
Hg exposed
Table 6 (cont.) - Adults from Sulawesi. Relevant data of the sub-groups. Grey shaded
fields in the table contain results that differ from the control group on a statistically
significant level (p < 0.05, one-tailed Chi-square test).
Adults from Sulawesi
Value or
Control
Not
Mineral
Amalgam-
Data or Test
Score
adults
occupational
processors
burners
burdened
Case
number 22 18 17 61
Anamnestic
data:
Lack of appetite
13.6%
11.1%
17.6%
11.5%
Loss of weight
0
5.6%
5.9%
11.5%
Easily tired
0
5.6%
0
14.8%
Rest more
0
0
0
13.1%
Feel sleepy
0
11.1%
5.9%
13.1%
Problems to start
0 0 0 4.9%
things
Lack of energy
0
0
0
14.8%
Less strength
0
0
0
13.1%
Weak
0
5.6%
0
13.1%
Table 6 (cont.) - Adults from Sulawesi. Relevant data of the sub-groups. Grey shaded
fields in the table contain results that differ from the control group on a statistically
significant level (p < 0.05, one-tailed Chi-square test).
Adults from Sulawesi
Value
Control
Not
Mineral
Amalgam-
Data or Test
or Score
adults
occupational
processors
burners
burdened
Case number
22
18
17
61
Anamnestic data:
Problems with
0 0 5.9% 9.8%
concentration
Problems to
0 5.6% 11.8% 4.9%
think clear
Word finding
0 0
0 8.2%
problems
Eyestrain
0
0
11.8%
6.6%
Memory problems
0
11.1%
17.6%
13.1%
Feel nervous
0
16.7%
29.4%
21.3%
Feel sad
0
16.7%
11.8%
4.9%
Headache
0
38.9%
58.8%
27.9%
Nausea
0
22.2%
47.1%
21.3%
Numbness
4.5%
27.8%
58.8%
37.7%
Table 6 (cont.) - Adults from Sulawesi. Relevant data of the sub-groups. Grey shaded
fields in the table contain results that differ from the control group on a statistically
significant level (p < 0.05, one-tailed Chi-square test).
Adults from Sulawesi
Value or
Control
Not
Mineral
Amalgam-
Data or Test
Score
adults
occupational
processors
burners
burdened
Case number
22
18
17
61
Clinical data:
Bluish coloration
0/1 0
0 5.9%
11.5%
of gingiva
Gingivitis
0 0 0
0
Ataxia of gait
0/1
9.1%
44.4%
23.5%
49.2%
Finger to nose
0/1 9.1% 5.6% 5.9% 1.6%
tremor
Finger to nose
0 11.1% 0
6.6%
dysmetria
Dysdiadochokin
0/1 18.2% 16.7% 29.4% 36.1%
esia
Tremor of eyelid
54.6%
38.9%
23.6%
39.4%
Table 6 (cont.) - Adults from Sulawesi. Relevant data of the sub-groups. Grey shaded
fields in the table contain results that differ from the control group on a statistically
significant level (p < 0.05, one-tailed Chi-square test).
Adults from Sulawesi
Value or
Control
Not
Mineral
Amalgam-
Data or Test
Score
adults
occupational
processors
burners
burdened
Case number
22
18
17
61
Clinical data:
Horizontal field of
170° 164°
159°
164°
vision (median)
Heel to knee
0/1 0 55.6%
23.5%
31.1%
ataxia
Heel to knee
0/1 0
0
0 3.3%
tremor
PSR normal
54.5%
61.1%
70.6%
59.0%
BSR normal
90.9%
77.8%
70.6%
68.9%
ASR normal
59.1%
50.0%
58.8%
50.8%
Mento-labial reflex
0/1 36.4% 27.8%
0 16.4%
pathologic
Bradykinesia 0 11.1%
17.6%
13.1%
Hypomimia 0 5.6%
5.9%
9.8%
Proteinuria
0/1 9.1% 22.2%
0 1.6%
Table 6 (cont.) - Adults from Sulawesi. Relevant data of the sub-groups. Grey shaded
fields in the table contain results that differ from the control group on a statistically
significant level (p < 0.05, one-tailed Chi-square test).
Adults from Sulawesi
Value or Control
Not
Mineral
Amalgam-
Data or Test
Score
adults
occupational
processors
burners
burdened
Case number
22
18
17
61
Neuro-psychological
test
0-1 63.6% 50.0% 23.5%
40.0%
2 31.8% 27.8% 47.1%
26.7%
Memory test
3-4
4.5% 22.2% 29.4%
33.3%
(worst)
10-16 sec
63.6%
16.7%
23.5%
21.3%
17-22 sec
31.8%
50.0%
58.8%
59.0%
Match box test
23-45 sec
4.5%
33.3%
17.6%
19.7%
(worst)
Table 6 (cont.) - Adults from Sulawesi. Relevant data of the sub-groups. Grey shaded
fields in the table contain results that differ from the control group on a statistically
significant level (p < 0.05, one-tailed Chi-square test).
Adults from Sulawesi
Value or
Control
Not
Mineral
Amalgam-
Data or Test
Score
adults
occupational processors burners
burdened
Case number
22
18
17
61
Neuro-psychological
test
13-12 45.5% 22.2%
29.4%
26.2%
11-10
40.9%
27.8%
29.4%
39.3%
Frostig test
9-2
13.6%
50.0%
41.2%
34.4%
(worst)
90-63 81.8% 11.1%
23.5%
39.3%
62-52 18.2% 66.7%
52.9%
41.0%
Pencil tapping test
51-26
0
22.2%
23.5%
19.7%
(worst)
Table 6 (cont.) - Adults from Sulawesi. Relevant data of the sub-groups. Grey shaded
fields in the table contain results that differ from the control group on a statistically
significant level (p < 0.05, one-tailed Chi-square test).
Adults from Sulawesi
Value or
Control
Not
Mineral
Amalgam-
Data or Test
Score
adults
occupational
processors
burners
burdened
Bio-monitoring
No. 22
18
17 61
median 0.7
3.0
7.8
21.9
Hg-urine
> HBM II
0
0
11.8%
44.3%
(µg/l)
> BAT
0
0
0
11.5%
max. 3.2 18.6 57.6 564
No. 22
18
17 61
median 0.4
2.0
3.7
10.0
Hg-urine
(µg/g creatinine) > HBM II
0
0
5.9%
34.4%
max. 1.35
9.8
23.0 233
Table 6 (cont.) - Adults from Sulawesi. Relevant data of the sub-groups. Grey shaded
fields in the table contain results that differ from the control group on a statistically
significant level (p < 0.05, one-tailed Chi-square test).
Adults from Sulawesi
Value or Control
Not
Mineral
Amalgam-
Data or Test
Score
adults
occupational
processors
burners
burdened
Bio-monitoring
No. 21
18
17
61
median 4.6
6.0
9.2
13.2
Hg-blood
> HBM II
0
0
23.5%
44.3%
> BAT
0
0
5.9%
24.6%
max. 10.1 12.6
78.4
186
No. 21
18
17
60
median 1.52
1.65
2.96
4.79
Total Hg-hair
> 5 µg/g
0
5.6%
23.5%
48.3%
max. 3.72 10.3
40.0
239
Table 6 (cont.) - Adults from Sulawesi. Relevant data of the sub-groups. Grey shaded
fields in the table contain results that differ from the control group on a statistically
significant level (p < 0.05, one-tailed Chi-square test).
Adults from Sulawesi
Value or Control
Not
Mineral
Amalgam-
Data or Test
Score
adults
occupational
processors
burners
burdened
Case number
22 18
17
61
median 2.5
5.5
6.0
6.0
0-4 90.9% 22.2%
17.6%
18.0%
Medical test
score
5-9 9.1% 61.1%
76.5%
68.9%
10-21
0
16.7%
5.9%
13.1%
(worst)
HBM II and
BAT
Blood or urine > HBM II
0
5.6%
29.4%
60.7%
or hair
Blood or urine
> BAT
0
0
5.9%
27.9%
Diagnosis
Hg
No.
2
4
33
intoxication
0
(%)
(11.1%)
(23.5%)
(54.1%)
Table 7 - Adults from Kalimantan: Relevant data of the sub-groups. Grey shaded fields
in the table contain results that differ from the control group from Sulawesi on a
statistically significant level (p < 0.05, one-tailed Chi-square test )
Adults from Kalimantan
Sulawesi Kalimantan
Data or Test
Value or Control
Tang-
Former
Not
Mineral Amalgam-
Score
adults
kiling
miner
occupational processors burners
burdened
Case number
22
36
10
67
30
69
Anamnestic data:
Male/female
18/4
3/33
0/10
3/64
15/15
50/19
Mean age (years)
27.5
36.2
36.5
31.4
33.7
31.9
Heavy alcohol
0 0 0 0
0 0
drinker
Metallic taste
0/1
0
0
10.0%
22.4%
20.0%
36.2%
Excessive
0/1 0 8.6%
20.0% 9.0% 36.7%
36.2%
salivation
Tremor at work
0/1
0
20.0%
30.0%
37.3%
23.3%
37.7%
Sleeping problems
0/1
9.1%
17.1%
30.0%
55.2%
46.7%
37.7%
Health problems
worsened since
0/1 0 0
10.0% 3.0% 16.7%
30.4%
Hg exposed
Table 7 (cont.) - Adults from Kalimantan: Relevant data of the sub-groups. Grey shaded
fields in the table contain results that differ from the control group from Sulawesi on a
statistically significant level (p < 0.05, one-tailed Chi-square test )
Adults from Kalimantan
Sulawesi Kalimantan
Data or Test
Value or Control Tang-
Former
Not
Mineral Amalgam-
Score
adults kiling
miner occupational processors
burners
burdened
Case number
22
36
10
67
30
69
Anamnestic data:
Lack of appetite
13.6%
36.2% 50.0%
70.1%
56.7%
58.0%
Loss of weight
0
61.1%
70.0%
67.2%
73.3%
44.2%
Easily tired
0
47.2%
70.0%
47.8%
56.6%
53.6%
Rest more
0
44.4%
70.0% 38.8% 36.6% 50.7%
Feel sleepy
0
13.9%
30.0%
31.3%
46.7%
39.1%
Problems to start
0 0
20.0%
1.5% 3.3%
10.1%
things
Lack of energy
0
25.0%
60.0%
35.8%
53.3%
38.2%
Less strength
0
25.0%
60.0%
38.8%
50.0%
43.5%
Weak
0
25.0%
50.0%
40.3%
50.0%
41.1%
Table 7 (cont.) - Adults from Kalimantan: Relevant data of the sub-groups. Grey shaded
fields in the table contain results that differ from the control group from Sulawesi on a
statistically significant level (p < 0.05, one-tailed Chi-square test )
Adults from Kalimantan
Sulawesi Kalimantan
Data or Test
Value or Control
Tang-
Former
Not
Mineral Amalgam-
Score
adults
kiling
miner occupational processors
burners
burdened
Case number
22
36
10
67
30
69
Anamnestic data:
Problems with
0
11.0%
20.0%
9.0%
10.0%
20.3%
concentration
Problems to
0
2.8%
10.0%
3.0%
10.0%
15.9%
think clear
Word finding
0
5.6%
20.0%
9.0%
10.0%
8.7%
problems
Eyestrain
0
11.1%
20.0%
17.9%
20.0%
26.4%
Memory
0
55.5%
70.0%
59.0%
36.7%
46.3%
problems
Feel nervous
0
52.8%
70.0%
59.1%
63.3%
66.1%
Feel sad
0
75.0%
100%
75.8%
76.7%
63.2%
Headache
0
80.0%
90.0%
83.6%
93.1%
81.2%
Nausea
0
47.2%
100%
62.7% 60.0%
60.9%
Numbness
4.5%
66.7%
70.0%
70.1%
73.3%
88.4%
Table 7 (cont.) - Adults from Kalimantan: Relevant data of the sub-groups. Grey shaded
fields in the table contain results that differ from the control group from Sulawesi on a
statistically significant level (p < 0.05, one-tailed Chi-square test )
Adults from Kalimantan
Sulawesi Kalimantan
Data or Test
Value or Control
Tang-
Former
Not
Mineral Amalgam-
Score
adults
kiling
miner occupational processors
burners
burdened
Case number
22
36
10
67
30
69
Clinical data:
Bluish coloration
0/1 0 2.9%
0 7.5% 16.7%
10.1%
of gingiva
Gingivitis 0
0
0
3.0%
0 0
0
Ataxia of gait
0/1
9.1%
17.1%
20.0%
50.7%
33.3%
49.3%
Finger to nose
0/1 9.1% 0 10.0% 7.5% 13.3%
11.6%
tremor
Finger to nose
0
2.8%
0 9.0% 20.0%
15.9%
dysmetria
Dysdiadochokine
0/1 18.2%
11.4%
30.0% 38.8%
43.3%
40.6%
sia
Tremor of eyelid
54.6%
30.6% 60.0%
46.3%
60.0%
66.6%
Table 7 (cont.) - Adults from Kalimantan: Relevant data of the sub-groups. Grey shaded
fields in the table contain results that differ from the control group from Sulawesi on a
statistically significant level (p < 0.05, one-tailed Chi-square test )
Adults from Kalimantan
Sulawesi Kalimantan
Data or Test
Value or Control
Tang-
Former
Not
Mineral Amalgam-
Score
adults
kiling
miner
occupational processors burners
burdened
Case number
22
36
10
67
30
69
Clinical data:
Horizontal
field of vision
170°
159°
165°
150°
149°
153°
(median)
Heel to knee
0/1 0
14.3%
50.0%
37.3%
50.0%
62.3%
ataxia
Heel to knee
0/1 0 0 0 3.0% 3.3% 2.9%
tremor
PSR normal
54.5%
72.2% 50.0%
68.7%
56.7% 46.4%
BSR normal
90.9%
80.6% 90.0%
89.4%
80.0% 76.8%
ASR normal
59.1%
72.2% 60.0%
81.8%
66.7% 56.5%
Mento-labial
reflex
0/1 36.4%
17.1%
20.0% 17.9% 16.7% 18.8%
pathologic
Bradykinesia 0 2.8%
20.0%
4.5%
20.0%
27.5%
Hypomimia 0
2.8%
20.0%
7.5%
20.0%
26.1%
Proteinuria
0/1 9.1%
8.3%
10.0% 10.4% 10.0% 10.1%
Table 7 (cont.) - Adults from Kalimantan: Relevant data of the sub-groups. Grey shaded
fields in the table contain results that differ from the control group from Sulawesi on a
statistically significant level (p < 0.05, one-tailed Chi-square test )
Adults from Kalimantan
Sulawesi Kalimantan
Data or Test
Value or Control
Tang-
Former
Not
Mineral Amalgam-
Score
adults
kiling
miner
occupational processors burners
burdened
Case number
22
36
10
67
30
69
Neuro-
psychological
test
0-1 63.6%
26.5%
20.0%
11.9%
13.3%
20.3%
2 31.8%
26.5%
40.0%
44.8%
46.7%
43.5%
Memory test
3-4
4.5%
47.1%
40.0%
43.3%
40.0%
36.2%
(worst)
10-16 sec
63.6%
11.4%
10.0%
41.8%
30.0%
18.8%
17-22 sec
31.8%
40.0%
60.0%
37.3%
50.0%
50.7%
Match box test 23-45 sec 4.5% 48.6% 30.0% 20.9%
20.0%
30.4%
(worst)
Table 7 (cont.) - Adults from Kalimantan: Relevant data of the sub-groups. Grey shaded
fields in the table contain results that differ from the control group from Sulawesi on a
statistically significant level (p < 0.05, one-tailed Chi-square test )
Adults from Kalimantan
Sulawesi Kalimantan
Data or Test
Value or Control Tang- Former
Not
Mineral
Amalgam-
Score
adults kiling miner occupational processors
burners
burdened
Case number
22
35
10
67
30
69
Neuro-
psychological
test
13-12 45.5%
37.1%
20.0%
23.9%
36.7% 30.4%
11-10
40.9% 37.1% 30.0%
38.8%
33.3% 42.0%
Frostig test
9-2
13.6% 25.7% 50.0%
37.3%
30.0% 27.5%
(worst)
90-63 81.8%
28.6% 10.0%
14.9%
20.0%
22.1%
62-52 18.2%
34.3% 60.0%
43.3%
63.3%
55.9%
Pencil tapping
test
51-26
0
37.1% 30.0%
41.8%
16.7%
22.1%
(worst)
Table 7 (cont.) - Adults from Kalimantan: Relevant data of the sub-groups. Grey shaded
fields in the table contain results that differ from the control group from Sulawesi on a
statistically significant level (p < 0.05, one-tailed Chi-square test )
Adults from Kalimantan
Sulawesi Kalimantan
Data or Test
Value or Control
Tang-
Former
Not
Mineral Amalgam-
Score
adults
kiling
miner
occupational processors burners
burdened
Bio-monitoring
No. 22 36 10
67
30 69
median 0.7 1.2
1.7
4.5
5.3
10.2
Hg-urine (µg/l) > HBM II
0
0
0
9.0%
10.0%
34.8%
> BAT
0
0
0
1.5%
6.7%
18.8%
max. 3.2 13.1 9.3
874
788 5,240
No. 22 36 10
67
30 69
median 0.4 0.7
1.5
2.7
3.3
5.3
Hg-urine (µg/g
creatinine)
> HBM II
0
0
0
3.0%
6.7%
24.6%
max. 1.35 4.8 2.9
355
261 1,697
Table 7 (cont.) - Adults from Kalimantan: Relevant data of the sub-groups. Grey shaded
fields in the table contain results that differ from the control group from Sulawesi on a
statistically significant level (p < 0.05, one-tailed Chi-square test )
Adults from Kalimantan
Sulawesi Kalimantan
Data or Test
Value or Control
Tang-
Former
Not
Mineral Amalgam-
Score
adults
kiling
miner occupational processors burners
burdened
Bio-monitoring
No. 21 36 10 67
30 69
median 4.6 11.0
12.6
8.5
9.5
10.6
> HBM
Hg-blood
0
22.2%
20.0%
16.4%
33.3%
40.6%
II
> BAT
0
0
0
9.0%
16.7%
23.2%
max. 10.1 19.5 21.1 172
145
429
No. 21 36 10 67
30 68
median 1.52 2.74
3.70
2.55
3.83
3.86
Total Hg-hair
> 5 µg/g
0
8.3%
20.0%
23.9%
26.7%
42.6%
max. 3.72 7.76 7.26 103
793
225
Table 7 (cont.) - Adults from Kalimantan: Relevant data of the sub-groups. Grey shaded
fields in the table contain results that differ from the control group from Sulawesi on a
statistically significant level (p < 0.05, one-tailed Chi-square test )
Adults from Kalimantan
Sulawesi Kalimantan
Data or Test
Value or Control
Tang-
Former
Not
Mineral Amalgam-
Score
adults
kiling
miner occupational processors burners
burdened
Case number
22
36
10
67
30
69
median 2.5 5.0 7.0
7.0
6.5
8.0
0-4 90.9%
30.6%
10.0%
13.4%
20.0%
14.5%
Medical test
score
5-9 9.1%
63.9%
80.0%
64.2%
50.0%
50.7%
10-21
0
5.6%
10.0%
22.4%
30.0%
34.8%
(worst)
HBM II and
BAT
Blood or urine
> HBM II
0
25.0%
30.0%
29.9%
43.3%
53.6%
or hair
Blood or urine
> BAT
0
0
0
9.0%
16.7%
24.6%
Diagnosis
No.
8
4
23
13
41
Hg intoxication
0
(%)
(22.2%) (40.0%)
(34.3%)
(43.3%)
(59.4%)
Table 8 - Children: Relevant data of the sub-groups. Grey shaded fields in the table
contain results that differ from the control group from Sulawesi n a statistically
significant level (p < 0.05, one-tailed Chi-square test
Children
Sulawesi Kalimantan
Data or Test
Value
Children
Children
Children
Children
or Score
Control not working working not working working
children
with Hg
with Hg
with Hg
with Hg
Case
number 31 22 51 27 8
Anamnestic
data:
Male/female
13/18
7/15
34/17
16/11 6/2
Mean age (years)
11.6
10.7
11.8 11.8 12.3
Heavy alcohol
0 0 0 0 0
drinker
Metallic taste
0/1
0
0
2.0%
11.1%
12.5%
Excessive
0/1 0
0 5.9% 7.4% 12.5%
salivation
Tremor at work
0/1
0
0
0
7.4%
25.0%
Sleeping
problems
0/1
3.2% 0 2.0%
14.8%
25.0%
Health problems
worsened since Hg
0/1 0 54.5%
76.5%
0 0
exposed
Table 8 (cont.) - Children: Relevant data of the sub-groups. Grey shaded fields in the
table contain results that differ from the control group from Sulawesi n a statistically
significant level (p < 0.05, one-tailed Chi-square test
Children
Sulawesi Kalimantan
Data or Test
Value or
Children
Children
Children
Children
Score
Control not working working not working working
children
with Hg
with Hg
with Hg
with Hg
Case
number 31 22 51 27 8
Anamnestic
data:
Lack of appetite
0
0
2.0%
51.9%
25.0%
Loss of weight
0
0
0
29.6%
62.5%
Easily tired
0
0
0
14.8%
12.5%
Rest more
0
0
0
11.1%
12.5%
Feel sleepy
0
0
0
7.7%
25.0%
Problems to start
0 0 0 0
12.5%
things
Lack of energy
0
0
0
3.7%
0
Less strength
0
0
0
3.7%
0
Weak
0
0
0
3.7%
0
Table 8 (cont.) - Children: Relevant data of the sub-groups. Grey shaded fields in the
table contain results that differ from the control group from Sulawesi n a statistically
significant level (p < 0.05, one-tailed Chi-square test
Children
Sulawesi Kalimantan
Data or Test
Value or
Children
Children
Children
Children
Score
Control not working working not working working
children
with Hg
with Hg
with Hg
with Hg
Case
number 31 22 51 27 8
Anamnestic
data:
Problems with
0 0 0
3.7% 0
concentration
Problems to
0 0 0 0
12.5%
think clear
Word finding
0 0 0
11.5%
0
problems
Eyestrain
0 0 0 0 0
Memory
0 0 0
22.2%
71.4%
problems
Feel
nervous 3.2% 0 9.8%
77.8%
75.0%
Feel sad
0
0
3.9%
63.0%
75.0%
Headache
19.4%
0
2.0%
76.9%
87.5%
Nausea
0
4.5%
2.0%
25.9%
75.0%
Numbness
3.2%
4.5%
13.7%
7.4%
50.0%
Table 8 (cont.) - Children: Relevant data of the sub-groups. Grey shaded fields in the
table contain results that differ from the control group from Sulawesi n a statistically
significant level (p < 0.05, one-tailed Chi-square test
Children
Sulawesi Kalimantan
Data or Test
Value or
Children
Children Children not
Children
Score
Control not working working working with working with
children
with Hg
with Hg
Hg
Hg
Case
number
31 22 51 27
8
Clinical
data:
Bluish
coloration of
0/1 0
0 2.0% 0
0
gingiva
Gingivitis 0
0 0 0 0 0
Ataxia of gait
0/1
6.5%
13.6%
29.4%
18.5% 25.0%
Finger to nose
0/1 0 13.6%
5.9% 0
0
tremor
Finger to nose
0 4.5%
5.9%
7.4% 0
dysmetria
Dysdiadochoki
0/1 9.7% 22.7% 29.4%
33.3%
25.0%
nesia
Tremor of
38.7% 40.9% 47.1% 44.4% 50.0%
eyelid
Table 8 (cont.) - Children: Relevant data of the sub-groups. Grey shaded fields in the
table contain results that differ from the control group from Sulawesi n a statistically
significant level (p < 0.05, one-tailed Chi-square test
Children
Sulawesi Kalimantan
Data or Test
Value or
Children
Children
Children
Children
Score
Control not working working not working working
children
with Hg
with Hg
with Hg
with Hg
Case
number
31 22 51 27 8
Clinical
data:
Horizontal
field of vision
173° 173° 172° 169°
167°
(median)
Heel to knee
0/1 12.9% 18.2% 33.3%
48.1%
37.5%
ataxia
Heel to knee
0/1
0 0 2.0% 0 0
tremor
PSR normal
100%
81.8%
84.3%
74.1%
62.5%
BSR normal
93.5%
81.8%
80.4%
85.2%
87.5%
ASR normal
87.1%
81.8%
76.5%
63.0%
50.0%
Mento-labial
reflex
0/1
16.1% 9.1% 15.7% 7.4% 12.5%
pathologic
Bradykinesia
0 0 0 0
12.5%
Hypomimia 0
0
0 3.7% 0
Proteinuria
0/1 9.7% 9.1%
0
11.1% 12.5%
Table 8 (cont.) - Children: Relevant data of the sub-groups. Grey shaded fields in the
table contain results that differ from the control group from Sulawesi n a statistically
significant level (p < 0.05, one-tailed Chi-square test
Children
Sulawesi Kalimantan
Data or Test
Value or
Children
Children
Children
Children
Score
Control not working working not working working
children
with Hg
with Hg
with Hg
with Hg
Case number
31
22
51
27
8
Neuro-
psychological
test
0-1 54.8% 68.2% 47.1% 29.6%
12.5%
2 25.8% 18.2% 31.4% 51.9%
62.5%
Memory test
3-4
19.4% 13.6% 21.6% 18.5%
25.0%
(worst)
10-16 sec
71.0%
18.2%
25.5%
14.8%
12.5%
17-22 sec
29.0%
54.5%
52.9%
40.7%
62.5%
Match box test 23-45 sec
0%
27.3%
21.6%
44.4%
25.0%
(worst)
Table 8 (cont.) - Children: Relevant data of the sub-groups. Grey shaded fields in the
table contain results that differ from the control group from Sulawesi n a statistically
significant level (p < 0.05, one-tailed Chi-square test
Children
Sulawesi Kalimantan
Data or Test
Value or
Children
Children
Children
Children
Score
Control not working working not working working
children
with Hg
with Hg
with Hg
with Hg
Case number
31
22
51
27
8
Neuro-
psychological test
13-12 67.7% 27.3%
39.2%
44.4%
62.5%
11-10
29.0%
50.0%
49.0%
44.4%
12.5%
Frostig test
9-2
3.2%
22.7%
11.8%
11.1%
25.0%
(worst)
90-63 41.9% 4.5%
21.6%
0
12.5%
Pencil tapping
62-52 54.8% 45.5%
52.9%
63.0%
50.0%
test
51-26
3.2%
50.0%
25.5%
37.0%
37.5%
(worst)
Table 8 (cont.) - Children: Relevant data of the sub-groups. Grey shaded fields in the
table contain results that differ from the control group from Sulawesi n a statistically
significant level (p < 0.05, one-tailed Chi-square test
Children
Sulawesi Kalimantan
Data or Test
Value or
Children
Children
Children
Children
Score
Control
not working
working
not working
working
children
with Hg
with Hg
with Hg
with Hg
Bio-
monitoring
No. 31 22
51
27
8
median 0.8
4.2
10.2
4.5
4.6
Hg-urine
> HBM II
0
0
9.8%
7.4%
12.5%
(µg/l)
> BAT
0
0
0
0
12.5%
max. 2.2 15.0 39.1 29.1 330
No. 31 22
51
27
8
Hg-urine
median 0.5
2.6
3.6
3.0
2.8
(µg/g
> HBM II
0
0
3.9%
0
12.5%
creatinine)
max. 1.0 13.3 25.3 15.3 120.0
Table 8 (cont.) - Children: Relevant data of the sub-groups. Grey shaded fields in the
table contain results that differ from the control group from Sulawesi n a statistically
significant level (p < 0.05, one-tailed Chi-square test
Children
Sulawesi Kalimantan
Data or Test
Value or
Children
Children Children not Children
Score
Control not working working
working
working
children
with Hg
with Hg
with Hg
with Hg
Bio-
monitoring
No. 31 22 51 27
8
median 4.1
5.4
7.8
7.1
8.5
Hg-blood
> HBM II
0
0
13.7%
7.4%
25.0%
> BAT
0
0
2.0%
0
12.5%
max. 7.9 12.4 28.4 16.4 64.8
No. 31 22 50 27
8
median 1.24 2.23
2.16
2.75
2.58
Total Hg-hair
> 5 µg/g
0
0
4.0%
25.9%
25.0%
max. 3.46 4.16 6.67 28.1 21.6
Table 8 (cont.) - Children: Relevant data of the sub-groups. Grey shaded fields in the
table contain results that differ from the control group from Sulawesi n a statistically
significant level (p < 0.05, one-tailed Chi-square test
Children
Sulawesi Kalimantan
Data or Test
Value or
Children
Children Children not Children
Score
Control not working working
working
working
children
with Hg
with Hg
with Hg
with Hg
Case number
31
22
51
27
8
median 2.0
5.5
5.0
6.0
6.0
0-4 87.1% 27.3%
39.2%
22.2%
25.0%
Medical test score
5-9 12.9% 72.7%
56.9%
77.8%
62.5%
10-21
0
0
3.9%
0
12.5%
(worst)
HBM II and BAT
Blood or urine or
> HBM II
0
0
21.6%
29.6%
25.0%
hair
Blood or urine
> BAT
0
0
2.0%
0
12.5%
Diagnosis
No.
9
5
2
Hg intoxication
0 0
(%)
(17.6%)
(18.5%)
(25.0%)
Appendix 2
Health Assessment Questionnaire
Health Assessment Questionnaire
by Dr. Stephan Boese O'Reilly, Prof. Dr. Gustav Drasch, Stefan Maydl, Dr. Milan Vosko
Ludwig-Maximilians University, Munich, Germany.
and Dr. Claude Casellas, Prof. Dr. André Rambaud
University of Montpellier, France
Marcello Veiga, UNIDO Vienna, Austria
Removal of Barriers to the Introduction of Cleaner Artisanal Gold Mining and
Extraction Technologies
United Nations Industrial Development Organization (UNIDO)
Global Environment Facility (GEF)
United Nations Development Programme (UNDP)
Health Assessment
Name: _____________________________________________________________________
I hereby declare that I want to take part in the UNIDO project. I will be questioned about
my living circumstances and health problems related to mercury. I will be medically
examined including neurological examination. Blood, urine and a small amount of hair
will be taken. The ... will inform me after the laboratory analysis about my personal
results. The UNIDO and the ... will get the results in a form where my name can not be
identified. The assessment is done respecting the "Recommendation for Conduct of
Clinical Research" (World Health Organization Declaration of Helsinki).
>>translation<<
Local and Date: _____________________ _________________________________
Signature
(in case of children signature of parents/guardian)
Witnesses (if needed):
________________________________ and ________________________________
(Name):
(Name):
Personal Data
Participant ID Number: ______________________
Family Name: ..............................................................................................
Surname:.................................................................................................
First Name:..................................................................................................
Date of Birth: ..................................................................................
Age: ..........................................(years)
Gender:
0 Female
1 Male
Address: .....................................................................................................................................
..................................................................................................................................................
(if possible local codes, like settlement A,B, C ....)
Any telephone for contact: .......................................
General Questionnaire
Date of interview:...................................................................
Name of the interviewer for this section:.........................................
Code of the interviewer ___________
(please give every interviewer a code, like A,B,C)
Work Exposure
How long have you been living in this area?
______ year(s)
Occupation (Detailed description of the job)
A Miner
B
Mineral processor (in charge of amalgamation)
C
Gold smelter (gold buyer)
D
Worker at a cyanidation plant
E Farmer
F Office
Job
G Driver
H
School child (not working)
J Other
job.....................................................................
Have you ever worked in the _____________ area?
0 ____ No
1 ____ Yes
If yes, for how many _______ year(s)?
Have you ever worked as a miner with direct contact with mercury?
0 ____ No
1 ____ Yes
If from when to when: ___________________________________
= _______ years of mercury contact
Have you ever worked burning amalgam or melting gold?
0 ____ No
1 ____ Yes
If yes, from when to when: _______________________________
= _______ years of mercury contact
Have you been using retort?
0 ____ Yes
1 ____ No
Have you stored mercury containers or flasks?
0 ____ Never
1 ____ At work
2 ____ At home
Have you kept your dirty working clothes at your home?
0 ____ No
1 ____ Yes
For how many years have you been working with mercury?
0 ____ not applicable (have not working directly with mercury)
1 ____ year(s)
Diet Issues
Fish eating habits
How frequently do you eat fish?
0 ____ Never
1 ____ At least once a month
2. ____ At least once a week
3. ____ At least once a day
How much fish to you eat?
________ meals per day
or
________ meals per week
Name the two or three types of fish you consume regularly. If possible, indicate the
type of fish that you eat the most:
· Does this fish eat other fish?
· Does this fish eat insects or small bugs?
· Does this fish eat plants or feed on the bottom?
List the species you most often eat. . If possible, try to estimate this between wet season
and dry season.
Use a number to estimate how often you eat each species:
4 = most meals; 3 = about half the meals; 2 = some meals 1 = occasionally.
Fish Name Species % %
(dry season) (wet season)
________________________ ____
____
____
________________________ ____
____
____
________________________ ____
____
____
________________________ ____
____
____
________________________ ____
____
____
________________________ ____
____
____
________________________ ____
____
____
________________________ ____
____
____
________________________ ____
____
____
The more detailed the information an individual can provide on his/her fish
consumption, the better. It is important to instruct health care workers delivering the
questionnaire on this. At the very least you must determine: the number of meals, type of
fish consumed and amount of fish (e.g., the size of you fist? the size of your hand? Etc)
consumed; daily, weekly or monthly as appropriate (in some seasons, fish may not be
consumed).
Please code the fishes like A, B, D, E, F, (Please use useful list of fish according to local
habits)
Do you know where the fish come from?
0 _____ from areas distant from mining
1 _____ from areas impacted by mining
9 _____ don't know the origin of the fish (buy in the market)
Can you name the river and local where you catch most fish you have consumed?
A ____ No
B____ Yes, the river (or lake or pool) is _______________________________
(Please give the areas codes, like C, D, E, F ...)
Other dietary issues
Name the place where you obtain drinking water:
________________________________________
(Please give the areas codes, like C, D, E, F ...)
Do you consume from local production chicken, ducks or eggs?
0 ____ Never
1 ____ At least once a month
2 ____ At least once a week
3 ____ At least once a day
Do you consume from local production meat?
0 ____ Never
1 ____ At least once a month
2 ____ At least once a week
3 ____ At least once a day
Do you consume from local production vegetables, fruits?
0 ____ Never
1 ____ At least once a month
2 ____ At least once a week
3 ____ At least once a day
Confounders
Do you smoke?
0 ____ Never
1 ____ Rarely (0-10 cigarettes per day)
2 ____ Medium (10-20 cigarettes per day)
3 ____ Lots (more then 20 cigarettes per day)
Do you drink alcohol?
0 ____ Never
1 ____ at least once a month
2 ____ at least once a week
3 ____ at least once a day
Have you been constantly handling gasoline and kerosene?
0 ____ No
1 ____ Yes
If yes, how many years you have been doing this? ______ (years)
Have you been constantly handling insecticides or pesticides?
0 ____ No
1 ____ Yes
If yes, how many years you have been doing this? ______ (years)
Do you use whitening soap (for lightening the skin)?
0 ____ No
1 ____ Yes
How is your current financial situation?
0 ____ (OK)
1 ____ (medium)
2 ____ (bad)
How is your current social life? (friends, family, hobby activities, etc.)
0 ____ (OK)
1 ____ (medium)
2 ____ (bad)
Health Problems not related to mercury
Date of interview:..................................................................
Name of the interviewer for this section:..........................................................................
Code of the interviewer ___________________
(please give every interviewer a code, like A,B,C)
Are you healthy now?
0 ____ Yes
1 ____ No
Why not? ___________________________________________________________
Do you have fever at the moment?
0 ____ No
1 ____ Yes
Did you loose weight within the last year?
0 ____ No
1 ____ Yes
Did you cough within the last year for more then for 3 month?
0 ____ No
1 ____ Yes
Have you ever had malaria?
0 ____ No
1 ____ Yes
If yes, how many time ago you had your last malaria? _______ (days or weeks or
months or years)
Have you ever had sleeping sickness? (for Africa)
0 ____ No
1 ____ Yes
Have you ever had any other major infectious disease?
0 ____ No
1 ____ Yes
Which disease (problem)? ______________________________________________________
Have you ever had kidney disease except urinary tract infection?
0 ____ No
1 ____ Yes
Which disease (problem)? ______________________________________________________
Which disease (problem)? ______________________________________________________
Have you ever had hepatitis or any other hepatic disorder?
0 ____ No
1 ____ Yes
Which disease (problem)? ______________________________________________________
Have you ever had severe respiratory problems (asthma, pneumonia)?
0 ____ No
1 ____ Yes
Which disease (problem)? ______________________________________________________
Did you ever have tuberculosis?
0 ____ No
1 ____ Yes
When did this happen ? _______________ (days or weeks or months or years) ago
Have you ever had any neurological disorders (epilepsy, stroke, Parkinson etc.) or
mental disorders?
0 ____ No
1 ____ Yes
Which disease (problem)? _____________________________________________________
Did you have any serious accidents (did you have to go to hospital)?
0 ____ No
1 ____ Yes, but not severe (less then 1 hour unconsciousness)
2 ___ Yes, and it was severe (more then 1 hour unconsciousness)
When did this happen ? _______________ (days or weeks or months or years) ago
Exclusion criteria from statistical evaluation
Severe neurological disease such as Parkinson, stroke or severe accident (brain injury),
birth trauma, tetanus, polio, diabetes, hyperthyroidism or any acute severe disease, etc...
To be filled in by project doctor.
0 ____ No
1 ____ Yes
Why this individual should be excluded from the assessment:
______________________________________________________________________________
______________________________________________________________________________
Health Questions related to mercury exposure
Date of interview:...................................................................
Name of the interviewer for this section:........................................................................
Code of the interviewer ___________
(please give every interviewer a code, like A,B,C)
Has the actual or former health problem worsened since exposure to mercury occurred?
0 _____ No mercury exposure
1 _____ Mercury exposure, but no worsening effects
2 ____ Yes, mercury exposure and worsening
How is your appetite?
0 ____ (OK)
1 ____ (medium)
2 ____ (bad)
Did you loose hair within the last year?
0 ____ No or only rarely
1 ____ Yes, slight to moderate
2 ____ Yes, marked to sever
Sleep disturbances
How do you feel after a usual night of sleep?
0 ____ (OK)
1 ____ (medium)
2 ____ (bad)
Do you feel a kind of a metallic taste?
0 ____ Never
1 ____ at least once a month
2 ____ at least once a week
3 ____ at least once a day
Do you suffer from excessive salivation?
0 ____ Never
1 ____ at least once a month
2 ____ at least once a week
3 ____ at least once a day
Have you had any problems with tremor (shaking)?
(Clinical Tremor Rating Scale)
0 ____ I have no tremor or tremor does not interfere with my job
1 ____ I am able to work, but I need to be more careful than the average person
2 ____ I am able to do everything, but with errors; poorer than usual performance because
of tremor
3 ____ I am unable to do a regular job, I may have changed to a different job due to
tremor; it limits some housework, such as ironing
4 ____ I am unable to do any outside job; housework very limited
Fatigue
Score to estimate the state of fatigue (Wessely S, Powell R: Fatigue syndrome)
Have you got tired easily?
0 ____ Same as usual
1 ____ Worse then usual
2 ____ Much worse than usual
Do you need to rest more?
0 ____ Same as usual
1 ____ Worse then usual
2 ____ Much worse than usual
Do you feel sleepy or drowsy?
0 ____ Same as usual
1 ____ Worse then usual
2 ____ Much worse than usual
Can you no longer start anything?
0 ____ Same as usual
1 ____ Worse then usual
2 ____ Much worse than usual
Do you always lack energy?
0 ____ Same as usual
1 ____ Worse then usual
2 ____ Much worse than usual
Do you have less strength in your muscles?
0 ____ Same as usual
1 ____ Worse then usual
2 ____ Much worse than usual
Do you feel weak?
0 ____ Same as usual
1 ____ Worse then usual
2 ____ Much worse than usual
Can you start things without difficulties, but get weak as you go on?
0 ____ Same as usual
1 ____ Worse then usual
2 ____ Much worse than usual
Physical fatigue sum: ___________ score sum (0 to 0)
Do you have problems concentrating?
0 ____ Same as usual
1 ____ Worse then usual
2 ____ Much worse than usual
Do you have problems thinking clearly?
0 ____ Same as usual
1 ____ Worse then usual
2 ____ Much worse than usual
Do you have problems to find correct words when you speak?
0 ____ Same as usual
1 ____ Worse then usual
2 ____ Much worse than usual
Do you have problems with eyestrain?
0 ____ Same as usual
1 ____ Worse then usual
2 ____ Much worse than usual
Do you have problems with memory?
0 ____ Same as usual
1 ____ Worse then usual
2 ____ Much worse than usual
Mental fatigue sum: ____________ score sum (0 to 0)
Well being
Do you feel nervous?
0 ____ Never
1 ____ at least once a month
2 ____ at least once a week
3 ____ at least once a day
Do you feel sad?
0 ____ Never
1 ____ at least once a month
2 ____ at least once a week
3 ____ at least once a day
Do you have palpitations?
Feeling the heart beating
0 ____ Never
1 ____ at least once a month
2 ____ at least once a week
3 ____ at least once a day
Do you have a headache?
0 ____ Never
1 ____ at least once a month
2 ____ at least once a week
3 ____ at least once a day
Do you have nausea?
0 ____ Never
1 ____ at least once a month
2 ____ at least once a week
3 ____ at least once a day
Do you feel numbness, prickling, aching at any location of your body?
Mainly perioral dysesthesia and sensory impairment of the glove and-stocking type
0 ____ Never
1 ____ at least once a month
2 ____ at least once a week
3 ____ at least once a day
Clinical neurological examination
Date of neurological examination:......................................................................
Name of the neurological examiner:.......................................................................
Code of the examiner ___________
(please give every examiner a code, like N,O,P)
Mouth and Teeth Conditions
Clinical signs of stomatitis
0 ____ No
1 ____ Yes
Clinical signs of gingivitis
0 ____ No
1 ____ Yes
Bluish discoloration of the gums
0 ____ No
1 ____ Slight
2 ____ Yes, obvious
How many teeth with dental fillings (Amalgam)?
0 ____ None
(n) ___ One or more how many _______
Examination of the eyes:
0 _____ No changes
1 _____ Bluish colored iris ring
2 _____ Kayser-Fleischer ring
Walking
Person is asked to walk up and down, first with eyes open, then with eyes closed.
Ataxia of gait (walking)
Examiner is watching for signs of ataxia (Klockgether Score p 435)
0 ___ Absent
1 ___ Slight (ataxia only visible when walking on tandem or without visual feedback)
2 ___ Moderate (ataxia visible in normal walking; difficulties, when walking on tandem)
3 ___ Marked (broad-based, staggering gait; unable to walk on tandem)
4 ___ Severe (unable to walk without support; wheelchair bound)
5 ___ Most severe (bedridden)
Rigidity of gait (walking)
Examiner is watching the gait, the swing of the arms, general posture and rates
0 ____ Normal
1 ____ Mild diminution in swing while the patient is walking
2 ____ Obvious diminution in swing suggesting shoulder rigidity
3 ____ Stiff gait with little or no arm swinging noticeable
4 ____ Rigid gait with arms slightly pronated; this would also include stopped-shuffling
gait with propulsion and retropulsion
Standing
Tremor - finger to nose test
Person is asked to stand still, legs together arms outstretched. Eyes closed. Finger tip
should touch the nose. Examiner is watching and rates the tremor (modified Clinical
Tremor Rating Scale)
0 ____ None
1 ____ Slight to moderate (amplitude < 0,5 cm 1cm); may be intermittent, may be
intermittent
2 ____ Marked amplitude (1-2 cm)
3 ____ Severe amplitude (> 2 cm)
Dysmetria - finger to nose test
Person is asked to stand still, legs together arms outstretched. Eyes closed. Finger tip
should touch the nose. Examiner is watching and rates the dysmetria
0 ____ Normal
1 ____ Moderate pathologic
2 ____ Severe pathologic
Dysdiadochokinesis
Person is asked to twist hands very quickly (alternating movements of the wrists
(Klockgether Score)
0 ____ Absent
1 ____ Slight (minimal slowness of alternating movements)
2 ____ Moderate (marked slowness of alternating movements)
3 ____ Severe (severe irregularity of alternating movements)
4 ____ Most severe (inability to perform alternating movements)
Tremor eye lid
Eyes closed. Examiner is watching and rates the tremor (Davao Pool score)
0 ____ None
1 ____ Slight
2 ____ Marked
Lying - Reflexes
Person is asked to lie on the examination bench.
Mentolabial reflex (Positive pyramidal sign)
0 ____ Negative
1 ____ Positive
Babinski reflex (Positive pyramidal signs)
0 ____ Negative
1 ____ Positive
Sucking reflex (Positive pyramidal signs)
0 ____ Negative
1 ____ Positive
Grasp reflex
0 ____ Negative
1 ____ Positive
PSR (quadrizeps reflex)
A No
reflex
B Hyporeflexia
C Normal
D Hyperreflexia
E Clonus
BSR (bizeps brachii reflex)
A No
reflex
B Hyporeflexia
C Normal
D Hyperreflexia
E Clonus
AR (Achilles reflex, ankle jerk)
A No
reflex
B Hyporeflexia
C Normal
D Hyperreflexia
E Clonus
Lying other tests
Intentional Tremor - heel-to-shin test
Person is asked to touch with his heel the knee of the other leg. Then to move with the
heel along the shin to the foot. Repeat and do it with both sides. Eyes first open, then
closed. Rate tremor during heel-to-shin test (Klockgether Score)
0 ____ Absent
1 ____ Slight (slight terminal tremor)
2 ____ Moderate (marked terminal tremor)
3 ____ Marked (kinetic tremor throughout intended movements)
4 ____ Severe (severe kinetic tremor heavily interfering with everyday life)
5 ____ Most severe (maximal form of kinetic tremor making intended movements
impossible)
Ataxia - heel-to-shin test
Rate ataxia (Klockgether Score)
0 ____ Absent
1 ____ Slight (slight hypermetria in heel-to-shin test)
2 ____ Moderate (hypermetria and slight ataxic performance of heel-to-shin test)
3 ____ Marked (marked swaying: unable to stand with feet together)
4 ____ Severe (pronounced ataxia in performing heel-to-shin test)
5 ____ Most severe (unable to perform heel-to-shin test)
Sensory disturbances
Sensory disturbances such as sensory impairment of the glove and-stocking type
0 ____ Absent
1 ____ Present
Comments____________________________________________________________________
______________________________________________________________________________
Bradykinesia
Rate your observation whether there was any sign of bradykinesia during the
examination (slower active movements, absent or altered synkinesia of upper
extremities during gait)
0 ____ Absent
1 ____ Present
Hypo-mimia
Rate your observation whether there you observed an hypo mimic expression of the
face during the examination)
0 ____ Absent
1 ____ Present
Specific Tests
Date of the specific test:................................................................................
Name of the tester:..........................................................................................
Code of the tester ___________
(please give every examiner a code, like N,O,P)
Memory Disturbances (Wechsler)
Forward digit span test (part of Wechsler Memory Scale)
Please repeat each column of numbers. Score longest series correctly repeated forward
Score
Test
4
6-4-3-9
4
7-2-8-6
3
4-2-7-3-1
3
7-5-8-3-6
2
6-1-9-4-7-3
2
3-9-2-4-8-7
1
5-9-1-7-4-2-3
1
4-1-7-9-3-8-6
0
5-8-1-9-2-6-4-7
0
3-8-2-9-5-1-7-4
Match Box Test (from MOT)
Put 20 matches on a table , half of each on one side of an open matchbox, approx. 15 cm
away. Take the time until all matches are put into the box. Use left and right hand
alternatively.
______ seconds
Finger Tapping Test (from MOT)
Sitting at a table. Elbows should be placed on the table. Try to do as many points as
possible on a piece of paper with a pencil. Count the amount of points within 10
seconds.
_______ points
Frostig Score
Draw a line from one symbol to the other. Do not interrupt while drawing. Do not
touch the lines.
Score: ______
Please connect with a pencil the symbols. Please try to stay within the lines. ??
F1
0-2
F2
0-2
F3
0-2
F4
0-1
F5
0-2
F6
0-2
Please connect the symbols with a straight line.
F7
F8
0-1
Memory Disturbances (new battery)
Orientation to time - season
0____ correct response
1____ incorrect response
Orientation to time- part of the day
0____ correct response
1____ incorrect response
Orientation to place name of the village
0____ correct response
1____ incorrect response
Orientation to place name of the country
0____ correct response
1____ incorrect response
Episodic memory (registration of 3 words): example: fish, ball, tree
0 ____ Registered all 3
1 ____ Registered jus t 2
2 ____ Registered just 1
3 ____ Registered none
Visual field test
Result _____________________
Objective tremor assessment
Result _________________________
Specimens
Date of the specimen.........................................................................................
Time of the specimen sampling.....................................................................
Name of the specimen taker:...................................................................
Code ___________
Blood (EDTA-blood 10 ml)
____ Yes
____ No
Urine (spontaneous urine sample 10 ml)
____ Yes
____ No
Proteinuria
0 ____ negative
1 ____ positive ____ score
Urine total mercury (field test) (additional)
____ Result ____ unit
Hair
____ Yes, sample collected
____ No
Others (breast milk)
____ Yes, sample collected
____ No sample
Laboratory Analysis Results
Material/test
Result Unit
Blood
Total mercury
______ µg/l
Methyl-mercury
______ µg/l
Selenium
______ µg/l
Urine
Total mercury
______ µg/l
Total mercury / g crea
______ µg / g crea
Methyl mercury
______ µg/l
Methyl mercury / g crea
______ µg/ g crea
Hair
Total mercury
______ µg / g
Methyl mercury
______ µg / g
Others (breast milk)
Total mercury
______ µg/l
Comments:
____________________________________________________________________________
____________________________________________________________________________
____________________________________________________________________________
____________________________________________________________________________
____________________________________________________________________________
____________________________________________________________________________
Medical Score Sum
Test Score
Points
Results
Anamnestic data
Metallic taste (see 0)
0/1
Excessive salivation (see 0)
0/1
Tremor at work (see 0)
0/1
Sleeping problems at night (see 0)
0/1
Health problems worsened since Hg exposed
0/1
(see 0)
Clinical data
Bluish coloration of gingiva (see 0)
0/1
Ataxia of gait (see 0)
0/1
Finger to nose trem (see 0)or
0/1
Dysdiadochokinesis (see 0)
0/1
Heel to knee ataxia (see 0)
0/1
Heel to knee tremor (see 0)
0/1
Mento labial reflex (see 0)
0/1
Proteinuria (see 0) 1 0/1
Neuropsychological tests
Memory test (see 0) 2 0/1/2
Matchbox test (see 0) 3 0/1/2
Frostig test (see 0) 4 0/1/2
Tapping test (see 0) 5 0/1/2
Maximum 21
Medical score sum _____________
1 Proteinuria 1 = more then trace, 0 = 0 or
2 Memory test: 2 = score 0, 1 = score 1-2, 0 = score 3-4
3 Matchbox test: 2 = 21 seconds or more, 1 = 16-20 seconds, 0 = 0-15 seconds
4 Frostig test: 2 = 0-9 correct answers, 1 = 10-12 correct answers, 0 = 13-16 correct answers
5 Tapping test: 2 = 0-53 dots, 1= 54-64 dots, 0 = 65 or more dots
Decision for the diagnosis of a "chronic mercury intoxication"
Threshold limits for mercury
Table 9 - Toxicologically established threshold limits for mercury in blood, urine and
hair (HBM = Human Bio-Monitoring; BAT = Biologischer Arbeitsstoff-Toleranzwert;
BEI = Biological Exposure Indices)
Hg-blood
Hg-urine
Hg-urine
Hg-hair
(µg/l)
(µg/l)
(µg/g crea)
(µg/g)
HBM I
5
7
5
HBM II
15
25
20
5 (in analogy)
WHO
50
7
BAT for metallic and
25 100
inorganic Hg
BAT for organic Hg
100
BEI (Biological
15
35
exposure index)
(after working)
(before working)
Decision for the diagnosis of a "chronic mercury intoxication"
Table 10 - Decision for the diagnosis "chronic mercury intoxication" Intoxication
Medical Score Sum
0 4
5 9
10 - 19
Hg in all biomonitors
< HBM I
> HBM I
+
Hg at least in one biomonitor
> HBM II
+
+
>
BAT
+ + +
________ no
________ yes
Appendix 3
Pictures
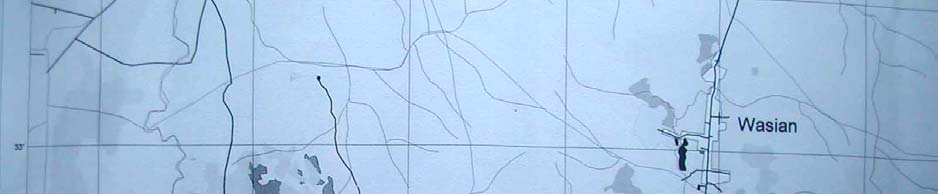
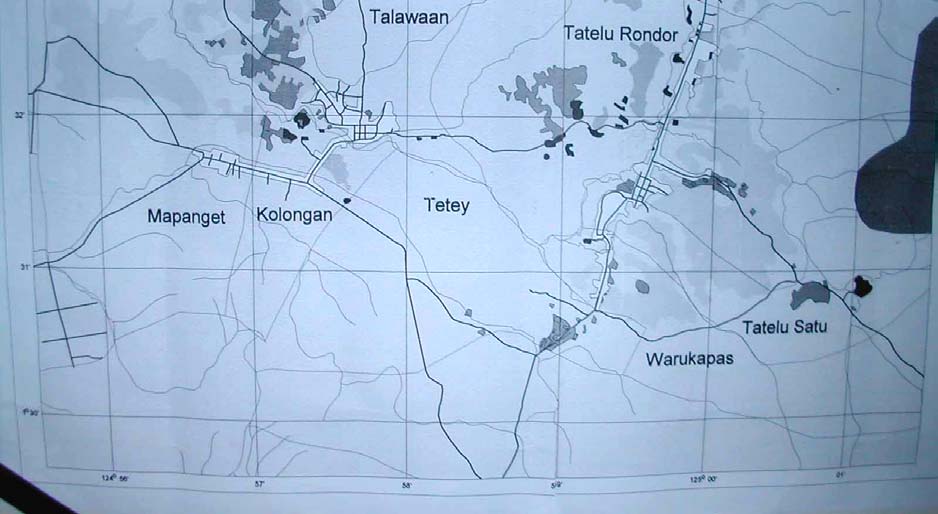
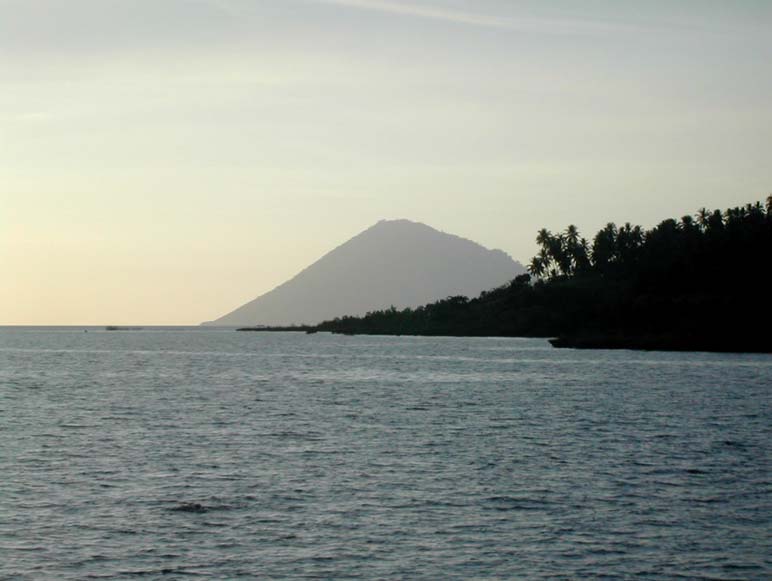
Map of Tatelu area
Manado Bay

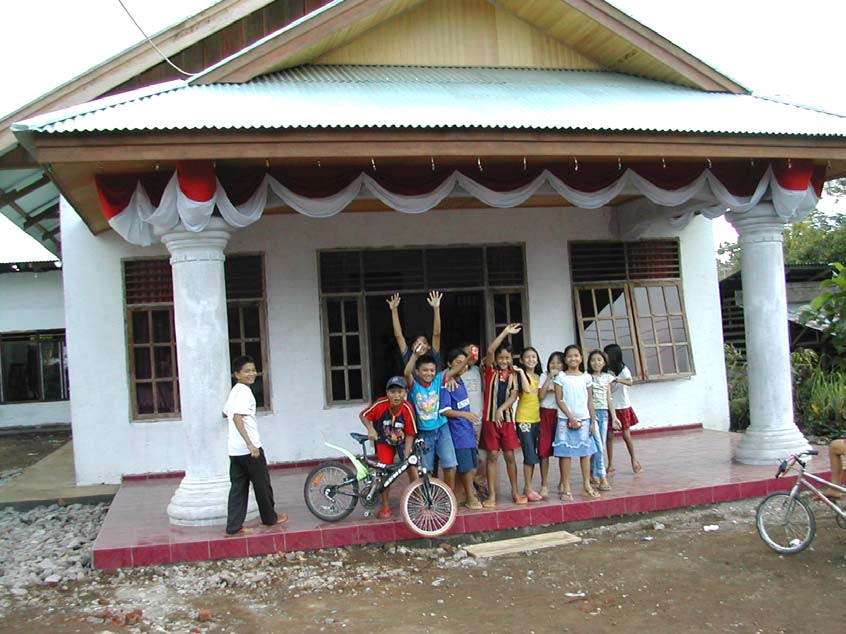
Manado Bay
Village centre in Tatelu, where the health assessment was performed
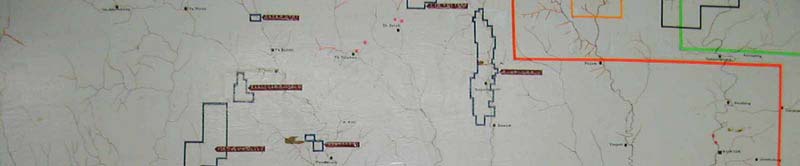
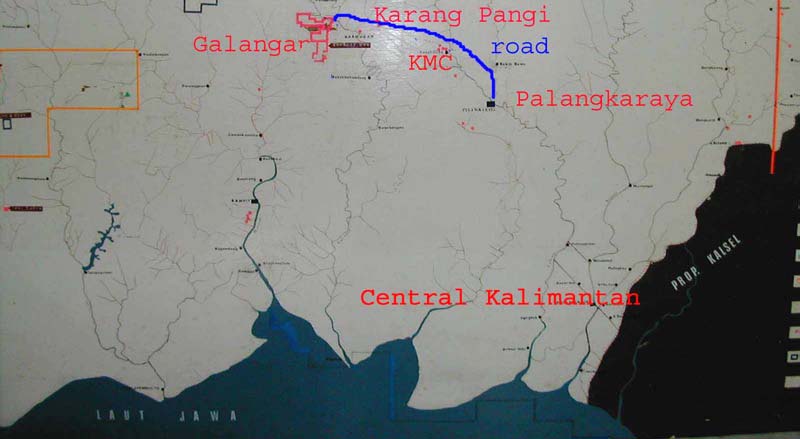
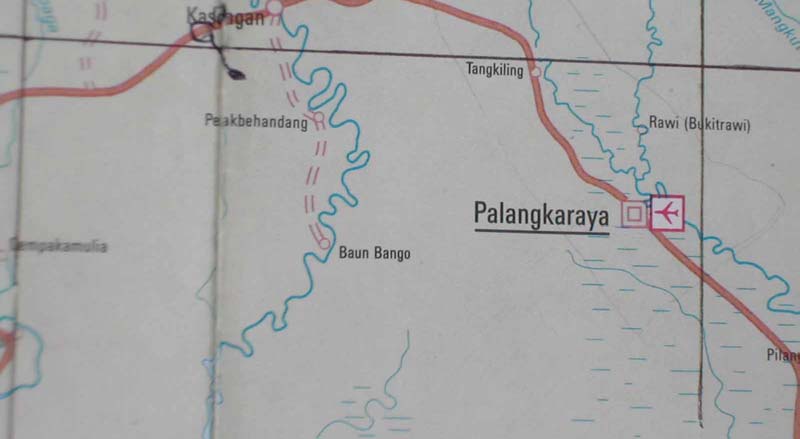
Map of Central Kalimantan, KMC = Tangkiling, no mining area upstream is recorded.
Tangkiling is situated on a different river system to Galangan area
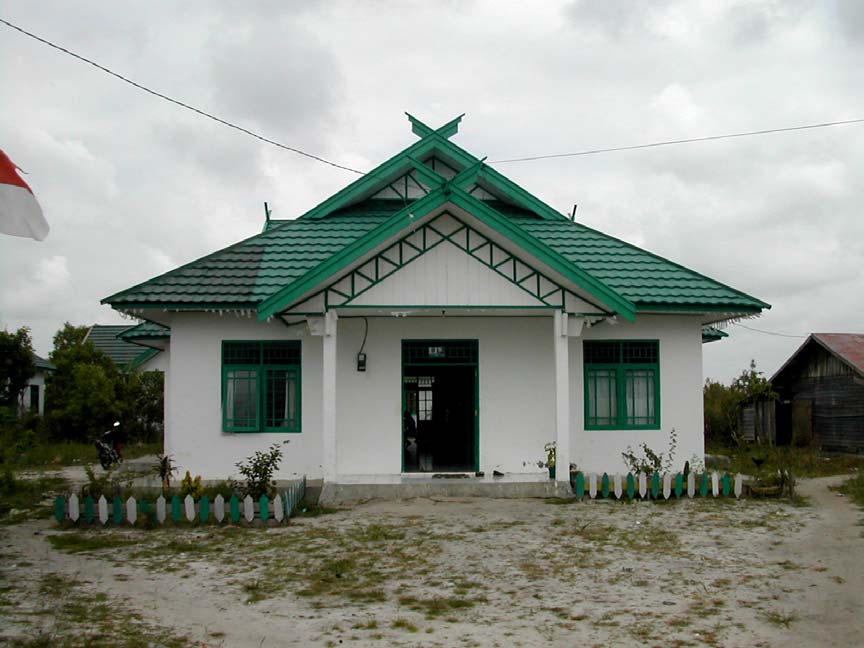
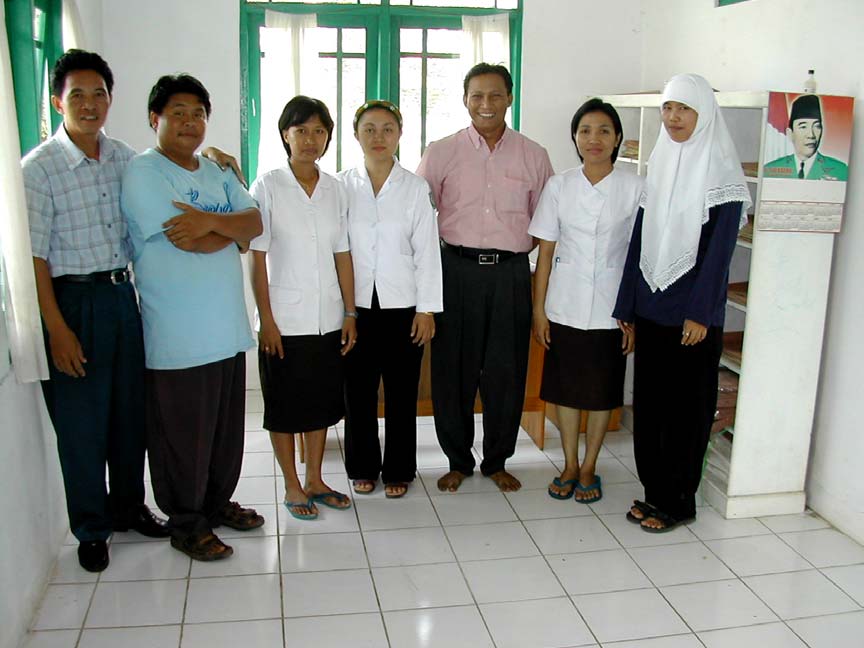
Local health centre in Kereng Pangi
Local health team members in Kereng Pangi
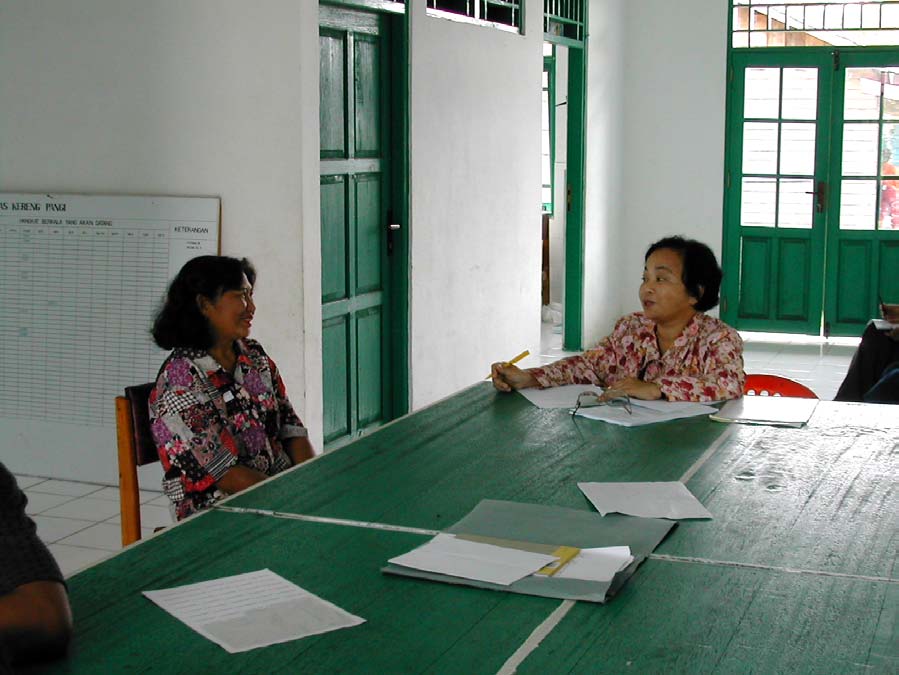
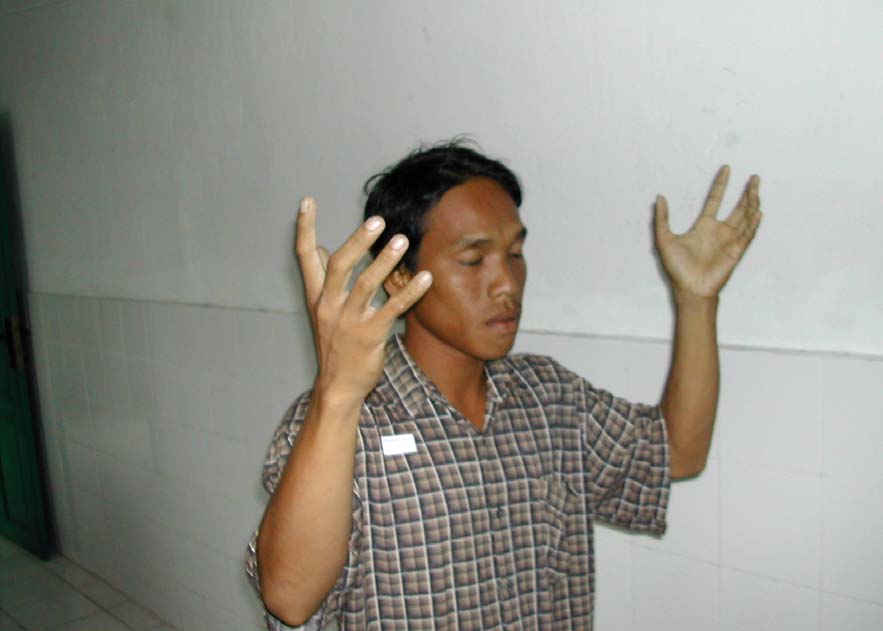
Performing the questionnaire
Performing the test for dysdiadochokinesia
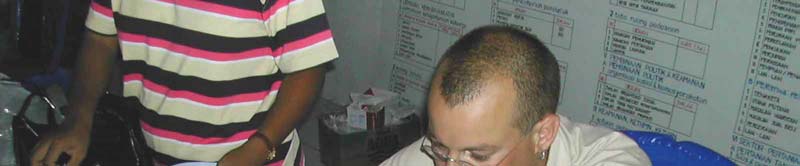
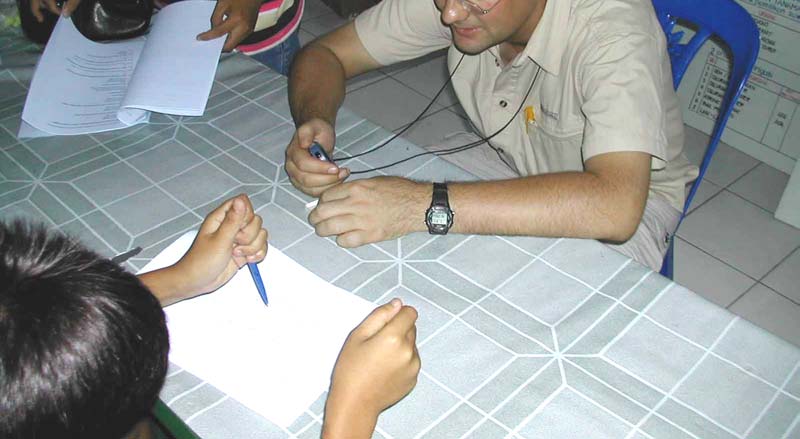
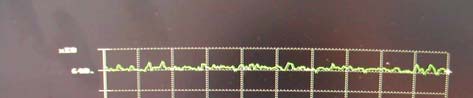
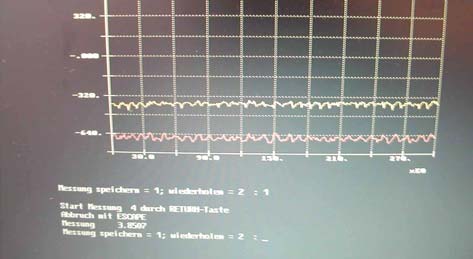
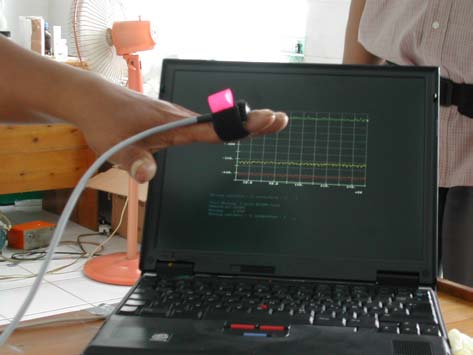
Pencil tapping test
Tremor-meter
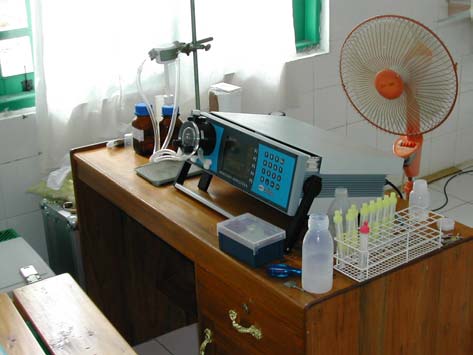
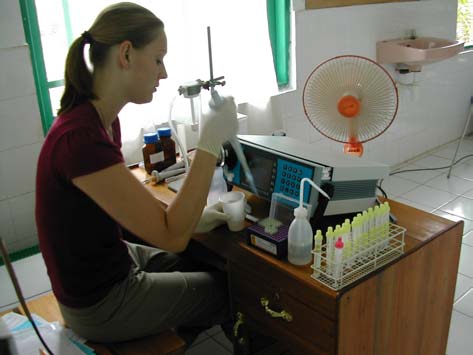
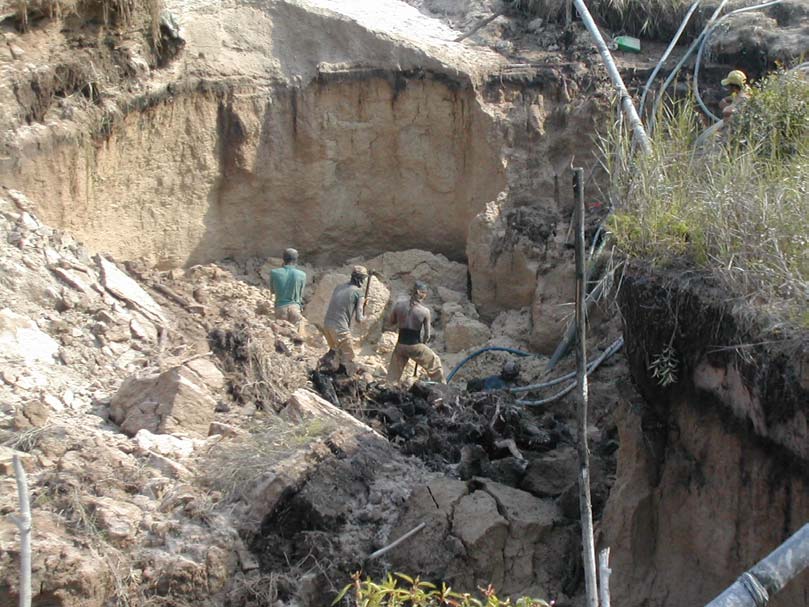
Mobile mercury analyzer
Open pit mining in Galangan (Kalimantan) Sulawesi Manado Bay
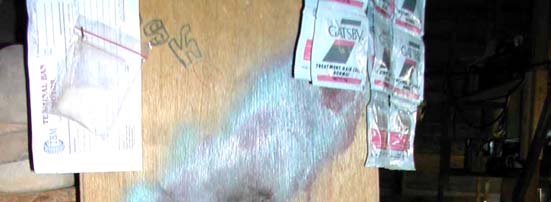
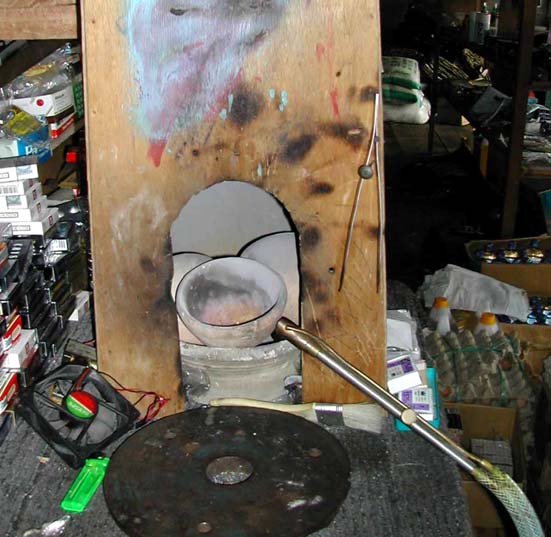
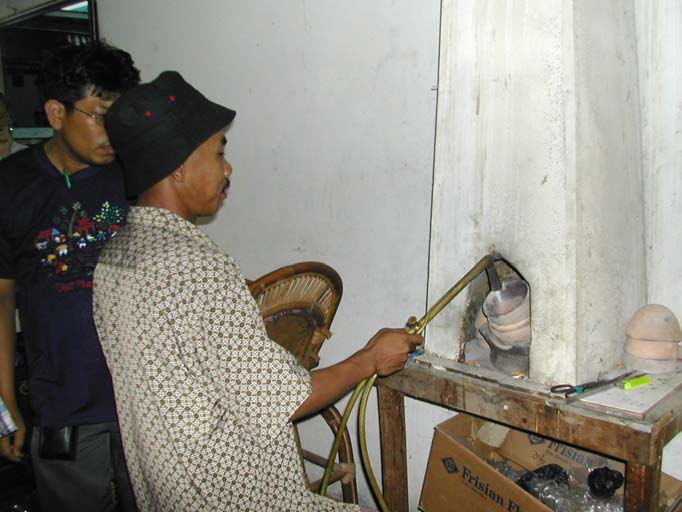
Amalgam smelting place in a small shop in the Galangan area (Kalimantan)
Amalgam smelting in Kereng Pangi in a gold shop (Toko Mas)
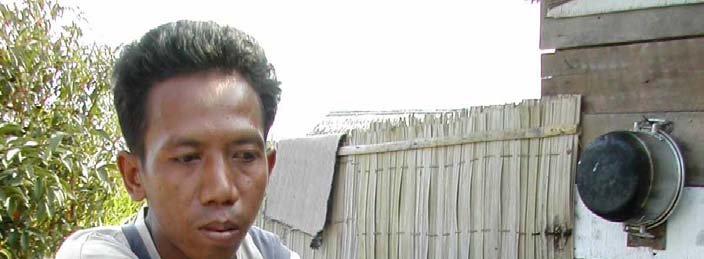
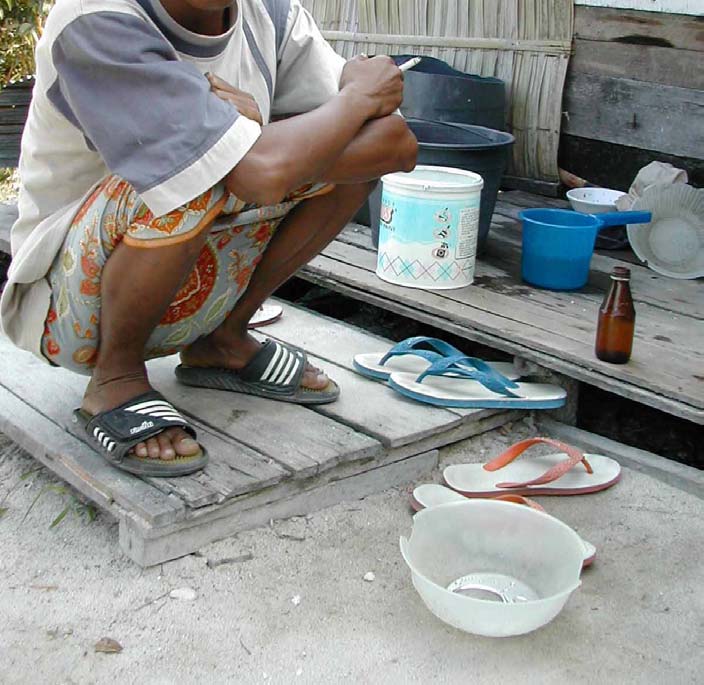
Miner in Galangan with a pot of liquid mercury

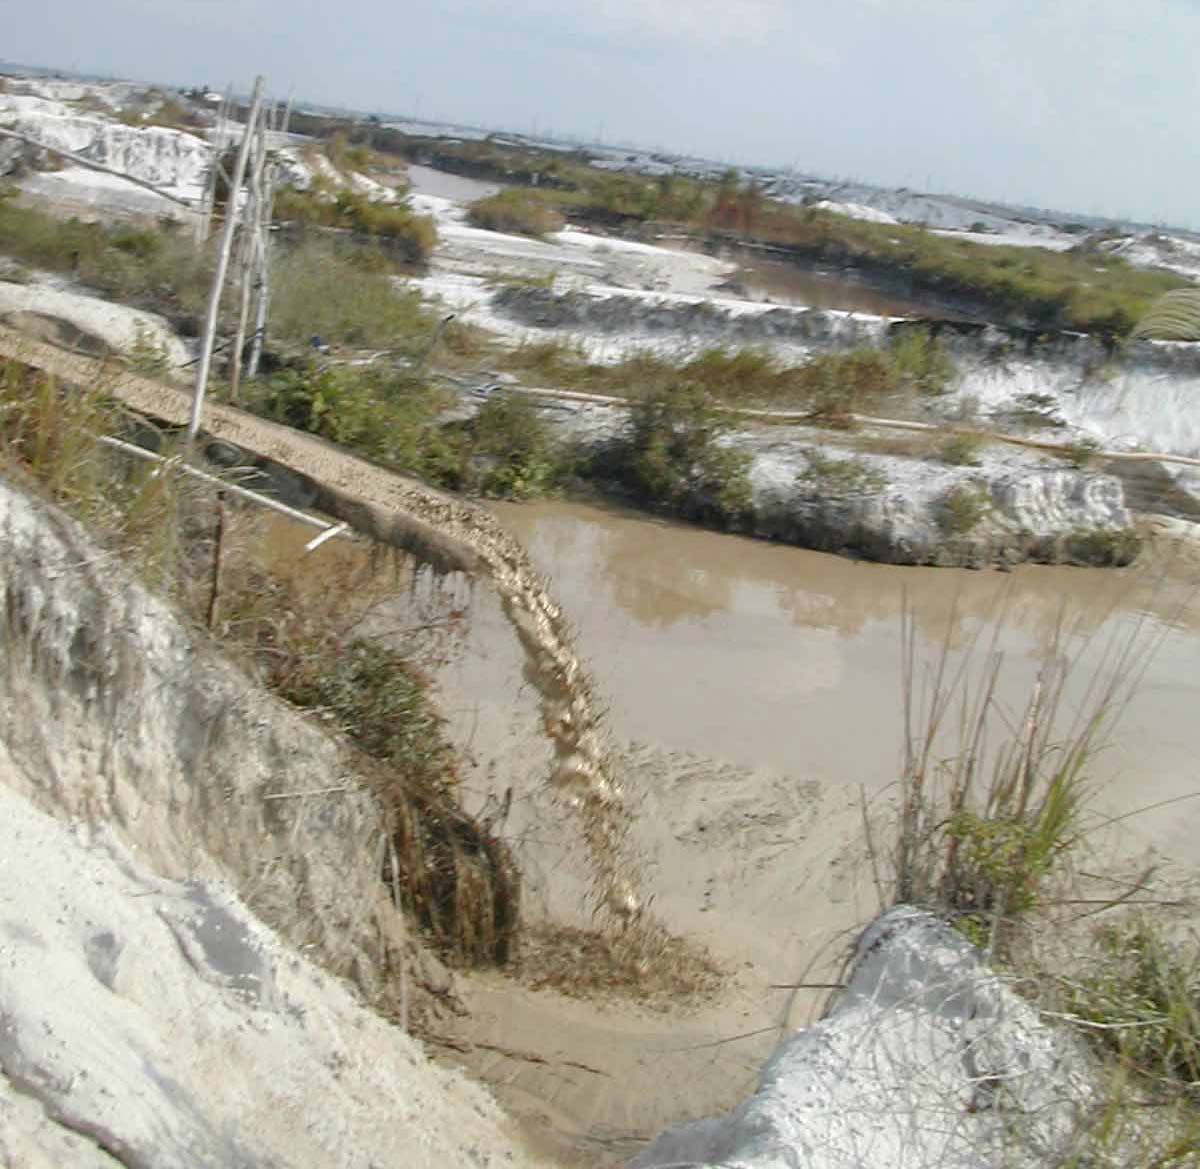
Sluice box in Galangan
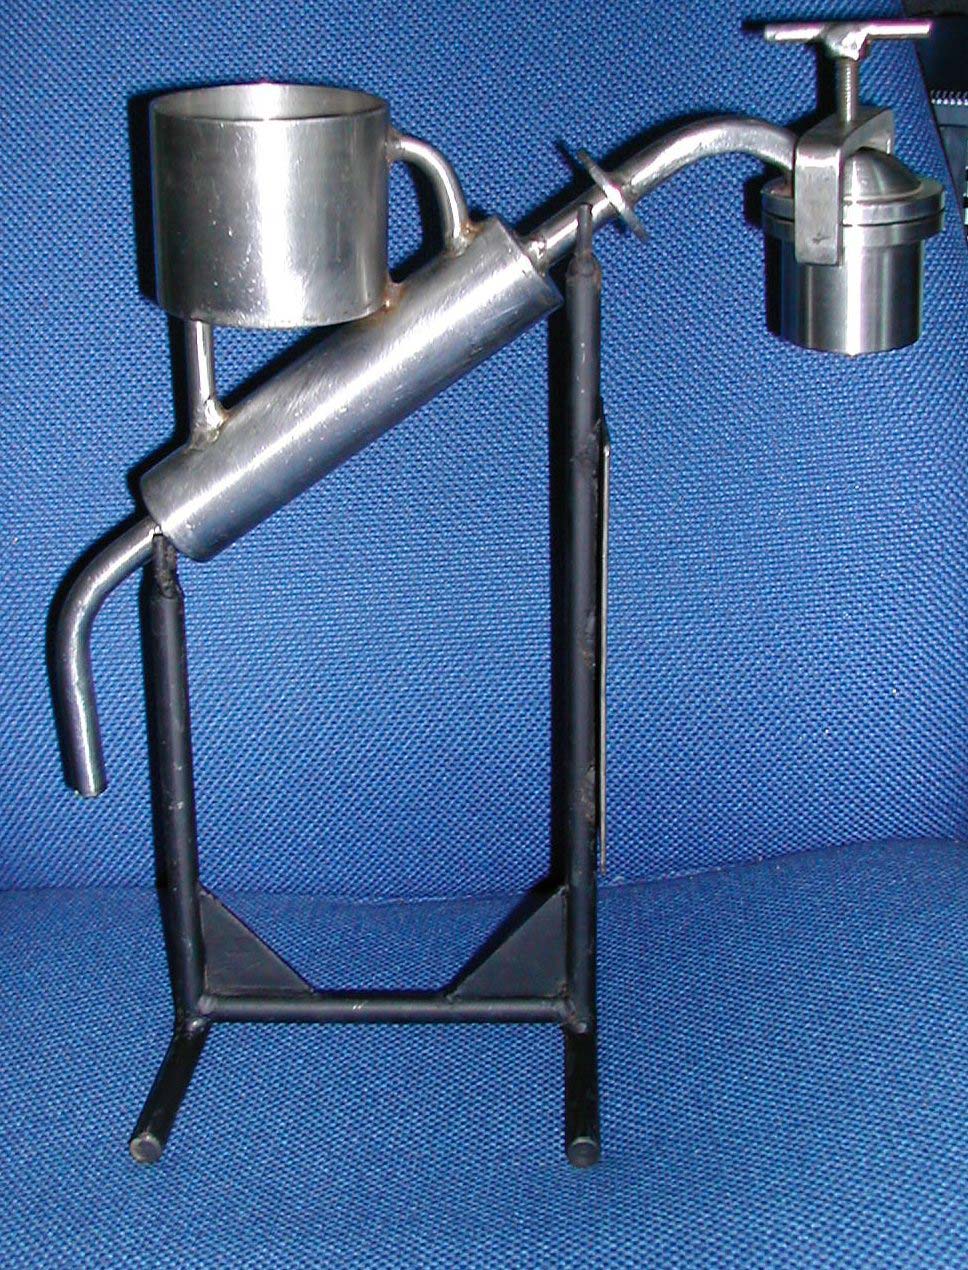
Retort from GTZ project
Appendix 4
Hg concentrations in sediments,
tailings and soils
KALIMANTAN AND SULAWESI
KALIMANTAN
Ref Hg -200# Hg 200# Hg Total
AreaSample Intervalo Lab
Coor. S
Coord. E
Type
ppm
ppm
ppm
A1 A101
K67 4.12 5.31
01 58 56.32 S 113 17 09.1 E sediment
A1 A102
K68 1.55 1.55
01 58 56.32 S 113 17 09.1 E sediment
A1 A103
K72 2.22 0.43
01 58 56.32 S 113 17 11.1 E sediment
A1 A104
K73 14.00 3.54
01 58 56.32 S 113 17 11.1 E
tailing
A1 A105
K77 2.10 1.63
01 58 34.7 S
113 17 01.8 E sediment
A1 A106
K79 5.67 2.26
01 58 34.7 S
113 17 01.8 E
tailing
A1 A107
K81 9.78 11.10
01 58 34.7 S
113 17 01.8 E
tailing
A1 A108
K83 1.02 1.32
01 58 34.7 S
113 17 01.8 E sediment
A1 A109
K86 2.02 4.56
01 58 34.7 S
113 17 01.8 E sediment
A1 A110
K87 1.39 1.70
01 58 34.7 S
113 17 01.8 E sediment
A1 A111
K 47
0.6
0.10
01 58 43.7 S
113 17 51.3 E sediment
A1 A112
K50 1.03 0.80
01 58 43.7 S
113 17 51.3 E sediment
A1 A113
K66 0.94 0.78
01 58 56.32 S 113 17 09.1 E sediment
A1 A114
K74 0.53 0.47
01 58 56.32 S 113 17 11.1 E sediment
A1 A115
K84 0.77 0.29
01 58 34.7 S
113 17 01.8 E sediment
A1 A116
K88 0.89 1.76
01 58 34.7 S
113 17 01.8 E sediment
A1 A117
K20 2.17 1.86
01 58 56 S
113 17 08.2 E sediment
A1 A118
K27 1.09 0.83
01 58 56 S
113 17 08.2 E sediment
A1 A119
K28 1.23 0.80
01 58 56 S
113 17 08.2 E sediment
A1 A120
K32 2.80 2.75
01 58 56 S
113 17 08.2 E sediment
A1 A121
K52 9.34 2.41
01 58 56 S
113 17 08.2 E
tailing
A1 A122
K18 1.23 1.24
01 58 56 S
113 17 08.2 E sediment
A1 A123
K19 0.77 0.77
01 58 56 S
113 17 08.2 E sediment
A1 A124
K21 1.00 0.41
01 58 56 S
113 17 08.2 E sediment
A1 A125
K23 0.08 0.19
01 58 56 S
113 17 08.2 E sediment
A1 A126
K29 0.79 0.95
01 58 56 S
113 17 08.2 E sediment
A1 A127
K30 0.68 0.31
01 58 56 S
113 17 08.2 E sediment
A1 A128
K57 0.11 30.00
01 58 56 S
113 17 08.2 E sediment
A1 A129
K51 39.70 19.30
01 58 56 S
113 17 08.2 E
tailing
A1 A130
K56 15.20 5.04
01 58 56 S
113 17 08.2 E
tailing
A1 A131
K1 0.60 0.64
01 59 16.4 S
113 17 09.1 E sediment
A1 A132
K2 0.31 0.24
01 59 16.4 S
113 17 09.1 E sediment
A1 A133
K3 0.51 0.70
01 59 16.4 S
113 17 09.1 E sediment
A1 A134
K4 0.94 1.12
01 59 16.4 S
113 17 09.1 E sediment
A1 A135
K6 0.78 0.78
01 59 16.4 S
113 17 09.1 E sediment
A1 A136
K9 1.05 1.72
01 59 16.4 S
113 17 09.1 E sediment
A1 A137
K13 0.68 0.34
01 59 16.4 S
113 17 09.1 E sediment
A1 A138
K15 0.48 0.73
01 59 16.4 S
113 17 09.1 E sediment
A1 A139
K16 0.75 0.22
01 59 16.4 S
113 17 09.1 E sediment
A1 A140
K17 0.44 0.18
01 59 16.4 S
113 17 09.1 E sediment
A1 A141
K8 1.27 1.80
01 59 16.4 S
113 17 09.1 E sediment
A1 A142
K11 1.15 1.17
01 59 16.4 S
113 17 09.1 E sediment
A1 A143
K12 1.24 1.58
01 59 16.4 S
113 17 09.1 E sediment
A1 A144
K65 0.90 0.63
01 58 56.32 S 113 17 09.1 E sediment
A1 A145
K61 1.90 0.51
01 58 56 S
113 17 08.2 E sediment
A1 A146
K62 0.18 26.00
01 58 56 S
113 17 08.2 E sediment
A1 A147
K7 1.04 0.33
01 59 16.4 S
113 17 09.1 E
soil
A1 A148
K10 2.71 1.01
01 59 16.4 S
113 17 09.1E
soil
A1 A149
K24 0.58 1.24
01 58 56.0 S
113 17 08.2 E
soil
A1 A150
K26 0.41 0.25
01 58 56.0 S
113 17 08.2 E
soil
Ref Hg -200# Hg 200# Hg Total
AreaSample Intervalo Lab
Coor. S
Coord. E
Type
ppm
ppm
ppm
A1 A151
K31 1.03 0.48
01 58 56.0 S
113 17 08.2 E
soil
A1 A152
K33 0.78 0.61
01 58 56.0 S
113 17 08.2 E
soil
A1 A153
K35 2.35 1.08
01 58 56.0 S
113 17 08.2 E
soil
A1 A154
K36 2.23 0.58
01 58 56.0 S
113 17 08.2 E
soil
A1 A155
K46 0.77 0.45
01 58 56.0 S
113 17 08.2 E
soil
A1 A156
K47 0.62 0.10
01 58 56.0 S
113 17 08.2 E
soil
A1 A157
K48 1.29 0.72
01 58 56.0 S
113 17 08.2 E
soil
A1 A158
K49 1.59 0.54
01 58 56.0 S
113 17 08.2 E
soil
A1 A159
K50 1.03 0.28
01 58 56.0 S
113 17 08.2 E
soil
A1 A160
K94 2.01 2.15
01 58 56.0 S
113 17 08.2 E
soil
A1 A161
K120 1.37
1.22
01 58 56.0 S
113 17 08.2 E
soil
A1 A162
K121 1.14
1.06
01 58 56.0 S
113 17 08.2 E
soil
A1 A163
K82 2.96 4.86
01 55 36.2 S
113 23 02.3 E sediment
A1 A164
K25 0.59 0.14
01 58 43.7 S
113 17 51.3 E
tailing
A1 A165
K37 1.28 0.46
01 58 56.0
113 17 08.2 E
tailing
A1 A166
K38 0.24 0.09
01 58 24.0 S
113 17 01.9 E
tailing
A1 A167
K39 0.55 0.45
01 58 24.0 S
113 17 01.9 E
tailing
A1 A168
K40 0.80 0.59
01 58 24.0 S
113 17 01.9 E
tailing
A1 A169
K41 1.39 0.82
01 58 24.0 S
113 17 01.9 E
tailing
A1 A170
K42 0.42 0.14
01 58 24.0 S
113 17 01.9 E
tailing
A1 A171
K43 0.90 0.43
01 58 24.0 S
113 17 01.9 E
tailing
A1 A172
K44 0.42 0.19
01 58 24.0 S
113 17 01.9 E
tailing
A2 A201
0 - 3 cm
KI1
0.05
0.09
01 55 31.2 S
113 22 02 E
sediment
A2 A201
3 - 6 cm
KI3
0.28
0.22
01 55 31.2 S
113 22 02 E
sediment
A2 A201 6 - 14 cm KI4
0.08
0.08
01 55 31.2 S
113 22 02 E
sediment
A2 A201 14 - 16 cm KI5 0.21 0.06
01 55 31.2 S
113 22 02 E
sediment
A2 A201 16 - 23 cm KI6 0.83 0.23
01 55 31.2 S
113 22 02 E
sediment
A2 A201 23 - 27 cm KI7
1.04
0.33
0.13
01 55 31.2 S
113 22 02 E
sediment
A2 A201 27 - 30 cm KI8 0.14 0.45
01 55 31.2 S
113 22 02 E
sediment
A2 A201 30 - 34 cm KI9
0.09
0.09
0.09
01 55 31.2 S
113 22 02 E
sediment
A2 A201 34 - 37 cm KI10 0.30 0.10
01 55 31.2 S
113 22 02 E
sediment
A2 A201 37 - 43 cm KI11 0.57 0.62
01 55 31.2 S
113 22 02 E
sediment
A2 A201 43 - 49 cm KI12 0.12 0.05
01 55 31.2 S
113 22 02 E
sediment
A2 A201 49 - 58 cm KI13 0.86 0.20
01 55 31.2 S
113 22 02 E
sediment
A2 A201 58 - 66 cm KI14 1.21 0.16
01 55 31.2 S
113 22 02 E
sediment
A2 A201 66 - 74 cm KI15
0.09
0.09
0.09
01 55 31.2 S
113 22 02 E
sediment
A2 A201 74 - 76 cm KI16
0.09
0.09
0.09
01 55 31.2 S
113 22 02 E
sediment
A2 A201 76 - 81 cm KI17 0.05 0.07
01 55 31.2 S
113 22 02 E
sediment
A2 A201 81 - 87 cm KI18
0.03
0.03
0.038
01 55 31.2 S
113 22 02 E
sediment
A2 A201 94 - 96 cm KI20 0.43 0.20
01 55 31.2 S
113 22 02 E
sediment
96 - 104
A2 A201
KI21 0.88 0.88
01 55 31.2 S
113 22 02 E
sediment
cm
104 - 107
A2 A201
KI22 0.16 0.07
01 55 31.2 S
113 22 02 E
sediment
cm
107 - 111
A2 A201
KI23 0.50 0.19
01 55 31.2 S
113 22 02 E
sediment
cm
A3 A301
0 - 2 cm K89
3.37
2.48
01 59 32.1 S
113 25 26.2 E sediment
A3 A301
2 - 4 cm K90
0.25
0.12
01 59 32.1 S
113 25 26.2 E sediment
A3 A301
4 - 6 cm K91
1.24
1.05
01 59 32.1 S
113 25 26.2 E sediment
A3 A301
6 - 8 cm K92
1.04
0.87
01 59 32.1 S
113 25 26.2 E sediment
A3 A301 8 - 10 cm K93
8.43
8.17
01 59 32.1 S
113 25 26.2 E sediment
A3 A302
K94 2.01 2.15
01 59 32.1 S
113 25 26.2 E
residue
Area
Ref Hg -200# Hg 200# Hg Total
Sample Intervalo Lab
Coor. S
Coord. E
Type
ppm
ppm
ppm
A4
A401
0 - 2 cm K114
0.84
0.46
02 01 42.6 S
113 24 44.1 E sediment
A4
A401
2 - 4 cm K115
2.24
1.61
02 00 28.3 S
113 24 23.8 E sediment
A4
A401
4 - 6 cm K116
5.53
8.79
02 00 28.3 S
113 24 23.8 E sediment
A4
A401
6 - 8 cm K117
0.82
0.60
02 00 28.3 S
113 24 23.8 E sediment
A4
A401 8 - 10 cm K118
1.32
1.40
02 00 28.3 S
113 24 23.8 E sediment
A4 A402 A402 K121 2.19
1.68
02 00 28.3 S
113 24 23.8 E sediment
A5
A501
0 - 2 cm K106
1.62
0.88
02 01 42.6 S
113 24 44.1 E sediment
A5
A501
2 - 4 cm K107
2.19
1.68
02 01 42.6 S
113 24 44.1 E sediment
A5
A501
4 - 6 cm K108
1.16
0.62
02 01 42.6 S
113 24 44.1 E sediment
A5
A501
6 - 8 cm K109
21.80
9.26
02 01 42.6 S
113 24 44.1 E sediment
A5
A501 8 - 10 cm K110
2.08
2.93
02 01 42.6 S
113 24 44.1 E sediment
A5
A501 10 - 12 cm K111 3.03
2.24
02 01 42.6 S
113 24 44.1 E sediment
A5
A501 12 - 14 cm K112 2.52
1.79
02 01 42.6 S
113 24 44.1 E sediment
A6
A601
0 - 3 cm K96
0.71
0.72
02 02 09.9 S
113 25 42.8 E sediment
A6
A601
3 - 6 cm K97
4.63
4.55
02 02 09.9 S
113 25 42.8 E sediment
A6
A601
6 - 9 cm K98
0.93
0.65
02 02 09.9 S
113 25 42.8 E sediment
A6
A601 9 - 12 cm K99
3.15
2.11
02 02 09.9 S
113 25 42.8 E sediment
A6
A601 12 - 15 cm K100 1.35
1.57
02 02 09.9 S
113 25 42.8 E sediment
A6
A601 15 - 18 cm K101 0.94
0.82
02 02 09.9 S
113 25 42.8 E sediment
A6
A601 18 - 21 cm K102 1.50
1.00
02 02 09.9 S
113 25 42.8 E sediment
A6
A601 21 - 24 cm K103 4.51
2.94
02 02 09.9 S
113 25 42.8 E sediment
A6
A601 24 - 27 cm K104 3.23
1.90
02 02 09.9 S
113 25 42.8 E sediment
SULAWESI
Sample Ref Hg -200# Hg 200#
Lab
(ppm)
(ppm)
Total
Coor. S
Coord. E
Type
A101
T5
73.50
39.10
01 30 53.9 S 125 00 48.8 E sediment
A102
T6
93.30
26.20
01 30 53.9 S 125 00 48.8 E sediment
A201
C17
89.20
44.2
01 31 50.3 S 124 58 48.0 E sediment
A202
C23
88.80
48.7
01 31 50.3 S 124 58 48.0 E sediment
A203
C26
88.80
58.0
01 31 50.3 S 124 58 48.0 E sediment
A204
C30
38.90
33.20
01 31 50.3 S 124 58 48.0 E sediment
A205
F1
271.20
308.70
01 31 51.5 S 124 58 52.1 E sediment
A206
F2
78.90
78.90
01 31 51.5 S 124 58 52.1 E sediment
A207
F3
195.40
170.50
01 31 51.5 S 124 58 52.1 E sediment
A208
F5
195.40
170.50
01 31 51.5 S 124 58 52.1 E sediment
A209
F6
103.40
74.3
01 31 51.5 S 124 58 52.1 E sediment
A210
F7
130.30
88.7
01 31 51.5 S 124 58 52.1 E sediment
A211
F10
65.10
74.0
01 31 51.5 S 124 58 52.1 E sediment
A212
F11
94.70
91.5
01 31 50.3 S 124 58 48.0 E sediment
A213
T13
182.70
94.5
01 31 50.3 S 124 58 48.0 E sediment
A214
T15
117.70
75.2
01 31 50.3 S 124 58 48.0 E sediment
A215
T23
110.60
5.39
01 31 50.3 S 124 58 48.0 E sediment
A216
Tat1
201.60
149.30
01 31 51.5 S 124 58 52.1 E sediment
A217
TaT2
486.70
621.10
01 31 51.5 S 124 58 52.1 E sediment
A218
Tat6
88.50
62.90
01 31 51.5 S 124 58 52.1 E sediment
A219
Tat7
60.90
43.70
01 31 51.5 S 124 58 52.1 E sediment
A220
TSF
38.80
16.50
01 31 51.5 S 124 58 52.1 E sediment
A221
TaT3
23.80
23.80
01 31 51.8 S 124 58 55.6 E sediment
A222
TaT4
13.30
13.30
01 31 51.8 S 125 58 55.6 E sediment
A223
TaT5
129.40
129.40
01 31 51.8 S 126 58 55.6 E sediment
A224
F29A
6.21
4.36
01 31 49.8 S
124 58 55 E sediment
A225
Gala-
10
10.1
5.21
01 31 51.2 S 124 58 53.2 E sediment
A226 Gala-8
10.30
2.94
01 32 05.8 S 124 55 48.3 E sediment
A227
TaT9
39.40
39.40
01 31 51.5 S 124 58 52.1 E sediment
A228
C1
113.3
113.3
01 32 00.9 S 124 59 44.2 E
tailing
A229
C2
190.9
208.8
01 32 00.9 S 124 59 44.2 E
tailing
A230
C9
121.7
95.3
01 32 00.9 S 124 59 44.2 E
tailing
A231
F4
863.9
863.9
01 31 51.2 S 124 58 53.2 E tailing
A232
F12
835.4
375.5
01 31 51.2 S 124 58 53.2 E tailing
A233
F13
1269.2
246.4
01 31 51.2 S 124 58 53.2 E tailing
A234
F14
160.5
26.4
01 31 51.2 S 124 58 53.2 E tailing
A235
F40
333.3
333.3
01 31 51.2 S 124 58 53.2 E tailing
A236
F41
593.4
550.6
01 31 51.2 S 124 58 53.2 E tailing
A237
F42
471.4
292.2
01 31 51.2 S 124 58 53.2 E tailing
A238
F43
437.9
426.2
01 31 51.2 S 124 58 53.2 E tailing
A239
F44
399
299.8
01 31 51.2 S 124 58 53.2 E tailing
A240
F45
317.6
147.6
01 31 51.2 S 124 58 53.2 E tailing
A241
F46
208.9
142.1
01 31 51.2 S 124 58 53.2 E tailing
A242
F47
65.3
23.8
01 31 51.8 S 124 58 55.6 E
tailing
A243
F48
134.6
102.2
01 31 51.8 S 124 58 55.6 E
tailing
A244
F49
275.9
354.9
01 31 51.8 S 124 58 55.6 E
tailing
A245
T3
139.5
98.7
01 31 51.2 S 124 58 53.2 E tailing
A246
T4
916.30
916.30
01 31 51.2 S 124 58 53.2 E tailing
A247
F16
12215.30
690.80
01 31 51.2 S 124 58 53.2 E
dust
Sample Ref Hg -200# Hg 200#
Lab
(ppm)
(ppm)
Total
Coor. S
Coord. E
Type
A248
F19
229.30
196.60
01 31 51.2 S 124 58 53.2 E
dust
A249
C8
17.6
9.8
01 31 55.9 S 124 59 01.9 E
soil
A250
C11
113.3
110.3
01 31 58.7 S 124 59 39.3 E
soil
A251
F15
698.6
876.9
01 31 58.7 S 124 59 39.3 E
soil
A252
F19b
229.3
196.6
01 31 58.7 S 124 59 39.3 E
soil
A253
F25
31.9
21.9
01 31 51.2 S 124 58 53.2 E
soil
A254
F26
10.5
8.2
01 31 49.8 S 124 58 55.0 E
soil
A255
F27
35.1
29.8
01 31 49.8 S 124 58 55.0 E
soil
A256
F28
10.3
8.3
01 31 49.8 S 124 58 55.0 E
soil
A257
F29
8.4
9.7
01 31 49.8 S 124 58 55.0 E
soil
A258
F30
14.1
12.0
01 31 52.5 S 124 58 58.4 E
soil
A259
F31
4.9
4.5
01 31 52.5 S 124 58 58.4 E
soil
A260
F33
2.6
2.1
01 31 52.5 S 124 58 58.4 E
soil
A261
F34
6.9
4.0
01 31 52.5 S 124 58 58.4 E
soil
A262
F35
8.1
5.5
01 31 52.5 S 124 58 58.4 E
soil
A263
F36
10.2
7.7
01 31 55.9 S 124 59 01.9 E
soil
A264
F37
10.7
9.1
01 31 55.9 S 124 59 01.9 E
soil
A265
F39
11.5
9.4
01 31 55.9 S 124 59 01.9 E
soil
A266
T16
2.00
01 31 18.7 S 125 00 30.1 E
water
A267
C12
2.10
01 32 00.9 S 124 59 44.2 E
plants
A268
C12
4.16
01 32 00.9 S 124 59 44.2 E
plants
A269
C13
5.76
01 32 00.9 S 124 59 44.2 E
plants
A270
C15
6.71
01 32 00.9 S 124 59 44.2 E
plants
A271
C16
1.03
01 32 00.9 S 124 59 44.2 E
plants
A272
C18
12.20
01 32 00.9 S 124 59 44.2 E
plants
A273
C19
21.60
01 32 00.9 S 124 59 44.2 E
plants
A274
C19
388.30
01 32 00.9 S 124 59 44.2 E
plants
A275
C21
4.93
01 32 00.9 S 124 59 44.2 E
plants
A276
T18
0.31
01 32 00.9 S 124 59 44.2 E
plants
A277
T20
0.20
01 32 00.9 S 124 59 44.2 E
plants
A278
T21
74.80
86.40
86.40
01 32 00.9 S 124 59 44.2 E
plants
A279
T22
34.20
01 32 00.9 S 124 59 44.2 E
plants
A280
T51
0.38
01 32 00.9 S 124 59 44.2 E
plants
A281
T52
0.26
01 32 00.9 S 124 59 44.2 E
plants
A301
T1
154.30
01 31 50.5 S 124 57 36.6 E sediment
A302
T2
256.70
89.70
01 31 50.5 S 124 57 36.6 E sediment
A303
T9
206.90
171.90
01 31 54.4
124 57 24.4 sediment
A304
T12
0.31
01 31 54.4 S 124 57 24.4 E
plants
A305
T12a
0.13
01 31 54.4 S 124 57 24.4 E
plants
A306
C7
7.50
01 32 05.8 S 124 55 48.4 E
plants
A307
C5
37.80
01 32 05.8 S 124 55 48.4 E
plants
A308
T10
8.57
01 31 54.4 S 124 57 24.4 E animal
A309
T11
2.13
01 31 54.4 S 124 57 24.4 E animal
A310
T19
2.24
01 31 54.4 S 124 57 24.4 E animal
A311
T30
0.08
01 31 54.4 S 124 57 24.4 E animal
A401
T7
60.60
41.40
01 33 29.2 S 124 56 14.9 E sediment
A402
T8
114.80
93.80
01 33 10.8 S 124 56 19.8 E sediment
A501
T41
5.85
3.96
01 36 05.4 S 124 52 50.2 E sediment
A502
T44
2.86
1.89
01 36 05.4 S 124 52 50.2 E sediment
A503
T45
2.63
3.97
01 36 05.4 S 124 52 50.2 E sediment
Sample Ref Hg -200# Hg 200#
Lab
(ppm)
(ppm)
Total
Coor. S
Coord. E
Type
A504
T47
3.55
5.67
01 36 05.4 S 124 52 50.2 E sediment
A505
T48
6.53
3.82
01 36 05.4 S 124 52 50.2 E sediment
A506
T38
3.8
2.1
01 36 05.4 S 124 52 50.2 E
soil
A507
T40
10.9
5.6
01 36 05.4 S 124 52 50.2 E
soil
A601
T34
8.36
4.44
01 36 51.0 S 124 52 19.5 E sediment
A602
T42
14.80
7.0
01 36 51.0 S 124 52 19.5 E sediment
A603
T43
9.61
5.34
01 36 51.0 S 124 52 19.5 E sediment
A604
F8
32.9
31.1
01 36 51.0 S 124 52 19.5 E
soil
A605
F9
10.0
10.0
01 36 51.0 S 124 52 19.5 E
soil
A606
T32
8.4
5.4
01 36 51.0 S 124 52 19.5 E
soil
A607
T32A
12.9
8.2
01 36 51.0 S 124 52 19.5 E
soil
A608
T36
0.05
01 36 22.1 S 124 52 34.6 E
water
A609
T50
0.10
01 36 22.1 S 124 52 34.6 E
water
A610
Coral
0.01
01 36 51.0 S 124 52 19.5 E animal
A701
B1
18.50
11.00
01 30 27.3 S 124 58 50.7 E sediment
A702
B2
34.70
24.50
01 30 27.3 S 124 58 50.7 E sediment